UNITED STATES
SECURITIES AND EXCHANGE COMMISSION
Washington, D.C. 20549
FORM N-CSR
CERTIFIED SHAREHOLDER REPORT OF REGISTERED
MANAGEMENT INVESTMENT COMPANIES
Investment Company Act file number | 811-04367 |
|
Columbia Funds Series Trust I |
(Exact name of registrant as specified in charter) |
|
225 Franklin Street, Boston, Massachusetts | | 02110 |
(Address of principal executive offices) | | (Zip code) |
|
Scott R. Plummer 5228 Ameriprise Financial Center Minneapolis, MN 55474 |
(Name and address of agent for service) |
|
Registrant’s telephone number, including area code: | 1-612-671-1947 | |
|
Date of fiscal year end: | October 31 | |
|
Date of reporting period: | October 31, 2012 | |
| | | | | | | | |
Form N-CSR is to be used by management investment companies to file reports with the Commission not later than 10 days after the transmission to stockholders of any report that is required to be transmitted to stockholders under Rule 30e-1 under the Investment Company Act of 1940 (17 CFR 270.30e-1). The Commission may use the information provided on Form N-CSR in its regulatory, disclosure review, inspection, and policymaking roles.
A registrant is required to disclose the information specified by Form N-CSR, and the Commission will make this information public. A registrant is not required to respond to the collection of information contained in Form N-CSR unless the Form displays a currently valid Office of Management and Budget (“OMB”) control number. Please direct comments concerning the accuracy of the information collection burden estimate and any suggestions for reducing the burden to Secretary, Securities and Exchange Commission, 450 Fifth Street, NW, Washington, DC 20549-0609. The OMB has reviewed this collection of information under the clearance requirements of 44 U.S.C. § 3507.
Item 1. Reports to Stockholders.
Annual Report
October 31, 2012

Columbia Intermediate Municipal Bond Fund
Not FDIC insured • No bank guarantee • May lose value
Columbia Intermediate Municipal Bond Fund
 Dear Shareholders,
Stocks rebound around the world
After a weak second quarter, U.S. stock market averages rebounded in the third quarter, erasing earlier losses and boosting year-to-date returns well into double digits. Welcome news from Europe and additional quantitative easing in the United States by the Federal Reserve Board helped bolster the rally. The Standard & Poor's 500 Index (S&P 500 Index) rose 6.35% (total return) for the quarter. The Dow Jones Industrial Average advanced 4.32% for the same period. From the beginning of the calendar year through September 30, 2012, the S&P 500 Index was up 16.44% (total return). And, as of the end of September, the S&P 500 Index stood at 1,440 — approximately 8% below its all-time high of 1,565 that was set on October 9, 2007.
Outside the United States, stock markets of both developed and emerging market economies rebounded, as measured in U.S. dollars. Investors responded favorably to the announcement of policy measures aimed to resolve the eurozone crisis, which could potentially have a favorable impact on growth in emerging market economies. A weaker dollar also benefited returns to U.S. investors.
Solid gains for fixed income
Within fixed income, investors appeared to be increasingly willing to take on risk as they abandoned higher quality sectors that dominated the performance rankings in the second quarter and favored riskier sectors, where yield spreads tightened by a significant margin. Fixed-income returns were strong, but unlike equities, they have been less volatile, accumulating steadily over the course of the year. Gains were the highest for high-yield and emerging market bonds. By contrast, government issued debt securities eked out smaller gains.
Stay on track with Columbia Management
Backed by more than 100 years of experience, Columbia Management is one of the nation's largest asset managers. At the heart of our success — and, most importantly, that of our investors — are highly talented industry professionals, brought together by a unique way of working. We are dedicated to helping you take advantage of today's opportunities and anticipate tomorrow's. We stay abreast of the latest investment trends and ideas, using our collective insight to evaluate events and transform them into solutions you can use.
Visit columbiamanagement.com for:
> The Columbia Management Perspectives blog, featuring timely posts by our investment teams
> Detailed up-to-date fund performance and portfolio information
> Economic analysis and market commentary
> Quarterly fund commentaries
> Columbia Management Investor, our award-winning quarterly newsletter for shareholders
Thank you for your continued support of the Columbia Funds. We look forward to serving your investment needs for many years to come.
Best Regards,

J. Kevin Connaughton
President, Columbia Funds
The S&P 500 Index, an unmanaged index, measures the performance of 500 widely held, large-capitalization U.S. stocks and is frequently used as a general measure of market performance. The Dow Jones Industrial Average is a price weighted average of 30 actively traded shares of blue chip US industrial corporations listed on the New York Stock Exchange. Indices are not available for investment, are not professionally managed and do not reflect sales charges, fees, brokerage commissions, taxes or other expenses of investing.
Investors should consider the investment objectives, risks, charges and expenses of a mutual fund carefully before investing. For a free prospectus, which contains this and other important information about a fund, visit columbiamanagement.com. The prospectus should be read carefully before investing.
Columbia Funds are distributed by Columbia Management Investment Distributors, Inc., member FINRA, and managed by Columbia Management Investment Advisers, LLC.
© 2012 Columbia Management Investment Advisers, LLC. All rights reserved.
Columbia Intermediate Municipal Bond Fund
Performance Overview | | | 2 | | |
Manager Discussion of Fund Performance | | | 4 | | |
Understanding Your Fund's Expenses | | | 6 | | |
Portfolio of Investments | | | 7 | | |
Statement of Assets and Liabilities | | | 31 | | |
Statement of Operations | | | 33 | | |
Statement of Changes in Net Assets | | | 34 | | |
Financial Highlights | | | 36 | | |
Notes to Financial Statements | | | 41 | | |
Report of Independent Registered
Public Accounting Firm | | | 48 | | |
Federal Income Tax Information | | | 49 | | |
Trustees and Officers | | | 50 | | |
Board Consideration and Approval of Advisory Agreement | | | 53 | | |
Important Information About This Report | | | 57 | | |
Fund Investment Manager
Columbia Management Investment
Advisers, LLC
225 Franklin Street
Boston, MA 02110
Fund Distributor
Columbia Management Investment
Distributors, Inc.
225 Franklin Street
Boston, MA 02110
Fund Transfer Agent
Columbia Management Investment
Services Corp.
P.O. Box 8081
Boston, MA 02266-8081
For more information about any of the funds, please visit columbiamanagement.com or call 800.345.6611. Customer Service Representatives are available to answer your questions Monday through Friday from 8 a.m. to 8 p.m. Eastern time.
The views expressed in this report reflect the current views of the respective parties. These views are not guarantees of future performance and involve certain risks, uncertainties and assumptions that are difficult to predict, so actual outcomes and results may differ significantly from the views expressed. These views are subject to change at any time based upon economic, market or other conditions and the respective parties disclaim any responsibility to update such views. These views may not be relied on as investment advice and, because investment decisions for a Columbia Fund are based on numerous factors, may not be relied on as an indication of trading intent on behalf of any particular Columbia Fund. References to specific securities should not be construed as a recommendation or investment advice.
Columbia Intermediate Municipal Bond Fund
Performance Summary
> Columbia Intermediate Municipal Bond Fund (the Fund) Class A shares returned 7.88% excluding sales charges for the 12-month period that ended October 31, 2012.
> The Fund outperformed its benchmark, the Barclays 3-15 Year Blend Municipal Bond Index, which returned 7.68% for the same time period.
> A longer-than-benchmark duration over most of the 12 months helped the Fund capture the strong performance of longer-maturity securities. Relative results also received a boost from the greater-than-benchmark exposure to A and BBB rated credits.
Average Annual Total Returns (%) (for period ended October 31, 2012)
| | Inception | | 1 Year | | 5 Years | | 10 Years | |
Class A* | | 11/25/02 | | | | | | | |
Excluding sales charges | | | | | 7.88 | | | | 5.19 | | | | 4.15 | | |
Including sales charges | | | | | 4.42 | | | | 4.50 | | | | 3.65 | | |
Class B* | | 11/25/02 | | | | | | | |
Excluding sales charges | | | | | 7.17 | | | | 4.50 | | | | 3.48 | | |
Including sales charges | | | | | 4.17 | | | | 4.50 | | | | 3.48 | | |
Class C* | | 11/25/02 | | | | | | | |
Excluding sales charges | | | | | 7.66 | | | | 4.97 | | | | 3.94 | | |
Including sales charges | | | | | 6.66 | | | | 4.97 | | | | 3.94 | | |
Class T | | 06/26/00 | | | | | | | |
Excluding sales charges | | | | | 7.93 | | | | 5.24 | | | | 4.21 | | |
Including sales charges | | | | | 2.77 | | | | 4.22 | | | | 3.70 | | |
Class Z | | 06/14/93 | | | 8.07 | | | | 5.40 | | | | 4.36 | | |
Barclays 3-15 Year Blend Municipal Bond Index | | | | | 7.68 | | | | 6.11 | | | | 5.05 | | |
Returns for Class A are shown with and without the maximum initial sales charge of 3.25% (for the one-year and five-year periods) and 4.75% (for the 10-year period). (Prior to August 22, 2005, new purchases of Class A shares had a maximum initial sales charge of 4.75%.) Returns for Class B are shown with and without the applicable contingent deferred sales charge (CDSC) of 3.00% in the first year, declining to 1.00% in the fourth year and eliminated thereafter. Returns for Class C are shown with and without the 1.00% CDSC for the first year only. Returns for Class T are shown with and without the maximum sales charge of 4.75%. The Fund's other classes are not subject to sales charges and have limited eligibility. Please see the Fund's prospectuses for details. Performance for different share classes will vary based on differences in sales charges and fees associated with each class. All results shown assume reinvestment of distributions during the period. Returns do not reflect the deduction of taxes that a shareholder may pay on Fund distributions or on the redemption of Fund shares. Performance results reflect the effect of any fee waivers or reimbursements of Fund expenses by Columbia Management Investment Advisers, LLC and/or any of its affiliates. Absent these fee waivers or expense reimbursement arrangements, performance results would have been lower.
The performance information shown represents past performance and is not a guarantee of future results. The investment return and principal value of your investment will fluctuate so that your shares, when redeemed, may be worth more or less than their original cost. Current performance may be lower or higher than the performance information shown. You may obtain performance information current to the most recent month-end by contacting your financial intermediary, visiting columbiamanagement.com or calling 800.345.6611.
*The returns shown for periods prior to the share class inception date (including returns since inception if shown, which are since Fund inception) include the returns of the Fund's oldest share class. These returns are adjusted to reflect any higher class-related operating expenses of the newer share classes, as applicable. Please visit columbiamanagement.com/mutual-funds/appended-performance for more information.
The Barclays 3-15 Year Blend Municipal Bond Index is an unmanaged index that tracks the performance of municipal bonds issued after December 31, 1990, with remaining maturities between 2 and 17 years and at least $7 million in principal amount outstanding.
Indices are not available for investment, are not professionally managed and do not reflect sales charges, fees, brokerage commissions, taxes or other expenses of investing. Securities in the Fund may not match those in an index.
Annual Report 2012
2
Columbia Intermediate Municipal Bond Fund
Performance Overview (continued)
Performance of a Hypothetical $10,000 Investment (November 1, 2002 – October 31, 2012)
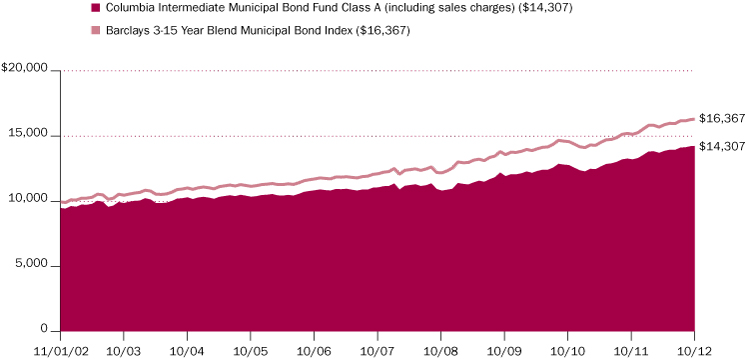
The chart above shows the change in value of a hypothetical $10,000 investment in Class A shares of Columbia Intermediate Municipal Bond Fund during the stated time period, and does not reflect the deduction of taxes that a shareholder may pay on Fund distributions or on the redemption of Fund shares. The performance of a $10,000 investment with sales charge for Class A shares is calculated with an initial sales charge of 4.75%, which was the effective sales charge prior to August 22, 2005.
Annual Report 2012
3
Columbia Intermediate Municipal Bond Fund
Manager Discussion of Fund Performance
For the 12-month period that ended October 31, 2012, the Fund's Class A shares returned 7.88% excluding sales charges. The Fund's benchmark, the Barclays 3-15 Year Blend Municipal Bond Index returned 7.68% for the same time period. In a solid year for municipal bond performance, the Fund outpaced its Barclays benchmark, helped by its maturity positioning and greater exposure to credit-sensitive investments, especially A and BBB rated securities, which outperformed higher quality names. Investments in zero coupon bonds and an underweight in state general obligation securities also helped performance. Exposure to very short-maturity bonds and cash detracted from results.
Strong Demand, Declining Rates Helped Drive Municipal Market
Demand for tax-advantaged municipal bond investments remained strong over the 12-month period, with investors pouring new money into the market. While the supply of new issuance was steady, opportunities to invest were limited because many newer securities carried lower yields and shorter maturities than older bonds as municipal issuers took advantage of falling interest rates to refinance debt at lower interest rates. This worked against investors in older, higher-yielding securities that were called back by issuers. Newer investment opportunities offered lower yields.
Municipal revenues, in general, grew over the period, although total revenues remained below the 2008 peak. Most state general obligation bonds maintained their credit ratings, but some were downgraded by major ratings services, mainly because of under-funded pension liabilities. From a quality perspective, lower-rated, higher-yielding municipal bonds outperformed higher-rated counterparts.
Emphasis on Lower-Rated, Investment-Grade Debt Aided Performance
The Fund was well positioned to take advantage of the outperformance by credit-sensitive municipal bonds, with an average of about 20% more assets than the Index, invested in A and BBB rated debt that outpaced higher-rated securities. A small exposure to non-rated securities also helped. Moreover, the Fund was structured with a relatively large position in bonds with longer call protection, which served to help protect the income stream against issuers calling back their bonds. In addition, the Fund had almost 5% of net assets invested in outperforming zero coupon bonds, which were mostly non-callable and had longer durations than most coupon bonds. (Duration is a measure of interest rate sensitivity.) The Fund was underweight relative to the index in state general obligation bonds, which proved to be an advantage as the higher credit ratings of most state governments led to underperformance.
Credit Research an Advantage
Our strong emphasis on credit research proved an advantage over the 12-month period, as our expert credit staff was able to identify solid opportunities, notably in the hospital and transportation sectors. The electric revenue bonds held by the Fund outperformed index holdings in the sector, the result of good credit selection. Similarly, the Fund took advantage of opportunities in California, where highly publicized problems by some local issuers led our credit staff to identify undervalued opportunities in what we consider to be fundamentally solid names.
Portfolio Management
Brian McGreevy
Paul Fuchs, CFA
Paul Fuchs joined Brian McGreevy as a Portfolio Manager of the Fund in October 2012.
Top Ten States (%)
(at October 31, 2012) | |
New York | | | 13.2 | | |
California | | | 12.3 | | |
Texas | | | 9.7 | | |
Florida | | | 8.7 | | |
Massachusetts | | | 5.7 | | |
New Jersey | | | 5.4 | | |
Illinois | | | 5.2 | | |
Pennsylvania | | | 3.1 | | |
Rhode Island | | | 2.8 | | |
Michigan | | | 2.5 | | |
Percentages indicated are based upon total investments (excluding Money Market Funds).
Quality Breakdown (%)
(at October 31, 2012) | |
AAA rating | | | 8.8 | | |
AA rating | | | 42.5 | | |
A rating | | | 33.1 | | |
BBB rating | | | 11.4 | | |
Non-investment grade | | | 1.1 | | |
Not rated | | | 3.1 | | |
Total | | | 100.0 | | |
Percentages indicated are based upon total fixed income securities (excluding Money Market Funds).
Bond ratings apply to the underlying holdings of the Fund and not the Fund itself and are divided into categories ranging from AAA (highest) to D (lowest), and are subject to change. The ratings shown are determined by using the middle rating of Moody's, S&P, and Fitch after dropping the highest and lowest available ratings. When a rating from only two agencies is available, the lower rating is used. When a rating from only one agency is available, that rating is used. When a bond is not rated by any of these agencies, it is designated as Not rated. Credit ratings are subjective opinions and not statements of fact.
Annual Report 2012
4
Columbia Intermediate Municipal Bond Fund
Manager Discussion of Fund Performance (continued)
Looking Ahead
At present, we continue to see value in some A and BBB rated securities that offer higher yields than the highest-rated debt. Nevertheless, the yield advantages of lower-rated securities have tightened, giving investors less of a cushion against the risk of an unanticipated credit ratings downgrade. In this environment, we believe our experienced credit research staff, which can examine the credit-worthiness of each potential investment, becomes an even more important asset.
We currently expect interest rates to remain low; and with a steep yield curve, we see opportunities to reduce exposure to very short-term bonds and pick up additional yield without a significant increase in risk. (The yield curve charts the difference in yield of similar-quality bonds from short- to long-term maturities.)
Annual Report 2012
5
Columbia Intermediate Municipal Bond Fund
Understanding Your Fund's Expenses
(Unaudited)
As an investor, you incur two types of costs. There are transaction costs, which generally include sales charges on purchases and may include redemption fees. There are also ongoing costs, which generally include management fees, distribution and service (Rule 12b-1) fees, and other fund expenses. The following information is intended to help you understand your ongoing costs (in dollars) of investing in the Fund and to help you compare these costs with the ongoing costs of investing in other mutual funds.
Analyzing Your Fund's Expenses
To illustrate these ongoing costs, we have provided examples and calculated the expenses paid by investors in each share class of the Fund during the period. The actual and hypothetical information in the table is based on an initial investment of $1,000 at the beginning of the period indicated and held for the entire period. Expense information is calculated two ways and each method provides you with different information. The amount listed in the "Actual" column is calculated using the Fund's actual operating expenses and total returns for the period. You may use the Actual information, together with the amount invested, to estimate the expenses that you paid over the period. Simply divide your account value by $1,000 (for example, an $8,600 account value divided by $1,000 = 8.6), then multiply the results by the expenses paid during the period under the Actual column. The amount listed in the "Hypothetical" column assumes a 5% annual rate of return before expenses (which is not the Fund's actual return) and then applies the Fund's actual expense ratio for the period to the hypothetical return. You should not use the hypothetical account values and expenses to estimate either your actual account balance at the end of the period or the expenses you paid during the period. See "Compare With Other Funds" below for details on how to use the hypothetical data.
Compare With Other Funds
Since all mutual funds are required to include the same hypothetical calculations about expenses in shareholder reports, you can use this information to compare the ongoing cost of investing in the Fund with other funds. To do so, compare the hypothetical example with the 5% hypothetical examples that appear in the shareholder reports of other funds. As you compare hypothetical examples of other funds, it is important to note that hypothetical examples are meant to highlight the ongoing costs of investing in a fund only and do not reflect any transaction costs, such as redemption or exchange fees, or expenses that apply to the subaccount or the contract. Therefore, the hypothetical calculations are useful in comparing ongoing costs only, and will not help you determine the relative total costs of owning different funds. If transaction costs were included in these calculations, your costs would be higher.
May 1, 2012 – October 31, 2012
| | Account Value at the Beginning
of the Period ($) | | Account Value at the End of the
Period ($) | | Expenses Paid During the
Period ($) | | Fund's Annualized
Expense Ratio (%) | |
| | Actual | | Hypothetical | | Actual | | Hypothetical | | Actual | | Hypothetical | | Actual | |
Class A | | | 1,000.00 | | | | 1,000.00 | | | | 1,028.20 | | | | 1,021.42 | | | | 3.77 | | | | 3.76 | | | | 0.74 | | |
Class B | | | 1,000.00 | | | | 1,000.00 | | | | 1,024.80 | | | | 1,018.15 | | | | 7.07 | | | | 7.05 | | | | 1.39 | | |
Class C | | | 1,000.00 | | | | 1,000.00 | | | | 1,027.20 | | | | 1,020.41 | | | | 4.79 | | | | 4.77 | | | | 0.94 | | |
Class T | | | 1,000.00 | | | | 1,000.00 | | | | 1,028.40 | | | | 1,021.67 | | | | 3.52 | | | | 3.51 | | | | 0.69 | | |
Class Z | | | 1,000.00 | | | | 1,000.00 | | | | 1,029.20 | | | | 1,022.42 | | | | 2.75 | | | | 2.75 | | | | 0.54 | | |
Expenses paid during the period are equal to the annualized expense ratio for each class as indicated above, multiplied by the average account value over the period and then multiplied by the number of days in the Fund's most recent fiscal half year and divided by 366.
Expenses do not include fees and expenses incurred indirectly by the Fund from the underlying funds in which the Fund may invest (also referred to as "acquired funds"), including affiliated and non-affiliated pooled investment vehicles (including mutual funds and exchange-traded funds).
Had Columbia Management Investment Advisers, LLC and/or certain of its affiliates not waived/reimbursed certain fees and expenses, account value at the end of the period would have been reduced.
Annual Report 2012
6
Columbia Intermediate Municipal Bond Fund
Portfolio of Investments
October 31, 2012
(Percentages represent value of investments compared to net assets)
Municipal Bonds 95.8%
Issue
Description | | Coupon
Rate | | Principal
Amount ($) | | Value ($) | |
Alabama 0.5% | |
Alabama 21st Century Authority
Revenue Bonds
Series 2012A
06/01/19 | | | 5.000 | % | | | 1,750,000 | | | | 2,101,715 | | |
Alabama Public School & College Authority
Refunding Revenue Bonds
Series 2009A
05/01/19 | | | 5.000 | % | | | 10,000,000 | | | | 12,329,800 | | |
Total | | | | | | | 14,431,515 | | |
Alaska 1.2% | |
City of Valdez
Refunding Revenue Bonds
BP Pipelines Project
Series 2003B
01/01/21 | | | 5.000 | % | | | 19,460,000 | | | | 23,576,958 | | |
BP Pipelines, Inc. Project
Series 2001
01/01/18 | | | 5.000 | % | | | 8,000,000 | | | | 9,378,160 | | |
Total | | | | | | | 32,955,118 | | |
Arizona 1.6% | |
Arizona School Facilities Board
Certificate of Participation
Series 2008
09/01/15 | | | 5.500 | % | | | 7,500,000 | | | | 8,486,925 | | |
City of Tucson
Unlimited General Obligation Refunding Bonds
Series 1998
07/01/18 | | | 5.500 | % | | | 4,760,000 | | | | 5,870,746 | | |
Maricopa County High School District No. 210-Phoenix
Unlimited General Obligation Refunding Bonds
Series 2003 (NPFGC)
07/01/15 | | | 5.000 | % | | | 6,300,000 | | | | 7,028,595 | | |
Maricopa County Industrial Development Authority
Revenue Bonds
Catholic Healthcare West
Series 2007A
07/01/18 | | | 5.000 | % | | | 3,500,000 | | | | 4,004,175 | | |
Maricopa County Pollution Control Corp.
Refunding Revenue Bonds
Arizona Public Service Co.
Series 2009D(a)
05/01/29 | | | 6.000 | % | | | 10,000,000 | | | | 10,656,800 | | |
Salt River Project Agricultural Improvement & Power
District
Revenue Bonds
Series 2009A
01/01/22 | | | 5.000 | % | | | 1,000,000 | | | | 1,199,530 | | |
Municipal Bonds (continued)
Issue
Description | | Coupon
Rate | | Principal
Amount ($) | | Value ($) | |
State of Arizona
Certificate of Participation
Department of Administration
Series 2010A (AGM)
10/01/18 | | | 5.000 | % | | | 5,000,000 | | | | 5,918,000 | | |
Total | | | | | | | 43,164,771 | | |
Arkansas 0.2% | |
County of Independence
Refunding Revenue Bonds
Entergy Mississippi, Inc. Project
Series 1999 (AMBAC)
07/01/22 | | | 4.900 | % | | | 4,600,000 | | | | 4,740,576 | | |
California 11.8% | |
California Health Facilities Financing Authority
Revenue Bonds
St. Joseph Health System
Series 2009B
07/01/18 | | | 5.000 | % | | | 10,445,000 | | | | 12,405,004 | | |
California Health Facilities Financing Authority(a)
Revenue Bonds
Catholic Healthcare West
Series 2009F
07/01/27 | | | 5.000 | % | | | 3,000,000 | | | | 3,184,950 | | |
California Municipal Finance Authority
Revenue Bonds
Biola University
Series 2008
10/01/23 | | | 5.625 | % | | | 3,000,000 | | | | 3,313,530 | | |
California State Department of Water Resources
Revenue Bonds
Power Supply
Series 2008H
05/01/21 | | | 5.000 | % | | | 5,000,000 | | | | 6,024,100 | | |
California State Public Works Board
Refunding Revenue Bonds
Department of Corrections and Rehab
Series 2006F (NPFGC/FGIC)
11/01/18 | | | 5.250 | % | | | 4,000,000 | | | | 4,826,120 | | |
Various Capital Projects
Series 2012G
11/01/28 | | | 5.000 | % | | | 5,510,000 | | | | 6,262,115 | | |
Revenue Bonds
Department of Corrections
Series 2003C
06/01/18 | | | 5.500 | % | | | 1,500,000 | | | | 1,585,140 | | |
Department of Mental Health Coalinga
Series 2004A-A
06/01/19 | | | 5.500 | % | | | 2,000,000 | | | | 2,139,400 | | |
Various Capital Projects
Series 2011A
10/01/22 | | | 5.250 | % | | | 3,395,000 | | | | 4,093,317 | | |
Series 2012A
04/01/28 | | | 5.000 | % | | | 10,000,000 | | | | 11,297,000 | | |
The accompanying Notes to Financial Statements are an integral part of this statement.
Annual Report 2012
7
Columbia Intermediate Municipal Bond Fund
Portfolio of Investments (continued)
October 31, 2012
Municipal Bonds (continued)
Issue
Description | | Coupon
Rate | | Principal
Amount ($) | | Value ($) | |
California State University
Revenue Bonds
Systemwide
Series 2008A (AGM)
11/01/22 | | | 5.000 | % | | | 5,000,000 | | | | 5,785,050 | | |
California Statewide Communities Development Authority
Revenue Bonds
Proposition 1A Receivables Program
Series 2009
06/15/13 | | | 5.000 | % | | | 12,500,000 | | | | 12,867,250 | | |
City of Fresno Sewer System
Revenue Bonds
Series 1993A-1 (AMBAC)
09/01/19 | | | 5.250 | % | | | 5,000,000 | | | | 5,806,850 | | |
City of Vernon Electric System
Revenue Bonds
Series 2009A
08/01/21 | | | 5.125 | % | | | 10,435,000 | | | | 11,746,471 | | |
County of Sacramento Airport System
Revenue Bonds
Series 2009B
07/01/24 | | | 5.000 | % | | | 1,000,000 | | | | 1,125,670 | | |
Los Angeles Unified School District
Unlimited General Obligation Bonds
Election of 2005
Series 2007E (AGM)
07/01/20 | | | 5.000 | % | | | 6,230,000 | | | | 7,318,755 | | |
Manteca Unified School District
Unlimited General Obligation Bonds
Capital Appreciation-Election of 2004
Series 2006 (NPFGC)(b)
08/01/24 | | | 0.000 | % | | | 5,000,000 | | | | 2,820,200 | | |
Monrovia Unified School District
Unlimited General Obligation Refunding Bonds
Series 2005 (NPFGC)
08/01/21 | | | 5.250 | % | | | 5,600,000 | | | | 6,837,880 | | |
Oakland Unified School District
Unlimited General Obligation Bonds
Election of 2006
Series 2009A
08/01/29 | | | 6.125 | % | | | 14,500,000 | | | | 16,573,065 | | |
Orange County Public Financing Authority
Refunding Revenue Bonds
Series 2005 (NPFGC)
07/01/16 | | | 5.000 | % | | | 10,000,000 | | | | 11,457,900 | | |
Oxnard Financing Authority
Revenue Bonds
Redwood Trunk Sewer & Headworks
Series 2004A (NPFGC/FGIC)
06/01/29 | | | 5.000 | % | | | 3,795,000 | | | | 3,905,472 | | |
Municipal Bonds (continued)
Issue
Description | | Coupon
Rate | | Principal
Amount ($) | | Value ($) | |
Pico Rivera Water Authority
Revenue Bonds
Water System Project
Series 1999A (NPFGC)
05/01/29 | | | 5.500 | % | | | 3,000,000 | | | | 3,237,690 | | |
Rancho Santiago Community College District
Unlimited General Obligation Bonds
Capital Appreciation-Election of 2002
Series 2006C (AGM)(b)
09/01/31 | | | 0.000 | % | | | 28,000,000 | | | | 11,679,080 | | |
Sacramento Municipal Utility District
Refunding Revenue Bonds
Series 2005 (AMBAC)
07/01/14 | | | 5.250 | % | | | 6,680,000 | | | | 7,054,280 | | |
Revenue Bonds
Cosumnes Project
Series 2006 (NPFGC)
07/01/29 | | | 5.125 | % | | | 7,035,000 | | | | 7,492,205 | | |
San Francisco City & County Airports Commission
Revenue Bonds
Series 2010A
05/01/29 | | | 4.900 | % | | | 5,000,000 | | | | 5,713,800 | | |
San Joaquin Hills Transportation Corridor Agency
Revenue Bonds
Senior Lien
Series 1993 Escrowed to Maturity(b)
01/01/25 | | | 0.000 | % | | | 22,405,000 | | | | 16,780,673 | | |
San Mateo County Community College District
Unlimited General Obligation Bonds
Capital Appreciation Election of 2005
Series 2006A (NPFGC)(b)
09/01/20 | | | 0.000 | % | | | 9,310,000 | | | | 7,606,270 | | |
Southern California Public Power Authority
Revenue Bonds
Project No. 1
Series 2007A
11/01/22 | | | 5.250 | % | | | 2,500,000 | | | | 2,768,875 | | |
Windy Point/Flats Project 1
Series 2010
07/01/28 | | | 5.000 | % | | | 10,000,000 | | | | 11,850,000 | | |
Windy Point/Windy Flats Project
Series 2010-1
07/01/30 | | | 5.000 | % | | | 15,875,000 | | | | 18,806,954 | | |
State of California
Unlimited General Obligation Bonds
Series 2002 (AMBAC)
02/01/18 | | | 6.000 | % | | | 5,000,000 | | | | 6,225,600 | | |
Series 2004A (NPFGC)
07/01/15 | | | 5.000 | % | | | 5,000,000 | | | | 5,390,850 | | |
Various Purpose
Series 2009
04/01/22 | | | 5.250 | % | | | 1,000,000 | | | | 1,199,300 | | |
10/01/22 | | | 5.250 | % | | | 25,000,000 | | | | 29,752,250 | | |
The accompanying Notes to Financial Statements are an integral part of this statement.
Annual Report 2012
8
Columbia Intermediate Municipal Bond Fund
Portfolio of Investments (continued)
October 31, 2012
Municipal Bonds (continued)
Issue
Description | | Coupon
Rate | | Principal
Amount ($) | | Value ($) | |
Series 2010
03/01/25 | | | 5.000 | % | | | 1,000,000 | | | | 1,157,960 | | |
Series 2011
10/01/19 | | | 5.000 | % | | | 12,000,000 | | | | 14,714,040 | | |
Unlimited General Obligation Refunding Bonds
Series 2005
03/01/17 | | | 5.000 | % | | | 10,000,000 | | | | 11,370,700 | | |
Series 2009A
07/01/20 | | | 5.000 | % | | | 12,500,000 | | | | 15,305,625 | | |
07/01/21 | | | 5.250 | % | | | 1,000,000 | | | | 1,234,540 | | |
West Contra Costa Unified School District
Unlimited General Obligation Bonds
Series 2005 (NPFGC/FGIC)(b)
08/01/20 | | | 0.000 | % | | | 7,285,000 | | | | 5,624,530 | | |
Total | | | | | | | 326,340,461 | | |
Colorado 1.8% | |
Baptist Road Rural Transportation Authority
Revenue Bonds
Series 2007
12/01/17 | | | 4.800 | % | | | 375,000 | | | | 362,479 | | |
Colorado Department of Transportation
Refunding Revenue Bonds
Transportation
RAN Series 2002B (NPFGC)
06/15/14 | | | 5.500 | % | | | 3,000,000 | | | | 3,248,790 | | |
06/15/15 | | | 5.500 | % | | | 1,000,000 | | | | 1,130,440 | | |
Colorado Health Facilities Authority
Refunding Revenue Bonds
Covenant Retirement Communities
Series 2012A
12/01/27 | | | 5.000 | % | | | 2,500,000 | | | | 2,692,950 | | |
Revenue Bonds
Covenant Retirement Communities, Inc.
Series 2005
12/01/18 | | | 5.000 | % | | | 1,000,000 | | | | 1,064,730 | | |
Evangelical Lutheran
Series 2005
06/01/23 | | | 5.250 | % | | | 500,000 | | | | 535,415 | | |
Colorado Health Facilities Authority(a)
Revenue Bonds
Catholic Health Initiatives
Series 2008D-3
10/01/38 | | | 5.500 | % | | | 5,000,000 | | | | 5,708,500 | | |
County of Adams
Refunding Revenue Bonds
Public Service Co. of Colorado Project
Series 2005A (NPFGC)
09/01/17 | | | 4.375 | % | | | 11,550,000 | | | | 12,409,666 | | |
E-470 Public Highway Authority
Revenue Bonds
Capital Appreciation
Senior Series 2000B (NPFGC)(b)
09/01/18 | | | 0.000 | % | | | 1,500,000 | | | | 1,236,915 | | |
Municipal Bonds (continued)
Issue
Description | | Coupon
Rate | | Principal
Amount ($) | | Value ($) | |
North Range Metropolitan District No. 1
Limited General Obligation Refunding Bonds
Series 2007 (ACA)
12/15/15 | | | 5.000 | % | | | 365,000 | | | | 370,453 | | |
12/15/17 | | | 5.000 | % | | | 350,000 | | | | 354,858 | | |
North Range Metropolitan District No. 2
Limited Tax General Obligation Bonds
Series 2007
12/15/14 | | | 5.500 | % | | | 555,000 | | | | 565,745 | | |
Northwest Parkway Public Highway Authority
Prerefunded 06/15/16 Revenue Bonds
Capital Appreciation
Series 2001C (AMBAC)
06/15/21 | | | 5.700 | % | | | 4,000,000 | | | | 4,728,560 | | |
Regional Transportation District
Certificate of Participation
Series 2010A
06/01/25 | | | 5.000 | % | | | 10,000,000 | | | | 11,374,600 | | |
University of Colorado Hospital Authority
Revenue Bonds
Series 2012-A
11/15/27 | | | 5.000 | % | | | 3,500,000 | | | | 4,044,145 | | |
Total | | | | | | | 49,828,246 | | |
Connecticut 1.4% | |
City of Bridgeport
Unlimited General Obligation Refunding Bonds
Series 2012B
08/15/18 | | | 4.000 | % | | | 8,340,000 | | | | 9,264,405 | | |
08/15/19 | | | 4.000 | % | | | 5,680,000 | | | | 6,300,199 | | |
City of West Haven
Unlimited General Obligation Bonds
Series 2012 (AGM)
08/01/18 | | | 4.000 | % | | | 2,080,000 | | | | 2,248,210 | | |
08/01/19 | | | 4.000 | % | | | 2,000,000 | | | | 2,166,040 | | |
Connecticut State Development Authority
Refunding Revenue Bonds
Connecticut Light & Power Co. Project
Series 2011
09/01/28 | | | 4.375 | % | | | 3,615,000 | | | | 3,933,662 | | |
Connecticut State Health & Educational Facility Authority
Refunding Revenue Bonds
Connecticut State University
Series 2012L
11/01/23 | | | 4.000 | % | | | 4,000,000 | | | | 4,544,360 | | |
Revenue Bonds
Trinity College
Series 1998F (NPFGC)
07/01/21 | | | 5.500 | % | | | 1,000,000 | | | | 1,214,740 | | |
The accompanying Notes to Financial Statements are an integral part of this statement.
Annual Report 2012
9
Columbia Intermediate Municipal Bond Fund
Portfolio of Investments (continued)
October 31, 2012
Municipal Bonds (continued)
Issue
Description | | Coupon
Rate | | Principal
Amount ($) | | Value ($) | |
Harbor Point Infrastructure Improvement District
Tax Allocation Bonds
Harbor Point Project
Series 2010A
04/01/22 | | | 7.000 | % | | | 7,233,000 | | | | 8,264,209 | | |
Total | | | | | | | 37,935,825 | | |
District of Columbia 1.1% | |
District of Columbia Water & Sewer Authority
Revenue Bonds
Series 2009A
10/01/24 | | | 5.000 | % | | | 1,000,000 | | | | 1,192,050 | | |
Metropolitan Washington Airports Authority
Revenue Bonds
Series 2009C
10/01/25 | | | 5.250 | % | | | 8,920,000 | | | | 10,459,681 | | |
Metropolitan Washington Airports Authority(b)
Revenue Bonds
Capital Appreciation-2nd Senior Lien
Series 2009B (AGM)
10/01/24 | | | 0.000 | % | | | 20,980,000 | | | | 12,606,882 | | |
10/01/25 | | | 0.000 | % | | | 7,500,000 | | | | 4,246,500 | | |
10/01/26 | | | 0.000 | % | | | 5,000,000 | | | | 2,691,600 | | |
Total | | | | | | | 31,196,713 | | |
Florida 8.3% | |
Capital Trust Agency, Inc.
Revenue Bonds
Atlantic Housing Foundation
Subordinated Series 2008B(c)
07/15/32 | | | 7.000 | % | | | 1,910,000 | | | | 859,290 | | |
Citizens Property Insurance Corp.
Revenue Bonds
Senior Secured
Series 2012A-1
06/01/20 | | | 5.000 | % | | | 10,000,000 | | | | 11,647,600 | | |
06/01/21 | | | 5.000 | % | | | 16,965,000 | | | | 19,913,008 | | |
City of Cocoa Water & Sewer
Refunding Revenue Bonds
Series 2003 (AMBAC)
10/01/19 | | | 5.500 | % | | | 1,000,000 | | | | 1,250,850 | | |
City of Hollywood Water & Sewer
Improvement Refunding Revenue Bonds
Series 2003 (AGM)
10/01/17 | | | 5.000 | % | | | 1,070,000 | | | | 1,112,693 | | |
City of Jacksonville
Revenue Bonds
Better Jacksonville
Series 2003 (NPFGC)
10/01/19 | | | 5.250 | % | | | 1,080,000 | | | | 1,129,108 | | |
Municipal Bonds (continued)
Issue
Description | | Coupon
Rate | | Principal
Amount ($) | | Value ($) | |
City of Lakeland
Refunding Revenue Bonds
1st Mortgage-Carpenters Accident Investor
Series 2008(d)
01/01/19 | | | 5.875 | % | | | 1,875,000 | | | | 2,075,044 | | |
City of Tallahassee
Refunding Revenue Bonds
Series 2001 (NPFGC/FGIC)
10/01/14 | | | 5.500 | % | | | 1,330,000 | | | | 1,453,198 | | |
10/01/17 | | | 5.500 | % | | | 1,900,000 | | | | 2,300,045 | | |
10/01/18 | | | 5.500 | % | | | 1,000,000 | | | | 1,241,650 | | |
City of Tampa
Revenue Bonds
Health System Catholic Health East
Series 1998A (NPFGC)
11/15/13 | | | 5.500 | % | | | 6,080,000 | | | | 6,371,293 | | |
11/15/14 | | | 5.500 | % | | | 6,000,000 | | | | 6,497,160 | | |
County of Broward
Refunding Revenue Bonds
Civic Arena Project
Series 2006A (AMBAC)
09/01/18 | | | 5.000 | % | | | 2,500,000 | | | | 2,811,700 | | |
County of Escambia
Refunding Revenue Bonds
Series 2003A
04/01/15 | | | 4.700 | % | | | 500,000 | | | | 540,000 | | |
County of Miami-Dade Aviation
Revenue Bonds
Miami International Airport
Series 2010A
10/01/25 | | | 5.500 | % | | | 6,000,000 | | | | 7,132,440 | | |
County of Miami-Dade Water & Sewer System
Refunding Revenue Bonds
System
Series 2008B (AGM)
10/01/21 | | | 5.250 | % | | | 20,000,000 | | | | 25,200,200 | | |
County of Miami-Dade
Revenue Bonds
Series 2004 (NPFGC)
04/01/24 | | | 5.000 | % | | | 2,445,000 | | | | 2,667,935 | | |
Transit System Sales Surtax
Series 2006 (XLCA)
07/01/19 | | | 5.000 | % | | | 5,040,000 | | | | 5,760,418 | | |
County of Osceola
Improvement Refunding Revenue Bonds
Osceola Parkway Project
Series 2004 (NPFGC)
04/01/18 | | | 5.000 | % | | | 1,000,000 | | | | 1,060,690 | | |
County of Palm Beach
Prerefunded 08/01/14 Refunding Revenue Bonds
Series 2004
08/01/17 | | | 5.000 | % | | | 1,000,000 | | | | 1,081,840 | | |
The accompanying Notes to Financial Statements are an integral part of this statement.
Annual Report 2012
10
Columbia Intermediate Municipal Bond Fund
Portfolio of Investments (continued)
October 31, 2012
Municipal Bonds (continued)
Issue
Description | | Coupon
Rate | | Principal
Amount ($) | | Value ($) | |
Flagler County School District
Certificate of Participation
Series 2005A (AGM)
08/01/18 | | | 5.000 | % | | | 2,320,000 | | | | 2,561,744 | | |
Florida Hurricane Catastrophe Fund Finance Corp.
Revenue Bonds
Series 2008A
07/01/14 | | | 5.000 | % | | | 15,000,000 | | | | 16,100,700 | | |
Florida Municipal Loan Council
Revenue Bonds
Series 2005A (NPFGC)
02/01/19 | | | 5.000 | % | | | 1,015,000 | | | | 1,090,760 | | |
Florida State Department of General Services
Refunding Revenue Bonds
Florida Facilities Pool
Series 2005A (AMBAC)
09/01/21 | | | 5.000 | % | | | 3,000,000 | | | | 3,395,820 | | |
Hillsborough County Industrial Development Authority
Revenue Bonds
Tampa Electric
Series 2007
05/15/18 | | | 5.650 | % | | | 3,425,000 | | | | 4,109,041 | | |
Hillsborough County Industrial Development Authority(a)
Revenue Bonds
Tampa Electric
Series 2007B
09/01/25 | | | 5.150 | % | | | 2,000,000 | | | | 2,070,100 | | |
Hillsborough County School Board
Certificate of Participation
Master Lease Program
Series 1998A (NPFGC)
07/01/14 | | | 5.500 | % | | | 2,000,000 | | | | 2,140,260 | | |
Kissimmee Utility Authority
Improvement Refunding Revenue Bonds
Series 2003 (AGM)
10/01/15 | | | 5.250 | % | | | 2,235,000 | | | | 2,329,272 | | |
Lake County School Board
Certificate of Participation
Series 2006C (AMBAC)
06/01/18 | | | 5.250 | % | | | 1,500,000 | | | | 1,758,915 | | |
Lee County Industrial Development Authority
Refunding Revenue Bonds
Shell Point/Alliance Community Project
Series 2007
11/15/22 | | | 5.000 | % | | | 7,650,000 | | | | 7,942,000 | | |
Oakmont Grove Community Development District
Special Assessment Bonds
Series 2007B(c)(e)
09/28/12 | | | 5.250 | % | | | 2,000,000 | | | | 20 | | |
Municipal Bonds (continued)
Issue
Description | | Coupon
Rate | | Principal
Amount ($) | | Value ($) | |
Orange County Health Facilities Authority
Revenue Bonds
Series 1996A Escrowed to Maturity (NPFGC)
10/01/16 | | | 6.250 | % | | | 4,705,000 | | | | 5,453,001 | | |
Unrefunded Revenue Bonds
Series 1996A (NPFGC)
10/01/16 | | | 6.250 | % | | | 1,700,000 | | | | 1,884,433 | | |
Orange County School Board
Certificate of Participation
Series 2005A (NPFGC)
08/01/18 | | | 5.000 | % | | | 1,000,000 | | | | 1,119,850 | | |
Series 2012B
08/01/26 | | | 5.000 | % | | | 6,400,000 | | | | 7,554,432 | | |
Orlando Utilities Commission
Refunding Revenue Bonds
Subordinated Series 1989D Escrowed to Maturity
10/01/17 | | | 6.750 | % | | | 1,365,000 | | | | 1,598,647 | | |
Revenue Bonds
Series 2005B
10/01/24 | | | 5.000 | % | | | 3,000,000 | | | | 3,359,040 | | |
Reedy Creek Improvement District
Limited General Obligation Bonds
Series 2004A (NPFGC)
06/01/17 | | | 5.000 | % | | | 1,000,000 | | | | 1,050,230 | | |
Sarasota County Health Facilities Authority
Refunding Revenue Bonds
Village on the Isle Project
Series 2007
01/01/27 | | | 5.500 | % | | | 4,000,000 | | | | 4,261,960 | | |
Seminole Indian Tribe of Florida
Revenue Bonds
Series 2007A(d)(g)
10/01/22 | | | 5.750 | % | | | 9,530,000 | | | | 10,434,206 | | |
St. Johns River Power Park
Refunding Revenue Bonds
Issue 2
Series 2005-21 (NPFGC)
10/01/19 | | | 5.000 | % | | | 1,000,000 | | | | 1,104,830 | | |
State of Florida
Refunding Revenue Bonds
Environmental Protection-Preservation 2000
Series 1998A (AGM)
07/01/13 | | | 6.000 | % | | | 10,000,000 | | | | 10,377,900 | | |
Unlimited General Obligation Refunding Bonds
Public Education
Series 2005C
06/01/13 | | | 5.000 | % | | | 11,830,000 | | | | 12,159,229 | | |
Series 2005B
01/01/14 | | | 5.000 | % | | | 17,395,000 | | | | 18,340,070 | | |
Sterling Hill Community Development District
Special Assessment Bonds
Series 2003B(c)(e)
11/01/10 | | | 5.500 | % | | | 150,000 | | | | 105,018 | | |
The accompanying Notes to Financial Statements are an integral part of this statement.
Annual Report 2012
11
Columbia Intermediate Municipal Bond Fund
Portfolio of Investments (continued)
October 31, 2012
Municipal Bonds (continued)
Issue
Description | | Coupon
Rate | | Principal
Amount ($) | | Value ($) | |
Tampa Bay Water
Improvement Refunding Revenue Bonds
Series 2005 (NPFGC/FGIC)
10/01/19 | | | 5.500 | % | | | 1,500,000 | | | | 1,901,235 | | |
Tampa Sports Authority
Sales Tax Revenue Bonds
Tampa Bay Arena Project
Series 1995 (NPFGC)
10/01/15 | | | 5.750 | % | | | 1,585,000 | | | | 1,650,508 | | |
10/01/20 | | | 5.750 | % | | | 1,000,000 | | | | 1,111,330 | | |
Village Center Community Development District
Revenue Bonds
Subordinated Series 2003B
01/01/18 | | | 6.350 | % | | | 1,000,000 | | | | 1,016,390 | | |
Total | | | | | | | 230,087,103 | | |
Georgia 2.2% | |
City of Atlanta Water & Wasterwater
Revenue Bonds
Series 1999A (NPFGC/FGIC)
11/01/18 | | | 5.500 | % | | | 15,305,000 | | | | 18,993,505 | | |
DeKalb County Hospital Authority
Revenue Bonds
DeKalb Medical Center, Inc. Project
Series 2010
09/01/30 | | | 6.000 | % | | | 5,000,000 | | | | 5,951,550 | | |
Gwinnett County Water & Sewerage Authority
Revenue Bonds
Series 2008
08/01/19 | | | 5.000 | % | | | 1,000,000 | | | | 1,220,980 | | |
State of Georgia
Unlimited General Obligation Bonds
Series 2007G
12/01/17 | | | 5.000 | % | | | 500,000 | | | | 607,135 | | |
Series 2012A
07/01/31 | | | 4.000 | % | | | 29,765,000 | | | | 33,359,719 | | |
Total | | | | | | | 60,132,889 | | |
Hawaii 0.5% | |
State of Hawaii
Unlimited General Obligation Bonds
Series 2008DK
05/01/22 | | | 5.000 | % | | | 10,750,000 | | | | 12,731,225 | | |
Illinois 5.0% | |
Chicago Board of Education
Unlimited General Obligation Refunding Bonds
Dedicated Revenues
Series 2005B (AMBAC)
12/01/21 | | | 5.000 | % | | | 5,825,000 | | | | 6,380,472 | | |
Series 2005A (AMBAC)
12/01/22 | | | 5.500 | % | | | 5,000,000 | | | | 6,222,200 | | |
Municipal Bonds (continued)
Issue
Description | | Coupon
Rate | | Principal
Amount ($) | | Value ($) | |
Chicago Transit Authority
Revenue Bonds
Federal Transit Administration Section 5309
Series 2008A
06/01/16 | | | 5.000 | % | | | 2,500,000 | | | | 2,808,625 | | |
Series 2011
12/01/29 | | | 5.250 | % | | | 4,000,000 | | | | 4,700,120 | | |
City of Chicago O'Hare International Airport
Refunding Revenue Bonds
General Airport 3rd Lien
Series 2005B (NPFGC)
01/01/17 | | | 5.250 | % | | | 10,000,000 | | | | 11,685,500 | | |
Passenger Facility Charge
Series 2012A
01/01/28 | | | 5.000 | % | | | 2,590,000 | | | | 2,951,124 | | |
01/01/29 | | | 5.000 | % | | | 2,500,000 | | | | 2,837,950 | | |
01/01/30 | | | 5.000 | % | | | 3,000,000 | | | | 3,413,160 | | |
City of Chicago
Limited General Obligation Refunding Bonds
Emergency Telephone System
Series 1999 (NPFGC/FGIC)
01/01/18 | | | 5.250 | % | | | 7,540,000 | | | | 8,866,588 | | |
Revenue Bonds
Asphalt Operating Services- Recovery Zone Facility
Series 2010
12/01/18 | | | 6.125 | % | | | 3,930,000 | | | | 4,215,632 | | |
County of Cook
Unlimited General Obligation Refunding Bonds
Series 2010A
11/15/22 | | | 5.250 | % | | | 12,000,000 | | | | 14,363,280 | | |
Illinois Finance Authority
Refunding Revenue Bonds
DePaul University
Series 2004A
10/01/17 | | | 5.375 | % | | | 1,000,000 | | | | 1,165,560 | | |
10/01/18 | | | 5.375 | % | | | 2,000,000 | | | | 2,377,300 | | |
Revenue Bonds
OSF Healthcare System
Series 2012A
05/15/24 | | | 4.500 | % | | | 10,350,000 | | | | 11,399,386 | | |
Illinois State Toll Highway Authority
Revenue Bonds
Senior Priority
Series 2006A-1 (AGM)
01/01/18 | | | 5.000 | % | | | 2,000,000 | | | | 2,299,920 | | |
Kendall & Kane Counties Community Unit School
District No. 115(b)
Unlimited General Obligation Bonds
Capital Appreciation
Series 2002 Escrowed to Maturity (FGIC)
01/01/17 | | | 0.000 | % | | | 600,000 | | | | 575,094 | | |
Unrefunded Unlimited General Obligation Bonds
Capital Appreciation
Series 2002 (NPFGC/FGIC)
01/01/17 | | | 0.000 | % | | | 3,050,000 | | | | 2,769,369 | | |
The accompanying Notes to Financial Statements are an integral part of this statement.
Annual Report 2012
12
Columbia Intermediate Municipal Bond Fund
Portfolio of Investments (continued)
October 31, 2012
Municipal Bonds (continued)
Issue
Description | | Coupon
Rate | | Principal
Amount ($) | | Value ($) | |
Railsplitter Tobacco Settlement Authority
Revenue Bonds
Series 2010
06/01/19 | | | 5.000 | % | | | 5,000,000 | | | | 5,785,900 | | |
06/01/21 | | | 5.250 | % | | | 12,000,000 | | | | 14,139,120 | | |
State of Illinois
Revenue Bonds
2nd Series 2002 (NPFGC/FGIC)
06/15/15 | | | 5.500 | % | | | 1,000,000 | | | | 1,127,920 | | |
Unlimited General Obligation Bonds
Series 2004 (AMBAC)
11/01/18 | | | 5.000 | % | | | 10,650,000 | | | | 11,491,776 | | |
Series 2005 (AGM)
09/01/17 | | | 5.000 | % | | | 5,000,000 | | | | 5,475,750 | | |
Unlimited General Obligation Refunding Bonds
Series 2012
08/01/24 | | | 5.000 | % | | | 6,000,000 | | | | 6,772,980 | | |
State of Illinois(b)
Revenue Bonds
Capital Appreciation-Civic Center
Series 1990B (AMBAC)
12/15/17 | | | 0.000 | % | | | 5,540,000 | | | | 4,803,402 | | |
Total | | | | | | | 138,628,128 | | |
Indiana 1.3% | |
Indiana Finance Authority
Refunding Revenue Bonds
Clarian Health Obligation Group
Series 2006B
02/15/24 | | | 5.000 | % | | | 1,000,000 | | | | 1,108,840 | | |
Indiana Power & Light Co.
Series 2009B
01/01/16 | | | 4.900 | % | | | 11,000,000 | | | | 12,059,080 | | |
Revenue Bonds
1st Lien-CWA Authority
Series 2011A
10/01/25 | | | 5.250 | % | | | 1,750,000 | | | | 2,119,635 | | |
2nd Lien-CWA Authority
Series 2011B
10/01/23 | | | 5.250 | % | | | 7,035,000 | | | | 8,497,576 | | |
Indiana Health & Educational Facilities Financing Authority
Revenue Bonds
Baptist Homes of Indiana
Series 2005
11/15/25 | | | 5.250 | % | | | 10,640,000 | | | | 11,113,693 | | |
Indiana Toll Road Commission
Revenue Bonds
Series 1980 Escrowed to Maturity
01/01/15 | | | 9.000 | % | | | 1,470,000 | | | | 1,620,234 | | |
Total | | | | | | | 36,519,058 | | |
Municipal Bonds (continued)
Issue
Description | | Coupon
Rate | | Principal
Amount ($) | | Value ($) | |
Iowa 0.2% | |
City of Coralville
Tax Allocation Bonds
Tax Increment
Series 2007C
06/01/17 | | | 5.000 | % | | | 730,000 | | | | 811,227 | | |
Iowa Finance Authority
Refunding Revenue Bonds
Development-Care Initiatives Project
Series 2006A
07/01/18 | | | 5.250 | % | | | 2,695,000 | | | | 2,941,862 | | |
Revenue Bonds
Iowa State Revolving Fund
Series 2008
08/01/20 | | | 5.250 | % | | | 500,000 | | | | 618,995 | | |
Total | | | | | | | 4,372,084 | | |
Kansas 1.0% | |
City of Manhattan
Revenue Bonds
Meadowlark Hills Retirement
Series 2007A
05/15/24 | | | 5.000 | % | | | 6,000,000 | | | | 6,107,040 | | |
County of Labette
Revenue Bonds
Capital Accumulator Bonds
Series 1982 Escrowed to Maturity(b)
12/01/14 | | | 0.000 | % | | | 2,175,000 | | | | 2,149,509 | | |
Kansas State Department of Transportation
Revenue Bonds
Series 2004A
03/01/18 | | | 5.500 | % | | | 11,775,000 | | | | 14,657,991 | | |
Kansas Turnpike Authority
Revenue Bonds
Series 2002 (AGM)
09/01/16 | | | 5.250 | % | | | 1,230,000 | | | | 1,446,566 | | |
Wyandotte County-Kansas City Unified Government
Refunding Revenue Bonds
Sales Tax-2nd Lien-Area B
Series 2005
12/01/20 | | | 5.000 | % | | | 2,805,000 | | | | 2,815,351 | | |
Total | | | | | | | 27,176,457 | | |
Kentucky 0.7% | |
Louisville & Jefferson County Metropolitan Sewer District
Revenue Bonds
Series 2009A
05/15/21 | | | 5.000 | % | | | 7,445,000 | | | | 8,902,508 | | |
05/15/22 | | | 5.000 | % | | | 7,825,000 | | | | 9,269,338 | | |
Total | | | | | | | 18,171,846 | | |
The accompanying Notes to Financial Statements are an integral part of this statement.
Annual Report 2012
13
Columbia Intermediate Municipal Bond Fund
Portfolio of Investments (continued)
October 31, 2012
Municipal Bonds (continued)
Issue
Description | | Coupon
Rate | | Principal
Amount ($) | | Value ($) | |
Louisiana 0.9% | |
Louisiana Office Facilities Corp.
Refunding Revenue Bonds
State Capital
Series 2010A
05/01/20 | | | 5.000 | % | | | 4,290,000 | | | | 5,220,072 | | |
Louisiana State Citizens Property Insurance Corp.
Revenue Bonds
Series 2006B (AMBAC)
06/01/16 | | | 5.000 | % | | | 500,000 | | | | 557,870 | | |
New Orleans Aviation Board
Revenue Bonds
Consolidated Rental Car
Series 2009A
01/01/25 | | | 6.000 | % | | | 4,250,000 | | | | 4,857,283 | | |
Parish of Morehouse
Refunding Revenue Bonds
International Paper Co. Project
Series 2001A
11/15/13 | | | 5.250 | % | | | 8,525,000 | | | | 8,896,178 | | |
Parish of St. Charles
Revenue Bonds
Valero Energy Corp.
Series 2010(a)
12/01/40 | | | 4.000 | % | | | 5,495,000 | | | | 6,031,257 | | |
Total | | | | | | | 25,562,660 | | |
Maryland 0.1% | |
Maryland State Department of Transportation
Revenue Bonds
Series 2002
02/01/15 | | | 5.500 | % | | | 3,750,000 | | | | 4,182,863 | | |
Massachusetts 5.5% | |
Commonwealth of Massachusetts
Limited General Obligation Bonds
Consolidated Loan
Series 2002C (NPFGC/FGIC)
11/01/14 | | | 5.500 | % | | | 2,000,000 | | | | 2,203,540 | | |
Series 2002D (AMBAC/TCRS/BNY)
08/01/18 | | | 5.500 | % | | | 6,500,000 | | | | 8,142,810 | | |
Limited General Obligation Refunding Bonds
Series 2003D
10/01/17 | | | 5.500 | % | | | 5,000,000 | | | | 6,125,300 | | |
Revenue Bonds
Consolidated Loan
Series 2005A (AGM)
06/01/16 | | | 5.500 | % | | | 13,615,000 | | | | 15,968,489 | | |
Unlimited General Obligation Bonds
Consolidated Loan
Series 1998C
08/01/17 | | | 5.250 | % | | | 1,775,000 | | | | 2,142,425 | | |
Municipal Bonds (continued)
Issue
Description | | Coupon
Rate | | Principal
Amount ($) | | Value ($) | |
Unlimited General Obligation Refunding Bonds
Series 2004C (AGM)
12/01/16 | | | 5.500 | % | | | 10,000,000 | | | | 11,963,800 | | |
Commonwealth of Massachusetts(a)
Limited General Obligation Refunding Bonds
Series 2007A
11/01/25 | | | 0.848 | % | | | 10,000,000 | | | | 9,271,100 | | |
Unlimited General Obligation Bonds
Series 2010A
02/01/14 | | | 0.740 | % | | | 2,000,000 | | | | 2,000,740 | | |
Massachusetts Bay Transportation Authority
Revenue Bonds
General Transportation
Series 1991 Escrowed to Maturity (NPFGC)
03/01/21 | | | 7.000 | % | | | 2,425,000 | | | | 2,767,046 | | |
Unrefunded Revenue Bonds
General Transportation
Series 1991 (NPFGC)
03/01/21 | | | 7.000 | % | | | 2,860,000 | | | | 3,785,353 | | |
Massachusetts Development Finance Agency
Revenue Bonds
1st Mortgage-Orchard Cove
Series 2007
10/01/17 | | | 5.000 | % | | | 695,000 | | | | 725,719 | | |
Massachusetts Health & Educational Facilities Authority
Revenue Bonds
Boston College
Series 2008M-1
06/01/24 | | | 5.500 | % | | | 2,670,000 | | | | 3,476,153 | | |
Caregroup
Series 2008E-2
07/01/20 | | | 5.375 | % | | | 9,720,000 | | | | 11,378,135 | | |
07/01/22 | | | 5.375 | % | | | 13,345,000 | | | | 15,356,359 | | |
Harvard University
Series 2009A
11/15/19 | | | 5.250 | % | | | 1,000,000 | | | | 1,250,290 | | |
Massachusetts Institute of Technology
Series 2009O
07/01/26 | | | 5.000 | % | | | 500,000 | | | | 595,915 | | |
Massachusetts Port Authority
Refunding Revenue Bonds
Passenger Facility Charge
Series 2007D (AGM)
07/01/17 | | | 5.000 | % | | | 8,500,000 | | | | 9,946,870 | | |
Revenue Bonds
Series 2010A
07/01/25 | | | 5.000 | % | | | 1,500,000 | | | | 1,808,865 | | |
Massachusetts School Building Authority
Refunding Revenue Bonds
Senior Series 2012A
08/15/26 | | | 5.000 | % | | | 16,000,000 | | | | 19,782,560 | | |
The accompanying Notes to Financial Statements are an integral part of this statement.
Annual Report 2012
14
Columbia Intermediate Municipal Bond Fund
Portfolio of Investments (continued)
October 31, 2012
Municipal Bonds (continued)
Issue
Description | | Coupon
Rate | | Principal
Amount ($) | | Value ($) | |
Massachusetts Water Pollution Abatement Trust (The)
Refunding Revenue Bonds
Pool Program
Series 2004A
08/01/17 | | | 5.250 | % | | | 2,920,000 | | | | 3,549,026 | | |
Revenue Bonds
MWRA Program
Subordinated Series 1999A
08/01/19 | | | 6.000 | % | | | 2,500,000 | | | | 3,284,975 | | |
State Revolving Fund
Series 2009-14
08/01/24 | | | 5.000 | % | | | 12,530,000 | | | | 15,371,052 | | |
Total | | | | | | | 150,896,522 | | |
Michigan 2.4% | |
City of Detroit Sewage Disposal System
Prerefunded 07/01/13 Revenue Bonds
Senior Lien
Series 2003A (AGM)
07/01/14 | | | 5.000 | % | | | 7,180,000 | | | | 7,406,026 | | |
Refunding Revenue Bonds
Senior Lien
Series 2012A
07/01/26 | | | 5.250 | % | | | 2,000,000 | | | | 2,222,440 | | |
07/01/27 | | | 5.250 | % | | | 1,500,000 | | | | 1,661,715 | | |
Unrefunded Revenue Bonds
Senior Lien
Series 2003A (AGM)
07/01/14 | | | 5.000 | % | | | 2,820,000 | | | | 2,887,172 | | |
Detroit City School District
Unlimited General Obligation Bonds
School Building & Site Improvement
Series 2002A (FGIC) (Qualified School Bond Loan Fund)
05/01/19 | | | 6.000 | % | | | 2,000,000 | | | | 2,459,380 | | |
Series 2003B (FGIC) (Qualified School Bond Loan Fund)
05/01/14 | | | 5.250 | % | | | 6,335,000 | | | | 6,493,185 | | |
Dickinson County Economic Development Corp.
Refunding Revenue Bonds
International Paper Company Projects
Series 2004A
11/01/18 | | | 4.800 | % | | | 6,750,000 | | | | 7,072,582 | | |
Michigan Public Power Agency
Refunding Revenue Bonds
Belle River Project
Series 2002A (NPFGC)
01/01/16 | | | 5.250 | % | | | 1,000,000 | | | | 1,131,800 | | |
Michigan State Building Authority
Refunding Revenue Bonds
Facilities Program
Series 2003I (AGM)
10/15/14 | | | 5.250 | % | | | 10,000,000 | | | | 10,463,100 | | |
Municipal Bonds (continued)
Issue
Description | | Coupon
Rate | | Principal
Amount ($) | | Value ($) | |
Saginaw Hospital Finance Authority
Refunding Revenue Bonds
Covenant Medical Center
Series 2004G
07/01/22 | | | 5.125 | % | | | 10,000,000 | | | | 10,535,700 | | |
State of Michigan Trunk Line
Refunding Revenue Bonds
Series 1998A
11/01/16 | | | 5.500 | % | | | 2,000,000 | | | | 2,369,460 | | |
Series 2005 (AGM)
11/01/17 | | | 5.250 | % | | | 5,050,000 | | | | 6,126,660 | | |
Revenue Bonds
Series 2011
11/15/27 | | | 5.000 | % | | | 1,000,000 | | | | 1,194,880 | | |
11/15/28 | | | 5.000 | % | | | 1,000,000 | | | | 1,190,430 | | |
11/15/29 | | | 5.000 | % | | | 1,205,000 | | | | 1,428,082 | | |
State of Michigan
Unlimited General Obligation Refunding Bonds
Series 2001
12/01/15 | | | 5.500 | % | | | 1,250,000 | | | | 1,433,313 | | |
Total | | | | | | | 66,075,925 | | |
Minnesota 0.1% | |
City of Minneapolis
Revenue Bonds
Fairview Health Services
Series 2008A
11/15/18 | | | 6.000 | % | | | 1,000,000 | | | | 1,140,520 | | |
City of St. Louis Park
Revenue Bonds
Park Nicollet Health Services
Series 2008C
07/01/23 | | | 5.500 | % | | | 750,000 | | | | 843,480 | | |
St. Paul Housing & Redevelopment Authority
Revenue Bonds
HealthPartners Obligation Group Project
Series 2006
05/15/23 | | | 5.250 | % | | | 500,000 | | | | 534,850 | | |
State of Minnesota
Unlimited General Obligation Bonds
Series 2008C
08/01/19 | | | 5.000 | % | | | 500,000 | | | | 627,565 | | |
Total | | | | | | | 3,146,415 | | |
Missouri 1.0% | |
City of Fenton
Refunding Tax Allocation Bonds
Gravois Bluffs Redevelopment Project
Series 2006
04/01/21 | | | 4.500 | % | | | 430,000 | | | | 440,169 | | |
The accompanying Notes to Financial Statements are an integral part of this statement.
Annual Report 2012
15
Columbia Intermediate Municipal Bond Fund
Portfolio of Investments (continued)
October 31, 2012
Municipal Bonds (continued)
Issue
Description | | Coupon
Rate | | Principal
Amount ($) | | Value ($) | |
City of St. Louis
Refunding Revenue Bonds
Lambert International Airport
Series 2007A (AGM)
07/01/21 | | | 5.000 | % | | | 5,000,000 | | | | 5,626,200 | | |
Missouri Highway & Transportation Commission
Revenue Bonds
2nd Lien
Series 2007
05/01/17 | | | 5.000 | % | | | 1,000,000 | | | | 1,189,030 | | |
Missouri Joint Municipal Electric Utility Commission
Revenue Bonds
IATAN 2 Project
Series 2009A
01/01/17 | | | 4.500 | % | | | 1,000,000 | | | | 1,128,490 | | |
Missouri State Environmental Improvement &
Energy Resources Authority
Revenue Bonds
State Revolving Funds Program
Series 2004B
01/01/18 | | | 5.250 | % | | | 7,470,000 | | | | 9,140,591 | | |
Missouri State Health & Educational Facilities Authority
Revenue Bonds
St. Louis University
Series 1998
10/01/16 | | | 5.500 | % | | | 1,000,000 | | | | 1,185,110 | | |
Washington University
Series 2001A
06/15/16 | | | 5.500 | % | | | 1,000,000 | | | | 1,178,890 | | |
Series 2008A
03/15/18 | | | 5.250 | % | | | 1,000,000 | | | | 1,230,810 | | |
St. Louis County Industrial Development Authority
Revenue Bonds
St. Andrews Residence for Seniors
Series 2007A
12/01/26 | | | 6.250 | % | | | 7,000,000 | | | | 7,423,570 | | |
Total | | | | | | | 28,542,860 | | |
Nebraska 0.1% | |
Elkhorn School District
Unlimited General Obligation Bonds
Series 2009
06/15/19 | | | 5.375 | % | | | 500,000 | | | | 530,410 | | |
Municipal Energy Agency of Nebraska
Refunding Revenue Bonds
Series 2009A (BHAC)
04/01/21 | | | 5.000 | % | | | 750,000 | | | | 895,455 | | |
Nebraska Public Power District
Revenue Bonds
Series 2008B
01/01/20 | | | 5.000 | % | | | 570,000 | | | | 667,265 | | |
Municipal Bonds (continued)
Issue
Description | | Coupon
Rate | | Principal
Amount ($) | | Value ($) | |
University of Nebraska
Revenue Bonds
Lincoln Student Fees & Facilities
Series 2009A
07/01/23 | | | 5.000 | % | | | 700,000 | | | | 829,724 | | |
Total | | | | | | | 2,922,854 | | |
Nevada 1.5% | |
City of Carson City
Refunding Revenue Bonds
Carson Tahoe Regional Medical Center
Series 2012
09/01/27 | | | 5.000 | % | | | 3,250,000 | | | | 3,582,313 | | |
City of Sparks
Revenue Bonds
Senior Sales Tax Anticipation
Series 2008A(d)
06/15/20 | | | 6.500 | % | | | 5,395,000 | | | | 5,615,440 | | |
Clark County School District
Prerefunded 12/15/13 Limited General Obligation Bonds
Series 2003D (NPFGC)
06/15/16 | | | 5.000 | % | | | 10,760,000 | | | | 11,332,324 | | |
County of Clark Airport System
Revenue Bonds
System Subordinated Lien
Series 2009C (AGM)
07/01/25 | | | 5.000 | % | | | 8,190,000 | | | | 9,233,406 | | |
County of Clark
Limited General Obligation Refunding Bonds
Transportation
Series 2009A
12/01/28 | | | 5.000 | % | | | 10,740,000 | | | | 12,285,486 | | |
Total | | | | | | | 42,048,969 | | |
New Hampshire 0.9% | |
City of Manchester
Refunding Revenue Bonds
Series 2004 (NPFGC)
06/01/19 | | | 5.500 | % | | | 4,450,000 | | | | 5,648,652 | | |
New Hampshire Business Finance Authority
Revenue Bonds
Public Service Co. Project
Series 2001C (NPFGC)
05/01/21 | | | 5.450 | % | | | 1,500,000 | | | | 1,521,585 | | |
New Hampshire Health & Education Facilities Authority
Revenue Bonds
Southern New Hampshire Medical Center
Series 2007A
10/01/23 | | | 5.250 | % | | | 7,000,000 | | | | 7,665,350 | | |
University System
Series 2009A
07/01/23 | | | 5.000 | % | | | 8,370,000 | | | | 9,781,768 | | |
Total | | | | | | | 24,617,355 | | |
The accompanying Notes to Financial Statements are an integral part of this statement.
Annual Report 2012
16
Columbia Intermediate Municipal Bond Fund
Portfolio of Investments (continued)
October 31, 2012
Municipal Bonds (continued)
Issue
Description | | Coupon
Rate | | Principal
Amount ($) | | Value ($) | |
New Jersey 5.2% | |
Bergen County Improvement Authority
Revenue Bonds
Bergen County Utilities
Series 2008
12/15/26 | | | 5.000 | % | | | 500,000 | | | | 572,505 | | |
Camden County Improvement Authority
Revenue Bonds
County Guaranteed
Series 2006A (AMBAC)
09/01/21 | | | 4.000 | % | | | 1,140,000 | | | | 1,211,410 | | |
Cape May County Municipal Utilities Authority
Refunding Revenue Bonds
Series 2002A (AGM)
01/01/16 | | | 5.750 | % | | | 1,000,000 | | | | 1,155,490 | | |
City of Atlantic City
Unlimited General Obligation Bonds
Series 2008A
02/15/18 | | | 5.500 | % | | | 500,000 | | | | 588,675 | | |
City of Newark
Unlimited General Obligation Refunding Bonds
General Improvement
Series 2010A
10/01/18 | | | 4.000 | % | | | 1,000,000 | | | | 1,114,610 | | |
City of Summit
Unlimited General Obligation Refunding Bonds
Series 2001
06/01/16 | | | 5.250 | % | | | 605,000 | | | | 707,203 | | |
County of Passaic
Unlimited General Obligation Refunding Bonds
Series 2003 (AGM)
09/01/16 | | | 5.200 | % | | | 1,500,000 | | | | 1,735,305 | | |
Cumberland County Improvement Authority
Revenue Bonds
Vineland Local Unit Program
Series 2009A
04/15/19 | | | 4.000 | % | | | 750,000 | | | | 864,878 | | |
East Orange Board of Educatioin
Certificate of Participation
Capital Appreciation
Series 1998 (AGM)(b)
02/01/18 | | | 0.000 | % | | | 1,000,000 | | | | 854,750 | | |
Essex County Improvement Authority
Refunding Revenue Bonds
County Guaranteed Project Consolidation
Series 2004 (NPFGC)
10/01/26 | | | 5.500 | % | | | 750,000 | | | | 983,827 | | |
Essex County Utilities Authority
Refunding Revenue Bonds
Series 2009 (AGM)
04/01/20 | | | 5.000 | % | | | 1,000,000 | | | | 1,165,070 | | |
Municipal Bonds (continued)
Issue
Description | | Coupon
Rate | | Principal
Amount ($) | | Value ($) | |
Flemington Raritan Regional Board of Education
Unlimited General Obligation Bonds
Series 2000 (NPFGC/FGIC)
02/01/15 | | | 5.700 | % | | | 400,000 | | | | 442,268 | | |
Freehold Regional High School District
Unlimited General Obligation Refunding Bonds
Series 2001 (NPFGC/FGIC)
03/01/20 | | | 5.000 | % | | | 1,205,000 | | | | 1,490,091 | | |
Hudson County Improvement Authority
Refunding Revenue Bonds
Hudson County Lease Project
Series 2010 (AGM)
10/01/24 | | | 5.375 | % | | | 2,000,000 | | | | 2,488,820 | | |
Jersey City Municipal Utilities Authority
Refunding Revenue Bonds
Series 2007 (NPFGC/FGIC)
01/01/19 | | | 5.250 | % | | | 1,000,000 | | | | 1,160,560 | | |
Manalapan-Englishtown Regional Board Of Education
Unlimited General Obligation Refunding Bonds
Series 2004 (NPFGC/FGIC)
12/01/20 | | | 5.750 | % | | | 1,325,000 | | | | 1,743,872 | | |
Middlesex County Improvement Authority
Revenue Bonds
George Street Student Housing Project
Series 2004A
08/15/18 | | | 5.000 | % | | | 500,000 | | | | 522,300 | | |
Heldrich Center Hotel
Senior Series 2005A
01/01/20 | | | 5.000 | % | | | 815,000 | | | | 525,129 | | |
New Jersey Economic Development Authority
Refunding Revenue Bonds
New Jersey American Water Co.
Series 2010A
06/01/23 | | | 4.450 | % | | | 1,000,000 | | | | 1,120,070 | | |
School Facilities-Construction
Series 2005K (AMBAC)
12/15/20 | | | 5.250 | % | | | 16,710,000 | | | | 20,827,678 | | |
Series 2009AA
12/15/20 | | | 5.250 | % | | | 1,000,000 | | | | 1,212,090 | | |
Revenue Bonds
Cigarette Tax
Series 2004
06/15/15 | | | 5.375 | % | | | 4,000,000 | | | | 4,519,880 | | |
06/15/16 | | | 5.500 | % | | | 5,500,000 | | | | 6,492,805 | | |
Liberty State Park Project
Series 2005C (AGM)
03/01/19 | | | 5.000 | % | | | 2,000,000 | | | | 2,187,040 | | |
MSU Student Housing Project
Series 2010
06/01/21 | | | 5.000 | % | | | 1,000,000 | | | | 1,128,220 | | |
Motor Vehicle Surcharges
Series 2004A (NPFGC)
07/01/17 | | | 5.250 | % | | | 1,000,000 | | | | 1,077,600 | | |
Newark Downtown District Management Corp.
Series 2007
06/15/27 | | | 5.125 | % | | | 400,000 | | | | 422,256 | | |
The accompanying Notes to Financial Statements are an integral part of this statement.
Annual Report 2012
17
Columbia Intermediate Municipal Bond Fund
Portfolio of Investments (continued)
October 31, 2012
Municipal Bonds (continued)
Issue
Description | | Coupon
Rate | | Principal
Amount ($) | | Value ($) | |
New Jersey Economic Development Authority(b)
Revenue Bonds
Capital Appreciation-Motor Vehicle Surcharges
Series 2004 (NPFGC)
07/01/21 | | | 0.000 | % | | | 1,255,000 | | | | 927,909 | | |
New Jersey Educational Facilities Authority
Refunding Revenue Bonds
Rowan University
Series 2008B (AGM)
07/01/23 | | | 5.000 | % | | | 750,000 | | | | 848,475 | | |
Revenue Bonds
Drew University
Series 2003C (NPFGC/FGIC)
07/01/20 | | | 5.250 | % | | | 1,000,000 | | | | 1,200,410 | | |
New Jersey Health Care Facilities Financing Authority
Revenue Bonds
Children's Specialized Hospital
Series 2005A
07/01/18 | | | 5.000 | % | | | 575,000 | | | | 604,089 | | |
South Jersey Hospital
Series 2006
07/01/20 | | | 5.000 | % | | | 1,550,000 | | | | 1,682,649 | | |
St. Josephs Healthcare System
Series 2008
07/01/18 | | | 6.000 | % | | | 500,000 | | | | 583,855 | | |
New Jersey Higher Education Student Assistance
Authority
Refunding Revenue Bonds
Series 2010-1A
12/01/18 | | | 4.300 | % | | | 680,000 | | | | 772,874 | | |
12/01/25 | | | 5.000 | % | | | 1,000,000 | | | | 1,100,100 | | |
Revenue Bonds
Series 2010-2
12/01/18 | | | 3.750 | % | | | 1,000,000 | | | | 1,091,310 | | |
New Jersey Housing & Mortgage Finance Agency
Revenue Bonds
Series 2008AA
10/01/28 | | | 6.375 | % | | | 355,000 | | | | 384,611 | | |
New Jersey State Turnpike Authority
Revenue Bonds
Series 1989 Escrowed to Maturity
01/01/19 | | | 6.000 | % | | | 1,000,000 | | | | 1,243,770 | | |
New Jersey Transit Corp.
Certificate of Participation
Federal Transit Administration Grants
Series 2002A (AMBAC)
09/15/15 | | | 5.500 | % | | | 7,725,000 | | | | 8,651,459 | | |
Subordinated Series 2005A (NPFGC/FGIC)
09/15/17 | | | 5.000 | % | | | 1,000,000 | | | | 1,134,460 | | |
Municipal Bonds (continued)
Issue
Description | | Coupon
Rate | | Principal
Amount ($) | | Value ($) | |
New Jersey Transportation Trust Fund Authority
Revenue Bonds
Transportation System
Series 2001C (AGM)
12/15/18 | | | 5.500 | % | | | 2,000,000 | | | | 2,484,140 | | |
Series 2003A (AMBAC)
12/15/15 | | | 5.500 | % | | | 4,260,000 | | | | 4,880,767 | | |
Series 2006A
12/15/20 | | | 5.250 | % | | | 1,000,000 | | | | 1,251,540 | | |
12/15/21 | | | 5.500 | % | | | 680,000 | | | | 865,579 | | |
Series 2006A (AGM)
12/15/21 | | | 5.500 | % | | | 4,700,000 | | | | 6,005,002 | | |
12/15/22 | | | 5.250 | % | | | 4,000,000 | | | | 5,033,040 | | |
Series 2010D
12/15/23 | | | 5.250 | % | | | 25,000,000 | | | | 31,427,250 | | |
North Brunswick Township Board of Education
Unlimited General Obligation Refunding Bonds
Series 2010
07/15/18 | | | 4.000 | % | | | 1,000,000 | | | | 1,149,840 | | |
Robbinsville Board of Education
Unlimited General Obligation Refunding Bonds
Series 2005 (AGM)
01/01/28 | | | 5.250 | % | | | 500,000 | | | | 662,950 | | |
Scotch Plains-Fanwood School District
Unlimited General Obligation Refunding Bonds
Series 2010
07/15/19 | | | 4.000 | % | | | 845,000 | | | | 985,515 | | |
South Jersey Port Corp.
Revenue Bonds
Marine Terminal
Series 2009P-2
01/01/16 | | | 4.000 | % | | | 1,150,000 | | | | 1,259,146 | | |
State of New Jersey
Certificate of Participation
Equipment Lease Purchase
Series 2008A
06/15/17 | | | 5.000 | % | | | 1,565,000 | | | | 1,809,954 | | |
06/15/21 | | | 5.000 | % | | | 250,000 | | | | 285,508 | | |
06/15/23 | | | 5.000 | % | | | 1,000,000 | | | | 1,123,800 | | |
Series 2009A
06/15/17 | | | 5.000 | % | | | 1,000,000 | | | | 1,156,520 | | |
Tobacco Settlement Financing Corp.
Prerefunded 06/01/13 Revenue Bonds
Series 2003
06/01/39 | | | 6.750 | % | | | 4,000,000 | | | | 4,152,320 | | |
Toms River Board of Education
Unlimited General Obligation Refunding Bonds
Regional Schools
Series 2007 (NPFGC)
01/15/20 | | | 4.500 | % | | | 500,000 | | | | 561,880 | | |
Total | | | | | | | 143,635,124 | | |
The accompanying Notes to Financial Statements are an integral part of this statement.
Annual Report 2012
18
Columbia Intermediate Municipal Bond Fund
Portfolio of Investments (continued)
October 31, 2012
Municipal Bonds (continued)
Issue
Description | | Coupon
Rate | | Principal
Amount ($) | | Value ($) | |
New Mexico 0.1% | |
County of Bernalillo
Refunding Revenue Bonds
Series 1998
04/01/27 | | | 5.250 | % | | | 3,000,000 | | | | 3,778,950 | | |
New York 12.7% | |
Albany Industrial Development Agency
Revenue Bonds
St. Peters Hospital Project
Series 2008A
11/15/16 | | | 5.250 | % | | | 1,750,000 | | | | 2,019,448 | | |
11/15/17 | | | 5.250 | % | | | 1,250,000 | | | | 1,474,425 | | |
City of New York
Unlimited General Obligation Bonds
Series 2005D
08/01/13 | | | 5.000 | % | | | 4,000,000 | | | | 4,141,680 | | |
Series 2005G
08/01/20 | | | 5.000 | % | | | 10,000,000 | | | | 11,321,700 | | |
Series 2007D-1
12/01/21 | | | 5.000 | % | | | 5,900,000 | | | | 7,034,511 | | |
Subordinated Series 2008B-1
09/01/22 | | | 5.250 | % | | | 7,200,000 | | | | 8,813,160 | | |
Metropolitan Transportation Authority
Revenue Bonds
Commuter Facilities
Series 1993O Escrowed to Maturity
07/01/17 | | | 5.500 | % | | | 3,000,000 | | | | 3,588,270 | | |
Series 2004A (NPFGC/FGIC)
11/15/16 | | | 5.250 | % | | | 3,000,000 | | | | 3,543,810 | | |
11/15/17 | | | 5.250 | % | | | 4,000,000 | | | | 4,858,360 | | |
Series 2007A (AGM)
11/15/20 | | | 5.000 | % | | | 5,000,000 | | | | 5,844,600 | | |
11/15/21 | | | 5.000 | % | | | 3,000,000 | | | | 3,494,070 | | |
Series 2009A
11/15/26 | | | 5.300 | % | | | 710,000 | | | | 833,405 | | |
Series 2012E
11/15/28 | | | 5.000 | % | | | 3,900,000 | | | | 4,601,415 | | |
Monroe County Industrial Development Agency
Refunding Revenue Bonds
Highland Hospital of Rochester
Series 2005
08/01/14 | | | 5.000 | % | | | 730,000 | | | | 776,173 | | |
08/01/15 | | | 5.000 | % | | | 545,000 | | | | 597,167 | | |
Nassau County Interim Finance Authority
Prerefunded 11/15/13 Revenue Bonds
Sales Tax Secured
Series 2003B (AMBAC)
11/15/14 | | | 5.000 | % | | | 5,720,000 | | | | 6,002,968 | | |
Nassau County Local Economic Assistance Corp.
Refunding Revenue Bonds
Catholic Health Services
Series 2011
07/01/19 | | | 5.000 | % | | | 6,125,000 | | | | 7,037,502 | | |
07/01/20 | | | 5.000 | % | | | 9,390,000 | | | | 10,750,423 | | |
Municipal Bonds (continued)
Issue
Description | | Coupon
Rate | | Principal
Amount ($) | | Value ($) | |
New York City Transitional Finance Authority Building Aid
Revenue Bonds
Series 2012S-1
07/15/29 | | | 5.000 | % | | | 7,000,000 | | | | 8,432,620 | | |
New York City Transitional Finance Authority
Prerefunded 02/01/14 Revenue Bonds
Future Tax Secured
Series 2004
02/01/18 | | | 5.250 | % | | | 3,495,000 | | | | 3,711,271 | | |
Revenue Bonds
Future Tax Secured
Series 2009A
05/01/27 | | | 5.000 | % | | | 10,430,000 | | | | 12,468,752 | | |
Subordinated Series 2007C-1
11/01/20 | | | 5.000 | % | | | 10,300,000 | | | | 12,330,748 | | |
Unrefunded Revenue Bonds
Future Tax Secured
Series 2004
02/01/18 | | | 5.250 | % | | | 5,000 | | | | 5,302 | | |
New York State Dormitory Authority
Refunding Revenue Bonds
Consolidated Service Contract
Series 2009A
07/01/24 | | | 5.000 | % | | | 3,500,000 | | | | 4,095,035 | | |
Revenue Bonds
City University System
Series 1995A (AMBAC/TCRS)
07/01/16 | | | 5.625 | % | | | 1,245,000 | | | | 1,380,095 | | |
Series 1995A (FGIC)
07/01/16 | | | 5.625 | % | | | 4,965,000 | | | | 5,503,752 | | |
Court Facilities Lease
Series 2005A (AMBAC)
05/15/18 | | | 5.250 | % | | | 6,000,000 | | | | 7,236,120 | | |
Mount Sinai School of Medicine
Series 2009
07/01/26 | | | 5.500 | % | | | 14,635,000 | | | | 16,830,396 | | |
07/01/27 | | | 5.500 | % | | | 10,675,000 | | | | 12,227,679 | | |
North Shore-Long Island Jewish Health
Series 2009A
05/01/30 | | | 5.250 | % | | | 4,750,000 | | | | 5,335,153 | | |
St. Johns University
Series 2007C (NPFGC)
07/01/23 | | | 5.250 | % | | | 3,245,000 | | | | 4,062,123 | | |
State University Educational Facilities
3rd General Series 2005A (NPFGC/FGIC)
05/15/17 | | | 5.500 | % | | | 10,000,000 | | | | 12,041,000 | | |
05/15/22 | | | 5.500 | % | | | 6,730,000 | | | | 8,687,286 | | |
Series 1993A
05/15/15 | | | 5.250 | % | | | 5,850,000 | | | | 6,342,804 | | |
Series 1993A (AGM)
05/15/15 | | | 5.250 | % | | | 4,000,000 | | | | 4,327,440 | | |
Upstate Community-State Supported
Series 2005B (NPFGC/FGIC)
07/01/21 | | | 5.500 | % | | | 6,345,000 | | | | 8,080,865 | | |
The accompanying Notes to Financial Statements are an integral part of this statement.
Annual Report 2012
19
Columbia Intermediate Municipal Bond Fund
Portfolio of Investments (continued)
October 31, 2012
Municipal Bonds (continued)
Issue
Description | | Coupon
Rate | | Principal
Amount ($) | | Value ($) | |
New York State Thruway Authority
Revenue Bonds
2nd General Series 2005B (AMBAC)
04/01/20 | | | 5.500 | % | | | 10,840,000 | | | | 13,813,629 | | |
2nd General Series 2007B
04/01/19 | | | 5.000 | % | | | 5,000,000 | | | | 5,966,550 | | |
General Revenue
Series 2012I
01/01/24 | | | 5.000 | % | | | 8,500,000 | | | | 10,316,280 | | |
Series 2007H (NPFGC/FGIC)
01/01/23 | | | 5.000 | % | | | 1,500,000 | | | | 1,760,040 | | |
New York State Urban Development Corp.
Refunding Revenue Bonds
Service Contract
Series 2008B
01/01/19 | | | 5.000 | % | | | 4,000,000 | | | | 4,801,080 | | |
01/01/20 | | | 5.000 | % | | | 10,460,000 | | | | 12,491,750 | | |
Revenue Bonds
State Personal Income Tax-State Facilities
Series 2004A-2 (NPFGC)
03/15/20 | | | 5.500 | % | | | 29,450,000 | | | | 37,821,457 | | |
Niagara County Industrial Development Agency
Refunding Revenue Bonds
Series 2001B AMT(a)(f)
11/15/24 | | | 5.550 | % | | | 8,000,000 | | | | 8,016,400 | | |
Port Authority of New York & New Jersey
Revenue Bonds
Consolidated 154th
Series 2009
09/01/26 | | | 4.750 | % | | | 1,000,000 | | | | 1,142,970 | | |
Triborough Bridge & Tunnel Authority
Revenue Bonds
Subordinated Series 2008D
11/15/22 | | | 5.000 | % | | | 10,000,000 | | | | 11,597,500 | | |
Triborough Bridge & Tunnel Authority(a)
Revenue Bonds
General
Subordinated Series 2008B-1
11/15/25 | | | 5.000 | % | | | 21,500,000 | | | | 22,515,015 | | |
Total | | | | | | | 350,074,199 | | |
North Carolina 1.5% | |
Albemarle Hospital Authority
Refunding Revenue Bonds
Series 2007
10/01/21 | | | 5.250 | % | | | 3,000,000 | | | | 3,183,630 | | |
10/01/27 | | | 5.250 | % | | | 3,700,000 | | | | 3,809,520 | | |
Cape Fear Public Utility Authority
Revenue Bonds
Series 2008
08/01/20 | | | 5.000 | % | | | 800,000 | | | | 960,888 | | |
Municipal Bonds (continued)
Issue
Description | | Coupon
Rate | | Principal
Amount ($) | | Value ($) | |
City of Charlotte Water & Sewer System
Revenue Bonds
Water & Sewer
Series 2008
07/01/26 | | | 5.000 | % | | | 1,250,000 | | | | 1,495,812 | | |
County of Iredell
Certificate of Participation
Iredell County School Project
Series 2008 (AGM)
06/01/17 | | | 5.250 | % | | | 1,710,000 | | | | 2,019,972 | | |
North Carolina Eastern Municipal Power Agency
Refunding Revenue Bonds
Series 2008A (AGM)
01/01/19 | | | 5.250 | % | | | 5,415,000 | | | | 6,397,119 | | |
Revenue Bonds
Series 2009B
01/01/26 | | | 5.000 | % | | | 17,625,000 | | | | 20,117,175 | | |
North Carolina Medical Care Commission
Revenue Bonds
Health Care Housing-Arc Projects
Series 2004A
10/01/24 | | | 5.500 | % | | | 1,575,000 | | | | 1,663,247 | | |
State of North Carolina
Unlimited General Obligation Refunding Bonds
Series 2005B
04/01/17 | | | 5.000 | % | | | 1,000,000 | | | | 1,189,820 | | |
Total | | | | | | | 40,837,183 | | |
Ohio 1.9% | |
American Municipal Power, Inc.
Revenue Bonds
AMP Fremont Energy Center Project
Series 2012
02/15/24 | | | 5.000 | % | | | 2,000,000 | | | | 2,381,960 | | |
Prairie State Energy Campus Project
Series 2008A
02/15/20 | | | 5.250 | % | | | 4,060,000 | | | | 4,809,151 | | |
02/15/22 | | | 5.250 | % | | | 9,810,000 | | | | 11,411,679 | | |
City of Cleveland
Limited General Obligation Refunding Bonds
Series 2005 (AMBAC)
10/01/16 | | | 5.500 | % | | | 7,710,000 | | | | 8,990,708 | | |
County of Hamilton Sewer System
Refunding Revenue Bonds
Series 2005A (NPFGC)
12/01/15 | | | 5.000 | % | | | 5,535,000 | | | | 6,179,274 | | |
County of Montgomery
Revenue Bonds
Catholic Health Initiatives
Series 2008D-2(a)
10/01/38 | | | 5.250 | % | | | 8,000,000 | | | | 8,369,840 | | |
The accompanying Notes to Financial Statements are an integral part of this statement.
Annual Report 2012
20
Columbia Intermediate Municipal Bond Fund
Portfolio of Investments (continued)
October 31, 2012
Municipal Bonds (continued)
Issue
Description | | Coupon
Rate | | Principal
Amount ($) | | Value ($) | |
Mason City School District
Unlimited General Obligation Refunding Bonds
Series 2005 (NPFGC/FGIC)
12/01/19 | | | 5.250 | % | | | 2,250,000 | | | | 2,842,695 | | |
Ohio State Turnpike Commission
Refunding Revenue Bonds
Series 1998A (NPFGC/FGIC)
02/15/21 | | | 5.500 | % | | | 2,000,000 | | | | 2,570,520 | | |
State of Ohio
Refunding Revenue Bonds
Cleveland Clinic Health System
Series 2011
01/01/25 | | | 5.000 | % | | | 3,750,000 | | | | 4,342,463 | | |
Total | | | | | | | 51,898,290 | | |
Oklahoma 0.2% | |
Chickasaw Nation
Revenue Bonds
Health System
Series 2007(d)
12/01/17 | | | 5.375 | % | | | 2,965,000 | | | | 3,126,859 | | |
Cleveland County Justice Authority
Revenue Bonds
Detention Facility Project
Series 2009A
03/01/15 | | | 5.000 | % | | | 1,260,000 | | | | 1,351,716 | | |
Total | | | | | | | 4,478,575 | | |
Oregon 0.1% | |
Oregon State Department of Administrative Services
Revenue Bonds
Series 2009A
04/01/24 | | | 5.250 | % | | | 1,000,000 | | | | 1,196,780 | | |
Yamhill Clackamas & Washington Counties School
District No. 29J Newberg
Unlimited General Obligation Refunding Bonds
Series 2005 (NPFGC/FGIC)
06/15/17 | | | 5.500 | % | | | 2,500,000 | | | | 3,022,025 | | |
Total | | | | | | | 4,218,805 | | |
Pennsylvania 3.0% | |
City of Philadelphia
Unlimited General Obligation Bonds
Series 2011
08/01/19 | | | 5.250 | % | | | 3,795,000 | | | | 4,424,439 | | |
Commonwealth of Pennsylvania
Unlimited General Obligation Refunding Bonds
Series 2002
02/01/15 | | | 5.500 | % | | | 3,000,000 | | | | 3,339,810 | | |
Series 2004 (AGM)
07/01/18 | | | 5.375 | % | | | 12,000,000 | | | | 14,937,720 | | |
Series 2004 (NPFGC)
07/01/16 | | | 5.375 | % | | | 10,000,000 | | | | 11,737,000 | | |
Municipal Bonds (continued)
Issue
Description | | Coupon
Rate | | Principal
Amount ($) | | Value ($) | |
County of Westmoreland
Unlimited General Obligation Bonds
Capital Appreciation
Series 1997 Escrowed to Maturity (NPFGC/FGIC)(b)
12/01/18 | | | 0.000 | % | | | 1,000,000 | | | | 826,430 | | |
Delaware Valley Regioinal Financial Authority
Revenue Bonds
Series 1997B (AMBAC)
07/01/17 | | | 5.600 | % | | | 2,000,000 | | | | 2,303,360 | | |
Series 2002
07/01/17 | | | 5.750 | % | | | 2,000,000 | | | | 2,327,700 | | |
Elizabeth Forward School District
Unlimited General Obligation Bonds
Capital Appreciation
Series 1994B Escrowed to Maturity (NPFGC)(b)
09/01/21 | | | 0.000 | % | | | 2,210,000 | | | | 1,853,173 | | |
Northampton County General Purpose Authority
Revenue Bonds
Saint Luke's Hospital Project
Series 2008A
08/15/20 | | | 5.000 | % | | | 3,480,000 | | | | 3,854,552 | | |
08/15/21 | | | 5.125 | % | | | 3,715,000 | | | | 4,083,602 | | |
08/15/22 | | | 5.250 | % | | | 1,965,000 | | | | 2,162,247 | | |
Pennsylvania Turnpike Commission
Revenue Bonds
Capital Appreciation
Subordinated Series 2010B-2(b)
12/01/24 | | | 0.000 | % | | | 20,000,000 | | | | 20,264,600 | | |
Subordinated Series 2011A
12/01/31 | | | 5.625 | % | | | 8,150,000 | | | | 9,604,857 | | |
Total | | | | | | | 81,719,490 | | |
Puerto Rico 0.8% | |
Commonwealth of Puerto Rico(g)
Unlimited General Obligation Bonds
Series 1997 (NPFGC)
07/01/15 | | | 6.500 | % | | | 4,190,000 | | | | 4,620,187 | | |
Unlimited General Obligation Public Improvement Bonds
Series 2006B
07/01/16 | | | 5.250 | % | | | 5,000,000 | | | | 5,424,850 | | |
Puerto Rico Electric Power Authority
Refunding Revenue Bonds
Series 2002KK (AGM)(g)
07/01/15 | | | 5.500 | % | | | 10,000,000 | | | | 10,924,700 | | |
Puerto Rico Highway & Transportation Authority
Refunding Revenue Bonds
Series 2005L (CIFG/TCRS/AGM)(g)
07/01/18 | | | 5.250 | % | | | 2,000,000 | | | | 2,308,900 | | |
Total | | | | | | | 23,278,637 | | |
The accompanying Notes to Financial Statements are an integral part of this statement.
Annual Report 2012
21
Columbia Intermediate Municipal Bond Fund
Portfolio of Investments (continued)
October 31, 2012
Municipal Bonds (continued)
Issue
Description | | Coupon
Rate | | Principal
Amount ($) | | Value ($) | |
Rhode Island 2.6% | |
City of Cranston
Unlimited General Obligation Bonds
Series 2008 (AGM)
07/01/26 | | | 4.750 | % | | | 900,000 | | | | 1,003,176 | | |
07/01/27 | | | 4.750 | % | | | 945,000 | | | | 1,047,438 | | |
Unlimited General Obligation Refunding Bonds
Series 2005 (AMBAC)
07/15/15 | | | 5.000 | % | | | 2,280,000 | | | | 2,540,718 | | |
Providence Housing Authority
Revenue Bonds
Capital Fund
Series 2008
09/01/24 | | | 5.000 | % | | | 565,000 | | | | 639,275 | | |
09/01/26 | | | 5.000 | % | | | 310,000 | | | | 347,783 | | |
09/01/27 | | | 5.000 | % | | | 690,000 | | | | 771,468 | | |
Rhode Island Clean Water Finance Agency
Revenue Bonds
Revolving Fund-Pooled Loan Association
Series 2004A
10/01/23 | | | 4.750 | % | | | 1,000,000 | | | | 1,074,930 | | |
Safe Drinking Water Revolving Fund
Series 2004A
10/01/18 | | | 5.000 | % | | | 1,000,000 | | | | 1,082,270 | | |
Water Pollution Control Revolving Fund
Series 2007
10/01/21 | | | 4.750 | % | | | 1,000,000 | | | | 1,165,590 | | |
Rhode Island Convention Center Authority
Refunding Revenue Bonds
Series 2005A (AGM)
05/15/21 | | | 5.000 | % | | | 4,500,000 | | | | 4,880,520 | | |
05/15/22 | | | 5.000 | % | | | 3,525,000 | | | | 3,812,076 | | |
05/15/23 | | | 5.000 | % | | | 5,905,000 | | | | 6,385,903 | | |
Rhode Island Depositors Economic Protection Corp.
Revenue Bonds
Series 1993A Escrowed to Maturity (AGM)
08/01/21 | | | 5.750 | % | | | 2,165,000 | | | | 2,849,465 | | |
Rhode Island Economic Development Corp.
Revenue Bonds
Department of Transportation
Series 2006A (AMBAC)
06/15/22 | | | 5.000 | % | | | 1,000,000 | | | | 1,081,680 | | |
East Greenwich Free Library Association
Series 2004
06/15/14 | | | 4.500 | % | | | 135,000 | | | | 135,602 | | |
06/15/24 | | | 5.750 | % | | | 415,000 | | | | 420,399 | | |
Grant Anticipation-Department of Transportation
Series 2009A (AGM)
06/15/21 | | | 5.250 | % | | | 2,000,000 | | | | 2,396,640 | | |
Providence Place Mall
Series 2000
07/01/20 | | | 6.125 | % | | | 1,520,000 | | | | 1,520,547 | | |
Series 2008C (AGM)
07/01/17 | | | 5.000 | % | | | 2,245,000 | | | | 2,553,284 | | |
Municipal Bonds (continued)
Issue
Description | | Coupon
Rate | | Principal
Amount ($) | | Value ($) | |
Rhode Island Health & Educational Building Corp.
Prerefunded 08/15/14 Revenue Bonds
Higher Education Facility
Series 2004D (XLCA)
08/15/16 | | | 5.500 | % | | | 1,340,000 | | | | 1,461,444 | | |
08/15/17 | | | 5.500 | % | | | 1,345,000 | | | | 1,466,897 | | |
Refunding Revenue Bonds
Hospital Financing-Lifespan Obligation
Series 2006A (AGM)
05/15/26 | | | 5.000 | % | | | 2,000,000 | | | | 2,155,640 | | |
University of Rhode Island
Series 2008A
09/15/28 | | | 6.500 | % | | | 3,000,000 | | | | 3,643,440 | | |
Revenue Bonds
Bond Financing Program
Series 2009
05/15/25 | | | 5.000 | % | | | 1,515,000 | | | | 1,791,139 | | |
Brown University
Series 2007
09/01/18 | | | 5.000 | % | | | 1,000,000 | | | | 1,191,910 | | |
Higher Education Facility
Series 2004A (AMBAC)
09/15/20 | | | 5.250 | % | | | 1,020,000 | | | | 1,083,138 | | |
Higher Education-Johnson & Wales
Series 1999 (NPFGC)
04/01/15 | | | 5.500 | % | | | 1,000,000 | | | | 1,088,780 | | |
04/01/17 | | | 5.500 | % | | | 1,000,000 | | | | 1,143,380 | | |
04/01/18 | | | 5.500 | % | | | 1,420,000 | | | | 1,649,785 | | |
Higher Educational-Providence College
Series 2003A (XLCA)
11/01/24 | | | 5.000 | % | | | 2,000,000 | | | | 2,045,540 | | |
Hospital Financing-Lifespan Obligation
Series 2009A (AGM)
05/15/27 | | | 6.125 | % | | | 400,000 | | | | 475,804 | | |
05/15/30 | | | 6.250 | % | | | 500,000 | | | | 590,620 | | |
New England Institute of Technology
Series 2010
03/01/24 | | | 5.000 | % | | | 1,145,000 | | | | 1,303,044 | | |
Providence Public Schools Financing Program
Series 2006A (AGM)
05/15/23 | | | 5.000 | % | | | 2,000,000 | | | | 2,123,500 | | |
Series 2007A (AGM)
05/15/22 | | | 5.000 | % | | | 2,000,000 | | | | 2,145,420 | | |
Series 2007C (AGM)
05/15/21 | | | 5.000 | % | | | 1,500,000 | | | | 1,622,325 | | |
Public Schools Financing Program
Series 2007B (AMBAC)
05/15/19 | | | 4.250 | % | | | 250,000 | | | | 250,150 | | |
Times2 Academy
Series 2004
12/15/24 | | | 5.000 | % | | | 1,500,000 | | | | 1,544,955 | | |
University of Rhode Island
Series 2009A (AGM)
09/15/24 | | | 4.750 | % | | | 1,000,000 | | | | 1,144,750 | | |
The accompanying Notes to Financial Statements are an integral part of this statement.
Annual Report 2012
22
Columbia Intermediate Municipal Bond Fund
Portfolio of Investments (continued)
October 31, 2012
Municipal Bonds (continued)
Issue
Description | | Coupon
Rate | | Principal
Amount ($) | | Value ($) | |
Rhode Island Student Loan Authority
Revenue Bonds
Program
Senior Series 2010A
12/01/20 | | | 4.600 | % | | | 885,000 | | | | 963,101 | | |
State of Rhode Island
Certificate of Participation
Lease-Training School Project
Series 2005A (NPFGC)
10/01/19 | | | 5.000 | % | | | 1,200,000 | | | | 1,333,680 | | |
Unlimited General Obligation Bonds
Consolidated Capital Development Loan
Series 2006C (NPFGC)
11/15/18 | | | 5.000 | % | | | 1,000,000 | | | | 1,155,940 | | |
Unlimited General Obligation Refunding Bonds
Consolidated Capital Development Loan
Series 2005A (AGM)
08/01/17 | | | 5.000 | % | | | 2,000,000 | | | | 2,239,700 | | |
Series 2006A (AGM)
08/01/20 | | | 4.500 | % | | | 1,750,000 | | | | 1,962,170 | | |
Total | | | | | | | 73,285,016 | | |
South Carolina 1.9% | |
Berkeley County School District
Revenue Bonds
Securing Assets for Education
Series 2003
12/01/18 | | | 5.250 | % | | | 1,000,000 | | | | 1,051,520 | | |
12/01/28 | | | 5.000 | % | | | 7,205,000 | | | | 7,513,302 | | |
Charleston Educational Excellence Finance Corp.
Revenue Bonds
Charleston County School District
Series 2005
12/01/24 | | | 5.250 | % | | | 10,000,000 | | | | 11,171,900 | | |
County of Greenwood
Refunding Revenue Bonds
Self Regional Healthcare
Series 2012B
10/01/31 | | | 5.000 | % | | | 5,000,000 | | | | 5,704,800 | | |
Dorchester County School District No. 2
Revenue Bonds
Growth Remedy Opportunity Tax Hike
Series 2004
12/01/17 | | | 5.250 | % | | | 2,000,000 | | | | 2,179,840 | | |
Greenville County School District
Refunding Revenue Bonds
Building Equity Sooner
Series 2005
12/01/18 | | | 5.500 | % | | | 5,000,000 | | | | 6,234,300 | | |
Greenville Hospital System Board
Refunding Revenue Bonds
Series 2012
05/01/28 | | | 5.000 | % | | | 8,440,000 | | | | 9,638,902 | | |
Municipal Bonds (continued)
Issue
Description | | Coupon
Rate | | Principal
Amount ($) | | Value ($) | |
Newberry Investing in Children's Education
Revenue Bonds
Newberry County School District Project
Series 2005
12/01/19 | | | 5.250 | % | | | 1,500,000 | | | | 1,615,395 | | |
South Carolina State Public Service Authority
Revenue Bonds
Santee Cooper
Series 2006A (NPFGC)
01/01/30 | | | 5.000 | % | | | 5,555,000 | | | | 6,119,499 | | |
Total | | | | | | | 51,229,458 | | |
South Dakota 0.1% | |
South Dakota Health & Educational Facilities Authority
Revenue Bonds
Regional Health
Series 2011
09/01/19 | | | 5.000 | % | | | 1,250,000 | | | | 1,466,563 | | |
09/01/20 | | | 5.000 | % | | | 1,250,000 | | | | 1,458,750 | | |
09/01/21 | | | 5.000 | % | | | 1,000,000 | | | | 1,148,940 | | |
Total | | | | | | | 4,074,253 | | |
Tennessee 0.4% | |
Blount County Public Building Authority
Prerefunded 6/01/14 Revenue Bonds
Local Government Public
Series 2004 (NPFGC/FGIC)
06/01/16 | | | 5.000 | % | | | 815,000 | | | | 875,546 | | |
City of Chattanooga
Unlimited General Obligation Refunding Bonds
Series 2005A (AGM)
09/01/14 | | | 5.000 | % | | | 4,150,000 | | | | 4,505,531 | | |
County of Overton
Unlimited General Obligation Refunding Bonds
School
Series 2004 (NPFGC)
04/01/16 | | | 5.000 | % | | | 1,000,000 | | | | 1,074,840 | | |
Metropolitan Government Nashville & Davidson
County Health & Educational Facilities Board
Improvement Refunding Revenue Bonds
Meharry Medical College
Series 1996 (AMBAC)
12/01/16 | | | 6.000 | % | | | 3,800,000 | | | | 4,226,930 | | |
Total | | | | | | | 10,682,847 | | |
Texas 9.3% | |
Aldine Independent School District
Unlimited General Obligation Refunding Bonds
Series 2005 (Permanent School Fund Guarantee)
02/15/15 | | | 5.250 | % | | | 1,655,000 | | | | 1,759,447 | | |
The accompanying Notes to Financial Statements are an integral part of this statement.
Annual Report 2012
23
Columbia Intermediate Municipal Bond Fund
Portfolio of Investments (continued)
October 31, 2012
Municipal Bonds (continued)
Issue
Description | | Coupon
Rate | | Principal
Amount ($) | | Value ($) | |
Barbers Hill Independent School District
Prerefunded 02/15/13 Unlimited General Obligation Bonds
Series 2003 (Permanent School Fund Guarantee)
02/15/22 | | | 5.000 | % | | | 975,000 | | | | 988,475 | | |
Brownwood Independent School District
Unlimited General Obligation Refunding Bonds
School Building
Series 2005 (NPFGC/FGIC)
02/15/17 | | | 5.250 | % | | | 1,310,000 | | | | 1,429,289 | | |
Central Texas Regional Mobility Authority
Revenue Bonds
Senior Lien
Series 2010
01/01/19 | | | 5.750 | % | | | 750,000 | | | | 875,400 | | |
01/01/20 | | | 5.750 | % | | | 1,250,000 | | | | 1,471,900 | | |
Series 2011
01/01/31 | | | 5.750 | % | | | 15,230,000 | | | | 17,786,355 | | |
City Public Service Board of San Antonio
Refunding Revenue Bonds
Series 2005
02/01/18 | | | 5.000 | % | | | 10,000,000 | | | | 10,983,200 | | |
System
Series 2002
02/01/14 | | | 5.375 | % | | | 2,500,000 | | | | 2,658,325 | | |
City of Austin
Refunding Revenue Bonds
Subordinated Lien
Series 1998 (NPFGC)
05/15/18 | | | 5.250 | % | | | 1,100,000 | | | | 1,319,483 | | |
City of Corpus Christi Utility System
Refunding Revenue Bonds
Series 2005A (AMBAC)
07/15/19 | | | 5.000 | % | | | 2,000,000 | | | | 2,220,560 | | |
City of El Paso
Limited General Obligation Refunding Bonds
Series 2005 (NPFGC/FGIC)
08/15/14 | | | 5.250 | % | | | 2,000,000 | | | | 2,171,980 | | |
City of Houston Airport System
Refunding Revenue Bonds
Subordinate Lien
Series 2012B
07/01/28 | | | 5.000 | % | | | 7,000,000 | | | | 8,199,030 | | |
City of Houston Utility System
Refunding Revenue Bonds
1st Lien
Series 2004A (NPFGC/FGIC)
05/15/24 | | | 5.250 | % | | | 5,000,000 | | | | 5,341,550 | | |
City of Houston
Prerefunded 03/01/15 Limited General Obligation Bonds
Series 2005E (AMBAC)
03/01/20 | | | 5.000 | % | | | 2,525,000 | | | | 2,791,564 | | |
Municipal Bonds (continued)
Issue
Description | | Coupon
Rate | | Principal
Amount ($) | | Value ($) | |
City of Houston(b)
Revenue Bonds
Capital Appreciation-Convention
Series 2001B (AMBAC)
09/01/17 | | | 0.000 | % | | | 2,000,000 | | | | 1,800,140 | | |
City of Irving
Prerefunded 11/15/15 Limited General Obligation Bonds
Improvement
Series 2005A
11/15/18 | | | 5.000 | % | | | 1,075,000 | | | | 1,224,834 | | |
City of Laredo
Limited General Obligation Refunding Bonds
Series 2005 (AMBAC)
08/15/20 | | | 5.000 | % | | | 1,065,000 | | | | 1,193,737 | | |
City of McKinney
Limited General Obligation Bonds
Waterworks & Sewer System
Series 2005 (NPFGC/FGIC)
08/15/17 | | | 5.250 | % | | | 1,125,000 | | | | 1,266,075 | | |
Conroe Independent School District
Prerefunded 02/15/15 Unlimited General
Obligation Bonds
Schoolhouse
Series 2005C (Permanent School Fund Guarantee)
02/15/19 | | | 5.000 | % | | | 1,650,000 | | | | 1,824,949 | | |
Unlimited General Obligation Bonds
School Building
Series 2009A
02/15/25 | | | 5.250 | % | | | 1,135,000 | | | | 1,343,624 | | |
Corpus Christi Business & Job Development Corp.
Improvement Refunding Revenue Bonds
Arena Project
Series 2002 (AMBAC)
09/01/14 | | | 5.500 | % | | | 2,065,000 | | | | 2,139,712 | | |
09/01/18 | | | 5.500 | % | | | 1,250,000 | | | | 1,294,163 | | |
County of Williamson
Unlimited General Obligation Bonds
Series 2005 (NPFGC)
02/15/16 | | | 5.000 | % | | | 1,985,000 | | | | 2,182,627 | | |
Dallas County Community College District
Limited General Obligation Bonds
Series 2009
02/15/20 | | | 5.000 | % | | | 750,000 | | | | 921,690 | | |
Dallas-Fort Worth International Airport
Refunding Revenue Bonds
Joint
Series 2012B
11/01/28 | | | 5.000 | % | | | 21,280,000 | | | | 24,515,837 | | |
Dickinson Independent School District
Unlimited General Obligation Bonds
Series 2006 (Permanent School Fund Guarantee)
02/15/20 | | | 5.000 | % | | | 2,405,000 | | | | 2,738,982 | | |
The accompanying Notes to Financial Statements are an integral part of this statement.
Annual Report 2012
24
Columbia Intermediate Municipal Bond Fund
Portfolio of Investments (continued)
October 31, 2012
Municipal Bonds (continued)
Issue
Description | | Coupon
Rate | | Principal
Amount ($) | | Value ($) | |
Dripping Springs Independent School District
Unlimited General Obligation Bonds
School Building
Series 2008 (Permanent School Fund Guarantee)
02/15/26 | | | 5.000 | % | | | 1,000,000 | | | | 1,157,470 | | |
Duncanville Independent School District
Unlimited General Obligation Refunding Bonds
Capital Appreciation
Series 2005 (Permanent School Fund Guarantee)(b)
02/15/22 | | | 0.000 | % | | | 2,000,000 | | | | 1,641,020 | | |
Gulf Coast Waste Disposal Authority(a)
Revenue Bonds
BP Products North America
Series 2007
01/01/42 | | | 2.300 | % | | | 3,350,000 | | | | 3,399,044 | | |
Gulf Coast Waste Disposal Authority(f)
Refunding Revenue Bonds
Series 2002A AMT
08/01/24 | | | 6.100 | % | | | 5,750,000 | | | | 5,770,182 | | |
Harris County Flood Control District
Limited General Obligation Bonds
Improvement
Series 2006
10/01/29 | | | 4.750 | % | | | 10,000,000 | | | | 11,194,200 | | |
Harris County Industrial Development Corp.
Revenue Bonds
Deer Park Refining Project
Series 2008
05/01/18 | | | 4.700 | % | | | 12,000,000 | | | | 13,331,760 | | |
Houston Higher Education Finance Corp.
Revenue Bonds
Cosmos Foundation, Inc.
Series 2011A
05/15/31 | | | 6.500 | % | | | 1,000,000 | | | | 1,250,790 | | |
Houston Independent School District
Limited General Obligation Refunding Bonds
Limited Tax
Series 2007 (Permanent School Fund Guarantee)
02/15/25 | | | 4.500 | % | | | 5,000,000 | | | | 5,467,250 | | |
La Joya Independent School District
Unlimited General Obligation Refunding Bonds
Series 2005 (Permanent School Fund Guarantee)
02/15/20 | | | 5.000 | % | | | 1,000,000 | | | | 1,096,830 | | |
Lewisville Independent School District
Unlimited General Obligation Bonds
School Building
Series 2009
08/15/21 | | | 5.000 | % | | | 1,000,000 | | | | 1,217,090 | | |
Municipal Bonds (continued)
Issue
Description | | Coupon
Rate | | Principal
Amount ($) | | Value ($) | |
Lower Colorado River Authority
Refunding Revenue Bonds
5th Supplemental Series 1993 Escrowed to Maturity
01/01/16 | | | 5.375 | % | | | 2,100,000 | | | | 2,419,788 | | |
LCRA Transmission Services Corp. Project
Series 2011
05/15/27 | | | 5.000 | % | | | 11,195,000 | | | | 13,072,401 | | |
North Central Texas Health Facility Development Corp.
Revenue Bonds
Hospital-Presbyterian Healthcare
Series 1996B Escrowed to Maturity (NPFGC)
06/01/16 | | | 5.500 | % | | | 9,645,000 | | | | 10,695,437 | | |
North Harris County Regional Water Authority
Revenue Bonds
Senior Lien
Series 2008
12/15/20 | | | 5.250 | % | | | 4,415,000 | | | | 5,262,018 | | |
North Texas Tollway Authority
Refunding Revenue Bonds
System-1st Tier
Series 2008A
01/01/22 | | | 6.000 | % | | | 14,000,000 | | | | 16,720,200 | | |
North Texas Tollway Authority(a)
Refunding Revenue Bonds
System-1st Tier
Series 2008E-3
01/01/38 | | | 5.750 | % | | | 9,350,000 | | | | 10,705,563 | | |
SA Energy Acquisition Public Facility Corp.
Revenue Bonds
Gas Supply
Series 2007
08/01/16 | | | 5.250 | % | | | 4,450,000 | | | | 4,845,293 | | |
Sam Rayburn Municipal Power Agency
Refunding Revenue Bonds
Series 2012
10/01/21 | | | 5.000 | % | | | 2,300,000 | | | | 2,739,760 | | |
San Juan Higher Education Finance Authority
Revenue Bonds
Idea Public Schools
Series 2010A
08/15/20 | | | 5.125 | % | | | 2,000,000 | | | | 2,212,600 | | |
08/15/24 | | | 5.750 | % | | | 1,590,000 | | | | 1,790,388 | | |
Southwest Higher Education Authority, Inc.
Revenue Bonds
Southern Methodist University Project
Series 2009
10/01/26 | | | 5.000 | % | | | 1,000,000 | | | | 1,211,840 | | |
Spring Independent School District
Unlimited General Obligation Bonds
Schoolhouse
Series 2009 (Permanent School Fund Guarantee)
08/15/21 | | | 5.000 | % | | | 750,000 | | | | 919,358 | | |
The accompanying Notes to Financial Statements are an integral part of this statement.
Annual Report 2012
25
Columbia Intermediate Municipal Bond Fund
Portfolio of Investments (continued)
October 31, 2012
Municipal Bonds (continued)
Issue
Description | | Coupon
Rate | | Principal
Amount ($) | | Value ($) | |
Tarrant County Cultural Education Facilities Finance Corp.
Revenue Bonds
Air Force Obligation Group
Series 2007
05/15/27 | | | 5.125 | % | | | 3,750,000 | | | | 3,835,350 | | |
Texas City Industrial Development Corp.
Refunding Revenue Bonds
Arco Pipe Line Co. Project
Series 1990
10/01/20 | | | 7.375 | % | | | 3,000,000 | | | | 4,149,900 | | |
Texas Municipal Gas Acquisition & Supply Corp.
Revenue Bonds
Senior Lien
Series 2006A
12/15/12 | | | 5.000 | % | | | 5,500,000 | | | | 5,533,189 | | |
Texas Public Finance Authority
Revenue Bonds
Stephen F. Austin State University Financing
Series 2005 (NPFGC)
10/15/19 | | | 5.000 | % | | | 2,000,000 | | | | 2,239,900 | | |
Trinity River Authority
Improvement Refunding Revenue Bonds
Tarrant County Water Project
Series 2005 (NPFGC)
02/01/17 | | | 5.000 | % | | | 1,000,000 | | | | 1,115,480 | | |
02/01/18 | | | 5.000 | % | | | 1,000,000 | | | | 1,113,740 | | |
University of Houston
Refunding Revenue Bonds
Series 2009
02/15/21 | | | 5.000 | % | | | 1,000,000 | | | | 1,199,070 | | |
University of Texas System
Prerefunded 02/15/17 Revenue Bonds
Financing System
Series 2006D
08/15/18 | | | 5.000 | % | | | 8,455,000 | | | | 9,978,591 | | |
Refunding Revenue Bonds
Financing System
Series 2004A
08/15/17 | | | 5.250 | % | | | 2,000,000 | | | | 2,419,180 | | |
Unrefunded Revenue Bonds
Financing System
Series 2006D
08/15/18 | | | 5.000 | % | | | 1,545,000 | | | | 1,820,118 | | |
Uptown Development Authority
Tax Allocation Bonds
Infrastructure Improvement Facilities
Series 2009
09/01/22 | | | 5.000 | % | | | 750,000 | | | | 825,953 | | |
West Harris County Regional Water Authority
Revenue Bonds
Series 2009
12/15/25 | | | 5.000 | % | | | 1,000,000 | | | | 1,178,670 | | |
Total | | | | | | | 255,972,351 | | |
Municipal Bonds (continued)
Issue
Description | | Coupon
Rate | | Principal
Amount ($) | | Value ($) | |
Utah 0.8% | |
Intermountain Power Agency
Refunding Revenue Bonds
Subordinated Series 2007A (AMBAC)
07/01/17 | | | 5.000 | % | | | 15,000,000 | | | | 17,665,200 | | |
Utah State Building Ownership Authority
Refunding Revenue Bonds
State Facilities Master Lease Program
Series 1998C Escrowed to Maturity (AGM)
05/15/14 | | | 5.500 | % | | | 5,000,000 | | | | 5,386,400 | | |
Total | | | | | | | 23,051,600 | | |
Virgin Islands —% | |
Virgin Islands Water & Power Authority
Refunding Revenue Bonds
Series 2012A(g)
07/01/21 | | | 4.000 | % | | | 625,000 | | | | 631,388 | | |
Virginia 1.2% | |
Augusta County Industrial Development Authority
Refunding Revenue Bonds
Augusta Health Care, Inc.
Series 2003
09/01/18 | | | 5.250 | % | | | 1,500,000 | | | | 1,773,150 | | |
Virginia College Building Authority
Revenue Bonds
Public Higher Education Financing Program
Series 2009A
09/01/24 | | | 5.000 | % | | | 1,000,000 | | | | 1,196,340 | | |
Virginia Public School Authority
Refunding Revenue Bonds
School Financing 1997 Resolution
Series 2005B
08/01/16 | | | 5.250 | % | | | 13,995,000 | | | | 16,382,547 | | |
Revenue Bonds
School Financing 1997 Resolution
Series 2005C
08/01/16 | | | 5.000 | % | | | 6,285,000 | | | | 7,061,009 | | |
Virginia Resources Authority
Revenue Bonds
State Revolving Fund
Series 2009
10/01/22 | | | 5.000 | % | | | 500,000 | | | | 618,075 | | |
Subordinated Series 2008
10/01/19 | | | 5.000 | % | | | 1,000,000 | | | | 1,225,690 | | |
Subordinated Revenue Bonds
Clean Water State Revolving Fund
Series 2007
10/01/17 | | | 5.000 | % | | | 3,760,000 | | | | 4,528,920 | | |
Total | | | | | | | 32,785,731 | | |
The accompanying Notes to Financial Statements are an integral part of this statement.
Annual Report 2012
26
Columbia Intermediate Municipal Bond Fund
Portfolio of Investments (continued)
October 31, 2012
Municipal Bonds (continued)
Issue
Description | | Coupon
Rate | | Principal
Amount ($) | | Value ($) | |
Washington 0.9% | |
Clark County School District No. 37 Vancouver
Unlimited General Obligation Bonds
Series 2001C (NPFGC/FGIC)(b)
12/01/16 | | | 0.000 | % | | | 1,000,000 | | | | 949,130 | | |
Energy Northwest
Revenue Bonds
Columbia Generating Station
Series 2007D
07/01/22 | | | 5.000 | % | | | 1,000,000 | | | | 1,170,290 | | |
State of Washington
Unlimited General Obligation Bonds
Motor Vehicle Fuel
Series 2010B
08/01/26 | | | 5.000 | % | | | 18,270,000 | | | | 22,176,857 | | |
Series 2008D
01/01/20 | | | 5.000 | % | | | 1,000,000 | | | | 1,191,460 | | |
Total | | | | | | | 25,487,737 | | |
West Virginia 0.4% | |
West Virginia Economic Development Authority
Refunding Revenue Bonds
Appalachian Power Co. Amos
Series 2008C(a)
05/01/19 | | | 4.850 | % | | | 6,500,000 | | | | 6,677,515 | | |
West Virginia Hospital Finance Authority
Revenue Bonds
Charleston Area Medical Center, Inc.
Series 1993A Escrowed to Maturity
09/01/23 | | | 6.500 | % | | | 3,980,000 | | | | 5,318,673 | | |
Total | | | | | | | 11,996,188 | | |
Wisconsin 1.4% | |
City of Sheboygan
Refunding Revenue Bonds
Wisconsin Power
Series 2006 (FGIC)
09/01/15 | | | 5.000 | % | | | 5,600,000 | | | | 6,191,528 | | |
State of Wisconsin
Revenue Bonds
Series 2009A
05/01/22 | | | 5.000 | % | | | 1,000,000 | | | | 1,170,940 | | |
05/01/23 | | | 5.125 | % | | | 14,000,000 | | | | 16,614,220 | | |
Wisconsin Health & Educational Facilities Authority
Refunding Revenue Bonds
Wheaton Healthcare
Series 2006B
08/15/23 | | | 5.125 | % | | | 13,065,000 | | | | 13,935,390 | | |
Total | | | | | | | 37,912,078 | | |
Total Municipal Bonds
(Cost: $2,389,355,042) | | | | | | | 2,647,436,338 | | |
Floating Rate Notes 0.1%
Issue
Description | | Effective
Yield | | Amount
Payable at
Maturity ($) | | Value ($) | |
Colorado 0.1% | |
Colorado Educational & Cultural Facilities Authority
Revenue Bonds
Flying J Ranch LLC
VRDN Series 2006 (U.S. Bank)(a)(h)
03/01/36 | | | 0.240 | % | | | 800,000 | | | | 800,000 | | |
Missouri —% | |
Missouri State Health & Educational Facilities Authority
Revenue Bonds
St. Louis University
VRDN Series 2008A-2 (Wells Fargo Bank)(a)(h)
10/01/35 | | | 0.170 | % | | | 700,000 | | | | 700,000 | | |
Total Floating Rate Notes
(Cost: $1,500,000) | | | | | | | 1,500,000 | | |
Money Market Funds 3.0%
| | | Shares | | Value ($) | |
Dreyfus Tax-Exempt Cash Management Fund,
0.000%(i) | | | 40,919,040 | | | | 40,919,040 | | |
JPMorgan Tax-Free Money Market Fund,
0.000%(i) | | | 42,860,699 | | | | 42,860,699 | | |
Total Money Market Funds
(Cost: $83,779,739) | | | | | 83,779,739 | | |
Total Investments
(Cost: $2,474,634,781) | | | | | 2,732,716,077 | | |
Other Assets & Liabilities, Net | | | | | 30,702,219 | | |
Net Assets | | | | | 2,763,418,296 | | |
The accompanying Notes to Financial Statements are an integral part of this statement.
Annual Report 2012
27
Columbia Intermediate Municipal Bond Fund
Portfolio of Investments (continued)
October 31, 2012
Notes to Portfolio of Investments
(a) Variable rate security. The interest rate shown reflects the rate as of October 31, 2012.
(b) Zero coupon bond.
(c) Identifies issues considered to be illiquid as to their marketability. The aggregate value of such securities at October 31, 2012 was $964,328, representing 0.03% of net assets. Information concerning such security holdings at October 31, 2012 was as follows:
Security Description | | Acquisition Dates | | Cost ($) | |
Capital Trust Agency, Inc.
Revenue Bonds
Atlantic Housing Foundation
Subordinated Series 2008B
7.000% 07/15/32 | | 07/23/08 | | | 1,910,000 | | |
Oakmont Grove Community Development District
Special Assessment Bonds
Series 2007B
5.250% 09/28/12 | | 04/19/07 - 04/25/07 | | | 2,007,500 | | |
Sterling Hill Community Development District
Special Assessment Bonds
Series 2003B
5.500% 11/01/10 | | 10/23/03 | | | 149,140 | | |
(d) Security exempt from registration pursuant to Rule 144A under the Securities Act of 1933. This security may be resold in transactions exempt from registration, normally to qualified institutional buyers. At October 31, 2012, the value of these securities amounted to $21,251,549 or 0.77% of net assets.
(e) Represents securities that have defaulted on payment of interest. The Fund has stopped accruing interest on these securities. At October 31, 2012, the value of these securities amounted to $105,038, which represents less than 0.01% of net assets.
(f) Income from this security may be subject to alternative minimum tax.
(g) Municipal obligations include debt obligations issued by or on behalf of territories, possessions, or sovereign nations within the territorial boundaries of the United States. At October 31, 2012, the value of these securities amounted to $34,344,231 or 1.24% of net assets.
(h) The Fund is entitled to receive principal and interest from the guarantor after a day or a week's notice or upon maturity. The maturity date disclosed represents the final maturity.
(i) The rate shown is the seven-day current annualized yield at October 31, 2012.
Abbreviation Legend
ACA ACA Financial Guaranty Corporation
AGM Assured Guaranty Municipal Corporation
AMBAC Ambac Assurance Corporation
AMT Alternative Minimum Tax
BHAC Berkshire Hathaway Assurance Corporation
BNY Bank of New York
CIFG IXIS Financial Guaranty
FGIC Financial Guaranty Insurance Company
NPFGC National Public Finance Guarantee Corporation
TCRS Transferable Custodial Receipts
VRDN Variable Rate Demand Note
XLCA XL Capital Assurance
The accompanying Notes to Financial Statements are an integral part of this statement.
Annual Report 2012
28
Columbia Intermediate Municipal Bond Fund
Portfolio of Investments (continued)
October 31, 2012
Generally accepted accounting principles (GAAP) require disclosure regarding the inputs and valuation techniques used to measure fair value and any changes in valuation inputs or techniques. In addition, investments shall be disclosed by major category.
The Fund categorizes its fair value measurements according to a three-level hierarchy that maximizes the use of observable inputs and minimizes the use of unobservable inputs by prioritizing that the most observable input be used when available. Observable inputs are those that market participants would use in pricing an investment based on market data obtained from sources independent of the reporting entity. Unobservable inputs are those that reflect the Fund's assumptions about the information market participants would use in pricing an investment. An investment's level within the fair value hierarchy is based on the lowest level of any input that is deemed significant to the asset or liability's fair value measurement. The input levels are not necessarily an indication of the risk or liquidity associated with investments at that level. For example, certain U.S. government securities are generally high quality and liquid, however, they are reflected as Level 2 because the inputs used to determine fair value may not always be quoted prices in an active market.
Fair value inputs are summarized in the three broad levels listed below:
> Level 1 — Valuations based on quoted prices for investments in active markets that the Fund has the ability to access at the measurement date (including NAV for open-end mutual funds). Valuation adjustments are not applied to Level 1 investments.
> Level 2 — Valuations based on other significant observable inputs (including quoted prices for similar securities, interest rates, prepayment speeds, credit risks, etc.).
> Level 3 — Valuations based on significant unobservable inputs (including the Fund's own assumptions and judgment in determining the fair value of investments).
Inputs that are used in determining fair value of an investment may include price information, credit data, volatility statistics, and other factors. These inputs can be either observable or unobservable. The availability of observable inputs can vary between investments, and is affected by various factors such as the type of investment, and the volume and level of activity for that investment or similar investments in the marketplace. The inputs will be considered by the Investment Manager, along with any other relevant factors in the calculation of an investment's fair value. The Fund uses prices and inputs that are current as of the measurement date, which may include periods of market dislocations. During these periods, the availability of prices and inputs may be reduced for many investments. This condition could cause an investment to be reclassified between the various levels within the hierarchy.
Investments falling into the Level 3 category are primarily supported by quoted prices from brokers and dealers participating in the market for those investments. However, these may be classified as Level 3 investments due to lack of market transparency and corroboration to support these quoted prices. Additionally, valuation models may be used as the pricing source for any remaining investments classified as Level 3. These models rely on one or more significant unobservable inputs and/or significant assumptions by the Investment Manager. Inputs used in valuations may include, but are not limited to, financial statement analysis, capital account balances, discount rates and estimated cash flows, and comparable company data.
Under the direction of the Fund's Board of Trustees (the Board), the Investment Manager's Valuation Committee (the Committee) is responsible for carrying out the valuation procedures approved by the Board. The Committee consists of voting and non-voting members from various groups within the Investment Manager's organization, including operations and accounting, trading and investments, compliance, risk management and legal.
The Committee meets at least monthly to review and approve valuation matters, which may include a description of specific valuation determinations, data regarding pricing information received from approved pricing vendors and brokers and the results of Board-approved valuation control policies and procedures (the Policies). The Policies address, among other things, instances when market quotations are readily available, including recommendations of third party pricing vendors and a determination of appropriate pricing methodologies; events that require specific valuation determinations and assessment of fair value techniques; securities with a potential for stale pricing, including those that are illiquid, restricted, or in default; and the effectiveness of third-party pricing vendors, including periodic reviews of vendors. The Committee meets more frequently, as needed, to discuss additional valuation matters, which may include the need to review back-testing results, review time-sensitive information or approve related valuation actions. The Committee reports to the Board, with members of the Committee meeting with the Board at each of its regularly scheduled meetings to discuss valuation matters and actions during the period, similar to those described earlier.
For investments categorized as Level 3, the Committee monitors information similar to that described above, which may include: (i) data specific to the issuer or comparable issuers, (ii) general market or specific sector news and (iii) quoted prices and specific or similar security transactions. The Committee considers this data and any changes from prior periods in order to assess the reasonableness of observable and unobservable inputs, any assumptions or internal models used to value those securities and changes in fair value. This data is also used to corroborate, when available, information received from approved pricing vendors and brokers. Various factors impact the frequency of monitoring this information (which may occur as often as daily). However, the Committee may determine that changes to inputs, assumptions and models are not required as a result of the monitoring procedures performed.
The accompanying Notes to Financial Statements are an integral part of this statement.
Annual Report 2012
29
Columbia Intermediate Municipal Bond Fund
Portfolio of Investments (continued)
October 31, 2012
Fair Value Measurements (continued)
The following table is a summary of the inputs used to value the Fund's investments at October 31, 2012:
Description | | Level 1
Quoted Prices in Active
Markets for Identical
Assets ($) | | Level 2
Other Significant
Observable Inputs ($) | | Level 3
Significant
Unobservable Inputs ($) | | Total ($) | |
Bonds | |
Municipal Bonds | | | — | | | | 2,647,436,338 | | | | — | | | | 2,647,436,338 | | |
Total Bonds | | | — | | | | 2,647,436,338 | | | | — | | | | 2,647,436,338 | | |
Short-Term Securities | |
Floating Rate Notes | | | — | | | | 1,500,000 | | | | — | | | | 1,500,000 | | |
Total Short-Term Securities | | | — | | | | 1,500,000 | | | | — | | | | 1,500,000 | | |
Other | |
Money Market Funds | | | 83,779,739 | | | | — | | | | — | | | | 83,779,739 | | |
Total Other | | | 83,779,739 | | | | — | | | | — | | | | 83,779,739 | | |
Total | | | 83,779,739 | | | | 2,648,936,338 | | | | — | | | | 2,732,716,077 | | |
See the Portfolio of Investments for all investment classifications not indicated in the table.
The Fund's assets assigned to the Level 2 input category are generally valued using the market approach, in which a security's value is determined through reference to prices and information from market transactions for similar or identical assets.
There were no transfers of financial assets between Levels 1 and 2 during the period.
The accompanying Notes to Financial Statements are an integral part of this statement.
Annual Report 2012
30
Columbia Intermediate Municipal Bond Fund
Statement of Assets and Liabilities
October 31, 2012
Assets | |
Investments, at value | |
(identified cost $2,474,634,781) | | $ | 2,732,716,077 | | |
Receivable for: | |
Capital shares sold | | | 5,848,247 | | |
Dividends | | | 1 | | |
Interest | | | 35,607,807 | | |
Expense reimbursement due from Investment Manager | | | 36,476 | | |
Prepaid expenses | | | 34,175 | | |
Trustees' deferred compensation plan | | | 185,917 | | |
Total assets | | | 2,774,428,700 | | |
Liabilities | |
Payable for: | |
Capital shares purchased | | | 2,165,396 | | |
Dividend distributions to shareholders | | | 7,666,196 | | |
Investment management fees | | | 145,840 | | |
Distribution and service fees | | | 9,331 | | |
Transfer agent fees | | | 469,273 | | |
Administration fees | | | 23,624 | | |
Compensation of board members | | | 220,167 | | |
Chief compliance officer expenses | | | 776 | | |
Other expenses | | | 123,884 | | |
Trustees' deferred compensation plan | | | 185,917 | | |
Total liabilities | | | 11,010,404 | | |
Net assets applicable to outstanding capital stock | | $ | 2,763,418,296 | | |
Represented by | |
Paid-in capital | | $ | 2,525,027,370 | | |
Undistributed net investment income | | | 1,480,423 | | |
Accumulated net realized loss | | | (21,170,793 | ) | |
Unrealized appreciation (depreciation) on: | |
Investments | | | 258,081,296 | | |
Total — representing net assets applicable to outstanding capital stock | | $ | 2,763,418,296 | | |
The accompanying Notes to Financial Statements are an integral part of this statement.
Annual Report 2012
31
Columbia Intermediate Municipal Bond Fund
Statement of Assets and Liabilities (continued)
October 31, 2012
Class A | |
Net assets | | $ | 212,160,596 | | |
Shares outstanding | | | 19,232,501 | | |
Net asset value per share | | $ | 11.03 | | |
Maximum offering price per share(a) | | $ | 11.40 | | |
Class B | |
Net assets | | $ | 1,841,729 | | |
Shares outstanding | | | 166,988 | | |
Net asset value per share | | $ | 11.03 | | |
Class C | |
Net assets | | $ | 53,729,466 | | |
Shares outstanding | | | 4,869,939 | | |
Net asset value per share | | $ | 11.03 | | |
Class T | |
Net assets | | $ | 20,104,582 | | |
Shares outstanding | | | 1,822,581 | | |
Net asset value per share | | $ | 11.03 | | |
Maximum offering price per share(a) | | $ | 11.58 | | |
Class Z | |
Net assets | | $ | 2,475,581,923 | | |
Shares outstanding | | | 224,299,290 | | |
Net asset value per share | | $ | 11.04 | | |
(a) The maximum offering price per share is calculated by dividing the net asset value by 1.0 minus the maximum sales charge of 3.25% for Class A and by dividing the net asset value by 1.0 minus the maximum sales charge of 4.75% for Class T.
The accompanying Notes to Financial Statements are an integral part of this statement.
Annual Report 2012
32
Columbia Intermediate Municipal Bond Fund
Statement of Operations
Year Ended October 31, 2012
Net investment income | |
Income: | |
Dividends | | $ | 8,026 | | |
Interest | | | 104,985,386 | | |
Total income | | | 104,993,412 | | |
Expenses: | |
Investment management fees | | | 10,291,609 | | |
Distribution fees | |
Class B | | | 14,771 | | |
Class C | | | 285,748 | | |
Service fees | |
Class A | | | 401,557 | | |
Class B | | | 4,545 | | |
Class C | | | 87,945 | | |
Shareholder service fee — Class T | | | 29,945 | | |
Transfer agent fees | |
Class A | | | 374,176 | | |
Class B | | | 4,240 | | |
Class C | | | 81,846 | | |
Class T | | | 37,226 | | |
Class Z | | | 4,438,482 | | |
Administration fees | | | 1,665,246 | | |
Compensation of board members | | | 68,740 | | |
Custodian fees | | | 12,436 | | |
Printing and postage fees | | | 79,883 | | |
Registration fees | | | 131,922 | | |
Professional fees | | | 157,917 | | |
Chief compliance officer expenses | | | 1,226 | | |
Other | | | 161,084 | | |
Total expenses | | | 18,330,544 | | |
Fees waived or expenses reimbursed by Investment Manager and its affiliates | | | (3,199,657 | ) | |
Fees waived by Distributor — Class C | | | (197,803 | ) | |
Expense reductions | | | (800 | ) | |
Total net expenses | | | 14,932,284 | | |
Net investment income | | | 90,061,128 | | |
Realized and unrealized gain (loss) — net | |
Net realized gain (loss) on: | |
Investments | | | (19,837,666 | ) | |
Net realized loss | | | (19,837,666 | ) | |
Net change in unrealized appreciation (depreciation) on: | |
Investments | | | 132,396,839 | | |
Net change in unrealized appreciation (depreciation) | | | 132,396,839 | | |
Net realized and unrealized gain | | | 112,559,173 | | |
Net increase in net assets resulting from operations | | $ | 202,620,301 | | |
The accompanying Notes to Financial Statements are an integral part of this statement.
Annual Report 2012
33
Columbia Intermediate Municipal Bond Fund
Statement of Changes in Net Assets
| | | Year Ended
October 31,
2012 | | Year Ended
October 31,
2011 | |
Operations | |
Net investment income | | $ | 90,061,128 | | | $ | 88,126,068 | | |
Net realized gain (loss) | | | (19,837,666 | ) | | | 1,995,080 | | |
Net change in unrealized appreciation (depreciation) | | | 132,396,839 | | | | (10,933,222 | ) | |
Net increase in net assets resulting from operations | | | 202,620,301 | | | | 79,187,926 | | |
Distributions to shareholders | |
Net investment income | |
Class A | | | (6,493,716 | ) | | | (4,560,858 | ) | |
Class B | | | (58,722 | ) | | | (73,388 | ) | |
Class C | | | (1,329,944 | ) | | | (890,030 | ) | |
Class T | | | (656,047 | ) | | | (505,217 | ) | |
Class Z | | | (81,612,772 | ) | | | (81,781,568 | ) | |
Total distributions to shareholders | | | (90,151,201 | ) | | | (87,811,061 | ) | |
Increase (decrease) in net assets from capital stock activity | | | 179,725,667 | | | | (19,514,237 | ) | |
Proceeds from regulatory settlements (Note 6) | | | 4,227 | | | | — | | |
Total increase (decrease) in net assets | | | 292,198,994 | | | | (28,137,372 | ) | |
Net assets at beginning of year | | | 2,471,219,302 | | | | 2,499,356,674 | | |
Net assets at end of year | | $ | 2,763,418,296 | | | $ | 2,471,219,302 | | |
Undistributed net investment income | | $ | 1,480,423 | | | $ | 1,966,067 | | |
The accompanying Notes to Financial Statements are an integral part of this statement.
Annual Report 2012
34
Columbia Intermediate Municipal Bond Fund
Statement of Changes in Net Assets (continued)
| | | Year Ended October 31, 2012 | | Year Ended October 31, 2011 | |
| | | Shares | | Dollars ($) | | Shares | | Dollars ($) | |
Capital stock activity | |
Class A shares | |
Subscriptions(a) | | | 3,755,163 | | | | 40,921,751 | | | | 2,662,745 | | | | 27,758,263 | | |
Fund merger | | | — | | | | — | | | | 9,094,510 | | | | 95,165,598 | | |
Distributions reinvested | | | 410,721 | | | | 4,482,131 | | | | 229,777 | | | | 2,404,502 | | |
Redemptions | | | (2,670,991 | ) | | | (29,076,371 | ) | | | (3,535,850 | ) | | | (36,490,331 | ) | |
Net increase | | | 1,494,893 | | | | 16,327,511 | | | | 8,451,182 | | | | 88,838,032 | | |
Class B shares | |
Subscriptions | | | 33,433 | | | | 361,732 | | | | 12,087 | | | | 127,072 | | |
Fund merger | | | — | | | | — | | | | 244,615 | | | | 2,560,189 | | |
Distributions reinvested | | | 3,143 | | | | 34,222 | | | | 2,800 | | | | 29,255 | | |
Redemptions(a) | | | (105,809 | ) | | | (1,153,859 | ) | | | (333,920 | ) | | | (3,462,592 | ) | |
Net decrease | | | (69,233 | ) | | | (757,905 | ) | | | (74,418 | ) | | | (746,076 | ) | |
Class C shares | |
Subscriptions | | | 1,902,465 | | | | 20,750,735 | | | | 678,139 | | | | 7,048,453 | | |
Fund merger | | | — | | | �� | — | | | | 1,195,348 | | | | 12,501,819 | | |
Distributions reinvested | | | 81,625 | | | | 891,224 | | | | 45,066 | | | | 470,347 | | |
Redemptions | | | (478,499 | ) | | | (5,218,100 | ) | | | (625,338 | ) | | | (6,447,647 | ) | |
Net increase | | | 1,505,591 | | | | 16,423,859 | | | | 1,293,215 | | | | 13,572,972 | | |
Class T shares | |
Subscriptions | | | 8,780 | | | | 95,622 | | | | 8,651 | | | | 90,290 | | |
Fund merger | | | — | | | | — | | | | 1,084,706 | | | | 11,350,322 | | |
Distributions reinvested | | | 41,479 | | | | 452,314 | | | | 32,929 | | | | 343,458 | | |
Redemptions | | | (100,424 | ) | | | (1,086,501 | ) | | | (222,125 | ) | | | (2,316,090 | ) | |
Net increase (decrease) | | | (50,165 | ) | | | (538,565 | ) | | | 904,161 | | | | 9,467,980 | | |
Class Z shares | |
Subscriptions | | | 43,078,479 | | | | 469,076,802 | | | | 27,836,430 | | | | 288,404,098 | | |
Fund merger | | | — | | | | — | | | | 11,527,090 | | | | 120,618,060 | | |
Distributions reinvested | | | 469,549 | | | | 5,127,586 | | | | 463,106 | | | | 4,803,397 | | |
Redemptions | | | (29,912,911 | ) | | | (325,933,621 | ) | | | (52,863,118 | ) | | | (544,472,700 | ) | |
Net increase (decrease) | | | 13,635,117 | | | | 148,270,767 | | | | (13,036,492 | ) | | | (130,647,145 | ) | |
Total net increase (decrease) | | | 16,516,203 | | | | 179,725,667 | | | | (2,462,352 | ) | | | (19,514,237 | ) | |
(a) Includes conversions of Class B shares to Class A shares, if any.
The accompanying Notes to Financial Statements are an integral part of this statement.
Annual Report 2012
35
Columbia Intermediate Municipal Bond Fund
The following tables are intended to help you understand the Fund's financial performance. Certain information reflects financial results for a single share of a class held for the periods shown. Per share net investment income (loss) amounts are calculated based on average shares outstanding during the period. Total return assumes reinvestment of all dividends and distributions. Total return does not reflect payment of sales charges, if any, and is not annualized for periods of less than one year.
| | | Year Ended October 31, | |
Class A | | 2012 | | 2011 | | 2010 | | 2009 | | 2008 | |
Per share data | |
Net asset value, beginning of period | | $ | 10.56 | | | $ | 10.58 | | | $ | 10.22 | | | $ | 9.62 | | | $ | 10.22 | | |
Income from investment operations: | |
Net investment income | | | 0.35 | | | | 0.37 | | | | 0.36 | | | | 0.37 | | | | 0.38 | | |
Net realized and unrealized gain (loss) | | | 0.47 | | | | (0.02 | ) | | | 0.36 | | | | 0.60 | | | | (0.60 | ) | |
Total from investment operations | | | 0.82 | | | | 0.35 | | | | 0.72 | | | | 0.97 | | | | (0.22 | ) | |
Less distributions to shareholders: | |
Net investment income | | | (0.35 | ) | | | (0.37 | ) | | | (0.36 | ) | | | (0.37 | ) | | | (0.38 | ) | |
Proceeds from regulatory settlements | | | 0.00 | (a) | | | — | | | | 0.00 | (a) | | | 0.00 | (a) | | | — | | |
Net asset value, end of period | | $ | 11.03 | | | $ | 10.56 | | | $ | 10.58 | | | $ | 10.22 | | | $ | 9.62 | | |
Total return | | | 7.88 | %(b) | | | 3.43 | % | | | 7.13 | % | | | 10.19 | % | | | (2.25 | %) | |
Ratios to average net assets(c) | |
Expenses prior to fees waived or expenses reimbursed | | | 0.86 | % | | | 0.86 | % | | | 0.75 | % | | | 0.74 | % | | | 0.72 | % | |
Net expenses after fees waived or expenses reimbursed(d) | | | 0.74 | %(e) | | | 0.73 | %(e) | | | 0.75 | %(e) | | | 0.73 | %(e) | | | 0.70 | %(e) | |
Net investment income | | | 3.22 | %(e) | | | 3.52 | %(e) | | | 3.43 | %(e) | | | 3.66 | %(e) | | | 3.76 | %(e) | |
Supplemental data | |
Net assets, end of period (in thousands) | | $ | 212,161 | | | $ | 187,355 | | | $ | 98,208 | | | $ | 85,642 | | | $ | 78,126 | | |
Portfolio turnover | | | 10 | % | | | 9 | % | | | 13 | % | | | 23 | % | | | 14 | % | |
Notes to Financial Highlights
(a) Rounds to less than $0.01.
(b) The Fund received proceeds from regulatory settlements which had an impact of less than 0.01%.
(c) In addition to the fees and expenses which the Fund bears directly, the Fund indirectly bears a pro rata share of the fees and expenses of the acquired funds in which it invests. Such indirect expenses are not included in the reported expense ratios.
(d) The Investment Manager and certain of its affiliates agreed to waive/reimburse certain fees and expenses, if applicable.
(e) The benefits derived from expense reductions had an impact of less than 0.01%.
The accompanying Notes to Financial Statements are an integral part of this statement.
Annual Report 2012
36
Columbia Intermediate Municipal Bond Fund
Financial Highlights (continued)
| | | Year Ended October 31, | |
Class B | | 2012 | | 2011 | | 2010 | | 2009 | | 2008 | |
Per share data | |
Net asset value, beginning of period | | $ | 10.56 | | | $ | 10.58 | | | $ | 10.22 | | | $ | 9.62 | | | $ | 10.22 | | |
Income from investment operations: | |
Net investment income | | | 0.28 | | | | 0.30 | | | | 0.29 | | | | 0.30 | | | | 0.32 | | |
Net realized and unrealized gain (loss) | | | 0.47 | | | | (0.02 | ) | | | 0.36 | | | | 0.60 | | | | (0.60 | ) | |
Total from investment operations | | | 0.75 | | | | 0.28 | | | | 0.65 | | | | 0.90 | | | | (0.28 | ) | |
Less distributions to shareholders: | |
Net investment income | | | (0.28 | ) | | | (0.30 | ) | | | (0.29 | ) | | | (0.30 | ) | | | (0.32 | ) | |
Proceeds from regulatory settlements | | | 0.00 | (a) | | | — | | | | 0.00 | (a) | | | 0.00 | (a) | | | — | | |
Net asset value, end of period | | $ | 11.03 | | | $ | 10.56 | | | $ | 10.58 | | | $ | 10.22 | | | $ | 9.62 | | |
Total return | | | 7.17 | %(b) | | | 2.76 | % | | | 6.44 | % | | | 9.48 | % | | | (2.88 | %) | |
Ratios to average net assets(c) | |
Expenses prior to fees waived or expenses reimbursed | | | 1.51 | % | | | 1.52 | % | | | 1.40 | % | | | 1.39 | % | | | 1.37 | % | |
Net expenses after fees waived or expenses reimbursed(d) | | | 1.39 | %(e) | | | 1.40 | %(e) | | | 1.40 | %(e) | | | 1.38 | %(e) | | | 1.35 | %(e) | |
Net investment income | | | 2.58 | %(e) | | | 2.85 | %(e) | | | 2.80 | %(e) | | | 3.03 | %(e) | | | 3.11 | %(e) | |
Supplemental data | |
Net assets, end of period (in thousands) | | $ | 1,842 | | | $ | 2,494 | | | $ | 3,285 | | | $ | 5,294 | | | $ | 5,874 | | |
Portfolio turnover | | | 10 | % | | | 9 | % | | | 13 | % | | | 23 | % | | | 14 | % | |
Notes to Financial Highlights
(a) Rounds to less than $0.01.
(b) The Fund received proceeds from regulatory settlements which had an impact of less than 0.01%.
(c) In addition to the fees and expenses which the Fund bears directly, the Fund indirectly bears a pro rata share of the fees and expenses of the acquired funds in which it invests. Such indirect expenses are not included in the reported expense ratios.
(d) The Investment Manager and certain of its affiliates agreed to waive/reimburse certain fees and expenses, if applicable.
(e) The benefits derived from expense reductions had an impact of less than 0.01%.
The accompanying Notes to Financial Statements are an integral part of this statement.
Annual Report 2012
37
Columbia Intermediate Municipal Bond Fund
Financial Highlights (continued)
| | | Year Ended October 31, | |
Class C | | 2012 | | 2011 | | 2010 | | 2009 | | 2008 | |
Per share data | |
Net asset value, beginning of period | | $ | 10.56 | | | $ | 10.58 | | | $ | 10.22 | | | $ | 9.62 | | | $ | 10.22 | | |
Income from investment operations: | |
Net investment income | | | 0.33 | | | | 0.35 | | | | 0.34 | | | | 0.35 | | | | 0.36 | | |
Net realized and unrealized gain (loss) | | | 0.47 | | | | (0.02 | ) | | | 0.36 | | | | 0.60 | | | | (0.60 | ) | |
Total from investment operations | | | 0.80 | | | | 0.33 | | | | 0.70 | | | | 0.95 | | | | (0.24 | ) | |
Less distributions to shareholders: | |
Net investment income | | | (0.33 | ) | | | (0.35 | ) | | | (0.34 | ) | | | (0.35 | ) | | | (0.36 | ) | |
Proceeds from regulatory settlements | | | 0.00 | (a) | | | — | | | | 0.00 | (a) | | | 0.00 | (a) | | | — | | |
Net asset value, end of period | | $ | 11.03 | | | $ | 10.56 | | | $ | 10.58 | | | $ | 10.22 | | | $ | 9.62 | | |
Total return | | | 7.66 | %(b) | | | 3.22 | % | | | 6.92 | % | | | 9.97 | % | | | (2.45 | %) | |
Ratios to average net assets(c) | |
Expenses prior to fees waived or expenses reimbursed | | | 1.51 | % | | | 1.52 | % | | | 1.40 | % | | | 1.39 | % | | | 1.37 | % | |
Net expenses after fees waived or expenses reimbursed(d) | | | 0.94 | %(e) | | | 0.93 | %(e) | | | 0.95 | %(e) | | | 0.93 | %(e) | | | 0.90 | %(e) | |
Net investment income | | | 3.01 | %(e) | | | 3.33 | %(e) | | | 3.23 | %(e) | | | 3.45 | %(e) | | | 3.56 | %(e) | |
Supplemental data | |
Net assets, end of period (in thousands) | | $ | 53,729 | | | $ | 35,541 | | | $ | 21,903 | | | $ | 17,304 | | | $ | 12,625 | | |
Portfolio turnover | | | 10 | % | | | 9 | % | | | 13 | % | | | 23 | % | | | 14 | % | |
Notes to Financial Highlights
(a) Rounds to less than $0.01.
(b) The Fund received proceeds from regulatory settlements which had an impact of less than 0.01%.
(c) In addition to the fees and expenses which the Fund bears directly, the Fund indirectly bears a pro rata share of the fees and expenses of the acquired funds in which it invests. Such indirect expenses are not included in the reported expense ratios.
(d) The Investment Manager and certain of its affiliates agreed to waive/reimburse certain fees and expenses, if applicable.
(e) The benefits derived from expense reductions had an impact of less than 0.01%.
The accompanying Notes to Financial Statements are an integral part of this statement.
Annual Report 2012
38
Columbia Intermediate Municipal Bond Fund
Financial Highlights (continued)
| | | Year Ended October 31, | |
Class T | | 2012 | | 2011 | | 2010 | | 2009 | | 2008 | |
Per share data | |
Net asset value, beginning of period | | $ | 10.56 | | | $ | 10.58 | | | $ | 10.22 | | | $ | 9.62 | | | $ | 10.22 | | |
Income from investment operations: | |
Net investment income | | | 0.36 | | | | 0.37 | | | | 0.36 | | | | 0.37 | | | | 0.39 | | |
Net realized and unrealized gain (loss) | | | 0.47 | | | | (0.01 | ) | | | 0.36 | | | | 0.60 | | | | (0.60 | ) | |
Total from investment operations | | | 0.83 | | | | 0.36 | | | | 0.72 | | | | 0.97 | | | | (0.21 | ) | |
Less distributions to shareholders: | |
Net investment income | | | (0.36 | ) | | | (0.38 | ) | | | (0.36 | ) | | | (0.37 | ) | | | (0.39 | ) | |
Proceeds from regulatory settlements | | | 0.00 | (a) | | | — | | | | 0.00 | (a) | | | 0.00 | (a) | | | — | | |
Net asset value, end of period | | $ | 11.03 | | | $ | 10.56 | | | $ | 10.58 | | | $ | 10.22 | | | $ | 9.62 | | |
Total return | | | 7.93 | %(b) | | | 3.48 | % | | | 7.19 | % | | | 10.25 | % | | | (2.20 | %) | |
Ratios to average net assets(c) | |
Expenses prior to fees waived or expenses reimbursed | | | 0.81 | % | | | 0.81 | % | | | 0.70 | % | | | 0.69 | % | | | 0.67 | % | |
Net expenses after fees waived or expenses reimbursed(d) | | | 0.69 | %(e) | | | 0.68 | %(e) | | | 0.70 | %(e) | | | 0.68 | %(e) | | | 0.65 | %(e) | |
Net investment income | | | 3.28 | %(e) | | | 3.56 | %(e) | | | 3.49 | %(e) | | | 3.72 | %(e) | | | 3.81 | %(e) | |
Supplemental data | |
Net assets, end of period (in thousands) | | $ | 20,105 | | | $ | 19,780 | | | $ | 10,243 | | | $ | 10,462 | | | $ | 10,786 | | |
Portfolio turnover | | | 10 | % | | | 9 | % | | | 13 | % | | | 23 | % | | | 14 | % | |
Notes to Financial Highlights
(a) Rounds to less than $0.01.
(b) The Fund received proceeds from regulatory settlements which had an impact of less than 0.01%.
(c) In addition to the fees and expenses which the Fund bears directly, the Fund indirectly bears a pro rata share of the fees and expenses of the acquired funds in which it invests. Such indirect expenses are not included in the reported expense ratios.
(d) The Investment Manager and certain of its affiliates agreed to waive/reimburse certain fees and expenses, if applicable.
(e) The benefits derived from expense reductions had an impact of less than 0.01%.
The accompanying Notes to Financial Statements are an integral part of this statement.
Annual Report 2012
39
Columbia Intermediate Municipal Bond Fund
Financial Highlights (continued)
| | | Year Ended October 31, | |
Class Z | | 2012 | | 2011 | | 2010 | | 2009 | | 2008 | |
Per share data | |
Net asset value, beginning of period | | $ | 10.57 | | | $ | 10.58 | | | $ | 10.22 | | | $ | 9.62 | | | $ | 10.22 | | |
Income from investment operations: | |
Net investment income | | | 0.37 | | | | 0.39 | | | | 0.38 | | | | 0.39 | | | | 0.40 | | |
Net realized and unrealized gain (loss) | | | 0.47 | | | | (0.01 | ) | | | 0.36 | | | | 0.60 | | | | (0.60 | ) | |
Total from investment operations | | | 0.84 | | | | 0.38 | | | | 0.74 | | | | 0.99 | | | | (0.20 | ) | |
Less distributions to shareholders: | |
Net investment income | | | (0.37 | ) | | | (0.39 | ) | | | (0.38 | ) | | | (0.39 | ) | | | (0.40 | ) | |
Proceeds from regulatory settlements | | | 0.00 | (a) | | | — | | | | 0.00 | (a) | | | 0.00 | (a) | | | — | | |
Net asset value, end of period | | $ | 11.04 | | | $ | 10.57 | | | $ | 10.58 | | | $ | 10.22 | | | $ | 9.62 | | |
Total return | | | 8.07 | %(b) | | | 3.69 | % | | | 7.35 | % | | | 10.41 | % | | | (2.05 | %) | |
Ratios to average net assets(c) | |
Expenses prior to fees waived or expenses reimbursed | | | 0.66 | % | | | 0.66 | % | | | 0.55 | % | | | 0.54 | % | | | 0.52 | % | |
Net expenses after fees waived or expenses reimbursed(d) | | | 0.54 | %(e) | | | 0.54 | %(e) | | | 0.55 | %(e) | | | 0.53 | %(e) | | | 0.50 | %(e) | |
Net investment income | | | 3.42 | %(e) | | | 3.74 | %(e) | | | 3.64 | %(e) | | | 3.87 | %(e) | | | 3.96 | %(e) | |
Supplemental data | |
Net assets, end of period (in thousands) | | $ | 2,475,582 | | | $ | 2,226,049 | | | $ | 2,365,718 | | | $ | 2,384,815 | | | $ | 2,310,978 | | |
Portfolio turnover | | | 10 | % | | | 9 | % | | | 13 | % | | | 23 | % | | | 14 | % | |
Notes to Financial Highlights
(a) Rounds to less than $0.01.
(b) The Fund received proceeds from regulatory settlements which had an impact of less than 0.01%.
(c) In addition to the fees and expenses which the Fund bears directly, the Fund indirectly bears a pro rata share of the fees and expenses of the acquired funds in which it invests. Such indirect expenses are not included in the reported expense ratios.
(d) The Investment Manager and certain of its affiliates agreed to waive/reimburse certain fees and expenses, if applicable.
(e) The benefits derived from expense reductions had an impact of less than 0.01%.
The accompanying Notes to Financial Statements are an integral part of this statement.
Annual Report 2012
40
Columbia Intermediate Municipal Bond Fund
Notes to Financial Statements
October 31, 2012
Note 1. Organization
Columbia Intermediate Municipal Bond Fund (the Fund), a series of Columbia Funds Series Trust I (the Trust), is a diversified fund. The Trust is registered under the Investment Company Act of 1940, as amended (the 1940 Act), as an open-end management investment company organized as a Massachusetts business trust.
Fund Shares
The Trust may issue an unlimited number of shares (without par value). The Fund offers Class A, Class B, Class C, Class T and Class Z shares. All share classes have identical voting, dividend and liquidation rights. Each share class has its own expense structure and sales charges, as applicable.
Class A shares are subject to a maximum front-end sales charge of 3.25% based on the initial investment amount. Class A shares purchased without an initial sales charge in accounts aggregating $1 million to $50 million at the time of purchase are subject to a contingent deferred sales charge (CDSC) if the shares are sold within 18 months of purchase, charged as follows: 1.00% CDSC if redeemed within 12 months of purchase, and 0.50% CDSC if redeemed more than 12, but less than 18, months after purchase.
Class B shares may be subject to a maximum CDSC of 3.00% based upon the holding period after purchase. Class B shares will generally convert to Class A shares eight years after purchase. The Fund no longer accepts investments by new or existing investors in the Fund's Class B shares, except in connection with the reinvestment of any dividend and/or capital gain distributions in Class B shares of the Fund and exchanges by existing Class B shareholders of certain other funds within the Columbia Family of Funds.
Class C shares are subject to a 1.00% CDSC on shares redeemed within one year of purchase.
Class R5 shares are not subject to sales charges and are only available to investors purchasing through authorized investment professionals. Class R5 shares commenced operations on November 8, 2012.
Class T shares are subject to a maximum front-end sales charge of 4.75% based on the investment amount. Class T shares purchased without an initial sales charge in accounts aggregating $1 million to $50 million at the time of purchase are subject to a CDSC if the shares are sold within 18 months of purchase, charged as follows: 1.00% CDSC if redeemed within 12 months of purchase, and 0.50% CDSC if redeemed more than 12, but less than 18, months after purchase. Class T shares are available only to investors who received (and who have continuously held) Class T shares in connection with the
merger of certain Galaxy Funds into various Columbia Funds (formerly named Liberty Funds).
Class Z shares are not subject to sales charges, and are only available to certain investors.
Note 2. Summary of Significant Accounting Policies
Use of Estimates
The preparation of financial statements in accordance with U.S. generally accepted accounting principles (GAAP) requires management to make certain estimates and assumptions that affect the reported amounts of assets and liabilities, the disclosure of contingent assets and liabilities at the date of the financial statements and the reported amounts of revenue and expenses during the reporting period. Actual results could differ from those estimates.
The following is a summary of significant accounting policies consistently followed by the Fund in the preparation of its financial statements.
Security Valuation
Debt securities generally are valued by pricing services approved by the Board of Trustees (the Board) based upon market transactions for normal, institutional-size trading units of similar securities. The services may use various pricing techniques which take into account appropriate factors such as yield, quality, coupon rate, maturity, type of issue, trading characteristics and other data, as well as broker quotes. Debt securities for which quotations are readily available may also be valued based upon an over-the-counter or exchange bid quotation.
Investments in other open-end investment companies, including money market funds, are valued at net asset value.
Short-term securities purchased within 60 days to maturity are valued at amortized cost, which approximates market value. The value of short-term securities originally purchased with maturities greater than 60 days is determined based on an amortized value to par upon reaching 60 days to maturity. Short-term securities maturing in more than 60 days from the valuation date are valued at the market price or approximate market value based on current interest rates.
Investments for which market quotations are not readily available, or that have quotations which management believes are not reliable, are valued at fair value as determined in good faith under consistently applied procedures established by and under the general supervision of the Board. If a security or class of securities (such as foreign securities) is valued at fair
Annual Report 2012
41
Columbia Intermediate Municipal Bond Fund
Notes to Financial Statements (continued)
October 31, 2012
value, such value is likely to be different from the last quoted market price for the security.
The determination of fair value often requires significant judgment. To determine fair value, management may use assumptions including but not limited to future cash flows and estimated risk premiums. Multiple inputs from various sources may be used to determine fair value.
Delayed Delivery Securities and Forward Sale Commitments
The Fund may trade securities on other than normal settlement terms, including securities purchased or sold on a "when-issued" basis. This may increase the risk if the other party to the transaction fails to deliver and causes the Fund to subsequently invest at less advantageous prices. The Fund designates cash or liquid securities in an amount equal to the delayed delivery commitment.
The Fund may enter into forward sale commitments to hedge its portfolio positions or to sell mortgage-backed securities it owns under delayed delivery arrangements. Proceeds of forward sale commitments are not received until the contractual settlement date. While a forward sale commitment is outstanding, equivalent deliverable securities or an offsetting forward purchase commitment deliverable on or before the sale commitment date, are used to satisfy the commitment.
Unsettled forward sale commitments are valued at the current market value of the underlying securities, generally according to the procedures described under "Security Valuation" above. The forward sale commitment is "marked-to-market" daily and the change in market value is recorded by the Fund as an unrealized gain or loss. If the forward sale commitment is closed through the acquisition of an offsetting purchase commitment, the Fund realizes a gain or loss. If the Fund delivers securities under the commitment, the Fund realizes a gain or a loss from the sale of the securities based upon the market price established at the date the commitment was entered into.
Security Transactions
Security transactions are accounted for on the trade date. Cost is determined and gains (losses) are based upon the specific identification method for both financial statement and federal income tax purposes.
Income Recognition
Interest income is recorded on an accrual basis. Market premiums and discounts, including original issue discounts, are amortized and accreted, respectively, over the expected life of the security on all debt securities, unless otherwise noted.
Dividend income is recorded on the ex-dividend date.
Expenses
General expenses of the Trust are allocated to the Fund and other funds of the Trust based upon relative net assets or other expense allocation methodologies determined by the nature of the expense. Expenses directly attributable to the Fund are charged to the Fund. Expenses directly attributable to a specific class of shares are charged to that share class.
Determination of Class Net Asset Value
All income, expenses (other than class-specific expenses, which are charged to that share class, as shown in the Statement of Operations) and realized and unrealized gains (losses) are allocated to each class of the Fund on a daily basis for purposes of determining the net asset value of each class. Income and expenses are allocated to each class based on the settled shares method, while realized and unrealized gains (losses) are allocated based on the relative net assets of each class.
Federal Income Tax Status
The Fund intends to qualify each year as a regulated investment company under Subchapter M of the Internal Revenue Code, as amended, and will distribute substantially all of its tax exempt or taxable income (including net short-term capital gains), if any, for its tax year, and as such will not be subject to federal income taxes. In addition, the Fund intends to distribute in each calendar year substantially all of its net investment income, capital gains and certain other amounts, if any, such that the Fund should not be subject to federal excise tax. Therefore, no federal income or excise tax provision is recorded.
Distributions to Shareholders
Distributions from net investment income, if any, are declared daily and paid monthly. Net realized capital gains, if any, are distributed at least annually. Income distributions and capital gain distributions are determined in accordance with federal income tax regulations, which may differ from GAAP.
Guarantees and Indemnifications
Under the Trust's organizational documents and, in some cases, by contract, its officers and trustees are indemnified against certain liabilities arising out of the performance of their duties to the Trust or its funds. In addition, certain of the Fund's contracts with its service providers contain general indemnification clauses. The Fund's maximum exposure under these arrangements is unknown since the amount of any future claims that may be made against the Fund cannot be determined, and the Fund has no historical basis for predicting the likelihood of any such claims.
Annual Report 2012
42
Columbia Intermediate Municipal Bond Fund
Notes to Financial Statements (continued)
October 31, 2012
Recent Accounting Pronouncement
Disclosures about Offsetting Assets and Liabilities
In December 2011, the Financial Accounting Standards Board (FASB) issued ASU No. 2011-11, Disclosures about Offsetting Assets and Liabilities. The objective of the FASB is to enhance current disclosure requirements on offsetting of certain assets and liabilities and to enable financial statement users to compare financial statements prepared under GAAP and International Financial Reporting Standards.
Specifically, ASU No. 2011-11 requires an entity to disclose both gross and net information for derivatives and other financial instruments that are subject to a master netting arrangement or similar agreement. The standard requires disclosure of collateral received in connection with the master netting agreements or similar agreements. The effective date of ASU No. 2011-11 is for interim and annual periods beginning on or after January 1, 2013. At this time, management is evaluating the implications of this guidance and the impact it will have on the financial statement amounts and footnote disclosures, if any.
Note 3. Fees and Compensation Paid to Affiliates
Investment Management Fees
Under an Investment Management Services Agreement, Columbia Management Investment Advisers, LLC (the Investment Manager), a wholly-owned subsidiary of Ameriprise Financial, Inc. (Ameriprise Financial), determines which securities will be purchased, held or sold. The investment management fee is an annual fee that is equal to a percentage of the Fund's average daily net assets that declines from 0.41% to 0.25% as the Fund's net assets increase. The annualized effective investment management fee rate for the year ended October 31, 2012 was 0.39% of the Fund's average daily net assets.
Administration Fees
Under an Administrative Services Agreement, the Investment Manager also serves as the Fund Administrator. The Fund pays the Fund Administrator an annual fee for administration and accounting services equal to a percentage of the Fund's average daily net assets that declines from 0.07% to 0.04% as the Fund's net assets increase. The annualized effective administration fee rate for the year ended October 31, 2012 was 0.06% of the Fund's average daily net assets.
Compensation of Board Members
Board members are compensated for their services to the Fund as disclosed in the Statement of Operations. The Trust's eligible Trustees may participate in a Deferred Compensation
Plan (the Plan) which may be terminated at any time. Obligations of the Plan will be paid solely out of the Fund's assets.
Compensation of Chief Compliance Officer
The Board has appointed a Chief Compliance Officer to the Fund in accordance with federal securities regulations. The Fund pays its pro-rata share of the expenses associated with the Chief Compliance Officer. The Fund's expenses for the Chief Compliance Officer will not exceed $15,000 per year.
Transfer Agent Fees
Under a Transfer and Dividend Disbursing Agent Agreement, Columbia Management Investment Services Corp. (the Transfer Agent), an affiliate of the Investment Manager and a wholly-owned subsidiary of Ameriprise Financial, is responsible for providing transfer agency services to the Fund. The Transfer Agent has contracted with Boston Financial Data Services (BFDS) to serve as sub-transfer agent.
The Transfer Agent receives monthly account-based service fees based on the number of open accounts and is reimbursed by the Fund for the fees and expenses the Transfer Agent pays to financial intermediaries that maintain omnibus accounts with the Fund that is a percentage of the average aggregate value of the Fund's shares maintained in each such omnibus account (other than omnibus accounts for which American Enterprise Investment Services Inc. is the broker of record or accounts where the beneficial shareholder is a customer of Ameriprise Financial Services, Inc., which are paid a per account fee). The Transfer Agent pays the fees of BFDS for services as sub-transfer agent and is not entitled to reimbursement for such fees from the Fund (with the exception of out-of-pocket fees).
The Transfer Agent also receives compensation from fees for various shareholder services and reimbursements for certain out-of-pocket fees.
For the year ended October 31, 2012, the Fund's annualized effective transfer agent fee rates as a percentage of average daily net assets of each class were as follows:
Class A | | | 0.19 | % | |
Class B | | | 0.19 | | |
Class C | | | 0.19 | | |
Class T | | | 0.19 | | |
Class Z | | | 0.19 | | |
An annual minimum account balance fee of $20 may apply to certain accounts with a value below the Fund's initial minimum investment requirements to reduce the impact of small accounts on transfer agent fees. These minimum account balance fees are recorded as part of expense reductions in the
Annual Report 2012
43
Columbia Intermediate Municipal Bond Fund
Notes to Financial Statements (continued)
October 31, 2012
Statement of Operations. For the year ended October 31, 2012, these minimum account balance fees reduced total expenses by $800.
Distribution and Service Fees
The Fund has an agreement with Columbia Management Investment Distributors, Inc. (the Distributor), an affiliate of the Investment Manager and a wholly-owned subsidiary of Ameriprise Financial, for distribution and shareholder services. Pursuant to Rule 12b-1 under the 1940 Act, the Board has approved, and the Fund has adopted, distribution and shareholder service plans (the Plans) which set the distribution and service fees for the Fund. These fees are calculated daily and are intended to compensate the Distributor and/or eligible selling and/or servicing agents for selling shares of the Fund and providing services to investors.
The Plans require the payment of a monthly service fee to the Distributor at the maximum annual rate of 0.20% of the average daily net assets attributable to Class A, Class B and Class C shares of the Fund. The Plans also require the payment of a monthly distribution fee to the Distributor at the maximum annual rate of 0.65% of the average daily net assets attributable to Class B and Class C shares only.
The Distributor has voluntarily agreed to waive a portion of the distribution fee for Class C shares so that the combined distribution and service fee does not exceed 0.40% annually of the average daily net assets attributable to Class C shares. This arrangement may be modified or terminated by the Distributor at any time.
Shareholder Services Fees
The Fund has adopted a shareholder services plan that permits it to pay for certain services provided to Class T shareholders by their selling and/or servicing agents. The Fund may pay shareholder servicing fees up to an aggregate annual rate of 0.40% of the Fund's average daily net assets attributable to Class T shares (comprised of up to 0.20% for shareholder liaison services and up to 0.20% for administrative support services). These fees are currently limited to an aggregate annual rate of not more than 0.15% of the Fund's average daily net assets attributable to Class T shares. In addition, the servicing fee for Class T shares will be waived by selling and/or servicing agents to the extent necessary to prevent the net investment income for the Class T shares from falling below 0.00% on a daily basis. The shareholder services fee for the year ended October 31, 2012 was 0.15% of the Fund's average daily net assets attributable to Class T shares.
Sales Charges
Sales charges, including front-end charges and CDSCs, received by the Distributor for distributing Fund shares were $191,156 for Class A, $347 for Class B, $4,058 for Class C and $105 for Class T shares for the year ended October 31, 2012.
Expenses Waived/Reimbursed by the Investment Manager and its Affiliates
The Investment Manager and certain of its affiliates have contractually agreed to waive fees and/or reimburse expenses (excluding certain fees and expenses described below), through February 28, 2013, unless sooner terminated at the sole discretion of the Board, so that the Fund's net operating expenses, after giving effect to fees waived/expenses reimbursed and/or overdraft charges from the Fund's custodian, do not exceed the following annual rates as a percentage of the class' average daily net assets:
Class A | | | 0.74 | % | |
Class B | | | 1.39 | | |
Class C | | | 1.39 | | |
Class T | | | 0.69 | | |
Class Z | | | 0.54 | | |
Under the agreement, the following fees and expenses are excluded from the waiver/reimbursement commitment, and therefore will be paid by the Fund, if applicable: taxes (including foreign transaction taxes), expenses associated with investments in affiliated and non-affiliated pooled investment vehicles (including mutual funds and exchange traded funds), transaction costs and brokerage commissions, costs related to any securities lending program, dividend expenses associated with securities sold short, inverse floater program fees and expenses, transaction charges and interest on borrowed money, interest, extraordinary expenses and any other expenses the exclusion of which is specifically approved by the Board. This agreement may be modified or amended only with approval from all parties. Class C distribution fees waived by the Distributor, as discussed above, are in addition to the waiver/reimbursement commitment under the agreement.
Note 4. Federal Tax Information
The timing and character of income and capital gain distributions are determined in accordance with income tax regulations, which may differ from GAAP because of temporary or permanent book to tax differences.
At October 31, 2012, these differences are primarily due to differing treatment for capital loss carryforwards, principal and/or interest of fixed income securities, Trustees' deferred compensation, distribution reclassifications, and proceeds from regulatory settlements. To the extent these differences are
Annual Report 2012
44
Columbia Intermediate Municipal Bond Fund
Notes to Financial Statements (continued)
October 31, 2012
permanent, reclassifications are made among the components of the Fund's net assets in the Statement of Assets and Liabilities. Temporary differences do not require reclassifications. In the Statement of Assets and Liabilities the following reclassifications were made:
Undistributed net investment income | | $ | (395,571 | ) | |
Accumulated net realized loss | | | 72,287 | | |
Paid-in capital | | | 323,284 | | |
Net investment income and net realized gains (losses), as disclosed in the Statement of Operations, and net assets were not affected by this reclassification.
The tax character of distributions paid during the years indicated was as follows:
Year Ended October 31, | | 2012 | | 2011 | |
Ordinary income | | $ | 62,042 | | | $ | 1,294,392 | | |
Tax-exempt income | | | 90,089,159 | | | | 86,516,669 | | |
Long-term capital gains | | | — | | | | — | | |
Tax return of capital | | | — | | | | — | | |
Total | | $ | 90,151,201 | | | $ | 87,811,061 | | |
Short-term capital gain distributions, if any, are considered ordinary income distributions for tax purposes.
At October 31, 2012, the components of distributable earnings on a tax basis were as follows:
Undistributed tax-exempt income | | $ | 9,451,826 | | |
Undistributed accumulated long-term gain | | | — | | |
Unrealized appreciation | | | 257,796,134 | | |
At October 31, 2012, the cost of investments for federal income tax purposes was $2,474,919,943 and the aggregate gross unrealized appreciation and depreciation based on that cost was:
Unrealized appreciation | | $ | 262,058,589 | | |
Unrealized depreciation | | | (4,262,455 | ) | |
Net unrealized appreciation | | $ | 257,796,134 | | |
The following capital loss carryforward, determined at October 31, 2012, may be available to reduce taxable income arising from future net realized gains on investments, if any, to the extent permitted by the Internal Revenue Code:
Year of Expiration | | Amount | |
2017 | | $ | 832,773 | | |
2018 | | | 62,558 | | |
Unlimited long-term | | | 19,899,605 | | |
Total | | $ | 20,794,936 | | |
Unlimited capital loss carryforwards are required to be utilized prior to any capital losses which carry an expiration
date. As a result of this ordering rule, capital loss carryforwards which carry an expiration date may be more likely to expire unused.
Management of the Fund has concluded that there are no significant uncertain tax positions that would require recognition in the financial statements. However, management's conclusion may be subject to review and adjustment at a later date based on factors including, but not limited to, new tax laws, regulations, and administrative interpretations (including relevant court decisions). Generally, the Fund's federal tax returns for the prior three fiscal years remain subject to examination by the Internal Revenue Service.
Note 5. Portfolio Information
The cost of purchases and proceeds from sales of securities, excluding short-term obligations, aggregated to $370,055,936 and $254,182,694, respectively, for the year ended October 31, 2012.
Note 6. Regulatory Settlements
During the year ended October 31, 2012, the Fund received $4,227 as a result of a regulatory settlement proceeding brought by the Securities and Exchange Commission against an unaffiliated third party relating to market timing and/or late trading of mutual funds. This amount represented the Fund's portion of the proceeds from the settlement (the Fund was not a party to the proceeding). The payments have been included in "Proceeds from regulatory settlements" in the Statement of Changes in Net Assets.
Note 7. Shareholder Concentration
At October 31, 2012, one unaffiliated shareholder account owned 84.2% of the outstanding shares of the Fund. The Fund has no knowledge about whether any portion of those shares was owned beneficially by such account. Subscription and redemption activity by concentrated accounts may have a significant effect on the operations of the Fund.
Note 8. Line of Credit
The Fund has entered into a revolving credit facility with a syndicate of banks led by JPMorgan Chase Bank N.A. whereby the Fund may borrow for the temporary funding of shareholder redemptions or for other temporary or emergency purposes. The credit facility agreement, as amended, which is a collective agreement between the Fund and certain other funds managed by the Investment Manager, severally and not jointly, permits collective borrowings up to $500 million. Pursuant to a December 13, 2011 amendment to the credit facility agreement, interest is charged to each participating
Annual Report 2012
45
Columbia Intermediate Municipal Bond Fund
Notes to Financial Statements (continued)
October 31, 2012
fund based on its borrowings at a rate equal to the higher of (i) the overnight federal funds rate plus 1.00% or (ii) the one-month LIBOR rate plus 1.00%. Each borrowing under the credit facility matures no later than 60 days after the date of borrowing. The Fund also pays a commitment fee equal to its pro rata share of the amount of the credit facility at a rate of 0.08% per annum.
Prior to December 13, 2011, interest was charged to each participating fund based on its borrowings at a rate equal to the sum of the federal funds rate plus (i) 1.25% per annum plus (ii) if one-month LIBOR exceeds the federal funds rate, the amount of such excess. The Fund also paid a commitment fee equal to its pro rata share of the amount of the credit facility at a rate of 0.10% per annum.
The Fund had no borrowings during the year ended October 31, 2012.
Note 9. Fund Merger
At the close of business on June 3, 2011, the Fund acquired the assets and assumed the identified liabilities of Columbia New Jersey Intermediate Municipal Bond Fund and Columbia Rhode Island Intermediate Municipal Bond Fund, two series of the Columbia Funds Series Trust I, and RiverSource Intermediate Tax-Exempt Fund, a series of RiverSource Tax-Exempt Series, Inc. The reorganization was completed after shareholders approved the plan on February 15, 2011. The purpose of the transaction was to combine four funds managed by the Investment Manager with comparable investment objectives and strategies.
The aggregate net assets of the Fund immediately before the acquisitions were $2,227,872,401 and the combined net assets immediately after the acquisitions were $2,470,068,389.
The merger was accomplished by a tax-free exchange of 6,633,086 shares of Columbia New Jersey Intermediate Municipal Bond Fund valued at $67,948,141 (including $2,489,546 of unrealized appreciation), 7,276,496 shares of Columbia Rhode Island Intermediate Municipal Bond Fund valued at $80,645,240 (including $3,430,564 of unrealized appreciation), and 17,556,452 shares of RiverSource Intermediate Tax-Exempt Fund valued at $93,602,607 (including $4,097,605 of unrealized appreciation).
In exchange for shares of Columbia New Jersey Intermediate Municipal Bond Fund, Columbia Rhode Island Intermediate
Municipal Bond Fund and RiverSource Intermediate Tax-Exempt Fund, the Fund issued the following number of shares:
| | | Columbia New Jersey
Intermediate
Municipal Bond
Fund | | Columbia Rhode Island
Intermediate
Municipal Bond
Fund | | RiverSource
Intermediate
Tax-Exempt
Fund | |
Class A | | | 797,207 | | | | 143,586 | | | | 8,153,717 | | |
Class B | | | 45,032 | | | | 19,457 | | | | 180,126 | | |
Class C | | | 442,856 | | | | 140,604 | | | | 611,888 | | |
Class T | | | 332,124 | | | | 752,582 | | | | N/A | | |
Class Z | | | 4,876,357 | | | | 6,650,733 | | | | N/A | | |
For financial reporting purposes, net assets received and shares issued by the Fund were recorded at fair value; however, Columbia New Jersey Intermediate Municipal Bond Fund, Columbia Rhode Island Intermediate Municipal Bond Fund and RiverSource Intermediate Tax-Exempt Fund's cost of investments were carried forward.
The financial statements reflect the operations of the Fund for the period prior to the merger and the combined fund for the period subsequent to the merger. Because the combined investment portfolios have been managed as a single integrated portfolio since the merger was completed, it is not practicable to separate the amounts of revenue and earnings of Columbia New Jersey Intermediate Municipal Bond Fund, Columbia Rhode Island Intermediate Municipal Bond Fund and RiverSource Intermediate Tax-Exempt Fund that have been included in the combined Fund's Statement of Operations since the merger was completed.
Assuming the merger had been completed on November 1, 2010, the Fund's pro-forma net investment income, net gain on investments, net change in unrealized depreciation and net increase in net assets from operations for the year ended October 31, 2011 would have been approximately $93.3 million, $2.3million, $(15.9) million and $79.6 million, respectively.
Note 10. Subsequent Events
Management has evaluated the events and transactions that have occurred through the date the financial statements were issued and noted no items requiring adjustment of the financial statements or additional disclosure.
Note 11. Information Regarding Pending and Settled Legal Proceedings
In December 2005, without admitting or denying the allegations, American Express Financial Corporation (AEFC, which is now known as Ameriprise Financial, Inc. (Ameriprise Financial)) entered into settlement agreements with the Securities and Exchange Commission (SEC) and Minnesota Department of Commerce (MDOC) related to market timing
Annual Report 2012
46
Columbia Intermediate Municipal Bond Fund
Notes to Financial Statements (continued)
October 31, 2012
activities. As a result, AEFC was censured and ordered to cease and desist from committing or causing any violations of certain provisions of the Investment Advisers Act of 1940, the Investment Company Act of 1940, and various Minnesota laws. AEFC agreed to pay disgorgement of $10 million and civil money penalties of $7 million. AEFC also agreed to retain an independent distribution consultant to assist in developing a plan for distribution of all disgorgement and civil penalties ordered by the SEC in accordance with various undertakings detailed at www.sec.gov/litigation/admin/ia-2451.pdf. Ameriprise Financial and its affiliates have cooperated with the SEC and the MDOC in these legal proceedings, and have made regular reports to the funds' Boards of Trustees.
Ameriprise Financial and certain of its affiliates have historically been involved in a number of legal, arbitration and regulatory proceedings, including routine litigation, class actions, and governmental actions, concerning matters arising in connection with the conduct of their business activities. Ameriprise Financial believes that the Funds are not currently the subject of, and that neither Ameriprise Financial nor any of its affiliates are the subject of, any pending legal, arbitration or regulatory proceedings that are likely to have a material
adverse effect on the Funds or the ability of Ameriprise Financial or its affiliates to perform under their contracts with the Funds. Ameriprise Financial is required to make 10-Q, 10-K and, as necessary, 8-K filings with the Securities and Exchange Commission on legal and regulatory matters that relate to Ameriprise Financial and its affiliates. Copies of these filings may be obtained by accessing the SEC website at www.sec.gov.
There can be no assurance that these matters, or the adverse publicity associated with them, will not result in increased fund redemptions, reduced sale of fund shares or other adverse consequences to the Funds. Further, although we believe proceedings are not likely to have a material adverse effect on the Funds or the ability of Ameriprise Financial or its affiliates to perform under their contracts with the Funds, these proceedings are subject to uncertainties and, as such, we are unable to estimate the possible loss or range of loss that may result. An adverse outcome in one or more of these proceedings could result in adverse judgments, settlements, fines, penalties or other relief that could have a material adverse effect on the consolidated financial condition or results of operations of Ameriprise Financial.
Annual Report 2012
47
Columbia Intermediate Municipal Bond Fund
Report of Independent Registered Public Accounting Firm
To the Trustees of Columbia Funds Series Trust I and
the Shareholders of Columbia Intermediate Municipal Bond Fund
In our opinion, the accompanying statement of assets and liabilities, including the portfolio of investments, and the related statements of operations and of changes in net assets and the financial highlights present fairly, in all material respects, the financial position of Columbia Intermediate Municipal Bond Fund (the "Fund") (a series of Columbia Funds Series Trust I) at October 31, 2012, the results of its operations for the year then ended, the changes in its net assets for each of the two years in the period then ended and the financial highlights for each of the periods indicated, in conformity with accounting principles generally accepted in the United States of America. These financial statements and financial highlights (hereafter referred to as "financial statements") are the responsibility of the Fund's management. Our responsibility is to express an opinion on these financial statements based on our audits. We conducted our audits of these financial statements in accordance with the standards of the Public Company Accounting Oversight Board (United States). Those standards require that we plan and perform the audit to obtain reasonable assurance about whether the financial statements are free of material misstatement. An audit includes examining, on a test basis, evidence supporting the amounts and disclosures in the financial statements, assessing the accounting principles used and significant estimates made by management, and evaluating the overall financial statement presentation. We believe that our audits, which included confirmation of securities at October 31, 2012 by correspondence with the custodian, brokers and transfer agent, provide a reasonable basis for our opinion.
PricewaterhouseCoopers LLP
Minneapolis, Minnesota
December 21, 2012
Annual Report 2012
48
Columbia Intermediate Municipal Bond Fund
Federal Income Tax Information
(Unaudited)
The Fund hereby designates the following tax attributes for the fiscal year ended October 31, 2012. Shareholders will be notified in early 2013 of amounts for use in preparing 2012 income tax returns.
Tax Designations:
| Exempt-Interest Dividends | | | 99.93 | % | |
Exempt-Interest Dividends. The percentage of net investment income distributions paid during the fiscal year that qualifies as exempt-interest dividends for federal income tax purposes.
Annual Report 2012
49
Columbia Intermediate Municipal Bond Fund
The Trustees serve terms of indefinite duration. The names, addresses and birth years of the Trustees and Officers of the Funds in Columbia Funds Series Trust I, the year each was first elected or appointed to office, their principal business occupations during at least the last five years, the number of Funds overseen by each Trustee and other directorships they hold are shown below. Each officer listed below serves as an officer of each Fund in Columbia Funds Series Trust I.
Independent Trustees
Name, Address and Year of Birth,
Position with Funds, Year First
Elected or Appointed to Office | | Principal Occupation(s) During Past Five Years, Number of Funds in Columbia
Funds Complex Overseen by Trustee, Other Directorships Held
| |
Rodman L. Drake (Born 1943)
c/o Columbia Management Investment Advisers, LLC
225 Franklin Street
Boston, MA 02110
Trustee (since 1994) and
Chairman of the Board (since 2009) | | Independent consultant since 2010; Co-Founder of Baringo Capital LLC (private equity) from 1997 to 2008; CEO of Crystal River Capital, Inc. (real estate investment trust) from 2003 to 2010; Oversees 52; Jackson Hewitt Tax Service Inc. (tax preparation services from 2004 to 2011); Celgene Corporation (global biotechnology company); Student Loan Corporation (student loan provider from 2005 to 2010); Celgene Corporation (global biotechnology company); The Helios Funds and Brookfield Funds (closed-end funds); Crystal River Capital, Inc. from 2005 to 2010; Parsons Brinckerhoff from 1995 to 2008; and Apex Silver Mines Ltd. from 2007 to 2009 | |
Douglas A. Hacker (Born 1955)
c/o Columbia Management Investment Advisers, LLC
225 Franklin Street
Boston, MA 02110
Trustee (since 1996) | | Independent business executive since May 2006; Executive Vice President — Strategy of United Airlines from December 2002 to May 2006; President of UAL Loyalty Services (airline marketing company) from September 2001 to December 2002; Executive Vice President and Chief Financial Officer of United Airlines from July 1999 to September 2001. Oversees 52; Nash Finch Company (food distributor); Aircastle Limited (aircraft leasing); and SeaCube Container Leasing Ltd. (container leasing) | |
Janet Langford Kelly (Born 1957)
c/o Columbia Management Investment Advisers, LLC
225 Franklin Street
Boston, MA 02110
Trustee (since 1996) | | Senior Vice President, General Counsel and Corporate Secretary, ConocoPhillips (integrated energy company) since September 2007; Deputy General Counsel — Corporate Legal Services, ConocoPhillips from August 2006 to August 2007; Partner, Zelle, Hofmann, Voelbel, Mason & Gette LLP (law firm) from March 2005 to July 2006; Adjunct Professor of Law, Northwestern University from September 2004 to June 2006; Director, UAL Corporation (airline) from February 2006 to July 2006; Chief Administrative Officer and Senior Vice President, Kmart Holding Corporation (consumer goods) from September 2003 to March 2004. Oversees 52; None | |
Nancy T. Lukitsh (Born 1956)
c/o Columbia Management Investment Advisers, LLC
225 Franklin Street
Boston, MA 02110
Trustee (since 2011) | | Senior Vice President, Partner and Director of Marketing, Wellington Management Company, LLP (investment adviser) from 1997 to 2010; Chair, Wellington Management Investment Portfolios (commingled non-U.S. investment pools) from 2007 to 2010; Director, Wellington Trust Company, NA and other Wellington affiliates from 1997 to 2010. Oversees 52; None | |
William E. Mayer (Born 1940)
c/o Columbia Management Investment Advisers, LLC
225 Franklin Street
Boston, MA 02110
Trustee (since 1994) | | Partner, Park Avenue Equity Partners (private equity) since February 1999; Dean and Professor, College of Business and Management, University of Maryland from 1992 to 1996. Oversees 52; DynaVox Inc. (speech creation); Lee Enterprises (print media); WR Hambrecht + Co. (financial service provider) from 2000 to 2012; BlackRock Kelso Capital Corporation (investment company) | |
David M. Moffett (Born 1952)
c/o Columbia Management Investment Advisers, LLC
225 Franklin Street
Boston, MA 02110
Trustee (since 2011) | | Retired. Chief Executive Officer, Federal Home Loan Mortgage Corporation, from 2008 to 2009; Senior Adviser, Global Financial Services Group, Carlyle Group, Inc., from 2007 to 2008; Vice Chairman and Chief Financial Officer, U.S. Bancorp, from 1993 to 2007. Oversees 52; CIT Group Inc. (commercial and consumer finance); eBay Inc. (online trading community); MBIA Inc. (financial service provider); E.W. Scripps Co. (print and television media), Building Materials Holding Corp. (building materials and construction services); and University of Oklahoma Foundation. | |
Charles R. Nelson (Born 1942)
c/o Columbia Management Investment Advisers, LLC
225 Franklin Street
Boston, MA 02110
Trustee (since 1981) | | Retired Professor Emeritus, University of Washington, since 2011; Professor of Economics, University of Washington from January 1976 to 2011; Ford and Louisa Van Voorhis Professor of Political Economy, University of Washington from 1993 to 2011; Adjunct Professor of Statistics, University of Washington from 1980 to 2011; Associate Editor, Journal of Money Credit and Banking from 1993 to 2008; consultant on econometric and statistical matters. Oversees 52; None | |
John J. Neuhauser (Born 1943)
c/o Columbia Management Investment Advisers, LLC
225 Franklin Street
Boston, MA 02110
Trustee (since 1984) | | President, Saint Michael's College, since August 2007; Director or Trustee of several non-profit organizations, including Fletcher Allen Health Care, Inc.; University Professor, Boston College from November 2005 to August 2007; Academic Vice President and Dean of Faculties, Boston College from August 1999 to October 2005. Oversees 52; Liberty All-Star Equity Fund and Liberty All-Star Growth Fund (closed-end funds) | |
Annual Report 2012
50
Columbia Intermediate Municipal Bond Fund
Trustees and Officers (continued)
Independent Trustees (continued)
Name, Address and Year of Birth,
Position with Funds, Year First
Elected or Appointed to Office | | Principal Occupation(s) During Past Five Years, Number of Funds in Columbia
Funds Complex Overseen by Trustee, Other Directorships Held
| |
Patrick J. Simpson (Born 1944)
c/o Columbia Management Investment Advisers, LLC
225 Franklin Street
Boston, MA 02110
Trustee (since 2000) | | Partner, Perkins Coie LLP (law firm). Oversees 52; None | |
Anne-Lee Verville (Born 1945)
c/o Columbia Management Investment Advisers, LLC
225 Franklin Street
Boston, MA 02110
Trustee (since 1998) | | Retired. General Manager — Global Education Industry from 1994 to 1997, President — Application Systems Division from 1991 to 1994, Chief Financial Officer — US Marketing & Services from 1988 to 1991, and Chief Information Officer from 1987 to 1988, IBM Corporation (computer and technology). Oversees 52; Enesco Group, Inc. (producer of giftware and home and garden decor products) from 2001 to 2006 | |
Interested Trustee
Name, Address and Year of Birth,
Position with Funds, Year First
Elected or Appointed to Office | | Principal Occupation(s) During Past Five Years, Number of Funds in Columbia
Funds Complex Overseen by Trustee, Other Directorships Held
| |
William F. Truscott (born 1960)
53600 Ameriprise Financial Center
Minneapolis, MN 55474
Senior Vice President (since 2012) | | Chairman of the Board and President, Columbia Management Investment Advisers, LLC since May 2010 and February 2012, respectively (previously President, Chairman of the Board and Chief Investment Officer, from 2001 to April 2010); Chief Executive Officer, U.S. Asset Management & President, Annuities, Ameriprise Financial, Inc. since May 2010 (previously President — U.S. Asset Management and Chief Investment Officer from 2005 to April 2010, and Senior Vice President — Chief Investment Officer, from 2001 to 2005); Director, President and Chief Executive Officer, Ameriprise Certificate Company since 2006; Director and Chief Executive Officer, Columbia Management Investment Distributors, Inc. since May 2010 and February 2012, respectively (previously Chairman of the Board and Chief Executive Officer from 2008 to April 2010); Chairman of the Board and Chief Executive Officer, RiverSource Distributors, Inc. since 2006. Oversees 208; Columbia Funds Board. | |
The Statement of Additional Information includes additional information about the Trustees of the Funds and is available, without charge, upon request by calling 1-800-345-6611.
Officers
Name, Year of Birth and Address | | Principal Occupation(s) During the Past Five Years | |
J. Kevin Connaughton (Born 1964)
225 Franklin Street
Boston, MA 02110
President (since 2009) | | Senior Vice President and General Manager — Mutual Fund Products, Columbia Management Investment Advisers, LLC since May 2010; President, Columbia Funds, since 2009, and RiverSource Funds, since May 2010 (previously Senior Vice President and Chief Financial Officer, Columbia Funds, from June 2008 to January 2009, Treasurer, Columbia Funds, from October 2003 to May 2008, and senior officer of various other affiliated funds since 2000); Managing Director, Columbia Management Advisors, LLC from December 2004 to April 2010. | |
Michael G. Clarke (Born 1969)
225 Franklin Street
Boston, MA 02110
Treasurer (since 2011) and Chief Financial Officer (since 2009) | | Vice President, Columbia Management Investment Advisers, LLC since May 2010; Managing Director of Fund Administration, Columbia Management Advisors, LLC, from September 2004 to April 2010; senior officer of Columbia Funds and affiliated funds since 2002. | |
Scott R. Plummer (Born 1959)
5228 Ameriprise Financial Center
Minneapolis, MN 55474
Senior Vice President, Assistant Secretary and Chief Legal Officer (since 2010) | | Senior Vice President, Chief Legal Officer and Assistant Secretary, Columbia Management Investment Advisers, LLC since June 2005; Vice President and Lead Chief Counsel — Asset Management, Ameriprise Financial, Inc. since May 2010 (previously Vice President and Chief Counsel — Asset Management, from 2005 to April 2010); Vice President, Chief Counsel and Assistant Secretary, Columbia Management Investment Distributors, Inc. since 2008; Vice President, General Counsel and Secretary, Ameriprise Certificate Company since 2005; Chief Counsel, RiverSource Distributors, Inc. since 2006; Vice President, General Counsel and Secretary, RiverSource Funds since December 2006; Senior Vice President, Secretary and Chief Legal Officer, Columbia Funds, since May 2010. | |
Annual Report 2012
51
Columbia Intermediate Municipal Bond Fund
Trustees and Officers (continued)
Officers (continued)
Name, Year of Birth and Address | | Principal Occupation(s) During the Past Five Years | |
William F. Truscott (Born 1960)
53600 Ameriprise Financial Center
Minneapolis, MN 55474
Senior Vice President (since 2010) | | Chairman of the Board and President, Columbia Management Investment Advisers, LLC since May 2010 and February 2012, respectively (previously President, Chairman of the Board and Chief Investment Officer, from 2001 to April 2010); Chief Executive Officer, U.S. Asset Management & President, Annuities, Ameriprise Financial, Inc. since May 2010 (previously President — U.S. Asset Management and Chief Investment Officer from 2005 to April 2010); Director, President and Chief Executive Officer, Ameriprise Certificate Company since 2006; Director and Chief Executive Officer, Columbia Management Investment Distributors, Inc. since May 2010 and February 2012, respectively (previously Chairman of the Board and Chief Executive Officer from 2008 to April 2010); Chairman of the Board and Chief Executive Officer, RiverSource Distributors, Inc. since 2006. | |
Thomas P. McGuire (Born 1972)
225 Franklin Street
Boston, MA 02110
Chief Compliance Officer (since 2012) | | Vice President — Asset Management Compliance, Columbia Management Investment Advisers, LLC since 2010; Chief Compliance Officer, Ameriprise Certificate Company, since September 2010; Compliance Executive, Bank of America, 2005-2010. | |
Colin Moore (Born 1958)
225 Franklin Street
Boston, MA 02110
Senior Vice President (since 2010) | | Director and Chief Investment Officer, Columbia Management Investment Advisers, LLC since May 2010; Manager, Managing Director and Chief Investment Officer of Columbia Management Advisors, LLC from 2007 to April 2010; Head of Equities, Columbia Management Advisors, LLC from 2002 to 2007. | |
Amy Johnson (Born 1965)
5228 Ameriprise Financial Center
Minneapolis, MN 55474
Vice President (since 2010) | | Senior Vice President and Chief Operating Officer, Columbia Management Investment Advisers, LLC since May 2010 (previously Chief Administrative Officer, from 2009 until April 2010, Vice President — Asset Management and Trust Company Services, from 2006 to 2009, and Vice President — Operations and Compliance from 2004 to 2006). | |
Joseph F. DiMaria (Born 1968)
225 Franklin Street
Boston, MA 02110
Vice President (since 2011) and Chief Accounting Officer (since 2008) | | Vice President, Mutual Fund Administration, Columbia Management Investment Advisers, LLC, since May 2010; Director of Fund Administration, Columbia Management Advisors, LLC from January 2006 to April 2010; Head of Tax/Compliance and Assistant Treasurer, Columbia Management Advisors, LLC, from November 2004 to December 2005. | |
Stephen T. Welsh (born 1957)
225 Franklin Street
Boston, MA 02110
Vice President (since 2006) | | President and Director, Columbia Management Investment Services Corp. since May 2010; President and Director, Columbia Management Services, Inc. from July 2004 to April 2010; Managing Director, Columbia Management Distributors, Inc. from August 2007 to April 2010. | |
Paul D. Pearson (born 1956)
10468 Ameriprise Financial Center
Minneapolis, MN 55474
Vice President and Assistant Treasurer (since 2011) | | Vice President, Investment Accounting, Columbia Management Investment Advisers, LLC, since May 2010; Vice President, Managed Assets, Investment Accounting, Ameriprise Financial Corporation. | |
Paul B. Goucher (born 1968)
5228 Ameriprise Financial Center
Minneapolis, MN 55474
Vice President and Assistant Secretary (since 2010) | | Vice President and Chief Counsel of Ameriprise Financial since January 2010 (formerly Vice President and Group Counsel from November 2008 to January 2010); Director, Managing Director and General Counsel of J. & W. Seligman & Co. Incorporated (Seligman) from July 2008 to November 2008 and Managing Director and Associate General Counsel of Seligman from January 2005 to July 2008. | |
Christopher O. Petersen (born 1970)
5228 Ameriprise Financial Center
Minneapolis, MN 55474
Vice President (since 2010) and Secretary (since 2011) | | Vice President and Chief Counsel, Ameriprise Financial since January 2010 (formerly Vice President and Group Counsel or Counsel from April 2004 to January 2010); Assistant Secretary of RiverSource Funds since January 2007; officer of Columbia Funds and affiliated funds since 2007. | |
Michael E. DeFao (born 1968)
225 Franklin Street
Boston, MA 02110
Vice President and Assistant Secretary (since 2011) | | Vice President and Chief Counsel, Ameriprise Financial since May 2010; Associate General Counsel, Bank of America from June 2005 to April 2010. | |
Annual Report 2012
52
Columbia Intermediate Municipal Bond Fund
Board Consideration and Approval of
Advisory Agreement
On June 6, 2012, the Board of Trustees (the "Board") and the Trustees who are not interested persons (as defined in the Investment Company Act of 1940) of the Trust (the "Independent Trustees") unanimously approved the continuation of the Investment Management Services Agreement (the "Advisory Agreement") with Columbia Management Investment Advisers, LLC (the "Investment Manager") with respect to Columbia Intermediate Municipal Bond Fund (the "Fund"), a series of the Trust. As detailed below, the Advisory Fees and Expenses Committee (the "Committee") and the Board met on multiple occasions to review and discuss, both among themselves and with the management team of the Investment Manager, materials provided by the Investment Manager before determining to approve the continuation of the Advisory Agreement.
In connection with their deliberations regarding the continuation of the Advisory Agreement, the Committee and the Board requested and evaluated materials from the Investment Manager regarding the Fund and the Advisory Agreement, and discussed these materials with representatives of the Investment Manager at the Committee meeting held on June 5, 2012 and at the Board meeting held on June 6, 2012. In addition, the Board considers matters bearing on the Advisory Agreement at most of its other meetings throughout the year and meets regularly with senior management of the Funds and the Investment Manager. Through the Board's Investment Oversight Committees, Trustees also meet with selected Fund portfolio managers and other investment personnel at various times throughout the year. The Committee and the Board also consulted with Fund counsel and with the Independent Trustees' independent legal counsel, who advised on the legal standard for consideration by the Board and otherwise assisted the Board in its deliberations. On June 5, 2012, the Committee recommended that the Board approve the continuation of the Advisory Agreement. On June 6, 2012, the Board, including the Independent Trustees, voting separately, unanimously approved the continuation of the Advisory Agreement for the Fund.
The Committee and the Board considered all information that they, their legal counsel, or the Investment Manager believed reasonably necessary to evaluate and to determine whether to approve the continuation of the Advisory Agreement. In their deliberations, the Trustees did not identify any particular information that was all-important or controlling, and individual Trustees may have attributed different weights to the various factors. The information and factors considered by the Committee and the Board in recommending for approval or approving the continuation of the Advisory Agreement for the Fund included the following:
• Information on the investment performance of the Fund relative to the performance of the Fund's benchmarks and the performance of a group of comparable mutual funds, as determined by an independent third-party data provider;
• Information on the Fund's advisory fees and total expenses, including information comparing the Fund's expenses to those of a group of comparable mutual funds, as determined by an independent third-party data provider;
• The Investment Manager's agreement to contractually limit or cap total operating expenses for the Fund so that total operating expenses (excluding certain fees and expenses, such as transaction costs and certain other investment related expenses, interest, taxes, acquired fund fees and expenses, and extraordinary expenses) would not exceed the median expenses of a group of comparable funds (as determined from time to time, generally annually, by an independent third-party data provider);
• The terms and conditions of the Advisory Agreement, including that the advisory fee rates payable by the Fund would not change;
• The terms and conditions of other agreements and arrangements with affiliates of the Investment Manager relating to the operations of the Fund, including the Administrative Services Agreement, the Distribution Agreement and the Transfer and Dividend Disbursing Agent Agreement, noting in the case of the Transfer and Dividend Disbursing Agent Agreement certain proposed changes to the fee rates payable thereunder;
• Descriptions of various functions performed by the Investment Manager under the Advisory Agreement, including portfolio management and portfolio trading practices;
• Information regarding the management fees and investment performance of any comparable portfolios of other clients of the Investment Manager, including institutional separate accounts; and
• The profitability to the Investment Manager and its affiliates from their relationships with the Fund.
Annual Report 2012
53
Columbia Intermediate Municipal Bond Fund
Board Consideration and Approval of
Advisory Agreement (continued)
Nature, Extent and Quality of Services to be Provided under the Advisory Agreement
The Committee and the Board considered the nature, extent and quality of services provided to the Fund by the Investment Manager and its affiliates under the Advisory Agreement and under separate agreements for the provision of transfer agency and administrative services, and the resources dedicated to the Fund and the other Columbia Funds by the Investment Manager and its affiliates. The Committee and the Board considered, among other things, the Investment Manager's ability to attract, motivate and retain highly qualified research, advisory and supervisory investment professionals (including personnel and other resources, compensation programs for personnel involved in fund management, reputation and other attributes), the portfolio management services provided by those investment professionals, the quality of the Investment Manager's investment research capabilities and trade execution services, and the other resources that the Investment Manager devotes to the Fund. The Committee and the Board also considered the potential benefits to shareholders of investing in a mutual fund that is part of a fund complex offering exposure to a variety of asset classes and investment disciplines and providing a variety of fund and shareholder services.
The Committee and the Board also considered the professional experience and qualifications of the senior personnel of the Investment Manager. The Committee and the Board noted the compliance programs of and the compliance-related resources provided to the Fund by the Investment Manager and its affiliates, and considered the Investment Manager's ability to provide administrative services to the Fund pursuant to a separate administrative services agreement, including the Investment Manager's ability to coordinate the activities of the Fund's other service providers. After reviewing these and related factors, the Committee and the Board concluded, within the context of their overall conclusions, that the expected nature, extent and quality of the services to be provided to the Fund under the Advisory Agreement supported the continuation of such agreement.
Investment Performance
The Committee and the Board reviewed information about the performance of the Fund over various time periods, including performance information relative to benchmarks and information based on reports of an independent third-party data provider that compared the performance of the Fund to the performance of a group of comparable mutual funds. The Committee and the Board also reviewed a description of the third party's methodology for identifying the Fund's peer groups for purposes of performance and expense comparisons. In the case of each Fund whose performance lagged that of a relevant peer group for certain (although not necessarily all) periods, the Committee and the Board concluded that other factors relevant to performance were sufficient, in light of other considerations, to warrant continuation of the Fund's Advisory Agreement. Those factors varied from fund to fund, but included one or more of the following: (i) that the Fund's performance, although lagging in certain recent periods, was stronger over the longer term; (ii) that the underperformance was attributable, to a significant extent, to investment decisions that were reasonable and consistent with the Fund's investment strategy and policies and that the Fund was performing within a reasonable range of expectations, given those investment decisions, market conditions and the Fund's investment strategy; (iii) that the Fund's performance was competitive when compared to other relevant performance benchmarks or peer groups; and (iv) that the Investment Manager had taken or was taking steps designed to help improve the Fund's investment performance, including, but not limited to, replacing portfolio managers, enhancing the resources supporting the portfolio managers, or modifying investment strategies.
The Committee and the Board noted that, through December 31, 2011, the Fund's performance was in the twenty-eighth, fifty-third, and fifty-seventh percentiles (where the best performance would be in the first percentile) of its category selected by an independent third-party data provider for the purposes of performance comparisons for the one-, three- and five- year periods, respectively.
The Committee and the Board also considered the Investment Manager's performance and reputation generally, the Investment Manager's historical responsiveness to Board concerns about performance and the Investment Manager's willingness to take steps intended to improve performance. After reviewing these and related factors, the Committee and the Board concluded, within the context of their overall conclusions regarding the Advisory Agreement, that the performance of the Fund and the Investment Manager was sufficient, in light of other considerations, to warrant the continuation of the Advisory Agreement.
Annual Report 2012
54
Columbia Intermediate Municipal Bond Fund
Board Consideration and Approval of
Advisory Agreement (continued)
Investment Advisory Fee Rates and Other Expenses
The Committee and the Board considered the advisory fees to be charged to the Fund under the Advisory Agreement as well as the total expenses to be incurred by the Fund. In assessing the reasonableness of the fees under the Advisory Agreement, the Committee and the Board considered, among other information, the Fund's advisory fee and its expected total expense ratio as a percentage of average daily net assets. The Committee and the Board noted that the Fund's actual management fee and total net expense ratio are ranked in the second and third quintiles, respectively, against the Fund's expense universe as determined by an independent third-party data provider for purposes of expense comparison. The Committee and the Board also took into account the fee waiver and expense limitation arrangements agreed to by the Investment Manager, as noted above.
The Committee and the Board also considered the fact that the advisory fee rates payable by the Fund to the Investment Manager under the Advisory Agreement were the same as those currently paid by the Fund to the Investment Manager.
The Committee and the Board also received and considered information about the advisory fees charged by the Investment Manager to institutional separate accounts. In considering the fees charged to those accounts, the Committee and the Board took into account, among other things, the Investment Manager's representations about the differences between managing mutual funds as compared to other types of accounts, including differences in the services provided, differences in the risk profile of such business for the Investment Manager and the additional resources required to manage mutual funds effectively. In evaluating the Fund's advisory fees, the Committee and the Board also took into account the demands, complexity and quality of the investment management of the Fund.
After reviewing these and related factors, the Committee and the Board concluded, within the context of their overall conclusions, that the advisory fee rates and expenses of the Fund supported the continuation of the Advisory Agreement.
Costs of Services to be Provided and Profitability
The Committee and the Board also took note of the costs of the services provided (both on an absolute and relative basis) and the profitability to the Investment Manager and its affiliates in connection with their relationships with the Fund. In evaluating these considerations, the Committee and the Board took note of the advisory fees charged by the Investment Manager to other clients, including fees charged by the Investment Manager to any institutional separate account clients with similar investment strategies to those of the Fund.
The Committee and the Board also considered the compensation directly or indirectly received by the Investment Manager's affiliates in connection with their relationships with the Fund. The Committee and the Board reviewed information provided by management as to the profitability of the Investment Manager and its affiliates of their relationships with the Fund, and information about the allocation of expenses used to calculate profitability. When reviewing profitability, the Committee and the Board also considered court cases in which adviser profitability was an issue in whole or in part, the performance of the fund, the expense ratio of the fund, and the implementation of expense limitations with respect to the fund. The Committee and the Board also considered information provided by the Investment Manager regarding its financial condition and comparing its profitability to that of other asset management firms that are, or are subsidiaries of, publicly traded companies.
After reviewing these and related factors, the Committee and the Board concluded, within the context of their overall conclusions, that the profitability to the Investment Manager and its affiliates from their relationships with the Fund supported the continuation of the Advisory Agreement.
Economies of Scale
The Committee and the Board considered the potential existence of economies of scale in the provision by the Investment Manager of services to the Fund, to groups of related funds, and to the Investment Manager's investment advisory clients as a whole, and whether those economies of scale were shared with the Fund through breakpoints in investment advisory fees or other means, such as expense limitation arrangements and additional investments by the Investment Manager in investment, trading and compliance resources. The Committee and the Board noted that the investment advisory fee schedules for the Fund contained breakpoints that would reduce the fee rate on assets above specified threshold levels.
Annual Report 2012
55
Columbia Intermediate Municipal Bond Fund
Board Consideration and Approval of
Advisory Agreement (continued)
In considering these issues, the Committee and the Board also considered the costs of the services provided (both on an absolute and relative basis) and the profitability to the Investment Manager and its affiliates from their relationships with the Fund, as discussed above. After reviewing these and related factors, the Committee and the Board concluded, within the context of their overall conclusions, that the extent to which economies of scale were expected to be shared with the Fund supported the continuation of the Advisory Agreement.
Other Benefits to the Investment Manager
The Committee and the Board received and considered information regarding "fall-out" or ancillary benefits received by the Investment Manager and its affiliates as a result of their relationships with the Fund, such as the engagement of the Investment Manager to provide administrative services to the Fund and the engagement of the Investment Manager's affiliates to provide distribution and transfer agency services to the Fund. The Committee and the Board considered that the Fund's distributor retains a portion of the distribution fees from the Fund and receives a portion of the sales charges on sales or redemptions of certain classes of shares of the Fund. The Committee and the Board also considered the benefits of research made available to the Investment Manager by reason of brokerage commissions generated by the Fund's securities transactions, and reviewed information about the Investment Manager's practices with respect to allocating portfolio brokerage for brokerage and research services. The Committee and the Board considered the possible conflicts of interest associated with certain fall-out or other ancillary benefits and the reporting, disclosure and other processes that would be in place to address such possible conflicts of interest. The Committee and the Board recognized that the Investment Manager's profitability would be somewhat lower without these benefits.
Conclusion
The Committee and the Board reviewed all of the above considerations in reaching their decisions to recommend or approve the continuation of the Advisory Agreement. No single item was identified as paramount or controlling, and individual Trustees may have attributed different weights to various factors. Based on their evaluation of all factors that they deemed to be material, including those factors described above, and assisted by the advice of independent legal counsel, the Board, including the Independent Trustees, voting separately, unanimously approved the continuation of the Advisory Agreement.
Annual Report 2012
56
Columbia Intermediate Municipal Bond Fund
Important Information About This Report
Each fund mails one shareholder report to each shareholder address. If you would like more than one report, please call shareholder services at 800.345.6611 and additional reports will be sent to you.
The policy of the Board is to vote the proxies of the companies in which each fund holds investments consistent with the procedures as stated in the Statement of Additional Information (SAI). You may obtain a copy of the SAI without charge by calling 800.345.6611; contacting your financial intermediary; visiting columbiamanagement.com; or searching the website of the Securities and Exchange Commission (SEC) at sec.gov. Information regarding how each fund voted proxies relating to portfolio securities is filed with the SEC by August 31 for the most recent 12-month period ending June 30 of that year, and is available without charge by visiting columbiamanagement.com; or searching the website of the SEC at sec.gov.
Each fund files a complete schedule of portfolio holdings with the SEC for the first and third quarters of each fiscal year on Form N-Q. Each fund's Form N-Q is available on the SEC's website at sec.gov and may be reviewed and copied at the SEC's Public Reference Room in Washington, D.C. Information on the operation of the Public Reference Room may be obtained by calling 800.SEC.0330. Each fund's complete schedule of portfolio holdings, as filed on Form N-Q, can also be obtained without charge, upon request, by calling 800.345.6611.
Annual Report 2012
57

Columbia Intermediate Municipal Bond Fund
P.O. Box 8081
Boston, MA 02266-8081
columbiamanagement.com
This information is for use with concurrent or prior delivery of a fund prospectus. Please read and consider the investment objectives, risks, charges and expenses for any fund carefully before investing. For a prospectus which contains this and other important information about the Fund go to columbiamanagement.com. The Fund is distributed by Columbia Management Investment Distributors, Inc., member FINRA, and managed by Columbia Management Investment Advisers, LLC.
© 2012 Columbia Management Investment Advisers, LLC. All rights reserved.
C-1726 D (12/12)
Annual Report
October 31, 2012

Columbia Connecticut Tax-Exempt Fund
Not FDIC insured • No bank guarantee • May lose value
Columbia Connecticut Tax-Exempt Fund
 Dear Shareholders,
Stocks rebound around the world
After a weak second quarter, U.S. stock market averages rebounded in the third quarter, erasing earlier losses and boosting year-to-date returns well into double digits. Welcome news from Europe and additional quantitative easing in the United States by the Federal Reserve Board helped bolster the rally. The Standard & Poor's 500 Index (S&P 500 Index) rose 6.35% (total return) for the quarter. The Dow Jones Industrial Average advanced 4.32% for the same period. From the beginning of the calendar year through September 30, 2012, the S&P 500 Index was up 16.44% (total return). And, as of the end of September, the S&P 500 Index stood at 1,440 — approximately 8% below its all-time high of 1,565 that was set on October 9, 2007.
Outside the United States, stock markets of both developed and emerging market economies rebounded, as measured in U.S. dollars. Investors responded favorably to the announcement of policy measures aimed to resolve the eurozone crisis, which could potentially have a favorable impact on growth in emerging market economies. A weaker dollar also benefited returns to U.S. investors.
Solid gains for fixed income
Within fixed income, investors appeared to be increasingly willing to take on risk as they abandoned higher quality sectors that dominated the performance rankings in the second quarter and favored riskier sectors, where yield spreads tightened by a significant margin. Fixed-income returns were strong, but unlike equities, they have been less volatile, accumulating steadily over the course of the year. Gains were the highest for high-yield and emerging market bonds. By contrast, government issued debt securities eked out smaller gains.
Stay on track with Columbia Management
Backed by more than 100 years of experience, Columbia Management is one of the nation's largest asset managers. At the heart of our success — and, most importantly, that of our investors — are highly talented industry professionals, brought together by a unique way of working. We are dedicated to helping you take advantage of today's opportunities and anticipate tomorrow's. We stay abreast of the latest investment trends and ideas, using our collective insight to evaluate events and transform them into solutions you can use.
Visit columbiamanagement.com for:
> The Columbia Management Perspectives blog, featuring timely posts by our investment teams
> Detailed up-to-date fund performance and portfolio information
> Economic analysis and market commentary
> Quarterly fund commentaries
> Columbia Management Investor, our award-winning quarterly newsletter for shareholders
Thank you for your continued support of the Columbia Funds. We look forward to serving your investment needs for many years to come.
Best Regards,

J. Kevin Connaughton
President, Columbia Funds
The S&P 500 Index, an unmanaged index, measures the performance of 500 widely held, large-capitalization U.S. stocks and is frequently used as a general measure of market performance. The Dow Jones Industrial Average is a price weighted average of 30 actively traded shares of blue chip US industrial corporations listed on the New York Stock Exchange. Indices are not available for investment, are not professionally managed and do not reflect sales charges, fees, brokerage commissions, taxes or other expenses of investing.
Investors should consider the investment objectives, risks, charges and expenses of a mutual fund carefully before investing. For a free prospectus, which contains this and other important information about a fund, visit columbiamanagement.com. The prospectus should be read carefully before investing.
Columbia Funds are distributed by Columbia Management Investment Distributors, Inc., member FINRA, and managed by Columbia Management Investment Advisers, LLC.
© 2012 Columbia Management Investment Advisers, LLC. All rights reserved.
Columbia Connecticut Tax-Exempt Fund
Performance Overview | | | 2 | | |
Manager Discussion of Fund Performance | | | 4 | | |
Understanding Your Fund's Expenses | | | 6 | | |
Portfolio of Investments | | | 7 | | |
Statement of Assets and Liabilities | | | 12 | | |
Statement of Operations | | | 14 | | |
Statement of Changes in Net Assets | | | 15 | | |
Financial Highlights | | | 17 | | |
Notes to Financial Statements | | | 21 | | |
Report of Independent Registered
Public Accounting Firm | | | 27 | | |
Federal Income Tax Information | | | 28 | | |
Trustees and Officers | | | 29 | | |
Board Consideration and Approval of Advisory Agreement | | | 32 | | |
Important Information About This Report | | | 37 | | |
Fund Investment Manager
Columbia Management Investment
Advisers, LLC
225 Franklin Street
Boston, MA 02110
Fund Distributor
Columbia Management Investment
Distributors, Inc.
225 Franklin Street
Boston, MA 02110
Fund Transfer Agent
Columbia Management Investment
Services Corp.
P.O. Box 8081
Boston, MA 02266-8081
For more information about any of the funds, please visit columbiamanagement.com or call 800.345.6611. Customer Service Representatives are available to answer your questions Monday through Friday from 8 a.m. to 8 p.m. Eastern time.
The views expressed in this report reflect the current views of the respective parties. These views are not guarantees of future performance and involve certain risks, uncertainties and assumptions that are difficult to predict, so actual outcomes and results may differ significantly from the views expressed. These views are subject to change at any time based upon economic, market or other conditions and the respective parties disclaim any responsibility to update such views. These views may not be relied on as investment advice and, because investment decisions for a Columbia Fund are based on numerous factors, may not be relied on as an indication of trading intent on behalf of any particular Columbia Fund. References to specific securities should not be construed as a recommendation or investment advice.
Columbia Connecticut Tax-Exempt Fund
Performance Summary
> Columbia Connecticut Tax-Exempt Fund (the Fund) Class A shares returned 9.67% excluding sales charges for the 12-month period that ended October 31, 2012.
> The Fund outperformed its benchmarks, the broader Barclays Municipal Bond Index, and the Barclays Connecticut Municipal Bond Index, which returned 9.03% and 5.87%, respectively, for the period, as well as the average return of the funds in its peer group, the Lipper Connecticut Municipal Debt Funds Classification, which returned 8.84% for the 12-month period.
> Favorable credit-quality, interest-rate positioning and security section aided relative performance.
Average Annual Total Returns (%) (for period ended October 31, 2012)
| | Inception | | 1 Year | | 5 Years | | 10 Years | |
Class A | | 11/01/91 | | | | | | | | | | | | | |
Excluding sales charges | | | | | | | 9.67 | | | | 5.70 | | | | 4.65 | | |
Including sales charges | | | | | | | 4.47 | | | | 4.68 | | | | 4.14 | | |
Class B | | 06/08/92 | | | | | | | | | | | | | |
Excluding sales charges | | | | | | | 8.85 | | | | 4.91 | | | | 3.87 | | |
Including sales charges | | | | | | | 3.85 | | | | 4.58 | | | | 3.87 | | |
Class C | | 08/01/97 | | | | | | | | | | | | | |
Excluding sales charges | | | | | | | 9.19 | | | | 5.22 | | | | 4.18 | | |
Including sales charges | | | | | | | 8.19 | | | | 5.22 | | | | 4.18 | | |
Class Z* | | 09/27/10 | | | 9.96 | | | | 5.77 | | | | 4.69 | | |
Barclays Municipal Bond Index | | | | | | | 9.03 | | | | 6.02 | | | | 5.24 | | |
Barclays Connecticut Municipal Bond Index | | | | | | | 5.87 | | | | 5.41 | | | | 4.59 | | |
Lipper Connecticut Municipal Debt Funds Classification | | | | | | | 8.84 | | | | 5.03 | | | | 4.34 | | |
Returns for Class A are shown with and without the maximum initial sales charge of 4.75%. Returns for Class B are shown with and without the applicable contingent deferred sales charge (CDSC) of 5.00% in the first year, declining to 1.00% in the sixth year and eliminated thereafter. Returns for Class C are shown with and without the 1.00% CDSC for the first year only. The Fund's other classes are not subject to sales charges and have limited eligibility. Please see the Fund's prospectuses for details. Performance for different share classes will vary based on differences in sales charges and fees associated with each class. All results shown assume reinvestment of distributions during the period. Returns do not reflect the deduction of taxes that a shareholder may pay on Fund distributions or on the redemption of Fund shares. Performance results reflect the effect of any fee waivers or reimbursements of Fund expenses by Columbia Management Investment Advisers, LLC and/or any of its affiliates. Absent these fee waivers or expense reimbursement arrangements, performance results would have been lower.
The performance information shown represents past performance and is not a guarantee of future results. The investment return and principal value of your investment will fluctuate so that your shares, when redeemed, may be worth more or less than their original cost. Current performance may be lower or higher than the performance information shown. You may obtain performance information current to the most recent month-end by contacting your financial intermediary, visiting columbiamanagement.com or calling 800.345.6611.
*The returns shown for periods prior to the share class inception date (including returns since inception if shown, which are since Fund inception) include the returns of the Fund's oldest share class. These returns are adjusted to reflect any higher class-related operating expenses of the newer share classes, as applicable. Please visit columbiamanagement.com/mutual-funds/appended-performance for more information.
The Barclays Municipal Bond Index is an unmanaged index considered representative of the broad market for investment-grade, tax-exempt bonds with a maturity of at least one year.
The Barclays Connecticut Municipal Bond Index is a subset of the Barclays Municipal Bond Index consisting solely of bonds issued by obligors located in the state of Connecticut.
The Lipper Connecticut Municipal Debt Funds Classification is a calculation of average total returns of mutual funds that limit assets to those securities exempt from taxation in the state of Connecticut.
Indices are not available for investment, are not professionally managed and do not reflect sales charges, fees, brokerage commissions, taxes or other expenses of investing. Securities in the Fund may not match those in an index.
Annual Report 2012
2
Columbia Connecticut Tax-Exempt Fund
Performance Overview (continued)
Performance of a Hypothetical $10,000 Investment (November 1, 2002 – October 31, 2012)
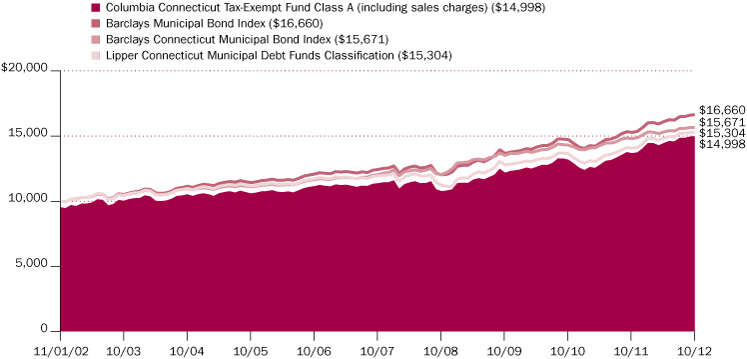
The chart above shows the change in value of a hypothetical $10,000 investment in Class A shares of Columbia Connecticut Tax-Exempt Fund during the stated time period, and does not reflect the deduction of taxes that a shareholder may pay on Fund distributions or on the redemption of Fund shares.
Annual Report 2012
3
Columbia Connecticut Tax-Exempt Fund
Manager Discussion of Fund Performance
For the 12-month period that ended October 31, 2012, the Fund's Class A shares returned 9.67% without sales charge, beating the broader Barclays Municipal Bond Index and the Barclays Connecticut Municipal Bond Index, which returned 9.03% and 5.87%, respectively. The Fund also outpaced the average return of its peer group, the Lipper Connecticut Municipal Debt Funds Classification, which was 8.84%. Exposure to longer-maturity and lower-quality investment-grade securities, as well as strong security selection, accounted for the Fund's outperformance relative to these measures.
Municipal Bonds Rally as Yields Fall
Market conditions were favorable for municipal bonds over the 12-month period. Although sovereign debt problems in Europe created global economic uncertainty, the U.S. economic outlook improved, with modest gains in employment, manufacturing and housing by period end. State finances also strengthened. Investor demand for tax-exempt securities remained strong, helping to drive municipal bond yields down and prices up across all maturities. With interest rates declining to near all-time lows, investors sought the higher yields offered by bonds with maturities of 15 or more years and those with credit ratings of A or below. Longer-term and lower quality issues outperformed shorter-term and higher quality security by a sizable margin. Top performing sectors included industrial development/pollution control revenue bonds, hospitals and leasing, all of which posted returns of 10% or more.
Gains from Long Maturity and Lower Credit Quality Bias
The Fund benefited from having an above-average sensitivity to interest rate changes and an overweight in longer-maturity bonds, which outperformed as their yields fell more than those of shorter-maturity issues. In addition, long-term bond prices gained from a confluence of strong demand and decreased supply, which occurred as many issuers retired older, longer-maturity debt with higher interest costs and refunded with new lower-rate, intermediate-maturity securities. An overweight in lower-quality investment-grade issues and sectors, including hospitals and leasing, and an underweight in higher quality securities also aided results, as credit spreads — the difference between yields on high- and low-quality bonds — tightened. Security selection in the water-and-sewer segment also contributed to the Fund's gains. The Fund lost ground from underweights in industrial development/pollution control revenue bonds and transportation, a small cash position and security selection among state and local general obligation bonds.
Shifts to Protect the Portfolio and Boost Performance
Over the year, we reduced exposure to BBB rated bonds issued by the Commonwealth of Puerto Rico because of mounting concerns about the issuer's fiscal health. We replaced them with A rated hospital and education bonds, which offered a yield advantage over higher quality securities but less credit risk than the Puerto Rico bonds. We also trimmed the Fund's weight in state-appropriated and pre-refunded bonds — which tend to be higher quality, lower-yielding issues. Pre-refunding occurs when an issuer sells a new bond at a lower rate to pay off higher-rate issues. The proceeds from the sale are invested into an escrow account (typically short-term government securities), which generates interest that is used to pay the interest on the original bonds until they are called or mature.
Portfolio Management
Catherine Stienstra
Quality Breakdown (%)
(at October 31, 2012) | |
AAA rating | | | 7.3 | | |
AA rating | | | 25.5 | | |
A rating | | | 49.7 | | |
BBB rating | | | 10.7 | | |
Non-investment grade | | | 1.7 | | |
Not rated | | | 5.1 | | |
Total | | | 100.0 | | |
Percentages indicated are based upon total fixed income securities (excluding Money Market Funds).
Bond ratings apply to the underlying holdings of the Fund and not the Fund itself and are divided into categories ranging from AAA (highest) to D (lowest), and are subject to change. The ratings shown are determined by using the middle rating of Moody's, S&P, and Fitch after dropping the highest and lowest available ratings. When a rating from only two agencies is available, the lower rating is used. When a rating from only one agency is available, that rating is used. When a bond is not rated by any of these agencies, it is designated as Not rated. Credit ratings are subjective opinions and not statements of fact.
Annual Report 2012
4
Columbia Connecticut Tax-Exempt Fund
Manager Discussion of Fund Performance (continued)
Looking Ahead
Going forward, we will be closely monitoring what happens with the automatic federal spending cuts and tax increases scheduled for January 1, 2013. An increase in the taxes on high-income earners, for example could boost demand for municipal bonds, while potential elimination of the sector's tax-exempt status could pressure returns. As long as credit spreads are expected to tighten and short-term interest rates projected to remain low, the Fund will likely maintain a longer-maturity and lower-quality bias within the investment-grade universe.
At the state level, we remain concerned that a full economic recovery will take some time. In January 2012, Moody's downgraded Connecticut's credit rating from Aa2 to Aa3 amid concerns over the state's sizable debt service and pension obligations. In addition, job losses in the aerospace, financial services, construction and government sectors have had a negative impact on the Connecticut economy. On the upside, state tax revenues have been slowly climbing, and Connecticut remains one of the wealthiest states in the country. While expectations are that credit downgrades will continue to outpace upgrades, we think the rate of defaults will remain relatively benign. Going forward, we plan to rely on proprietary credit research from our in-house team to help us identify lower quality investment grade securities that represent good risk/return opportunities for the portfolio.
Annual Report 2012
5
Columbia Connecticut Tax-Exempt Fund
Understanding Your Fund's Expenses
(Unaudited)
As an investor, you incur two types of costs. There are transaction costs, which generally include sales charges on purchases and may include redemption fees. There are also ongoing costs, which generally include management fees, distribution and service (Rule 12b-1) fees, and other fund expenses. The following information is intended to help you understand your ongoing costs (in dollars) of investing in the Fund and to help you compare these costs with the ongoing costs of investing in other mutual funds.
Analyzing Your Fund's Expenses
To illustrate these ongoing costs, we have provided examples and calculated the expenses paid by investors in each share class of the Fund during the period. The actual and hypothetical information in the table is based on an initial investment of $1,000 at the beginning of the period indicated and held for the entire period. Expense information is calculated two ways and each method provides you with different information. The amount listed in the "Actual" column is calculated using the Fund's actual operating expenses and total return for the period. You may use the Actual information, together with the amount invested, to estimate the expenses that you paid over the period. Simply divide your account value by $1,000 (for example, an $8,600 account value divided by $1,000 = 8.6), then multiply the results by the expenses paid during the period under the Actual column. The amount listed in the "Hypothetical" column assumes a 5% annual rate of return before expenses (which is not the Fund's actual return) and then applies the Fund's actual expense ratio for the period to the hypothetical return. You should not use the hypothetical account values and expenses to estimate either your actual account balance at the end of the period or the expenses you paid during the period. See "Compare With Other Funds" below for details on how to use the hypothetical data.
Compare With Other Funds
Since all mutual funds are required to include the same hypothetical calculations about expenses in shareholder reports, you can use this information to compare the ongoing cost of investing in the Fund with other funds. To do so, compare the hypothetical example with the 5% hypothetical examples that appear in the shareholder reports of other funds. As you compare hypothetical examples of other funds, it is important to note that hypothetical examples are meant to highlight the ongoing costs of investing in a fund only and do not reflect any transaction costs, such as sales charges, or redemption or exchange fees. Therefore, the hypothetical calculations are useful in comparing ongoing costs only, and will not help you determine the relative total costs of owning different funds. If transaction costs were included in these calculations, your costs would be higher.
May 1, 2012 – October 31, 2012
| | Account Value at the Beginning
of the Period ($) | | Account Value at the End of the
Period ($) | | Expenses Paid During the
Period ($) | | Fund's Annualized
Expense Ratio (%) | |
| | Actual | | Hypothetical | | Actual | | Hypothetical | | Actual | | Hypothetical | | Actual | |
Class A | | | 1,000.00 | | | | 1,000.00 | | | | 1,037.20 | | | | 1,021.17 | | | | 4.05 | | | | 4.01 | | | | 0.79 | | |
Class B | | | 1,000.00 | | | | 1,000.00 | | | | 1,033.30 | | | | 1,017.39 | | | | 7.87 | | | | 7.81 | | | | 1.54 | | |
Class C | | | 1,000.00 | | | | 1,000.00 | | | | 1,034.90 | | | | 1,018.90 | | | | 6.34 | | | | 6.29 | | | | 1.24 | | |
Class Z | | | 1,000.00 | | | | 1,000.00 | | | | 1,038.50 | | | | 1,022.42 | | | | 2.77 | | | | 2.75 | | | | 0.54 | | |
Expenses paid during the period are equal to the annualized expense ratio for each class as indicated above, multiplied by the average account value over the period and then multiplied by the number of days in the Fund's most recent fiscal half year and divided by 366.
Expenses do not include fees and expenses incurred indirectly by the Fund from the underlying funds in which the Fund may invest (also referred to as "acquired funds"), including affiliated and non-affiliated pooled investment vehicles (including mutual funds and exchange-traded funds).
Had Columbia Management Investment Advisers, LLC and/or certain of its affiliates not waived/reimbursed certain fees and expenses, account value at the end of the period would have been reduced.
Annual Report 2012
6
Columbia Connecticut Tax-Exempt Fund
Portfolio of Investments
October 31, 2012
(Percentages represent value of investments compared to net assets)
Municipal Bonds 93.0%
Issue
Description | | Coupon
Rate | | Principal
Amount ($) | | Value ($) | |
Disposal 2.0% | |
New Haven Solid Waste Authority
Revenue Bonds
Series 2008
06/01/28 | | | 5.375 | % | | | 1,750,000 | | | | 1,938,440 | | |
Higher Education 13.3% | |
Connecticut State Health & Educational Facility Authority
Revenue Bonds
Connecticut College
Series 2011H-1
07/01/41 | | | 5.000 | % | | | 1,625,000 | | | | 1,834,300 | | |
Series 2012I
07/01/31 | | | 5.000 | % | | | 700,000 | | | | 817,978 | | |
Fairfield University
Series 2008N
07/01/27 | | | 4.750 | % | | | 1,000,000 | | | | 1,087,270 | | |
Series 2010O
07/01/40 | | | 5.000 | % | | | 1,000,000 | | | | 1,103,590 | | |
Quinnipiac University
Series 2007I (NPFGC)
07/01/28 | | | 4.375 | % | | | 1,015,000 | | | | 1,067,181 | | |
Sacred Heart University
Series 2011G
07/01/31 | | | 5.375 | % | | | 500,000 | | | | 556,490 | | |
Trinity College
Series 1998F (NPFGC)
07/01/21 | | | 5.500 | % | | | 2,000,000 | | | | 2,429,480 | | |
Series 2007J (NPFGC)
07/01/37 | | | 4.500 | % | | | 1,500,000 | | | | 1,576,545 | | |
Yale University
Series 2003X-1
07/01/42 | | | 5.000 | % | | | 2,000,000 | | | | 2,059,280 | | |
Total | | | | | | | 12,532,114 | | |
Hospital 18.2% | |
Connecticut State Health & Educational Facility Authority
Revenue Bonds
Ascension Health Senior Center
Series 2010
11/15/40 | | | 5.000 | % | | | 2,499,999 | | | | 2,758,375 | | |
Danbury Hospital
Series 2006H (AMBAC)
07/01/33 | | | 4.500 | % | | | 2,000,000 | | | | 2,018,700 | | |
Hartford Healthcare
Series 2011A
07/01/32 | | | 5.000 | % | | | 500,000 | | | | 554,445 | | |
Hartford Healthcare Corp.
Series 2011A
07/01/41 | | | 5.000 | % | | | 1,500,000 | | | | 1,621,425 | | |
Lawrence & Memorial Hospital
Series 2011S
07/01/22 | | | 5.000 | % | | | 1,810,000 | | | | 2,118,315 | | |
07/01/31 | | | 5.000 | % | | | 1,425,000 | | | | 1,575,679 | | |
Municipal Bonds (continued)
Issue
Description | | Coupon
Rate | | Principal
Amount ($) | | Value ($) | |
Middlesex Hospital
Series 2011N
07/01/24 | | | 5.000 | % | | | 425,000 | | | | 477,692 | | |
07/01/26 | | | 5.000 | % | | | 900,000 | | | | 1,009,422 | | |
Stamford Hospital
Series 2012J
07/01/37 | | | 5.000 | % | | | 1,000,000 | | | | 1,084,480 | | |
Western Connecticut Health
Series 2011M
07/01/41 | | | 5.375 | % | | | 1,500,000 | | | | 1,712,235 | | |
Western Connecticut Health Network
Series 2011
07/01/29 | | | 5.000 | % | | | 1,000,000 | | | | 1,107,710 | | |
Yale-New Haven Hospital
Series 2010M
07/01/40 | | | 5.500 | % | | | 1,000,000 | | | | 1,155,230 | | |
Total | | | | | | | 17,193,708 | | |
Human Service Provider 0.3% | |
Connecticut State Health & Educational Facility Authority
Revenue Bonds
Village Families & Children
Series 2002A (AMBAC)
07/01/23 | | | 5.000 | % | | | 255,000 | | | | 256,823 | | |
Investor Owned 1.7% | |
Connecticut State Development Authority
Refunding Revenue Bonds
Connecticut Light & Power Co. Project
Series 2011
09/01/28 | | | 4.375 | % | | | 1,500,000 | | | | 1,632,225 | | |
Local General Obligation 12.8% | |
City of Bridgeport
Unlimited General Obligation Refunding Bonds
Series 2004C (NPFGC)
08/15/19 | | | 5.500 | % | | | 1,500,000 | | | | 1,818,870 | | |
City of Hartford
Unlimited General Obligation Bonds
Series 2012A
04/01/32 | | | 5.000 | % | | | 350,000 | | | | 399,032 | | |
City of New Britain
Unlimited General Obligation Bonds
Series 2006 (AMBAC)
04/15/21 | | | 5.000 | % | | | 1,160,000 | | | | 1,413,054 | | |
City of Stamford
Unlimited General Obligation Refunding Bonds
Series 2003B
08/15/16 | | | 5.250 | % | | | 1,000,000 | | | | 1,175,380 | | |
City of West Haven
Unlimited General Obligation Bonds
Series 2012 (AGM)
08/01/25 | | | 5.000 | % | | | 1,000,000 | | | | 1,109,220 | | |
The accompanying Notes to Financial Statements are an integral part of this statement.
Annual Report 2012
7
Columbia Connecticut Tax-Exempt Fund
Portfolio of Investments (continued)
October 31, 2012
Municipal Bonds (continued)
Issue
Description | | Coupon
Rate | | Principal
Amount ($) | | Value ($) | |
Town of Cheshire
Unlimited General Obligation Refunding Bonds
Series 2001B
08/01/14 | | | 5.000 | % | | | 1,000,000 | | | | 1,081,510 | | |
Town of East Hartford
Unlimited General Obligation Refunding Bonds
Series 2003 (NPFGC/FGIC)
05/01/15 | | | 5.250 | % | | | 1,000,000 | | | | 1,113,010 | | |
Town of Granby
Unlimited General Obligation Bonds
Series 2006
02/15/26 | | | 5.000 | % | | | 540,000 | | | | 721,494 | | |
Town of North Haven
Unlimited General Obligation Bonds
Series 2007
07/15/26 | | | 4.750 | % | | | 1,150,000 | | | | 1,505,499 | | |
Town of Suffield
Unlimited General Obligation Refunding Bonds
Series 2005
06/15/20 | | | 5.000 | % | | | 1,400,000 | | | | 1,766,814 | | |
Total | | | | | | | 12,103,883 | | |
Multi-Family 1.2% | |
Bridgeport Housing Authority
Revenue Bonds
Custodial Receipts Energy Performance
Series 2009
06/01/30 | | | 5.600 | % | | | 1,000,000 | | | | 1,092,170 | | |
Nursing Home 3.2% | |
Connecticut State Development Authority
Revenue Bonds
Alzheimer's Resource Center Project
Series 2007
08/15/21 | | | 5.400 | % | | | 500,000 | | | | 530,695 | | |
08/15/27 | | | 5.500 | % | | | 2,375,000 | | | | 2,491,755 | | |
Total | | | | | | | 3,022,450 | | |
Other Bond Issue 0.6% | |
New Haven Parking Authority
Refunding Revenue Bonds
Series 2002 (AMBAC)
12/01/15 | | | 5.375 | % | | | 500,000 | | | | 535,780 | | |
Pool/Bond Bank 1.3% | |
State of Connecticut
Revenue Bonds
Revolving Fund
Series 2009A
06/01/26 | | | 5.000 | % | | | 1,000,000 | | | | 1,217,210 | | |
Municipal Bonds (continued)
Issue
Description | | Coupon
Rate | | Principal
Amount ($) | | Value ($) | |
Prep School 5.5% | |
Connecticut State Health & Educational Facility Authority
Revenue Bonds
Loomis Chaffe School
Series 2005F (AMBAC)
07/01/25 | | | 5.250 | % | | | 2,035,000 | | | | 2,652,215 | | |
07/01/26 | | | 5.250 | % | | | 1,045,000 | | | | 1,376,641 | | |
Miss Porters School Issue
Series 2006B (AMBAC)
07/01/36 | | | 5.000 | % | | | 1,075,000 | | | | 1,136,813 | | |
Total | | | | | | | 5,165,669 | | |
Refunded/Escrowed 2.2% | |
City of New Haven
Unlimited General Obligation Bonds
Series 2002C Escrowed to Maturity (NPFGC)
11/01/20 | | | 5.000 | % | | | 10,000 | | | | 10,140 | | |
Puerto Rico Public Finance Corp.(a)
Revenue Bonds
Commonwealth Appropriation
Series 2002E Escrowed to Maturity (AMBAC)
08/01/27 | | | 5.500 | % | | | 450,000 | | | | 622,404 | | |
Unrefunded Revenue Bonds
Commonwealth Appropriation
Series 2002E Escrowed to Maturity (AMBAC)
08/01/27 | | | 5.500 | % | | | 1,050,000 | | | | 1,452,276 | | |
Total | | | | | | | 2,084,820 | | |
Resource Recovery 1.6% | |
Connecticut Resources Recovery Authority
Refunding Revenue Bonds
American Fuel Co.
Series 2001A-II AMT(b)
11/15/15 | | | 5.500 | % | | | 1,500,000 | | | | 1,517,505 | | |
Single Family 1.9% | |
Connecticut Housing Finance Authority(b)
Revenue Bonds
Housing Mortgage Finance Program
Subordinated Series 2006A-1 AMT
11/15/36 | | | 4.875 | % | | | 760,000 | | | | 779,220 | | |
Subordinated Revenue Bonds
Series 2012B-2 AMT
11/15/32 | | | 4.050 | % | | | 1,000,000 | | | | 1,022,470 | | |
Total | | | | | | | 1,801,690 | | |
Special Non Property Tax 11.1% | |
Puerto Rico Highway & Transportation Authority
Refunding Revenue Bonds
Series 2003AA-2(a)
07/01/35 | | | 5.300 | % | | | 3,000,000 | | | | 3,091,170 | | |
The accompanying Notes to Financial Statements are an integral part of this statement.
Annual Report 2012
8
Columbia Connecticut Tax-Exempt Fund
Portfolio of Investments (continued)
October 31, 2012
Municipal Bonds (continued)
Issue
Description | | Coupon
Rate | | Principal
Amount ($) | | Value ($) | |
Puerto Rico Sales Tax Financing Corp.(a)
1st Subordinated Revenue Bonds
Series 2010C | |
08/01/41 | | | 5.250 | % | | | 500,000 | | | | 528,290 | | |
Revenue Bonds
1st Subordinated
Series 2009A
08/01/37 | | | 5.750 | % | | | 1,500,000 | | | | 1,656,645 | | |
State of Connecticut
Refunding Special Tax Bonds
Transportation Infrastructure
Series 2004B (AMBAC)
07/01/18 | | | 5.250 | % | | | 2,000,000 | | | | 2,467,160 | | |
Territory of Guam(a)
Revenue Bonds
Section 30
Series 2009A
12/01/34 | | | 5.750 | % | | | 2,150,000 | | | | 2,412,408 | | |
Series 2011A
01/01/42 | | | 5.125 | % | | | 330,000 | | | | 367,072 | | |
Total | | | | | | | 10,522,745 | | |
Special Property Tax 0.9% | |
Harbor Point Infrastructure Improvement District
Tax Allocation Bonds
Harbor Point Project
Series 2010A
04/01/39 | | | 7.875 | % | | | 750,000 | | | | 856,748 | | |
State Appropriated 6.9% | |
Connecticut State Health & Educational Facility Authority
Revenue Bonds
State Supported Child Care
Series 2011 | |
07/01/28 | | | 5.000 | % | | | 1,030,000 | | | | 1,169,318 | | |
07/01/29 | | | 5.000 | % | | | 860,000 | | | | 972,840 | | |
State of Connecticut
Certificate of Participation
Juvenile Training School
Series 2001
12/15/25 | | | 4.750 | % | | | 2,500,000 | | | | 2,550,600 | | |
University of Connecticut
Revenue Bonds
Series 2009A
02/15/28 | | | 5.000 | % | | | 500,000 | | | | 597,675 | | |
Series 2010A
02/15/29 | | | 5.000 | % | | | 1,000,000 | | | | 1,197,410 | | |
Total | | | | | | | 6,487,843 | | |
Municipal Bonds (continued)
Issue
Description | | Coupon
Rate | | Principal
Amount ($) | | Value ($) | |
State General Obligation 2.7% | |
Connecticut Housing Finance Authority
Revenue Bonds
State Supported Special Obligation
Series 2009-10
06/15/28 | | | 5.000 | % | | | 750,000 | | | | 846,660 | | |
State of Connecticut
Unlimited General Obligation Bonds
Series 2001C (AGM)
12/15/15 | | | 5.500 | % | | | 1,500,000 | | | | 1,731,765 | | |
Total | | | | | | | 2,578,425 | | |
Water & Sewer 5.6% | |
Greater New Haven Water Pollution Control Authority
Revenue Bonds
Series 2008A (AGM)
11/15/28 | | | 4.750 | % | | | 600,000 | | | | 668,742 | | |
South Central Connecticut Regional Water Authority
Refunding Revenue Bonds
20th Series 2007A (NPFGC)
08/01/23 | | | 5.250 | % | | | 1,000,000 | | | | 1,302,060 | | |
20th Series 2007A (NPFGC)
08/01/24 | | | 5.250 | % | | | 1,000,000 | | | | 1,313,850 | | |
Revenue Bonds
20th Series 2005 (NPFGC)
08/01/30 | | | 5.000 | % | | | 1,870,000 | | | | 2,027,174 | | |
Total | | | | | | | 5,311,826 | | |
Total Municipal Bonds
(Cost: $79,194,830) | | | | | | | 87,852,074 | | |
Floating Rate Notes 3.3%
Connecticut Housing Finance Authority
Revenue Bonds
VRDN Series 2010F-1(c)
11/15/35 | | | 0.220 | % | | | 800,000 | | | | 800,000 | | |
Connecticut State Health & Educational Facility Authority(c)
Revenue Bonds
Yale University
VRDN Series 2001V-2
07/01/36 | | | 0.170 | % | | | 800,000 | | | | 800,000 | | |
Connecticut State Health & Educational Facility Authority(c)(d)
Revenue Bonds
Choate Rosemary Hall
VRDN Series 2008D (JPMorgan Chase Bank)
07/01/37 | | | 0.210 | % | | | 1,500,000 | | | | 1,500,000 | | |
Total Floating Rate Notes
(Cost: $3,100,000) | | | | | | | 3,100,000 | | |
The accompanying Notes to Financial Statements are an integral part of this statement.
Annual Report 2012
9
Columbia Connecticut Tax-Exempt Fund
Portfolio of Investments (continued)
October 31, 2012
Money Market Funds 2.5%
| | | Shares | | Value ($) | |
Dreyfus Tax-Exempt Cash Management Fund,
0.000%(e) | | | 500,005 | | | | 500,005 | | |
JPMorgan Municipal Money Market Fund,
0.000%(e) | | | 1,854,746 | | | | 1,854,746 | | |
Total Money Market Funds
(Cost: $2,354,751) | | | | | 2,354,751 | | |
Total Investments
(Cost: $84,649,581) | | | | | 93,306,825 | | |
Other Assets & Liabilities, Net | | | | | 1,104,742 | | |
Net Assets | | | | | 94,411,567 | | |
Notes to Portfolio of Investments
(a) Municipal obligations include debt obligations issued by or on behalf of territories, possessions, or sovereign nations within the territorial boundaries of the United States. At October 31, 2012, the value of these securities amounted to $10,130,265 or 10.73% of net assets.
(b) Income from this security may be subject to alternative minimum tax.
(c) Interest rate varies to reflect current market conditions; rate shown is the effective rate on October 31, 2012.
(d) The Fund is entitled to receive principal and interest from the guarantor after a day or a week's notice or upon maturity. The maturity date disclosed represents the final maturity.
(e) The rate shown is the seven-day current annualized yield at October 31, 2012.
Abbreviation Legend
AGM Assured Guaranty Municipal Corporation
AMBAC Ambac Assurance Corporation
AMT Alternative Minimum Tax
FGIC Financial Guaranty Insurance Company
NPFGC National Public Finance Guarantee Corporation
VRDN Variable Rate Demand Note
Fair Value Measurements
Generally accepted accounting principles (GAAP) require disclosure regarding the inputs and valuation techniques used to measure fair value and any changes in valuation inputs or techniques. In addition, investments shall be disclosed by major category.
The Fund categorizes its fair value measurements according to a three-level hierarchy that maximizes the use of observable inputs and minimizes the use of unobservable inputs by prioritizing that the most observable input be used when available. Observable inputs are those that market participants would use in pricing an investment based on market data obtained from sources independent of the reporting entity. Unobservable inputs are those that reflect the Fund's assumptions about the information market participants would use in pricing an investment. An investment's level within the fair value hierarchy is based on the lowest level of any input that is deemed significant to the asset or liability's fair value measurement. The input levels are not necessarily an indication of the risk or liquidity associated with investments at that level. For example, certain U.S. government securities are generally high quality and liquid, however, they are reflected as Level 2 because the inputs used to determine fair value may not always be quoted prices in an active market.
Fair value inputs are summarized in the three broad levels listed below:
> Level 1 — Valuations based on quoted prices for investments in active markets that the Fund has the ability to access at the measurement date (including NAV for open-end mutual funds). Valuation adjustments are not applied to Level 1 investments.
> Level 2 — Valuations based on other significant observable inputs (including quoted prices for similar securities, interest rates, prepayment speeds, credit risks, etc.).
> Level 3 — Valuations based on significant unobservable inputs (including the Fund's own assumptions and judgment in determining the fair value of investments).
The accompanying Notes to Financial Statements are an integral part of this statement.
Annual Report 2012
10
Columbia Connecticut Tax-Exempt Fund
Portfolio of Investments (continued)
October 31, 2012
Fair Value Measurements (continued)
Inputs that are used in determining fair value of an investment may include price information, credit data, volatility statistics, and other factors. These inputs can be either observable or unobservable. The availability of observable inputs can vary between investments, and is affected by various factors such as the type of investment, and the volume and level of activity for that investment or similar investments in the marketplace. The inputs will be considered by the Investment Manager, along with any other relevant factors in the calculation of an investment's fair value. The Fund uses prices and inputs that are current as of the measurement date, which may include periods of market dislocations. During these periods, the availability of prices and inputs may be reduced for many investments. This condition could cause an investment to be reclassified between the various levels within the hierarchy.
Investments falling into the Level 3 category are primarily supported by quoted prices from brokers and dealers participating in the market for those investments. However, these may be classified as Level 3 investments due to lack of market transparency and corroboration to support these quoted prices. Additionally, valuation models may be used as the pricing source for any remaining investments classified as Level 3. These models rely on one or more significant unobservable inputs and/or significant assumptions by the Investment Manager. Inputs used in valuations may include, but are not limited to, financial statement analysis, capital account balances, discount rates and estimated cash flows, and comparable company data.
Under the direction of the Fund's Board of Trustees (the Board), the Investment Manager's Valuation Committee (the Committee) is responsible for carrying out the valuation procedures approved by the Board. The Committee consists of voting and non-voting members from various groups within the Investment Manager's organization, including operations and accounting, trading and investments, compliance, risk management and legal.
The Committee meets at least monthly to review and approve valuation matters, which may include a description of specific valuation determinations, data regarding pricing information received from approved pricing vendors and brokers and the results of Board-approved valuation control policies and procedures (the Policies). The Policies address, among other things, instances when market quotations are readily available, including recommendations of third party pricing vendors and a determination of appropriate pricing methodologies; events that require specific valuation determinations and assessment of fair value techniques; securities with a potential for stale pricing, including those that are illiquid, restricted, or in default; and the effectiveness of third-party pricing vendors, including periodic reviews of vendors. The Committee meets more frequently, as needed, to discuss additional valuation matters, which may include the need to review back-testing results, review time-sensitive information or approve related valuation actions. The Committee reports to the Board, with members of the Committee meeting with the Board at each of its regularly scheduled meetings to discuss valuation matters and actions during the period, similar to those described earlier.
For investments categorized as Level 3, the Committee monitors information similar to that described above, which may include: (i) data specific to the issuer or comparable issuers, (ii) general market or specific sector news and (iii) quoted prices and specific or similar security transactions. The Committee considers this data and any changes from prior periods in order to assess the reasonableness of observable and unobservable inputs, any assumptions or internal models used to value those securities and changes in fair value. This data is also used to corroborate, when available, information received from approved pricing vendors and brokers. Various factors impact the frequency of monitoring this information (which may occur as often as daily). However, the Committee may determine that changes to inputs, assumptions and models are not required as a result of the monitoring procedures performed.
The following table is a summary of the inputs used to value the Fund's investments at October 31, 2012:
Description | | Level 1
Quoted Prices in Active
Markets for Identical
Assets ($) | |
Level 2
Other Significant
Observable Inputs ($) | |
Level 3
Significant
Unobservable Inputs ($) | |
Total ($) | |
Bonds | |
Municipal Bonds | | | — | | | | 87,852,074 | | | | — | | | | 87,852,074 | | |
Total Bonds | | | — | | | | 87,852,074 | | | | — | | | | 87,852,074 | | |
Short-Term Securities | |
Floating Rate Notes | | | — | | | | 3,100,000 | | | | — | | | | 3,100,000 | | |
Total Short-Term Securities | | | — | | | | 3,100,000 | | | | — | | | | 3,100,000 | | |
Other | |
Money Market Funds | | | 2,354,751 | | | | — | | | | — | | | | 2,354,751 | | |
Total Other | | | 2,354,751 | | | | — | | | | — | | | | 2,354,751 | | |
Investments in Securities | | | 2,354,751 | | | | 90,952,074 | | | | — | | | | 93,306,825 | | |
See the Portfolio of Investments for all investment classifications not indicated in the table.
The Fund's assets assigned to the Level 2 input category are generally valued using the market approach, in which a security's value is determined through reference to prices and information from market transactions for similar or identical assets.
There were no transfers of financial assets between Levels 1 and 2 during the period.
The accompanying Notes to Financial Statements are an integral part of this statement.
Annual Report 2012
11
Columbia Connecticut Tax-Exempt Fund
Statement of Assets and Liabilities
October 31, 2012
Assets | |
Investments, at value | |
(identified cost $84,649,581) | | $ | 93,306,825 | | |
Receivable for: | |
Capital shares sold | | | 239,413 | | |
Interest | | | 1,289,122 | | |
Expense reimbursement due from Investment Manager | | | 1,465 | | |
Prepaid expenses | | | 1,259 | | |
Trustees' deferred compensation plan | | | 31,608 | | |
Total assets | | | 94,869,692 | | |
Liabilities | |
Payable for: | |
Capital shares purchased | | | 67,953 | | |
Dividend distributions to shareholders | | | 265,800 | | |
Investment management fees | | | 5,156 | | |
Distribution and service fees | | | 3,746 | | |
Transfer agent fees | | | 15,793 | | |
Administration fees | | | 902 | | |
Compensation of board members | | | 129 | | |
Chief compliance officer expenses | | | 29 | | |
Other expenses | | | 67,009 | | |
Trustees' deferred compensation plan | | | 31,608 | | |
Total liabilities | | | 458,125 | | |
Net assets applicable to outstanding capital stock | | $ | 94,411,567 | | |
Represented by | |
Paid-in capital | | $ | 85,177,779 | | |
Undistributed net investment income | | | 262,903 | | |
Accumulated net realized gain | | | 313,641 | | |
Unrealized appreciation (depreciation) on: | |
Investments | | | 8,657,244 | | |
Total — representing net assets applicable to outstanding capital stock | | $ | 94,411,567 | | |
The accompanying Notes to Financial Statements are an integral part of this statement.
Annual Report 2012
12
Columbia Connecticut Tax-Exempt Fund
Statement of Assets and Liabilities (continued)
October 31, 2012
Class A | |
Net assets | | $ | 74,187,378 | | |
Shares outstanding | | | 9,007,289 | | |
Net asset value per share | | $ | 8.24 | | |
Maximum offering price per share(a) | | $ | 8.65 | | |
Class B | |
Net assets | | $ | 584,915 | | |
Shares outstanding | | | 71,009 | | |
Net asset value per share | | $ | 8.24 | | |
Class C | |
Net assets | | $ | 11,811,052 | | |
Shares outstanding | | | 1,433,857 | | |
Net asset value per share | | $ | 8.24 | | |
Class Z | |
Net assets | | $ | 7,828,222 | | |
Shares outstanding | | | 951,537 | | |
Net asset value per share | | $ | 8.23 | | |
(a) The maximum offering price per share is calculated by dividing the net asset value by 1.0 minus the maximum sales charge of 4.75%.
The accompanying Notes to Financial Statements are an integral part of this statement.
Annual Report 2012
13
Columbia Connecticut Tax-Exempt Fund
Statement of Operations
Year Ended October 31, 2012
Net investment income | |
Income: | |
Dividends | | $ | 780 | | |
Interest | | | 4,122,723 | | |
Total income | | | 4,123,503 | | |
Expenses: | |
Investment management fees | | | 390,371 | | |
Distribution fees | |
Class B | | | 5,308 | | |
Class C | | | 89,263 | | |
Service fees | |
Class A | | | 184,897 | | |
Class B | | | 1,769 | | |
Class C | | | 29,767 | | |
Transfer agent fees | |
Class A | | | 94,817 | | |
Class B | | | 973 | | |
Class C | | | 15,259 | | |
Class Z | | | 13,707 | | |
Administration fees | | | 68,315 | | |
Compensation of board members | | | 17,467 | | |
Custodian fees | | | 3,164 | | |
Printing and postage fees | | | 47,246 | | |
Registration fees | | | 50,371 | | |
Professional fees | | | 29,027 | | |
Other | | | 4,580 | | |
Total expenses | | | 1,046,301 | | |
Fees waived or expenses reimbursed by Investment Manager and its affiliates | | | (208,486 | ) | |
Fees waived by Distributor — Class C | | | (35,682 | ) | |
Expense reductions | | | (160 | ) | |
Total net expenses | | | 801,973 | | |
Net investment income | | | 3,321,530 | | |
Realized and unrealized gain (loss) — net | |
Net realized gain (loss) on: | |
Investments | | | 358,085 | | |
Net realized gain | | | 358,085 | | |
Net change in unrealized appreciation (depreciation) on: | |
Investments | | | 5,241,506 | | |
Net change in unrealized appreciation (depreciation) | | | 5,241,506 | | |
Net realized and unrealized gain | | | 5,599,591 | | |
Net increase in net assets resulting from operations | | $ | 8,921,121 | | |
The accompanying Notes to Financial Statements are an integral part of this statement.
Annual Report 2012
14
Columbia Connecticut Tax-Exempt Fund
Statement of Changes in Net Assets
| | | Year Ended
October 31,
2012 | | Year Ended
October 31,
2011 | |
Operations | |
Net investment income | | $ | 3,321,530 | | | $ | 3,186,103 | | |
Net realized gain | | | 358,085 | | | | 698,124 | | |
Net change in unrealized appreciation (depreciation) | | | 5,241,506 | | | | (1,238,343 | ) | |
Net increase in net assets resulting from operations | | | 8,921,121 | | | | 2,645,884 | | |
Distributions to shareholders | |
Net investment income | |
Class A | | | (2,536,193 | ) | | | (2,683,637 | ) | |
Class B | | | (19,012 | ) | | | (50,316 | ) | |
Class C | | | (354,735 | ) | | | (369,894 | ) | |
Class Z | | | (405,348 | ) | | | (83,208 | ) | |
Net realized gains | |
Class A | | | (516,241 | ) | | | (594,077 | ) | |
Class B | | | (6,489 | ) | | | (19,492 | ) | |
Class C | | | (81,732 | ) | | | (98,272 | ) | |
Class Z | | | (67,149 | ) | | | (19 | ) | |
Total distributions to shareholders | | | (3,986,899 | ) | | | (3,898,915 | ) | |
Increase (decrease) in net assets from capital stock activity | | | (4,503,482 | ) | | | (210,877 | ) | |
Total increase (decrease) in net assets | | | 430,740 | | | | (1,463,908 | ) | |
Net assets at beginning of year | | | 93,980,827 | | | | 95,444,735 | | |
Net assets at end of year | | $ | 94,411,567 | | | $ | 93,980,827 | | |
Undistributed net investment income | | $ | 262,903 | | | $ | 256,661 | | |
The accompanying Notes to Financial Statements are an integral part of this statement.
Annual Report 2012
15
Columbia Connecticut Tax-Exempt Fund
Statement of Changes in Net Assets (continued)
| | | Year Ended October 31, 2012 | | Year Ended October 31, 2011 | |
| | | Shares | | Dollars ($) | | Shares | | Dollars ($) | |
Capital stock activity | |
Class A shares | |
Subscriptions(a) | | | 452,840 | | | | 3,660,794 | | | | 585,007 | | | | 4,472,771 | | |
Distributions reinvested | | | 260,446 | | | | 2,095,050 | | | | 270,923 | | | | 2,047,754 | | |
Redemptions | | | (940,857 | ) | | | (7,616,585 | ) | | | (1,740,760 | ) | | | (13,109,732 | ) | |
Net decrease | | | (227,571 | ) | | | (1,860,741 | ) | | | (884,830 | ) | | | (6,589,207 | ) | |
Class B shares | |
Subscriptions | | | 597 | | | | 4,790 | | | | 3,716 | | | | 28,135 | | |
Distributions reinvested | | | 1,933 | | | | 15,455 | | | | 4,841 | | | | 36,420 | | |
Redemptions(a) | | | (57,296 | ) | | | (459,371 | ) | | | (241,989 | ) | | | (1,820,736 | ) | |
Net decrease | | | (54,766 | ) | | | (439,126 | ) | | | (233,432 | ) | | | (1,756,181 | ) | |
Class C shares | |
Subscriptions | | | 161,090 | | | | 1,306,250 | | | | 145,694 | | | | 1,105,102 | | |
Distributions reinvested | | | 35,575 | | | | 286,047 | | | | 36,914 | | | | 279,090 | | |
Redemptions | | | (221,002 | ) | | | (1,800,598 | ) | | | (337,484 | ) | | | (2,515,782 | ) | |
Net decrease | | | (24,337 | ) | | | (208,301 | ) | | | (154,876 | ) | | | (1,131,590 | ) | |
Class Z shares | |
Subscriptions | | | 567,154 | | | | 4,586,183 | | | | 1,422,522 | | | | 11,074,956 | | |
Distributions reinvested | | | 58,392 | | | | 469,822 | | | | 10,643 | | | | 83,045 | | |
Redemptions | | | (864,819 | ) | | | (7,051,319 | ) | | | (242,669 | ) | | | (1,891,900 | ) | |
Net increase (decrease) | | | (239,273 | ) | | | (1,995,314 | ) | | | 1,190,496 | | | | 9,266,101 | | |
Total net decrease | | | (545,947 | ) | | | (4,503,482 | ) | | | (82,642 | ) | | | (210,877 | ) | |
(a) Includes conversions of Class B shares to Class A shares, if any.
The accompanying Notes to Financial Statements are an integral part of this statement.
Annual Report 2012
16
Columbia Connecticut Tax-Exempt Fund
The following tables are intended to help you understand the Fund's financial performance. Certain information reflects financial results for a single share of a class held for the periods shown. Per share net investment income (loss) amounts are calculated based on average shares outstanding during the period. Total return assumes reinvestment of all dividends and distributions. Total return does not reflect payment of sales charges, if any, and is not annualized for periods of less than one year.
| | | Year Ended October 31, | |
Class A | | 2012 | | 2011 | | 2010 | | 2009 | | 2008 | |
Per share data | |
Net asset value, beginning of period | | $ | 7.83 | | | $ | 7.89 | | | $ | 7.56 | | | $ | 6.95 | | | $ | 7.71 | | |
Income from investment operations: | |
Net investment income | | | 0.28 | | | | 0.28 | | | | 0.28 | | | | 0.27 | | | | 0.28 | | |
Net realized and unrealized gain (loss) | | | 0.46 | | | | (0.00 | )(a) | | | 0.33 | | | | 0.63 | | | | (0.68 | ) | |
Total from investment operations | | | 0.74 | | | | 0.28 | | | | 0.61 | | | | 0.90 | | | | (0.40 | ) | |
Less distributions to shareholders: | |
Net investment income | | | (0.27 | ) | | | (0.28 | ) | | | (0.28 | ) | | | (0.27 | ) | | | (0.27 | ) | |
Net realized gains | | | (0.06 | ) | | | (0.06 | ) | | | — | | | | (0.02 | ) | | | (0.09 | ) | |
Total distributions to shareholders | | | (0.33 | ) | | | (0.34 | ) | | | (0.28 | ) | | | (0.29 | ) | | | (0.36 | ) | |
Net asset value, end of period | | $ | 8.24 | | | $ | 7.83 | | | $ | 7.89 | | | $ | 7.56 | | | $ | 6.95 | | |
Total return | | | 9.67 | % | | | 3.85 | % | | | 8.14 | % | | | 13.18 | % | | | (5.36 | %) | |
Ratios to average net assets(b) | |
Expenses prior to fees waived or expenses reimbursed | | | 1.00 | % | | | 1.07 | % | | | 1.05 | % | | | 1.01 | % | | | 0.99 | % | |
Net expenses after fees waived or expenses reimbursed(c) | | | 0.79 | %(d) | | | 0.81 | %(d) | | | 0.84 | %(d) | | | 0.84 | %(d) | | | 0.84 | %(d) | |
Net investment income | | | 3.44 | %(d) | | | 3.74 | %(d) | | | 3.57 | %(d) | | | 3.67 | %(d) | | | 3.73 | %(d) | |
Supplemental data | |
Net assets, end of period (in thousands) | | $ | 74,187 | | | $ | 72,272 | | | $ | 79,875 | | | $ | 75,465 | | | $ | 67,265 | | |
Portfolio turnover | | | 14 | % | | | 24 | % | | | 17 | % | | | 7 | % | | | 10 | % | |
Notes to Financial Highlights
(a) Rounds to less than $0.01.
(b) In addition to the fees and expenses which the Fund bears directly, the Fund indirectly bears a pro rata share of the fees and expenses of the acquired funds in which it invests. Such indirect expenses are not included in the reported expense ratios.
(c) The Investment Manager and certain of its affiliates agreed to waive/reimburse certain fees and expenses, if applicable.
(d) The benefits derived from expense reductions had an impact of less than 0.01%.
The accompanying Notes to Financial Statements are an integral part of this statement.
Annual Report 2012
17
Columbia Connecticut Tax-Exempt Fund
Financial Highlights (continued)
| | | Year Ended October 31, | |
Class B | | 2012 | | 2011 | | 2010 | | 2009 | | 2008 | |
Per share data | |
Net asset value, beginning of period | | $ | 7.83 | | | $ | 7.89 | | | $ | 7.56 | | | $ | 6.95 | | | $ | 7.71 | | |
Income from investment operations: | |
Net investment income | | | 0.22 | | | | 0.23 | | | | 0.22 | | | | 0.21 | | | | 0.22 | | |
Net realized and unrealized gain (loss) | | | 0.46 | | | | (0.00 | )(a) | | | 0.33 | | | | 0.63 | | | | (0.67 | ) | |
Total from investment operations | | | 0.68 | | | | 0.23 | | | | 0.55 | | | | 0.84 | | | | (0.45 | ) | |
Less distributions to shareholders: | |
Net investment income | | | (0.21 | ) | | | (0.23 | ) | | | (0.22 | ) | | | (0.21 | ) | | | (0.22 | ) | |
Net realized gains | | | (0.06 | ) | | | (0.06 | ) | | | — | | | | (0.02 | ) | | | (0.09 | ) | |
Total distributions to shareholders | | | (0.27 | ) | | | (0.29 | ) | | | (0.22 | ) | | | (0.23 | ) | | | (0.31 | ) | |
Net asset value, end of period | | $ | 8.24 | | | $ | 7.83 | | | $ | 7.89 | | | $ | 7.56 | | | $ | 6.95 | | |
Total return | | | 8.85 | % | | | 3.07 | % | | | 7.34 | % | | | 12.34 | % | | | (6.07 | %) | |
Ratios to average net assets(b) | |
Expenses prior to fees waived or expenses reimbursed | | | 1.77 | % | | | 1.83 | % | | | 1.80 | % | | | 1.76 | % | | | 1.74 | % | |
Net expenses after fees waived or expenses reimbursed(c) | | | 1.54 | %(d) | | | 1.57 | %(d) | | | 1.59 | %(d) | | | 1.59 | %(d) | | | 1.59 | %(d) | |
Net investment income | | | 2.70 | %(d) | | | 3.00 | %(d) | | | 2.85 | %(d) | | | 2.94 | %(d) | | | 2.98 | %(d) | |
Supplemental data | |
Net assets, end of period (in thousands) | | $ | 585 | | | $ | 984 | | | $ | 2,835 | | | $ | 6,871 | | | $ | 10,860 | | |
Portfolio turnover | | | 14 | % | | | 24 | % | | | 17 | % | | | 7 | % | | | 10 | % | |
Notes to Financial Highlights
(a) Rounds to less than $0.01.
(b) In addition to the fees and expenses which the Fund bears directly, the Fund indirectly bears a pro rata share of the fees and expenses of the acquired funds in which it invests. Such indirect expenses are not included in the reported expense ratios.
(c) The Investment Manager and certain of its affiliates agreed to waive/reimburse certain fees and expenses, if applicable.
(d) The benefits derived from expense reductions had an impact of less than 0.01%.
The accompanying Notes to Financial Statements are an integral part of this statement.
Annual Report 2012
18
Columbia Connecticut Tax-Exempt Fund
Financial Highlights (continued)
| | | Year Ended October 31, | |
Class C | | 2012 | | 2011 | | 2010 | | 2009 | | 2008 | |
Per share data | |
Net asset value, beginning of period | | $ | 7.83 | | | $ | 7.89 | | | $ | 7.56 | | | $ | 6.95 | | | $ | 7.71 | | |
Income from investment operations: | |
Net investment income | | | 0.24 | | | | 0.25 | | | | 0.24 | | | | 0.24 | | | | 0.25 | | |
Net realized and unrealized gain (loss) | | | 0.47 | | | | (0.00 | )(a) | | | 0.33 | | | | 0.63 | | | | (0.68 | ) | |
Total from investment operations | | | 0.71 | | | | 0.25 | | | | 0.57 | | | | 0.87 | | | | (0.43 | ) | |
Less distributions to shareholders: | |
Net investment income | | | (0.24 | ) | | | (0.25 | ) | | | (0.24 | ) | | | (0.24 | ) | | | (0.24 | ) | |
Net realized gains | | | (0.06 | ) | | | (0.06 | ) | | | — | | | | (0.02 | ) | | | (0.09 | ) | |
Total distributions to shareholders | | | (0.30 | ) | | | (0.31 | ) | | | (0.24 | ) | | | (0.26 | ) | | | (0.33 | ) | |
Net asset value, end of period | | $ | 8.24 | | | $ | 7.83 | | | $ | 7.89 | | | $ | 7.56 | | | $ | 6.95 | | |
Total return | | | 9.19 | % | | | 3.37 | % | | | 7.66 | % | | | 12.67 | % | | | (5.79 | %) | |
Ratios to average net assets(b) | |
Expenses prior to fees waived or expenses reimbursed | | | 1.75 | % | | | 1.82 | % | | | 1.80 | % | | | 1.76 | % | | | 1.74 | % | |
Net expenses after fees waived or expenses reimbursed(c) | | | 1.24 | %(d) | | | 1.26 | %(d) | | | 1.29 | %(d) | | | 1.29 | %(d) | | | 1.29 | %(d) | |
Net investment income | | | 2.99 | %(d) | | | 3.29 | %(d) | | | 3.12 | %(d) | | | 3.22 | %(d) | | | 3.28 | %(d) | |
Supplemental data | |
Net assets, end of period (in thousands) | | $ | 11,811 | | | $ | 11,413 | | | $ | 12,732 | | | $ | 12,311 | | | $ | 11,565 | | |
Portfolio turnover | | | 14 | % | | | 24 | % | | | 17 | % | | | 7 | % | | | 10 | % | |
Notes to Financial Highlights
(a) Rounds to less than $0.01.
(b) In addition to the fees and expenses which the Fund bears directly, the Fund indirectly bears a pro rata share of the fees and expenses of the acquired funds in which it invests. Such indirect expenses are not included in the reported expense ratios.
(c) The Investment Manager and certain of its affiliates agreed to waive/reimburse certain fees and expenses, if applicable.
(d) The benefits derived from expense reductions had an impact of less than 0.01%.
The accompanying Notes to Financial Statements are an integral part of this statement.
Annual Report 2012
19
Columbia Connecticut Tax-Exempt Fund
Financial Highlights (continued)
| | | Year Ended October 31, | |
Class Z | | 2012 | | 2011 | | 2010(a) | |
Per share data | |
Net asset value, beginning of period | | $ | 7.82 | | | $ | 7.89 | | | $ | 7.98 | | |
Income from investment operations: | |
Net investment income | | | 0.30 | | | | 0.30 | | | | 0.03 | | |
Net realized and unrealized gain (loss) | | | 0.46 | | | | (0.01 | ) | | | (0.09 | ) | |
Total from investment operations | | | 0.76 | | | | 0.29 | | | | (0.06 | ) | |
Less distributions to shareholders: | |
Net investment income | | | (0.29 | ) | | | (0.30 | ) | | | (0.03 | ) | |
Net realized gains | | | (0.06 | ) | | | (0.06 | ) | | | — | | |
Total distributions to shareholders | | | (0.35 | ) | | | (0.36 | ) | | | (0.03 | ) | |
Net asset value, end of period | | $ | 8.23 | | | $ | 7.82 | | | $ | 7.89 | | |
Total return | | | 9.96 | % | | | 3.94 | % | | | (0.79 | %) | |
Ratios to average net assets(b) | |
Expenses prior to fees waived or expenses reimbursed | | | 0.75 | % | | | 0.82 | % | | | 0.81 | %(c) | |
Net expenses after fees waived or expenses reimbursed(d) | | | 0.54 | %(e) | | | 0.54 | %(e) | | | 0.60 | %(c)(e) | |
Net investment income | | | 3.68 | %(e) | | | 3.90 | %(e) | | | 3.70 | %(c)(e) | |
Supplemental data | |
Net assets, end of period (in thousands) | | $ | 7,828 | | | $ | 9,311 | | | $ | 2 | | |
Portfolio turnover | | | 14 | % | | | 24 | % | | | 17 | % | |
Notes to Financial Highlights
(a) For the period from September 27, 2010 (commencement of operations) to October 31, 2010.
(b) In addition to the fees and expenses which the Fund bears directly, the Fund indirectly bears a pro rata share of the fees and expenses of the acquired funds in which it invests. Such indirect expenses are not included in the reported expense ratios.
(c) Annualized.
(d) The Investment Manager and certain of its affiliates agreed to waive/reimburse certain fees and expenses, if applicable.
(e) The benefits derived from expense reductions had an impact of less than 0.01%.
The accompanying Notes to Financial Statements are an integral part of this statement.
Annual Report 2012
20
Columbia Connecticut Tax-Exempt Fund
Notes to Financial Statements
October 31, 2012
Note 1. Organization
Columbia Connecticut Tax-Exempt Fund (the Fund), a series of Columbia Funds Series Trust I (the Trust), is a non-diversified fund. The Trust is registered under the Investment Company Act of 1940, as amended (the 1940 Act), as an open-end management investment company organized as a Massachusetts business trust.
Fund Shares
The Trust may issue an unlimited number of shares (without par value). The Fund offers Class A, Class B, Class C and Class Z shares. All share classes have identical voting, dividend and liquidation rights. Each share class has its own expense structure and sales charges, as applicable.
Class A shares are subject to a maximum front-end sales charge of 4.75% based on the initial investment amount. Class A shares purchased without an initial sales charge in accounts aggregating $1 million to $50 million at the time of purchase are subject to a contingent deferred sales charge (CDSC) if the shares are sold within 18 months of purchase, charged as follows: 1.00% CDSC if redeemed within 12 months of purchase, and 0.50% CDSC if redeemed more than 12, but less than 18, months after purchase.
Class B shares may be subject to a maximum CDSC of 5.00% based upon the holding period after purchase. Class B shares will generally convert to Class A shares eight years after purchase. The Fund no longer accepts investments by new or existing investors in the Fund's Class B shares, except in connection with the reinvestment of any dividend and/or capital gain distributions in Class B shares of the Fund and exchanges by existing Class B shareholders of certain other funds within the Columbia Family of Funds.
Class C shares are subject to a 1.00% CDSC on shares redeemed within one year of purchase.
Class Z shares are not subject to sales charges, and are only available to certain investors.
Note 2. Summary of Significant Accounting Policies
Use of Estimates
The preparation of financial statements in accordance with U.S. generally accepted accounting principles (GAAP) requires management to make certain estimates and assumptions that affect the reported amounts of assets and liabilities, the disclosure of contingent assets and liabilities at the date of the financial statements and the reported amounts of revenue and expenses during the reporting period. Actual results could differ from those estimates.
The following is a summary of significant accounting policies consistently followed by the Fund in the preparation of its financial statements.
Security Valuation
Debt securities generally are valued by pricing services approved by the Board of Trustees (the Board) based upon market transactions for normal, institutional-size trading units of similar securities. The services may use various pricing techniques which take into account appropriate factors such as yield, quality, coupon rate, maturity, type of issue, trading characteristics and other data, as well as broker quotes. Debt securities for which quotations are readily available may also be valued based upon an over-the-counter or exchange bid quotation.
Investments in other open-end investment companies, including money market funds, are valued at net asset value.
Short-term securities purchased within 60 days to maturity are valued at amortized cost, which approximates market value. The value of short-term securities originally purchased with maturities greater than 60 days is determined based on an amortized value to par upon reaching 60 days to maturity. Short-term securities maturing in more than 60 days from the valuation date are valued at the market price or approximate market value based on current interest rates.
Investments for which market quotations are not readily available, or that have quotations which management believes are not reliable, are valued at fair value as determined in good faith under consistently applied procedures established by and under the general supervision of the Board. If a security or class of securities (such as foreign securities) is valued at fair value, such value is likely to be different from the last quoted market price for the security.
The determination of fair value often requires significant judgment. To determine fair value, management may use assumptions including but not limited to future cash flows and estimated risk premiums. Multiple inputs from various sources may be used to determine fair value.
Security Transactions
Security transactions are accounted for on the trade date. Cost is determined and gains (losses) are based upon the specific identification method for both financial statement and federal income tax purposes.
Income Recognition
Interest income is recorded on an accrual basis. Market premiums and discounts, including original issue discounts, are amortized and accreted, respectively, over the expected life of the security on all debt securities, unless otherwise noted.
Annual Report 2012
21
Columbia Connecticut Tax-Exempt Fund
Notes to Financial Statements (continued)
October 31, 2012
Dividend income is recorded on the ex-dividend date.
Expenses
General expenses of the Trust are allocated to the Fund and other funds of the Trust based upon relative net assets or other expense allocation methodologies determined by the nature of the expense. Expenses directly attributable to the Fund are charged to the Fund. Expenses directly attributable to a specific class of shares are charged to that share class.
Determination of Class Net Asset Value
All income, expenses (other than class-specific expenses, which are charged to that share class, as shown in the Statement of Operations) and realized and unrealized gains (losses) are allocated to each class of the Fund on a daily basis for purposes of determining the net asset value of each class. Income and expenses are allocated to each class based on the settled shares method, while realized and unrealized gains (losses) are allocated based on the relative net assets of each class.
Federal Income Tax Status
The Fund intends to qualify each year as a regulated investment company under Subchapter M of the Internal Revenue Code, as amended, and will distribute substantially all of its tax exempt or taxable income (including net short-term capital gains), if any, for its tax year, and as such will not be subject to federal income taxes. In addition, the Fund intends to distribute in each calendar year substantially all of its net investment income, capital gains and certain other amounts, if any, such that the Fund should not be subject to federal excise tax. Therefore, no federal income or excise tax provision is recorded.
Distributions to Shareholders
Distributions from net investment income, if any, are declared daily and paid monthly. Net realized capital gains, if any, are distributed at least annually. Income distributions and capital gain distributions are determined in accordance with federal income tax regulations, which may differ from GAAP.
Guarantees and Indemnifications
Under the Trust's organizational documents and, in some cases, by contract, its officers and trustees are indemnified against certain liabilities arising out of the performance of their duties to the Trust or its funds. In addition, certain of the Fund's contracts with its service providers contain general indemnification clauses. The Fund's maximum exposure under these arrangements is unknown since the amount of any future claims that may be made against the Fund cannot be determined, and the Fund has no historical basis for predicting the likelihood of any such claims.
Recent Accounting Pronouncement
Disclosures about Offsetting Assets and Liabilities
In December 2011, the Financial Accounting Standards Board (FASB) issued ASU No. 2011-11, Disclosures about Offsetting Assets and Liabilities. The objective of the FASB is to enhance current disclosure requirements on offsetting of certain assets and liabilities and to enable financial statement users to compare financial statements prepared under GAAP and International Financial Reporting Standards.
Specifically, ASU No. 2011-11 requires an entity to disclose both gross and net information for derivatives and other financial instruments that are subject to a master netting arrangement or similar agreement. The standard requires disclosure of collateral received in connection with the master netting agreements or similar agreements. The effective date of ASU No. 2011-11 is for interim and annual periods beginning on or after January 1, 2013. At this time, management is evaluating the implications of this guidance and the impact it will have on the financial statement amounts and footnote disclosures, if any.
Note 3. Fees and Compensation Paid to Affiliates
Investment Management Fees
Under an Investment Management Services Agreement, Columbia Management Investment Advisers, LLC (the Investment Manager), a wholly-owned subsidiary of Ameriprise Financial, Inc. (Ameriprise Financial), determines which securities will be purchased, held or sold. The investment management fee is an annual fee that is equal to a percentage of the Fund's average daily net assets that declines from 0.40% to 0.27% as the Fund's net assets increase. The annualized effective investment management fee rate for the year ended October 31, 2012 was 0.40% of the Fund's average daily net assets.
Administration Fees
Under an Administrative Services Agreement, the Investment Manager also serves as the Fund Administrator. The Fund pays the Fund Administrator an annual fee for administration and accounting services equal to a percentage of the Fund's average daily net assets that declines from 0.07% to 0.04% as the Fund's net assets increase. The annualized effective administration fee rate for the year ended October 31, 2012 was 0.07% of the Fund's average daily net assets.
Compensation of Board Members
Board members are compensated for their services to the Fund as disclosed in the Statement of Operations. The Trust's eligible
Annual Report 2012
22
Columbia Connecticut Tax-Exempt Fund
Notes to Financial Statements (continued)
October 31, 2012
Trustees may participate in a Deferred Compensation Plan (the Plan) which may be terminated at any time. Obligations of the Plan will be paid solely out of the Fund's assets.
Compensation of Chief Compliance Officer
The Board has appointed a Chief Compliance Officer to the Fund in accordance with federal securities regulations. The Fund pays its pro-rata share of the expenses associated with the Chief Compliance Officer. The Fund's expenses for the Chief Compliance Officer will not exceed $15,000 per year.
Transfer Agent Fees
Under a Transfer and Dividend Disbursing Agent Agreement, Columbia Management Investment Services Corp. (the Transfer Agent), an affiliate of the Investment Manager and a wholly-owned subsidiary of Ameriprise Financial, is responsible for providing transfer agency services to the Fund. The Transfer Agent has contracted with Boston Financial Data Services (BFDS) to serve as sub-transfer agent.
The Transfer Agent receives monthly account-based service fees based on the number of open accounts and is reimbursed by the Fund for the fees and expenses the Transfer Agent pays to financial intermediaries that maintain omnibus accounts with the Fund that is a percentage of the average aggregate value of the Fund's shares maintained in each such omnibus account (other than omnibus accounts for which American Enterprise Investment Services Inc. is the broker of record or accounts where the beneficial shareholder is a customer of Ameriprise Financial Services, Inc., which are paid a per account fee). The Transfer Agent pays the fees of BFDS for services as sub-transfer agent and is not entitled to reimbursement for such fees from the Fund (with the exception of out-of-pocket fees).
The Transfer Agent also receives compensation from fees for various shareholder services and reimbursements for certain out-of-pocket fees.
For the year ended October 31, 2012, the Fund's annualized effective transfer agent fee rates as a percentage of average daily net assets of each class were as follows:
Class A | | | 0.13 | % | |
Class B | | | 0.14 | | |
Class C | | | 0.13 | | |
Class Z | | | 0.12 | | |
An annual minimum account balance fee of $20 may apply to certain accounts with a value below the Fund's initial minimum investment requirements to reduce the impact of small accounts on transfer agent fees. These minimum account balance fees are recorded as part of expense reductions in the Statement of Operations. For the year ended October 31, 2012,
these minimum account balance fees reduced total expenses by $160.
Distribution and Service Fees
The Fund has an agreement with Columbia Management Investment Distributors, Inc. (the Distributor), an affiliate of the Investment Manager and a wholly-owned subsidiary of Ameriprise Financial, for distribution and shareholder services. Pursuant to Rule 12b-1 under the 1940 Act, the Board has approved, and the Fund has adopted, distribution and shareholder service plans (the Plans) which set the distribution and service fees for the Fund. These fees are calculated daily and are intended to compensate the Distributor and/or eligible selling and/or servicing agents for selling shares of the Fund and providing services to investors.
The Plans require the payment of a monthly service fee to the Distributor at the maximum annual rate of 0.25% of the average daily net assets attributable to Class A, Class B and Class C shares of the Fund. The Plans also require the payment of a monthly distribution fee to the Distributor at the maximum annual rate of 0.75% of the average daily net assets attributable to Class B and Class C shares, only.
The Distributor has voluntarily agreed to waive a portion of the distribution fee for Class C shares so that the distribution fee does not exceed 0.45% annually of the average daily net assets attributable to Class C shares. This arrangement may be modified or terminated by the Distributor at any time.
Sales Charges
Sales charges, including front-end charges and CDSCs, received by the Distributor for distributing Fund shares were $48,118 for Class A, $916 for Class B, and $546 for Class C shares for the year ended October 31, 2012.
Expenses Waived/Reimbursed by the Investment Manager and its Affiliates
Effective March 1, 2012, the Investment Manager and certain of its affiliates have contractually agreed to waive fees and/or reimburse expenses (excluding certain fees and expenses described below), through February 28, 2013, unless sooner terminated at the sole discretion of the Board, so that the Fund's net operating expenses, after giving effect to fees waived/expenses reimbursed and/or overdraft charges from the Fund's custodian, do not exceed the following annual rates as a percentage of the class' average daily net assets:
Class A | | | 0.79 | % | |
Class B | | | 1.54 | | |
Class C | | | 1.54 | | |
Class Z | | | 0.54 | | |
Annual Report 2012
23
Columbia Connecticut Tax-Exempt Fund
Notes to Financial Statements (continued)
October 31, 2012
Prior to March 1, 2012, the Investment Manager and certain of its affiliates contractually agreed to waive fees and/or reimburse expenses (excluding certain fees and expenses described), so that the Fund's net operating expenses, after giving effect to fees waived/expenses reimbursed and any balance credits and/or overdraft charges from the Fund's custodian, did not exceed the following annual rates as a percentage of the class' average daily net assets:
Class A | | | 0.79 | % | |
Class B | | | 1.54 | | |
Class C | | | 1.54 | | |
Class Z | | | 0.55 | | |
Under the agreement, the following fees and expenses are excluded from the waiver/reimbursement commitment, and therefore will be paid by the Fund, if applicable: taxes (including foreign transaction taxes), expenses associated with investments in affiliated and non-affiliated pooled investment vehicles (including mutual funds and exchange traded funds), transaction costs and brokerage commissions, costs related to any securities lending program, dividend expenses associated with securities sold short, inverse floater program fees and expenses, transaction charges and interest on borrowed money, interest, extraordinary expenses and any other expenses the exclusion of which is specifically approved by the Board. This agreement may be modified or amended only with approval from all parties. Class C distribution fees waived by the Distributor, as discussed above, are in addition to the waiver/reimbursement commitment under the agreement.
Note 4. Federal Tax Information
The timing and character of income and capital gain distributions are determined in accordance with income tax regulations, which may differ from GAAP because of temporary or permanent book to tax differences.
At October 31, 2012, these differences are primarily due to differing treatment for Trustees' deferred compensation, distribution reclassifications and principle and/or interest of fixed income securities. To the extent these differences are permanent, reclassifications are made among the components of the Fund's net assets in the Statement of Assets and Liabilities. Temporary differences do not require reclassifications.
The Fund did not have any permanent differences; therefore, no reclassifications were made to the Statement of Assets and Liabilities.
The tax character of distributions paid during the years indicated was as follows:
Year Ended October 31, | | 2012 | | 2011 | |
Ordinary income | | $ | 8,968 | | | $ | 5,921 | | |
Long-term capital gains | | | 671,611 | | | | 711,860 | | |
Tax return of capital | | | — | | | | — | | |
Tax-exempt Income | | | 3,306,320 | | | | 3,181,134 | | |
Total | | $ | 3,986,899 | | | $ | 3,898,915 | | |
Short-term capital gain distributions, if any, are considered ordinary income distributions for tax purposes.
At October 31, 2012, the components of distributable earnings on a tax basis were as follows:
Undistributed short-term gain | | $ | 230,494 | | |
Undistributed tax-exempt income | | | 535,985 | | |
Undistributed accumulated long-term gain | | | 102,635 | | |
Unrealized appreciation | | | 8,660,233 | | |
At October 31, 2012, the cost of investments for federal income tax purposes was $84,646,592 and the aggregate gross unrealized appreciation and depreciation based on that cost was:
Unrealized appreciation | | $ | 8,660,233 | | |
Unrealized depreciation | | | — | | |
Net unrealized appreciation | | $ | 8,660,233 | | |
Management of the Fund has concluded that there are no significant uncertain tax positions that would require recognition in the financial statements. However, management's conclusion may be subject to review and adjustment at a later date based on factors including, but not limited to, new tax laws, regulations, and administrative interpretations (including relevant court decisions). Generally, the Fund's federal tax returns for the prior three fiscal years remain subject to examination by the Internal Revenue Service.
Note 5. Portfolio Information
The cost of purchases and proceeds from sales of securities, excluding short-term obligations, aggregated to $12,792,959 and $21,650,273, respectively, for the year ended October 31, 2012.
Note 6. Shareholder Concentration
At October 31, 2012, 2 unaffiliated shareholder accounts owned an aggregate of 31.1% of the outstanding shares of the Fund. The Fund has no knowledge about whether any portion of those shares was owned beneficially by such accounts. Subscription and redemption activity by concentrated accounts may have a significant effect on the operations of the Fund.
Annual Report 2012
24
Columbia Connecticut Tax-Exempt Fund
Notes to Financial Statements (continued)
October 31, 2012
Note 7. Line of Credit
The Fund has entered into a revolving credit facility with a syndicate of banks led by JPMorgan Chase Bank N.A. whereby the Fund may borrow for the temporary funding of shareholder redemptions or for other temporary or emergency purposes. The credit facility agreement, as amended, which is a collective agreement between the Fund and certain other funds managed by the Investment Manager, severally and not jointly, permits collective borrowings up to $500 million. Pursuant to a December 13, 2011 amendment to the credit facility agreement, interest is charged to each participating fund based on its borrowings at a rate equal to the higher of (i) the overnight federal funds rate plus 1.00% or (ii) the one-month LIBOR rate plus 1.00%. Each borrowing under the credit facility matures no later than 60 days after the date of borrowing. The Fund also pays a commitment fee equal to its pro rata share of the amount of the credit facility at a rate of 0.08% per annum.
Prior to December 13, 2011, interest was charged to each participating fund based on its borrowings at a rate equal to the sum of the federal funds rate plus (i) 1.25% per annum plus (ii) if one-month LIBOR exceeds the federal funds rate, the amount of such excess. The Fund also paid a commitment fee equal to its pro rata share of the amount of the credit facility at a rate of 0.10% per annum.
The Fund had no borrowings during the year ended October 31, 2012.
Note 8. Significant Risks
Non-Diversification Risk
A non-diversified fund is permitted to invest a greater percentage of its total assets in fewer issuers than a diversified fund. The Fund may, therefore, have a greater risk of loss from a few issuers than a similar fund that invests more broadly.
Geographic Concentration Risk
Because state-specific tax-exempt funds invest primarily in the municipal securities issued by the state and political sub-divisions of the state, the Fund will be particularly affected by political and economic conditions and developments in the state in which it invests. The Fund may, therefore, have a greater risk than that of a municipal bond fund which is more geographically diversified. The value of the municipal securities owned by the Fund also may be adversely affected by future changes in federal or state income tax laws.
Note 9. Subsequent Events
Management has evaluated the events and transactions that have occurred through the date the financial statements were issued. Other than as noted below, there were no items requiring adjustment of the financial statements or additional disclosure.
In August 2012, the Board of Trustees approved a proposal to merge the Fund into Columbia Tax-Exempt Fund. Shareholders of the Fund will vote on the proposed merger at a special meeting of shareholders to be held during the first half of 2013.
Note 10. Information Regarding Pending and Settled Legal Proceedings
In December 2005, without admitting or denying the allegations, American Express Financial Corporation (AEFC, which is now known as Ameriprise Financial, Inc. (Ameriprise Financial)) entered into settlement agreements with the Securities and Exchange Commission (SEC) and Minnesota Department of Commerce (MDOC) related to market timing activities. As a result, AEFC was censured and ordered to cease and desist from committing or causing any violations of certain provisions of the Investment Advisers Act of 1940, the Investment Company Act of 1940, and various Minnesota laws. AEFC agreed to pay disgorgement of $10 million and civil money penalties of $7 million. AEFC also agreed to retain an independent distribution consultant to assist in developing a plan for distribution of all disgorgement and civil penalties ordered by the SEC in accordance with various undertakings detailed at www.sec.gov/litigation/admin/ia-2451.pdf. Ameriprise Financial and its affiliates have cooperated with the SEC and the MDOC in these legal proceedings, and have made regular reports to the funds' Boards of Trustees.
Ameriprise Financial and certain of its affiliates have historically been involved in a number of legal, arbitration and regulatory proceedings, including routine litigation, class actions, and governmental actions, concerning matters arising in connection with the conduct of their business activities. Ameriprise Financial believes that the Funds are not currently the subject of, and that neither Ameriprise Financial nor any of its affiliates are the subject of, any pending legal, arbitration or regulatory proceedings that are likely to have a material adverse effect on the Funds or the ability of Ameriprise Financial or its affiliates to perform under their contracts with the Funds. Ameriprise Financial is required to make 10-Q, 10-K and, as necessary, 8-K filings with the Securities and Exchange Commission on legal and regulatory matters that relate to Ameriprise Financial and its affiliates. Copies of these filings may be obtained by accessing the SEC website at www.sec.gov.
Annual Report 2012
25
Columbia Connecticut Tax-Exempt Fund
Notes to Financial Statements (continued)
October 31, 2012
There can be no assurance that these matters, or the adverse publicity associated with them, will not result in increased fund redemptions, reduced sale of fund shares or other adverse consequences to the Funds. Further, although we believe proceedings are not likely to have a material adverse effect on the Funds or the ability of Ameriprise Financial or its affiliates to perform under their contracts with the Funds, these proceedings are subject to uncertainties and, as such, we are unable to estimate the possible loss or range of loss that may result. An adverse outcome in one or more of these proceedings could result in adverse judgments, settlements, fines, penalties or other relief that could have a material adverse effect on the consolidated financial condition or results of operations of Ameriprise Financial.
Annual Report 2012
26
Columbia Connecticut Tax-Exempt Fund
Report of Independent Registered Public Accounting Firm
To the Trustees of Columbia Funds Series Trust I and
the Shareholders of Columbia Connecticut Tax-Exempt Fund
In our opinion, the accompanying statement of assets and liabilities, including the portfolio of investments, and the related statements of operations and of changes in net assets and the financial highlights present fairly, in all material respects, the financial position of Columbia Connecticut Tax-Exempt Fund (the "Fund") (a series of Columbia Funds Series Trust I) at October 31, 2012, the results of its operations, the changes in its net assets and the financial highlights for each of the periods indicated, in conformity with accounting principles generally accepted in the United States of America. These financial statements and financial highlights (hereafter referred to as "financial statements") are the responsibility of the Fund's management. Our responsibility is to express an opinion on these financial statements based on our audits. We conducted our audits of these financial statements in accordance with the standards of the Public Company Accounting Oversight Board (United States). Those standards require that we plan and perform the audit to obtain reasonable assurance about whether the financial statements are free of material misstatement. An audit includes examining, on a test basis, evidence supporting the amounts and disclosures in the financial statements, assessing the accounting principles used and significant estimates made by management, and evaluating the overall financial statement presentation. We believe that our audits, which included confirmation of securities at October 31, 2012 by correspondence with the custodian, brokers and transfer agent, provide a reasonable basis for our opinion.
PricewaterhouseCoopers LLP
Minneapolis, Minnesota
December 21, 2012
Annual Report 2012
27
Columbia Connecticut Tax-Exempt Fund
Federal Income Tax Information
(Unaudited)
The Fund hereby designates the following tax attributes for the fiscal year ended October 31, 2012. Shareholders will be notified in early 2013 of amounts for use in preparing 2012 income tax returns.
Tax Designations:
Capital Gain Dividend | | $ | 133,971 | | |
Exempt-Interest Dividends | | | 99.73 | % | |
Capital Gain Dividend — The Fund designates as a capital gain dividend the amount reflected above, or if subsequently determined to be different, the net capital gain of such fiscal period.
Exempt-Interest Dividends — The percentage of net investment income distributions paid during the fiscal year that qualifies as exempt-interest dividends for federal income tax purposes.
Annual Report 2012
28
Columbia Connecticut Tax-Exempt Fund
The Trustees serve terms of indefinite duration. The names, addresses and birth years of the Trustees and Officers of the Funds in Columbia Funds Series Trust I, the year each was first elected or appointed to office, their principal business occupations during at least the last five years, the number of Funds overseen by each Trustee and other directorships they hold are shown below. Each officer listed below serves as an officer of each Fund in Columbia Funds Series Trust I.
Independent Trustees
Name, Address and Year of Birth,
Position with Funds, Year First
Elected or Appointed to Office | | Principal Occupation(s) During Past Five Years, Number of Funds in Columbia
Funds Complex Overseen by Trustee, Other Directorships Held
| |
Rodman L. Drake (Born 1943)
c/o Columbia Management Investment Advisers, LLC
225 Franklin Street
Boston, MA 02110
Trustee (since 1994) and
Chairman of the Board (since 2009) | | Independent consultant since 2010; Co-Founder of Baringo Capital LLC (private equity) from 1997 to 2008; CEO of Crystal River Capital, Inc. (real estate investment trust) from 2003 to 2010; Oversees 52; Jackson Hewitt Tax Service Inc. (tax preparation services from 2004 to 2011); Celgene Corporation (global biotechnology company); Student Loan Corporation (student loan provider from 2005 to 2010); Celgene Corporation (global biotechnology company); The Helios Funds and Brookfield Funds (closed-end funds); Crystal River Capital, Inc. from 2005 to 2010; Parsons Brinckerhoff from 1995 to 2008; and Apex Silver Mines Ltd. from 2007 to 2009 | |
Douglas A. Hacker (Born 1955)
c/o Columbia Management Investment Advisers, LLC
225 Franklin Street
Boston, MA 02110
Trustee (since 1996) | | Independent business executive since May 2006; Executive Vice President — Strategy of United Airlines from December 2002 to May 2006; President of UAL Loyalty Services (airline marketing company) from September 2001 to December 2002; Executive Vice President and Chief Financial Officer of United Airlines from July 1999 to September 2001. Oversees 52; Nash Finch Company (food distributor); Aircastle Limited (aircraft leasing); and SeaCube Container Leasing Ltd. (container leasing) | |
Janet Langford Kelly (Born 1957)
c/o Columbia Management Investment Advisers, LLC
225 Franklin Street
Boston, MA 02110
Trustee (since 1996) | | Senior Vice President, General Counsel and Corporate Secretary, ConocoPhillips (integrated energy company) since September 2007; Deputy General Counsel — Corporate Legal Services, ConocoPhillips from August 2006 to August 2007; Partner, Zelle, Hofmann, Voelbel, Mason & Gette LLP (law firm) from March 2005 to July 2006; Adjunct Professor of Law, Northwestern University from September 2004 to June 2006; Director, UAL Corporation (airline) from February 2006 to July 2006; Chief Administrative Officer and Senior Vice President, Kmart Holding Corporation (consumer goods) from September 2003 to March 2004. Oversees 52; None | |
Nancy T. Lukitsh (Born 1956)
c/o Columbia Management Investment Advisers, LLC
225 Franklin Street
Boston, MA 02110
Trustee (since 2011) | | Senior Vice President, Partner and Director of Marketing, Wellington Management Company, LLP (investment adviser) from 1997 to 2010; Chair, Wellington Management Investment Portfolios (commingled non-U.S. investment pools) from 2007 to 2010; Director, Wellington Trust Company, NA and other Wellington affiliates from 1997 to 2010. Oversees 52; None | |
William E. Mayer (Born 1940)
c/o Columbia Management Investment Advisers, LLC
225 Franklin Street
Boston, MA 02110
Trustee (since 1994) | | Partner, Park Avenue Equity Partners (private equity) since February 1999; Dean and Professor, College of Business and Management, University of Maryland from 1992 to 1996. Oversees 52; DynaVox Inc. (speech creation); Lee Enterprises (print media); WR Hambrecht + Co. (financial service provider) from 2000 to 2012; BlackRock Kelso Capital Corporation (investment company) | |
David M. Moffett (Born 1952)
c/o Columbia Management Investment Advisers, LLC
225 Franklin Street
Boston, MA 02110
Trustee (since 2011) | | Retired. Chief Executive Officer, Federal Home Loan Mortgage Corporation, from 2008 to 2009; Senior Adviser, Global Financial Services Group, Carlyle Group, Inc., from 2007 to 2008; Vice Chairman and Chief Financial Officer, U.S. Bancorp, from 1993 to 2007. Oversees 52; CIT Group Inc. (commercial and consumer finance); eBay Inc. (online trading community); MBIA Inc. (financial service provider); E.W. Scripps Co. (print and television media), Building Materials Holding Corp. (building materials and construction services); and University of Oklahoma Foundation. | |
Charles R. Nelson (Born 1942)
c/o Columbia Management Investment Advisers, LLC
225 Franklin Street
Boston, MA 02110
Trustee (since 1981) | | Retired Professor Emeritus, University of Washington, since 2011; Professor of Economics, University of Washington from January 1976 to 2011; Ford and Louisa Van Voorhis Professor of Political Economy, University of Washington from 1993 to 2011; Adjunct Professor of Statistics, University of Washington from 1980 to 2011; Associate Editor, Journal of Money Credit and Banking from 1993 to 2008; consultant on econometric and statistical matters. Oversees 52; None | |
John J. Neuhauser (Born 1943)
c/o Columbia Management Investment Advisers, LLC
225 Franklin Street
Boston, MA 02110
Trustee (since 1984) | | President, Saint Michael's College, since August 2007; Director or Trustee of several non-profit organizations, including Fletcher Allen Health Care, Inc.; University Professor, Boston College from November 2005 to August 2007; Academic Vice President and Dean of Faculties, Boston College from August 1999 to October 2005. Oversees 52; Liberty All-Star Equity Fund and Liberty All-Star Growth Fund (closed-end funds) | |
Annual Report 2012
29
Columbia Connecticut Tax-Exempt Fund
Trustees and Officers (continued)
Independent Trustees (continued)
Name, Address and Year of Birth,
Position with Funds, Year First
Elected or Appointed to Office | | Principal Occupation(s) During Past Five Years, Number of Funds in Columbia
Funds Complex Overseen by Trustee, Other Directorships Held
| |
Patrick J. Simpson (Born 1944)
c/o Columbia Management Investment Advisers, LLC
225 Franklin Street
Boston, MA 02110
Trustee (since 2000) | | Partner, Perkins Coie LLP (law firm). Oversees 52; None | |
Anne-Lee Verville (Born 1945)
c/o Columbia Management Investment Advisers, LLC
225 Franklin Street
Boston, MA 02110
Trustee (since 1998) | | Retired. General Manager — Global Education Industry from 1994 to 1997, President — Application Systems Division from 1991 to 1994, Chief Financial Officer — US Marketing & Services from 1988 to 1991, and Chief Information Officer from 1987 to 1988, IBM Corporation (computer and technology). Oversees 52; Enesco Group, Inc. (producer of giftware and home and garden decor products) from 2001 to 2006 | |
Interested Trustee
Name, Address and Year of Birth,
Position with Funds, Year First
Elected or Appointed to Office | | Principal Occupation(s) During Past Five Years, Number of Funds in Columbia
Funds Complex Overseen by Trustee, Other Directorships Held
| |
William F. Truscott (born 1960)
53600 Ameriprise Financial Center
Minneapolis, MN 55474
Senior Vice President (since 2012) | | Chairman of the Board and President, Columbia Management Investment Advisers, LLC since May 2010 and February 2012, respectively (previously President, Chairman of the Board and Chief Investment Officer, from 2001 to April 2010); Chief Executive Officer, U.S. Asset Management & President, Annuities, Ameriprise Financial, Inc. since May 2010 (previously President — U.S. Asset Management and Chief Investment Officer from 2005 to April 2010, and Senior Vice President — Chief Investment Officer, from 2001 to 2005); Director, President and Chief Executive Officer, Ameriprise Certificate Company since 2006; Director and Chief Executive Officer, Columbia Management Investment Distributors, Inc. since May 2010 and February 2012, respectively (previously Chairman of the Board and Chief Executive Officer from 2008 to April 2010); Chairman of the Board and Chief Executive Officer, RiverSource Distributors, Inc. since 2006. Oversees 208; Columbia Funds Board. | |
The Statement of Additional Information includes additional information about the Trustees of the Funds and is available, without charge, upon request by calling 1-800-345-6611.
Officers
Name, Year of Birth and Address | | Principal Occupation(s) During the Past Five Years | |
J. Kevin Connaughton (Born 1964)
225 Franklin Street
Boston, MA 02110
President (since 2009) | | Senior Vice President and General Manager — Mutual Fund Products, Columbia Management Investment Advisers, LLC since May 2010; President, Columbia Funds, since 2009, and RiverSource Funds, since May 2010 (previously Senior Vice President and Chief Financial Officer, Columbia Funds, from June 2008 to January 2009, Treasurer, Columbia Funds, from October 2003 to May 2008, and senior officer of various other affiliated funds since 2000); Managing Director, Columbia Management Advisors, LLC from December 2004 to April 2010. | |
Michael G. Clarke (Born 1969)
225 Franklin Street
Boston, MA 02110
Treasurer (since 2011) and Chief Financial Officer (since 2009) | | Vice President, Columbia Management Investment Advisers, LLC since May 2010; Managing Director of Fund Administration, Columbia Management Advisors, LLC, from September 2004 to April 2010; senior officer of Columbia Funds and affiliated funds since 2002. | |
Scott R. Plummer (Born 1959)
5228 Ameriprise Financial Center
Minneapolis, MN 55474
Senior Vice President, Assistant Secretary and Chief Legal Officer (since 2010) | | Senior Vice President, Chief Legal Officer and Assistant Secretary, Columbia Management Investment Advisers, LLC since June 2005; Vice President and Lead Chief Counsel — Asset Management, Ameriprise Financial, Inc. since May 2010 (previously Vice President and Chief Counsel — Asset Management, from 2005 to April 2010); Vice President, Chief Counsel and Assistant Secretary, Columbia Management Investment Distributors, Inc. since 2008; Vice President, General Counsel and Secretary, Ameriprise Certificate Company since 2005; Chief Counsel, RiverSource Distributors, Inc. since 2006; Vice President, General Counsel and Secretary, RiverSource Funds since December 2006; Senior Vice President, Secretary and Chief Legal Officer, Columbia Funds, since May 2010. | |
Annual Report 2012
30
Columbia Connecticut Tax-Exempt Fund
Trustees and Officers (continued)
Officers (continued)
Name, Year of Birth and Address | | Principal Occupation(s) During the Past Five Years | |
William F. Truscott (Born 1960)
53600 Ameriprise Financial Center
Minneapolis, MN 55474
Senior Vice President (since 2010) | | Chairman of the Board and President, Columbia Management Investment Advisers, LLC since May 2010 and February 2012, respectively (previously President, Chairman of the Board and Chief Investment Officer, from 2001 to April 2010); Chief Executive Officer, U.S. Asset Management & President, Annuities, Ameriprise Financial, Inc. since May 2010 (previously President — U.S. Asset Management and Chief Investment Officer from 2005 to April 2010); Director, President and Chief Executive Officer, Ameriprise Certificate Company since 2006; Director and Chief Executive Officer, Columbia Management Investment Distributors, Inc. since May 2010 and February 2012, respectively (previously Chairman of the Board and Chief Executive Officer from 2008 to April 2010); Chairman of the Board and Chief Executive Officer, RiverSource Distributors, Inc. since 2006. | |
Thomas P. McGuire (Born 1972)
225 Franklin Street
Boston, MA 02110
Chief Compliance Officer (since 2012) | | Vice President — Asset Management Compliance, Columbia Management Investment Advisers, LLC since 2010; Chief Compliance Officer, Ameriprise Certificate Company, since September 2010; Compliance Executive, Bank of America, 2005-2010. | |
Colin Moore (Born 1958)
225 Franklin Street
Boston, MA 02110
Senior Vice President (since 2010) | | Director and Chief Investment Officer, Columbia Management Investment Advisers, LLC since May 2010; Manager, Managing Director and Chief Investment Officer of Columbia Management Advisors, LLC from 2007 to April 2010; Head of Equities, Columbia Management Advisors, LLC from 2002 to 2007. | |
Amy Johnson (Born 1965)
5228 Ameriprise Financial Center
Minneapolis, MN 55474
Vice President (since 2010) | | Senior Vice President and Chief Operating Officer, Columbia Management Investment Advisers, LLC since May 2010 (previously Chief Administrative Officer, from 2009 until April 2010, Vice President — Asset Management and Trust Company Services, from 2006 to 2009, and Vice President — Operations and Compliance from 2004 to 2006). | |
Joseph F. DiMaria (Born 1968)
225 Franklin Street
Boston, MA 02110
Vice President (since 2011) and Chief Accounting Officer (since 2008) | | Vice President, Mutual Fund Administration, Columbia Management Investment Advisers, LLC, since May 2010; Director of Fund Administration, Columbia Management Advisors, LLC from January 2006 to April 2010; Head of Tax/Compliance and Assistant Treasurer, Columbia Management Advisors, LLC, from November 2004 to December 2005. | |
Stephen T. Welsh (born 1957)
225 Franklin Street
Boston, MA 02110
Vice President (since 2006) | | President and Director, Columbia Management Investment Services Corp. since May 2010; President and Director, Columbia Management Services, Inc. from July 2004 to April 2010; Managing Director, Columbia Management Distributors, Inc. from August 2007 to April 2010. | |
Paul D. Pearson (born 1956)
10468 Ameriprise Financial Center
Minneapolis, MN 55474
Vice President and Assistant Treasurer (since 2011) | | Vice President, Investment Accounting, Columbia Management Investment Advisers, LLC, since May 2010; Vice President, Managed Assets, Investment Accounting, Ameriprise Financial Corporation. | |
Paul B. Goucher (born 1968)
5228 Ameriprise Financial Center
Minneapolis, MN 55474
Vice President and Assistant Secretary (since 2010) | | Vice President and Chief Counsel of Ameriprise Financial since January 2010 (formerly Vice President and Group Counsel from November 2008 to January 2010); Director, Managing Director and General Counsel of J. & W. Seligman & Co. Incorporated (Seligman) from July 2008 to November 2008 and Managing Director and Associate General Counsel of Seligman from January 2005 to July 2008. | |
Christopher O. Petersen (born 1970)
5228 Ameriprise Financial Center
Minneapolis, MN 55474
Vice President (since 2010) and Secretary (since 2011) | | Vice President and Chief Counsel, Ameriprise Financial since January 2010 (formerly Vice President and Group Counsel or Counsel from April 2004 to January 2010); Assistant Secretary of RiverSource Funds since January 2007; officer of Columbia Funds and affiliated funds since 2007. | |
Michael E. DeFao (born 1968)
225 Franklin Street
Boston, MA 02110
Vice President and Assistant Secretary (since 2011) | | Vice President and Chief Counsel, Ameriprise Financial since May 2010; Associate General Counsel, Bank of America from June 2005 to April 2010. | |
Annual Report 2012
31
Columbia Connecticut Tax-Exempt Fund
Board Consideration and Approval of
Advisory Agreement
On June 6, 2012, the Board of Trustees (the "Board") and the Trustees who are not interested persons (as defined in the Investment Company Act of 1940) of the Trust (the "Independent Trustees") unanimously approved the continuation of the Investment Management Services Agreement (the "Advisory Agreement") with Columbia Management Investment Advisers, LLC (the "Investment Manager") with respect to Columbia Connecticut Tax-Exempt Fund (the "Fund"), a series of the Trust. As detailed below, the Advisory Fees and Expenses Committee (the "Committee") and the Board met on multiple occasions to review and discuss, both among themselves and with the management team of the Investment Manager, materials provided by the Investment Manager before determining to approve the continuation of the Advisory Agreement.
In connection with their deliberations regarding the continuation of the Advisory Agreement, the Committee and the Board requested and evaluated materials from the Investment Manager regarding the Fund and the Advisory Agreement, and discussed these materials with representatives of the Investment Manager at the Committee meeting held on June 5, 2012 and at the Board meeting held on June 6, 2012. In addition, the Board considers matters bearing on the Advisory Agreement at most of its other meetings throughout the year and meets regularly with senior management of the Funds and the Investment Manager. Through the Board's Investment Oversight Committees, Trustees also meet with selected Fund portfolio managers and other investment personnel at various times throughout the year. The Committee and the Board also consulted with Fund counsel and with the Independent Trustees' independent legal counsel, who advised on the legal standard for consideration by the Board and otherwise assisted the Board in its deliberations. On June 5, 2012, the Committee recommended that the Board approve the continuation of the Advisory Agreement. On June 6, 2012, the Board, including the Independent Trustees, voting separately, unanimously approved the continuation of the Advisory Agreement for the Fund.
The Committee and the Board considered all information that they, their legal counsel, or the Investment Manager believed reasonably necessary to evaluate and to determine whether to approve the continuation of the Advisory Agreement. In their deliberations, the Trustees did not identify any particular information that was all-important or controlling, and individual Trustees may have attributed different weights to the various factors. The information and factors considered by the Committee and the Board in recommending for approval or approving the continuation of the Advisory Agreement for the Fund included the following:
• Information on the investment performance of the Fund relative to the performance of the Fund's benchmarks and the performance of a group of comparable mutual funds, as determined by an independent third-party data provider;
• Information on the Fund's advisory fees and total expenses, including information comparing the Fund's expenses to those of a group of comparable mutual funds, as determined by an independent third-party data provider;
• The Investment Manager's agreement to contractually limit or cap total operating expenses for the Fund so that total operating expenses (excluding certain fees and expenses, such as transaction costs and certain other investment related expenses, interest, taxes, acquired fund fees and expenses, and extraordinary expenses) would not exceed the median expenses of a group of comparable funds (as determined from time to time, generally annually, by an independent third-party data provider);
• The terms and conditions of the Advisory Agreement, including that the advisory fee rates payable by the Fund would not change;
• The terms and conditions of other agreements and arrangements with affiliates of the Investment Manager relating to the operations of the Fund, including the Administrative Services Agreement, the Distribution Agreement and the Transfer and Dividend Disbursing Agent Agreement, noting in the case of the Transfer and Dividend Disbursing Agent Agreement certain proposed changes to the fee rates payable thereunder;
• Descriptions of various functions performed by the Investment Manager under the Advisory Agreement, including portfolio management and portfolio trading practices;
• Information regarding the management fees and investment performance of any comparable portfolios of other clients of the Investment Manager, including institutional separate accounts; and
• The profitability to the Investment Manager and its affiliates from their relationships with the Fund.
Annual Report 2012
32
Columbia Connecticut Tax-Exempt Fund
Board Consideration and Approval of
Advisory Agreement (continued)
Nature, Extent and Quality of Services to be Provided under the Advisory Agreement
The Committee and the Board considered the nature, extent and quality of services provided to the Fund by the Investment Manager and its affiliates under the Advisory Agreement and under separate agreements for the provision of transfer agency and administrative services, and the resources dedicated to the Fund and the other Columbia Funds by the Investment Manager and its affiliates. The Committee and the Board considered, among other things, the Investment Manager's ability to attract, motivate and retain highly qualified research, advisory and supervisory investment professionals (including personnel and other resources, compensation programs for personnel involved in fund management, reputation and other attributes), the portfolio management services provided by those investment professionals, the quality of the Investment Manager's investment research capabilities and trade execution services, and the other resources that the Investment Manager devotes to the Fund. The Committee and the Board also considered the potential benefits to shareholders of investing in a mutual fund that is part of a fund complex offering exposure to a variety of asset classes and investment disciplines and providing a variety of fund and shareholder services.
The Committee and the Board also considered the professional experience and qualifications of the senior personnel of the Investment Manager. The Committee and the Board noted the compliance programs of and the compliance-related resources provided to the Fund by the Investment Manager and its affiliates, and considered the Investment Manager's ability to provide administrative services to the Fund pursuant to a separate administrative services agreement, including the Investment Manager's ability to coordinate the activities of the Fund's other service providers. After reviewing these and related factors, the Committee and the Board concluded, within the context of their overall conclusions, that the expected nature, extent and quality of the services to be provided to the Fund under the Advisory Agreement supported the continuation of such agreement.
Investment Performance
The Committee and the Board reviewed information about the performance of the Fund over various time periods, including performance information relative to benchmarks and information based on reports of an independent third-party data provider that compared the performance of the Fund to the performance of a group of comparable mutual funds. The Committee and the Board also reviewed a description of the third party's methodology for identifying the Fund's peer groups for purposes of performance and expense comparisons. In the case of each Fund whose performance lagged that of a relevant peer group for certain (although not necessarily all) periods, the Committee and the Board concluded that other factors relevant to performance were sufficient, in light of other considerations, to warrant continuation of the Fund's Advisory Agreement. Those factors varied from fund to fund, but included one or more of the following: (i) that the Fund's performance, although lagging in certain recent periods, was stronger over the longer term; (ii) that the underperformance was attributable, to a significant extent, to investment decisions that were reasonable and consistent with the Fund's investment strategy and policies and that the Fund was performing within a reasonable range of expectations, given those investment decisions, market conditions and the Fund's investment strategy; (iii) that the Fund's performance was competitive when compared to other relevant performance benchmarks or peer groups; and (iv) that the Investment Manager had taken or was taking steps designed to help improve the Fund's investment performance, including, but not limited to, replacing portfolio managers, enhancing the resources supporting the portfolio managers, or modifying investment strategies.
The Committee and the Board noted that, through December 31, 2011, the Fund's performance was in the first, ninety-ninth and first percentiles (where the best performance would be in the first percentile) of its category selected by an independent third-party data provider for the purposes of performance comparisons for the one-, three- and five- year periods, respectively.
The Committee and the Board also considered the Investment Manager's performance and reputation generally, the Investment Manager's historical responsiveness to Board concerns about performance and the Investment Manager's willingness to take steps intended to improve performance. After reviewing these and related factors, the Committee and the Board concluded, within the context of their overall conclusions regarding the Advisory Agreement, that the performance of the Fund and the Investment Manager was sufficient, in light of other considerations, to warrant the continuation of the Advisory Agreement.
Annual Report 2012
33
Columbia Connecticut Tax-Exempt Fund
Board Consideration and Approval of
Advisory Agreement (continued)
Investment Advisory Fee Rates and Other Expenses
The Committee and the Board considered the advisory fees to be charged to the Fund under the Advisory Agreement as well as the total expenses to be incurred by the Fund. In assessing the reasonableness of the fees under the Advisory Agreement, the Committee and the Board considered, among other information, the Fund's advisory fee and its expected total expense ratio as a percentage of average daily net assets. The Committee and the Board noted that the Fund's actual management fee and total net expense ratio are ranked in the first and third quintiles, respectively, against the Fund's expense universe as determined by an independent third-party data provider for purposes of expense comparison. The Committee and the Board also took into account the fee waiver and expense limitation arrangements agreed to by the Investment Manager, as noted above.
The Committee and the Board also considered the fact that the advisory fee rates payable by the Fund to the Investment Manager under the Advisory Agreement were the same as those currently paid by the Fund to the Investment Manager.
The Committee and the Board also received and considered information about the advisory fees charged by the Investment Manager to institutional separate accounts. In considering the fees charged to those accounts, the Committee and the Board took into account, among other things, the Investment Manager's representations about the differences between managing mutual funds as compared to other types of accounts, including differences in the services provided, differences in the risk profile of such business for the Investment Manager and the additional resources required to manage mutual funds effectively. In evaluating the Fund's advisory fees, the Committee and the Board also took into account the demands, complexity and quality of the investment management of the Fund.
After reviewing these and related factors, the Committee and the Board concluded, within the context of their overall conclusions, that the advisory fee rates and expenses of the Fund supported the continuation of the Advisory Agreement.
Costs of Services to be Provided and Profitability
The Committee and the Board also took note of the costs of the services provided (both on an absolute and relative basis) and the profitability to the Investment Manager and its affiliates in connection with their relationships with the Fund. In evaluating these considerations, the Committee and the Board took note of the advisory fees charged by the Investment Manager to other clients, including fees charged by the Investment Manager to any institutional separate account clients with similar investment strategies to those of the Fund.
The Committee and the Board also considered the compensation directly or indirectly received by the Investment Manager's affiliates in connection with their relationships with the Fund. The Committee and the Board reviewed information provided by management as to the profitability of the Investment Manager and its affiliates of their relationships with the Fund, and information about the allocation of expenses used to calculate profitability. When reviewing profitability, the Committee and the Board also considered court cases in which adviser profitability was an issue in whole or in part, the performance of the fund, the expense ratio of the fund, and the implementation of expense limitations with respect to the fund. The Committee and the Board also considered information provided by the Investment Manager regarding its financial condition and comparing its profitability to that of other asset management firms that are, or are subsidiaries of, publicly traded companies.
After reviewing these and related factors, the Committee and the Board concluded, within the context of their overall conclusions, that the profitability to the Investment Manager and its affiliates from their relationships with the Fund supported the continuation of the Advisory Agreement.
Economies of Scale
The Committee and the Board considered the potential existence of economies of scale in the provision by the Investment Manager of services to the Fund, to groups of related funds, and to the Investment Manager's investment advisory clients as a whole, and whether those economies of scale were shared with the Fund through breakpoints in investment advisory fees or other means, such as expense limitation arrangements and additional investments by the Investment Manager in investment, trading and compliance resources. The Committee and the Board noted that the investment advisory fee schedules for the Fund contained breakpoints that would reduce the fee rate on assets above specified threshold levels.
Annual Report 2012
34
Columbia Connecticut Tax-Exempt Fund
Board Consideration and Approval of
Advisory Agreement (continued)
In considering these issues, the Committee and the Board also considered the costs of the services provided (both on an absolute and relative basis) and the profitability to the Investment Manager and its affiliates from their relationships with the Fund, as discussed above. After reviewing these and related factors, the Committee and the Board concluded, within the context of their overall conclusions, that the extent to which economies of scale were expected to be shared with the Fund supported the continuation of the Advisory Agreement.
Other Benefits to the Investment Manager
The Committee and the Board received and considered information regarding "fall-out" or ancillary benefits received by the Investment Manager and its affiliates as a result of their relationships with the Fund, such as the engagement of the Investment Manager to provide administrative services to the Fund and the engagement of the Investment Manager's affiliates to provide distribution and transfer agency services to the Fund. The Committee and the Board considered that the Fund's distributor retains a portion of the distribution fees from the Fund and receives a portion of the sales charges on sales or redemptions of certain classes of shares of the Fund. The Committee and the Board also considered the benefits of research made available to the Investment Manager by reason of brokerage commissions generated by the Fund's securities transactions, and reviewed information about the Investment Manager's practices with respect to allocating portfolio brokerage for brokerage and research services. The Committee and the Board considered the possible conflicts of interest associated with certain fall-out or other ancillary benefits and the reporting, disclosure and other processes that would be in place to address such possible conflicts of interest. The Committee and the Board recognized that the Investment Manager's profitability would be somewhat lower without these benefits.
Conclusion
The Committee and the Board reviewed all of the above considerations in reaching their decisions to recommend or approve the continuation of the Advisory Agreement. No single item was identified as paramount or controlling, and individual Trustees may have attributed different weights to various factors. Based on their evaluation of all factors that they deemed to be material, including those factors described above, and assisted by the advice of independent legal counsel, the Board, including the Independent Trustees, voting separately, unanimously approved the continuation of the Advisory Agreement.
Annual Report 2012
35
This page intentionally left blank.
Annual Report 2012
36
Columbia Connecticut Tax-Exempt Fund
Important Information About This Report
Each fund mails one shareholder report to each shareholder address. If you would like more than one report, please call shareholder services at 800.345.6611 and additional reports will be sent to you.
The policy of the Board is to vote the proxies of the companies in which each fund holds investments consistent with the procedures as stated in the Statement of Additional Information (SAI). You may obtain a copy of the SAI without charge by calling 800.345.6611; contacting your financial intermediary; visiting columbiamanagement.com; or searching the website of the Securities and Exchange Commission (SEC) at sec.gov. Information regarding how each fund voted proxies relating to portfolio securities is filed with the SEC by August 31 for the most recent 12-month period ending June 30 of that year, and is available without charge by visiting columbiamanagement.com; or searching the website of the SEC at sec.gov.
Each fund files a complete schedule of portfolio holdings with the SEC for the first and third quarters of each fiscal year on Form N-Q. Each fund's Form N-Q is available on the SEC's website at sec.gov and may be reviewed and copied at the SEC's Public Reference Room in Washington, D.C. Information on the operation of the Public Reference Room may be obtained by calling 800.SEC.0330. Each fund's complete schedule of portfolio holdings, as filed on Form N-Q, can also be obtained without charge, upon request, by calling 800.345.6611.
Annual Report 2012
37

Columbia Connecticut Tax-Exempt Fund
P.O. Box 8081
Boston, MA 02266-8081
columbiamanagement.com
This information is for use with concurrent or prior delivery of a fund prospectus. Please read and consider the investment objectives, risks, charges and expenses for any fund carefully before investing. For a prospectus which contains this and other important information about the Fund go to columbiamanagement.com. The Fund is distributed by Columbia Management Investment Distributors, Inc., member FINRA, and managed by Columbia Management Investment Advisers, LLC.
© 2012 Columbia Management Investment Advisers, LLC. All rights reserved.
C-1011 D (12/12)
Annual Report
October 31, 2012

Columbia New York Tax-Exempt Fund
Not FDIC insured • No bank guarantee • May lose value
Columbia New York Tax-Exempt Fund
 Dear Shareholders,
Stocks rebound around the world
After a weak second quarter, U.S. stock market averages rebounded in the third quarter, erasing earlier losses and boosting year-to-date returns well into double digits. Welcome news from Europe and additional quantitative easing in the United States by the Federal Reserve Board helped bolster the rally. The Standard & Poor's 500 Index (S&P 500 Index) rose 6.35% (total return) for the quarter. The Dow Jones Industrial Average advanced 4.32% for the same period. From the beginning of the calendar year through September 30, 2012, the S&P 500 Index was up 16.44% (total return). And, as of the end of September, the S&P 500 Index stood at 1,440 — approximately 8% below its all-time high of 1,565 that was set on October 9, 2007.
Outside the United States, stock markets of both developed and emerging market economies rebounded, as measured in U.S. dollars. Investors responded favorably to the announcement of policy measures aimed to resolve the eurozone crisis, which could potentially have a favorable impact on growth in emerging market economies. A weaker dollar also benefited returns to U.S. investors.
Solid gains for fixed income
Within fixed income, investors appeared to be increasingly willing to take on risk as they abandoned higher quality sectors that dominated the performance rankings in the second quarter and favored riskier sectors, where yield spreads tightened by a significant margin. Fixed-income returns were strong, but unlike equities, they have been less volatile, accumulating steadily over the course of the year. Gains were the highest for high-yield and emerging market bonds. By contrast, government issued debt securities eked out smaller gains.
Stay on track with Columbia Management
Backed by more than 100 years of experience, Columbia Management is one of the nation's largest asset managers. At the heart of our success — and, most importantly, that of our investors — are highly talented industry professionals, brought together by a unique way of working. We are dedicated to helping you take advantage of today's opportunities and anticipate tomorrow's. We stay abreast of the latest investment trends and ideas, using our collective insight to evaluate events and transform them into solutions you can use.
Visit columbiamanagement.com for:
> The Columbia Management Perspectives blog, featuring timely posts by our investment teams
> Detailed up-to-date fund performance and portfolio information
> Economic analysis and market commentary
> Quarterly fund commentaries
> Columbia Management Investor, our award-winning quarterly newsletter for shareholders
Thank you for your continued support of the Columbia Funds. We look forward to serving your investment needs for many years to come.
Best Regards,

J. Kevin Connaughton
President, Columbia Funds
The S&P 500 Index, an unmanaged index, measures the performance of 500 widely held, large-capitalization U.S. stocks and is frequently used as a general measure of market performance. The Dow Jones Industrial Average is a price weighted average of 30 actively traded shares of blue chip US industrial corporations listed on the New York Stock Exchange. Indices are not available for investment, are not professionally managed and do not reflect sales charges, fees, brokerage commissions, taxes or other expenses of investing.
Investors should consider the investment objectives, risks, charges and expenses of a mutual fund carefully before investing. For a free prospectus, which contains this and other important information about a fund, visit columbiamanagement.com. The prospectus should be read carefully before investing.
Columbia Funds are distributed by Columbia Management Investment Distributors, Inc., member FINRA, and managed by Columbia Management Investment Advisers, LLC.
© 2012 Columbia Management Investment Advisers, LLC. All rights reserved.
Columbia New York Tax-Exempt Fund
Performance Overview | | | 2 | | |
Manager Discussion of Fund Performance | | | 4 | | |
Understanding Your Fund's Expenses | | | 6 | | |
Portfolio of Investments | | | 7 | | |
Statement of Assets and Liabilities | | | 15 | | |
Statement of Operations | | | 17 | | |
Statement of Changes in Net Assets | | | 18 | | |
Financial Highlights | | | 20 | | |
Notes to Financial Statements | | | 24 | | |
Report of Independent Registered
Public Accounting Firm | | | 30 | | |
Federal Income Tax Information | | | 31 | | |
Trustees and Officers | | | 32 | | |
Board Consideration and Approval of Advisory Agreement | | | 35 | | |
Important Information About This Report | | | 41 | | |
Fund Investment Manager
Columbia Management Investment
Advisers, LLC
225 Franklin Street
Boston, MA 02110
Fund Distributor
Columbia Management Investment
Distributors, Inc.
225 Franklin Street
Boston, MA 02110
Fund Transfer Agent
Columbia Management Investment
Services Corp.
P.O. Box 8081
Boston, MA 02266-8081
For more information about any of the funds, please visit columbiamanagement.com or call 800.345.6611. Customer Service Representatives are available to answer your questions Monday through Friday from 8 a.m. to 8 p.m. Eastern time.
The views expressed in this report reflect the current views of the respective parties. These views are not guarantees of future performance and involve certain risks, uncertainties and assumptions that are difficult to predict, so actual outcomes and results may differ significantly from the views expressed. These views are subject to change at any time based upon economic, market or other conditions and the respective parties disclaim any responsibility to update such views. These views may not be relied on as investment advice and, because investment decisions for a Columbia Fund are based on numerous factors, may not be relied on as an indication of trading intent on behalf of any particular Columbia Fund. References to specific securities should not be construed as a recommendation or investment advice.
Columbia New York Tax-Exempt Fund
Performance Summary
> Columbia New York Tax-Exempt Fund (the Fund) Class A shares returned 10.90% excluding sales charges for the 12-month period that ended October 31, 2012.
> The Fund outperformed its benchmarks, the broader Barclays Municipal Bond Index and the Barclays New York Municipal Bond Index, which returned 9.03% and 8.26%, respectively, for the same period, as well as the average return of the funds in its peer group, the Lipper New York Municipal Debt Funds Classification, which returned 9.94% for the same 12 months.
> The Fund's credit-quality and interest-rate positioning aided performance, as did security selection.
Average Annual Total Returns (%) (for period ended October 31, 2012)
| | Inception | | 1 Year | | 5 Years | | 10 Years | |
Class A | | 09/26/86 | | | | | | | | | | | | | |
Excluding sales charges | | | | | | | 10.90 | | | | 6.16 | | | | 5.18 | | |
Including sales charges | | | | | | | 5.67 | | | | 5.14 | | | | 4.67 | | |
Class B | | 08/04/92 | | | | | | | | | | | | | |
Excluding sales charges | | | | | | | 10.08 | | | | 5.37 | | | | 4.40 | | |
Including sales charges | | | | | | | 5.08 | | | | 5.05 | | | | 4.40 | | |
Class C | | 08/01/97 | | | | | | | | | | | | | |
Excluding sales charges | | | | | | | 10.41 | | | | 5.69 | | | | 4.71 | | |
Including sales charges | | | | | | | 9.41 | | | | 5.69 | | | | 4.71 | | |
Class Z* | | 09/01/11 | | | 11.19 | | | | 6.23 | | | | 5.21 | | |
Barclays Municipal Bond Index | | | | | | | 9.03 | | | | 6.02 | | | | 5.24 | | |
Barclays New York Municipal Bond Index | | | | | | | 8.26 | | | | 5.91 | | | | 5.14 | | |
Lipper New York Municipal Debt Funds Classification | | | | | | | 9.94 | | | | 5.10 | | | | 4.53 | | |
Returns for Class A are shown with and without the maximum initial sales charge of 4.75%. Returns for Class B are shown with and without the applicable contingent deferred sales charge (CDSC) of 5.00% in the first year, declining to 1.00% in the sixth year and eliminated thereafter. Returns for Class C are shown with and without the 1.00% CDSC for the first year only. The Fund's other classes are not subject to sales charges and have limited eligibility. Please see the Fund's prospectuses for details. Performance for different share classes will vary based on differences in sales charges and fees associated with each class. All results shown assume reinvestment of distributions during the period. Returns do not reflect the deduction of taxes that a shareholder may pay on Fund distributions or on the redemption of Fund shares. Performance results reflect the effect of any fee waivers or reimbursements of Fund expenses by Columbia Management Investment Advisers, LLC and/or any of its affiliates. Absent these fee waivers or expense reimbursement arrangements, performance results would have been lower.
The performance information shown represents past performance and is not a guarantee of future results. The investment return and principal value of your investment will fluctuate so that your shares, when redeemed, may be worth more or less than their original cost. Current performance may be lower or higher than the performance information shown. You may obtain performance information current to the most recent month-end by contacting your financial intermediary, visiting columbiamanagement.com or calling 800.345.6611.
*The returns shown for periods prior to the share class inception date (including returns since inception if shown, which are since Fund inception) include the returns of the Fund's oldest share class. These returns are adjusted to reflect any higher class-related operating expenses of the newer share classes, as applicable. Please visit columbiamanagement.com/mutual-funds/appended-performance for more information.
The Barclays Municipal Bond Index is an unmanaged index considered representative of the broad market for investment-grade, tax-exempt bonds with a maturity of at least one year.
The Barclays New York Municipal Bond Index is a market-capitalization-weighted index of New York investment grade bonds with maturity of one year or more.
The Lipper New York Municipal Debt Funds Classification is a calculation of average total returns of mutual funds that limit assets to those securities exempt from taxation in the state of New York.
Indices are not available for investment, are not professionally managed and do not reflect sales charges, fees, brokerage commissions, taxes or other expenses of investing. Securities in the Fund may not match those in an index.
Annual Report 2012
2
Columbia New York Tax-Exempt Fund
Performance Overview (continued)
Performance of a Hypothetical $10,000 Investment (November 1, 2002 – October 31, 2012)
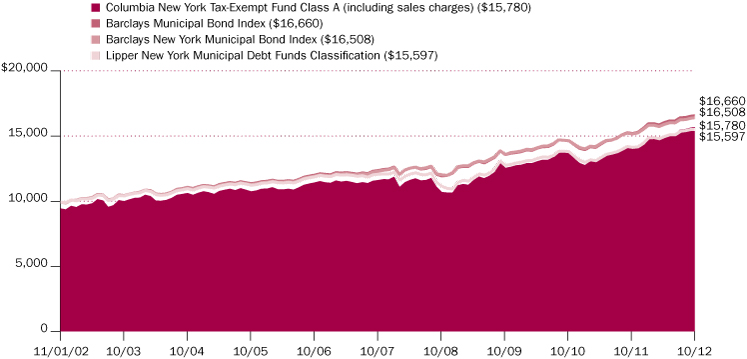
The chart above shows the change in value of a hypothetical $10,000 investment in Class A shares of Columbia New York Tax-Exempt Fund during the stated time period, and does not reflect the deduction of taxes that a shareholder may pay on Fund distributions or on the redemption of Fund shares.
Annual Report 2012
3
Columbia New York Tax-Exempt Fund
Manager Discussion of Fund Performance
For the 12-month period that ended October 31, 2012, the Fund's Class A shares returned 10.90%, beating the broader Barclays Municipal Bond Index and the Barclays New York Municipal Bond Index, which returned 9.03% and 8.26%, respectively. The Fund also outperformed the 9.94% average return of its peer group, the Lipper New York Municipal Debt Funds Classification. Overweights in longer-maturity, more interest-rate sensitive issues and higher-yielding, lower-quality investment-grade bonds helped relative results, as did security selection.
Municipal Bonds Rally as Yields Fall
Market conditions were favorable for municipal bonds over the 12-month period. Although sovereign debt problems in Europe created global economic uncertainty, the U.S. economic outlook improved, with modest gains in employment, manufacturing and housing by period end. Tax collections rose in many states, while governments continued to make difficult budget decisions to improve their fiscal outlooks. Investor demand for tax-exempt securities remained strong, helping to drive municipal bond yields down and prices up across all maturities. With interest rates declining to near all-time lows, investors sought the higher yields offered by bonds with maturities of 15 or more years and those with credit ratings of A or lower. Longer-term and lower-quality issues outperformed shorter-term and higher quality bonds by a sizable margin. Top performing sectors included industrial development/pollution control revenue, hospitals and leasing, all of which posted returns of 10% or more.
Gains from Long Maturity and Lower Credit Quality Bias
The Fund had an above-average sensitivity to interest rate changes with an overweight in longer-maturity bonds, which saw the biggest drop in yields and most sizable price increases across the maturity spectrum. In addition, long-term bond prices gained from a confluence of strong demand and decreased supply, which occurred as many issuers retired older, longer-maturity debt with higher interest costs and refunded with new lower-rate, intermediate-maturity securities. An overweight in lower quality investment grade issues, notably hospital bonds, further aided results as credit spreads — the difference between yields on high- and low-quality bonds — tightened. Strong security selection in the hospital, transportation, education and electric sectors also helped results. By contrast, an overweight in housing bonds, underweights in the strong-performing tobacco and industrial development revenue/pollution control revenue sectors and a small cash position detracted from relative returns.
Shifts in Sector Weights and Credit Quality
To help increase the Fund's yield and total return potential, we boosted exposure to lower quality A rated securities and trimmed higher quality AA rated issues. In particular, we added to hospitals, special tax and transportation sectors, while we reduced stakes in state-appropriated debt and higher quality pre-refunded debt. Pre-refunding occurs when an issuer sells a new bond at a lower rate to pay off old, higher-rate issues. The proceeds from the sale are invested into an escrow account (typically short-term government securities), which generates interest that is used to pay the interest on the original bonds until they are called or mature.
Portfolio Management
Catherine Stienstra
Quality Breakdown (%)
(at October 31, 2012) | |
AAA rating | | | 3.9 | | |
AA rating | | | 41.9 | | |
A rating | | | 34.9 | | |
BBB rating | | | 13.2 | | |
Non-investment grade | | | 2.1 | | |
Not rated | | | 4.0 | | |
Total | | | 100.0 | | |
Percentages indicated are based upon total fixed income securities (excluding Money Market Funds).
Bond ratings apply to the underlying holdings of the Fund and not the Fund itself and are divided into categories ranging from AAA (highest) to D (lowest), and are subject to change. The ratings shown are determined by using the middle rating of Moody's, S&P, and Fitch after dropping the highest and lowest available ratings. When a rating from only two agencies is available, the lower rating is used. When a rating from only one agency is available, that rating is used. When a bond is not rated by any of these agencies, it is designated as Not rated. Credit ratings are subjective opinions and not statements of fact.
Annual Report 2012
4
Columbia New York Tax-Exempt Fund
Manager Discussion of Fund Performance (continued)
Looking Ahead
Going forward, we will be closely monitoring what happens with the automatic federal spending cuts and tax increases scheduled for January 1, 2013. An increase in the taxes paid by high-income earners, for example, could boost demand for municipal bonds, while potential elimination of the sector's tax-exempt status could pressure municipal returns. As long as credit spreads are expected to tighten and short-term interest rates are projected to remain low, the Fund will likely maintain a longer-maturity and lower quality bias within the investment grade universe.
At period end, New York's general obligation debt carried a Aa2 credit rating from Moody's and a AA rating from Standard & Poor's. In late August, Standard & Poor's revised its outlook for New York to "positive," up from "stable," stirring hope of a future upgrade. The revision reflected an improved fiscal outlook for the state, thanks to spending cuts, a new tax on millionaires, a hike in public college tuitions and slowly improving tax revenues. However, New York's economy could face new pressures if financial regulatory reform leads to layoffs on Wall Street, the European banking crisis spreads to U.S. banks or the federal government slashes defense spending. Our expectation is that credit downgrades could continue to outpace upgrades, but the rate of defaults could be relatively benign. As always, the Fund's security selection and sector positioning will rely heavily on the proprietary credit research generated by our in-house team of analysts.
Annual Report 2012
5
Columbia New York Tax-Exempt Fund
Understanding Your Fund's Expenses
(Unaudited)
As an investor, you incur two types of costs. There are transaction costs, which generally include sales charges on purchases and may include redemption fees. There are also ongoing costs, which generally include management fees, distribution and service (Rule 12b-1) fees, and other fund expenses. The following information is intended to help you understand your ongoing costs (in dollars) of investing in the Fund and to help you compare these costs with the ongoing costs of investing in other mutual funds.
Analyzing Your Fund's Expenses
To illustrate these ongoing costs, we have provided examples and calculated the expenses paid by investors in each share class of the Fund during the period. The actual and hypothetical information in the table is based on an initial investment of $1,000 at the beginning of the period indicated and held for the entire period. Expense information is calculated two ways and each method provides you with different information. The amount listed in the "Actual" column is calculated using the Fund's actual operating expenses and total return for the period. You may use the Actual information, together with the amount invested, to estimate the expenses that you paid over the period. Simply divide your account value by $1,000 (for example, an $8,600 account value divided by $1,000 = 8.6), then multiply the results by the expenses paid during the period under the Actual column. The amount listed in the "Hypothetical" column assumes a 5% annual rate of return before expenses (which is not the Fund's actual return) and then applies the Fund's actual expense ratio for the period to the hypothetical return. You should not use the hypothetical account values and expenses to estimate either your actual account balance at the end of the period or the expenses you paid during the period. See "Compare With Other Funds" below for details on how to use the hypothetical data.
Compare With Other Funds
Since all mutual funds are required to include the same hypothetical calculations about expenses in shareholder reports, you can use this information to compare the ongoing cost of investing in the Fund with other funds. To do so, compare the hypothetical example with the 5% hypothetical examples that appear in the shareholder reports of other funds. As you compare hypothetical examples of other funds, it is important to note that hypothetical examples are meant to highlight the ongoing costs of investing in a fund only and do not reflect any transaction costs, such as sales charges, or redemption or exchange fees. Therefore, the hypothetical calculations are useful in comparing ongoing costs only, and will not help you determine the relative total costs of owning different funds. If transaction costs were included in these calculations, your costs would be higher.
May 1, 2012 – October 31, 2012
| | Account Value at the Beginning
of the Period ($) | | Account Value at the End of the
Period ($) | | Expenses Paid During the
Period ($) | | Fund's Annualized
Expense Ratio (%) | |
| | Actual | | Hypothetical | | Actual | | Hypothetical | | Actual | | Hypothetical | | Actual | |
Class A | | | 1,000.00 | | | | 1,000.00 | | | | 1,045.20 | | | | 1,021.17 | | | | 4.06 | | | | 4.01 | | | | 0.79 | | |
Class B | | | 1,000.00 | | | | 1,000.00 | | | | 1,041.20 | | | | 1,017.39 | | | | 7.90 | | | | 7.81 | | | | 1.54 | | |
Class C | | | 1,000.00 | | | | 1,000.00 | | | | 1,042.80 | | | | 1,018.90 | | | | 6.37 | | | | 6.29 | | | | 1.24 | | |
Class Z | | | 1,000.00 | | | | 1,000.00 | | | | 1,046.60 | | | | 1,022.42 | | | | 2.78 | | | | 2.75 | | | | 0.54 | | |
Expenses paid during the period are equal to the annualized expense ratio for each class as indicated above, multiplied by the average account value over the period and then multiplied by the number of days in the Fund's most recent fiscal half year and divided by 366.
Expenses do not include fees and expenses incurred indirectly by the Fund from the underlying funds in which the Fund may invest (also referred to as "acquired funds"), including affiliated and non-affiliated pooled investment vehicles (including mutual funds and exchange-traded funds).
Had Columbia Management Investment Advisers, LLC and/or certain of its affiliates not waived/reimbursed certain fees and expenses, account value at the end of the period would have been reduced.
Annual Report 2012
6
Columbia New York Tax-Exempt Fund
Portfolio of Investments
October 31, 2012
(Percentages represent value of investments compared to net assets)
Municipal Bonds 95.2%
Issue
Description | | Coupon
Rate | | Principal
Amount ($) | | Value ($) | |
Air Transportation 4.1% | |
New York City Industrial Development Agency(a)
Refunding Revenue Bonds
TRIPS
Senior Series 2012A AMT
07/01/28 | | | 5.000 | % | | | 2,000,000 | | | | 2,121,040 | | |
Revenue Bonds
Terminal One Group Association Project
Series 2005 AMT
01/01/15 | | | 5.500 | % | | | 1,500,000 | | | | 1,628,745 | | |
New York City Industrial Development Agency(a)(b)
Revenue Bonds
Terminal One Group Association Project
Series 2005 AMT
01/01/24 | | | 5.500 | % | | | 2,000,000 | | | | 2,139,880 | | |
Port Authority of New York & New Jersey
Revenue Bonds
JFK International Air Terminal
Series 2010
12/01/42 | | | 6.000 | % | | | 2,000,000 | | | | 2,333,980 | | |
Total | | | | | | | 8,223,645 | | |
Assisted Living 1.2% | |
Huntington Housing Authority
Revenue Bonds
Gurwin Jewish Senior Residences
Series 1999A
05/01/19 | | | 5.875 | % | | | 1,140,000 | | | | 1,141,755 | | |
Mount Vernon Industrial Development Agency
Revenue Bonds
Wartburg Senior Housing, Inc. - Meadowview
Series 1999
06/01/19 | | | 6.150 | % | | | 695,000 | | | | 695,980 | | |
06/01/29 | | | 6.200 | % | | | 615,000 | | | | 615,449 | | |
Total | | | | | | | 2,453,184 | | |
Disposal 0.3% | |
Seneca County Industrial Development Agency
Revenue Bonds
Seneca Meadows, Inc. Project
Series 2005 AMT(a)(b)(c)
10/01/35 | | | 6.625 | % | | | 500,000 | | | | 505,915 | | |
Higher Education 14.9% | |
Dutchess County Local Development Corp.
Refunding Revenue Bonds
Marist College Project
Series 2012A
07/01/21 | | | 5.000 | % | | | 675,000 | | | | 814,522 | | |
Geneva Development Corp.
Refunding Revenue Bonds
Hobart & William Smith College
Series 2012
09/01/25 | | | 5.000 | % | | | 295,000 | | | | 350,439 | | |
Municipal Bonds (continued)
Issue
Description | | Coupon
Rate | | Principal
Amount ($) | | Value ($) | |
Nassau County Industrial Development Agency
Refunding Revenue Bonds
New York Institute of Technology Project
Series 2000A
03/01/26 | | | 4.750 | % | | | 1,210,000 | | | | 1,326,172 | | |
New York City Trust for Cultural Resources
Revenue Bonds
01/01/34 | | | 5.000 | % | | | 375,000 | | | | 438,818 | | |
Revenue Bonds
Juilliard School
Series 2009A
01/01/39 | | | 5.000 | % | | | 500,000 | | | | 577,065 | | |
New York State Dormitory Authority
Revenue Bonds
Consolidated City University System
Series 1993A
07/01/13 | | | 5.750 | % | | | 820,000 | | | | 849,258 | | |
Consolidated City University System 5th General Resolution
Series 2008B
07/01/27 | | | 5.000 | % | | | 1,000,000 | | | | 1,129,600 | | |
Cornell University
Series 2006A
07/01/31 | | | 5.000 | % | | | 1,000,000 | | | | 1,131,860 | | |
Series 2009A
07/01/27 | | | 5.000 | % | | | 1,000,000 | | | | 1,173,730 | | |
07/01/39 | | | 5.000 | % | | | 500,000 | | | | 572,540 | | |
Culinary Institute of America
Series 2012
07/01/34 | | | 5.000 | % | | | 350,000 | | | | 385,182 | | |
Manhattan Marymount College
Series 2009
07/01/29 | | | 5.250 | % | | | 1,500,000 | | | | 1,605,060 | | |
Mount Sinai School of Medicine
Series 2009
07/01/39 | | | 5.125 | % | | | 1,000,000 | | | | 1,105,850 | | |
New York University-Independent School District
Series 2001-1 (AMBAC)
07/01/40 | | | 5.500 | % | | | 1,000,000 | | | | 1,365,000 | | |
Pratt Institute
Series 2009C (AGM)
07/01/39 | | | 5.125 | % | | | 1,000,000 | | | | 1,102,710 | | |
Rochester Institute of Technology
Series 2008A
07/01/33 | | | 6.000 | % | | | 1,000,000 | | | | 1,176,880 | | |
St. John's University
Series 2007A (NPFGC)
07/01/32 | | | 5.250 | % | | | 1,000,000 | | | | 1,100,460 | | |
Series 2007C (NPFGC)
07/01/26 | | | 5.250 | % | | | 1,205,000 | | | | 1,519,493 | | |
Series 2012A
07/01/27 | | | 5.000 | % | | | 240,000 | | | | 284,213 | | |
State University Dormitory Facilities
Series 2011A
07/01/31 | | | 5.000 | % | | | 1,000,000 | | | | 1,177,480 | | |
Teacher's College
Series 2009
03/01/39 | | | 5.500 | % | | | 500,000 | | | | 565,125 | | |
The accompanying Notes to Financial Statements are an integral part of this statement.
Annual Report 2012
7
Columbia New York Tax-Exempt Fund
Portfolio of Investments (continued)
October 31, 2012
Municipal Bonds (continued)
Issue
Description | | Coupon
Rate | | Principal
Amount ($) | | Value ($) | |
The New School
Series 2010
07/01/40 | | | 5.500 | % | | | 1,500,000 | | | | 1,719,660 | | |
University of Rochester
Series 2009A
07/01/39 | | | 5.125 | % | | | 2,250,000 | | | | 2,531,070 | | |
Yeshiva University
Series 2001 (AMBAC)
07/01/30 | | | 5.000 | % | | | 75,000 | | | | 75,120 | | |
New York State Dormitory Authority(d)
Revenue Bonds
NYSARC, Inc.
Series 2012A
07/01/22 | | | 5.000 | % | | | 890,000 | | | | 1,073,651 | | |
Niagara Area Development Corp.
Revenue Bonds
Niagra University Project
Series 2012A
05/01/35 | | | 5.000 | % | | | 500,000 | | | | 549,145 | | |
Seneca County Industrial Development Agency
Revenue Bonds
New York Chiropractic College
Series 2007
10/01/27 | | | 5.000 | % | | | 750,000 | | | | 794,130 | | |
St. Lawrence County Industrial Development Agency
Revenue Bonds
Clarkson University Project
Series 2007
07/01/31 | | | 5.000 | % | | | 1,000,000 | | | | 1,070,240 | | |
Town of Hempstead Local Development Corp.
Revenue Bonds
Molloy College Project
Series 2009
07/01/39 | | | 5.750 | % | | | 1,000,000 | | | | 1,142,280 | | |
Yonkers Industrial Development Agency
Revenue Bonds
Sarah Lawrence College Project
Series 2001A
06/01/29 | | | 6.000 | % | | | 1,000,000 | | | | 1,147,100 | | |
Total | | | | | | | 29,853,853 | | |
Hospital 19.2% | |
Albany Industrial Development Agency
Revenue Bonds
St. Peters Hospital Project
Series 2008A
11/15/27 | | | 5.250 | % | | | 2,000,000 | | | | 2,237,860 | | |
Build NYC Resource Corp.
Revenue Bonds
Royal Charter Properties
Series 2012 (AGM)
12/15/32 | | | 4.750 | % | | | 2,000,000 | | | | 2,160,080 | | |
Municipal Bonds (continued)
Issue
Description | | Coupon
Rate | | Principal
Amount ($) | | Value ($) | |
Monroe County Industrial Development Corp.
Revenue Bonds
Unity Hospital-Rochester Project
Series 2010 (FHA)
08/15/35 | | | 5.750 | % | | | 2,000,000 | | | | 2,440,260 | | |
New York State Dormitory Authority
Revenue Bonds
Kaleida Health
Series 2006 (FHA)
02/15/35 | | | 4.700 | % | | | 1,000,000 | | | | 1,041,250 | | |
Memorial Sloan-Kettering Cancer Center
Series 2012
07/01/34 | | | 5.000 | % | | | 1,470,000 | | | | 1,716,872 | | |
Mount Sinai Hospital
Series 2010A
07/01/26 | | | 5.000 | % | | | 2,275,000 | | | | 2,574,481 | | |
Series 2011A
07/01/41 | | | 5.000 | % | | | 2,000,000 | | | | 2,181,880 | | |
NYU Hospital Center
Series 2007B
07/01/37 | | | 5.625 | % | | | 1,000,000 | | | | 1,098,390 | | |
New York Hospital Medical Center
Series 2007 (FHA)
02/15/37 | | | 4.750 | % | | | 975,000 | | | | 1,013,249 | | |
New York University Hospital Center
Series 2006A
07/01/20 | | | 5.000 | % | | | 500,000 | | | | 558,325 | | |
Series 2007B
07/01/24 | | | 5.250 | % | | | 640,000 | | | | 701,664 | | |
Series 2011A
07/01/31 | | | 5.750 | % | | | 800,000 | | | | 940,656 | | |
North Shore Long Island Jewish
Series 2009A
05/01/37 | | | 5.500 | % | | | 2,000,000 | | | | 2,288,200 | | |
North Shore-Long Island Jewish
Series 2011A
05/01/41 | | | 5.000 | % | | | 1,500,000 | | | | 1,659,540 | | |
North Shore-Long Island Jewish Obligation Group
Series 2007A
05/01/32 | | | 5.000 | % | | | 1,000,000 | | | | 1,069,260 | | |
Orange Regional Medical Center
Series 2008
12/01/29 | | | 6.125 | % | | | 1,900,000 | | | | 2,119,279 | | |
Sloan-Kettering Memorial Center
Series 2006-1
07/01/35 | | | 5.000 | % | | | 1,000,000 | | | | 1,105,290 | | |
University of Rochester
Series 2007B
07/01/27 | | | 5.000 | % | | | 1,000,000 | | | | 1,127,880 | | |
Vassar Brothers Hospital
Series 1997 (AGM)
07/01/25 | | | 5.375 | % | | | 1,500,000 | | | | 1,505,415 | | |
Saratoga County Industrial Development Agency
Revenue Bonds
Saratoga Hospital Project
Series 2007B
12/01/32 | | | 5.250 | % | | | 500,000 | | | | 530,835 | | |
The accompanying Notes to Financial Statements are an integral part of this statement.
Annual Report 2012
8
Columbia New York Tax-Exempt Fund
Portfolio of Investments (continued)
October 31, 2012
Municipal Bonds (continued)
Issue
Description | | Coupon
Rate | | Principal
Amount ($) | | Value ($) | |
Suffolk County Economic Development Corp.
Revenue Bonds
Catholic Health Services
Series 2011
07/01/28 | | | 5.000 | % | | | 3,500,000 | | | | 4,004,735 | | |
Westchester County Healthcare Corp.
Revenue Bonds
Senior Lien
Series 2010C-2
11/01/37 | | | 6.125 | % | | | 1,850,000 | | | | 2,200,520 | | |
Series 2011A
11/01/30 | | | 5.000 | % | | | 2,000,000 | | | | 2,223,380 | | |
Total | | | | | | | 38,499,301 | | |
Human Service Provider 0.5% | |
Dutchess County Local Development Corp.
Revenue Bonds
Anderson Center Services, Inc. Project
Series 2010
10/01/30 | | | 6.000 | % | | | 1,000,000 | | | | 1,058,640 | | |
Independent Power 0.5% | |
Suffolk County Industrial Development Agency
Revenue Bonds
Nissequogue Cogen Partners Facility
Series 1998 AMT(a)
01/01/23 | | | 5.500 | % | | | 1,000,000 | | | | 1,000,060 | | |
Investor Owned 0.7% | |
New York State Energy Research & Development Authority
Revenue Bonds
Series 1993(b)
04/01/20 | | | 12.079 | % | | | 1,500,000 | | | | 1,508,310 | | |
Local Appropriation 1.7% | |
Hudson Yards Infrastructure Corp.
Revenue Bonds
Series 2011A
02/15/47 | | | 5.750 | % | | | 2,000,000 | | | | 2,361,360 | | |
New York State Dormitory Authority
Revenue Bonds
Capital Appreciation-Court Facilities
Series 1998(e)
08/01/19 | | | 0.000 | % | | | 1,200,000 | | | | 1,079,676 | | |
Total | | | | | | | 3,441,036 | | |
Local General Obligation 3.8% | |
City of New York
Unlimited General Obligation Bonds
Series 2010B
08/01/21 | | | 5.000 | % | | | 500,000 | | | | 610,460 | | |
Subordinated Series 2009I-1
04/01/27 | | | 5.125 | % | | | 1,500,000 | | | | 1,796,925 | | |
Municipal Bonds (continued)
Issue
Description | | Coupon
Rate | | Principal
Amount ($) | | Value ($) | |
City of Syracuse
Unlimited General Obligation Bonds
Airport Terminal Security Access Improvement
Series 2011 AMT(a)
11/01/36 | | | 5.000 | % | | | 1,750,000 | | | | 1,892,170 | | |
County of Monroe
Unlimited General Obligation Refunding & Public Improvement Bonds
Series 1996 (NPFGC)
03/01/15 | | | 6.000 | % | | | 1,250,000 | | | | 1,371,975 | | |
Mount Sinai Union Free School District
Unlimited General Obligation Refunding Bonds
Series 1992 (AMBAC)
02/15/19 | | | 6.200 | % | | | 1,005,000 | | | | 1,304,781 | | |
Sullivan West Central School District
Unlimited General Obligation Refunding Bonds
Series 2012
04/15/24 | | | 5.000 | % | | | 500,000 | | | | 620,055 | | |
Total | | | | | | | 7,596,366 | | |
Multi-Family 2.1% | |
Housing Development Corp.
Revenue Bonds
Gateway Apartments
Series 2009A
09/15/25 | | | 4.500 | % | | | 165,000 | | | | 176,883 | | |
Series 2009C-1
11/01/34 | | | 5.500 | % | | | 500,000 | | | | 551,125 | | |
Series 2009M
11/01/45 | | | 5.150 | % | | | 1,250,000 | | | | 1,341,175 | | |
Onondaga Civic Development Corp.
Revenue Bonds
Upstate Properties Development, Inc.
Series 2011
12/01/41 | | | 5.250 | % | | | 1,945,000 | | | | 2,159,864 | | |
Total | | | | | | | 4,229,047 | | |
Municipal Power 2.2% | |
Long Island Power Authority
Revenue Bonds
Series 2008A
05/01/33 | | | 6.000 | % | | | 1,000,000 | | | | 1,206,780 | | |
Series 2009A
04/01/23 | | | 5.000 | % | | | 750,000 | | | | 885,360 | | |
Series 2012A
09/01/37 | | | 5.000 | % | | | 2,000,000 | | | | 2,274,440 | | |
Total | | | | | | | 4,366,580 | | |
Nursing Home 0.4% | |
Amherst Industrial Development Agency
Revenue Bonds
Beechwood Health Care Center, Inc.
Series 2007
01/01/40 | | | 5.200 | % | | | 750,000 | | | | 721,672 | | |
The accompanying Notes to Financial Statements are an integral part of this statement.
Annual Report 2012
9
Columbia New York Tax-Exempt Fund
Portfolio of Investments (continued)
October 31, 2012
Municipal Bonds (continued)
Issue
Description | | Coupon
Rate | | Principal
Amount ($) | | Value ($) | |
Other Bond Issue 0.3% | |
Westchester County Industrial Development Agency
Revenue Bonds
Guiding Eyes for the Blind
Series 2004
08/01/24 | | | 5.375 | % | | | 550,000 | | | | 577,198 | | |
Other Industrial Development Bond 2.3% | |
New York State Energy Research & Development Authority
Revenue Bonds
Brooklyn Union Gas Co. Project
Series 1996 (NPFGC)
01/01/21 | | | 5.500 | % | | | 2,000,000 | | | | 2,007,560 | | |
Onondaga County Industrial Development Agency
Revenue Bonds
Bristol-Meyers Squibb Co. Project
Series 1994 AMT(a)
03/01/24 | | | 5.750 | % | | | 2,000,000 | | | | 2,525,780 | | |
Total | | | | | | | 4,533,340 | | |
Pool/Bond Bank 3.6% | |
New York State Dormitory Authority
Revenue Bonds
School Districts Financing Program
Series 2009C (AGM)
10/01/36 | | | 5.125 | % | | | 1,000,000 | | | | 1,121,200 | | |
New York State Environmental Facilities Corp.
Revenue Bonds
Revolving Funds-Pooled Financing
Series 2005B
04/15/35 | | | 5.500 | % | | | 1,000,000 | | | | 1,437,290 | | |
Series 2009A
06/15/34 | | | 5.000 | % | | | 4,000,000 | | | | 4,755,840 | | |
Total | | | | | | | 7,314,330 | | |
Ports 3.5% | |
Port Authority of New York & New Jersey
Revenue Bonds
Consolidated 85th
Series 1993
03/01/28 | | | 5.375 | % | | | 2,000,000 | | | | 2,518,960 | | |
Consolidated 93rd
Series 1994
06/01/94 | | | 6.125 | % | | | 2,250,000 | | | | 2,805,975 | | |
Port Authority of New York & New Jersey(a)
Revenue Bonds
Consolidated 143rd
Series 2006 (AGM) AMT
10/01/21 | | | 5.000 | % | | | 1,000,000 | | | | 1,109,110 | | |
Consolidated 147th
Series 2007 (NPFGC/FGIC) AMT
10/15/26 | | | 5.000 | % | | | 500,000 | | | | 543,585 | | |
Total | | | | | | | 6,977,630 | | |
Municipal Bonds (continued)
Issue
Description | | Coupon
Rate | | Principal
Amount ($) | | Value ($) | |
Prep School 0.7% | |
New York City Industrial Development Agency
Revenue Bonds
Marymont School of New York Project
Series 2001 (ACA)
09/01/21 | | | 5.125 | % | | | 575,000 | | | | 581,825 | | |
New York State Dormitory Authority
Revenue Bonds
Convent-Sacred Heart
Series 2011 (AGM)
11/01/35 | | | 5.625 | % | | | 750,000 | | | | 891,173 | | |
Total | | | | | | | 1,472,998 | | |
Recreation 1.6% | |
Build NYC Resource Corp.
Revenue Bonds
YMCA of Greater NY Project
Series 2012
08/01/32 | | | 5.000 | % | | | 500,000 | | | | 567,670 | | |
New York City Industrial Development Agency
Revenue Bonds
Queens Baseball Stadium Pilot
Series 2006 (AMBAC)
01/01/24 | | | 5.000 | % | | | 500,000 | | | | 518,990 | | |
Yankee Stadium Pilot
Series 2009 (AGM)
03/01/49 | | | 7.000 | % | | | 250,000 | | | | 306,503 | | |
New York City Trust for Cultural Resources
Refunding Revenue Bonds
Museum of Modern Art
Series 2008-1A
04/01/31 | | | 5.000 | % | | | 750,000 | | | | 867,022 | | |
Revenue Bonds
Lincoln Center
Series 2008C
12/01/18 | | | 5.250 | % | | | 750,000 | | | | 909,397 | | |
Total | | | | | | | 3,169,582 | | |
Refunded/Escrowed 3.0% | |
Greece Central School District
Unlimited General Obligation Bonds
Series 1992 (FGIC)
06/15/16 | | | 6.000 | % | | | 500,000 | | | | 599,825 | | |
New York State Dormitory Authority
Revenue Bonds
Brooklyn Law School
Series 2003B (XLCA)
07/01/30 | | | 5.125 | % | | | 2,000,000 | | | | 2,063,380 | | |
Triborough Bridge & Tunnel Authority
Prerefunded 01/01/22 Revenue Bonds
General Purpose
Series 1999B
01/01/30 | | | 5.500 | % | | | 1,800,000 | | | | 2,371,122 | | |
The accompanying Notes to Financial Statements are an integral part of this statement.
Annual Report 2012
10
Columbia New York Tax-Exempt Fund
Portfolio of Investments (continued)
October 31, 2012
Municipal Bonds (continued)
Issue
Description | | Coupon
Rate | | Principal
Amount ($) | | Value ($) | |
Refunding Revenue Bonds
Series 2002B
11/15/29 | | | 5.125 | % | | | 1,000,000 | | | | 1,001,900 | | |
Total | | | | | | | 6,036,227 | | |
Retirement Communities 2.6% | |
Broome County Industrial Development Agency
Revenue Bonds
Good Shepard Village
Series 2008A
07/01/28 | | | 6.750 | % | | | 500,000 | | | | 525,440 | | |
07/01/40 | | | 6.875 | % | | | 250,000 | | | | 260,838 | | |
New York State Dormitory Authority
Revenue Bonds
Miriam Osborn Memorial Home Association
Series 2012
07/01/29 | | | 5.000 | % | | | 1,000,000 | | | | 1,091,880 | | |
Suffolk County Economic Development Corp.
Refunding Revenue Bonds
Peconic Landing Southold
Series 2010
12/01/40 | | | 6.000 | % | | | 1,225,000 | | | | 1,366,757 | | |
Suffolk County Industrial Development Agency
Refunding Revenue Bonds
Jeffersons Ferry Project
Series 2006
11/01/28 | | | 5.000 | % | | | 1,335,000 | | | | 1,369,830 | | |
Ulster County Industrial Development Agency
Revenue Bonds
Series 2007A
09/15/42 | | | 6.000 | % | | | 1,000,000 | | | | 697,440 | | |
Total | | | | | | | 5,312,185 | | |
Single Family 0.9% | |
New York Mortgage Agency(a)
Revenue Bonds
Homeowner Mortgage
Series 1998-69 AMT
10/01/28 | | | 5.500 | % | | | 235,000 | | | | 235,313 | | |
Series 2007-140 AMT
10/01/21 | | | 4.600 | % | | | 500,000 | | | | 525,370 | | |
Series 2007-148 AMT
10/01/32 | | | 5.200 | % | | | 970,000 | | | | 1,027,230 | | |
Total | | | | | | | 1,787,913 | | |
Special Non Property Tax 10.9% | |
Metropolitan Transportation Authority
Revenue Bonds
Series 2009A
11/15/26 | | | 5.300 | % | | | 700,000 | | | | 821,667 | | |
Series 2009B
11/15/34 | | | 5.000 | % | | | 4,500,000 | | | | 5,085,495 | | |
Municipal Bonds (continued)
Issue
Description | | Coupon
Rate | | Principal
Amount ($) | | Value ($) | |
Nassau County Interim Finance Authority
Revenue Bonds
Secured Sales Tax
Series 2009A
11/15/24 | | | 5.000 | % | | | 250,000 | | | | 293,370 | | |
New York City Transitional Finance Authority Building Aid
Revenue Bonds
Fiscal 2009
Series 2009S-3
01/15/22 | | | 5.000 | % | | | 1,000,000 | | | | 1,182,850 | | |
Series 2009S-5
01/15/32 | | | 5.000 | % | | | 1,000,000 | | | | 1,137,300 | | |
New York City Transitional Finance Authority
Subordinated Revenue Bonds
Future Tax Secured
Series 2007B
11/01/26 | | | 5.000 | % | | | 1,035,000 | | | | 1,195,477 | | |
New York State Dormitory Authority
Refunding Revenue Bonds
General Purpose
Series 2012A
06/15/31 | | | 5.000 | % | | | 2,250,000 | | | | 2,703,398 | | |
Revenue Bonds
Education
Series 2008B
03/15/36 | | | 5.750 | % | | | 500,000 | | | | 620,090 | | |
Series 2009A
03/15/28 | | | 5.000 | % | | | 1,545,000 | | | | 1,849,581 | | |
Series 2009A
02/15/34 | | | 5.000 | % | | | 1,400,000 | | | | 1,661,842 | | |
New York State Thruway Authority
Revenue Bonds
Series 2005A (NPFGC)
04/01/25 | | | 5.000 | % | | | 500,000 | | | | 546,095 | | |
Series 2009A-1
04/01/29 | | | 5.000 | % | | | 1,000,000 | | | | 1,151,820 | | |
New York State Urban Development Corp.
Revenue Bonds
State Personal Income Tax
Series 2009B-1
03/15/36 | | | 5.000 | % | | | 1,500,000 | | | | 1,723,845 | | |
Puerto Rico Sales Tax Financing Corp.
1st Subordinated Revenue Bonds
Series 2010C(f)
08/01/41 | | | 5.250 | % | | | 1,750,000 | | | | 1,849,015 | | |
Total | | | | | | | 21,821,845 | | |
State Appropriated 3.0% | |
Erie County Industrial Development Agency (The)
Revenue Bonds
School District Buffalo Project
Series 2011A
05/01/32 | | | 5.250 | % | | | 1,000,000 | | | | 1,164,450 | | |
The accompanying Notes to Financial Statements are an integral part of this statement.
Annual Report 2012
11
Columbia New York Tax-Exempt Fund
Portfolio of Investments (continued)
October 31, 2012
Municipal Bonds (continued)
Issue
Description | | Coupon
Rate | | Principal
Amount ($) | | Value ($) | |
New York Local Government Assistance Corp.
Refunding Revenue Bonds
Senior Lien
Series 2007A
04/01/19 | | | 5.000 | % | | | 1,000,000 | | | | 1,179,440 | | |
New York State Dormitory Authority
Revenue Bonds
Consolidated City University Systems 2nd Generation
Series 1993A
07/01/20 | | | 6.000 | % | | | 2,000,000 | | | | 2,499,080 | | |
State University Educational Facilities
Series 2000C (AGM)
05/15/17 | | | 5.750 | % | | | 1,000,000 | | | | 1,213,710 | | |
Total | | | | | | | 6,056,680 | | |
Student Loan —% | |
New York Mortgage Agency
Revenue Bonds
New York State Higher Education Finance
Series 2009
11/01/26 | | | 4.750 | % | | | 75,000 | | | | 82,354 | | |
Transportation 4.0% | |
Metropolitan Transportation Authority
Revenue Bonds
Series 2005B (AMBAC)
11/15/23 | | | 5.250 | % | | | 1,250,000 | | | | 1,570,200 | | |
Series 2005F
11/15/35 | | | 5.000 | % | | | 500,000 | | | | 538,615 | | |
Series 2006A
11/15/22 | | | 5.000 | % | | | 750,000 | | | | 855,450 | | |
Series 2010D
11/15/34 | | | 5.000 | % | | | 1,350,000 | | | | 1,513,917 | | |
Series 2011D
11/15/36 | | | 5.000 | % | | | 1,000,000 | | | | 1,126,920 | | |
Series 2012E
11/15/31 | | | 5.000 | % | | | 2,000,000 | | | | 2,321,900 | | |
Total | | | | | | | 7,927,002 | | |
Turnpike/Bridge/Toll Road 2.2% | |
New York State Thruway Authority
Revenue Bonds
General Revenue
Series 2012I
01/01/32 | | | 5.000 | % | | | 2,000,000 | | | | 2,327,120 | | |
Series 2005F (AMBAC)
01/01/25 | | | 5.000 | % | | | 2,000,000 | | | | 2,169,660 | | |
Total | | | | | | | 4,496,780 | | |
Water & Sewer 5.0% | |
Great Neck North Water Authority
Revenue Bonds
Series 2008
01/01/33 | | | 5.000 | % | | | 690,000 | | | | 766,383 | | |
Municipal Bonds (continued)
Issue
Description | | Coupon
Rate | | Principal
Amount ($) | | Value ($) | |
New York City Municipal Water Finance Authority
Revenue Bonds
Fiscal 2009
Series 2008A
06/15/40 | | | 5.750 | % | | | 1,000,000 | | | | 1,202,630 | | |
Series 2008CC
06/15/34 | | | 5.000 | % | | | 3,500,000 | | | | 4,021,710 | | |
Series 2009EE
06/15/40 | | | 5.250 | % | | | 500,000 | | | | 581,700 | | |
Series 2009FF-2
06/15/40 | | | 5.500 | % | | | 1,000,000 | | | | 1,198,340 | | |
Series 2012FF
06/15/33 | | | 5.000 | % | | | 1,000,000 | | | | 1,175,190 | | |
Rensselaer County Water Service & Sewer Authority
Revenue Bonds
Water Service
Series 2008
09/01/38 | | | 5.250 | % | | | 1,000,000 | | | | 1,094,330 | | |
Total | | | | | | | 10,040,283 | | |
Total Municipal Bonds
(Cost: $170,091,254) | | | | | | | 191,063,956 | | |
Floating Rate Notes 2.0%
City of New York
Unlimited General Obligation Bonds
VRDN Series 1995F-6 (JPMorgan Chase Bank)(b)
02/15/18 | | | 0.210 | % | | | 2,000,000 | | | | 2,000,000 | | |
Triborough Bridge & Tunnel Authority
Revenue Bonds
General
VRDN Series 2005B-2C (U.S. Bank)(b)
01/01/32 | | | 0.170 | % | | | 2,000,000 | | | | 2,000,000 | | |
Total Floating Rate Notes
(Cost: $4,000,000) | | | | | | | 4,000,000 | | |
Money Market Funds 2.1%
| | | Shares | | Value ($) | |
Dreyfus New York AMT-Free
Municipal Money Market Fund,
0.000%(g) | | | 1,104,868 | | | | 1,104,868 | | |
JPMorgan Tax Free Money
Market Fund, 0.000%(g) | | | 3,054,617 | | | | 3,054,617 | | |
Total Money Market Funds
(Cost: $4,159,485) | | | | | 4,159,485 | | |
Total Investments
(Cost: $178,250,739) | | | | | 199,223,441 | | |
Other Assets & Liabilities, Net | | | | | 1,347,196 | | |
Net Assets | | | | | 200,570,637 | | |
The accompanying Notes to Financial Statements are an integral part of this statement.
Annual Report 2012
12
Columbia New York Tax-Exempt Fund
Portfolio of Investments (continued)
October 31, 2012
Notes to Portfolio of Investments
(a) Income from this security may be subject to alternative minimum tax.
(b) Variable rate security. The interest rate shown reflects the rate as of October 31, 2012.
(c) Security exempt from registration pursuant to Rule 144A under the Securities Act of 1933. This security may be resold in transactions exempt from registration, normally to qualified institutional buyers. At October 31, 2012, the value of these securities amounted to $505,915 or 0.25% of net assets.
(d) Represents a security purchased on a when-issued or delayed delivery basis.
(e) Zero coupon bond.
(f) Municipal obligations include debt obligations issued by or on behalf of territories, possessions, or sovereign nations within the territorial boundaries of the United States. At October 31, 2012, the value of these securities amounted to $1,849,015 or 0.92% of net assets.
(g) The rate shown is the seven-day current annualized yield at October 31, 2012.
Abbreviation Legend
ACA ACA Financial Guaranty Corporation
AGM Assured Guaranty Municipal Corporation
AMBAC Ambac Assurance Corporation
AMT Alternative Minimum Tax
FGIC Financial Guaranty Insurance Company
FHA Federal Housing Authority
NPFGC National Public Finance Guarantee Corporation
VRDN Variable Rate Demand Note
XLCA XL Capital Assurance
Fair Value Measurements
Generally accepted accounting principles (GAAP) require disclosure regarding the inputs and valuation techniques used to measure fair value and any changes in valuation inputs or techniques. In addition, investments shall be disclosed by major category.
The Fund categorizes its fair value measurements according to a three-level hierarchy that maximizes the use of observable inputs and minimizes the use of unobservable inputs by prioritizing that the most observable input be used when available. Observable inputs are those that market participants would use in pricing an investment based on market data obtained from sources independent of the reporting entity. Unobservable inputs are those that reflect the Fund's assumptions about the information market participants would use in pricing an investment. An investment's level within the fair value hierarchy is based on the lowest level of any input that is deemed significant to the asset or liability's fair value measurement. The input levels are not necessarily an indication of the risk or liquidity associated with investments at that level. For example, certain U.S. government securities are generally high quality and liquid, however, they are reflected as Level 2 because the inputs used to determine fair value may not always be quoted prices in an active market.
Fair value inputs are summarized in the three broad levels listed below:
> Level 1 — Valuations based on quoted prices for investments in active markets that the Fund has the ability to access at the measurement date (including NAV for open-end mutual funds). Valuation adjustments are not applied to Level 1 investments.
> Level 2 — Valuations based on other significant observable inputs (including quoted prices for similar securities, interest rates, prepayment speeds, credit risks, etc.).
> Level 3 — Valuations based on significant unobservable inputs (including the Fund's own assumptions and judgment in determining the fair value of investments).
Inputs that are used in determining fair value of an investment may include price information, credit data, volatility statistics, and other factors. These inputs can be either observable or unobservable. The availability of observable inputs can vary between investments, and is affected by various factors such as the type of investment, and the volume and level of activity for that investment or similar investments in the marketplace. The inputs will be considered by the Investment Manager, along with any other relevant factors in the calculation of an investment's fair value. The Fund uses prices and inputs that are current as of the measurement date, which may include periods of market dislocations. During these periods, the availability of prices and inputs may be reduced for many investments. This condition could cause an investment to be reclassified between the various levels within the hierarchy.
The accompanying Notes to Financial Statements are an integral part of this statement.
Annual Report 2012
13
Columbia New York Tax-Exempt Fund
Portfolio of Investments (continued)
October 31, 2012
Fair Value Measurements (continued)
Investments falling into the Level 3 category are primarily supported by quoted prices from brokers and dealers participating in the market for those investments. However, these may be classified as Level 3 investments due to lack of market transparency and corroboration to support these quoted prices. Additionally, valuation models may be used as the pricing source for any remaining investments classified as Level 3. These models rely on one or more significant unobservable inputs and/or significant assumptions by the Investment Manager. Inputs used in valuations may include, but are not limited to, financial statement analysis, capital account balances, discount rates and estimated cash flows, and comparable company data.
Under the direction of the Fund's Board of Trustees (the Board), the Investment Manager's Valuation Committee (the Committee) is responsible for carrying out the valuation procedures approved by the Board. The Committee consists of voting and non-voting members from various groups within the Investment Manager's organization, including operations and accounting, trading and investments, compliance, risk management and legal.
The Committee meets at least monthly to review and approve valuation matters, which may include a description of specific valuation determinations, data regarding pricing information received from approved pricing vendors and brokers and the results of Board-approved valuation control policies and procedures (the Policies). The Policies address, among other things, instances when market quotations are readily available, including recommendations of third party pricing vendors and a determination of appropriate pricing methodologies; events that require specific valuation determinations and assessment of fair value techniques; securities with a potential for stale pricing, including those that are illiquid, restricted, or in default; and the effectiveness of third-party pricing vendors, including periodic reviews of vendors. The Committee meets more frequently, as needed, to discuss additional valuation matters, which may include the need to review back-testing results, review time-sensitive information or approve related valuation actions. The Committee reports to the Board, with members of the Committee meeting with the Board at each of its regularly scheduled meetings to discuss valuation matters and actions during the period, similar to those described earlier.
For investments categorized as Level 3, the Committee monitors information similar to that described above, which may include: (i) data specific to the issuer or comparable issuers, (ii) general market or specific sector news and (iii) quoted prices and specific or similar security transactions. The Committee considers this data and any changes from prior periods in order to assess the reasonableness of observable and unobservable inputs, any assumptions or internal models used to value those securities and changes in fair value. This data is also used to corroborate, when available, information received from approved pricing vendors and brokers. Various factors impact the frequency of monitoring this information (which may occur as often as daily). However, the Committee may determine that changes to inputs, assumptions and models are not required as a result of the monitoring procedures performed.
The following table is a summary of the inputs used to value the Fund's investments at October 31, 2012:
Description | | Level 1
Quoted Prices in Active
Markets for Identical
Assets ($) | | Level 2
Other Significant
Observable Inputs ($) | | Level 3
Significant
Unobservable Inputs ($) | |
Total ($) | |
Bonds | |
Municipal Bonds | | | — | | | | 191,063,956 | | | | — | | | | 191,063,956 | | |
Total Bonds | | | — | | | | 191,063,956 | | | | — | | | | 191,063,956 | | |
Short-Term Securities | |
Floating Rate Notes | | | — | | | | 4,000,000 | | | | — | | | | 4,000,000 | | |
Total Short-Term Securities | | | — | | | | 4,000,000 | | | | — | | | | 4,000,000 | | |
Other | |
Money Market Funds | | | 4,159,485 | | | | — | | | | — | | | | 4,159,485 | | |
Total Other | | | 4,159,485 | | | | — | | | | — | | | | 4,159,485 | | |
Total | | | 4,159,485 | | | | 195,063,956 | | | | — | | | | 199,223,441 | | |
See the Portfolio of Investments for all investment classifications not indicated in the table.
The Fund's assets assigned to the Level 2 input category are generally valued using the market approach, in which a security's value is determined through reference to prices and information from market transactions for similar or identical assets.
There were no transfers of financial assets between Levels 1 and 2 during the period.
The accompanying Notes to Financial Statements are an integral part of this statement.
Annual Report 2012
14
Columbia New York Tax-Exempt Fund
Statement of Assets and Liabilities
October 31, 2012
Assets | |
Investments, at value | |
(identified cost $178,250,739) | | $ | 199,223,441 | | |
Receivable for: | |
Capital shares sold | | | 475,689 | | |
Interest | | | 2,879,878 | | |
Expense reimbursement due from Investment Manager | | | 3,213 | | |
Trustees' deferred compensation plan | | | 26,816 | | |
Total assets | | | 202,609,037 | | |
Liabilities | |
Payable for: | |
Investments purchased on a delayed delivery basis | | | 1,073,118 | | |
Capital shares purchased | | | 191,307 | | |
Dividend distributions to shareholders | | | 589,872 | | |
Investment management fees | | | 10,943 | | |
Distribution and service fees | | | 8,191 | | |
Transfer agent fees | | | 29,978 | | |
Administration fees | | | 1,915 | | |
Compensation of board members | | | 3,634 | | |
Chief compliance officer expenses | | | 56 | | |
Other expenses | | | 102,570 | | |
Trustees' deferred compensation plan | | | 26,816 | | |
Total liabilities | | | 2,038,400 | | |
Net assets applicable to outstanding capital stock | | $ | 200,570,637 | | |
Represented by | |
Paid-in capital | | $ | 178,641,115 | | |
Undistributed net investment income | | | 315,040 | | |
Accumulated net realized gain | | | 641,780 | | |
Unrealized appreciation (depreciation) on: | |
Investments | | | 20,972,702 | | |
Total — representing net assets applicable to outstanding capital stock | | $ | 200,570,637 | | |
The accompanying Notes to Financial Statements are an integral part of this statement.
Annual Report 2012
15
Columbia New York Tax-Exempt Fund
Statement of Assets and Liabilities (continued)
October 31, 2012
Class A | |
Net assets | | $ | 177,945,427 | | |
Shares outstanding | | | 22,932,849 | | |
Net asset value per share | | $ | 7.76 | | |
Maximum offering price per share(a) | | $ | 8.15 | | |
Class B | |
Net assets | | $ | 1,390,318 | | |
Shares outstanding | | | 179,238 | | |
Net asset value per share | | $ | 7.76 | | |
Class C | |
Net assets | | $ | 20,239,802 | | |
Shares outstanding | | | 2,609,200 | | |
Net asset value per share | | $ | 7.76 | | |
Class Z | |
Net assets | | $ | 995,090 | | |
Shares outstanding | | | 128,251 | | |
Net asset value per share | | $ | 7.76 | | |
(a) The maximum offering price per share is calculated by dividing the net asset value by 1.0 minus the maximum sales charge of 4.75%.
The accompanying Notes to Financial Statements are an integral part of this statement.
Annual Report 2012
16
Columbia New York Tax-Exempt Fund
Statement of Operations
Year Ended October 31, 2012
Net investment income | |
Income: | |
Dividends | | $ | 246 | | |
Interest | | | 8,614,349 | | |
Total income | | | 8,614,595 | | |
Expenses: | |
Investment management fees | | | 768,227 | | |
Distribution fees | |
Class B | | | 14,240 | | |
Class C | | | 136,252 | | |
Service fees | |
Class A | | | 428,826 | | |
Class B | | | 4,747 | | |
Class C | | | 45,436 | | |
Transfer agent fees | |
Class A | | | 182,472 | | |
Class B | | | 2,190 | | |
Class C | | | 19,624 | | |
Class Z | | | 535 | | |
Administration fees | | | 134,440 | | |
Compensation of board members | | | 24,158 | | |
Custodian fees | | | 5,126 | | |
Printing and postage fees | | | 66,255 | | |
Registration fees | | | 47,659 | | |
Professional fees | | | 46,131 | | |
Other | | | 15,015 | | |
Total expenses | | | 1,941,333 | | |
Fees waived or expenses reimbursed by Investment Manager and its affiliates | | | (275,120 | ) | |
Fees waived by Distributor — Class C | | | (54,467 | ) | |
Expense reductions | | | (300 | ) | |
Total net expenses | | | 1,611,446 | | |
Net investment income | | | 7,003,149 | | |
Realized and unrealized gain (loss) — net | |
Net realized gain (loss) on: | |
Investments | | | 1,469,883 | | |
Net realized gain | | | 1,469,883 | | |
Net change in unrealized appreciation (depreciation) on: | |
Investments | | | 11,251,561 | | |
Net change in unrealized appreciation (depreciation) | | | 11,251,561 | | |
Net realized and unrealized gain | | | 12,721,444 | | |
Net increase in net assets resulting from operations | | $ | 19,724,593 | | |
The accompanying Notes to Financial Statements are an integral part of this statement.
Annual Report 2012
17
Columbia New York Tax-Exempt Fund
Statement of Changes in Net Assets
| | | Year Ended
October 31,
2012 | | Year Ended
October 31,
2011(a) | |
Operations | |
Net investment income | | $ | 7,003,149 | | | $ | 4,456,556 | | |
Net realized gain | | | 1,469,883 | | | | 557,401 | | |
Net change in unrealized appreciation (depreciation) | | | 11,251,561 | | | | 1,031,575 | | |
Net increase in net assets resulting from operations | | | 19,724,593 | | | | 6,045,532 | | |
Distributions to shareholders | |
Net investment income | |
Class A | | | (6,306,480 | ) | | | (3,955,675 | ) | |
Class B | | | (55,711 | ) | | | (103,319 | ) | |
Class C | | | (585,801 | ) | | | (425,671 | ) | |
Class Z | | | (17,711 | ) | | | (34 | ) | |
Net realized gains | |
Class A | | | (267,207 | ) | | | (80,083 | ) | |
Class B | | | (3,562 | ) | | | (5,958 | ) | |
Class C | | | (27,350 | ) | | | (13,363 | ) | |
Class Z | | | (8 | ) | | | — | | |
Total distributions to shareholders | | | (7,263,830 | ) | | | (4,584,103 | ) | |
Increase (decrease) in net assets from capital stock activity | | | 6,333,234 | | | | 111,487,203 | | |
Total increase in net assets | | | 18,793,997 | | | | 112,948,632 | | |
Net assets at beginning of year | | | 181,776,640 | | | | 68,828,008 | | |
Net assets at end of year | | $ | 200,570,637 | | | $ | 181,776,640 | | |
Undistributed net investment income | | $ | 315,040 | | | $ | 322,679 | | |
(a) Class Z shares are for the period from September 1, 2011 (commencement of operations) to October 31, 2011.
The accompanying Notes to Financial Statements are an integral part of this statement.
Annual Report 2012
18
Columbia New York Tax-Exempt Fund
Statement of Changes in Net Assets (continued)
| | | Year Ended October 31, 2012 | | Year Ended October 31, 2011(a) | |
| | | Shares | | Dollars ($) | | Shares | | Dollars ($) | |
Capital stock activity | |
Class A shares | |
Subscriptions | | | 2,154,954 | | | | 16,316,878 | | | | 1,416,525 | | | | 10,057,117 | | |
Fund merger | | | — | | | | — | | | | 15,425,984 | | | | 109,863,826 | | |
Distributions reinvested | | | 656,913 | | | | 4,974,218 | | | | 373,324 | | | | 2,661,888 | | |
Redemptions | | | (2,362,750 | ) | | | (17,887,399 | ) | | | (2,207,714 | ) | | | (15,646,941 | ) | |
Net increase | | | 449,117 | | | | 3,403,697 | | | | 15,008,119 | | | | 106,935,890 | | |
Class B shares | |
Subscriptions | | | 7,319 | | | | 55,458 | | | | 2,638 | | | | 18,448 | | |
Fund merger | | | — | | | | — | | | | 153,991 | | | | 1,096,096 | | |
Distributions reinvested | | | 4,754 | | | | 35,836 | | | | 8,764 | | | | 61,562 | | |
Redemptions | | | (135,943 | ) | | | (1,032,617 | ) | | | (480,574 | ) | | | (3,366,812 | ) | |
Net decrease | | | (123,870 | ) | | | (941,323 | ) | | | (315,181 | ) | | | (2,190,706 | ) | |
Class C shares | |
Subscriptions | | | 725,014 | | | | 5,461,336 | | | | 150,723 | | | | 1,073,119 | | |
Fund merger | | | — | | | | — | | | | 1,033,183 | | | | 7,354,989 | | |
Distributions reinvested | | | 52,599 | | | | 398,568 | | | | 32,912 | | | | 233,321 | | |
Redemptions | | | (393,145 | ) | | | (2,960,844 | ) | | | (272,441 | ) | | | (1,924,444 | ) | |
Net increase | | | 384,468 | | | | 2,899,060 | | | | 944,377 | | | | 6,736,985 | | |
Class Z shares | |
Subscriptions | | | 128,984 | | | | 982,563 | | | | 689 | | | | 5,000 | | |
Distributions reinvested | | | 2,286 | | | | 17,613 | | | | 5 | | | | 34 | | |
Redemptions | | | (3,713 | ) | | | (28,376 | ) | | | — | | | | — | | |
Net increase | | | 127,557 | | | | 971,800 | | | | 694 | | | | 5,034 | | |
Total net increase | | | 837,272 | | | | 6,333,234 | | | | 15,638,009 | | | | 111,487,203 | | |
(a) Class Z shares are for the period from September 1, 2011 (commencement of operations) to October 31, 2011.
The accompanying Notes to Financial Statements are an integral part of this statement.
Annual Report 2012
19
Columbia New York Tax-Exempt Fund
The following tables are intended to help you understand the Fund's financial performance. Certain information reflects financial results for a single share of a class held for the periods shown. Per share net investment income (loss) amounts are calculated based on average shares outstanding during the period. Total return assumes reinvestment of all dividends and distributions. Total return does not reflect payment of sales charges, if any, and is not annualized for periods of less than one year.
| | | Year Ended October 31, | |
Class A | | 2012 | | 2011 | | 2010 | | 2009 | | 2008 | |
Per share data | |
Net asset value, beginning of period | | $ | 7.27 | | | $ | 7.34 | | | $ | 7.25 | | | $ | 6.55 | | | $ | 7.49 | | |
Income from investment operations: | |
Net investment income | | | 0.28 | | | | 0.29 | | | | 0.30 | | | | 0.31 | | | | 0.31 | | |
Net realized and unrealized gain (loss) | | | 0.50 | | | | (0.06 | )(a) | | | 0.31 | | | | 0.78 | | | | (0.87 | ) | |
Total from investment operations | | | 0.78 | | | | 0.23 | | | | 0.61 | | | | 1.09 | | | | (0.56 | ) | |
Less distributions to shareholders: | |
Net investment income | | | (0.28 | ) | | | (0.29 | ) | | | (0.34 | ) | | | (0.30 | ) | | | (0.30 | ) | |
Net realized gains | | | (0.01 | ) | | | (0.01 | ) | | | (0.18 | ) | | | (0.09 | ) | | | (0.08 | ) | |
Total distributions to shareholders | | | (0.29 | ) | | | (0.30 | ) | | | (0.52 | ) | | | (0.39 | ) | | | (0.38 | ) | |
Net asset value, end of period | | $ | 7.76 | | | $ | 7.27 | | | $ | 7.34 | | | $ | 7.25 | | | $ | 6.55 | | |
Total return | | | 10.90 | % | | | 3.40 | % | | | 8.86 | % | | | 17.24 | % | | | (7.86 | %) | |
Ratios to average net assets(b) | |
Expenses prior to fees waived or expenses reimbursed | | | 0.93 | % | | | 1.02 | % | | | 1.12 | % | | | 1.09 | % | | | 1.08 | % | |
Net expenses after fees waived or expenses reimbursed(c) | | | 0.79 | %(d) | | | 0.82 | %(d) | | | 0.84 | %(d) | | | 0.84 | %(d) | | | 0.84 | %(d) | |
Net investment income | | | 3.70 | %(d) | | | 4.04 | %(d) | | | 4.11 | %(d) | | | 4.47 | %(d) | | | 4.29 | %(d) | |
Supplemental data | |
Net assets, end of period (in thousands) | | $ | 177,945 | | | $ | 163,405 | | | $ | 54,888 | | | $ | 50,469 | | | $ | 42,819 | | |
Portfolio turnover | | | 24 | % | | | 22 | % | | | 9 | % | | | 20 | % | | | 17 | % | |
Notes to Financial Highlights
(a) Calculation of the net gain (loss) per share (both realized and unrealized) does not correlate to the aggregate realized and unrealized gain (loss) presented in the Statement of Operations due to the timing of sales and repurchases of Fund shares in relation to fluctuations in the market value of the portfolio.
(b) In addition to the fees and expenses which the Fund bears directly, the Fund indirectly bears a pro rata share of the fees and expenses of the acquired funds in which it invests. Such indirect expenses are not included in the reported expense ratios.
(c) The Investment Manager and certain of its affiliates agreed to waive/reimburse certain fees and expenses, if applicable.
(d) The benefits derived from expense reductions had an impact of less than 0.01%.
The accompanying Notes to Financial Statements are an integral part of this statement.
Annual Report 2012
20
Columbia New York Tax-Exempt Fund
Financial Highlights (continued)
| | | Year Ended October 31, | |
Class B | | 2012 | | 2011 | | 2010 | | 2009 | | 2008 | |
Per share data | |
Net asset value, beginning of period | | $ | 7.27 | | | $ | 7.34 | | | $ | 7.25 | | | $ | 6.55 | | | $ | 7.49 | | |
Income from investment operations: | |
Net investment income | | | 0.22 | | | | 0.24 | | | | 0.24 | | | | 0.25 | | | | 0.26 | | |
Net realized and unrealized gain (loss) | | | 0.50 | | | | (0.06 | )(a) | | | 0.32 | | | | 0.78 | | | | (0.88 | ) | |
Total from investment operations | | | 0.72 | | | | 0.18 | | | | 0.56 | | | | 1.03 | | | | (0.62 | ) | |
Less distributions to shareholders: | |
Net investment income | | | (0.22 | ) | | | (0.24 | ) | | | (0.29 | ) | | | (0.24 | ) | | | (0.24 | ) | |
Net realized gains | | | (0.01 | ) | | | (0.01 | ) | | | (0.18 | ) | | | (0.09 | ) | | | (0.08 | ) | |
Total distributions to shareholders | | | (0.23 | ) | | | (0.25 | ) | | | (0.47 | ) | | | (0.33 | ) | | | (0.32 | ) | |
Net asset value, end of period | | $ | 7.76 | | | $ | 7.27 | | | $ | 7.34 | | | $ | 7.25 | | | $ | 6.55 | | |
Total return | | | 10.08 | % | | | 2.62 | % | | | 8.05 | % | | | 16.38 | % | | | (8.54 | %) | |
Ratios to average net assets(b) | |
Expenses prior to fees waived or expenses reimbursed | | | 1.70 | % | | | 1.87 | % | | | 1.87 | % | | | 1.84 | % | | | 1.83 | % | |
Net expenses after fees waived or expenses reimbursed(c) | | | 1.54 | %(d) | | | 1.60 | %(d) | | | 1.59 | %(d) | | | 1.59 | %(d) | | | 1.59 | %(d) | |
Net investment income | | | 2.95 | %(d) | | | 3.38 | %(d) | | | 3.38 | %(d) | | | 3.73 | %(d) | | | 3.54 | %(d) | |
Supplemental data | |
Net assets, end of period (in thousands) | | $ | 1,390 | | | $ | 2,202 | | | $ | 4,540 | | | $ | 8,217 | | | $ | 10,084 | | |
Portfolio turnover | | | 24 | % | | | 22 | % | | | 9 | % | | | 20 | % | | | 17 | % | |
Notes to Financial Highlights
(a) Calculation of the net gain (loss) per share (both realized and unrealized) does not correlate to the aggregate realized and unrealized gain (loss) presented in the Statement of Operations due to the timing of sales and repurchases of Fund shares in relation to fluctuations in the market value of the portfolio.
(b) In addition to the fees and expenses which the Fund bears directly, the Fund indirectly bears a pro rata share of the fees and expenses of the acquired funds in which it invests. Such indirect expenses are not included in the reported expense ratios.
(c) The Investment Manager and certain of its affiliates agreed to waive/reimburse certain fees and expenses, if applicable.
(d) The benefits derived from expense reductions had an impact of less than 0.01%.
The accompanying Notes to Financial Statements are an integral part of this statement.
Annual Report 2012
21
Columbia New York Tax-Exempt Fund
Financial Highlights (continued)
| | | Year Ended October 31, | |
Class C | | 2012 | | 2011 | | 2010 | | 2009 | | 2008 | |
Per share data | |
Net asset value, beginning of period | | $ | 7.27 | | | $ | 7.34 | | | $ | 7.25 | | | $ | 6.55 | | | $ | 7.49 | | |
Income from investment operations: | |
Net investment income | | | 0.25 | | | | 0.26 | | | | 0.26 | | | | 0.28 | | | | 0.28 | | |
Net realized and unrealized gain (loss) | | | 0.50 | | | | (0.06 | )(a) | | | 0.32 | | | | 0.78 | | | | (0.87 | ) | |
Total from investment operations | | | 0.75 | | | | 0.20 | | | | 0.58 | | | | 1.06 | | | | (0.59 | ) | |
Less distributions to shareholders: | |
Net investment income | | | (0.25 | ) | | | (0.26 | ) | | | (0.31 | ) | | | (0.27 | ) | | | (0.27 | ) | |
Net realized gains | | | (0.01 | ) | | | (0.01 | ) | | | (0.18 | ) | | | (0.09 | ) | | | (0.08 | ) | |
Total distributions to shareholders | | | (0.26 | ) | | | (0.27 | ) | | | (0.49 | ) | | | (0.36 | ) | | | (0.35 | ) | |
Net asset value, end of period | | $ | 7.76 | | | $ | 7.27 | | | $ | 7.34 | | | $ | 7.25 | | | $ | 6.55 | | |
Total return | | | 10.41 | % | | | 2.95 | % | | | 8.37 | % | | | 16.72 | % | | | (8.27 | %) | |
Ratios to average net assets(b) | |
Expenses prior to fees waived or expenses reimbursed | | | 1.68 | % | | | 1.82 | % | | | 1.87 | % | | | 1.84 | % | | | 1.83 | % | |
Net expenses after fees waived or expenses reimbursed(c) | | | 1.24 | %(d) | | | 1.28 | %(d) | | | 1.29 | %(d) | | | 1.29 | %(d) | | | 1.29 | %(d) | |
Net investment income | | | 3.24 | %(d) | | | 3.64 | %(d) | | | 3.66 | %(d) | | | 4.02 | %(d) | | | 3.84 | %(d) | |
Supplemental data | |
Net assets, end of period (in thousands) | | $ | 20,240 | | | $ | 16,164 | | | $ | 9,401 | | | $ | 9,031 | | | $ | 8,319 | | |
Portfolio turnover | | | 24 | % | | | 22 | % | | | 9 | % | | | 20 | % | | | 17 | % | |
Notes to Financial Highlights
(a) Calculation of the net gain (loss) per share (both realized and unrealized) does not correlate to the aggregate realized and unrealized gain (loss) presented in the Statement of Operations due to the timing of sales and repurchases of Fund shares in relation to fluctuations in the market value of the portfolio.
(b) In addition to the fees and expenses which the Fund bears directly, the Fund indirectly bears a pro rata share of the fees and expenses of the acquired funds in which it invests. Such indirect expenses are not included in the reported expense ratios.
(c) The Investment Manager and certain of its affiliates agreed to waive/reimburse certain fees and expenses, if applicable.
(d) The benefits derived from expense reductions had an impact of less than 0.01%.
The accompanying Notes to Financial Statements are an integral part of this statement.
Annual Report 2012
22
Columbia New York Tax-Exempt Fund
Financial Highlights (continued)
| | | Year Ended October 31, | |
Class Z | | 2012 | | 2011(a) | |
Per share data | |
Net asset value, beginning of period | | $ | 7.27 | | | $ | 7.25 | | |
Income from investment operations: | |
Net investment income | | | 0.30 | | | | 0.05 | | |
Net realized and unrealized gain | | | 0.50 | | | | 0.02 | | |
Total from investment operations | | | 0.80 | | | | 0.07 | | |
Less distributions to shareholders: | |
Net investment income | | | (0.30 | ) | | | (0.05 | ) | |
Net realized gains | | | (0.01 | ) | | | — | | |
Total distributions to shareholders | | | (0.31 | ) | | | (0.05 | ) | |
Net asset value, end of period | | $ | 7.76 | | | $ | 7.27 | | |
Total return | | | 11.19 | % | | | 0.96 | % | |
Ratios to average net assets(b) | |
Expenses prior to fees waived or expenses reimbursed | | | 0.66 | % | | | 0.61 | %(c) | |
Net expenses after fees waived or expenses reimbursed(d) | | | 0.54 | %(e) | | | 0.52 | %(c) | |
Net investment income | | | 3.90 | %(e) | | | 4.19 | %(c) | |
Supplemental data | |
Net assets, end of period (in thousands) | | $ | 995 | | | $ | 5 | | |
Portfolio turnover | | | 24 | % | | | 22 | % | |
Notes to Financial Highlights
(a) For the period from September 1, 2011 (commencement of operations) to October 31, 2011.
(b) In addition to the fees and expenses which the Fund bears directly, the Fund indirectly bears a pro rata share of the fees and expenses of the acquired funds in which it invests. Such indirect expenses are not included in the reported expense ratios.
(c) Annualized.
(d) The Investment Manager and certain of its affiliates agreed to waive/reimburse certain fees and expenses, if applicable.
(e) The benefits derived from expense reductions had an impact of less than 0.01%.
The accompanying Notes to Financial Statements are an integral part of this statement.
Annual Report 2012
23
Columbia New York Tax-Exempt Fund
Notes to Financial Statements
October 31, 2012
Note 1. Organization
Columbia New York Tax-Exempt Fund (the Fund), a series of Columbia Funds Series Trust I (the Trust), is a non-diversified fund. The Trust is registered under the Investment Company Act of 1940, as amended (the 1940 Act), as an open-end management investment company organized as a Massachusetts business trust.
Fund Shares
The Trust may issue an unlimited number of shares (without par value). The Fund offers Class A, Class B, Class C and Class Z shares. All share classes have identical voting, dividend and liquidation rights. Each share class has its own expense structure and sales charges, as applicable.
Class A shares are subject to a maximum front-end sales charge of 4.75% based on the initial investment amount. Class A shares purchased without an initial sales charge in accounts aggregating $1 million to $50 million at the time of purchase are subject to a contingent deferred sales charge (CDSC) if the shares are sold within 18 months of purchase, charged as follows: 1.00% CDSC if redeemed within 12 months of purchase, and 0.50% CDSC if redeemed more than 12, but less than 18, months after purchase.
Class B shares may be subject to a maximum CDSC of 5.00% based upon the holding period after purchase. Class B shares will generally convert to Class A shares eight years after purchase. The Fund no longer accepts investments by new or existing investors in the Fund's Class B shares, except in connection with the reinvestment of any dividend and/or capital gain distributions in Class B shares of the Fund and exchanges by existing Class B shareholders of certain other funds within the Columbia Family of Funds.
Class C shares are subject to a 1.00% CDSC on shares redeemed within one year of purchase.
Class R5 shares are not subject to sales charges and are only available to investors purchasing through authorized investment professionals. Class R5 shares commenced operations on November 8, 2012.
Class Z shares are not subject to sales charges, and are only available to certain investors.
Note 2. Summary of Significant Accounting Policies
Use of Estimates
The preparation of financial statements in accordance with U.S. generally accepted accounting principles (GAAP) requires management to make certain estimates and assumptions that affect the reported amounts of assets and liabilities, the disclosure of contingent assets and liabilities at
the date of the financial statements and the reported amounts of revenue and expenses during the reporting period. Actual results could differ from those estimates.
The following is a summary of significant accounting policies consistently followed by the Fund in the preparation of its financial statements.
Security Valuation
Debt securities generally are valued by pricing services approved by the Board of Trustees (the Board) based upon market transactions for normal, institutional-size trading units of similar securities. The services may use various pricing techniques which take into account appropriate factors such as yield, quality, coupon rate, maturity, type of issue, trading characteristics and other data, as well as broker quotes. Debt securities for which quotations are readily available may also be valued based upon an over-the-counter or exchange bid quotation.
Investments in other open-end investment companies, including money market funds, are valued at net asset value.
Investments for which market quotations are not readily available, or that have quotations which management believes are not reliable, are valued at fair value as determined in good faith under consistently applied procedures established by and under the general supervision of the Board. If a security or class of securities (such as foreign securities) is valued at fair value, such value is likely to be different from the last quoted market price for the security.
The determination of fair value often requires significant judgment. To determine fair value, management may use assumptions including but not limited to future cash flows and estimated risk premiums. Multiple inputs from various sources may be used to determine fair value.
Security Transactions
Security transactions are accounted for on the trade date. Cost is determined and gains (losses) are based upon the specific identification method for both financial statement and federal income tax purposes.
Income Recognition
Interest income is recorded on an accrual basis. Market premiums and discounts, including original issue discounts, are amortized and accreted, respectively, over the expected life of the security on all debt securities, unless otherwise noted.
Dividend income is recorded on the ex-dividend date.
Expenses
General expenses of the Trust are allocated to the Fund and other funds of the Trust based upon relative net assets or other
Annual Report 2012
24
Columbia New York Tax-Exempt Fund
Notes to Financial Statements (continued)
October 31, 2012
expense allocation methodologies determined by the nature of the expense. Expenses directly attributable to the Fund are charged to the Fund. Expenses directly attributable to a specific class of shares are charged to that share class.
Determination of Class Net Asset Value
All income, expenses (other than class-specific expenses, which are charged to that share class, as shown in the Statement of Operations) and realized and unrealized gains (losses) are allocated to each class of the Fund on a daily basis for purposes of determining the net asset value of each class. Income and expenses are allocated to each class based on the settled shares method, while realized and unrealized gains (losses) are allocated based on the relative net assets of each class.
Federal Income Tax Status
The Fund intends to qualify each year as a regulated investment company under Subchapter M of the Internal Revenue Code, as amended, and will distribute substantially all of its tax exempt income (including net short-term capital gains), if any, for its tax year, and as such will not be subject to federal income taxes. In addition, the Fund intends to distribute in each calendar year substantially all of its net investment income, capital gains and certain other amounts, if any, such that the Fund should not be subject to federal excise tax. Therefore, no federal income or excise tax provision is recorded.
Distributions to Shareholders
Distributions from net investment income, if any, are declared daily and paid monthly. Net realized capital gains, if any, are distributed at least annually. Income distributions and capital gain distributions are determined in accordance with federal income tax regulations, which may differ from GAAP.
Guarantees and Indemnifications
Under the Trust's organizational documents and, in some cases, by contract, its officers and trustees are indemnified against certain liabilities arising out of the performance of their duties to the Trust or its funds. In addition, certain of the Fund's contracts with its service providers contain general indemnification clauses. The Fund's maximum exposure under these arrangements is unknown since the amount of any future claims that may be made against the Fund cannot be determined, and the Fund has no historical basis for predicting the likelihood of any such claims.
Recent Accounting Pronouncement
Disclosures about Offsetting Assets and Liabilities
In December 2011, the Financial Accounting Standards Board (FASB) issued ASU No. 2011-11, Disclosures about Offsetting Assets and Liabilities. The objective of the FASB is
to enhance current disclosure requirements on offsetting of certain assets and liabilities and to enable financial statement users to compare financial statements prepared under GAAP and International Financial Reporting Standards.
Specifically, ASU No. 2011-11 requires an entity to disclose both gross and net information for derivatives and other financial instruments that are subject to a master netting arrangement or similar agreement. The standard requires disclosure of collateral received in connection with the master netting agreements or similar agreements. The effective date of ASU No. 2011-11 is for interim and annual periods beginning on or after January 1, 2013. At this time, management is evaluating the implications of this guidance and the impact it will have on the financial statement amounts and footnote disclosures, if any.
Note 3. Fees and Compensation Paid to Affiliates
Investment Management Fees
Under an Investment Management Services Agreement, Columbia Management Investment Advisers, LLC (the Investment Manager), a wholly-owned subsidiary of Ameriprise Financial, Inc. (Ameriprise Financial), determines which securities will be purchased, held or sold. The investment management fee is an annual fee that is equal to a percentage of the Fund's average daily net assets that declines from 0.40% to 0.27% as the Fund's net assets increase. The annualized effective investment management fee rate for the year ended October 31, 2012 was 0.40% of the Fund's average daily net assets.
Administration Fees
Under an Administrative Services Agreement, the Investment Manager also serves as the Fund Administrator. The Fund pays the Fund Administrator an annual fee for administration and accounting services equal to a percentage of the Fund's average daily net assets that declines from 0.07% to 0.04% as the Fund's net assets increase. The annualized effective administration fee rate for the year ended October 31, 2012 was 0.07% of the Fund's average daily net assets.
Compensation of Board Members
Board members are compensated for their services to the Fund as disclosed in the Statement of Operations. The Trust's eligible Trustees may participate in a Deferred Compensation Plan (the Plan) which may be terminated at any time. Obligations of the Plan will be paid solely out of the Fund's assets.
Annual Report 2012
25
Columbia New York Tax-Exempt Fund
Notes to Financial Statements (continued)
October 31, 2012
Compensation of Chief Compliance Officer
The Board has appointed a Chief Compliance Officer to the Fund in accordance with federal securities regulations. The Fund pays its pro-rata share of the expenses associated with the Chief Compliance Officer. The Fund's expenses for the Chief Compliance Officer will not exceed $15,000 per year.
Transfer Agent Fees
Under a Transfer and Dividend Disbursing Agent Agreement, Columbia Management Investment Services Corp. (the Transfer Agent), an affiliate of the Investment Manager and a wholly-owned subsidiary of Ameriprise Financial, is responsible for providing transfer agency services to the Fund. The Transfer Agent has contracted with Boston Financial Data Services (BFDS) to serve as sub-transfer agent.
The Transfer Agent receives monthly account-based service fees based on the number of open accounts and is reimbursed by the Fund for the fees and expenses the Transfer Agent pays to financial intermediaries that maintain omnibus accounts with the Fund that is a percentage of the average aggregate value of the Fund's shares maintained in each such omnibus account (other than omnibus accounts for which American Enterprise Investment Services Inc. is the broker of record or accounts where the beneficial shareholder is a customer of Ameriprise Financial Services, Inc., which are paid a per account fee). The Transfer Agent pays the fees of BFDS for services as sub-transfer agent and is not entitled to reimbursement for such fees from the Fund (with the exception of out-of-pocket fees).
The Transfer Agent also receives compensation from fees for various shareholder services and reimbursements for certain out-of-pocket expenses.
For the year ended October 31, 2012, the Fund's annualized effective transfer agent fee rates as a percentage of average daily net assets of each class were as follows:
Class A | | | 0.11 | % | |
Class B | | | 0.12 | | |
Class C | | | 0.11 | | |
Class Z | | | 0.12 | | |
In connection with the acquisition of Seligman New York Municipal Fund (see Note 8), the Fund assumed the assets and obligations of Seligman New York Municipal Fund, which together with certain other associated investment companies (together, the Guarantors), have severally, but not jointly, guaranteed the performance and observance of all the terms and conditions of a lease entered into by Seligman Data Corp. (SDC), the former transfer agent, including the payment of rent by SDC (the Guaranty). The lease and the Guaranty
expire in January 2019. At October 31, 2012, the Fund's total potential future obligation over the life of the Guaranty is $82,272. The liability remaining at October 31, 2012 for non-recurring charges associated with the lease amounted to $41,341 and is included within other accrued expenses in the Statement of Assets and Liabilities.
An annual minimum account balance fee of $20 may apply to certain accounts with a value below the Fund's initial minimum investment requirements to reduce the impact of small accounts on transfer agent fees. These minimum account balance fees are recorded as part of expense reductions in the Statement of Operations. For the year ended October 31, 2012, these minimum account balance fees reduced total expenses by $300.
Distribution and Service Fees
The Fund has an agreement with Columbia Management Investment Distributors, Inc. (the Distributor), an affiliate of the Investment Manager and a wholly-owned subsidiary of Ameriprise Financial, for distribution and shareholder services. Pursuant to Rule 12b-1 under the 1940 Act, the Board has approved, and the Fund has adopted, distribution and shareholder service plans (the Plans) which set the distribution and service fees for the Fund. These fees are calculated daily and are intended to compensate the Distributor and/or eligible selling and/or servicing agents for selling shares of the Fund and providing services to investors.
The Plans require the payment of a monthly service fee to the Distributor at the maximum annual rate of 0.25% of the average daily net assets attributable to Class A, Class B and Class C shares of the Fund. The Plans also require the payment of a monthly distribution fee to the Distributor at the maximum annual rate of 0.75% of the average daily net assets attributable to Class B and Class C shares only.
The Distributor has voluntarily agreed to waive a portion of the distribution fee for Class C shares so that the distribution fee does not exceed 0.45% annually of the average daily net assets attributable to Class C shares. This arrangement may be modified or terminated by the Distributor at any time.
Sales Charges
Sales charges, including front-end charges and CDSCs, received by the Distributor for distributing Fund shares were $162,976 for Class A, $1,249 for Class B and $1,378 for Class C shares for the year ended October 31, 2012.
Expenses Waived/Reimbursed by the Investment Manager and its Affiliates
The Investment Manager and certain of its affiliates have contractually agreed to waive fees and/or reimburse expenses
Annual Report 2012
26
Columbia New York Tax-Exempt Fund
Notes to Financial Statements (continued)
October 31, 2012
(excluding certain fees and expenses described below), through February 28, 2013, unless sooner terminated at the sole discretion of the Board, so that the Fund's net operating expenses, after giving effect to fees waived/expenses reimbursed and/or overdraft charges from the Fund's custodian, do not exceed the following annual rates as a percentage of the class' average daily net assets:
Class A | | | 0.79 | % | |
Class B | | | 1.54 | | |
Class C | | | 1.54 | | |
Class Z | | | 0.54 | | |
Under the agreement, the following fees and expenses are excluded from the waiver/reimbursement commitment, and therefore will be paid by the Fund, if applicable: taxes (including foreign transaction taxes), expenses associated with investments in affiliated and non-affiliated pooled investment vehicles (including mutual funds and exchange traded funds), transaction costs and brokerage commissions, costs related to any securities lending program, dividend expenses associated with securities sold short, inverse floater program fees and expenses, transaction charges and interest on borrowed money, interest, extraordinary expenses and any other expenses the exclusion of which is specifically approved by the Board. This agreement may be modified or amended only with approval from all parties. Class C distribution fees waived by the Distributor, as discussed above, are in addition to the waiver/reimbursement commitment under the agreement.
Note 4. Federal Tax Information
The timing and character of income and capital gain distributions are determined in accordance with income tax regulations, which may differ from GAAP because of temporary or permanent book to tax differences.
At October 31, 2012, these differences are primarily due to differing treatment for Trustees' deferred compensation, market discount, distributions and tax straddles. To the extent these differences are permanent, reclassifications are made among the components of the Fund's net assets in the Statement of Assets and Liabilities. Temporary differences do not require reclassifications. In the Statement of Assets and Liabilities the following reclassifications were made:
Undistributed net investment income | | $ | (45,085 | ) | |
Accumulated net realized gain | | | (10,288 | ) | |
Paid-in capital | | | 55,373 | | |
Net investment income and net realized gains (losses), as disclosed in the Statement of Operations, and net assets were not affected by this reclassification.
The tax character of distributions paid during the years indicated was as follows:
Year Ended October 31, | | 2012 | | 2011 | |
Tax-exempt income | | $ | 6,960,213 | | | $ | 4,484,699 | | |
Ordinary income | | | 5,490 | | | | 53,528 | | |
Long-term capital gains | | | 298,127 | | | | 45,876 | | |
Total | | | 7,263,830 | | | | 4,584,103 | | |
Short-term capital gain distributions, if any, are considered ordinary income distributions for tax purposes.
At October 31, 2012, the components of distributable earnings on a tax basis were as follows:
Undistributed ordinary income | | $ | 355,465 | | |
Undistributed tax-exempt income | | | 696,040 | | |
Undistributed accumulated long-term gain | | | 688,134 | | |
Unrealized appreciation | | | 20,808,401 | | |
At October 31, 2012, the cost of investments for federal income tax purposes was $178,340,421 and the aggregate gross unrealized appreciation and depreciation based on that cost was:
Unrealized appreciation | | $ | 21,206,788 | | |
Unrealized depreciation | | | (323,768 | ) | |
Net unrealized appreciation | | | 20,883,020 | | |
For the year ended October 31, 2012, $174,547 of capital loss carryforward was utilized.
Management of the Fund has concluded that there are no significant uncertain tax positions that would require recognition in the financial statements. However, management's conclusion may be subject to review and adjustment at a later date based on factors including, but not limited to, new tax laws, regulations, and administrative interpretations (including relevant court decisions). Generally, the Fund's federal tax returns for the prior three fiscal years remain subject to examination by the Internal Revenue Service.
Note 5. Portfolio Information
The cost of purchases and proceeds from sales of securities, excluding short-term obligations, aggregated to $46,535,118 and $45,146,952, respectively, for the year ended October 31, 2012.
Note 6. Shareholder Concentration
At October 31, 2012, two unaffiliated shareholder accounts owned an aggregate of 20.7% of the outstanding shares of the Fund. The Fund has no knowledge about whether any portion of those shares was owned beneficially by such accounts. Subscription and redemption activity by concentrated accounts may have a significant effect on the operations of the Fund.
Annual Report 2012
27
Columbia New York Tax-Exempt Fund
Notes to Financial Statements (continued)
October 31, 2012
Note 7. Line of Credit
The Fund has entered into a revolving credit facility with a syndicate of banks led by JPMorgan Chase Bank N.A. (JPMorgan) whereby the Fund may borrow for the temporary funding of shareholder redemptions or for other temporary or emergency purposes. The credit facility agreement, as amended, which is a collective agreement between the Fund and certain other funds managed by the Investment Manager, severally and not jointly, permits collective borrowings up to $500 million. Pursuant to a December 13, 2011 amendment to the credit facility agreement, interest is charged to each participating fund based on its borrowings at a rate equal to the higher of (i) the overnight federal funds rate plus 1.00% or (ii) the one-month LIBOR rate plus 1.00%. Each borrowing under the credit facility matures no later than 60 days after the date of borrowing. The Fund also pays a commitment fee equal to its pro rata share of the amount of the credit facility at a rate of 0.08% per annum.
Prior to December 13, 2011, interest was charged to each participating fund based on its borrowings at a rate equal to the sum of the federal funds rate plus (i) 1.25% per annum plus (ii) if one-month LIBOR exceeds the federal funds rate, the amount of such excess. The Fund also paid a commitment fee equal to its pro rata share of the amount of the credit facility at a rate of 0.10% per annum.
The Fund had no borrowings during the year ended October 31, 2012.
Note 8. Fund Merger
At the close of business on June 3, 2011, the Fund acquired the assets and assumed the identified liabilities of RiverSource New York Tax-Exempt Fund, a series of RiverSource Special Tax-Exempt Series Trust, and Seligman New York Municipal Fund, a series of Seligman Municipal Series, Inc. The mergers were completed after shareholders of the acquired funds approved the plan on February 15, 2011.
The aggregate net assets of the Fund immediately before the acquisitions were $62,703,788 and the combined net assets immediately after the acquisitions were $181,018,699.
The acquisitions were accomplished by a tax-free exchange of 9,512,113 shares of RiverSource New York Tax-Exempt Fund valued at $46,900,979 (including unrealized appreciation of $1,132,099) and 9,034,756 shares of Seligman New York Municipal Fund valued at $71,413,932 (including unrealized appreciation of $2,655,052).
In exchange for shares of RiverSource New York Tax-Exempt Fund and Seligman New York Municipal Fund, the Fund issued the following number of shares:
| | | RiverSource
New York
Tax-Exempt Fund | | Seligman
New York
Municipal Fund | |
Class A | | | 6,311,058 | | | | 9,114,926 | | |
Class B | | | 153,991 | | | | — | | |
Class C | | | 121,288 | | | | 911,895 | | |
For financial reporting purposes, net assets received and shares issued by the Fund were recorded at fair value; however, RiverSource New York Tax-Exempt Fund and Seligman New York Municipal Fund's cost of investments were carried forward.
The financial statements reflect the operations of the Fund for the period prior to the merger and the combined fund for the period subsequent to the merger. Because the combined investment portfolios have been managed as a single integrated portfolio since the merger was completed, it is not practicable to separate the amounts of revenue and earnings of RiverSource New York Tax-Exempt Fund and Seligman New York Municipal Fund that have been included in the combined Fund's Statement of Operations since the merger was completed.
Assuming the merger had been completed on November 1, 2010, the Fund's pro-forma net investment income, net gain on investments, net change in unrealized depreciation and net increase in net assets from operations for the year ended October 31, 2011 would have been approximately $7.4 million, $1.1million, $(3.5) million and $5.0 million, respectively.
Note 9. Significant Risks
Non-Diversification Risk
A non-diversified fund is permitted to invest a greater percentage of its total assets in fewer issuers than a diversified fund. The Fund may, therefore, have a greater risk of loss from a few issuers than a similar fund that invests more broadly.
Geographic Concentration Risk
Because state-specific tax-exempt funds invest primarily in the municipal securities issued by the state and political sub-divisions of the state, the Fund will be particularly affected by political and economic conditions and developments in the state in which it invests. The Fund may, therefore, have a greater risk than that of a municipal bond fund which is more geographically diversified. The value of the municipal securities owned by the Fund also may be adversely affected by future changes in federal or state income tax laws.
Annual Report 2012
28
Columbia New York Tax-Exempt Fund
Notes to Financial Statements (continued)
October 31, 2012
Note 10. Subsequent Events
Management has evaluated the events and transactions that have occurred through the date the financial statements were issued and noted no items requiring adjustment of the financial statements or additional disclosure.
Note 11. Information Regarding Pending and Settled Legal Proceedings
In December 2005, without admitting or denying the allegations, American Express Financial Corporation (AEFC, which is now known as Ameriprise Financial, Inc. (Ameriprise Financial)) entered into settlement agreements with the Securities and Exchange Commission (SEC) and Minnesota Department of Commerce (MDOC) related to market timing activities. As a result, AEFC was censured and ordered to cease and desist from committing or causing any violations of certain provisions of the Investment Advisers Act of 1940, the Investment Company Act of 1940, and various Minnesota laws. AEFC agreed to pay disgorgement of $10 million and civil money penalties of $7 million. AEFC also agreed to retain an independent distribution consultant to assist in developing a plan for distribution of all disgorgement and civil penalties ordered by the SEC in accordance with various undertakings detailed at www.sec.gov/litigation/admin/ia-2451.pdf. Ameriprise Financial and its affiliates have cooperated with the SEC and the MDOC in these legal proceedings, and have made regular reports to the funds' Boards of Trustees.
Ameriprise Financial and certain of its affiliates have historically been involved in a number of legal, arbitration and regulatory proceedings, including routine litigation, class actions, and governmental actions, concerning matters arising in connection with the conduct of their business activities. Ameriprise Financial believes that the Funds are not currently the subject of, and that neither Ameriprise Financial nor any of its affiliates are the subject of, any pending legal, arbitration or regulatory proceedings that are likely to have a material adverse effect on the Funds or the ability of Ameriprise Financial or its affiliates to perform under their contracts with the Funds. Ameriprise Financial is required to make 10-Q, 10-K and, as necessary, 8-K filings with the Securities and Exchange Commission on legal and regulatory matters that relate to Ameriprise Financial and its affiliates. Copies of these filings may be obtained by accessing the SEC website at www.sec.gov.
There can be no assurance that these matters, or the adverse publicity associated with them, will not result in increased fund redemptions, reduced sale of fund shares or other adverse consequences to the Funds. Further, although we believe proceedings are not likely to have a material adverse effect on the Funds or the ability of Ameriprise Financial or its affiliates
to perform under their contracts with the Funds, these proceedings are subject to uncertainties and, as such, we are unable to estimate the possible loss or range of loss that may result. An adverse outcome in one or more of these proceedings could result in adverse judgments, settlements, fines, penalties or other relief that could have a material adverse effect on the consolidated financial condition or results of operations of Ameriprise Financial.
Annual Report 2012
29
Columbia New York Tax-Exempt Fund
Report of Independent Registered Public Accounting Firm
To the Trustees of Columbia Funds Series Trust I and
the Shareholders of Columbia New York Tax-Exempt Fund
In our opinion, the accompanying statement of assets and liabilities, including the portfolio of investments, and the related statements of operations and of changes in net assets and the financial highlights present fairly, in all material respects, the financial position of Columbia New York Tax-Exempt Fund (the "Fund") (a series of Columbia Funds Series Trust I) at October 31, 2012, the results of its operations for the year then ended, the changes in its net assets for each of the two years in the period then ended and the financial highlights for each of the periods indicated, in conformity with accounting principles generally accepted in the United States of America. These financial statements and financial highlights (hereafter referred to as "financial statements") are the responsibility of the Fund's management. Our responsibility is to express an opinion on these financial statements based on our audits. We conducted our audits of these financial statements in accordance with the standards of the Public Company Accounting Oversight Board (United States). Those standards require that we plan and perform the audit to obtain reasonable assurance about whether the financial statements are free of material misstatement. An audit includes examining, on a test basis, evidence supporting the amounts and disclosures in the financial statements, assessing the accounting principles used and significant estimates made by management, and evaluating the overall financial statement presentation. We believe that our audits, which included confirmation of securities at October 31, 2012 by correspondence with the custodians, brokers and transfer agent, provide a reasonable basis for our opinion.
PricewaterhouseCoopers LLP
Minneapolis, Minnesota
December 21, 2012
Annual Report 2012
30
Columbia New York Tax-Exempt Fund
Federal Income Tax Information
(Unaudited)
The Fund hereby designates the following tax attributes for distributions paid in the fiscal year ended October 31, 2012. Shareholders will be notified in early 2013 of amounts for use in preparing 2012 income tax returns.
Tax Designations:
Capital Gain Dividend | | $ | 738,398 | | |
Exempt-Interest Dividends | | | 99.92 | % | |
Capital Gain Dividend. The Fund designates as a capital gain dividend the amount reflected above, or if subsequently determined to be different, the net capital gain of such fiscal period.
Exempt-Interest Dividends. The percentage of net investment income distributions paid during the fiscal year that qualifies as exempt-interest dividends for federal income tax purposes.
Annual Report 2012
31
Columbia New York Tax-Exempt Fund
The Trustees serve terms of indefinite duration. The names, addresses and birth years of the Trustees and Officers of the Funds in Columbia Funds Series Trust I, the year each was first elected or appointed to office, their principal business occupations during at least the last five years, the number of Funds overseen by each Trustee and other directorships they hold are shown below. Each officer listed below serves as an officer of each Fund in Columbia Funds Series Trust I.
Independent Trustees
Name, Address and Year of Birth,
Position with Funds, Year First
Elected or Appointed to Office | | Principal Occupation(s) During Past Five Years, Number of Funds in Columbia
Funds Complex Overseen by Trustee, Other Directorships Held
| |
Rodman L. Drake (Born 1943)
c/o Columbia Management Investment Advisers, LLC
225 Franklin Street
Boston, MA 02110
Trustee (since 1994) and
Chairman of the Board (since 2009) | | Independent consultant since 2010; Co-Founder of Baringo Capital LLC (private equity) from 1997 to 2008; CEO of Crystal River Capital, Inc. (real estate investment trust) from 2003 to 2010; Oversees 52; Jackson Hewitt Tax Service Inc. (tax preparation services from 2004 to 2011); Celgene Corporation (global biotechnology company); Student Loan Corporation (student loan provider from 2005 to 2010); Celgene Corporation (global biotechnology company); The Helios Funds and Brookfield Funds (closed-end funds); Crystal River Capital, Inc. from 2005 to 2010; Parsons Brinckerhoff from 1995 to 2008; and Apex Silver Mines Ltd. from 2007 to 2009 | |
Douglas A. Hacker (Born 1955)
c/o Columbia Management Investment Advisers, LLC
225 Franklin Street
Boston, MA 02110
Trustee (since 1996) | | Independent business executive since May 2006; Executive Vice President — Strategy of United Airlines from December 2002 to May 2006; President of UAL Loyalty Services (airline marketing company) from September 2001 to December 2002; Executive Vice President and Chief Financial Officer of United Airlines from July 1999 to September 2001. Oversees 52; Nash Finch Company (food distributor); Aircastle Limited (aircraft leasing); and SeaCube Container Leasing Ltd. (container leasing) | |
Janet Langford Kelly (Born 1957)
c/o Columbia Management Investment Advisers, LLC
225 Franklin Street
Boston, MA 02110
Trustee (since 1996) | | Senior Vice President, General Counsel and Corporate Secretary, ConocoPhillips (integrated energy company) since September 2007; Deputy General Counsel — Corporate Legal Services, ConocoPhillips from August 2006 to August 2007; Partner, Zelle, Hofmann, Voelbel, Mason & Gette LLP (law firm) from March 2005 to July 2006; Adjunct Professor of Law, Northwestern University from September 2004 to June 2006; Director, UAL Corporation (airline) from February 2006 to July 2006; Chief Administrative Officer and Senior Vice President, Kmart Holding Corporation (consumer goods) from September 2003 to March 2004. Oversees 52; None | |
Nancy T. Lukitsh (Born 1956)
c/o Columbia Management Investment Advisers, LLC
225 Franklin Street
Boston, MA 02110
Trustee (since 2011) | | Senior Vice President, Partner and Director of Marketing, Wellington Management Company, LLP (investment adviser) from 1997 to 2010; Chair, Wellington Management Investment Portfolios (commingled non-U.S. investment pools) from 2007 to 2010; Director, Wellington Trust Company, NA and other Wellington affiliates from 1997 to 2010. Oversees 52; None | |
William E. Mayer (Born 1940)
c/o Columbia Management Investment Advisers, LLC
225 Franklin Street
Boston, MA 02110
Trustee (since 1994) | | Partner, Park Avenue Equity Partners (private equity) since February 1999; Dean and Professor, College of Business and Management, University of Maryland from 1992 to 1996. Oversees 52; DynaVox Inc. (speech creation); Lee Enterprises (print media); WR Hambrecht + Co. (financial service provider) from 2000 to 2012; BlackRock Kelso Capital Corporation (investment company) | |
David M. Moffett (Born 1952)
c/o Columbia Management Investment Advisers, LLC
225 Franklin Street
Boston, MA 02110
Trustee (since 2011) | | Retired. Chief Executive Officer, Federal Home Loan Mortgage Corporation, from 2008 to 2009; Senior Adviser, Global Financial Services Group, Carlyle Group, Inc., from 2007 to 2008; Vice Chairman and Chief Financial Officer, U.S. Bancorp, from 1993 to 2007. Oversees 52; CIT Group Inc. (commercial and consumer finance); eBay Inc. (online trading community); MBIA Inc. (financial service provider); E.W. Scripps Co. (print and television media), Building Materials Holding Corp. (building materials and construction services); and University of Oklahoma Foundation. | |
Charles R. Nelson (Born 1942)
c/o Columbia Management Investment Advisers, LLC
225 Franklin Street
Boston, MA 02110
Trustee (since 1981) | | Retired Professor Emeritus, University of Washington, since 2011; Professor of Economics, University of Washington from January 1976 to 2011; Ford and Louisa Van Voorhis Professor of Political Economy, University of Washington from 1993 to 2011; Adjunct Professor of Statistics, University of Washington from 1980 to 2011; Associate Editor, Journal of Money Credit and Banking from 1993 to 2008; consultant on econometric and statistical matters. Oversees 52; None | |
John J. Neuhauser (Born 1943)
c/o Columbia Management Investment Advisers, LLC
225 Franklin Street
Boston, MA 02110
Trustee (since 1984) | | President, Saint Michael's College, since August 2007; Director or Trustee of several non-profit organizations, including Fletcher Allen Health Care, Inc.; University Professor, Boston College from November 2005 to August 2007; Academic Vice President and Dean of Faculties, Boston College from August 1999 to October 2005. Oversees 52; Liberty All-Star Equity Fund and Liberty All-Star Growth Fund (closed-end funds) | |
Annual Report 2012
32
Columbia New York Tax-Exempt Fund
Trustees and Officers (continued)
Independent Trustees (continued)
Name, Address and Year of Birth,
Position with Funds, Year First
Elected or Appointed to Office | | Principal Occupation(s) During Past Five Years, Number of Funds in Columbia
Funds Complex Overseen by Trustee, Other Directorships Held
| |
Patrick J. Simpson (Born 1944)
c/o Columbia Management Investment Advisers, LLC
225 Franklin Street
Boston, MA 02110
Trustee (since 2000) | | Partner, Perkins Coie LLP (law firm). Oversees 52; None | |
Anne-Lee Verville (Born 1945)
c/o Columbia Management Investment Advisers, LLC
225 Franklin Street
Boston, MA 02110
Trustee (since 1998) | | Retired. General Manager — Global Education Industry from 1994 to 1997, President — Application Systems Division from 1991 to 1994, Chief Financial Officer — US Marketing & Services from 1988 to 1991, and Chief Information Officer from 1987 to 1988, IBM Corporation (computer and technology). Oversees 52; Enesco Group, Inc. (producer of giftware and home and garden decor products) from 2001 to 2006 | |
Interested Trustee
Name, Address and Year of Birth,
Position with Funds, Year First
Elected or Appointed to Office | | Principal Occupation(s) During Past Five Years, Number of Funds in Columbia
Funds Complex Overseen by Trustee, Other Directorships Held
| |
William F. Truscott (born 1960)
53600 Ameriprise Financial Center
Minneapolis, MN 55474
Senior Vice President (since 2012) | | Chairman of the Board and President, Columbia Management Investment Advisers, LLC since May 2010 and February 2012, respectively (previously President, Chairman of the Board and Chief Investment Officer, from 2001 to April 2010); Chief Executive Officer, U.S. Asset Management & President, Annuities, Ameriprise Financial, Inc. since May 2010 (previously President — U.S. Asset Management and Chief Investment Officer from 2005 to April 2010, and Senior Vice President — Chief Investment Officer, from 2001 to 2005); Director, President and Chief Executive Officer, Ameriprise Certificate Company since 2006; Director and Chief Executive Officer, Columbia Management Investment Distributors, Inc. since May 2010 and February 2012, respectively (previously Chairman of the Board and Chief Executive Officer from 2008 to April 2010); Chairman of the Board and Chief Executive Officer, RiverSource Distributors, Inc. since 2006. Oversees 208; Columbia Funds Board. | |
The Statement of Additional Information includes additional information about the Trustees of the Funds and is available, without charge, upon request by calling 1-800-345-6611.
Officers
Name, Year of Birth and Address | | Principal Occupation(s) During the Past Five Years | |
J. Kevin Connaughton (Born 1964)
225 Franklin Street
Boston, MA 02110
President (since 2009) | | Senior Vice President and General Manager — Mutual Fund Products, Columbia Management Investment Advisers, LLC since May 2010; President, Columbia Funds, since 2009, and RiverSource Funds, since May 2010 (previously Senior Vice President and Chief Financial Officer, Columbia Funds, from June 2008 to January 2009, Treasurer, Columbia Funds, from October 2003 to May 2008, and senior officer of various other affiliated funds since 2000); Managing Director, Columbia Management Advisors, LLC from December 2004 to April 2010. | |
Michael G. Clarke (Born 1969)
225 Franklin Street
Boston, MA 02110
Treasurer (since 2011) and Chief Financial Officer (since 2009) | | Vice President, Columbia Management Investment Advisers, LLC since May 2010; Managing Director of Fund Administration, Columbia Management Advisors, LLC, from September 2004 to April 2010; senior officer of Columbia Funds and affiliated funds since 2002. | |
Scott R. Plummer (Born 1959)
5228 Ameriprise Financial Center
Minneapolis, MN 55474
Senior Vice President, Assistant Secretary and Chief Legal Officer (since 2010) | | Senior Vice President, Chief Legal Officer and Assistant Secretary, Columbia Management Investment Advisers, LLC since June 2005; Vice President and Lead Chief Counsel — Asset Management, Ameriprise Financial, Inc. since May 2010 (previously Vice President and Chief Counsel — Asset Management, from 2005 to April 2010); Vice President, Chief Counsel and Assistant Secretary, Columbia Management Investment Distributors, Inc. since 2008; Vice President, General Counsel and Secretary, Ameriprise Certificate Company since 2005; Chief Counsel, RiverSource Distributors, Inc. since 2006; Vice President, General Counsel and Secretary, RiverSource Funds since December 2006; Senior Vice President, Secretary and Chief Legal Officer, Columbia Funds, since May 2010. | |
Annual Report 2012
33
Columbia New York Tax-Exempt Fund
Trustees and Officers (continued)
Officers (continued)
Name, Year of Birth and Address | | Principal Occupation(s) During the Past Five Years | |
William F. Truscott (Born 1960)
53600 Ameriprise Financial Center
Minneapolis, MN 55474
Senior Vice President (since 2010) | | Chairman of the Board and President, Columbia Management Investment Advisers, LLC since May 2010 and February 2012, respectively (previously President, Chairman of the Board and Chief Investment Officer, from 2001 to April 2010); Chief Executive Officer, U.S. Asset Management & President, Annuities, Ameriprise Financial, Inc. since May 2010 (previously President — U.S. Asset Management and Chief Investment Officer from 2005 to April 2010); Director, President and Chief Executive Officer, Ameriprise Certificate Company since 2006; Director and Chief Executive Officer, Columbia Management Investment Distributors, Inc. since May 2010 and February 2012, respectively (previously Chairman of the Board and Chief Executive Officer from 2008 to April 2010); Chairman of the Board and Chief Executive Officer, RiverSource Distributors, Inc. since 2006. | |
Thomas P. McGuire (Born 1972)
225 Franklin Street
Boston, MA 02110
Chief Compliance Officer (since 2012) | | Vice President — Asset Management Compliance, Columbia Management Investment Advisers, LLC since 2010; Chief Compliance Officer, Ameriprise Certificate Company, since September 2010; Compliance Executive, Bank of America, 2005-2010. | |
Colin Moore (Born 1958)
225 Franklin Street
Boston, MA 02110
Senior Vice President (since 2010) | | Director and Chief Investment Officer, Columbia Management Investment Advisers, LLC since May 2010; Manager, Managing Director and Chief Investment Officer of Columbia Management Advisors, LLC from 2007 to April 2010; Head of Equities, Columbia Management Advisors, LLC from 2002 to 2007. | |
Amy Johnson (Born 1965)
5228 Ameriprise Financial Center
Minneapolis, MN 55474
Vice President (since 2010) | | Senior Vice President and Chief Operating Officer, Columbia Management Investment Advisers, LLC since May 2010 (previously Chief Administrative Officer, from 2009 until April 2010, Vice President — Asset Management and Trust Company Services, from 2006 to 2009, and Vice President — Operations and Compliance from 2004 to 2006). | |
Joseph F. DiMaria (Born 1968)
225 Franklin Street
Boston, MA 02110
Vice President (since 2011) and Chief Accounting Officer (since 2008) | | Vice President, Mutual Fund Administration, Columbia Management Investment Advisers, LLC, since May 2010; Director of Fund Administration, Columbia Management Advisors, LLC from January 2006 to April 2010; Head of Tax/Compliance and Assistant Treasurer, Columbia Management Advisors, LLC, from November 2004 to December 2005. | |
Stephen T. Welsh (born 1957)
225 Franklin Street
Boston, MA 02110
Vice President (since 2006) | | President and Director, Columbia Management Investment Services Corp. since May 2010; President and Director, Columbia Management Services, Inc. from July 2004 to April 2010; Managing Director, Columbia Management Distributors, Inc. from August 2007 to April 2010. | |
Paul D. Pearson (born 1956)
10468 Ameriprise Financial Center
Minneapolis, MN 55474
Vice President and Assistant Treasurer (since 2011) | | Vice President, Investment Accounting, Columbia Management Investment Advisers, LLC, since May 2010; Vice President, Managed Assets, Investment Accounting, Ameriprise Financial Corporation. | |
Paul B. Goucher (born 1968)
5228 Ameriprise Financial Center
Minneapolis, MN 55474
Vice President and Assistant Secretary (since 2010) | | Vice President and Chief Counsel of Ameriprise Financial since January 2010 (formerly Vice President and Group Counsel from November 2008 to January 2010); Director, Managing Director and General Counsel of J. & W. Seligman & Co. Incorporated (Seligman) from July 2008 to November 2008 and Managing Director and Associate General Counsel of Seligman from January 2005 to July 2008. | |
Christopher O. Petersen (born 1970)
5228 Ameriprise Financial Center
Minneapolis, MN 55474
Vice President (since 2010) and Secretary (since 2011) | | Vice President and Chief Counsel, Ameriprise Financial since January 2010 (formerly Vice President and Group Counsel or Counsel from April 2004 to January 2010); Assistant Secretary of RiverSource Funds since January 2007; officer of Columbia Funds and affiliated funds since 2007. | |
Michael E. DeFao (born 1968)
225 Franklin Street
Boston, MA 02110
Vice President and Assistant Secretary (since 2011) | | Vice President and Chief Counsel, Ameriprise Financial since May 2010; Associate General Counsel, Bank of America from June 2005 to April 2010. | |
Annual Report 2012
34
Columbia New York Tax-Exempt Fund
Board Consideration and Approval of
Advisory Agreement
On June 6, 2012, the Board of Trustees (the "Board") and the Trustees who are not interested persons (as defined in the Investment Company Act of 1940) of the Trust (the "Independent Trustees") unanimously approved the continuation of the Investment Management Services Agreement (the "Advisory Agreement") with Columbia Management Investment Advisers, LLC (the "Investment Manager") with respect to Columbia New York Tax-Exempt Fund (the "Fund"), a series of the Trust. As detailed below, the Advisory Fees and Expenses Committee (the "Committee") and the Board met on multiple occasions to review and discuss, both among themselves and with the management team of the Investment Manager, materials provided by the Investment Manager before determining to approve the continuation of the Advisory Agreement.
In connection with their deliberations regarding the continuation of the Advisory Agreement, the Committee and the Board requested and evaluated materials from the Investment Manager regarding the Fund and the Advisory Agreement, and discussed these materials with representatives of the Investment Manager at the Committee meeting held on June 5, 2012 and at the Board meeting held on June 6, 2012. In addition, the Board considers matters bearing on the Advisory Agreement at most of its other meetings throughout the year and meets regularly with senior management of the Funds and the Investment Manager. Through the Board's Investment Oversight Committees, Trustees also meet with selected Fund portfolio managers and other investment personnel at various times throughout the year. The Committee and the Board also consulted with Fund counsel and with the Independent Trustees' independent legal counsel, who advised on the legal standard for consideration by the Board and otherwise assisted the Board in its deliberations. On June 5, 2012, the Committee recommended that the Board approve the continuation of the Advisory Agreement. On June 6, 2012, the Board, including the Independent Trustees, voting separately, unanimously approved the continuation of the Advisory Agreement for the Fund.
The Committee and the Board considered all information that they, their legal counsel, or the Investment Manager believed reasonably necessary to evaluate and to determine whether to approve the continuation of the Advisory Agreement. In their deliberations, the Trustees did not identify any particular information that was all-important or controlling, and individual Trustees may have attributed different weights to the various factors. The information and factors considered by the Committee and the Board in recommending for approval or approving the continuation of the Advisory Agreement for the Fund included the following:
• Information on the investment performance of the Fund relative to the performance of the Fund's benchmarks and the performance of a group of comparable mutual funds, as determined by an independent third-party data provider;
• Information on the Fund's advisory fees and total expenses, including information comparing the Fund's expenses to those of a group of comparable mutual funds, as determined by an independent third-party data provider;
• The Investment Manager's agreement to contractually limit or cap total operating expenses for the Fund so that total operating expenses (excluding certain fees and expenses, such as transaction costs and certain other investment related expenses, interest, taxes, acquired fund fees and expenses, and extraordinary expenses) would not exceed the median expenses of a group of comparable funds (as determined from time to time, generally annually, by an independent third-party data provider);
• The terms and conditions of the Advisory Agreement, including that the advisory fee rates payable by the Fund would not change;
• The terms and conditions of other agreements and arrangements with affiliates of the Investment Manager relating to the operations of the Fund, including the Administrative Services Agreement, the Distribution Agreement and the Transfer and Dividend Disbursing Agent Agreement, noting in the case of the Transfer and Dividend Disbursing Agent Agreement certain proposed changes to the fee rates payable thereunder;
• Descriptions of various functions performed by the Investment Manager under the Advisory Agreement, including portfolio management and portfolio trading practices;
• Information regarding the management fees and investment performance of any comparable portfolios of other clients of the Investment Manager, including institutional separate accounts; and
• The profitability to the Investment Manager and its affiliates from their relationships with the Fund.
Annual Report 2012
35
Columbia New York Tax-Exempt Fund
Board Consideration and Approval of
Advisory Agreement (continued)
Nature, Extent and Quality of Services to be Provided under the Advisory Agreement
The Committee and the Board considered the nature, extent and quality of services provided to the Fund by the Investment Manager and its affiliates under the Advisory Agreement and under separate agreements for the provision of transfer agency and administrative services, and the resources dedicated to the Fund and the other Columbia Funds by the Investment Manager and its affiliates. The Committee and the Board considered, among other things, the Investment Manager's ability to attract, motivate and retain highly qualified research, advisory and supervisory investment professionals (including personnel and other resources, compensation programs for personnel involved in fund management, reputation and other attributes), the portfolio management services provided by those investment professionals, the quality of the Investment Manager's investment research capabilities and trade execution services, and the other resources that the Investment Manager devotes to the Fund. The Committee and the Board also considered the potential benefits to shareholders of investing in a mutual fund that is part of a fund complex offering exposure to a variety of asset classes and investment disciplines and providing a variety of fund and shareholder services.
The Committee and the Board also considered the professional experience and qualifications of the senior personnel of the Investment Manager. The Committee and the Board noted the compliance programs of and the compliance-related resources provided to the Fund by the Investment Manager and its affiliates, and considered the Investment Manager's ability to provide administrative services to the Fund pursuant to a separate administrative services agreement, including the Investment Manager's ability to coordinate the activities of the Fund's other service providers. After reviewing these and related factors, the Committee and the Board concluded, within the context of their overall conclusions, that the expected nature, extent and quality of the services to be provided to the Fund under the Advisory Agreement supported the continuation of such agreement.
Investment Performance
The Committee and the Board reviewed information about the performance of the Fund over various time periods, including performance information relative to benchmarks and information based on reports of an independent third-party data provider that compared the performance of the Fund to the performance of a group of comparable mutual funds. The Committee and the Board also reviewed a description of the third party's methodology for identifying the Fund's peer groups for purposes of performance and expense comparisons. In the case of each Fund whose performance lagged that of a relevant peer group for certain (although not necessarily all) periods, the Committee and the Board concluded that other factors relevant to performance were sufficient, in light of other considerations, to warrant continuation of the Fund's Advisory Agreement. Those factors varied from fund to fund, but included one or more of the following: (i) that the Fund's performance, although lagging in certain recent periods, was stronger over the longer term; (ii) that the underperformance was attributable, to a significant extent, to investment decisions that were reasonable and consistent with the Fund's investment strategy and policies and that the Fund was performing within a reasonable range of expectations, given those investment decisions, market conditions and the Fund's investment strategy; (iii) that the Fund's performance was competitive when compared to other relevant performance benchmarks or peer groups; and (iv) that the Investment Manager had taken or was taking steps designed to help improve the Fund's investment performance, including, but not limited to, replacing portfolio managers, enhancing the resources supporting the portfolio managers, or modifying investment strategies.
The Committee and the Board noted that, through December 31, 2011, the Fund's performance was in the eighth, twenty third and ninth percentiles (where the best performance would be in the first percentile) of its category selected by an independent third-party data provider for the purposes of performance comparisons for the one-, three- and five- year periods, respectively.
The Committee and the Board also considered the Investment Manager's performance and reputation generally, the Investment Manager's historical responsiveness to Board concerns about performance and the Investment Manager's willingness to take steps intended to improve performance. After reviewing these and related factors, the Committee and the Board concluded, within the context of their overall conclusions regarding the Advisory Agreement, that the performance of the Fund and the Investment Manager was sufficient, in light of other considerations, to warrant the continuation of the Advisory Agreement.
Annual Report 2012
36
Columbia New York Tax-Exempt Fund
Board Consideration and Approval of
Advisory Agreement (continued)
Investment Advisory Fee Rates and Other Expenses
The Committee and the Board considered the advisory fees to be charged to the Fund under the Advisory Agreement as well as the total expenses to be incurred by the Fund. In assessing the reasonableness of the fees under the Advisory Agreement, the Committee and the Board considered, among other information, the Fund's advisory fee and its expected total expense ratio as a percentage of average daily net assets. The Committee and the Board noted that the Fund's actual management fee and total net expense ratio are ranked in the first and third quintiles, respectively, against the Fund's expense universe as determined by an independent third-party data provider for purposes of expense comparison. The Committee and the Board also took into account the fee waiver and expense limitation arrangements agreed to by the Investment Manager, as noted above.
The Committee and the Board also considered the fact that the advisory fee rates payable by the Fund to the Investment Manager under the Advisory Agreement were the same as those currently paid by the Fund to the Investment Manager.
The Committee and the Board also received and considered information about the advisory fees charged by the Investment Manager to institutional separate accounts. In considering the fees charged to those accounts, the Committee and the Board took into account, among other things, the Investment Manager's representations about the differences between managing mutual funds as compared to other types of accounts, including differences in the services provided, differences in the risk profile of such business for the Investment Manager and the additional resources required to manage mutual funds effectively. In evaluating the Fund's advisory fees, the Committee and the Board also took into account the demands, complexity and quality of the investment management of the Fund.
After reviewing these and related factors, the Committee and the Board concluded, within the context of their overall conclusions, that the advisory fee rates and expenses of the Fund supported the continuation of the Advisory Agreement.
Costs of Services to be Provided and Profitability
The Committee and the Board also took note of the costs of the services provided (both on an absolute and relative basis) and the profitability to the Investment Manager and its affiliates in connection with their relationships with the Fund. In evaluating these considerations, the Committee and the Board took note of the advisory fees charged by the Investment Manager to other clients, including fees charged by the Investment Manager to any institutional separate account clients with similar investment strategies to those of the Fund.
The Committee and the Board also considered the compensation directly or indirectly received by the Investment Manager's affiliates in connection with their relationships with the Fund. The Committee and the Board reviewed information provided by management as to the profitability of the Investment Manager and its affiliates of their relationships with the Fund, and information about the allocation of expenses used to calculate profitability. When reviewing profitability, the Committee and the Board also considered court cases in which adviser profitability was an issue in whole or in part, the performance of the fund, the expense ratio of the fund, and the implementation of expense limitations with respect to the fund. The Committee and the Board also considered information provided by the Investment Manager regarding its financial condition and comparing its profitability to that of other asset management firms that are, or are subsidiaries of, publicly traded companies.
After reviewing these and related factors, the Committee and the Board concluded, within the context of their overall conclusions, that the profitability to the Investment Manager and its affiliates from their relationships with the Fund supported the continuation of the Advisory Agreement.
Economies of Scale
The Committee and the Board considered the potential existence of economies of scale in the provision by the Investment Manager of services to the Fund, to groups of related funds, and to the Investment Manager's investment advisory clients as a whole, and whether those economies of scale were shared with the Fund through breakpoints in investment advisory fees or other means, such as expense limitation arrangements and additional investments by the Investment Manager in investment, trading and compliance resources. The Committee and the Board noted that the investment advisory fee schedules for the Fund contained breakpoints that would reduce the fee rate on assets above specified threshold levels.
Annual Report 2012
37
Columbia New York Tax-Exempt Fund
Board Consideration and Approval of
Advisory Agreement (continued)
In considering these issues, the Committee and the Board also considered the costs of the services provided (both on an absolute and relative basis) and the profitability to the Investment Manager and its affiliates from their relationships with the Fund, as discussed above. After reviewing these and related factors, the Committee and the Board concluded, within the context of their overall conclusions, that the extent to which economies of scale were expected to be shared with the Fund supported the continuation of the Advisory Agreement.
Other Benefits to the Investment Manager
The Committee and the Board received and considered information regarding "fall-out" or ancillary benefits received by the Investment Manager and its affiliates as a result of their relationships with the Fund, such as the engagement of the Investment Manager to provide administrative services to the Fund and the engagement of the Investment Manager's affiliates to provide distribution and transfer agency services to the Fund. The Committee and the Board considered that the Fund's distributor retains a portion of the distribution fees from the Fund and receives a portion of the sales charges on sales or redemptions of certain classes of shares of the Fund. The Committee and the Board also considered the benefits of research made available to the Investment Manager by reason of brokerage commissions generated by the Fund's securities transactions, and reviewed information about the Investment Manager's practices with respect to allocating portfolio brokerage for brokerage and research services. The Committee and the Board considered the possible conflicts of interest associated with certain fall-out or other ancillary benefits and the reporting, disclosure and other processes that would be in place to address such possible conflicts of interest. The Committee and the Board recognized that the Investment Manager's profitability would be somewhat lower without these benefits.
Conclusion
The Committee and the Board reviewed all of the above considerations in reaching their decisions to recommend or approve the continuation of the Advisory Agreement. No single item was identified as paramount or controlling, and individual Trustees may have attributed different weights to various factors. Based on their evaluation of all factors that they deemed to be material, including those factors described above, and assisted by the advice of independent legal counsel, the Board, including the Independent Trustees, voting separately, unanimously approved the continuation of the Advisory Agreement.
Annual Report 2012
38
This page intentionally left blank.
Annual Report 2012
39
This page intentionally left blank.
Annual Report 2012
40
Columbia New York Tax-Exempt Fund
Important Information About This Report
Each fund mails one shareholder report to each shareholder address. If you would like more than one report, please call shareholder services at 800.345.6611 and additional reports will be sent to you.
The policy of the Board is to vote the proxies of the companies in which each fund holds investments consistent with the procedures as stated in the Statement of Additional Information (SAI). You may obtain a copy of the SAI without charge by calling 800.345.6611; contacting your financial intermediary; visiting columbiamanagement.com; or searching the website of the Securities and Exchange Commission (SEC) at sec.gov. Information regarding how each fund voted proxies relating to portfolio securities is filed with the SEC by August 31 for the most recent 12-month period ending June 30 of that year, and is available without charge by visiting columbiamanagement.com; or searching the website of the SEC at sec.gov.
Each fund files a complete schedule of portfolio holdings with the SEC for the first and third quarters of each fiscal year on Form N-Q. Each fund's Form N-Q is available on the SEC's website at sec.gov and may be reviewed and copied at the SEC's Public Reference Room in Washington, D.C. Information on the operation of the Public Reference Room may be obtained by calling 800.SEC.0330. Each fund's complete schedule of portfolio holdings, as filed on Form N-Q, can also be obtained without charge, upon request, by calling 800.345.6611.
Annual Report 2012
41

Columbia New York Tax-Exempt Fund
P.O. Box 8081
Boston, MA 02266-8081
columbiamanagement.com
This information is for use with concurrent or prior delivery of a fund prospectus. Please read and consider the investment objectives, risks, charges and expenses for any fund carefully before investing. For a prospectus which contains this and other important information about the Fund go to columbiamanagement.com. The Fund is distributed by Columbia Management Investment Distributors, Inc., member FINRA, and managed by Columbia Management Investment Advisers, LLC.
© 2012 Columbia Management Investment Advisers, LLC. All rights reserved.
C-1021 D (12/12)
Annual Report
October 31, 2012

Columbia Connecticut Intermediate Municipal Bond Fund
Not FDIC insured • No bank guarantee • May lose value
Columbia Connecticut Intermediate Municipal Bond Fund
 Dear Shareholders,
Stocks rebound around the world
After a weak second quarter, U.S. stock market averages rebounded in the third quarter, erasing earlier losses and boosting year-to-date returns well into double digits. Welcome news from Europe and additional quantitative easing in the United States by the Federal Reserve Board helped bolster the rally. The Standard & Poor's 500 Index (S&P 500 Index) rose 6.35% (total return) for the quarter. The Dow Jones Industrial Average advanced 4.32% for the same period. From the beginning of the calendar year through September 30, 2012, the S&P 500 Index was up 16.44% (total return). And, as of the end of September, the S&P 500 Index stood at 1,440 — approximately 8% below its all-time high of 1,565 that was set on October 9, 2007.
Outside the United States, stock markets of both developed and emerging market economies rebounded, as measured in U.S. dollars. Investors responded favorably to the announcement of policy measures aimed to resolve the eurozone crisis, which could potentially have a favorable impact on growth in emerging market economies. A weaker dollar also benefited returns to U.S. investors.
Solid gains for fixed income
Within fixed income, investors appeared to be increasingly willing to take on risk as they abandoned higher quality sectors that dominated the performance rankings in the second quarter and favored riskier sectors, where yield spreads tightened by a significant margin. Fixed-income returns were strong, but unlike equities, they have been less volatile, accumulating steadily over the course of the year. Gains were the highest for high-yield and emerging market bonds. By contrast, government issued debt securities eked out smaller gains.
Stay on track with Columbia Management
Backed by more than 100 years of experience, Columbia Management is one of the nation's largest asset managers. At the heart of our success — and, most importantly, that of our investors — are highly talented industry professionals, brought together by a unique way of working. We are dedicated to helping you take advantage of today's opportunities and anticipate tomorrow's. We stay abreast of the latest investment trends and ideas, using our collective insight to evaluate events and transform them into solutions you can use.
Visit columbiamanagement.com for:
> The Columbia Management Perspectives blog, featuring timely posts by our investment teams
> Detailed up-to-date fund performance and portfolio information
> Economic analysis and market commentary
> Quarterly fund commentaries
> Columbia Management Investor, our award-winning quarterly newsletter for shareholders
Thank you for your continued support of the Columbia Funds. We look forward to serving your investment needs for many years to come.
Best Regards,

J. Kevin Connaughton
President, Columbia Funds
The S&P 500 Index, an unmanaged index, measures the performance of 500 widely held, large-capitalization U.S. stocks and is frequently used as a general measure of market performance. The Dow Jones Industrial Average is a price weighted average of 30 actively traded shares of blue chip US industrial corporations listed on the New York Stock Exchange. Indices are not available for investment, are not professionally managed and do not reflect sales charges, fees, brokerage commissions, taxes or other expenses of investing.
Investors should consider the investment objectives, risks, charges and expenses of a mutual fund carefully before investing. For a free prospectus, which contains this and other important information about a fund, visit columbiamanagement.com. The prospectus should be read carefully before investing.
Columbia Funds are distributed by Columbia Management Investment Distributors, Inc., member FINRA, and managed by Columbia Management Investment Advisers, LLC.
© 2012 Columbia Management Investment Advisers, LLC. All rights reserved.
Columbia Connecticut Intermediate Municipal Bond Fund
Performance Overview | | | 2 | | |
Manager Discussion of Fund Performance | | | 4 | | |
Understanding Your Fund's Expenses | | | 6 | | |
Portfolio of Investments | | | 7 | | |
Statement of Assets and Liabilities | | | 13 | | |
Statement of Operations | | | 15 | | |
Statement of Changes in Net Assets | | | 16 | | |
Financial Highlights | | | 18 | | |
Notes to Financial Statements | | | 23 | | |
Report of Independent Registered
Public Accounting Firm | | | 29 | | |
Federal Income Tax Information | | | 30 | | |
Trustees and Officers | | | 31 | | |
Board Consideration and Approval of Advisory Agreement | | | 34 | | |
Important Information About This Report | | | 41 | | |
Fund Investment Manager
Columbia Management Investment
Advisers, LLC
225 Franklin Street
Boston, MA 02110
Fund Distributor
Columbia Management Investment
Distributors, Inc.
225 Franklin Street
Boston, MA 02110
Fund Transfer Agent
Columbia Management Investment
Services Corp.
P.O. Box 8081
Boston, MA 02266-8081
For more information about any of the funds, please visit columbiamanagement.com or call 800.345.6611. Customer Service Representatives are available to answer your questions Monday through Friday from 8 a.m. to 8 p.m. Eastern time.
The views expressed in this report reflect the current views of the respective parties. These views are not guarantees of future performance and involve certain risks, uncertainties and assumptions that are difficult to predict, so actual outcomes and results may differ significantly from the views expressed. These views are subject to change at any time based upon economic, market or other conditions and the respective parties disclaim any responsibility to update such views. These views may not be relied on as investment advice and, because investment decisions for a Columbia Fund are based on numerous factors, may not be relied on as an indication of trading intent on behalf of any particular Columbia Fund. References to specific securities should not be construed as a recommendation or investment advice.
Columbia Connecticut Intermediate Municipal Bond Fund
Performance Summary
> Columbia Connecticut Intermediate Municipal Bond Fund (the Fund) Class A shares returned 6.36% for the 12-month period that ended October 31, 2012.
> The Fund trailed its benchmark, the Barclays 3-15 Year Blend Municipal Bond Index, which returned 7.68% for the same time period.
> The Fund's investments in shorter-maturity securities detracted from results. Performance relative to the nationally-focused benchmark also was held back by the generally lower yields available from Connecticut AAA and A rated debt. Security selection in the hospital and education sectors helped performance.
Average Annual Total Returns (%) (for period ended October 31, 2012)
| | Inception | | 1 Year | | 5 Years | | 10 Years | |
Class A* | | 11/18/02 | | | | | | | | | | | | | |
Excluding sales charges | | | | | | | 6.36 | | | | 4.60 | | | | 3.65 | | |
Including sales charges | | | | | | | 2.89 | | | | 3.90 | | | | 3.14 | | |
Class B* | | 11/18/02 | | | | | | | | | | | | | |
Excluding sales charges | | | | | | | 5.56 | | | | 3.82 | | | | 2.87 | | |
Including sales charges | | | | | | | 2.56 | | | | 3.82 | | | | 2.87 | | |
Class C* | | 11/18/02 | | | | | | | | | | | | | |
Excluding sales charges | | | | | | | 5.94 | | | | 4.18 | | | | 3.24 | | |
Including sales charges | | | | | | | 4.94 | | | | 4.18 | | | | 3.24 | | |
Class T | | 06/26/00 | | | | | | | | | | | | | |
Excluding sales charges | | | | | | | 6.47 | | | | 4.71 | | | | 3.76 | | |
Including sales charges | | | | | | | 1.39 | | | | 3.69 | | | | 3.25 | | |
Class Z | | 08/01/94 | | | 6.63 | | | | 4.86 | | | | 3.91 | | |
Barclays 3-15 Year Blend Municipal Bond Index | | | | | | | 7.68 | | | | 6.11 | | | | 5.05 | | |
Returns for Class A are shown with and without the maximum initial sales charge of 3.25% (for the one-year and five-year periods) and 4.75% (for the 10-year period). (Prior to August 22, 2005, new purchases of Class A shares had a maximum initial sales charge of 4.75%.) Returns for Class B are shown with and without the applicable contingent deferred sales charge (CDSC) of 3.00% in the first year, declining to 1.00% in the fourth year and eliminated thereafter. Returns for Class C are shown with and without the 1.00% CDSC for the first year only. Returns for Class T are shown with and without the maximum sales charge of 4.75%. The Fund's other classes are not subject to sales charges and have limited eligibility. Please see the Fund's prospectuses for details. Performance for different share classes will vary based on differences in sales charges and fees associated with each class. All results shown assume reinvestment of distributions during the period. Returns do not reflect the deduction of taxes that a shareholder may pay on Fund distributions or on the redemption of Fund shares. Performance results reflect the effect of any fee waivers or reimbursements of Fund expenses by Columbia Management Investment Advisers, LLC and/or any of its affiliates. Absent these fee waivers or expense reimbursement arrangements, performance results would have been lower.
The performance information shown represents past performance and is not a guarantee of future results. The investment return and principal value of your investment will fluctuate so that your shares, when redeemed, may be worth more or less than their original cost. Current performance may be lower or higher than the performance information shown. You may obtain performance information current to the most recent month-end by contacting your financial intermediary, visiting columbiamanagement.com or calling 800.345.6611.
*The returns shown for periods prior to the share class inception date (including returns since inception if shown, which are since Fund inception) include the returns of the Fund's oldest share class. These returns are adjusted to reflect any higher class-related operating expenses of the newer share classes, as applicable. Please visit columbiamanagement.com/mutual-funds/appended-performance for more information.
The Barclays 3-15 Year Blend Municipal Bond Index is an unmanaged index that tracks the performance of municipal bonds issued after December 31, 1990, with remaining maturities between 2 and 17 years and at least $7 million in principal amount outstanding.
Indices are not available for investment, are not professionally managed and do not reflect sales charges, fees, brokerage commissions, taxes or other expenses of investing. Securities in the Fund may not match those in an index.
Annual Report 2012
2
Columbia Connecticut Intermediate Municipal Bond Fund
Performance Overview (continued)
Performance of a Hypothetical $10,000 Investment (November 1, 2002 – October 31, 2012)

The chart above shows the change in value of a hypothetical $10,000 investment in Class A shares of Columbia Connecticut Intermediate Municipal Bond Fund during the stated time period, and does not reflect the deduction of taxes that a shareholder may pay on Fund distributions or on the redemption of Fund shares. The performance of a $10,000 with sales charge for Class A shares is calculated with an initial sales charge of 4.75%, which was the effective sales charge prior to August 22, 2005.
Annual Report 2012
3
Columbia Connecticut Intermediate Municipal Bond Fund
Manager Discussion of Fund Performance
For the 12-month period that ended October 31, 2012, the Fund's Class A shares returned 6.36% excluding sales charges. By comparison, the Fund's benchmark, the Barclays 3-15 Year Blend Municipal Bond Index, which is national in scope, returned 7.68% for the same time period. The Fund's exposure to shorter-maturity securities detracted from relative results at a time when the longer end of the intermediate maturity range outperformed. In addition, the Fund had more exposure than the index to A rated bonds and was equally weighted in AAA rated securities, which detracted from returns as both groups offered lower yields than comparably-rated securities outside Connecticut. However, security selection in both the hospital and education sectors helped relative performance, as did an overweight in both sectors.
Key Industries Hold Back Recovery in Connecticut
Connecticut's economic rebound has been slowed by weak job growth in major industries, notably financial services and aerospace. Growth also has been held back by weakness in the housing market and in the construction industry. Reduced government spending further dampened the economic expansion in the state. Against this backdrop, investor demand for tax-advantaged municipal bond investments in Connecticut, as with the country overall, remained strong. The supply of new issuance was steady over the period, in part because many municipal issuers took advantage of falling interest rates to refinance debt and reduce borrowing costs. As a consequence, many newly issued bonds tended to offer lower yields than older, retired bonds.
Despite a relatively slow recovery, Connecticut municipal bonds retained solid credit ratings, which resulted in lower yields from better-quality bonds than available in many other states. For the municipal market nationwide, higher-yielding securities tended to outperform.
Short Maturities, Higher Quality Hampered Relative Performance
During the 12-month period, municipal bonds with maturities at the long end of the intermediate maturity spectrum — in the 12-to-17 year range — had the strongest performance. As a result, the Fund's exposure to shorter maturities held back results relative to the national benchmark. The Fund was somewhat constrained in its maturity focus because many new Connecticut issues tended to be relatively small local general obligation bonds with relatively shorter maturities. Moreover, while the Fund had an emphasis on A rated securities, the yield advantage of this group was weaker than of A rated bonds nationally, so the Connecticut bonds tended to produce less income. Similarly, lower-yielding AAA rated Connecticut-based securities held back results.
Hospital, Education Bonds Aided Results
The Fund's investments in the hospital and education sectors did better than the same sectors in the index. In addition, relative performance was augmented by overweight positions in both sectors. We increased exposure to the hospital sector, adding several new issuers, including Stamford Hospital and Bridgeport Hospital.
Portfolio Management
Brian McGreevy
Quality Breakdown (%)
(at October 31, 2012) | |
AAA rating | | | 13.9 | | |
AA rating | | | 43.0 | | |
A rating | | | 36.6 | | |
BBB rating | | | 4.1 | | |
Not rated | | | 2.4 | | |
Total | | | 100.0 | | |
Percentages indicated are based upon total fixed income securities (excluding Money Market Funds).
Bond ratings apply to the underlying holdings of the Fund and not the Fund itself and are divided into categories ranging from AAA (highest) to D (lowest), and are subject to change. The ratings shown are determined by using the middle rating of Moody's, S&P, and Fitch after dropping the highest and lowest available ratings. When a rating from only two agencies is available, the lower rating is used. When a rating from only one agency is available, that rating is used. When a bond is not rated by any of these agencies, it is designated as Not rated. Credit ratings are subjective opinions and not statements of fact.
Annual Report 2012
4
Columbia Connecticut Intermediate Municipal Bond Fund
Manager Discussion of Fund Performance (continued)
Looking Ahead
As Connecticut's major financial services and industrial companies continue to lag in new job creation, the state's recovery may trail that of the nation in the near term. However, the state has clusters of higher-growth industries, such as biotechnology, software development and medical research, which have the potential to help drive significant job growth over the longer term. We currently expect interest rates to remain low; and with a steep yield curve, we see opportunities to reduce exposure to very short-term bonds and pick up additional yield from longer-maturity securities without a significant increase in risk. (The yield curve charts the difference in yield of similar-quality bonds from short- to long-term maturities.) In the wake of the November 2012 elections, we plan to stay alert to potential changes in the tax code — a significant uncertainty for the municipal bond market.
Annual Report 2012
5
Columbia Connecticut Intermediate Municipal Bond Fund
Understanding Your Fund's Expenses
(Unaudited)
As an investor, you incur two types of costs. There are transaction costs, which generally include sales charges on purchases and may include redemption fees. There are also ongoing costs, which generally include management fees, distribution and service (Rule 12b-1) fees, and other fund expenses. The following information is intended to help you understand your ongoing costs (in dollars) of investing in the Fund and to help you compare these costs with the ongoing costs of investing in other mutual funds.
Analyzing Your Fund's Expenses
To illustrate these ongoing costs, we have provided examples and calculated the expenses paid by investors in each share class of the Fund during the period. The actual and hypothetical information in the table is based on an initial investment of $1,000 at the beginning of the period indicated and held for the entire period. Expense information is calculated two ways and each method provides you with different information. The amount listed in the "Actual" column is calculated using the Fund's actual operating expenses and total return for the period. You may use the Actual information, together with the amount invested, to estimate the expenses that you paid over the period. Simply divide your account value by $1,000 (for example, an $8,600 account value divided by $1,000 = 8.6), then multiply the results by the expenses paid during the period under the Actual column. The amount listed in the "Hypothetical" column assumes a 5% annual rate of return before expenses (which is not the Fund's actual return) and then applies the Fund's actual expense ratio for the period to the hypothetical return. You should not use the hypothetical account values and expenses to estimate either your actual account balance at the end of the period or the expenses you paid during the period. See "Compare With Other Funds" below for details on how to use the hypothetical data.
Compare With Other Funds
Since all mutual funds are required to include the same hypothetical calculations about expenses in shareholder reports, you can use this information to compare the ongoing cost of investing in the Fund with other funds. To do so, compare the hypothetical example with the 5% hypothetical examples that appear in the shareholder reports of other funds. As you compare hypothetical examples of other funds, it is important to note that hypothetical examples are meant to highlight the ongoing costs of investing in a fund only and do not reflect any transaction costs, such as sales charges, or redemption or exchange fees. Therefore, the hypothetical calculations are useful in comparing ongoing costs only, and will not help you determine the relative total costs of owning different funds. If transaction costs were included in these calculations, your costs would be higher.
May 1, 2012 – October 31, 2012
| | Account Value at the Beginning
of the Period ($) | | Account Value at the End of the
Period ($) | | Expenses Paid During the
Period ($) | | Fund's Annualized
Expense Ratio (%) | |
| | Actual | | Hypothetical | | Actual | | Hypothetical | | Actual | | Hypothetical | | Actual | |
Class A | | | 1,000.00 | | | | 1,000.00 | | | | 1,021.70 | | | | 1,021.17 | | | | 4.01 | | | | 4.01 | | | | 0.79 | | |
Class B | | | 1,000.00 | | | | 1,000.00 | | | | 1,017.90 | | | | 1,017.39 | | | | 7.81 | | | | 7.81 | | | | 1.54 | | |
Class C | | | 1,000.00 | | | | 1,000.00 | | | | 1,019.70 | | | | 1,019.15 | | | | 6.04 | | | | 6.04 | | | | 1.19 | | |
Class T | | | 1,000.00 | | | | 1,000.00 | | | | 1,022.20 | | | | 1,021.67 | | | | 3.51 | | | | 3.51 | | | | 0.69 | | |
Class Z | | | 1,000.00 | | | | 1,000.00 | | | | 1,023.00 | | | | 1,022.42 | | | | 2.75 | | | | 2.75 | | | | 0.54 | | |
Expenses paid during the period are equal to the annualized expense ratio for each class as indicated above, multiplied by the average account value over the period and then multiplied by the number of days in the Fund's most recent fiscal half year and divided by 366.
Expenses do not include fees and expenses incurred indirectly by the Fund from the underlying funds in which the Fund may invest (also referred to as "acquired funds"), including affiliated and non-affiliated pooled investment vehicles (including mutual funds and exchange-traded funds).
Had Columbia Management Investment Advisers, LLC and/or certain of its affiliates not waived/reimbursed certain fees and expenses, account value at the end of the period would have been reduced.
Annual Report 2012
6
Columbia Connecticut Intermediate Municipal Bond Fund
Portfolio of Investments
October 31, 2012
(Percentages represent value of investments compared to net assets)
Municipal Bonds 96.6%
Issue
Description | | Coupon
Rate | | Principal
Amount ($) | | Value ($) | |
Disposal 0.8% | |
New Haven Solid Waste Authority
Revenue Bonds
Series 2008
06/01/23 | | | 5.125 | % | | | 1,520,000 | | | | 1,708,708 | | |
Higher Education 10.7% | |
Connecticut State Health & Educational Facility Authority
Refunding Revenue Bonds
Connecticut State University
Series 2012L
11/01/23 | | | 4.000 | % | | | 2,065,000 | | | | 2,346,026 | | |
Sacred Heart University
Series 2012H (AGM)
07/01/19 | | | 5.000 | % | | | 2,350,000 | | | | 2,767,877 | | |
Revenue Bonds
Fairfield University
Series 2008N
07/01/18 | | | 5.000 | % | | | 2,120,000 | | | | 2,496,406 | | |
07/01/22 | | | 5.000 | % | | | 2,500,000 | | | | 2,829,675 | | |
Quinnipiac University
Series 2007I (NPFGC)
07/01/22 | | | 5.000 | % | | | 2,000,000 | | | | 2,219,840 | | |
Quinnipiac University Health & Education
Series 2007 (NPFGC)
07/01/28 | | | 5.000 | % | | | 2,000,000 | | | | 2,199,280 | | |
Sacred Heart University
Series 2011G
07/01/20 | | | 5.000 | % | | | 1,190,000 | | | | 1,353,185 | | |
Trinity College
Series 1998F (NPFGC)
07/01/21 | | | 5.500 | % | | | 500,000 | | | | 607,370 | | |
Series 2004H (NPFGC)
07/01/25 | | | 5.000 | % | | | 540,000 | | | | 573,615 | | |
Yale University
Series 1997T-1
07/01/29 | | | 4.700 | % | | | 4,800,000 | | | | 5,424,000 | | |
Total | | | | | | | 22,817,274 | | |
Hospital 10.8% | |
Connecticut State Health & Educational Facility Authority
Revenue Bonds
Bridgeport Hospital
Series 2012D
07/01/22 | | | 5.000 | % | | | 1,400,000 | | | | 1,643,054 | | |
Health System Catholic East
Series 2010
11/15/29 | | | 4.750 | % | | | 3,420,000 | | | | 3,795,961 | | |
Hospital for Special Care
Series 2007C (RAD)
07/01/17 | | | 5.250 | % | | | 500,000 | | | | 551,040 | | |
07/01/20 | | | 5.250 | % | | | 1,235,000 | | | | 1,332,775 | | |
07/01/27 | | | 5.250 | % | | | 750,000 | | | | 782,528 | | |
Lawrence & Memorial Hospital
Series 2011S
07/01/15 | | | 5.000 | % | | | 850,000 | | | | 947,104 | | |
Municipal Bonds (continued)
Issue
Description | | Coupon
Rate | | Principal
Amount ($) | | Value ($) | |
Middlesex Hospital
Series 2006M (AGM)
07/01/27 | | | 4.875 | % | | | 500,000 | | | | 547,685 | | |
Series 2011N
07/01/17 | | | 5.000 | % | | | 1,175,000 | | | | 1,355,656 | | |
07/01/20 | | | 5.000 | % | | | 1,365,000 | | | | 1,588,259 | | |
07/01/21 | | | 5.000 | % | | | 1,000,000 | | | | 1,159,470 | | |
Stamford Hospital
Series 2012J
07/01/19 | | | 4.000 | % | | | 1,435,000 | | | | 1,588,703 | | |
07/01/20 | | | 5.000 | % | | | 1,525,000 | | | | 1,774,429 | | |
Western Connecticut Health Network
Series 2011
07/01/19 | | | 5.000 | % | | | 1,760,000 | | | | 2,040,914 | | |
07/01/20 | | | 5.000 | % | | | 1,630,000 | | | | 1,889,235 | | |
William W Backus Hospital
Series 2005G (AGM)
07/01/24 | | | 5.000 | % | | | 2,060,000 | | | | 2,208,814 | | |
Total | | | | | | | 23,205,627 | | |
Human Service Provider 0.1% | |
Connecticut State Health & Educational Facility Authority
Revenue Bonds
Village Families & Children
Series 2002A (AMBAC)
07/01/23 | | | 5.000 | % | | | 260,000 | | | | 261,859 | | |
Investor Owned 2.6% | |
Connecticut State Development Authority
Refunding Revenue Bonds
Connecticut Light & Power Co. Project
Series 2011
09/01/28 | | | 4.375 | % | | | 5,000,000 | | | | 5,440,750 | | |
Joint Power Authority 2.4% | |
Connecticut Municipal Electric Energy Cooperative
Revenue Bonds
Series 2006A (AMBAC)
01/01/22 | | | 5.000 | % | | | 2,000,000 | | | | 2,260,920 | | |
Series 2009A (AGM)
01/01/17 | | | 5.000 | % | | | 1,525,000 | | | | 1,780,804 | | |
Series 2012A
01/01/27 | | | 5.000 | % | | | 1,000,000 | | | | 1,184,740 | | |
Total | | | | | | | 5,226,464 | | |
Local General Obligation 27.4% | |
City of Bridgeport
Unlimited General Obligation Refunding Bonds
Series 2004C (NPFGC)
08/15/17 | | | 5.250 | % | | | 1,500,000 | | | | 1,750,770 | | |
08/15/21 | | | 5.500 | % | | | 1,125,000 | | | | 1,378,136 | | |
Series 2012B
08/15/19 | | | 4.000 | % | | | 3,000,000 | | | | 3,327,570 | | |
The accompanying Notes to Financial Statements are an integral part of this statement.
Annual Report 2012
7
Columbia Connecticut Intermediate Municipal Bond Fund
Portfolio of Investments (continued)
October 31, 2012
Municipal Bonds (continued)
Issue
Description | | Coupon
Rate | | Principal
Amount ($) | | Value ($) | |
City of Danbury
Unlimited General Obligation Refunding Bonds
Series 2004 (NPFGC/FGIC)
08/01/16 | | | 4.750 | % | | | 1,270,000 | | | | 1,376,032 | | |
City of Hartford
Unlimited General Obligation Bonds
Series 2006 (AMBAC)
07/15/22 | | | 5.000 | % | | | 600,000 | | | | 676,542 | | |
Series 2009A (AGM)
08/15/17 | | | 5.000 | % | | | 695,000 | | | | 831,568 | | |
Series 2011A
04/01/22 | | | 5.250 | % | | | 1,325,000 | | | | 1,634,533 | | |
04/01/23 | | | 5.250 | % | | | 1,325,000 | | | | 1,616,884 | | |
04/01/24 | | | 5.250 | % | | | 1,325,000 | | | | 1,601,117 | | |
Unlimited General Obligation Refunding Bonds
Series 2005C (NPFGC)
09/01/19 | | | 5.000 | % | | | 2,085,000 | | | | 2,542,574 | | |
City of New Britain
Unlimited General Obligation Bonds
Series 2006 (AMBAC)
04/15/17 | | | 5.000 | % | | | 1,165,000 | | | | 1,348,732 | | |
City of New Haven
Unlimited General Obligation Bonds
Series 2011 (AGM)
08/01/18 | | | 5.000 | % | | | 820,000 | | | | 964,951 | | |
Unlimited General Obligation Refunding Bonds
Series 2008 (AGM)
11/01/18 | | | 5.000 | % | | | 4,260,000 | | | | 5,036,854 | | |
Unrefunded Unlimited General Obligation Bonds
Series 2003A (NPFGC/FGIC)
11/01/16 | | | 5.250 | % | | | 1,830,000 | | | | 1,935,152 | | |
City of New London
Unlimited General Obligation Refunding Bonds
Series 2003C (AMBAC)
02/01/17 | | | 5.000 | % | | | 1,290,000 | | | | 1,304,796 | | |
City of Stamford
Unlimited General Obligation Refunding Bonds
Series 2003B
08/15/17 | | | 5.250 | % | | | 1,125,000 | | | | 1,362,566 | | |
City of West Haven
Unlimited General Obligation Bonds
Series 2012 (AGM)
08/01/17 | | | 4.000 | % | | | 2,215,000 | | | | 2,384,160 | | |
Regional School District No. 15
Limited General Obligation Refunding Bonds
Series 2003 (NPFGC/FGIC)
02/01/15 | | | 5.000 | % | | | 1,105,000 | | | | 1,211,566 | | |
02/01/16 | | | 5.000 | % | | | 1,025,000 | | | | 1,163,765 | | |
Town of East Haven
Unlimited General Obligation Refunding Bonds
Series 2003 (NPFGC)
09/01/15 | | | 5.000 | % | | | 640,000 | | | | 705,466 | | |
Municipal Bonds (continued)
Issue
Description | | Coupon
Rate | | Principal
Amount ($) | | Value ($) | |
Town of Fairfield
Unlimited General Obligation Refunding Bonds
Series 2004
01/01/16 | | | 4.500 | % | | | 1,690,000 | | | | 1,769,345 | | |
Series 2008
01/01/20 | | | 5.000 | % | | | 1,000,000 | | | | 1,252,390 | | |
01/01/22 | | | 5.000 | % | | | 500,000 | | | | 637,060 | | |
Town of New Milford
Unlimited General Obligation Bonds
Series 2004 (AMBAC)
01/15/16 | | | 5.000 | % | | | 1,025,000 | | | | 1,171,760 | | |
Town of Newtown
Unlimited General Obligation Refunding Bonds
Series 2010
07/01/20 | | | 4.500 | % | | | 1,500,000 | | | | 1,837,530 | | |
Town of North Haven
Unlimited General Obligation Bonds
Series 2007
07/15/24 | | | 4.750 | % | | | 1,150,000 | | | | 1,476,428 | | |
07/15/25 | | | 4.750 | % | | | 1,150,000 | | | | 1,489,652 | | |
Town of Ridgefield
Unlimited General Obligation Refunding Bonds
Series 2009
09/15/20 | | | 5.000 | % | | | 2,130,000 | | | | 2,738,498 | | |
Town of Trumbull
Unlimited General Obligation Bonds
Series 2012
09/01/19 | | | 3.000 | % | | | 1,070,000 | | | | 1,190,525 | | |
09/01/20 | | | 3.000 | % | | | 1,070,000 | | | | 1,181,494 | | |
09/01/21 | | | 3.000 | % | | | 1,070,000 | | | | 1,164,759 | | |
Unlimited General Obligation Refunding Bonds
Series 2009
09/15/20 | | | 4.000 | % | | | 575,000 | | | | 666,649 | | |
09/15/21 | | | 4.000 | % | | | 600,000 | | | | 685,470 | | |
Town of Watertown
Unlimited General Obligation Refunding Bonds
Series 2005 (NPFGC)
08/01/17 | | | 5.000 | % | | | 1,060,000 | | | | 1,263,817 | | |
Series 2009B
07/01/17 | | | 5.000 | % | | | 2,000,000 | | | | 2,381,000 | | |
Town of Weston
Unlimited General Obligation Bonds
Series 2004
07/15/15 | | | 5.250 | % | | | 1,300,000 | | | | 1,470,131 | | |
Town of Westport
Unlimited General Obligation Refunding Bonds
Series 2003
08/15/18 | | | 5.000 | % | | | 1,200,000 | | | | 1,267,836 | | |
Town of Windham
Unlimited General Obligation Refunding Bonds
Series 2004 (NPFGC)
06/15/15 | | | 5.000 | % | | | 785,000 | | | | 878,258 | | |
Total | | | | | | | 58,676,336 | | |
The accompanying Notes to Financial Statements are an integral part of this statement.
Annual Report 2012
8
Columbia Connecticut Intermediate Municipal Bond Fund
Portfolio of Investments (continued)
October 31, 2012
Municipal Bonds (continued)
Issue
Description | | Coupon
Rate | | Principal
Amount ($) | | Value ($) | |
Multi-Family 1.1% | |
Bridgeport Housing Authority
Revenue Bonds
Custodial Receipts Energy Performance
Series 2009
06/01/22 | | | 5.000 | % | | | 1,035,000 | | | | 1,121,816 | | |
06/01/23 | | | 5.000 | % | | | 1,085,000 | | | | 1,168,903 | | |
Total | | | | | | | 2,290,719 | | |
Municipal Power 0.2% | |
Guam Power Authority
Refunding Revenue Bonds
Series 2012A (AGM)(a)
10/01/24 | | | 5.000 | % | | | 315,000 | | | | 361,116 | | |
Nursing Home 0.7% | |
Connecticut State Development Authority
Revenue Bonds
Alzheimer's Resource Center Project
Series 2007
08/15/21 | | | 5.400 | % | | | 500,000 | | | | 530,695 | | |
Alzheimers Residence Center, Inc. Project
Series 2007
08/15/17 | | | 5.200 | % | | | 870,000 | | | | 934,328 | | |
Total | | | | | | | 1,465,023 | | |
Other Bond Issue 0.6% | |
Puerto Rico Housing Finance Authority
Subordinated Revenue Bonds
Capital Fund Modernization
Series 2008(a)
12/01/13 | | | 5.000 | % | | | 1,300,000 | | | | 1,354,561 | | |
Pool/Bond Bank 1.1% | |
State of Connecticut
Refunding Revenue Bonds
Revolving Fund
Series 2003B
10/01/15 | | | 5.000 | % | | | 1,000,000 | | | | 1,133,250 | | |
Series 2009C
10/01/18 | | | 5.000 | % | | | 1,000,000 | | | | 1,234,580 | | |
Total | | | | | | | 2,367,830 | | |
Prep School 2.9% | |
Connecticut State Health & Educational Facility Authority
Revenue Bonds
Greenwich Academy
Series 2007E (AGM)
03/01/26 | | | 5.250 | % | | | 2,770,000 | | | | 3,433,719 | | |
Loomis Chaffe School
Series 2005F (AMBAC)
07/01/27 | | | 5.250 | % | | | 1,670,000 | | | | 2,213,986 | | |
Municipal Bonds (continued)
Issue
Description | | Coupon
Rate | | Principal
Amount ($) | | Value ($) | |
Miss Porters School Issue
Series 2006B (AMBAC)
07/01/29 | | | 4.500 | % | | | 600,000 | | | | 629,520 | | |
Total | | | | | | | 6,277,225 | | |
Refunded/Escrowed 3.6% | |
City of New Haven
Prerefunded 11/01/13 Unlimited General Obligation Bonds
Series 2003A (FGIC)
11/01/16 | | | 5.250 | % | | | 170,000 | | | | 180,180 | | |
Puerto Rico Highway & Transportation Authority
Prerefunded Revenue Bonds
Series 2005BB (AGM) Escrowed to Maturity(a)
07/01/22 | | | 5.250 | % | | | 895,000 | | | | 1,158,631 | | |
State of Connecticut
Prerefunded 08/15/13 Unlimited General Obligation Bonds
Series 2003E
08/15/21 | | | 5.000 | % | | | 1,000,000 | | | | 1,037,210 | | |
Prerefunded 10/01/13 Revenue Bonds
Revolving Fund
Series 2003A
10/01/19 | | | 5.000 | % | | | 4,290,000 | | | | 4,477,258 | | |
Special Tax Bonds
Transportation Infrastructure
Series 2003B (NPFGC/FGIC)
01/01/23 | | | 5.000 | % | | | 800,000 | | | | 843,656 | | |
Total | | | | | | | 7,696,935 | | |
Retirement Communities 0.7% | |
Connecticut State Development Authority
Revenue Bonds
The Elm Park Baptist, Inc. Project
Series 2003
12/01/23 | | | 5.750 | % | | | 1,500,000 | | | | 1,530,285 | | |
Single Family 3.6% | |
Connecticut Housing Finance Authority
Revenue Bonds
Subordinated Series 2008B-1
11/15/23 | | | 4.750 | % | | | 3,000,000 | | | | 3,262,380 | | |
Subordinated Series 2009B-1
11/15/24 | | | 4.550 | % | | | 4,000,000 | | | | 4,370,560 | | |
Total | | | | | | | 7,632,940 | | |
Special Non Property Tax 8.4% | |
State of Connecticut Special Tax
Revenue Bonds
Transportation Infrastructure
Series 2009A
12/01/19 | | | 4.500 | % | | | 3,765,000 | | | | 4,555,499 | | |
The accompanying Notes to Financial Statements are an integral part of this statement.
Annual Report 2012
9
Columbia Connecticut Intermediate Municipal Bond Fund
Portfolio of Investments (continued)
October 31, 2012
Municipal Bonds (continued)
Issue
Description | | Coupon
Rate | | Principal
Amount ($) | | Value ($) | |
State of Connecticut
Refunding Special Tax Bonds
2nd Lien Transportation Infrastructure
Series 2009-1
02/01/17 | | | 4.250 | % | | | 3,000,000 | | | | 3,432,930 | | |
02/01/19 | | | 5.000 | % | | | 3,450,000 | | | | 4,229,631 | | |
Transportation Infrastructure
Series 2004B (AMBAC)
07/01/18 | | | 5.250 | % | | | 2,250,000 | | | | 2,775,555 | | |
Territory of Guam
Revenue Bonds
Series 2011A(a)
01/01/31 | | | 5.000 | % | | | 550,000 | | | | 617,865 | | |
Virgin Islands Public Finance Authority
Revenue Bonds
Senior Lien-Matching Fund Loan Note
Series 2010A(a)
10/01/25 | | | 5.000 | % | | | 2,020,000 | | | | 2,254,118 | | |
Total | | | | | | | 17,865,598 | | |
Special Property Tax 1.6% | |
Harbor Point Infrastructure Improvement District
Tax Allocation Bonds
Harbor Point Project
Series 2010A
04/01/22 | | | 7.000 | % | | | 2,921,000 | | | | 3,337,447 | | |
State Appropriated 2.7% | |
Connecticut State Health & Educational Facility Authority
Refunding Revenue Bonds
Connecticut State University System
Series 2007I (AGM)
11/01/17 | | | 5.250 | % | | | 1,000,000 | | | | 1,203,960 | | |
University of Connecticut
Revenue Bonds
Series 2007A
04/01/24 | | | 4.000 | % | | | 2,100,000 | | | | 2,262,834 | | |
Series 2009A
02/15/23 | | | 5.000 | % | | | 2,000,000 | | | | 2,397,800 | | |
Total | | | | | | | 5,864,594 | | |
State General Obligation 11.4% | |
Connecticut Housing Finance Authority
Revenue Bonds
State Supported Special Obligation
Series 2009-10
06/15/18 | | | 5.000 | % | | | 1,755,000 | | | | 2,091,346 | | |
06/15/19 | | | 5.000 | % | | | 1,840,000 | | | | 2,220,861 | | |
State of Connecticut
Unlimited General Obligation Bonds
Series 2001 (AGM)
12/15/14 | | | 5.500 | % | | | 1,500,000 | | | | 1,663,635 | | |
Municipal Bonds (continued)
Issue
Description | | Coupon
Rate | | Principal
Amount ($) | | Value ($) | |
Series 2005D (NPFGC/FGIC)
11/15/23 | | | 5.000 | % | | | 4,000,000 | | | | 4,519,680 | | |
Series 2008B
04/15/22 | | | 5.000 | % | | | 5,415,000 | | | | 6,429,013 | | |
Series 2012E
09/15/28 | | | 4.000 | % | | | 4,000,000 | | | | 4,429,600 | | |
Unlimited General Obligation Refunding Bonds
Series 2005B (AMBAC)
06/01/20 | | | 5.250 | % | | | 600,000 | | | | 759,108 | | |
Series 2006E
12/15/20 | | | 5.000 | % | | | 2,000,000 | | | | 2,340,040 | | |
Total | | | | | | | 24,453,283 | | |
Water & Sewer 3.2% | |
South Central Connecticut Regional Water Authority
Refunding Revenue Bonds
20th Series 2007A (NPFGC)
08/01/22 | | | 5.250 | % | | | 1,370,000 | | | | 1,768,464 | | |
08/01/23 | | | 5.250 | % | | | 500,000 | | | | 651,030 | | |
Series 2012-27
08/01/29 | | | 5.000 | % | | | 2,945,000 | | | | 3,538,918 | | |
South Central Connecticut Regional Water Authority(b)
Revenue Bonds
18th Series 2003B (NPFGC)
08/01/29 | | | 5.250 | % | | | 750,000 | | | | 851,423 | | |
Total | | | | | | | 6,809,835 | | |
Total Municipal Bonds
(Cost: $189,338,372) | | | | | | | 206,644,409 | | |
Money Market Funds 1.6%
| | | Shares | | Value ($) | |
Dreyfus Tax-Exempt Cash
Management Fund, 0.000%(c) | | | 1,500,007 | | | | 1,500,007 | | |
JPMorgan Tax Free Money
Market Fund, 0.000%(c) | | | 1,952,984 | | | | 1,952,984 | | |
Total Money Market Funds
(Cost: $3,452,991) | | | | | 3,452,991 | | |
Total Investments
(Cost: $192,791,363) | | | | | 210,097,400 | | |
Other Assets & Liabilities, Net | | | | | 3,993,472 | | |
Net Assets | | | | | 214,090,872 | | |
The accompanying Notes to Financial Statements are an integral part of this statement.
Annual Report 2012
10
Columbia Connecticut Intermediate Municipal Bond Fund
Portfolio of Investments (continued)
October 31, 2012
Notes to Portfolio of Investments
(a) Municipal obligations include debt obligations issued by or on behalf of territories, possessions, or sovereign nations within the territorial boundaries of the United States. At October 31, 2012, the value of these securities amounted to $5,746,291 or 2.68% of net assets.
(b) Variable rate security. The interest rate shown reflects the rate as of October 31, 2012.
(c) The rate shown is the seven-day current annualized yield at October 31, 2012.
Abbreviation Legend
AGM Assured Guaranty Municipal Corporation
AMBAC Ambac Assurance Corporation
FGIC Financial Guaranty Insurance Company
NPFGC National Public Finance Guarantee Corporation
RAD Radian Asset Assurance, Inc.
Fair Value Measurements
Generally accepted accounting principles (GAAP) require disclosure regarding the inputs and valuation techniques used to measure fair value and any changes in valuation inputs or techniques. In addition, investments shall be disclosed by major category.
The Fund categorizes its fair value measurements according to a three-level hierarchy that maximizes the use of observable inputs and minimizes the use of unobservable inputs by prioritizing that the most observable input be used when available. Observable inputs are those that market participants would use in pricing an investment based on market data obtained from sources independent of the reporting entity. Unobservable inputs are those that reflect the Fund's assumptions about the information market participants would use in pricing an investment. An investment's level within the fair value hierarchy is based on the lowest level of any input that is deemed significant to the asset or liability's fair value measurement. The input levels are not necessarily an indication of the risk or liquidity associated with investments at that level. For example, certain U.S. government securities are generally high quality and liquid, however, they are reflected as Level 2 because the inputs used to determine fair value may not always be quoted prices in an active market.
Fair value inputs are summarized in the three broad levels listed below:
> Level 1 — Valuations based on quoted prices for investments in active markets that the Fund has the ability to access at the measurement date (including NAV for open-end mutual funds). Valuation adjustments are not applied to Level 1 investments.
> Level 2 — Valuations based on other significant observable inputs (including quoted prices for similar securities, interest rates, prepayment speeds, credit risks, etc.).
> Level 3 — Valuations based on significant unobservable inputs (including the Fund's own assumptions and judgment in determining the fair value of investments).
Inputs that are used in determining fair value of an investment may include price information, credit data, volatility statistics, and other factors. These inputs can be either observable or unobservable. The availability of observable inputs can vary between investments, and is affected by various factors such as the type of investment, and the volume and level of activity for that investment or similar investments in the marketplace. The inputs will be considered by the Investment Manager, along with any other relevant factors in the calculation of an investment's fair value. The Fund uses prices and inputs that are current as of the measurement date, which may include periods of market dislocations. During these periods, the availability of prices and inputs may be reduced for many investments. This condition could cause an investment to be reclassified between the various levels within the hierarchy.
Investments falling into the Level 3 category are primarily supported by quoted prices from brokers and dealers participating in the market for those investments. However, these may be classified as Level 3 investments due to lack of market transparency and corroboration to support these quoted prices. Additionally, valuation models may be used as the pricing source for any remaining investments classified as Level 3. These models rely on one or more significant unobservable inputs and/or significant assumptions by the Investment Manager. Inputs used in valuations may include, but are not limited to, financial statement analysis, capital account balances, discount rates and estimated cash flows, and comparable company data.
Under the direction of the Fund's Board of Trustees (the Board), the Investment Manager's Valuation Committee (the Committee) is responsible for carrying out the valuation procedures approved by the Board. The Committee consists of voting and non-voting members from various groups within the Investment Manager's organization, including operations and accounting, trading and investments, compliance, risk management and legal.
The accompanying Notes to Financial Statements are an integral part of this statement.
Annual Report 2012
11
Columbia Connecticut Intermediate Municipal Bond Fund
Portfolio of Investments (continued)
October 31, 2012
Fair Value Measurements (continued)
The Committee meets at least monthly to review and approve valuation matters, which may include a description of specific valuation determinations, data regarding pricing information received from approved pricing vendors and brokers and the results of Board-approved valuation control policies and procedures (the Policies). The Policies address, among other things, instances when market quotations are readily available, including recommendations of third party pricing vendors and a determination of appropriate pricing methodologies; events that require specific valuation determinations and assessment of fair value techniques; securities with a potential for stale pricing, including those that are illiquid, restricted, or in default; and the effectiveness of third-party pricing vendors, including periodic reviews of vendors. The Committee meets more frequently, as needed, to discuss additional valuation matters, which may include the need to review back-testing results, review time-sensitive information or approve related valuation actions. The Committee reports to the Board, with members of the Committee meeting with the Board at each of its regularly scheduled meetings to discuss valuation matters and actions during the period, similar to those described earlier.
For investments categorized as Level 3, the Committee monitors information similar to that described above, which may include: (i) data specific to the issuer or comparable issuers, (ii) general market or specific sector news and (iii) quoted prices and specific or similar security transactions. The Committee considers this data and any changes from prior periods in order to assess the reasonableness of observable and unobservable inputs, any assumptions or internal models used to value those securities and changes in fair value. This data is also used to corroborate, when available, information received from approved pricing vendors and brokers. Various factors impact the frequency of monitoring this information (which may occur as often as daily). However, the Committee may determine that changes to inputs, assumptions and models are not required as a result of the monitoring procedures performed.
The following table is a summary of the inputs used to value the Fund's investments at October 31, 2012:
Description | | Level 1
Quoted Prices in Active
Markets for Identical
Assets ($) | | Level 2
Other Significant
Observable Inputs ($) | | Level 3
Significant
Unobservable Inputs ($) | | Total ($) | |
Bonds | |
Municipal Bonds | | | — | | | | 206,644,409 | | | | — | | | | 206,644,409 | | |
Total Bonds | | | — | | | | 206,644,409 | | | | — | | | | 206,644,409 | | |
Other | |
Money Market Funds | | | 3,452,991 | | | | — | | | | — | | | | 3,452,991 | | |
Total Other | | | 3,452,991 | | | | — | | | | — | | | | 3,452,991 | | |
Total | | | 3,452,991 | | | | 206,644,409 | | | | — | | | | 210,097,400 | | |
See the Portfolio of Investments for all investment classifications not indicated in the table.
The Fund's assets assigned to the Level 2 input category are generally valued using the market approach, in which a security's value is determined through reference to prices and information from market transactions for similar or identical assets.
There were no transfers of financial assets between Levels 1 and 2 during the period.
The accompanying Notes to Financial Statements are an integral part of this statement.
Annual Report 2012
12
Columbia Connecticut Intermediate Municipal Bond Fund
Statement of Assets and Liabilities
October 31, 2012
Assets | |
Investments, at value | |
(identified cost $192,791,363) | | $ | 210,097,400 | | |
Receivable for: | |
Capital shares sold | | | 122,977 | | |
Interest | | | 2,557,935 | | |
Investments sold | | | 2,004,850 | | |
Expense reimbursement due from Investment Manager | | | 5,966 | | |
Prepaid expenses | | | 2,743 | | |
Trustees' deferred compensation plan | | | 29,131 | | |
Total assets | | | 214,821,002 | | |
Liabilities | |
Payable for: | |
Capital shares purchased | | | 63,306 | | |
Dividend distributions to shareholders | | | 525,392 | | |
Investment management fees | | | 11,699 | | |
Distribution and service fees | | | 1,308 | | |
Transfer agent fees | | | 37,140 | | |
Administration fees | | | 2,047 | | |
Compensation of board members | | | 1,006 | | |
Chief compliance officer expenses | | | 63 | | |
Other expenses | | | 59,038 | | |
Trustees' deferred compensation plan | | | 29,131 | | |
Total liabilities | | | 730,130 | | |
Net assets applicable to outstanding capital stock | | $ | 214,090,872 | | |
Represented by | |
Paid-in capital | | $ | 195,785,068 | | |
Undistributed net investment income | | | 159,453 | | |
Accumulated net realized gain | | | 840,314 | | |
Unrealized appreciation (depreciation) on: | |
Investments | | | 17,306,037 | | |
Total — representing net assets applicable to outstanding capital stock | | $ | 214,090,872 | | |
The accompanying Notes to Financial Statements are an integral part of this statement.
Annual Report 2012
13
Columbia Connecticut Intermediate Municipal Bond Fund
Statement of Assets and Liabilities (continued)
October 31, 2012
Class A | |
Net assets | | $ | 8,937,280 | | |
Shares outstanding | | | 788,208 | | |
Net asset value per share | | $ | 11.34 | | |
Maximum offering price per share(a) | | $ | 11.72 | | |
Class B | |
Net assets | | $ | 197,477 | | |
Shares outstanding | | | 17,418 | | |
Net asset value per share | | $ | 11.34 | | |
Class C | |
Net assets | | $ | 7,520,125 | | |
Shares outstanding | | | 663,281 | | |
Net asset value per share | | $ | 11.34 | | |
Class T | |
Net assets | | $ | 14,902,559 | | |
Shares outstanding | | | 1,314,498 | | |
Net asset value per share | | $ | 11.34 | | |
Maximum offering price per share(a) | | $ | 11.91 | | |
Class Z | |
Net assets | | $ | 182,533,431 | | |
Shares outstanding | | | 16,100,793 | | |
Net asset value per share | | $ | 11.34 | | |
(a) The maximum offering price is calculated by dividing the net asset value by 1.0 minus the maximum sales charge of 3.25% for Class A and 4.75% for Class T.
The accompanying Notes to Financial Statements are an integral part of this statement.
Annual Report 2012
14
Columbia Connecticut Intermediate Municipal Bond Fund
Statement of Operations
Year Ended October 31, 2012
Net investment income | |
Income: | |
Dividends | | $ | 382 | | |
Interest | | | 7,739,814 | | |
Total income | | | 7,740,196 | | |
Expenses: | |
Investment management fees | | | 865,432 | | |
Distribution fees | |
Class B | | | 1,788 | | |
Class C | | | 54,033 | | |
Service fees | |
Class A | | | 20,636 | | |
Class B | | | 596 | | |
Class C | | | 18,015 | | |
Shareholder service fee — Class T | | | 22,788 | | |
Transfer agent fees | |
Class A | | | 16,531 | | |
Class B | | | 672 | | |
Class C | | | 13,855 | | |
Class T | | | 29,402 | | |
Class Z | | | 358,616 | | |
Administration fees | | | 151,451 | | |
Compensation of board members | | | 12,423 | | |
Custodian fees | | | 2,587 | | |
Printing and postage fees | | | 40,139 | | |
Registration fees | | | 84,968 | | |
Professional fees | | | 23,705 | | |
Chief compliance officer expenses | | | 159 | | |
Other | | | 9,809 | | |
Total expenses | | | 1,727,605 | | |
Fees waived or expenses reimbursed by Investment Manager and its affiliates | | | (441,958 | ) | |
Fees waived by Distributor — Class C | | | (25,209 | ) | |
Expense reductions | | | (80 | ) | |
Total net expenses | | | 1,260,358 | | |
Net investment income | | | 6,479,838 | | |
Realized and unrealized gain (loss) — net | |
Net realized gain (loss) on: | |
Investments | | | 905,873 | | |
Net realized gain | | | 905,873 | | |
Net change in unrealized appreciation (depreciation) on: | |
Investments | | | 6,420,027 | | |
Net change in unrealized appreciation (depreciation) | | | 6,420,027 | | |
Net realized and unrealized gain | | | 7,325,900 | | |
Net increase in net assets resulting from operations | | $ | 13,805,738 | | |
The accompanying Notes to Financial Statements are an integral part of this statement.
Annual Report 2012
15
Columbia Connecticut Intermediate Municipal Bond Fund
Statement of Changes in Net Assets
| | | Year Ended
October 31,
2012 | | Year Ended
October 31,
2011 | |
Operations | |
Net investment income | | $ | 6,479,838 | | | $ | 7,263,181 | | |
Net realized gain | | | 905,873 | | | | 786,239 | | |
Net change in unrealized appreciation (depreciation) | | | 6,420,027 | | | | (2,490,968 | ) | |
Net increase in net assets resulting from operations | | | 13,805,738 | | | | 5,558,452 | | |
Distributions to shareholders | |
Net investment income | |
Class A | | | (229,355 | ) | | | (328,201 | ) | |
Class B | | | (4,861 | ) | | | (19,318 | ) | |
Class C | | | (171,721 | ) | | | (192,487 | ) | |
Class T | | | (438,059 | ) | | | (483,649 | ) | |
Class Z | | | (5,624,284 | ) | | | (6,200,831 | ) | |
Net realized gains | |
Class A | | | (5,890 | ) | | | — | | |
Class B | | | (198 | ) | | | — | | |
Class C | | | (5,430 | ) | | | — | | |
Class T | | | (11,410 | ) | | | — | | |
Class Z | | | (138,191 | ) | | | — | | |
Total distributions to shareholders | | | (6,629,399 | ) | | | (7,224,486 | ) | |
Increase (decrease) in net assets from capital stock activity | | | (7,140,775 | ) | | | (31,087,917 | ) | |
Total increase (decrease) in net assets | | | 35,564 | | | | (32,753,951 | ) | |
Net assets at beginning of year | | | 214,055,308 | | | | 246,809,259 | | |
Net assets at end of year | | $ | 214,090,872 | | | $ | 214,055,308 | | |
Undistributed net investment income | | $ | 159,453 | | | $ | 151,243 | | |
The accompanying Notes to Financial Statements are an integral part of this statement.
Annual Report 2012
16
Columbia Connecticut Intermediate Municipal Bond Fund
Statement of Changes in Net Assets (continued)
| | | Year Ended October 31, 2012 | | Year Ended October 31, 2011 | |
| | | Shares | | Dollars ($) | | Shares | | Dollars ($) | |
Capital stock activity | |
Class A shares | |
Subscriptions(a) | | | 228,505 | | | | 2,573,955 | | | | 408,591 | | | | 4,360,971 | | |
Distributions reinvested | | | 16,061 | | | | 180,719 | | | | 15,452 | | | | 166,781 | | |
Redemptions | | | (286,767 | ) | | | (3,201,169 | ) | | | (635,052 | ) | | | (6,808,731 | ) | |
Net decrease | | | (42,201 | ) | | | (446,495 | ) | | | (211,009 | ) | | | (2,280,979 | ) | |
Class B shares | |
Subscriptions | | | 146 | | | | 1,642 | | | | 1,027 | | | | 11,102 | | |
Distributions reinvested | | | 292 | | | | 3,279 | | | | 690 | | | | 7,414 | | |
Redemptions(a) | | | (7,204 | ) | | | (81,242 | ) | | | (110,843 | ) | | | (1,197,295 | ) | |
Net decrease | | | (6,766 | ) | | | (76,321 | ) | | | (109,126 | ) | | | (1,178,779 | ) | |
Class C shares | |
Subscriptions | | | 125,172 | | | | 1,404,628 | | | | 117,144 | | | | 1,264,707 | | |
Distributions reinvested | | | 9,899 | | | | 111,347 | | | | 8,502 | | | | 91,935 | | |
Redemptions | | | (125,712 | ) | | | (1,409,142 | ) | | | (189,406 | ) | | | (2,027,550 | ) | |
Net increase (decrease) | | | 9,359 | | | | 106,833 | | | | (63,760 | ) | | | (670,908 | ) | |
Class T shares | |
Subscriptions | | | 4,949 | | | | 55,653 | | | | 5,776 | | | | 62,387 | | |
Distributions reinvested | | | 22,302 | | | | 250,774 | | | | 23,969 | | | | 258,920 | | |
Redemptions | | | (90,480 | ) | | | (1,017,917 | ) | | | (160,999 | ) | | | (1,724,529 | ) | |
Net decrease | | | (63,229 | ) | | | (711,490 | ) | | | (131,254 | ) | | | (1,403,222 | ) | |
Class Z shares | |
Subscriptions | | | 1,836,040 | | | | 20,639,272 | | | | 1,156,541 | | | | 12,494,637 | | |
Distributions reinvested | | | 19,839 | | | | 223,272 | | | | 20,165 | | | | 217,720 | | |
Redemptions | | | (2,386,699 | ) | | | (26,875,846 | ) | | | (3,575,202 | ) | | | (38,266,386 | ) | |
Net decrease | | | (530,820 | ) | | | (6,013,302 | ) | | | (2,398,496 | ) | | | (25,554,029 | ) | |
Total net decrease | | | (633,657 | ) | | | (7,140,775 | ) | | | (2,913,645 | ) | | | (31,087,917 | ) | |
(a) Includes conversions of Class B shares to Class A shares, if any.
The accompanying Notes to Financial Statements are an integral part of this statement.
Annual Report 2012
17
Columbia Connecticut Intermediate Municipal Bond Fund
The following tables are intended to help you understand the Fund's financial performance. Certain information reflects financial results for a single share of a class held for the periods shown. Per share net investment income (loss) amounts are calculated based on average shares outstanding during the period. Total return assumes reinvestment of all dividends and distributions. Total return does not reflect payment of sales charges, if any, and is not annualized for periods of less than one year.
| | | Year Ended October 31, | |
Class A | | 2012 | | 2011 | | 2010 | | 2009 | | 2008 | |
Per share data | |
Net asset value, beginning of period | | $ | 10.97 | | | $ | 11.00 | | | $ | 10.69 | | | $ | 10.06 | | | $ | 10.62 | | |
Income from investment operations: | |
Net investment income | | | 0.31 | | | | 0.33 | | | | 0.33 | | | | 0.35 | | | | 0.37 | | |
Net realized and unrealized gain (loss) | | | 0.38 | | | | (0.03 | ) | | | 0.31 | | | | 0.63 | | | | (0.55 | ) | |
Total from investment operations | | | 0.69 | | | | 0.30 | | | | 0.64 | | | | 0.98 | | | | (0.18 | ) | |
Less distributions to shareholders: | |
Net investment income | | | (0.31 | ) | | | (0.33 | ) | | | (0.33 | ) | | | (0.35 | ) | | | (0.38 | ) | |
Net realized gains | | | (0.01 | ) | | | — | | | | — | | | | — | | | | — | | |
Total distributions to shareholders | | | (0.32 | ) | | | (0.33 | ) | | | (0.33 | ) | | | (0.35 | ) | | | (0.38 | ) | |
Net asset value, end of period | | $ | 11.34 | | | $ | 10.97 | | | $ | 11.00 | | | $ | 10.69 | | | $ | 10.06 | | |
Total return | | | 6.36 | % | | | 2.83 | % | | | 6.10 | % | | | 9.87 | % | | | (1.80 | %) | |
Ratios to average net assets(a) | |
Expenses prior to fees waived or expenses reimbursed | | | 1.00 | % | | | 1.03 | % | | | 0.94 | % | | | 0.94 | % | | | 0.96 | % | |
Net expenses after fees waived or expenses reimbursed(b) | | | 0.79 | %(c) | | | 0.79 | %(c) | | | 0.80 | %(c) | | | 0.78 | %(c) | | | 0.75 | %(c) | |
Net investment income | | | 2.79 | %(c) | | | 3.09 | %(c) | | | 3.08 | %(c) | | | 3.35 | %(c) | | | 3.55 | %(c) | |
Supplemental data | |
Net assets, end of period (in thousands) | | $ | 8,937 | | | $ | 9,108 | | | $ | 11,458 | | | $ | 10,863 | | | $ | 12,115 | | |
Portfolio turnover | | | 19 | % | | | 6 | % | | | 10 | % | | | 12 | % | | | 4 | % | |
Notes to Financial Highlights
(a) In addition to the fees and expenses which the Fund bears directly, the Fund indirectly bears a pro rata share of the fees and expenses of the acquired funds in which it invests. Such indirect expenses are not included in the reported expense ratios.
(b) The Investment Manager and certain of its affiliates agreed to waive/reimburse certain fees and expenses, if applicable.
(c) The benefits derived from expense reductions had an impact of less than 0.01%.
The accompanying Notes to Financial Statements are an integral part of this statement.
Annual Report 2012
18
Columbia Connecticut Intermediate Municipal Bond Fund
Financial Highlights (continued)
| | | Year Ended October 31, | |
Class B | | 2012 | | 2011 | | 2010 | | 2009 | | 2008 | |
Per share data | |
Net asset value, beginning of period | | $ | 10.97 | | | $ | 11.00 | | | $ | 10.69 | | | $ | 10.06 | | | $ | 10.62 | | |
Income from investment operations: | |
Net investment income | | | 0.23 | | | | 0.25 | | | | 0.25 | | | | 0.28 | | | | 0.30 | | |
Net realized and unrealized gain (loss) | | | 0.38 | | | | (0.03 | ) | | | 0.31 | | | | 0.62 | | | | (0.56 | ) | |
Total from investment operations | | | 0.61 | | | | 0.22 | | | | 0.56 | | | | 0.90 | | | | (0.26 | ) | |
Less distributions to shareholders: | |
Net investment income | | | (0.23 | ) | | | (0.25 | ) | | | (0.25 | ) | | | (0.27 | ) | | | (0.30 | ) | |
Net realized gains | | | (0.01 | ) | | | — | | | | — | | | | — | | | | — | | |
Total distributions to shareholders | | | (0.24 | ) | | | (0.25 | ) | | | (0.25 | ) | | | (0.27 | ) | | | (0.30 | ) | |
Net asset value, end of period | | $ | 11.34 | | | $ | 10.97 | | | $ | 11.00 | | | $ | 10.69 | | | $ | 10.06 | | |
Total return | | | 5.56 | % | | | 2.05 | % | | | 5.31 | % | | | 9.05 | % | | | (2.52 | %) | |
Ratios to average net assets(a) | |
Expenses prior to fees waived or expenses reimbursed | | | 1.84 | % | | | 1.83 | % | | | 1.69 | % | | | 1.69 | % | | | 1.71 | % | |
Net expenses after fees waived or expenses reimbursed(b) | | | 1.54 | %(c) | | | 1.55 | %(c) | | | 1.55 | %(c) | | | 1.53 | %(c) | | | 1.50 | %(c) | |
Net investment income | | | 2.06 | %(c) | | | 2.35 | %(c) | | | 2.34 | %(c) | | | 2.62 | %(c) | | | 2.86 | %(c) | |
Supplemental data | |
Net assets, end of period (in thousands) | | $ | 197 | | | $ | 265 | | | $ | 1,467 | | | $ | 1,995 | | | $ | 2,528 | | |
Portfolio turnover | | | 19 | % | | | 6 | % | | | 10 | % | | | 12 | % | | | 4 | % | |
Notes to Financial Highlights
(a) In addition to the fees and expenses which the Fund bears directly, the Fund indirectly bears a pro rata share of the fees and expenses of the acquired funds in which it invests. Such indirect expenses are not included in the reported expense ratios.
(b) The Investment Manager and certain of its affiliates agreed to waive/reimburse certain fees and expenses, if applicable.
(c) The benefits derived from expense reductions had an impact of less than 0.01%.
The accompanying Notes to Financial Statements are an integral part of this statement.
Annual Report 2012
19
Columbia Connecticut Intermediate Municipal Bond Fund
Financial Highlights (continued)
| | | Year Ended October 31, | |
Class C | | 2012 | | 2011 | | 2010 | | 2009 | | 2008 | |
Per share data | |
Net asset value, beginning of period | | $ | 10.97 | | | $ | 11.00 | | | $ | 10.69 | | | $ | 10.06 | | | $ | 10.62 | | |
Income from investment operations: | |
Net investment income | | | 0.27 | | | | 0.29 | | | | 0.29 | | | | 0.31 | | | | 0.34 | | |
Net realized and unrealized gain (loss) | | | 0.38 | | | | (0.03 | ) | | | 0.31 | | | | 0.63 | | | | (0.56 | ) | |
Total from investment operations | | | 0.65 | | | | 0.26 | | | | 0.60 | | | | 0.94 | | | | (0.22 | ) | |
Less distributions to shareholders: | |
Net investment income | | | (0.27 | ) | | | (0.29 | ) | | | (0.29 | ) | | | (0.31 | ) | | | (0.34 | ) | |
Net realized gains | | | (0.01 | ) | | | — | | | | — | | | | — | | | | — | | |
Total distributions to shareholders | | | (0.28 | ) | | | (0.29 | ) | | | (0.29 | ) | | | (0.31 | ) | | | (0.34 | ) | |
Net asset value, end of period | | $ | 11.34 | | | $ | 10.97 | | | $ | 11.00 | | | $ | 10.69 | | | $ | 10.06 | | |
Total return | | | 5.94 | % | | | 2.41 | % | | | 5.68 | % | | | 9.43 | % | | | (2.18 | %) | |
Ratios to average net assets(a) | |
Expenses prior to fees waived or expenses reimbursed | | | 1.74 | % | | | 1.79 | % | | | 1.69 | % | | | 1.69 | % | | | 1.71 | % | |
Net expenses after fees waived or expenses reimbursed(b) | | | 1.19 | %(c) | | | 1.19 | %(c) | | | 1.20 | %(c) | | | 1.18 | %(c) | | | 1.15 | %(c) | |
Net investment income | | | 2.39 | %(c) | | | 2.68 | %(c) | | | 2.68 | %(c) | | | 2.94 | %(c) | | | 3.20 | %(c) | |
Supplemental data | |
Net assets, end of period (in thousands) | | $ | 7,520 | | | $ | 7,172 | | | $ | 7,897 | | | $ | 8,047 | | | $ | 6,203 | | |
Portfolio turnover | | | 19 | % | | | 6 | % | | | 10 | % | | | 12 | % | | | 4 | % | |
Notes to Financial Highlights
(a) In addition to the fees and expenses which the Fund bears directly, the Fund indirectly bears a pro rata share of the fees and expenses of the acquired funds in which it invests. Such indirect expenses are not included in the reported expense ratios.
(b) The Investment Manager and certain of its affiliates agreed to waive/reimburse certain fees and expenses, if applicable.
(c) The benefits derived from expense reductions had an impact of less than 0.01%.
The accompanying Notes to Financial Statements are an integral part of this statement.
Annual Report 2012
20
Columbia Connecticut Intermediate Municipal Bond Fund
Financial Highlights (continued)
| | | Year Ended October 31, | |
Class T | | 2012 | | 2011 | | 2010 | | 2009 | | 2008 | |
Per share data | |
Net asset value, beginning of period | | $ | 10.97 | | | $ | 11.00 | | | $ | 10.69 | | | $ | 10.06 | | | $ | 10.62 | | |
Income from investment operations: | |
Net investment income | | | 0.32 | | | | 0.34 | | | | 0.35 | | | | 0.36 | | | | 0.39 | | |
Net realized and unrealized gain (loss) | | | 0.38 | | | | (0.03 | ) | | | 0.30 | | | | 0.63 | | | | (0.56 | ) | |
Total from investment operations | | | 0.70 | | | | 0.31 | | | | 0.65 | | | | 0.99 | | | | (0.17 | ) | |
Less distributions to shareholders: | |
Net investment income | | | (0.32 | ) | | | (0.34 | ) | | | (0.34 | ) | | | (0.36 | ) | | | (0.39 | ) | |
Net realized gains | | | (0.01 | ) | | | — | | | | — | | | | — | | | | — | | |
Total distributions to shareholders | | | (0.33 | ) | | | (0.34 | ) | | | (0.34 | ) | | | (0.36 | ) | | | (0.39 | ) | |
Net asset value, end of period | | $ | 11.34 | | | $ | 10.97 | | | $ | 11.00 | | | $ | 10.69 | | | $ | 10.06 | | |
Total return | | | 6.47 | % | | | 2.93 | % | | | 6.21 | % | | | 9.98 | % | | | (1.68 | %) | |
Ratios to average net assets(a) | |
Expenses prior to fees waived or expenses reimbursed | | | 0.89 | % | | | 0.94 | % | | | 0.84 | % | | | 0.84 | % | | | 0.86 | % | |
Net expenses after fees waived or expenses reimbursed(b) | | | 0.69 | %(c) | | | 0.69 | %(c) | | | 0.70 | %(c) | | | 0.68 | %(c) | | | 0.65 | %(c) | |
Net investment income | | | 2.89 | %(c) | | | 3.18 | %(c) | | | 3.18 | %(c) | | | 3.46 | %(c) | | | 3.71 | %(c) | |
Supplemental data | |
Net assets, end of period (in thousands) | | $ | 14,903 | | | $ | 15,110 | | | $ | 16,603 | | | $ | 16,889 | | | $ | 17,461 | | |
Portfolio turnover | | | 19 | % | | | 6 | % | | | 10 | % | | | 12 | % | | | 4 | % | |
Notes to Financial Highlights
(a) In addition to the fees and expenses which the Fund bears directly, the Fund indirectly bears a pro rata share of the fees and expenses of the acquired funds in which it invests. Such indirect expenses are not included in the reported expense ratios.
(b) The Investment Manager and certain of its affiliates agreed to waive/reimburse certain fees and expenses, if applicable.
(c) The benefits derived from expense reductions had an impact of less than 0.01%.
The accompanying Notes to Financial Statements are an integral part of this statement.
Annual Report 2012
21
Columbia Connecticut Intermediate Municipal Bond Fund
Financial Highlights (continued)
| | | Year Ended October 31, | |
Class Z | | 2012 | | 2011 | | 2010 | | 2009 | | 2008 | |
Per share data | |
Net asset value, beginning of period | | $ | 10.97 | | | $ | 11.00 | | | $ | 10.69 | | | $ | 10.06 | | | $ | 10.62 | | |
Income from investment operations: | |
Net investment income | | | 0.34 | | | | 0.36 | | | | 0.36 | | | | 0.38 | | | | 0.41 | | |
Net realized and unrealized gain (loss) | | | 0.38 | | | | (0.03 | ) | | | 0.31 | | | | 0.63 | | | | (0.56 | ) | |
Total from investment operations | | | 0.72 | | | | 0.33 | | | | 0.67 | | | | 1.01 | | | | (0.15 | ) | |
Less distributions to shareholders: | |
Net investment income | | | (0.34 | ) | | | (0.36 | ) | | | (0.36 | ) | | | (0.38 | ) | | | (0.41 | ) | |
Net realized gains | | | (0.01 | ) | | | — | | | | — | | | | — | | | | — | | |
Total distributions to shareholders | | | (0.35 | ) | | | (0.36 | ) | | | (0.36 | ) | | | (0.38 | ) | | | (0.41 | ) | |
Net asset value, end of period | | $ | 11.34 | | | $ | 10.97 | | | $ | 11.00 | | | $ | 10.69 | | | $ | 10.06 | | |
Total return | | | 6.63 | % | | | 3.08 | % | | | 6.37 | % | | | 10.14 | % | | | (1.53 | %) | |
Ratios to average net assets(a) | |
Expenses prior to fees waived or expenses reimbursed | | | 0.74 | % | | | 0.79 | % | | | 0.69 | % | | | 0.69 | % | | | 0.71 | % | |
Net expenses after fees waived or expenses reimbursed(b) | | | 0.54 | %(c) | | | 0.54 | %(c) | | | 0.55 | %(c) | | | 0.53 | %(c) | | | 0.50 | %(c) | |
Net investment income | | | 3.04 | %(c) | | | 3.33 | %(c) | | | 3.33 | %(c) | | | 3.60 | %(c) | | | 3.86 | %(c) | |
Supplemental data | |
Net assets, end of period (in thousands) | | $ | 182,533 | | | $ | 182,400 | | | $ | 209,384 | | | $ | 200,830 | | | $ | 169,072 | | |
Portfolio turnover | | | 19 | % | | | 6 | % | | | 10 | % | | | 12 | % | | | 4 | % | |
Notes to Financial Highlights
(a) In addition to the fees and expenses which the Fund bears directly, the Fund indirectly bears a pro rata share of the fees and expenses of the acquired funds in which it invests. Such indirect expenses are not included in the reported expense ratios.
(b) The Investment Manager and certain of its affiliates agreed to waive/reimburse certain fees and expenses, if applicable.
(c) The benefits derived from expense reductions had an impact of less than 0.01%.
The accompanying Notes to Financial Statements are an integral part of this statement.
Annual Report 2012
22
Columbia Connecticut Intermediate Municipal Bond Fund
Notes to Financial Statements
October 31, 2012
Note 1. Organization
Columbia Connecticut Intermediate Municipal Bond Fund (the Fund), a series of Columbia Funds Series Trust I (the Trust), is a non-diversified fund. The Trust is registered under the Investment Company Act of 1940, as amended (the 1940 Act), as an open-end management investment company organized as a Massachusetts business trust.
Fund Shares
The Trust may issue an unlimited number of shares (without par value). The Fund offers Class A, Class B, Class C, Class T and Class Z shares. All share classes have identical voting, dividend and liquidation rights. Each share class has its own expense structure and sales charges, as applicable.
Class A shares are subject to a maximum front-end sales charge of 3.25% based on the initial investment amount. Class A shares purchased without an initial sales charge in accounts aggregating $1 million to $50 million at the time of purchase are subject to a contingent deferred sales charge (CDSC) if the shares are sold within 18 months of purchase, charged as follows: 1.00% CDSC if redeemed within 12 months of purchase, and 0.50% CDSC if redeemed more than 12, but less than 18, months after purchase.
Class B shares may be subject to a maximum CDSC of 3.00% based upon the holding period after purchase. Class B shares will generally convert to Class A shares eight years after purchase. The Fund no longer accepts investments by new or existing investors in the Fund's Class B shares, except in connection with the reinvestment of any dividend and/or capital gain distributions in Class B shares of the Fund and exchanges by existing Class B shareholders of certain other funds within the Columbia Family of Funds.
Class C shares are subject to a 1.00% CDSC on shares redeemed within one year of purchase.
Class T shares are subject to a maximum front-end sales charge of 4.75% based on the investment amount. Class T shares purchased without an initial sales charge in accounts aggregating $1 million to $50 million at the time of purchase are subject to a contingent deferred sales charge (CDSC) if the shares are sold within 18 months of purchase, charged as follows: 1.00% CDSC if redeemed within 12 months of purchase, and 0.50% CDSC if redeemed more than 12, but less than 18, months after purchase. Class T shares are available only to investors who received (and who have continuously held) Class T shares in connection with the merger of certain Galaxy Funds into various Columbia Funds (formerly named Liberty Funds).
Class Z shares are not subject to sales charges, and are only available to certain investors.
Note 2. Summary of Significant Accounting Policies
Use of Estimates
The preparation of financial statements in accordance with U.S. generally accepted accounting principles (GAAP) requires management to make certain estimates and assumptions that affect the reported amounts of assets and liabilities, the disclosure of contingent assets and liabilities at the date of the financial statements and the reported amounts of revenue and expenses during the reporting period. Actual results could differ from those estimates.
The following is a summary of significant accounting policies consistently followed by the Fund in the preparation of its financial statements.
Security Valuation
Debt securities generally are valued by pricing services approved by the Board of Trustees (the Board) based upon market transactions for normal, institutional-size trading units of similar securities. The services may use various pricing techniques which take into account appropriate factors such as yield, quality, coupon rate, maturity, type of issue, trading characteristics and other data, as well as broker quotes. Debt securities for which quotations are readily available may also be valued based upon an over-the-counter or exchange bid quotation.
Investments in other open-end investment companies, including money market funds, are valued at net asset value.
Short-term securities purchased within 60 days to maturity are valued at amortized cost, which approximates market value. The value of short-term securities originally purchased with maturities greater than 60 days is determined based on an amortized value to par upon reaching 60 days to maturity. Short-term securities maturing in more than 60 days from the valuation date are valued at the market price or approximate market value based on current interest rates.
Investments for which market quotations are not readily available, or that have quotations which management believes are not reliable, are valued at fair value as determined in good faith under consistently applied procedures established by and under the general supervision of the Board. If a security or class of securities (such as foreign securities) is valued at fair value, such value is likely to be different from the last quoted market price for the security.
Annual Report 2012
23
Columbia Connecticut Intermediate Municipal Bond Fund
Notes to Financial Statements (continued)
October 31, 2012
The determination of fair value often requires significant judgment. To determine fair value, management may use assumptions including but not limited to future cash flows and estimated risk premiums. Multiple inputs from various sources may be used to determine fair value.
Security Transactions
Security transactions are accounted for on the trade date. Cost is determined and gains (losses) are based upon the specific identification method for both financial statement and federal income tax purposes.
Income Recognition
Interest income is recorded on an accrual basis. Market premiums and discounts, including original issue discounts, are amortized and accreted, respectively, over the expected life of the security on all debt securities, unless otherwise noted.
Dividend income is recorded on the ex-dividend date.
Expenses
General expenses of the Trust are allocated to the Fund and other funds of the Trust based upon relative net assets or other expense allocation methodologies determined by the nature of the expense. Expenses directly attributable to the Fund are charged to the Fund. Expenses directly attributable to a specific class of shares are charged to that share class.
Determination of Class Net Asset Value
All income, expenses (other than class-specific expenses, which are charged to that share class, as shown in the Statement of Operations) and realized and unrealized gains (losses) are allocated to each class of the Fund on a daily basis for purposes of determining the net asset value of each class. Income and expenses are allocated to each class based on the settled shares method, while realized and unrealized gains (losses) are allocated based on the relative net assets of each class.
Federal Income Tax Status
The Fund intends to qualify each year as a regulated investment company under Subchapter M of the Internal Revenue Code, as amended, and will distribute substantially all of its tax exempt or taxable income (including net short-term capital gains), if any, for its tax year, and as such will not be subject to federal income taxes. In addition, the Fund intends to distribute in each calendar year substantially all of its net investment income, capital gains and certain other amounts, if any, such that the Fund should not be subject to federal excise tax. Therefore, no federal income or excise tax provision is recorded.
Distributions to Shareholders
Distributions from net investment income, if any, are declared daily and paid monthly. Net realized capital gains, if any, are distributed at least annually. Income distributions and capital gain distributions are determined in accordance with federal income tax regulations, which may differ from GAAP.
Guarantees and Indemnifications
Under the Trust's organizational documents and, in some cases, by contract, its officers and trustees are indemnified against certain liabilities arising out of the performance of their duties to the Trust or its funds. In addition, certain of the Fund's contracts with its service providers contain general indemnification clauses. The Fund's maximum exposure under these arrangements is unknown since the amount of any future claims that may be made against the Fund cannot be determined, and the Fund has no historical basis for predicting the likelihood of any such claims.
Recent Accounting Pronouncement
Disclosures about Offsetting Assets and Liabilities
In December 2011, the Financial Accounting Standards Board (FASB) issued ASU No. 2011-11, Disclosures about Offsetting Assets and Liabilities. The objective of the FASB is to enhance current disclosure requirements on offsetting of certain assets and liabilities and to enable financial statement users to compare financial statements prepared under GAAP and International Financial Reporting Standards.
Specifically, ASU No. 2011-11 requires an entity to disclose both gross and net information for derivatives and other financial instruments that are subject to a master netting arrangement or similar agreement. The standard requires disclosure of collateral received in connection with the master netting agreements or similar agreements. The effective date of ASU No. 2011-11 is for interim and annual periods beginning on or after January 1, 2013. At this time, management is evaluating the implications of this guidance and the impact it will have on the financial statement amounts and footnote disclosures, if any.
Note 3. Fees and Compensation Paid to Affiliates
Investment Management Fees
Under an Investment Management Services Agreement, Columbia Management Investment Advisers, LLC (the Investment Manager), a wholly-owned subsidiary of Ameriprise Financial, Inc. (Ameriprise Financial), determines which securities will be purchased, held or sold. The investment management fee is an annual fee that is equal to a percentage of the Fund's average daily net assets that declines
Annual Report 2012
24
Columbia Connecticut Intermediate Municipal Bond Fund
Notes to Financial Statements (continued)
October 31, 2012
from 0.40% to 0.27% as the Fund's net assets increase. The effective investment management fee rate for the year ended October 31, 2012 was 0.40% of the Fund's average daily net assets.
Administration Fees
Under an Administrative Services Agreement, the Investment Manager also serves as the Fund Administrator. The Fund pays the Fund Administrator an annual fee for administration and accounting services equal to a percentage of the Fund's average daily net assets that declines from 0.07% to 0.04% as the Fund's net assets increase. The effective administration fee rate for the year ended October 31, 2012 was 0.07% of the Fund's average daily net assets.
Compensation of Board Members
Board members are compensated for their services to the Fund as disclosed in the Statement of Operations. The Trust's eligible Trustees may participate in a Deferred Compensation Plan (the Plan) which may be terminated at any time. Obligations of the Plan will be paid solely out of the Fund's assets.
Compensation of Chief Compliance Officer
The Board has appointed a Chief Compliance Officer to the Fund in accordance with federal securities regulations. The Fund pays its pro-rata share of the expenses associated with the Chief Compliance Officer. The Fund's expenses for the Chief Compliance Officer will not exceed $15,000 per year.
Transfer Agent Fees
Under a Transfer and Dividend Disbursing Agent Agreement, Columbia Management Investment Services Corp. (the Transfer Agent), an affiliate of the Investment Manager and a wholly-owned subsidiary of Ameriprise Financial, is responsible for providing transfer agency services to the Fund. The Transfer Agent has contracted with Boston Financial Data Services (BFDS) to serve as sub-transfer agent.
The Transfer Agent receives monthly account-based service fees based on the number of open accounts and is reimbursed by the Fund for the fees and expenses the Transfer Agent pays to financial intermediaries that maintain omnibus accounts with the Fund that is a percentage of the average aggregate value of the Fund's shares maintained in each such omnibus account (other than omnibus accounts for which American Enterprise Investment Services Inc. is the broker of record or accounts where the beneficial shareholder is a customer of Ameriprise Financial Services, Inc., which are paid a per account fee). The Transfer Agent pays the fees of BFDS for services as sub-transfer agent and is not entitled to reimbursement for such fees from the Fund (with the exception of out-of-pocket fees).
The Transfer Agent also receives compensation from fees for various shareholder services and reimbursements for certain out-of-pocket fees.
For the year ended October 31, 2012, the Fund's effective transfer agent fee rates as a percentage of average daily net assets of each class were as follows:
Class A | | | 0.20 | % | |
Class B | | | 0.28 | | |
Class C | | | 0.19 | | |
Class T | | | 0.19 | | |
Class Z | | | 0.19 | | |
An annual minimum account balance fee of $20 may apply to certain accounts with a value below the Fund's initial minimum investment requirements to reduce the impact of small accounts on transfer agent fees. These minimum account balance fees are recorded as part of expense reductions in the Statement of Operations. For the year ended October 31, 2012, these minimum account balance fees reduced total expenses by $80.
Distribution and Service Fees
The Fund has an agreement with Columbia Management Investment Distributors, Inc. (the Distributor), an affiliate of the Investment Manager and a wholly-owned subsidiary of Ameriprise Financial, for distribution and shareholder services. Pursuant to Rule 12b-1 under the 1940 Act, the Board has approved, and the Fund has adopted, distribution and shareholder service plans (the Plans) which set the distribution and service fees for the Fund. These fees are calculated daily and are intended to compensate the Distributor and/or eligible selling and/or servicing agents for selling shares of the Fund and providing services to investors.
The Plans require the payment of a monthly service fee to the Distributor at the maximum annual rate of 0.25% of the average daily net assets attributable to Class A, Class B and Class C shares of the Fund. The Plans also require the payment of a monthly distribution fee to the Distributor at the maximum annual rates of 0.75% of the average daily net assets attributable to Class B and Class C shares only.
The Distributor has voluntarily agreed to waive a portion of the distribution fee for Class C shares so that the combined distribution and service fee does not exceed 0.65% annually of the average daily net assets attributable to Class C shares. This arrangement may be modified or terminated by the Distributor at any time.
Shareholder Services Fees
The Fund has adopted a shareholder services plan that permits it to pay for certain services provided to Class T shareholders by their selling and/or servicing agents. The Fund may pay
Annual Report 2012
25
Columbia Connecticut Intermediate Municipal Bond Fund
Notes to Financial Statements (continued)
October 31, 2012
shareholder servicing fees up to an aggregate annual rate of 0.40% of the Fund's average daily net assets attributable to Class T shares (comprised of up to 0.20% for shareholder liaison services and up to 0.20% for administrative support services). These fees are currently limited to an aggregate annual rate of not more than 0.15% of the Fund's average daily net assets attributable to Class T shares. In addition, the servicing fee for Class T shares will be waived by selling and/or servicing agents to the extent necessary to prevent the net investment income for the Class T shares from falling below 0.00% on a daily basis. The effective shareholder services fee rate for the year ended October 31, 2012 was 0.15% of the Fund's average daily net assets attributable to Class T shares.
Sales Charges
Sales charges, including front-end charges and CDSCs, received by the Distributor for distributing Fund shares were $12,299 for Class A and $93 for Class C shares for the year ended October 31, 2012.
Expenses Waived/Reimbursed by the Investment Manager and its Affiliates
The Investment Manager and certain of its affiliates have contractually agreed to waive fees and/or reimburse expenses (excluding certain fees and expenses described below), through February 28, 2013, unless sooner terminated at the sole discretion of the Board, so that the Fund's net operating expenses, after giving effect to fees waived/expenses reimbursed and any balance credits and/or overdraft charges from the Fund's custodian, do not exceed the following annual rates as a percentage of the class' average daily net assets:
Class A | | | 0.79 | % | |
Class B | | | 1.54 | | |
Class C | | | 1.54 | | |
Class T | | | 0.69 | | |
Class Z | | | 0.54 | | |
Under the agreement, the following fees and expenses are excluded from the waiver/reimbursement commitment, and therefore will be paid by the Fund, if applicable: taxes (including foreign transaction taxes), expenses associated with investments in affiliated and non-affiliated pooled investment vehicles (including mutual funds and exchange traded funds), transaction costs and brokerage commissions, costs related to any securities lending program, dividend expenses associated with securities sold short, inverse floater program fees and expenses, transaction charges and interest on borrowed money, interest, extraordinary expenses and any other expenses the exclusion of which is specifically approved by the Board. This agreement may be modified or amended only with approval
from all parties. Class C distribution fees waived by the Distributor, as discussed above, are in addition to the waiver/reimbursement commitment under the agreement.
Note 4. Federal Tax Information
The timing and character of income and capital gain distributions are determined in accordance with income tax regulations, which may differ from GAAP because of temporary or permanent book to tax differences.
At October 31, 2012, these differences are primarily due to differing treatment for principal and/or interest of fixed income securities, derivative investments, distribution payable, and Trustees' deferred compensation. To the extent these differences are permanent, reclassifications are made among the components of the Fund's net assets in the Statement of Assets and Liabilities. Temporary differences do not require reclassifications. In the Statement of Assets and Liabilities the following reclassifications were made:
Undistributed net investment income | | $ | (3,348 | ) | |
Paid-in capital | | | 3,348 | | |
Net investment income and net realized gains (losses), as disclosed in the Statement of Operations, and net assets were not affected by this reclassification.
The tax character of distributions paid during the years indicated was as follows:
Year Ended October 31, | | 2012 ($) | | 2011 ($) | |
Tax-exempt income | | | 6,468,280 | | | | 7,224,786 | | |
Long-term capital gains | | | 161,119 | | | | — | | |
Total | | | 6,629,399 | | | | 7,224,486 | | |
Short-term capital gain distributions, if any, are considered ordinary income distributions for tax purposes.
At October 31, 2012, the components of distributable earnings on a tax basis were as follows:
Undistributed tax-exempt income | | $ | 670,076 | | |
Undistributed accumulated long-term gain | | | 849,148 | | |
Unrealized appreciation | | | 17,339,209 | | |
At October 31, 2012, the cost of investments for federal income tax purposes was $192,758,191 and the aggregate gross unrealized appreciation and depreciation based on that cost was:
Unrealized appreciation | | $ | 17,340,336 | | |
Unrealized depreciation | | | (1,127 | ) | |
Net unrealized appreciation | | $ | 17,339,209 | | |
Management of the Fund has concluded that there are no significant uncertain tax positions that would require
Annual Report 2012
26
Columbia Connecticut Intermediate Municipal Bond Fund
Notes to Financial Statements (continued)
October 31, 2012
recognition in the financial statements. However, management's conclusion may be subject to review and adjustment at a later date based on factors including, but not limited to, new tax laws, regulations, and administrative interpretations (including relevant court decisions). Generally, the Fund's federal tax returns for the prior three fiscal years remain subject to examination by the Internal Revenue Service.
Note 5. Portfolio Information
The cost of purchases and proceeds from sales of securities, excluding short-term obligations, aggregated to $40,220,372 and $41,312,905, respectively, for the year ended October 31, 2012.
Note 6. Shareholder Concentration
At October 31, 2012, one unaffiliated shareholder account owned 84.0% of the outstanding shares of the Fund. The Fund has no knowledge about whether any portion of those shares was owned beneficially by such account. Subscription and redemption activity by concentrated accounts may have a significant effect on the operations of the Fund.
Note 7. Line of Credit
The Fund has entered into a revolving credit facility with a syndicate of banks led by JPMorgan Chase Bank N.A. (JPMorgan) whereby the Fund may borrow for the temporary funding of shareholder redemptions or for other temporary or emergency purposes. The credit facility agreement, as amended, which is a collective agreement between the Fund and certain other funds managed by the Investment Manager, severally and not jointly, permits collective borrowings up to $500 million. Interest is charged to each participating fund based on its borrowings at a rate equal to the higher of (i) the overnight federal funds rate plus 1.00% or (ii) the one-month LIBOR rate plus 1.00%. Each borrowing under the credit facility matures no later than 60 days after the date of borrowing. The Fund also pays a commitment fee equal to its pro rata share of the amount of the credit facility at a rate of 0.08% per annum.
The Fund had no borrowings during the year ended October 31, 2012.
Note 8. Significant Risks
Non-Diversification Risk
A non-diversified fund is permitted to invest a greater percentage of its total assets in fewer issuers than a diversified fund. The Fund may, therefore, have a greater risk of loss from a few issuers than a similar fund that invests more broadly.
Geographic Concentration Risk
Because state-specific tax-exempt funds invest primarily in the municipal securities issued by the state and political sub-divisions of the state, the Fund will be particularly affected by political and economic conditions and developments in the state in which it invests. The Fund may, therefore, have a greater risk than that of a municipal bond fund which is more geographically diversified. The value of the municipal securities owned by the Fund also may be adversely affected by future changes in federal or state income tax laws.
Note 9. Subsequent Events
Management has evaluated the events and transactions that have occurred through the date the financial statements were issued and noted no items requiring adjustment of the financial statements or additional disclosure.
Note 10. Information Regarding Pending and Settled Legal Proceedings
In December 2005, without admitting or denying the allegations, American Express Financial Corporation (AEFC, which is now known as Ameriprise Financial, Inc. (Ameriprise Financial)) entered into settlement agreements with the Securities and Exchange Commission (SEC) and Minnesota Department of Commerce (MDOC) related to market timing activities. As a result, AEFC was censured and ordered to cease and desist from committing or causing any violations of certain provisions of the Investment Advisers Act of 1940, the Investment Company Act of 1940, and various Minnesota laws. AEFC agreed to pay disgorgement of $10 million and civil money penalties of $7 million. AEFC also agreed to retain an independent distribution consultant to assist in developing a plan for distribution of all disgorgement and civil penalties ordered by the SEC in accordance with various undertakings detailed at www.sec.gov/litigation/admin/ia-2451.pdf. Ameriprise Financial and its affiliates have cooperated with the SEC and the MDOC in these legal proceedings, and have made regular reports to the funds' Boards of Trustees.
Ameriprise Financial and certain of its affiliates have historically been involved in a number of legal, arbitration and regulatory proceedings, including routine litigation, class actions, and governmental actions, concerning matters arising in connection with the conduct of their business activities. Ameriprise Financial believes that the Funds are not currently the subject of, and that neither Ameriprise Financial nor any of its affiliates are the subject of, any pending legal, arbitration or regulatory proceedings that are likely to have a material adverse effect on the Funds or the ability of Ameriprise Financial or its affiliates to perform under their contracts with the Funds. Ameriprise Financial is required to make 10-Q,
Annual Report 2012
27
Columbia Connecticut Intermediate Municipal Bond Fund
Notes to Financial Statements (continued)
October 31, 2012
10-K and, as necessary, 8-K filings with the Securities and Exchange Commission on legal and regulatory matters that relate to Ameriprise Financial and its affiliates. Copies of these filings may be obtained by accessing the SEC website at www.sec.gov.
There can be no assurance that these matters, or the adverse publicity associated with them, will not result in increased fund redemptions, reduced sale of fund shares or other adverse consequences to the Funds. Further, although we believe proceedings are not likely to have a material adverse effect on the Funds or the ability of Ameriprise Financial or its affiliates to perform under their contracts with the Funds, these proceedings are subject to uncertainties and, as such, we are unable to estimate the possible loss or range of loss that may result. An adverse outcome in one or more of these proceedings could result in adverse judgments, settlements, fines, penalties or other relief that could have a material adverse effect on the consolidated financial condition or results of operations of Ameriprise Financial.
Annual Report 2012
28
Columbia Connecticut Intermediate Municipal Bond Fund
Report of Independent Registered Public Accounting Firm
To the Trustees of Columbia Funds Series Trust I and
the Shareholders of Columbia Connecticut Intermediate Municipal Bond Fund
In our opinion, the accompanying statement of assets and liabilities, including the portfolio of investments, and the related statements of operations and of changes in net assets and the financial highlights present fairly, in all material respects, the financial position of Columbia Connecticut Intermediate Municipal Bond Fund (the "Fund") (a series of Columbia Funds Series Trust I) at October 31, 2012, the results of its operations for the year then ended, the changes in its net assets for each of the two years in the period then ended and the financial highlights for each of the periods indicated, in conformity with accounting principles generally accepted in the United States of America. These financial statements and financial highlights (hereafter referred to as "financial statements") are the responsibility of the Fund's management. Our responsibility is to express an opinion on these financial statements based on our audits. We conducted our audits of these financial statements in accordance with the standards of the Public Company Accounting Oversight Board (United States). Those standards require that we plan and perform the audit to obtain reasonable assurance about whether the financial statements are free of material misstatement. An audit includes examining, on a test basis, evidence supporting the amounts and disclosures in the financial statements, assessing the accounting principles used and significant estimates made by management, and evaluating the overall financial statement presentation. We believe that our audits, which included confirmation of securities at October 31, 2012 by correspondence with the custodian and brokers, provide a reasonable basis for our opinion.
PricewaterhouseCoopers LLP
Minneapolis, Minnesota
December 21, 2012
Annual Report 2012
29
Columbia Connecticut Intermediate Municipal Bond Fund
Federal Income Tax Information
(Unaudited)
The Fund hereby designates the following tax attributes for distributions paid in the fiscal year ended October 31, 2012. Shareholders will be notified in early 2013 of amounts for use in preparing 2012 income tax returns.
Tax Designations:
Capital Gain Dividend | | $ | 932,392 | | |
Exempt-Interest Dividends | | | 100.00 | % | |
Capital Gain Dividend — The Fund designates as a capital gain dividend the amount reflected above, or if subsequently determined to be different, the net capital gain of such fiscal period.
Exempt-Interest Dividends — The percentage of net investment income distributions paid during the fiscal year that qualifies as exempt-interest dividends for federal income tax purposes.
Annual Report 2012
30
Columbia Connecticut Intermediate Municipal Bond Fund
The Trustees serve terms of indefinite duration. The names, addresses and birth years of the Trustees and Officers of the Funds in Columbia Funds Series Trust I, the year each was first elected or appointed to office, their principal business occupations during at least the last five years, the number of Funds overseen by each Trustee and other directorships they hold are shown below. Each officer listed below serves as an officer of each Fund in Columbia Funds Series Trust I.
Independent Trustees
Name, Address and Year of Birth,
Position with Funds, Year First
Elected or Appointed to Office | | Principal Occupation(s) During Past Five Years, Number of Funds in Columbia
Funds Complex Overseen by Trustee, Other Directorships Held
| |
Rodman L. Drake (Born 1943)
c/o Columbia Management Investment Advisers, LLC
225 Franklin Street
Boston, MA 02110
Trustee (since 1994) and
Chairman of the Board (since 2009) | | Independent consultant since 2010; Co-Founder of Baringo Capital LLC (private equity) from 1997 to 2008; CEO of Crystal River Capital, Inc. (real estate investment trust) from 2003 to 2010; Oversees 52; Jackson Hewitt Tax Service Inc. (tax preparation services from 2004 to 2011); Celgene Corporation (global biotechnology company); Student Loan Corporation (student loan provider from 2005 to 2010); Celgene Corporation (global biotechnology company); The Helios Funds and Brookfield Funds (closed-end funds); Crystal River Capital, Inc. from 2005 to 2010; Parsons Brinckerhoff from 1995 to 2008; and Apex Silver Mines Ltd. from 2007 to 2009 | |
Douglas A. Hacker (Born 1955)
c/o Columbia Management Investment Advisers, LLC
225 Franklin Street
Boston, MA 02110
Trustee (since 1996) | | Independent business executive since May 2006; Executive Vice President — Strategy of United Airlines from December 2002 to May 2006; President of UAL Loyalty Services (airline marketing company) from September 2001 to December 2002; Executive Vice President and Chief Financial Officer of United Airlines from July 1999 to September 2001. Oversees 52; Nash Finch Company (food distributor); Aircastle Limited (aircraft leasing); and SeaCube Container Leasing Ltd. (container leasing) | |
Janet Langford Kelly (Born 1957)
c/o Columbia Management Investment Advisers, LLC
225 Franklin Street
Boston, MA 02110
Trustee (since 1996) | | Senior Vice President, General Counsel and Corporate Secretary, ConocoPhillips (integrated energy company) since September 2007; Deputy General Counsel — Corporate Legal Services, ConocoPhillips from August 2006 to August 2007; Partner, Zelle, Hofmann, Voelbel, Mason & Gette LLP (law firm) from March 2005 to July 2006; Adjunct Professor of Law, Northwestern University from September 2004 to June 2006; Director, UAL Corporation (airline) from February 2006 to July 2006; Chief Administrative Officer and Senior Vice President, Kmart Holding Corporation (consumer goods) from September 2003 to March 2004. Oversees 52; None | |
Nancy T. Lukitsh (Born 1956)
c/o Columbia Management Investment Advisers, LLC
225 Franklin Street
Boston, MA 02110
Trustee (since 2011) | | Senior Vice President, Partner and Director of Marketing, Wellington Management Company, LLP (investment adviser) from 1997 to 2010; Chair, Wellington Management Investment Portfolios (commingled non-U.S. investment pools) from 2007 to 2010; Director, Wellington Trust Company, NA and other Wellington affiliates from 1997 to 2010. Oversees 52; None | |
William E. Mayer (Born 1940)
c/o Columbia Management Investment Advisers, LLC
225 Franklin Street
Boston, MA 02110
Trustee (since 1994) | | Partner, Park Avenue Equity Partners (private equity) since February 1999; Dean and Professor, College of Business and Management, University of Maryland from 1992 to 1996. Oversees 52; DynaVox Inc. (speech creation); Lee Enterprises (print media); WR Hambrecht + Co. (financial service provider) from 2000 to 2012; BlackRock Kelso Capital Corporation (investment company) | |
David M. Moffett (Born 1952)
c/o Columbia Management Investment Advisers, LLC
225 Franklin Street
Boston, MA 02110
Trustee (since 2011) | | Retired. Chief Executive Officer, Federal Home Loan Mortgage Corporation, from 2008 to 2009; Senior Adviser, Global Financial Services Group, Carlyle Group, Inc., from 2007 to 2008; Vice Chairman and Chief Financial Officer, U.S. Bancorp, from 1993 to 2007. Oversees 52; CIT Group Inc. (commercial and consumer finance); eBay Inc. (online trading community); MBIA Inc. (financial service provider); E.W. Scripps Co. (print and television media), Building Materials Holding Corp. (building materials and construction services); and University of Oklahoma Foundation. | |
Charles R. Nelson (Born 1942)
c/o Columbia Management Investment Advisers, LLC
225 Franklin Street
Boston, MA 02110
Trustee (since 1981) | | Retired Professor Emeritus, University of Washington, since 2011; Professor of Economics, University of Washington from January 1976 to 2011; Ford and Louisa Van Voorhis Professor of Political Economy, University of Washington from 1993 to 2011; Adjunct Professor of Statistics, University of Washington from 1980 to 2011; Associate Editor, Journal of Money Credit and Banking from 1993 to 2008; consultant on econometric and statistical matters. Oversees 52; None | |
John J. Neuhauser (Born 1943)
c/o Columbia Management Investment Advisers, LLC
225 Franklin Street
Boston, MA 02110
Trustee (since 1984) | | President, Saint Michael's College, since August 2007; Director or Trustee of several non-profit organizations, including Fletcher Allen Health Care, Inc.; University Professor, Boston College from November 2005 to August 2007; Academic Vice President and Dean of Faculties, Boston College from August 1999 to October 2005. Oversees 52; Liberty All-Star Equity Fund and Liberty All-Star Growth Fund (closed-end funds) | |
Annual Report 2012
31
Columbia Connecticut Intermediate Municipal Bond Fund
Trustees and Officers (continued)
Independent Trustees (continued)
Name, Address and Year of Birth,
Position with Funds, Year First
Elected or Appointed to Office | | Principal Occupation(s) During Past Five Years, Number of Funds in Columbia
Funds Complex Overseen by Trustee, Other Directorships Held
| |
Patrick J. Simpson (Born 1944)
c/o Columbia Management Investment Advisers, LLC
225 Franklin Street
Boston, MA 02110
Trustee (since 2000) | | Partner, Perkins Coie LLP (law firm). Oversees 52; None | |
Anne-Lee Verville (Born 1945)
c/o Columbia Management Investment Advisers, LLC
225 Franklin Street
Boston, MA 02110
Trustee (since 1998) | | Retired. General Manager — Global Education Industry from 1994 to 1997, President — Application Systems Division from 1991 to 1994, Chief Financial Officer — US Marketing & Services from 1988 to 1991, and Chief Information Officer from 1987 to 1988, IBM Corporation (computer and technology). Oversees 52; Enesco Group, Inc. (producer of giftware and home and garden decor products) from 2001 to 2006 | |
Interested Trustee
Name, Address and Year of Birth,
Position with Funds, Year First
Elected or Appointed to Office | | Principal Occupation(s) During Past Five Years, Number of Funds in Columbia
Funds Complex Overseen by Trustee, Other Directorships Held
| |
William F. Truscott (born 1960)
53600 Ameriprise Financial Center
Minneapolis, MN 55474
Senior Vice President (since 2012) | | Chairman of the Board and President, Columbia Management Investment Advisers, LLC since May 2010 and February 2012, respectively (previously President, Chairman of the Board and Chief Investment Officer, from 2001 to April 2010); Chief Executive Officer, U.S. Asset Management & President, Annuities, Ameriprise Financial, Inc. since May 2010 (previously President — U.S. Asset Management and Chief Investment Officer from 2005 to April 2010, and Senior Vice President — Chief Investment Officer, from 2001 to 2005); Director, President and Chief Executive Officer, Ameriprise Certificate Company since 2006; Director and Chief Executive Officer, Columbia Management Investment Distributors, Inc. since May 2010 and February 2012, respectively (previously Chairman of the Board and Chief Executive Officer from 2008 to April 2010); Chairman of the Board and Chief Executive Officer, RiverSource Distributors, Inc. since 2006. Oversees 208; Columbia Funds Board. | |
The Statement of Additional Information includes additional information about the Trustees of the Funds and is available, without charge, upon request by calling 1-800-345-6611.
Officers
Name, Year of Birth and Address | | Principal Occupation(s) During the Past Five Years | |
J. Kevin Connaughton (Born 1964)
225 Franklin Street
Boston, MA 02110
President (since 2009) | | Senior Vice President and General Manager — Mutual Fund Products, Columbia Management Investment Advisers, LLC since May 2010; President, Columbia Funds, since 2009, and RiverSource Funds, since May 2010 (previously Senior Vice President and Chief Financial Officer, Columbia Funds, from June 2008 to January 2009, Treasurer, Columbia Funds, from October 2003 to May 2008, and senior officer of various other affiliated funds since 2000); Managing Director, Columbia Management Advisors, LLC from December 2004 to April 2010. | |
Michael G. Clarke (Born 1969)
225 Franklin Street
Boston, MA 02110
Treasurer (since 2011) and Chief Financial Officer (since 2009) | | Vice President, Columbia Management Investment Advisers, LLC since May 2010; Managing Director of Fund Administration, Columbia Management Advisors, LLC, from September 2004 to April 2010; senior officer of Columbia Funds and affiliated funds since 2002. | |
Scott R. Plummer (Born 1959)
5228 Ameriprise Financial Center
Minneapolis, MN 55474
Senior Vice President, Assistant Secretary and Chief Legal Officer (since 2010) | | Senior Vice President, Chief Legal Officer and Assistant Secretary, Columbia Management Investment Advisers, LLC since June 2005; Vice President and Lead Chief Counsel — Asset Management, Ameriprise Financial, Inc. since May 2010 (previously Vice President and Chief Counsel — Asset Management, from 2005 to April 2010); Vice President, Chief Counsel and Assistant Secretary, Columbia Management Investment Distributors, Inc. since 2008; Vice President, General Counsel and Secretary, Ameriprise Certificate Company since 2005; Chief Counsel, RiverSource Distributors, Inc. since 2006; Vice President, General Counsel and Secretary, RiverSource Funds since December 2006; Senior Vice President, Secretary and Chief Legal Officer, Columbia Funds, since May 2010. | |
Annual Report 2012
32
Columbia Connecticut Intermediate Municipal Bond Fund
Trustees and Officers (continued)
Officers (continued)
Name, Year of Birth and Address | | Principal Occupation(s) During the Past Five Years | |
William F. Truscott (Born 1960)
53600 Ameriprise Financial Center
Minneapolis, MN 55474
Senior Vice President (since 2010) | | Chairman of the Board and President, Columbia Management Investment Advisers, LLC since May 2010 and February 2012, respectively (previously President, Chairman of the Board and Chief Investment Officer, from 2001 to April 2010); Chief Executive Officer, U.S. Asset Management & President, Annuities, Ameriprise Financial, Inc. since May 2010 (previously President — U.S. Asset Management and Chief Investment Officer from 2005 to April 2010); Director, President and Chief Executive Officer, Ameriprise Certificate Company since 2006; Director and Chief Executive Officer, Columbia Management Investment Distributors, Inc. since May 2010 and February 2012, respectively (previously Chairman of the Board and Chief Executive Officer from 2008 to April 2010); Chairman of the Board and Chief Executive Officer, RiverSource Distributors, Inc. since 2006. | |
Thomas P. McGuire (Born 1972)
225 Franklin Street
Boston, MA 02110
Chief Compliance Officer (since 2012) | | Vice President — Asset Management Compliance, Columbia Management Investment Advisers, LLC since 2010; Chief Compliance Officer, Ameriprise Certificate Company, since September 2010; Compliance Executive, Bank of America, 2005-2010. | |
Colin Moore (Born 1958)
225 Franklin Street
Boston, MA 02110
Senior Vice President (since 2010) | | Director and Chief Investment Officer, Columbia Management Investment Advisers, LLC since May 2010; Manager, Managing Director and Chief Investment Officer of Columbia Management Advisors, LLC from 2007 to April 2010; Head of Equities, Columbia Management Advisors, LLC from 2002 to 2007. | |
Amy Johnson (Born 1965)
5228 Ameriprise Financial Center
Minneapolis, MN 55474
Vice President (since 2010) | | Senior Vice President and Chief Operating Officer, Columbia Management Investment Advisers, LLC since May 2010 (previously Chief Administrative Officer, from 2009 until April 2010, Vice President — Asset Management and Trust Company Services, from 2006 to 2009, and Vice President — Operations and Compliance from 2004 to 2006). | |
Joseph F. DiMaria (Born 1968)
225 Franklin Street
Boston, MA 02110
Vice President (since 2011) and Chief Accounting Officer (since 2008) | | Vice President, Mutual Fund Administration, Columbia Management Investment Advisers, LLC, since May 2010; Director of Fund Administration, Columbia Management Advisors, LLC from January 2006 to April 2010; Head of Tax/Compliance and Assistant Treasurer, Columbia Management Advisors, LLC, from November 2004 to December 2005. | |
Stephen T. Welsh (born 1957)
225 Franklin Street
Boston, MA 02110
Vice President (since 2006) | | President and Director, Columbia Management Investment Services Corp. since May 2010; President and Director, Columbia Management Services, Inc. from July 2004 to April 2010; Managing Director, Columbia Management Distributors, Inc. from August 2007 to April 2010. | |
Paul D. Pearson (born 1956)
10468 Ameriprise Financial Center
Minneapolis, MN 55474
Vice President and Assistant Treasurer (since 2011) | | Vice President, Investment Accounting, Columbia Management Investment Advisers, LLC, since May 2010; Vice President, Managed Assets, Investment Accounting, Ameriprise Financial Corporation. | |
Paul B. Goucher (born 1968)
5228 Ameriprise Financial Center
Minneapolis, MN 55474
Vice President and Assistant Secretary (since 2010) | | Vice President and Chief Counsel of Ameriprise Financial since January 2010 (formerly Vice President and Group Counsel from November 2008 to January 2010); Director, Managing Director and General Counsel of J. & W. Seligman & Co. Incorporated (Seligman) from July 2008 to November 2008 and Managing Director and Associate General Counsel of Seligman from January 2005 to July 2008. | |
Christopher O. Petersen (born 1970)
5228 Ameriprise Financial Center
Minneapolis, MN 55474
Vice President (since 2010) and Secretary (since 2011) | | Vice President and Chief Counsel, Ameriprise Financial since January 2010 (formerly Vice President and Group Counsel or Counsel from April 2004 to January 2010); Assistant Secretary of RiverSource Funds since January 2007; officer of Columbia Funds and affiliated funds since 2007. | |
Michael E. DeFao (born 1968)
225 Franklin Street
Boston, MA 02110
Vice President and Assistant Secretary (since 2011) | | Vice President and Chief Counsel, Ameriprise Financial since May 2010; Associate General Counsel, Bank of America from June 2005 to April 2010. | |
Annual Report 2012
33
Columbia Connecticut Intermediate Municipal Bond Fund
Board Consideration and Approval of
Advisory Agreement
On June 6, 2012, the Board of Trustees (the "Board") and the Trustees who are not interested persons (as defined in the Investment Company Act of 1940) of the Trust (the "Independent Trustees") unanimously approved the continuation of the Investment Management Services Agreement (the "Advisory Agreement") with Columbia Management Investment Advisers, LLC (the "Investment Manager") with respect to Columbia Connecticut Intermediate Municipal Bond Fund (the "Fund"), a series of the Trust. As detailed below, the Advisory Fees and Expenses Committee (the "Committee") and the Board met on multiple occasions to review and discuss, both among themselves and with the management team of the Investment Manager, materials provided by the Investment Manager before determining to approve the continuation of the Advisory Agreement.
In connection with their deliberations regarding the continuation of the Advisory Agreement, the Committee and the Board requested and evaluated materials from the Investment Manager regarding the Fund and the Advisory Agreement, and discussed these materials with representatives of the Investment Manager at the Committee meeting held on June 5, 2012 and at the Board meeting held on June 6, 2012. In addition, the Board considers matters bearing on the Advisory Agreement at most of its other meetings throughout the year and meets regularly with senior management of the Funds and the Investment Manager. Through the Board's Investment Oversight Committees, Trustees also meet with selected Fund portfolio managers and other investment personnel at various times throughout the year. The Committee and the Board also consulted with Fund counsel and with the Independent Trustees' independent legal counsel, who advised on the legal standard for consideration by the Board and otherwise assisted the Board in its deliberations. On June 5, 2012, the Committee recommended that the Board approve the continuation of the Advisory Agreement. On June 6, 2012, the Board, including the Independent Trustees, voting separately, unanimously approved the continuation of the Advisory Agreement for the Fund.
The Committee and the Board considered all information that they, their legal counsel, or the Investment Manager believed reasonably necessary to evaluate and to determine whether to approve the continuation of the Advisory Agreement. In their deliberations, the Trustees did not identify any particular information that was all-important or controlling, and individual Trustees may have attributed different weights to the various factors. The information and factors considered by the Committee and the Board in recommending for approval or approving the continuation of the Advisory Agreement for the Fund included the following:
• Information on the investment performance of the Fund relative to the performance of the Fund's benchmarks and the performance of a group of comparable mutual funds, as determined by an independent third-party data provider;
• Information on the Fund's advisory fees and total expenses, including information comparing the Fund's expenses to those of a group of comparable mutual funds, as determined by an independent third-party data provider;
• The Investment Manager's agreement to contractually limit or cap total operating expenses for the Fund so that total operating expenses (excluding certain fees and expenses, such as transaction costs and certain other investment related expenses, interest, taxes, acquired fund fees and expenses, and extraordinary expenses) would not exceed the median expenses of a group of comparable funds (as determined from time to time, generally annually, by an independent third-party data provider);
• The terms and conditions of the Advisory Agreement, including that the advisory fee rates payable by the Fund would not change;
• The terms and conditions of other agreements and arrangements with affiliates of the Investment Manager relating to the operations of the Fund, including the Administrative Services Agreement, the Distribution Agreement and the Transfer and Dividend Disbursing Agent Agreement, noting in the case of the Transfer and Dividend Disbursing Agent Agreement certain proposed changes to the fee rates payable thereunder;
• Descriptions of various functions performed by the Investment Manager under the Advisory Agreement, including portfolio management and portfolio trading practices;
• Information regarding the management fees and investment performance of any comparable portfolios of other clients of the Investment Manager, including institutional separate accounts; and
• The profitability to the Investment Manager and its affiliates from their relationships with the Fund.
Annual Report 2012
34
Columbia Connecticut Intermediate Municipal Bond Fund
Board Consideration and Approval of
Advisory Agreement (continued)
Nature, Extent and Quality of Services to be Provided under the Advisory Agreement
The Committee and the Board considered the nature, extent and quality of services provided to the Fund by the Investment Manager and its affiliates under the Advisory Agreement and under separate agreements for the provision of transfer agency and administrative services, and the resources dedicated to the Fund and the other Columbia Funds by the Investment Manager and its affiliates. The Committee and the Board considered, among other things, the Investment Manager's ability to attract, motivate and retain highly qualified research, advisory and supervisory investment professionals (including personnel and other resources, compensation programs for personnel involved in fund management, reputation and other attributes), the portfolio management services provided by those investment professionals, the quality of the Investment Manager's investment research capabilities and trade execution services, and the other resources that the Investment Manager devotes to the Fund. The Committee and the Board also considered the potential benefits to shareholders of investing in a mutual fund that is part of a fund complex offering exposure to a variety of asset classes and investment disciplines and providing a variety of fund and shareholder services.
The Committee and the Board also considered the professional experience and qualifications of the senior personnel of the Investment Manager. The Committee and the Board noted the compliance programs of and the compliance-related resources provided to the Fund by the Investment Manager and its affiliates, and considered the Investment Manager's ability to provide administrative services to the Fund pursuant to a separate administrative services agreement, including the Investment Manager's ability to coordinate the activities of the Fund's other service providers. After reviewing these and related factors, the Committee and the Board concluded, within the context of their overall conclusions, that the expected nature, extent and quality of the services to be provided to the Fund under the Advisory Agreement supported the continuation of such agreement.
Investment Performance
The Committee and the Board reviewed information about the performance of the Fund over various time periods, including performance information relative to benchmarks and information based on reports of an independent third-party data provider that compared the performance of the Fund to the performance of a group of comparable mutual funds. The Committee and the Board also reviewed a description of the third party's methodology for identifying the Fund's peer groups for purposes of performance and expense comparisons. In the case of each Fund whose performance lagged that of a relevant peer group for certain (although not necessarily all) periods, the Committee and the Board concluded that other factors relevant to performance were sufficient, in light of other considerations, to warrant continuation of the Fund's Advisory Agreement. Those factors varied from fund to fund, but included one or more of the following: (i) that the Fund's performance, although lagging in certain recent periods, was stronger over the longer term; (ii) that the underperformance was attributable, to a significant extent, to investment decisions that were reasonable and consistent with the Fund's investment strategy and policies and that the Fund was performing within a reasonable range of expectations, given those investment decisions, market conditions and the Fund's investment strategy; (iii) that the Fund's performance was competitive when compared to other relevant performance benchmarks or peer groups; and (iv) that the Investment Manager had taken or was taking steps designed to help improve the Fund's investment performance, including, but not limited to, replacing portfolio managers, enhancing the resources supporting the portfolio managers, or modifying investment strategies.
The Committee and the Board noted that, through December 31, 2011, the Fund's performance was in the forty-ninth, sixty-seventh and eighty-fifth percentiles (where the best performance would be in the first percentile) of its category selected by an independent third-party data provider for the purposes of performance comparisons for the one-, three- and five- year periods, respectively.
The Committee and the Board also considered the Investment Manager's performance and reputation generally, the Investment Manager's historical responsiveness to Board concerns about performance and the Investment Manager's willingness to take steps intended to improve performance. After reviewing these and related factors, the Committee and the Board concluded, within the context of their overall conclusions regarding the Advisory Agreement, that the performance of the Fund and the Investment Manager was sufficient, in light of other considerations, to warrant the continuation of the Advisory Agreement.
Annual Report 2012
35
Columbia Connecticut Intermediate Municipal Bond Fund
Board Consideration and Approval of
Advisory Agreement (continued)
Investment Advisory Fee Rates and Other Expenses
The Committee and the Board considered the advisory fees to be charged to the Fund under the Advisory Agreement as well as the total expenses to be incurred by the Fund. In assessing the reasonableness of the fees under the Advisory Agreement, the Committee and the Board considered, among other information, the Fund's advisory fee and its expected total expense ratio as a percentage of average daily net assets. The Committee and the Board noted that the Fund's actual management fee and total net expense ratio are ranked in the first and second quintiles, respectively, against the Fund's expense universe as determined by an independent third-party data provider for purposes of expense comparison. The Committee and the Board also took into account the fee waiver and expense limitation arrangements agreed to by the Investment Manager, as noted above.
The Committee and the Board also considered the fact that the advisory fee rates payable by the Fund to the Investment Manager under the Advisory Agreement were the same as those currently paid by the Fund to the Investment Manager.
The Committee and the Board also received and considered information about the advisory fees charged by the Investment Manager to institutional separate accounts. In considering the fees charged to those accounts, the Committee and the Board took into account, among other things, the Investment Manager's representations about the differences between managing mutual funds as compared to other types of accounts, including differences in the services provided, differences in the risk profile of such business for the Investment Manager and the additional resources required to manage mutual funds effectively. In evaluating the Fund's advisory fees, the Committee and the Board also took into account the demands, complexity and quality of the investment management of the Fund.
After reviewing these and related factors, the Committee and the Board concluded, within the context of their overall conclusions, that the advisory fee rates and expenses of the Fund supported the continuation of the Advisory Agreement.
Costs of Services to be Provided and Profitability
The Committee and the Board also took note of the costs of the services provided (both on an absolute and relative basis) and the profitability to the Investment Manager and its affiliates in connection with their relationships with the Fund. In evaluating these considerations, the Committee and the Board took note of the advisory fees charged by the Investment Manager to other clients, including fees charged by the Investment Manager to any institutional separate account clients with similar investment strategies to those of the Fund.
The Committee and the Board also considered the compensation directly or indirectly received by the Investment Manager's affiliates in connection with their relationships with the Fund. The Committee and the Board reviewed information provided by management as to the profitability of the Investment Manager and its affiliates of their relationships with the Fund, and information about the allocation of expenses used to calculate profitability. When reviewing profitability, the Committee and the Board also considered court cases in which adviser profitability was an issue in whole or in part, the performance of the fund, the expense ratio of the fund, and the implementation of expense limitations with respect to the fund. The Committee and the Board also considered information provided by the Investment Manager regarding its financial condition and comparing its profitability to that of other asset management firms that are, or are subsidiaries of, publicly traded companies.
After reviewing these and related factors, the Committee and the Board concluded, within the context of their overall conclusions, that the profitability to the Investment Manager and its affiliates from their relationships with the Fund supported the continuation of the Advisory Agreement.
Economies of Scale
The Committee and the Board considered the potential existence of economies of scale in the provision by the Investment Manager of services to the Fund, to groups of related funds, and to the Investment Manager's investment advisory clients as a whole, and whether those economies of scale were shared with the Fund through breakpoints in investment advisory fees or other means, such as expense limitation arrangements and additional investments by the Investment Manager in investment, trading and compliance resources. The Committee and the Board noted that the investment advisory fee schedules for the Fund contained breakpoints that would reduce the fee rate on assets above specified threshold levels.
Annual Report 2012
36
Columbia Connecticut Intermediate Municipal Bond Fund
Board Consideration and Approval of
Advisory Agreement (continued)
In considering these issues, the Committee and the Board also considered the costs of the services provided (both on an absolute and relative basis) and the profitability to the Investment Manager and its affiliates from their relationships with the Fund, as discussed above. After reviewing these and related factors, the Committee and the Board concluded, within the context of their overall conclusions, that the extent to which economies of scale were expected to be shared with the Fund supported the continuation of the Advisory Agreement.
Other Benefits to the Investment Manager
The Committee and the Board received and considered information regarding "fall-out" or ancillary benefits received by the Investment Manager and its affiliates as a result of their relationships with the Fund, such as the engagement of the Investment Manager to provide administrative services to the Fund and the engagement of the Investment Manager's affiliates to provide distribution and transfer agency services to the Fund. The Committee and the Board considered that the Fund's distributor retains a portion of the distribution fees from the Fund and receives a portion of the sales charges on sales or redemptions of certain classes of shares of the Fund. The Committee and the Board also considered the benefits of research made available to the Investment Manager by reason of brokerage commissions generated by the Fund's securities transactions, and reviewed information about the Investment Manager's practices with respect to allocating portfolio brokerage for brokerage and research services. The Committee and the Board considered the possible conflicts of interest associated with certain fall-out or other ancillary benefits and the reporting, disclosure and other processes that would be in place to address such possible conflicts of interest. The Committee and the Board recognized that the Investment Manager's profitability would be somewhat lower without these benefits.
Conclusion
The Committee and the Board reviewed all of the above considerations in reaching their decisions to recommend or approve the continuation of the Advisory Agreement. No single item was identified as paramount or controlling, and individual Trustees may have attributed different weights to various factors. Based on their evaluation of all factors that they deemed to be material, including those factors described above, and assisted by the advice of independent legal counsel, the Board, including the Independent Trustees, voting separately, unanimously approved the continuation of the Advisory Agreement.
Annual Report 2012
37
This page intentionally left blank.
Annual Report 2012
38
This page intentionally left blank.
Annual Report 2012
39
This page intentionally left blank.
Annual Report 2012
40
Columbia Connecticut Intermediate Municipal Bond Fund
Important Information About This Report
Each fund mails one shareholder report to each shareholder address. If you would like more than one report, please call shareholder services at 800.345.6611 and additional reports will be sent to you.
The policy of the Board is to vote the proxies of the companies in which each fund holds investments consistent with the procedures as stated in the Statement of Additional Information (SAI). You may obtain a copy of the SAI without charge by calling 800.345.6611; contacting your financial intermediary; visiting columbiamanagement.com; or searching the website of the Securities and Exchange Commission (SEC) at sec.gov. Information regarding how each fund voted proxies relating to portfolio securities is filed with the SEC by August 31 for the most recent 12-month period ending June 30 of that year, and is available without charge by visiting columbiamanagement.com; or searching the website of the SEC at sec.gov.
Each fund files a complete schedule of portfolio holdings with the SEC for the first and third quarters of each fiscal year on Form N-Q. Each fund's Form N-Q is available on the SEC's website at sec.gov and may be reviewed and copied at the SEC's Public Reference Room in Washington, D.C. Information on the operation of the Public Reference Room may be obtained by calling 800.SEC.0330. Each fund's complete schedule of portfolio holdings, as filed on Form N-Q, can also be obtained without charge, upon request, by calling 800.345.6611.
Annual Report 2012
41

Columbia Connecticut Intermediate Municipal Bond Fund
P.O. Box 8081
Boston, MA 02266-8081
columbiamanagement.com
This information is for use with concurrent or prior delivery of a fund prospectus. Please read and consider the investment objectives, risks, charges and expenses for any fund carefully before investing. For a prospectus which contains this and other important information about the Fund go to columbiamanagement.com. The Fund is distributed by Columbia Management Investment Distributors, Inc., member FINRA, and managed by Columbia Management Investment Advisers, LLC.
© 2012 Columbia Management Investment Advisers, LLC. All rights reserved.
C-1026 D (12/12)
Annual Report
October 31, 2012

Columbia New York Intermediate Municipal Bond Fund
Not FDIC insured • No bank guarantee • May lose value
Columbia New York Intermediate Municipal Bond Fund
 Dear Shareholders,
Stocks rebound around the world
After a weak second quarter, U.S. stock market averages rebounded in the third quarter, erasing earlier losses and boosting year-to-date returns well into double digits. Welcome news from Europe and additional quantitative easing in the United States by the Federal Reserve Board helped bolster the rally. The Standard & Poor's 500 Index (S&P 500 Index) rose 6.35% (total return) for the quarter. The Dow Jones Industrial Average advanced 4.32% for the same period. From the beginning of the calendar year through September 30, 2012, the S&P 500 Index was up 16.44% (total return). And, as of the end of September, the S&P 500 Index stood at 1,440 — approximately 8% below its all-time high of 1,565 that was set on October 9, 2007.
Outside the United States, stock markets of both developed and emerging market economies rebounded, as measured in U.S. dollars. Investors responded favorably to the announcement of policy measures aimed to resolve the eurozone crisis, which could potentially have a favorable impact on growth in emerging market economies. A weaker dollar also benefited returns to U.S. investors.
Solid gains for fixed income
Within fixed income, investors appeared to be increasingly willing to take on risk as they abandoned higher quality sectors that dominated the performance rankings in the second quarter and favored riskier sectors, where yield spreads tightened by a significant margin. Fixed-income returns were strong, but unlike equities, they have been less volatile, accumulating steadily over the course of the year. Gains were the highest for high-yield and emerging market bonds. By contrast, government issued debt securities eked out smaller gains.
Stay on track with Columbia Management
Backed by more than 100 years of experience, Columbia Management is one of the nation's largest asset managers. At the heart of our success — and, most importantly, that of our investors — are highly talented industry professionals, brought together by a unique way of working. We are dedicated to helping you take advantage of today's opportunities and anticipate tomorrow's. We stay abreast of the latest investment trends and ideas, using our collective insight to evaluate events and transform them into solutions you can use.
Visit columbiamanagement.com for:
> The Columbia Management Perspectives blog, featuring timely posts by our investment teams
> Detailed up-to-date fund performance and portfolio information
> Economic analysis and market commentary
> Quarterly fund commentaries
> Columbia Management Investor, our award-winning quarterly newsletter for shareholders
Thank you for your continued support of the Columbia Funds. We look forward to serving your investment needs for many years to come.
Best Regards,

J. Kevin Connaughton
President, Columbia Funds
The S&P 500 Index, an unmanaged index, measures the performance of 500 widely held, large-capitalization U.S. stocks and is frequently used as a general measure of market performance. The Dow Jones Industrial Average is a price weighted average of 30 actively traded shares of blue chip US industrial corporations listed on the New York Stock Exchange. Indices are not available for investment, are not professionally managed and do not reflect sales charges, fees, brokerage commissions, taxes or other expenses of investing.
Investors should consider the investment objectives, risks, charges and expenses of a mutual fund carefully before investing. For a free prospectus, which contains this and other important information about a fund, visit columbiamanagement.com. The prospectus should be read carefully before investing.
Columbia Funds are distributed by Columbia Management Investment Distributors, Inc., member FINRA, and managed by Columbia Management Investment Advisers, LLC.
© 2012 Columbia Management Investment Advisers, LLC. All rights reserved.
Columbia New York Intermediate Municipal Bond Fund
Performance Overview | | | 2 | | |
Manager Discussion of Fund Performance | | | 4 | | |
Understanding Your Fund's Expenses | | | 6 | | |
Portfolio of Investments | | | 7 | | |
Statement of Assets and Liabilities | | | 15 | | |
Statement of Operations | | | 17 | | |
Statement of Changes in Net Assets | | | 18 | | |
Financial Highlights | | | 20 | | |
Notes to Financial Statements | | | 25 | | |
Report of Independent Registered
Public Accounting Firm | | | 31 | | |
Federal Income Tax Information | | | 32 | | |
Trustees and Officers | | | 33 | | |
Board Consideration and Approval of Advisory Agreement | | | 36 | | |
Important Information About This Report | | | 41 | | |
Fund Investment Manager
Columbia Management Investment
Advisers, LLC
225 Franklin Street
Boston, MA 02110
Fund Distributor
Columbia Management Investment
Distributors, Inc.
225 Franklin Street
Boston, MA 02110
Fund Transfer Agent
Columbia Management Investment
Services Corp.
P.O. Box 8081
Boston, MA 02266-8081
For more information about any of the funds, please visit columbiamanagement.com or call 800.345.6611. Customer Service Representatives are available to answer your questions Monday through Friday from 8 a.m. to 8 p.m. Eastern time.
The views expressed in this report reflect the current views of the respective parties. These views are not guarantees of future performance and involve certain risks, uncertainties and assumptions that are difficult to predict, so actual outcomes and results may differ significantly from the views expressed. These views are subject to change at any time based upon economic, market or other conditions and the respective parties disclaim any responsibility to update such views. These views may not be relied on as investment advice and, because investment decisions for a Columbia Fund are based on numerous factors, may not be relied on as an indication of trading intent on behalf of any particular Columbia Fund. References to specific securities should not be construed as a recommendation or investment advice.
Columbia New York Intermediate Municipal Bond Fund
Performance Summary
> Columbia New York Intermediate Municipal Bond Fund (the Fund) Class A shares returned 6.84% excluding sales charges for the 12-month period that ended October 31, 2012.
> The Fund underperformed the broader Barclays 3-15 Year Blend Municipal Bond Index, which returned 7.68%, and the Barclays New York 3-15 Year Blend Municipal Bond Index, which returned 7.01% for the 12-month period.
> Underweighting bonds with maturities of more than 12 years and overweighting maturities of less than two years hurt relative performance, while overweighting A and BBB rated hospital bonds had a positive influence on relative results.
Average Annual Total Returns (%) (for period ended October 31, 2012)
| | | Inception | | 1 Year | | 5 Years | | 10 Years | |
Class A* | | 11/25/02 | | | | | | | | | | | | | |
Excluding sales charges | | | | | | | 6.84 | | | | 5.07 | | | | 4.00 | | |
Including sales charges | | | | | 3.34 | | | | 4.37 | | | | 3.50 | | |
Class B* | | 11/25/02 | | | | | | | | | | | | | |
Excluding sales charges | | | | | | | 6.02 | | | | 4.29 | | | | 3.22 | | |
Including sales charges | | | | | | | 3.02 | | | | 4.29 | | | | 3.22 | | |
Class C* | | 11/25/02 | | | | | | | | | | | | | |
Excluding sales charges | | | | | | | 6.41 | | | | 4.65 | | | | 3.59 | | |
Including sales charges | | | | | | | 5.41 | | | | 4.65 | | | | 3.59 | | |
Class T | | 12/31/91 | | | | | | | | | | | | | |
Excluding sales charges | | | | | | | 6.95 | | | | 5.18 | | | | 4.11 | | |
Including sales charges | | | | | | | 1.90 | | | | 4.15 | | | | 3.60 | | |
Class Z | | 12/31/91 | | | 7.11 | | | | 5.34 | | | | 4.27 | | |
Barclays 3-15 Year Blend Municipal Bond Index | | | | | | | 7.68 | | | | 6.11 | | | | 5.05 | | |
Barclays New York 3-15 Year Blend Municipal Bond Index | | | | | | | 7.01 | | | | 5.98 | | | | 5.00 | | |
Returns for Class A are shown with and without the maximum initial sales charge of 3.25% (for the one-year and five-year periods) and 4.75% (for the 10-year period). (Prior to August 22, 2005, new purchases of Class A shares had a maximum initial sales charge of 4.75%.) Returns for Class B are shown with and without the applicable contingent deferred sales charge (CDSC) of 3.00% in the first year, declining to 1.00% in the fourth year and eliminated thereafter. Returns for Class C are shown with and without the 1.00% CDSC for the first year only. Returns for Class T are shown with and without the maximum sales charge of 4.75%. The Fund's other classes are not subject to sales charges and have limited eligibility. Please see the Fund's prospectuses for details. Performance for different share classes will vary based on differences in sales charges and fees associated with each class. All results shown assume reinvestment of distributions during the period. Returns do not reflect the deduction of taxes that a shareholder may pay on Fund distributions or on the redemption of Fund shares. Performance results reflect the effect of any fee waivers or reimbursements of Fund expenses by Columbia Management Investment Advisers, LLC and/or any of its affiliates. Absent these fee waivers or expense reimbursement arrangements, performance results would have been lower.
The performance information shown represents past performance and is not a guarantee of future results. The investment return and principal value of your investment will fluctuate so that your shares, when redeemed, may be worth more or less than their original cost. Current performance may be lower or higher than the performance information shown. You may obtain performance information current to the most recent month-end by contacting your financial intermediary, visiting columbiamanagement.com or calling 800.345.6611.
*The returns shown for periods prior to the share class inception date (including returns since inception if shown, which are since Fund inception) include the returns of the Fund's oldest share class. Since the Fund launched more than one share class at its inception, Class Z shares were used. These returns are adjusted to reflect any higher class-related operating expenses of the newer share classes, as applicable. Please visit columbiamanagement.com/mutual-funds/appended-performance for more information.
The Barclays 3-15 Year Blend Municipal Bond Index is an unmanaged index that tracks the performance of municipal bonds issued after December 31, 1990, with remaining maturities between 2 and 17 years and at least $7 million in principal amount outstanding.
The Barclays New York 3-15 Year Blend Municipal Bond Index, which tracks investment grade bonds from the state of New York and its municipalities.
Indices are not available for investment, are not professionally managed and do not reflect sales charges, fees, brokerage commissions, taxes or other expenses of investing. Securities in the Fund may not match those in an index.
Annual Report 2012
2
Columbia New York Intermediate Municipal Bond Fund
Performance Overview (continued)
Performance of a Hypothetical $10,000 Investment (November 1, 2002 – October 31, 2012)
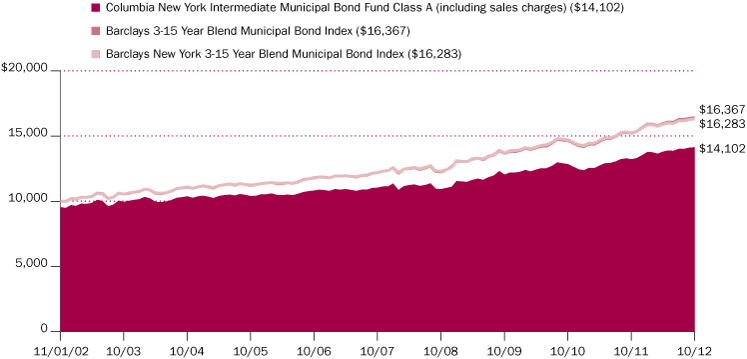
The chart above shows the change in value of a hypothetical $10,000 investment in Class A shares of Columbia New York Intermediate Municipal Bond Fund during the stated time period, and does not reflect the deduction of taxes that a shareholder may pay on Fund distributions or on the redemption of Fund shares. The performance of a $10,000 investment with sales charge for Class A shares is calculated with an initial sales charge of 4.75%, which was the effective sales charge prior to August 22, 2005.
Annual Report 2012
3
Columbia New York Intermediate Municipal Bond Fund
Manager Discussion of Fund Performance
For the 12-month period that ended October 31, 2012, the Fund's Class A shares returned 6.84% excluding sales charges. By comparison, the Barclays 3-15 Year Blend Municipal Bond Index, which is national in scope, returned 7.68% and the Barclays New York 3-15 Year Blend Municipal Bond Index returned 7.01%. An overweight in stronger-performing hospital sector bonds rated A and BBB aided returns. The Fund had less exposure than the New York index to longer-maturity bonds in the intermediate universe, which held back results.
Investor Demand Drove Solid Returns by Municipals
Heavy investor buying led to strong performance by tax-advantaged municipal securities in New York, where state bonds were rated AA2 by Moody's and AA by Standard & Poor's. Demand was also healthy throughout the national municipal bond market, as investors poured cash into municipal mutual funds. While demand was strong, yield opportunities were limited, as about 50% of new issuance was in refunding deals. Refunding allowed cities, towns and agencies to call back older, higher-yielding debt callable in 24 months or less and refinance with lower-yielding debt. As a consequence, many holders of better-yielding, callable bonds saw their investments called back while reinvestment prospects offered less income. Despite an environment of economic uncertainty, higher yielding, lower quality bonds performed particularly well. Securities rated A and BBB produced approximately twice the total return as the highest-rated AAA debt.
New York's Economy in Line with National Trends
The New York state economy performed generally in line with the national economy, which experienced modest but positive growth over the 12-month period. Private sector employment in New York rose to pre-recession levels, but income growth was somewhat less than the national average. Manufacturing activity was softer than on the national scene, as New York's military contractors were hurt by shifting priorities in national defense spending. State tax revenues lagged early in the period, coming in at approximately $150 million below projections for the first eight months of 2012.
Hospital Bonds a Plus; Short-Maturity Overweight a Minus
Investments in the hospital and transportation sectors made solid gains for the Fund as both groups produced healthy returns. Performance benefited from an overweight in competitively yielding A and BBB rated hospital bonds. Transportation bonds account for approximately 25% of the New York index, but prudence demanded an underweight in the sector, which nevertheless contributed to the Fund's strong gains.
The Fund's maturity positioning detracted from performance. An overweight in securities with maturities of less than two years and an underweight in maturities of 12+ years detracted from relative returns as longer maturities did well during the period. During the period, we modestly increased the Fund's exposure to A rated issues with maturities of 12 years or longer. An overweight in short-maturity pre-refunded bonds also detracted from performance. Pre-refunding occurs when an issuer sells a new bond at a lower rate to pay off old, higher-rate issues. The proceeds from the sale are invested into an escrow account (typically short-term government securities), which generates interest that is used to pay the interest on the original bonds until they are called or they mature.
Portfolio Management
Brian McGreevy
Paul Fuchs, CFA
Paul Fuchs joined Brian McGreevy as a Portfolio Manager of the Fund in
January 2012.
Quality Breakdown (%)
(at October 31, 2012) | |
AAA rating | | | 6.3 | | |
AA rating | | | 52.4 | | |
A rating | | | 31.6 | | |
BBB rating | | | 8.2 | | |
Non-investment grade | | | 1.1 | | |
Not rated | | | 0.4 | | |
Total | | | 100.0 | | |
Percentages indicated are based upon total fixed income securities (excluding Money Market Funds).
Bond ratings apply to the underlying holdings of the Fund and not the Fund itself and are divided into categories ranging from AAA (highest) to D (lowest), and are subject to change. The ratings shown are determined by using the middle rating of Moody's, S&P, and Fitch after dropping the highest and lowest available ratings. When a rating from only two agencies is available, the lower rating is used. When a rating from only one agency is available, that rating is used. When a bond is not rated by any of these agencies, it is designated as Not rated. Credit ratings are subjective opinions and not statements of fact.
Annual Report 2012
4
Columbia New York Intermediate Municipal Bond Fund
Manager Discussion of Fund Performance (continued)
Looking Ahead
We believe that the New York economy has reasonable prospects going forward. The near-term outlook is clouded by uncertainty over how the federal government can avert automatic spending cuts. However, over the longer term, income and output in New York are both expected to exceed national trends, even though employment growth in New York may trail that of the nation. With these expectations, we currently intend to continue to look for opportunities to add to bonds with maturities of 12 years or longer while reducing exposure to securities with maturities of less than two years. We intend to look for investments in securities rated A and BBB where we can obtain incremental yield, relative value and sound fundamentals.
Annual Report 2012
5
Columbia New York Intermediate Municipal Bond Fund
Understanding Your Fund's Expenses
(Unaudited)
As an investor, you incur two types of costs. There are transaction costs, which generally include sales charges on purchases and may include redemption fees. There are also ongoing costs, which generally include management fees, distribution and service (Rule 12b-1) fees, and other fund expenses. The following information is intended to help you understand your ongoing costs (in dollars) of investing in the Fund and to help you compare these costs with the ongoing costs of investing in other mutual funds.
Analyzing Your Fund's Expenses
To illustrate these ongoing costs, we have provided examples and calculated the expenses paid by investors in each share class of the Fund during the period. The actual and hypothetical information in the table is based on an initial investment of $1,000 at the beginning of the period indicated and held for the entire period. Expense information is calculated two ways and each method provides you with different information. The amount listed in the "Actual" column is calculated using the Fund's actual operating expenses and total return for the period. You may use the Actual information, together with the amount invested, to estimate the expenses that you paid over the period. Simply divide your account value by $1,000 (for example, an $8,600 account value divided by $1,000 = 8.6), then multiply the results by the expenses paid during the period under the Actual column. The amount listed in the "Hypothetical" column assumes a 5% annual rate of return before expenses (which is not the Fund's actual return) and then applies the Fund's actual expense ratio for the period to the hypothetical return. You should not use the hypothetical account values and expenses to estimate either your actual account balance at the end of the period or the expenses you paid during the period. See "Compare With Other Funds" below for details on how to use the hypothetical data.
Compare With Other Funds
Since all mutual funds are required to include the same hypothetical calculations about expenses in shareholder reports, you can use this information to compare the ongoing cost of investing in the Fund with other funds. To do so, compare the hypothetical example with the 5% hypothetical examples that appear in the shareholder reports of other funds. As you compare hypothetical examples of other funds, it is important to note that hypothetical examples are meant to highlight the ongoing costs of investing in a fund only and do not reflect any transaction costs, such as sales charges, or redemption or exchange fees. Therefore, the hypothetical calculations are useful in comparing ongoing costs only, and will not help you determine the relative total costs of owning different funds. If transaction costs were included in these calculations, your costs would be higher.
May 1, 2012 – October 31, 2012
| | Account Value at the Beginning
of the Period ($) | | Account Value at the End of the
Period ($) | | Expenses Paid During the
Period ($) | | Fund's Annualized
Expense Ratio (%) | |
| | Actual | | Hypothetical | | Actual | | Hypothetical | | Actual | | Hypothetical | | Actual | |
Class A | | | 1,000.00 | | | | 1,000.00 | | | | 1,024.40 | | | | 1,021.32 | | | | 3.87 | | | | 3.86 | | | | 0.76 | | |
Class B | | | 1,000.00 | | | | 1,000.00 | | | | 1,021.20 | | | | 1,017.60 | | | | 7.62 | | | | 7.61 | | | | 1.50 | | |
Class C | | | 1,000.00 | | | | 1,000.00 | | | | 1,022.30 | | | | 1,019.36 | | | | 5.85 | | | | 5.84 | | | | 1.15 | | |
Class T | | | 1,000.00 | | | | 1,000.00 | | | | 1,025.00 | | | | 1,021.87 | | | | 3.31 | | | | 3.30 | | | | 0.65 | | |
Class Z | | | 1,000.00 | | | | 1,000.00 | | | | 1,025.80 | | | | 1,022.62 | | | | 2.55 | | | | 2.54 | | | | 0.50 | | |
Expenses paid during the period are equal to the annualized expense ratio for each class as indicated above, multiplied by the average account value over the period and then multiplied by the number of days in the Fund's most recent fiscal half year and divided by 366.
Expenses do not include fees and expenses incurred indirectly by the Fund from the underlying funds in which the Fund may invest (also referred to as "acquired funds"), including affiliated and non-affiliated pooled investment vehicles (including mutual funds and exchange-traded funds).
Had Columbia Management Investment Advisers, LLC and/or certain of its affiliates not waived/reimbursed certain fees and expenses, account value at the end of the period would have been reduced.
Annual Report 2012
6
Columbia New York Intermediate Municipal Bond Fund
Portfolio of Investments
October 31, 2012
(Percentages represent value of investments compared to net assets)
Municipal Bonds 95.9%
Issue
Description | | Coupon
Rate | | Principal
Amount ($) | | Value ($) | |
Disposal 1.8% | |
Babylon Industrial Development Agency
Revenue Bonds
Covanta Babylon, Inc.
Series 2009A
01/01/18 | | | 5.000 | % | | | 3,500,000 | | | | 4,046,385 | | |
Oneida-Herkimer Solid Waste Management Authority
Revenue Bonds
Series 2011
04/01/19 | | | 5.000 | % | | | 830,000 | | | | 975,839 | | |
04/01/20 | | | 5.000 | % | | | 870,000 | | | | 1,025,582 | | |
Total | | | | | | | 6,047,806 | | |
Higher Education 8.7% | |
Dutchess County Local Development Corp.
Refunding Revenue Bonds
Marist College Project
Series 2012A
07/01/20 | | | 5.000 | % | | | 1,055,000 | | | | 1,268,110 | | |
Geneva Development Corp.
Refunding Revenue Bonds
Hobart & William Smith College
Series 2012
09/01/24 | | | 5.000 | % | | | 600,000 | | | | 717,504 | | |
09/01/25 | | | 5.000 | % | | | 300,000 | | | | 356,379 | | |
New York State Dormitory Authority
Revenue Bonds
Barnard College
Series 2007A (NPFGC/FGIC)
07/01/18 | | | 5.000 | % | | | 1,745,000 | | | | 2,033,833 | | |
Cornell University
Series 2006A
07/01/21 | | | 5.000 | % | | | 2,350,000 | | | | 2,691,408 | | |
Series 2009A
07/01/25 | | | 5.000 | % | | | 1,000,000 | | | | 1,180,530 | | |
Culinary Institute of America
Series 2012
07/01/28 | | | 5.000 | % | | | 500,000 | | | | 564,100 | | |
Mount Sinai School of Medicine
Series 2009
07/01/27 | | | 5.500 | % | | | 4,000,000 | | | | 4,581,800 | | |
Series 2010A
07/01/21 | | | 5.000 | % | | | 1,000,000 | | | | 1,181,080 | | |
New York University
Series 1998A (NPFGC)
07/01/17 | | | 6.000 | % | | | 2,475,000 | | | | 3,042,938 | | |
07/01/20 | | | 5.750 | % | | | 2,000,000 | | | | 2,572,420 | | |
Series 2001-1 (AMBAC)
07/01/15 | | | 5.500 | % | | | 1,205,000 | | | | 1,359,927 | | |
Rochester Institute of Technology
Series 2010
07/01/21 | | | 5.000 | % | | | 1,000,000 | | | | 1,205,160 | | |
St. John's University
Series 2012A
07/01/27 | | | 5.000 | % | | | 470,000 | | | | 556,583 | | |
Municipal Bonds (continued)
Issue
Description | | Coupon
Rate | | Principal
Amount ($) | | Value ($) | |
Teachers College
Series 2009
03/01/24 | | | 5.000 | % | | | 1,000,000 | | | | 1,146,410 | | |
Oneida County Industrial Development Agency(a)
Revenue Bonds
Hamilton College Project
Series 2007A (NPFGC)
07/01/18 | | | 0.000 | % | | | 1,000,000 | | | | 905,810 | | |
07/01/20 | | | 0.000 | % | | | 1,000,000 | | | | 805,480 | | |
St. Lawrence County Industrial Development Agency
Revenue Bonds
St. Lawrence University
Series 2009A
10/01/16 | | | 5.000 | % | | | 3,000,000 | | | | 3,423,420 | | |
Total | | | | | | | 29,592,892 | | |
Hospital 9.0% | |
Albany Industrial Development Agency
Revenue Bonds
St. Peters Hospital Project
Series 2008A
11/15/22 | | | 5.750 | % | | | 500,000 | | | | 575,815 | | |
11/15/27 | | | 5.250 | % | | | 1,000,000 | | | | 1,118,930 | | |
Series 2008E
11/15/22 | | | 5.250 | % | | | 500,000 | | | | 562,040 | | |
Monroe County Industrial Development Agency
Refunding Revenue Bonds
Highland Hospital of Rochester
Series 2005
08/01/22 | | | 5.000 | % | | | 700,000 | | | | 735,637 | | |
Nassau County Local Economic Assistance Corp.
Refunding Revenue Bonds
Catholic Health Services
Series 2011
07/01/19 | | | 5.000 | % | | | 1,840,000 | | | | 2,114,123 | | |
07/01/20 | | | 5.000 | % | | | 2,815,000 | | | | 3,222,837 | | |
New York State Dormitory Authority
Revenue Bonds
Long Island Jewish Obligated Group
Series 2006A
11/01/19 | | | 5.000 | % | | | 1,000,000 | | | | 1,118,450 | | |
Memorial Sloan-Kettering Cancer Center
Series 2012
07/01/27 | | | 5.000 | % | | | 500,000 | | | | 600,460 | | |
Series 2012-1
07/01/21 | | | 4.000 | % | | | 1,250,000 | | | | 1,446,963 | | |
Mount Sinai Hospital
Series 2010A
07/01/26 | | | 5.000 | % | | | 1,725,000 | | | | 1,952,079 | | |
Series 2011A
07/01/31 | | | 5.000 | % | | | 2,000,000 | | | | 2,219,360 | | |
New York Methodist Hospital
Series 2004
07/01/24 | | | 5.250 | % | | | 1,000,000 | | | | 1,028,700 | | |
The accompanying Notes to Financial Statements are an integral part of this statement.
Annual Report 2012
7
Columbia New York Intermediate Municipal Bond Fund
Portfolio of Investments (continued)
October 31, 2012
Municipal Bonds (continued)
Issue
Description | | Coupon
Rate | | Principal
Amount ($) | | Value ($) | |
New York University Hospital Center
Series 2006A
07/01/20 | | | 5.000 | % | | | 3,000,000 | | | | 3,349,950 | | |
Series 2011A
07/01/23 | | | 5.125 | % | | | 1,000,000 | | | | 1,142,700 | | |
North Shore-Long Island Jewish Health
Series 2009A
05/01/30 | | | 5.250 | % | | | 4,000,000 | | | | 4,492,760 | | |
Orange Regional Medical Center
Series 2008
12/01/29 | | | 6.125 | % | | | 1,350,000 | | | | 1,505,803 | | |
Presbyterian Hospital
Series 2007 (AGM)
08/15/23 | | | 5.250 | % | | | 250,000 | | | | 268,170 | | |
United Health Services Hospitals
Series 2009 (FHA)
08/01/18 | | | 4.500 | % | | | 1,000,000 | | | | 1,102,980 | | |
White Plains Hospital
Series 2004 (FHA)
02/15/18 | | | 4.625 | % | | | 290,000 | | | | 304,378 | | |
Saratoga County Industrial Development Agency
Revenue Bonds
Saratoga Hospital Project
Series 2004A
12/01/13 | | | 5.000 | % | | | 485,000 | | | | 502,960 | | |
Series 2007B
12/01/22 | | | 5.000 | % | | | 500,000 | | | | 537,505 | | |
12/01/27 | | | 5.125 | % | | | 500,000 | | | | 529,180 | | |
Total | | | | | | | 30,431,780 | | |
Investor Owned 0.9% | |
New York State Energy Research & Development Authority
Revenue Bonds
Rochester Gas & Electric Corp.
Series 2004A (NPFGC)(b)
05/15/32 | | | 4.750 | % | | | 2,650,000 | | | | 2,902,412 | | |
Local Appropriation 0.8% | |
New York State Dormitory Authority
Revenue Bonds
Municipal Health Facilities
Subordinated Series 2001-2
01/15/21 | | | 5.000 | % | | | 2,500,000 | | | | 2,868,250 | | |
Local General Obligation 13.1% | |
Bethlehem Central School District
Unlimited General Obligation Refunding Bonds
Series 2012A
01/15/20 | | | 4.000 | % | | | 2,490,000 | | | | 2,840,044 | | |
City of New York
Unlimited General Obligation Bonds
Series 2004G
12/01/19 | | | 5.000 | % | | | 2,430,000 | | | | 2,658,250 | | |
Series 2005G
08/01/16 | | | 5.250 | % | | | 500,000 | | | | 583,765 | | |
Municipal Bonds (continued)
Issue
Description | | Coupon
Rate | | Principal
Amount ($) | | Value ($) | |
Series 2007C
01/01/15 | | | 5.000 | % | | | 4,000,000 | | | | 4,384,640 | | |
Series 2007D-1
12/01/21 | | | 5.000 | % | | | 2,000,000 | | | | 2,384,580 | | |
Subordinated Series 2008I-1
02/01/23 | | | 5.000 | % | | | 2,000,000 | | | | 2,376,340 | | |
Unlimited General Obligation Refunding Bonds
Series 2007D
02/01/24 | | | 5.000 | % | | | 2,000,000 | | | | 2,325,020 | | |
City of Yonkers
Unlimited General Obligation Bonds
Series 2005B (NPFGC)
08/01/21 | | | 5.000 | % | | | 2,425,000 | | | | 2,577,242 | | |
08/01/22 | | | 5.000 | % | | | 2,545,000 | | | | 2,689,149 | | |
County of Albany
Unlimited General Obligation Bonds
Series 2006 (XLCA)
09/15/20 | | | 4.125 | % | | | 1,000,000 | | | | 1,094,350 | | |
County of Erie
Limited General Obligation Bonds
Public Improvement
Series 2012A
04/01/24 | | | 5.000 | % | | | 640,000 | | | | 761,075 | | |
04/01/25 | | | 5.000 | % | | | 500,000 | | | | 590,150 | | |
County of Monroe
Unlimited General Obligation Bonds
Series 2009A (AGM)
06/01/14 | | | 5.000 | % | | | 3,000,000 | | | | 3,206,940 | | |
Unlimited General Obligation Refunding & Public Improvement Bonds
Series 1996 (NPFGC)
03/01/16 | | | 6.000 | % | | | 1,210,000 | | | | 1,368,849 | | |
County of Nassau
Unlimited General Obligation Improvement Bonds
Series 2010A
04/01/18 | | | 4.000 | % | | | 1,340,000 | | | | 1,514,414 | | |
County of Suffolk
Unlimited General Obligation Refunding Bonds
Series 2012A | |
04/01/20 | | | 5.000 | % | | | 1,680,000 | | | | 1,967,179 | | |
Mount Vernon City School District
Unlimited General Obligation Refunding Bonds
Series 2012
08/15/18 | | | 5.000 | % | | | 2,570,000 | | | | 3,024,068 | | |
New York State Dormitory Authority
Revenue Bonds
School Districts Financing Program
Series 2012H
10/01/21 | | | 5.000 | % | | | 750,000 | | | | 916,965 | | |
Newark Central School District
Unlimited General Obligation Refunding Bonds
Series 2012
06/15/18 | | | 5.000 | % | | | 2,100,000 | | | | 2,476,341 | | |
The accompanying Notes to Financial Statements are an integral part of this statement.
Annual Report 2012
8
Columbia New York Intermediate Municipal Bond Fund
Portfolio of Investments (continued)
October 31, 2012
Municipal Bonds (continued)
Issue
Description | | Coupon
Rate | | Principal
Amount ($) | | Value ($) | |
Ravena Coeymans Selkirk Central School District
Limited General Obligation Refunding Bonds
Series 2012
06/15/17 | | | 4.000 | % | | | 1,370,000 | | | | 1,530,482 | | |
Sachem Central School District
Unlimited General Obligation Refunding Bonds
Series 2006 (NPFGC/FGIC)
10/15/24 | | | 4.250 | % | | | 1,000,000 | | | | 1,067,170 | | |
Sullivan West Central School District
Unlimited General Obligation Refunding Bonds
Series 2012
04/15/23 | | | 5.000 | % | | | 565,000 | | | | 694,831 | | |
Three Village Central School District
Unlimited General Obligation Refunding Bonds
Series 2005 (NPFGC/FGIC)
06/01/18 | | | 5.000 | % | | | 1,000,000 | | | | 1,209,180 | | |
Total | | | | | | | 44,241,024 | | |
Multi-Family 0.6% | |
New York State Dormitory Authority
Revenue Bonds
Residential Institution for Children
Series 2008-A1
06/01/33 | | | 5.000 | % | | | 1,700,000 | | | | 1,875,389 | | |
Municipal Power 2.2% | |
Long Island Power Authority
Revenue Bonds
General
Series 2011A
05/01/21 | | | 5.000 | % | | | 1,000,000 | | | | 1,227,630 | | |
Series 2009A
04/01/21 | | | 5.250 | % | | | 1,000,000 | | | | 1,219,370 | | |
04/01/22 | | | 5.500 | % | | | 3,000,000 | | | | 3,660,660 | | |
Series 2012B
09/01/26 | | | 5.000 | % | | | 1,000,000 | | | | 1,193,620 | | |
Total | | | | | | | 7,301,280 | | |
Nursing Home 1.2% | |
Amherst Industrial Development Agency
Revenue Bonds
Beechwood Health Care Center, Inc.
Series 2007
01/01/13 | | | 4.875 | % | | | 10,000 | | | | 10,026 | | |
Rensselaer Municipal Leasing Corp.
Revenue Bonds
Rensselaer County Nursing Home
Series 2009A
06/01/19 | | | 5.000 | % | | | 4,000,000 | | | | 4,177,440 | | |
Total | | | | | | | 4,187,466 | | |
Municipal Bonds (continued)
Issue
Description | | Coupon
Rate | | Principal
Amount ($) | | Value ($) | |
Other Bond Issue 1.8% | |
New York City Industrial Development Agency
Revenue Bonds
United Jewish Appeal Federal Project
Series 2004A
07/01/27 | | | 5.000 | % | | | 625,000 | | | | 667,825 | | |
New York Liberty Development Corp.
Refunding Revenue Bonds
4 World Trade Center Project
Series 2011
11/15/31 | | | 5.000 | % | | | 2,350,000 | | | | 2,741,933 | | |
Puerto Rico Housing Finance Authority
Subordinated Revenue Bonds
Capital Fund Modernization
Series 2008(c)
12/01/13 | | | 5.000 | % | | | 2,000,000 | | | | 2,083,940 | | |
Westchester County Industrial Development Agency
Revenue Bonds
Guiding Eyes for the Blind
Series 2004
08/01/24 | | | 5.375 | % | | | 500,000 | | | | 524,725 | | |
Total | | | | | | | 6,018,423 | | |
Pool/Bond Bank 7.0% | |
New York Municipal Bond Bank Agency
Revenue Bonds
Subordinated Series 2009C-1
02/15/18 | | | 5.000 | % | | | 3,000,000 | | | | 3,544,470 | | |
New York State Dormitory Authority
Revenue Bonds
School Districts Financing Program
Series 2008A (AGM)
10/01/23 | | | 5.000 | % | | | 3,000,000 | | | | 3,450,990 | | |
Series 2009C
10/01/21 | | | 5.000 | % | | | 5,000,000 | | | | 5,895,400 | | |
Series 2009C (AGM)
10/01/22 | | | 5.000 | % | | | 3,000,000 | | | | 3,501,600 | | |
Series 2012B
10/01/26 | | | 5.000 | % | | | 3,000,000 | | | | 3,604,680 | | |
New York State Environmental Facilities Corp.
Revenue Bonds
Revolving Funds-Municipal Water
Series 2008B | |
06/15/21 | | | 5.000 | % | | | 3,000,000 | | | | 3,602,730 | | |
Total | | | | | | | 23,599,870 | | |
Ports 1.6% | |
Port Authority of New York & New Jersey
Revenue Bonds
Consolidated 135th
Series 2004 (XLCA)
09/15/28 | | | 5.000 | % | | | 1,500,000 | | | | 1,591,440 | | |
The accompanying Notes to Financial Statements are an integral part of this statement.
Annual Report 2012
9
Columbia New York Intermediate Municipal Bond Fund
Portfolio of Investments (continued)
October 31, 2012
Municipal Bonds (continued)
Issue
Description | | Coupon
Rate | | Principal
Amount ($) | | Value ($) | |
Consolidated 161st
Series 2009
10/15/31 | | | 5.000 | % | | | 3,390,000 | | | | 3,946,774 | | |
Total | | | | | | | 5,538,214 | | |
Recreation 2.8% | |
Build NYC Resource Corp.
Revenue Bonds
YMCA of Greater NY Project
Series 2012
08/01/32 | | | 5.000 | % | | | 500,000 | | | | 567,670 | | |
New York City Industrial Development Agency
Revenue Bonds
Pilot-Queens Baseball Stadium
Series 2006 (AMBAC)
01/01/19 | | | 5.000 | % | | | 850,000 | | | | 906,806 | | |
Pilot-Yankee Stadium
Series 2006 (NPFGC)
03/01/15 | | | 5.000 | % | | | 1,150,000 | | | | 1,243,736 | | |
YMCA of Greater New York Project
Series 2006
08/01/26 | | | 5.000 | % | | | 1,000,000 | | | | 1,063,600 | | |
New York City Trust for Cultural Resources
Refunding Revenue Bonds
Museum of Modern Art
Series 2008-1A
04/01/26 | | | 5.000 | % | | | 4,850,000 | | | | 5,738,229 | | |
Total | | | | | | | 9,520,041 | | |
Refunded/Escrowed 10.0% | |
City of New York
Prerefunded 06/01/13 Unlimited General Obligation Bonds
Series 2003J
06/01/16 | | | 5.500 | % | | | 1,250,000 | | | | 1,288,375 | | |
Elizabeth Forward School District
Unlimited General Obligation Bonds
Capital Appreciation
Series 1994B Escrowed to Maturity (NPFGC)(a)
09/01/20 | | | 0.000 | % | | | 2,210,000 | | | | 1,916,556 | | |
Long Island Power Authority
Revenue Bonds
General
Series 1998A Escrowed to Maturity (AGM)
12/01/13 | | | 5.500 | % | | | 2,000,000 | | | | 2,113,980 | | |
12/01/14 | | | 5.250 | % | | | 5,000,000 | | | | 5,500,000 | | |
Metropolitan Transportation Authority
Prerefunded 07/01/13 Revenue Bonds
Service Contract
Series 1997-8 (AGM)
07/01/21 | | | 5.375 | % | | | 3,000,000 | | | | 3,101,100 | | |
Prerefunded 10/01/15 Revenue Bonds
Series 1998A (FGIC)
04/01/23 | | | 5.000 | % | | | 2,000,000 | | | | 2,264,320 | | |
Municipal Bonds (continued)
Issue
Description | | Coupon
Rate | | Principal
Amount ($) | | Value ($) | |
New York City Transitional Finance Authority
Prerefunded 08/01/13 Revenue Bonds
Future Tax Secured
Series 2003
08/01/17 | | | 5.250 | % | | | 2,000,000 | | | | 2,075,280 | | |
New York Municipal Bond Bank Agency
Prerefunded 06/01/13 Revenue Bonds
Series 2003C
12/01/21 | | | 5.250 | % | | | 3,330,000 | | | | 3,427,569 | | |
New York State Dormitory Authority
Revenue Bonds
Capital Appreciation-Memorial Sloan-Kettering Cancer Center
Series 2003-1 Escrowed to Maturity (NPFGC)(a)
07/01/25 | | | 0.000 | % | | | 3,750,000 | | | | 2,780,700 | | |
New York State Thruway Authority
Prerefunded 04/01/13 Revenue Bonds
Series 2003A (NPFGC)
04/01/17 | | | 5.250 | % | | | 1,750,000 | | | | 1,786,855 | | |
Puerto Rico Highway & Transportation Authority
Prerefunded Revenue Bonds
Series 2005BB (AGM) Escrowed to Maturity(c)
07/01/22 | | | 5.250 | % | | | 355,000 | | | | 459,569 | | |
Triborough Bridge & Tunnel Authority
Prerefunded 01/01/22 Revenue Bonds
General Purpose
Series 1999B
01/01/30 | | | 5.500 | % | | | 2,000,000 | | | | 2,634,580 | | |
Revenue Bonds
General Purpose
Series 1992Y Escrowed to Maturity
01/01/17 | | | 5.500 | % | | | 2,000,000 | | | | 2,188,500 | | |
Series 2006A
11/15/19 | | | 5.000 | % | | | 2,000,000 | | | | 2,361,400 | | |
Total | | | | | | | 33,898,784 | | |
Retirement Communities 0.6% | |
New York State Dormitory Authority
Revenue Bonds
Miriam Osborn Memorial Home Association
Series 2012
07/01/26 | | | 5.000 | % | | | 740,000 | | | | 815,628 | | |
07/01/27 | | | 5.000 | % | | | 700,000 | | | | 766,493 | | |
Suffolk County Industrial Development Agency
Refunding Revenue Bonds
Jeffersons Ferry Project
Series 2006
11/01/28 | | | 5.000 | % | | | 335,000 | | | | 343,740 | | |
Total | | | | | | | 1,925,861 | | |
The accompanying Notes to Financial Statements are an integral part of this statement.
Annual Report 2012
10
Columbia New York Intermediate Municipal Bond Fund
Portfolio of Investments (continued)
October 31, 2012
Municipal Bonds (continued)
Issue
Description | | Coupon
Rate | | Principal
Amount ($) | | Value ($) | |
Special Non Property Tax 14.7% | |
Metropolitan Transportation Authority
Revenue Bonds
Series 2004A (NPFGC/FGIC)
11/15/18 | | | 5.250 | % | | | 800,000 | | | | 993,200 | | |
Nassau County Interim Finance Authority
Prerefunded 11/15/14 Revenue Bonds
Sales Tax Secured
Series 2004H (AMBAC)
11/15/15 | | | 5.250 | % | | | 5,000,000 | | | | 5,498,400 | | |
New York City Transitional Finance Authority Building Aid
Revenue Bonds
Series 2007S-2 (NPFGC/FGIC)
01/15/21 | | | 5.000 | % | | | 4,300,000 | | | | 4,980,862 | | |
Series 2012S-1
07/15/29 | | | 5.000 | % | | | 3,000,000 | | | | 3,613,980 | | |
New York City Transitional Finance Authority
Refunding Revenue Bonds
Future Tax Secured
Senior Series 2005A-1
11/01/19 | | | 5.000 | % | | | 3,000,000 | | | | 3,331,290 | | |
Revenue Bonds
Future Tax Secured
Series 2009A
05/01/27 | | | 5.000 | % | | | 5,000,000 | | | | 5,977,350 | | |
New York Local Government Assistance Corp.
Refunding Revenue Bonds
Series 1993E
04/01/14 | | | 6.000 | % | | | 2,335,000 | | | | 2,460,086 | | |
New York State Dormitory Authority
Refunding Revenue Bonds
Education
Series 2005B (AMBAC)
03/15/26 | | | 5.500 | % | | | 1,000,000 | | | | 1,345,140 | | |
General Purpose
Series 2012A
12/15/25 | | | 5.000 | % | | | 2,500,000 | | | | 3,099,300 | | |
New York State Environmental Facilities Corp.
Revenue Bonds
Series 2004A (NPFGC/FGIC)
12/15/21 | | | 5.000 | % | | | 2,685,000 | | | | 2,938,706 | | |
New York State Housing Finance Agency
Revenue Bonds
Series 2008A
09/15/19 | | | 5.000 | % | | | 1,400,000 | | | | 1,676,584 | | |
New York State Thruway Authority
Revenue Bonds
2nd General Series 2005B (AMBAC)
04/01/19 | | | 5.000 | % | | | 2,500,000 | | | | 2,830,975 | | |
Series 2005A (NPFGC)
04/01/22 | | | 5.000 | % | | | 500,000 | | | | 552,415 | | |
Series 2008A
04/01/21 | | | 5.000 | % | | | 1,000,000 | | | | 1,192,620 | | |
Municipal Bonds (continued)
Issue
Description | | Coupon
Rate | | Principal
Amount ($) | | Value ($) | |
Transportation
Series 2007A
03/15/22 | | | 5.000 | % | | | 1,000,000 | | | | 1,188,090 | | |
Puerto Rico Highway & Transportation Authority
Refunding Revenue Bonds
Series 2005BB (AGM)(c)
07/01/22 | | | 5.250 | % | | | 645,000 | | | | 746,626 | | |
Sales Tax Asset Receivables Corp.
Revenue Bonds
Series 2004A (NPFGC)
10/15/22 | | | 5.000 | % | | | 4,000,000 | | | | 4,346,120 | | |
Virgin Islands Public Finance Authority
Revenue Bonds
Senior Lien-Matching Fund Loan Note
Series 2010A(c) | |
10/01/25 | | | 5.000 | % | | | 2,755,000 | | | | 3,074,304 | | |
Total | | | | | | | 49,846,048 | | |
State Appropriated 6.8% | |
Erie County Industrial Development Agency (The)
Revenue Bonds
School District of Buffalo Project
Series 2008A (AGM)
05/01/18 | | | 5.000 | % | | | 1,000,000 | | | | 1,196,980 | | |
Series 2011A
05/01/30 | | | 5.250 | % | | | 1,440,000 | | | | 1,692,130 | | |
New York State Dormitory Authority
Refunding Revenue Bonds
Consolidated Service Contract
Series 2009A
07/01/24 | | | 5.000 | % | | | 3,000,000 | | | | 3,510,030 | | |
Revenue Bonds
Schools Program
Series 2000
07/01/20 | | | 6.250 | % | | | 1,545,000 | | | | 1,552,431 | | |
Series 2009
02/15/18 | | | 5.500 | % | | | 1,000,000 | | | | 1,225,750 | | |
State University Educational Facilities
3rd General Series 2005A (NPFGC/FGIC)
05/15/21 | | | 5.500 | % | | | 1,000,000 | | | | 1,278,750 | | |
Series 1993A
05/15/15 | | | 5.250 | % | | | 2,000,000 | | | | 2,168,480 | | |
05/15/19 | | | 5.500 | % | | | 2,500,000 | | | | 2,986,250 | | |
Series 2000C (AGM)
05/15/17 | | | 5.750 | % | | | 1,250,000 | | | | 1,517,138 | | |
New York State Urban Development Corp.
Refunding Revenue Bonds
Service Contract
Series 2008B
01/01/26 | | | 5.000 | % | | | 3,125,000 | | | | 3,586,906 | | |
Series 2008C
01/01/22 | | | 5.000 | % | | | 2,000,000 | | | | 2,302,520 | | |
Total | | | | | | | 23,017,365 | | |
The accompanying Notes to Financial Statements are an integral part of this statement.
Annual Report 2012
11
Columbia New York Intermediate Municipal Bond Fund
Portfolio of Investments (continued)
October 31, 2012
Municipal Bonds (continued)
Issue
Description | | Coupon
Rate | | Principal
Amount ($) | | Value ($) | |
State General Obligation 0.8% | |
Puerto Rico Public Buildings Authority
Refunding Revenue Bonds
Government Facilities
Series 2007M(c)
07/01/23 | | | 6.250 | % | | | 2,250,000 | | | | 2,628,405 | | |
Tobacco 0.3% | |
Suffolk Tobacco Asset Securitization Corp.
Revenue Bonds
Turbo
Series 2008B
06/01/28 | | | 5.375 | % | | | 1,145,000 | | | | 1,027,660 | | |
Transportation 4.8% | |
Metropolitan Transportation Authority
Revenue Bonds
Series 2005B (AMBAC)
11/15/24 | | | 5.250 | % | | | 750,000 | | | | 946,770 | | |
Series 2006 (CIFG/TCRS)
11/15/22 | | | 5.000 | % | | | 2,280,000 | | | | 2,600,568 | | |
Series 2006B
11/15/16 | | | 5.000 | % | | | 1,500,000 | | | | 1,737,495 | | |
Series 2007B
11/15/22 | | | 5.000 | % | | | 1,500,000 | | | | 1,740,720 | | |
Series 2008C
11/15/23 | | | 6.250 | % | | | 3,570,000 | | | | 4,542,254 | | |
Series 2010D
11/15/28 | | | 5.250 | % | | | 3,000,000 | | | | 3,499,920 | | |
Metropolitan Transportation Authority(b)
Revenue Bonds
Mandatory Tender
Series 2008B
11/15/30 | | | 5.000 | % | | | 1,000,000 | | | | 1,082,490 | | |
Total | | | | | | | 16,150,217 | | |
Turnpike/Bridge/Toll Road 5.1% | |
New York State Thruway Authority
Revenue Bonds
General Revenue
Series 2012I
01/01/23 | | | 5.000 | % | | | 3,000,000 | | | | 3,663,150 | | |
Niagara Falls Bridge Commission
Revenue Bonds
Bridge System
Series 1993A (AGM)
10/01/19 | | | 4.000 | % | | | 2,000,000 | | | | 2,209,880 | | |
Triborough Bridge & Tunnel Authority
Refunding Revenue Bonds
General Purpose
Series 2002B
11/15/13 | | | 5.250 | % | | | 2,015,000 | | | | 2,120,546 | | |
Series 2011A
01/01/25 | | | 5.000 | % | | | 3,000,000 | | | | 3,668,700 | | |
Municipal Bonds (continued)
Issue
Description | | Coupon
Rate | | Principal
Amount ($) | | Value ($) | |
Series 2012-B
11/15/20 | | | 5.000 | % | | | 2,500,000 | | | | 3,144,975 | | |
Revenue Bonds
General Purpose
Series 2008
11/15/21 | | | 5.000 | % | | | 2,000,000 | | | | 2,391,600 | | |
Total | | | | | | | 17,198,851 | | |
Water & Sewer 1.3% | |
Onondaga County Water Authority
Revenue Bonds
General
Series 2005A (AMBAC)
09/15/22 | | | 5.000 | % | | | 895,000 | | | | 1,000,019 | | |
09/15/23 | | | 5.000 | % | | | 940,000 | | | | 1,037,581 | | |
Rensselaer County Water Service & Sewer Authority
Revenue Bonds
Sewer Service
Series 2008
09/01/28 | | | 5.100 | % | | | 1,155,000 | | | | 1,289,766 | | |
Water Service
Series 2008
09/01/28 | | | 5.100 | % | | | 1,060,000 | | | | 1,168,131 | | |
Total | | | | | | | 4,495,497 | | |
Total Municipal Bonds
(Cost: $295,328,794) | | | | | | | 324,313,535 | | |
Money Market Funds 3.1%
| | | Shares | | Value ($) | |
Dreyfus New York AMT-Free Municipal
Money Market Fund, 0.000%(d) | | | 5,008,838 | | | | 5,008,838 | | |
JPMorgan Tax Free Money
Market Fund, 0.000%(d) | | | 5,367,868 | | | | 5,367,868 | | |
Total Money Market Funds
(Cost: $10,376,706) | | | | | 10,376,706 | | |
Total Investments
(Cost: $305,705,500) | | | | | 334,690,241 | | |
Other Assets & Liabilities, Net | | | | | 3,544,828 | | |
Net Assets | | | | | 338,235,069 | | |
The accompanying Notes to Financial Statements are an integral part of this statement.
Annual Report 2012
12
Columbia New York Intermediate Municipal Bond Fund
Portfolio of Investments (continued)
October 31, 2012
Notes to Portfolio of Investments
(a) Zero coupon bond.
(b) Variable rate security. The interest rate shown reflects the rate as of October 31, 2012.
(c) Municipal obligations include debt obligations issued by or on behalf of territories, possessions, or sovereign nations within the territorial boundaries of the United States. At October 31, 2012, the value of these securities amounted to $8,992,844 or 2.66% of net assets.
(d) The rate shown is the seven-day current annualized yield at October 31, 2012.
Abbreviation Legend
AGM Assured Guaranty Municipal Corporation
AMBAC Ambac Assurance Corporation
AMT Alternative Minimum Tax
CIFG IXIS Financial Guaranty
FGIC Financial Guaranty Insurance Company
FHA Federal Housing Authority
NPFGC National Public Finance Guarantee Corporation
TCRS Transferable Custodial Receipts
XLCA XL Capital Assurance
Fair Value Measurements
Generally accepted accounting principles (GAAP) require disclosure regarding the inputs and valuation techniques used to measure fair value and any changes in valuation inputs or techniques. In addition, investments shall be disclosed by major category.
The Fund categorizes its fair value measurements according to a three-level hierarchy that maximizes the use of observable inputs and minimizes the use of unobservable inputs by prioritizing that the most observable input be used when available. Observable inputs are those that market participants would use in pricing an investment based on market data obtained from sources independent of the reporting entity. Unobservable inputs are those that reflect the Fund's assumptions about the information market participants would use in pricing an investment. An investment's level within the fair value hierarchy is based on the lowest level of any input that is deemed significant to the asset or liability's fair value measurement. The input levels are not necessarily an indication of the risk or liquidity associated with investments at that level. For example, certain U.S. government securities are generally high quality and liquid, however, they are reflected as Level 2 because the inputs used to determine fair value may not always be quoted prices in an active market.
Fair value inputs are summarized in the three broad levels listed below:
> Level 1 — Valuations based on quoted prices for investments in active markets that the Fund has the ability to access at the measurement date (including NAV for open-end mutual funds). Valuation adjustments are not applied to Level 1 investments.
> Level 2 — Valuations based on other significant observable inputs (including quoted prices for similar securities, interest rates, prepayment speeds, credit risks, etc.).
> Level 3 — Valuations based on significant unobservable inputs (including the Fund's own assumptions and judgment in determining the fair value of investments).
Inputs that are used in determining fair value of an investment may include price information, credit data, volatility statistics, and other factors. These inputs can be either observable or unobservable. The availability of observable inputs can vary between investments, and is affected by various factors such as the type of investment, and the volume and level of activity for that investment or similar investments in the marketplace. The inputs will be considered by the Investment Manager, along with any other relevant factors in the calculation of an investment's fair value. The Fund uses prices and inputs that are current as of the measurement date, which may include periods of market dislocations. During these periods, the availability of prices and inputs may be reduced for many investments. This condition could cause an investment to be reclassified between the various levels within the hierarchy.
Investments falling into the Level 3 category are primarily supported by quoted prices from brokers and dealers participating in the market for those investments. However, these may be classified as Level 3 investments due to lack of market transparency and corroboration to support these quoted prices. Additionally, valuation models may be used as the pricing source for any remaining investments classified as Level 3. These models rely on one or more significant unobservable inputs and/or significant assumptions by the Investment Manager. Inputs used in valuations may include, but are not limited to, financial statement analysis, capital account balances, discount rates and estimated cash flows, and comparable company data.
The accompanying Notes to Financial Statements are an integral part of this statement.
Annual Report 2012
13
Columbia New York Intermediate Municipal Bond Fund
Portfolio of Investments (continued)
October 31, 2012
Fair Value Measurements (continued)
Under the direction of the Fund's Board of Trustees (the Board), the Investment Manager's Valuation Committee (the Committee) is responsible for carrying out the valuation procedures approved by the Board. The Committee consists of voting and non-voting members from various groups within the Investment Manager's organization, including operations and accounting, trading and investments, compliance, risk management and legal.
The Committee meets at least monthly to review and approve valuation matters, which may include a description of specific valuation determinations, data regarding pricing information received from approved pricing vendors and brokers and the results of Board-approved valuation control policies and procedures (the Policies). The Policies address, among other things, instances when market quotations are readily available, including recommendations of third party pricing vendors and a determination of appropriate pricing methodologies; events that require specific valuation determinations and assessment of fair value techniques; securities with a potential for stale pricing, including those that are illiquid, restricted, or in default; and the effectiveness of third- party pricing vendors, including periodic reviews of vendors. The Committee meets more frequently, as needed, to discuss additional valuation matters, which may include the need to review back-testing results, review time-sensitive information or approve related valuation actions. The Committee reports to the Board, with members of the Committee meeting with the Board at each of its regularly scheduled meetings to discuss valuation matters and actions during the period, similar to those described earlier.
For investments categorized as Level 3, the Committee monitors information similar to that described above, which may include: (i) data specific to the issuer or comparable issuers, (ii) general market or specific sector news and (iii) quoted prices and specific or similar security transactions. The Committee considers this data and any changes from prior periods in order to assess the reasonableness of observable and unobservable inputs, any assumptions or internal models used to value those securities and changes in fair value. This data is also used to corroborate, when available, information received from approved pricing vendors and brokers. Various factors impact the frequency of monitoring this information (which may occur as often as daily). However, the Committee may determine that changes to inputs, assumptions and models are not required as a result of the monitoring procedures performed.
The following table is a summary of the inputs used to value the Fund's investments at October 31, 2012:
Description | | Level 1
Quoted Prices in Active
Markets for Identical
Assets ($) | |
Level 2
Other Significant
Observable Inputs ($) | |
Level 3
Significant
Unobservable Inputs ($) | |
Total ($) | |
Bonds | |
Municipal Bonds | | | — | | | | 324,313,535 | | | | — | | | | 324,313,535 | | |
Total Bonds | | | — | | | | 324,313,535 | | | | — | | | | 324,313,535 | | |
Other | |
Money Market Funds | | | 10,376,706 | | | | — | | | | — | | | | 10,376,706 | | |
Total Other | | | 10,376,706 | | | | — | | | | — | | | | 10,376,706 | | |
Total | | | 10,376,706 | | | | 324,313,535 | | | | — | | | | 334,690,241 | | |
See the Portfolio of Investments for all investment classifications not indicated in the table.
The Fund's assets assigned to the Level 2 input category are generally valued using the market approach, in which a security's value is determined through reference to prices and information from market transactions for similar or identical assets.
There were no transfers of financial assets between Levels 1 and 2 during the period.
The accompanying Notes to Financial Statements are an integral part of this statement.
Annual Report 2012
14
Columbia New York Intermediate Municipal Bond Fund
Statement of Assets and Liabilities
October 31, 2012
Assets | |
Investments, at value | |
(identified cost $305,705,500) | | $ | 334,690,241 | | |
Receivable for: | |
Capital shares sold | | | 452,071 | | |
Interest | | | 4,301,585 | | |
Expense reimbursement due from Investment Manager | | | 6,830 | | |
Prepaid expenses | | | 4,192 | | |
Trustees' deferred compensation plan | | | 29,190 | | |
Total assets | | | 339,484,109 | | |
Liabilities | |
Payable for: | |
Capital shares purchased | | | 189,383 | | |
Dividend distributions to shareholders | | | 881,503 | | |
Investment management fees | | | 18,469 | | |
Distribution and service fees | | | 3,010 | | |
Transfer agent fees | | | 61,263 | | |
Administration fees | | | 3,172 | | |
Compensation of board members | | | 28 | | |
Chief compliance officer expenses | | | 95 | | |
Other expenses | | | 62,927 | | |
Trustees' deferred compensation plan | | | 29,190 | | |
Total liabilities | | | 1,249,040 | | |
Net assets applicable to outstanding capital stock | | $ | 338,235,069 | | |
Represented by | |
Paid-in capital | | $ | 310,012,620 | | |
Undistributed net investment income | | | 184,624 | | |
Accumulated net realized loss | | | (946,916 | ) | |
Unrealized appreciation (depreciation) on: | |
Investments | | | 28,984,741 | | |
Total — representing net assets applicable to outstanding capital stock | | $ | 338,235,069 | | |
The accompanying Notes to Financial Statements are an integral part of this statement.
Annual Report 2012
15
Columbia New York Intermediate Municipal Bond Fund
Statement of Assets and Liabilities (continued)
October 31, 2012
Class A | |
Net assets | | $ | 21,763,890 | | |
Shares outstanding | | | 1,734,115 | | |
Net asset value per share | | $ | 12.55 | | |
Maximum offering price per share(a) | | $ | 12.97 | | |
Class B | |
Net assets | | $ | 240,826 | | |
Shares outstanding | | | 19,192 | | |
Net asset value per share | | $ | 12.55 | | |
Class C | |
Net assets | | $ | 23,008,111 | | |
Shares outstanding | | | 1,833,394 | | |
Net asset value per share | | $ | 12.55 | | |
Class T | |
Net assets | | $ | 9,569,603 | | |
Shares outstanding | | | 762,617 | | |
Net asset value per share | | $ | 12.55 | | |
Maximum offering price per share(a) | | $ | 13.18 | | |
Class Z | |
Net assets | | $ | 283,652,639 | | |
Shares outstanding | | | 22,604,565 | | |
Net asset value per share | | $ | 12.55 | | |
(a) The maximum offering price is calculated by dividing the net asset value by 1.0 minus the maximum sales charge of 3.25% for Class A and 4.75% for Class T.
The accompanying Notes to Financial Statements are an integral part of this statement.
Annual Report 2012
16
Columbia New York Intermediate Municipal Bond Fund
Statement of Operations
Year Ended October 31, 2012
Net investment income | |
Income: | |
Dividends | | $ | 1,530 | | |
Interest | | | 12,079,706 | | |
Total income | | | 12,081,236 | | |
Expenses: | |
Investment management fees | | | 1,296,104 | | |
Distribution fees | |
Class B | | | 2,652 | | |
Class C | | | 145,819 | | |
Service fees | |
Class A | | | 49,365 | | |
Class B | | | 884 | | |
Class C | | | 48,615 | | |
Shareholder service fee — Class T | | | 14,296 | | |
Transfer agent fees | |
Class A | | | 38,630 | | |
Class B | | | 704 | | |
Class C | | | 38,397 | | |
Class T | | | 19,260 | | |
Class Z | | | 548,013 | | |
Administration fees | | | 223,123 | | |
Compensation of board members | | | 30,497 | | |
Custodian fees | | | 3,650 | | |
Printing and postage fees | | | 58,295 | | |
Registration fees | | | 86,234 | | |
Professional fees | | | 42,500 | | |
Chief compliance officer expenses | | | 271 | | |
Other | | | 16,260 | | |
Total expenses | | | 2,663,569 | | |
Fees waived or expenses reimbursed by Investment Manager and its affiliates | | | (782,387 | ) | |
Fees waived by Distributor — Class C | | | (68,035 | ) | |
Expense reductions | | | (180 | ) | |
Total net expenses | | | 1,812,967 | | |
Net investment income | | | 10,268,269 | | |
Realized and unrealized gain (loss) — net | |
Net realized gain (loss) on: | |
Investments | | | 70,301 | | |
Net realized gain | | | 70,301 | | |
Net change in unrealized appreciation (depreciation) on: | |
Investments | | | 11,283,666 | | |
Net change in unrealized appreciation (depreciation) | | | 11,283,666 | | |
Net realized and unrealized gain | | | 11,353,967 | | |
Net increase in net assets resulting from operations | | $ | 21,622,236 | | |
The accompanying Notes to Financial Statements are an integral part of this statement.
Annual Report 2012
17
Columbia New York Intermediate Municipal Bond Fund
Statement of Changes in Net Assets
| | | Year Ended
October 31,
2012 | | Year Ended
October 31,
2011 | |
Operations | |
Net investment income | | $ | 10,268,269 | | | $ | 10,336,710 | | |
Net realized gain | | | 70,301 | | | | 334,681 | | |
Net change in unrealized appreciation (depreciation) | | | 11,283,666 | | | | (2,792,748 | ) | |
Net increase in net assets resulting from operations | | | 21,622,236 | | | | 7,878,643 | | |
Distributions to shareholders | |
Net investment income | |
Class A | | | (585,150 | ) | | | (422,806 | ) | |
Class B | | | (7,898 | ) | | | (16,435 | ) | |
Class C | | | (497,459 | ) | | | (386,449 | ) | |
Class T | | | (293,105 | ) | | | (335,085 | ) | |
Class Z | | | (8,868,243 | ) | | | (9,117,123 | ) | |
Total distributions to shareholders | | | (10,251,855 | ) | | | (10,277,898 | ) | |
Increase (decrease) in net assets from capital stock activity | | | 28,432,895 | | | | (28,428,745 | ) | |
Total increase (decrease) in net assets | | | 39,803,276 | | | | (30,828,000 | ) | |
Net assets at beginning of year | | | 298,431,793 | | | | 329,259,793 | | |
Net assets at end of year | | $ | 338,235,069 | | | $ | 298,431,793 | | |
Undistributed net investment income | | $ | 184,624 | | | $ | 168,191 | | |
The accompanying Notes to Financial Statements are an integral part of this statement.
Annual Report 2012
18
Columbia New York Intermediate Municipal Bond Fund
Statement of Changes in Net Assets (continued)
| | | Year Ended October 31, 2012 | | Year Ended October 31, 2011 | |
| | | Shares | | Dollars ($) | | Shares | | Dollars ($) | |
Capital stock activity | |
Class A shares | |
Subscriptions(a) | | | 819,600 | | | | 10,165,989 | | | | 680,452 | | | | 8,129,296 | | |
Distributions reinvested | | | 41,739 | | | | 519,633 | | | | 25,334 | | | | 301,939 | | |
Redemptions | | | (402,168 | ) | | | (4,999,941 | ) | | | (428,180 | ) | | | (5,078,822 | ) | |
Net increase | | | 459,171 | | | | 5,685,681 | | | | 277,606 | | | | 3,352,413 | | |
Class B shares | |
Subscriptions | | | 6,839 | | | | 83,458 | | | | 295 | | | | 3,482 | | |
Distributions reinvested | | | 399 | | | | 4,955 | | | | 581 | | | | 6,906 | | |
Redemptions(a) | | | (26,003 | ) | | | (321,964 | ) | | | (46,583 | ) | | | (545,881 | ) | |
Net decrease | | | (18,765 | ) | | | (233,551 | ) | | | (45,707 | ) | | | (535,493 | ) | |
Class C shares | |
Subscriptions | | | 831,018 | | | | 10,306,930 | | | | 462,728 | | | | 5,509,783 | | |
Distributions reinvested | | | 21,313 | | | | 265,287 | | | | 16,798 | | | | 200,011 | | |
Redemptions | | | (205,083 | ) | | | (2,545,613 | ) | | | (300,163 | ) | | | (3,563,549 | ) | |
Net increase | | | 647,248 | | | | 8,026,604 | | | | 179,363 | | | | 2,146,245 | | |
Class T shares | |
Subscriptions | | | 11,199 | | | | 139,650 | | | | 4,125 | | | | 49,079 | | |
Distributions reinvested | | | 14,628 | | | | 181,968 | | | | 16,746 | | | | 199,199 | | |
Redemptions | | | (41,612 | ) | | | (517,853 | ) | | | (145,887 | ) | | | (1,729,797 | ) | |
Net decrease | | | (15,785 | ) | | | (196,235 | ) | | | (125,016 | ) | | | (1,481,519 | ) | |
Class Z shares | |
Subscriptions | | | 4,241,040 | | | | 52,669,245 | | | | 3,697,552 | | | | 43,887,293 | | |
Distributions reinvested | | | 95,680 | | | | 1,190,800 | | | | 90,984 | | | | 1,082,992 | | |
Redemptions | | | (3,114,369 | ) | | | (38,709,649 | ) | | | (6,532,538 | ) | | | (76,880,676 | ) | |
Net increase (decrease) | | | 1,222,351 | | | | 15,150,396 | | | | (2,744,002 | ) | | | (31,910,391 | ) | |
Total net increase (decrease) | | | 2,294,220 | | | | 28,432,895 | | | | (2,457,756 | ) | | | (28,428,745 | ) | |
(a) Includes conversions of Class B shares to Class A shares, if any.
The accompanying Notes to Financial Statements are an integral part of this statement.
Annual Report 2012
19
Columbia New York Intermediate Municipal Bond Fund
The following tables are intended to help you understand the Fund's financial performance. Certain information reflects financial results for a single share of a class held for the periods shown. Per share net investment income (loss) amounts are calculated based on average shares outstanding during the period. Total return assumes reinvestment of all dividends and distributions. Total return does not reflect payment of sales charges, if any, and is not annualized for periods of less than one year.
| | | Year Ended October 31, | |
Class A | | 2012 | | 2011 | | 2010 | | 2009 | | 2008 | |
Per share data | |
Net asset value, beginning of period | | $ | 12.10 | | | $ | 12.14 | | | $ | 11.76 | | | $ | 11.03 | | | $ | 11.54 | | |
Income from investment operations: | |
Net investment income | | | 0.37 | | | | 0.39 | | | | 0.38 | | | | 0.39 | | | | 0.40 | | |
Net realized and unrealized gain (loss) | | | 0.45 | | | | (0.04 | ) | | | 0.38 | | | | 0.73 | | | | (0.51 | ) | |
Total from investment operations | | | 0.82 | | | | 0.35 | | | | 0.76 | | | | 1.12 | | | | (0.11 | ) | |
Less distributions to shareholders: | |
Net investment income | | | (0.37 | ) | | | (0.39 | ) | | | (0.38 | ) | | | (0.39 | ) | | | (0.40 | ) | |
Total distributions to shareholders | | | (0.37 | ) | | | (0.39 | ) | | | (0.38 | ) | | | (0.39 | ) | | | (0.40 | ) | |
Net asset value, end of period | | $ | 12.55 | | | $ | 12.10 | | | $ | 12.14 | | | $ | 11.76 | | | $ | 11.03 | | |
Total return | | | 6.84 | % | | | 2.99 | % | | | 6.59 | % | | | 10.30 | % | | | (1.02 | %) | |
Ratios to average net assets(a) | |
Expenses prior to fees waived or expenses reimbursed | | | 0.99 | % | | | 0.98 | % | | | 0.93 | % | | | 0.91 | % | | | 0.93 | % | |
Net expenses after fees waived or expenses reimbursed(b) | | | 0.75 | %(c) | | | 0.76 | %(c) | | | 0.80 | %(c) | | | 0.78 | %(c) | | | 0.75 | %(c) | |
Net investment income | | | 2.97 | %(c) | | | 3.30 | %(c) | | | 3.20 | %(c) | | | 3.39 | %(c) | | | 3.44 | %(c) | |
Supplemental data | |
Net assets, end of period (in thousands) | | $ | 21,764 | | | $ | 15,431 | | | $ | 12,110 | | | $ | 8,452 | | | $ | 4,200 | | |
Portfolio turnover | | | 7 | % | | | 8 | % | | | 10 | % | | | 20 | % | | | 9 | % | |
Notes to Financial Highlights
(a) In addition to the fees and expenses which the Fund bears directly, the Fund indirectly bears a pro rata share of the fees and expenses of the acquired funds in which it invests. Such indirect expenses are not included in the reported expense ratios.
(b) The Investment Manager and certain of its affiliates agreed to waive/reimburse certain fees and expenses, if applicable.
(c) The benefits derived from expense reductions had an impact of less than 0.01%.
The accompanying Notes to Financial Statements are an integral part of this statement.
Annual Report 2012
20
Columbia New York Intermediate Municipal Bond Fund
Financial Highlights (continued)
| | | Year Ended October 31, | |
Class B | | 2012 | | 2011 | | 2010 | | 2009 | | 2008 | |
Per share data | |
Net asset value, beginning of period | | $ | 12.10 | | | $ | 12.14 | | | $ | 11.76 | | | $ | 11.03 | | | $ | 11.54 | | |
Income from investment operations: | |
Net investment income | | | 0.28 | | | | 0.30 | | | | 0.30 | | | | 0.31 | | | | 0.32 | | |
Net realized and unrealized gain (loss) | | | 0.44 | | | | (0.04 | ) | | | 0.37 | | | | 0.73 | | | | (0.51 | ) | |
Total from investment operations | | | 0.72 | | | | 0.26 | | | | 0.67 | | | | 1.04 | | | | (0.19 | ) | |
Less distributions to shareholders: | |
Net investment income | | | (0.27 | ) | | | (0.30 | ) | | | (0.29 | ) | | | (0.31 | ) | | | (0.32 | ) | |
Total distributions to shareholders | | | (0.27 | ) | | | (0.30 | ) | | | (0.29 | ) | | | (0.31 | ) | | | (0.32 | ) | |
Net asset value, end of period | | $ | 12.55 | | | $ | 12.10 | | | $ | 12.14 | | | $ | 11.76 | | | $ | 11.03 | | |
Total return | | | 6.02 | % | | | 2.23 | % | | | 5.80 | % | | | 9.49 | % | | | (1.74 | %) | |
Ratios to average net assets(a) | |
Expenses prior to fees waived or expenses reimbursed | | | 1.74 | % | | | 1.75 | % | | | 1.68 | % | | | 1.66 | % | | | 1.68 | % | |
Net expenses after fees waived or expenses reimbursed(b) | | | 1.50 | %(c) | | | 1.52 | %(c) | | | 1.55 | %(c) | | | 1.53 | %(c) | | | 1.50 | %(c) | |
Net investment income | | | 2.25 | %(c) | | | 2.55 | %(c) | | | 2.47 | %(c) | | | 2.67 | %(c) | | | 2.77 | %(c) | |
Supplemental data | |
Net assets, end of period (in thousands) | | $ | 241 | | | $ | 459 | | | $ | 1,016 | | | $ | 1,453 | | | $ | 1,503 | | |
Portfolio turnover | | | 7 | % | | | 8 | % | | | 10 | % | | | 20 | % | | | 9 | % | |
Notes to Financial Highlights
(a) In addition to the fees and expenses which the Fund bears directly, the Fund indirectly bears a pro rata share of the fees and expenses of the acquired funds in which it invests. Such indirect expenses are not included in the reported expense ratios.
(b) The Investment Manager and certain of its affiliates agreed to waive/reimburse certain fees and expenses, if applicable.
(c) The benefits derived from expense reductions had an impact of less than 0.01%.
The accompanying Notes to Financial Statements are an integral part of this statement.
Annual Report 2012
21
Columbia New York Intermediate Municipal Bond Fund
Financial Highlights (continued)
| | | Year Ended October 31, | |
Class C | | 2012 | | 2011 | | 2010 | | 2009 | | 2008 | |
Per share data | |
Net asset value, beginning of period | | $ | 12.10 | | | $ | 12.14 | | | $ | 11.76 | | | $ | 11.03 | | | $ | 11.54 | | |
Income from investment operations: | |
Net investment income | | | 0.32 | | | | 0.34 | | | | 0.33 | | | | 0.34 | | | | 0.36 | | |
Net realized and unrealized gain (loss) | | | 0.45 | | | | (0.04 | ) | | | 0.39 | | | | 0.74 | | | | (0.51 | ) | |
Total from investment operations | | | 0.77 | | | | 0.30 | | | | 0.72 | | | | 1.08 | | | | (0.15 | ) | |
Less distributions to shareholders: | |
Net investment income | | | (0.32 | ) | | | (0.34 | ) | | | (0.34 | ) | | | (0.35 | ) | | | (0.36 | ) | |
Total distributions to shareholders | | | (0.32 | ) | | | (0.34 | ) | | | (0.34 | ) | | | (0.35 | ) | | | (0.36 | ) | |
Net asset value, end of period | | $ | 12.55 | | | $ | 12.10 | | | $ | 12.14 | | | $ | 11.76 | | | $ | 11.03 | | |
Total return | | | 6.41 | % | | | 2.57 | % | | | 6.16 | % | | | 9.87 | % | | | (1.40 | %) | |
Ratios to average net assets(a) | |
Expenses prior to fees waived or expenses reimbursed | | | 1.74 | % | | | 1.73 | % | | | 1.67 | % | | | 1.66 | % | | | 1.68 | % | |
Net expenses after fees waived or expenses reimbursed(b) | | | 1.15 | %(c) | | | 1.16 | %(c) | | | 1.20 | %(c) | | | 1.18 | %(c) | | | 1.15 | %(c) | |
Net investment income | | | 2.57 | %(c) | | | 2.89 | %(c) | | | 2.77 | %(c) | | | 2.96 | %(c) | | | 3.09 | %(c) | |
Supplemental data | |
Net assets, end of period (in thousands) | | $ | 23,008 | | | $ | 14,355 | | | $ | 12,224 | | | $ | 5,861 | | | $ | 2,649 | | |
Portfolio turnover | | | 7 | % | | | 8 | % | | | 10 | % | | | 20 | % | | | 9 | % | |
Notes to Financial Highlights
(a) In addition to the fees and expenses which the Fund bears directly, the Fund indirectly bears a pro rata share of the fees and expenses of the acquired funds in which it invests. Such indirect expenses are not included in the reported expense ratios.
(b) The Investment Manager and certain of its affiliates agreed to waive/reimburse certain fees and expenses, if applicable.
(c) The benefits derived from expense reductions had an impact of less than 0.01%.
The accompanying Notes to Financial Statements are an integral part of this statement.
Annual Report 2012
22
Columbia New York Intermediate Municipal Bond Fund
Financial Highlights (continued)
| | | Year Ended October 31, | |
Class T | | 2012 | | 2011 | | 2010 | | 2009 | | 2008 | |
Per share data | |
Net asset value, beginning of period | | $ | 12.10 | | | $ | 12.14 | | | $ | 11.76 | | | $ | 11.03 | | | $ | 11.54 | | |
Income from investment operations: | |
Net investment income | | | 0.38 | | | | 0.40 | | | | 0.40 | | | | 0.41 | | | | 0.42 | | |
Net realized and unrealized gain (loss) | | | 0.45 | | | | (0.04 | ) | | | 0.38 | | | | 0.72 | | | | (0.52 | ) | |
Total from investment operations | | | 0.83 | | | | 0.36 | | | | 0.78 | | | | 1.13 | | | | (0.10 | ) | |
Less distributions to shareholders: | |
Net investment income | | | (0.38 | ) | | | (0.40 | ) | | | (0.40 | ) | | | (0.40 | ) | | | (0.41 | ) | |
Total distributions to shareholders | | | (0.38 | ) | | | (0.40 | ) | | | (0.40 | ) | | | (0.40 | ) | | | (0.41 | ) | |
Net asset value, end of period | | $ | 12.55 | | | $ | 12.10 | | | $ | 12.14 | | | $ | 11.76 | | | $ | 11.03 | | |
Total return | | | 6.95 | % | | | 3.09 | % | | | 6.69 | % | | | 10.42 | % | | | (0.90 | %) | |
Ratios to average net assets(a) | |
Expenses prior to fees waived or expenses reimbursed | | | 0.90 | % | | | 0.89 | % | | | 0.83 | % | | | 0.81 | % | | | 0.83 | % | |
Net expenses after fees waived or expenses reimbursed(b) | | | 0.65 | %(c) | | | 0.67 | %(c) | | | 0.70 | %(c) | | | 0.68 | %(c) | | | 0.65 | %(c) | |
Net investment income | | | 3.08 | %(c) | | | 3.40 | %(c) | | | 3.31 | %(c) | | | 3.52 | %(c) | | | 3.62 | %(c) | |
Supplemental data | |
Net assets, end of period (in thousands) | | $ | 9,570 | | | $ | 9,420 | | | $ | 10,969 | | | $ | 11,667 | | | $ | 11,520 | | |
Portfolio turnover | | | 7 | % | | | 8 | % | | | 10 | % | | | 20 | % | | | 9 | % | |
Notes to Financial Highlights
(a) In addition to the fees and expenses which the Fund bears directly, the Fund indirectly bears a pro rata share of the fees and expenses of the acquired funds in which it invests. Such indirect expenses are not included in the reported expense ratios.
(b) The Investment Manager and certain of its affiliates agreed to waive/reimburse certain fees and expenses, if applicable.
(c) The benefits derived from expense reductions had an impact of less than 0.01%.
The accompanying Notes to Financial Statements are an integral part of this statement.
Annual Report 2012
23
Columbia New York Intermediate Municipal Bond Fund
Financial Highlights (continued)
| | | Year Ended October 31, | |
Class Z | | 2012 | | 2011 | | 2010 | | 2009 | | 2008 | |
Per share data | |
Net asset value, beginning of period | | $ | 12.10 | | | $ | 12.14 | | | $ | 11.76 | | | $ | 11.03 | | | $ | 11.54 | | |
Income from investment operations: | |
Net investment income | | | 0.40 | | | | 0.42 | | | | 0.41 | | | | 0.42 | | | | 0.42 | | |
Net realized and unrealized gain (loss) | | | 0.45 | | | | (0.04 | ) | | | 0.38 | | | | 0.73 | | | | (0.50 | ) | |
Total from investment operations | | | 0.85 | | | | 0.38 | | | | 0.79 | | | | 1.15 | | | | (0.08 | ) | |
Less distributions to shareholders: | |
Net investment income | | | (0.40 | ) | | | (0.42 | ) | | | (0.41 | ) | | | (0.42 | ) | | | (0.43 | ) | |
Total distributions to shareholders | | | (0.40 | ) | | | (0.42 | ) | | | (0.41 | ) | | | (0.42 | ) | | | (0.43 | ) | |
Net asset value, end of period | | $ | 12.55 | | | $ | 12.10 | | | $ | 12.14 | | | $ | 11.76 | | | $ | 11.03 | | |
Total return | | | 7.11 | % | | | 3.24 | % | | | 6.85 | % | | | 10.58 | % | | | (0.75 | %) | |
Ratios to average net assets(a) | |
Expenses prior to fees waived or expenses reimbursed | | | 0.74 | % | | | 0.73 | % | | | 0.68 | % | | | 0.66 | % | | | 0.68 | % | |
Net expenses after fees waived or expenses reimbursed(b) | | | 0.50 | %(c) | | | 0.52 | %(c) | | | 0.55 | %(c) | | | 0.53 | %(c) | | | 0.50 | %(c) | |
Net investment income | | | 3.23 | %(c) | | | 3.55 | %(c) | | | 3.46 | %(c) | | | 3.66 | %(c) | | | 3.73 | %(c) | |
Supplemental data | |
Net assets, end of period (in thousands) | | $ | 283,653 | | | $ | 258,766 | | | $ | 292,941 | | | $ | 293,160 | | | $ | 272,139 | | |
Portfolio turnover | | | 7 | % | | | 8 | % | | | 10 | % | | | 20 | % | | | 9 | % | |
Notes to Financial Highlights
(a) In addition to the fees and expenses which the Fund bears directly, the Fund indirectly bears a pro rata share of the fees and expenses of the acquired funds in which it invests. Such indirect expenses are not included in the reported expense ratios.
(b) The Investment Manager and certain of its affiliates agreed to waive/reimburse certain fees and expenses, if applicable.
(c) The benefits derived from expense reductions had an impact of less than 0.01%.
The accompanying Notes to Financial Statements are an integral part of this statement.
Annual Report 2012
24
Columbia New York Intermediate Municipal Bond Fund
Notes to Financial Statements
October 31, 2012
Note 1. Organization
Columbia New York Intermediate Municipal Bond Fund (the Fund), a series of Columbia Funds Series Trust I (the Trust), is a non-diversified fund. The Trust is registered under the Investment Company Act of 1940, as amended (the 1940 Act), as an open-end management investment company organized as a Massachusetts business trust.
Fund Shares
The Trust may issue an unlimited number of shares (without par value). The Fund offers Class A, Class B, Class C, Class T and Class Z shares. All share classes have identical voting, dividend and liquidation rights. Each share class has its own expense structure and sales charges, as applicable.
Class A shares are subject to a maximum front-end sales charge of 3.25% based on the initial investment amount. Class A shares purchased without an initial sales charge in accounts aggregating $1 million to $50 million at the time of purchase are subject to a contingent deferred sales charge (CDSC) if the shares are sold within 18 months of purchase, charged as follows: 1.00% CDSC if redeemed within 12 months of purchase, and 0.50% CDSC if redeemed more than 12, but less than 18, months after purchase.
Class B shares may be subject to a maximum CDSC of 3.00% based upon the holding period after purchase. Class B shares will generally convert to Class A shares eight years after purchase. The Fund no longer accepts investments by new or existing investors in the Fund's Class B shares, except in connection with the reinvestment of any dividend and/or capital gain distributions in Class B shares of the Fund and exchanges by existing Class B shareholders of certain other funds within the Columbia Family of Funds.
Class C shares are subject to a 1.00% CDSC on shares redeemed within one year of purchase.
Class T shares are subject to a maximum front-end sales charge of 4.75% based on the investment amount. Class T shares purchased without an initial sales charge in accounts aggregating $1 million to $50 million at the time of purchase are subject to a contingent deferred sales charge (CDSC) if the shares are sold within 18 months of purchase, charged as follows: 1.00% CDSC if redeemed within 12 months of purchase, and 0.50% CDSC if redeemed more than 12, but less than 18, months after purchase. Class T shares are available only to investors who received (and who have continuously held) Class T shares in connection with the merger of certain Galaxy Funds into various Columbia Funds (formerly named Liberty Funds).
Class Z shares are not subject to sales charges, and are only available to certain investors.
Note 2. Summary of Significant Accounting Policies
Use of Estimates
The preparation of financial statements in accordance with U.S. generally accepted accounting principles (GAAP) requires management to make certain estimates and assumptions that affect the reported amounts of assets and liabilities, the disclosure of contingent assets and liabilities at the date of the financial statements and the reported amounts of revenue and expenses during the reporting period. Actual results could differ from those estimates.
The following is a summary of significant accounting policies consistently followed by the Fund in the preparation of its financial statements.
Security Valuation
Debt securities generally are valued by pricing services approved by the Board of Trustees (the Board) based upon market transactions for normal, institutional-size trading units of similar securities. The services may use various pricing techniques which take into account appropriate factors such as yield, quality, coupon rate, maturity, type of issue, trading characteristics and other data, as well as broker quotes. Debt securities for which quotations are readily available may also be valued based upon an over-the-counter or exchange bid quotation.
Investments in other open-end investment companies, including money market funds, are valued at net asset value.
Investments for which market quotations are not readily available, or that have quotations which management believes are not reliable, are valued at fair value as determined in good faith under consistently applied procedures established by and under the general supervision of the Board. If a security or class of securities (such as foreign securities) is valued at fair value, such value is likely to be different from the last quoted market price for the security.
The determination of fair value often requires significant judgment. To determine fair value, management may use assumptions including but not limited to future cash flows and estimated risk premiums. Multiple inputs from various sources may be used to determine fair value.
Security Transactions
Security transactions are accounted for on the trade date. Cost is determined and gains (losses) are based upon the specific identification method for both financial statement and federal income tax purposes.
Annual Report 2012
25
Columbia New York Intermediate Municipal Bond Fund
Notes to Financial Statements (continued)
October 31, 2012
Income Recognition
Interest income is recorded on an accrual basis. Market premiums and discounts, including original issue discounts, are amortized and accreted, respectively, over the expected life of the security on all debt securities, unless otherwise noted.
Dividend income is recorded on the ex-dividend date.
Expenses
General expenses of the Trust are allocated to the Fund and other funds of the Trust based upon relative net assets or other expense allocation methodologies determined by the nature of the expense. Expenses directly attributable to the Fund are charged to the Fund. Expenses directly attributable to a specific class of shares are charged to that share class.
Determination of Class Net Asset Value
All income, expenses (other than class-specific expenses, which are charged to that share class, as shown in the Statement of Operations) and realized and unrealized gains (losses) are allocated to each class of the Fund on a daily basis for purposes of determining the net asset value of each class. Income and expenses are allocated to each class based on the settled shares method, while realized and unrealized gains (losses) are allocated based on the relative net assets of each class.
Federal Income Tax Status
The Fund intends to qualify each year as a regulated investment company under Subchapter M of the Internal Revenue Code, as amended, and will distribute substantially all of its tax exempt or taxable income (including net short-term capital gains), if any, for its tax year, and as such will not be subject to federal income taxes. In addition, the Fund intends to distribute in each calendar year substantially all of its net investment income, capital gains and certain other amounts, if any, such that the Fund should not be subject to federal excise tax. Therefore, no federal income or excise tax provision is recorded.
Distributions to Shareholders
Distributions from net investment income, if any, are declared daily and paid monthly. Net realized capital gains, if any, are distributed at least annually. Income distributions and capital gain distributions are determined in accordance with federal income tax regulations, which may differ from GAAP.
Guarantees and Indemnifications
Under the Trust's organizational documents and, in some cases, by contract, its officers and trustees are indemnified against certain liabilities arising out of the performance of their duties to the Trust or its funds. In addition, certain of the Fund's contracts with its service providers contain general indemnification clauses. The Fund's maximum exposure
under these arrangements is unknown since the amount of any future claims that may be made against the Fund cannot be determined, and the Fund has no historical basis for predicting the likelihood of any such claims.
Recent Accounting Pronouncement
Disclosures about Offsetting Assets and Liabilities
In December 2011, the Financial Accounting Standards Board (FASB) issued ASU No. 2011-11, Disclosures about Offsetting Assets and Liabilities. The objective of the FASB is to enhance current disclosure requirements on offsetting of certain assets and liabilities and to enable financial statement users to compare financial statements prepared under GAAP and International Financial Reporting Standards.
Specifically, ASU No. 2011-11 requires an entity to disclose both gross and net information for derivatives and other financial instruments that are subject to a master netting arrangement or similar agreement. The standard requires disclosure of collateral received in connection with the master netting agreements or similar agreements. The effective date of ASU No. 2011-11 is for interim and annual periods beginning on or after January 1, 2013. At this time, management is evaluating the implications of this guidance and the impact it will have on the financial statement amounts and footnote disclosures, if any.
Note 3. Fees and Compensation Paid to Affiliates
Investment Management Fees
Under an Investment Management Services Agreement, Columbia Management Investment Advisers, LLC (the Investment Manager), a wholly-owned subsidiary of Ameriprise Financial, Inc. (Ameriprise Financial), determines which securities will be purchased, held or sold. The investment management fee is an annual fee that is equal to a percentage of the Fund's average daily net assets that declines from 0.40% to 0.27% as the Fund's net assets increase. The annualized effective investment management fee rate for the year ended October 31, 2012 was 0.40% of the Fund's average daily net assets.
Administration Fees
Under an Administrative Services Agreement, the Investment Manager also serves as the Fund Administrator. The Fund pays the Fund Administrator an annual fee for administration and accounting services equal to a percentage of the Fund's average daily net assets that declines from 0.07% to 0.04% as the Fund's net assets increase. The annualized effective administration fee rate for the year ended October 31, 2012 was 0.07% of the Fund's average daily net assets.
Annual Report 2012
26
Columbia New York Intermediate Municipal Bond Fund
Notes to Financial Statements (continued)
October 31, 2012
Compensation of Board Members
Board members are compensated for their services to the Fund as disclosed in the Statement of Operations. The Trust's eligible Trustees may participate in a Deferred Compensation Plan (the Plan) which may be terminated at any time. Obligations of the Plan will be paid solely out of the Fund's assets.
Compensation of Chief Compliance Officer
The Board has appointed a Chief Compliance Officer to the Fund in accordance with federal securities regulations. The Fund pays its pro-rata share of the expenses associated with the Chief Compliance Officer. The Fund's expenses for the Chief Compliance Officer will not exceed $15,000 per year.
Transfer Agent Fees
Under a Transfer and Dividend Disbursing Agent Agreement, Columbia Management Investment Services Corp. (the Transfer Agent), an affiliate of the Investment Manager and a wholly-owned subsidiary of Ameriprise Financial, is responsible for providing transfer agency services to the Fund. The Transfer Agent has contracted with Boston Financial Data Services (BFDS) to serve as sub-transfer agent.
The Transfer Agent receives monthly account-based service fees based on the number of open accounts and is reimbursed by the Fund for the fees and expenses the Transfer Agent pays to financial intermediaries that maintain omnibus accounts with the Fund that is a percentage of the average aggregate value of the Fund's shares maintained in each such omnibus account (other than omnibus accounts for which American Enterprise Investment Services Inc. is the broker of record or accounts where the beneficial shareholder is a customer of Ameriprise Financial Services, Inc., which are paid a per account fee). The Transfer Agent pays the fees of BFDS for services as sub-transfer agent and is not entitled to reimbursement for such fees from the Fund (with the exception of out-of-pocket fees).
The Transfer Agent also receives compensation from fees for various shareholder services and reimbursements for certain out-of-pocket expenses.
For the year ended October 31, 2012, the Fund's annualized effective transfer agent fee rates as a percentage of average daily net assets of each class were as follows:
Class A | | | 0.20 | % | |
Class B | | | 0.20 | | |
Class C | | | 0.20 | | |
Class T | | | 0.20 | | |
Class Z | | | 0.20 | | |
An annual minimum account balance fee of $20 may apply to certain accounts with a value below the Fund's initial minimum investment requirements to reduce the impact of small accounts on transfer agent fees. These minimum account balance fees are recorded as part of expense reductions in the Statement of Operations. For the year ended October 31, 2012, these minimum account balance fees reduced total expenses by $180.
Distribution and Service Fees
The Fund has an agreement with Columbia Management Investment Distributors, Inc. (the Distributor), an affiliate of the Investment Manager and a wholly-owned subsidiary of Ameriprise Financial, for distribution and shareholder services. Pursuant to Rule 12b-1 under the 1940 Act, the Board has approved, and the Fund has adopted, distribution and shareholder service plans (the Plans) which set the distribution and service fees for the Fund. These fees are calculated daily and are intended to compensate the Distributor and/or eligible selling and/or servicing agents for selling shares of the Fund and providing services to investors.
The Plans require the payment of a monthly service fee to the Distributor at the maximum annual rate of 0.25% of the average daily net assets attributable to Class A, Class B and Class C shares of the Fund. The Plans also require the payment of a monthly distribution fee to the Distributor at the maximum annual rate of 0.75% of the average daily net assets attributable to Class B and Class C shares only.
The Distributor has voluntarily agreed to waive a portion of the distribution fee for Class C shares so that the combined distribution and service fee does not exceed 0.65% annually of the average daily net assets attributable to Class C shares. This arrangement may be modified or terminated by the Distributor at any time.
Shareholder Services Fees
The Fund has adopted a shareholder services plan that permits it to pay for certain services provided to Class T shareholders by their selling and/or servicing agents. The Fund may pay shareholder servicing fees up to an aggregate annual rate of 0.40% of the Fund's average daily net assets attributable to Class T shares (comprised of up to 0.20% for shareholder liaison services and up to 0.20% for administrative support services). These fees are currently limited to an aggregate annual rate of not more than 0.15% of the Fund's average daily net assets attributable to Class T shares. In addition, the servicing fee for Class T shares will be waived by selling and/or servicing agents to the extent necessary to prevent the net investment income for the Class T shares from falling below 0.00% on a daily basis. The shareholder services fee for
Annual Report 2012
27
Columbia New York Intermediate Municipal Bond Fund
Notes to Financial Statements (continued)
October 31, 2012
the year ended October 31, 2012 was 0.15% of the Fund's average daily net assets attributable to Class T shares.
Sales Charges
Sales charges, including front-end charges and CDSCs, received by the Distributor for distributing Fund shares were $37,522 for Class A, $27 for Class B, $5,389 for Class C and $28 for Class T shares for the year ended October 31, 2012.
Expenses Waived/Reimbursed by the Investment Manager and its Affiliates
The Investment Manager and certain of its affiliates have contractually agreed to waive fees and/or reimburse expenses (excluding certain fees and expenses described below), through February 28, 2013, unless sooner terminated at the sole discretion of the Board, so that the Fund's net operating expenses, after giving effect to fees waived/expenses reimbursed and/or overdraft charges from the Fund's custodian, do not exceed the following annual rates as a percentage of the class' average daily net assets:
Class A | | | 0.75 | % | |
Class B | | | 1.50 | | |
Class C | | | 1.50 | | |
Class T | | | 0.65 | | |
Class Z | | | 0.50 | | |
Under the agreement, the following fees and expenses are excluded from the waiver/reimbursement commitment, and therefore will be paid by the Fund, if applicable: taxes (including foreign transaction taxes), expenses associated with investments in affiliated and non-affiliated pooled investment vehicles (including mutual funds and exchange traded funds), transaction costs and brokerage commissions, costs related to any securities lending program, dividend expenses associated with securities sold short, inverse floater program fees and expenses, transaction charges and interest on borrowed money, interest, extraordinary expenses and any other expenses the exclusion of which is specifically approved by the Board. This agreement may be modified or amended only with approval from all parties. Class C distribution fees waived by the Distributor, as discussed above, are in addition to the waiver/reimbursement commitment under the agreement.
Note 4. Federal Tax Information
The timing and character of income and capital gain distributions are determined in accordance with income tax regulations, which may differ from GAAP because of temporary or permanent book to tax differences.
At October 31, 2012, these differences are primarily due to differing treatment for capital loss carryforwards, principal and/or interest of fixed income securities, Trustees' deferred
compensation, distribution reclassifications and recognition of unrealized appreciation (depreciation) for certain derivative investments. To the extent these differences are permanent, reclassifications are made among the components of the Fund's net assets in the Statement of Assets and Liabilities. Temporary differences do not require reclassifications. In the Statement of Assets and Liabilities the following reclassifications were made:
Undistributed net investment income | | $ | 19 | | |
Accumulated net realized gain | | | (19 | ) | |
Net investment income and net realized gains (losses), as disclosed in the Statement of Operations, and net assets were not affected by this reclassification.
The tax character of distributions paid during the years indicated was as follows:
Year Ended October 31, | | 2012 | | 2011 | |
Tax-exempt income | | $ | 10,251,838 | | | $ | 10,277,898 | | |
Ordinary income | | | 17 | | | | — | | |
Total | | $ | 10,251,855 | | | $ | 10,277,898 | | |
Short-term capital gain distributions, if any, are considered ordinary income distributions for tax purposes.
At October 31, 2012, the components of distributable earnings on a tax basis were as follows:
Undistributed tax-exempt income | | $ | 1,001,958 | | |
Undistributed accumulated long-term gain | | | — | | |
Accumulated realized loss | | | (946,916 | ) | |
Unrealized appreciation | | | 29,076,123 | | |
At October 31, 2012, the cost of investments for federal income tax purposes was $305,614,118 and the aggregate gross unrealized appreciation and depreciation based on that cost was:
Unrealized appreciation | | $ | 29,080,714 | | |
Unrealized depreciation | | | (4,591 | ) | |
Net unrealized appreciation | | $ | 29,076,123 | | |
The following capital loss carryforward, determined at October 31, 2012, may be available to reduce taxable income arising from future net realized gains on investments, if any, to the extent permitted by the Internal Revenue Code:
Year of Expiration | | Amount ($) | |
| | 2017 | | | $ | (946,916 | ) | |
For the year ended October 31, 2012, $59,152 of capital loss carryforward was utilized.
Management of the Fund has concluded that there are no significant uncertain tax positions that would require recognition in the financial statements. However,
Annual Report 2012
28
Columbia New York Intermediate Municipal Bond Fund
Notes to Financial Statements (continued)
October 31, 2012
management's conclusion may be subject to review and adjustment at a later date based on factors including, but not limited to, new tax laws, regulations, and administrative interpretations (including relevant court decisions). Generally, the Fund's federal tax returns for the prior three fiscal years remain subject to examination by the Internal Revenue Service.
Note 5. Portfolio Information
The cost of purchases and proceeds from sales of securities, excluding short-term obligations, aggregated to $54,793,298 and $22,581,072, respectively, for the year ended October 31, 2012.
Note 6. Shareholder Concentration
At October 31, 2012, one unaffiliated shareholder account owned 74.0% of the outstanding shares of the Fund. The Fund has no knowledge about whether any portion of those shares was owned beneficially by such account. Subscription and redemption activity by concentrated accounts may have a significant effect on the operations of the Fund.
Note 7. Line of Credit
The Fund has entered into a revolvoing credit facility with a syndicate of banks led by JPMorgan Chase Bank N.A. (JPMorgan) whereby the Fund may borrow for the temporary funding of shareholder redemptions or for other temporary or emergency purposes. The credit facility agreement, as amended, which is a collective agreement between the Fund and certain other funds managed by the Investment Manager, severally and not jointly, permits collective borrowings up to $500 million. Pursuant to a December 13, 2011 amendment to the credit facility agreement, interest is charged to each participating fund based on its borrowings at a rate equal to the higher of (i) the overnight federal funds rate plus 1.00% or (ii) the one-month LIBOR rate plus 1.00%. Each borrowing under the credit facility matures no later than 60 days after the date of borrowing. The Fund also pays a commitment fee equal to its pro rata share of the amount of the credit facility at a rate of 0.08% per annum.
Prior to December 13, 2011, interest was charged to each participating fund based on its borrowings at a rate equal to the sum of the federal funds rate plus (i) 1.25% per annum plus (ii) if one-month LIBOR exceeds the federal funds rate, the amount of such excess. The Fund also paid a commitment fee equal to its pro rata share of the amount of the credit facility at a rate of 0.10% per annum.
The Fund had no borrowings during the year ended October 31, 2012.
Note 8. Significant Risks
Non-Diversification Risk
A non-diversified fund is permitted to invest a greater percentage of its total assets in fewer issuers than a diversified fund. The Fund may, therefore, have a greater risk of loss from a few issuers than a similar fund that invests more broadly.
Geographic Concentration Risk
Because state-specific tax-exempt funds invest primarily in the municipal securities issued by the state and political sub-divisions of the state, the Fund will be particularly affected by political and economic conditions and developments in the state in which it invests. The Fund may, therefore, have a greater risk than that of a municipal bond fund which is more geographically diversified. The value of the municipal securities owned by the Fund also may be adversely affected by future changes in federal or state income tax laws.
Note 9. Subsequent Events
Management has evaluated the events and transactions that have occurred through the date the financial statements were issued and noted no items requiring adjustment of the financial statements or additional disclosure.
Note 10. Information Regarding Pending and Settled Legal Proceedings
In December 2005, without admitting or denying the allegations, American Express Financial Corporation (AEFC, which is now known as Ameriprise Financial, Inc. (Ameriprise Financial)) entered into settlement agreements with the Securities and Exchange Commission (SEC) and Minnesota Department of Commerce (MDOC) related to market timing activities. As a result, AEFC was censured and ordered to cease and desist from committing or causing any violations of certain provisions of the Investment Advisers Act of 1940, the Investment Company Act of 1940, and various Minnesota laws. AEFC agreed to pay disgorgement of $10 million and civil money penalties of $7 million. AEFC also agreed to retain an independent distribution consultant to assist in developing a plan for distribution of all disgorgement and civil penalties ordered by the SEC in accordance with various undertakings detailed at www.sec.gov/litigation/admin/ia-2451.pdf. Ameriprise Financial and its affiliates have cooperated with the SEC and the MDOC in these legal proceedings, and have made regular reports to the funds' Boards of Trustees.
Ameriprise Financial and certain of its affiliates have historically been involved in a number of legal, arbitration and regulatory proceedings, including routine litigation, class actions, and governmental actions, concerning matters arising in connection with the conduct of their business activities.
Annual Report 2012
29
Columbia New York Intermediate Municipal Bond Fund
Notes to Financial Statements (continued)
October 31, 2012
Ameriprise Financial believes that the Funds are not currently the subject of, and that neither Ameriprise Financial nor any of its affiliates are the subject of, any pending legal, arbitration or regulatory proceedings that are likely to have a material adverse effect on the Funds or the ability of Ameriprise Financial or its affiliates to perform under their contracts with the Funds. Ameriprise Financial is required to make 10-Q, 10-K and, as necessary, 8-K filings with the Securities and Exchange Commission on legal and regulatory matters that relate to Ameriprise Financial and its affiliates. Copies of these filings may be obtained by accessing the SEC website at www.sec.gov.
There can be no assurance that these matters, or the adverse publicity associated with them, will not result in increased fund redemptions, reduced sale of fund shares or other adverse consequences to the Funds. Further, although we believe proceedings are not likely to have a material adverse effect on the Funds or the ability of Ameriprise Financial or its affiliates to perform under their contracts with the Funds, these proceedings are subject to uncertainties and, as such, we are unable to estimate the possible loss or range of loss that may result. An adverse outcome in one or more of these proceedings could result in adverse judgments, settlements, fines, penalties or other relief that could have a material adverse effect on the consolidated financial condition or results of operations of Ameriprise Financial.
Annual Report 2012
30
Columbia New York Intermediate Municipal Bond Fund
Report of Independent Registered Public Accounting Firm
To the Trustees of Columbia Funds Series Trust I and
the Shareholders of Columbia New York Intermediate Municipal Bond Fund
In our opinion, the accompanying statement of assets and liabilities, including the portfolio of investments, and the related statements of operations and of changes in net assets and the financial highlights present fairly, in all material respects, the financial position of Columbia New York Intermediate Municipal Bond Fund (the "Fund") (a series of Columbia Funds Series Trust I) at October 31, 2012, the results of its operations for the year then ended, the changes in its net assets for each of the two years in the period then ended and the financial highlights for each of the periods indicated, in conformity with accounting principles generally accepted in the United States of America. These financial statements and financial highlights (hereafter referred to as "financial statements") are the responsibility of the Fund's management. Our responsibility is to express an opinion on these financial statements based on our audits. We conducted our audits of these financial statements in accordance with the standards of the Public Company Accounting Oversight Board (United States). Those standards require that we plan and perform the audit to obtain reasonable assurance about whether the financial statements are free of material misstatement. An audit includes examining, on a test basis, evidence supporting the amounts and disclosures in the financial statements, assessing the accounting principles used and significant estimates made by management, and evaluating the overall financial statement presentation. We believe that our audits, which included confirmation of securities at October 31, 2012 by correspondence with the custodian, transfer agent and brokers, provide a reasonable basis for our opinion.
PricewaterhouseCoopers LLP
Minneapolis, Minnesota
December 21, 2012
Annual Report 2012
31
Columbia New York Intermediate Municipal Bond Fund
Federal Income Tax Information
(Unaudited)
The Fund hereby designates the following tax attributes for the fiscal year ended October 31, 2012. Shareholders will be notified in early 2013 of amounts for use in preparing 2012 income tax returns.
Tax Designations:
Exempt-Interest Dividends | | | 100.00 | % | |
Exempt-Interest Dividends. The percentage of net investment income distributions paid during the fiscal year that qualifies as exempt-interest dividends for federal income tax purposes.
Annual Report 2012
32
Columbia New York Intermediate Municipal Bond Fund
The Trustees serve terms of indefinite duration. The names, addresses and birth years of the Trustees and Officers of the Funds in Columbia Funds Series Trust I, the year each was first elected or appointed to office, their principal business occupations during at least the last five years, the number of Funds overseen by each Trustee and other directorships they hold are shown below. Each officer listed below serves as an officer of each Fund in Columbia Funds Series Trust I.
Independent Trustees
Name, Address and Year of Birth,
Position with Funds, Year First
Elected or Appointed to Office | | Principal Occupation(s) During Past Five Years, Number of Funds in Columbia
Funds Complex Overseen by Trustee, Other Directorships Held
| |
Rodman L. Drake (Born 1943)
c/o Columbia Management Investment Advisers, LLC
225 Franklin Street
Boston, MA 02110
Trustee (since 1994) and
Chairman of the Board (since 2009) | | Independent consultant since 2010; Co-Founder of Baringo Capital LLC (private equity) from 1997 to 2008; CEO of Crystal River Capital, Inc. (real estate investment trust) from 2003 to 2010; Oversees 52; Jackson Hewitt Tax Service Inc. (tax preparation services from 2004 to 2011); Celgene Corporation (global biotechnology company); Student Loan Corporation (student loan provider from 2005 to 2010); Celgene Corporation (global biotechnology company); The Helios Funds and Brookfield Funds (closed-end funds); Crystal River Capital, Inc. from 2005 to 2010; Parsons Brinckerhoff from 1995 to 2008; and Apex Silver Mines Ltd. from 2007 to 2009 | |
Douglas A. Hacker (Born 1955)
c/o Columbia Management Investment Advisers, LLC
225 Franklin Street
Boston, MA 02110
Trustee (since 1996) | | Independent business executive since May 2006; Executive Vice President — Strategy of United Airlines from December 2002 to May 2006; President of UAL Loyalty Services (airline marketing company) from September 2001 to December 2002; Executive Vice President and Chief Financial Officer of United Airlines from July 1999 to September 2001. Oversees 52; Nash Finch Company (food distributor); Aircastle Limited (aircraft leasing); and SeaCube Container Leasing Ltd. (container leasing) | |
Janet Langford Kelly (Born 1957)
c/o Columbia Management Investment Advisers, LLC
225 Franklin Street
Boston, MA 02110
Trustee (since 1996) | | Senior Vice President, General Counsel and Corporate Secretary, ConocoPhillips (integrated energy company) since September 2007; Deputy General Counsel — Corporate Legal Services, ConocoPhillips from August 2006 to August 2007; Partner, Zelle, Hofmann, Voelbel, Mason & Gette LLP (law firm) from March 2005 to July 2006; Adjunct Professor of Law, Northwestern University from September 2004 to June 2006; Director, UAL Corporation (airline) from February 2006 to July 2006; Chief Administrative Officer and Senior Vice President, Kmart Holding Corporation (consumer goods) from September 2003 to March 2004. Oversees 52; None | |
Nancy T. Lukitsh (Born 1956)
c/o Columbia Management Investment Advisers, LLC
225 Franklin Street
Boston, MA 02110
Trustee (since 2011) | | Senior Vice President, Partner and Director of Marketing, Wellington Management Company, LLP (investment adviser) from 1997 to 2010; Chair, Wellington Management Investment Portfolios (commingled non-U.S. investment pools) from 2007 to 2010; Director, Wellington Trust Company, NA and other Wellington affiliates from 1997 to 2010. Oversees 52; None | |
William E. Mayer (Born 1940)
c/o Columbia Management Investment Advisers, LLC
225 Franklin Street
Boston, MA 02110
Trustee (since 1994) | | Partner, Park Avenue Equity Partners (private equity) since February 1999; Dean and Professor, College of Business and Management, University of Maryland from 1992 to 1996. Oversees 52; DynaVox Inc. (speech creation); Lee Enterprises (print media); WR Hambrecht + Co. (financial service provider) from 2000 to 2012; BlackRock Kelso Capital Corporation (investment company) | |
David M. Moffett (Born 1952)
c/o Columbia Management Investment Advisers, LLC
225 Franklin Street
Boston, MA 02110
Trustee (since 2011) | | Retired. Chief Executive Officer, Federal Home Loan Mortgage Corporation, from 2008 to 2009; Senior Adviser, Global Financial Services Group, Carlyle Group, Inc., from 2007 to 2008; Vice Chairman and Chief Financial Officer, U.S. Bancorp, from 1993 to 2007. Oversees 52; CIT Group Inc. (commercial and consumer finance); eBay Inc. (online trading community); MBIA Inc. (financial service provider); E.W. Scripps Co. (print and television media), Building Materials Holding Corp. (building materials and construction services); and University of Oklahoma Foundation. | |
Charles R. Nelson (Born 1942)
c/o Columbia Management Investment Advisers, LLC
225 Franklin Street
Boston, MA 02110
Trustee (since 1981) | | Retired Professor Emeritus, University of Washington, since 2011; Professor of Economics, University of Washington from January 1976 to 2011; Ford and Louisa Van Voorhis Professor of Political Economy, University of Washington from 1993 to 2011; Adjunct Professor of Statistics, University of Washington from 1980 to 2011; Associate Editor, Journal of Money Credit and Banking from 1993 to 2008; consultant on econometric and statistical matters. Oversees 52; None | |
John J. Neuhauser (Born 1943)
c/o Columbia Management Investment Advisers, LLC
225 Franklin Street
Boston, MA 02110
Trustee (since 1984) | | President, Saint Michael's College, since August 2007; Director or Trustee of several non-profit organizations, including Fletcher Allen Health Care, Inc.; University Professor, Boston College from November 2005 to August 2007; Academic Vice President and Dean of Faculties, Boston College from August 1999 to October 2005. Oversees 52; Liberty All-Star Equity Fund and Liberty All-Star Growth Fund (closed-end funds) | |
Annual Report 2012
33
Columbia New York Intermediate Municipal Bond Fund
Trustees and Officers (continued)
Independent Trustees (continued)
Name, Address and Year of Birth,
Position with Funds, Year First
Elected or Appointed to Office | | Principal Occupation(s) During Past Five Years, Number of Funds in Columbia
Funds Complex Overseen by Trustee, Other Directorships Held
| |
Patrick J. Simpson (Born 1944)
c/o Columbia Management Investment Advisers, LLC
225 Franklin Street
Boston, MA 02110
Trustee (since 2000) | | Partner, Perkins Coie LLP (law firm). Oversees 52; None | |
Anne-Lee Verville (Born 1945)
c/o Columbia Management Investment Advisers, LLC
225 Franklin Street
Boston, MA 02110
Trustee (since 1998) | | Retired. General Manager — Global Education Industry from 1994 to 1997, President — Application Systems Division from 1991 to 1994, Chief Financial Officer — US Marketing & Services from 1988 to 1991, and Chief Information Officer from 1987 to 1988, IBM Corporation (computer and technology). Oversees 52; Enesco Group, Inc. (producer of giftware and home and garden decor products) from 2001 to 2006 | |
Interested Trustee
Name, Address and Year of Birth,
Position with Funds, Year First
Elected or Appointed to Office | | Principal Occupation(s) During Past Five Years, Number of Funds in Columbia
Funds Complex Overseen by Trustee, Other Directorships Held
| |
William F. Truscott (born 1960)
53600 Ameriprise Financial Center
Minneapolis, MN 55474
Senior Vice President (since 2012) | | Chairman of the Board and President, Columbia Management Investment Advisers, LLC since May 2010 and February 2012, respectively (previously President, Chairman of the Board and Chief Investment Officer, from 2001 to April 2010); Chief Executive Officer, U.S. Asset Management & President, Annuities, Ameriprise Financial, Inc. since May 2010 (previously President — U.S. Asset Management and Chief Investment Officer from 2005 to April 2010, and Senior Vice President — Chief Investment Officer, from 2001 to 2005); Director, President and Chief Executive Officer, Ameriprise Certificate Company since 2006; Director and Chief Executive Officer, Columbia Management Investment Distributors, Inc. since May 2010 and February 2012, respectively (previously Chairman of the Board and Chief Executive Officer from 2008 to April 2010); Chairman of the Board and Chief Executive Officer, RiverSource Distributors, Inc. since 2006. Oversees 208; Columbia Funds Board. | |
The Statement of Additional Information includes additional information about the Trustees of the Funds and is available, without charge, upon request by calling 1-800-345-6611.
Officers
Name, Year of Birth and Address | | Principal Occupation(s) During the Past Five Years | |
J. Kevin Connaughton (Born 1964)
225 Franklin Street
Boston, MA 02110
President (since 2009) | | Senior Vice President and General Manager — Mutual Fund Products, Columbia Management Investment Advisers, LLC since May 2010; President, Columbia Funds, since 2009, and RiverSource Funds, since May 2010 (previously Senior Vice President and Chief Financial Officer, Columbia Funds, from June 2008 to January 2009, Treasurer, Columbia Funds, from October 2003 to May 2008, and senior officer of various other affiliated funds since 2000); Managing Director, Columbia Management Advisors, LLC from December 2004 to April 2010. | |
Michael G. Clarke (Born 1969)
225 Franklin Street
Boston, MA 02110
Treasurer (since 2011) and Chief Financial Officer (since 2009) | | Vice President, Columbia Management Investment Advisers, LLC since May 2010; Managing Director of Fund Administration, Columbia Management Advisors, LLC, from September 2004 to April 2010; senior officer of Columbia Funds and affiliated funds since 2002. | |
Scott R. Plummer (Born 1959)
5228 Ameriprise Financial Center
Minneapolis, MN 55474
Senior Vice President, Assistant Secretary and Chief Legal Officer (since 2010) | | Senior Vice President, Chief Legal Officer and Assistant Secretary, Columbia Management Investment Advisers, LLC since June 2005; Vice President and Lead Chief Counsel — Asset Management, Ameriprise Financial, Inc. since May 2010 (previously Vice President and Chief Counsel — Asset Management, from 2005 to April 2010); Vice President, Chief Counsel and Assistant Secretary, Columbia Management Investment Distributors, Inc. since 2008; Vice President, General Counsel and Secretary, Ameriprise Certificate Company since 2005; Chief Counsel, RiverSource Distributors, Inc. since 2006; Vice President, General Counsel and Secretary, RiverSource Funds since December 2006; Senior Vice President, Secretary and Chief Legal Officer, Columbia Funds, since May 2010. | |
Annual Report 2012
34
Columbia New York Intermediate Municipal Bond Fund
Trustees and Officers (continued)
Officers (continued)
Name, Year of Birth and Address | | Principal Occupation(s) During the Past Five Years | |
William F. Truscott (Born 1960)
53600 Ameriprise Financial Center
Minneapolis, MN 55474
Senior Vice President (since 2010) | | Chairman of the Board and President, Columbia Management Investment Advisers, LLC since May 2010 and February 2012, respectively (previously President, Chairman of the Board and Chief Investment Officer, from 2001 to April 2010); Chief Executive Officer, U.S. Asset Management & President, Annuities, Ameriprise Financial, Inc. since May 2010 (previously President — U.S. Asset Management and Chief Investment Officer from 2005 to April 2010); Director, President and Chief Executive Officer, Ameriprise Certificate Company since 2006; Director and Chief Executive Officer, Columbia Management Investment Distributors, Inc. since May 2010 and February 2012, respectively (previously Chairman of the Board and Chief Executive Officer from 2008 to April 2010); Chairman of the Board and Chief Executive Officer, RiverSource Distributors, Inc. since 2006. | |
Thomas P. McGuire (Born 1972)
225 Franklin Street
Boston, MA 02110
Chief Compliance Officer (since 2012) | | Vice President — Asset Management Compliance, Columbia Management Investment Advisers, LLC since 2010; Chief Compliance Officer, Ameriprise Certificate Company, since September 2010; Compliance Executive, Bank of America, 2005-2010. | |
Colin Moore (Born 1958)
225 Franklin Street
Boston, MA 02110
Senior Vice President (since 2010) | | Director and Chief Investment Officer, Columbia Management Investment Advisers, LLC since May 2010; Manager, Managing Director and Chief Investment Officer of Columbia Management Advisors, LLC from 2007 to April 2010; Head of Equities, Columbia Management Advisors, LLC from 2002 to 2007. | |
Amy Johnson (Born 1965)
5228 Ameriprise Financial Center
Minneapolis, MN 55474
Vice President (since 2010) | | Senior Vice President and Chief Operating Officer, Columbia Management Investment Advisers, LLC since May 2010 (previously Chief Administrative Officer, from 2009 until April 2010, Vice President — Asset Management and Trust Company Services, from 2006 to 2009, and Vice President — Operations and Compliance from 2004 to 2006). | |
Joseph F. DiMaria (Born 1968)
225 Franklin Street
Boston, MA 02110
Vice President (since 2011) and Chief Accounting Officer (since 2008) | | Vice President, Mutual Fund Administration, Columbia Management Investment Advisers, LLC, since May 2010; Director of Fund Administration, Columbia Management Advisors, LLC from January 2006 to April 2010; Head of Tax/Compliance and Assistant Treasurer, Columbia Management Advisors, LLC, from November 2004 to December 2005. | |
Stephen T. Welsh (born 1957)
225 Franklin Street
Boston, MA 02110
Vice President (since 2006) | | President and Director, Columbia Management Investment Services Corp. since May 2010; President and Director, Columbia Management Services, Inc. from July 2004 to April 2010; Managing Director, Columbia Management Distributors, Inc. from August 2007 to April 2010. | |
Paul D. Pearson (born 1956)
10468 Ameriprise Financial Center
Minneapolis, MN 55474
Vice President and Assistant Treasurer (since 2011) | | Vice President, Investment Accounting, Columbia Management Investment Advisers, LLC, since May 2010; Vice President, Managed Assets, Investment Accounting, Ameriprise Financial Corporation. | |
Paul B. Goucher (born 1968)
5228 Ameriprise Financial Center
Minneapolis, MN 55474
Vice President and Assistant Secretary (since 2010) | | Vice President and Chief Counsel of Ameriprise Financial since January 2010 (formerly Vice President and Group Counsel from November 2008 to January 2010); Director, Managing Director and General Counsel of J. & W. Seligman & Co. Incorporated (Seligman) from July 2008 to November 2008 and Managing Director and Associate General Counsel of Seligman from January 2005 to July 2008. | |
Christopher O. Petersen (born 1970)
5228 Ameriprise Financial Center
Minneapolis, MN 55474
Vice President (since 2010) and Secretary (since 2011) | | Vice President and Chief Counsel, Ameriprise Financial since January 2010 (formerly Vice President and Group Counsel or Counsel from April 2004 to January 2010); Assistant Secretary of RiverSource Funds since January 2007; officer of Columbia Funds and affiliated funds since 2007. | |
Michael E. DeFao (born 1968)
225 Franklin Street
Boston, MA 02110
Vice President and Assistant Secretary (since 2011) | | Vice President and Chief Counsel, Ameriprise Financial since May 2010; Associate General Counsel, Bank of America from June 2005 to April 2010. | |
Annual Report 2012
35
Columbia New York Intermediate Municipal Bond Fund
Board Consideration and Approval of
Advisory Agreement
On June 6, 2012, the Board of Trustees (the "Board") and the Trustees who are not interested persons (as defined in the Investment Company Act of 1940) of the Trust (the "Independent Trustees") unanimously approved the continuation of the Investment Management Services Agreement (the "Advisory Agreement") with Columbia Management Investment Advisers, LLC (the "Investment Manager") with respect to Columbia New York Intermediate Municipal Bond Fund (the "Fund"), a series of the Trust. As detailed below, the Advisory Fees and Expenses Committee (the "Committee") and the Board met on multiple occasions to review and discuss, both among themselves and with the management team of the Investment Manager, materials provided by the Investment Manager before determining to approve the continuation of the Advisory Agreement.
In connection with their deliberations regarding the continuation of the Advisory Agreement, the Committee and the Board requested and evaluated materials from the Investment Manager regarding the Fund and the Advisory Agreement, and discussed these materials with representatives of the Investment Manager at the Committee meeting held on June 5, 2012 and at the Board meeting held on June 6, 2012. In addition, the Board considers matters bearing on the Advisory Agreement at most of its other meetings throughout the year and meets regularly with senior management of the Funds and the Investment Manager. Through the Board's Investment Oversight Committees, Trustees also meet with selected Fund portfolio managers and other investment personnel at various times throughout the year. The Committee and the Board also consulted with Fund counsel and with the Independent Trustees' independent legal counsel, who advised on the legal standard for consideration by the Board and otherwise assisted the Board in its deliberations. On June 5, 2012, the Committee recommended that the Board approve the continuation of the Advisory Agreement. On June 6, 2012, the Board, including the Independent Trustees, voting separately, unanimously approved the continuation of the Advisory Agreement for the Fund.
The Committee and the Board considered all information that they, their legal counsel, or the Investment Manager believed reasonably necessary to evaluate and to determine whether to approve the continuation of the Advisory Agreement. In their deliberations, the Trustees did not identify any particular information that was all-important or controlling, and individual Trustees may have attributed different weights to the various factors. The information and factors considered by the Committee and the Board in recommending for approval or approving the continuation of the Advisory Agreement for the Fund included the following:
• Information on the investment performance of the Fund relative to the performance of the Fund's benchmarks and the performance of a group of comparable mutual funds, as determined by an independent third-party data provider;
• Information on the Fund's advisory fees and total expenses, including information comparing the Fund's expenses to those of a group of comparable mutual funds, as determined by an independent third-party data provider;
• The Investment Manager's agreement to contractually limit or cap total operating expenses for the Fund so that total operating expenses (excluding certain fees and expenses, such as transaction costs and certain other investment related expenses, interest, taxes, acquired fund fees and expenses, and extraordinary expenses) would not exceed the median expenses of a group of comparable funds (as determined from time to time, generally annually, by an independent third-party data provider);
• The terms and conditions of the Advisory Agreement, including that the advisory fee rates payable by the Fund would not change;
• The terms and conditions of other agreements and arrangements with affiliates of the Investment Manager relating to the operations of the Fund, including the Administrative Services Agreement, the Distribution Agreement and the Transfer and Dividend Disbursing Agent Agreement, noting in the case of the Transfer and Dividend Disbursing Agent Agreement certain proposed changes to the fee rates payable thereunder;
• Descriptions of various functions performed by the Investment Manager under the Advisory Agreement, including portfolio management and portfolio trading practices;
• Information regarding the management fees and investment performance of any comparable portfolios of other clients of the Investment Manager, including institutional separate accounts; and
• The profitability to the Investment Manager and its affiliates from their relationships with the Fund.
Annual Report 2012
36
Columbia New York Intermediate Municipal Bond Fund
Board Consideration and Approval of
Advisory Agreement (continued)
Nature, Extent and Quality of Services to be Provided under the Advisory Agreement
The Committee and the Board considered the nature, extent and quality of services provided to the Fund by the Investment Manager and its affiliates under the Advisory Agreement and under separate agreements for the provision of transfer agency and administrative services, and the resources dedicated to the Fund and the other Columbia Funds by the Investment Manager and its affiliates. The Committee and the Board considered, among other things, the Investment Manager's ability to attract, motivate and retain highly qualified research, advisory and supervisory investment professionals (including personnel and other resources, compensation programs for personnel involved in fund management, reputation and other attributes), the portfolio management services provided by those investment professionals, the quality of the Investment Manager's investment research capabilities and trade execution services, and the other resources that the Investment Manager devotes to the Fund. The Committee and the Board also considered the potential benefits to shareholders of investing in a mutual fund that is part of a fund complex offering exposure to a variety of asset classes and investment disciplines and providing a variety of fund and shareholder services.
The Committee and the Board also considered the professional experience and qualifications of the senior personnel of the Investment Manager. The Committee and the Board noted the compliance programs of and the compliance-related resources provided to the Fund by the Investment Manager and its affiliates, and considered the Investment Manager's ability to provide administrative services to the Fund pursuant to a separate administrative services agreement, including the Investment Manager's ability to coordinate the activities of the Fund's other service providers. After reviewing these and related factors, the Committee and the Board concluded, within the context of their overall conclusions, that the expected nature, extent and quality of the services to be provided to the Fund under the Advisory Agreement supported the continuation of such agreement.
Investment Performance
The Committee and the Board reviewed information about the performance of the Fund over various time periods, including performance information relative to benchmarks and information based on reports of an independent third-party data provider that compared the performance of the Fund to the performance of a group of comparable mutual funds. The Committee and the Board also reviewed a description of the third party's methodology for identifying the Fund's peer groups for purposes of performance and expense comparisons. In the case of each Fund whose performance lagged that of a relevant peer group for certain (although not necessarily all) periods, the Committee and the Board concluded that other factors relevant to performance were sufficient, in light of other considerations, to warrant continuation of the Fund's Advisory Agreement. Those factors varied from fund to fund, but included one or more of the following: (i) that the Fund's performance, although lagging in certain recent periods, was stronger over the longer term; (ii) that the underperformance was attributable, to a significant extent, to investment decisions that were reasonable and consistent with the Fund's investment strategy and policies and that the Fund was performing within a reasonable range of expectations, given those investment decisions, market conditions and the Fund's investment strategy; (iii) that the Fund's performance was competitive when compared to other relevant performance benchmarks or peer groups; and (iv) that the Investment Manager had taken or was taking steps designed to help improve the Fund's investment performance, including, but not limited to, replacing portfolio managers, enhancing the resources supporting the portfolio managers, or modifying investment strategies.
The Committee and the Board noted that, through December 31, 2011, the Fund's performance was in the fiftieth, thirty-eighth and fiftieth percentiles (where the best performance would be in the first percentile) of its category selected by an independent third-party data provider for the purposes of performance comparisons for the one-, three- and five- year periods, respectively.
The Committee and the Board also considered the Investment Manager's performance and reputation generally, the Investment Manager's historical responsiveness to Board concerns about performance and the Investment Manager's willingness to take steps intended to improve performance. After reviewing these and related factors, the Committee and the Board concluded, within the context of their overall conclusions regarding the Advisory Agreement, that the performance of the Fund and the Investment Manager was sufficient, in light of other considerations, to warrant the continuation of the Advisory Agreement.
Annual Report 2012
37
Columbia New York Intermediate Municipal Bond Fund
Board Consideration and Approval of
Advisory Agreement (continued)
Investment Advisory Fee Rates and Other Expenses
The Committee and the Board considered the advisory fees to be charged to the Fund under the Advisory Agreement as well as the total expenses to be incurred by the Fund. In assessing the reasonableness of the fees under the Advisory Agreement, the Committee and the Board considered, among other information, the Fund's advisory fee and its expected total expense ratio as a percentage of average daily net assets. The Committee and the Board noted that the Fund's actual management fee and total net expense ratio are ranked in the first and third quintiles, respectively, against the Fund's expense universe as determined by an independent third-party data provider for purposes of expense comparison. The Committee and the Board also took into account the fee waiver and expense limitation arrangements agreed to by the Investment Manager, as noted above.
The Committee and the Board also considered the fact that the advisory fee rates payable by the Fund to the Investment Manager under the Advisory Agreement were the same as those currently paid by the Fund to the Investment Manager.
The Committee and the Board also received and considered information about the advisory fees charged by the Investment Manager to institutional separate accounts. In considering the fees charged to those accounts, the Committee and the Board took into account, among other things, the Investment Manager's representations about the differences between managing mutual funds as compared to other types of accounts, including differences in the services provided, differences in the risk profile of such business for the Investment Manager and the additional resources required to manage mutual funds effectively. In evaluating the Fund's advisory fees, the Committee and the Board also took into account the demands, complexity and quality of the investment management of the Fund.
After reviewing these and related factors, the Committee and the Board concluded, within the context of their overall conclusions, that the advisory fee rates and expenses of the Fund supported the continuation of the Advisory Agreement.
Costs of Services to be Provided and Profitability
The Committee and the Board also took note of the costs of the services provided (both on an absolute and relative basis) and the profitability to the Investment Manager and its affiliates in connection with their relationships with the Fund. In evaluating these considerations, the Committee and the Board took note of the advisory fees charged by the Investment Manager to other clients, including fees charged by the Investment Manager to any institutional separate account clients with similar investment strategies to those of the Fund.
The Committee and the Board also considered the compensation directly or indirectly received by the Investment Manager's affiliates in connection with their relationships with the Fund. The Committee and the Board reviewed information provided by management as to the profitability of the Investment Manager and its affiliates of their relationships with the Fund, and information about the allocation of expenses used to calculate profitability. When reviewing profitability, the Committee and the Board also considered court cases in which adviser profitability was an issue in whole or in part, the performance of the fund, the expense ratio of the fund, and the implementation of expense limitations with respect to the fund. The Committee and the Board also considered information provided by the Investment Manager regarding its financial condition and comparing its profitability to that of other asset management firms that are, or are subsidiaries of, publicly traded companies.
After reviewing these and related factors, the Committee and the Board concluded, within the context of their overall conclusions, that the profitability to the Investment Manager and its affiliates from their relationships with the Fund supported the continuation of the Advisory Agreement.
Economies of Scale
The Committee and the Board considered the potential existence of economies of scale in the provision by the Investment Manager of services to the Fund, to groups of related funds, and to the Investment Manager's investment advisory clients as a whole, and whether those economies of scale were shared with the Fund through breakpoints in investment advisory fees or other means, such as expense limitation arrangements and additional investments by the Investment Manager in investment, trading and compliance resources. The Committee and the Board noted that the investment advisory fee schedules for the Fund contained breakpoints that would reduce the fee rate on assets above specified threshold levels.
Annual Report 2012
38
Columbia New York Intermediate Municipal Bond Fund
Board Consideration and Approval of
Advisory Agreement (continued)
In considering these issues, the Committee and the Board also considered the costs of the services provided (both on an absolute and relative basis) and the profitability to the Investment Manager and its affiliates from their relationships with the Fund, as discussed above. After reviewing these and related factors, the Committee and the Board concluded, within the context of their overall conclusions, that the extent to which economies of scale were expected to be shared with the Fund supported the continuation of the Advisory Agreement.
Other Benefits to the Investment Manager
The Committee and the Board received and considered information regarding "fall-out" or ancillary benefits received by the Investment Manager and its affiliates as a result of their relationships with the Fund, such as the engagement of the Investment Manager to provide administrative services to the Fund and the engagement of the Investment Manager's affiliates to provide distribution and transfer agency services to the Fund. The Committee and the Board considered that the Fund's distributor retains a portion of the distribution fees from the Fund and receives a portion of the sales charges on sales or redemptions of certain classes of shares of the Fund. The Committee and the Board also considered the benefits of research made available to the Investment Manager by reason of brokerage commissions generated by the Fund's securities transactions, and reviewed information about the Investment Manager's practices with respect to allocating portfolio brokerage for brokerage and research services. The Committee and the Board considered the possible conflicts of interest associated with certain fall-out or other ancillary benefits and the reporting, disclosure and other processes that would be in place to address such possible conflicts of interest. The Committee and the Board recognized that the Investment Manager's profitability would be somewhat lower without these benefits.
Conclusion
The Committee and the Board reviewed all of the above considerations in reaching their decisions to recommend or approve the continuation of the Advisory Agreement. No single item was identified as paramount or controlling, and individual Trustees may have attributed different weights to various factors. Based on their evaluation of all factors that they deemed to be material, including those factors described above, and assisted by the advice of independent legal counsel, the Board, including the Independent Trustees, voting separately, unanimously approved the continuation of the Advisory Agreement.
Annual Report 2012
39
This page intentionally left blank.
Annual Report 2012
40
Columbia New York Intermediate Municipal Bond Fund
Important Information About This Report
Each fund mails one shareholder report to each shareholder address. If you would like more than one report, please call shareholder services at 800.345.6611 and additional reports will be sent to you.
The policy of the Board is to vote the proxies of the companies in which each fund holds investments consistent with the procedures as stated in the Statement of Additional Information (SAI). You may obtain a copy of the SAI without charge by calling 800.345.6611; contacting your financial intermediary; visiting columbiamanagement.com; or searching the website of the Securities and Exchange Commission (SEC) at sec.gov. Information regarding how each fund voted proxies relating to portfolio securities is filed with the SEC by August 31 for the most recent 12-month period ending June 30 of that year, and is available without charge by visiting columbiamanagement.com; or searching the website of the SEC at sec.gov.
Each fund files a complete schedule of portfolio holdings with the SEC for the first and third quarters of each fiscal year on Form N-Q. Each fund's Form N-Q is available on the SEC's website at sec.gov and may be reviewed and copied at the SEC's Public Reference Room in Washington, D.C. Information on the operation of the Public Reference Room may be obtained by calling 800.SEC.0330. Each fund's complete schedule of portfolio holdings, as filed on Form N-Q, can also be obtained without charge, upon request, by calling 800.345.6611.
Annual Report 2012
41

Columbia New York Intermediate Municipal Bond Fund
P.O. Box 8081
Boston, MA 02266-8081
columbiamanagement.com
This information is for use with concurrent or prior delivery of a fund prospectus. Please read and consider the investment objectives, risks, charges and expenses for any fund carefully before investing. For a prospectus which contains this and other important information about the Fund go to columbiamanagement.com. The Fund is distributed by Columbia Management Investment Distributors, Inc., member FINRA, and managed by Columbia Management Investment Advisers, LLC.
© 2012 Columbia Management Investment Advisers, LLC. All rights reserved.
C-1741 D (12/12)
Annual Report
October 31, 2012

Columbia Massachusetts Intermediate Municipal Bond Fund
Not FDIC insured • No bank guarantee • May lose value
Columbia Massachusetts Intermediate Municipal Bond Fund
 Dear Shareholders,
Stocks rebound around the world
After a weak second quarter, U.S. stock market averages rebounded in the third quarter, erasing earlier losses and boosting year-to-date returns well into double digits. Welcome news from Europe and additional quantitative easing in the United States by the Federal Reserve Board helped bolster the rally. The Standard & Poor's 500 Index (S&P 500 Index) rose 6.35% (total return) for the quarter. The Dow Jones Industrial Average advanced 4.32% for the same period. From the beginning of the calendar year through September 30, 2012, the S&P 500 Index was up 16.44% (total return). And, as of the end of September, the S&P 500 Index stood at 1,440 — approximately 8% below its all-time high of 1,565 that was set on October 9, 2007.
Outside the United States, stock markets of both developed and emerging market economies rebounded, as measured in U.S. dollars. Investors responded favorably to the announcement of policy measures aimed to resolve the eurozone crisis, which could potentially have a favorable impact on growth in emerging market economies. A weaker dollar also benefited returns to U.S. investors.
Solid gains for fixed income
Within fixed income, investors appeared to be increasingly willing to take on risk as they abandoned higher quality sectors that dominated the performance rankings in the second quarter and favored riskier sectors, where yield spreads tightened by a significant margin. Fixed-income returns were strong, but unlike equities, they have been less volatile, accumulating steadily over the course of the year. Gains were the highest for high-yield and emerging market bonds. By contrast, government issued debt securities eked out smaller gains.
Stay on track with Columbia Management
Backed by more than 100 years of experience, Columbia Management is one of the nation's largest asset managers. At the heart of our success — and, most importantly, that of our investors — are highly talented industry professionals, brought together by a unique way of working. We are dedicated to helping you take advantage of today's opportunities and anticipate tomorrow's. We stay abreast of the latest investment trends and ideas, using our collective insight to evaluate events and transform them into solutions you can use.
Visit columbiamanagement.com for:
> The Columbia Management Perspectives blog, featuring timely posts by our investment teams
> Detailed up-to-date fund performance and portfolio information
> Economic analysis and market commentary
> Quarterly fund commentaries
> Columbia Management Investor, our award-winning quarterly newsletter for shareholders
Thank you for your continued support of the Columbia Funds. We look forward to serving your investment needs for many years to come.
Best Regards,

J. Kevin Connaughton
President, Columbia Funds
The S&P 500 Index, an unmanaged index, measures the performance of 500 widely held, large-capitalization U.S. stocks and is frequently used as a general measure of market performance. The Dow Jones Industrial Average is a price weighted average of 30 actively traded shares of blue chip US industrial corporations listed on the New York Stock Exchange. Indices are not available for investment, are not professionally managed and do not reflect sales charges, fees, brokerage commissions, taxes or other expenses of investing.
Investors should consider the investment objectives, risks, charges and expenses of a mutual fund carefully before investing. For a free prospectus, which contains this and other important information about a fund, visit columbiamanagement.com. The prospectus should be read carefully before investing.
Columbia Funds are distributed by Columbia Management Investment Distributors, Inc., member FINRA, and managed by Columbia Management Investment Advisers, LLC.
© 2012 Columbia Management Investment Advisers, LLC. All rights reserved.
Columbia Massachusetts Intermediate Municipal Bond Fund
Performance Overview | | | 2 | | |
Manager Discussion of Fund Performance | | | 4 | | |
Understanding Your Fund's Expenses | | | 6 | | |
Portfolio of Investments | | | 7 | | |
Statement of Assets and Liabilities | | | 14 | | |
Statement of Operations | | | 16 | | |
Statement of Changes in Net Assets | | | 17 | | |
Financial Highlights | | | 19 | | |
Notes to Financial Statements | | | 24 | | |
Report of Independent Registered
Public Accounting Firm | | | 30 | | |
Federal Income Tax Information | | | 31 | | |
Trustees and Officers | | | 32 | | |
Board Consideration and Approval of Advisory Agreement | | | 35 | | |
Important Information About This Report | | | 41 | | |
Fund Investment Manager
Columbia Management Investment
Advisers, LLC
225 Franklin Street
Boston, MA 02110
Fund Distributor
Columbia Management Investment
Distributors, Inc.
225 Franklin Street
Boston, MA 02110
Fund Transfer Agent
Columbia Management Investment
Services Corp.
P.O. Box 8081
Boston, MA 02266-8081
For more information about any of the funds, please visit columbiamanagement.com or call 800.345.6611. Customer Service Representatives are available to answer your questions Monday through Friday from 8 a.m. to 8 p.m. Eastern time.
The views expressed in this report reflect the current views of the respective parties. These views are not guarantees of future performance and involve certain risks, uncertainties and assumptions that are difficult to predict, so actual outcomes and results may differ significantly from the views expressed. These views are subject to change at any time based upon economic, market or other conditions and the respective parties disclaim any responsibility to update such views. These views may not be relied on as investment advice and, because investment decisions for a Columbia Fund are based on numerous factors, may not be relied on as an indication of trading intent on behalf of any particular Columbia Fund. References to specific securities should not be construed as a recommendation or investment advice.
Columbia Massachusetts Intermediate Municipal Bond Fund
Performance Summary
> Columbia Massachusetts Intermediate Municipal Bond Fund (the Fund) Class A shares returned 6.69% excluding sales charges for the 12-month period that ended October 31, 2012.
> The Fund trailed its benchmark, the Barclays 3-15 Year Blend Municipal Bond Index, which returned 7.68% for the same time period.
> An underweight in bonds with maturities longer than 12 years and an overweight in bonds with very short maturities generally accounted for the shortfall relative to the benchmark. An emphasis on hospital and education bonds helped performance.
Average Annual Total Returns (%) (for period ended October 31, 2012)
| | Inception | | 1 Year | | 5 Years | | 10 Years | |
Class A* | | 12/09/02 | | | | | | | | | | | | | |
Excluding sales charges | | | | | | | 6.69 | | | | 5.20 | | | | 4.02 | | |
Including sales charges | | | | | | | 3.20 | | | | 4.50 | | | | 3.52 | | |
Class B* | | 12/09/02 | | | | | | | | | | | | | |
Excluding sales charges | | | | | | | 5.89 | | | | 4.41 | | | | 3.25 | | |
Including sales charges | | | | | | | 2.89 | | | | 4.41 | | | | 3.25 | | |
Class C* | | 12/09/02 | | | | | | | | | | | | | |
Excluding sales charges | | | | | | | 6.27 | | | | 4.78 | | | | 3.61 | | |
Including sales charges | | | | | | | 5.27 | | | | 4.78 | | | | 3.61 | | |
Class T | | 06/26/00 | | | | | | | | | | | | | |
Excluding sales charges | | | | | | | 6.80 | | | | 5.30 | | | | 4.13 | | |
Including sales charges | | | | | | | 1.69 | | | | 4.27 | | | | 3.62 | | |
Class Z | | 06/14/93 | | | 6.96 | | | | 5.46 | | | | 4.29 | | |
Barclays 3-15 Year Blend Municipal Bond Index | | | | | | | 7.68 | | | | 6.11 | | | | 5.05 | | |
Returns for Class A are shown with and without the maximum initial sales charge of 3.25% (for the one-year and five-year periods) and 4.75% (for the 10-year period). (Prior to August 22, 2005, new purchases of Class A shares had a maximum initial sales charge of 4.75%.) Returns for Class B are shown with and without the applicable contingent deferred sales charge (CDSC) of 3.00% in the first year, declining to 1.00% in the fourth year and eliminated thereafter. Returns for Class C are shown with and without the 1.00% CDSC for the first year only. Returns for Class T are shown with and without the maximum sales charge of 4.75%. The Fund's other classes are not subject to sales charges and have limited eligibility. Please see the Fund's prospectuses for details. Performance for different share classes will vary based on differences in sales charges and fees associated with each class. All results shown assume reinvestment of distributions during the period. Returns do not reflect the deduction of taxes that a shareholder may pay on Fund distributions or on the redemption of Fund shares. Performance results reflect the effect of any fee waivers or reimbursements of Fund expenses by Columbia Management Investment Advisers, LLC and/or any of its affiliates. Absent these fee waivers or expense reimbursement arrangements, performance results would have been lower.
The performance information shown represents past performance and is not a guarantee of future results. The investment return and principal value of your investment will fluctuate so that your shares, when redeemed, may be worth more or less than their original cost. Current performance may be lower or higher than the performance information shown. You may obtain performance information current to the most recent month-end by contacting your financial intermediary, visiting columbiamanagement.com or calling 800.345.6611.
*The returns shown for periods prior to the share class inception date (including returns since inception if shown, which are since Fund inception) include the returns of the Fund's oldest share class. These returns are adjusted to reflect any higher class-related operating expenses of the newer share classes, as applicable. Please visit columbiamanagement.com/mutual-funds/appended-performance for more information.
The Barclays 3-15 Year Blend Municipal Bond Index is an unmanaged index that tracks the performance of municipal bonds issued after December 31, 1990, with remaining maturities between 2 and 17 years and at least $7 million in principal amount outstanding.
Indices are not available for investment, are not professionally managed and do not reflect sales charges, fees, brokerage commissions, taxes or other expenses of investing. Securities in the Fund may not match those in an index.
Annual Report 2012
2
Columbia Massachusetts Intermediate Municipal Bond Fund
Performance Overview (continued)
Performance of a Hypothetical $10,000 Investment (November 1, 2002 – October 31, 2012)
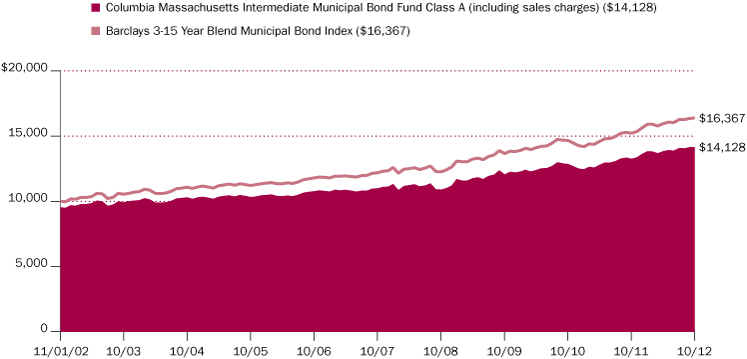
The chart above shows the change in value of a hypothetical $10,000 investment in Class A shares of Columbia Massachusetts Intermediate Municipal Bond Fund during the stated time period, and does not reflect the deduction of taxes that a shareholder may pay on Fund distributions or on the redemption of Fund shares. The performance of a $10,000 investment with sales charge for Class A shares is calculated with an initial sales charge of 4.75%, which was the effective sales charge prior to August 22, 2005.
Annual Report 2012
3
Columbia Massachusetts Intermediate Municipal Bond Fund
Manager Discussion of Fund Performance
For the 12-month period that ended October 31, 2012, the Fund's Class A shares returned 6.69% excluding sales charges. By comparison, the Fund's benchmark, the Barclays 3-15 Year Blend Municipal Bond Index, which is national in scope, returned 7.68%. An underweight in bonds with maturities of 12 years or longer and a corresponding overweight in bonds with very short maturities held back results in a year when longer maturities tended to outperform. The larger-than-benchmark allocation to hospital and education bonds helped performance.
Strong Demand for Massachusetts Municipals
The Massachusetts economy has held up better in the economic downturn than the nation as a whole, although growth stagnated in the latter half of 2012 after a brisk start to the year. Nevertheless, unemployment remains below the national average and the Commonwealth remains in better shape than the national economy. Stabilization of employment in the financial services industry has helped, while the software and biotechnology industries have emerged as the fastest-growing segments in the economy. Manufacturing activity has struggled, however, and restricted spending by local governments has been a constraint on growth. Massachusetts government finances steadily improved over the year.
Investors' appetite for tax-advantaged municipal bonds often outstripped supply in Massachusetts, where the Commonwealth's debt rating stood at Aa1 by Moody's and AA+ by Standard & Poor's. The strong demand was consistent with national trends in a period in which municipal mutual funds received positive inflows of new investor money. At the same time that new money was entering the market, many cities, towns and agencies saw an opportunity to call back older bonds paying relatively higher yields and replace them with newer, lower-cost bond issues. As a consequence, the holders of currently callable bonds saw their existing higher-yielding investments being called back. In this environment, new issues that offered relatively higher yields were in particularly strong demand, which created a challenging situation for investors who tried to maintain diversification, relative value and sound fundamentals in their portfolios. Against a backdrop of generally low interest rates, investors sought the additional income offered by lower-rated issues, which led to strong total return performance from A and BBB rated securities compared to AAA rated bonds.
Shorter Maturity Holdings Detracted from Relative Return
The Fund's positioning in securities with maturities of two years or less detracted from relative performance, as the low-yields available in these very short securities contributed very little to total return. During a period in which longer-maturity bonds tended to outperform, an underweight in securities with maturities of 12+ years also handicapped relative performance. We modestly increased duration over the 12-month period to take advantage of falling interest rates and rising prices in longer-maturity securities. (Duration is a measure of price-sensitivity to changes in interest rates.)
Hospital, Education Bonds Helped Results
We emphasized sectors that we believed offered good relative value, notably hospital and education bonds, which were strong performers during the 12 months and helped relative results. The hospital and education sectors also
Portfolio Management
Brian McGreevy
Paul Fuchs, CFA
Paul Fuchs joined Brian McGreevy as a Portfolio Manager of the Fund in January 2012.
Quality Breakdown (%)
(at October 31, 2012) | |
AAA rating | | | 6.1 | | |
AA rating | | | 61.3 | | |
A rating | | | 19.2 | | |
BBB rating | | | 11.7 | | |
Not rated | | | 1.7 | | |
Total | | | 100.0 | | |
Percentages indicated are based upon total fixed income securities (excluding Money Market Funds).
Bond ratings apply to the underlying holdings of the Fund and not the Fund itself and are divided into categories ranging from AAA (highest) to D (lowest), and are subject to change. The ratings shown are determined by using the middle rating of Moody's, S&P, and Fitch after dropping the highest and lowest available ratings. When a rating from only two agencies is available, the lower rating is used. When a rating from only one agency is available, that rating is used. When a bond is not rated by any of these agencies, it is designated as Not rated. Credit ratings are subjective opinions and not statements of fact.
Annual Report 2012
4
Columbia Massachusetts Intermediate Municipal Bond Fund
Manager Discussion of Fund Performance (continued)
provided the Fund with opportunity to invest in better-yielding A and BBB rated securities, which are scarcer in Massachusetts than in the national market.
Looking Ahead
We currently intend to continue to look for opportunities to reduce the Fund's exposure to very short maturities and increase the weight of bonds with maturities of 12 years or longer. In addition, when possible, we intend to add A and BBB rated issues when we believe they offer additional yield, relative value and good fundamentals.
Annual Report 2012
5
Columbia Massachusetts Intermediate Municipal Bond Fund
Understanding Your Fund's Expenses
(Unaudited)
As an investor, you incur two types of costs. There are transaction costs, which generally include sales charges on purchases and may include redemption fees. There are also ongoing costs, which generally include management fees, distribution and service (Rule 12b-1) fees, and other fund expenses. The following information is intended to help you understand your ongoing costs (in dollars) of investing in the Fund and to help you compare these costs with the ongoing costs of investing in other mutual funds.
Analyzing Your Fund's Expenses
To illustrate these ongoing costs, we have provided examples and calculated the expenses paid by investors in each share class of the Fund during the period. The actual and hypothetical information in the table is based on an initial investment of $1,000 at the beginning of the period indicated and held for the entire period. Expense information is calculated two ways and each method provides you with different information. The amount listed in the "Actual" column is calculated using the Fund's actual operating expenses and total return for the period. You may use the Actual information, together with the amount invested, to estimate the expenses that you paid over the period. Simply divide your account value by $1,000 (for example, an $8,600 account value divided by $1,000 = 8.6), then multiply the results by the expenses paid during the period under the Actual column. The amount listed in the "Hypothetical" column assumes a 5% annual rate of return before expenses (which is not the Fund's actual return) and then applies the Fund's actual expense ratio for the period to the hypothetical return. You should not use the hypothetical account values and expenses to estimate either your actual account balance at the end of the period or the expenses you paid during the period. See "Compare With Other Funds" below for details on how to use the hypothetical data.
Compare With Other Funds
Since all mutual funds are required to include the same hypothetical calculations about expenses in shareholder reports, you can use this information to compare the ongoing cost of investing in the Fund with other funds. To do so, compare the hypothetical example with the 5% hypothetical examples that appear in the shareholder reports of other funds. As you compare hypothetical examples of other funds, it is important to note that hypothetical examples are meant to highlight the ongoing costs of investing in a fund only and do not reflect any transaction costs, such as sales charges, or redemption or exchange fees. Therefore, the hypothetical calculations are useful in comparing ongoing costs only, and will not help you determine the relative total costs of owning different funds. If transaction costs were included in these calculations, your costs would be higher.
May 1, 2012 – October 31, 2012
| | Account Value at the Beginning
of the Period ($) | | Account Value at the End of the
Period ($) | | Expenses Paid During the
Period ($) | | Fund's Annualized
Expense Ratio (%) | |
| | Actual | | Hypothetical | | Actual | | Hypothetical | | Actual | | Hypothetical | | Actual | |
Class A | | | 1,000.00 | | | | 1,000.00 | | | | 1,022.60 | | | | 1,021.37 | | | | 3.81 | | | | 3.81 | | | | 0.75 | | |
Class B | | | 1,000.00 | | | | 1,000.00 | | | | 1,018.70 | | | | 1,017.60 | | | | 7.61 | | | | 7.61 | | | | 1.50 | | |
Class C | | | 1,000.00 | | | | 1,000.00 | | | | 1,020.60 | | | | 1,019.36 | | | | 5.84 | | | | 5.84 | | | | 1.15 | | |
Class T | | | 1,000.00 | | | | 1,000.00 | | | | 1,023.10 | | | | 1,021.87 | | | | 3.31 | | | | 3.30 | | | | 0.65 | | |
Class Z | | | 1,000.00 | | | | 1,000.00 | | | | 1,023.90 | | | | 1,022.62 | | | | 2.54 | | | | 2.54 | | | | 0.50 | | |
Expenses paid during the period are equal to the annualized expense ratio for each class as indicated above, multiplied by the average account value over the period and then multiplied by the number of days in the Fund's most recent fiscal half year and divided by 366.
Expenses do not include fees and expenses incurred indirectly by the Fund from the underlying funds in which the Fund may invest (also referred to as "acquired funds"), including affiliated and non-affiliated pooled investment vehicles (including mutual funds and exchange-traded funds).
Had Columbia Management Investment Advisers, LLC and/or certain of its affiliates not waived/reimbursed certain fees and expenses, account value at the end of the period would have been reduced.
Annual Report 2012
6
Columbia Massachusetts Intermediate Municipal Bond Fund
Portfolio of Investments
October 31, 2012
(Percentages represent value of investments compared to net assets)
Municipal Bonds 97.3%
Issue
Description | | Coupon
Rate | | Principal
Amount ($) | | Value ($) | |
Airport 2.4% | |
Massachusetts Port Authority
Refunding Revenue Bonds
Passenger Facility Charge
Series 2007D (AGM)
07/01/17 | | | 5.000 | % | | | 3,000,000 | | | | 3,510,660 | | |
Revenue Bonds
Series 2005C (AMBAC)
07/01/15 | | | 5.000 | % | | | 1,500,000 | | | | 1,675,605 | | |
07/01/22 | | | 5.000 | % | | | 3,500,000 | | | | 3,899,385 | | |
Total | | | | | | | 9,085,650 | | |
Assisted Living 0.5% | |
Massachusetts Development Finance Agency
Refunding Revenue Bonds
1st Mortgage VOA Concord
Series 2007
11/01/17 | | | 5.000 | % | | | 540,000 | | | | 559,057 | | |
11/01/27 | | | 5.125 | % | | | 1,500,000 | | | | 1,486,065 | | |
Total | | | | | | | 2,045,122 | | |
Higher Education 18.6% | |
Massachusetts Development Finance Agency
Revenue Bonds
Boston College
Series 2007P
07/01/20 | | | 5.000 | % | | | 3,260,000 | | | | 3,815,145 | | |
Boston University
Series 2009V-2
10/01/14 | | | 2.875 | % | | | 3,000,000 | | | | 3,131,760 | | |
Brandeis University
Series 2010O-2
10/01/24 | | | 5.000 | % | | | 5,000,000 | | | | 5,782,450 | | |
Emerson College
Series 2006A
01/01/20 | | | 5.000 | % | | | 870,000 | | | | 961,698 | | |
01/01/21 | | | 5.000 | % | | | 2,500,000 | | | | 2,742,650 | | |
01/01/23 | | | 5.000 | % | | | 1,000,000 | | | | 1,081,410 | | |
Hampshire College
Series 2004
10/01/14 | | | 5.150 | % | | | 85,000 | | | | 87,610 | | |
Merrimack College
Series 2012A
07/01/27 | | | 5.000 | % | | | 1,075,000 | | | | 1,182,156 | | |
Mount Holyoke College
Series 2008
07/01/23 | | | 5.000 | % | | | 1,285,000 | | | | 1,523,021 | | |
Wheelock College
Series 2007C
10/01/17 | | | 5.000 | % | | | 1,100,000 | | | | 1,243,319 | | |
Worcester Polytechnic Institute
Series 2007 (NPFGC)
09/01/22 | | | 5.000 | % | | | 1,710,000 | | | | 1,917,782 | | |
Municipal Bonds (continued)
Issue
Description | | Coupon
Rate | | Principal
Amount ($) | | Value ($) | |
Massachusetts Health & Educational Facilities Authority
Revenue Bonds
Berklee College of Music
Series 2007A
10/01/32 | | | 5.000 | % | | | 2,440,000 | | | | 2,715,622 | | |
Boston College
Series 2003N
06/01/15 | | | 5.250 | % | | | 1,000,000 | | | | 1,028,940 | | |
Series 2008M-1
06/01/24 | | | 5.500 | % | | | 3,000,000 | | | | 3,905,790 | | |
Massachusetts Institute of Technology
Series 2002K
07/01/17 | | | 5.375 | % | | | 2,275,000 | | | | 2,770,677 | | |
07/01/22 | | | 5.500 | % | | | 1,000,000 | | | | 1,344,290 | | |
Series 2004M
07/01/19 | | | 5.250 | % | | | 610,000 | | | | 777,256 | | |
Northeastern University
Series 2008T-1
10/01/28 | | | 5.000 | % | | | 1,750,000 | | | | 2,071,335 | | |
Series 2008T-2
10/01/29 | | | 5.000 | % | | | 4,045,000 | | | | 4,749,558 | | |
Series 2010A
10/01/13 | | | 5.000 | % | | | 1,040,000 | | | | 1,082,526 | | |
Simmons College
Series 2009I
10/01/18 | | | 6.750 | % | | | 1,365,000 | | | | 1,715,518 | | |
Suffolk University
Series 2009A
07/01/24 | | | 6.000 | % | | | 2,100,000 | | | | 2,475,249 | | |
Tufts University
Series 2002J
08/15/16 | | | 5.500 | % | | | 1,500,000 | | | | 1,767,210 | | |
Series 2008
08/15/14 | | | 5.000 | % | | | 1,250,000 | | | | 1,351,925 | | |
08/15/17 | | | 5.000 | % | | | 1,145,000 | | | | 1,365,458 | | |
Wellesley College
Series 2003
07/01/15 | | | 5.000 | % | | | 610,000 | | | | 629,264 | | |
Williams College
Series 2003H
07/01/16 | | | 5.000 | % | | | 1,740,000 | | | | 1,794,236 | | |
Massachusetts Health & Educational Facilities Authority(a)
Revenue Bonds
Northeastern University
Series 2008T-3
10/01/37 | | | 2.700 | % | | | 2,500,000 | | | | 2,563,600 | | |
Massachusetts Industrial Finance Agency
Revenue Bonds
Tufts University
Series 1998H (NPFGC)
02/15/13 | | | 5.500 | % | | | 1,830,000 | | | | 1,857,468 | | |
Massachusetts State College Building Authority
Revenue Bonds
Series 2012A
05/01/29 | | | 5.000 | % | | | 3,000,000 | | | | 3,597,030 | | |
The accompanying Notes to Financial Statements are an integral part of this statement.
Annual Report 2012
7
Columbia Massachusetts Intermediate Municipal Bond Fund
Portfolio of Investments (continued)
October 31, 2012
Municipal Bonds (continued)
Issue
Description | | Coupon
Rate | | Principal
Amount ($) | | Value ($) | |
University of Massachusetts Building Authority
Revenue Bonds
Senior Series 2008-2 (AGM)
05/01/21 | | | 5.000 | % | | | 1,510,000 | | | | 1,783,929 | | |
Senior Series 2009-1
05/01/23 | | | 5.000 | % | | | 5,000,000 | | | | 5,922,400 | | |
Total | | | | | | | 70,738,282 | | |
Hospital 8.5% | |
Massachusetts Development Finance Agency
Revenue Bonds
Berkshire Health System
Series 2012G
10/01/26 | | | 5.000 | % | | | 1,200,000 | | | | 1,358,424 | | |
Boston Medical Center
Series 2012C
07/01/27 | | | 5.250 | % | | | 3,695,000 | | | | 4,174,352 | | |
UMASS Memorial Issue
Series 2011H
07/01/26 | | | 5.125 | % | | | 2,000,000 | | | | 2,231,560 | | |
Massachusetts Health & Educational Facilities Authority
Revenue Bonds
Caregroup
Series 1998B-2 (NPFGC)
02/01/27 | | | 5.375 | % | | | 1,585,000 | | | | 1,793,935 | | |
Series 2004D (NPFGC)
07/01/22 | | | 5.250 | % | | | 1,000,000 | | | | 1,135,670 | | |
Series 2008E-2
07/01/19 | | | 5.375 | % | | | 4,675,000 | | | | 5,521,736 | | |
Milford Regional Medical
Series 2007E
07/15/17 | | | 5.000 | % | | | 1,050,000 | | | | 1,131,291 | | |
07/15/22 | | | 5.000 | % | | | 1,500,000 | | | | 1,571,610 | | |
Partners Healthcare
Series 2003E
07/01/15 | | | 5.000 | % | | | 1,140,000 | | | | 1,174,098 | | |
Series 2010J-2
07/01/22 | | | 5.000 | % | | | 5,000,000 | | | | 5,861,950 | | |
Partners Healthcare System
Series 2005F | |
07/01/17 | | | 5.000 | % | | | 2,000,000 | | | | 2,215,280 | | |
Series 2007G
07/01/18 | | | 5.000 | % | | | 2,575,000 | | | | 3,021,608 | | |
UMASS Memorial Issue
Series 1998A (AMBAC)
07/01/14 | | | 5.250 | % | | | 975,000 | | | | 977,652 | | |
Total | | | | | | | 32,169,166 | | |
Human Service Provider 0.4% | |
Massachusetts Development Finance Agency
Revenue Bonds
Evergreen Center, Inc.
Series 2005
01/01/20 | | | 5.500 | % | | | 1,355,000 | | | | 1,398,699 | | |
Municipal Bonds (continued)
Issue
Description | | Coupon
Rate | | Principal
Amount ($) | | Value ($) | |
Investor Owned 1.7% | |
Massachusetts Development Finance Agency(a)
Refunding Revenue Bonds
Dominion Energy Brayton 1
Series 2009
12/01/42 | | | 5.750 | % | | | 3,460,000 | | | | 4,240,645 | | |
Revenue Bonds
Dominion Energy Brayton
Series 2010A
12/01/41 | | | 2.250 | % | | | 2,260,000 | | | | 2,314,105 | | |
Total | | | | | | | 6,554,750 | | |
Joint Power Authority 3.2% | |
Berkshire Wind Power Cooperative Corp.
Revenue Bonds
Series 2010-1
07/01/24 | | | 5.250 | % | | | 3,785,000 | | | | 4,242,228 | | |
07/01/25 | | | 5.000 | % | | | 2,000,000 | | | | 2,193,280 | | |
Massachusetts Municipal Wholesale Electric Co.
Revenue Bonds
Project 6
Series 2012A
07/01/16 | | | 5.000 | % | | | 2,000,000 | | | | 2,291,580 | | |
Project No. 6
Series 2011
07/01/19 | | | 5.000 | % | | | 2,760,000 | | | | 3,270,572 | | |
Total | | | | | | | 11,997,660 | | |
Local General Obligation 7.9% | |
Boston Metropolitan District
Unlimited General Obligation Refunding Bonds
Series 2002A
12/01/14 | | | 5.250 | % | | | 2,010,000 | | | | 2,018,362 | | |
City of Boston
Unlimited General Obligation Bonds
Series 2012A
04/01/24 | | | 4.000 | % | | | 2,150,000 | | | | 2,520,896 | | |
Unlimited General Obligation Refunding Bonds
Series 2004A
01/01/14 | | | 5.000 | % | | | 1,000,000 | | | | 1,055,300 | | |
City of Fall River
Limited General Obligation Refunding Bonds
State Qualified
Series 2012
03/01/20 | | | 4.000 | % | | | 2,295,000 | | | | 2,616,438 | | |
03/01/21 | | | 4.000 | % | | | 335,000 | | | | 380,329 | | |
City of Lawrence
Limited General Obligation Refunding Bonds
State Qualified
Series 2006 (AGM)
02/01/18 | | | 5.000 | % | | | 1,500,000 | | | | 1,755,150 | | |
The accompanying Notes to Financial Statements are an integral part of this statement.
Annual Report 2012
8
Columbia Massachusetts Intermediate Municipal Bond Fund
Portfolio of Investments (continued)
October 31, 2012
Municipal Bonds (continued)
Issue
Description | | Coupon
Rate | | Principal
Amount ($) | | Value ($) | |
City of Springfield
Limited General Obligation Bonds
State Qualified Municipal Purpose Loan
Series 2003 (AGM)
08/01/21 | | | 4.500 | % | | | 2,000,000 | | | | 2,241,940 | | |
City of Worcester
Limited General Obligation Bonds
Series 2004A (NPFGC)
08/15/13 | | | 5.250 | % | | | 2,810,000 | | | | 2,914,869 | | |
Dudley Charlton Regional School District
Unlimited General Obligation Bonds
Series 1999A (NPFGC/FGIC)
06/15/14 | | | 5.125 | % | | | 2,305,000 | | | | 2,468,724 | | |
Puerto Rico Municipal Finance Agency
Unrefunded Revenue Bonds
Series 1997A (AGM)(b)
07/01/17 | | | 5.500 | % | | | 245,000 | | | | 245,784 | | |
Town of Hopedale
Limited General Obligation Refunding Bonds
Series 2004 (AMBAC)
11/15/17 | | | 5.000 | % | | | 1,000,000 | | | | 1,087,950 | | |
Town of North Reading
Limited General Obligation Bonds
Muni Purpose Loan
Series 2012
05/15/28 | | | 4.000 | % | | | 2,130,000 | | | | 2,353,927 | | |
Town of Sandwich
Unlimited General Obligation Refunding Bonds
Series 2005 (NPFGC)
07/15/18 | | | 5.000 | % | | | 1,575,000 | | | | 1,768,599 | | |
Town of Tewksbury
Unlimited General Obligation Bonds
Muni Purpose Loan
Series 2011
04/15/19 | | | 4.000 | % | | | 1,000,000 | | | | 1,162,630 | | |
04/15/20 | | | 4.000 | % | | | 1,675,000 | | | | 1,953,485 | | |
04/15/21 | | | 4.000 | % | | | 1,050,000 | | | | 1,204,056 | | |
04/15/22 | | | 4.000 | % | | | 880,000 | | | | 998,536 | | |
Town of Westborough
Unlimited General Obligation Bonds
Series 2003
11/15/16 | | | 5.000 | % | | | 1,000,000 | | | | 1,046,420 | | |
Total | | | | | | | 29,793,395 | | |
Municipal Power 0.9% | |
Guam Power Authority
Refunding Revenue Bonds
Series 2012A (AGM)(b)
10/01/24 | | | 5.000 | % | | | 630,000 | | | | 722,232 | | |
Municipal Bonds (continued)
Issue
Description | | Coupon
Rate | | Principal
Amount ($) | | Value ($) | |
Puerto Rico Electric Power Authority
Revenue Bonds
Series 2002LL (NPFGC)(b)
07/01/17 | | | 5.500 | % | | | 2,400,000 | | | | 2,711,880 | | |
Total | | | | | | | 3,434,112 | | |
Other Bond Issue 2.3% | |
Boston Housing Authority
Revenue Bonds
Series 2008 (AGM)
04/01/20 | | | 5.000 | % | | | 2,135,000 | | | | 2,431,060 | | |
04/01/23 | | | 5.000 | % | | | 1,865,000 | | | | 2,068,378 | | |
04/01/24 | | | 5.000 | % | | | 3,260,000 | | | | 3,592,227 | | |
Massachusetts Development Finance Agency
Revenue Bonds
Jewish Philanthropies
Series 2002A
02/01/22 | | | 5.250 | % | | | 450,000 | | | | 454,923 | | |
Total | | | | | | | 8,546,588 | | |
Pool/Bond Bank 4.4% | |
Massachusetts Water Pollution Abatement Trust (The)
Refunding Revenue Bonds
Pool Program
Series 2004A
08/01/15 | | | 5.250 | % | | | 3,000,000 | | | | 3,400,470 | | |
Series 2006
08/01/20 | | | 5.250 | % | | | 3,000,000 | | | | 3,871,500 | | |
Revenue Bonds
Pool Program
Series 2005-11
08/01/19 | | | 5.250 | % | | | 4,465,000 | | | | 5,700,064 | | |
State Revolving Fund
Series 2009-14
08/01/24 | | | 5.000 | % | | | 3,100,000 | | | | 3,802,894 | | |
Total | | | | | | | 16,774,928 | | |
Prep School 1.6% | |
Massachusetts Development Finance Agency
Revenue Bonds
Foxborough Regional Charter School
Series 2010A
07/01/30 | | | 6.375 | % | | | 3,150,000 | | | | 3,603,789 | | |
Noble & Greenough School
Series 2011
04/01/21 | | | 4.000 | % | | | 1,500,000 | | | | 1,741,755 | | |
Park School
Series 2012
09/01/20 | | | 5.000 | % | | | 150,000 | | | | 178,006 | | |
09/01/21 | | | 5.000 | % | | | 330,000 | | | | 391,466 | | |
Total | | | | | | | 5,915,016 | | |
The accompanying Notes to Financial Statements are an integral part of this statement.
Annual Report 2012
9
Columbia Massachusetts Intermediate Municipal Bond Fund
Portfolio of Investments (continued)
October 31, 2012
Municipal Bonds (continued)
Issue
Description | | Coupon
Rate | | Principal
Amount ($) | | Value ($) | |
Refunded/Escrowed 7.4% | |
City of Springfield
Prerefunded 01/15/13 Limited General Obligation Bonds
State Qualified
Series 2003 (NPFGC)
01/15/15 | | | 5.250 | % | | | 1,500,000 | | | | 1,515,555 | | |
Commonwealth of Massachusetts
Prerefunded 01/01/13 Limited General Obligation Bonds
Consolidated Loan
Series 2002E (AGM)
01/01/18 | | | 5.250 | % | | | 2,000,000 | | | | 2,016,380 | | |
Prerefunded 08/01/14 Limited General Obligation Bonds
Consolidated Loan
Series 2004B (AMBAC)
08/01/22 | | | 5.000 | % | | | 2,000,000 | | | | 2,158,180 | | |
Commonwealth of Massachusetts(c)
Revenue Bonds
Capital Appreciation-Federal Highway
Series 1998A Escrowed to Maturity
06/15/15 | | | 0.000 | % | | | 4,000,000 | | | | 3,934,560 | | |
Massachusetts Development Finance Agency
Prerefunded 07/01/13 Revenue Bonds
Pharmacy & Allied Health Sciences
Series 2003
07/01/23 | | | 6.375 | % | | | 1,000,000 | | | | 1,050,610 | | |
Massachusetts Health & Educational Facilities Authority
Prerefunded 10/01/13 Revenue Bonds
Simmons College
Series 2003F (FGIC)
10/01/15 | | | 5.000 | % | | | 1,015,000 | | | | 1,059,112 | | |
Massachusetts School Building Authority
Prerefunded 08/15/15 Revenue Bonds
Series 2005A (AGM)
08/15/26 | | | 5.000 | % | | | 5,000,000 | | | | 5,637,600 | | |
Massachusetts State College Building Authority
Revenue Bonds
Capital Appreciation
Senior Series 1999A Escrowed to Maturity (NPFGC)(c)
05/01/28 | | | 0.000 | % | | | 4,000,000 | | | | 2,615,400 | | |
Massachusetts Water Resources Authority
Refunding Revenue Bonds
General
Series 1998B Escrowed to Maturity (AGM/TCRS)
08/01/15 | | | 5.500 | % | | | 1,165,000 | | | | 1,327,494 | | |
Revenue Bonds
General
Series 2002J Escrowed to Maturity (AGM/TCRS)
08/01/15 | | | 5.250 | % | | | 3,000,000 | | | | 3,399,720 | | |
Puerto Rico Highway & Transportation Authority
Prerefunded Revenue Bonds
Series 2005BB (AGM) Escrowed to Maturity(b)
07/01/22 | | | 5.250 | % | | | 1,075,000 | | | | 1,391,652 | | |
Municipal Bonds (continued)
Issue
Description | | Coupon
Rate | | Principal
Amount ($) | | Value ($) | |
University of Massachusetts Building Authority
Prerefunded 11/01/13 Revenue Bonds
Senior Series 2003-1 (AMBAC)
11/01/15 | | | 5.250 | % | | | 2,000,000 | | | | 2,097,120 | | |
Total | | | | | | | 28,203,383 | | |
Retirement Communities 0.4% | |
Massachusetts Development Finance Agency
Revenue Bonds
1st Mortgage-Orchard Cove
Series 2007
10/01/17 | | | 5.000 | % | | | 1,030,000 | | | | 1,075,526 | | |
10/01/18 | | | 5.000 | % | | | 515,000 | | | | 533,808 | | |
Total | | | | | | | 1,609,334 | | |
Single Family 0.3% | |
Massachusetts Housing Finance Agency
Revenue Bonds
Single Family
Series 2009-143
12/01/24 | | | 5.000 | % | | | 1,000,000 | | | | 1,116,120 | | |
Special Non Property Tax 9.7% | |
Commonwealth of Massachusetts
Revenue Bonds
Consolidated Loan
Series 1997A
06/01/13 | | | 5.500 | % | | | 1,000,000 | | | | 1,030,740 | | |
Series 2004 (NPFGC/FGIC)
01/01/19 | | | 5.250 | % | | | 750,000 | | | | 898,913 | | |
Massachusetts Bay Transportation Authority
Revenue Bonds
Senior Series 2003A
07/01/17 | | | 5.250 | % | | | 1,000,000 | | | | 1,205,990 | | |
07/01/19 | | | 5.250 | % | | | 625,000 | | | | 789,463 | | |
Senior Series 2004C
07/01/18 | | | 5.250 | % | | | 1,000,000 | | | | 1,239,180 | | |
Senior Series 2005B (NPFGC)
07/01/23 | | | 5.500 | % | | | 2,890,000 | | | | 3,832,747 | | |
Senior Series 2006A
07/01/22 | | | 5.250 | % | | | 3,500,000 | | | | 4,523,785 | | |
Senior Series 2008B
07/01/23 | | | 5.000 | % | | | 910,000 | | | | 1,163,517 | | |
Massachusetts School Building Authority
Refunding Revenue Bonds
Senior Series 2012A
08/15/26 | | | 5.000 | % | | | 4,000,000 | | | | 4,945,640 | | |
Revenue Bonds
Series 2007A (AMBAC)
08/15/18 | | | 5.000 | % | | | 5,000,000 | | | | 5,952,350 | | |
Senior Revenue Bonds
Series 2011B
10/15/27 | | | 5.000 | % | | | 4,000,000 | | | | 4,863,080 | | |
The accompanying Notes to Financial Statements are an integral part of this statement.
Annual Report 2012
10
Columbia Massachusetts Intermediate Municipal Bond Fund
Portfolio of Investments (continued)
October 31, 2012
Municipal Bonds (continued)
Issue
Description | | Coupon
Rate | | Principal
Amount ($) | | Value ($) | |
Puerto Rico Highway & Transportation Authority
Refunding Revenue Bonds
Series 2005BB (AGM)(b)
07/01/22 | | | 5.250 | % | | | 1,925,000 | | | | 2,228,303 | | |
Territory of Guam
Revenue Bonds
Series 2011A(b)
01/01/31 | | | 5.000 | % | | | 950,000 | | | | 1,067,220 | | |
Virgin Islands Public Finance Authority
Revenue Bonds
Senior Lien-Matching Fund Loan Note
Series 2010A(b)
10/01/25 | | | 5.000 | % | | | 2,755,000 | | | | 3,074,304 | | |
Total | | | | | | | 36,815,232 | | |
Special Property Tax 1.2% | |
Metropolitan Boston Transit Parking Corp.
Revenue Bonds
Series 2011
07/01/25 | | | 5.000 | % | | | 3,210,000 | | | | 3,802,887 | | |
07/01/27 | | | 5.000 | % | | | 775,000 | | | | 903,425 | | |
Total | | | | | | | 4,706,312 | | |
State Appropriated 1.0% | |
Massachusetts Development Finance Agency
Revenue Bonds
Visual & Performing Arts Project
Series 2000
08/01/13 | | | 5.750 | % | | | 1,030,000 | | | | 1,071,210 | | |
08/01/17 | | | 6.000 | % | | | 540,000 | | | | 658,924 | | |
08/01/21 | | | 6.000 | % | | | 1,750,000 | | | | 2,167,183 | | |
Total | | | | | | | 3,897,317 | | |
State General Obligation 14.7% | |
Commonwealth of Massachusetts
Limited General Obligation Bonds
Consolidated Loan
Series 2002C
11/01/17 | | | 5.500 | % | | | 1,500,000 | | | | 1,842,375 | | |
Series 2002D (AMBAC/TCRS/BNY)
08/01/18 | | | 5.500 | % | | | 3,500,000 | | | | 4,384,590 | | |
Series 2008A
08/01/16 | | | 5.000 | % | | | 2,000,000 | | | | 2,326,740 | | |
Limited General Obligation Refunding Bonds
Series 2003D
10/01/17 | | | 5.500 | % | | | 5,000,000 | | | | 6,125,300 | | |
Series 2003D (AMBAC)
10/01/19 | | | 5.500 | % | | | 5,000,000 | | | | 6,409,500 | | |
Series 2003D (NPFGC)
10/01/20 | | | 5.500 | % | | | 2,500,000 | | | | 3,243,250 | | |
Municipal Bonds (continued)
Issue
Description | | Coupon
Rate | | Principal
Amount ($) | | Value ($) | |
Series 2004B
08/01/20 | | | 5.250 | % | | | 3,000,000 | | | | 3,825,810 | | |
Series 2006B (AGM)
09/01/22 | | | 5.250 | % | | | 4,000,000 | | | | 5,182,720 | | |
Unlimited General Obligation Refunding Bonds
Series 2003D (AGM)
10/01/19 | | | 5.500 | % | | | 3,500,000 | | | | 4,486,650 | | |
Series 2004C (AMBAC)
12/01/24 | | | 5.500 | % | | | 5,000,000 | | | | 6,692,500 | | |
Series 2004C (NPFGC)
12/01/19 | | | 5.500 | % | | | 3,795,000 | | | | 4,882,533 | | |
Series 2008A
09/01/15 | | | 5.000 | % | | | 3,000,000 | | | | 3,381,420 | | |
Commonwealth of Massachusetts(a)
Unlimited General Obligation Bonds
Series 2010A
02/01/14 | | | 0.740 | % | | | 3,000,000 | | | | 3,001,110 | | |
Total | | | | | | | 55,784,498 | | |
Student Loan 2.4% | |
Massachusetts Educational Financing Authority
Revenue Bonds
Issue I
Series 2010A
01/01/22 | | | 5.500 | % | | | 4,625,000 | | | | 5,407,689 | | |
Series 2009I
01/01/18 | | | 5.125 | % | | | 3,310,000 | | | | 3,820,534 | | |
Total | | | | | | | 9,228,223 | | |
Transportation 0.3% | |
Woods Hole Marthas Vineyard & Nantucket Steamship Authority
Revenue Bonds
Series 2004B
03/01/18 | | | 5.000 | % | | | 975,000 | | | | 1,069,273 | | |
Turnpike/Bridge/Toll Road 0.7% | |
Massachusetts Department of Transportation
Revenue Bonds
Senior Series 2010B
01/01/22 | | | 5.000 | % | | | 2,180,000 | | | | 2,569,937 | | |
Water & Sewer 6.8% | |
Massachusetts Water Resources Authority
Refunding Revenue Bonds
General
Series 2005A (NPFGC/TCRS)
08/01/17 | | | 5.250 | % | | | 6,000,000 | | | | 7,226,400 | | |
Series 2007B (AGM/TCRS)
08/01/23 | | | 5.250 | % | | | 5,500,000 | | | | 7,140,320 | | |
Series 2012B
08/01/28 | | | 5.000 | % | | | 5,000,000 | | | | 6,128,850 | | |
The accompanying Notes to Financial Statements are an integral part of this statement.
Annual Report 2012
11
Columbia Massachusetts Intermediate Municipal Bond Fund
Portfolio of Investments (continued)
October 31, 2012
Municipal Bonds (continued)
Issue
Description | | Coupon
Rate | | Principal
Amount ($) | | Value ($) | |
Revenue Bonds
General
Series 2002J (AGM/TCRS)
08/01/14 | | | 5.250 | % | | | 2,870,000 | | | | 3,112,113 | | |
08/01/18 | | | 5.250 | % | | | 1,000,000 | | | | 1,236,270 | | |
Puerto Rico Commonwealth Aqueduct & Sewer Authority
Revenue Bonds
Senior Lien
Series 2008A (AGM)(b)
07/01/16 | | | 5.000 | % | | | 1,000,000 | | | | 1,106,840 | | |
Total | | | | | | | 25,950,793 | | |
Total Municipal Bonds
(Cost: $332,492,908) | | | | | | | 369,403,790 | | |
Money Market Funds 1.6%
| | | Shares | | Value ($) | |
Dreyfus Massachusetts Municipal
Money Market Fund, 0.000%(d) | | | 2,627,238 | | | | 2,627,238 | | |
JPMorgan Tax Free Money Market
Fund, 0.000%(d) | | | 3,326,500 | | | | 3,326,500 | | |
Total Money Market Funds
(Cost: $5,953,738) | | | | | 5,953,738 | | |
Total Investments
(Cost: $338,446,646) | | | | | 375,357,528 | | |
Other Assets & Liabilities, Net | | | | | 4,337,736 | | |
Net Assets | | | | | 379,695,264 | | |
Notes to Portfolio of Investments
(a) Variable rate security. The interest rate shown reflects the rate as of October 31, 2012.
(b) Municipal obligations include debt obligations issued by or on behalf of territories, possessions, or sovereign nations within the territorial boundaries of the United States. At October 31, 2012, the value of these securities amounted to $12,548,215 or 3.30% of net assets.
(c) Zero coupon bond.
(d) The rate shown is the seven-day current annualized yield at October 31, 2012.
Abbreviation Legend
AGM Assured Guaranty Municipal Corporation
AMBAC Ambac Assurance Corporation
BNY Bank of New York
FGIC Financial Guaranty Insurance Company
NPFGC National Public Finance Guarantee Corporation
TCRS Transferable Custodial Receipts
Fair Value Measurements
Generally accepted accounting principles (GAAP) require disclosure regarding the inputs and valuation techniques used to measure fair value and any changes in valuation inputs or techniques. In addition, investments shall be disclosed by major category.
The Fund categorizes its fair value measurements according to a three-level hierarchy that maximizes the use of observable inputs and minimizes the use of unobservable inputs by prioritizing that the most observable input be used when available. Observable inputs are those that market participants would use in pricing an investment based on market data obtained from sources independent of the reporting entity. Unobservable inputs are those that reflect the Fund's assumptions about the information market participants would use in pricing an investment. An investment's level within the fair value hierarchy is based on the lowest level of any input that is deemed significant to the asset or liability's fair value measurement. The input levels are not necessarily an indication of the risk or liquidity associated with investments at that level. For example, certain U.S. government securities are generally high quality and liquid, however, they are reflected as Level 2 because the inputs used to determine fair value may not always be quoted prices in an active market.
Fair value inputs are summarized in the three broad levels listed below:
> Level 1 — Valuations based on quoted prices for investments in active markets that the Fund has the ability to access at the measurement date (including NAV for open-end mutual funds). Valuation adjustments are not applied to Level 1 investments.
> Level 2 — Valuations based on other significant observable inputs (including quoted prices for similar securities, interest rates, prepayment speeds, credit risks, etc.).
> Level 3 — Valuations based on significant unobservable inputs (including the Fund's own assumptions and judgment in determining the fair value of investments).
The accompanying Notes to Financial Statements are an integral part of this statement.
Annual Report 2012
12
Columbia Massachusetts Intermediate Municipal Bond Fund
Portfolio of Investments (continued)
October 31, 2012
Fair Value Measurements (continued)
Inputs that are used in determining fair value of an investment may include price information, credit data, volatility statistics, and other factors. These inputs can be either observable or unobservable. The availability of observable inputs can vary between investments, and is affected by various factors such as the type of investment, and the volume and level of activity for that investment or similar investments in the marketplace. The inputs will be considered by the Investment Manager, along with any other relevant factors in the calculation of an investment's fair value. The Fund uses prices and inputs that are current as of the measurement date, which may include periods of market dislocations. During these periods, the availability of prices and inputs may be reduced for many investments. This condition could cause an investment to be reclassified between the various levels within the hierarchy.
Investments falling into the Level 3 category are primarily supported by quoted prices from brokers and dealers participating in the market for those investments. However, these may be classified as Level 3 investments due to lack of market transparency and corroboration to support these quoted prices. Additionally, valuation models may be used as the pricing source for any remaining investments classified as Level 3. These models rely on one or more significant unobservable inputs and/or significant assumptions by the Investment Manager. Inputs used in valuations may include, but are not limited to, financial statement analysis, capital account balances, discount rates and estimated cash flows, and comparable company data.
Under the direction of the Fund's Board of Trustees (the Board), the Investment Manager's Valuation Committee (the Committee) is responsible for carrying out the valuation procedures approved by the Board. The Committee consists of voting and non-voting members from various groups within the Investment Manager's organization, including operations and accounting, trading and investments, compliance, risk management and legal.
The Committee meets at least monthly to review and approve valuation matters, which may include a description of specific valuation determinations, data regarding pricing information received from approved pricing vendors and brokers and the results of Board-approved valuation control policies and procedures (the Policies). The Policies address, among other things, instances when market quotations are readily available, including recommendations of third party pricing vendors and a determination of appropriate pricing methodologies; events that require specific valuation determinations and assessment of fair value techniques; securities with a potential for stale pricing, including those that are illiquid, restricted, or in default; and the effectiveness of third-party pricing vendors, including periodic reviews of vendors. The Committee meets more frequently, as needed, to discuss additional valuation matters, which may include the need to review back-testing results, review time-sensitive information or approve related valuation actions. The Committee reports to the Board, with members of the Committee meeting with the Board at each of its regularly scheduled meetings to discuss valuation matters and actions during the period, similar to those described earlier.
For investments categorized as Level 3, the Committee monitors information similar to that described above, which may include: (i) data specific to the issuer or comparable issuers, (ii) general market or specific sector news and (iii) quoted prices and specific or similar security transactions. The Committee considers this data and any changes from prior periods in order to assess the reasonableness of observable and unobservable inputs, any assumptions or internal models used to value those securities and changes in fair value. This data is also used to corroborate, when available, information received from approved pricing vendors and brokers. Various factors impact the frequency of monitoring this information (which may occur as often as daily). However, the Committee may determine that changes to inputs, assumptions and models are not required as a result of the monitoring procedures performed.
The following table is a summary of the inputs used to value the Fund's investments at October 31, 2012:
Description | | Level 1
Quoted Prices in Active
Markets for Identical
Assets ($) | |
Level 2
Other Significant
Observable Inputs ($) | |
Level 3
Significant
Unobservable Inputs ($) | |
Total ($) | |
Bonds | |
Municipal Bonds | | | — | | | | 369,403,790 | | | | — | | | | 369,403,790 | | |
Total Bonds | | | — | | | | 369,403,790 | | | | — | | | | 369,403,790 | | |
Other | |
Money Market Funds | | | 5,953,738 | | | | — | | | | — | | | | 5,953,738 | | |
Total Other | | | 5,953,738 | | | | — | | | | — | | | | 5,953,738 | | |
Total | | | 5,953,738 | | | | 369,403,790 | | | | — | | | | 375,357,528 | | |
See the Portfolio of Investments for all investment classifications not indicated in the table.
The Fund's assets assigned to the Level 2 input category are generally valued using the market approach, in which a security's value is determined through reference to prices and information from market transactions for similar or identical assets.
There were no transfers of financial assets between Levels 1 and 2 during the period.
The accompanying Notes to Financial Statements are an integral part of this statement.
Annual Report 2012
13
Columbia Massachusetts Intermediate Municipal Bond Fund
Statement of Assets and Liabilities
October 31, 2012
Assets | |
Investments, at value | |
(identified cost $338,446,646) | | $ | 375,357,528 | | |
Receivable for: | |
Investments sold | | | 1,119,181 | | |
Capital shares sold | | | 370,252 | | |
Interest | | | 4,223,865 | | |
Expense reimbursement due from Investment Manager | | | 11,985 | | |
Prepaid expenses | | | 4,895 | | |
Trustees' deferred compensation plan | | | 37,677 | | |
Total assets | | | 381,125,383 | | |
Liabilities | |
Payable for: | |
Capital shares purchased | | | 251,608 | | |
Dividend distributions to shareholders | | | 977,243 | | |
Investment management fees | | | 20,743 | | |
Distribution and service fees | | | 2,791 | | |
Transfer agent fees | | | 68,480 | | |
Administration fees | | | 3,542 | | |
Compensation of board members | | | 64 | | |
Chief compliance officer expenses | | | 112 | | |
Other expenses | | | 67,859 | | |
Trustees' deferred compensation plan | | | 37,677 | | |
Total liabilities | | | 1,430,119 | | |
Net assets applicable to outstanding capital stock | | $ | 379,695,264 | | |
Represented by | |
Paid-in capital | | $ | 342,588,342 | | |
Excess of distributions over net investment income | | | (9,434 | ) | |
Accumulated net realized gain | | | 205,474 | | |
Unrealized appreciation (depreciation) on: | |
Investments | | | 36,910,882 | | |
Total — representing net assets applicable to outstanding capital stock | | $ | 379,695,264 | | |
The accompanying Notes to Financial Statements are an integral part of this statement.
Annual Report 2012
14
Columbia Massachusetts Intermediate Municipal Bond Fund
Statement of Assets and Liabilities (continued)
October 31, 2012
Class A | |
Net assets | | $ | 32,398,069 | | |
Shares outstanding | | | 2,856,713 | | |
Net asset value per share | | $ | 11.34 | | |
Maximum offering price per share(a) | | $ | 11.72 | | |
Class B | |
Net assets | | $ | 99,280 | | |
Shares outstanding | | | 8,755 | | |
Net asset value per share | | $ | 11.34 | | |
Class C | |
Net assets | | $ | 11,969,723 | | |
Shares outstanding | | | 1,055,494 | | |
Net asset value per share | | $ | 11.34 | | |
Class T | |
Net assets | | $ | 30,008,497 | | |
Shares outstanding | | | 2,645,748 | | |
Net asset value per share | | $ | 11.34 | | |
Maximum offering price per share(a) | | $ | 11.91 | | |
Class Z | |
Net assets | | $ | 305,219,695 | | |
Shares outstanding | | | 26,910,910 | | |
Net asset value per share | | $ | 11.34 | | |
(a) The maximum offering price per share is calculated by dividing the net asset value by 1.0 minus the maximum sales charge of 3.25% for Class A and by dividing the net asset value by 1.0 minus the maximum sales charge of 4.75% for Class T.
The accompanying Notes to Financial Statements are an integral part of this statement.
Annual Report 2012
15
Columbia Massachusetts Intermediate Municipal Bond Fund
Statement of Operations
Year Ended October 31, 2012
Net investment income | |
Income: | |
Dividends | | $ | 1,005 | | |
Interest | | | 13,718,813 | | |
Total income | | | 13,719,818 | | |
Expenses: | |
Investment management fees | | | 1,511,872 | | |
Distribution fees | |
Class B | | | 955 | | |
Class C | | | 84,107 | | |
Service fees | |
Class A | | | 84,532 | | |
Class B | | | 318 | | |
Class C | | | 28,041 | | |
Shareholder service fee — Class T | | | 50,404 | | |
Transfer agent fees | |
Class A | | | 64,903 | | |
Class B | | | 373 | | |
Class C | | | 21,795 | | |
Class T | | | 66,124 | | |
Class Z | | | 582,257 | | |
Administration fees | | | 258,185 | | |
Compensation of board members | | | 30,982 | | |
Custodian fees | | | 4,125 | | |
Printing and postage fees | | | 39,977 | | |
Registration fees | | | 113,241 | | |
Professional fees | | | 45,234 | | |
Chief compliance officer expenses | | | 260 | | |
Other | | | 11,571 | | |
Total expenses | | | 2,999,256 | | |
Fees waived or expenses reimbursed by Investment Manager and its affiliates | | | (861,785 | ) | |
Fees waived by Distributor — Class C | | | (39,241 | ) | |
Expense reductions | | | (180 | ) | |
Total net expenses | | | 2,098,050 | | |
Net investment income | | | 11,621,768 | | |
Realized and unrealized gain (loss) — net | |
Net realized gain (loss) on: | |
Investments | | | 235,614 | | |
Net realized gain | | | 235,614 | | |
Net change in unrealized appreciation (depreciation) on: | |
Investments | | | 12,977,036 | | |
Net change in unrealized appreciation (depreciation) | | | 12,977,036 | | |
Net realized and unrealized gain | | | 13,212,650 | | |
Net increase in net assets resulting from operations | | $ | 24,834,418 | | |
The accompanying Notes to Financial Statements are an integral part of this statement.
Annual Report 2012
16
Columbia Massachusetts Intermediate Municipal Bond Fund
Statement of Changes in Net Assets
| | | Year Ended
October 31,
2012 | | Year Ended
October 31,
2011 | |
Operations | |
Net investment income | | $ | 11,621,768 | | | $ | 11,858,667 | | |
Net realized gain | | | 235,614 | | | | 368,477 | | |
Net change in unrealized appreciation (depreciation) | | | 12,977,036 | | | | (504,369 | ) | |
Net increase in net assets resulting from operations | | | 24,834,418 | | | | 11,722,775 | | |
Distributions to shareholders | |
Net investment income | |
Class A | | | (971,229 | ) | | | (936,724 | ) | |
Class B | | | (2,701 | ) | | | (13,113 | ) | |
Class C | | | (277,975 | ) | | | (276,773 | ) | |
Class T | | | (1,001,276 | ) | | | (1,207,723 | ) | |
Class Z | | | (9,362,111 | ) | | | (9,460,100 | ) | |
Net realized gains | |
Class A | | | (33,104 | ) | | | (8,919 | ) | |
Class B | | | (154 | ) | | | (251 | ) | |
Class C | | | (10,855 | ) | | | (2,946 | ) | |
Class T | | | (37,440 | ) | | | (10,766 | ) | |
Class Z | | | (303,309 | ) | | | (78,146 | ) | |
Total distributions to shareholders | | | (12,000,154 | ) | | | (11,995,461 | ) | |
Increase (decrease) in net assets from capital stock activity | | | 7,854,448 | | | | (8,674,656 | ) | |
Total increase (decrease) in net assets | | | 20,688,712 | | | | (8,947,342 | ) | |
Net assets at beginning of year | | | 359,006,552 | | | | 367,953,894 | | |
Net assets at end of year | | $ | 379,695,264 | | | $ | 359,006,552 | | |
Excess of distributions over net investment income | | $ | (9,434 | ) | | $ | (15,910 | ) | |
The accompanying Notes to Financial Statements are an integral part of this statement.
Annual Report 2012
17
Columbia Massachusetts Intermediate Municipal Bond Fund
Statement of Changes in Net Assets (continued)
| | | Year Ended October 31, 2012 | | Year Ended October 31, 2011 | |
| | | Shares | | Dollars ($) | | Shares | | Dollars ($) | |
Capital stock activity | |
Class A shares | |
Subscriptions(a) | | | 1,496,976 | | | | 16,795,784 | | | | 857,941 | | | | 9,241,447 | | |
Distributions reinvested | | | 47,187 | | | | 531,355 | | | | 27,493 | | | | 296,677 | | |
Redemptions | | | (1,412,576 | ) | | | (15,869,515 | ) | | | (991,654 | ) | | | (10,618,232 | ) | |
Net increase (decrease) | | | 131,587 | | | | 1,457,624 | | | | (106,220 | ) | | | (1,080,108 | ) | |
Class B shares | |
Subscriptions | | | 2,956 | | | | 33,415 | | | | 445 | | | | 4,765 | | |
Distributions reinvested | | | 63 | | | | 704 | | | | 384 | | | | 4,106 | | |
Redemptions(a) | | | (7,547 | ) | | | (85,026 | ) | | | (79,651 | ) | | | (856,228 | ) | |
Net decrease | | | (4,528 | ) | | | (50,907 | ) | | | (78,822 | ) | | | (847,357 | ) | |
Class C shares | |
Subscriptions | | | 251,681 | | | | 2,819,614 | | | | 130,008 | | | | 1,401,873 | | |
Distributions reinvested | | | 16,149 | | | | 181,711 | | | | 14,598 | | | | 157,335 | | |
Redemptions | | | (119,050 | ) | | | (1,336,435 | ) | | | (192,530 | ) | | | (2,070,017 | ) | |
Net increase (decrease) | | | 148,780 | | | | 1,664,890 | | | | (47,924 | ) | | | (510,809 | ) | |
Class T shares | |
Subscriptions | | | 33,047 | | | | 371,567 | | | | 46,857 | | | | 503,396 | | |
Distributions reinvested | | | 36,159 | | | | 406,757 | | | | 47,090 | | | | 507,088 | | |
Redemptions | | | (614,463 | ) | | | (6,929,522 | ) | | | (492,558 | ) | | | (5,311,869 | ) | |
Net decrease | | | (545,257 | ) | | | (6,151,198 | ) | | | (398,611 | ) | | | (4,301,385 | ) | |
Class Z shares | |
Subscriptions | | | 3,611,918 | | | | 40,597,578 | | | | 4,041,762 | | | | 43,640,534 | | |
Distributions reinvested | | | 23,928 | | | | 269,674 | | | | 22,929 | | | | 246,385 | | |
Redemptions | | | (2,664,685 | ) | | | (29,933,213 | ) | | | (4,266,000 | ) | | | (45,821,916 | ) | |
Net increase (decrease) | | | 971,161 | | | | 10,934,039 | | | | (201,309 | ) | | | (1,934,997 | ) | |
Total net increase (decrease) | | | 701,743 | | | | 7,854,448 | | | | (832,886 | ) | | | (8,674,656 | ) | |
(a) Includes conversions of Class B shares to Class A shares, if any.
The accompanying Notes to Financial Statements are an integral part of this statement.
Annual Report 2012
18
Columbia Massachusetts Intermediate Municipal Bond Fund
The following tables are intended to help you understand the Fund's financial performance. Certain information reflects financial results for a single share of a class held for the periods shown. Per share net investment income (loss) amounts are calculated based on average shares outstanding during the period. Total return assumes reinvestment of all dividends and distributions. Total return does not reflect payment of sales charges, if any, and is not annualized for periods of less than one year.
| | | Year Ended October 31, | |
Class A | | 2012 | | 2011 | | 2010 | | 2009 | | 2008 | |
Per share data | |
Net asset value, beginning of period | | $ | 10.95 | | | $ | 10.95 | | | $ | 10.61 | | | $ | 9.90 | | | $ | 10.35 | | |
Income from investment operations: | |
Net investment income | | | 0.32 | | | | 0.34 | | | | 0.34 | | | | 0.35 | | | | 0.36 | | |
Net realized and unrealized gain (loss) | | | 0.41 | | | | 0.00 | (a) | | | 0.34 | | | | 0.71 | | | | (0.44 | ) | |
Total from investment operations | | | 0.73 | | | | 0.34 | | | | 0.68 | | | | 1.06 | | | | (0.08 | ) | |
Less distributions to shareholders: | |
Net investment income | | | (0.33 | ) | | | (0.34 | ) | | | (0.34 | ) | | | (0.35 | ) | | | (0.37 | ) | |
Net realized gains | | | (0.01 | ) | | | (0.00 | )(a) | | | — | | | | — | | | | (0.00 | )(a) | |
Total distributions to shareholders | | | (0.34 | ) | | | (0.34 | ) | | | (0.34 | ) | | | (0.35 | ) | | | (0.37 | ) | |
Net asset value, end of period | | $ | 11.34 | | | $ | 10.95 | | | $ | 10.95 | | | $ | 10.61 | | | $ | 9.90 | | |
Total return | | | 6.69 | % | | | 3.24 | % | | | 6.51 | % | | | 10.78 | % | | | (0.88 | %) | |
Ratios to average net assets(b) | |
Expenses prior to fees waived or expenses reimbursed | | | 0.98 | % | | | 0.99 | % | | | 0.91 | % | | | 0.90 | % | | | 0.92 | % | |
Net expenses after fees waived or expenses reimbursed(c) | | | 0.75 | %(d) | | | 0.77 | %(d) | | | 0.80 | %(d) | | | 0.78 | %(d) | | | 0.75 | %(d) | |
Net investment income | | | 2.88 | %(d) | | | 3.16 | %(d) | | | 3.12 | %(d) | | | 3.30 | %(d) | | | 3.51 | %(d) | |
Supplemental data | |
Net assets, end of period (in thousands) | | $ | 32,398 | | | $ | 29,849 | | | $ | 30,998 | | | $ | 16,049 | | | $ | 11,936 | | |
Portfolio turnover | | | 11 | % | | | 10 | % | | | 9 | % | | | 8 | % | | | 10 | % | |
Notes to Financial Highlights
(a) Rounds to less than $0.01.
(b) In addition to the fees and expenses which the Fund bears directly, the Fund indirectly bears a pro rata share of the fees and expenses of the acquired funds in which it invests. Such indirect expenses are not included in the reported expense ratios.
(c) The Investment Manager and certain of its affiliates agreed to waive/reimburse certain fees and expenses, if applicable.
(d) The benefits derived from expense reductions had an impact of less than 0.01%.
The accompanying Notes to Financial Statements are an integral part of this statement.
Annual Report 2012
19
Columbia Massachusetts Intermediate Municipal Bond Fund
Financial Highlights (continued)
| | | Year Ended October 31, | |
Class B | | 2012 | | 2011 | | 2010 | | 2009 | | 2008 | |
Per share data | |
Net asset value, beginning of period | | $ | 10.95 | | | $ | 10.95 | | | $ | 10.61 | | | $ | 9.90 | | | $ | 10.35 | | |
Income from investment operations: | |
Net investment income | | | 0.24 | | | | 0.26 | | | | 0.26 | | | | 0.27 | | | | 0.29 | | |
Net realized and unrealized gain (loss) | | | 0.40 | | | | 0.00 | (a) | | | 0.34 | | | | 0.71 | | | | (0.45 | ) | |
Total from investment operations | | | 0.64 | | | | 0.26 | | | | 0.60 | | | | 0.98 | | | | (0.16 | ) | |
Less distributions to shareholders: | |
Net investment income | | | (0.24 | ) | | | (0.26 | ) | | | (0.26 | ) | | | (0.27 | ) | | | (0.29 | ) | |
Net realized gains | | | (0.01 | ) | | | (0.00 | )(a) | | | — | | | | — | | | | (0.00 | )(a) | |
Total distributions to shareholders | | | (0.25 | ) | | | (0.26 | ) | | | (0.26 | ) | | | (0.27 | ) | | | (0.29 | ) | |
Net asset value, end of period | | $ | 11.34 | | | $ | 10.95 | | | $ | 10.95 | | | $ | 10.61 | | | $ | 9.90 | | |
Total return | | | 5.89 | % | | | 2.48 | % | | | 5.72 | % | | | 9.96 | % | | | (1.61 | %) | |
Ratios to average net assets(b) | |
Expenses prior to fees waived or expenses reimbursed | | | 1.83 | % | | | 1.79 | % | | | 1.66 | % | | | 1.65 | % | | | 1.67 | % | |
Net expenses after fees waived or expenses reimbursed(c) | | | 1.50 | %(d) | | | 1.53 | %(d) | | | 1.55 | %(d) | | | 1.53 | %(d) | | | 1.50 | %(d) | |
Net investment income | | | 2.13 | %(d) | | | 2.44 | %(d) | | | 2.42 | %(d) | | | 2.59 | %(d) | | | 2.78 | %(d) | |
Supplemental data | |
Net assets, end of period (in thousands) | | $ | 99 | | | $ | 145 | | | $ | 1,008 | | | $ | 1,222 | | | $ | 1,440 | | |
Portfolio turnover | | | 11 | % | | | 10 | % | | | 9 | % | | | 8 | % | | | 10 | % | |
Notes to Financial Highlights
(a) Rounds to less than $0.01.
(b) In addition to the fees and expenses which the Fund bears directly, the Fund indirectly bears a pro rata share of the fees and expenses of the acquired funds in which it invests. Such indirect expenses are not included in the reported expense ratios.
(c) The Investment Manager and certain of its affiliates agreed to waive/reimburse certain fees and expenses, if applicable.
(d) The benefits derived from expense reductions had an impact of less than 0.01%.
The accompanying Notes to Financial Statements are an integral part of this statement.
Annual Report 2012
20
Columbia Massachusetts Intermediate Municipal Bond Fund
Financial Highlights (continued)
| | | Year Ended October 31, | |
Class C | | 2012 | | 2011 | | 2010 | | 2009 | | 2008 | |
Per share data | |
Net asset value, beginning of period | | $ | 10.95 | | | $ | 10.95 | | | $ | 10.61 | | | $ | 9.90 | | | $ | 10.35 | | |
Income from investment operations: | |
Net investment income | | | 0.28 | | | | 0.30 | | | | 0.30 | | | | 0.30 | | | | 0.32 | | |
Net realized and unrealized gain (loss) | | | 0.40 | | | | 0.00 | (a) | | | 0.34 | | | | 0.72 | | | | (0.44 | ) | |
Total from investment operations | | | 0.68 | | | | 0.30 | | | | 0.64 | | | | 1.02 | | | | (0.12 | ) | |
Less distributions to shareholders: | |
Net investment income | | | (0.28 | ) | | | (0.30 | ) | | | (0.30 | ) | | | (0.31 | ) | | | (0.33 | ) | |
Net realized gains | | | (0.01 | ) | | | (0.00 | )(a) | | | — | | | | — | | | | (0.00 | )(a) | |
Total distributions to shareholders | | | (0.29 | ) | | | (0.30 | ) | | | (0.30 | ) | | | (0.31 | ) | | | (0.33 | ) | |
Net asset value, end of period | | $ | 11.34 | | | $ | 10.95 | | | $ | 10.95 | | | $ | 10.61 | | | $ | 9.90 | | |
Total return | | | 6.27 | % | | | 2.83 | % | | | 6.09 | % | | | 10.34 | % | | | (1.27 | %) | |
Ratios to average net assets(b) | |
Expenses prior to fees waived or expenses reimbursed | | | 1.73 | % | | | 1.74 | % | | | 1.66 | % | | | 1.65 | % | | | 1.67 | % | |
Net expenses after fees waived or expenses reimbursed(c) | | | 1.15 | %(d) | | | 1.17 | %(d) | | | 1.20 | %(d) | | | 1.18 | %(d) | | | 1.15 | %(d) | |
Net investment income | | | 2.48 | %(d) | | | 2.75 | %(d) | | | 2.75 | %(d) | | | 2.88 | %(d) | | | 3.13 | %(d) | |
Supplemental data | |
Net assets, end of period (in thousands) | | $ | 11,970 | | | $ | 9,931 | | | $ | 10,452 | | | $ | 8,859 | | | $ | 4,036 | | |
Portfolio turnover | | | 11 | % | | | 10 | % | | | 9 | % | | | 8 | % | | | 10 | % | |
Notes to Financial Highlights
(a) Rounds to less than $0.01.
(b) In addition to the fees and expenses which the Fund bears directly, the Fund indirectly bears a pro rata share of the fees and expenses of the acquired funds in which it invests. Such indirect expenses are not included in the reported expense ratios.
(c) The Investment Manager and certain of its affiliates agreed to waive/reimburse certain fees and expenses, if applicable.
(d) The benefits derived from expense reductions had an impact of less than 0.01%.
The accompanying Notes to Financial Statements are an integral part of this statement.
Annual Report 2012
21
Columbia Massachusetts Intermediate Municipal Bond Fund
Financial Highlights (continued)
| | | Year Ended October 31, | |
Class T | | 2012 | | 2011 | | 2010 | | 2009 | | 2008 | |
Per share data | |
Net asset value, beginning of period | | $ | 10.95 | | | $ | 10.95 | | | $ | 10.61 | | | $ | 9.90 | | | $ | 10.35 | | |
Income from investment operations: | |
Net investment income | | | 0.34 | | | | 0.35 | | | | 0.35 | | | | 0.36 | | | | 0.38 | | |
Net realized and unrealized gain (loss) | | | 0.40 | | | | 0.00 | (a) | | | 0.34 | | | | 0.71 | | | | (0.45 | ) | |
Total from investment operations | | | 0.74 | | | | 0.35 | | | | 0.69 | | | | 1.07 | | | | (0.07 | ) | |
Less distributions to shareholders: | |
Net investment income | | | (0.34 | ) | | | (0.35 | ) | | | (0.35 | ) | | | (0.36 | ) | | | (0.38 | ) | |
Net realized gains | | | (0.01 | ) | | | (0.00 | )(a) | | | — | | | | — | | | | (0.00 | )(a) | |
Total distributions to shareholders | | | (0.35 | ) | | | (0.35 | ) | | | (0.35 | ) | | | (0.36 | ) | | | (0.38 | ) | |
Net asset value, end of period | | $ | 11.34 | | | $ | 10.95 | | | $ | 10.95 | | | $ | 10.61 | | | $ | 9.90 | | |
Total return | | | 6.80 | % | | | 3.34 | % | | | 6.62 | % | | | 10.89 | % | | | (0.77 | %) | |
Ratios to average net assets(b) | |
Expenses prior to fees waived or expenses reimbursed | | | 0.88 | % | | | 0.89 | % | | | 0.81 | % | | | 0.80 | % | | | 0.82 | % | |
Net expenses after fees waived or expenses reimbursed(c) | | | 0.65 | %(d) | | | 0.67 | %(d) | | | 0.70 | %(d) | | | 0.68 | %(d) | | | 0.65 | %(d) | |
Net investment income | | | 2.98 | %(d) | | | 3.25 | %(d) | | | 3.26 | %(d) | | | 3.43 | %(d) | | | 3.63 | %(d) | |
Supplemental data | |
Net assets, end of period (in thousands) | | $ | 30,008 | | | $ | 34,952 | | | $ | 39,300 | | | $ | 39,221 | | | $ | 37,689 | | |
Portfolio turnover | | | 11 | % | | | 10 | % | | | 9 | % | | | 8 | % | | | 10 | % | |
Notes to Financial Highlights
(a) Rounds to less than $0.01.
(b) In addition to the fees and expenses which the Fund bears directly, the Fund indirectly bears a pro rata share of the fees and expenses of the acquired funds in which it invests. Such indirect expenses are not included in the reported expense ratios.
(c) The Investment Manager and certain of its affiliates agreed to waive/reimburse certain fees and expenses, if applicable.
(d) The benefits derived from expense reductions had an impact of less than 0.01%.
The accompanying Notes to Financial Statements are an integral part of this statement.
Annual Report 2012
22
Columbia Massachusetts Intermediate Municipal Bond Fund
Financial Highlights (continued)
| | | Year Ended October 31, | |
Class Z | | 2012 | | 2011 | | 2010 | | 2009 | | 2008 | |
Per share data | |
Net asset value, beginning of period | | $ | 10.95 | | | $ | 10.95 | | | $ | 10.61 | | | $ | 9.90 | | | $ | 10.35 | | |
Income from investment operations: | |
Net investment income | | | 0.35 | | | | 0.37 | | | | 0.37 | | | | 0.37 | | | | 0.39 | | |
Net realized and unrealized gain (loss) | | | 0.40 | | | | 0.00 | (a) | | | 0.34 | | | | 0.71 | | | | (0.45 | ) | |
Total from investment operations | | | 0.75 | | | | 0.37 | | | | 0.71 | | | | 1.08 | | | | (0.06 | ) | |
Less distributions to shareholders: | |
Net investment income | | | (0.35 | ) | | | (0.37 | ) | | | (0.37 | ) | | | (0.37 | ) | | | (0.39 | ) | |
Net realized gains | | | (0.01 | ) | | | (0.00 | )(a) | | | — | | | | — | | | | (0.00 | )(a) | |
Total distributions to shareholders | | | (0.36 | ) | | | (0.37 | ) | | | (0.37 | ) | | | (0.37 | ) | | | (0.39 | ) | |
Net asset value, end of period | | $ | 11.34 | | | $ | 10.95 | | | $ | 10.95 | | | $ | 10.61 | | | $ | 9.90 | | |
Total return | | | 6.96 | % | | | 3.49 | % | | | 6.77 | % | | | 11.06 | % | | | (0.62 | %) | |
Ratios to average net assets(b) | |
Expenses prior to fees waived or expenses reimbursed | | | 0.73 | % | | | 0.74 | % | | | 0.66 | % | | | 0.65 | % | | | 0.67 | % | |
Net expenses after fees waived or expenses reimbursed(c) | | | 0.50 | %(d) | | | 0.52 | %(d) | | | 0.55 | %(d) | | | 0.53 | %(d) | | | 0.50 | %(d) | |
Net investment income | | | 3.13 | %(d) | | | 3.40 | %(d) | | | 3.41 | %(d) | | | 3.58 | %(d) | | | 3.78 | %(d) | |
Supplemental data | |
Net assets, end of period (in thousands) | | $ | 305,220 | | | $ | 284,128 | | | $ | 286,196 | | | $ | 282,469 | | | $ | 259,753 | | |
Portfolio turnover | | | 11 | % | | | 10 | % | | | 9 | % | | | 8 | % | | | 10 | % | |
Notes to Financial Highlights
(a) Rounds to less than $0.01.
(b) In addition to the fees and expenses which the Fund bears directly, the Fund indirectly bears a pro rata share of the fees and expenses of the acquired funds in which it invests. Such indirect expenses are not included in the reported expense ratios.
(c) The Investment Manager and certain of its affiliates agreed to waive/reimburse certain fees and expenses, if applicable.
(d) The benefits derived from expense reductions had an impact of less than 0.01%.
The accompanying Notes to Financial Statements are an integral part of this statement.
Annual Report 2012
23
Columbia Massachusetts Intermediate Municipal Bond Fund
Notes to Financial Statements
October 31, 2012
Note 1. Organization
Columbia Massachusetts Intermediate Municipal Bond Fund (the Fund), a series of Columbia Funds Series Trust I (the Trust), is a non-diversified fund. The Trust is registered under the Investment Company Act of 1940, as amended (the 1940 Act), as an open-end management investment company organized as a Massachusetts business trust.
Fund Shares
The Trust may issue an unlimited number of shares (without par value). The Fund offers Class A, Class B, Class C, Class T and Class Z shares. All share classes have identical voting, dividend and liquidation rights. Each share class has its own expense structure and sales charges, as applicable.
Class A shares are subject to a maximum front-end sales charge of 3.25% based on the initial investment amount. Class A shares purchased without an initial sales charge in accounts aggregating $1 million to $50 million at the time of purchase are subject to a contingent deferred sales charge (CDSC) if the shares are sold within 18 months of purchase, charged as follows: 1.00% CDSC if redeemed within 12 months of purchase, and 0.50% CDSC if redeemed more than 12, but less than 18, months after purchase.
Class B shares may be subject to a maximum CDSC of 3.00% based upon the holding period after purchase. Class B shares will generally convert to Class A shares eight years after purchase. The Fund no longer accepts investments by new or existing investors in the Fund's Class B shares, except in connection with the reinvestment of any dividend and/or capital gain distributions in Class B shares of the Fund and exchanges by existing Class B shareholders of certain other funds within the Columbia Family of Funds.
Class C shares are subject to a 1.00% CDSC on shares redeemed within one year of purchase.
Class T shares are subject to a maximum front-end sales charge of 4.75% based on the investment amount. Class T shares purchased without an initial sales charge in accounts aggregating $1 million to $50 million at the time of purchase are subject to a contingent deferred sales charge (CDSC) if the shares are sold within 18 months of purchase, charged as follows: 1.00% CDSC if redeemed within 12 months of purchase, and 0.50% CDSC if redeemed more than 12, but less than 18, months after purchase. Class T shares are available only to investors who received (and who have continuously held) Class T shares in connection with the merger of certain Galaxy Funds into various Columbia Funds (formerly named Liberty Funds).
Class Z shares are not subject to sales charges, and are only available to certain investors.
Note 2. Summary of Significant Accounting Policies
Use of Estimates
The preparation of financial statements in accordance with U.S. generally accepted accounting principles (GAAP) requires management to make certain estimates and assumptions that affect the reported amounts of assets and liabilities, the disclosure of contingent assets and liabilities at the date of the financial statements and the reported amounts of revenue and expenses during the reporting period. Actual results could differ from those estimates.
The following is a summary of significant accounting policies consistently followed by the Fund in the preparation of its financial statements.
Security Valuation
Debt securities generally are valued by pricing services approved by the Board of Trustees (the Board) based upon market transactions for normal, institutional-size trading units of similar securities. The services may use various pricing techniques which take into account appropriate factors such as yield, quality, coupon rate, maturity, type of issue, trading characteristics and other data, as well as broker quotes. Debt securities for which quotations are readily available may also be valued based upon an over-the-counter or exchange bid quotation.
Investments in other open-end investment companies, including money market funds, are valued at net asset value.
Short-term securities purchased within 60 days to maturity are valued at amortized cost, which approximates market value. The value of short-term securities originally purchased with maturities greater than 60 days is determined based on an amortized value to par upon reaching 60 days to maturity. Short-term securities maturing in more than 60 days from the valuation date are valued at the market price or approximate market value based on current interest rates.
Investments for which market quotations are not readily available, or that have quotations which management believes are not reliable, are valued at fair value as determined in good faith under consistently applied procedures established by and under the general supervision of the Board. If a security or class of securities (such as foreign securities) is valued at fair value, such value is likely to be different from the last quoted market price for the security.
Annual Report 2012
24
Columbia Massachusetts Intermediate Municipal Bond Fund
Notes to Financial Statements (continued)
October 31, 2012
The determination of fair value often requires significant judgment. To determine fair value, management may use assumptions including but not limited to future cash flows and estimated risk premiums. Multiple inputs from various sources may be used to determine fair value.
Delayed Delivery Securities and Forward Sale Commitments
The Fund may trade securities on other than normal settlement terms, including securities purchased or sold on a "when-issued" basis. This may increase the risk if the other party to the transaction fails to deliver and causes the Fund to subsequently invest at less advantageous prices. The Fund designates cash or liquid securities in an amount equal to the delayed delivery commitment.
The Fund may enter into forward sale commitments to hedge its portfolio positions or to sell mortgage-backed securities it owns under delayed delivery arrangements. Proceeds of forward sale commitments are not received until the contractual settlement date. While a forward sale commitment is outstanding, equivalent deliverable securities or an offsetting forward purchase commitment deliverable on or before the sale commitment date, are used to satisfy the commitment.
Unsettled forward sale commitments are valued at the current market value of the underlying securities, generally according to the procedures described under "Security Valuation" above. The forward sale commitment is "marked-to-market" daily and the change in market value is recorded by the Fund as an unrealized gain or loss. If the forward sale commitment is closed through the acquisition of an offsetting purchase commitment, the Fund realizes a gain or loss. If the Fund delivers securities under the commitment, the Fund realizes a gain or a loss from the sale of the securities based upon the market price established at the date the commitment was entered into.
Security Transactions
Security transactions are accounted for on the trade date. Cost is determined and gains (losses) are based upon the specific identification method for both financial statement and federal income tax purposes.
Income Recognition
Interest income is recorded on an accrual basis. Market premiums and discounts, including original issue discounts, are amortized and accreted, respectively, over the expected life of the security on all debt securities, unless otherwise noted.
Dividend income is recorded on the ex-dividend date.
Expenses
General expenses of the Trust are allocated to the Fund and other funds of the Trust based upon relative net assets or other expense allocation methodologies determined by the nature of the expense. Expenses directly attributable to the Fund are charged to the Fund. Expenses directly attributable to a specific class of shares are charged to that share class.
Determination of Class Net Asset Value
All income, expenses (other than class-specific expenses, which are charged to that share class, as shown in the Statement of Operations) and realized and unrealized gains (losses) are allocated to each class of the Fund on a daily basis for purposes of determining the net asset value of each class. Income and expenses are allocated to each class based on the settled shares method, while realized and unrealized gains (losses) are allocated based on the relative net assets of each class.
Federal Income Tax Status
The Fund intends to qualify each year as a regulated investment company under Subchapter M of the Internal Revenue Code, as amended, and will distribute substantially all of its tax exempt or taxable income (including net short-term capital gains), if any, for its tax year, and as such will not be subject to federal income taxes. In addition, the Fund intends to distribute in each calendar year substantially all of its net investment income, capital gains and certain other amounts, if any, such that the Fund should not be subject to federal excise tax. Therefore, no federal income or excise tax provision is recorded.
Distributions to Shareholders
Distributions from net investment income, if any, are declared daily and paid monthly. Net realized capital gains, if any, are distributed at least annually. Income distributions and capital gain distributions are determined in accordance with federal income tax regulations, which may differ from GAAP.
Guarantees and Indemnifications
Under the Trust's organizational documents and, in some cases, by contract, its officers and trustees are indemnified against certain liabilities arising out of the performance of their duties to the Trust or its funds. In addition, certain of the Fund's contracts with its service providers contain general indemnification clauses. The Fund's maximum exposure under these arrangements is unknown since the amount of any future claims that may be made against the Fund cannot be determined, and the Fund has no historical basis for predicting the likelihood of any such claims.
Annual Report 2012
25
Columbia Massachusetts Intermediate Municipal Bond Fund
Notes to Financial Statements (continued)
October 31, 2012
Recent Accounting Pronouncement
Disclosures about Offsetting Assets and Liabilities
In December 2011, the Financial Accounting Standards Board (FASB) issued ASU No. 2011-11, Disclosures about Offsetting Assets and Liabilities. The objective of the FASB is to enhance current disclosure requirements on offsetting of certain assets and liabilities and to enable financial statement users to compare financial statements prepared under GAAP and International Financial Reporting Standards.
Specifically, ASU No. 2011-11 requires an entity to disclose both gross and net information for derivatives and other financial instruments that are subject to a master netting arrangement or similar agreement. The standard requires disclosure of collateral received in connection with the master netting agreements or similar agreements. The effective date of ASU No. 2011-11 is for interim and annual periods beginning on or after January 1, 2013. At this time, management is evaluating the implications of this guidance and the impact it will have on the financial statement amounts and footnote disclosures, if any.
Note 3. Fees and Compensation Paid to Affiliates
Investment Management Fees
Under an Investment Management Services Agreement, Columbia Management Investment Advisers, LLC (the Investment Manager), a wholly-owned subsidiary of Ameriprise Financial, Inc. (Ameriprise Financial), determines which securities will be purchased, held or sold. The investment management fee is an annual fee that is equal to a percentage of the Fund's average daily net assets that declines from 0.40% to 0.27% as the Fund's net assets increase. The effective investment management fee rate for the year ended October 31, 2012 was 0.40% of the Fund's average daily net assets.
Administration Fees
Under an Administrative Services Agreement, the Investment Manager also serves as the Fund Administrator. The Fund pays the Fund Administrator an annual fee for administration and accounting services equal to a percentage of the Fund's average daily net assets that declines from 0.07% to 0.04% as the Fund's net assets increase. The effective administration fee rate for the year ended October 31, 2012 was 0.07% of the Fund's average daily net assets.
Compensation of Board Members
Board members are compensated for their services to the Fund as disclosed in the Statement of Operations. The Trust's eligible Trustees may participate in a Deferred Compensation
Plan (the Plan) which may be terminated at any time. Obligations of the Plan will be paid solely out of the Fund's assets.
Compensation of Chief Compliance Officer
The Board has appointed a Chief Compliance Officer to the Fund in accordance with federal securities regulations. The Fund pays its pro-rata share of the expenses associated with the Chief Compliance Officer. The Fund's expenses for the Chief Compliance Officer will not exceed $15,000 per year.
Transfer Agent Fees
Under a Transfer and Dividend Disbursing Agent Agreement, Columbia Management Investment Services Corp. (the Transfer Agent), an affiliate of the Investment Manager and a wholly-owned subsidiary of Ameriprise Financial, is responsible for providing transfer agency services to the Fund. The Transfer Agent has contracted with Boston Financial Data Services (BFDS) to serve as sub-transfer agent.
The Transfer Agent receives monthly account-based service fees based on the number of open accounts and is reimbursed by the Fund for the fees and expenses the Transfer Agent pays to financial intermediaries that maintain omnibus accounts with the Fund that is a percentage of the average aggregate value of the Fund's shares maintained in each such omnibus account (other than omnibus accounts for which American Enterprise Investment Services Inc. is the broker of record or accounts where the beneficial shareholder is a customer of Ameriprise Financial Services, Inc., which are paid a per account fee). The Transfer Agent pays the fees of BFDS for services as sub-transfer agent and is not entitled to reimbursement for such fees from the Fund (with the exception of out-of-pocket fees).
The Transfer Agent also receives compensation from fees for various shareholder services and reimbursements for certain out-of-pocket fees.
For the year ended October 31, 2012, the Fund's effective transfer agent fee rates as a percentage of average daily net assets of each class were as follows:
Class A | | | 0.19 | % | |
Class B | | | 0.29 | | |
Class C | | | 0.19 | | |
Class T | | | 0.20 | | |
Class Z | | | 0.19 | | |
An annual minimum account balance fee of $20 may apply to certain accounts with a value below the Fund's initial minimum investment requirements to reduce the impact of small accounts on transfer agent fees. These minimum account balance fees are recorded as part of expense reductions in the
Annual Report 2012
26
Columbia Massachusetts Intermediate Municipal Bond Fund
Notes to Financial Statements (continued)
October 31, 2012
Statement of Operations. For the year ended October 31, 2012, these minimum account balance fees reduced total expenses by $180.
Distribution and Service Fees
The Fund has an agreement with Columbia Management Investment Distributors, Inc. (the Distributor), an affiliate of the Investment Manager and a wholly-owned subsidiary of Ameriprise Financial, for distribution and shareholder services. Pursuant to Rule 12b-1 under the 1940 Act, the Board has approved, and the Fund has adopted, distribution and shareholder service plans (the Plans) which set the distribution and service fees for the Fund. These fees are calculated daily and are intended to compensate the Distributor and/or eligible selling and/or servicing agents for selling shares of the Fund and providing services to investors.
The Plans require the payment of a monthly service fee to the Distributor at the maximum annual rate of 0.25% of the average daily net assets attributable to Class A, Class B and Class C shares of the Fund. The Plans also require the payment of a monthly distribution fee to the Distributor at the maximum annual rate of 0.75% of the average daily net assets attributable to Class B and Class C shares only.
The Distributor has voluntarily agreed to waive a portion of the distribution fee for Class C shares so that the combined distribution and service fee does not exceed 0.65% annually of the average daily net assets attributable to Class C shares. This arrangement may be modified or terminated by the Distributor at any time.
Shareholder Services Fees
The Fund has adopted a shareholder services plan that permits it to pay for certain services provided to Class T shareholders by their selling and/or servicing agents. The Fund may pay shareholder servicing fees up to an aggregate annual rate of 0.40% of the Fund's average daily net assets attributable to Class T shares (comprised of up to 0.20% for shareholder liaison services and up to 0.20% for administrative support services). These fees are currently limited to an aggregate annual rate of not more than 0.15% of the Fund's average daily net assets attributable to Class T shares. In addition, the servicing fee for Class T shares will be waived by selling and/or servicing agents to the extent necessary to prevent the net investment income for the Class T shares from falling below 0.00% on a daily basis. The shareholder services fee for the year ended October 31, 2012 was 0.15% of the Fund's average daily net assets attributable to Class T shares.
Sales Charges
Sales charges, including front-end charges and CDSCs, received by the Distributor for distributing Fund shares were $40,902 for Class A, $5 for Class B and $454 for Class T shares for the year ended October 31, 2012.
Expenses Waived/Reimbursed by the Investment Manager and its Affiliates
The Investment Manager and certain of its affiliates have contractually agreed to waive fees and/or reimburse expenses (excluding certain fees and expenses described below), through February 28, 2013, unless sooner terminated at the sole discretion of the Board, so that the Fund's net operating expenses, after giving effect to fees waived/expenses reimbursed and/or overdraft charges from the Fund's custodian, do not exceed the following annual rates as a percentage of the class' average daily net assets:
Class A | | | 0.75 | % | |
Class B | | | 1.50 | | |
Class C | | | 1.50 | | |
Class T | | | 0.65 | | |
Class Z | | | 0.50 | | |
Under the agreement, the following fees and expenses are excluded from the waiver/reimbursement commitment, and therefore will be paid by the Fund, if applicable: taxes (including foreign transaction taxes), expenses associated with investments in affiliated and non-affiliated pooled investment vehicles (including mutual funds and exchange traded funds), transaction costs and brokerage commissions, costs related to any securities lending program, dividend expenses associated with securities sold short, inverse floater program fees and expenses, transaction charges and interest on borrowed money, interest, extraordinary expenses and any other expenses the exclusion of which is specifically approved by the Board. This agreement may be modified or amended only with approval from all parties. Class C distribution fees waived by the Distributor, as discussed above, are in addition to the waiver/reimbursement commitment under the agreement.
Note 4. Federal Tax Information
The timing and character of income and capital gain distributions are determined in accordance with income tax regulations, which may differ from GAAP because of temporary or permanent book to tax differences.
At October 31, 2012, these differences are primarily due to differing treatment for distributions, market discount and Trustees' deferred compensation. To the extent these differences are permanent, reclassifications are made among the components of the Fund's net assets in the Statement of
Annual Report 2012
27
Columbia Massachusetts Intermediate Municipal Bond Fund
Notes to Financial Statements (continued)
October 31, 2012
Assets and Liabilities. The Fund did not have any permanent differences; therefore, no reclassifications were made to the Statement of Assets and Liabilities.
The tax character of distributions paid during the years indicated was as follows:
Year Ended October 31, | | 2012 | | 2011 | |
Tax-exempt income | | $ | 11,615,292 | | | $ | 11,894,433 | | |
Long-term capital gains | | | 384,862 | | | | 101,028 | | |
Short-term capital gain distributions, if any, are considered ordinary income distributions for tax purposes.
At October 31, 2012, the components of distributable earnings on a tax basis were as follows:
Undistributed tax-exempt income | | $ | 976,841 | | |
Undistributed accumulated long-term gain | | | 205,474 | | |
Unrealized appreciation | | | 36,937,116 | | |
At October 31, 2012, the cost of investments for federal income tax purposes was $338,420,412 and the aggregate gross unrealized appreciation and depreciation based on that cost was:
Unrealized appreciation | | $ | 36,951,051 | | |
Unrealized depreciation | | | (13,935 | ) | |
Net unrealized appreciation | | $ | 36,937,116 | | |
Management of the Fund has concluded that there are no significant uncertain tax positions that would require recognition in the financial statements. However, management's conclusion may be subject to review and adjustment at a later date based on factors including, but not limited to, new tax laws, regulations, and administrative interpretations (including relevant court decisions). Generally, the Fund's federal tax returns for the prior three fiscal years remain subject to examination by the Internal Revenue Service.
Note 5. Portfolio Information
The cost of purchases and proceeds from sales of securities, excluding short-term obligations, aggregated to $53,167,821 and $38,432,554, respectively, for the year ended October 31, 2012.
Note 6. Shareholder Concentration
At October 31, 2012, one unaffiliated shareholder account owned 84.4% of the outstanding shares of the Fund. The Fund has no knowledge about whether any portion of those shares was owned beneficially by such account. Subscription and redemption activity by concentrated accounts may have a significant effect on the operations of the Fund.
Note 7. Line of Credit
The Fund has entered into a revolving credit facility with a syndicate of banks led by JPMorgan Chase Bank N.A. (JPMorgan) whereby the Fund may borrow for the temporary funding of shareholder redemptions or for other temporary or emergency purposes. The credit facility agreement, as amended, which is a collective agreement between the Fund and certain other funds managed by the Investment Manager, severally and not jointly, permits collective borrowings up to $500 million. Pursuant to a December 13, 2011 amendment to the credit facility agreement, interest is charged to each participating fund based on its borrowings at a rate equal to the higher of (i) the overnight federal funds rate plus 1.00% or (ii) the one-month LIBOR rate plus 1.00%. Each borrowing under the credit facility matures no later than 60 days after the date of borrowing. The Fund also pays a commitment fee equal to its pro rata share of the amount of the credit facility at a rate of 0.08% per annum.
Prior to December 13, 2011, interest was charged to each participating fund based on its borrowings at a rate equal to the sum of the federal funds rate plus (i) 1.25% per annum plus (ii) if one-month LIBOR exceeds the federal funds rate, the amount of such excess. The Fund also paid a commitment fee equal to its pro rata share of the amount of the credit facility at a rate of 0.10% per annum.
The Fund had no borrowings during the year ended October 31, 2012.
Note 8. Significant Risks
Non-Diversification Risk
A non-diversified fund is permitted to invest a greater percentage of its total assets in fewer issuers than a diversified fund. The Fund may, therefore, have a greater risk of loss from a few issuers than a similar fund that invests more broadly.
Geographic Concentration Risk
Because state-specific tax-exempt funds invest primarily in the municipal securities issued by the state and political sub-divisions of the state, the Fund will be particularly affected by political and economic conditions and developments in the state in which it invests. The Fund may, therefore, have a greater risk than that of a municipal bond fund which is more geographically diversified. The value of the municipal securities owned by the Fund also may be adversely affected by future changes in federal or state income tax laws.
Annual Report 2012
28
Columbia Massachusetts Intermediate Municipal Bond Fund
Notes to Financial Statements (continued)
October 31, 2012
Note 9. Subsequent Events
Management has evaluated the events and transactions that have occurred through the date the financial statements were issued and noted no items requiring adjustment of the financial statements or additional disclosure.
Note 10. Information Regarding Pending and Settled Legal Proceedings
In December 2005, without admitting or denying the allegations, American Express Financial Corporation (AEFC, which is now known as Ameriprise Financial, Inc. (Ameriprise Financial)) entered into settlement agreements with the Securities and Exchange Commission (SEC) and Minnesota Department of Commerce (MDOC) related to market timing activities. As a result, AEFC was censured and ordered to cease and desist from committing or causing any violations of certain provisions of the Investment Advisers Act of 1940, the Investment Company Act of 1940, and various Minnesota laws. AEFC agreed to pay disgorgement of $10 million and civil money penalties of $7 million. AEFC also agreed to retain an independent distribution consultant to assist in developing a plan for distribution of all disgorgement and civil penalties ordered by the SEC in accordance with various undertakings detailed at www.sec.gov/litigation/admin/ia-2451.pdf. Ameriprise Financial and its affiliates have cooperated with the SEC and the MDOC in these legal proceedings, and have made regular reports to the funds' Boards of Trustees.
Ameriprise Financial and certain of its affiliates have historically been involved in a number of legal, arbitration and regulatory proceedings, including routine litigation, class actions, and governmental actions, concerning matters arising in connection with the conduct of their business activities. Ameriprise Financial believes that the Funds are not currently the subject of, and that neither Ameriprise Financial nor any of its affiliates are the subject of, any pending legal, arbitration or regulatory proceedings that are likely to have a material adverse effect on the Funds or the ability of Ameriprise Financial or its affiliates to perform under their contracts with the Funds. Ameriprise Financial is required to make 10-Q, 10-K and, as necessary, 8-K filings with the Securities and Exchange Commission on legal and regulatory matters that relate to Ameriprise Financial and its affiliates. Copies of these filings may be obtained by accessing the SEC website at www.sec.gov.
There can be no assurance that these matters, or the adverse publicity associated with them, will not result in increased fund redemptions, reduced sale of fund shares or other adverse consequences to the Funds. Further, although we believe proceedings are not likely to have a material adverse effect on
the Funds or the ability of Ameriprise Financial or its affiliates to perform under their contracts with the Funds, these proceedings are subject to uncertainties and, as such, we are unable to estimate the possible loss or range of loss that may result. An adverse outcome in one or more of these proceedings could result in adverse judgments, settlements, fines, penalties or other relief that could have a material adverse effect on the consolidated financial condition or results of operations of Ameriprise Financial.
Annual Report 2012
29
Columbia Massachusetts Intermediate Municipal Bond Fund
Report of Independent Registered Public Accounting Firm
To the Trustees of Columbia Funds Series Trust I and
the Shareholders of Columbia Massachusetts Intermediate Municipal Bond Fund
In our opinion, the accompanying statement of assets and liabilities, including the portfolio of investments, and the related statements of operations and of changes in net assets and the financial highlights present fairly, in all material respects, the financial position of Columbia Massachusetts Intermediate Municipal Bond Fund (the "Fund") (a series of Columbia Funds Series Trust I) at October 31, 2012, the results of its operations for the year then ended, the changes in its net assets for each of the two years in the period then ended and the financial highlights for each of the periods indicated, in conformity with accounting principles generally accepted in the United States of America. These financial statements and financial highlights (hereafter referred to as "financial statements") are the responsibility of the Fund's management. Our responsibility is to express an opinion on these financial statements based on our audits. We conducted our audits of these financial statements in accordance with the standards of the Public Company Accounting Oversight Board (United States). Those standards require that we plan and perform the audit to obtain reasonable assurance about whether the financial statements are free of material misstatement. An audit includes examining, on a test basis, evidence supporting the amounts and disclosures in the financial statements, assessing the accounting principles used and significant estimates made by management, and evaluating the overall financial statement presentation. We believe that our audits, which included confirmation of securities at October 31, 2012 by correspondence with the custodian, brokers and transfer agent, provide a reasonable basis for our opinion.
PricewaterhouseCoopers LLP
Minneapolis, Minnesota
December 21, 2012
Annual Report 2012
30
Columbia Massachusetts Intermediate Municipal Bond Fund
Federal Income Tax Information
(Unaudited)
The Fund hereby designates the following tax attributes for the fiscal year ended October 31, 2012. Shareholders will be notified in early 2013 of amounts for use in preparing 2012 income tax returns.
Tax Designations:
Capital Gain Dividend | | $ | 247,395 | | |
Exempt-Interest Dividends | | | 100 | % | |
Capital Gain Dividend. The Fund designates as a capital gain dividend the amount reflected above, or if subsequently determined to be different, the net capital gain of such fiscal period.
Exempt-Interest Dividends. The percentage of net investment income distributions paid during the fiscal year that qualifies as exempt-interest dividends for federal income tax purposes.
Annual Report 2012
31
Columbia Massachusetts Intermediate Municipal Bond Fund
The Trustees serve terms of indefinite duration. The names, addresses and birth years of the Trustees and Officers of the Funds in Columbia Funds Series Trust I, the year each was first elected or appointed to office, their principal business occupations during at least the last five years, the number of Funds overseen by each Trustee and other directorships they hold are shown below. Each officer listed below serves as an officer of each Fund in Columbia Funds Series Trust I.
Independent Trustees
Name, Address and Year of Birth,
Position with Funds, Year First
Elected or Appointed to Office | | Principal Occupation(s) During Past Five Years, Number of Funds in Columbia
Funds Complex Overseen by Trustee, Other Directorships Held
| |
Rodman L. Drake (Born 1943)
c/o Columbia Management Investment Advisers, LLC
225 Franklin Street
Boston, MA 02110
Trustee (since 1994) and
Chairman of the Board (since 2009) | | Independent consultant since 2010; Co-Founder of Baringo Capital LLC (private equity) from 1997 to 2008; CEO of Crystal River Capital, Inc. (real estate investment trust) from 2003 to 2010; Oversees 52; Jackson Hewitt Tax Service Inc. (tax preparation services from 2004 to 2011); Celgene Corporation (global biotechnology company); Student Loan Corporation (student loan provider from 2005 to 2010); Celgene Corporation (global biotechnology company); The Helios Funds and Brookfield Funds (closed-end funds); Crystal River Capital, Inc. from 2005 to 2010; Parsons Brinckerhoff from 1995 to 2008; and Apex Silver Mines Ltd. from 2007 to 2009 | |
Douglas A. Hacker (Born 1955)
c/o Columbia Management Investment Advisers, LLC
225 Franklin Street
Boston, MA 02110
Trustee (since 1996) | | Independent business executive since May 2006; Executive Vice President — Strategy of United Airlines from December 2002 to May 2006; President of UAL Loyalty Services (airline marketing company) from September 2001 to December 2002; Executive Vice President and Chief Financial Officer of United Airlines from July 1999 to September 2001. Oversees 52; Nash Finch Company (food distributor); Aircastle Limited (aircraft leasing); and SeaCube Container Leasing Ltd. (container leasing) | |
Janet Langford Kelly (Born 1957)
c/o Columbia Management Investment Advisers, LLC
225 Franklin Street
Boston, MA 02110
Trustee (since 1996) | | Senior Vice President, General Counsel and Corporate Secretary, ConocoPhillips (integrated energy company) since September 2007; Deputy General Counsel — Corporate Legal Services, ConocoPhillips from August 2006 to August 2007; Partner, Zelle, Hofmann, Voelbel, Mason & Gette LLP (law firm) from March 2005 to July 2006; Adjunct Professor of Law, Northwestern University from September 2004 to June 2006; Director, UAL Corporation (airline) from February 2006 to July 2006; Chief Administrative Officer and Senior Vice President, Kmart Holding Corporation (consumer goods) from September 2003 to March 2004. Oversees 52; None | |
Nancy T. Lukitsh (Born 1956)
c/o Columbia Management Investment Advisers, LLC
225 Franklin Street
Boston, MA 02110
Trustee (since 2011) | | Senior Vice President, Partner and Director of Marketing, Wellington Management Company, LLP (investment adviser) from 1997 to 2010; Chair, Wellington Management Investment Portfolios (commingled non-U.S. investment pools) from 2007 to 2010; Director, Wellington Trust Company, NA and other Wellington affiliates from 1997 to 2010. Oversees 52; None | |
William E. Mayer (Born 1940)
c/o Columbia Management Investment Advisers, LLC
225 Franklin Street
Boston, MA 02110
Trustee (since 1994) | | Partner, Park Avenue Equity Partners (private equity) since February 1999; Dean and Professor, College of Business and Management, University of Maryland from 1992 to 1996. Oversees 52; DynaVox Inc. (speech creation); Lee Enterprises (print media); WR Hambrecht + Co. (financial service provider) from 2000 to 2012; BlackRock Kelso Capital Corporation (investment company) | |
David M. Moffett (Born 1952)
c/o Columbia Management Investment Advisers, LLC
225 Franklin Street
Boston, MA 02110
Trustee (since 2011) | | Retired. Chief Executive Officer, Federal Home Loan Mortgage Corporation, from 2008 to 2009; Senior Adviser, Global Financial Services Group, Carlyle Group, Inc., from 2007 to 2008; Vice Chairman and Chief Financial Officer, U.S. Bancorp, from 1993 to 2007. Oversees 52; CIT Group Inc. (commercial and consumer finance); eBay Inc. (online trading community); MBIA Inc. (financial service provider); E.W. Scripps Co. (print and television media), Building Materials Holding Corp. (building materials and construction services); and University of Oklahoma Foundation. | |
Charles R. Nelson (Born 1942)
c/o Columbia Management Investment Advisers, LLC
225 Franklin Street
Boston, MA 02110
Trustee (since 1981) | | Retired Professor Emeritus, University of Washington, since 2011; Professor of Economics, University of Washington from January 1976 to 2011; Ford and Louisa Van Voorhis Professor of Political Economy, University of Washington from 1993 to 2011; Adjunct Professor of Statistics, University of Washington from 1980 to 2011; Associate Editor, Journal of Money Credit and Banking from 1993 to 2008; consultant on econometric and statistical matters. Oversees 52; None | |
John J. Neuhauser (Born 1943)
c/o Columbia Management Investment Advisers, LLC
225 Franklin Street
Boston, MA 02110
Trustee (since 1984) | | President, Saint Michael's College, since August 2007; Director or Trustee of several non-profit organizations, including Fletcher Allen Health Care, Inc.; University Professor, Boston College from November 2005 to August 2007; Academic Vice President and Dean of Faculties, Boston College from August 1999 to October 2005. Oversees 52; Liberty All-Star Equity Fund and Liberty All-Star Growth Fund (closed-end funds) | |
Annual Report 2012
32
Columbia Massachusetts Intermediate Municipal Bond Fund
Trustees and Officers (continued)
Independent Trustees (continued)
Name, Address and Year of Birth,
Position with Funds, Year First
Elected or Appointed to Office | | Principal Occupation(s) During Past Five Years, Number of Funds in Columbia
Funds Complex Overseen by Trustee, Other Directorships Held
| |
Patrick J. Simpson (Born 1944)
c/o Columbia Management Investment Advisers, LLC
225 Franklin Street
Boston, MA 02110
Trustee (since 2000) | | Partner, Perkins Coie LLP (law firm). Oversees 52; None | |
Anne-Lee Verville (Born 1945)
c/o Columbia Management Investment Advisers, LLC
225 Franklin Street
Boston, MA 02110
Trustee (since 1998) | | Retired. General Manager — Global Education Industry from 1994 to 1997, President — Application Systems Division from 1991 to 1994, Chief Financial Officer — US Marketing & Services from 1988 to 1991, and Chief Information Officer from 1987 to 1988, IBM Corporation (computer and technology). Oversees 52; Enesco Group, Inc. (producer of giftware and home and garden decor products) from 2001 to 2006 | |
Interested Trustee
Name, Address and Year of Birth,
Position with Funds, Year First
Elected or Appointed to Office | | Principal Occupation(s) During Past Five Years, Number of Funds in Columbia
Funds Complex Overseen by Trustee, Other Directorships Held
| |
William F. Truscott (born 1960)
53600 Ameriprise Financial Center
Minneapolis, MN 55474
Senior Vice President (since 2012) | | Chairman of the Board and President, Columbia Management Investment Advisers, LLC since May 2010 and February 2012, respectively (previously President, Chairman of the Board and Chief Investment Officer, from 2001 to April 2010); Chief Executive Officer, U.S. Asset Management & President, Annuities, Ameriprise Financial, Inc. since May 2010 (previously President — U.S. Asset Management and Chief Investment Officer from 2005 to April 2010, and Senior Vice President — Chief Investment Officer, from 2001 to 2005); Director, President and Chief Executive Officer, Ameriprise Certificate Company since 2006; Director and Chief Executive Officer, Columbia Management Investment Distributors, Inc. since May 2010 and February 2012, respectively (previously Chairman of the Board and Chief Executive Officer from 2008 to April 2010); Chairman of the Board and Chief Executive Officer, RiverSource Distributors, Inc. since 2006. Oversees 208; Columbia Funds Board. | |
The Statement of Additional Information includes additional information about the Trustees of the Funds and is available, without charge, upon request by calling 1-800-345-6611.
Officers
Name, Year of Birth and Address | | Principal Occupation(s) During the Past Five Years | |
J. Kevin Connaughton (Born 1964)
225 Franklin Street
Boston, MA 02110
President (since 2009) | | Senior Vice President and General Manager — Mutual Fund Products, Columbia Management Investment Advisers, LLC since May 2010; President, Columbia Funds, since 2009, and RiverSource Funds, since May 2010 (previously Senior Vice President and Chief Financial Officer, Columbia Funds, from June 2008 to January 2009, Treasurer, Columbia Funds, from October 2003 to May 2008, and senior officer of various other affiliated funds since 2000); Managing Director, Columbia Management Advisors, LLC from December 2004 to April 2010. | |
Michael G. Clarke (Born 1969)
225 Franklin Street
Boston, MA 02110
Treasurer (since 2011) and Chief Financial Officer (since 2009) | | Vice President, Columbia Management Investment Advisers, LLC since May 2010; Managing Director of Fund Administration, Columbia Management Advisors, LLC, from September 2004 to April 2010; senior officer of Columbia Funds and affiliated funds since 2002. | |
Scott R. Plummer (Born 1959)
5228 Ameriprise Financial Center
Minneapolis, MN 55474
Senior Vice President, Assistant Secretary and Chief Legal Officer (since 2010) | | Senior Vice President, Chief Legal Officer and Assistant Secretary, Columbia Management Investment Advisers, LLC since June 2005; Vice President and Lead Chief Counsel — Asset Management, Ameriprise Financial, Inc. since May 2010 (previously Vice President and Chief Counsel — Asset Management, from 2005 to April 2010); Vice President, Chief Counsel and Assistant Secretary, Columbia Management Investment Distributors, Inc. since 2008; Vice President, General Counsel and Secretary, Ameriprise Certificate Company since 2005; Chief Counsel, RiverSource Distributors, Inc. since 2006; Vice President, General Counsel and Secretary, RiverSource Funds since December 2006; Senior Vice President, Secretary and Chief Legal Officer, Columbia Funds, since May 2010. | |
Annual Report 2012
33
Columbia Massachusetts Intermediate Municipal Bond Fund
Trustees and Officers (continued)
Officers (continued)
Name, Year of Birth and Address | | Principal Occupation(s) During the Past Five Years | |
William F. Truscott (Born 1960)
53600 Ameriprise Financial Center
Minneapolis, MN 55474
Senior Vice President (since 2010) | | Chairman of the Board and President, Columbia Management Investment Advisers, LLC since May 2010 and February 2012, respectively (previously President, Chairman of the Board and Chief Investment Officer, from 2001 to April 2010); Chief Executive Officer, U.S. Asset Management & President, Annuities, Ameriprise Financial, Inc. since May 2010 (previously President — U.S. Asset Management and Chief Investment Officer from 2005 to April 2010); Director, President and Chief Executive Officer, Ameriprise Certificate Company since 2006; Director and Chief Executive Officer, Columbia Management Investment Distributors, Inc. since May 2010 and February 2012, respectively (previously Chairman of the Board and Chief Executive Officer from 2008 to April 2010); Chairman of the Board and Chief Executive Officer, RiverSource Distributors, Inc. since 2006. | |
Thomas P. McGuire (Born 1972)
225 Franklin Street
Boston, MA 02110
Chief Compliance Officer (since 2012) | | Vice President — Asset Management Compliance, Columbia Management Investment Advisers, LLC since 2010; Chief Compliance Officer, Ameriprise Certificate Company, since September 2010; Compliance Executive, Bank of America, 2005-2010. | |
Colin Moore (Born 1958)
225 Franklin Street
Boston, MA 02110
Senior Vice President (since 2010) | | Director and Chief Investment Officer, Columbia Management Investment Advisers, LLC since May 2010; Manager, Managing Director and Chief Investment Officer of Columbia Management Advisors, LLC from 2007 to April 2010; Head of Equities, Columbia Management Advisors, LLC from 2002 to 2007. | |
Amy Johnson (Born 1965)
5228 Ameriprise Financial Center
Minneapolis, MN 55474
Vice President (since 2010) | | Senior Vice President and Chief Operating Officer, Columbia Management Investment Advisers, LLC since May 2010 (previously Chief Administrative Officer, from 2009 until April 2010, Vice President — Asset Management and Trust Company Services, from 2006 to 2009, and Vice President — Operations and Compliance from 2004 to 2006). | |
Joseph F. DiMaria (Born 1968)
225 Franklin Street
Boston, MA 02110
Vice President (since 2011) and Chief Accounting Officer (since 2008) | | Vice President, Mutual Fund Administration, Columbia Management Investment Advisers, LLC, since May 2010; Director of Fund Administration, Columbia Management Advisors, LLC from January 2006 to April 2010; Head of Tax/Compliance and Assistant Treasurer, Columbia Management Advisors, LLC, from November 2004 to December 2005. | |
Stephen T. Welsh (born 1957)
225 Franklin Street
Boston, MA 02110
Vice President (since 2006) | | President and Director, Columbia Management Investment Services Corp. since May 2010; President and Director, Columbia Management Services, Inc. from July 2004 to April 2010; Managing Director, Columbia Management Distributors, Inc. from August 2007 to April 2010. | |
Paul D. Pearson (born 1956)
10468 Ameriprise Financial Center
Minneapolis, MN 55474
Vice President and Assistant Treasurer (since 2011) | | Vice President, Investment Accounting, Columbia Management Investment Advisers, LLC, since May 2010; Vice President, Managed Assets, Investment Accounting, Ameriprise Financial Corporation. | |
Paul B. Goucher (born 1968)
5228 Ameriprise Financial Center
Minneapolis, MN 55474
Vice President and Assistant Secretary (since 2010) | | Vice President and Chief Counsel of Ameriprise Financial since January 2010 (formerly Vice President and Group Counsel from November 2008 to January 2010); Director, Managing Director and General Counsel of J. & W. Seligman & Co. Incorporated (Seligman) from July 2008 to November 2008 and Managing Director and Associate General Counsel of Seligman from January 2005 to July 2008. | |
Christopher O. Petersen (born 1970)
5228 Ameriprise Financial Center
Minneapolis, MN 55474
Vice President (since 2010) and Secretary (since 2011) | | Vice President and Chief Counsel, Ameriprise Financial since January 2010 (formerly Vice President and Group Counsel or Counsel from April 2004 to January 2010); Assistant Secretary of RiverSource Funds since January 2007; officer of Columbia Funds and affiliated funds since 2007. | |
Michael E. DeFao (born 1968)
225 Franklin Street
Boston, MA 02110
Vice President and Assistant Secretary (since 2011) | | Vice President and Chief Counsel, Ameriprise Financial since May 2010; Associate General Counsel, Bank of America from June 2005 to April 2010. | |
Annual Report 2012
34
Columbia Massachusetts Intermediate Municipal Bond Fund
Board Consideration and Approval of
Advisory Agreement
On June 6, 2012, the Board of Trustees (the "Board") and the Trustees who are not interested persons (as defined in the Investment Company Act of 1940) of the Trust (the "Independent Trustees") unanimously approved the continuation of the Investment Management Services Agreement (the "Advisory Agreement") with Columbia Management Investment Advisers, LLC (the "Investment Manager") with respect to Columbia Massachusetts Intermediate Municipal Bond Fund (the "Fund"), a series of the Trust. As detailed below, the Advisory Fees and Expenses Committee (the "Committee") and the Board met on multiple occasions to review and discuss, both among themselves and with the management team of the Investment Manager, materials provided by the Investment Manager before determining to approve the continuation of the Advisory Agreement.
In connection with their deliberations regarding the continuation of the Advisory Agreement, the Committee and the Board requested and evaluated materials from the Investment Manager regarding the Fund and the Advisory Agreement, and discussed these materials with representatives of the Investment Manager at the Committee meeting held on June 5, 2012 and at the Board meeting held on June 6, 2012. In addition, the Board considers matters bearing on the Advisory Agreement at most of its other meetings throughout the year and meets regularly with senior management of the Funds and the Investment Manager. Through the Board's Investment Oversight Committees, Trustees also meet with selected Fund portfolio managers and other investment personnel at various times throughout the year. The Committee and the Board also consulted with Fund counsel and with the Independent Trustees' independent legal counsel, who advised on the legal standard for consideration by the Board and otherwise assisted the Board in its deliberations. On June 5, 2012, the Committee recommended that the Board approve the continuation of the Advisory Agreement. On June 6, 2012, the Board, including the Independent Trustees, voting separately, unanimously approved the continuation of the Advisory Agreement for the Fund.
The Committee and the Board considered all information that they, their legal counsel, or the Investment Manager believed reasonably necessary to evaluate and to determine whether to approve the continuation of the Advisory Agreement. In their deliberations, the Trustees did not identify any particular information that was all-important or controlling, and individual Trustees may have attributed different weights to the various factors. The information and factors considered by the Committee and the Board in recommending for approval or approving the continuation of the Advisory Agreement for the Fund included the following:
• Information on the investment performance of the Fund relative to the performance of the Fund's benchmarks and the performance of a group of comparable mutual funds, as determined by an independent third-party data provider;
• Information on the Fund's advisory fees and total expenses, including information comparing the Fund's expenses to those of a group of comparable mutual funds, as determined by an independent third-party data provider;
• The Investment Manager's agreement to contractually limit or cap total operating expenses for the Fund so that total operating expenses (excluding certain fees and expenses, such as transaction costs and certain other investment related expenses, interest, taxes, acquired fund fees and expenses, and extraordinary expenses) would not exceed the median expenses of a group of comparable funds (as determined from time to time, generally annually, by an independent third-party data provider);
• The terms and conditions of the Advisory Agreement, including that the advisory fee rates payable by the Fund would not change;
• The terms and conditions of other agreements and arrangements with affiliates of the Investment Manager relating to the operations of the Fund, including the Administrative Services Agreement, the Distribution Agreement and the Transfer and Dividend Disbursing Agent Agreement, noting in the case of the Transfer and Dividend Disbursing Agent Agreement certain proposed changes to the fee rates payable thereunder;
• Descriptions of various functions performed by the Investment Manager under the Advisory Agreement, including portfolio management and portfolio trading practices;
• Information regarding the management fees and investment performance of any comparable portfolios of other clients of the Investment Manager, including institutional separate accounts; and
• The profitability to the Investment Manager and its affiliates from their relationships with the Fund.
Annual Report 2012
35
Columbia Massachusetts Intermediate Municipal Bond Fund
Board Consideration and Approval of
Advisory Agreement (continued)
Nature, Extent and Quality of Services to be Provided under the Advisory Agreement
The Committee and the Board considered the nature, extent and quality of services provided to the Fund by the Investment Manager and its affiliates under the Advisory Agreement and under separate agreements for the provision of transfer agency and administrative services, and the resources dedicated to the Fund and the other Columbia Funds by the Investment Manager and its affiliates. The Committee and the Board considered, among other things, the Investment Manager's ability to attract, motivate and retain highly qualified research, advisory and supervisory investment professionals (including personnel and other resources, compensation programs for personnel involved in fund management, reputation and other attributes), the portfolio management services provided by those investment professionals, the quality of the Investment Manager's investment research capabilities and trade execution services, and the other resources that the Investment Manager devotes to the Fund. The Committee and the Board also considered the potential benefits to shareholders of investing in a mutual fund that is part of a fund complex offering exposure to a variety of asset classes and investment disciplines and providing a variety of fund and shareholder services.
The Committee and the Board also considered the professional experience and qualifications of the senior personnel of the Investment Manager. The Committee and the Board noted the compliance programs of and the compliance-related resources provided to the Fund by the Investment Manager and its affiliates, and considered the Investment Manager's ability to provide administrative services to the Fund pursuant to a separate administrative services agreement, including the Investment Manager's ability to coordinate the activities of the Fund's other service providers. After reviewing these and related factors, the Committee and the Board concluded, within the context of their overall conclusions, that the expected nature, extent and quality of the services to be provided to the Fund under the Advisory Agreement supported the continuation of such agreement.
Investment Performance
The Committee and the Board reviewed information about the performance of the Fund over various time periods, including performance information relative to benchmarks and information based on reports of an independent third-party data provider that compared the performance of the Fund to the performance of a group of comparable mutual funds. The Committee and the Board also reviewed a description of the third party's methodology for identifying the Fund's peer groups for purposes of performance and expense comparisons. In the case of each Fund whose performance lagged that of a relevant peer group for certain (although not necessarily all) periods, the Committee and the Board concluded that other factors relevant to performance were sufficient, in light of other considerations, to warrant continuation of the Fund's Advisory Agreement. Those factors varied from fund to fund, but included one or more of the following: (i) that the Fund's performance, although lagging in certain recent periods, was stronger over the longer term; (ii) that the underperformance was attributable, to a significant extent, to investment decisions that were reasonable and consistent with the Fund's investment strategy and policies and that the Fund was performing within a reasonable range of expectations, given those investment decisions, market conditions and the Fund's investment strategy; (iii) that the Fund's performance was competitive when compared to other relevant performance benchmarks or peer groups; and (iv) that the Investment Manager had taken or was taking steps designed to help improve the Fund's investment performance, including, but not limited to, replacing portfolio managers, enhancing the resources supporting the portfolio managers, or modifying investment strategies.
The Committee and the Board noted that, through December 31, 2011, the Fund's performance was in the twenty-first, forty-sixth and twenty-fourth percentiles (where the best performance would be in the first percentile) of its category selected by an independent third-party data provider for the purposes of performance comparisons for the one-, three- and five- year periods, respectively.
The Committee and the Board also considered the Investment Manager's performance and reputation generally, the Investment Manager's historical responsiveness to Board concerns about performance and the Investment Manager's willingness to take steps intended to improve performance. After reviewing these and related factors, the Committee and the Board concluded, within the context of their overall conclusions regarding the Advisory Agreement, that the performance of the Fund and the Investment Manager was sufficient, in light of other considerations, to warrant the continuation of the Advisory Agreement.
Annual Report 2012
36
Columbia Massachusetts Intermediate Municipal Bond Fund
Board Consideration and Approval of
Advisory Agreement (continued)
Investment Advisory Fee Rates and Other Expenses
The Committee and the Board considered the advisory fees to be charged to the Fund under the Advisory Agreement as well as the total expenses to be incurred by the Fund. In assessing the reasonableness of the fees under the Advisory Agreement, the Committee and the Board considered, among other information, the Fund's advisory fee and its expected total expense ratio as a percentage of average daily net assets. The Committee and the Board noted that the Fund's actual management fee and total net expense ratio are both ranked in the first quintiles against the Fund's expense universe as determined by an independent third-party data provider for purposes of expense comparison. The Committee and the Board also took into account the fee waiver and expense limitation arrangements agreed to by the Investment Manager, as noted above.
The Committee and the Board also considered the fact that the advisory fee rates payable by the Fund to the Investment Manager under the Advisory Agreement were the same as those currently paid by the Fund to the Investment Manager.
The Committee and the Board also received and considered information about the advisory fees charged by the Investment Manager to institutional separate accounts. In considering the fees charged to those accounts, the Committee and the Board took into account, among other things, the Investment Manager's representations about the differences between managing mutual funds as compared to other types of accounts, including differences in the services provided, differences in the risk profile of such business for the Investment Manager and the additional resources required to manage mutual funds effectively. In evaluating the Fund's advisory fees, the Committee and the Board also took into account the demands, complexity and quality of the investment management of the Fund.
After reviewing these and related factors, the Committee and the Board concluded, within the context of their overall conclusions, that the advisory fee rates and expenses of the Fund supported the continuation of the Advisory Agreement.
Costs of Services to be Provided and Profitability
The Committee and the Board also took note of the costs of the services provided (both on an absolute and relative basis) and the profitability to the Investment Manager and its affiliates in connection with their relationships with the Fund. In evaluating these considerations, the Committee and the Board took note of the advisory fees charged by the Investment Manager to other clients, including fees charged by the Investment Manager to any institutional separate account clients with similar investment strategies to those of the Fund.
The Committee and the Board also considered the compensation directly or indirectly received by the Investment Manager's affiliates in connection with their relationships with the Fund. The Committee and the Board reviewed information provided by management as to the profitability of the Investment Manager and its affiliates of their relationships with the Fund, and information about the allocation of expenses used to calculate profitability. When reviewing profitability, the Committee and the Board also considered court cases in which adviser profitability was an issue in whole or in part, the performance of the fund, the expense ratio of the fund, and the implementation of expense limitations with respect to the fund. The Committee and the Board also considered information provided by the Investment Manager regarding its financial condition and comparing its profitability to that of other asset management firms that are, or are subsidiaries of, publicly traded companies.
After reviewing these and related factors, the Committee and the Board concluded, within the context of their overall conclusions, that the profitability to the Investment Manager and its affiliates from their relationships with the Fund supported the continuation of the Advisory Agreement.
Economies of Scale
The Committee and the Board considered the potential existence of economies of scale in the provision by the Investment Manager of services to the Fund, to groups of related funds, and to the Investment Manager's investment advisory clients as a whole, and whether those economies of scale were shared with the Fund through breakpoints in investment advisory fees or other means, such as expense limitation arrangements and additional investments by the Investment Manager in investment, trading and compliance resources. The Committee and the Board noted that the investment advisory fee schedules for the Fund contained breakpoints that would reduce the fee rate on assets above specified threshold levels.
In considering these issues, the Committee and the Board also considered the costs of the services provided (both on an absolute and relative basis) and the profitability to the Investment Manager and its affiliates from their relationships with the
Annual Report 2012
37
Columbia Massachusetts Intermediate Municipal Bond Fund
Board Consideration and Approval of
Advisory Agreement (continued)
Fund, as discussed above. After reviewing these and related factors, the Committee and the Board concluded, within the context of their overall conclusions, that the extent to which economies of scale were expected to be shared with the Fund supported the continuation of the Advisory Agreement.
Other Benefits to the Investment Manager
The Committee and the Board received and considered information regarding "fall-out" or ancillary benefits received by the Investment Manager and its affiliates as a result of their relationships with the Fund, such as the engagement of the Investment Manager to provide administrative services to the Fund and the engagement of the Investment Manager's affiliates to provide distribution and transfer agency services to the Fund. The Committee and the Board considered that the Fund's distributor retains a portion of the distribution fees from the Fund and receives a portion of the sales charges on sales or redemptions of certain classes of shares of the Fund. The Committee and the Board also considered the benefits of research made available to the Investment Manager by reason of brokerage commissions generated by the Fund's securities transactions, and reviewed information about the Investment Manager's practices with respect to allocating portfolio brokerage for brokerage and research services. The Committee and the Board considered the possible conflicts of interest associated with certain fall-out or other ancillary benefits and the reporting, disclosure and other processes that would be in place to address such possible conflicts of interest. The Committee and the Board recognized that the Investment Manager's profitability would be somewhat lower without these benefits.
Conclusion
The Committee and the Board reviewed all of the above considerations in reaching their decisions to recommend or approve the continuation of the Advisory Agreement. No single item was identified as paramount or controlling, and individual Trustees may have attributed different weights to various factors. Based on their evaluation of all factors that they deemed to be material, including those factors described above, and assisted by the advice of independent legal counsel, the Board, including the Independent Trustees, voting separately, unanimously approved the continuation of the Advisory Agreement.
Annual Report 2012
38
This page intentionally left blank.
Annual Report 2012
39
This page intentionally left blank.
Annual Report 2012
40
Columbia Massachusetts Intermediate Municipal Bond Fund
Important Information About This Report
Each fund mails one shareholder report to each shareholder address. If you would like more than one report, please call shareholder services at 800.345.6611 and additional reports will be sent to you.
The policy of the Board is to vote the proxies of the companies in which each fund holds investments consistent with the procedures as stated in the Statement of Additional Information (SAI). You may obtain a copy of the SAI without charge by calling 800.345.6611; contacting your financial intermediary; visiting columbiamanagement.com; or searching the website of the Securities and Exchange Commission (SEC) at sec.gov. Information regarding how each fund voted proxies relating to portfolio securities is filed with the SEC by August 31 for the most recent 12-month period ending June 30 of that year, and is available without charge by visiting columbiamanagement.com; or searching the website of the SEC at sec.gov.
Each fund files a complete schedule of portfolio holdings with the SEC for the first and third quarters of each fiscal year on Form N-Q. Each fund's Form N-Q is available on the SEC's website at sec.gov and may be reviewed and copied at the SEC's Public Reference Room in Washington, D.C. Information on the operation of the Public Reference Room may be obtained by calling 800.SEC.0330. Each fund's complete schedule of portfolio holdings, as filed on Form N-Q, can also be obtained without charge, upon request, by calling 800.345.6611.
Annual Report 2012
41

Columbia Massachusetts Intermediate Municipal Bond Fund
P.O. Box 8081
Boston, MA 02266-8081
columbiamanagement.com
This information is for use with concurrent or prior delivery of a fund prospectus. Please read and consider the investment objectives, risks, charges and expenses for any fund carefully before investing. For a prospectus which contains this and other important information about the Fund go to columbiamanagement.com. The Fund is distributed by Columbia Management Investment Distributors, Inc., member FINRA, and managed by Columbia Management Investment Advisers, LLC.
© 2012 Columbia Management Investment Advisers, LLC. All rights reserved.
C-1028 D (12/12)
Annual Report
October 31, 2012

Columbia Massachusetts Tax-Exempt Fund
Not FDIC insured • No bank guarantee • May lose value
Columbia Massachusetts Tax-Exempt Fund
 Dear Shareholders,
Stocks rebound around the world
After a weak second quarter, U.S. stock market averages rebounded in the third quarter, erasing earlier losses and boosting year-to-date returns well into double digits. Welcome news from Europe and additional quantitative easing in the United States by the Federal Reserve Board helped bolster the rally. The Standard & Poor's 500 Index (S&P 500 Index) rose 6.35% (total return) for the quarter. The Dow Jones Industrial Average advanced 4.32% for the same period. From the beginning of the calendar year through September 30, 2012, the S&P 500 Index was up 16.44% (total return). And, as of the end of September, the S&P 500 Index stood at 1,440 — approximately 8% below its all-time high of 1,565 that was set on October 9, 2007.
Outside the United States, stock markets of both developed and emerging market economies rebounded, as measured in U.S. dollars. Investors responded favorably to the announcement of policy measures aimed to resolve the eurozone crisis, which could potentially have a favorable impact on growth in emerging market economies. A weaker dollar also benefited returns to U.S. investors.
Solid gains for fixed income
Within fixed income, investors appeared to be increasingly willing to take on risk as they abandoned higher quality sectors that dominated the performance rankings in the second quarter and favored riskier sectors, where yield spreads tightened by a significant margin. Fixed-income returns were strong, but unlike equities, they have been less volatile, accumulating steadily over the course of the year. Gains were the highest for high-yield and emerging market bonds. By contrast, government issued debt securities eked out smaller gains.
Stay on track with Columbia Management
Backed by more than 100 years of experience, Columbia Management is one of the nation's largest asset managers. At the heart of our success — and, most importantly, that of our investors — are highly talented industry professionals, brought together by a unique way of working. We are dedicated to helping you take advantage of today's opportunities and anticipate tomorrow's. We stay abreast of the latest investment trends and ideas, using our collective insight to evaluate events and transform them into solutions you can use.
Visit columbiamanagement.com for:
> The Columbia Management Perspectives blog, featuring timely posts by our investment teams
> Detailed up-to-date fund performance and portfolio information
> Economic analysis and market commentary
> Quarterly fund commentaries
> Columbia Management Investor, our award-winning quarterly newsletter for shareholders
Thank you for your continued support of the Columbia Funds. We look forward to serving your investment needs for many years to come.
Best Regards,

J. Kevin Connaughton
President, Columbia Funds
The S&P 500 Index, an unmanaged index, measures the performance of 500 widely held, large-capitalization U.S. stocks and is frequently used as a general measure of market performance. The Dow Jones Industrial Average is a price weighted average of 30 actively traded shares of blue chip US industrial corporations listed on the New York Stock Exchange. Indices are not available for investment, are not professionally managed and do not reflect sales charges, fees, brokerage commissions, taxes or other expenses of investing.
Investors should consider the investment objectives, risks, charges and expenses of a mutual fund carefully before investing. For a free prospectus, which contains this and other important information about a fund, visit columbiamanagement.com. The prospectus should be read carefully before investing.
Columbia Funds are distributed by Columbia Management Investment Distributors, Inc., member FINRA, and managed by Columbia Management Investment Advisers, LLC.
© 2012 Columbia Management Investment Advisers, LLC. All rights reserved.
Columbia Massachusetts Tax-Exempt Fund
Performance Overview | | | 2 | | |
Manager Discussion of Fund Performance | | | 4 | | |
Understanding Your Fund's Expenses | | | 6 | | |
Portfolio of Investments | | | 7 | | |
Statement of Assets and Liabilities | | | 13 | | |
Statement of Operations | | | 15 | | |
Statement of Changes in Net Assets | | | 16 | | |
Financial Highlights | | | 18 | | |
Notes to Financial Statements | | | 22 | | |
Report of Independent Registered
Public Accounting Firm | | | 27 | | |
Federal Income Tax Information | | | 28 | | |
Trustees and Officers | | | 29 | | |
Board Consideration and Approval of Advisory Agreement | | | 32 | | |
Important Information About This Report | | | 37 | | |
Fund Investment Manager
Columbia Management Investment
Advisers, LLC
225 Franklin Street
Boston, MA 02110
Fund Distributor
Columbia Management Investment
Distributors, Inc.
225 Franklin Street
Boston, MA 02110
Fund Transfer Agent
Columbia Management Investment
Services Corp.
P.O. Box 8081
Boston, MA 02266-8081
For more information about any of the funds, please visit columbiamanagement.com or call 800.345.6611. Customer Service Representatives are available to answer your questions Monday through Friday from 8 a.m. to 8 p.m. Eastern time.
The views expressed in this report reflect the current views of the respective parties. These views are not guarantees of future performance and involve certain risks, uncertainties and assumptions that are difficult to predict, so actual outcomes and results may differ significantly from the views expressed. These views are subject to change at any time based upon economic, market or other conditions and the respective parties disclaim any responsibility to update such views. These views may not be relied on as investment advice and, because investment decisions for a Columbia Fund are based on numerous factors, may not be relied on as an indication of trading intent on behalf of any particular Columbia Fund. References to specific securities should not be construed as a recommendation or investment advice.
Columbia Massachusetts Tax-Exempt Fund
Performance Summary
> Columbia Massachusetts Tax-Exempt Fund (the Fund) Class A shares returned 9.50% excluding sales charges for the 12-month period that ended October 31, 2012.
> The Fund outperformed its benchmarks, the broader Barclays Municipal Bond Index and the Barclays Massachusetts Municipal Bond Index, which returned 9.03% and 8.29%, respectively, during the period, but trailed the average return of the funds in its peer group, the Lipper Massachusetts Municipal Debt Funds Classification, which returned 10.05% for the 12 months.
> The Fund's credit-quality and interest-rate positioning aided relative performance, as did issue selection in certain sectors.
Average Annual Total Returns (%) (for period ended October 31, 2012)
| | Inception | | 1 Year | | 5 Years | | 10 Years | |
Class A | | 04/10/87 | | | | | | | | | | | | | |
Excluding sales charges | | | | | | | 9.50 | | | | 5.70 | | | | 4.94 | | |
Including sales charges | | | | | | | 4.36 | | | | 4.68 | | | | 4.43 | | |
Class B | | 06/08/92 | | | | | | | | | | | | | |
Excluding sales charges | | | | | | | 8.68 | | | | 4.91 | | | | 4.16 | | |
Including sales charges | | | | | | | 3.68 | | | | 4.58 | | | | 4.16 | | |
Class C | | 08/01/97 | | | | | | | | | | | | | |
Excluding sales charges | | | | | | | 9.01 | | | | 5.22 | | | | 4.47 | | |
Including sales charges | | | | | | | 8.01 | | | | 5.22 | | | | 4.47 | | |
Class Z* | | 09/01/11 | | | 9.66 | | | | 5.73 | | | | 4.96 | | |
Barclays Municipal Bond Index | | | | | | | 9.03 | | | | 6.02 | | | | 5.24 | | |
Barclays Massachusetts Municipal Bond Index | | | | | | | 8.29 | | | | 6.18 | | | | 5.25 | | |
Lipper Massachusetts Municipal Debt Funds Classification | | | | | | | 10.05 | | | | 5.06 | | | | 4.57 | | |
Returns for Class A are shown with and without the maximum initial sales charge of 4.75%. Returns for Class B are shown with and without the applicable contingent deferred sales charge (CDSC) of 5.00% in the first year, declining to 1.00% in the sixth year and eliminated thereafter. Returns for Class C are shown with and without the 1.00% CDSC for the first year only. The Fund's other classes are not subject to sales charges and have limited eligibility. Please see the Fund's prospectuses for details. Performance for different share classes will vary based on differences in sales charges and fees associated with each class. All results shown assume reinvestment of distributions during the period. Returns do not reflect the deduction of taxes that a shareholder may pay on Fund distributions or on the redemption of Fund shares. Performance results reflect the effect of any fee waivers or reimbursements of Fund expenses by Columbia Management Investment Advisers, LLC and/or any of its affiliates. Absent these fee waivers or expense reimbursement arrangements, performance results would have been lower.
The performance information shown represents past performance and is not a guarantee of future results. The investment return and principal value of your investment will fluctuate so that your shares, when redeemed, may be worth more or less than their original cost. Current performance may be lower or higher than the performance information shown. You may obtain performance information current to the most recent month-end by contacting your financial intermediary, visiting columbiamanagement.com or calling 800.345.6611.
*The returns shown for periods prior to the share class inception date (including returns since inception if shown, which are since Fund inception) include the returns of the Fund's oldest share class. These returns are adjusted to reflect any higher class-related operating expenses of the newer share classes, as applicable. Please visit columbiamanagement.com/mutual-funds/appended-performance for more information.
The Barclays Municipal Bond Index is an unmanaged index considered representative of the broad market for investment-grade, tax-exempt bonds with a maturity of at least one year.
The Barclays Massachusetts Municipal Bond Index is a subset of the Barclays Municipal Bond Index consisting solely of bonds issued in the commonwealth of Massachusetts.
The Lipper Massachusetts Municipal Debt Funds Classification is a calculation of average total returns of mutual funds that limit assets to those securities exempt from taxation in the commonwealth of Massachusetts.
Indices are not available for investment, are not professionally managed and do not reflect sales charges, fees, brokerage commissions, taxes or other expenses of investing. Securities in the Fund may not match those in an index.
Annual Report 2012
2
Columbia Massachusetts Tax-Exempt Fund
Performance Overview (continued)
Performance of a Hypothetical $10,000 Investment (November 1, 2002 – October 31, 2012)
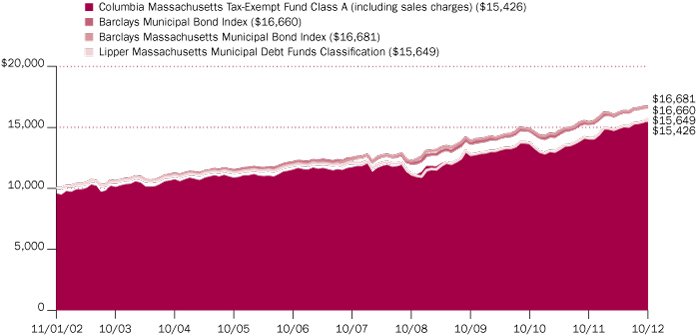
The chart above shows the change in value of a hypothetical $10,000 investment in Class A shares of Columbia Massachusetts Tax-Exempt Fund during the stated time period, and does not reflect the deduction of taxes that a shareholder may pay on Fund distributions or on the redemption of Fund shares.
Annual Report 2012
3
Columbia Massachusetts Tax-Exempt Fund
Manager Discussion of Fund Performance
For the 12-month period that ended October 31, 2012, the Fund's Class A shares returned 9.50% excluding sales charges. The Fund outperformed its benchmarks, the broader Barclays Municipal Bond Index and the Barclays Massachusetts Municipal Bond Index, which returned 9.03% and 8.29%, respectively, during the period. Performance trailed the average return of the peer group, the Lipper Massachusetts Municipal Debt Funds Classification, which was 10.05% for the 12 months. Overweights in longer-maturity, more interest-rate sensitive issues and lower-quality investment-grade bonds helped performance relative to both benchmarks, while a small cash position and disappointing security selection in certain sectors hampered results.
Municipal Bonds Rally as Yields Fall
Market conditions were favorable for municipal bonds over the 12-month period. Although the sovereign debt problems in Europe created global economic uncertainty, the U.S. economic outlook improved with modest gains in employment, manufacturing and housing. Tax collections rose in many states, while governments continued to make difficult budget decisions to improve their fiscal outlooks. Investor demand for tax-exempt bonds remained strong, helping to drive municipal bond yields down and prices up across all maturities. With interest rates declining to near all-time lows, investors sought the higher yields offered by bonds with maturities of 15+ years and those with credit ratings of A or lower. Longer-term and lower quality issues outperformed shorter-term and higher quality securities by a sizable margin. Top-performing sectors included industrial development/pollution control revenue, hospitals and leasing, all of which posted returns of 10% or more.
Gains from Long Maturity and Lower Credit Quality Bias
The Fund benefited from having an above-average sensitivity to interest rate changes with an overweight in longer-maturity bonds, which outperformed as their yields fell more than those on shorter-term bonds. In addition, long-term bond prices gained from a confluence of strong demand and decreased supply, which occurred as many issuers retired older, longer-maturity debt with higher interest costs and refunded with new lower-rate, intermediate-maturity securities. An overweight in hospital bonds, which tend to be lower quality, further aided relative results as credit spreads — the difference between yields on high-and low-quality bonds — tightened. Security selection in the housing, education and industrial development/pollution control revenue segments also made a positive contribution to relative performance. By contrast, issue selection in the water-and-sewer and hospital sectors hurt relative results.
Shifts in Sector Weights and Credit Quality
To help increase yield and total return, we boosted exposure to higher-yielding hospital and multifamily housing bonds. We also added to the state general obligation (G.O.) sector and trimmed the Fund's stake in the higher quality pre-refunded and water-and-sewer segments. Pre-refunding occurs when an issuer sells a new bond at a lower rate to pay off higher-rate issues. The proceeds from the sale are invested into an escrow account (typically short-term government securities), which generates interest that is used to pay the interest on the original bonds until they are called (or mature). We also boosted yield by increasing our stake in A and BBB rated bonds and reducing exposure to higher quality, AA rated issues.
Portfolio Management
Catherine Stienstra
Quality Breakdown (%)
(at October 31, 2012) | |
AAA rating | | | 9.1 | | |
AA rating | | | 41.3 | | |
A rating | | | 31.2 | | |
BBB rating | | | 8.6 | | |
Non-investment grade | | | 2.1 | | |
Not rated | | | 7.7 | | |
Total | | | 100.0 | | |
Percentages indicated are based upon total fixed income securities (excluding Money Market Funds).
Bond ratings apply to the underlying holdings of the Fund and not the Fund itself and are divided into categories ranging from AAA (highest) to D (lowest), and are subject to change. The ratings shown are determined by using the middle rating of Moody's, S&P, and Fitch after dropping the highest and lowest available ratings. When a rating from only two agencies is available, the lower rating is used. When a rating from only one agency is available, that rating is used. When a bond is not rated by any of these agencies, it is designated as Not rated. Credit ratings are subjective opinions and not statements of fact.
Annual Report 2012
4
Columbia Massachusetts Tax-Exempt Fund
Manager Discussion of Fund Performance (continued)
Looking Ahead
Going forward, we will be monitoring closely what happens with the automatic federal spending cuts and tax increases scheduled for January 1, 2013. An increase in the taxes paid by high-income earners, for example, could boost demand for municipal bonds, while potential elimination of the sector's tax-exempt status could pressure returns. As long as credit spreads are expected to tighten and short-term interest rates projected to remain low, the Fund will likely maintain a longer-maturity and lower quality bias within the investment-grade universe.
We expect Massachusetts to keep its high (Aa1) credit rating from Moody's amid a backdrop of continued slow economic growth. We're encouraged by the Commonwealth's relative resilience, with unemployment in September 2012 at 6.5%, well below the 7.8% national average. In addition, the Commonwealth's growing high-tech industry and well-educated workforce remain strengths. On the downside are the high costs of doing business in Massachusetts, an expensive housing market and above-average exposure to Europe's economic woes through exports to that region. Plus, many local governments continue to struggle with declining revenues. Given this environment, we think credit downgrades will continue to outpace upgrades, while the rate of defaults will be relatively benign. As always, the Fund's security selection will rely heavily on the proprietary credit research generated by our in-house team of analysts.
Annual Report 2012
5
Columbia Massachusetts Tax-Exempt Fund
Understanding Your Fund's Expenses
(Unaudited)
As an investor, you incur two types of costs. There are transaction costs, which generally include sales charges on purchases and may include redemption fees. There are also ongoing costs, which generally include management fees, distribution and service (Rule 12b-1) fees, and other fund expenses. The following information is intended to help you understand your ongoing costs (in dollars) of investing in the Fund and to help you compare these costs with the ongoing costs of investing in other mutual funds.
Analyzing Your Fund's Expenses
To illustrate these ongoing costs, we have provided examples and calculated the expenses paid by investors in each share class of the Fund during the period. The actual and hypothetical information in the table is based on an initial investment of $1,000 at the beginning of the period indicated and held for the entire period. Expense information is calculated two ways and each method provides you with different information. The amount listed in the "Actual" column is calculated using the Fund's actual operating expenses and total returns for the period. You may use the Actual information, together with the amount invested, to estimate the expenses that you paid over the period. Simply divide your account value by $1,000 (for example, an $8,600 account value divided by $1,000 = 8.6), then multiply the results by the expenses paid during the period under the Actual column. The amount listed in the "Hypothetical" column assumes a 5% annual rate of return before expenses (which is not the Fund's actual return) and then applies the Fund's actual expense ratio for the period to the hypothetical return. You should not use the hypothetical account values and expenses to estimate either your actual account balance at the end of the period or the expenses you paid during the period. See "Compare With Other Funds" below for details on how to use the hypothetical data.
Compare With Other Funds
Since all mutual funds are required to include the same hypothetical calculations about expenses in shareholder reports, you can use this information to compare the ongoing cost of investing in the Fund with other funds. To do so, compare the hypothetical example with the 5% hypothetical examples that appear in the shareholder reports of other funds. As you compare hypothetical examples of other funds, it is important to note that hypothetical examples are meant to highlight the ongoing costs of investing in a fund only and do not reflect any transaction costs, such as redemption or exchange fees, or expenses that apply to the subaccount or the contract. Therefore, the hypothetical calculations are useful in comparing ongoing costs only, and will not help you determine the relative total costs of owning different funds. If transaction costs were included in these calculations, your costs would be higher.
May 1, 2012 – October 31, 2012
| | Account Value at the Beginning
of the Period ($) | | Account Value at the End of the
Period ($) | | Expenses Paid During the
Period ($) | | Fund's Annualized
Expense Ratio (%) | |
| | Actual | | Hypothetical | | Actual | | Hypothetical | | Actual | | Hypothetical | | Actual | |
Class A | | | 1,000.00 | | | | 1,000.00 | | | | 1,034.00 | | | | 1,021.17 | | | | 4.04 | | | | 4.01 | | | | 0.79 | | |
Class B | | | 1,000.00 | | | | 1,000.00 | | | | 1,030.00 | | | | 1,017.39 | | | | 7.86 | | | | 7.81 | | | | 1.54 | | |
Class C | | | 1,000.00 | | | | 1,000.00 | | | | 1,031.60 | | | | 1,018.90 | | | | 6.33 | | | | 6.29 | | | | 1.24 | | |
Class Z | | | 1,000.00 | | | | 1,000.00 | | | | 1,034.10 | | | | 1,022.42 | | | | 2.76 | | | | 2.75 | | | | 0.54 | | |
Expenses paid during the period are equal to the annualized expense ratio for each class as indicated above, multiplied by the average account value over the period and then multiplied by the number of days in the Fund's most recent fiscal half year and divided by 366.
Expenses do not include fees and expenses incurred indirectly by the Fund from the underlying funds in which the Fund may invest (also referred to as "acquired funds"), including affiliated and non-affiliated pooled investment vehicles (including mutual funds and exchange-traded funds).
Had Columbia Management Investment Advisers, LLC and/or certain of its affiliates not waived/reimbursed certain fees and expenses, account value at the end of the period would have been reduced.
Annual Report 2012
6
Columbia Massachusetts Tax-Exempt Fund
Portfolio of Investments
October 31, 2012
(Percentages represent value of investments compared to net assets)
Municipal Bonds 94.0%
Issue
Description | | Coupon
Rate | | Principal
Amount ($) | | Value ($) | |
Air Transportation 1.5% | |
Massachusetts Port Authority
Revenue Bonds
Bosfuel Project
Series 2007 (NPFGC/FGIC) AMT(a)
07/01/32 | | | 5.000 | % | | | 2,000,000 | | | | 2,084,260 | | |
Airport 2.5% | |
Massachusetts Port Authority
Revenue Bonds
Conrac Project
Series 2011A
07/01/41 | | | 5.125 | % | | | 3,000,000 | | | | 3,356,820 | | |
Assisted Living 0.8% | |
Massachusetts Development Finance Agency
Refunding Revenue Bonds
1st Mortgage-VOA Concord
Series 2007
11/01/41 | | | 5.200 | % | | | 1,145,000 | | | | 1,084,716 | | |
Higher Education 19.0% | |
Massachusetts Development Finance Agency
Revenue Bonds
Boston University
Series 1999P
05/15/59 | | | 6.000 | % | | | 1,000,000 | | | | 1,262,850 | | |
Series 2005T-1 (AMBAC)
10/01/39 | | | 5.000 | % | | | 2,000,000 | | | | 2,080,180 | | |
Merrimack College
Series 2012A
07/01/32 | | | 5.000 | % | | | 1,450,000 | | | | 1,565,231 | | |
Northeastern University
Series 2012
10/01/31 | | | 5.000 | % | | | 550,000 | | | | 640,656 | | |
Smith College
Series 2005
07/01/35 | | | 5.000 | % | | | 3,000,000 | | | | 3,267,630 | | |
Massachusetts Health & Educational Facilities Authority
Revenue Bonds
Boston College
Series 2008M-2
06/01/35 | | | 5.500 | % | | | 2,500,000 | | | | 3,439,250 | | |
Harvard University
Series 1991N
04/01/20 | | | 6.250 | % | | | 2,675,000 | | | | 3,622,378 | | |
Series 2009A
11/15/36 | | | 5.500 | % | | | 1,000,000 | | | | 1,210,980 | | |
Northeastern University
Series 2008T-2
10/01/30 | | | 5.000 | % | | | 1,000,000 | | | | 1,168,560 | | |
Suffolk University
Series 2009A
07/01/30 | | | 6.250 | % | | | 1,000,000 | | | | 1,165,430 | | |
Municipal Bonds (continued)
Issue
Description | | Coupon
Rate | | Principal
Amount ($) | | Value ($) | |
Tufts University
Series 2008
08/15/38 | | | 5.375 | % | | | 1,000,000 | | | | 1,212,830 | | |
Massachusetts State College Building Authority
Refunding Revenue Bonds
Senior Series 1994A
05/01/14 | | | 7.500 | % | | | 1,260,000 | | | | 1,339,960 | | |
Revenue Bonds
Series 2008A (AGM)
05/01/38 | | | 5.000 | % | | | 3,000,000 | | | | 3,388,680 | | |
Total | | | | | | | 25,364,615 | | |
Hospital 7.4% | |
Massachusetts Development Finance Agency
Revenue Bonds
Berkshire Health System
Series 2012G
10/01/30 | | | 5.000 | % | | | 1,500,000 | | | | 1,677,105 | | |
Boston Medical Center
Series 2012C
07/01/29 | | | 5.000 | % | | | 1,000,000 | | | | 1,093,310 | | |
Covenant Health System Obligation Group
Series 2012
07/01/31 | | | 5.000 | % | | | 1,000,000 | | | | 1,094,580 | | |
Partners Healthcare
Series 2012L
07/01/36 | | | 5.000 | % | | | 1,000,000 | | | | 1,132,020 | | |
Massachusetts Health & Educational Facilities Authority
Revenue Bonds
Caregroup
Series 2008E-1
07/01/33 | | | 5.125 | % | | | 2,000,000 | | | | 2,123,380 | | |
Massachusetts Eye & Ear Infirmary
Series 2010C
07/01/35 | | | 5.375 | % | | | 1,000,000 | | | | 1,083,780 | | |
Partners Healthcare
Series 2010J-1
07/01/34 | | | 5.000 | % | | | 1,500,000 | | | | 1,660,875 | | |
Total | | | | | | | 9,865,050 | | |
Hotels 1.3% | |
Boston Industrial Development Financing Authority
Revenue Bonds
Crosstown Center Project
Senior Series 2002 AMT(a)(b)
09/01/35 | | | 6.500 | % | | | 2,185,000 | | | | 1,715,290 | | |
Human Service Provider 0.6% | |
Massachusetts Development Finance Agency
Revenue Bonds
Evergreen Center, Inc.
Series 2005
01/01/35 | | | 5.500 | % | | | 750,000 | | | | 756,022 | | |
The accompanying Notes to Financial Statements are an integral part of this statement.
Annual Report 2012
7
Columbia Massachusetts Tax-Exempt Fund
Portfolio of Investments (continued)
October 31, 2012
Municipal Bonds (continued)
Issue
Description | | Coupon
Rate | | Principal
Amount ($) | | Value ($) | |
Joint Power Authority 2.5% | |
Berkshire Wind Power Cooperative Corp.
Revenue Bonds
Series 2010-1
07/01/30 | | | 5.250 | % | | | 1,000,000 | | | | 1,093,450 | | |
Massachusetts Municipal Wholesale Electric Co.
Revenue Bonds
Project 6
Series 2012A
07/01/15 | | | 5.000 | % | | | 2,000,000 | | | | 2,215,000 | | |
Total | | | | | | | 3,308,450 | | |
Multi-Family 3.6% | |
Massachusetts Housing Finance Agency(a)
Revenue Bonds
Housing
Series 2011A AMT
12/01/36 | | | 5.250 | % | | | 2,000,000 | | | | 2,134,140 | | |
Series 2010C AMT
12/01/30 | | | 5.000 | % | | | 1,000,000 | | | | 1,077,020 | | |
12/01/42 | | | 5.350 | % | | | 1,500,000 | | | | 1,614,675 | | |
Total | | | | | | | 4,825,835 | | |
Municipal Power 0.6% | |
Puerto Rico Electric Power Authority
Refunding Revenue Bonds
Series 2007VV (NPFGC)(c)
07/01/29 | | | 5.250 | % | | | 750,000 | | | | 808,995 | | |
Nursing Home 0.5% | |
Massachusetts Industrial Finance Agency
Refunding Revenue Bonds
Chelsea Jewish
Series 1997A (FHA)
08/01/37 | | | 6.500 | % | | | 670,000 | | | | 671,655 | | |
Other Bond Issue 4.5% | |
Massachusetts Development Finance Agency
Revenue Bonds
Broad Institute
Series 2011A
04/01/37 | | | 5.250 | % | | | 3,000,000 | | | | 3,398,490 | | |
WGBH Educational Foundation
Series 2002A (AMBAC)
01/01/42 | | | 5.750 | % | | | 2,000,000 | | | | 2,653,800 | | |
Total | | | | | | | 6,052,290 | | |
Pool/Bond Bank 4.3% | |
Massachusetts Water Pollution Abatement Trust (The)
Refunding Revenue Bonds
Pool Program
Series 2006
08/01/30 | | | 5.250 | % | | | 1,000,000 | | | | 1,342,480 | | |
Municipal Bonds (continued)
Issue
Description | | Coupon
Rate | | Principal
Amount ($) | | Value ($) | |
Revenue Bonds
MWRA Program
Subordinated Series 1999A
08/01/17 | | | 6.000 | % | | | 2,445,000 | | | | 3,029,942 | | |
State Revolving Fund
Series 2009-14
08/01/38 | | | 5.000 | % | | | 1,200,000 | | | | 1,412,952 | | |
Total | | | | | | | 5,785,374 | | |
Prep School 2.9% | |
Massachusetts Development Finance Agency
Revenue Bonds
Education-Dexter School Project
Series 2007
05/01/26 | | | 4.500 | % | | | 1,600,000 | | | | 1,691,808 | | |
Foxborough Regional Charter School
Series 2010A
07/01/42 | | | 7.000 | % | | | 1,000,000 | | | | 1,182,560 | | |
Massachusetts Industrial Finance Agency
Revenue Bonds
Cambridge Friends School
Series 1998
09/01/18 | | | 5.750 | % | | | 1,000,000 | | | | 1,000,750 | | |
Total | | | | | | | 3,875,118 | | |
Refunded/Escrowed 9.5% | |
Massachusetts Bay Transportation Authority
Revenue Bonds
General Transportation
Series 1991 Escrowed to Maturity (NPFGC)
03/01/21 | | | 7.000 | % | | | 630,000 | | | | 718,862 | | |
Massachusetts State College Building Authority(d)
Revenue Bonds
Capital Appreciation
Senior Series 1999A Escrowed to Maturity (NPFGC)
05/01/18 | | | 0.000 | % | | | 4,000,000 | | | | 3,718,840 | | |
05/01/23 | | | 0.000 | % | | | 3,000,000 | | | | 2,332,080 | | |
Massachusetts Water Resources Authority
Revenue Bonds
General
Series 1993C Escrowed to Maturity (AMBAC/TCRS)
12/01/15 | | | 5.250 | % | | | 610,000 | | | | 653,609 | | |
Series 1992A Escrowed to Maturity
07/15/19 | | | 6.500 | % | | | 2,100,000 | | | | 2,512,104 | | |
Puerto Rico Public Finance Corp.
Revenue Bonds
Commonwealth Appropriation
Series 1998A (AMBAC)(c)
06/01/19 | | | 5.375 | % | | | 2,190,000 | | | | 2,764,612 | | |
Total | | | | | | | 12,700,107 | | |
The accompanying Notes to Financial Statements are an integral part of this statement.
Annual Report 2012
8
Columbia Massachusetts Tax-Exempt Fund
Portfolio of Investments (continued)
October 31, 2012
Municipal Bonds (continued)
Issue
Description | | Coupon
Rate | | Principal
Amount ($) | | Value ($) | |
Retirement Communities 2.4% | |
Massachusetts Development Finance Agency
Revenue Bonds
1st Mortgage-Loomis Communities Project
Series 2002A
03/01/32 | | | 6.900 | % | | | 1,000,000 | | | | 1,021,390 | | |
Linden Ponds, Inc. Facility
Series 2011A-1
11/15/46 | | | 6.250 | % | | | 2,127,125 | | | | 1,568,457 | | |
Series 2011A-2
11/15/46 | | | 5.500 | % | | | 112,921 | | | | 71,357 | | |
Massachusetts Development Finance Agency(b)
Revenue Bonds
Groves-Lincoln
Series 2009A
06/01/29 | | | 7.500 | % | | | 1,000,000 | | | | 523,020 | | |
Massachusetts Development Finance Agency(b)(d)
Revenue Bonds
Linden Ponds, Inc. Facility
Series 2011B
11/15/56 | | | 0.000 | % | | | 561,650 | | | | 2,977 | | |
Total | | | | | | | 3,187,201 | | |
Single Family 0.8% | |
Massachusetts Housing Finance Agency
Revenue Bonds
Series 2009-147
06/01/28 | | | 4.800 | % | | | 1,000,000 | | | | 1,093,030 | | |
Special Non Property Tax 10.4% | |
Commonwealth of Massachusetts
Refunding Revenue Bonds
Series 2005 (NPFGC/FGIC)
01/01/30 | | | 5.500 | % | | | 2,500,000 | | | | 3,204,875 | | |
Revenue Bonds
Accelerated Bridge Program
Series 2012
06/01/28 | | | 4.000 | % | | | 1,000,000 | | | | 1,102,210 | | |
Massachusetts Bay Transportation Authority
Revenue Bonds
Senior Series 2008B
07/01/27 | | | 5.250 | % | | | 710,000 | | | | 938,201 | | |
Unrefunded Revenue Bonds
General Transportation
Series 1991 (NPFGC)
03/01/21 | | | 7.000 | % | | | 750,000 | | | | 992,662 | | |
Massachusetts School Building Authority
Senior Revenue Bonds
Series 2011B
10/15/35 | | | 5.000 | % | | | 1,000,000 | | | | 1,173,180 | | |
Puerto Rico Sales Tax Financing Corp.(c)
Revenue Bonds
1st Subordinated
Series 2009A
08/01/37 | | | 5.750 | % | | | 2,500,000 | | | | 2,761,075 | | |
Municipal Bonds (continued)
Issue
Description | | Coupon
Rate | | Principal
Amount ($) | | Value ($) | |
Series 2007
08/01/57 | | | 5.250 | % | | | 1,000,000 | | | | 1,052,070 | | |
Series 2011C
08/01/40 | | | 5.000 | % | | | 2,000,000 | | | | 2,158,580 | | |
Territory of Guam
Revenue Bonds
Series 2011A(c)
01/01/42 | | | 5.125 | % | | | 470,000 | | | | 522,800 | | |
Total | | | | | | | 13,905,653 | | |
Special Property Tax 2.6% | |
Metropolitan Boston Transit Parking Corp.
Revenue Bonds
Series 2011
07/01/36 | | | 5.250 | % | | | 3,000,000 | | | | 3,423,120 | | |
State General Obligation 4.2% | |
Commonwealth of Massachusetts
Limited General Obligation Bonds
Series 2011A
04/01/28 | | | 5.000 | % | | | 1,795,000 | | | | 2,153,264 | | |
Massachusetts Bay Transportation Authority
Refunding Revenue Bonds
General Transportation System
Series 1994A (FGIC)
03/01/14 | | | 7.000 | % | | | 1,250,000 | | | | 1,315,250 | | |
Series 1992B (NPFGC)
03/01/16 | | | 6.200 | % | | | 2,025,000 | | | | 2,183,942 | | |
Total | | | | | | | 5,652,456 | | |
Student Loan 5.5% | |
Massachusetts Educational Financing Authority
Revenue Bonds
Series 2009I
01/01/28 | | | 6.000 | % | | | 820,000 | | | | 953,980 | | |
Massachusetts Educational Financing Authority(a)
Refunding Revenue Bonds
Senior Series 2002E (AMBAC) AMT
01/01/13 | | | 5.000 | % | | | 1,340,000 | | | | 1,343,578 | | |
Revenue Bonds
Issue I
Series 2010B AMT
01/01/31 | | | 5.700 | % | | | 825,000 | | | | 883,451 | | |
Series 2008H (AGM) AMT
01/01/30 | | | 6.350 | % | | | 615,000 | | | | 687,293 | | |
Series 2011J AMT
07/01/33 | | | 5.625 | % | | | 2,360,000 | | | | 2,524,162 | | |
Series 2012J AMT
07/01/28 | | | 4.900 | % | | | 1,000,000 | | | | 1,038,570 | | |
Total | | | | | | | 7,431,034 | | |
The accompanying Notes to Financial Statements are an integral part of this statement.
Annual Report 2012
9
Columbia Massachusetts Tax-Exempt Fund
Portfolio of Investments (continued)
October 31, 2012
Municipal Bonds (continued)
Issue
Description | | Coupon
Rate | | Principal
Amount ($) | | Value ($) | |
Water & Sewer 6.6% | |
Boston Water & Sewer Commission
Refunding Revenue Bonds
Senior Series 2009A
11/01/28 | | | 5.000 | % | | | 1,250,000 | | | | 1,466,688 | | |
Revenue Bonds
Senior Series 1992A
11/01/13 | | | 5.750 | % | | | 190,000 | | | | 194,577 | | |
Senior Series 1993A
11/01/19 | | | 5.250 | % | | | 4,320,000 | | | | 4,998,327 | | |
Massachusetts Water Resources Authority
Refunding Revenue Bonds
General
Series 2011C
08/01/28 | | | 5.000 | % | | | 500,000 | | | | 603,345 | | |
Unrefunded Revenue Bonds
General
Series 1993C (AMBAC/TCRS)
12/01/15 | | | 5.250 | % | | | 390,000 | | | | 417,479 | | |
Series 1993C (TCRS)
12/01/15 | | | 5.250 | % | | | 1,070,000 | | | | 1,145,392 | | |
Total | | | | | | | 8,825,808 | | |
Total Municipal Bonds
(Cost: $113,481,552) | | | | | | | 125,772,899 | | |
Floating Rate Notes 2.2%
Issue
Description | | Coupon
Rate | | Principal
Amount ($) | | Value ($) | |
Massachusetts Development Finance Agency
Refunding Revenue Bonds
College of the Holy Cross
VRDN Series 2008A (JPMorgan Chase Bank)(e)
09/01/37 | | | 0.200 | % | | | 3,000,000 | | | | 3,000,000 | | |
Total Floating Rate Notes
(Cost: $3,000,000) | | | | | | | 3,000,000 | | |
Money Market Funds 2.1%
| | | Shares | | Value ($) | |
Dreyfus Massachusetts Municipal
Money Market Fund, 0.000%(f) | | | 1,501,733 | | | | 1,501,733 | | |
JPMorgan Municipal Money Market
Fund, 0.000%(f) | | | 1,250,487 | | | | 1,250,487 | | |
Total Money Market Funds
(Cost: $2,752,220) | | | | | 2,752,220 | | |
Total Investments
(Cost: $119,233,772) | | | | | 131,525,119 | | |
Other Assets & Liabilities, Net | | | | | 2,208,333 | | |
Net Assets | | | | | 133,733,452 | | |
Notes to Portfolio of Investments
(a) Income from this security may be subject to alternative minimum tax.
(b) Identifies issues considered to be illiquid as to their marketability. The aggregate value of such securities at October 31, 2012 was $2,241,287, representing 1.68% of net assets. Information concerning such security holdings at October 31, 2012 was as follows:
Security Description | | Acquisition Dates | | Cost ($) | |
Boston Industrial Development Financing Authority
Revenue Bonds
Crosstown Center Project
Senior Series 2002 AMT
09/01/35 6.500% | | 09/20/02 - 04/07/08 | | | 2,141,325 | | |
Massachusetts Development Finance Agency
Revenue Bonds
Groves-Lincoln
Series 2009A
06/01/29 7.500% | | 11/12/09 | | | 976,778 | | |
Massachusetts Development Finance Agency
Revenue Bonds
Linden Ponds, Inc. Facility
Series 2011B
11/15/56 0.000% | | 07/07/08 - 11/24/08 | | | 5,974 | | |
(c) Municipal obligations include debt obligations issued by or on behalf of territories, possessions, or sovereign nations within the territorial boundaries of the United States. At October 31, 2012, the value of these securities amounted to $10,068,132 or 7.53% of net assets.
(d) Zero coupon bond.
(e) Interest rate varies to reflect current market conditions; rate shown is the effective rate on October 31, 2012.
The accompanying Notes to Financial Statements are an integral part of this statement.
Annual Report 2012
10
Columbia Massachusetts Tax-Exempt Fund
Portfolio of Investments (continued)
October 31, 2012
Notes to Portfolio of Investments (continued)
(f) The rate shown is the seven-day current annualized yield at October 31, 2012.
Abbreviation Legend
AGM Assured Guaranty Municipal Corporation
AMBAC Ambac Assurance Corporation
AMT Alternative Minimum Tax
FGIC Financial Guaranty Insurance Company
FHA Federal Housing Authority
NPFGC National Public Finance Guarantee Corporation
TCRS Transferable Custodial Receipts
VRDN Variable Rate Demand Note
Fair Value Measurements
Generally accepted accounting principles (GAAP) require disclosure regarding the inputs and valuation techniques used to measure fair value and any changes in valuation inputs or techniques. In addition, investments shall be disclosed by major category.
The Fund categorizes its fair value measurements according to a three-level hierarchy that maximizes the use of observable inputs and minimizes the use of unobservable inputs by prioritizing that the most observable input be used when available. Observable inputs are those that market participants would use in pricing an investment based on market data obtained from sources independent of the reporting entity. Unobservable inputs are those that reflect the Fund's assumptions about the information market participants would use in pricing an investment. An investment's level within the fair value hierarchy is based on the lowest level of any input that is deemed significant to the asset or liability's fair value measurement. The input levels are not necessarily an indication of the risk or liquidity associated with investments at that level. For example, certain U.S. government securities are generally high quality and liquid, however, they are reflected as Level 2 because the inputs used to determine fair value may not always be quoted prices in an active market.
Fair value inputs are summarized in the three broad levels listed below:
> Level 1 — Valuations based on quoted prices for investments in active markets that the Fund has the ability to access at the measurement date (including NAV for open-end mutual funds). Valuation adjustments are not applied to Level 1 investments.
> Level 2 — Valuations based on other significant observable inputs (including quoted prices for similar securities, interest rates, prepayment speeds, credit risks, etc.).
> Level 3 — Valuations based on significant unobservable inputs (including the Fund's own assumptions and judgment in determining the fair value of investments).
Inputs that are used in determining fair value of an investment may include price information, credit data, volatility statistics, and other factors. These inputs can be either observable or unobservable. The availability of observable inputs can vary between investments, and is affected by various factors such as the type of investment, and the volume and level of activity for that investment or similar investments in the marketplace. The inputs will be considered by the Investment Manager, along with any other relevant factors in the calculation of an investment's fair value. The Fund uses prices and inputs that are current as of the measurement date, which may include periods of market dislocations. During these periods, the availability of prices and inputs may be reduced for many investments. This condition could cause an investment to be reclassified between the various levels within the hierarchy.
Investments falling into the Level 3 category are primarily supported by quoted prices from brokers and dealers participating in the market for those investments. However, these may be classified as Level 3 investments due to lack of market transparency and corroboration to support these quoted prices. Additionally, valuation models may be used as the pricing source for any remaining investments classified as Level 3. These models rely on one or more significant unobservable inputs and/or significant assumptions by the Investment Manager. Inputs used in valuations may include, but are not limited to, financial statement analysis, capital account balances, discount rates and estimated cash flows, and comparable company data.
Under the direction of the Fund's Board of Trustees (the Board), the Investment Manager's Valuation Committee (the Committee) is responsible for carrying out the valuation procedures approved by the Board. The Committee consists of voting and non-voting members from various groups within the Investment Manager's organization, including operations and accounting, trading and investments, compliance, risk management and legal.
The accompanying Notes to Financial Statements are an integral part of this statement.
Annual Report 2012
11
Columbia Massachusetts Tax-Exempt Fund
Portfolio of Investments (continued)
October 31, 2012
Fair Value Measurements (continued)
The Committee meets at least monthly to review and approve valuation matters, which may include a description of specific valuation determinations, data regarding pricing information received from approved pricing vendors and brokers and the results of Board-approved valuation control policies and procedures (the Policies). The Policies address, among other things, instances when market quotations are readily available, including recommendations of third party pricing vendors and a determination of appropriate pricing methodologies; events that require specific valuation determinations and assessment of fair value techniques; securities with a potential for stale pricing, including those that are illiquid, restricted, or in default; and the effectiveness of third-party pricing vendors, including periodic reviews of vendors. The Committee meets more frequently, as needed, to discuss additional valuation matters, which may include the need to review back-testing results, review time-sensitive information or approve related valuation actions. The Committee reports to the Board, with members of the Committee meeting with the Board at each of its regularly scheduled meetings to discuss valuation matters and actions during the period, similar to those described earlier.
For investments categorized as Level 3, the Committee monitors information similar to that described above, which may include: (i) data specific to the issuer or comparable issuers, (ii) general market or specific sector news and (iii) quoted prices and specific or similar security transactions. The Committee considers this data and any changes from prior periods in order to assess the reasonableness of observable and unobservable inputs, any assumptions or internal models used to value those securities and changes in fair value. This data is also used to corroborate, when available, information received from approved pricing vendors and brokers. Various factors impact the frequency of monitoring this information (which may occur as often as daily). However, the Committee may determine that changes to inputs, assumptions and models are not required as a result of the monitoring procedures performed.
The following table is a summary of the inputs used to value the Fund's investments at October 31, 2012:
Description | | Level 1
Quoted Prices in Active
Markets for Identical
Assets ($) | | Level 2
Other Significant
Observable Inputs ($) | | Level 3
Significant
Unobservable Inputs ($) | | Total ($) | |
Bonds | |
Municipal Bonds | | | — | | | | 125,772,899 | | | | — | | | | 125,772,899 | | |
Total Bonds | | | — | | | | 125,772,899 | | | | — | | | | 125,772,899 | | |
Short-Term Securities | |
Floating Rate Notes | | | — | | | | 3,000,000 | | | | — | | | | 3,000,000 | | |
Total Short-Term Securities | | | — | | | | 3,000,000 | | | | — | | | | 3,000,000 | | |
Other | |
Money Market Funds | | | 2,752,220 | | | | — | | | | — | | | | 2,752,220 | | |
Total Other | | | 2,752,220 | | | | — | | | | — | | | | 2,752,220 | | |
Total | | | 2,752,220 | | | | 128,772,899 | | | | — | | | | 131,525,119 | | |
See the Portfolio of Investments for all investment classifications not indicated in the table.
The Fund's assets assigned to the Level 2 input category are generally valued using the market approach, in which a security's value is determined through reference to prices and information from market transactions for similar or identical assets.
There were no transfers of financial assets between Levels 1 and 2 during the period.
The accompanying Notes to Financial Statements are an integral part of this statement.
Annual Report 2012
12
Columbia Massachusetts Tax-Exempt Fund
Statement of Assets and Liabilities
October 31, 2012
Assets | |
Investments, at value | |
(identified cost $119,233,772) | | $ | 131,525,119 | | |
Receivable for: | |
Investments sold | | | 626,463 | | |
Capital shares sold | | | 399,538 | | |
Interest | | | 1,829,487 | | |
Expense reimbursement due from Investment Manager | | | 5,043 | | |
Prepaid expenses | | | 1,676 | | |
Trustees' deferred compensation plan | | | 33,974 | | |
Total assets | | | 134,421,300 | | |
Liabilities | |
Payable for: | |
Capital shares purchased | | | 141,140 | | |
Dividend distributions to shareholders | | | 404,578 | | |
Investment management fees | | | 7,295 | | |
Distribution and service fees | | | 5,417 | | |
Transfer agent fees | | | 32,239 | | |
Administration fees | | | 1,277 | | |
Compensation of board members | | | 116 | | |
Chief compliance officer expenses | | | 38 | | |
Other expenses | | | 61,774 | | |
Trustees' deferred compensation plan | | | 33,974 | | |
Total liabilities | | | 687,848 | | |
Net assets applicable to outstanding capital stock | | $ | 133,733,452 | | |
Represented by | |
Paid-in capital | | $ | 119,901,698 | | |
Undistributed net investment income | | | 332,673 | | |
Accumulated net realized gain | | | 1,207,734 | | |
Unrealized appreciation (depreciation) on: | |
Investments | | | 12,291,347 | | |
Total — representing net assets applicable to outstanding capital stock | | $ | 133,733,452 | | |
The accompanying Notes to Financial Statements are an integral part of this statement.
Annual Report 2012
13
Columbia Massachusetts Tax-Exempt Fund
Statement of Assets and Liabilities (continued)
October 31, 2012
Class A | |
Net assets | | $ | 119,456,235 | | |
Shares outstanding | | | 14,789,875 | | |
Net asset value per share | | $ | 8.08 | | |
Maximum offering price per share(a) | | $ | 8.48 | | |
Class B | |
Net assets | | $ | 456,994 | | |
Shares outstanding | | | 56,578 | | |
Net asset value per share | | $ | 8.08 | | |
Class C | |
Net assets | | $ | 13,464,733 | | |
Shares outstanding | | | 1,667,189 | | |
Net asset value per share | | $ | 8.08 | | |
Class Z | |
Net assets | | $ | 355,490 | | |
Shares outstanding | | | 44,024 | | |
Net asset value per share | | $ | 8.07 | | |
(a) The maximum offering price per share is calculated by dividing the net asset value by 1.0 minus the maximum sales charge of 4.75%.
The accompanying Notes to Financial Statements are an integral part of this statement.
Annual Report 2012
14
Columbia Massachusetts Tax-Exempt Fund
Statement of Operations
Year Ended October 31, 2012
Net investment income | |
Income: | |
Dividends | | $ | 1,353 | | |
Interest | | | 5,939,632 | | |
Total income | | | 5,940,985 | | |
Expenses: | |
Investment management fees | | | 519,325 | | |
Distribution fees | |
Class B | | | 5,730 | | |
Class C | | | 90,856 | | |
Service fees | |
Class A | | | 291,775 | | |
Class B | | | 1,910 | | |
Class C | | | 30,297 | | |
Transfer agent fees | |
Class A | | | 169,859 | | |
Class B | | | 1,200 | | |
Class C | | | 18,225 | | |
Class Z | | | 352 | | |
Administration fees | | | 90,882 | | |
Compensation of board members | | | 21,735 | | |
Custodian fees | | | 3,714 | | |
Printing and postage fees | | | 50,000 | | |
Registration fees | | | 60,204 | | |
Professional fees | | | 31,161 | | |
Chief compliance officer expenses | | | 38 | | |
Other | | | 5,407 | | |
Total expenses | | | 1,392,670 | | |
Fees waived or expenses reimbursed by Investment Manager and its affiliates | | | (273,767 | ) | |
Fees waived by Distributor — Class C | | | (36,321 | ) | |
Expense reductions | | | (280 | ) | |
Total net expenses | | | 1,082,302 | | |
Net investment income | | | 4,858,683 | | |
Realized and unrealized gain (loss) — net | |
Net realized gain (loss) on: | |
Investments | | | 1,485,416 | | |
Net realized gain | | | 1,485,416 | | |
Net change in unrealized appreciation (depreciation) on: | |
Investments | | | 5,219,430 | | |
Net change in unrealized appreciation (depreciation) | | | 5,219,430 | | |
Net realized and unrealized gain | | | 6,704,846 | | |
Net increase in net assets resulting from operations | | $ | 11,563,529 | | |
The accompanying Notes to Financial Statements are an integral part of this statement.
Annual Report 2012
15
Columbia Massachusetts Tax-Exempt Fund
Statement of Changes in Net Assets
| | | Year Ended
October 31,
2012 | | Year Ended
October 31,
2011(a) | |
Operations | |
Net investment income | | $ | 4,858,683 | | | $ | 4,958,962 | | |
Net realized gain | | | 1,485,416 | | | | 838,199 | | |
Net change in unrealized appreciation (depreciation) | | | 5,219,430 | | | | (2,500,654 | ) | |
Net increase in net assets resulting from operations | | | 11,563,529 | | | | 3,296,507 | | |
Distributions to shareholders | |
Net investment income | |
Class A | | | (4,378,586 | ) | | | (4,578,207 | ) | |
Class B | | | (23,027 | ) | | | (64,887 | ) | |
Class C | | | (399,081 | ) | | | (365,495 | ) | |
Class Z | | | (9,411 | ) | | | (33 | ) | |
Net realized gains | |
Class A | | | (719,546 | ) | | | (929,002 | ) | |
Class B | | | (6,868 | ) | | | (26,156 | ) | |
Class C | | | (69,041 | ) | | | (84,365 | ) | |
Class Z | | | (33 | ) | | | — | | |
Total distributions to shareholders | | | (5,605,593 | ) | | | (6,048,145 | ) | |
Increase (decrease) in net assets from capital stock activity | | | 4,932,334 | | | | (9,823,746 | ) | |
Total increase (decrease) in net assets | | | 10,890,270 | | | | (12,575,384 | ) | |
Net assets at beginning of year | | | 122,843,182 | | | | 135,418,566 | | |
Net assets at end of year | | $ | 133,733,452 | | | $ | 122,843,182 | | |
Undistributed net investment income | | $ | 332,673 | | | $ | 284,095 | | |
(a) Class Z shares are for the period from September 1, 2011 (commencement of operations) to October 31, 2011.
The accompanying Notes to Financial Statements are an integral part of this statement.
Annual Report 2012
16
Columbia Massachusetts Tax-Exempt Fund
Statement of Changes in Net Assets (continued)
| | | Year Ended October 31, 2012 | | Year Ended October 31, 2011(a) | |
| | | Shares | | Dollars ($) | | Shares | | Dollars ($) | |
Capital stock activity | |
Class A shares | |
Subscriptions(b) | | | 1,350,597 | | | | 10,759,295 | | | | 886,416 | | | | 6,632,031 | | |
Distributions reinvested | | | 453,930 | | | | 3,597,651 | | | | 464,714 | | | | 3,459,200 | | |
Redemptions | | | (1,430,865 | ) | | | (11,395,032 | ) | | | (2,366,879 | ) | | | (17,515,906 | ) | |
Net increase (decrease) | | | 373,662 | | | | 2,961,914 | | | | (1,015,749 | ) | | | (7,424,675 | ) | |
Class B shares | |
Subscriptions | | | 564 | | | | 4,404 | | | | 3,108 | | | | 23,001 | | |
Distributions reinvested | | | 2,775 | | | | 21,872 | | | | 6,390 | | | | 47,325 | | |
Redemptions(b) | | | (88,085 | ) | | | (702,317 | ) | | | (326,007 | ) | | | (2,390,477 | ) | |
Net decrease | | | (84,746 | ) | | | (676,041 | ) | | | (316,509 | ) | | | (2,320,151 | ) | |
Class C shares | |
Subscriptions | | | 393,314 | | | | 3,122,006 | | | | 205,048 | | | | 1,563,155 | | |
Distributions reinvested | | | 38,568 | | | | 305,866 | | | | 33,545 | | | | 249,745 | | |
Redemptions | | | (141,689 | ) | | | (1,124,547 | ) | | | (255,533 | ) | | | (1,896,853 | ) | |
Net increase (decrease) | | | 290,193 | | | | 2,303,325 | | | | (16,940 | ) | | | (83,953 | ) | |
Class Z shares | |
Subscriptions | | | 131,283 | | | | 1,055,166 | | | | 651 | | | | 5,000 | | |
Distributions reinvested | | | 1,158 | | | | 9,336 | | | | 4 | | | | 33 | | |
Redemptions | | | (89,072 | ) | | | (721,366 | ) | | | — | | | | — | | |
Net increase | | | 43,369 | | | | 343,136 | | | | 655 | | | | 5,033 | | |
Total net increase (decrease) | | | 622,478 | | | | 4,932,334 | | | | (1,348,543 | ) | | | (9,823,746 | ) | |
(a) Class Z shares are for the period from September 1, 2011 (commencement of operations) to October 31, 2011.
(b) Includes conversions of Class B shares to Class A shares, if any.
The accompanying Notes to Financial Statements are an integral part of this statement.
Annual Report 2012
17
Columbia Massachusetts Tax-Exempt Fund
The following tables are intended to help you understand the Fund's financial performance. Certain information reflects financial results for a single share of a class held for the periods shown. Per share net investment income (loss) amounts are calculated based on average shares outstanding during the period. Total return assumes reinvestment of all dividends and distributions. Total return does not reflect payment of sales charges, if any, and is not annualized for periods of less than one year.
| | | Year Ended October 31, | |
Class A | | 2012 | | 2011 | | 2010 | | 2009 | | 2008 | |
Per share data | |
Net asset value, beginning of period | | $ | 7.71 | | | $ | 7.84 | | | $ | 7.57 | | | $ | 6.98 | | | $ | 7.69 | | |
Income from investment operations: | |
Net investment income | | | 0.30 | | | | 0.31 | | | | 0.31 | | | | 0.31 | | | | 0.31 | | |
Net realized and unrealized gain (loss) | | | 0.42 | | | | (0.07 | ) | | | 0.30 | | | | 0.63 | | | | (0.71 | ) | |
Total from investment operations | | | 0.72 | | | | 0.24 | | | | 0.61 | | | | 0.94 | | | | (0.40 | ) | |
Less distributions to shareholders: | |
Net investment income | | | (0.30 | ) | | | (0.31 | ) | | | (0.30 | ) | | | (0.30 | ) | | | (0.31 | ) | |
Net realized gains | | | (0.05 | ) | | | (0.06 | ) | | | (0.04 | ) | | | (0.05 | ) | | | — | | |
Total distributions to shareholders | | | (0.35 | ) | | | (0.37 | ) | | | (0.34 | ) | | | (0.35 | ) | | | (0.31 | ) | |
Proceeds from regulatory settlements | | | — | | | | — | | | | 0.00 | (a) | | | — | | | | — | | |
Net asset value, end of period | | $ | 8.08 | | | $ | 7.71 | | | $ | 7.84 | | | $ | 7.57 | | | $ | 6.98 | | |
Total return | | | 9.50 | % | | | 3.37 | % | | | 8.30 | % | | | 13.82 | % | | | (5.46 | %) | |
Ratios to average net assets(b) | |
Expenses prior to fees waived or expenses reimbursed
(including interest expense) | | | 1.00 | % | | | 1.00 | % | | | 0.96 | % | | | 0.94 | % | | | 0.96 | %(c) | |
Net expenses after fees waived or expenses reimbursed
(including interest expense)(d) | | | 0.79 | %(e) | | | 0.80 | %(e) | | | 0.83 | %(e) | | | 0.85 | %(e) | | | 0.96 | %(c)(e) | |
Expenses prior to fees waived or expenses reimbursed
(excluding interest expense) | | | 1.00 | % | | | 1.00 | % | | | 0.96 | % | | | 0.94 | % | | | 0.93 | % | |
Net expenses after fees waived or expenses reimbursed
(excluding interest expense)(d) | | | 0.79 | %(e) | | | 0.80 | %(e) | | | 0.83 | %(e) | | | 0.85 | %(e) | | | 0.93 | %(e) | |
Net investment income | | | 3.79 | %(e) | | | 4.13 | %(e) | | | 4.02 | %(e) | | | 4.18 | %(e) | | | 4.08 | %(e) | |
Supplemental data | |
Net assets, end of period (in thousands) | | $ | 119,456 | | | $ | 111,134 | | | $ | 120,910 | | | $ | 117,193 | | | $ | 108,149 | | |
Portfolio turnover | | | 21 | % | | | 26 | % | | | 8 | % | | | 15 | % | | | 16 | % | |
Notes to Financial Highlights
(a) Rounds to less than $0.01.
(b) In addition to the fees and expenses which the Fund bears directly, the Fund indirectly bears a pro rata share of the fees and expenses of the acquired funds in which it invests. Such indirect expenses are not included in the reported expense ratios.
(c) Interest expense and fees related to the liability for floating-rate notes issued in conjunction with inverse floater securities transactions.
(d) The Investment Manager and certain of its affiliates agreed to waive/reimburse certain fees and expenses, if applicable.
(e) The benefits derived from expense reductions had an impact of less than 0.01%.
The accompanying Notes to Financial Statements are an integral part of this statement.
Annual Report 2012
18
Columbia Massachusetts Tax-Exempt Fund
Financial Highlights (continued)
| | | Year Ended October 31, | |
Class B | | 2012 | | 2011 | | 2010 | | 2009 | | 2008 | |
Per share data | |
Net asset value, beginning of period | | $ | 7.71 | | | $ | 7.84 | | | $ | 7.57 | | | $ | 6.98 | | | $ | 7.69 | | |
Income from investment operations: | |
Net investment income | | | 0.24 | | | | 0.25 | | | | 0.25 | | | | 0.25 | | | | 0.25 | | |
Net realized and unrealized gain (loss) | | | 0.42 | | | | (0.06 | ) | | | 0.31 | | | | 0.64 | | | | (0.71 | ) | |
Total from investment operations | | | 0.66 | | | | 0.19 | | | | 0.56 | | | | 0.89 | | | | (0.46 | ) | |
Less distributions to shareholders: | |
Net investment income | | | (0.24 | ) | | | (0.26 | ) | | | (0.25 | ) | | | (0.25 | ) | | | (0.25 | ) | |
Net realized gains | | | (0.05 | ) | | | (0.06 | ) | | | (0.04 | ) | | | (0.05 | ) | | | — | | |
Total distributions to shareholders | | | (0.29 | ) | | | (0.32 | ) | | | (0.29 | ) | | | (0.30 | ) | | | (0.25 | ) | |
Proceeds from regulatory settlements | | | — | | | | — | | | | 0.00 | (a) | | | — | | | | — | | |
Net asset value, end of period | | $ | 8.08 | | | $ | 7.71 | | | $ | 7.84 | | | $ | 7.57 | | | $ | 6.98 | | |
Total return | | | 8.68 | % | | | 2.60 | % | | | 7.50 | % | | | 12.98 | % | | | (6.16 | %) | |
Ratios to average net assets(b) | |
Expenses prior to fees waived or expenses reimbursed
(including interest expense) | | | 1.77 | % | | | 1.76 | % | | | 1.71 | % | | | 1.69 | % | | | 1.71 | %(c) | |
Net expenses after fees waived or expenses reimbursed
(including interest expense)(d) | | | 1.54 | %(e) | | | 1.56 | %(e) | | | 1.58 | %(e) | | | 1.60 | %(e) | | | 1.71 | %(c)(e) | |
Expenses prior to fees waived or expenses reimbursed
(excluding interest expense) | | | 1.77 | % | | | 1.76 | % | | | 1.71 | % | | | 1.69 | % | | | 1.68 | % | |
Net expenses after fees waived or expenses reimbursed
(excluding interest expense)(d) | | | 1.54 | %(e) | | | 1.56 | %(e) | | | 1.58 | %(e) | | | 1.60 | %(e) | | | 1.68 | %(e) | |
Net investment income | | | 3.06 | %(e) | | | 3.40 | %(e) | | | 3.29 | %(e) | | | 3.46 | %(e) | | | 3.32 | %(e) | |
Supplemental data | |
Net assets, end of period (in thousands) | | $ | 457 | | | $ | 1,089 | | | $ | 3,587 | | | $ | 6,641 | | | $ | 10,518 | | |
Portfolio turnover | | | 21 | % | | | 26 | % | | | 8 | % | | | 15 | % | | | 16 | % | |
Notes to Financial Highlights
(a) Rounds to less than $0.01.
(b) In addition to the fees and expenses which the Fund bears directly, the Fund indirectly bears a pro rata share of the fees and expenses of the acquired funds in which it invests. Such indirect expenses are not included in the reported expense ratios.
(c) Interest expense and fees related to the liability for floating-rate notes issued in conjunction with inverse floater securities transactions.
(d) The Investment Manager and certain of its affiliates agreed to waive/reimburse certain fees and expenses, if applicable.
(e) The benefits derived from expense reductions had an impact of less than 0.01%.
The accompanying Notes to Financial Statements are an integral part of this statement.
Annual Report 2012
19
Columbia Massachusetts Tax-Exempt Fund
Financial Highlights (continued)
| | | Year Ended October 31, | |
Class C | | 2012 | | 2011 | | 2010 | | 2009 | | 2008 | |
Per share data | |
Net asset value, beginning of period | | $ | 7.71 | | | $ | 7.84 | | | $ | 7.57 | | | $ | 6.98 | | | $ | 7.69 | | |
Income from investment operations: | |
Net investment income | | | 0.26 | | | | 0.27 | | | | 0.28 | | | | 0.27 | | | | 0.27 | | |
Net realized and unrealized gain (loss) | | | 0.42 | | | | (0.06 | ) | | | 0.30 | | | | 0.64 | | | | (0.71 | ) | |
Total from investment operations | | | 0.68 | | | | 0.21 | | | | 0.58 | | | | 0.91 | | | | (0.44 | ) | |
Less distributions to shareholders: | |
Net investment income | | | (0.26 | ) | | | (0.28 | ) | | | (0.27 | ) | | | (0.27 | ) | | | (0.27 | ) | |
Net realized gains | | | (0.05 | ) | | | (0.06 | ) | | | (0.04 | ) | | | (0.05 | ) | | | — | | |
Total distributions to shareholders | | | (0.31 | ) | | | (0.34 | ) | | | (0.31 | ) | | | (0.32 | ) | | | (0.27 | ) | |
Proceeds from regulatory settlements | | | — | | | | — | | | | 0.00 | (a) | | | — | | | | — | | |
Net asset value, end of period | | $ | 8.08 | | | $ | 7.71 | | | $ | 7.84 | | | $ | 7.57 | | | $ | 6.98 | | |
Total return | | | 9.01 | % | | | 2.92 | % | | | 7.81 | % | | | 13.31 | % | | | (5.88 | %) | |
Ratios to average net assets(b) | |
Expenses prior to fees waived or expenses reimbursed
(including interest expense) | | | 1.75 | % | | | 1.76 | % | | | 1.71 | % | | | 1.69 | % | | | 1.71 | %(c) | |
Net expenses after fees waived or expenses reimbursed
(including interest expense)(d) | | | 1.24 | %(e) | | | 1.26 | %(e) | | | 1.28 | %(e) | | | 1.30 | %(e) | | | 1.41 | %(c)(e) | |
Expenses prior to fees waived or expenses reimbursed
(excluding interest expense) | | | 1.75 | % | | | 1.76 | % | | | 1.71 | % | | | 1.69 | % | | | 1.68 | % | |
Net expenses after fees waived or expenses reimbursed
(excluding interest expense)(d) | | | 1.24 | %(e) | | | 1.26 | %(e) | | | 1.28 | %(e) | | | 1.30 | %(e) | | | 1.38 | %(e) | |
Net investment income | | | 3.33 | %(e) | | | 3.68 | %(e) | | | 3.57 | %(e) | | | 3.73 | %(e) | | | 3.63 | %(e) | |
Supplemental data | |
Net assets, end of period (in thousands) | | $ | 13,465 | | | $ | 10,614 | | | $ | 10,922 | | | $ | 10,339 | | | $ | 8,670 | | |
Portfolio turnover | | | 21 | % | | | 26 | % | | | 8 | % | | | 15 | % | | | 16 | % | |
Notes to Financial Highlights
(a) Rounds to less than $0.01.
(b) In addition to the fees and expenses which the Fund bears directly, the Fund indirectly bears a pro rata share of the fees and expenses of the acquired funds in which it invests. Such indirect expenses are not included in the reported expense ratios.
(c) Interest expense and fees related to the liability for floating-rate notes issued in conjunction with inverse floater securities transactions.
(d) The Investment Manager and certain of its affiliates agreed to waive/reimburse certain fees and expenses, if applicable.
(e) The benefits derived from expense reductions had an impact of less than 0.01%.
The accompanying Notes to Financial Statements are an integral part of this statement.
Annual Report 2012
20
Columbia Massachusetts Tax-Exempt Fund
Financial Highlights (continued)
| | | Year Ended October 31, | |
Class Z | | 2012 | | 2011(a) | |
Per share data | |
Net asset value, beginning of period | | $ | 7.71 | | | $ | 7.69 | | |
Income from investment operations: | |
Net investment income | | | 0.32 | | | | 0.05 | | |
Net realized and unrealized gain | | | 0.41 | | | | 0.02 | (b) | |
Total from investment operations | | | 0.73 | | | | 0.07 | | |
Less distributions to shareholders: | |
Net investment income | | | (0.32 | ) | | | (0.05 | ) | |
Net realized gains | | | (0.05 | ) | | | — | | |
Total distributions to shareholders | | | (0.37 | ) | | | (0.05 | ) | |
Net asset value, end of period | | $ | 8.07 | | | $ | 7.71 | | |
Total return | | | 9.66 | % | | | 0.93 | % | |
Ratios to average net assets(c) | |
Expenses prior to fees waived or expenses reimbursed (including interest expense) | | | 0.70 | % | | | 0.71 | %(d) | |
Net expenses after fees waived or expenses reimbursed (including interest expense)(e) | | | 0.54 | % | | | 0.52 | %(d) | |
Expenses prior to fees waived or expenses reimbursed (excluding interest expense) | | | 0.70 | % | | | 0.71 | %(d) | |
Net expenses after fees waived or expenses reimbursed (excluding interest expense)(e) | | | 0.54 | % | | | 0.52 | %(d) | |
Net investment income | | | 3.97 | % | | | 4.20 | %(d) | |
Supplemental data | |
Net assets, end of period (in thousands) | | $ | 355 | | | $ | 5 | | |
Portfolio turnover | | | 21 | % | | | 26 | % | |
Notes to Financial Highlights
(a) For the period from September 1, 2011 (commencement of operations) to October 31, 2011.
(b) Calculation of the net gain (loss) per share (both realized and unrealized) does not correlate to the aggregate realized and unrealized gain (loss) presented in the Statement of Operations due to the timing of sales and repurchases of Fund shares in relation to fluctuations in the market value of the portfolio.
(c) In addition to the fees and expenses which the Fund bears directly, the Fund indirectly bears a pro rata share of the fees and expenses of the acquired funds in which it invests. Such indirect expenses are not included in the reported expense ratios.
(d) Annualized.
(e) The Investment Manager and certain of its affiliates agreed to waive/reimburse certain fees and expenses, if applicable.
The accompanying Notes to Financial Statements are an integral part of this statement.
Annual Report 2012
21
Columbia Massachusetts Tax-Exempt Fund
Notes to Financial Statements
October 31, 2012
Note 1. Organization
Columbia Massachusetts Tax-Exempt Fund (the Fund), a series of Columbia Funds Series Trust I (the Trust), is a non-diversified fund. The Trust is registered under the Investment Company Act of 1940, as amended (the 1940 Act), as an open-end management investment company organized as a Massachusetts business trust.
Fund Shares
The Trust may issue an unlimited number of shares (without par value). The Fund offers Class A, Class B, Class C and Class Z shares. All share classes have identical voting, dividend and liquidation rights. Each share class has its own expense structure and sales charges, as applicable.
Class A shares are subject to a maximum front-end sales charge of 4.75% based on the initial investment amount. Class A shares purchased without an initial sales charge in accounts aggregating $1 million to $50 million at the time of purchase are subject to a contingent deferred sales charge (CDSC) if the shares are sold within 18 months of purchase, charged as follows: 1.00% CDSC if redeemed within 12 months of purchase, and 0.50% CDSC if redeemed more than 12, but less than 18, months after purchase.
Class B shares may be subject to a maximum CDSC of 5.00% based upon the holding period after purchase. Class B shares will generally convert to Class A shares eight years after purchase. The Fund no longer accepts investments by new or existing investors in the Fund's Class B shares, except in connection with the reinvestment of any dividend and/or capital gain distributions in Class B shares of the Fund and exchanges by existing Class B shareholders of certain other funds within the Columbia Family of Funds.
Class C shares are subject to a 1.00% CDSC on shares redeemed within one year of purchase.
Class Z shares are not subject to sales charges, and are only available to certain investors.
Note 2. Summary of Significant Accounting Policies
Use of Estimates
The preparation of financial statements in accordance with U.S. generally accepted accounting principles (GAAP) requires management to make certain estimates and assumptions that affect the reported amounts of assets and liabilities, the disclosure of contingent assets and liabilities at the date of the financial statements and the reported amounts of revenue and expenses during the reporting period. Actual results could differ from those estimates.
The following is a summary of significant accounting policies consistently followed by the Fund in the preparation of its financial statements.
Security Valuation
Debt securities generally are valued by pricing services approved by the Board of Trustees (the Board) based upon market transactions for normal, institutional-size trading units of similar securities. The services may use various pricing techniques which take into account appropriate factors such as yield, quality, coupon rate, maturity, type of issue, trading characteristics and other data, as well as broker quotes. Debt securities for which quotations are readily available may also be valued based upon an over-the-counter or exchange bid quotation.
Investments in other open-end investment companies, including money market funds, are valued at net asset value.
Short-term securities purchased within 60 days to maturity are valued at amortized cost, which approximates market value. The value of short-term securities originally purchased with maturities greater than 60 days is determined based on an amortized value to par upon reaching 60 days to maturity. Short-term securities maturing in more than 60 days from the valuation date are valued at the market price or approximate market value based on current interest rates.
Investments for which market quotations are not readily available, or that have quotations which management believes are not reliable, are valued at fair value as determined in good faith under consistently applied procedures established by and under the general supervision of the Board. If a security or class of securities (such as foreign securities) is valued at fair value, such value is likely to be different from the last quoted market price for the security.
The determination of fair value often requires significant judgment. To determine fair value, management may use assumptions including but not limited to future cash flows and estimated risk premiums. Multiple inputs from various sources may be used to determine fair value.
Security Transactions
Security transactions are accounted for on the trade date. Cost is determined and gains (losses) are based upon the specific identification method for both financial statement and federal income tax purposes.
Income Recognition
Interest income is recorded on an accrual basis. Market premiums and discounts, including original issue discounts, are amortized and accreted, respectively, over the expected life of the security on all debt securities, unless otherwise noted.
Annual Report 2012
22
Columbia Massachusetts Tax-Exempt Fund
Notes to Financial Statements (continued)
October 31, 2012
Dividend income is recorded on the ex-dividend date.
Expenses
General expenses of the Trust are allocated to the Fund and other funds of the Trust based upon relative net assets or other expense allocation methodologies determined by the nature of the expense. Expenses directly attributable to the Fund are charged to the Fund. Expenses directly attributable to a specific class of shares are charged to that share class.
Determination of Class Net Asset Value
All income, expenses (other than class-specific expenses, which are charged to that share class, as shown in the Statement of Operations) and realized and unrealized gains (losses) are allocated to each class of the Fund on a daily basis for purposes of determining the net asset value of each class. Income and expenses are allocated to each class based on the settled shares method, while realized and unrealized gains (losses) are allocated based on the relative net assets of each class.
Federal Income Tax Status
The Fund intends to qualify each year as a regulated investment company under Subchapter M of the Internal Revenue Code, as amended, and will distribute substantially all of its tax exempt or taxable income (including net short-term capital gains), if any, for its tax year, and as such will not be subject to federal income taxes. In addition, the Fund intends to distribute in each calendar year substantially all of its net investment income, capital gains and certain other amounts, if any, such that the Fund should not be subject to federal excise tax. Therefore, no federal income or excise tax provision is recorded.
Distributions to Shareholders
Distributions from net investment income, if any, are declared daily and paid monthly. Net realized capital gains, if any, are distributed at least annually. Income distributions and capital gain distributions are determined in accordance with federal income tax regulations, which may differ from GAAP.
Guarantees and Indemnifications
Under the Trust's organizational documents and, in some cases, by contract, its officers and trustees are indemnified against certain liabilities arising out of the performance of their duties to the Trust or its funds. In addition, certain of the Fund's contracts with its service providers contain general indemnification clauses. The Fund's maximum exposure under these arrangements is unknown since the amount of any future claims that may be made against the Fund cannot be determined, and the Fund has no historical basis for predicting the likelihood of any such claims.
Recent Accounting Pronouncement
Disclosures about Offsetting Assets and Liabilities
In December 2011, the Financial Accounting Standards Board (FASB) issued ASU No. 2011-11, Disclosures about Offsetting Assets and Liabilities. The objective of the FASB is to enhance current disclosure requirements on offsetting of certain assets and liabilities and to enable financial statement users to compare financial statements prepared under GAAP and International Financial Reporting Standards.
Specifically, ASU No. 2011-11 requires an entity to disclose both gross and net information for derivatives and other financial instruments that are subject to a master netting arrangement or similar agreement. The standard requires disclosure of collateral received in connection with the master netting agreements or similar agreements. The effective date of ASU No. 2011-11 is for interim and annual periods beginning on or after January 1, 2013. At this time, management is evaluating the implications of this guidance and the impact it will have on the financial statement amounts and footnote disclosures, if any.
Note 3. Fees and Compensation Paid to Affiliates
Investment Management Fees
Under an Investment Management Services Agreement, Columbia Management Investment Advisers, LLC (the Investment Manager), a wholly-owned subsidiary of Ameriprise Financial, Inc. (Ameriprise Financial), determines which securities will be purchased, held or sold. The investment management fee is an annual fee that is equal to a percentage of the Fund's average daily net assets that declines from 0.40% to 0.27% as the Fund's net assets increase. The effective investment management fee rate for the year ended October 31, 2012 was 0.40% of the Fund's average daily net assets.
Administration Fees
Under an Administrative Services Agreement, the Investment Manager also serves as the Fund Administrator. The Fund pays the Fund Administrator an annual fee for administration and accounting services equal to a percentage of the Fund's average daily net assets that declines from 0.07% to 0.04% as the Fund's net assets increase. The effective administration fee rate for the year ended October 31, 2012 was 0.07% of the Fund's average daily net assets.
Compensation of Board Members
Board members are compensated for their services to the Fund as disclosed in the Statement of Operations. The Trust's eligible Trustees may participate in a Deferred Compensation
Annual Report 2012
23
Columbia Massachusetts Tax-Exempt Fund
Notes to Financial Statements (continued)
October 31, 2012
Plan (the Plan) which may be terminated at any time. Obligations of the Plan will be paid solely out of the Fund's assets.
Compensation of Chief Compliance Officer
The Board has appointed a Chief Compliance Officer to the Fund in accordance with federal securities regulations. The Fund pays its pro-rata share of the expenses associated with the Chief Compliance Officer. The Fund's expenses for the Chief Compliance Officer will not exceed $15,000 per year.
Transfer Agent Fees
Under a Transfer and Dividend Disbursing Agent Agreement, Columbia Management Investment Services Corp. (the Transfer Agent), an affiliate of the Investment Manager and a wholly-owned subsidiary of Ameriprise Financial, is responsible for providing transfer agency services to the Fund. The Transfer Agent has contracted with Boston Financial Data Services (BFDS) to serve as sub-transfer agent.
The Transfer Agent receives monthly account-based service fees based on the number of open accounts and is reimbursed by the Fund for the fees and expenses the Transfer Agent pays to financial intermediaries that maintain omnibus accounts with the Fund that is a percentage of the average aggregate value of the Fund's shares maintained in each such omnibus account (other than omnibus accounts for which American Enterprise Investment Services Inc. is the broker of record or accounts where the beneficial shareholder is a customer of Ameriprise Financial Services, Inc., which are paid a per account fee). The Transfer Agent pays the fees of BFDS for services as sub-transfer agent and is not entitled to reimbursement for such fees from the Fund (with the exception of out-of-pocket fees).
The Transfer Agent also receives compensation from fees for various shareholder services and reimbursements for certain out-of-pocket fees.
For the year ended October 31, 2012, the Fund's effective transfer agent fee rates as a percentage of average daily net assets of each class were as follows:
Class A | | | 0.15 | % | |
Class B | | | 0.16 | | |
Class C | | | 0.15 | | |
Class Z | | | 0.15 | | |
An annual minimum account balance fee of $20 may apply to certain accounts with a value below the Fund's initial minimum investment requirements to reduce the impact of small accounts on transfer agent fees. These minimum account balance fees are recorded as part of expense reductions in the Statement of Operations. For the year ended October 31, 2012,
these minimum account balance fees reduced total expenses by $280.
Distribution and Service Fees
The Fund has an agreement with Columbia Management Investment Distributors, Inc. (the Distributor), an affiliate of the Investment Manager and a wholly-owned subsidiary of Ameriprise Financial, for distribution and shareholder services. Pursuant to Rule 12b-1 under the 1940 Act, the Board has approved, and the Fund has adopted, distribution and shareholder service plans (the Plans) which set the distribution and service fees for the Fund. These fees are calculated daily and are intended to compensate the Distributor and/or eligible selling and/or servicing agents for selling shares of the Fund and providing services to investors.
The Plans require the payment of a monthly service fee to the Distributor at the maximum annual rate of 0.25% of the average daily net assets attributable to Class A, Class B and Class C shares of the Fund. The Plans also require the payment of a monthly distribution fee to the Distributor at the maximum annual rates of 0.75% of the average daily net assets attributable to Class B and Class C shares, only.
The Distributor has voluntarily agreed to waive a portion of the distribution fee for Class C shares so that the distribution fee does not exceed 0.45% annually of the average daily net assets attributable to Class C shares. This arrangement may be modified or terminated by the Distributor at any time.
Sales Charges
Sales charges, including front-end charges and CDSCs, received by the Distributor for distributing Fund shares were $83,052 for Class A, $250 for Class B and $172 for Class C shares for the year ended October 31, 2012.
Expenses Waived/Reimbursed by the Investment Manager and its Affiliates
The Investment Manager and certain of its affiliates have contractually agreed to waive fees and/or reimburse expenses (excluding certain fees and expenses described below), through February 28, 2013, unless sooner terminated at the sole discretion of the Board, so that the Fund's net operating expenses, after giving effect to fees waived/expenses reimbursed and any balance credits and/or overdraft charges from the Fund's custodian, do not exceed the following annual rates as a percentage of the class' average daily net assets:
Class A | | | 0.79 | % | |
Class B | | | 1.54 | | |
Class C | | | 1.54 | | |
Class Z | | | 0.54 | | |
Annual Report 2012
24
Columbia Massachusetts Tax-Exempt Fund
Notes to Financial Statements (continued)
October 31, 2012
Under the agreement, the following fees and expenses are excluded from the waiver/reimbursement commitment, and therefore will be paid by the Fund, if applicable: taxes (including foreign transaction taxes), expenses associated with investments in affiliated and non-affiliated pooled investment vehicles (including mutual funds and exchange traded funds), transaction costs and brokerage commissions, costs related to any securities lending program, dividend expenses associated with securities sold short, inverse floater program fees and expenses, transaction charges and interest on borrowed money, interest, extraordinary expenses and any other expenses the exclusion of which is specifically approved by the Board. This agreement may be modified or amended only with approval from all parties. Class C distribution fees waived by the Distributor, as discussed above, are in addition to the waiver/reimbursement commitment under the agreement.
Note 4. Federal Tax Information
The timing and character of income and capital gain distributions are determined in accordance with income tax regulations, which may differ from GAAP because of temporary or permanent book to tax differences.
At October 31, 2012, these differences are primarily due to differing treatment for principal and/or interest of fixed income securities, Trustees' deferred compensation, distribution reclassifications, distribution payable and derivative investments. To the extent these differences are permanent, reclassifications are made among the components of the Fund's net assets in the Statement of Assets and Liabilities. Temporary differences do not require reclassifications.
The Fund did not have any permanent differences; therefore, no reclassifications were made to the Statement of Assets and Liabilities.
The tax character of distributions paid during the years indicated was as follows:
Year Ended October 31, | | 2012 | | 2011 | |
Tax-exempt income | | $ | 4,793,775 | | | $ | 5,008,622 | | |
Ordinary income | | | 16,330 | | | | — | | |
Long-term capital gains | | | 795,488 | | | | 1,039,523 | | |
Short-term capital gain distributions, if any, are considered ordinary income distributions for tax purposes.
At October 31, 2012, the components of distributable earnings on a tax basis were as follows:
Undistributed tax-exempt income | | $ | 463,979 | | |
Undistributed accumulated long-term gain | | | 1,376,010 | | |
Unrealized appreciation | | | 12,428,342 | | |
At October 31, 2012, the cost of investments for federal income tax purposes was $118,928,501 and the aggregate
gross unrealized appreciation and depreciation based on that cost was:
Unrealized appreciation | | $ | 14,131,527 | | |
Unrealized depreciation | | | (1,534,909 | ) | |
Net unrealized appreciation | | $ | 12,596,618 | | |
Management of the Fund has concluded that there are no significant uncertain tax positions that would require recognition in the financial statements. However, management's conclusion may be subject to review and adjustment at a later date based on factors including, but not limited to, new tax laws, regulations, and administrative interpretations (including relevant court decisions). Generally, the Fund's federal tax returns for the prior three fiscal years remain subject to examination by the Internal Revenue Service.
Note 5. Portfolio Information
The cost of purchases and proceeds from sales of securities, excluding short-term obligations, aggregated to $26,291,457 and $26,578,516, respectively, for the year ended October 31, 2012.
Note 6. Shareholder Concentration
At October 31, 2012, two unaffiliated shareholder accounts owned an aggregate of 30.3% of the outstanding shares of the Fund. The Fund has no knowledge about whether any portion of those shares was owned beneficially by such accounts. Subscription and redemption activity by concentrated accounts may have a significant effect on the operations of the Fund.
Note 7. Line of Credit
The Fund has entered into a revolving credit facility with a syndicate of banks led by JPMorgan Chase Bank N.A. whereby the Fund may borrow for the temporary funding of shareholder redemptions or for other temporary or emergency purposes. The credit facility agreement, as amended, which is a collective agreement between the Fund and certain other funds managed by the Investment Manager, severally and not jointly, permits collective borrowings up to $500 million. Pursuant to a December 13, 2011 amendment to the credit facility agreement, interest is charged to each participating fund based on its borrowings at a rate equal to the higher of (i) the overnight federal funds rate plus 1.00% or (ii) the one-month LIBOR rate plus 1.00%. Each borrowing under the credit facility matures no later than 60 days after the date of borrowing. The Fund also pays a commitment fee equal to its pro rata share of the amount of the credit facility at a rate of 0.08% per annum.
Prior to December 13, 2011, interest was charged to each participating fund based on its borrowings at a rate equal to
Annual Report 2012
25
Columbia Massachusetts Tax-Exempt Fund
Notes to Financial Statements (continued)
October 31, 2012
the sum of the federal funds rate plus (i) 1.25% per annum plus (ii) if one-month LIBOR exceeds the federal funds rate, the amount of such excess. The Fund also paid a commitment fee equal to its pro rata share of the amount of the credit facility at a rate of 0.10% per annum.
The Fund had no borrowings during the year ended October 31, 2012.
Note 8. Significant Risks
Non-Diversification Risk
A non-diversified fund is permitted to invest a greater percentage of its total assets in fewer issuers than a diversified fund. The Fund may, therefore, have a greater risk of loss from a few issuers than a similar fund that invests more broadly.
Geographic Concentration Risk
Because state-specific tax-exempt funds invest primarily in the municipal securities issued by the state and political sub-divisions of the state, the Fund will be particularly affected by political and economic conditions and developments in the state in which it invests. The Fund may, therefore, have a greater risk than that of a municipal bond fund which is more geographically diversified. The value of the municipal securities owned by the Fund also may be adversely affected by future changes in federal or state income tax laws.
Note 9. Subsequent Events
Management has evaluated the events and transactions that have occurred through the date the financial statements were issued. Other than as noted below, there were no items requiring adjustment of the financial statements or additional disclosure.
In August 2012, the Board of Trustees approved a proposal to merge the Fund into Columbia Tax-Exempt Fund. Shareholders of the Fund will vote on the proposed merger at a special meeting of shareholders to be held during the first half of 2013.
Note 10. Information Regarding Pending and Settled Legal Proceedings
In December 2005, without admitting or denying the allegations, American Express Financial Corporation (AEFC, which is now known as Ameriprise Financial, Inc. (Ameriprise Financial)) entered into settlement agreements with the Securities and Exchange Commission (SEC) and Minnesota Department of Commerce (MDOC) related to market timing activities. As a result, AEFC was censured and ordered to cease and desist from committing or causing any violations of
certain provisions of the Investment Advisers Act of 1940, the Investment Company Act of 1940, and various Minnesota laws. AEFC agreed to pay disgorgement of $10 million and civil money penalties of $7 million. AEFC also agreed to retain an independent distribution consultant to assist in developing a plan for distribution of all disgorgement and civil penalties ordered by the SEC in accordance with various undertakings detailed at www.sec.gov/litigation/admin/ia-2451.pdf. Ameriprise Financial and its affiliates have cooperated with the SEC and the MDOC in these legal proceedings, and have made regular reports to the funds' Boards of Trustees.
Ameriprise Financial and certain of its affiliates have historically been involved in a number of legal, arbitration and regulatory proceedings, including routine litigation, class actions, and governmental actions, concerning matters arising in connection with the conduct of their business activities. Ameriprise Financial believes that the Funds are not currently the subject of, and that neither Ameriprise Financial nor any of its affiliates are the subject of, any pending legal, arbitration or regulatory proceedings that are likely to have a material adverse effect on the Funds or the ability of Ameriprise Financial or its affiliates to perform under their contracts with the Funds. Ameriprise Financial is required to make 10-Q, 10-K and, as necessary, 8-K filings with the Securities and Exchange Commission on legal and regulatory matters that relate to Ameriprise Financial and its affiliates. Copies of these filings may be obtained by accessing the SEC website at www.sec.gov.
There can be no assurance that these matters, or the adverse publicity associated with them, will not result in increased fund redemptions, reduced sale of fund shares or other adverse consequences to the Funds. Further, although we believe proceedings are not likely to have a material adverse effect on the Funds or the ability of Ameriprise Financial or its affiliates to perform under their contracts with the Funds, these proceedings are subject to uncertainties and, as such, we are unable to estimate the possible loss or range of loss that may result. An adverse outcome in one or more of these proceedings could result in adverse judgments, settlements, fines, penalties or other relief that could have a material adverse effect on the consolidated financial condition or results of operations of Ameriprise Financial.
Annual Report 2012
26
Columbia Massachusetts Tax-Exempt Fund
Report of Independent Registered Public Accounting Firm
To the Trustees of Columbia Funds Series Trust I and
the Shareholders of Columbia Massachusetts Tax-Exempt Fund
In our opinion, the accompanying statement of assets and liabilities, including the portfolio of investments, and the related statements of operations and of changes in net assets and the financial highlights present fairly, in all material respects, the financial position of Columbia Massachusetts Tax-Exempt Fund (the "Fund") (a series of Columbia Funds Series Trust I) at October 31, 2012, the results of its operations for the year then ended, the changes in its net assets for each of the two years in the period then ended and the financial highlights for each of the periods indicated, in conformity with accounting principles generally accepted in the United States of America. These financial statements and financial highlights (hereafter referred to as "financial statements") are the responsibility of the Fund's management. Our responsibility is to express an opinion on these financial statements based on our audits. We conducted our audits of these financial statements in accordance with the standards of the Public Company Accounting Oversight Board (United States). Those standards require that we plan and perform the audit to obtain reasonable assurance about whether the financial statements are free of material misstatement. An audit includes examining, on a test basis, evidence supporting the amounts and disclosures in the financial statements, assessing the accounting principles used and significant estimates made by management, and evaluating the overall financial statement presentation. We believe that our audits, which included confirmation of securities at October 31, 2012 by correspondence with the custodian, brokers and transfer agent, provide a reasonable basis for our opinion.
PricewaterhouseCoopers LLP
Minneapolis, Minnesota
December 21, 2012
Annual Report 2012
27
Columbia Massachusetts Tax-Exempt Fund
Federal Income Tax Information
(Unaudited)
The Fund hereby designates the following tax attributes for distributions the fiscal year ended October 31, 2012. Shareholders will be notified in early 2013 of amounts for use in preparing 2012 income tax returns.
Tax Designations:
Capital Gain Dividend | | $ | 1,476,875 | | |
Exempt-Interest Dividends | | | 99.66 | % | |
Capital Gain Dividend — The Fund designates as a capital gain dividend the amount reflected above, or if subsequently determined to be different, the net capital gain of such fiscal period.
Exempt-Interest Dividends — The percentage of net investment income distributions paid during the fiscal year that qualifies as exempt-interest dividends for federal income tax purposes.
Annual Report 2012
28
Columbia Massachusetts Tax-Exempt Fund
The Trustees serve terms of indefinite duration. The names, addresses and birth years of the Trustees and Officers of the Funds in Columbia Funds Series Trust I, the year each was first elected or appointed to office, their principal business occupations during at least the last five years, the number of Funds overseen by each Trustee and other directorships they hold are shown below. Each officer listed below serves as an officer of each Fund in Columbia Funds Series Trust I.
Independent Trustees
Name, Address and Year of Birth,
Position with Funds, Year First
Elected or Appointed to Office | | Principal Occupation(s) During Past Five Years, Number of Funds in Columbia
Funds Complex Overseen by Trustee, Other Directorships Held
| |
Rodman L. Drake (Born 1943)
c/o Columbia Management Investment Advisers, LLC
225 Franklin Street
Boston, MA 02110
Trustee (since 1994) and
Chairman of the Board (since 2009) | | Independent consultant since 2010; Co-Founder of Baringo Capital LLC (private equity) from 1997 to 2008; CEO of Crystal River Capital, Inc. (real estate investment trust) from 2003 to 2010; Oversees 52; Jackson Hewitt Tax Service Inc. (tax preparation services from 2004 to 2011); Celgene Corporation (global biotechnology company); Student Loan Corporation (student loan provider from 2005 to 2010); Celgene Corporation (global biotechnology company); The Helios Funds and Brookfield Funds (closed-end funds); Crystal River Capital, Inc. from 2005 to 2010; Parsons Brinckerhoff from 1995 to 2008; and Apex Silver Mines Ltd. from 2007 to 2009 | |
Douglas A. Hacker (Born 1955)
c/o Columbia Management Investment Advisers, LLC
225 Franklin Street
Boston, MA 02110
Trustee (since 1996) | | Independent business executive since May 2006; Executive Vice President — Strategy of United Airlines from December 2002 to May 2006; President of UAL Loyalty Services (airline marketing company) from September 2001 to December 2002; Executive Vice President and Chief Financial Officer of United Airlines from July 1999 to September 2001. Oversees 52; Nash Finch Company (food distributor); Aircastle Limited (aircraft leasing); and SeaCube Container Leasing Ltd. (container leasing) | |
Janet Langford Kelly (Born 1957)
c/o Columbia Management Investment Advisers, LLC
225 Franklin Street
Boston, MA 02110
Trustee (since 1996) | | Senior Vice President, General Counsel and Corporate Secretary, ConocoPhillips (integrated energy company) since September 2007; Deputy General Counsel — Corporate Legal Services, ConocoPhillips from August 2006 to August 2007; Partner, Zelle, Hofmann, Voelbel, Mason & Gette LLP (law firm) from March 2005 to July 2006; Adjunct Professor of Law, Northwestern University from September 2004 to June 2006; Director, UAL Corporation (airline) from February 2006 to July 2006; Chief Administrative Officer and Senior Vice President, Kmart Holding Corporation (consumer goods) from September 2003 to March 2004. Oversees 52; None | |
Nancy T. Lukitsh (Born 1956)
c/o Columbia Management Investment Advisers, LLC
225 Franklin Street
Boston, MA 02110
Trustee (since 2011) | | Senior Vice President, Partner and Director of Marketing, Wellington Management Company, LLP (investment adviser) from 1997 to 2010; Chair, Wellington Management Investment Portfolios (commingled non-U.S. investment pools) from 2007 to 2010; Director, Wellington Trust Company, NA and other Wellington affiliates from 1997 to 2010. Oversees 52; None | |
William E. Mayer (Born 1940)
c/o Columbia Management Investment Advisers, LLC
225 Franklin Street
Boston, MA 02110
Trustee (since 1994) | | Partner, Park Avenue Equity Partners (private equity) since February 1999; Dean and Professor, College of Business and Management, University of Maryland from 1992 to 1996. Oversees 52; DynaVox Inc. (speech creation); Lee Enterprises (print media); WR Hambrecht + Co. (financial service provider) from 2000 to 2012; BlackRock Kelso Capital Corporation (investment company) | |
David M. Moffett (Born 1952)
c/o Columbia Management Investment Advisers, LLC
225 Franklin Street
Boston, MA 02110
Trustee (since 2011) | | Retired. Chief Executive Officer, Federal Home Loan Mortgage Corporation, from 2008 to 2009; Senior Adviser, Global Financial Services Group, Carlyle Group, Inc., from 2007 to 2008; Vice Chairman and Chief Financial Officer, U.S. Bancorp, from 1993 to 2007. Oversees 52; CIT Group Inc. (commercial and consumer finance); eBay Inc. (online trading community); MBIA Inc. (financial service provider); E.W. Scripps Co. (print and television media), Building Materials Holding Corp. (building materials and construction services); and University of Oklahoma Foundation. | |
Charles R. Nelson (Born 1942)
c/o Columbia Management Investment Advisers, LLC
225 Franklin Street
Boston, MA 02110
Trustee (since 1981) | | Retired Professor Emeritus, University of Washington, since 2011; Professor of Economics, University of Washington from January 1976 to 2011; Ford and Louisa Van Voorhis Professor of Political Economy, University of Washington from 1993 to 2011; Adjunct Professor of Statistics, University of Washington from 1980 to 2011; Associate Editor, Journal of Money Credit and Banking from 1993 to 2008; consultant on econometric and statistical matters. Oversees 52; None | |
John J. Neuhauser (Born 1943)
c/o Columbia Management Investment Advisers, LLC
225 Franklin Street
Boston, MA 02110
Trustee (since 1984) | | President, Saint Michael's College, since August 2007; Director or Trustee of several non-profit organizations, including Fletcher Allen Health Care, Inc.; University Professor, Boston College from November 2005 to August 2007; Academic Vice President and Dean of Faculties, Boston College from August 1999 to October 2005. Oversees 52; Liberty All-Star Equity Fund and Liberty All-Star Growth Fund (closed-end funds) | |
Annual Report 2012
29
Columbia Massachusetts Tax-Exempt Fund
Trustees and Officers (continued)
Independent Trustees (continued)
Name, Address and Year of Birth,
Position with Funds, Year First
Elected or Appointed to Office | | Principal Occupation(s) During Past Five Years, Number of Funds in Columbia
Funds Complex Overseen by Trustee, Other Directorships Held
| |
Patrick J. Simpson (Born 1944)
c/o Columbia Management Investment Advisers, LLC
225 Franklin Street
Boston, MA 02110
Trustee (since 2000) | | Partner, Perkins Coie LLP (law firm). Oversees 52; None | |
Anne-Lee Verville (Born 1945)
c/o Columbia Management Investment Advisers, LLC
225 Franklin Street
Boston, MA 02110
Trustee (since 1998) | | Retired. General Manager — Global Education Industry from 1994 to 1997, President — Application Systems Division from 1991 to 1994, Chief Financial Officer — US Marketing & Services from 1988 to 1991, and Chief Information Officer from 1987 to 1988, IBM Corporation (computer and technology). Oversees 52; Enesco Group, Inc. (producer of giftware and home and garden decor products) from 2001 to 2006 | |
Interested Trustee
Name, Address and Year of Birth,
Position with Funds, Year First
Elected or Appointed to Office | | Principal Occupation(s) During Past Five Years, Number of Funds in Columbia
Funds Complex Overseen by Trustee, Other Directorships Held
| |
William F. Truscott (born 1960)
53600 Ameriprise Financial Center
Minneapolis, MN 55474
Senior Vice President (since 2012) | | Chairman of the Board and President, Columbia Management Investment Advisers, LLC since May 2010 and February 2012, respectively (previously President, Chairman of the Board and Chief Investment Officer, from 2001 to April 2010); Chief Executive Officer, U.S. Asset Management & President, Annuities, Ameriprise Financial, Inc. since May 2010 (previously President — U.S. Asset Management and Chief Investment Officer from 2005 to April 2010, and Senior Vice President — Chief Investment Officer, from 2001 to 2005); Director, President and Chief Executive Officer, Ameriprise Certificate Company since 2006; Director and Chief Executive Officer, Columbia Management Investment Distributors, Inc. since May 2010 and February 2012, respectively (previously Chairman of the Board and Chief Executive Officer from 2008 to April 2010); Chairman of the Board and Chief Executive Officer, RiverSource Distributors, Inc. since 2006. Oversees 208; Columbia Funds Board. | |
The Statement of Additional Information includes additional information about the Trustees of the Funds and is available, without charge, upon request by calling 1-800-345-6611.
Officers
Name, Year of Birth and Address | | Principal Occupation(s) During the Past Five Years | |
J. Kevin Connaughton (Born 1964)
225 Franklin Street
Boston, MA 02110
President (since 2009) | | Senior Vice President and General Manager — Mutual Fund Products, Columbia Management Investment Advisers, LLC since May 2010; President, Columbia Funds, since 2009, and RiverSource Funds, since May 2010 (previously Senior Vice President and Chief Financial Officer, Columbia Funds, from June 2008 to January 2009, Treasurer, Columbia Funds, from October 2003 to May 2008, and senior officer of various other affiliated funds since 2000); Managing Director, Columbia Management Advisors, LLC from December 2004 to April 2010. | |
Michael G. Clarke (Born 1969)
225 Franklin Street
Boston, MA 02110
Treasurer (since 2011) and Chief Financial Officer (since 2009) | | Vice President, Columbia Management Investment Advisers, LLC since May 2010; Managing Director of Fund Administration, Columbia Management Advisors, LLC, from September 2004 to April 2010; senior officer of Columbia Funds and affiliated funds since 2002. | |
Scott R. Plummer (Born 1959)
5228 Ameriprise Financial Center
Minneapolis, MN 55474
Senior Vice President, Assistant Secretary and Chief Legal Officer (since 2010) | | Senior Vice President, Chief Legal Officer and Assistant Secretary, Columbia Management Investment Advisers, LLC since June 2005; Vice President and Lead Chief Counsel — Asset Management, Ameriprise Financial, Inc. since May 2010 (previously Vice President and Chief Counsel — Asset Management, from 2005 to April 2010); Vice President, Chief Counsel and Assistant Secretary, Columbia Management Investment Distributors, Inc. since 2008; Vice President, General Counsel and Secretary, Ameriprise Certificate Company since 2005; Chief Counsel, RiverSource Distributors, Inc. since 2006; Vice President, General Counsel and Secretary, RiverSource Funds since December 2006; Senior Vice President, Secretary and Chief Legal Officer, Columbia Funds, since May 2010. | |
Annual Report 2012
30
Columbia Massachusetts Tax-Exempt Fund
Trustees and Officers (continued)
Officers (continued)
Name, Year of Birth and Address | | Principal Occupation(s) During the Past Five Years | |
William F. Truscott (Born 1960)
53600 Ameriprise Financial Center
Minneapolis, MN 55474
Senior Vice President (since 2010) | | Chairman of the Board and President, Columbia Management Investment Advisers, LLC since May 2010 and February 2012, respectively (previously President, Chairman of the Board and Chief Investment Officer, from 2001 to April 2010); Chief Executive Officer, U.S. Asset Management & President, Annuities, Ameriprise Financial, Inc. since May 2010 (previously President — U.S. Asset Management and Chief Investment Officer from 2005 to April 2010); Director, President and Chief Executive Officer, Ameriprise Certificate Company since 2006; Director and Chief Executive Officer, Columbia Management Investment Distributors, Inc. since May 2010 and February 2012, respectively (previously Chairman of the Board and Chief Executive Officer from 2008 to April 2010); Chairman of the Board and Chief Executive Officer, RiverSource Distributors, Inc. since 2006. | |
Thomas P. McGuire (Born 1972)
225 Franklin Street
Boston, MA 02110
Chief Compliance Officer (since 2012) | | Vice President — Asset Management Compliance, Columbia Management Investment Advisers, LLC since 2010; Chief Compliance Officer, Ameriprise Certificate Company, since September 2010; Compliance Executive, Bank of America, 2005-2010. | |
Colin Moore (Born 1958)
225 Franklin Street
Boston, MA 02110
Senior Vice President (since 2010) | | Director and Chief Investment Officer, Columbia Management Investment Advisers, LLC since May 2010; Manager, Managing Director and Chief Investment Officer of Columbia Management Advisors, LLC from 2007 to April 2010; Head of Equities, Columbia Management Advisors, LLC from 2002 to 2007. | |
Amy Johnson (Born 1965)
5228 Ameriprise Financial Center
Minneapolis, MN 55474
Vice President (since 2010) | | Senior Vice President and Chief Operating Officer, Columbia Management Investment Advisers, LLC since May 2010 (previously Chief Administrative Officer, from 2009 until April 2010, Vice President — Asset Management and Trust Company Services, from 2006 to 2009, and Vice President — Operations and Compliance from 2004 to 2006). | |
Joseph F. DiMaria (Born 1968)
225 Franklin Street
Boston, MA 02110
Vice President (since 2011) and Chief Accounting Officer (since 2008) | | Vice President, Mutual Fund Administration, Columbia Management Investment Advisers, LLC, since May 2010; Director of Fund Administration, Columbia Management Advisors, LLC from January 2006 to April 2010; Head of Tax/Compliance and Assistant Treasurer, Columbia Management Advisors, LLC, from November 2004 to December 2005. | |
Stephen T. Welsh (born 1957)
225 Franklin Street
Boston, MA 02110
Vice President (since 2006) | | President and Director, Columbia Management Investment Services Corp. since May 2010; President and Director, Columbia Management Services, Inc. from July 2004 to April 2010; Managing Director, Columbia Management Distributors, Inc. from August 2007 to April 2010. | |
Paul D. Pearson (born 1956)
10468 Ameriprise Financial Center
Minneapolis, MN 55474
Vice President and Assistant Treasurer (since 2011) | | Vice President, Investment Accounting, Columbia Management Investment Advisers, LLC, since May 2010; Vice President, Managed Assets, Investment Accounting, Ameriprise Financial Corporation. | |
Paul B. Goucher (born 1968)
5228 Ameriprise Financial Center
Minneapolis, MN 55474
Vice President and Assistant Secretary (since 2010) | | Vice President and Chief Counsel of Ameriprise Financial since January 2010 (formerly Vice President and Group Counsel from November 2008 to January 2010); Director, Managing Director and General Counsel of J. & W. Seligman & Co. Incorporated (Seligman) from July 2008 to November 2008 and Managing Director and Associate General Counsel of Seligman from January 2005 to July 2008. | |
Christopher O. Petersen (born 1970)
5228 Ameriprise Financial Center
Minneapolis, MN 55474
Vice President (since 2010) and Secretary (since 2011) | | Vice President and Chief Counsel, Ameriprise Financial since January 2010 (formerly Vice President and Group Counsel or Counsel from April 2004 to January 2010); Assistant Secretary of RiverSource Funds since January 2007; officer of Columbia Funds and affiliated funds since 2007. | |
Michael E. DeFao (born 1968)
225 Franklin Street
Boston, MA 02110
Vice President and Assistant Secretary (since 2011) | | Vice President and Chief Counsel, Ameriprise Financial since May 2010; Associate General Counsel, Bank of America from June 2005 to April 2010. | |
Annual Report 2012
31
Columbia Massachusetts Tax-Exempt Fund
Board Consideration and Approval of
Advisory Agreement
On June 6, 2012, the Board of Trustees (the "Board") and the Trustees who are not interested persons (as defined in the Investment Company Act of 1940) of the Trust (the "Independent Trustees") unanimously approved the continuation of the Investment Management Services Agreement (the "Advisory Agreement") with Columbia Management Investment Advisers, LLC (the "Investment Manager") with respect to Columbia Massachusetts Tax-Exempt Fund (the "Fund"), a series of the Trust. As detailed below, the Advisory Fees and Expenses Committee (the "Committee") and the Board met on multiple occasions to review and discuss, both among themselves and with the management team of the Investment Manager, materials provided by the Investment Manager before determining to approve the continuation of the Advisory Agreement.
In connection with their deliberations regarding the continuation of the Advisory Agreement, the Committee and the Board requested and evaluated materials from the Investment Manager regarding the Fund and the Advisory Agreement, and discussed these materials with representatives of the Investment Manager at the Committee meeting held on June 5, 2012 and at the Board meeting held on June 6, 2012. In addition, the Board considers matters bearing on the Advisory Agreement at most of its other meetings throughout the year and meets regularly with senior management of the Funds and the Investment Manager. Through the Board's Investment Oversight Committees, Trustees also meet with selected Fund portfolio managers and other investment personnel at various times throughout the year. The Committee and the Board also consulted with Fund counsel and with the Independent Trustees' independent legal counsel, who advised on the legal standard for consideration by the Board and otherwise assisted the Board in its deliberations. On June 5, 2012, the Committee recommended that the Board approve the continuation of the Advisory Agreement. On June 6, 2012, the Board, including the Independent Trustees, voting separately, unanimously approved the continuation of the Advisory Agreement for the Fund.
The Committee and the Board considered all information that they, their legal counsel, or the Investment Manager believed reasonably necessary to evaluate and to determine whether to approve the continuation of the Advisory Agreement. In their deliberations, the Trustees did not identify any particular information that was all-important or controlling, and individual Trustees may have attributed different weights to the various factors. The information and factors considered by the Committee and the Board in recommending for approval or approving the continuation of the Advisory Agreement for the Fund included the following:
• Information on the investment performance of the Fund relative to the performance of the Fund's benchmarks and the performance of a group of comparable mutual funds, as determined by an independent third-party data provider;
• Information on the Fund's advisory fees and total expenses, including information comparing the Fund's expenses to those of a group of comparable mutual funds, as determined by an independent third-party data provider;
• The Investment Manager's agreement to contractually limit or cap total operating expenses for the Fund so that total operating expenses (excluding certain fees and expenses, such as transaction costs and certain other investment related expenses, interest, taxes, acquired fund fees and expenses, and extraordinary expenses) would not exceed the median expenses of a group of comparable funds (as determined from time to time, generally annually, by an independent third-party data provider);
• The terms and conditions of the Advisory Agreement, including that the advisory fee rates payable by the Fund would not change;
• The terms and conditions of other agreements and arrangements with affiliates of the Investment Manager relating to the operations of the Fund, including the Administrative Services Agreement, the Distribution Agreement and the Transfer and Dividend Disbursing Agent Agreement, noting in the case of the Transfer and Dividend Disbursing Agent Agreement certain proposed changes to the fee rates payable thereunder;
• Descriptions of various functions performed by the Investment Manager under the Advisory Agreement, including portfolio management and portfolio trading practices;
• Information regarding the management fees and investment performance of any comparable portfolios of other clients of the Investment Manager, including institutional separate accounts; and
• The profitability to the Investment Manager and its affiliates from their relationships with the Fund.
Annual Report 2012
32
Columbia Massachusetts Tax-Exempt Fund
Board Consideration and Approval of
Advisory Agreement (continued)
Nature, Extent and Quality of Services to be Provided under the Advisory Agreement
The Committee and the Board considered the nature, extent and quality of services provided to the Fund by the Investment Manager and its affiliates under the Advisory Agreement and under separate agreements for the provision of transfer agency and administrative services, and the resources dedicated to the Fund and the other Columbia Funds by the Investment Manager and its affiliates. The Committee and the Board considered, among other things, the Investment Manager's ability to attract, motivate and retain highly qualified research, advisory and supervisory investment professionals (including personnel and other resources, compensation programs for personnel involved in fund management, reputation and other attributes), the portfolio management services provided by those investment professionals, the quality of the Investment Manager's investment research capabilities and trade execution services, and the other resources that the Investment Manager devotes to the Fund. The Committee and the Board also considered the potential benefits to shareholders of investing in a mutual fund that is part of a fund complex offering exposure to a variety of asset classes and investment disciplines and providing a variety of fund and shareholder services.
The Committee and the Board also considered the professional experience and qualifications of the senior personnel of the Investment Manager. The Committee and the Board noted the compliance programs of and the compliance-related resources provided to the Fund by the Investment Manager and its affiliates, and considered the Investment Manager's ability to provide administrative services to the Fund pursuant to a separate administrative services agreement, including the Investment Manager's ability to coordinate the activities of the Fund's other service providers. After reviewing these and related factors, the Committee and the Board concluded, within the context of their overall conclusions, that the expected nature, extent and quality of the services to be provided to the Fund under the Advisory Agreement supported the continuation of such agreement.
Investment Performance
The Committee and the Board reviewed information about the performance of the Fund over various time periods, including performance information relative to benchmarks and information based on reports of an independent third-party data provider that compared the performance of the Fund to the performance of a group of comparable mutual funds. The Committee and the Board also reviewed a description of the third party's methodology for identifying the Fund's peer groups for purposes of performance and expense comparisons. In the case of each Fund whose performance lagged that of a relevant peer group for certain (although not necessarily all) periods, the Committee and the Board concluded that other factors relevant to performance were sufficient, in light of other considerations, to warrant continuation of the Fund's Advisory Agreement. Those factors varied from fund to fund, but included one or more of the following: (i) that the Fund's performance, although lagging in certain recent periods, was stronger over the longer term; (ii) that the underperformance was attributable, to a significant extent, to investment decisions that were reasonable and consistent with the Fund's investment strategy and policies and that the Fund was performing within a reasonable range of expectations, given those investment decisions, market conditions and the Fund's investment strategy; (iii) that the Fund's performance was competitive when compared to other relevant performance benchmarks or peer groups; and (iv) that the Investment Manager had taken or was taking steps designed to help improve the Fund's investment performance, including, but not limited to, replacing portfolio managers, enhancing the resources supporting the portfolio managers, or modifying investment strategies.
The Committee and the Board noted that, through December 31, 2011, the Fund's performance was in the eighth, seventy-fifth and forty-second percentiles (where the best performance would be in the first percentile) of its category selected by an independent third-party data provider for the purposes of performance comparisons for the one-, three- and five- year periods, respectively.
The Committee and the Board also considered the Investment Manager's performance and reputation generally, the Investment Manager's historical responsiveness to Board concerns about performance and the Investment Manager's willingness to take steps intended to improve performance. After reviewing these and related factors, the Committee and the Board concluded, within the context of their overall conclusions regarding the Advisory Agreement, that the performance of the Fund and the Investment Manager was sufficient, in light of other considerations, to warrant the continuation of the Advisory Agreement.
Annual Report 2012
33
Columbia Massachusetts Tax-Exempt Fund
Board Consideration and Approval of
Advisory Agreement (continued)
Investment Advisory Fee Rates and Other Expenses
The Committee and the Board considered the advisory fees to be charged to the Fund under the Advisory Agreement as well as the total expenses to be incurred by the Fund. In assessing the reasonableness of the fees under the Advisory Agreement, the Committee and the Board considered, among other information, the Fund's advisory fee and its expected total expense ratio as a percentage of average daily net assets. The Committee and the Board noted that the Fund's actual management fee and total net expense ratio are ranked in the first and second quintiles, respectively, against the Fund's expense universe as determined by an independent third-party data provider for purposes of expense comparison. The Committee and the Board also took into account the fee waiver and expense limitation arrangements agreed to by the Investment Manager, as noted above.
The Committee and the Board also considered the fact that the advisory fee rates payable by the Fund to the Investment Manager under the Advisory Agreement were the same as those currently paid by the Fund to the Investment Manager.
The Committee and the Board also received and considered information about the advisory fees charged by the Investment Manager to institutional separate accounts. In considering the fees charged to those accounts, the Committee and the Board took into account, among other things, the Investment Manager's representations about the differences between managing mutual funds as compared to other types of accounts, including differences in the services provided, differences in the risk profile of such business for the Investment Manager and the additional resources required to manage mutual funds effectively. In evaluating the Fund's advisory fees, the Committee and the Board also took into account the demands, complexity and quality of the investment management of the Fund.
After reviewing these and related factors, the Committee and the Board concluded, within the context of their overall conclusions, that the advisory fee rates and expenses of the Fund supported the continuation of the Advisory Agreement.
Costs of Services to be Provided and Profitability
The Committee and the Board also took note of the costs of the services provided (both on an absolute and relative basis) and the profitability to the Investment Manager and its affiliates in connection with their relationships with the Fund. In evaluating these considerations, the Committee and the Board took note of the advisory fees charged by the Investment Manager to other clients, including fees charged by the Investment Manager to any institutional separate account clients with similar investment strategies to those of the Fund.
The Committee and the Board also considered the compensation directly or indirectly received by the Investment Manager's affiliates in connection with their relationships with the Fund. The Committee and the Board reviewed information provided by management as to the profitability of the Investment Manager and its affiliates of their relationships with the Fund, and information about the allocation of expenses used to calculate profitability. When reviewing profitability, the Committee and the Board also considered court cases in which adviser profitability was an issue in whole or in part, the performance of the fund, the expense ratio of the fund, and the implementation of expense limitations with respect to the fund. The Committee and the Board also considered information provided by the Investment Manager regarding its financial condition and comparing its profitability to that of other asset management firms that are, or are subsidiaries of, publicly traded companies.
After reviewing these and related factors, the Committee and the Board concluded, within the context of their overall conclusions, that the profitability to the Investment Manager and its affiliates from their relationships with the Fund supported the continuation of the Advisory Agreement.
Economies of Scale
The Committee and the Board considered the potential existence of economies of scale in the provision by the Investment Manager of services to the Fund, to groups of related funds, and to the Investment Manager's investment advisory clients as a whole, and whether those economies of scale were shared with the Fund through breakpoints in investment advisory fees or other means, such as expense limitation arrangements and additional investments by the Investment Manager in investment, trading and compliance resources. The Committee and the Board noted that the investment advisory fee schedules for the Fund contained breakpoints that would reduce the fee rate on assets above specified threshold levels.
Annual Report 2012
34
Columbia Massachusetts Tax-Exempt Fund
Board Consideration and Approval of
Advisory Agreement (continued)
In considering these issues, the Committee and the Board also considered the costs of the services provided (both on an absolute and relative basis) and the profitability to the Investment Manager and its affiliates from their relationships with the Fund, as discussed above. After reviewing these and related factors, the Committee and the Board concluded, within the context of their overall conclusions, that the extent to which economies of scale were expected to be shared with the Fund supported the continuation of the Advisory Agreement.
Other Benefits to the Investment Manager
The Committee and the Board received and considered information regarding "fall-out" or ancillary benefits received by the Investment Manager and its affiliates as a result of their relationships with the Fund, such as the engagement of the Investment Manager to provide administrative services to the Fund and the engagement of the Investment Manager's affiliates to provide distribution and transfer agency services to the Fund. The Committee and the Board considered that the Fund's distributor retains a portion of the distribution fees from the Fund and receives a portion of the sales charges on sales or redemptions of certain classes of shares of the Fund. The Committee and the Board also considered the benefits of research made available to the Investment Manager by reason of brokerage commissions generated by the Fund's securities transactions, and reviewed information about the Investment Manager's practices with respect to allocating portfolio brokerage for brokerage and research services. The Committee and the Board considered the possible conflicts of interest associated with certain fall-out or other ancillary benefits and the reporting, disclosure and other processes that would be in place to address such possible conflicts of interest. The Committee and the Board recognized that the Investment Manager's profitability would be somewhat lower without these benefits.
Conclusion
The Committee and the Board reviewed all of the above considerations in reaching their decisions to recommend or approve the continuation of the Advisory Agreement. No single item was identified as paramount or controlling, and individual Trustees may have attributed different weights to various factors. Based on their evaluation of all factors that they deemed to be material, including those factors described above, and assisted by the advice of independent legal counsel, the Board, including the Independent Trustees, voting separately, unanimously approved the continuation of the Advisory Agreement.
Annual Report 2012
35
This page intentionally left blank.
Annual Report 2012
36
Columbia Massachusetts Tax-Exempt Fund
Important Information About This Report
Each fund mails one shareholder report to each shareholder address. If you would like more than one report, please call shareholder services at 800.345.6611 and additional reports will be sent to you.
The policy of the Board is to vote the proxies of the companies in which each fund holds investments consistent with the procedures as stated in the Statement of Additional Information (SAI). You may obtain a copy of the SAI without charge by calling 800.345.6611; contacting your financial intermediary; visiting columbiamanagement.com; or searching the website of the Securities and Exchange Commission (SEC) at sec.gov. Information regarding how each fund voted proxies relating to portfolio securities is filed with the SEC by August 31 for the most recent 12-month period ending June 30 of that year, and is available without charge by visiting columbiamanagement.com; or searching the website of the SEC at sec.gov.
Each fund files a complete schedule of portfolio holdings with the SEC for the first and third quarters of each fiscal year on Form N-Q. Each fund's Form N-Q is available on the SEC's website at sec.gov and may be reviewed and copied at the SEC's Public Reference Room in Washington, D.C. Information on the operation of the Public Reference Room may be obtained by calling 800.SEC.0330. Each fund's complete schedule of portfolio holdings, as filed on Form N-Q, can also be obtained without charge, upon request, by calling 800.345.6611.
Annual Report 2012
37

Columbia Massachusetts Tax-Exempt Fund
P.O. Box 8081
Boston, MA 02266-8081
columbiamanagement.com
This information is for use with concurrent or prior delivery of a fund prospectus. Please read and consider the investment objectives, risks, charges and expenses for any fund carefully before investing. For a prospectus which contains this and other important information about the Fund go to columbiamanagement.com. The Fund is distributed by Columbia Management Investment Distributors, Inc., member FINRA, and managed by Columbia Management Investment Advisers, LLC.
© 2012 Columbia Management Investment Advisers, LLC. All rights reserved.
C-1016 D (12/12)
Annual Report
October 31, 2012

Columbia Strategic Income Fund
Not FDIC insured • No bank guarantee • May lose value
Columbia Strategic Income Fund
 Dear Shareholders,
Stocks rebound around the world
After a weak second quarter, U.S. stock market averages rebounded in the third quarter, erasing earlier losses and boosting year-to-date returns well into double digits. Welcome news from Europe and additional quantitative easing in the United States by the Federal Reserve Board helped bolster the rally. The Standard & Poor's 500 Index (S&P 500 Index) rose 6.35% (total return) for the quarter. The Dow Jones Industrial Average advanced 4.32% for the same period. From the beginning of the calendar year through September 30, 2012, the S&P 500 Index was up 16.44% (total return). And, as of the end of September, the S&P 500 Index stood at 1,440 — approximately 8% below its all-time high of 1,565 that was set on October 9, 2007.
Outside the United States, stock markets of both developed and emerging market economies rebounded, as measured in U.S. dollars. Investors responded favorably to the announcement of policy measures aimed to resolve the eurozone crisis, which could potentially have a favorable impact on growth in emerging market economies. A weaker dollar also benefited returns to U.S. investors.
Solid gains for fixed income
Within fixed income, investors appeared to be increasingly willing to take on risk as they abandoned higher quality sectors that dominated the performance rankings in the second quarter and favored riskier sectors, where yield spreads tightened by a significant margin. Fixed-income returns were strong, but unlike equities, they have been less volatile, accumulating steadily over the course of the year. Gains were the highest for high-yield and emerging market bonds. By contrast, government issued debt securities eked out smaller gains.
Stay on track with Columbia Management
Backed by more than 100 years of experience, Columbia Management is one of the nation's largest asset managers. At the heart of our success — and, most importantly, that of our investors — are highly talented industry professionals, brought together by a unique way of working. We are dedicated to helping you take advantage of today's opportunities and anticipate tomorrow's. We stay abreast of the latest investment trends and ideas, using our collective insight to evaluate events and transform them into solutions you can use.
Visit columbiamanagement.com for:
> The Columbia Management Perspectives blog, featuring timely posts by our investment teams
> Detailed up-to-date fund performance and portfolio information
> Economic analysis and market commentary
> Quarterly fund commentaries
> Columbia Management Investor, our award-winning quarterly newsletter for shareholders
Thank you for your continued support of the Columbia Funds. We look forward to serving your investment needs for many years to come.
Best Regards,

J. Kevin Connaughton
President, Columbia Funds
The S&P 500 Index, an unmanaged index, measures the performance of 500 widely held, large-capitalization U.S. stocks and is frequently used as a general measure of market performance. The Dow Jones Industrial Average is a price weighted average of 30 actively traded shares of blue chip US industrial corporations listed on the New York Stock Exchange. Indices are not available for investment, are not professionally managed and do not reflect sales charges, fees, brokerage commissions, taxes or other expenses of investing.
Investors should consider the investment objectives, risks, charges and expenses of a mutual fund carefully before investing. For a free prospectus, which contains this and other important information about a fund, visit columbiamanagement.com. The prospectus should be read carefully before investing.
Columbia Funds are distributed by Columbia Management Investment Distributors, Inc., member FINRA, and managed by Columbia Management Investment Advisers, LLC.
© 2012 Columbia Management Investment Advisers, LLC. All rights reserved.
Columbia Strategic Income Fund
Performance Overview | | | 2 | | |
Manager Discussion of Fund Performance | | | 4 | | |
Understanding Your Fund's Expenses | | | 7 | | |
Portfolio of Investments | | | 8 | | |
Statement of Assets and Liabilities | | | 44 | | |
Statement of Operations | | | 46 | | |
Statement of Changes in Net Assets | | | 47 | | |
Financial Highlights | | | 50 | | |
Notes to Financial Statements | | | 58 | | |
Report of Independent Registered
Public Accounting Firm | | | 72 | | |
Federal Income Tax Information | | | 73 | | |
Trustees and Officers | | | 74 | | |
Board Consideration and Approval of Advisory Agreement | | | 77 | | |
Important Information About This Report | | | 81 | | |
Fund Investment Manager
Columbia Management Investment
Advisers, LLC
225 Franklin Street
Boston, MA 02110
Fund Distributor
Columbia Management Investment
Distributors, Inc.
225 Franklin Street
Boston, MA 02110
Fund Transfer Agent
Columbia Management Investment
Services Corp.
P.O. Box 8081
Boston, MA 02266-8081
For more information about any of the funds, please visit columbiamanagement.com or call 800.345.6611. Customer Service Representatives are available to answer your questions Monday through Friday from 8 a.m. to 8 p.m. Eastern time.
The views expressed in this report reflect the current views of the respective parties. These views are not guarantees of future performance and involve certain risks, uncertainties and assumptions that are difficult to predict, so actual outcomes and results may differ significantly from the views expressed. These views are subject to change at any time based upon economic, market or other conditions and the respective parties disclaim any responsibility to update such views. These views may not be relied on as investment advice and, because investment decisions for a Columbia Fund are based on numerous factors, may not be relied on as an indication of trading intent on behalf of any particular Columbia Fund. References to specific securities should not be construed as a recommendation or investment advice.
Columbia Strategic Income Fund
Performance Summary
> Columbia Strategic Income Fund (the Fund) Class A shares returned 6.72% excluding sales charges for the five-month period that ended October 31, 2012.
> The Fund outperformed its primary benchmark, the Barclays U.S. Government/Credit Bond Index, which returned 2.07% for the same time period. The Fund also outperformed its New Blended Benchmark, which returned 5.48%, and its Former Blended Benchmark, which returned 5.48%, for the same five months. These composite benchmarks established by the Fund's Investment Manager are described below.
> Both sector allocation and security selection overall contributed positively to the Fund's outperformance as did effective duration positioning.
Average Annual Total Returns (%) (for period ended October 31, 2012)
| | Inception | | 5 Months
cumulative(a) | | 1 Year | | 5 Years | | 10 Years | |
Class A | | 04/21/77 | | | | | | | | | |
Excluding sales charges | | | | | 6.72 | | | | 10.04 | | | | 7.35 | | | | 8.45 | | |
Including sales charges | | | | | 1.72 | | | | 4.89 | | | | 6.31 | | | | 7.92 | | |
Class B | | 05/15/92 | | | | | | | | | |
Excluding sales charges | | | | | 6.39 | | | | 9.39 | | | | 6.55 | | | | 7.64 | | |
Including sales charges | | | | | 1.39 | | | | 4.39 | | | | 6.24 | | | | 7.64 | | |
Class C | | 07/01/97 | | | | | | | | | |
Excluding sales charges | | | | | 6.45 | | | | 9.38 | | | | 6.67 | | | | 7.80 | | |
Including sales charges | | | | | 5.45 | | | | 8.38 | | | | 6.67 | | | | 7.80 | | |
Class K (formerly Class R4)* | | 03/07/11 | | | 6.68 | | | | 10.28 | | | | 7.39 | | | | 8.46 | | |
Class R* | | 09/27/10 | | | 6.58 | | | | 9.90 | | | | 7.18 | | | | 8.23 | | |
Class R5* | | 03/07/11 | | | 6.79 | | | | 10.56 | | | | 7.48 | | | | 8.51 | | |
Class W* | | 09/27/10 | | | 6.90 | | | | 10.23 | | | | 7.37 | | | | 8.45 | | |
Class Z | | 01/29/99 | | | 6.74 | | | | 10.45 | | | | 7.60 | | | | 8.68 | | |
Barclays U.S. Government/Credit Bond Index | | | | | 2.07 | | | | 5.90 | | | | 6.52 | | | | 5.53 | | |
New Blended Benchmark | | | | | 5.48 | | | | 9.04 | | | | 8.08 | | | | 8.65 | | |
Former Blended Benchmark | | | | | 5.48 | | | | 9.22 | | | | 8.17 | | | | 8.69 | | |
Returns for Class A are shown with and without the maximum initial sales charge of 4.75%. Returns for Class B are shown with and without the applicable contingent deferred sales charge (CDSC) of 5.00% in the first year, declining to 1.00% in the sixth year and eliminated thereafter. Returns for Class C are shown with and without the 1.00% CDSC for the first year only. The Fund's other classes are not subject to sales charges and have limited eligibility. Please see the Fund's prospectuses for details. Performance for different share classes will vary based on differences in sales charges and fees associated with each class. All results shown assume reinvestment of distributions during the period. Returns do not reflect the deduction of taxes that a shareholder may pay on Fund distributions or on the redemption of Fund shares. Performance results reflect the effect of any fee waivers or reimbursements of Fund expenses by Columbia Management Investment Advisers, LLC and/or any of its affiliates. Absent these fee waivers or expense reimbursement arrangements, performance results would have been lower.
The performance information shown represents past performance and is not a guarantee of future results. The investment return and principal value of your investment will fluctuate so that your shares, when redeemed, may be worth more or less than their original cost. Current performance may be lower or higher than the performance information shown. You may obtain performance information current to the most recent month-end by contacting your financial intermediary, visiting columbiamanagement.com or calling 800.345.6611.
*The returns shown for periods prior to the share class inception date (including returns since inception if shown, which are since Fund inception) include the returns of the Fund's oldest share class. These returns are adjusted to reflect any higher class-related operating expenses of the newer share classes, as applicable. Please visit columbiamanagement.com/mutual-funds/appended-performance for more information.
The Barclays U.S. Government/Credit Bond Index tracks the performance of U.S. government and corporate bonds rated investment grade or better, with maturities of at least one year.
The New Blended Benchmark consists of a 35% weighting of the Barclays U.S. Aggregate Bond Index, a 35% weighting of the Bank of America Merrill Lynch (BofAML) US High Yield Cash Pay Constrained Index, a 15% weighting of the Citigroup Non-U.S. World Government Bond (All Maturities) Index — Unhedged (Citigroup Non U.S. WGBI — Unhedged) and a 15% weighting of the JPMorgan Emerging Markets Bond Index (EMBI) — Global. The Barclays U.S. Aggregate Bond Index is a market value-weighted index that tracks the daily price, coupon, pay-downs and total return performance of fixed-rate, publicly placed, dollar-denominated and non-convertible investment grade debt issues with at least $250 million par amount outstanding and with at least one year to final maturity. The BofAML US High Yield Cash Pay Constrained Index tracks the performance of U.S. dollar-denominated below investment grade corporate debt, currently in a coupon paying period, that is publicly issued in the U.S. domestic market. The Citigroup Non-U.S. WGBI — Unhedged is calculated on a market-weighted basis and includes all fixed-rate bonds with a remaining maturity of one year or longer and with amounts outstanding of at least the equivalent of U.S. $25 million, while excluding floating or variable rate bonds. The JPMorgan EMBI — Global is based on U.S. dollar-denominated debt instruments issued by emerging market sovereign and quasi-sovereign entities, such as Brady bonds, Eurobonds and loans, and reflects reinvestment of all distributions and changes in market prices.
The Former Blended Benchmark consists of a 35% weighting of the Barclays U.S. Aggregate Bond Index, a 35% weighting of the JPMorgan Global High Yield Index, a 15% weighting of the Citigroup Non-U.S. WGBI — Unhedged and a 15% weighting of the JPMorgan EMBI Global Diversified Index. The JPMorgan Global High Yield Index measures the U.S. dollar global high yield corporate debt market, including domestic and international issues. The JPMorgan EMBI Global Diversified Index tracks total returns for traded external debt instruments in the emerging markets including U.S. dollar-denominated Brady bonds, loans and Eurobonds with an outstanding face value of at least $500 million.
Effective on February 29, 2012, the Fund changed its blended benchmark because the Investment Manager believes it is more consistent with the Fund's investment strategy.
Indices are not available for investment, are not professionally managed and do not reflect sales charges, fees, brokerage commissions, taxes or other expenses of investing. Securities in the Fund may not match those in an index.
(a) For the period from June 1, 2012 to October 31, 2012. During the period the Fund's fiscal year was changed from May 31 to October 31.
Annual Report 2012
2
Columbia Strategic Income Fund
Performance Overview (continued)
Performance of a Hypothetical $10,000 Investment (November 1, 2002 – October 31, 2012)
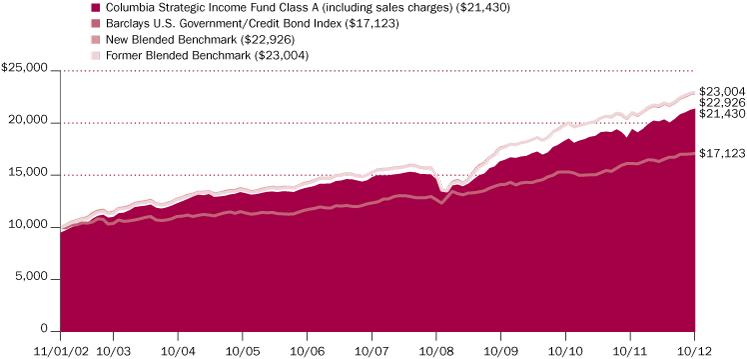
The chart above shows the change in value of a hypothetical $10,000 investment in Class A shares of Columbia Strategic Income Fund during the stated time period, and does not reflect the deduction of taxes that a shareholder may pay on Fund distributions or on the redemption of Fund shares.
Annual Report 2012
3
Columbia Strategic Income Fund
Manager Discussion of Fund Performance
The Board of Trustees for Columbia Strategic Income Fund has approved the change of the Fund's fiscal year end from May 31 to October 31. As a result, this report covers the five-month period since the last annual report. The next report you receive will be for the six-month period from November 1, 2012 through April 30, 2013.
On February 29, 2012, the Fund changed its secondary benchmark from the Former Blended Benchmark to the New Blended Benchmark because the Investment Manager believes it is more consistent with the Fund's investment strategy. The New Blended Benchmark consists of a 35% weighting of the Barclays U.S. Aggregate Bond Index, a 35% weighting of the Bank of America/Merrill Lynch US High Yield Cash Pay Constrained Index, a 15% weighting of the Citigroup Non-U.S. World Government Bond (All Maturities) Index — Unhedged and a 15% weighting of the JPMorgan Emerging Markets Bond Index (EMBI) — Global. The Former Blended Benchmark is a weighted custom composite, established by the Investment Manager, consists of a 35% weighting of the Barclays U.S. Aggregate Bond Index, a 35% weighting of the JPMorgan Global High Yield Index, a 15% weighting of the Citigroup Non-U.S. World Government Bond (All Maturities) Index — Unhedged and a 15% weighting of the JPMorgan EMBI Global Diversified Index.
For the five-month period that ended October 31, 2012, the Fund's Class A shares returned 6.72% excluding sales charges. The Fund outperformed its primary benchmark, the Barclays U.S. Government/Credit Bond Index, which returned 2.07%, as well as its New Blended Benchmark, which returned 5.48% for the same period. The Fund also outperformed its Former Blended Benchmark, which returned 5.48% for the five month period. Both sector allocation and security selection overall contributed positively to the Fund's outperformance as did effective duration positioning.
Global Central Bank Action Buoyed Bond Markets
Global bond markets posted positive results during the reporting period, as aggressive action from global central banks helped to buoy investor confidence. The U.S. Federal Reserve (the Fed) and the European Central Bank each announced new bond purchase programs designed to help boost economic growth. Better economic data also supported global bond market performance. The U.S. labor market improved, adding 737,000 new jobs during the 5-month reporting period. Job gains helped the unemployment rate decline to 7.9% in October from 8.2% in May. In addition, surveys of purchasing managers indicated expansion in both the manufacturing and service sectors of the economy in October following a span of sluggishness during the summer. As investor sentiment improved, interest rates rose, and investors sold "safe haven" government bonds in favor of other more credit-sensitive sectors, such that non-government bond sectors outperformed higher quality fixed income sectors during the reporting period. Yields on the benchmark 10-year U.S. Treasury note rose 13 basis points during the reporting period. (A basis point is 1/100th of a percentage point.) At the same time, the U.S. Treasury yield curve steepened, meaning yields on longer-term U.S. Treasuries rose more than those on shorter-term maturities. The Fed maintained overnight interest rates near zero, keeping the yields of shorter-maturity bonds generally contained.
Portfolio Management
Colin Lundgren, CFA
Gene Tannuzzo, CFA
Brian Lavin, CFA
Quality Breakdown (%)
(at October 31, 2012) | |
AAA rating | | | 28.4 | | |
AA rating | | | 1.8 | | |
A rating | | | 4.1 | | |
BBB rating | | | 19.6 | | |
BB rating | | | 15.1 | | |
B rating | | | 22.3 | | |
CCC rating | | | 5.3 | | |
CC rating | | | 0.1 | | |
D rating | | | 0.0 | (a) | |
Not rated | | | 3.3 | | |
Total | | | 100.0 | | |
Percentages indicated are based upon total fixed income securities (excluding Money Market Funds and Investments of Cash Collateral Received for Securities on Loan).
Bond ratings apply to the underlying holdings of the Fund and not the Fund itself and are divided into categories ranging from AAA (highest) to D (lowest), and are subject to change. The ratings shown are determined by using the middle rating of Moody's, S&P, and Fitch after dropping the highest and lowest available ratings. When a rating from only two agencies is available, the lower rating is used. When a rating from only one agency is available, that rating is used. When a bond is not rated by any of these agencies, it is designated as Not rated. Credit ratings are subjective opinions and not statements of fact.
(a) Rounds to less than 0.1%.
Annual Report 2012
4
Columbia Strategic Income Fund
Manager Discussion of Fund Performance (continued)
Sector Allocation and Security Selection Overall Boosted Fund Results
Sector allocation, overall, contributed positively to the Fund's results during the reporting period, driven by underweighted positions in U.S. Treasuries and international developed market government bonds. A modest overweight to emerging market bonds in June and July also helped performance. Security selection proved effective, led by strong bond picking in the mortgage-backed securities, international developed market government bond, high yield corporate bond and investment grade corporate bond sectors. Also contributing positively to the Fund's relative results was its duration positioning. The Fund maintained a shorter duration than its blended benchmark, which helped performance as yields drifted higher. Duration is a measure of the Fund's sensitivity to changes in interest rates.
Overweight to Mortgage-Backed Securities Hampered Performance
The Fund's overweighted position in the mortgage-backed securities sector was a drag on its relative performance, as mortgage-backed securities lagged other non-U.S. Treasury sectors during the reporting period. Security selection within the emerging market bond and commercial mortgage-backed securities sectors also detracted, albeit more modestly.
Derivative Positions in the Fund
The Fund utilized U.S. Treasury futures and options to manage duration and yield curve exposure, credit default swaps to hedge credit exposure, currency forwards for hedging and total return purposes and mortgage TBAs to add exposure to agency mortgage-backed securities (MBS). TBAs, which stands for "to be announced," are mortgage securities bought and sold for future settlement with an agreed upon price, coupon and face value, but without reference to the characteristics of the underlying pool of mortgages until 48 hours before delivery is taken. This feature gives TBA participants immediate exposure to agency MBS without having to value each individual security.
Shifting Market Conditions Drive Portfolio Changes
During the reporting period, we reduced the Fund's exposure to high yield corporate bonds and to emerging market bonds, as spreads, or the yield differential between these sectors and duration-equivalent U.S. Treasuries, narrowed. We used these proceeds to increase the Fund's allocation to mortgage-backed securities on the expectation that the Fed would increase purchases in that sector. Throughout, we maintained a duration position that varied between 0.25 and 0.50 years shorter than the Fund's blended benchmark.
Looking Ahead
Early in the reporting period, a broad deceleration in economic activity had become evident. Investors became concerned as the manufacturing sector stalled and the labor market became quite sluggish. Toward the end of the reporting period, however, it appeared that economic activity had begun to stabilize, as near-term economic momentum improved. We believe this was likely the start of yet another mini-cycle in economic activity, similar to others that we have experienced over the past three years. Despite short-term fluctuations in
Portfolio Breakdown (%)
(at October 31, 2012) | |
Asset-Backed Securities —
Non-Agency | | | 0.1 | | |
Commercial Mortgage-Backed
Securities — Non-Agency | | | 3.0 | | |
Common Stocks | | | 0.0 | (a) | |
Consumer Discretionary | | | 0.0 | (a) | |
Information Technology | | | 0.0 | (a) | |
Materials | | | 0.0 | (a) | |
Telecommunication Services | | | 0.0 | (a) | |
Corporate Bonds & Notes | | | 44.1 | | |
Consumer Discretionary | | | 5.0 | | |
Consumer Staples | | | 2.0 | | |
Energy | | | 6.3 | | |
Financials | | | 5.1 | | |
Health Care | | | 3.8 | | |
Industrials | | | 3.2 | | |
Materials | | | 3.7 | | |
Telecommunication | | | 9.2 | | |
Utilities | | | 5.8 | | |
Foreign Government
Obligations | | | 21.2 | | |
Inflation-Indexed Bonds | | | 0.9 | | |
Money Market Funds | | | 4.9 | | |
Municipal Bonds | | | 0.1 | | |
Residential Mortgage-Backed Securities — Agency | | | 12.7 | | |
Residential Mortgage-Backed Securities — Non-Agency | | | 3.5 | | |
Senior Loans | | | 3.6 | | |
Consumer Discretionary | | | 1.0 | | |
Consumer Staples | | | 0.3 | | |
Energy | | | 0.1 | | |
Financials | | | 0.1 | | |
Health Care | | | 0.3 | | |
Industrials | | | 0.5 | | |
Materials | | | 0.4 | | |
Telecommunication | | | 0.7 | | |
Utilities | | | 0.2 | | |
Treasury Bills | | | 0.1 | | |
U.S. Treasury Obligations | | | 5.8 | | |
Warrants | | | 0.0 | (a) | |
Total | | | 100.0 | | |
Percentages indicated are based upon total investments (excluding Investments of Cash Collateral Received for Securities on Loan). The Fund's portfolio composition is subject to change.
(a) Rounds to less than 0.1%.
Annual Report 2012
5
Columbia Strategic Income Fund
Manager Discussion of Fund Performance (continued)
economic activity during these three years, Gross Domestic Product (GDP) growth has consistently managed to revert back to a positive, albeit modest, rate of about 2%. Even with some near-term signs of strength in the labor and housing markets, we currently expect ongoing private sector deleveraging and political uncertainty to keep economic growth contained around this same level over the next year. With inflation currently running above the level of government bond yields, we believe investors may be better served looking elsewhere for income. However, with the U.S. fiscal cliff looming, we believe volatility may be poised to rise in the near term, and investors are not being compensated to venture too far down the quality spectrum. (The U.S. fiscal cliff refers to tax increases and spending cuts totaling approximately $576 billion scheduled to take effect on January 1, 2013.)
Given this view, at the end of October 2012, we believed high quality corporate bonds still offered attractive spreads when compared to strong corporate fundamental metrics. We thus maintained an overweight to investment grade and high yield corporate bonds, although we reduced these positions throughout the reporting period. We maintained an underweight to traditional "safe haven" markets overseas, specifically Germany and Japan, which in our view offered little value at current yield levels. We maintained an overweighted position in U.S. mortgage-backed securities, which we expect to perform well in light of the Fed's renewed commitment to purchase mortgage-backed securities as part of its quantitative easing program. We held duration, or interest rate risk, shorter than that of the New Blended Benchmark, as we believe that further improvements in the labor market could put upward pressure on government bond yields.
Annual Report 2012
6
Columbia Strategic Income Fund
Understanding Your Fund's Expenses
(Unaudited)
As an investor, you incur two types of costs. There are transaction costs, which generally include sales charges on purchases and may include redemption fees. There are also ongoing costs, which generally include management fees, distribution and service (Rule 12b-1) fees, and other fund expenses. The following information is intended to help you understand your ongoing costs (in dollars) of investing in the Fund and to help you compare these costs with the ongoing costs of investing in other mutual funds.
Analyzing Your Fund's Expenses
To illustrate these ongoing costs, we have provided examples and calculated the expenses paid by investors in each share class of the Fund during the period. The actual and hypothetical information in the table is based on an initial investment of $1,000 at the beginning of the period indicated and held for the entire period. Expense information is calculated two ways and each method provides you with different information. The amount listed in the "Actual" column is calculated using the Fund's actual operating expenses and total return for the period. You may use the Actual information, together with the amount invested, to estimate the expenses that you paid over the period. Simply divide your account value by $1,000 (for example, an $8,600 account value divided by $1,000 = 8.6), then multiply the results by the expenses paid during the period under the Actual column. The amount listed in the "Hypothetical" column assumes a 5% annual rate of return before expenses (which is not the Fund's actual return) and then applies the Fund's actual expense ratio for the period to the hypothetical return. You should not use the hypothetical account values and expenses to estimate either your actual account balance at the end of the period or the expenses you paid during the period. See "Compare With Other Funds" below for details on how to use the hypothetical data.
Compare With Other Funds
Since all mutual funds are required to include the same hypothetical calculations about expenses in shareholder reports, you can use this information to compare the ongoing cost of investing in the Fund with other funds. To do so, compare the hypothetical example with the 5% hypothetical examples that appear in the shareholder reports of other funds. As you compare hypothetical examples of other funds, it is important to note that hypothetical examples are meant to highlight the ongoing costs of investing in a fund only and do not reflect any transaction costs, such as sales charges, or redemption or exchange fees. Therefore, the hypothetical calculations are useful in comparing ongoing costs only, and will not help you determine the relative total costs of owning different funds. If transaction costs were included in these calculations, your costs would be higher.
May 1, 2012 – October 31, 2012
| | Account Value at the Beginning
of the Period ($) | | Account Value at the End of the
Period ($) | | Expenses Paid During the
Period ($) | | Fund's Annualized
Expense Ratio (%) | |
| | Actual | | Hypothetical | | Actual | | Hypothetical | | Actual | | Hypothetical | | Actual | |
Class A | | | 1,000.00 | | | | 1,000.00 | | | | 1,052.10 | | | | 1,020.06 | | | | 5.28 | | | | 5.19 | | | | 1.02 | | |
Class B | | | 1,000.00 | | | | 1,000.00 | | | | 1,048.20 | | | | 1,016.28 | | | | 9.14 | | | | 9.00 | | | | 1.77 | | |
Class C | | | 1,000.00 | | | | 1,000.00 | | | | 1,047.20 | | | | 1,017.04 | | | | 8.36 | | | | 8.24 | | | | 1.62 | | |
Class K
(formerly
Class R4) | | | 1,000.00 | | | | 1,000.00 | | | | 1,051.60 | | | | 1,020.77 | | | | 4.55 | | | | 4.48 | | | | 0.88 | | |
Class R | | | 1,000.00 | | | | 1,000.00 | | | | 1,050.50 | | | | 1,018.80 | | | | 6.56 | | | | 6.46 | | | | 1.27 | | |
Class R5 | | | 1,000.00 | | | | 1,000.00 | | | | 1,052.90 | | | | 1,022.08 | | | | 3.21 | | | | 3.16 | | | | 0.62 | | |
Class W | | | 1,000.00 | | | | 1,000.00 | | | | 1,052.20 | | | | 1,020.16 | | | | 5.17 | | | | 5.09 | | | | 1.00 | | |
Class Z | | | 1,000.00 | | | | 1,000.00 | | | | 1,052.40 | | | | 1,021.32 | | | | 3.98 | | | | 3.92 | | | | 0.77 | | |
Expenses paid during the period are equal to the annualized expense ratio for each class as indicated above, multiplied by the average account value over the period and then multiplied by the number of days in the Fund's most recent fiscal half year and divided by 365.
Expenses do not include fees and expenses incurred indirectly by the Fund from the underlying funds in which the Fund may invest (also referred to as "acquired funds"), including affiliated and non-affiliated pooled investment vehicles (including mutual funds and exchange-traded funds).
Had Columbia Management Investment Advisers, LLC and/or certain of its affiliates not waived/reimbursed certain fees and expenses, account value at the end of the period would have been reduced.
Annual Report 2012
7
Columbia Strategic Income Fund
Portfolio of Investments
October 31, 2012
(Percentages represent value of investments compared to net assets)
Corporate Bonds & Notes(a) 45.2%
Issuer | | Coupon
Rate | | Principal
Amount ($) | | Value ($) | |
Aerospace & Defense 1.0% | |
ADS Tactical, Inc.
Senior Secured(b)(c)
04/01/18 | | | 11.000 | % | | | 6,481,000 | | | | 6,416,190 | | |
Huntington Ingalls Industries, Inc.(c)
03/15/18 | | | 6.875 | % | | | 2,774,000 | | | | 2,995,920 | | |
Kratos Defense & Security Solutions, Inc.
Senior Secured
06/01/17 | | | 10.000 | % | | | 7,967,000 | | | | 8,604,360 | | |
Oshkosh Corp.
03/01/20 | | | 8.500 | % | | | 4,629,000 | | | | 5,097,686 | | |
Oshkosh Corp.(c)
03/01/17 | | | 8.250 | % | | | 1,263,000 | | | | 1,375,091 | | |
TransDigm, Inc.
Senior Subordinated Notes(b)
10/15/20 | | | 5.500 | % | | | 2,582,000 | | | | 2,614,275 | | |
Total | | | | | | | 27,103,522 | | |
Automotive 0.8% | |
Chrysler Group LLC/Co-Issuer, Inc.(c)
Secured
06/15/19 | | | 8.000 | % | | | 622,000 | | | | 661,653 | | |
06/15/21 | | | 8.250 | % | | | 4,536,000 | | | | 4,847,850 | | |
Dana Holding Corp.
Senior Unsecured
02/15/19 | | | 6.500 | % | | | 710,000 | | | | 741,950 | | |
02/15/21 | | | 6.750 | % | | | 408,000 | | | | 434,520 | | |
Delphi Corp.
05/15/19 | | | 5.875 | % | | | 1,137,000 | | | | 1,215,169 | | |
Delphi Corp.(c)
05/15/21 | | | 6.125 | % | | | 757,000 | | | | 836,485 | | |
Lear Corp.
03/15/18 | | | 7.875 | % | | | 3,524,000 | | | | 3,841,160 | | |
Schaeffler Finance BV(b)
Senior Secured
02/15/17 | | | 7.750 | % | | | 1,381,000 | | | | 1,526,005 | | |
Schaeffler Finance BV(b)(c)
Senior Secured
02/15/19 | | | 8.500 | % | | | 1,619,000 | | | | 1,825,422 | | |
Visteon Corp.(c)
04/15/19 | | | 6.750 | % | | | 6,140,000 | | | | 6,316,525 | | |
Total | | | | | | | 22,246,739 | | |
Banking 0.9% | |
BES Investimento do Brasil SA
Senior Unsecured(b)
03/25/15 | | | 5.625 | % | | | 1,000,000 | | | | 995,000 | | |
Corporate Bonds & Notes(a) (continued)
Issuer | | Coupon
Rate | | Principal
Amount ($) | | Value ($) | |
BanColombia SA
Senior Unsecured
06/03/21 | | | 5.950 | % | | | 1,600,000 | | | | 1,848,000 | | |
Banco de Bogota SA
Senior Unsecured(b)(c)
01/15/17 | | | 5.000 | % | | | 1,000,000 | | | | 1,073,923 | | |
Banco de Credito del Peru
Subordinated Notes(b)(d)
10/15/22 | | | 7.170 | % | | PEN | 2,000,000 | | | | 880,571 | | |
Bank of America Corp.
Senior Unsecured
05/13/21 | | | 5.000 | % | | | 6,860,000 | | | | 7,738,622 | | |
Citigroup, Inc.
Senior Unsecured
01/15/15 | | | 6.010 | % | | | 15,000 | | | | 16,513 | | |
JPMorgan Chase & Co.
Senior Unsecured
08/15/21 | | | 4.350 | % | | | 665,000 | | | | 743,273 | | |
JPMorgan Chase & Co.(c)
Senior Unsecured
09/23/22 | | | 3.250 | % | | | 890,000 | | | | 912,266 | | |
Lloyds Banking Group PLC(b)(d)
12/31/49 | | | 6.657 | % | | | 230,000 | | | | 193,200 | | |
Morgan Stanley
Senior Unsecured
01/26/20 | | | 5.500 | % | | | 500,000 | | | | 550,389 | | |
07/28/21 | | | 5.500 | % | | | 7,165,000 | | | | 7,963,360 | | |
Synovus Financial Corp.
Senior Unsecured
02/15/19 | | | 7.875 | % | | | 1,840,000 | | | | 2,079,200 | | |
Total | | | | | | | 24,994,317 | | |
Brokerage 0.6% | |
E*Trade Financial Corp.
Senior Unsecured
12/01/15 | | | 7.875 | % | | | 2,505,000 | | | | 2,539,444 | | |
E*Trade Financial Corp.(c)
Senior Unsecured
11/30/17 | | | 12.500 | % | | | 9,132,000 | | | | 10,341,990 | | |
Neuberger Berman Group LLC/Finance Corp.(b)
Senior Unsecured
03/15/20 | | | 5.625 | % | | | 1,092,000 | | | | 1,149,330 | | |
Neuberger Berman Group LLC/Finance Corp.(b)(c)
Senior Unsecured
03/15/22 | | | 5.875 | % | | | 1,987,000 | | | | 2,121,122 | | |
Nuveen Investments, Inc.
Senior Unsecured(b)
10/15/20 | | | 9.500 | % | | | 2,017,000 | | | | 2,032,128 | | |
Total | | | | | | | 18,184,014 | | |
The accompanying Notes to Financial Statements are an integral part of this statement.
Annual Report 2012
8
Columbia Strategic Income Fund
Portfolio of Investments (continued)
October 31, 2012
Corporate Bonds & Notes(a) (continued)
Issuer | | Coupon
Rate | | Principal
Amount ($) | | Value ($) | |
Building Materials 0.4% | |
Building Materials Corp. of America(b)
Senior Notes
05/01/21 | | | 6.750 | % | | | 2,517,000 | | | | 2,743,530 | | |
Senior Secured
02/15/20 | | | 7.000 | % | | | 945,000 | | | | 1,025,325 | | |
Gibraltar Industries, Inc.
12/01/15 | | | 8.000 | % | | | 2,523,000 | | | | 2,567,152 | | |
Interface, Inc.(c)
12/01/18 | | | 7.625 | % | | | 1,002,000 | | | | 1,083,413 | | |
Norcraft Companies LP/Finance Corp.
Secured
12/15/15 | | | 10.500 | % | | | 2,492,000 | | | | 2,504,460 | | |
Nortek, Inc.(c)
12/01/18 | | | 10.000 | % | | | 316,000 | | | | 350,365 | | |
04/15/21 | | | 8.500 | % | | | 1,307,000 | | | | 1,405,025 | | |
Total | | | | | | | 11,679,270 | | |
Chemicals 1.4% | |
Ashland, Inc.
Senior Unsecured(b)(c)
08/15/22 | | | 4.750 | % | | | 1,360,000 | | | | 1,387,200 | | |
Celanese U.S. Holdings LLC(c)
06/15/21 | | | 5.875 | % | | | 814,000 | | | | 906,593 | | |
Hexion US Finance Corp.
Senior Secured
04/15/20 | | | 6.625 | % | | | 609,000 | | | | 607,478 | | |
Huntsman International LLC
03/15/21 | | | 8.625 | % | | | 831,000 | | | | 945,263 | | |
JM Huber Corp.
Senior Notes(b)(c)
11/01/19 | | | 9.875 | % | | | 2,430,000 | | | | 2,697,300 | | |
LyondellBasell Industries NV(c)
Senior Unsecured
11/15/21 | | | 6.000 | % | | | 9,394,000 | | | | 10,861,812 | | |
04/15/24 | | | 5.750 | % | | | 6,124,000 | | | | 7,088,530 | | |
MPM Escrow LLC/Finance Corp.
Senior Secured(b)
10/15/20 | | | 8.875 | % | | | 2,356,000 | | | | 2,308,880 | | |
MacDermid, Inc.(b)
04/15/17 | | | 9.500 | % | | | 2,058,500 | | | | 2,151,132 | | |
Nova Chemicals Corp.
Senior Unsecured
11/01/19 | | | 8.625 | % | | | 2,153,000 | | | | 2,438,272 | | |
Nufarm Australia Ltd.(b)
10/15/19 | | | 6.375 | % | | | 674,000 | | | | 690,850 | | |
Polypore International, Inc.(c)
11/15/17 | | | 7.500 | % | | | 2,710,000 | | | | 2,926,800 | | |
Corporate Bonds & Notes(a) (continued)
Issuer | | Coupon
Rate | | Principal
Amount ($) | | Value ($) | |
Rockwood Specialties Group, Inc.
10/15/20 | | | 4.625 | % | | | 4,167,000 | | | | 4,292,010 | | |
Total | | | | | | | 39,302,120 | | |
Construction Machinery 1.1% | |
Ashtead Capital, Inc.
Secured(b)(c)
07/15/22 | | | 6.500 | % | | | 681,000 | | | | 721,860 | | |
CNH Capital LLC(b)
Senior Notes
11/01/15 | | | 3.875 | % | | | 303,000 | | | | 310,575 | | |
CNH Capital LLC(b)(c)
11/01/16 | | | 6.250 | % | | | 3,395,000 | | | | 3,666,600 | | |
Case New Holland, Inc.(c)
12/01/17 | | | 7.875 | % | | | 6,559,000 | | | | 7,706,825 | | |
Columbus McKinnon Corp.
02/01/19 | | | 7.875 | % | | | 950,000 | | | | 1,018,875 | | |
H&E Equipment Services, Inc.(b)
09/01/22 | | | 7.000 | % | | | 960,000 | | | | 998,400 | | |
Neff Rental LLC/Finance Corp.
Secured(b)
05/15/16 | | | 9.625 | % | | | 4,296,000 | | | | 4,360,440 | | |
Terex Corp.
04/01/20 | | | 6.500 | % | | | 1,845,000 | | | | 1,937,250 | | |
UR Merger Sub Corp.
12/15/19 | | | 9.250 | % | | | 5,225,000 | | | | 5,930,375 | | |
UR Merger Sub Corp.(b)
05/15/20 | | | 7.375 | % | | | 1,015,000 | | | | 1,096,200 | | |
UR Merger Sub Corp.(b)(c)
Secured
07/15/18 | | | 5.750 | % | | | 1,228,000 | | | | 1,317,030 | | |
UR Merger Sub Corp.(c)
09/15/20 | | | 8.375 | % | | | 1,662,000 | | | | 1,819,890 | | |
United Rentals, Inc.
06/15/23 | | | 6.125 | % | | | 679,000 | | | | 687,487 | | |
Total | | | | | | | 31,571,807 | | |
Consumer Cyclical Services 0.1% | |
Goodman Networks, Inc.
Senior Secured(b)
07/01/18 | | | 12.375 | % | | | 2,134,000 | | | | 2,294,050 | | |
Monitronics International, Inc.
04/01/20 | | | 9.125 | % | | | 1,380,000 | | | | 1,438,650 | | |
Total | | | | | | | 3,732,700 | | |
Consumer Products 0.5% | |
Clorox Co. (The)
Senior Unsecured
09/15/22 | | | 3.050 | % | | | 2,865,000 | | | | 2,965,120 | | |
The accompanying Notes to Financial Statements are an integral part of this statement.
Annual Report 2012
9
Columbia Strategic Income Fund
Portfolio of Investments (continued)
October 31, 2012
Corporate Bonds & Notes(a) (continued)
Issuer | | Coupon
Rate | | Principal
Amount ($) | | Value ($) | |
Libbey Glass, Inc.
Senior Secured(b)
05/15/20 | | | 6.875 | % | | | 973,000 | | | | 1,045,975 | | |
Serta Simmons Holdings LLC
Senior Notes(b)
10/01/20 | | | 8.125 | % | | | 2,975,000 | | | | 3,015,906 | | |
Spectrum Brands, Inc.(b)
03/15/20 | | | 6.750 | % | | | 667,000 | | | | 681,174 | | |
Spectrum Brands, Inc.(c)
Senior Secured
06/15/18 | | | 9.500 | % | | | 5,694,000 | | | | 6,391,515 | | |
Total | | | | | | | 14,099,690 | | |
Diversified Manufacturing 0.2% | |
Actuant Corp.
06/15/22 | | | 5.625 | % | | | 1,319,000 | | | | 1,361,868 | | |
Amsted Industries, Inc.
Senior Notes(b)
03/15/18 | | | 8.125 | % | | | 2,182,000 | | | | 2,356,560 | | |
Tomkins LLC/Inc.
Secured(c)
10/01/18 | | | 9.000 | % | | | 1,481,000 | | | | 1,658,720 | | |
Total | | | | | | | 5,377,148 | | |
Electric 3.4% | |
AES Corp.
Senior Unsecured
07/01/21 | | | 7.375 | % | | | 4,366,000 | | | | 4,879,005 | | |
Appalachian Power Co.
Senior Unsecured(c)
03/30/21 | | | 4.600 | % | | | 9,330,000 | | | | 10,894,193 | | |
Arizona Public Service Co.
Senior Unsecured
08/01/16 | | | 6.250 | % | | | 739,000 | | | | 865,706 | | |
Calpine Corp.
Senior Secured(b)(c)
02/15/21 | | | 7.500 | % | | | 6,071,000 | | | | 6,632,567 | | |
Carolina Power & Light Co.
1st Mortgage
05/15/42 | | | 4.100 | % | | | 1,500,000 | | | | 1,611,724 | | |
Cleveland Electric Illuminating Co. (The)
1st Mortgage
11/15/18 | | | 8.875 | % | | | 500,000 | | | | 670,191 | | |
Consolidated Edison Co. of New York, Inc.
Senior Unsecured
04/01/38 | | | 6.750 | % | | | 895,000 | | | | 1,339,325 | | |
Dominion Resources, Inc.
Senior Unsecured
11/30/17 | | | 6.000 | % | | | 1,080,000 | | | | 1,312,546 | | |
Corporate Bonds & Notes(a) (continued)
Issuer | | Coupon
Rate | | Principal
Amount ($) | | Value ($) | |
Dominion Resources, Inc.(c)
Senior Unsecured
08/15/19 | | | 5.200 | % | | | 3,904,000 | | | | 4,709,641 | | |
09/15/42 | | | 4.050 | % | | | 1,100,000 | | | | 1,143,988 | | |
Duke Energy Corp.
Senior Unsecured
09/15/14 | | | 3.950 | % | | | 3,930,000 | | | | 4,159,335 | | |
08/15/22 | | | 3.050 | % | | | 415,000 | | | | 426,103 | | |
Duke Energy Ohio, Inc.
1st Mortgage
04/01/19 | | | 5.450 | % | | | 3,585,000 | | | | 4,364,537 | | |
GenOn Energy, Inc.
Senior Unsecured
10/15/18 | | | 9.500 | % | | | 1,887,000 | | | | 2,151,180 | | |
Ipalco Enterprises, Inc.
Senior Secured(b)
04/01/16 | | | 7.250 | % | | | 2,415,000 | | | | 2,683,669 | | |
Nevada Power Co.
01/15/15 | | | 5.875 | % | | | 1,815,000 | | | | 2,011,162 | | |
05/15/18 | | | 6.500 | % | | | 10,355,000 | | | | 13,050,914 | | |
08/01/18 | | | 6.500 | % | | | 720,000 | | | | 912,713 | | |
04/01/36 | | | 6.650 | % | | | 950,000 | | | | 1,333,163 | | |
Oncor Electric Delivery Co. LLC
Senior Secured
06/01/42 | | | 5.300 | % | | | 3,300,000 | | | | 3,756,304 | | |
PacifiCorp
1st Mortgage
09/15/13 | | | 5.450 | % | | | 255,000 | | | | 265,310 | | |
Pacific Gas & Electric Co.(c)
Senior Unsecured
10/01/20 | | | 3.500 | % | | | 1,340,000 | | | | 1,492,925 | | |
04/15/42 | | | 4.450 | % | | | 575,000 | | | | 639,349 | | |
Progress Energy, Inc.
Senior Unsecured
12/01/19 | | | 4.875 | % | | | 3,862,000 | | | | 4,484,087 | | |
04/01/22 | | | 3.150 | % | | | 3,515,000 | | | | 3,620,165 | | |
Sierra Pacific Power Co.
05/15/16 | | | 6.000 | % | | | 3,020,000 | | | | 3,530,081 | | |
Toledo Edison Co. (The)
Senior Secured
05/15/37 | | | 6.150 | % | | | 3,400,000 | | | | 4,418,953 | | |
TransAlta Corp.
Senior Unsecured
05/15/18 | | | 6.650 | % | | | 7,330,000 | | | | 8,415,771 | | |
Total | | | | | | | 95,774,607 | | |
Entertainment 0.3% | |
AMC Entertainment, Inc.
12/01/20 | | | 9.750 | % | | | 1,965,000 | | | | 2,205,713 | | |
AMC Entertainment, Inc.(c)
06/01/19 | | | 8.750 | % | | | 3,177,000 | | | | 3,510,585 | | |
The accompanying Notes to Financial Statements are an integral part of this statement.
Annual Report 2012
10
Columbia Strategic Income Fund
Portfolio of Investments (continued)
October 31, 2012
Corporate Bonds & Notes(a) (continued)
Issuer | | Coupon
Rate | | Principal
Amount ($) | | Value ($) | |
Six Flags, Inc.(b)(e)(f)(g)
06/01/14 | | | 9.625 | % | | | 1,557,000 | | | | — | | |
Speedway Motorsports, Inc.(c)
02/01/19 | | | 6.750 | % | | | 722,000 | | | | 767,125 | | |
Vail Resorts, Inc.
05/01/19 | | | 6.500 | % | | | 623,000 | | | | 675,955 | | |
Total | | | | | | | 7,159,378 | | |
Environmental 0.1% | |
Clean Harbors, Inc.(b)
08/01/20 | | | 5.250 | % | | | 2,331,000 | | | | 2,389,275 | | |
Food and Beverage 1.5% | |
ConAgra Foods, Inc.
Senior Unsecured
09/15/22 | | | 3.250 | % | | | 5,690,000 | | | | 5,817,348 | | |
10/01/28 | | | 7.000 | % | | | 855,000 | | | | 1,116,131 | | |
Cott Beverages, Inc.(c)
11/15/17 | | | 8.375 | % | | | 1,185,000 | | | | 1,297,575 | | |
09/01/18 | | | 8.125 | % | | | 1,291,000 | | | | 1,433,010 | | |
Heineken NV
Senior Unsecured(b)
04/01/22 | | | 3.400 | % | | | 4,300,000 | | | | 4,594,215 | | |
Kraft Foods Group, Inc.(b)
Senior Unsecured
08/23/18 | | | 6.125 | % | | | 10,960,000 | | | | 13,662,854 | | |
02/10/20 | | | 5.375 | % | | | 28,000 | | | | 34,365 | | |
MHP SA(b)(c)
04/29/15 | | | 10.250 | % | | | 3,204,000 | | | | 3,292,110 | | |
Mondelez International, Inc.
Senior Unsecured
02/01/18 | | | 6.125 | % | | | 3,797,000 | | | | 4,681,739 | | |
02/10/20 | | | 5.375 | % | | | 27,000 | | | | 33,140 | | |
SABMiller Holdings, Inc.(b)
01/15/22 | | | 3.750 | % | | | 2,205,000 | | | | 2,425,147 | | |
SABMiller Holdings, Inc.(b)(c)
01/15/17 | | | 2.450 | % | | | 4,700,000 | | | | 4,926,780 | | |
Total | | | | | | | 43,314,414 | | |
Gaming 0.8% | |
Caesars Entertainment Operating Co., Inc.
Senior Secured(b)
02/15/20 | | | 8.500 | % | | | 2,816,000 | | | | 2,766,720 | | |
MGM Resorts International
06/01/16 | | | 7.500 | % | | | 995,000 | | | | 1,054,700 | | |
03/01/18 | | | 11.375 | % | | | 1,925,000 | | | | 2,261,875 | | |
MGM Resorts International(b)(c)
10/01/20 | | | 6.750 | % | | | 444,000 | | | | 440,670 | | |
Corporate Bonds & Notes(a) (continued)
Issuer | | Coupon
Rate | | Principal
Amount ($) | | Value ($) | |
Penn National Gaming, Inc.
Senior Subordinated Notes(c)
08/15/19 | | | 8.750 | % | | | 1,647,000 | | | | 1,840,522 | | |
ROC Finance LLC/Corp.
Secured(b)
09/01/18 | | | 12.125 | % | | | 2,529,000 | | | | 2,920,995 | | |
Seminole Indian Tribe of Florida(b)
10/01/17 | | | 7.750 | % | | | 444,000 | | | | 483,960 | | |
10/01/20 | | | 7.804 | % | | | 2,455,000 | | | | 2,509,035 | | |
Senior Secured
10/01/20 | | | 6.535 | % | | | 1,510,000 | | | | 1,625,258 | | |
Seneca Gaming Corp.(b)
12/01/18 | | | 8.250 | % | | | 2,909,000 | | | | 3,065,359 | | |
Tunica-Biloxi Gaming Authority
Senior Unsecured(b)
11/15/15 | | | 9.000 | % | | | 2,397,000 | | | | 2,181,270 | | |
Total | | | | | | | 21,150,364 | | |
Gas Pipelines 2.5% | |
Colorado Interstate Gas Co. LLC
Senior Unsecured(c)
11/15/15 | | | 6.800 | % | | | 3,219,000 | | | | 3,734,613 | | |
El Paso LLC
Senior Unsecured
06/01/18 | | | 7.250 | % | | | 779,000 | | | | 893,902 | | |
01/15/32 | | | 7.750 | % | | | 6,853,000 | | | | 8,178,336 | | |
El Paso LLC(c)
Senior Unsecured
06/15/14 | | | 6.875 | % | | | 1,495,000 | | | | 1,605,359 | | |
09/15/20 | | | 6.500 | % | | | 6,549,000 | | | | 7,321,782 | | |
Enterprise Products Operating LLC
02/15/42 | | | 5.700 | % | | | 2,145,000 | | | | 2,591,690 | | |
Kinder Morgan Energy Partners LP
Senior Unsecured
02/15/20 | | | 6.850 | % | | | 1,820,000 | | | | 2,324,781 | | |
09/15/20 | | | 5.300 | % | | | 1,350,000 | | | | 1,599,587 | | |
MarkWest Energy Partners LP/Finance Corp.
06/15/22 | | | 6.250 | % | | | 4,533,000 | | | | 4,918,305 | | |
02/15/23 | | | 5.500 | % | | | 2,894,000 | | | | 3,038,700 | | |
NiSource Finance Corp.(c)
09/15/17 | | | 5.250 | % | | | 9,860,000 | | | | 11,446,518 | | |
Northwest Pipeline GP
Senior Unsecured
04/15/17 | | | 5.950 | % | | | 500,000 | | | | 583,131 | | |
Plains All American Pipeline LP/Finance Corp.
05/01/19 | | | 8.750 | % | | | 2,715,000 | | | | 3,681,678 | | |
Regency Energy Partners LP/Corp.
04/15/23 | | | 5.500 | % | | | 2,707,000 | | | | 2,815,280 | | |
The accompanying Notes to Financial Statements are an integral part of this statement.
Annual Report 2012
11
Columbia Strategic Income Fund
Portfolio of Investments (continued)
October 31, 2012
Corporate Bonds & Notes(a) (continued)
Issuer | | Coupon
Rate | | Principal
Amount ($) | | Value ($) | |
Regency Energy Partners LP/Finance Corp.
12/01/18 | | | 6.875 | % | | | 1,682,000 | | | | 1,820,765 | | |
07/15/21 | | | 6.500 | % | | | 3,807,000 | | | | 4,130,595 | | |
Southern Natural Gas Co. LLC
Senior Unsecured(b)
04/01/17 | | | 5.900 | % | | | 1,255,000 | | | | 1,471,098 | | |
Southern Star Central Corp.
Senior Unsecured
03/01/16 | | | 6.750 | % | | | 2,270,000 | | | | 2,312,562 | | |
Tesoro Logistics LP/Finance Corp.
Senior Notes(b)(c)
10/01/20 | | | 5.875 | % | | | 1,537,000 | | | | 1,590,795 | | |
TransCanada PipeLines Ltd.
Senior Unsecured
01/15/39 | | | 7.625 | % | | | 575,000 | | | | 908,286 | | |
Transcontinental Gas Pipe Line Co. LLC
Senior Unsecured(b)
08/01/42 | | | 4.450 | % | | | 2,465,000 | | | | 2,640,280 | | |
Total | | | | | | | 69,608,043 | | |
Health Care 2.9% | |
American Renal Associates Holdings, Inc.
Senior Unsecured PIK
03/01/16 | | | 9.750 | % | | | 733,913 | | | | 777,948 | | |
American Renal Holdings, Inc.
Senior Secured
05/15/18 | | | 8.375 | % | | | 1,625,000 | | | | 1,718,437 | | |
Biomet, Inc.(b)(c)
08/01/20 | | | 6.500 | % | | | 2,763,000 | | | | 2,852,797 | | |
CHS/Community Health Systems, Inc.
11/15/19 | | | 8.000 | % | | | 2,605,000 | | | | 2,810,144 | | |
CHS/Community Health Systems, Inc.(c)
07/15/20 | | | 7.125 | % | | | 2,664,000 | | | | 2,817,180 | | |
Senior Secured
08/15/18 | | | 5.125 | % | | | 3,186,000 | | | | 3,305,475 | | |
ConvaTec Healthcare E SA
Senior Unsecured(b)(c)
12/15/18 | | | 10.500 | % | | | 5,272,000 | | | | 5,720,120 | | |
DaVita HealthCare Partners, Inc.
08/15/22 | | | 5.750 | % | | | 2,488,000 | | | | 2,599,960 | | |
Emdeon, Inc.
12/31/19 | | | 11.000 | % | | | 2,635,000 | | | | 3,023,662 | | |
Fresenius Medical Care U.S. Finance II, Inc.(b)
07/31/19 | | | 5.625 | % | | | 813,000 | | | | 855,683 | | |
01/31/22 | | | 5.875 | % | | | 1,054,000 | | | | 1,121,193 | | |
Fresenius Medical Care U.S. Finance, Inc.(b)
09/15/18 | | | 6.500 | % | | | 621,000 | | | | 695,520 | | |
Corporate Bonds & Notes(a) (continued)
Issuer | | Coupon
Rate | | Principal
Amount ($) | | Value ($) | |
HCA, Inc.
05/01/23 | | | 5.875 | % | | | 1,729,000 | | | | 1,746,290 | | |
Senior Secured
02/15/20 | | | 6.500 | % | | | 4,178,000 | | | | 4,616,690 | | |
05/01/23 | | | 4.750 | % | | | 1,149,000 | | | | 1,149,000 | | |
HCA, Inc.(c)
02/15/22 | | | 7.500 | % | | | 3,136,000 | | | | 3,504,480 | | |
Health Management Associates, Inc.(c)
01/15/20 | | | 7.375 | % | | | 1,539,000 | | | | 1,658,273 | | |
HealthSouth Corp.
11/01/24 | | | 5.750 | % | | | 1,504,000 | | | | 1,519,040 | | |
Hologic, Inc.(b)
08/01/20 | | | 6.250 | % | | | 973,000 | | | | 1,031,380 | | |
IASIS Healthcare LLC/Capital Corp.(c)
05/15/19 | | | 8.375 | % | | | 4,867,000 | | | | 4,477,640 | | |
IMS Health, Inc.
Senior Unsecured(b)
11/01/20 | | | 6.000 | % | | | 1,511,000 | | | | 1,537,443 | | |
Kinetic Concepts, Inc./KCI U.S.A., Inc.
Secured(b)
11/01/18 | | | 10.500 | % | | | 1,262,000 | | | | 1,344,030 | | |
LifePoint Hospitals, Inc.
10/01/20 | | | 6.625 | % | | | 1,002,000 | | | | 1,082,160 | | |
Multiplan, Inc.(b)(c)
09/01/18 | | | 9.875 | % | | | 5,520,000 | | | | 6,072,000 | | |
Omnicare, Inc.
06/01/20 | | | 7.750 | % | | | 1,499,000 | | | | 1,648,900 | | |
Physio-Control International, Inc.
Senior Secured(b)
01/15/19 | | | 9.875 | % | | | 2,117,000 | | | | 2,318,115 | | |
Radnet Management, Inc.(c)
04/01/18 | | | 10.375 | % | | | 970,000 | | | | 974,850 | | |
Rural/Metro Corp.
Senior Unsecured(b)
07/15/19 | | | 10.125 | % | | | 1,692,000 | | | | 1,586,250 | | |
STHI Holding Corp.
Secured(b)(c)
03/15/18 | | | 8.000 | % | | | 891,000 | | | | 953,370 | | |
Tenet Healthcare Corp.(b)
02/01/20 | | | 6.750 | % | | | 1,758,000 | | | | 1,747,012 | | |
Senior Secured
06/01/20 | | | 4.750 | % | | | 2,330,000 | | | | 2,309,612 | | |
Truven Health Analytics, Inc.
Senior Unsecured(b)(c)
06/01/20 | | | 10.625 | % | | | 1,268,000 | | | | 1,359,930 | | |
United Surgical Partners International, Inc.(c)
04/01/20 | | | 9.000 | % | | | 1,472,000 | | | | 1,611,840 | | |
The accompanying Notes to Financial Statements are an integral part of this statement.
Annual Report 2012
12
Columbia Strategic Income Fund
Portfolio of Investments (continued)
October 31, 2012
Corporate Bonds & Notes(a) (continued)
Issuer | | Coupon
Rate | | Principal
Amount ($) | | Value ($) | |
Universal Hospital Services, Inc.
Secured(b)(c)
08/15/20 | | | 7.625 | % | | | 843,000 | | | | 874,613 | | |
VWR Funding, Inc.(b)
09/15/17 | | | 7.250 | % | | | 180,000 | | | | 182,250 | | |
Vanguard Health Holding Co. II LLC/Inc.(b)
02/01/19 | | | 7.750 | % | | | 834,000 | | | | 867,360 | | |
Vanguard Health Holding Co. II LLC/Inc.(c)
02/01/18 | | | 8.000 | % | | | 5,259,000 | | | | 5,469,360 | | |
02/01/19 | | | 7.750 | % | | | 410,000 | | | | 425,375 | | |
Total | | | | | | | 80,365,382 | | |
Healthcare Insurance 0.2% | |
AMERIGROUP Corp.
Senior Unsecured
11/15/19 | | | 7.500 | % | | | 2,264,000 | | | | 2,643,220 | | |
UnitedHealth Group, Inc.
Senior Unsecured
10/15/42 | | | 3.950 | % | | | 950,000 | | | | 962,610 | | |
WellPoint, Inc.
Senior Unsecured
02/15/19 | | | 7.000 | % | | | 960,000 | | | | 1,223,209 | | |
Total | | | | | | | 4,829,039 | | |
Home Construction 0.3% | |
Beazer Homes USA, Inc.
05/15/19 | | | 9.125 | % | | | 915,000 | | | | 960,750 | | |
KB Home
03/15/20 | | | 8.000 | % | | | 1,053,000 | | | | 1,176,727 | | |
09/15/22 | | | 7.500 | % | | | 845,000 | | | | 914,713 | | |
Meritage Homes Corp.(c)
04/01/22 | | | 7.000 | % | | | 1,000,000 | | | | 1,080,000 | | |
Shea Homes LP/Funding Corp.
Senior Secured(c)
05/15/19 | | | 8.625 | % | | | 1,535,000 | | | | 1,707,687 | | |
Taylor Morrison Communities, Inc./Monarch, Inc.(b)
04/15/20 | | | 7.750 | % | | | 2,129,000 | | | | 2,267,385 | | |
04/15/20 | | | 7.750 | % | | | 660,000 | | | | 702,900 | | |
Total | | | | | | | 8,810,162 | | |
Independent Energy 5.3% | |
Anadarko Petroleum Corp.
Senior Unsecured
09/15/16 | | | 5.950 | % | | | 8,505,000 | | | | 9,879,510 | | |
Antero Resources Finance Corp.
12/01/17 | | | 9.375 | % | | | 154,000 | | | | 169,785 | | |
Antero Resources Finance Corp.(c)
08/01/19 | | | 7.250 | % | | | 552,000 | | | | 596,160 | | |
Corporate Bonds & Notes(a) (continued)
Issuer | | Coupon
Rate | | Principal
Amount ($) | | Value ($) | |
Berry Petroleum Co.
Senior Unsecured(c)
11/01/20 | | | 6.750 | % | | | 760,000 | | | | 805,600 | | |
Canadian Oil Sands Ltd.
Senior Unsecured(b)
04/01/42 | | | 6.000 | % | | | 2,285,000 | | | | 2,783,327 | | |
Carrizo Oil & Gas, Inc.
10/15/18 | | | 8.625 | % | | | 2,682,000 | | | | 2,889,855 | | |
Chaparral Energy, Inc.
10/01/20 | | | 9.875 | % | | | 1,090,000 | | | | 1,239,875 | | |
09/01/21 | | | 8.250 | % | | | 1,844,000 | | | | 2,014,570 | | |
Chaparral Energy, Inc.(b)(c)
11/15/22 | | | 7.625 | % | | | 932,000 | | | | 990,250 | | |
Chesapeake Energy Corp.
08/15/20 | | | 6.625 | % | | | 4,615,000 | | | | 4,822,675 | | |
02/15/21 | | | 6.125 | % | | | 4,711,000 | | | | 4,769,887 | | |
Cimarex Energy Co.
05/01/22 | | | 5.875 | % | | | 3,136,000 | | | | 3,332,000 | | |
Comstock Resources, Inc.
06/15/20 | | | 9.500 | % | | | 3,958,000 | | | | 4,235,060 | | |
Concho Resources, Inc.
01/15/21 | | | 7.000 | % | | | 3,680,000 | | | | 4,084,800 | | |
01/15/22 | | | 6.500 | % | | | 1,059,000 | | | | 1,162,253 | | |
Concho Resources, Inc.(c)
04/01/23 | | | 5.500 | % | | | 2,229,000 | | | | 2,334,878 | | |
Continental Resources, Inc.
10/01/19 | | | 8.250 | % | | | 216,000 | | | | 243,540 | | |
10/01/20 | | | 7.375 | % | | | 224,000 | | | | 252,000 | | |
04/01/21 | | | 7.125 | % | | | 3,095,000 | | | | 3,481,875 | | |
09/15/22 | | | 5.000 | % | | | 7,447,000 | | | | 7,837,967 | | |
Continental Resources, Inc.(b)
09/15/22 | | | 5.000 | % | | | 1,531,000 | | | | 1,615,205 | | |
EP Energy LLC/Everest Acquisition Finance, Inc.(b)
09/01/22 | | | 7.750 | % | | | 425,000 | | | | 439,875 | | |
EP Energy LLC/Finance, Inc.(b)
Senior Unsecured
05/01/20 | | | 9.375 | % | | | 4,075,000 | | | | 4,502,875 | | |
EP Energy LLC/Finance, Inc.(b)(c)
Senior Secured
05/01/19 | | | 6.875 | % | | | 3,810,000 | | | | 4,114,800 | | |
EnCana Corp.
Senior Unsecured
11/15/41 | | | 5.150 | % | | | 2,000,000 | | | | 2,190,888 | | |
Halcon Resources Corp.
Senior Unsecured(b)(h)
05/15/21 | | | 8.875 | % | | | 1,720,000 | | | | 1,743,650 | | |
Kodiak Oil & Gas Corp.(b)(c)
12/01/19 | | | 8.125 | % | | | 8,777,000 | | | | 9,566,930 | | |
The accompanying Notes to Financial Statements are an integral part of this statement.
Annual Report 2012
13
Columbia Strategic Income Fund
Portfolio of Investments (continued)
October 31, 2012
Corporate Bonds & Notes(a) (continued)
Issuer | | Coupon
Rate | | Principal
Amount ($) | | Value ($) | |
Laredo Petroleum, Inc.
02/15/19 | | | 9.500 | % | | | 6,085,000 | | | | 6,906,475 | | |
Laredo Petroleum, Inc.(c)
05/01/22 | | | 7.375 | % | | | 929,000 | | | | 1,012,610 | | |
MEG Energy Corp.(b)
03/15/21 | | | 6.500 | % | | | 2,610,000 | | | | 2,799,225 | | |
01/30/23 | | | 6.375 | % | | | 1,984,000 | | | | 2,122,880 | | |
Newfield Exploration Co.
Senior Unsecured
07/01/24 | | | 5.625 | % | | | 4,606,000 | | | | 4,916,905 | | |
Novatek Finance Ltd.
Senior Unsecured(b)
02/03/21 | | | 6.604 | % | | | 300,000 | | | | 351,260 | | |
Oasis Petroleum, Inc.
02/01/19 | | | 7.250 | % | | | 3,349,000 | | | | 3,583,430 | | |
01/15/23 | | | 6.875 | % | | | 2,463,000 | | | | 2,610,780 | | |
Oasis Petroleum, Inc.(c)
11/01/21 | | | 6.500 | % | | | 3,320,000 | | | | 3,510,900 | | |
Plains Exploration & Production Co.
11/15/20 | | | 6.500 | % | | | 5,975,000 | | | | 5,975,000 | | |
02/15/23 | | | 6.875 | % | | | 4,511,000 | | | | 4,505,361 | | |
QEP Resources, Inc.
Senior Unsecured
03/01/21 | | | 6.875 | % | | | 4,244,000 | | | | 4,838,160 | | |
QEP Resources, Inc.(c)
Senior Unsecured
10/01/22 | | | 5.375 | % | | | 5,098,000 | | | | 5,333,782 | | |
05/01/23 | | | 5.250 | % | | | 3,600,000 | | | | 3,753,000 | | |
Range Resources Corp.
05/15/19 | | | 8.000 | % | | | 1,115,000 | | | | 1,232,075 | | |
08/01/20 | | | 6.750 | % | | | 2,335,000 | | | | 2,574,338 | | |
06/01/21 | | | 5.750 | % | | | 385,000 | | | | 411,950 | | |
Range Resources Corp.(c)
08/15/22 | | | 5.000 | % | | | 527,000 | | | | 550,715 | | |
SM Energy Co.
Senior Unsecured
11/15/21 | | | 6.500 | % | | | 1,297,000 | | | | 1,365,093 | | |
01/01/23 | | | 6.500 | % | | | 1,067,000 | | | | 1,115,015 | | |
WPX Energy, Inc.
Senior Unsecured
01/15/22 | | | 6.000 | % | | | 806,000 | | | | 862,420 | | |
Whiting Petroleum Corp.
10/01/18 | | | 6.500 | % | | | 156,000 | | | | 168,285 | | |
Woodside Finance Ltd.(b)
05/10/21 | | | 4.600 | % | | | 4,500,000 | | | | 5,024,524 | | |
Total | | | | | | | 147,624,273 | | |
Integrated Energy 0.2% | |
Lukoil International Finance BV(b)
11/09/20 | | | 6.125 | % | | | 2,300,000 | | | | 2,614,350 | | |
Corporate Bonds & Notes(a) (continued)
Issuer | | Coupon
Rate | | Principal
Amount ($) | | Value ($) | |
Lukoil International Finance BV(b)(c)
11/05/19 | | | 7.250 | % | | | 1,100,000 | | | | 1,323,366 | | |
TNK-BP Finance SA(b)(c)
03/13/18 | | | 7.875 | % | | | 425,000 | | | | 504,097 | | |
Total | | | | | | | 4,441,813 | | |
Life Insurance 0.3% | |
Hartford Financial Services Group, Inc.
Senior Unsecured
04/15/42 | | | 6.625 | % | | | 3,095,000 | | | | 4,013,488 | | |
Prudential Financial, Inc.
Senior Unsecured
05/12/41 | | | 5.625 | % | | | 3,605,000 | | | | 4,263,298 | | |
Total | | | | | | | 8,276,786 | | |
Lodging —% | |
Choice Hotels International, Inc.(c)
07/01/22 | | | 5.750 | % | | | 1,055,000 | | | | 1,155,225 | | |
Media Cable 1.6% | |
CCO Holdings LLC/Capital Corp.(c)
04/30/20 | | | 8.125 | % | | | 4,045,000 | | | | 4,560,737 | | |
01/31/22 | | | 6.625 | % | | | 1,463,000 | | | | 1,587,355 | | |
09/30/22 | | | 5.250 | % | | | 5,310,000 | | | | 5,336,550 | | |
CSC Holdings LLC
Senior Unsecured(b)(c)
11/15/21 | | | 6.750 | % | | | 5,126,000 | | | | 5,702,675 | | |
Cablevision Systems Corp.
Senior Unsecured
09/15/22 | | | 5.875 | % | | | 1,262,000 | | | | 1,252,535 | | |
Cablevision Systems Corp.(c)
Senior Unsecured
04/15/20 | | | 8.000 | % | | | 1,175,000 | | | | 1,318,938 | | |
Cequel Communications Escrow 1 LLC/Capital Corp.
Senior Unsecured(b)
09/15/20 | | | 6.375 | % | | | 2,149,000 | | | | 2,175,862 | | |
Comcast Corp.
08/15/37 | | | 6.950 | % | | | 3,430,000 | | | | 4,764,812 | | |
DISH DBS Corp.
07/15/22 | | | 5.875 | % | | | 781,000 | | | | 820,050 | | |
DISH DBS Corp.(c)
09/01/19 | | | 7.875 | % | | | 523,000 | | | | 613,218 | | |
06/01/21 | | | 6.750 | % | | | 8,639,000 | | | | 9,621,686 | | |
DirecTV Holdings LLC/Financing Co., Inc.
03/15/42 | | | 5.150 | % | | | 2,525,000 | | | | 2,641,160 | | |
Quebecor Media, Inc.
Senior Unsecured(b)(c)
01/15/23 | | | 5.750 | % | | | 3,202,000 | | | | 3,266,040 | | |
Time Warner Cable, Inc.
07/01/18 | | | 6.750 | % | | | 145,000 | | | | 183,560 | | |
The accompanying Notes to Financial Statements are an integral part of this statement.
Annual Report 2012
14
Columbia Strategic Income Fund
Portfolio of Investments (continued)
October 31, 2012
Corporate Bonds & Notes(a) (continued)
Issuer | | Coupon
Rate | | Principal
Amount ($) | | Value ($) | |
Time Warner Cable, Inc.(c)
02/01/20 | | | 5.000 | % | | | 810,000 | | | | 954,112 | | |
Videotron Ltd.(c)
07/15/22 | | | 5.000 | % | | | 58,000 | | | | 60,030 | | |
Virgin Media Finance PLC
02/15/22 | | | 5.250 | % | | | 215,000 | | | | 224,675 | | |
WaveDivision Escrow LLC/Corp.
Senior Unsecured(b)
09/01/20 | | | 8.125 | % | | | 70,000 | | | | 72,100 | | |
Total | | | | | | | 45,156,095 | | |
Media Non-Cable 3.7% | |
AMC Networks, Inc.(c)
07/15/21 | | | 7.750 | % | | | 5,832,000 | | | | 6,619,320 | | |
Clear Channel Communications, Inc.
08/01/16 | | | 10.750 | % | | | 1,874,000 | | | | 1,386,760 | | |
Clear Channel Communications, Inc.(b)
Senior Secured
12/15/19 | | | 9.000 | % | | | 313,000 | | | | 281,700 | | |
Clear Channel Worldwide Holdings, Inc.
12/15/17 | | | 9.250 | % | | | 4,899,000 | | | | 5,254,177 | | |
Clear Channel Worldwide Holdings, Inc.(c)
03/15/20 | | | 7.625 | % | | | 6,806,000 | | | | 6,482,715 | | |
Getty Images LLC/Inc.
Senior Notes(b)
10/15/20 | | | 7.000 | % | | | 3,275,000 | | | | 3,324,125 | | |
Hughes Satellite Systems Corp.
Senior Secured
06/15/19 | | | 6.500 | % | | | 4,440,000 | | | | 4,750,800 | | |
Hughes Satellite Systems Corp.(c)
06/15/21 | | | 7.625 | % | | | 1,245,000 | | | | 1,385,063 | | |
Intelsat Jackson Holdings SA
04/01/19 | | | 7.250 | % | | | 395,000 | | | | 423,638 | | |
Intelsat Jackson Holdings SA(b)(c)
10/15/20 | | | 7.250 | % | | | 1,620,000 | | | | 1,717,200 | | |
12/15/22 | | | 6.625 | % | | | 979,000 | | | | 971,658 | | |
Intelsat Jackson Holdings SA(c)
04/01/21 | | | 7.500 | % | | | 2,660,000 | | | | 2,852,850 | | |
Intelsat Luxembourg SA
PIK(c)
02/04/17 | | | 11.500 | % | | | 5,692,000 | | | | 5,990,830 | | |
Lamar Media Corp.(b)
Senior Subordinated Notes
05/01/23 | | | 5.000 | % | | | 3,588,000 | | | | 3,588,000 | | |
Lamar Media Corp.(c)
02/01/22 | | | 5.875 | % | | | 2,098,000 | | | | 2,223,880 | | |
National CineMedia LLC(b)
Senior Secured
04/15/22 | | | 6.000 | % | | | 2,284,000 | | | | 2,409,620 | | |
Corporate Bonds & Notes(a) (continued)
Issuer | | Coupon
Rate | | Principal
Amount ($) | | Value ($) | |
National CineMedia LLC(c)
Senior Unsecured
07/15/21 | | | 7.875 | % | | | 2,784,000 | | | | 3,041,520 | | |
News America, Inc.
12/15/35 | | | 6.400 | % | | | 150,000 | | | | 192,362 | | |
02/15/41 | | | 6.150 | % | | | 5,395,000 | | | | 6,982,700 | | |
Nielsen Finance LLC/Co.(b)(c)
10/01/20 | | | 4.500 | % | | | 5,115,000 | | | | 5,076,637 | | |
Reed Elsevier Capital, Inc.(b)
10/15/22 | | | 3.125 | % | | | 2,455,000 | | | | 2,484,201 | | |
Salem Communications Corp.
Secured(c)
12/15/16 | | | 9.625 | % | | | 3,856,000 | | | | 4,289,800 | | |
Sinclair Television Group, Inc.
Secured(b)(c)
11/01/17 | | | 9.250 | % | | | 6,127,000 | | | | 6,785,652 | | |
Starz LLC/Finance Corp.
Senior Notes(b)
09/15/19 | | | 5.000 | % | | | 1,341,000 | | | | 1,371,173 | | |
TCM Sub LLC(b)
01/15/15 | | | 3.550 | % | | | 5,510,000 | | | | 5,798,988 | | |
Univision Communications, Inc.(b)
Senior Secured
09/15/22 | | | 6.750 | % | | | 962,000 | | | | 962,000 | | |
Univision Communications, Inc.(b)(c)
05/15/21 | | | 8.500 | % | | | 3,146,000 | | | | 3,169,595 | | |
Senior Secured
05/15/19 | | | 6.875 | % | | | 2,100,000 | | | | 2,147,250 | | |
11/01/20 | | | 7.875 | % | | | 6,618,000 | | | | 7,048,170 | | |
XM Satellite Radio, Inc.(b)
11/01/18 | | | 7.625 | % | | | 3,273,000 | | | | 3,616,665 | | |
Total | | | | | | | 102,629,049 | | |
Metals 1.4% | |
Alpha Natural Resources, Inc.
06/01/19 | | | 6.000 | % | | | 2,910,000 | | | | 2,546,250 | | |
Alpha Natural Resources, Inc.(c)
04/15/18 | | | 9.750 | % | | | 3,483,000 | | | | 3,526,538 | | |
06/01/21 | | | 6.250 | % | | | 1,953,000 | | | | 1,699,110 | | |
ArcelorMittal
Senior Unsecured(c)
03/01/41 | | | 7.000 | % | | | 4,020,000 | | | | 3,682,348 | | |
Arch Coal, Inc.
06/15/19 | | | 7.000 | % | | | 809,000 | | | | 717,988 | | |
06/15/21 | | | 7.250 | % | | | 262,000 | | | | 231,215 | | |
CONSOL Energy, Inc.
04/01/17 | | | 8.000 | % | | | 1,116,000 | | | | 1,180,170 | | |
Calcipar SA
Senior Secured(b)(c)
05/01/18 | | | 6.875 | % | | | 3,797,000 | | | | 3,806,492 | | |
The accompanying Notes to Financial Statements are an integral part of this statement.
Annual Report 2012
15
Columbia Strategic Income Fund
Portfolio of Investments (continued)
October 31, 2012
Corporate Bonds & Notes(a) (continued)
Issuer | | Coupon
Rate | | Principal
Amount ($) | | Value ($) | |
FMG Resources August 2006 Proprietary Ltd.(b)(c)
11/01/15 | | | 7.000 | % | | | 1,347,000 | | | | 1,357,103 | | |
11/01/19 | | | 8.250 | % | | | 5,816,000 | | | | 5,801,460 | | |
Inmet Mining Corp.(b)
06/01/20 | | | 8.750 | % | | | 4,985,000 | | | | 5,171,937 | | |
JMC Steel Group, Inc.
Senior Notes(b)(c)
03/15/18 | | | 8.250 | % | | | 2,108,000 | | | | 2,139,620 | | |
Old All, Inc.
Senior Unsecured(f)
06/01/20 | | | 6.000 | % | | | 3,093 | | | | 3,139 | | |
Peabody Energy Corp.(c)
11/15/18 | | | 6.000 | % | | | 2,594,000 | | | | 2,691,275 | | |
11/15/21 | | | 6.250 | % | | | 2,703,000 | | | | 2,790,848 | | |
Rain CII Carbon LLC/Corp.
Senior Secured(b)
12/01/18 | | | 8.000 | % | | | 3,182,000 | | | | 3,301,325 | | |
Total | | | | | | | 40,646,818 | | |
Non-Captive Consumer 0.4% | |
SLM Corp.
Senior Unsecured
03/25/20 | | | 8.000 | % | | | 3,097,000 | | | | 3,586,698 | | |
01/25/22 | | | 7.250 | % | | | 2,682,000 | | | | 2,956,905 | | |
Springleaf Finance Corp.
Senior Unsecured
12/15/17 | | | 6.900 | % | | | 5,059,000 | | | | 4,470,891 | | |
Total | | | | | | | 11,014,494 | | |
Non-Captive Diversified 2.2% | |
Ally Financial, Inc.
03/15/20 | | | 8.000 | % | | | 11,092,000 | | | | 13,228,319 | | |
Ally Financial, Inc.(c)
09/15/20 | | | 7.500 | % | | | 7,069,000 | | | | 8,332,584 | | |
CIT Group, Inc.
Senior Unsecured
03/15/18 | | | 5.250 | % | | | 3,007,000 | | | | 3,194,937 | | |
CIT Group, Inc.(b)
Senior Secured
04/01/18 | | | 6.625 | % | | | 3,125,000 | | | | 3,507,812 | | |
Senior Unsecured
02/15/19 | | | 5.500 | % | | | 6,682,000 | | | | 7,149,740 | | |
CIT Group, Inc.(c)
Senior Unsecured
05/15/20 | | | 5.375 | % | | | 1,953,000 | | | | 2,084,828 | | |
General Electric Capital Corp.
Senior Unsecured
10/17/21 | | | 4.650 | % | | | 9,370,000 | | | | 10,602,221 | | |
Corporate Bonds & Notes(a) (continued)
Issuer | | Coupon
Rate | | Principal
Amount ($) | | Value ($) | |
International Lease Finance Corp.
Senior Unsecured
01/15/22 | | | 8.625 | % | | | 2,266,000 | | | | 2,739,028 | | |
International Lease Finance Corp.(c)
Senior Unsecured
09/01/17 | | | 8.875 | % | | | 2,590,000 | | | | 3,069,150 | | |
04/01/19 | | | 5.875 | % | | | 853,000 | | | | 903,684 | | |
05/15/19 | | | 6.250 | % | | | 1,589,000 | | | | 1,712,546 | | |
12/15/20 | | | 8.250 | % | | | 3,280,000 | | | | 3,866,300 | | |
Total | | | | | | | 60,391,149 | | |
Oil Field Services 1.0% | |
Atwood Oceanics, Inc.
Senior Unsecured
02/01/20 | | | 6.500 | % | | | 6,024,000 | | | | 6,475,800 | | |
Bristow Group, Inc.
10/15/22 | | | 6.250 | % | | | 1,234,000 | | | | 1,291,073 | | |
Gazstream SA for Gazprom OAO
Senior Unsecured(b)
07/22/13 | | | 5.625 | % | | | 4,288 | | | | 4,361 | | |
Green Field Energy Services, Inc.(b)
Senior Secured
11/15/16 | | | 13.250 | % | | | 3,895,000 | | | | 3,972,900 | | |
Green Field Energy Services, Inc.(b)(g) | |
Senior Secured
11/15/16 | | | 13.250 | % | | | 93,000 | | | | 94,860 | | |
Hiland Partners LP/Finance Corp.(b)
10/01/20 | | | 7.250 | % | | | 5,635,000 | | | | 5,860,400 | | |
Offshore Group Investments Ltd.
Senior Secured(c)
08/01/15 | | | 11.500 | % | | | 3,917,000 | | | | 4,303,804 | | |
Oil States International, Inc.
06/01/19 | | | 6.500 | % | | | 3,301,000 | | | | 3,507,312 | | |
Seadrill Ltd.
Senior Unsecured(b)(c)
09/15/17 | | | 5.625 | % | | | 1,543,000 | | | | 1,543,000 | | |
Weatherford International Ltd.
03/15/13 | | | 5.150 | % | | | 14,000 | | | | 14,200 | | |
Total | | | | | | | 27,067,710 | | |
Other Industry 0.2% | |
Interline Brands, Inc.(c)
11/15/18 | | | 7.500 | % | | | 3,498,000 | | | | 3,777,840 | | |
SPL Logistics Escrow LLC/Finance Corp.
Senior Secured(b)
08/01/20 | | | 8.875 | % | | | 1,642,000 | | | | 1,744,625 | | |
Total | | | | | | | 5,522,465 | | |
The accompanying Notes to Financial Statements are an integral part of this statement.
Annual Report 2012
16
Columbia Strategic Income Fund
Portfolio of Investments (continued)
October 31, 2012
Corporate Bonds & Notes(a) (continued)
Issuer | | Coupon
Rate | | Principal
Amount ($) | | Value ($) | |
Packaging 0.6% | |
Ardagh Packaging Finance PLC
Senior Secured(b)(c)
10/15/17 | | | 7.375 | % | | | 1,237,000 | | | | 1,329,775 | | |
Berry Plastics Corp.
Secured(c)
01/15/21 | | | 9.750 | % | | | 1,343,000 | | | | 1,524,305 | | |
Reynolds Group Issuer, Inc./LLC
Senior Secured
08/15/19 | | | 7.875 | % | | | 6,224,000 | | | | 6,753,040 | | |
Reynolds Group Issuer, Inc./LLC(b)(c)
Senior Secured
10/15/20 | | | 5.750 | % | | | 1,865,000 | | | | 1,883,650 | | |
Reynolds Group Issuer, Inc./LLC(c)
08/15/19 | | | 9.875 | % | | | 3,714,000 | | | | 3,890,415 | | |
Sealed Air Corp.(b)
09/15/21 | | | 8.375 | % | | | 656,000 | | | | 721,600 | | |
Total | | | | | | | 16,102,785 | | |
Pharmaceuticals 0.8% | |
Catalent Pharma Solutions, Inc.(b)
10/15/18 | | | 7.875 | % | | | 2,942,000 | | | | 2,971,420 | | |
Elan Finance Plc./Corp.(b)(c)
10/15/19 | | | 6.250 | % | | | 2,094,000 | | | | 2,114,940 | | |
Grifols, Inc.(c)
02/01/18 | | | 8.250 | % | | | 2,873,000 | | | | 3,189,030 | | |
Jaguar Holding Co. I
Senior Notes PIK(b)
10/15/17 | | | 9.375 | % | | | 1,436,000 | | | | 1,457,540 | | |
Jaguar Holding Co. II/Merger Sub, Inc.
Senior Unsecured(b)
12/01/19 | | | 9.500 | % | | | 912,000 | | | | 1,019,160 | | |
Mylan, Inc.(b)
11/15/18 | | | 6.000 | % | | | 6,169,000 | | | | 6,569,985 | | |
VPI Escrow Corp.(b)
10/15/20 | | | 6.375 | % | | | 3,497,000 | | | | 3,680,592 | | |
Valeant Pharmaceuticals International
Senior Notes(b)(c)
10/15/20 | | | 6.375 | % | | | 700,000 | | | | 736,750 | | |
Warner Chilcott Co. LLC/Finance(c)
09/15/18 | | | 7.750 | % | | | 1,439,000 | | | | 1,518,145 | | |
Total | | | | | | | 23,257,562 | | |
Property & Casualty 0.5% | |
Alleghany Corp.
Senior Unsecured
06/27/22 | | | 4.950 | % | | | 2,000,000 | | | | 2,231,048 | | |
Corporate Bonds & Notes(a) (continued)
Issuer | | Coupon
Rate | | Principal
Amount ($) | | Value ($) | |
CNA Financial Corp.
Senior Unsecured
08/15/20 | | | 5.875 | % | | | 2,000,000 | | | | 2,352,732 | | |
Hub International Ltd.(b)
10/15/18 | | | 8.125 | % | | | 2,801,000 | | | | 2,878,028 | | |
Liberty Mutual Group, Inc.(b)
05/01/22 | | | 4.950 | % | | | 5,820,000 | | | | 6,355,795 | | |
Total | | | | | | | 13,817,603 | | |
Railroads 0.4% | |
Burlington Northern Santa Fe LLC
Senior Unsecured
09/01/42 | | | 4.375 | % | | | 4,000,000 | | | | 4,341,744 | | |
CSX Corp.
Senior Unsecured
04/15/41 | | | 5.500 | % | | | 3,205,000 | | | | 3,976,790 | | |
03/15/44 | | | 4.100 | % | | | 1,100,000 | | | | 1,114,721 | | |
Union Pacific Corp.
Senior Unsecured
08/15/18 | | | 5.700 | % | | | 1,440,000 | | | | 1,763,212 | | |
Total | | | | | | | 11,196,467 | | |
Refining —% | |
Phillips 66(b)
05/01/17 | | | 2.950 | % | | | 595,000 | | | | 634,587 | | |
REITs —% | |
Duke Realty LP
Senior Unsecured
08/15/19 | | | 8.250 | % | | | 200 | | | | 259 | | |
Restaurants 0.3% | |
Shearer's Escrow Corp.
Senior Secured(b)
11/01/19 | | | 9.000 | % | | | 1,693,000 | | | | 1,737,441 | | |
Yum! Brands, Inc.
Senior Unsecured
09/15/19 | | | 5.300 | % | | | 5,417,000 | | | | 6,306,071 | | |
Total | | | | | | | 8,043,512 | | |
Retailers 0.9% | |
99 Cents Only Stores(b)
12/15/19 | | | 11.000 | % | | | 1,316,000 | | | | 1,490,370 | | |
AutoNation, Inc.
02/01/20 | | | 5.500 | % | | | 186,000 | | | | 198,090 | | |
Burlington Coat Factory Warehouse Corp.(c)
02/15/19 | | | 10.000 | % | | | 2,466,000 | | | | 2,721,847 | | |
Jo-Ann Stores, Inc.
Senior Unsecured(b)(c)
03/15/19 | | | 8.125 | % | | | 1,842,000 | | | | 1,853,513 | | |
The accompanying Notes to Financial Statements are an integral part of this statement.
Annual Report 2012
17
Columbia Strategic Income Fund
Portfolio of Investments (continued)
October 31, 2012
Corporate Bonds & Notes(a) (continued)
Issuer | | Coupon
Rate | | Principal
Amount ($) | | Value ($) | |
Limited Brands, Inc.(c)
04/01/21 | | | 6.625 | % | | | 4,690,000 | | | | 5,364,187 | | |
02/15/22 | | | 5.625 | % | | | 1,832,000 | | | | 1,976,270 | | |
Penske Automotive Group, Inc.(b)
10/01/22 | | | 5.750 | % | | | 1,649,000 | | | | 1,679,919 | | |
Rite Aid Corp.
03/15/20 | | | 9.250 | % | | | 1,266,000 | | | | 1,294,485 | | |
Senior Secured
08/15/20 | | | 8.000 | % | | | 4,650,000 | | | | 5,342,850 | | |
Senior Unsecured
02/15/27 | | | 7.700 | % | | | 2,012,000 | | | | 1,659,900 | | |
Sally Holdings LLC/Capital, Inc.
11/15/19 | | | 6.875 | % | | | 1,217,000 | | | | 1,349,349 | | |
Sally Holdings LLC/Capital, Inc.(c)
06/01/22 | | | 5.750 | % | | | 724,000 | | | | 773,775 | | |
Total | | | | | | | 25,704,555 | | |
Supranational 0.3% | |
European Investment Bank
Senior Unsecured
06/20/17 | | | 1.400 | % | | JPY | 446,000,000 | | | | 5,862,054 | | |
01/18/27 | | | 2.150 | % | | JPY | 29,100,000 | | | | 387,081 | | |
International Finance Corp.
02/28/13 | | | 7.500 | % | | AUD | 2,675,000 | | | | 2,813,950 | | |
Total | | | | | | | 9,063,085 | | |
Technology 1.9% | |
Alliance Data Systems Corp.(b)
04/01/20 | | | 6.375 | % | | | 1,231,000 | | | | 1,323,325 | | |
Amkor Technology, Inc.
Senior Unsecured
05/01/18 | | | 7.375 | % | | | 775,000 | | | | 780,813 | | |
06/01/21 | | | 6.625 | % | | | 4,190,000 | | | | 3,990,975 | | |
Amkor Technology, Inc.(b)
10/01/22 | | | 6.375 | % | | | 1,533,000 | | | | 1,421,858 | | |
Anixter, Inc.
05/01/19 | | | 5.625 | % | | | 650,000 | | | | 682,500 | | |
Brocade Communications Systems, Inc.
Senior Secured
01/15/20 | | | 6.875 | % | | | 1,817,000 | | | | 1,966,903 | | |
CDW LLC/Finance Corp.(c)
04/01/19 | | | 8.500 | % | | | 4,474,000 | | | | 4,764,810 | | |
Senior Secured
12/15/18 | | | 8.000 | % | | | 2,247,000 | | | | 2,454,847 | | |
Cardtronics, Inc.(c)
09/01/18 | | | 8.250 | % | | | 2,916,000 | | | | 3,265,920 | | |
Equinix, Inc.
Senior Unsecured(c)
07/15/21 | | | 7.000 | % | | | 1,055,000 | | | | 1,171,050 | | |
Corporate Bonds & Notes(a) (continued)
Issuer | | Coupon
Rate | | Principal
Amount ($) | | Value ($) | |
First Data Corp.(b)
Secured
01/15/21 | | | 8.250 | % | | | 911,000 | | | | 911,000 | | |
Senior Secured
08/15/20 | | | 8.875 | % | | | 3,745,000 | | | | 4,082,050 | | |
11/01/20 | | | 6.750 | % | | | 2,287,000 | | | | 2,292,717 | | |
First Data Corp.(b)(c)
Senior Secured
06/15/19 | | | 7.375 | % | | | 2,674,000 | | | | 2,747,535 | | |
First Data Corp.(c)
01/15/21 | | | 12.625 | % | | | 3,469,000 | | | | 3,581,742 | | |
Freescale Semiconductor, Inc.
Senior Secured(b)
04/15/18 | | | 9.250 | % | | | 2,678,000 | | | | 2,865,460 | | |
Interactive Data Corp.
08/01/18 | | | 10.250 | % | | | 4,310,000 | | | | 4,827,200 | | |
Lender Processing Services, Inc.
04/15/23 | | | 5.750 | % | | | 1,710,000 | | | | 1,808,325 | | |
NXP BV/Funding LLC
Senior Secured(b)(c)
08/01/18 | | | 9.750 | % | | | 1,825,000 | | | | 2,089,625 | | |
Nuance Communications, Inc.(b)
08/15/20 | | | 5.375 | % | | | 4,623,000 | | | | 4,715,460 | | |
TransUnion Holding Co., Inc.
Senior Unsecured PIK(b)(h)
06/15/18 | | | 8.125 | % | | | 1,067,000 | | | | 1,072,335 | | |
Total | | | | | | | 52,816,450 | | |
Transportation Services 0.3% | |
Avis Budget Car Rental LLC/Finance, Inc.(c)
01/15/19 | | | 8.250 | % | | | 1,775,000 | | | | 1,936,969 | | |
03/15/20 | | | 9.750 | % | | | 1,330,000 | | | | 1,514,537 | | |
ERAC U.S.A. Finance LLC(b)
10/01/20 | | | 5.250 | % | | | 1,150,000 | | | | 1,318,175 | | |
03/15/42 | | | 5.625 | % | | | 415,000 | | | | 473,307 | | |
Hertz Corp. (The)
01/15/21 | | | 7.375 | % | | | 2,028,000 | | | | 2,182,635 | | |
Hertz Corp. (The)(b)
10/15/20 | | | 5.875 | % | | | 546,000 | | | | 551,460 | | |
10/15/22 | | | 6.250 | % | | | 1,508,000 | | | | 1,528,735 | | |
Total | | | | | | | 9,505,818 | | |
Wireless 1.7% | |
Cricket Communications, Inc.(c)
10/15/20 | | | 7.750 | % | | | 2,819,000 | | | | 2,907,094 | | |
Crown Castle International Corp.
Senior Unsecured(b)
01/15/23 | | | 5.250 | % | | | 3,663,000 | | | | 3,791,205 | | |
SBA Telecommunications, Inc.
08/15/19 | | | 8.250 | % | | | 2,834,000 | | | | 3,166,995 | | |
The accompanying Notes to Financial Statements are an integral part of this statement.
Annual Report 2012
18
Columbia Strategic Income Fund
Portfolio of Investments (continued)
October 31, 2012
Corporate Bonds & Notes(a) (continued)
Issuer | | Coupon
Rate | | Principal
Amount ($) | | Value ($) | |
SBA Telecommunications, Inc.(b)
07/15/20 | | | 5.750 | % | | | 4,485,000 | | | | 4,664,400 | | |
Sprint Capital Corp.
11/15/28 | | | 6.875 | % | | | 9,201,000 | | | | 9,408,022 | | |
Sprint Nextel Corp.(b)(c)
11/15/18 | | | 9.000 | % | | | 9,383,000 | | | | 11,588,005 | | |
03/01/20 | | | 7.000 | % | | | 1,261,000 | | | | 1,462,760 | | |
Sprint Nextel Corp.(c)
Senior Unsecured
08/15/20 | | | 7.000 | % | | | 290,000 | | | | 318,275 | | |
United States Cellular Corp.
Senior Unsecured
12/15/33 | | | 6.700 | % | | | 2,005,000 | | | | 2,101,601 | | |
VimpelCom Holdings BV(b)
03/01/22 | | | 7.504 | % | | | 1,000,000 | | | | 1,080,000 | | |
Wind Acquisition Finance SA(b)
Secured
07/15/17 | | | 11.750 | % | | | 2,175,000 | | | | 2,120,625 | | |
Senior Secured
02/15/18 | | | 7.250 | % | | | 3,836,000 | | | | 3,740,100 | | |
Total | | | | | | | 46,349,082 | | |
Wirelines 2.2% | |
AT&T, Inc.
Senior Unsecured
02/15/39 | | | 6.550 | % | | | 2,715,000 | | | | 3,743,741 | | |
09/01/40 | | | 5.350 | % | | | 2,905,000 | | | | 3,562,884 | | |
Embarq Corp.
Senior Unsecured
06/01/36 | | | 7.995 | % | | | 11,265,000 | | | | 12,159,982 | | |
Frontier Communications Corp.
Senior Unsecured
04/15/15 | | | 7.875 | % | | | 69,000 | | | | 77,108 | | |
04/15/20 | | | 8.500 | % | | | 3,550,000 | | | | 4,100,250 | | |
07/01/21 | | | 9.250 | % | | | 1,122,000 | | | | 1,326,765 | | |
Frontier Communications Corp.(c)
Senior Unsecured
04/15/17 | | | 8.250 | % | | | 260,000 | | | | 299,650 | | |
10/01/18 | | | 8.125 | % | | | 935,000 | | | | 1,058,888 | | |
04/15/22 | | | 8.750 | % | | | 953,000 | | | | 1,098,333 | | |
Integra Telecom Holdings, Inc.
Senior Secured(b)
04/15/16 | | | 10.750 | % | | | 647,000 | | | | 674,498 | | |
Level 3 Communications, Inc.(b)(c)
Senior Unsecured
06/01/19 | | | 8.875 | % | | | 756,000 | | | | 793,800 | | |
Level 3 Communications, Inc.(c)
Senior Unsecured
02/01/19 | | | 11.875 | % | | | 2,857,000 | | | | 3,249,837 | | |
Corporate Bonds & Notes(a) (continued)
Issuer | | Coupon
Rate | | Principal
Amount ($) | | Value ($) | |
Level 3 Financing, Inc.
07/01/19 | | | 8.125 | % | | | 1,656,000 | | | | 1,767,780 | | |
Level 3 Financing, Inc.(c)
02/01/18 | | | 10.000 | % | | | 1,620,000 | | | | 1,806,300 | | |
04/01/19 | | | 9.375 | % | | | 2,778,000 | | | | 3,097,470 | | |
07/15/20 | | | 8.625 | % | | | 1,005,000 | | | | 1,095,450 | | |
PAETEC Holding Corp.
Senior Secured
06/30/17 | | | 8.875 | % | | | 5,158,000 | | | | 5,557,745 | | |
PAETEC Holding Corp.(c)
12/01/18 | | | 9.875 | % | | | 3,015,000 | | | | 3,444,637 | | |
Qtel International Finance Ltd.(b)
06/10/19 | | | 7.875 | % | | | 600,000 | | | | 770,313 | | |
10/19/25 | | | 5.000 | % | | | 1,900,000 | | | | 2,155,361 | | |
Verizon New York, Inc.
Senior Unsecured(c)
04/01/32 | | | 7.375 | % | | | 1,775,000 | | | | 2,393,209 | | |
Windstream Corp.(c)
09/01/18 | | | 8.125 | % | | | 1,485,000 | | | | 1,607,512 | | |
03/15/19 | | | 7.000 | % | | | 395,000 | | | | 404,381 | | |
10/15/20 | | | 7.750 | % | | | 1,000,000 | | | | 1,077,500 | | |
Zayo Group LLC/Capital, Inc.(c)
07/01/20 | | | 10.125 | % | | | 1,927,000 | | | | 2,153,422 | | |
tw telecom Holdings, Inc.(b)
10/01/22 | | | 5.375 | % | | | 1,061,000 | | | | 1,090,178 | | |
Total | | | | | | | 60,566,994 | | |
Total Corporate Bonds & Notes
(Cost: $1,179,901,820) | | | | | | | 1,262,676,627 | | |
Residential Mortgage-Backed Securities — Agency 13.0%
Federal Home Loan Mortgage Corp.(d)(g)(j)(k)
CMO IO STRIPS Series 281 Class S1
10/15/42 | | | 5.773 | % | | | 18,000,000 | | | | 4,815,000 | | |
Federal Home Loan Mortgage Corp.(d)(j)(k)
CMO IO Series 2957 Class SW
04/15/35 | | | 5.786 | % | | | 10,870,225 | | | | 1,790,928 | | |
CMO IO Series 3122 Class IS
03/15/36 | | | 6.486 | % | | | 9,855,879 | | | | 1,447,971 | | |
CMO IO Series 3550 Class EI
07/15/39 | | | 6.186 | % | | | 12,255,092 | | | | 2,258,903 | | |
CMO IO Series 3761 Class KS
06/15/40 | | | 5.786 | % | | | 11,977,729 | | | | 1,799,674 | | |
CMO IO Series 3960 Class SL
11/15/41 | | | 6.286 | % | | | 14,203,277 | | | | 4,085,391 | | |
CMO IO Series 4073 Class AS
08/15/38 | | | 5.836 | % | | | 22,344,120 | | | | 4,839,017 | | |
CMO IO Series 4093 Class SD
01/15/38 | | | 6.486 | % | | | 30,315,214 | | | | 9,096,407 | | |
The accompanying Notes to Financial Statements are an integral part of this statement.
Annual Report 2012
19
Columbia Strategic Income Fund
Portfolio of Investments (continued)
October 31, 2012
Residential Mortgage-Backed Securities — Agency (continued)
Issuer | | Coupon
Rate | | Principal
Amount ($) | | Value ($) | |
Federal Home Loan Mortgage Corp.(j)
05/01/21-
06/01/36 | | | 5.000 | % | | | 4,136,940 | | | | 4,489,016 | | |
01/01/20 | | | 10.500 | % | | | 3,747 | | | | 3,766 | | |
Federal National Mortgage Association(d)(j)(k)
CMO IO Series 2006-5 Class N1
08/25/34 | | | 2.244 | % | | | 31,447,588 | | | | 1,660,942 | | |
CMO IO Series 2006-5 Class N2
02/25/35 | | | 2.198 | % | | | 44,662,373 | | | | 3,027,403 | | |
CMO IO Series 2007-39 Class AI
05/25/37 | | | 5.909 | % | | | 9,336,861 | | | | 1,768,782 | | |
CMO IO Series 2010-135 Class MS
12/25/40 | | | 5.739 | % | | | 6,705,761 | | | | 1,320,369 | | |
CMO IO Series 2012-74 Class AS
03/25/39 | | | 5.839 | % | | | 17,269,614 | | | | 3,463,031 | | |
CMO IO Series 2012-80 Class AS
02/25/39 | | | 5.839 | % | | | 17,837,158 | | | | 4,481,627 | | |
CMO IO Series 2012-87 SQ
08/25/42 | | | 6.089 | % | | | 11,348,834 | | | | 3,386,493 | | |
Federal National Mortgage Association(h)(j)
11/01/27 | | | 2.500 | % | | | 41,500,000 | | | | 43,432,344 | | |
11/01/27 | | | 3.000 | % | | | 44,000,000 | | | | 46,413,127 | | |
Federal National Mortgage Association(i)(j)
12/01/20-
07/01/39 | | | 4.500 | % | | | 30,867,399 | | | | 33,843,627 | | |
Federal National Mortgage Association(j)
06/01/27 | | | 3.000 | % | | | 28,500,000 | | | | 30,063,048 | | |
04/01/42-
06/01/42 | | | 3.500 | % | | | 54,731,232 | | | | 59,689,236 | | |
05/01/41-
06/01/42 | | | 4.000 | % | | | 28,286,700 | | | | 30,215,642 | | |
05/01/33-
06/01/34 | | | 5.000 | % | | | 5,615,110 | | | | 6,167,792 | | |
02/01/35-
11/01/36 | | | 5.500 | % | | | 2,890,157 | | | | 3,176,783 | | |
04/01/34-
02/01/37 | | | 6.000 | % | | | 4,121,693 | | | | 4,585,886 | | |
12/01/31-
11/01/36 | | | 6.500 | % | | | 7,632,503 | | | | 8,610,193 | | |
10/01/37-
07/01/38 | | | 7.000 | % | | | 591,013 | | | | 691,274 | | |
04/01/14 | | | 10.000 | % | | | 9,549 | | | | 9,666 | | |
Federal National Mortgage Association(j)(l)
07/01/40 | | | 4.500 | % | | | 12,640,204 | | | | 14,014,129 | | |
Government National Mortgage Association(d)(j)(k)
CMO IO Series 2010-108 Class PI
02/20/38 | | | 5.889 | % | | | 14,731,931 | | | | 1,994,728 | | |
CMO IO Series 2012-41 Class SA
03/20/42 | | | 6.389 | % | | | 22,550,466 | | | | 6,529,264 | | |
CMO IO Series 2012-48 Class SA
04/16/42 | | | 6.436 | % | | | 4,693,185 | | | | 993,725 | | |
Government National Mortgage Association(h)(j)
11/01/42 | | | 3.000 | % | | | 11,000,000 | | | | 11,696,953 | | |
Residential Mortgage-Backed Securities — Agency (continued)
Issuer | | Coupon
Rate | | Principal
Amount ($) | | Value ($) | |
Government National Mortgage Association(j)
08/15/13 | | | 11.750 | % | | | 678 | | | | 681 | | |
Government National Mortgage Association(j)(k)
CMO IO Series 2010-167 Class GI
02/20/38 | | | 4.000 | % | | | 8,185,111 | | | | 946,680 | | |
CMO IO Series 2012-94 Class BI
05/20/37 | | | 4.000 | % | | | 28,595,160 | | | | 5,583,248 | | |
Total Residential Mortgage-Backed
Securities — Agency
(Cost: $353,608,912) | | | | | | | 362,392,746 | | |
Residential Mortgage-Backed Securities — Non-Agency 3.5%
BCAP LLC Trust(b)(d)(j)
CMO Series 2010-RR7 Class 17A7
03/26/36 | | | 5.023 | % | | | 1,769,159 | | | | 1,469,065 | | |
BCAP LLC Trust(b)(j)
CMO Series 2010-RR7 Class 8A6
05/26/35 | | | 5.500 | % | | | 2,640,000 | | | | 2,611,776 | | |
Bayview Opportunity Master Fund Trust IIB LP(b)(d)(j)
Series 2012-4NPL Class A
07/28/32 | | | 3.475 | % | | | 7,249,209 | | | | 7,249,209 | | |
Series 2012-5NPL Class A
10/28/32 | | | 2.981 | % | | | 13,139,537 | | | | 13,139,537 | | |
Castle Peak Loan Trust(b)(j)
CMO Series 2011-1 Class 22A1
05/25/52 | | | 6.250 | % | | | 1,762,704 | | | | 1,759,619 | | |
CMO Series 2012-1A Class A1
05/25/52 | | | 5.000 | % | | | 12,184,706 | | | | 12,184,706 | | |
Citigroup Mortgage Loan Trust, Inc.(b)(d)(j)
CMO Series 2009-3 Class 4A3
10/25/33 | | | 2.513 | % | | | 6,105,977 | | | | 3,872,187 | | |
CMO Series 2009-4 Class 9A2
03/25/36 | | | 2.838 | % | | | 3,040,248 | | | | 2,420,086 | | |
CMO Series 2010-6 Class 2A2
09/25/35 | | | 2.654 | % | | | 1,143,314 | | | | 739,479 | | |
CMO Series 2010-6 Class 3A2
07/25/36 | | | 2.614 | % | | | 4,920,000 | | | | 4,329,874 | | |
CMO Series 2010-7 Class 3A4
12/25/35 | | | 6.870 | % | | | 2,185,000 | | | | 2,319,279 | | |
Credit Suisse Mortgage Capital Certificates(b)(d)(j)
CMO Series 2011-4R Class 4A7
08/27/37 | | | 4.000 | % | | | 8,522,738 | | | | 8,425,596 | | |
CMO Series 2011-7R Class A1
08/28/47 | | | 1.466 | % | | | 5,839,143 | | | | 5,777,347 | | |
Deutsche Mortgage Securities, Inc.
CMO Series 2003-1 Class 1A7(j)
04/25/33 | | | 5.500 | % | | | 2,984,188 | | | | 3,084,301 | | |
The accompanying Notes to Financial Statements are an integral part of this statement.
Annual Report 2012
20
Columbia Strategic Income Fund
Portfolio of Investments (continued)
October 31, 2012
Residential Mortgage-Backed Securities — Non-Agency (continued)
Issuer | | Coupon
Rate | | Principal
Amount ($) | | Value ($) | |
JPMorgan Resecuritization Trust
CMO Series 2010-5 Class 1A6(b)(d)(j)
04/26/37 | | | 4.500 | % | | | 1,312,000 | | | | 1,339,501 | | |
PennyMac Loan Trust(b)(d)(j)
Series 2011-NPL1 Class A
09/25/51 | | | 5.250 | % | | | 331,602 | | | | 331,440 | | |
Series 2012-NPL1 Class A
05/28/52 | | | 3.422 | % | | | 10,900,689 | | | | 10,900,689 | | |
RBSSP Resecuritization Trust
CMO Series 2010-12 Class 3A4(b)(d)(j)
06/27/32 | | | 4.000 | % | | | 1,968,820 | | | | 1,974,906 | | |
Residential Mortgage Asset Trust
Series 2012-1A Class A1(b)(d)(j)
08/26/52 | | | 2.734 | % | | | 10,133,723 | | | | 10,211,309 | | |
Wells Fargo Mortgage-Backed Securities Trust(j)
CMO Series 2005-14 Class 2A1
12/25/35 | | | 5.500 | % | | | 493,927 | | | | 504,077 | | |
CMO Series 2005-18 Class 2A6
01/25/36 | | | 5.500 | % | | | 1,493,056 | | | | 1,504,190 | | |
CMO Series 2005-9 Class 2A5
10/25/35 | | | 5.250 | % | | | 2,594,835 | | | | 2,612,262 | | |
Total Residential Mortgage-Backed
Securities — Non-Agency
(Cost: $99,629,280) | | | | | | | 98,760,435 | | |
Commercial Mortgage-Backed Securities — Non-Agency 3.1%
Bear Stearns Commercial Mortgage Securities(d)(j)
Series 2005-T18 Class A4
02/13/42 | | | 4.933 | % | | | 1,705,000 | | | | 1,852,397 | | |
Bear Stearns Commercial Mortgage Securities(j)
Series 2006-PW14 Class A4
12/11/38 | | | 5.201 | % | | | 5,000,000 | | | | 5,762,585 | | |
CFCRE Commercial Mortgage Trust
Series 2011-C2 Class A2(j)
12/15/47 | | | 3.061 | % | | | 4,650,000 | | | | 4,974,059 | | |
Commercial Mortgage Pass-Through Certificates
Series 2011-THL Class A(b)(j)
06/09/28 | | | 3.376 | % | | | 3,876,194 | | | | 3,936,372 | | |
Credit Suisse First Boston Mortgage Securities Corp.
Series 2004-C2 Class A1(j)
05/15/36 | | | 3.819 | % | | | 433,200 | | | | 442,255 | | |
GS Mortgage Securities Corp. II(c)(j)
Series 2005-GG4 Class A4A
07/10/39 | | | 4.751 | % | | | 4,825,000 | | | | 5,240,462 | | |
GS Mortgage Securities Corp. II(d)(j)
Series 2006-GG6 Class A4
04/10/38 | | | 5.553 | % | | | 4,898,000 | | | | 5,542,263 | | |
Commercial Mortgage-Backed Securities — Non-Agency (continued)
Issuer | | Coupon
Rate | | Principal
Amount ($) | | Value ($) | |
Greenwich Capital Commercial Funding Corp.(c)(j)
Series 2007-GG9 Class A4
03/10/39 | | | 5.444 | % | | | 10,780,000 | | | | 12,417,935 | | |
Greenwich Capital Commercial Funding Corp.(d)(j)
Series 2004-GG1 Class A7
06/10/36 | | | 5.317 | % | | | 1,390,515 | | | | 1,461,919 | | |
Greenwich Capital Commercial Funding Corp.(j)
Series 2003-C2 Class A3
01/05/36 | | | 4.533 | % | | | 57,151 | | | | 57,119 | | |
JPMorgan Chase Commercial Mortgage Securities Corp.(d)(j)
Series 2005-LDP4 Class AM
10/15/42 | | | 4.999 | % | | | 1,000,000 | | | | 1,088,382 | | |
JPMorgan Chase Commercial Mortgage Securities Corp.(j)
Series 2007-CB18 Class A4
06/12/47 | | | 5.440 | % | | | 4,000,000 | | | | 4,636,684 | | |
Series 2011-C5 Class A2
08/15/46 | | | 3.149 | % | | | 3,140,000 | | | | 3,372,622 | | |
Series 2012-C6 Class A3
05/15/45 | | | 3.507 | % | | | 4,000,000 | | | | 4,330,609 | | |
Morgan Stanley Capital I, Inc.
Series 2005-HQ6 Class A4A(j)
08/13/42 | | | 4.989 | % | | | 4,825,000 | | | | 5,307,920 | | |
Morgan Stanley Reremic Trust(b)(c)(d)(j)
Series 2010-GG10 Class A4A
08/15/45 | | | 5.789 | % | | | 9,600,000 | | | | 11,303,846 | | |
Morgan Stanley Reremic Trust(b)(d)(j)
Series 2009-GG10 Class A4B
08/12/45 | | | 5.789 | % | | | 5,800,000 | | | | 6,386,571 | | |
S2 Hospitality LLC
Series 2012-LV1 Class A(b)(j)
04/15/25 | | | 4.500 | % | | | 3,332,128 | | | | 3,347,509 | | |
TIAA Seasoned Commercial Mortgage Trust
Series 2007-C4 Class A3(d)(j)
08/15/39 | | | 5.585 | % | | | 50,000 | | | | 52,876 | | |
Wachovia Bank Commercial Mortgage Trust
Series 2005-C21 Class A4(c)(d)(j)
10/15/44 | | | 5.240 | % | | | 4,295,004 | | | | 4,779,786 | | |
Total Commercial Mortgage-Backed
Securities — Non-Agency
(Cost: $78,709,912) | | | | | | | 86,294,171 | | |
Asset-Backed Securities — Non-Agency 0.1%
GMAC Mortgage Corp Loan Trust
Series 2004-HE5 Class A5 (FGIC)(d)
09/25/34 | | | 5.865 | % | | | 1,922,555 | | | | 1,456,476 | | |
Total Asset-Backed Securities — Non-Agency
(Cost: $1,922,556) | | | | | | | 1,456,476 | | |
The accompanying Notes to Financial Statements are an integral part of this statement.
Annual Report 2012
21
Columbia Strategic Income Fund
Portfolio of Investments (continued)
October 31, 2012
Inflation-Indexed Bonds(a) 1.0%
Issuer | | Coupon
Rate | | Principal
Amount ($) | | Value ($) | |
Uruguay 1.0% | |
Uruguay Government International Bond
04/05/27 | | | 4.250 | % | | UYU | 233,629,415 | | | | 13,755,400 | | |
Senior Unsecured
12/15/28 | | | 4.375 | % | | UYU | 217,899,494 | | | | 13,050,274 | | |
Total | | | | | | | 26,805,674 | | |
Total Inflation-Indexed Bonds
(Cost: $23,891,812) | | | | | | | 26,805,674 | | |
U.S. Treasury Obligations 6.0%
U.S. Treasury
02/15/42 | | | 3.125 | % | | | 70,000 | | | | 74,200 | | |
08/15/42 | | | 2.750 | % | | | 31,750,000 | | | | 31,105,094 | | |
U.S. Treasury(c)
12/31/13 | | | 0.125 | % | | | 57,645,000 | | | | 57,572,944 | | |
07/31/16 | | | 1.500 | % | | | 14,000,000 | | | | 14,515,158 | | |
02/15/22 | | | 2.000 | % | | | 9,655,000 | | | | 9,998,206 | | |
08/15/22 | | | 1.625 | % | | | 1,215,000 | | | | 1,208,355 | | |
11/15/41 | | | 3.125 | % | | | 41,470,000 | | | | 44,010,037 | | |
05/15/42 | | | 3.000 | % | | | 2,190,000 | | | | 2,262,202 | | |
U.S. Treasury(c)(m)
STRIPS
11/15/13 | | | 0.000 | % | | | 2,250,000 | | | | 2,244,623 | | |
U.S. Treasury(m)
STRIPS
05/15/23 | �� | | 0.000 | % | | | 4,550,000 | | | | 3,708,259 | | |
Total U.S. Treasury Obligations
(Cost: $161,817,317) | | | | | | | 166,699,078 | | |
Foreign Government Obligations(a) 21.8%
Argentina 0.4% | |
Argentina Boden Bonds
Senior Unsecured
10/03/15 | | | 7.000 | % | | | 2,275,000 | | | | 1,888,250 | | |
Argentina Bonar Bonds
Senior Unsecured(c)
04/17/17 | | | 7.000 | % | | | 2,879,000 | | | | 2,130,460 | | |
Argentina Republic Government International Bond
Senior Unsecured
12/31/33 | | | 8.280 | % | | | 3,916,594 | | | | 2,682,867 | | |
Provincia de Buenos Aires
Senior Unsecured(b)(c)
01/26/21 | | | 10.875 | % | | | 2,490,000 | | | | 1,556,250 | | |
Provincia de Cordoba
Senior Unsecured(b)
08/17/17 | | | 12.375 | % | | | 2,570,000 | | | | 1,914,650 | | |
Total | | | | | | | 10,172,477 | | |
Foreign Government Obligations(a) (continued)
Issuer | | Coupon
Rate | | Principal
Amount ($) | | Value ($) | |
Australia 0.5% | |
Treasury Corp. of Victoria
Local Government Guaranteed
11/15/16 | | | 5.750 | % | | AUD | 4,600,000 | | | | 5,242,146 | | |
06/15/20 | | | 6.000 | % | | AUD | 7,100,000 | | | | 8,554,102 | | |
Total | | | | | | | 13,796,248 | | |
Brazil 1.4% | |
Brazil Notas do Tesouro Nacional
01/01/17 | | | 10.000 | % | | BRL | 4,639,000 | | | | 2,476,400 | | |
Brazilian Government International Bond
01/20/34 | | | 8.250 | % | | | 6,260,000 | | | | 10,266,400 | | |
08/17/40 | | | 11.000 | % | | | 2,700,000 | | | | 3,422,250 | | |
Senior Unsecured
01/05/24 | | | 8.500 | % | | BRL | 6,700,000 | | | | 3,859,580 | | |
Morgan Stanley
Senior Unsecured
10/22/20 | | | 11.500 | % | | BRL | 6,285,000 | | | | 3,610,839 | | |
Morgan Stanley(b)
Senior Unsecured
05/03/17 | | | 10.090 | % | | BRL | 400,000 | | | | 214,175 | | |
Petrobras International Finance Co.
03/15/19 | | | 7.875 | % | | | 8,580,000 | | | | 10,862,537 | | |
01/27/21 | | | 5.375 | % | | | 1,400,000 | | | | 1,583,153 | | |
01/20/40 | | | 6.875 | % | | | 1,400,000 | | | | 1,809,430 | | |
Total | | | | | | | 38,104,764 | | |
Canada 0.8% | |
Canadian Government Bond
08/01/15 | | | 1.500 | % | | CAD | 800,000 | | | | 808,186 | | |
06/01/19 | | | 3.750 | % | | CAD | 14,000,000 | | | | 15,969,462 | | |
06/01/23 | | | 8.000 | % | | CAD | 3,100,000 | | | | 4,926,726 | | |
Total | | | | | | | 21,704,374 | | |
Chile —% | |
Empresa Nacional del Petroleo
Senior Unsecured(b)(c)
07/08/19 | | | 6.250 | % | | | 600,000 | | | | 691,715 | | |
Colombia 1.0% | |
Bogota Distrito Capital
Senior Unsecured(b)
07/26/28 | | | 9.750 | % | | COP | 200,000,000 | | | | 163,231 | | |
Colombia Government International Bond
Senior Unsecured
06/28/27 | | | 9.850 | % | | COP | 300,000,000 | | | | 255,082 | | |
Colombia Government International Bond(c)
Senior Unsecured
05/21/24 | | | 8.125 | % | | | 790,000 | | | | 1,183,025 | | |
01/18/41 | | | 6.125 | % | | | 4,200,000 | | | | 5,742,180 | | |
The accompanying Notes to Financial Statements are an integral part of this statement.
Annual Report 2012
22
Columbia Strategic Income Fund
Portfolio of Investments (continued)
October 31, 2012
Foreign Government Obligations(a) (continued)
Issuer | | Coupon
Rate | | Principal
Amount ($) | | Value ($) | |
Corp. Andina De Fomento
06/15/22 | | | 4.375 | % | | | 1,150,000 | | | | 1,250,483 | | |
Ecopetrol SA
Senior Unsecured
07/23/19 | | | 7.625 | % | | | 3,855,000 | | | | 4,992,225 | | |
Empresa de Energia de Bogota SA
Senior Unsecured(b)(c)
11/10/21 | | | 6.125 | % | | | 2,725,000 | | | | 3,081,785 | | |
Empresas Publicas de Medellin ESP(b)
Senior Unsecured
02/01/21 | | | 8.375 | % | | COP | 11,190,000,000 | | | | 6,899,960 | | |
Empresas Publicas de Medellin ESP(b)(c)
Senior Unsecured
07/29/19 | | | 7.625 | % | | | 100,000 | | | | 127,669 | | |
Transportadora de Gas Internacional SA ESP
Senior Unsecured(b)(c)
03/20/22 | | | 5.700 | % | | | 2,800,000 | | | | 3,133,091 | | |
Total | | | | | | | 26,828,731 | | |
Dominican Republic 0.3% | |
Dominican Republic International Bond(b)
Senior Unsecured
05/06/21 | | | 7.500 | % | | | 4,325,000 | | | | 5,065,608 | | |
04/20/27 | | | 8.625 | % | | | 2,900,000 | | | | 3,480,000 | | |
Total | | | | | | | 8,545,608 | | |
El Salvador 0.1% | |
El Salvador Government International Bond(b)
Senior Unsecured
04/10/32 | | | 8.250 | % | | | 400,000 | | | | 490,000 | | |
06/15/35 | | | 7.650 | % | | | 490,000 | | | | 569,625 | | |
02/01/41 | | | 7.625 | % | | | 1,500,000 | | | | 1,736,250 | | |
Total | | | | | | | 2,795,875 | | |
Finland 0.1% | |
Finland Government Bond
Senior Unsecured
07/04/15 | | | 4.250 | % | | EUR | 2,720,000 | | | | 3,903,770 | | |
France 1.4% | |
France Government Bond OAT
04/25/13 | | | 4.000 | % | | EUR | 5,300,000 | | | | 6,997,037 | | |
04/25/17 | | | 3.750 | % | | EUR | 4,000,000 | | | | 5,845,634 | | |
10/25/18 | | | 4.250 | % | | EUR | 2,600,000 | | | | 3,942,212 | | |
04/25/22 | | | 3.000 | % | | EUR | 5,000,000 | | | | 6,951,638 | | |
04/25/29 | | | 5.500 | % | | EUR | 5,920,000 | | | | 10,339,643 | | |
French Treasury Note
07/12/15 | | | 2.000 | % | | EUR | 2,770,000 | | | | 3,751,360 | | |
Total | | | | | | | 37,827,524 | | |
Foreign Government Obligations(a) (continued)
Issuer | | Coupon
Rate | | Principal
Amount ($) | | Value ($) | |
Georgia —% | |
Georgian Railway JSC
Senior Unsecured(b)
07/11/22 | | | 7.750 | % | | | 1,039,000 | | | | 1,176,179 | | |
Germany 1.1% | |
Bundesrepublik Deutschland
06/20/16 | | | 6.000 | % | | EUR | 12,600,000 | | | | 19,704,097 | | |
07/04/17 | | | 4.250 | % | | EUR | 1,850,000 | | | | 2,820,862 | | |
01/04/18 | | | 4.000 | % | | EUR | 1,180,000 | | | | 1,797,952 | | |
01/04/19 | | | 3.750 | % | | EUR | 3,500,000 | | | | 5,348,334 | | |
07/04/21 | | | 3.250 | % | | EUR | 980,000 | | | | 1,477,769 | | |
07/04/34 | | | 4.750 | % | | EUR | 55,000 | | | | 102,184 | | |
KFW
01/20/14 | | | 1.350 | % | | JPY | 63,000,000 | | | | 800,966 | | |
Total | | | | | | | 32,052,164 | | |
Indonesia 1.4% | |
Indonesia Government International Bond(b)
Senior Unsecured
05/04/14 | | | 10.375 | % | | | 6,180,000 | | | | 6,983,400 | | |
04/20/15 | | | 7.250 | % | | | 1,300,000 | | | | 1,469,000 | | |
Indonesia Government International Bond(b)(c)
Senior Unsecured
03/13/20 | | | 5.875 | % | | | 11,125,000 | | | | 13,294,375 | | |
Indonesia Treasury Bond
Senior Unsecured
07/15/17 | | | 10.000 | % | | IDR | 15,043,000,000 | | | | 1,858,706 | | |
09/15/19 | | | 11.500 | % | | IDR | 22,600,000,000 | | | | 3,140,061 | | |
11/15/20 | | | 11.000 | % | | IDR | 2,000,000,000 | | | | 278,805 | | |
06/15/21 | | | 12.800 | % | | IDR | 17,200,000,000 | | | | 2,649,056 | | |
09/15/25 | | | 11.000 | % | | IDR | 16,500,000,000 | | | | 2,452,555 | | |
Majapahit Holding BV(b)
06/28/17 | | | 7.250 | % | | | 562,000 | | | | 673,818 | | |
01/20/20 | | | 7.750 | % | | | 1,100,000 | | | | 1,394,840 | | |
06/29/37 | | | 7.875 | % | | | 2,780,000 | | | | 3,808,600 | | |
PT Perusahaan Listrik Negara
Senior Unsecured(b)(c)
11/22/21 | | | 5.500 | % | | | 500,000 | | | | 564,153 | | |
Perusahaan Penerbit SBSN
Senior Unsecured(b)
04/23/14 | | | 8.800 | % | | | 700,000 | | | | 771,334 | | |
Total | | | | | | | 39,338,703 | | |
Japan 0.5% | |
Japan Government 10-Year Bond
Senior Unsecured
09/20/18 | | | 1.500 | % | | JPY | 330,000,000 | | | | 4,428,275 | | |
Japan Government 20-Year Bond
Senior Unsecured
09/20/26 | | | 2.200 | % | | JPY | 710,000,000 | | | | 10,022,962 | | |
Total | | | | | | | 14,451,237 | | |
The accompanying Notes to Financial Statements are an integral part of this statement.
Annual Report 2012
23
Columbia Strategic Income Fund
Portfolio of Investments (continued)
October 31, 2012
Foreign Government Obligations(a) (continued)
Issuer | | Coupon
Rate | | Principal
Amount ($) | | Value ($) | |
Kazakhstan 0.3% | |
KazMunayGas National Co.(b)
05/05/20 | | | 7.000 | % | | | 400,000 | | | | 492,097 | | |
Senior Unsecured
07/02/18 | | | 9.125 | % | | | 3,980,000 | | | | 5,187,532 | | |
04/09/21 | | | 6.375 | % | | | 2,500,000 | | | | 2,956,250 | | |
Total | | | | | | | 8,635,879 | | |
Latvia 0.1% | |
Republic of Latvia
Senior Unsecured(b)(c)
06/16/21 | | | 5.250 | % | | | 1,250,000 | | | | 1,428,963 | | |
Lithuania 0.3% | |
Lithuania Government International Bond(b)
Senior Unsecured
09/14/17 | | | 5.125 | % | | | 2,150,000 | | | | 2,419,997 | | |
03/09/21 | | | 6.125 | % | | | 1,550,000 | | | | 1,861,867 | | |
02/01/22 | | | 6.625 | % | | | 2,550,000 | | | | 3,158,878 | | |
Total | | | | | | | 7,440,742 | | |
Mexico 1.9% | |
Mexican Bonos
12/20/12 | | | 9.000 | % | | MXN | 5,300,000 | | | | 4,070,322 | | |
12/17/15 | | | 8.000 | % | | MXN | 1,485,000 | | | | 1,229,302 | | |
06/16/16 | | | 6.250 | % | | MXN | 4,100,000 | | | | 3,248,394 | | |
12/15/16 | | | 7.250 | % | | MXN | 659,000 | | | | 542,898 | | |
12/14/17 | | | 7.750 | % | | MXN | 950,000 | | | | 809,213 | | |
12/13/18 | | | 8.500 | % | | MXN | 7,086,000 | | | | 6,297,990 | | |
06/09/22 | | | 6.500 | % | | MXN | 7,200,000 | | | | 5,996,884 | | |
06/03/27 | | | 7.500 | % | | MXN | 6,769,000 | | | | 5,915,570 | | |
Mexico Government International Bond
Senior Unsecured(c)
01/11/40 | | | 6.050 | % | | | 2,350,000 | | | | 3,119,625 | | |
Pemex Finance Ltd.
Senior Unsecured (NPFGC)
08/15/17 | | | 10.610 | % | | | 1,650,000 | | | | 1,990,390 | | |
Pemex Finance Ltd.(c)
Senior Unsecured
11/15/18 | | | 9.150 | % | | | 2,485,000 | | | | 3,087,936 | | |
Pemex Project Funding Master Trust
03/01/18 | | | 5.750 | % | | | 4,870,000 | | | | 5,673,550 | | |
01/21/21 | | | 5.500 | % | | | 3,750,000 | | | | 4,378,125 | | |
06/15/35 | | | 6.625 | % | | | 870,000 | | | | 1,085,325 | | |
Pemex Project Funding Master Trust(c)
06/15/38 | | | 6.625 | % | | | 450,000 | | | | 562,500 | | |
Petroleos Mexicanos
05/03/19 | | | 8.000 | % | | | 600,000 | | | | 786,000 | | |
11/24/21 | | | 7.650 | % | | MXN | 1,920,000 | | | | 1,599,316 | | |
06/02/41 | | | 6.500 | % | | | 2,500,000 | | | | 3,103,125 | | |
Total | | | | | | | 53,496,465 | | |
Foreign Government Obligations(a) (continued)
Issuer | | Coupon
Rate | | Principal
Amount ($) | | Value ($) | |
Netherlands 0.3% | |
Netherlands Government Bond(b)
07/15/16 | | | 4.000 | % | | EUR | 5,135,000 | | | | 7,514,316 | | |
New Zealand 0.2% | |
New Zealand Government Bond
Senior Unsecured
05/15/21 | | | 6.000 | % | | NZD | 6,150,000 | | | | 6,060,614 | | |
Norway 0.7% | |
Norway Government Bond
05/15/13 | | | 6.500 | % | | NOK | 6,655,000 | | | | 1,195,922 | | |
05/19/17 | | | 4.250 | % | | NOK | 87,185,000 | | | | 17,087,116 | | |
05/22/19 | | | 4.500 | % | | NOK | 12,000,000 | | | | 2,463,649 | | |
Total | | | | | | | 20,746,687 | | |
Peru 0.5% | |
Corporacion Financiera de Desarrollo SA
Senior Unsecured(b)
02/08/22 | | | 4.750 | % | | | 2,900,000 | | | | 3,272,119 | | |
Peru Enhanced Pass-Through Finance Ltd.
Pass-Thru Certificates(b)(m)
05/31/18 | | | 0.000 | % | | | 2,231,522 | | | | 2,008,370 | | |
Peruvian Government International Bond
Senior Unsecured
11/21/33 | | | 8.750 | % | | | 4,508,000 | | | | 7,889,000 | | |
Peruvian Government International Bond(b)
Senior Unsecured
08/12/20 | | | 7.840 | % | | PEN | 3,100,000 | | | | 1,480,320 | | |
Total | | | | | | | 14,649,809 | | |
Philippines 0.4% | |
Philippine Government International Bond
Senior Unsecured
01/15/19 | | | 9.875 | % | | | 70,000 | | | | 101,500 | | |
01/15/21 | | | 4.950 | % | | PHP | 34,000,000 | | | | 904,467 | | |
03/30/26 | | | 5.500 | % | | | 3,825,000 | | | | 4,838,625 | | |
01/14/31 | | | 7.750 | % | | | 200,000 | | | | 309,000 | | |
01/14/36 | | | 6.250 | % | | PHP | 112,000,000 | | | | 3,179,609 | | |
Power Sector Assets & Liabilities Management Corp.
Government Guaranteed(b)
12/02/24 | | | 7.390 | % | | | 1,390,000 | | | | 1,927,193 | | |
Total | | | | | | | 11,260,394 | | |
Poland 0.9% | |
Poland Government Bond
10/24/15 | | | 6.250 | % | | PLN | 24,300,000 | | | | 8,098,351 | | |
10/25/17 | | | 5.250 | % | | PLN | 3,655,000 | | | | 1,202,172 | | |
10/25/19 | | | 5.500 | % | | PLN | 32,000,000 | | | | 10,759,714 | | |
Poland Government International Bond
Senior Unsecured
07/15/19 | | | 6.375 | % | | | 1,470,000 | | | | 1,830,150 | | |
The accompanying Notes to Financial Statements are an integral part of this statement.
Annual Report 2012
24
Columbia Strategic Income Fund
Portfolio of Investments (continued)
October 31, 2012
Foreign Government Obligations(a) (continued)
Issuer | | Coupon
Rate | | Principal
Amount ($) | | Value ($) | |
Poland Government International Bond(c)
Senior Unsecured
04/21/21 | | | 5.125 | % | | | 1,000,000 | | | | 1,170,900 | | |
03/23/22 | | | 5.000 | % | | | 2,950,000 | | | | 3,437,310 | | |
Total | | | | | | | 26,498,597 | | |
Qatar 0.1% | |
Nakilat, Inc.
Senior Secured(b)
12/31/33 | | | 6.067 | % | | | 3,260,000 | | | | 4,009,800 | | |
Republic of Namibia 0.1% | |
Namibia International Bonds
Senior Unsecured(b)
11/03/21 | | | 5.500 | % | | | 1,700,000 | | | | 1,904,000 | | |
Republic of the Congo —% | |
Republic of Congo
Senior Unsecured(d)
06/30/29 | | | 3.000 | % | | | 475,000 | | | | 396,625 | | |
Romania 0.1% | |
Romanian Government International Bond
Senior Unsecured(b)(c)
02/07/22 | | | 6.750 | % | | | 2,300,000 | | | | 2,652,079 | | |
Russian Federation 2.0% | |
Gazprom Neft OAO Via GPN Capital SA
Senior Unsecured(b)(c)
09/19/22 | | | 4.375 | % | | | 1,000,000 | | | | 1,015,133 | | |
Gazprom OAO Via Gaz Capital SA(b)
Senior Unsecured
11/22/16 | | | 6.212 | % | | | 400,000 | | | | 443,520 | | |
04/11/18 | | | 8.146 | % | | | 4,535,000 | | | | 5,555,965 | | |
Gazprom OAO Via Gaz Capital SA(b)(c)
Senior Unsecured
01/23/21 | | | 5.999 | % | | | 4,000,000 | | | | 4,516,000 | | |
03/07/22 | | | 6.510 | % | | | 4,535,000 | | | | 5,339,962 | | |
08/16/37 | | | 7.288 | % | | | 300,000 | | | | 388,500 | | |
RZD Capital Ltd.
Senior Unsecured
04/02/19 | | | 8.300 | % | | RUB | 120,000,000 | | | | 3,892,812 | | |
Russian Agricultural Bank OJSC Via RSHB Capital SA
Senior Unsecured(b)
12/27/17 | | | 5.298 | % | | | 1,700,000 | | | | 1,821,517 | | |
Russian Foreign Bond - Eurobond
Senior Unsecured
03/31/30 | | | 7.500 | % | | | 14,887,750 | | | | 18,852,358 | | |
Russian Foreign Bond - Eurobond(b)
Senior Unsecured
03/31/30 | | | 7.500 | % | | | 1,460,875 | | | | 1,849,906 | | |
Foreign Government Obligations(a) (continued)
Issuer | | Coupon
Rate | | Principal
Amount ($) | | Value ($) | |
Sberbank of Russia Via SB Capital SA
Senior Unsecured(b)
02/07/22 | | | 6.125 | % | | | 4,200,000 | | | | 4,708,008 | | |
VTB Bank OJSC Via VTB Capital SA
Senior Unsecured(b)
04/12/17 | | | 6.000 | % | | | 1,400,000 | | | | 1,461,250 | | |
Vnesheconombank Via VEB Finance PLC
Senior Unsecured(b)(c)
11/22/25 | | | 6.800 | % | | | 5,810,000 | | | | 6,957,475 | | |
Total | | | | | | | 56,802,406 | | |
South Africa 0.1% | |
South Africa Government International Bond
Senior Unsecured(c)
01/17/24 | | | 4.665 | % | | | 1,800,000 | | | | 1,989,000 | | |
Transnet SOC Ltd.
Senior Unsecured(b)(c)
07/26/22 | | | 4.000 | % | | | 1,100,000 | | | | 1,105,826 | | |
Total | | | | | | | 3,094,826 | | |
South Korea 0.2% | |
Export-Import Bank of Korea
Senior Unsecured
04/11/22 | | | 5.000 | % | | | 3,900,000 | | | | 4,594,173 | | |
Sweden 0.7% | |
Sweden Government Bond
12/01/20 | | | 5.000 | % | | SEK | 11,000,000 | | | | 2,114,161 | | |
Sweden Government Bond(c)
08/12/17 | | | 3.750 | % | | SEK | 108,600,000 | | | | 18,434,281 | | |
Total | | | | | | | 20,548,442 | | |
Trinidad and Tobago 0.2% | |
Petroleum Co. of Trinidad & Tobago Ltd.
Senior Unsecured(b)(c)
08/14/19 | | | 9.750 | % | | | 3,740,000 | | | | 4,946,018 | | |
Turkey 1.1% | |
Turkey Government International Bond
01/14/41 | | | 6.000 | % | | | 2,200,000 | | | | 2,585,000 | | |
Senior Unsecured
09/26/16 | | | 7.000 | % | | | 1,235,000 | | | | 1,435,688 | | |
11/07/19 | | | 7.500 | % | | | 1,300,000 | | | | 1,646,125 | | |
06/05/20 | | | 7.000 | % | | | 850,000 | | | | 1,061,225 | | |
03/30/21 | | | 5.625 | % | | | 7,250,000 | | | | 8,428,125 | | |
09/26/22 | | | 6.250 | % | | | 550,000 | | | | 666,325 | | |
02/05/25 | | | 7.375 | % | | | 8,680,000 | | | | 11,349,100 | | |
03/17/36 | | | 6.875 | % | | | 230,000 | | | | 295,964 | | |
05/30/40 | | | 6.750 | % | | | 1,500,000 | | | | 1,932,750 | | |
Total | | | | | | | 29,400,302 | | |
The accompanying Notes to Financial Statements are an integral part of this statement.
Annual Report 2012
25
Columbia Strategic Income Fund
Portfolio of Investments (continued)
October 31, 2012
Foreign Government Obligations(a) (continued)
Issuer | | Coupon
Rate | | Principal
Amount ($) | | Value ($) | |
Ukraine 0.1% | |
City of Kyiv Via Kyiv Finance PLC
Senior Unsecured(b)
07/11/16 | | | 9.375 | % | | | 1,300,000 | | | | 1,196,762 | | |
National JSC Naftogaz of Ukraine
Government Guaranteed
09/30/14 | | | 9.500 | % | | | 625,000 | | | | 637,547 | | |
Total | | | | | | | 1,834,309 | | |
United Arab Emirates 0.2% | |
Abu Dhabi National Energy Co.
Senior Unsecured(b)
12/13/21 | | | 5.875 | % | | | 1,300,000 | | | | 1,548,831 | | |
Dolphin Energy Ltd.
Senior Secured(b)
12/15/21 | | | 5.500 | % | | | 3,050,000 | | | | 3,513,063 | | |
Total | | | | | | | 5,061,894 | | |
United Kingdom 0.8% | |
United Kingdom Gilt
03/07/19 | | | 4.500 | % | | GBP | 800,000 | | | | 1,560,508 | | |
09/07/19 | | | 3.750 | % | | GBP | 3,200,000 | | | | 6,026,643 | | |
09/07/21 | | | 3.750 | % | | GBP | 2,100,000 | | | | 3,982,800 | | |
03/07/25 | | | 5.000 | % | | GBP | 4,810,000 | | | | 10,239,962 | | |
Total | | | | | | | 21,809,913 | | |
Uruguay 0.1% | |
Uruguay Government International Bond
Senior Unsecured
03/21/36 | | | 7.625 | % | | | 725,000 | | | | 1,125,563 | | |
Senior Unsecured PIK
01/15/33 | | | 7.875 | % | | | 1,940,000 | | | | 3,007,000 | | |
Total | | | | | | | 4,132,563 | | |
Venezuela 1.4% | |
Petroleos de Venezuela SA
04/12/17 | | | 5.250 | % | | | 11,540,000 | | | | 9,116,600 | | |
02/17/22 | | | 12.750 | % | | | 379,700 | | | | 390,142 | | |
Senior Unsecured
10/28/15 | | | 5.000 | % | | | 799,500 | | | | 699,563 | | |
Petroleos de Venezuela SA(c)
11/02/17 | | | 8.500 | % | | | 8,135,000 | | | | 7,301,162 | | |
Venezuela Government International Bond
Senior Unsecured
05/07/23 | | | 9.000 | % | | | 17,624,000 | | | | 15,465,060 | | |
Venezuela Government International Bond(c)
Senior Unsecured
02/26/16 | | | 5.750 | % | | | 2,050,000 | | | | 1,891,125 | | |
08/23/22 | | | 12.750 | % | | | 3,006,000 | | | | 3,223,935 | | |
Total | | | | | | | 38,087,587 | | |
Total Foreign Government Obligations
(Cost: $539,800,043) | | | | | | | 608,396,772 | | |
Municipal Bonds 0.1%
Issue
Description | | Coupon
Rate | | Principal
Amount ($) | | Value ($) | |
Cabazon Band Mission Indians
Revenue Bonds
Series 2004(b)(f)(n)(o)
10/01/11 | | | 13.000 | % | | | 2,820,000 | | | | 1,692,000 | | |
Total Municipal Bonds
(Cost: $2,820,000) | | | | | | | 1,692,000 | | |
Senior Loans 3.7%
Borrower | | Weighted
Average
Coupon | | Principal
Amount ($) | | Value ($) | |
Aerospace & Defense —% | |
Huntington Ingalls Industries, Inc.
Term Loan(d)(p)
03/30/16 | | | 2.750 | % | | | 185,000 | | | | 184,538 | | |
TransDigm, Inc.
Tranche B2 Term Loan(d)(p)
02/14/17 | | | 4.000 | % | | | 750,000 | | | | 752,677 | | |
Total | | | | | | | 937,215 | | |
Airlines 0.1% | |
Delta Air Lines, Inc.(d)(p)
Tranche B-1 Term Loan
09/28/18 | | | 5.250 | % | | | 375,000 | | | | 372,656 | | |
Tranche B-2 Term Loan
03/28/16 | | | 4.250 | % | | | 950,000 | | | | 943,170 | | |
U.S. Airways Group, Inc.
Term Loan(d)(p)
03/21/14 | | | 2.711 | % | | | 899,305 | | | | 877,722 | | |
United Air Lines, Inc.
Tranche B Term Loan(d)(p)
02/01/14 | | | 2.250 | % | | | 653,272 | | | | 644,564 | | |
Total | | | | | | | 2,838,112 | | |
Automotive 0.1% | |
Allison Transmission, Inc.
Tranche B1 Term Loan(d)(p)
08/07/14 | | | 2.720 | % | | | 293,239 | | | | 293,460 | | |
Chrysler Group LLC
Tranche B Term Loan(d)(p)
05/24/17 | | | 6.000 | % | | | 817,672 | | | | 834,590 | | |
Federal-Mogul Corp.(d)(p)
Tranche B Term Loan
12/29/14 | | | 2.148 | % | | | 427,558 | | | | 400,121 | | |
Tranche C Term Loan
12/28/15 | | | 2.148 | % | | | 218,142 | | | | 204,143 | | |
Goodyear Tire & Rubber Co. (The)
2nd Lien Term Loan(d)(p)
04/30/19 | | | 4.750 | % | | | 625,000 | | | | 628,594 | | |
The accompanying Notes to Financial Statements are an integral part of this statement.
Annual Report 2012
26
Columbia Strategic Income Fund
Portfolio of Investments (continued)
October 31, 2012
Senior Loans (continued)
Borrower | | Weighted
Average
Coupon | | Principal
Amount ($) | | Value ($) | |
Navistar, Inc.
Tranche B Term Loan(d)(p)
08/17/17 | | | 7.000 | % | | | 500,000 | | | | 501,250 | | |
Schaeffler AG
Tranche C2 Term Loan(d)(p)
01/27/17 | | | 6.000 | % | | | 675,000 | | | | 681,642 | | |
Total | | | | | | | 3,543,800 | | |
Brokerage —% | |
Nuveen Investments, Inc.(d)(p)
1st Lien Term Loan
05/13/17 | | | 7.250 | % | | | 250,000 | | | | 251,720 | | |
2nd Lien Term Loan
02/28/19 | | | 8.250 | % | | | 425,000 | | | | 431,375 | | |
Total | | | | | | | 683,095 | | |
Building Materials 0.1% | |
Custom Building Products, Inc.
Term Loan(d)(p)
03/19/15 | | | 5.750 | % | | | 69,153 | | | | 69,066 | | |
Goodman Global, Inc.(d)(p)
1st Lien Term Loan
10/28/16 | | | 5.750 | % | | | 93,083 | | | | 93,062 | | |
2nd Lien Term Loan
10/30/17 | | | 9.000 | % | | | 63,636 | | | | 64,336 | | |
Potters Holdings II LP(d)(p)
Tranche B 1st Lien Term Loan
05/06/17 | | | 6.000 | % | | | 493,750 | | | | 494,984 | | |
Tranche B 2nd Lien Term Loan
11/06/17 | | | 10.250 | % | | | 125,000 | | | | 125,729 | | |
Roofing Supply Group LLC(d)(p)
Term Loan
05/31/19 | | | 5.000 | % | | | 398,000 | | | | 398,995 | | |
05/31/19 | | | 5.000 | % | | | 200,000 | | | | 200,500 | | |
Wilsonart LLC
Tranche B Term Loan(d)(p)
10/31/19 | | | 5.500 | % | | | 575,000 | | | | 576,616 | | |
Total | | | | | | | 2,023,288 | | |
Chemicals 0.2% | |
AZ Chem U.S., Inc.
Term Loan(d)(p)
12/22/17 | | | 7.250 | % | | | 137,773 | | | | 139,323 | | |
Cristal Inorganic Chemicals U.S., Inc.
2nd Lien Term Loan(d)(p)
11/15/14 | | | 6.112 | % | | | 125,000 | | | | 124,635 | | |
Emerald Performance Materials LLC
1st Lien Term Loan(d)(p)
05/18/18 | | | 6.750 | % | | | 224,437 | | | | 226,121 | | |
Senior Loans (continued)
Borrower | | Weighted
Average
Coupon | | Principal
Amount ($) | | Value ($) | |
Houghton International, Inc.
Tranche B1 Term Loan(d)(p)
01/29/16 | | | 6.750 | % | | | 226,945 | | | | 228,364 | | |
Ineos U.S. Finance LLC
Term Loan(d)(p)
05/04/18 | | | 6.500 | % | | | 472,625 | | | | 478,826 | | |
Momentive Performance Materials
Tranche B3 Term Loan(d)(p)
05/05/15 | | | 3.750 | % | | | 174,125 | | | | 172,775 | | |
Momentive Specialty Chemicals, Inc.(d)(p)
Tranche C1B Term Loan
05/05/15 | | | 4.000 | % | | | 124,033 | | | | 123,103 | | |
Tranche C2B Term Loan
05/05/15 | | | 4.125 | % | | | 56,347 | | | | 55,925 | | |
Tranche C5B Term Loan
05/05/15 | | | 4.125 | % | | | 94,750 | | | | 91,907 | | |
Nexeo Solutions LLC
Term Loan(d)(p)
09/08/17 | | | 5.000 | % | | | 173,678 | | | | 170,421 | | |
Omnova Solutions, Inc.
Term Loan(d)(p)
05/31/17 | | | 5.500 | % | | | 640,226 | | | | 644,630 | | |
PQ Corp.
1st Lien Term Loan(d)(p)
07/30/14 | | | 3.962 | % | | | 636,207 | | | | 633,980 | | |
Trinseo Materials Operating SCA
Term Loan(d)(p)
08/02/17 | | | 8.000 | % | | | 689,516 | | | | 657,626 | | |
Tronox Pigments B.V.(d)(p)
Delayed Draw Term Loan
02/08/18 | | | 4.250 | % | | | 64,125 | | | | 64,455 | | |
Term Loan
02/08/18 | | | 4.250 | % | | | 235,125 | | | | 236,333 | | |
Univar, Inc.
Tranche B Term Loan(d)(p)
06/30/17 | | | 5.000 | % | | | 957,937 | | | | 946,509 | | |
Total | | | | | | | 4,994,933 | | |
Construction Machinery 0.1% | |
Douglas Dynamics LLC
Term Loan(d)(p)
04/18/18 | | | 5.750 | % | | | 656,560 | | | | 648,898 | | |
Manitowoc Co., Inc. (The)
Tranche B Term Loan(d)(p)
11/13/17 | | | 4.250 | % | | | 423,494 | | | | 426,670 | | |
Total | | | | | | | 1,075,568 | | |
The accompanying Notes to Financial Statements are an integral part of this statement.
Annual Report 2012
27
Columbia Strategic Income Fund
Portfolio of Investments (continued)
October 31, 2012
Senior Loans (continued)
Borrower | | Weighted
Average
Coupon | | Principal
Amount ($) | | Value ($) | |
Consumer Cyclical Services 0.1% | |
Acosta, Inc.
Tranche D Term Loan(d)(p)
03/02/18 | | | 5.000 | % | | | 611,572 | | | | 616,349 | | |
Insight Global
1st Lien Term Loan(d)(p)
10/31/19 | | | 6.000 | % | | | 550,000 | | | | 547,250 | | |
Live Nation Entertainment, Inc.
Tranche B Term Loan(d)(p)
11/07/16 | | | 4.500 | % | | | 514,451 | | | | 516,704 | | |
Sabre, Inc.
Term Loan(d)(p)
09/30/17 | | | 5.962 | % | | | 638,182 | | | | 635,788 | | |
West Corp.
Tranche B6 Term Loan(d)(p)
06/30/18 | | | 5.750 | % | | | 448,875 | | | | 455,047 | | |
Total | | | | | | | 2,771,138 | | |
Consumer Products 0.1% | |
Affinion Group, Inc.
Tranche B Term Loan(d)(p)
07/16/15 | | | 5.000 | % | | | 638,464 | | | | 600,558 | | |
Fender Musical Instruments Corp.(d)(p)
Delayed Draw Term Loan
06/09/14 | | | 2.470 | % | | | 152,717 | | | | 151,858 | | |
Term Loan
06/09/14 | | | 2.470 | % | | | 302,231 | | | | 300,533 | | |
Jarden Corp.
Tranche B Term Loan(d)(p)
03/31/18 | | | 3.212 | % | | | 320,869 | | | | 321,360 | | |
NBTY, Inc.
Tranche B1 Term Loan(d)(p)
10/01/17 | | | 4.250 | % | | | 796,821 | | | | 800,431 | | |
Serta Simmons Holdings LLC
Tranche B Term Loan(d)(p)
10/01/19 | | | 5.000 | % | | | 375,000 | | | | 374,599 | | |
Visant Corp.
Tranche B Term Loan(d)(p)
12/22/16 | | | 5.250 | % | | | 919,808 | | | | 879,180 | | |
Total | | | | | | | 3,428,519 | | |
Diversified Manufacturing 0.1% | |
Colfax Corp.
Tranche B Term Loan(d)(p)
01/11/19 | | | 4.500 | % | | | 272,937 | | | | 275,241 | | |
Generac Power System, Inc.
Term Loan(d)(p)
05/30/18 | | | 6.250 | % | | | 798,000 | | | | 813,960 | | |
Senior Loans (continued)
Borrower | | Weighted
Average
Coupon | | Principal
Amount ($) | | Value ($) | |
IMG Worldwide, Inc.
Tranche B Term Loan(d)(p)
06/16/16 | | | 5.500 | % | | | 740,625 | | | | 739,699 | | |
MRC Global, Inc.
Tranche B Term Loan(d)(h)(p)
11/08/19 | | | 6.250 | % | | | 325,000 | | | | 324,188 | | |
Rexnord LLC/RBS Global, Inc.
Tranche B Term Loan(d)(p)
04/01/18 | | | 4.500 | % | | | 700,000 | | | | 704,081 | | |
Tomkins LLC/Inc.
Tranche B1 Term Loan(d)(p)
09/29/16 | | | 4.250 | % | | | 728,491 | | | | 731,040 | | |
Total | | | | | | | 3,588,209 | | |
Electric 0.2% | |
Calpine Corp.(d)(p)
Term Loan
04/01/18 | | | 4.500 | % | | | 641,423 | | | | 642,289 | | |
04/01/18 | | | 4.500 | % | | | 246,875 | | | | 247,208 | | |
Equipower Resources Holdings LLC(d)(p)
Tranche B 1st Lien Term Loan
12/21/18 | | | 6.500 | % | | | 224,438 | | | | 225,373 | | |
Tranche B Term Loan
12/21/18 | | | 6.500 | % | | | 75,000 | | | | 75,313 | | |
Essential Power LLC
Term Loan(d)(p)
08/08/19 | | | 5.500 | % | | | 475,000 | | | | 475,000 | | |
FREIF North American Power I LLC(d)(p)
Tranche B Term Loan
03/29/19 | | | 6.000 | % | | | 214,948 | | | | 216,561 | | |
Tranche C Term Loan
03/29/19 | | | 6.000 | % | | | 33,951 | | | | 34,205 | | |
GenOn Energy/Americas, Inc.
Term Loan(d)(p)
12/04/17 | | | 6.500 | % | | | 916,369 | | | | 922,673 | | |
LSP Madison Funding LLC
Term Loan(d)(p)
06/28/19 | | | 5.500 | % | | | 249,375 | | | | 251,245 | | |
NRG Energy, Inc.
Term Loan(d)(p)
07/01/18 | | | 4.000 | % | | | 641,875 | | | | 645,219 | | |
TPF Generation Holdings LLC
1st Lien Synthetic Letter of Credit(d)(p)
12/15/13 | | | 2.362 | % | | | 84,723 | | | | 84,406 | | |
Texas Competitive Electric Holdings Co. LLC
Term Loan(d)(p)
10/10/14 | | | 3.749 | % | | | 1,345,944 | | | | 912,995 | | |
Total | | | | | | | 4,732,487 | | |
The accompanying Notes to Financial Statements are an integral part of this statement.
Annual Report 2012
28
Columbia Strategic Income Fund
Portfolio of Investments (continued)
October 31, 2012
Senior Loans (continued)
Borrower | | Weighted
Average
Coupon | | Principal
Amount ($) | | Value ($) | |
Entertainment 0.1% | |
24 Hour Fitness Worldwide, Inc.
Tranche B Term Loan(d)(p)
04/22/16 | | | 7.500 | % | | | 840,179 | | | | 844,119 | �� | |
Formula 1
Tranche B-2 Term Loan(d)(p)
04/27/19 | | | 6.000 | % | | | 995,000 | | | | 1,001,080 | | |
Six Flags Theme Parks, Inc.
Tranche B Term Loan(d)(p)
12/20/18 | | | 4.250 | % | | | 275,000 | | | | 276,425 | | |
Zuffa LLC
Term Loan(d)(p)
06/19/15 | | | 7.500 | % | | | 696,444 | | | | 698,401 | | |
Total | | | | | | | 2,820,025 | | |
Environmental 0.1% | |
ADS Waste Holdings, Inc.
Tranche B Term Loan(d)(p)
10/09/19 | | | 5.250 | % | | | 250,000 | | | | 252,250 | | |
EnviroSolutions Real Property Holdings, Inc.
2nd Lien Term Loan(d)(p)
07/29/14 | | | 8.000 | % | | | 1,386,588 | | | | 1,375,038 | | |
Synagro Technologies, Inc.
1st Lien Term Loan(d)(p)
04/02/14 | | | 2.400 | % | | | 174,862 | | | | 150,964 | | |
WCA Waste Corp.
Term Loan(d)(p)
03/23/18 | | | 5.500 | % | | | 199,000 | | | | 199,746 | | |
Total | | | | | | | 1,977,998 | | |
Food and Beverage 0.2% | |
AdvancePierre Foods, Inc.
1st Lien Term Loan(d)(p)
07/10/17 | | | 5.750 | % | | | 400,000 | | | | 402,400 | | |
Candy Intermediate Holdings, Inc.
Term Loan(d)(p)
06/18/18 | | | 7.509 | % | | | 1,250,865 | | | | 1,259,471 | | |
Del Monte Foods Co.
Term Loan(d)(p)
03/08/18 | | | 4.500 | % | | | 767,007 | | | | 765,811 | | |
Dole Food Co., Inc.
Tranche B2 Term Loan(d)(p)
07/08/18 | | | 5.036 | % | | | 303,397 | | | | 304,119 | | |
Earthbound Holdings III LLC
Term Loan(d)(p)
12/21/16 | | | 5.750 | % | | | 835,128 | | | | 836,172 | | |
JBS U.S.A. LLC
Term Loan(d)(p)
05/25/18 | | | 4.250 | % | | | 172,813 | | | | 171,948 | | |
Senior Loans (continued)
Borrower | | Weighted
Average
Coupon | | Principal
Amount ($) | | Value ($) | |
Pinnacle Foods Finance LLC
Tranche F Term Loan(d)(p)
10/17/18 | | | 4.750 | % | | | 224,438 | | | | 224,646 | | |
Solvest Ltd.
Tranche C2 Term Loan(d)(p)
07/08/18 | | | 5.021 | % | | | 542,921 | | | | 544,214 | | |
U.S. Foods, Inc.
Term Loan(d)(p)
07/03/14 | | | 2.710 | % | | | 736,399 | | | | 726,480 | | |
Windsor Quality Food Co. Ltd.
Tranche B Term Loan(d)(f)(p)
02/16/17 | | | 5.000 | % | | | 714,000 | | | | 706,860 | | |
Total | | | | | | | 5,942,121 | | |
Gaming 0.2% | |
Affinity Gaming LLC
Term Loan(d)(p)
11/09/17 | | | 5.500 | % | | | 223,875 | | | | 225,740 | | |
Caesars Entertainment Operating Co., Inc.
Tranche B2 Term Loan(d)(p)
01/28/15 | | | 3.211 | % | | | 800,000 | | | | 775,664 | | |
Caesars Octavius LLC
Tranche B Term Loan(d)(p)
04/25/17 | | | 9.250 | % | | | 725,000 | | | | 739,500 | | |
Cannery Casino(d)(p)
2nd Lien Term Loan
10/02/19 | | | 10.000 | % | | | 250,000 | | | | 243,332 | | |
Term Loan
10/02/18 | | | 6.000 | % | | | 275,000 | | | | 275,861 | | |
Golden Nugget, Inc.
2nd Lien Term Loan(d)(p)
11/02/14 | | | 3.520 | % | | | 50,000 | | | | 44,188 | | |
Las Vegas Sands LLC(d)(p)
Tranche B Term Loan
11/23/16 | | | 2.720 | % | | | 187,481 | | | | 187,012 | | |
Tranche I Delayed Draw Term Loan
11/23/16 | | | 2.720 | % | | | 23,566 | | | | 23,506 | | |
Pinnacle Entertainment, Inc.
Tranche A Term Loan(d)(p)
03/19/19 | | | 4.000 | % | | | 597,000 | | | | 599,985 | | |
ROC Finance LLC(d)(h)(p)(q)
Delayed Draw Term Loan
08/19/17 | | | 2.250 | % | | | 16,667 | | | | 17,042 | | |
08/19/17 | | | 2.250 | % | | | 10,000 | | | | 10,225 | | |
ROC Finance LLC(d)(p)
Tranche B Term Loan
08/19/17 | | | 8.500 | % | | | 248,333 | | | | 253,921 | | |
Stockbridge/SBE Holdings
Tranche B Term Loan(d)(p)
05/02/17 | | | 13.000 | % | | | 300,000 | | | | 298,500 | | |
The accompanying Notes to Financial Statements are an integral part of this statement.
Annual Report 2012
29
Columbia Strategic Income Fund
Portfolio of Investments (continued)
October 31, 2012
Senior Loans (continued)
Borrower | | Weighted
Average
Coupon | | Principal
Amount ($) | | Value ($) | |
Twin River Worldwide Holdings, Inc.
Term Loan(d)(p)
11/05/15 | | | 8.500 | % | | | 364,942 | | | | 366,613 | | |
Total | | | | | | | 4,061,089 | | |
Gas Pipelines —% | |
Energy Transfer Equity LP
Term Loan(d)(p)
03/24/17 | | | 3.750 | % | | | 200,000 | | | | 199,150 | | |
Health Care 0.2% | |
Alere, Inc.
Tranche B Term Loan(d)(p)
06/30/17 | | | 4.750 | % | | | 198,000 | | | | 199,273 | | |
Ardent Medical Services, Inc.
Term Loan(d)(p)
09/15/15 | | | 6.500 | % | | | 192,853 | | | | 193,576 | | |
Bausch & Lomb, Inc.(d)(p)
Delayed Draw Term Loan
09/30/15 | | | 4.750 | % | | | 225,000 | | | | 226,874 | | |
Term Loan
05/17/19 | | | 5.250 | % | | | 423,938 | | | | 428,330 | | |
Community Health Systems, Inc.(d)(p)
Term Loan
07/25/14 | | | 2.617 | % | | | 8,802 | | | | 8,837 | | |
01/25/17 | | | 3.921 | % | | | 1,049,790 | | | | 1,053,717 | | |
ConvaTec, Inc.
Term Loan(d)(p)
12/22/16 | | | 5.000 | % | | | 653,402 | | | | 655,852 | | |
DaVita, Inc.
Tranche B Term Loan(d)(p)
10/20/16 | | | 4.500 | % | | | 663,187 | | | | 666,663 | | |
Health Management Associates, Inc.
Tranche B Term Loan(d)(p)
11/16/18 | | | 4.500 | % | | | 248,125 | | | | 250,120 | | |
IASIS Healthcare LLC
Tranche B Term Loan(d)(p)
05/03/18 | | | 5.000 | % | | | 297,733 | | | | 298,105 | | |
Onex Carestream Finance LP
Term Loan(d)(p)
02/25/17 | | | 5.000 | % | | | 689,193 | | | | 680,722 | | |
Quintiles Transnational Corp.
Tranche B Term Loan(d)(p)
06/08/18 | | | 5.000 | % | | | 962,812 | | | | 963,419 | | |
Select Medical Corp.(d)(p)
Tranche B Term Loan
06/01/18 | | | 5.500 | % | | | 271,563 | | | | 272,920 | | |
06/01/18 | | | 5.502 | % | | | 74,813 | | | | 75,187 | | |
Senior Loans (continued)
Borrower | | Weighted
Average
Coupon | | Principal
Amount ($) | | Value ($) | |
inVentiv Health, Inc.
Term Loan(d)(p)
08/04/16 | | | 6.500 | % | | | 541,134 | | | | 528,510 | | |
Total | | | | | | | 6,502,105 | | |
Independent Energy —% | |
Plains E&P Co.
Tranche B Term Loan(d)(h)(p)
12/01/19 | | | 4.000 | % | | | 900,000 | | | | 903,537 | | |
Integrated Energy —% | |
Gibson Energy ULC
Tranche B Term Loan(d)(p)
06/15/18 | | | 4.750 | % | | | 241,434 | | | | 243,848 | | |
Media Cable 0.1% | |
Cequel Communications LLC
Term Loan(d)(p)
02/14/19 | | | 4.000 | % | | | 447,750 | | | | 447,831 | | |
MCC Iowa LLC
Tranche F Term Loan(d)(p)
10/23/17 | | | 4.500 | % | | | 687,689 | | | | 683,101 | | |
Mediacom Illinois LLC
Tranche E Term Loan(d)(p)
10/23/17 | | | 4.500 | % | | | 908,731 | | | | 901,352 | | |
Revolution Studios Distribution Co. LLC
Tranche B Term Loan(d)(f)(p)
12/21/14 | | | 3.970 | % | | | 206,257 | | | | 172,225 | | |
San Juan Cable LLC
Tranche B 1st Lien Term Loan(d)(p)
06/09/17 | | | 6.000 | % | | | 148,125 | | | | 147,755 | | |
Total | | | | | | | 2,352,264 | | |
Media Non-Cable 0.4% | |
AMC Networks, Inc.
Tranche B Term Loan(d)(p)
12/31/18 | | | 4.000 | % | | | 197,500 | | | | 197,747 | | |
Cengage Learning Acquisitions, Inc.
Term Loan(d)(p)
07/03/14 | | | 2.470 | % | | | 534,661 | | | | 508,864 | | |
Clear Channel Communications, Inc.
Tranche B Term Loan(d)(g)(p)
01/29/16 | | | 3.862 | % | | | 1,047,974 | | | | 835,078 | | |
Cumulus Media Holdings, Inc.(d)(p)
1st Lien Term Loan
09/17/18 | | | 5.750 | % | | | 545,434 | | | | 548,979 | | |
2nd Lien Term Loan
09/16/19 | | | 7.500 | % | | | 725,000 | | | | 733,156 | | |
The accompanying Notes to Financial Statements are an integral part of this statement.
Annual Report 2012
30
Columbia Strategic Income Fund
Portfolio of Investments (continued)
October 31, 2012
Senior Loans (continued)
Borrower | | Weighted
Average
Coupon | | Principal
Amount ($) | | Value ($) | |
Emmis Operating Co.
Tranche B Term Loan(d)(p)
11/01/13 | | | 4.362 | % | | | 170,369 | | | | 168,098 | | |
Encompass Digital Media, Inc.
Tranche B Term Loan(d)(p)
08/10/17 | | | 8.000 | % | | | 995,000 | | | | 999,975 | | |
GateHouse Media Operating, Inc.
Term Loan(d)(p)
08/28/14 | | | 2.470 | % | | | 687,756 | | | | 237,276 | | |
Getty Images, Inc.
Term Loan(d)(p)
10/18/19 | | | 4.750 | % | | | 550,000 | | | | 551,144 | | |
Granite Broadcasting
Tranche B 1st Lien Term Loan(d)(p)
05/23/18 | | | 8.500 | % | | | 523,687 | | | | 521,069 | | |
Gray Television, Inc.
Term Loan(d)(h)(p)
10/16/19 | | | 4.750 | % | | | 425,000 | | | | 425,455 | | |
Hubbard Radio LLC
1st Lien Term Loan(d)(p)
04/28/17 | | | 5.250 | % | | | 297,821 | | | | 298,566 | | |
Intelsat Jackson Holdings SA(d)(p)
Term Loan
02/01/14 | | | 2.711 | % | | | 500,000 | | | | 493,750 | | |
02/01/14 | | | 3.214 | % | | | 125,000 | | | | 123,437 | | |
Tranche B Term Loan
04/02/18 | | | 4.500 | % | | | 496,231 | | | | 499,228 | | |
LIN Television Corp.
Tranche B Term Loan(d)(p)
12/21/18 | | | 5.000 | % | | | 173,688 | | | | 174,990 | | |
MediaNews Group, Inc.
Term Loan(d)(p)
03/19/14 | | | 8.500 | % | | | 18,499 | | | | 17,944 | | |
Penton Media, Inc.
1st Lien Term Loan(d)(p)
08/01/14 | | | 5.000 | % | | | 486,572 | | | | 402,337 | | |
Radio One, Inc.
Term Loan(d)(p)
03/31/16 | | | 7.500 | % | | | 734,884 | | | | 734,274 | | |
Tribune Co.(d)(o)(p)
Tranche B Term Loan
06/04/14 | | | 5.250 | % | | | 98,750 | | | | 74,989 | | |
Tranche X Term Loan
09/29/14 | | | 5.000 | % | | | 17,067 | | | | 12,964 | | |
Univision Communications, Inc.
1st Lien Term Loan(d)(p)
03/31/17 | | | 4.462 | % | | | 950,912 | | | | 928,927 | | |
Van Wagner Communications LLC
Term Loan(d)(p)
08/03/18 | | | 8.250 | % | | | 400,000 | | | | 404,500 | | |
Total | | | | | | | 9,892,747 | | |
Senior Loans (continued)
Borrower | | Weighted
Average
Coupon | | Principal
Amount ($) | | Value ($) | |
Metals 0.1% | |
Essar Steel Algoma, Inc.
Term Loan(d)(p)
09/20/14 | | | 8.750 | % | | | 325,000 | | | | 327,438 | | |
FMG Resources August 2006 Proprietary Ltd.(d)(h)(p)
Term Loan
10/18/17 | | | 5.250 | % | | | 2,590,000 | | | | 2,575,755 | | |
FMG Resources August 2006 Proprietary Ltd.(d)(p)
Term Loan
10/18/17 | | | 5.250 | % | | | 400,000 | | | | 397,800 | | |
Novelis, Inc.
Tranche B2 Term Loan(d)(p)
03/10/17 | | | 4.000 | % | | | 445,500 | | | | 445,945 | | |
Total | | | | | | | 3,746,938 | | |
Non-Captive Consumer —% | |
Springleaf Financial Funding Co.
Term Loan(d)(p)
05/10/17 | | | 5.500 | % | | | 800,000 | | | | 788,600 | | |
Non-Captive Diversified —% | |
Istar Financial, Inc.
Term Loan(d)(h)(p)
10/16/17 | | | 5.750 | % | | | 625,000 | | | | 623,438 | | |
Oil Field Services —% | |
Frac Tech Services
Term Loan(d)(p)
05/06/16 | | | 8.500 | % | | | 680,076 | | | | 602,717 | | |
Other Financial Institutions —% | |
Alix Partners LLP
Tranche B2 1st Lien Term Loan(d)(p)
06/28/19 | | | 6.500 | % | | | 349,125 | | | | 352,962 | | |
Other Industry 0.1% | |
ATI Acquisition Co.
Tranche B Term Loan(d)(f)(o)(p)
12/30/14 | | | 12.250 | % | | | 91,907 | | | | 4,595 | | |
Advantage Sales & Marketing, Inc.
1st Lien Term Loan(d)(p)
12/18/17 | | | 5.250 | % | | | 171,937 | | | | 172,080 | | |
Harland Clarke Holdings Corp.
Tranche B1 Term Loan(d)(p)
06/30/14 | | | 2.712 | % | | | 563,414 | | | | 537,356 | | |
On Assignment, Inc.
Tranche B Term Loan(d)(p)
05/15/19 | | | 5.000 | % | | | 251,710 | | | | 252,339 | | |
The accompanying Notes to Financial Statements are an integral part of this statement.
Annual Report 2012
31
Columbia Strategic Income Fund
Portfolio of Investments (continued)
October 31, 2012
Senior Loans (continued)
Borrower | | Weighted
Average
Coupon | | Principal
Amount ($) | | Value ($) | |
Sensus U.S.A., Inc.
2nd Lien Term Loan(d)(p)
05/09/18 | | | 8.500 | % | | | 725,000 | | | | 725,000 | | |
WireCo WorldGroup, Inc.
Term Loan(d)(p)
02/15/17 | | | 6.000 | % | | | 575,000 | | | | 581,469 | | |
Total | | | | | | | 2,272,839 | | |
Packaging 0.1% | |
BWAY Corp.
Tranche B Term Loan(d)(p)
08/31/17 | | | 4.500 | % | | | 425,000 | | | | 426,062 | | |
Berry Plastics Holding Corp.
Tranche C Term Loan(d)(p)
04/03/15 | | | 2.212 | % | | | 853,089 | | | | 846,333 | | |
Reynolds Group Holdings, Inc.
Term Loan(d)(p)
09/28/18 | | | 4.750 | % | | | 549,868 | | | | 551,446 | | |
Total | | | | | | | 1,823,841 | | |
Paper —% | |
NewPage Corp.
Debtor In Possession Term Loan(d)(p)(r)
03/08/13 | | | 8.000 | % | | | 325,000 | | | | 325,543 | | |
Pharmaceuticals 0.1% | |
Endo Pharmaceuticals Holdings, Inc.(d)(p)
Tranche A Term Loan
06/17/16 | | | 2.250 | % | | | 235,938 | | | | 235,593 | | |
Tranche B Term Loan
06/17/18 | | | 4.000 | % | | | 57,339 | | | | 57,662 | | |
Grifols, Inc.
Tranche B Term Loan(d)(p)
06/01/17 | | | 4.500 | % | | | 618,562 | | | | 623,641 | | |
Pharmaceutical Product Development, Inc.
Term Loan(d)(p)
12/05/18 | | | 6.250 | % | | | 173,688 | | | | 175,902 | | |
RPI Finance Trust
Term Loan(d)(p)
05/09/18 | | | 3.500 | % | | | 895,466 | | | | 894,159 | | |
Valeant Pharmaceuticals International, Inc.
Tranche B Term Loan(d)(p)
02/13/19 | | | 4.250 | % | | | 373,500 | | | | 374,609 | | |
Total | | | | | | | 2,361,566 | | |
Property & Casualty —% | |
Asurion LLC
2nd Lien Term Loan(d)(p)
05/24/19 | | | 9.000 | % | | | 445,860 | | | | 460,431 | | |
Senior Loans (continued)
Borrower | | Weighted
Average
Coupon | | Principal
Amount ($) | | Value ($) | |
HUB International Ltd.
Term Loan(d)(p)
06/13/17 | | | 4.712 | % | | | 248,750 | | | | 249,295 | | |
Total | | | | | | | 709,726 | | |
REITs —% | |
CB Richard Ellis Services, Inc.
Tranche C Term Loan(d)(p)
03/04/18 | | | 3.462 | % | | | 271,562 | | | | 271,139 | | |
Restaurants —% | |
OSI Restaurant Partners
Tranche B Term Loan(d)(p)
10/30/19 | | | 3.814 | % | | | 400,000 | | | | 401,584 | | |
Retailers 0.4% | |
Academy Ltd.
Term Loan(d)(p)
08/03/18 | | | 6.000 | % | | | 795,119 | | | | 794,992 | | |
BJ Wholesale Club, Inc.
Term Loan(d)(p)
09/26/19 | | | 5.750 | % | | | 1,200,000 | | | | 1,211,328 | | |
Bass Pro Group LLC
Term Loan(d)(p)
06/13/17 | | | 5.250 | % | | | 628,183 | | | | 634,075 | | |
Blue Buffalo Co., Ltd.
Term Loan(d)(p)
08/08/19 | | | 6.500 | % | | | 250,000 | | | | 250,470 | | |
General Nutrition Centers, Inc.
Tranche B Term Loan(d)(p)
03/02/18 | | | 3.750 | % | | | 1,024,534 | | | | 1,025,384 | | |
J. Crew Group, Inc.
Term Loan(d)(p)
03/07/18 | | | 4.750 | % | | | 911,125 | | | | 911,353 | | |
Jo-Ann Stores, Inc.
Term Loan(d)(p)
03/16/18 | | | 4.750 | % | | | 988,512 | | | | 987,098 | | |
Neiman Marcus Group, Inc. (The)
Term Loan(d)(p)
05/16/18 | | | 4.750 | % | | | 1,000,000 | | | | 1,001,540 | | |
Orchard Supply Hardware LLC
Tranche B1 Term Loan(d)(p)
12/21/13 | | | 5.000 | % | | | 847,699 | | | | 661,205 | | |
Pantry, Inc. (The)
Term Loan(d)(p)
08/03/19 | | | 5.750 | % | | | 325,000 | | | | 328,656 | | |
Party City Holdings, Inc.
Term Loan(d)(p)
07/27/19 | | | 5.750 | % | | | 350,000 | | | | 352,975 | | |
The accompanying Notes to Financial Statements are an integral part of this statement.
Annual Report 2012
32
Columbia Strategic Income Fund
Portfolio of Investments (continued)
October 31, 2012
Senior Loans (continued)
Borrower | | Weighted
Average
Coupon | | Principal
Amount ($) | | Value ($) | |
Pep Boys
Tranche B Term Loan(d)(h)(p)
10/11/18 | | | 5.000 | % | | | 450,000 | | | | 452,250 | | |
PetCo Animal Supplies, Inc.
Term Loan(d)(p)
11/24/17 | | | 4.500 | % | | | 627,500 | | | | 629,753 | | |
Rite Aid Corp.
Tranche 2 Term Loan(d)(p)
06/04/14 | | | 1.970 | % | | | 894,340 | | | | 885,960 | | |
Toys 'R' Us - Delaware, Inc.
Term Loan(d)(p)
09/01/16 | | | 6.000 | % | | | 640,201 | | | | 637,480 | | |
Total | | | | | | | 10,764,519 | | |
Technology 0.3% | |
Aeroflex, Inc.
Tranche B Term Loan(d)(p)
05/09/18 | | | 5.750 | % | | | 687,265 | | | | 685,334 | | |
CommScope, Inc.
Tranche 1 Term Loan(d)(p)
01/14/18 | | | 4.250 | % | | | 568,980 | | | | 571,706 | | |
Edwards (Cayman Islands II) Ltd.(d)(p)
1st Lien Term Loan
05/31/16 | | | 5.500 | % | | | 214,328 | | | | 214,930 | | |
05/31/16 | | | 5.500 | % | | | 386,757 | | | | 387,844 | | |
First Data Corp.(d)(p)
Term Loan
03/26/18 | | | 4.211 | % | | | 848,315 | | | | 808,020 | | |
Tranche B1 Term Loan
09/24/14 | | | 2.961 | % | | | 4,006 | | | | 3,997 | | |
Freescale Semiconductor, Inc.
Tranche B1 Term Loan(d)(p)
12/01/16 | | | 4.462 | % | | | 922,197 | | | | 891,995 | | |
Greeneden U.S. Holdings II LLC
Term Loan(d)(p)
01/31/19 | | | 6.750 | % | | | 547,250 | | | | 552,892 | | |
Interactive Data Corp.
Tranche B Term Loan(d)(p)
02/11/18 | | | 4.500 | % | | | 862,249 | | | | 867,198 | | |
Kasima LLC
Term Loan(d)(p)
03/31/17 | | | 5.000 | % | | | 270,875 | | | | 270,875 | | |
Microsemi Corp.
Term Loan(d)(p)
02/02/18 | | | 4.000 | % | | | 762,970 | | | | 766,022 | | |
Novell, Inc.
1st Lien Term Loan(d)(p)
11/22/17 | | | 7.250 | % | | | 482,775 | | | | 487,907 | | |
Senior Loans (continued)
Borrower | | Weighted
Average
Coupon | | Principal
Amount ($) | | Value ($) | |
Openlink International, Inc.
Term Loan(d)(p)
10/30/17 | | | 7.750 | % | | | 148,875 | | | | 148,875 | | |
Rovi Solutions Corp./Guides, Inc.
Tranche B2 Term Loan(d)(p)
03/29/19 | | | 4.000 | % | | | 248,004 | | | | 242,734 | | |
Syniverse Holdings, Inc.
Term Loan(d)(p)
04/23/19 | | | 5.000 | % | | | 798,000 | | | | 801,990 | | |
Trans Union LLC
Term Loan(d)(p)
02/10/18 | | | 5.500 | % | | | 197,000 | | | | 199,175 | | |
Verint Systems, Inc.
Term Loan(d)(p)
10/27/17 | | | 4.500 | % | | | 197,500 | | | | 198,365 | | |
Total | | | | | | | 8,099,859 | | |
Textile —% | |
Levi Strauss & Co.
Term Loan(d)(p)
04/04/14 | | | 2.465 | % | | | 600,000 | | | | 596,502 | | |
Springs Window Fashions LLC
Tranche B Term Loan(d)(p)
05/31/17 | | | 6.000 | % | | | 183,215 | | | | 182,147 | | |
Total | | | | | | | 778,649 | | |
Transportation Services —% | |
Avis Budget Car Rental LLC
Tranche C Term Loan(d)(p)
03/15/19 | | | 4.250 | % | | | 373,125 | | | | 375,058 | | |
Hertz Corp. (The)
Letter of Credit(d)(p)
03/11/18 | | | 3.750 | % | | | 500,000 | | | | 488,750 | | |
Total | | | | | | | 863,808 | | |
Wireless 0.1% | |
Cricket Communications, Inc.
Term Loan(d)(p)
10/09/19 | | | 4.750 | % | | | 175,000 | | | | 175,548 | | |
Instant Web, Inc.(d)(p)
Delayed Draw Term Loan
08/07/14 | | | 3.587 | % | | | 25,223 | | | | 19,380 | | |
Term Loan
08/07/14 | | | 3.587 | % | | | 241,966 | | | | 185,910 | | |
MetroPCS Wireless, Inc.
Tranche B3 Term Loan(d)(p)
03/19/18 | | | 4.000 | % | | | 688,753 | | | | 688,539 | | |
The accompanying Notes to Financial Statements are an integral part of this statement.
Annual Report 2012
33
Columbia Strategic Income Fund
Portfolio of Investments (continued)
October 31, 2012
Senior Loans (continued)
Borrower | | Weighted
Average
Coupon | | Principal
Amount ($) | | Value ($) | |
Telesat Canada
Tranche B Term Loan(d)(p)
03/28/19 | | | 4.250 | % | | | 573,562 | | | | 578,105 | | |
nTelos, Inc.
Tranche B Term Loan(d)(p)
08/07/15 | | | 4.000 | % | | | 304,391 | | | | 303,566 | | |
Total | | | | | | | 1,951,048 | | |
Wirelines 0.1% | |
Alaska Communications Systems Holdings, Inc.
Term Loan(d)(p)
10/21/16 | | | 5.500 | % | | | 889,447 | | | | 816,068 | | |
Integra Telecom Holdings, Inc.
Term Loan(d)(p)
04/15/15 | | | 9.250 | % | | | 594,480 | | | | 591,881 | | |
Windstream Corp.
Tranche B3 Term Loan(d)(p)
08/08/19 | | | 4.000 | % | | | 623,437 | | | | 626,293 | | |
Total | | | | | | | 2,034,242 | | |
Total Senior Loans
(Cost: $104,744,518) | | | | | | | 104,284,266 | | |
Common Stocks —%
Issuer | | Shares | | Value ($) | |
Consumer Discretionary —% | |
Auto Components —% | |
Delphi Automotive PLC(s) | | | 1,315 | | | | 41,343 | | |
Hotels, Restaurants & Leisure —% | |
BLB Management Services , Inc.(s) | | | 5,526 | | | | 78,403 | | |
Media —% | |
Media News Group(s) | | | 2,495 | | | | 35,347 | | |
Total Consumer Discretionary | | | | | 155,093 | | |
Information Technology —% | |
IT Services —% | |
Advanstar Communications, Inc.(s) | | | 315 | | | | 3,189 | | |
Total Information Technology | | | | | 3,189 | | |
Materials —% | |
Chemicals —% | |
LyondellBasell Industries NV, Class A | | | 3,806 | | | | 203,202 | | |
Common Stocks (continued)
Issuer | | Shares | | Value ($) | |
Metals & Mining —% | |
Aleris International, Inc. | | | 3,583 | | | | 173,776 | | |
Total Materials | | | | | 376,978 | | |
Telecommunication Services —% | |
Diversified Telecommunication Services —% | |
Hawaiian Telcom Holdco, Inc.(s) | | | 478 | | | | 8,160 | | |
Total Telecommunication Services | | | | | 8,160 | | |
Total Common Stocks
(Cost: $510,040) | | | | | 543,420 | | |
Warrants —%
Energy —% | |
Energy Equipment & Services —% | |
Green Field Energy Services, Inc.(s) | | | 3,895 | | | | 120,745 | | |
Total Energy | | | | | 120,745 | | |
Total Warrants
(Cost: $157,633) | | | | | 120,745 | | |
Treasury Bills 0.1%
Issuer | | Effective
Yield | | Principal
Amount ($) | | Value ($) | |
Australia 0.1% | |
Australia Treasury Bills
02/08/13 | | | 3.020 | % | | AUD | 3,000,000 | | | | 3,089,126 | | |
Total Treasury Bills
(Cost: $3,082,753) | | | | | | | 3,089,126 | | |
Money Market Funds 5.0%
| | | Shares | | Value ($) | |
Columbia Short-Term Cash Fund,
0.149%(t)(u) | | | 140,193,065 | | | | 140,193,065 | | |
Total Money Market Funds
(Cost: $140,193,065) | | | | | 140,193,065 | | |
The accompanying Notes to Financial Statements are an integral part of this statement.
Annual Report 2012
34
Columbia Strategic Income Fund
Portfolio of Investments (continued)
October 31, 2012
Investments of Cash Collateral Received for Securities on Loan 10.1%
Issuer | | Effective
Yield | | Par ($)/
Principal ($)/
Shares | | Value ($) | |
Asset-Backed Commercial Paper 0.5% | |
Kells Funding LLC
11/01/12 | | | 0.360 | % | | | 4,995,400 | | | | 4,995,400 | | |
Salisbury Receivables Co. LLC
11/15/12 | | | 0.310 | % | | | 4,996,254 | | | | 4,996,254 | | |
Sheffield Receivable Corp.
11/05/12 | | | 0.310 | % | | | 4,995,910 | | | | 4,995,910 | | |
Total | | | | | | | 14,987,564 | | |
Certificates of Deposit 1.6% | |
Australia and New Zealand Bank Group Ltd.
11/16/12 | | | 0.620 | % | | | 5,000,000 | | | | 5,000,000 | | |
Credit Suisse
11/08/12 | | | 0.379 | % | | | 10,000,000 | | | | 10,000,000 | | |
Deutsche Bank AG
11/02/12 | | | 0.704 | % | | | 5,000,000 | | | | 5,000,000 | | |
National Bank of Canada
11/09/12 | | | 0.279 | % | | | 5,000,000 | | | | 5,000,000 | | |
Norinchukin Bank
11/09/12 | | | 0.497 | % | | | 10,000,000 | | | | 10,000,000 | | |
Sumitomo Trust & Banking Co., Ltd.
11/01/12 | | | 0.454 | % | | | 10,000,000 | | | | 10,000,000 | | |
Total | | | | | | | 45,000,000 | | |
Commercial Paper 0.3% | |
Bank of New Zealand
11/02/12 | | | 0.334 | % | | | 10,000,000 | | | | 10,000,000 | | |
Other Short-Term Obligations 0.4% | |
General Electric Capital Corp.
11/01/12 | | | 0.290 | % | | | 5,003,631 | | | | 5,003,631 | | |
Investments of Cash Collateral Received for Securities on Loan (continued)
Issuer | | Effective
Yield | | Par ($)/
Principal ($)/
Shares | | Value ($) | |
Natixis Financial Products LLC
11/01/12 | | | 0.520 | % | | | 5,000,000 | | | | 5,000,000 | | |
Total | | | | | | | 10,003,631 | | |
Repurchase Agreements 7.3% | |
Citigroup Global Markets, Inc.
dated 10/31/12, matures 11/01/12,
repurchase price
$5,000,044(v) | | | 0.320 | % | | | 5,000,000 | | | | 5,000,000 | | |
Mizuho Securities USA, Inc.
dated 10/31/12, matures 11/01/12,
repurchase price
$148,175,781(v) | | | 0.400 | % | | | 148,174,135 | | | | 148,174,135 | | |
Nomura Securities
dated 10/31/12, matures 11/01/12,
repurchase price
$50,000,500(v) | | | 0.360 | % | | | 50,000,000 | | | | 50,000,000 | | |
Total | | | | | | | 203,174,135 | | |
Total Investments of Cash Collateral Received
for Securities on Loan
(Cost: $283,165,330) | | | | | | | 283,165,330 | | |
Total Investments
(Cost: $2,973,954,991) | | | | | | | 3,146,569,931 | | |
Other Assets & Liabilities, Net | | | | | | | (354,651,714 | ) | |
Net Assets | | | | | | | 2,791,918,217 | | |
Investments in Derivatives
Futures Contracts Outstanding at October 31, 2012
Contract Description | | Number of
Contracts
Long (Short) | | Notional
Market
Value ($) | | Expiration
Date | | Unrealized
Appreciation ($) | | Unrealized
Depreciation ($) | |
U.S. Treasury Long Bond, 20-year | | | 234 | | | | 34,939,125 | | | December 2012 | | | — | | | | (248,976 | ) | |
U.S. Treasury Note, 2-year | | | 172 | | | | 37,896,438 | | | December 2012 | | | — | | | | (34,975 | ) | |
U.S. Treasury Note, 5-year | | | (96 | ) | | | (11,928,000 | ) | | December 2012 | | | 16,356 | | | | — | | |
U.S. Treasury Note, 10-year | | | (1,796 | ) | | | (238,924,125 | ) | | December 2012 | | | — | | | | (496,152 | ) | |
U.S. Treasury Ultra Bond, 30-year | | | 14 | | | | 2,311,313 | | | December 2012 | | | — | | | | (48,569 | ) | |
Total | | | | | | | | | 16,356 | | | | (828,672 | ) | |
The accompanying Notes to Financial Statements are an integral part of this statement.
Annual Report 2012
35
Columbia Strategic Income Fund
Portfolio of Investments (continued)
October 31, 2012
Credit Default Swap Contracts Outstanding at October 31, 2012
Buy Protection
Counterparty | | Reference
Entity | | Expiration Date | | Pay Fixed
Rate (%) | | Notional
Amount ($) | | Market
Value ($) | | Periodic
Payments
Receivable
(Payable) ($) | | Unrealized
Appreciation
($) | | Unrealized
Depreciation
($) | |
Barclays Capital | | Federative
Republic
of Brazil | | |
September 20, 2014 | | | | 1.470 | | | | 10,000,000 | | | | (177,928 | ) | | | (17,150 | ) | | | — | | | | (195,078 | ) | |
Total | | | | | | | | | | | | | | | — | | | | (195,078 | ) | |
Forward Foreign Currency Exchange Contracts Open at October 31, 2012
Counterparty | | Exchange Date | | Currency to
be Delivered | | Currency to
be Received | | Unrealized
Appreciation ($) | | Unrealized
Depreciation ($) | |
J.P. Morgan Securities, Inc. | | November 19, 2012 | | | 10,711,075
(USD) | | | | 840,000,000
(JPY) | | | | —
| | | | (187,258
| ) | |
UBS Securities | | November 29, 2012 | | | 6,100,000
(NZD) | | | | 4,976,075
(USD) | | | | —
| | | | (31,672
| ) | |
Citigroup Global Markets Inc. | | November 29, 2012 | | | 1,675,548
(USD) | | | | 52,887,000
(RUB) | | | | 2,663
| | | | —
| | |
State Street Bank & Trust Company | | December 4, 2012 | | | 8,628,000
(EUR) | | | | 11,154,710
(USD) | | | | —
| | | | (31,773
| ) | |
J.P. Morgan Securities, Inc. | | December 5, 2012 | | | 23,500,000
(PLN) | | | | 7,272,840
(USD) | | | | —
| | | | (58,615
| ) | |
HSBC Securities (USA), Inc. | | December 12, 2012 | | | 19,591,000
(CHF) | | | | 20,919,716
(USD) | | | | —
| | | | (130,033
| ) | |
Goldman, Sachs & Co. | | December 12, 2012 | | | 27,014,000
(EUR) | | | | 34,858,190
(USD) | | | | —
| | | | (169,793
| ) | |
State Street Bank & Trust Company | | December 12, 2012 | | | 1,109,691,000
(JPY) | | | | 13,941,717
(USD) | | | | 35,582
| | | | —
| | |
Morgan Stanley | | December 12, 2012 | | | 13,889,239
(USD) | | | | 13,460,000
(AUD) | | | | 37,055
| | | | —
| | |
Credit Suisse | | December 12, 2012 | | | 34,828,973
(USD) | | | | 34,849,000
(CAD) | | | | 33,510
| | | | —
| | |
UBS Securities | | December 12, 2012 | | | 20,897,604
(USD) | | | | 120,780,000
(NOK) | | | | 255,865
| | | | —
| | |
Total | | | | | | | | | 364,675 | | | | (609,144 | ) | |
Notes to Portfolio of Investments
(a) Principal amounts are denominated in United States Dollars unless otherwise noted.
(b) Security exempt from registration pursuant to Rule 144A under the Securities Act of 1933. This security may be resold in transactions exempt from registration, normally to qualified institutional buyers. At October 31, 2012, the value of these securities amounted to $668,415,578 or 23.94% of net assets.
(c) At October 31, 2012, security was partially or fully on loan.
(d) Variable rate security. The interest rate shown reflects the rate as of October 31, 2012.
(e) Negligible market value.
The accompanying Notes to Financial Statements are an integral part of this statement.
Annual Report 2012
36
Columbia Strategic Income Fund
Portfolio of Investments (continued)
October 31, 2012
Notes to Portfolio of Investments (continued)
(f) Identifies issues considered to be illiquid as to their marketability. The aggregate value of such securities at October 31, 2012 was $2,578,819, representing 0.09% of net assets. Information concerning such security holdings at October 31, 2012 was as follows:
Security Description | | Acquisition Dates | | Cost ($) | |
ATI Acquisition Co.
Tranche B Term Loan
12/30/14 12.250% | | 12/23/09 thru 10/29/12 | | | 77,486 | | |
Cabazon Band Mission Indians
Revenue Bonds
Series 2004
10/01/11 13.000% | | 10/04/04 | | | 2,820,000 | | |
Old All, Inc.
Senior Unsecured
06/01/20 6.000% | | 06/29/10 | | | — | | |
Revolution Studios Distribution Co. LLC
Tranche B Term Loan
12/21/14 3.970% | | 10/15/08 | | | 186,645 | | |
Six Flags, Inc.
06/01/14 9.625% | | 05/07/10 | | | — | | |
Windsor Quality Food Co. Ltd.
Tranche B Term Loan
02/16/17 5.000% | | 02/14/11 | | | 706,860 | | |
(g) Represents fair value as determined in good faith under procedures approved by the Board of Trustees. At October 31, 2012, the value of these securities amounted to $5,744,938, which represents 0.21% of net assets.
(h) Represents a security purchased on a when-issued or delayed delivery basis.
(i) Represents comparable securities held to satisfy future delivery requirements of the following open forward sale commitments at October 31, 2012:
Security Description | | Principal
Amount ($) | | Settlement
Date | | Proceeds
Receivable ($) | | Value ($) | |
Federal National Mortgage Association
11/01/42 4.500% | | | 20,000,000 | | | 11/14/12 | | | 21,607,812 | | | | 21,575,000 | | |
(j) The maturity dates shown represent the original maturity of the underlying obligation. Actual maturity may vary based upon prepayment activity on these obligations. Unless otherwise noted, the coupon rates presented are fixed rates.
(k) Interest Only (IO) security. The actual effective yield of this security is different than the stated coupon rate.
(l) At October 31, 2012, investments in securities included securities valued at $2,321,868 that were partially pledged as collateral to cover initial margin deposits on open interest rate futures contracts.
(m) Zero coupon bond.
(n) Municipal obligations include debt obligations issued by or on behalf of territories, possessions, or sovereign nations within the territorial boundaries of the United States. At October 31, 2012, the value of these securities amounted to $1,692,000 or 0.06% of net assets.
(o) Represents securities that have defaulted on payment of interest. The Fund has stopped accruing interest on these securities. At October 31, 2012, the value of these securities amounted to $1,784,548, which represents 0.06% of net assets.
(p) Senior loans have rates of interest that float periodically based primarily on the London Interbank Offered Rate ("LIBOR") and other short-term rates. The interest rate shown reflects the weighted average coupon as of October 31, 2012. The interest rate shown for senior loans purchased on a when-issued or delayed delivery basis, if any, reflects an estimated average coupon. Remaining maturities of senior loans may be less than the stated maturities shown as a result of contractual or optional prepayments by the borrower. Such prepayments cannot be predicted with certainty.
The accompanying Notes to Financial Statements are an integral part of this statement.
Annual Report 2012
37
Columbia Strategic Income Fund
Portfolio of Investments (continued)
October 31, 2012
Notes to Portfolio of Investments (continued)
(q) At October 31, 2012, the Fund had unfunded senior loan commitments pursuant to the terms of the loan agreement. The Fund receives a stated coupon rate until the borrower draws on the loan commitment, at which time the rate will become the stated rate in the loan agreement.
Borrower | | Unfunded
Commitment ($) | |
ROC Finance LLC
Delayed Draw Term Loan | | | 16,667 | | |
ROC Finance LLC
Delayed Draw Term Loan | | | 10,000 | | |
Total | | | 26,667 | | |
(r) The borrower filed for protection under Chapter 11 of the U.S. Federal Bankruptcy Code.
(s) Non-income producing.
(t) The rate shown is the seven-day current annualized yield at October 31, 2012.
(u) As defined in the Investment Company Act of 1940, an affiliated company is one in which the Fund owns 5% or more of its outstanding voting securities, or a company which is under common ownership or control with the Fund. Holdings and transactions in these affiliated companies during the year ended October 31, 2012, are as follows:
Issuer | | Beginning
Cost ($) | | Purchase
Cost ($) | | Proceeds
From Sales ($) | | Realized
Gain/Loss ($) | | Ending
Cost ($) | | Dividends
or Interest
Income ($) | |
Value ($) | |
Columbia Short-Term
Cash Fund | | | 194,567,321 | | | | 380,258,180 | | | | (434,632,436) | | | | — | | | | 140,193,065 | | | | 133,671 | | | | 140,193,065 | | |
(v) The following table represents securities received as collateral for repurchase agreements. This collateral is deposited with the Fund's custodian and, pursuant to the terms of the repurchase agreement, must have an aggregate value greater than or equal to the repurchase price plus accrued interest at all times. The value of securities and/or cash held as collateral for repurchase agreements is monitored on a daily basis to ensure the proper level of collateral.
Security Description | | Value ($) | |
Citigroup Global Markets, Inc. (0.320%) | |
Fannie Mae REMICS | | | 1,803,827 | | |
Fannie Mae-Aces | | | 621,796 | | |
Freddie Mac REMICS | | | 2,011,765 | | |
Ginnie Mae II Pool | | | 48,964 | | |
Government National Mortgage Association | | | 613,648 | | |
Total Market Value of Collateral Securities | | | 5,100,000 | | |
Security Description | | Value ($) | |
Mizuho Securities USA, Inc. (0.400%) | |
Fannie Mae Pool | | | 97,100,892 | | |
Fannie Mae REMICS | | | 15,826,843 | | |
Freddie Mac Gold Pool | | | 6,355,322 | | |
Freddie Mac Non Gold Pool | | | 5,909,389 | | |
Freddie Mac REMICS | | | 16,395,156 | | |
Government National Mortgage Association | | | 9,550,016 | | |
Total Market Value of Collateral Securities | | | 151,137,618 | | |
The accompanying Notes to Financial Statements are an integral part of this statement.
Annual Report 2012
38
Columbia Strategic Income Fund
Portfolio of Investments (continued)
October 31, 2012
Notes to Portfolio of Investments (continued)
Security Description | | Value ($) | |
Nomura Securities (0.360%) | |
Fannie Mae Pool | | | 3,151,525 | | |
Freddie Mac Gold Pool | | | 7,449,120 | | |
Ginnie Mae I Pool | | | 12,941,339 | | |
Ginnie Mae II Pool | | | 27,458,016 | | |
Total Market Value of Collateral Securities | | | 51,000,000 | | |
Abbreviation Legend
CMO Collateralized Mortgage Obligation
FGIC Financial Guaranty Insurance Company
NPFGC National Public Finance Guarantee Corporation
PIK Payment-in-Kind
REMIC(S) Real Estate Mortgage Investment Conduit(s)
STRIPS Separate Trading of Registered Interest and Principal Securities
Currency Legend
AUD Australian Dollar
BRL Brazilian Real
CAD Canadian Dollar
CHF Swiss Franc
COP Colombian Peso
EUR Euro
GBP British Pound
IDR Indonesian Rupiah
JPY Japanese Yen
MXN Mexican Peso
NOK Norwegian Krone
NZD New Zealand Dollar
PEN Peru Nuevos Soles
PHP Philippine Peso
PLN Polish Zloty
RUB Russian Rouble
SEK Swedish Krona
USD US Dollar
UYU Uruguay Pesos
The accompanying Notes to Financial Statements are an integral part of this statement.
Annual Report 2012
39
Columbia Strategic Income Fund
Portfolio of Investments (continued)
October 31, 2012
Fair Value Measurements
Generally accepted accounting principles (GAAP) require disclosure regarding the inputs and valuation techniques used to measure fair value and any changes in valuation inputs or techniques. In addition, investments shall be disclosed by major category.
The Fund categorizes its fair value measurements according to a three-level hierarchy that maximizes the use of observable inputs and minimizes the use of unobservable inputs by prioritizing that the most observable input be used when available. Observable inputs are those that market participants would use in pricing an investment based on market data obtained from sources independent of the reporting entity. Unobservable inputs are those that reflect the Fund's assumptions about the information market participants would use in pricing an investment. An investment's level within the fair value hierarchy is based on the lowest level of any input that is deemed significant to the asset or liability's fair value measurement. The input levels are not necessarily an indication of the risk or liquidity associated with investments at that level. For example, certain U.S. government securities are generally high quality and liquid, however, they are reflected as Level 2 because the inputs used to determine fair value may not always be quoted prices in an active market.
Fair value inputs are summarized in the three broad levels listed below:
> Level 1 — Valuations based on quoted prices for investments in active markets that the Fund has the ability to access at the measurement date (including NAV for open-end mutual funds). Valuation adjustments are not applied to Level 1 investments.
> Level 2 — Valuations based on other significant observable inputs (including quoted prices for similar securities, interest rates, prepayment speeds, credit risks, etc.).
> Level 3 — Valuations based on significant unobservable inputs (including the Fund's own assumptions and judgment in determining the fair value of investments).
Inputs that are used in determining fair value of an investment may include price information, credit data, volatility statistics, and other factors. These inputs can be either observable or unobservable. The availability of observable inputs can vary between investments, and is affected by various factors such as the type of investment, and the volume and level of activity for that investment or similar investments in the marketplace. The inputs will be considered by the Investment Manager, along with any other relevant factors in the calculation of an investment's fair value. The Fund uses prices and inputs that are current as of the measurement date, which may include periods of market dislocations. During these periods, the availability of prices and inputs may be reduced for many investments. This condition could cause an investment to be reclassified between the various levels within the hierarchy.
Investments falling into the Level 3 category are primarily supported by quoted prices from brokers and dealers participating in the market for those investments. However, these may be classified as Level 3 investments due to lack of market transparency and corroboration to support these quoted prices. Additionally, valuation models may be used as the pricing source for any remaining investments classified as Level 3. These models rely on one or more significant unobservable inputs and/or significant assumptions by the Investment Manager. Inputs used in valuations may include, but are not limited to, financial statement analysis, capital account balances, discount rates and estimated cash flows, and comparable company data.
Under the direction of the Fund's Board of Trustees (the Board), the Investment Manager's Valuation Committee (the Committee) is responsible for carrying out the valuation procedures approved by the Board. The Committee consists of voting and non-voting members from various groups within the Investment Manager's organization, including operations and accounting, trading and investments, compliance, risk management and legal.
The Committee meets at least monthly to review and approve valuation matters, which may include a description of specific valuation determinations, data regarding pricing information received from approved pricing vendors and brokers and the results of Board-approved valuation control policies and procedures (the Policies). The Policies address, among other things, instances when market quotations are readily available, including recommendations of third party pricing vendors and a determination of appropriate pricing methodologies; events that require specific valuation determinations and assessment of fair value techniques; securities with a potential for stale pricing, including those that are illiquid, restricted, or in default; and the effectiveness of third-party pricing vendors, including periodic reviews of vendors. The Committee meets more frequently, as needed, to discuss additional valuation matters, which may include the need to review back-testing results, review time-sensitive information or approve related valuation actions. The Committee reports to the Board, with members of the Committee meeting with the Board at each of its regularly scheduled meetings to discuss valuation matters and actions during the period, similar to those described earlier.
For investments categorized as Level 3, the Committee monitors information similar to that described above, which may include: (i) data specific to the issuer or comparable issuers, (ii) general market or specific sector news and (iii) quoted prices and specific or similar security transactions. The Committee considers this data and any changes from prior periods in order to assess the reasonableness of observable and unobservable inputs, any assumptions or internal models used to value those securities and changes in fair value. This data is also used to corroborate, when available, information received from approved pricing vendors and brokers. Various factors impact the frequency of monitoring this information (which may occur as often as daily). However, the Committee may determine that changes to inputs, assumptions and models are not required as a result of the monitoring procedures performed.
The accompanying Notes to Financial Statements are an integral part of this statement.
Annual Report 2012
40
Columbia Strategic Income Fund
Portfolio of Investments (continued)
October 31, 2012
Fair Value Measurements (continued)
The following table is a summary of the inputs used to value the Fund's investments at October 31, 2012:
Description | | Level 1
Quoted Prices in Active
Markets for Identical
Assets ($) | |
Level 2
Other Significant
Observable Inputs ($) | |
Level 3
Significant
Unobservable Inputs ($) | |
Total ($) | |
Bonds | |
Corporate Bonds & Notes | |
Banking | | | — | | | | 24,113,746 | | | | 880,571 | | | | 24,994,317 | | |
Metals | | | — | | | | 40,643,679 | | | | 3,139 | | | | 40,646,818 | | |
All Other Industries | | | — | | | | 1,197,035,492 | | | | — | | | | 1,197,035,492 | | |
Residential Mortgage-Backed
Securities — Agency | | | — | | | | 357,577,746 | | | | 4,815,000 | | | | 362,392,746 | | |
Residential Mortgage-Backed
Securities — Non-Agency | | | — | | | | 43,315,366 | | | | 55,445,069 | | | | 98,760,435 | | |
Commercial Mortgage-Backed
Securities — Non-Agency | | | — | | | | 86,294,171 | | | | — | | | | 86,294,171 | | |
Asset-Backed Securities — Non-Agency | | | — | | | | 1,456,476 | | | | — | | | | 1,456,476 | | |
Inflation-Indexed Bonds | | | — | | | | 26,805,674 | | | | — | | | | 26,805,674 | | |
U.S. Treasury Obligations | | | 160,746,196 | | | | 5,952,882 | | | | — | | | | 166,699,078 | | |
Foreign Government Obligations | | | — | | | | 606,388,402 | | | | 2,008,370 | | | | 608,396,772 | | |
Municipal Bonds | | | — | | | | 1,692,000 | | | | — | | | | 1,692,000 | | |
Total Bonds | | | 160,746,196 | | | | 2,391,275,634 | | | | 63,152,149 | | | | 2,615,173,979 | | |
Senior Loans | |
Aerospace & Defense | | | — | | | | 752,677 | | | | 184,538 | | | | 937,215 | | |
Brokerage | | | — | | | | 251,720 | | | | 431,375 | | | | 683,095 | | |
Building Materials | | | — | | | | 1,528,304 | | | | 494,984 | | | | 2,023,288 | | |
Chemicals | | | — | | | | 4,676,905 | | | | 318,028 | | | | 4,994,933 | | |
Construction Machinery | | | — | | | | 648,898 | | | | 426,670 | | | | 1,075,568 | | |
Electric | | | — | | | | 4,481,721 | | | | 250,766 | | | | 4,732,487 | | |
Gaming | | | — | | | | 2,423,104 | | | | 1,637,985 | | | | 4,061,089 | | |
Media Non-Cable | | | — | | | | 8,057,694 | | | | 1,835,053 | | | | 9,892,747 | | |
Other Industry | | | — | | | | 1,543,244 | | | | 729,595 | | | | 2,272,839 | | |
Technology | | | — | | | | 7,680,109 | | | | 419,750 | | | | 8,099,859 | | |
All Other Industries | | | — | | | | 65,511,146 | | | | — | | | | 65,511,146 | | |
Total Senior Loans | | | — | | | | 97,555,522 | | | | 6,728,744 | | | | 104,284,266 | | |
Equity Securities | |
Common Stocks | |
Consumer Discretionary | | | 41,343 | | | | 113,750 | | | | — | | | | 155,093 | | |
Information Technology | | | — | | | | — | | | | 3,189 | | | | 3,189 | | |
Materials | | | 203,202 | | | | — | | | | 173,776 | | | | 376,978 | | |
Telecommunication Services | | | 8,160 | | | | — | | | | — | | | | 8,160 | | |
The accompanying Notes to Financial Statements are an integral part of this statement.
Annual Report 2012
41
Columbia Strategic Income Fund
Portfolio of Investments (continued)
October 31, 2012
Fair Value Measurements (continued)
Description | | Level 1
Quoted Prices in Active
Markets for Identical
Assets ($) | |
Level 2
Other Significant
Observable Inputs ($) | |
Level 3
Significant
Unobservable Inputs ($) | |
Total ($) | |
Warrants | |
Energy | | | — | | | | 120,745 | | | | — | | | | 120,745 | | |
Total Equity Securities | | | 252,705 | | | | 234,495 | | | | 176,965 | | | | 664,165 | | |
Short-Term Securities | |
Treasury Bills | | | — | | | | 3,089,126 | | | | — | | | | 3,089,126 | | |
Total Short-Term Securities | | | — | | | | 3,089,126 | | | | — | | | | 3,089,126 | | |
Other | | | | | | | | | |
Money Market Funds | | | 140,193,065 | | | | — | | | | — | | | | 140,193,065 | | |
Investments of Cash Collateral
Received for Securities on Loan | | | — | | | | 283,165,330 | | | | — | | | | 283,165,330 | | |
Total Other | | | 140,193,065 | | | | 283,165,330 | | | | — | | | | 423,358,395 | | |
Investments in Securities | | | 301,191,966 | | | | 2,775,320,107 | | | | 70,057,858 | | | | 3,146,569,931 | | |
Forward Sale Commitments Liability | | | — | | | | (21,575,000 | ) | | | — | | | | (21,575,000 | ) | |
Derivatives | | | | | | | | | |
Assets | | | | | | | | | |
Futures Contracts | | | 16,356 | | | | — | | | | — | | | | 16,356 | | |
Forward Foreign Currency
Exchange Contracts | | | — | | | | 364,675 | | | | — | | | | 364,675 | | |
Liabilities | |
Futures Contracts | | | (828,672 | ) | | | — | | | | — | | | | (828,672 | ) | |
Forward Foreign Currency
Exchange Contracts | | | — | | | | (609,144 | ) | | | — | | | | (609,144 | ) | |
Swap Contracts | | | — | | | | (195,078 | ) | | | — | | | | (195,078 | ) | |
Total | | | 300,379,650 | | | | 2,753,305,560 | | | | 70,057,858 | | | | 3,123,743,068 | | |
See the Portfolio of Investments for all investment classifications not indicated in the table.
The Fund's assets assigned to the Level 2 input category are generally valued using the market approach, in which a security's value is determined through reference to prices and information from market transactions for similar or identical assets.
The Fund's assets assigned to the Level 3 category are valued utilizing the valuation technique deemed the most appropriate in the circumstances.
Residential Mortgage Backed Securities, Corporate Bonds, Senior Loans, Common Stock and Foreign Government Obligations classified as Level 3 are valued using the market approach and utilize single market quotations from broker dealers which may have included, but not limited to, the distressed nature of the security and observable transactions for similar assets in the market. Significant increases (decreases) to any of these inputs would result in a significantly lower (higher) fair value measurement.
Corporate Bonds classified as Level 3 are valued using a market approach. To determine fair value for these securities, management considered various factors which may have included, but were not limited to, trades of similar securities, estimated earnings of the respective company, market multiples derived from a set of comparable companies, and the position of the security within the respective company's capital structure. Significant increases (decreases) to any of these inputs would result in a significantly lower (higher) fair value measurement. Generally, a change in estimated earnings of the respective company may result in a change to the comparable companies and market multiples utilized.
There were no transfers of financial assets between Levels 1 and 2 during the period.
Derivative instruments are valued at unrealized appreciation (depreciation).
The accompanying Notes to Financial Statements are an integral part of this statement.
Annual Report 2012
42
Columbia Strategic Income Fund
Portfolio of Investments (continued)
October 31, 2012
Fair Value Measurements (continued)
The following table is a reconciliation of Level 3 assets for which significant observable and/or unobservable inputs were used to determine fair value.
| | | Corporate
Bonds &
Notes ($) | | Residential
Mortgage-
Backed
Securities —
Agency ($) | | Residential
Mortgage-
Backed
Securities —
Non-Agency ($) | | Foreign
Government
Obligations ($) | | Senior
Loans ($) | | Common
Stocks ($) | | Warrants ($) | | Total ($) | |
Balance as of
May 31, 2012 | | | 769,906 | | | | — | | | | 16,349,555 | | | | 1,919,109 | | | | 5,264,663 | | | | 214,693 | | | | 466 | | | | 24,518,392 | | |
Accrued discounts/
premiums | | | 355 | | | | — | | | | — | | | | 23,410 | | | | 27,298 | | | | — | | | | — | | | | 51,063 | | |
Realized gain (loss) | | | — | | | | — | | | | 6,611 | | | | — | | | | 5,022 | | | | (5,287 | ) | | | — | | | | 6,346 | | |
Change in
unrealized
appreciation
(depreciation)(a) | | | 113,449 | | | | — | | | | 80,622 | | | | 65,851 | | | | (54,190 | ) | | | 4,360 | | | | — | | | | 210,092 | | |
Sales | | | — | | | | — | | | | (4,176,719 | ) | | | — | | | | (461,556 | ) | | | — | | | | (466 | ) | | | (4,638,741 | ) | |
Purchases | | | — | | | | 4,815,000 | | | | 43,185,000 | | | | — | | | | 935,898 | | | | — | | | | — | | | | 48,935,898 | | |
Transfers into
Level 3 | | | — | | | | — | | | | — | | | | — | | | | 2,999,637 | | | | — | | | | — | | | | 2,999,637 | | |
Transfers out of
Level 3 | | | — | | | | — | | | | — | | | | — | | | | (1,988,028 | ) | | | (36,801 | ) | | | — | | | | (2,024,829 | ) | |
Balance as of
October 31, 2012 | | | 883,710 | | | | 4,815,000 | | | | 55,445,069 | | | | 2,008,370 | | | | 6,728,744 | | | | 176,965 | | | | — | | | | 70,057,858 | | |
(a) Change in unrealized appreciation (depreciation) relating to securities held at October 31, 2012 was $209,691, which is comprised of Corporate Bonds & Notes of $113,449, Residential Mortgage-Backed Securities — Non-Agency of $80,649, Foreign Government Obligations of $65,851, Senior Loans of $(50,256) and Common Stocks of $(2).
The Fund does not hold any significant investments with unobservable inputs which are categorized as Level 3.
Financial Assets were transferred from Level 2 to Level 3 due to utilizing a single market quotation from a broker dealer. As a result, as of period end, management determined to value the security under consistently applied procedures established by and under the general supervision of the Board of Trustees.
Financial assets were transferred from Level 3 to Level 2 as observable market inputs were utilized and management's determination that there was sufficient, reliable and observable market data to value these assets as of period end.
Transfers in and/or out of Level 3 are determined based on the fair value at the beginning of the period for security positions held throughout the period.
The accompanying Notes to Financial Statements are an integral part of this statement.
Annual Report 2012
43
Columbia Strategic Income Fund
Statement of Assets and Liabilities
October 31, 2012
Assets | |
Investments, at value* | |
Unaffiliated issuers (identified cost $2,550,596,596) | | $ | 2,723,211,536 | | |
Affiliated issuers (identified cost $140,193,065) | | | 140,193,065 | | |
Investment of cash collateral received for securities on loan | |
Short-term securities (identified cost $79,991,195) | | | 79,991,195 | | |
Repurchase agreements (identified cost $203,174,135) | | | 203,174,135 | | |
Total investments (identified cost $2,973,954,991) | | | 3,146,569,931 | | |
Cash | | | 1,104,370 | | |
Foreign currency (identified cost $4,244,917) | | | 4,243,375 | | |
Unrealized appreciation on forward foreign currency exchange contracts | | | 364,675 | | |
Receivable for: | |
Investments sold | | | 26,170,718 | | |
Investments sold on a delayed delivery basis | | | 60,807,274 | | |
Capital shares sold | | | 3,746,904 | | |
Dividends | | | 23,156 | | |
Interest | | | 34,748,482 | | |
Reclaims | | | 69,979 | | |
Prepaid expenses | | | 31,904 | | |
Trustees' deferred compensation plan | | | 163,087 | | |
Total assets | | | 3,278,043,855 | | |
Liabilities | |
Forward sale commitments, at value (proceeds $21,607,812) | | | 21,575,000 | | |
Due upon return of securities on loan | | | 283,165,330 | | |
Unrealized depreciation on forward foreign currency exchange contracts | | | 609,144 | | |
Unrealized depreciation on swap contracts | | | 195,078 | | |
Payable for: | |
Investments purchased | | | 4,755,853 | | |
Investments purchased on a delayed delivery basis | | | 170,826,075 | | |
Capital shares purchased | | | 3,194,014 | | |
Variation margin on futures contracts | | | 484,303 | | |
Investment management fees | | | 195,645 | | |
Distribution and service fees | | | 88,269 | | |
Foreign capital gains taxes deferred | | | 183,022 | | |
Transfer agent fees | | | 443,668 | | |
Administration fees | | | 23,870 | | |
Plan administration fees | | | 6 | | |
Compensation of board members | | | 45,271 | | |
Chief compliance officer expenses | | | 723 | | |
Expense reimbursement due to Investment Manager | | | 104 | | |
Other expenses | | | 177,176 | | |
Trustees' deferred compensation plan | | | 163,087 | | |
Total liabilities | | | 486,125,638 | | |
Net assets applicable to outstanding capital stock | | $ | 2,791,918,217 | | |
The accompanying Notes to Financial Statements are an integral part of this statement.
Annual Report 2012
44
Columbia Strategic Income Fund
Statement of Assets and Liabilities (continued)
October 31, 2012
Represented by | |
Paid-in capital | | $ | 2,608,779,743 | | |
Undistributed net investment income | | | 5,510,922 | | |
Accumulated net realized gain | | | 6,366,526 | | |
Unrealized appreciation (depreciation) on: | |
Investments | | | 172,614,940 | | |
Forward sale commitments | | | 32,812 | | |
Foreign currency translations | | | 48,159 | | |
Forward foreign currency exchange contracts | | | (244,469 | ) | |
Futures contracts | | | (812,316 | ) | |
Swap contracts | | | (195,078 | ) | |
Foreign capital gains tax | | | (183,022 | ) | |
Total — representing net assets applicable to outstanding capital stock | | $ | 2,791,918,217 | | |
*Value of securities on loan | | $ | 338,559,581 | | |
Class A | |
Net assets | | $ | 1,492,619,702 | | |
Shares outstanding | | | 232,818,034 | | |
Net asset value per share | | $ | 6.41 | | |
Maximum offering price per share(a) | | $ | 6.73 | | |
Class B | |
Net assets | | $ | 49,873,473 | | |
Shares outstanding | | | 7,783,019 | | |
Net asset value per share | | $ | 6.41 | | |
Class C | |
Net assets | | $ | 263,735,729 | | |
Shares outstanding | | | 41,120,168 | | |
Net asset value per share | | $ | 6.41 | | |
Class K(b) | |
Net assets | | $ | 182,394 | | |
Shares outstanding | | | 28,816 | | |
Net asset value per share | | $ | 6.33 | | |
Class R | |
Net assets | | $ | 218,499 | | |
Shares outstanding | | | 33,920 | | |
Net asset value per share | | $ | 6.44 | | |
Class R5 | |
Net assets | | $ | 8,166 | | |
Shares outstanding | | | 1,290 | | |
Net asset value per share | | $ | 6.33 | | |
Class W | |
Net assets | | $ | 2,599 | | |
Shares outstanding | | | 406 | | |
Net asset value per share(c) | | $ | 6.41 | | |
Class Z | |
Net assets | | $ | 985,277,655 | | |
Shares outstanding | | | 155,662,946 | | |
Net asset value per share | | $ | 6.33 | | |
(a) The maximum offering price per share is calculated by dividing the net asset value by 1.0 minus the maximum sales charge of 4.75%.
(b) Effective October 25, 2012, Class R4 shares were renamed Class K shares.
(c) Net asset value per share rounds to this amount due to fractional shares outstanding.
The accompanying Notes to Financial Statements are an integral part of this statement.
Annual Report 2012
45
Columbia Strategic Income Fund
| | | Year Ended
October 31, 2012(a) | | Year Ended
May 31, 2012 | |
Net investment income | |
Income: | |
Dividends — unaffiliated issuers | | $ | 1,712 | | | $ | 155,613 | | |
Dividends — affiliated issuers | | | 133,671 | | | | 122,038 | | |
Interest | | | 55,943,392 | | | | 134,143,693 | | |
Income from securities lending — net | | | 605,876 | | | | 1,145,654 | | |
Foreign taxes withheld | | | (39,758 | ) | | | (479,077 | ) | |
Total income | | | 56,644,893 | | | | 135,087,921 | | |
Expenses: | |
Investment management fees | | | 5,668,830 | | | | 11,871,078 | | |
Distribution fees | |
Class B | | | 165,054 | | | | 488,995 | | |
Class C | | | 788,635 | | | | 1,626,607 | | |
Class R | | | 296 | | | | 141 | | |
Service fees | |
Class A | | | 1,501,480 | | | | 3,230,326 | | |
Class B | | | 55,018 | | | | 163,250 | | |
Class C | | | 262,160 | | | | 541,936 | | |
Class W | | | 3 | | | | 6 | | |
Transfer agent fees | |
Class A | | | 979,138 | | | | 2,084,576 | | |
Class B | | | 35,820 | | | | 108,264 | | |
Class C | | | 170,996 | | | | 348,096 | | |
Class K(b) | | | 41 | | | | 71 | | |
Class R | | | 97 | | | | 48 | | |
Class R5 | | | 39 | | | | 79 | | |
Class W | | | 2 | | | | 4 | | |
Class Z | | | 609,468 | | | | 1,145,218 | | |
Administration fees | | | 691,881 | | | | 1,450,327 | | |
Plan administration fees | |
Class K(b) | | | 213 | | | | 534 | | |
Compensation of board members | | | 23,715 | | | | 83,177 | | |
Custodian fees | | | 63,129 | | | | 152,871 | | |
Printing and postage fees | | | 106,493 | | | | 159,848 | | |
Registration fees | | | 98,434 | | | | 202,222 | | |
Professional fees | | | 75,829 | | | | 134,390 | | |
Chief compliance officer expenses | | | 1,140 | | | | 1,164 | | |
Other | | | 14,252 | | | | 66,229 | | |
Total expenses | | | 11,312,163 | | | | 23,859,457 | | |
Fees waived or expenses reimbursed by Investment Manager and its affiliates | | | (66,617 | ) | | | (182,250 | ) | |
Fees waived by Distributor — Class C | | | (159,451 | ) | | | (323,325 | ) | |
Expense reductions | | | (8,026 | ) | | | (8,823 | ) | |
Total net expenses | | | 11,078,069 | | | | 23,345,059 | | |
Net investment income | | | 45,566,824 | | | | 111,742,862 | | |
Realized and unrealized gain (loss) — net | |
Net realized gain (loss) on: | |
Investments | | | 35,783,362 | | | | 43,584,287 | | |
Foreign currency translations | | | (257,930 | ) | | | (765,984 | ) | |
Forward foreign currency exchange contracts | | | 2,709,501 | | | | 2,394,851 | | |
Futures contracts | | | (1,791,152 | ) | | | (21,885,053 | ) | |
Options contracts written | | | 299,821 | | | | 986,180 | | |
Swap contracts | | | (75,133 | ) | | | (149,042 | ) | |
Net realized gain | | | 36,668,469 | | | | 24,165,239 | | |
Net change in unrealized appreciation (depreciation) on: | |
Investments | | | 86,430,627 | | | | (35,649,065 | ) | |
Forward sale commitments | | | 32,812 | | | | — | | |
Foreign currency translations | | | 606,785 | | | | (555,881 | ) | |
Forward foreign currency exchange contracts | | | (1,313,869 | ) | | | 879,748 | | |
Futures contracts | | | 872,549 | | | | (1,725,754 | ) | |
Swap contracts | | | (101,884 | ) | | | 151,791 | | |
Foreign capital gains tax | | | 65,941 | | | | (248,963 | ) | |
Net change in unrealized appreciation (depreciation) | | | 86,592,961 | | | | (37,148,124 | ) | |
Net realized and unrealized gain (loss) | | | 123,261,430 | | | | (12,982,885 | ) | |
Net increase in net assets resulting from operations | | $ | 168,828,254 | | | $ | 98,759,977 | | |
(a) For the period from June 1, 2012 to October 31, 2012. During the period, the Fund's fiscal year end was changed from May 31 to October 31.
(b) Effective October 25, 2012, Class R4 shares were renamed Class K shares.
The accompanying Notes to Financial Statements are an integral part of this statement.
Annual Report 2012
46
Columbia Strategic Income Fund
Statement of Changes in Net Assets
| | | Year Ended
October 31, 2012(a) | | Year Ended
May 31,
2012 | | Year Ended
May 31,
2011(b)(c) | |
Operations | |
Net investment income | | $ | 45,566,824 | | | $ | 111,742,862 | | | $ | 101,752,453 | | |
Net realized gain | | | 36,668,469 | | | | 24,165,239 | | | | 114,391,303 | | |
Net change in unrealized appreciation (depreciation) | | | 86,592,961 | | | | (37,148,124 | ) | | | 28,649,553 | | |
Net increase in net assets resulting from operations | | | 168,828,254 | | | | 98,759,977 | | | | 244,793,309 | | |
Distributions to shareholders | |
Net investment income | |
Class A | | | (24,628,452 | ) | | | (66,539,026 | ) | | | (69,981,175 | ) | |
Class B | | | (727,074 | ) | | | (2,824,433 | ) | | | (4,835,348 | ) | |
Class C | | | (3,678,258 | ) | | | (9,849,005 | ) | | | (12,463,225 | ) | |
Class K(d) | | | (3,520 | ) | | | (11,357 | ) | | | (32 | ) | |
Class R | | | (2,410 | ) | | | (1,222 | ) | | | (129 | ) | |
Class R5 | | | (3,333 | ) | | | (15,349 | ) | | | (33 | ) | |
Class W | | | (44 | ) | | | (129 | ) | | | (133 | ) | |
Class Z | | | (16,713,389 | ) | | | (38,835,078 | ) | | | (49,909,500 | ) | |
Total distributions to shareholders | | | (45,756,480 | ) | | | (118,075,599 | ) | | | (137,189,575 | ) | |
Increase (decrease) in net assets from capital stock activity | | | 199,890,800 | | | | 623,615,952 | | | | (259,350,846 | ) | |
Total increase (decrease) in net assets | | | 322,962,574 | | | | 604,300,330 | | | | (151,747,112 | ) | |
Net assets at beginning of year | | | 2,468,955,643 | | | | 1,864,655,313 | | | | 2,016,402,425 | | |
Net assets at end of year | | $ | 2,791,918,217 | | | $ | 2,468,955,643 | | | $ | 1,864,655,313 | | |
Undistributed net investment income | | $ | 5,510,922 | | | $ | 2,649,575 | | | $ | 4,632,213 | | |
(a) For the period from June 1, 2012 to October 31, 2012. During the period, the Fund's fiscal year end was changed from May 31 to October 31.
(b) Class R and Class W shares are for the period from September 27, 2010 (commencement of operations) to May 31, 2011.
(c) Class K and Class R5 shares are for the period from March 7, 2011 (commencement of operations) to May 31, 2011.
(d) Effective October 25, 2012, Class R4 shares were renamed Class K shares.
The accompanying Notes to Financial Statements are an integral part of this statement.
Annual Report 2012
47
Columbia Strategic Income Fund
Statement of Changes in Net Assets
| | | Year Ended October 31,
2012(a) | | Year Ended May 31,
2012 | | Year Ended May 31,
2011(b)(c) | |
| | | Shares | | Dollars ($) | | Shares | | Dollars ($) | | Shares | | Dollars ($) | |
Capital stock activity | |
Class A shares | |
Subscriptions(d) | | | 21,601,647 | | | | 136,516,417 | | | | 52,489,779 | | | | 320,916,293 | | | | 22,444,538 | | | | 136,451,728 | | |
Fund merger | | | — | | | | — | | | | 50,379,122 | | | | 310,385,658 | | | | — | | | | — | | |
Distributions reinvested | | | 3,438,283 | | | | 21,696,932 | | | | 8,155,920 | | | | 49,568,948 | | | | 7,415,133 | | | | 44,784,581 | | |
Redemptions | | | (15,660,207 | ) | | | (98,920,906 | ) | | | (42,689,073 | ) | | | (260,445,140 | ) | | | (48,368,248 | ) | | | (294,113,944 | ) | |
Net increase (decrease) | | | 9,379,723 | | | | 59,292,443 | | | | 68,335,748 | | | | 420,425,759 | | | | (18,508,577 | ) | | | (112,877,635 | ) | |
Class B shares | |
Subscriptions | | | 273,212 | | | | 1,721,309 | | | | 976,504 | | | | 5,951,250 | | | | 715,729 | | | | 4,343,096 | | |
Fund merger | | | — | | | | — | | | | 3,427,244 | | | | 21,120,603 | | | | — | | | | — | | |
Distributions reinvested | | | 89,638 | | | | 565,140 | | | | 327,055 | | | | 1,984,880 | | | | 423,625 | | | | 2,552,887 | | |
Redemptions(d) | | | (1,680,285 | ) | | | (10,576,032 | ) | | | (5,644,122 | ) | | | (34,428,362 | ) | | | (6,851,911 | ) | | | (41,582,909 | ) | |
Net decrease | | | (1,317,435 | ) | | | (8,289,583 | ) | | | (913,319 | ) | | | (5,371,629 | ) | | | (5,712,557 | ) | | | (34,686,926 | ) | |
Class C shares | |
Subscriptions | | | 5,053,632 | | | | 31,881,610 | | | | 10,704,507 | | | | 65,378,318 | | | | 4,802,590 | | | | 29,231,386 | | |
Fund merger | | | — | | | | — | | | | 3,538,608 | | | | 21,808,409 | | | | — | | | | — | | |
Distributions reinvested | | | 431,277 | | | | 2,724,318 | | | | 1,040,533 | | | | 6,326,289 | | | | 1,104,074 | | | | 6,665,128 | | |
Redemptions | | | (2,692,272 | ) | | | (16,999,819 | ) | | | (7,096,976 | ) | | | (43,274,133 | ) | | | (9,369,474 | ) | | | (56,956,485 | ) | |
Net increase (decrease) | | | 2,792,637 | | | | 17,606,109 | | | | 8,186,672 | | | | 50,238,883 | | | | (3,462,810 | ) | | | (21,059,971 | ) | |
Class K shares(e) | |
Subscriptions | | | — | | | | — | | | | — | | | | — | | | | 416 | | | | 2,500 | | |
Fund merger | | | — | | | | — | | | | 36,339 | | | | 221,227 | | | | — | | | | — | | |
Distributions reinvested | | | 543 | | | | 3,378 | | | | 1,778 | | | | 10,674 | | | | — | | | | — | | |
Redemptions | | | (8,074 | ) | | | (50,302 | ) | | | (2,186 | ) | | | (13,236 | ) | | | — | | | | — | | |
Net increase (decrease) | | | (7,531 | ) | | | (46,924 | ) | | | 35,931 | | | | 218,665 | | | | 416 | | | | 2,500 | | |
Class R shares | |
Subscriptions | | | 28,755 | | | | 182,539 | | | | 10,170 | | | | 62,779 | | | | 406 | | | | 2,500 | | |
Fund merger | | | — | | | | — | | | | 859 | | | | 5,322 | | | | — | | | | — | | |
Distributions reinvested | | | 343 | | | | 2,181 | | | | 111 | | | | 686 | | | | — | | | | — | | |
Redemptions | | | (6,719 | ) | | | (42,801 | ) | | | (5 | ) | | | (31 | ) | | | — | | | | — | | |
Net increase | | | 22,379 | | | | 141,919 | | | | 11,135 | | | | 68,756 | | | | 406 | | | | 2,500 | | |
Class R5 shares | |
Subscriptions | | | — | | | | — | | | | — | | | | — | | | | 416 | | | | 2,500 | | |
Fund merger | | | — | | | | — | | | | 45,399 | | | | 276,592 | | | | — | | | | — | | |
Redemptions | | | (44,525 | ) | | | (279,263 | ) | | | — | | | | — | | | | — | | | | — | | |
Net increase (decrease) | | | (44,525 | ) | | | (279,263 | ) | | | 45,399 | | | | 276,592 | | | | 416 | | | | 2,500 | | |
Class W shares | |
Subscriptions | | | — | | | | — | | | | — | | | | — | | | | 430 | | | | 2,650 | | |
Redemptions | | | — | | | | — | | | | — | | | | — | | | | (24 | ) | | | (151 | ) | |
Net increase | | | — | | | | — | | | | — | | | | — | | | | 406 | | | | 2,499 | | |
The accompanying Notes to Financial Statements are an integral part of this statement.
Annual Report 2012
48
Columbia Strategic Income Fund
Statement of Changes in Net Assets (continued)
| | | Year Ended October 31,
2012(a) | | Year Ended May 31,
2012 | | Year Ended May 31,
2011(b)(c) | |
| | | Shares | | Dollars ($) | | Shares | | Dollars ($) | | Shares | | Dollars ($) | |
Capital stock activity (continued) | |
Class Z shares | |
Subscriptions | | | 31,757,630 | | | | 198,575,251 | | | | 56,110,241 | | | | 339,467,116 | | | | 20,596,037 | | | | 124,112,385 | | |
Distributions reinvested | | | 534,916 | | | | 3,334,648 | | | | 1,329,496 | | | | 7,983,778 | | | | 1,743,711 | | | | 10,411,117 | | |
Redemptions | | | (11,302,670 | ) | | | (70,443,800 | ) | | | (31,284,926 | ) | | | (189,691,968 | ) | | | (37,504,048 | ) | | | (225,259,815 | ) | |
Net increase (decrease) | | | 20,989,876 | | | | 131,466,099 | | | | 26,154,811 | | | | 157,758,926 | | | | (15,164,300 | ) | | | (90,736,313 | ) | |
Total net increase (decrease) | | | 31,815,124 | | | | 199,890,800 | | | | 101,856,377 | | | | 623,615,952 | | | | (42,846,600 | ) | | | (259,350,846 | ) | |
(a) For the period from June 1, 2012 to October 31, 2012. During the period, the Fund's fiscal year end was changed from May 31 to October 31.
(b) Class R and Class W shares are for the period from September 27, 2010 (commencement of operations) to May 31, 2011.
(c) Class K and Class R5 shares are for the period from March 7, 2011 (commencement of operations) to May 31, 2011.
(d) Includes conversions of Class B shares to Class A shares, if any.
(e) Effective October 25, 2012, Class R4 shares were renamed Class K shares.
The accompanying Notes to Financial Statements are an integral part of this statement.
Annual Report 2012
49
Columbia Strategic Income Fund
The following tables are intended to help you understand the Fund's financial performance. Certain information reflects financial results for a single share of a class held for the periods shown. Per share net investment income (loss) amounts are calculated based on average shares outstanding during the period. Total return assumes reinvestment of all dividends and distributions. Total return does not reflect payment of sales charges, if any, and is not annualized for periods of less than one year.
| | | Year Ended
October 31, | |
Year Ended May 31, | |
Class A | | 2012(a) | | 2012 | | 2011 | | 2010 | | 2009 | | 2008 | |
Per share data | |
Net asset value, beginning of period | | $ | 6.11 | | | $ | 6.16 | | | $ | 5.84 | | | $ | 5.40 | | | $ | 5.91 | | | $ | 6.01 | | |
Income from investment operations: | |
Net investment income | | | 0.11 | | | | 0.30 | | | | 0.32 | | | | 0.29 | | | | 0.29 | | | | 0.31 | | |
Net realized and unrealized gain (loss) | | | 0.30 | | | | (0.04 | ) | | | 0.43 | | | | 0.41 | | | | (0.41 | ) | | | (0.05 | ) | |
Total from investment operations | | | 0.41 | | | | 0.26 | | | | 0.75 | | | | 0.70 | | | | (0.12 | ) | | | 0.26 | | |
Less distributions to shareholders: | |
Net investment income | | | (0.11 | ) | | | (0.31 | ) | | | (0.43 | ) | | | (0.26 | ) | | | (0.38 | ) | | | (0.36 | ) | |
Tax return of capital | | | — | | | | — | | | | — | | | | — | | | | (0.01 | ) | | | — | | |
Total distributions to shareholders | | | (0.11 | ) | | | (0.31 | ) | | | (0.43 | ) | | | (0.26 | ) | | | (0.39 | ) | | | (0.36 | ) | |
Net asset value, end of period | | $ | 6.41 | | | $ | 6.11 | | | $ | 6.16 | | | $ | 5.84 | | | $ | 5.40 | | | $ | 5.91 | | |
Total return | | | 6.72 | % | | | 4.44 | % | | | 13.21 | % | | | 13.14 | % | | | (1.79 | %) | | | 4.47 | % | |
Ratios to average net assets(b) | |
Expenses prior to fees waived or expenses
reimbursed | | | 1.02 | %(c) | | | 1.03 | % | | | 1.01 | % | | | 0.99 | % | | | 0.98 | % | | | 0.95 | % | |
Net expenses after fees waived or expenses
reimbursed(d) | | | 1.02 | %(c)(e) | | | 1.02 | %(e) | | | 1.00 | %(e) | | | 0.99 | %(e) | | | 0.98 | %(e) | | | 0.95 | %(e) | |
Net investment income | | | 4.11 | %(c)(e) | | | 4.89 | %(e) | | | 5.22 | %(e) | | | 5.09 | %(e) | | | 5.46 | %(e) | | | 5.24 | %(e) | |
Supplemental data | |
Net assets, end of period (in thousands) | | $ | 1,492,620 | | | $ | 1,365,605 | | | $ | 956,132 | | | $ | 1,013,941 | | | $ | 913,087 | | | $ | 865,282 | | |
Portfolio turnover | | | 48 | %(f) | | | 83 | %(f) | | | 128 | % | | | 50 | % | | | 43 | % | | | 41 | % | |
Notes to Financial Highlights
(a) For the period from June 1, 2012 to October 31, 2012. During the period, the Fund's fiscal year end was changed from May 31 to October 31.
(b) In addition to the fees and expenses which the Fund bears directly, the Fund indirectly bears a pro rata share of the fees and expenses of the acquired funds in which it invests. Such indirect expenses are not included in the reported expense ratios.
(c) Annualized.
(d) The Investment Manager and certain of its affiliates agreed to waive/reimburse certain fees and expenses, if applicable.
(e) The benefits derived from expense reductions had an impact of less than 0.01%.
(f) Includes mortgage dollar rolls. If mortgage dollar roll transactions were excluded, the portfolio turnover would have been 25% and 63% for the period ended October 31, 2012 and the year May 31, 2012, respectively.
The accompanying Notes to Financial Statements are an integral part of this statement.
Annual Report 2012
50
Columbia Strategic Income Fund
Financial Highlights (continued)
| | | Year Ended
October 31, | |
Year Ended May 31, | |
Class B | | 2012(a) | | 2012 | | 2011 | | 2010 | | 2009 | | 2008 | |
Per share data | |
Net asset value, beginning of period | | $ | 6.11 | | | $ | 6.16 | | | $ | 5.84 | | | $ | 5.40 | | | $ | 5.91 | | | $ | 6.00 | | |
Income from investment operations: | |
Net investment income | | | 0.09 | | | | 0.25 | | | | 0.27 | | | | 0.25 | | | | 0.25 | | | | 0.27 | | |
Net realized and unrealized gain (loss) | | | 0.30 | | | | (0.03 | ) | | | 0.43 | | | | 0.41 | | | | (0.41 | ) | | | (0.05 | ) | |
Total from investment operations | | | 0.39 | | | | 0.22 | | | | 0.70 | | | | 0.66 | | | | (0.16 | ) | | | 0.22 | | |
Less distributions to shareholders: | |
Net investment income | | | (0.09 | ) | | | (0.27 | ) | | | (0.38 | ) | | | (0.22 | ) | | | (0.34 | ) | | | (0.31 | ) | |
Tax return of capital | | | — | | | | — | | | | — | | | | — | | | | (0.01 | ) | | | — | | |
Total distributions to shareholders | | | (0.09 | ) | | | (0.27 | ) | | | (0.38 | ) | | | (0.22 | ) | | | (0.35 | ) | | | (0.31 | ) | |
Net asset value, end of period | | $ | 6.41 | | | $ | 6.11 | | | $ | 6.16 | | | $ | 5.84 | | | $ | 5.40 | | | $ | 5.91 | | |
Total return | | | 6.39 | % | | | 3.65 | % | | | 12.37 | % | | | 12.30 | % | | | (2.52 | %) | | | 3.86 | % | |
Ratios to average net assets(b) | |
Expenses prior to fees waived or expenses
reimbursed | | | 1.77 | %(c) | | | 1.78 | % | | | 1.76 | % | | | 1.74 | % | | | 1.73 | % | | | 1.70 | % | |
Net expenses after fees waived or expenses
reimbursed(d) | | | 1.77 | %(c)(e) | | | 1.77 | %(e) | | | 1.75 | %(e) | | | 1.74 | %(e) | | | 1.73 | %(e) | | | 1.70 | %(e) | |
Net investment income | | | 3.37 | %(c)(e) | | | 4.15 | %(e) | | | 4.47 | %(e) | | | 4.43 | %(e) | | | 4.71 | %(e) | | | 4.50 | %(e) | |
Supplemental data | |
Net assets, end of period (in thousands) | | $ | 49,873 | | | $ | 55,594 | | | $ | 61,684 | | | $ | 91,784 | | | $ | 122,915 | | | $ | 169,001 | | |
Portfolio turnover | | | 48 | %(f) | | | 83 | %(f) | | | 128 | % | | | 50 | % | | | 43 | % | | | 41 | % | |
Notes to Financial Highlights
(a) For the period from June 1, 2012 to October 31, 2012. During the period, the Fund's fiscal year end was changed from May 31 to October 31.
(b) In addition to the fees and expenses which the Fund bears directly, the Fund indirectly bears a pro rata share of the fees and expenses of the acquired funds in which it invests. Such indirect expenses are not included in the reported expense ratios.
(c) Annualized.
(d) The Investment Manager and certain of its affiliates agreed to waive/reimburse certain fees and expenses, if applicable.
(e) The benefits derived from expense reductions had an impact of less than 0.01%.
(f) Includes mortgage dollar rolls. If mortgage dollar roll transactions were excluded, the portfolio turnover would have been 25% and 63% for the period ended October 31, 2012 and the year May 31, 2012, respectively.
The accompanying Notes to Financial Statements are an integral part of this statement.
Annual Report 2012
51
Columbia Strategic Income Fund
Financial Highlights (continued)
| | | Year Ended
October 31, | |
Year Ended May 31, | |
Class C | | 2012(a) | | 2012 | | 2011 | | 2010 | | 2009 | | 2008 | |
Per share data | |
Net asset value, beginning of period | | $ | 6.11 | | | $ | 6.17 | | | $ | 5.84 | | | $ | 5.41 | | | $ | 5.91 | | | $ | 6.01 | | |
Income from investment operations: | |
Net investment income | | | 0.09 | | | | 0.26 | | | | 0.28 | | | | 0.26 | | | | 0.26 | | | | 0.28 | | |
Net realized and unrealized gain (loss) | | | 0.30 | | | | (0.04 | ) | | | 0.44 | | | | 0.40 | | | | (0.41 | ) | | | (0.06 | ) | |
Total from investment operations | | | 0.39 | | | | 0.22 | | | | 0.72 | | | | 0.66 | | | | (0.15 | ) | | | 0.22 | | |
Less distributions to shareholders: | |
Net investment income | | | (0.09 | ) | | | (0.28 | ) | | | (0.39 | ) | | | (0.23 | ) | | | (0.34 | ) | | | (0.32 | ) | |
Tax return of capital | | | — | | | | — | | | | — | | | | — | | | | (0.01 | ) | | | — | | |
Total distributions to shareholders | | | (0.09 | ) | | | (0.28 | ) | | | (0.39 | ) | | | (0.23 | ) | | | (0.35 | ) | | | (0.32 | ) | |
Net asset value, end of period | | $ | 6.41 | | | $ | 6.11 | | | $ | 6.17 | | | $ | 5.84 | | | $ | 5.41 | | | $ | 5.91 | | |
Total return | | | 6.45 | % | | | 3.64 | % | | | 12.72 | % | | | 12.26 | % | | | (2.21 | %) | | | 3.84 | % | |
Ratios to average net assets(b) | |
Expenses prior to fees waived or expenses
reimbursed | | | 1.77 | %(c) | | | 1.78 | % | | | 1.76 | % | | | 1.74 | % | | | 1.73 | % | | | 1.70 | % | |
Net expenses after fees waived or expenses
reimbursed(d) | | | 1.62 | %(c)(e) | | | 1.62 | %(e) | | | 1.60 | %(e) | | | 1.59 | %(e) | | | 1.58 | %(e) | | | 1.55 | %(e) | |
Net investment income | | | 3.51 | %(c)(e) | | | 4.28 | %(e) | | | 4.62 | %(e) | | | 4.47 | %(e) | | | 4.85 | %(e) | | | 4.63 | %(e) | |
Supplemental data | |
Net assets, end of period (in thousands) | | $ | 263,736 | | | $ | 234,351 | | | $ | 185,859 | | | $ | 196,319 | | | $ | 157,492 | | | $ | 130,420 | | |
Portfolio turnover | | | 48 | %(f) | | | 83 | %(f) | | | 128 | % | | | 50 | % | | | 43 | % | | | 41 | % | |
Notes to Financial Highlights
(a) For the period from June 1, 2012 to October 31, 2012. During the period, the Fund's fiscal year end was changed from May 31 to October 31.
(b) In addition to the fees and expenses which the Fund bears directly, the Fund indirectly bears a pro rata share of the fees and expenses of the acquired funds in which it invests. Such indirect expenses are not included in the reported expense ratios.
(c) Annualized.
(d) The Investment Manager and certain of its affiliates agreed to waive/reimburse certain fees and expenses, if applicable.
(e) The benefits derived from expense reductions had an impact of less than 0.01%.
(f) Includes mortgage dollar rolls. If mortgage dollar roll transactions were excluded, the portfolio turnover would have been 25% and 63% for the period ended October 31, 2012 and the year May 31, 2012, respectively.
The accompanying Notes to Financial Statements are an integral part of this statement.
Annual Report 2012
52
Columbia Strategic Income Fund
Financial Highlights (continued)
| | | Year Ended
October 31, | |
Year Ended May 31, | |
Class K(c) | | 2012(a) | | 2012 | | 2011(b) | |
Per share data | |
Net asset value, beginning of period | | $ | 6.04 | | | $ | 6.09 | | | $ | 6.01 | | |
Income from investment operations: | |
Net investment income | | | 0.11 | | | | 0.30 | | | | 0.07 | | |
Net realized and unrealized gain (loss) | | | 0.29 | | | | (0.03 | ) | | | 0.09 | | |
Total from investment operations | | | 0.40 | | | | 0.27 | | | | 0.16 | | |
Less distributions to shareholders: | |
Net investment income | | | (0.11 | ) | | | (0.32 | ) | | | (0.08 | ) | |
Total distributions to shareholders | | | (0.11 | ) | | | (0.32 | ) | | | (0.08 | ) | |
Net asset value, end of period | | $ | 6.33 | | | $ | 6.04 | | | $ | 6.09 | | |
Total return | | | 6.68 | % | | | 4.59 | % | | | 2.62 | % | |
Ratios to average net assets(d) | |
Expenses prior to fees waived or expenses reimbursed | | | 0.91 | %(e) | | | 0.90 | % | | | 0.89 | %(e) | |
Net expenses after fees waived or expenses reimbursed(f) | | | 0.91 | %(e)(g) | | | 0.90 | %(g) | | | 0.89 | %(e)(g) | |
Net investment income | | | 4.22 | %(e)(g) | | | 5.00 | %(g) | | | 5.19 | %(e)(g) | |
Supplemental data | |
Net assets, end of period (in thousands) | | $ | 182 | | | $ | 219 | | | $ | 3 | | |
Portfolio turnover | | | 48 | %(h) | | | 83 | %(h) | | | 128 | % | |
Notes to Financial Highlights
(a) For the period from June 1, 2012 to October 31, 2012. During the period, the Fund's fiscal year end was changed from May 31 to October 31.
(b) For the period from March 7, 2011 (commencement of operations) to May 31, 2011.
(c) Effective October 25, 2012, Class R4 shares were renamed Class K shares.
(d) In addition to the fees and expenses which the Fund bears directly, the Fund indirectly bears a pro rata share of the fees and expenses of the acquired funds in which it invests. Such indirect expenses are not included in the reported expense ratios.
(e) Annualized.
(f) The Investment Manager and certain of its affiliates agreed to waive/reimburse certain fees and expenses, if applicable.
(g) The benefits derived from expense reductions had an impact of less than 0.01%.
(h) Includes mortgage dollar rolls. If mortgage dollar roll transactions were excluded, the portfolio turnover would have been 25% and 63% for the period ended October 31, 2012 and the year May 31, 2012, respectively.
The accompanying Notes to Financial Statements are an integral part of this statement.
Annual Report 2012
53
Columbia Strategic Income Fund
Financial Highlights (continued)
| | | Year Ended
October 31, | |
Year Ended May 31, | |
Class R | | 2012(a) | | 2012 | | 2011(b) | |
Per share data | |
Net asset value, beginning of period | | $ | 6.14 | | | $ | 6.19 | | | $ | 6.16 | | |
Income from investment operations: | |
Net investment income | | | 0.10 | | | | 0.27 | | | | 0.22 | | |
Net realized and unrealized gain (loss) | | | 0.30 | | | | (0.02 | ) | | | 0.13 | | |
Total from investment operations | | | 0.40 | | | | 0.25 | | | | 0.35 | | |
Less distributions to shareholders: | |
Net investment income | | | (0.10 | ) | | | (0.30 | ) | | | (0.32 | ) | |
Total distributions to shareholders | | | (0.10 | ) | | | (0.30 | ) | | | (0.32 | ) | |
Net asset value, end of period | | $ | 6.44 | | | $ | 6.14 | | | $ | 6.19 | | |
Total return | | | 6.58 | % | | | 4.20 | % | | | 5.86 | % | |
Ratios to average net assets(c) | |
Expenses prior to fees waived or expenses reimbursed | | | 1.27 | %(d) | | | 1.29 | % | | | 1.36 | %(d) | |
Net expenses after fees waived or expenses reimbursed(e) | | | 1.27 | %(d)(f) | | | 1.27 | %(f) | | | 1.25 | %(d)(f) | |
Net investment income | | | 3.82 | %(d)(f) | | | 4.44 | %(f) | | | 5.31 | %(d)(f) | |
Supplemental data | |
Net assets, end of period (in thousands) | | $ | 218 | | | $ | 71 | | | $ | 3 | | |
Portfolio turnover | | | 48 | %(g) | | | 83 | %(g) | | | 128 | % | |
Notes to Financial Highlights
(a) For the period from June 1, 2012 to October 31, 2012. During the period, the Fund's fiscal year end was changed from May 31 to October 31.
(b) For the period from September 27, 2010 (commencement of operations) to May 31, 2011.
(c) In addition to the fees and expenses which the Fund bears directly, the Fund indirectly bears a pro rata share of the fees and expenses of the acquired funds in which it invests. Such indirect expenses are not included in the reported expense ratios.
(d) Annualized.
(e) The Investment Manager and certain of its affiliates agreed to waive/reimburse certain fees and expenses, if applicable.
(f) The benefits derived from expense reductions had an impact of less than 0.01%.
(g) Includes mortgage dollar rolls. If mortgage dollar roll transactions were excluded, the portfolio turnover would have been 25% and 63% for the period ended October 31, 2012 and the year May 31, 2012, respectively.
The accompanying Notes to Financial Statements are an integral part of this statement.
Annual Report 2012
54
Columbia Strategic Income Fund
Financial Highlights (continued)
| | | Year Ended
October 31, | |
Year Ended May 31, | |
Class R5 | | 2012(a) | | 2012 | | 2011(b) | |
Per share data | |
Net asset value, beginning of period | | $ | 6.04 | | | $ | 6.09 | | | $ | 6.01 | | |
Income from investment operations: | |
Net investment income | | | 0.12 | | | | 0.32 | | | | 0.08 | | |
Net realized and unrealized gain (loss) | | | 0.29 | | | | (0.03 | ) | | | 0.08 | | |
Total from investment operations | | | 0.41 | | | | 0.29 | | | | 0.16 | | |
Less distributions to shareholders: | |
Net investment income | | | (0.12 | ) | | | (0.34 | ) | | | (0.08 | ) | |
Total distributions to shareholders | | | (0.12 | ) | | | (0.34 | ) | | | (0.08 | ) | |
Net asset value, end of period | | $ | 6.33 | | | $ | 6.04 | | | $ | 6.09 | | |
Total return | | | 6.79 | % | | | 4.86 | % | | | 2.68 | % | |
Ratios to average net assets(c) | |
Expenses prior to fees waived or expenses reimbursed | | | 0.66 | %(d) | | | 0.65 | % | | | 0.63 | %(d) | |
Net expenses after fees waived or expenses reimbursed(e) | | | 0.66 | %(d)(f) | | | 0.65 | %(f) | | | 0.63 | %(d)(f) | |
Net investment income | | | 4.50 | %(d)(f) | | | 5.26 | %(f) | | | 5.45 | %(d)(f) | |
Supplemental data | |
Net assets, end of period (in thousands) | | $ | 8 | | | $ | 277 | | | $ | 3 | | |
Portfolio turnover | | | 48 | %(g) | | | 83 | %(g) | | | 128 | % | |
Notes to Financial Highlights
(a) For the period from June 1, 2012 to October 31, 2012. During the period, the Fund's fiscal year end was changed from May 31 to October 31.
(b) For the period from March 7, 2011 (commencement of operations) to May 31, 2011.
(c) In addition to the fees and expenses which the Fund bears directly, the Fund indirectly bears a pro rata share of the fees and expenses of the acquired funds in which it invests. Such indirect expenses are not included in the reported expense ratios.
(d) Annualized.
(e) The Investment Manager and certain of its affiliates agreed to waive/reimburse certain fees and expenses, if applicable.
(f) The benefits derived from expense reductions had an impact of less than 0.01%.
(g) Includes mortgage dollar rolls. If mortgage dollar roll transactions were excluded, the portfolio turnover would have been 25% and 63% for the period ended October 31, 2012 and the year May 31, 2012, respectively.
The accompanying Notes to Financial Statements are an integral part of this statement.
Annual Report 2012
55
Columbia Strategic Income Fund
Financial Highlights (continued)
| | | Year Ended
October 31, | |
Year Ended May 31, | |
Class W | | 2012(a) | | 2012 | | 2011(b) | |
Per share data | |
Net asset value, beginning of period | | $ | 6.10 | | | $ | 6.16 | | | $ | 6.16 | | |
Income from investment operations: | |
Net investment income | | | 0.11 | | | | 0.30 | | | | 0.21 | | |
Net realized and unrealized gain (loss) | | | 0.31 | | | | (0.04 | ) | | | 0.12 | | |
Total from investment operations | | | 0.42 | | | | 0.26 | | | | 0.33 | | |
Less distributions to shareholders: | |
Net investment income | | | (0.11 | ) | | | (0.32 | ) | | | (0.33 | ) | |
Total distributions to shareholders | | | (0.11 | ) | | | (0.32 | ) | | | (0.33 | ) | |
Net asset value, end of period | | $ | 6.41 | | | $ | 6.10 | | | $ | 6.16 | | |
Total return | | | 6.90 | % | | | 4.34 | % | | | 5.53 | % | |
Ratios to average net assets(c) | |
Expenses prior to fees waived or expenses reimbursed | | | 1.00 | %(d) | | | 1.03 | % | | | 0.89 | %(d) | |
Net expenses after fees waived or expenses reimbursed(e) | | | 1.00 | %(d)(f) | | | 1.02 | %(f) | | | 0.89 | %(d)(f) | |
Net investment income | | | 4.19 | %(d)(f) | | | 4.89 | %(f) | | | 5.10 | %(d)(f) | |
Supplemental data | |
Net assets, end of period (in thousands) | | $ | 3 | | | $ | 2 | | | $ | 3 | | |
Portfolio turnover | | | 48 | %(g) | | | 83 | %(g) | | | 128 | % | |
Notes to Financial Highlights
(a) For the period from June 1, 2012 to October 31, 2012. During the period, the Fund's fiscal year end was changed from May 31 to October 31.
(b) For the period from September 27, 2010 (commencement of operations) to May 31, 2011.
(c) In addition to the fees and expenses which the Fund bears directly, the Fund indirectly bears a pro rata share of the fees and expenses of the acquired funds in which it invests. Such indirect expenses are not included in the reported expense ratios.
(d) Annualized.
(e) The Investment Manager and certain of its affiliates agreed to waive/reimburse certain fees and expenses, if applicable.
(f) The benefits derived from expense reductions had an impact of less than 0.01%.
(g) Includes mortgage dollar rolls. If mortgage dollar roll transactions were excluded, the portfolio turnover would have been 25% and 63% for the period ended October 31, 2012 and the year May 31, 2012, respectively.
The accompanying Notes to Financial Statements are an integral part of this statement.
Annual Report 2012
56
Columbia Strategic Income Fund
Financial Highlights (continued)
| | | Year Ended
October 31, | |
Year Ended May 31, | |
Class Z | | 2012(a) | | 2012 | | 2011 | | 2010 | | 2009 | | 2008 | |
Per share data | |
Net asset value, beginning of period | | $ | 6.04 | | | $ | 6.09 | | | $ | 5.78 | | | $ | 5.35 | | | $ | 5.85 | | | $ | 5.95 | | |
Income from investment operations: | |
Net investment income | | | 0.11 | | | | 0.31 | | | | 0.33 | | | | 0.31 | | | | 0.30 | | | | 0.32 | | |
Net realized and unrealized gain (loss) | | | 0.29 | | | | (0.03 | ) | | | 0.42 | | | | 0.39 | | | | (0.40 | ) | | | (0.05 | ) | |
Total from investment operations | | | 0.40 | | | | 0.28 | | | | 0.75 | | | | 0.70 | | | | (0.10 | ) | | | 0.27 | | |
Less distributions to shareholders: | |
Net investment income | | | (0.11 | ) | | | (0.33 | ) | | | (0.44 | ) | | | (0.27 | ) | | | (0.39 | ) | | | (0.37 | ) | |
Tax return of capital | | | — | | | | — | | | | — | | | | — | | | | (0.01 | ) | | | — | | |
Total distributions to shareholders | | | (0.11 | ) | | | (0.33 | ) | | | (0.44 | ) | | | (0.27 | ) | | | (0.40 | ) | | | (0.37 | ) | |
Net asset value, end of period | | $ | 6.33 | | | $ | 6.04 | | | $ | 6.09 | | | $ | 5.78 | | | $ | 5.35 | | | $ | 5.85 | | |
Total return | | | 6.74 | % | | | 4.75 | % | | | 13.46 | % | | | 13.36 | % | | | (1.38 | %) | | | 4.77 | % | |
Ratios to average net assets(b) | |
Expenses prior to fees waived or expenses
reimbursed | | | 0.77 | %(c) | | | 0.78 | % | | | 0.76 | % | | | 0.74 | % | | | 0.73 | % | | | 0.70 | % | |
Net expenses after fees waived or expenses
reimbursed(d) | | | 0.77 | %(c)(e) | | | 0.77 | %(e) | | | 0.75 | %(e) | | | 0.74 | %(e) | | | 0.73 | %(e) | | | 0.70 | %(e) | |
Net investment income | | | 4.37 | %(c)(e) | | | 5.13 | %(e) | | | 5.47 | %(e) | | | 5.35 | %(e) | | | 5.71 | %(e) | | | 5.47 | %(e) | |
Supplemental data | |
Net assets, end of period (in thousands) | | $ | 985,278 | | | $ | 812,836 | | | $ | 660,970 | | | $ | 714,358 | | | $ | 704,118 | | | $ | 726,217 | | |
Portfolio turnover | | | 48 | %(f) | | | 83 | %(f) | | | 128 | % | | | 50 | % | | | 43 | % | | | 41 | % | |
Notes to Financial Highlights
(a) For the period from June 1, 2012 to October 31, 2012. During the period, the Fund's fiscal year end was changed from May 31 to October 31.
(b) In addition to the fees and expenses which the Fund bears directly, the Fund indirectly bears a pro rata share of the fees and expenses of the acquired funds in which it invests. Such indirect expenses are not included in the reported expense ratios.
(c) Annualized.
(d) The Investment Manager and certain of its affiliates agreed to waive/reimburse certain fees and expenses, if applicable.
(e) The benefits derived from expense reductions had an impact of less than 0.01%.
(f) Includes mortgage dollar rolls. If mortgage dollar roll transactions were excluded, the portfolio turnover would have been 25% and 63% for the period ended October 31, 2012 and the year May 31, 2012, respectively.
The accompanying Notes to Financial Statements are an integral part of this statement.
Annual Report 2012
57
Columbia Strategic Income Fund
Notes to Financial Statements
October 31, 2012
Note 1. Organization
Columbia Strategic Income Fund (the Fund), a series of Columbia Funds Series Trust I (the Trust), is a diversified fund. The Trust is registered under the Investment Company Act of 1940, as amended (the 1940 Act), as an open-end management investment company organized as a Massachusetts business trust.
Fiscal Year End Change
During the period, the Fund changed its fiscal year end from May 31 to October 31.
Fund Shares
The Trust may issue an unlimited number of shares (without par value). The Fund offers Class A, Class B, Class C, Class K, Class R, Class R5, Class W and Class Z shares. All share classes have identical voting, dividend and liquidation rights. Each share class has its own expense structure and sales charges, as applicable.
Class A shares are subject to a maximum front-end sales charge of 4.75% based on the initial investment amount. Class A shares purchased without an initial sales charge in accounts aggregating $1 million to $50 million at the time of purchase are subject to a contingent deferred sales charge (CDSC) if the shares are sold within 18 months of purchase, charged as follows: 1.00% CDSC if redeemed within 12 months of purchase, and 0.50% CDSC if redeemed more than 12, but less than 18, months after purchase.
Class B shares may be subject to a maximum CDSC of 5.00% based upon the holding period after purchase. Class B shares will generally convert to Class A shares eight years after purchase. The Fund no longer accepts investments by new or existing investors in the Fund's Class B shares, except in connection with the reinvestment of any dividend and/or capital gain distributions in Class B shares of the Fund and exchanges by existing Class B shareholders of certain other funds within the Columbia Family of Funds.
Class C shares are subject to a 1.00% CDSC on shares redeemed within one year of purchase.
Class R shares are not subject to sales charges and are only available to qualifying institutional investors.
Class K shares (formerly Class R4 shares) are not subject to sales charges; however, this share class is closed to new investors. Effective October 25, 2012, Class R4 shares were renamed Class K shares.
Class R5 shares are not subject to sales charges; however, this share class is closed to new investors.
Class W shares are not subject to sales charges and are only available to investors purchasing through authorized investment programs managed by investment professionals, including discretionary managed account programs.
Class Z shares are not subject to sales charges, and are only available to certain investors.
Note 2. Summary of Significant Accounting Policies
Use of Estimates
The preparation of financial statements in accordance with U.S. generally accepted accounting principles (GAAP) requires management to make certain estimates and assumptions that affect the reported amounts of assets and liabilities, the disclosure of contingent assets and liabilities at the date of the financial statements and the reported amounts of revenue and expenses during the reporting period. Actual results could differ from those estimates.
The following is a summary of significant accounting policies consistently followed by the Fund in the preparation of its financial statements.
Security Valuation
Debt securities generally are valued by pricing services approved by the Board of Trustees (the Board) based upon market transactions for normal, institutional-size trading units of similar securities. The services may use various pricing techniques which take into account appropriate factors such as yield, quality, coupon rate, maturity, type of issue, trading characteristics and other data, as well as broker quotes. Debt securities for which quotations are readily available may also be valued based upon an over-the-counter or exchange bid quotation.
All equity securities are valued at the close of business of the New York Stock Exchange (NYSE). Equity securities are valued at the last quoted sales price on the principal exchange or market on which they trade, except for securities traded on the NASDAQ Stock Market, which are valued at the NASDAQ official close price. Unlisted securities or listed securities for which there were no sales during the day are valued at the mean of the latest quoted bid and ask prices on such exchanges or markets.
Asset and mortgage-backed securities are generally valued by pricing services, which utilize pricing models that incorporate the securities' cash flow and loan performance data. These models also take into account available market data, including trades, market quotations, and benchmark yield curves for identical or similar securities. Factors used to identify similar
Annual Report 2012
58
Columbia Strategic Income Fund
Notes to Financial Statements (continued)
October 31, 2012
securities may include, but are not limited to, issuer, collateral type, vintage, prepayment speeds, collateral performance, credit ratings, credit enhancement and expected life. Asset-backed securities for which quotations are readily available may also be valued based upon an over-the-counter or exchange bid quotation.
Foreign securities are valued based on quotations from the principal market in which such securities are normally traded. If any foreign share prices are not readily available as a result of limited share activity the securities are valued at the mean of the latest quoted bid and ask prices on such exchanges or markets. Foreign currency exchange rates are generally determined at 4:00 p.m. Eastern (U.S.) time. However, many securities markets and exchanges outside the U.S. close prior to the close of the NYSE; therefore, the closing prices for securities in such markets or on such exchanges may not fully reflect events that occur after such close but before the close of the NYSE. In those situations, foreign securities will be fair valued pursuant to the policy adopted by the Board, including utilizing a third party pricing service to determine these fair values. The third party pricing service takes into account multiple factors, including, but not limited to, movements in the U.S. securities markets, certain depositary receipts, futures contracts and foreign exchange rates that have occurred subsequent to the close of the foreign exchange or market, to determine a good faith estimate that reasonably reflects the current market conditions as of the close of the NYSE. The fair value of a security is likely to be different from the quoted or published price, if available.
Investments in other open-end investment companies, including money market funds, are valued at net asset value.
Short-term securities purchased within 60 days to maturity are valued at amortized cost, which approximates market value. The value of short-term securities originally purchased with maturities greater than 60 days is determined based on an amortized value to par upon reaching 60 days to maturity. Short-term securities maturing in more than 60 days from the valuation date are valued at the market price or approximate market value based on current interest rates.
Forward foreign currency exchange contracts are marked-to-market based upon foreign currency exchange rates provided by a pricing service.
Futures and options on futures contracts are valued based upon the settlement price established each day by the board of trade or exchange on which they are traded.
Option contracts are valued at the mean of the latest quoted bid and asked prices on their primary exchanges. Option contracts, including over-the-counter (OTC) option contracts, with no readily available market value are valued using
quotations obtained from independent brokers as of the close of the NYSE.
Swap transactions are valued through an independent pricing service or broker, or if neither is available, through an internal model based upon observable inputs.
Investments for which market quotations are not readily available, or that have quotations which management believes are not reliable, are valued at fair value as determined in good faith under consistently applied procedures established by and under the general supervision of the Board. If a security or class of securities (such as foreign securities) is valued at fair value, such value is likely to be different from the last quoted market price for the security.
The determination of fair value often requires significant judgment. To determine fair value, management may use assumptions including but not limited to future cash flows and estimated risk premiums. Multiple inputs from various sources may be used to determine fair value.
Foreign Currency Transactions and Translations
The values of all assets and liabilities denominated in foreign currencies are translated into U.S. dollars at that day's exchange rates. Net realized and unrealized gains (losses) on foreign currency transactions and translations include gains (losses) arising from the fluctuation in exchange rates between trade and settlement dates on securities transactions, gains (losses) arising from the disposition of foreign currency and currency gains (losses) between the accrual and payment dates on dividends, interest income and foreign withholding taxes.
For financial statement purposes, the Fund does not distinguish that portion of gains (losses) on investments which is due to changes in foreign exchange rates from that which is due to changes in market prices of the investments. Such fluctuations are included with the net realized and unrealized gains (losses) on investments in the Statement of Operations.
Derivative Instruments
The Fund invests in certain derivative instruments, as detailed below, to meet its investment objectives. Derivatives are instruments whose values depend on, or are derived from, in whole or in part, the value of one or more other assets, such as securities, currencies, commodities or indices. Derivative instruments may be used to maintain cash reserves while maintaining exposure to certain other assets, to offset anticipated declines in values of investments, to facilitate trading, to reduce transaction costs and to pursue higher investment returns. The Fund may also use derivative instruments to mitigate certain investment risks, such as foreign currency exchange rate risk, interest rate risk and credit risk. Derivatives may involve various risks, including
Annual Report 2012
59
Columbia Strategic Income Fund
Notes to Financial Statements (continued)
October 31, 2012
the potential inability of the counterparty to fulfill its obligation under the terms of the contract, the potential for an illiquid secondary market and the potential for market movements which may expose the Fund to gains or losses in excess of the amount shown in the Statement of Assets and Liabilities.
The Fund and any counterparty are required to maintain an agreement that requires the Fund and that counterparty to monitor (on a daily basis) the net fair value of all derivatives entered into pursuant to the agreement between the Fund and such counterparty. If the net fair value of such derivatives between the Fund and that counterparty exceeds a certain threshold (as defined in the agreement), the Fund or the counterparty (as the case may be) is required to post cash and/or securities as collateral. Fair values of derivatives presented in the financial statements are not netted with the fair value of other derivatives or with any collateral amounts posted by the Fund or any counterparty.
Forward Foreign Currency Exchange Contracts
Forward foreign currency exchange contracts are agreements between two parties to buy and sell a currency at a set price on a future date. These contracts are intended to be used to minimize the exposure to foreign exchange rate fluctuations during the period between the trade and settlement dates of the contract. The Fund utilized forward foreign currency exchange contracts to hedge the currency exposure associated with some or all of the Fund's securities, to shift foreign currency exposure back to U.S. dollars and to shift investment exposure from one currency to another.
The values of forward foreign currency exchange contracts fluctuate with changes in foreign currency exchange rates. The Fund will record a realized gain or loss when the forward foreign currency exchange contract expires.
The use of forward foreign currency exchange contracts does not eliminate fluctuations in the prices of the Fund's portfolio securities. The risks of forward foreign currency exchange contracts include movement in the values of the foreign currencies relative to the U.S. dollar (or other foreign currencies) and the possibility that counterparties will not complete their contractual obligations, which may be in excess of the amount reflected, if any, in the Statement of Assets and Liabilities.
Futures Contracts
Futures contracts represent commitments for the future purchase or sale of an asset at a specified price on a specified date. The Fund bought and sold futures contracts to manage the duration and yield curve exposure of the Fund versus the benchmark. Upon entering into futures contracts, the Fund
bears risks which may include interest rates, exchange rates or securities prices moving unexpectedly, in which case, the Fund may not achieve the anticipated benefits of the futures contracts and may realize a loss. Additional risks include counterparty credit risk, the possibility of an illiquid market, and that a change in the value of the contract or option may not correlate with changes in the value of the underlying asset.
Upon entering into a futures contract, the Fund pledges cash or securities with the broker in an amount sufficient to meet the initial margin requirement. Subsequent payments (variation margin) are made or received by the Fund each day. The variation margin payments are equal to the daily change in the contract value and are recorded as variation margin receivable or payable and are offset in unrealized gains or losses. The Fund recognizes a realized gain or loss when the contract is closed or expires. Futures contracts involve, to varying degrees, risk of loss in excess of the variation margin disclosed in the Statement of Assets and Liabilities.
Options Contracts
Options are contracts which entitle the holder to purchase or sell securities or other identified assets at a specified price, or in the case of index option contracts, to receive or pay the difference between the index value and the strike price of the index option contract. The Fund purchased and wrote option contracts to manage the duration and yield curve exposure of the Fund versus the benchmark. Completion of transactions for option contracts traded in the OTC market depends upon the performance of the other party. Cash collateral may be collected or posted by the Fund to secure certain OTC option contract trades. Cash collateral held or posted by the Fund for such option contract trades must be returned to the counterparty or the Fund upon closure, exercise or expiration of the contract.
Option contracts purchased are recorded as investments and options contracts written are recorded as liabilities of the Fund. The Fund will realize a gain or loss when the option contract expires. When option contracts are exercised, the proceeds on sales for a written call or purchased put option contract, or the purchase cost for a written put or purchased call option contract, is adjusted by the amount of premium received or paid.
The risk in buying an option contract is that the Fund pays a premium whether or not the option contract is exercised. The Fund also has the additional risk of being unable to enter into a closing transaction if a liquid secondary market does not exist. The risk in writing a call option contract is that the Fund gives up the opportunity for profit if the market price of the security increases. The risk in writing a put option contract is that the Fund may incur a loss if the market price of the
Annual Report 2012
60
Columbia Strategic Income Fund
Notes to Financial Statements (continued)
October 31, 2012
security decreases and the option contract is exercised. The Fund's maximum payout in the case of written put option contracts represents the maximum potential amount of future payments (undiscounted) that the Fund could be required to make under the contract. For OTC options contracts, the transaction is also subject to counterparty credit risk. The maximum payout amount may be offset by the subsequent sale, if any, of assets obtained upon the exercise of the put option contracts by holders of the option contracts or proceeds received upon entering into the contracts.
Contracts and premiums associated with options contracts written for the period ended October 31, 2012 are as follows:
| | | Calls | |
| | | Contracts | | Premiums ($) | |
Balance at May 31, 2012 | | | — | | | | — | | |
Opened | | | 900 | | | | 569,129 | | |
Closed | | | (900 | ) | | | (569,129 | ) | |
Balance at October 31, 2012 | | | — | | | | — | | |
Contracts and premiums associated with options contracts written for the year ended May 31, 2012 are as follows:
| | Calls | |
| | Contracts | | Premiums ($) | |
Balance at May 31, 2011 | | | — | | | | — | | |
Opened | | | 570 | | | | 986,180 | | |
Expired | | | (570 | ) | | | (986,180 | ) | |
Balance at May 31, 2012 | | | — | | | | — | | |
Credit Default Swap Contracts
Credit default swap contracts are agreements in which one party pays fixed periodic payments to a counterparty in consideration for a guarantee from the counterparty to make a specific payment should a specified negative credit event(s) take place. The Fund entered into credit default swap contracts to increase or decrease its credit exposure to a single issuer of debt securities.
As the purchaser of a credit default swap contract, the Fund purchases protection by paying a periodic interest rate on the notional amount to the counterparty. The interest amount is accrued daily as a component of unrealized appreciation (depreciation) and is recorded as a realized loss upon payment. If a credit event as specified in the contract occurs, the Fund may have the option either to deliver the reference obligation to the seller in exchange for a cash payment of its par amount, or to receive a net cash settlement equal to the par amount less an agreed-upon value of the reference obligation as of the date of the credit event. The difference between the value of the
obligation or cash delivered and the notional amount received will be recorded as a realized gain (loss).
As the seller of a credit default swap contract, the Fund sells protection to a buyer and will generally receive a periodic interest rate on the notional amount. The interest amount is accrued daily as a component of unrealized appreciation (depreciation) and is recorded as a realized gain upon receipt of the payment. If a credit event as specified in the contract occurs, the Fund may either be required to accept the reference obligation from the buyer in exchange for a cash payment of its notional amount, or to pay the buyer a net cash settlement equal to the notional amount less an agreed-upon value of the reference obligation as of the date of the credit event. The difference between the value of the obligation or cash received and the notional amount paid will be recorded as a realized gain (loss). The maximum potential amount of undiscounted future payments the Fund could be required to make as the seller of protection under a credit default swap contract is equal to the notional amount of the reference obligation. Notional amounts of all credit default swap contracts outstanding for which the Fund is the seller of protection, if any, are disclosed in the Credit Default Swap Contracts Outstanding schedule following the Portfolio of Investments. These potential amounts may be partially offset by any recovery values of the respective reference obligations or premiums received upon entering into the agreement.
As a protection seller, the Fund bears the risk of loss from the credit events specified in the contract. Although specified events are contract specific, credit events are generally defined as bankruptcy, failure to pay, restructuring, obligation acceleration, obligation default, or repudiation/moratorium. For credit default swap contracts on credit indices, quoted market prices and resulting market values serve as an indicator of the current status of the payment/performance risk. Increasing market values, in absolute terms when compared to the notional amount of the swap, represent a deterioration of the reference entity's credit soundness and a greater likelihood or risk of default or other credit event occurring as defined under the terms of the contract. Market values for credit default swap contracts in which the Fund is the seller of protection, if any, are disclosed in the Credit Default Swap Contracts Outstanding schedule following the Portfolio of Investments.
The notional amounts and market values of credit default swap contracts are not recorded in the financial statements. Any premium paid or received by the Fund upon entering into a credit default swap contract is recorded as an asset or liability, respectively, and amortized daily as a component of realized gain (loss) in the Statement of Operations. Credit default swap contracts are valued daily, and the change in value is recorded
Annual Report 2012
61
Columbia Strategic Income Fund
Notes to Financial Statements (continued)
October 31, 2012
as unrealized appreciation (depreciation) until the termination of the swap, at which time a realized gain (loss) is recorded.
Credit default swap contracts can involve greater risks than if a fund had invested in the reference obligation directly since, in addition to general market risks, credit default swaps are subject to counterparty credit risk, leverage risk, hedging risk, correlation risk and liquidity risk. The Fund will enter into credit default swap transactions only with counterparties that meet certain standards of creditworthiness.
Effects of Derivative Transactions in the Financial Statements
The following tables are intended to provide additional information about the effect of derivatives on the financial statements of the Fund, including: the fair value of derivatives by risk category and the location of those fair values in the Statement of Assets and Liabilities; the impact of derivative transactions on the Fund's operations over the period including realized gains or losses and unrealized gains or losses. The derivative schedules following the Portfolio of Investments present additional information regarding derivative instruments outstanding at the end of the period, if any.
The following table is a summary of the fair value of derivative instruments at October 31, 2012:
| | | Asset Derivatives | |
Risk Exposure
Category | | Statement of Assets and
Liabilities Location | | Fair Value ($) | |
Foreign exchange
contracts | | Unrealized appreciation on
forward foreign currency
exchange contracts | | | 364,675 | | |
Interest rate
contracts | | Net assets — unrealized
appreciation on futures
contracts | | | 16,356 | * | |
Total | | | | | 381,031 | | |
| | | Liability Derivatives | |
Risk Exposure
Category | | Statement of Assets and
Liabilities Location | | Fair Value ($) | |
Credit contracts | | Unrealized depreciation on
swap contracts | | | 195,078 | | |
Foreign exchange
contracts | | Unrealized depreciation on
forward foreign currency
exchange contracts | | | 609,144 | | |
Interest rate
contracts | | Net assets — unrealized
depreciation on futures
contracts | | | 828,672 | * | |
Total | | | | | 1,632,894 | | |
*Includes cumulative appreciation (depreciation) of futures contracts as reported in the Futures Contracts Outstanding table following the Portfolio of Investments. Only the current day's variation margin is reported in receivables or payables in the Statement of Assets and Liabilities.
The effect of derivative instruments in the Statement of Operations for the period ended October 31, 2012:
| | | Amount of Realized Gain (Loss) on Derivatives Recognized in Income | |
Risk Exposure
Category | | Forward Foreign
Currency Exchange
Contracts ($) | | Futures
Contracts ($) | | Options Contracts
Written and
Purchased ($) | | Swap
Contracts ($) | | Total ($) | |
Credit contracts | | | — | | | | — | | | | — | | | | (75,133 | ) | | | (75,133 | ) | |
Foreign exchange contracts | | | 2,709,501 | | | | — | | | | — | | | | — | | | | 2,709,501 | | |
Interest rate contracts | | | — | | | | (1,791,152 | ) | | | (451,960 | ) | | | — | | | | (2,243,112 | ) | |
Total | | | 2,709,501 | | | | (1,791,152 | ) | | | (451,960 | ) | | | (75,133 | ) | | | 391,256 | | |
| | | Change in Unrealized Appreciation (Depreciation) on Derivatives Recognized in Income | |
Risk Exposure
Category | | Forward Foreign
Currency Exchange
Contracts ($) | | Futures
Contracts ($) | | Options Contracts
Written and
Purchased ($) | | Swap
Contracts ($) | | Total ($) | |
Credit contracts | | | — | | | | — | | | | — | | | | (101,884 | ) | | | (101,884 | ) | |
Foreign exchange contracts | | | (1,313,869 | ) | | | — | | | | — | | | | — | | | | (1,313,869 | ) | |
Interest rate contracts | | | — | | | | 872,549 | | | | 49,438 | | | | — | | | | 921,987 | | |
Total | | | (1,313,869 | ) | | | 872,549 | | | | 49,438 | | | | (101,884 | ) | | | (493,766 | ) | |
Annual Report 2012
62
Columbia Strategic Income Fund
Notes to Financial Statements (continued)
October 31, 2012
The following table is a summary of the volume of derivative instruments for the period ended October 31, 2012:
Derivative Instrument | | Contracts Opened | |
Forward foreign currency exchange contracts | | | 122 | | |
Futures contracts | | | 4,892 | | |
Options contracts | | | 1,800 | | |
Swap contracts | | | — | | |
Derivative Instrument | | Aggregate Notional
Opened ($) | |
Credit default swap contracts — buy protection | | | — | | |
The following table is a summary of the fair value of derivative instruments at May 31, 2012:
| | | Asset Derivatives | |
Risk Exposure
Category | | Statement of Assets and
Liabilities Location | | Fair Value ($) | |
Foreign exchange
contracts | | Unrealized appreciation on
forward foreign currency
exchange contracts | | | 2,533,616 | | |
Interest rate
contracts | | Net assets — unrealized
appreciation on futures
contracts | | | 688,914 | * | |
Total | | | | | 3,222,530 | | |
| | Liability Derivatives | |
Risk Exposure
Category | | Statement of Assets and
Liabilities Location | | Fair Value ($) | |
Credit contracts | | Unrealized depreciation on
credit default swap
contracts | | | 93,194 | | |
Foreign exchange
contracts | | Unrealized depreciation on
forward foreign currency
exchange contracts | | | 1,464,216 | | |
Interest rate
contracts | | Net assets — unrealized
depreciation on futures
contracts | | | 2,373,779 | * | |
Total | | | | | 3,931,189 | | |
*Includes cumulative appreciation (depreciation) of futures contracts as reported in the Futures Contracts Outstanding table following the Portfolio of Investments. Only the current day's variation margin is reported in receivables or payables in the Statement of Assets and Liabilities.
The effect of derivative instruments in the Statement of Operations for the year ended May 31, 2012:
| | Amount of Realized Gain (Loss) on Derivatives Recognized in Income | |
Risk Exposure
Category | | Forward Foreign
Currency Exchange
Contracts ($) | | Futures
Contracts ($) | | Options Contracts
Written and
Purchased ($) | | Swap
Contracts ($) | | Total ($) | |
Credit contracts | | | — | | | | — | | | | — | | | | (149,042 | ) | | | (149,042 | ) | |
Foreign exchange contracts | | | 2,394,851 | | | | — | | | | — | | | | — | | | | 2,394,851 | | |
Interest rate contracts | | | — | | | | (21,885,053 | ) | | | 1,367,495 | | | | — | | | | (20,517,558 | ) | |
Total | | | 2,394,851 | | | | (21,885,053 | ) | | | 1,367,495 | | | | (149,042 | ) | | | (18,271,749 | ) | |
| | Change in Unrealized Appreciation (Depreciation) on Derivatives Recognized in Income | |
Risk Exposure
Category | | Forward Foreign
Currency Exchange
Contracts ($) | | Futures
Contracts ($) | | Options Contracts
Written and
Purchased ($) | | Swap
Contracts ($) | | Total ($) | |
Credit contracts | | | — | | | | — | | | | — | | | | 151,791 | | | | 151,791 | | |
Foreign exchange contracts | | | (879,748 | ) | | | — | | | | — | | | | — | | | | (879,748 | ) | |
Interest rate contracts | | | — | | | | (1,725,754 | ) | | | (49,438 | ) | | | — | | | | (1,775,192 | ) | |
Total | | | (879,748 | ) | | | (1,725,754 | ) | | | (49,438 | ) | | | 151,791 | | | | (2,503,149 | ) | |
Annual Report 2012
63
Columbia Strategic Income Fund
Notes to Financial Statements (continued)
October 31, 2012
The following table is a summary of the volume of derivative instruments for the year ended May 31, 2012:
Derivative Instrument | | Contracts Opened | |
Forward Foreign Currency Exchange Contracts | | | 274 | | |
Futures Contracts | | | 15,829 | | |
Options Contracts | | | 7,534 | | |
Swap Contracts | | | — | | |
| Derivative Instrument | | Aggregate Notional
Opened ($) | |
Credit Default Swap Contracts — Buy Protection | | | — | | |
Repurchase Agreements
The Fund may engage in repurchase agreement transactions with institutions that management has determined are creditworthy. The Fund, through the custodian, receives delivery of the underlying securities collateralizing a repurchase agreement. Management is responsible for determining that the collateral is at least equal, at all times, to the value of the repurchase obligation including interest. A repurchase agreement transaction involves certain risks in the event of default or insolvency of the counterparty. These risks include possible delays in or restrictions on the Fund's ability to dispose of the underlying securities and a possible decline in the value of the underlying securities during the period while the Fund seeks to assert its rights.
Delayed Delivery Securities and Forward Sale Commitments
The Fund may trade securities on other than normal settlement terms, including securities purchased or sold on a "when-issued" basis. This may increase the risk if the other party to the transaction fails to deliver and causes the Fund to subsequently invest at less advantageous prices. The Fund designates cash or liquid securities in an amount equal to the delayed delivery commitment.
The Fund may enter into forward sale commitments to hedge its portfolio positions or to sell mortgage-backed securities it owns under delayed delivery arrangements. Proceeds of forward sale commitments are not received until the contractual settlement date. While a forward sale commitment is outstanding, equivalent deliverable securities or an offsetting forward purchase commitment deliverable on or before the sale commitment date, are used to satisfy the commitment.
Unsettled forward sale commitments are valued at the current market value of the underlying securities, generally according to the procedures described under "Security Valuation" above. The forward sale commitment is "marked-to-market" daily and the change in market value is recorded by the Fund as an
unrealized gain or loss. If the forward sale commitment is closed through the acquisition of an offsetting purchase commitment, the Fund realizes a gain or loss. If the Fund delivers securities under the commitment, the Fund realizes a gain or a loss from the sale of the securities based upon the market price established at the date the commitment was entered into.
Mortgage Dollar Roll Transactions
The Fund may enter into mortgage "dollar rolls" in which the Fund sells securities for delivery in the current month and simultaneously contracts with the same counterparty to repurchase similar (same type, coupon and maturity) but not identical securities on a specified future date not exceeding 120 days. During the roll period, the Fund loses the right to receive principal and interest paid on the securities sold. However, the Fund will benefit because it receives negotiated amounts in the form of reductions of the purchase price for the future purchase plus the interest earned on the cash proceeds of the securities sold until the settlement date of the forward purchase. The Fund records the incremental difference between the forward purchase and sale of each forward roll as a realized gain or loss. Unless any realized gains exceed the income, capital appreciation, and gain or loss due to mortgage prepayments that would have been realized on the securities sold as part of the mortgage dollar roll, the use of this technique will diminish the investment performance of the Fund compared to what the performance would have been without the use of mortgage dollar rolls. All cash proceeds will be invested in instruments that are permissible investments for the Fund. The Fund identifies within its Portfolio of Investments cash or liquid securities in an amount equal to the forward purchase price.
For financial reporting and tax purposes, the Fund treats "to be announced" mortgage dollar rolls as two separate transactions, one involving the purchase of a security and a separate transaction involving a sale. This treatment may exaggerate the Fund's portfolio turnover rate. The Fund does not currently enter into mortgage dollar rolls that are accounted for as financing transactions.
Mortgage dollar rolls involve certain risks. If the broker-dealer to whom the Fund sells the securities becomes insolvent, the Fund's right to purchase or repurchase the mortgage-related securities may be restricted and the instruments which the Fund is required to repurchase may be worth less than instruments which the Fund originally held. Successful use of mortgage dollar rolls may depend upon the Investment Manager's ability to predict interest rates and mortgage prepayments. For these reasons, there is no assurance that mortgage dollar rolls can be successfully employed.
Annual Report 2012
64
Columbia Strategic Income Fund
Notes to Financial Statements (continued)
October 31, 2012
Treasury Inflation Protected Securities
The Fund may invest in treasury inflation protected securities (TIPS). The principal amount of TIPS is adjusted periodically and is increased for inflation or decreased for deflation based on a monthly published index. Interest payments are based on the adjusted principal at the time the interest is paid. These adjustments are recorded as interest income in the Statement of Operations.
Loan Participations and Commitments
The Fund may invest in loan participations. When the Fund purchases a loan participation, the Fund typically enters into a contractual relationship with the lender or third party selling such participation (Selling Participant), but not the borrower. However, the Fund assumes the credit risk of the borrower, Selling Participant and any other persons interpositioned between the Fund and the borrower. The Fund may not directly benefit from the collateral supporting the senior loan which it has purchased from the Selling Participant.
Stripped Securities
The Fund may invest in Interest Only (IO) and Principal Only (PO) stripped mortgage-backed securities. These securities are derivative multi-class mortgage securities structured so that one class receives most, if not all, of the principal from the underlying mortgage assets, while the other class receives most, if not all, of the interest and the remainder of the principal. If the underlying mortgage assets experience greater than anticipated prepayments of principal, the Fund may fail to fully recoup its initial investment in an IO security, therefore the daily interest accrual factor is adjusted each month to reflect the paydown of principal. The market value of these securities can be extremely volatile in response to changes in interest rates. Credit risk reflects the risk that the Fund may not receive all or part of its principal because the issuer or credit enhancer has defaulted on its obligation.
Security Transactions
Security transactions are accounted for on the trade date. Cost is determined and gains (losses) are based upon the specific identification method for both financial statement and federal income tax purposes.
Income Recognition
Interest income is recorded on an accrual basis. Market premiums and discounts, including original issue discounts, are amortized and accreted, respectively, over the expected life of the security on all debt securities, unless otherwise noted.
Corporate actions and dividend income are recorded net of any non-reclaimable tax withholdings, on the ex-dividend date
or upon receipt of ex-dividend notification in the case of certain foreign securities.
The value of additional securities received as an income payment is recorded as income and increases the cost basis of such securities.
Expenses
General expenses of the Trust are allocated to the Fund and other funds of the Trust based upon relative net assets or other expense allocation methodologies determined by the nature of the expense. Expenses directly attributable to the Fund are charged to the Fund. Expenses directly attributable to a specific class of shares are charged to that share class.
Determination of Class Net Asset Value
All income, expenses (other than class-specific expenses, which are charged to that share class, as shown in the Statement of Operations) and realized and unrealized gains (losses) are allocated to each class of the Fund on a daily basis, based on the relative net assets of each class, for purposes of determining the net asset value of each class.
Federal Income Tax Status
The Fund intends to qualify each year as a regulated investment company under Subchapter M of the Internal Revenue Code, as amended, and will distribute substantially all of its taxable income (including net short-term capital gains), if any, for its tax year, and as such will not be subject to federal income taxes. In addition, the Fund intends to distribute in each calendar year substantially all of its net investment income, capital gains and certain other amounts, if any, such that the Fund should not be subject to federal excise tax. Therefore, no federal income or excise tax provision is recorded.
Foreign Taxes
The Fund may be subject to foreign taxes on income, gains on investments or currency repatriation, a portion of which may be recoverable. The Fund will accrue such taxes and recoveries, as applicable, based upon its current interpretation of tax rules and regulations that exist in the markets in which it invests.
Realized gains in certain countries may be subject to foreign taxes at the Fund level, based on statutory rates. The Fund accrues for such foreign taxes on net realized and unrealized gains at the appropriate rate for each jurisdiction, as applicable. The amount, if any, is disclosed as a liability on the Statement of Assets and Liabilities.
Annual Report 2012
65
Columbia Strategic Income Fund
Notes to Financial Statements (continued)
October 31, 2012
Distributions to Shareholders
Distributions from net investment income, if any, are declared and paid monthly. Net realized capital gains, if any, are distributed at least annually. Income distributions and capital gain distributions are determined in accordance with federal income tax regulations, which may differ from GAAP.
Guarantees and Indemnifications
Under the Trust's organizational documents and, in some cases, by contract, its officers and trustees are indemnified against certain liabilities arising out of the performance of their duties to the Trust or its funds. In addition, certain of the Fund's contracts with its service providers contain general indemnification clauses. The Fund's maximum exposure under these arrangements is unknown since the amount of any future claims that may be made against the Fund cannot be determined, and the Fund has no historical basis for predicting the likelihood of any such claims.
Recent Accounting Pronouncement
Disclosures about Offsetting Assets and Liabilities
In December 2011, the Financial Accounting Standards Board (FASB) issued ASU No. 2011-11, Disclosures about Offsetting Assets and Liabilities. The objective of the FASB is to enhance current disclosure requirements on offsetting of certain assets and liabilities and to enable financial statement users to compare financial statements prepared under GAAP and International Financial Reporting Standards.
Specifically, ASU No. 2011-11 requires an entity to disclose both gross and net information for derivatives and other financial instruments that are subject to a master netting arrangement or similar agreement. The standard requires disclosure of collateral received in connection with the master netting agreements or similar agreements. The effective date of ASU No. 2011-11 is for interim and annual periods beginning on or after January 1, 2013. At this time, management is evaluating the implications of this guidance and the impact it will have on the financial statement amounts and footnote disclosures, if any.
Note 3. Fees and Compensation Paid to Affiliates
Investment Management Fees
Under an Investment Management Services Agreement, Columbia Management Investment Advisers, LLC (the Investment Manager), a wholly-owned subsidiary of Ameriprise Financial, Inc. (Ameriprise Financial), determines which securities will be purchased, held or sold. The
investment management fee is an annual fee that is equal to a percentage of the Fund's average daily net assets that declines from 0.530% to 0.353% as the Fund's net assets increase. The annualized effective investment management fee rates for the period ended October 31, 2012 and for the year ended May 31, 2012 was 0.51% and 0.52%, respectively, of the Fund's average daily net assets.
Administration Fees
Under an Administrative Services Agreement, the Investment Manager also serves as the Fund Administrator. The Fund pays the Fund Administrator an annual fee for administration and accounting services equal to a percentage of the Fund's average daily net assets that declines from 0.07% to 0.04% as the Fund's net assets increase. The annualized effective administration fee rate for the period ended October 31, 2012 and for the year ended May 31, 2012 was 0.06% and 0.06%, respectively, of the Fund's average daily net assets.
Compensation of Board Members
Board members are compensated for their services to the Fund as disclosed in the Statement of Operations. The Trust's eligible Trustees may participate in a Deferred Compensation Plan (the Plan) which may be terminated at any time. Obligations of the Plan will be paid solely out of the Fund's assets.
Compensation of Chief Compliance Officer
The Board has appointed a Chief Compliance Officer to the Fund in accordance with federal securities regulations. The Fund pays its pro-rata share of the expenses associated with the Chief Compliance Officer. The Fund's expenses for the Chief Compliance Officer will not exceed $15,000 per year.
Transfer Agent Fees
Under a Transfer and Dividend Disbursing Agent Agreement, Columbia Management Investment Services Corp. (the Transfer Agent), an affiliate of the Investment Manager and a wholly-owned subsidiary of Ameriprise Financial, is responsible for providing transfer agency services to the Fund. The Transfer Agent has contracted with Boston Financial Data Services (BFDS) to serve as sub-transfer agent.
The Transfer Agent receives monthly account-based service fees based on the number of open accounts and is reimbursed by the Fund for the fees and expenses the Transfer Agent pays to financial intermediaries that maintain omnibus accounts with the Fund that is a percentage of the average aggregate value of the Fund's shares maintained in each such omnibus account (other than omnibus accounts for which American Enterprise Investment Services Inc. is the broker of record or accounts where the beneficial shareholder is a customer of
Annual Report 2012
66
Columbia Strategic Income Fund
Notes to Financial Statements (continued)
October 31, 2012
Ameriprise Financial Services, Inc., which are paid a per account fee). The Transfer Agent pays the fees of BFDS for services as sub-transfer agent and is not entitled to reimbursement for such fees from the Fund (with the exception of out-of-pocket fees).
The Transfer Agent also receives compensation from fees for various shareholder services and reimbursements for certain out-of-pocket fees. Total transfer agent fees for Class K and Class R5 shares are subject to an annual limitation of not more than 0.05% of the average daily net assets attributable to each share class.
For the period ended October 31, 2012 and for the year ended May 31, 2012, the Fund's annualized effective transfer agent fee rates as a percentage of average daily net assets of each class were as follows:
| | | Period Ended
October 31, 2012 | | Year Ended
May 31, 2012 | |
Class A | | | 0.16 | % | | | 0.16 | % | |
Class B | | | 0.16 | | | | 0.17 | | |
Class C | | | 0.16 | | | | 0.16 | | |
Class K | | | 0.05 | | | | 0.03 | | |
Class R | | | 0.16 | | | | 0.17 | | |
Class R5 | | | 0.05 | | | | 0.03 | | |
Class W | | | 0.15 | | | | 0.18 | | |
Class Z | | | 0.16 | | | | 0.16 | | |
An annual minimum account balance fee of $20 may apply to certain accounts with a value below the Fund's initial minimum investment requirements to reduce the impact of small accounts on transfer agent fees. These minimum account balance fees are recorded as part of expense reductions in the Statement of Operations. For the period ended October 31, 2012 and for the year ended May 31, 2012, these minimum account balance fees reduced total expenses by $8,026 and $8,823, respectively.
Plan Administration Fees
Under a Plan Administration Services Agreement with the Transfer Agent, the Fund pays an annual fee at a rate of 0.25% of the Fund's average daily net assets attributable to Class K shares for the provision of various administrative, recordkeeping, communication and educational services.
Distribution and Service Fees
The Fund has an agreement with Columbia Management Investment Distributors, Inc. (the Distributor), an affiliate of the Investment Manager and a wholly-owned subsidiary of Ameriprise Financial, for distribution and shareholder services. Pursuant to Rule 12b-1 under the 1940 Act, the
Board has approved, and the Fund has adopted, distribution and shareholder service plans (the Plans) which set the distribution and service fees for the Fund. These fees are calculated daily and are intended to compensate the Distributor and/or eligible selling and/or servicing agents for selling shares of the Fund and providing services to investors.
Effective July 1, 2011, the Plans require the payment of a monthly service fee to the Distributor equal to 0.25% annually of the average daily net assets attributable to Class A, Class B, Class C and Class W shares of the Fund. Prior to July 1, 2011, the Fund paid a monthly service fee which was equal to 0.15% annually of the average daily net assets attributable to outstanding Class A and Class B shares of the Fund issued prior to January 1, 1993 and 0.25% annually of the average daily net assets attributable to outstanding Class A, Class B, Class C and Class W shares issued thereafter. The arrangement resulted in an annual rate of service fee for shares that was a blend between the 0.15% and 0.25% rates. For the period ended October 31, 2012 and the year ended May 31, 2012, the Fund's annualized effective service fee rate was 0.25% and 0.25%, respectively of the Fund's average daily net assets attributable to Class A, Class B, Class C and Class W shares.
The Plans also require the payment of a monthly distribution fee to the Distributor at the maximum annual rates of 0.75%, 0.75%, 0.50% and 0.25% of the of the average daily net assets attributable to Class B, Class C, Class R and Class W shares, respectively.
The Distributor has voluntarily agreed to waive a portion of the distribution fee for Class C shares so that the combined distribution and service fee does not exceed 0.85% annually of the average daily net assets attributable to Class C shares. This arrangement may be modified or terminated by the Distributor at any time.
Although the Fund may pay a distribution fee up to 0.25% of the Fund's average daily net assets attributable to Class W shares and a service fee of up to 0.25% of the Fund's average daily net assets attributable to Class W shares, the aggregate fee shall not exceed 0.25% of the Fund's average daily net assets attributable to Class W shares.
Sales Charges
Sales charges, including front-end charges and CDSCs, received by the Distributor for distributing Fund shares were $787,126 for Class A, $11,682 for Class B and $7,631 for Class C shares for the period ended October 31, 2012 and $1,735,829 for Class A, $39,178 for Class B and $15,293 for Class C shares for the year ended May 31, 2012.
Annual Report 2012
67
Columbia Strategic Income Fund
Notes to Financial Statements (continued)
October 31, 2012
Expenses Waived/Reimbursed by the Investment Manager and its Affiliates
Effective October 1, 2012, the Investment Manager and certain of its affiliates have contractually agreed to waive fees and/or reimburse expenses (excluding certain fees and expenses described below), through February 28, 2014, unless sooner terminated at the sole discretion of the Board, so that the Fund's net operating expenses, after giving effect to fees waived/expenses reimbursed and/or overdraft charges from the Fund's custodian, do not exceed the following annual rates as a percentage of the class' average daily net assets:
Class A | | | 1.04 | % | |
Class B | | | 1.79 | | |
Class C | | | 1.79 | | |
Class K | | | 0.97 | | |
Class R | | | 1.29 | | |
Class R5 | | | 0.72 | | |
Class W | | | 1.04 | | |
Class Z | | | 0.79 | | |
Prior to October 1, 2012, the Investment Manager and certain of its affiliates contractually agreed to waive fees and/or reimburse expenses (excluding certain fees and expenses described below), so that the Fund's net operating expenses, after giving effect to fees waived/expenses reimbursed and any balance credits and/or overdraft charges from the Fund's custodian, did not exceed the following annual rates as a percentage of the class' average daily net assets:
Class A | | | 1.02 | % | |
Class B | | | 1.77 | | |
Class C | | | 1.77 | | |
Class K | | | 0.97 | | |
Class R | | | 1.27 | | |
Class R5 | | | 0.72 | | |
Class W | | | 1.02 | | |
Class Z | | | 0.77 | | |
Under the agreement, the following fees and expenses are excluded from the waiver/reimbursement commitment, and therefore will be paid by the Fund, if applicable: taxes (including foreign transaction taxes), expenses associated with investments in affiliated and non-affiliated pooled investment vehicles (including mutual funds and exchange traded funds), transaction costs and brokerage commissions, costs related to any securities lending program, dividend expenses associated with securities sold short, inverse floater program fees and expenses, transaction charges and interest on borrowed money, interest, extraordinary expenses and any other expenses the exclusion of which is specifically approved by the Board. This
agreement may be modified or amended only with approval from all parties. Class C distribution fees waived by the Distributor, as discussed above, are in addition to the waiver/reimbursement commitment under the agreement.
Note 4. Federal Tax Information
The timing and character of income and capital gain distributions are determined in accordance with income tax regulations, which may differ from GAAP because of temporary or permanent book to tax differences.
At October 31, 2012, these differences are primarily due to differing treatment for deferral/reversal of wash sales losses, Trustees' deferred compensation, capital loss carryforwards, foreign capital gains tax, foreign currency transactions, market discount/premium, paydown reclassifications and recognition of unrealized appreciation (depreciation) for certain derivative investments. To the extent these differences are permanent, reclassifications are made among the components of the Fund's net assets in the Statement of Assets and Liabilities. Temporary differences do not require reclassifications. In the Statement of Assets and Liabilities the following reclassifications were made:
Undistributed net investment income | | $ | 3,051,003 | | |
Accumulated net realized gain | | | (3,053,819 | ) | |
Paid-in capital | | | 2,816 | | |
Net investment income and net realized gains (losses), as disclosed in the Statement of Operations, and net assets were not affected by this reclassification.
The tax character of distributions paid during the periods indicated was as follows:
| | | Period Ended
October 31,
2012 | | Year Ended
May 31,
2012 | | Year Ended
May 31,
2011 | |
Ordinary income | | $ | 45,756,480 | | | $ | 118,075,599 | | | $ | 137,189,575 | | |
Long-term
capital gains | | | — | | | | — | | | | — | | |
Short-term capital gain distributions, if any, are considered ordinary income distributions for tax purposes.
At October 31, 2012, the components of distributable earnings on a tax basis were as follows:
Undistributed ordinary income | | $ | 6,975,159 | | |
Undistributed accumulated long-term gain | | | 7,555,669 | | |
Unrealized appreciation | | | 170,161,251 | | |
At October 31, 2012, the cost of investments for federal income tax purposes was $2,975,643,772 and the aggregate
Annual Report 2012
68
Columbia Strategic Income Fund
Notes to Financial Statements (continued)
October 31, 2012
gross unrealized appreciation and depreciation based on that cost was:
Unrealized appreciation | | $ | 184,227,529 | | |
Unrealized depreciation | | | (13,301,370 | ) | |
Net unrealized appreciation | | $ | 170,926,159 | | |
For the year ended October 31, 2012, $26,559,405 of capital loss carryforward was utilized.
Management of the Fund has concluded that there are no significant uncertain tax positions that would require recognition in the financial statements. However, management's conclusion may be subject to review and adjustment at a later date based on factors including, but not limited to, new tax laws, regulations, and administrative interpretations (including relevant court decisions). Generally, the Fund's federal tax returns for the prior three fiscal years remain subject to examination by the Internal Revenue Service.
Note 5. Portfolio Information
The cost of purchases and proceeds from sales of securities, excluding short-term obligations, aggregated to $1,465,753,847 and $1,234,968,216, respectively, for the period ended October 31, 2012, of which $904,077,876 and $820,484,346, respectively, were U.S. government securities.
Note 6. Lending of Portfolio Securities
The Fund has entered into a Master Securities Lending Agreement (the Agreement) with JPMorgan Chase Bank, N.A. (JPMorgan). The Agreement authorizes JPMorgan as lending agent to lend securities to authorized borrowers in order to generate additional income on behalf of the Fund. Pursuant to the Agreement, the securities loaned are secured by cash or securities that either are issued or guaranteed as to principal and interest by the U.S. government, its agencies, authorities or instrumentalities with value equal to at least 100% of the market value of the loaned securities. Any additional collateral required to maintain those levels due to market fluctuations of the loaned securities is requested to be delivered the following business day. Cash collateral received is invested by the lending agent on behalf of the Fund into authorized investments pursuant to the Agreement. The investments made with the cash collateral are listed in the Portfolio of Investments. The values of such investments and any uninvested cash collateral are disclosed in the Statement of Assets and Liabilities along with the related obligation to return the collateral upon the return of the securities loaned.
Risks of delay in recovery of securities or even loss of rights in the securities may occur should the borrower of the securities fail financially. Risks may also arise to the extent that the
value of the securities loaned increases above the value of the collateral received. JPMorgan will indemnify the Fund from losses resulting from a borrower's failure to return a loaned security when due. Such indemnification does not extend to losses associated with declines in the value of cash collateral investments. The Investment Manager is not responsible for any losses incurred by the Fund in connection with the securities lending program. Loans are subject to termination by the Fund or the borrower at any time, and are, therefore, not considered to be illiquid investments.
Pursuant to the Agreement, the Fund receives income for lending its securities either in the form of fees or by earning interest on invested cash collateral, net of negotiated rebates paid to borrowers and fees paid to the lending agent for services provided and any other securities lending expenses. Net income earned from securities lending for the period ended October 31, 2012 and for the year ended May 31, 2012 is disclosed in the Statement of Operations. The Fund continues to earn and accrue interest and dividends on the securities loaned.
At October 31, 2012, securities valued at $338,559,581 were on loan, secured by U.S. government and agency securities valued at $63,210,430 and by cash collateral of $283,165,330 (which does not reflect calls for collateral made to borrowers by JPMorgan at period end) that is partially or fully invested in short-term securities or other cash equivalents.
At May 31, 2012, securities valued at $427,484,121 were on loan, secured by U.S. government and agency securities valued at $46,519,634 and by cash collateral of $391,874,113 (which does not reflect calls for collateral made to borrowers by JPMorgan at period end) that is partially or fully invested in short-term securities or other cash equivalents.
In October 2012, the Board voted to cease securities lending by or on December 31, 2012.
Note 7. Affiliated Money Market Fund
The Fund invests its daily cash balances in Columbia Short-Term Cash Fund, an affiliated money market fund established for the exclusive use by the Fund and other affiliated funds. The income earned by the Fund from such investments is included as "Dividends — affiliated issuers" in the Statement of Operations. As an investing fund, the Fund indirectly bears its proportionate share of the expenses of Columbia Short-Term Cash Fund.
Note 8. Shareholder Concentration
At October 31, 2012, two unaffiliated shareholder accounts owned an aggregate of 54.7% of the outstanding shares of the Fund. The Fund has no knowledge about whether any portion
Annual Report 2012
69
Columbia Strategic Income Fund
Notes to Financial Statements (continued)
October 31, 2012
of those shares was owned beneficially by such accounts. Subscription and redemption activity by concentrated accounts may have a significant effect on the operations of the Fund.
Note 9. Line of Credit
The Fund has entered into a revolving credit facility with a syndicate of banks led by JPMorgan whereby the Fund may borrow for the temporary funding of shareholder redemptions or for other temporary or emergency purposes. The credit facility agreement, as amended, which is a collective agreement between the Fund and certain other funds managed by the Investment Manager, severally and not jointly, permits collective borrowings up to $500 million. Pursuant to a December 13, 2011 amendment to the credit facility agreement, interest is charged to each participating fund based on its borrowings at a rate equal to the higher of (i) the overnight federal funds rate plus 1.00% or (ii) the one-month LIBOR rate plus 1.00%. Each borrowing under the credit facility matures no later than 60 days after the date of borrowing. The Fund also pays a commitment fee equal to its pro rata share of the amount of the credit facility at a rate of 0.08% per annum.
Prior to December 13, 2011, interest was charged to each participating fund based on its borrowings at a rate equal to the sum of the federal funds rate plus (i) 1.25% per annum plus (ii) if one-month LIBOR exceeds the federal funds rate, the amount of such excess. The Fund also paid a commitment fee equal to its pro rata share of the amount of the credit facility at a rate of 0.10% per annum.
The Fund had no borrowings during the period ended October 31, 2012 or the year ended May 31, 2012.
Note 10. Fund Merger
At the close of business on June 3, 2011, the Fund acquired the assets and assumed the identified liabilities of RiverSource Strategic Income Allocation Fund, a series of RiverSource Strategic Allocation Series, Inc. The reorganization was completed after shareholders of RiverSource Strategic Income Allocation Fund approved the plan on February 15, 2011. The purpose of the transaction was to combine two funds managed by the Investment Manager with comparable investment objectives and strategies.
The aggregate net assets of the Fund immediately before the acquisition were $1,863,662,877 and the combined net assets immediately after the acquisition were $2,217,480,688.
The merger was accomplished by a tax-free exchange of 35,698,301 shares of RiverSource Strategic Income Allocation
Fund valued at $353,817,811 (including $21,440,497 of unrealized appreciation).
In exchange for RiverSource Strategic Income Allocation Fund shares, the Fund issued the following number of shares:
| | | Shares | |
Class A | | | 50,379,122 | | |
Class B | | | 3,427,244 | | |
Class C | | | 3,538,608 | | |
Class R | | | 859 | | |
Class K | | | 36,339 | | |
Class R5 | | | 45,399 | | |
For financial reporting purposes, net assets received and shares issued by the Fund were recorded at fair value; however, RiverSource Strategic Income Allocation Fund's cost of investments was carried forward
The financial statements reflect the operations of the Fund for the period prior to the merger and the combined fund for the period subsequent to the merger. Because the combined investment portfolios have been managed as a single integrated portfolio since the merger was completed, it is not practicable to separate the amounts of revenue and earnings of RiverSource Strategic Income Allocation Fund that have been included in the combined Fund's Statement of Operations since the merger was completed.
Assuming the merger had been completed on June 1, 2011, the Fund's pro-forma net investment income, net gain on investments, net change in unrealized depreciation and net increase in net assets from operations for the year ended May 31, 2012 would have been approximately $111.5 million, $24.3 million, $(37.4) million and $98.3 million, respectively.
Note 11. Significant Risks
Foreign Securities Risk
Investing in foreign securities may include certain risks and considerations not typically associated with investing in U.S. securities, such as fluctuating currency values and changing local and regional economic, political and social conditions, which may result in greater market volatility. In addition, certain foreign securities may not be as liquid as U.S. securities. Investing in emerging markets may accentuate these risks.
Investments in emerging market countries are subject to additional risk. The risk of foreign investments is typically increased in less developed countries. These countries are also more likely to experience high levels of inflation, deflation or currency devaluation which could hurt their economies and securities markets.
Annual Report 2012
70
Columbia Strategic Income Fund
Notes to Financial Statements (continued)
October 31, 2012
High Yield Securities Risk
Investing in high-yield fixed income securities may involve greater credit risk and considerations not typically associated with investing in U.S. Government bonds and other higher quality fixed income securities. These securities are non-investment grade securities, often referred to as "junk" bonds. Economic downturns may disrupt the high yield market and impair the ability of issuers to repay principal and interest. Also, an increase in interest rates would likely have an adverse impact on the value of such obligations. Moreover, high-yield securities may be less liquid to the extent that there is no established secondary market.
Note 12. Subsequent Events
Management has evaluated the events and transactions that have occurred through the date the financial statements were issued and noted no items requiring adjustment of the financial statements or additional disclosure.
Note 13. Information Regarding Pending and Settled Legal Proceedings
In December 2005, without admitting or denying the allegations, American Express Financial Corporation (AEFC, which is now known as Ameriprise Financial, Inc. (Ameriprise Financial)) entered into settlement agreements with the Securities and Exchange Commission (SEC) and Minnesota Department of Commerce (MDOC) related to market timing activities. As a result, AEFC was censured and ordered to cease and desist from committing or causing any violations of certain provisions of the Investment Advisers Act of 1940, the Investment Company Act of 1940, and various Minnesota laws. AEFC agreed to pay disgorgement of $10 million and civil money penalties of $7 million. AEFC also agreed to retain an independent distribution consultant to assist in developing a plan for distribution of all disgorgement and civil penalties ordered by the SEC in accordance with various undertakings detailed at www.sec.gov/litigation/admin/ia-2451.pdf. Ameriprise Financial and its affiliates have cooperated with the SEC and the MDOC in these legal proceedings, and have made regular reports to the funds' Boards of Trustees.
Ameriprise Financial and certain of its affiliates have historically been involved in a number of legal, arbitration and regulatory proceedings, including routine litigation, class actions, and governmental actions, concerning matters arising in connection with the conduct of their business activities. Ameriprise Financial believes that the Funds are not currently the subject of, and that neither Ameriprise Financial nor any of its affiliates are the subject of, any pending legal, arbitration or regulatory proceedings that are likely to have a material adverse effect on the Funds or the ability of Ameriprise
Financial or its affiliates to perform under their contracts with the Funds. Ameriprise Financial is required to make 10-Q, 10-K and, as necessary, 8-K filings with the Securities and Exchange Commission on legal and regulatory matters that relate to Ameriprise Financial and its affiliates. Copies of these filings may be obtained by accessing the SEC website at www.sec.gov.
There can be no assurance that these matters, or the adverse publicity associated with them, will not result in increased fund redemptions, reduced sale of fund shares or other adverse consequences to the Funds. Further, although we believe proceedings are not likely to have a material adverse effect on the Funds or the ability of Ameriprise Financial or its affiliates to perform under their contracts with the Funds, these proceedings are subject to uncertainties and, as such, we are unable to estimate the possible loss or range of loss that may result. An adverse outcome in one or more of these proceedings could result in adverse judgments, settlements, fines, penalties or other relief that could have a material adverse effect on the consolidated financial condition or results of operations of Ameriprise Financial.
Annual Report 2012
71
Columbia Strategic Income Fund
Report of Independent Registered Public Accounting Firm
To the Trustees of Columbia Funds Series Trust I and
the Shareholders of Columbia Strategic Income Fund
In our opinion, the accompanying statement of assets and liabilities, including the portfolio of investments, and the related statements of operations and of changes in net assets and the financial highlights present fairly, in all material respects, the financial position of Columbia Strategic Income Fund (the "Fund") (a series of Columbia Funds Series Trust I) at October 31, 2012, the results of its operations, the changes in its net assets and the financial highlights for each of the periods indicated, in conformity with accounting principles generally accepted in the United States of America. These financial statements and financial highlights (hereafter referred to as "financial statements") are the responsibility of the Fund's management. Our responsibility is to express an opinion on these financial statements based on our audits. We conducted our audits of these financial statements in accordance with the standards of the Public Company Accounting Oversight Board (United States). Those standards require that we plan and perform the audit to obtain reasonable assurance about whether the financial statements are free of material misstatement. An audit includes examining, on a test basis, evidence supporting the amounts and disclosures in the financial statements, assessing the accounting principles used and significant estimates made by management, and evaluating the overall financial statement presentation. We believe that our audits, which included confirmation of securities at October 31, 2012 by correspondence with the custodian, brokers and transfer agent, provide a reasonable basis for our opinion.
PricewaterhouseCoopers LLP
Minneapolis, Minnesota
December 21, 2012
Annual Report 2012
72
Columbia Strategic Income Fund
Federal Income Tax Information
(Unaudited)
The Fund hereby designates the following tax attributes for the fiscal year ended October 31, 2012. Shareholders will be notified in early 2013 of amounts for use in preparing 2012 income tax returns.
Tax Designations:
Capital Gain Dividend | | $ | 7,933,452 | | |
Capital Gain Dividend. The Fund designates as a capital gain dividend the amount reflected above, or if subsequently determined to be different, the net capital gain of such fiscal period. The Fund also designates as capital gain dividends, to the extent necessary to fully distribute such capital gains, earnings and profits distributed to shareholders on the redemption of shares.
Annual Report 2012
73
Columbia Strategic Income Fund
The Trustees serve terms of indefinite duration. The names, addresses and birth years of the Trustees and Officers of the Funds in Columbia Funds Series Trust I, the year each was first elected or appointed to office, their principal business occupations during at least the last five years, the number of Funds overseen by each Trustee and other directorships they hold are shown below. Each officer listed below serves as an officer of each Fund in Columbia Funds Series Trust I.
Independent Trustees
Name, Address and Year of Birth,
Position with Funds, Year First
Elected or Appointed to Office | | Principal Occupation(s) During Past Five Years, Number of Funds in Columbia
Funds Complex Overseen by Trustee, Other Directorships Held
| |
Rodman L. Drake (Born 1943)
c/o Columbia Management Investment Advisers, LLC
225 Franklin Street
Boston, MA 02110
Trustee (since 1994) and
Chairman of the Board (since 2009) | | Independent consultant since 2010; Co-Founder of Baringo Capital LLC (private equity) from 1997 to 2008; CEO of Crystal River Capital, Inc. (real estate investment trust) from 2003 to 2010; Oversees 52; Jackson Hewitt Tax Service Inc. (tax preparation services from 2004 to 2011); Celgene Corporation (global biotechnology company); Student Loan Corporation (student loan provider from 2005 to 2010); Celgene Corporation (global biotechnology company); The Helios Funds and Brookfield Funds (closed-end funds); Crystal River Capital, Inc. from 2005 to 2010; Parsons Brinckerhoff from 1995 to 2008; and Apex Silver Mines Ltd. from 2007 to 2009 | |
Douglas A. Hacker (Born 1955)
c/o Columbia Management Investment Advisers, LLC
225 Franklin Street
Boston, MA 02110
Trustee (since 1996) | | Independent business executive since May 2006; Executive Vice President — Strategy of United Airlines from December 2002 to May 2006; President of UAL Loyalty Services (airline marketing company) from September 2001 to December 2002; Executive Vice President and Chief Financial Officer of United Airlines from July 1999 to September 2001. Oversees 52; Nash Finch Company (food distributor); Aircastle Limited (aircraft leasing); and SeaCube Container Leasing Ltd. (container leasing) | |
Janet Langford Kelly (Born 1957)
c/o Columbia Management Investment Advisers, LLC
225 Franklin Street
Boston, MA 02110
Trustee (since 1996) | | Senior Vice President, General Counsel and Corporate Secretary, ConocoPhillips (integrated energy company) since September 2007; Deputy General Counsel — Corporate Legal Services, ConocoPhillips from August 2006 to August 2007; Partner, Zelle, Hofmann, Voelbel, Mason & Gette LLP (law firm) from March 2005 to July 2006; Adjunct Professor of Law, Northwestern University from September 2004 to June 2006; Director, UAL Corporation (airline) from February 2006 to July 2006; Chief Administrative Officer and Senior Vice President, Kmart Holding Corporation (consumer goods) from September 2003 to March 2004. Oversees 52; None | |
Nancy T. Lukitsh (Born 1956)
c/o Columbia Management Investment Advisers, LLC
225 Franklin Street
Boston, MA 02110
Trustee (since 2011) | | Senior Vice President, Partner and Director of Marketing, Wellington Management Company, LLP (investment adviser) from 1997 to 2010; Chair, Wellington Management Investment Portfolios (commingled non-U.S. investment pools) from 2007 to 2010; Director, Wellington Trust Company, NA and other Wellington affiliates from 1997 to 2010. Oversees 52; None | |
William E. Mayer (Born 1940)
c/o Columbia Management Investment Advisers, LLC
225 Franklin Street
Boston, MA 02110
Trustee (since 1994) | | Partner, Park Avenue Equity Partners (private equity) since February 1999; Dean and Professor, College of Business and Management, University of Maryland from 1992 to 1996. Oversees 52; DynaVox Inc. (speech creation); Lee Enterprises (print media); WR Hambrecht + Co. (financial service provider) from 2000 to 2012; BlackRock Kelso Capital Corporation (investment company) | |
David M. Moffett (Born 1952)
c/o Columbia Management Investment Advisers, LLC
225 Franklin Street
Boston, MA 02110
Trustee (since 2011) | | Retired. Chief Executive Officer, Federal Home Loan Mortgage Corporation, from 2008 to 2009; Senior Adviser, Global Financial Services Group, Carlyle Group, Inc., from 2007 to 2008; Vice Chairman and Chief Financial Officer, U.S. Bancorp, from 1993 to 2007. Oversees 52; CIT Group Inc. (commercial and consumer finance); eBay Inc. (online trading community); MBIA Inc. (financial service provider); E.W. Scripps Co. (print and television media), Building Materials Holding Corp. (building materials and construction services); and University of Oklahoma Foundation. | |
Charles R. Nelson (Born 1942)
c/o Columbia Management Investment Advisers, LLC
225 Franklin Street
Boston, MA 02110
Trustee (since 1981) | | Retired Professor Emeritus, University of Washington, since 2011; Professor of Economics, University of Washington from January 1976 to 2011; Ford and Louisa Van Voorhis Professor of Political Economy, University of Washington from 1993 to 2011; Adjunct Professor of Statistics, University of Washington from 1980 to 2011; Associate Editor, Journal of Money Credit and Banking from 1993 to 2008; consultant on econometric and statistical matters. Oversees 52; None | |
John J. Neuhauser (Born 1943)
c/o Columbia Management Investment Advisers, LLC
225 Franklin Street
Boston, MA 02110
Trustee (since 1984) | | President, Saint Michael's College, since August 2007; Director or Trustee of several non-profit organizations, including Fletcher Allen Health Care, Inc.; University Professor, Boston College from November 2005 to August 2007; Academic Vice President and Dean of Faculties, Boston College from August 1999 to October 2005. Oversees 52; Liberty All-Star Equity Fund and Liberty All-Star Growth Fund (closed-end funds) | |
Annual Report 2012
74
Columbia Strategic Income Fund
Trustees and Officers (continued)
Independent Trustees (continued)
Name, Address and Year of Birth,
Position with Funds, Year First
Elected or Appointed to Office | | Principal Occupation(s) During Past Five Years, Number of Funds in Columbia
Funds Complex Overseen by Trustee, Other Directorships Held
| |
Patrick J. Simpson (Born 1944)
c/o Columbia Management Investment Advisers, LLC
225 Franklin Street
Boston, MA 02110
Trustee (since 2000) | | Partner, Perkins Coie LLP (law firm). Oversees 52; None | |
Anne-Lee Verville (Born 1945)
c/o Columbia Management Investment Advisers, LLC
225 Franklin Street
Boston, MA 02110
Trustee (since 1998) | | Retired. General Manager — Global Education Industry from 1994 to 1997, President — Application Systems Division from 1991 to 1994, Chief Financial Officer — US Marketing & Services from 1988 to 1991, and Chief Information Officer from 1987 to 1988, IBM Corporation (computer and technology). Oversees 52; Enesco Group, Inc. (producer of giftware and home and garden decor products) from 2001 to 2006 | |
Interested Trustee
Name, Address and Year of Birth,
Position with Funds, Year First
Elected or Appointed to Office | | Principal Occupation(s) During Past Five Years, Number of Funds in Columbia
Funds Complex Overseen by Trustee, Other Directorships Held
| |
William F. Truscott (born 1960)
53600 Ameriprise Financial Center
Minneapolis, MN 55474
Senior Vice President (since 2012) | | Chairman of the Board and President, Columbia Management Investment Advisers, LLC since May 2010 and February 2012, respectively (previously President, Chairman of the Board and Chief Investment Officer, from 2001 to April 2010); Chief Executive Officer, U.S. Asset Management & President, Annuities, Ameriprise Financial, Inc. since May 2010 (previously President — U.S. Asset Management and Chief Investment Officer from 2005 to April 2010, and Senior Vice President — Chief Investment Officer, from 2001 to 2005); Director, President and Chief Executive Officer, Ameriprise Certificate Company since 2006; Director and Chief Executive Officer, Columbia Management Investment Distributors, Inc. since May 2010 and February 2012, respectively (previously Chairman of the Board and Chief Executive Officer from 2008 to April 2010); Chairman of the Board and Chief Executive Officer, RiverSource Distributors, Inc. since 2006. Oversees 208; Columbia Funds Board. | |
The Statement of Additional Information includes additional information about the Trustees of the Funds and is available, without charge, upon request by calling 1-800-345-6611.
Officers
Name, Year of Birth and Address | | Principal Occupation(s) During the Past Five Years | |
J. Kevin Connaughton (Born 1964)
225 Franklin Street
Boston, MA 02110
President (since 2009) | | Senior Vice President and General Manager — Mutual Fund Products, Columbia Management Investment Advisers, LLC since May 2010; President, Columbia Funds, since 2009, and RiverSource Funds, since May 2010 (previously Senior Vice President and Chief Financial Officer, Columbia Funds, from June 2008 to January 2009, Treasurer, Columbia Funds, from October 2003 to May 2008, and senior officer of various other affiliated funds since 2000); Managing Director, Columbia Management Advisors, LLC from December 2004 to April 2010. | |
Michael G. Clarke (Born 1969)
225 Franklin Street
Boston, MA 02110
Treasurer (since 2011) and Chief Financial Officer (since 2009) | | Vice President, Columbia Management Investment Advisers, LLC since May 2010; Managing Director of Fund Administration, Columbia Management Advisors, LLC, from September 2004 to April 2010; senior officer of Columbia Funds and affiliated funds since 2002. | |
Scott R. Plummer (Born 1959)
5228 Ameriprise Financial Center
Minneapolis, MN 55474
Senior Vice President, Assistant Secretary and Chief Legal Officer (since 2010) | | Senior Vice President, Chief Legal Officer and Assistant Secretary, Columbia Management Investment Advisers, LLC since June 2005; Vice President and Lead Chief Counsel — Asset Management, Ameriprise Financial, Inc. since May 2010 (previously Vice President and Chief Counsel — Asset Management, from 2005 to April 2010); Vice President, Chief Counsel and Assistant Secretary, Columbia Management Investment Distributors, Inc. since 2008; Vice President, General Counsel and Secretary, Ameriprise Certificate Company since 2005; Chief Counsel, RiverSource Distributors, Inc. since 2006; Vice President, General Counsel and Secretary, RiverSource Funds since December 2006; Senior Vice President, Secretary and Chief Legal Officer, Columbia Funds, since May 2010. | |
Annual Report 2012
75
Columbia Strategic Income Fund
Trustees and Officers (continued)
Officers (continued)
Name, Year of Birth and Address | | Principal Occupation(s) During the Past Five Years | |
William F. Truscott (Born 1960)
53600 Ameriprise Financial Center
Minneapolis, MN 55474
Senior Vice President (since 2010) | | Chairman of the Board and President, Columbia Management Investment Advisers, LLC since May 2010 and February 2012, respectively (previously President, Chairman of the Board and Chief Investment Officer, from 2001 to April 2010); Chief Executive Officer, U.S. Asset Management & President, Annuities, Ameriprise Financial, Inc. since May 2010 (previously President — U.S. Asset Management and Chief Investment Officer from 2005 to April 2010); Director, President and Chief Executive Officer, Ameriprise Certificate Company since 2006; Director and Chief Executive Officer, Columbia Management Investment Distributors, Inc. since May 2010 and February 2012, respectively (previously Chairman of the Board and Chief Executive Officer from 2008 to April 2010); Chairman of the Board and Chief Executive Officer, RiverSource Distributors, Inc. since 2006. | |
Thomas P. McGuire (Born 1972)
225 Franklin Street
Boston, MA 02110
Chief Compliance Officer (since 2012) | | Vice President — Asset Management Compliance, Columbia Management Investment Advisers, LLC since 2010; Chief Compliance Officer, Ameriprise Certificate Company, since September 2010; Compliance Executive, Bank of America, 2005-2010. | |
Colin Moore (Born 1958)
225 Franklin Street
Boston, MA 02110
Senior Vice President (since 2010) | | Director and Chief Investment Officer, Columbia Management Investment Advisers, LLC since May 2010; Manager, Managing Director and Chief Investment Officer of Columbia Management Advisors, LLC from 2007 to April 2010; Head of Equities, Columbia Management Advisors, LLC from 2002 to 2007. | |
Amy Johnson (Born 1965)
5228 Ameriprise Financial Center
Minneapolis, MN 55474
Vice President (since 2010) | | Senior Vice President and Chief Operating Officer, Columbia Management Investment Advisers, LLC since May 2010 (previously Chief Administrative Officer, from 2009 until April 2010, Vice President — Asset Management and Trust Company Services, from 2006 to 2009, and Vice President — Operations and Compliance from 2004 to 2006). | |
Joseph F. DiMaria (Born 1968)
225 Franklin Street
Boston, MA 02110
Vice President (since 2011) and Chief Accounting Officer (since 2008) | | Vice President, Mutual Fund Administration, Columbia Management Investment Advisers, LLC, since May 2010; Director of Fund Administration, Columbia Management Advisors, LLC from January 2006 to April 2010; Head of Tax/Compliance and Assistant Treasurer, Columbia Management Advisors, LLC, from November 2004 to December 2005. | |
Stephen T. Welsh (born 1957)
225 Franklin Street
Boston, MA 02110
Vice President (since 2006) | | President and Director, Columbia Management Investment Services Corp. since May 2010; President and Director, Columbia Management Services, Inc. from July 2004 to April 2010; Managing Director, Columbia Management Distributors, Inc. from August 2007 to April 2010. | |
Paul D. Pearson (born 1956)
10468 Ameriprise Financial Center
Minneapolis, MN 55474
Vice President and Assistant Treasurer (since 2011) | | Vice President, Investment Accounting, Columbia Management Investment Advisers, LLC, since May 2010; Vice President, Managed Assets, Investment Accounting, Ameriprise Financial Corporation. | |
Paul B. Goucher (born 1968)
5228 Ameriprise Financial Center
Minneapolis, MN 55474
Vice President and Assistant Secretary (since 2010) | | Vice President and Chief Counsel of Ameriprise Financial since January 2010 (formerly Vice President and Group Counsel from November 2008 to January 2010); Director, Managing Director and General Counsel of J. & W. Seligman & Co. Incorporated (Seligman) from July 2008 to November 2008 and Managing Director and Associate General Counsel of Seligman from January 2005 to July 2008. | |
Christopher O. Petersen (born 1970)
5228 Ameriprise Financial Center
Minneapolis, MN 55474
Vice President (since 2010) and Secretary (since 2011) | | Vice President and Chief Counsel, Ameriprise Financial since January 2010 (formerly Vice President and Group Counsel or Counsel from April 2004 to January 2010); Assistant Secretary of RiverSource Funds since January 2007; officer of Columbia Funds and affiliated funds since 2007. | |
Michael E. DeFao (born 1968)
225 Franklin Street
Boston, MA 02110
Vice President and Assistant Secretary (since 2011) | | Vice President and Chief Counsel, Ameriprise Financial since May 2010; Associate General Counsel, Bank of America from June 2005 to April 2010. | |
Annual Report 2012
76
Columbia Strategic Income Fund
Board Consideration and Approval of
Advisory Agreement
On June 6, 2012, the Board of Trustees (the "Board") and the Trustees who are not interested persons (as defined in the Investment Company Act of 1940) of the Trust (the "Independent Trustees") unanimously approved the continuation of the Investment Management Services Agreement (the "Advisory Agreement") with Columbia Management Investment Advisers, LLC (the "Investment Manager") with respect to Columbia Strategic Income Fund (the "Fund"), a series of the Trust. As detailed below, the Advisory Fees and Expenses Committee (the "Committee") and the Board met on multiple occasions to review and discuss, both among themselves and with the management team of the Investment Manager, materials provided by the Investment Manager before determining to approve the continuation of the Advisory Agreement.
In connection with their deliberations regarding the continuation of the Advisory Agreement, the Committee and the Board requested and evaluated materials from the Investment Manager regarding the Fund and the Advisory Agreement, and discussed these materials with representatives of the Investment Manager at the Committee meeting held on June 5, 2012 and at the Board meeting held on June 6, 2012. In addition, the Board considers matters bearing on the Advisory Agreement at most of its other meetings throughout the year and meets regularly with senior management of the Funds and the Investment Manager. Through the Board's Investment Oversight Committees, Trustees also meet with selected Fund portfolio managers and other investment personnel at various times throughout the year. The Committee and the Board also consulted with Fund counsel and with the Independent Trustees' independent legal counsel, who advised on the legal standard for consideration by the Board and otherwise assisted the Board in its deliberations. On June 5, 2012, the Committee recommended that the Board approve the continuation of the Advisory Agreement. On June 6, 2012, the Board, including the Independent Trustees, voting separately, unanimously approved the continuation of the Advisory Agreement for the Fund.
The Committee and the Board considered all information that they, their legal counsel, or the Investment Manager believed reasonably necessary to evaluate and to determine whether to approve the continuation of the Advisory Agreement. In their deliberations, the Trustees did not identify any particular information that was all-important or controlling, and individual Trustees may have attributed different weights to the various factors. The information and factors considered by the Committee and the Board in recommending for approval or approving the continuation of the Advisory Agreement for the Fund included the following:
• Information on the investment performance of the Fund relative to the performance of the Fund's benchmarks and the performance of a group of comparable mutual funds, as determined by an independent third-party data provider;
• Information on the Fund's advisory fees and total expenses, including information comparing the Fund's expenses to those of a group of comparable mutual funds, as determined by an independent third-party data provider;
• The Investment Manager's agreement to contractually limit or cap total operating expenses for the Fund so that total operating expenses (excluding certain fees and expenses, such as transaction costs and certain other investment related expenses, interest, taxes, acquired fund fees and expenses, and extraordinary expenses) would not exceed the median expenses of a group of comparable funds (as determined from time to time, generally annually, by an independent third-party data provider);
• The terms and conditions of the Advisory Agreement, including that the advisory fee rates payable by the Fund would not change;
• The terms and conditions of other agreements and arrangements with affiliates of the Investment Manager relating to the operations of the Fund, including the Administrative Services Agreement, the Distribution Agreement and the Transfer and Dividend Disbursing Agent Agreement, noting in the case of the Transfer and Dividend Disbursing Agent Agreement certain proposed changes to the fee rates payable thereunder;
• Descriptions of various functions performed by the Investment Manager under the Advisory Agreement, including portfolio management and portfolio trading practices;
• Information regarding the management fees and investment performance of any comparable portfolios of other clients of the Investment Manager, including institutional separate accounts; and
• The profitability to the Investment Manager and its affiliates from their relationships with the Fund.
Annual Report 2012
77
Columbia Strategic Income Fund
Board Consideration and Approval of
Advisory Agreement (continued)
Nature, Extent and Quality of Services to be Provided under the Advisory Agreement
The Committee and the Board considered the nature, extent and quality of services provided to the Fund by the Investment Manager and its affiliates under the Advisory Agreement and under separate agreements for the provision of transfer agency and administrative services, and the resources dedicated to the Fund and the other Columbia Funds by the Investment Manager and its affiliates. The Committee and the Board considered, among other things, the Investment Manager's ability to attract, motivate and retain highly qualified research, advisory and supervisory investment professionals (including personnel and other resources, compensation programs for personnel involved in fund management, reputation and other attributes), the portfolio management services provided by those investment professionals, the quality of the Investment Manager's investment research capabilities and trade execution services, and the other resources that the Investment Manager devotes to the Fund. The Committee and the Board also considered the potential benefits to shareholders of investing in a mutual fund that is part of a fund complex offering exposure to a variety of asset classes and investment disciplines and providing a variety of fund and shareholder services.
The Committee and the Board also considered the professional experience and qualifications of the senior personnel of the Investment Manager. The Committee and the Board noted the compliance programs of and the compliance-related resources provided to the Fund by the Investment Manager and its affiliates, and considered the Investment Manager's ability to provide administrative services to the Fund pursuant to a separate administrative services agreement, including the Investment Manager's ability to coordinate the activities of the Fund's other service providers. After reviewing these and related factors, the Committee and the Board concluded, within the context of their overall conclusions, that the expected nature, extent and quality of the services to be provided to the Fund under the Advisory Agreement supported the continuation of such agreement.
Investment Performance
The Committee and the Board reviewed information about the performance of the Fund over various time periods, including performance information relative to benchmarks and information based on reports of an independent third-party data provider that compared the performance of the Fund to the performance of a group of comparable mutual funds. The Committee and the Board also reviewed a description of the third party's methodology for identifying the Fund's peer groups for purposes of performance and expense comparisons. In the case of each Fund whose performance lagged that of a relevant peer group for certain (although not necessarily all) periods, the Committee and the Board concluded that other factors relevant to performance were sufficient, in light of other considerations, to warrant continuation of the Fund's Advisory Agreement. Those factors varied from fund to fund, but included one or more of the following: (i) that the Fund's performance, although lagging in certain recent periods, was stronger over the longer term; (ii) that the underperformance was attributable, to a significant extent, to investment decisions that were reasonable and consistent with the Fund's investment strategy and policies and that the Fund was performing within a reasonable range of expectations, given those investment decisions, market conditions and the Fund's investment strategy; (iii) that the Fund's performance was competitive when compared to other relevant performance benchmarks or peer groups; and (iv) that the Investment Manager had taken or was taking steps designed to help improve the Fund's investment performance, including, but not limited to, replacing portfolio managers, enhancing the resources supporting the portfolio managers, or modifying investment strategies.
The Committee and the Board noted that, through December 31, 2011, the Fund's performance was in the twelfth, eighty-second and thirty-third percentiles (where the best performance would be in the first percentile) of its category selected by an independent third-party data provider for the purposes of performance comparisons for the one-, three- and five- year periods, respectively.
The Committee and the Board also considered the Investment Manager's performance and reputation generally, the Investment Manager's historical responsiveness to Board concerns about performance and the Investment Manager's willingness to take steps intended to improve performance. After reviewing these and related factors, the Committee and the Board concluded, within the context of their overall conclusions regarding the Advisory Agreement, that the performance of the Fund and the Investment Manager was sufficient, in light of other considerations, to warrant the continuation of the Advisory Agreement.
Annual Report 2012
78
Columbia Strategic Income Fund
Board Consideration and Approval of
Advisory Agreement (continued)
Investment Advisory Fee Rates and Other Expenses
The Committee and the Board considered the advisory fees to be charged to the Fund under the Advisory Agreement as well as the total expenses to be incurred by the Fund. In assessing the reasonableness of the fees under the Advisory Agreement, the Committee and the Board considered, among other information, the Fund's advisory fee and its expected total expense ratio as a percentage of average daily net assets. The Committee and the Board noted that the Fund's actual management fee and total net expense ratio are both ranked in the third quintiles against the Fund's expense universe as determined by an independent third-party data provider for purposes of expense comparison. The Committee and the Board also took into account the fee waiver and expense limitation arrangements agreed to by the Investment Manager, as noted above.
The Committee and the Board also considered the fact that the advisory fee rates payable by the Fund to the Investment Manager under the Advisory Agreement were the same as those currently paid by the Fund to the Investment Manager.
The Committee and the Board also received and considered information about the advisory fees charged by the Investment Manager to institutional separate accounts. In considering the fees charged to those accounts, the Committee and the Board took into account, among other things, the Investment Manager's representations about the differences between managing mutual funds as compared to other types of accounts, including differences in the services provided, differences in the risk profile of such business for the Investment Manager and the additional resources required to manage mutual funds effectively. In evaluating the Fund's advisory fees, the Committee and the Board also took into account the demands, complexity and quality of the investment management of the Fund.
After reviewing these and related factors, the Committee and the Board concluded, within the context of their overall conclusions, that the advisory fee rates and expenses of the Fund supported the continuation of the Advisory Agreement.
Costs of Services to be Provided and Profitability
The Committee and the Board also took note of the costs of the services provided (both on an absolute and relative basis) and the profitability to the Investment Manager and its affiliates in connection with their relationships with the Fund. In evaluating these considerations, the Committee and the Board took note of the advisory fees charged by the Investment Manager to other clients, including fees charged by the Investment Manager to any institutional separate account clients with similar investment strategies to those of the Fund.
The Committee and the Board also considered the compensation directly or indirectly received by the Investment Manager's affiliates in connection with their relationships with the Fund. The Committee and the Board reviewed information provided by management as to the profitability of the Investment Manager and its affiliates of their relationships with the Fund, and information about the allocation of expenses used to calculate profitability. When reviewing profitability, the Committee and the Board also considered court cases in which adviser profitability was an issue in whole or in part, the performance of the fund, the expense ratio of the fund, and the implementation of expense limitations with respect to the fund. The Committee and the Board also considered information provided by the Investment Manager regarding its financial condition and comparing its profitability to that of other asset management firms that are, or are subsidiaries of, publicly traded companies.
After reviewing these and related factors, the Committee and the Board concluded, within the context of their overall conclusions, that the profitability to the Investment Manager and its affiliates from their relationships with the Fund supported the continuation of the Advisory Agreement.
Economies of Scale
The Committee and the Board considered the potential existence of economies of scale in the provision by the Investment Manager of services to the Fund, to groups of related funds, and to the Investment Manager's investment advisory clients as a whole, and whether those economies of scale were shared with the Fund through breakpoints in investment advisory fees or other means, such as expense limitation arrangements and additional investments by the Investment Manager in investment, trading and compliance resources. The Committee and the Board noted that the investment advisory fee schedules for the Fund contained breakpoints that would reduce the fee rate on assets above specified threshold levels.
In considering these issues, the Committee and the Board also considered the costs of the services provided (both on an absolute and relative basis) and the profitability to the Investment Manager and its affiliates from their relationships with the
Annual Report 2012
79
Columbia Strategic Income Fund
Board Consideration and Approval of
Advisory Agreement (continued)
Fund, as discussed above. After reviewing these and related factors, the Committee and the Board concluded, within the context of their overall conclusions, that the extent to which economies of scale were expected to be shared with the Fund supported the continuation of the Advisory Agreement.
Other Benefits to the Investment Manager
The Committee and the Board received and considered information regarding "fall-out" or ancillary benefits received by the Investment Manager and its affiliates as a result of their relationships with the Fund, such as the engagement of the Investment Manager to provide administrative services to the Fund and the engagement of the Investment Manager's affiliates to provide distribution and transfer agency services to the Fund. The Committee and the Board considered that the Fund's distributor retains a portion of the distribution fees from the Fund and receives a portion of the sales charges on sales or redemptions of certain classes of shares of the Fund. The Committee and the Board also considered the benefits of research made available to the Investment Manager by reason of brokerage commissions generated by the Fund's securities transactions, and reviewed information about the Investment Manager's practices with respect to allocating portfolio brokerage for brokerage and research services. The Committee and the Board considered the possible conflicts of interest associated with certain fall-out or other ancillary benefits and the reporting, disclosure and other processes that would be in place to address such possible conflicts of interest. The Committee and the Board recognized that the Investment Manager's profitability would be somewhat lower without these benefits.
Conclusion
The Committee and the Board reviewed all of the above considerations in reaching their decisions to recommend or approve the continuation of the Advisory Agreement. No single item was identified as paramount or controlling, and individual Trustees may have attributed different weights to various factors. Based on their evaluation of all factors that they deemed to be material, including those factors described above, and assisted by the advice of independent legal counsel, the Board, including the Independent Trustees, voting separately, unanimously approved the continuation of the Advisory Agreement.
Annual Report 2012
80
Columbia Strategic Income Fund
Important Information About This Report
Each fund mails one shareholder report to each shareholder address. If you would like more than one report, please call shareholder services at 800.345.6611 and additional reports will be sent to you.
The policy of the Board is to vote the proxies of the companies in which each fund holds investments consistent with the procedures as stated in the Statement of Additional Information (SAI). You may obtain a copy of the SAI without charge by calling 800.345.6611; contacting your financial intermediary; visiting columbiamanagement.com; or searching the website of the Securities and Exchange Commission (SEC) at sec.gov. Information regarding how each fund voted proxies relating to portfolio securities is filed with the SEC by August 31 for the most recent 12-month period ending June 30 of that year, and is available without charge by visiting columbiamanagement.com; or searching the website of the SEC at sec.gov.
Each fund files a complete schedule of portfolio holdings with the SEC for the first and third quarters of each fiscal year on Form N-Q. Each fund's Form N-Q is available on the SEC's website at sec.gov and may be reviewed and copied at the SEC's Public Reference Room in Washington, D.C. Information on the operation of the Public Reference Room may be obtained by calling 800.SEC.0330. Each fund's complete schedule of portfolio holdings, as filed on Form N-Q, can also be obtained without charge, upon request, by calling 800.345.6611.
Annual Report 2012
81

Columbia Strategic Income Fund
P.O. Box 8081
Boston, MA 02266-8081
columbiamanagement.com
This information is for use with concurrent or prior delivery of a fund prospectus. Please read and consider the investment objectives, risks, charges and expenses for any fund carefully before investing. For a prospectus which contains this and other important information about the Fund go to columbiamanagement.com. The Fund is distributed by Columbia Management Investment Distributors, Inc., member FINRA, and managed by Columbia Management Investment Advisers, LLC.
© 2012 Columbia Management Investment Advisers, LLC. All rights reserved.
C-1036 E (12/12)
Annual Report
October 31, 2012

Columbia California Tax-Exempt Fund
Not FDIC insured • No bank guarantee • May lose value
Columbia California Tax-Exempt Fund
 Dear Shareholders,
Stocks rebound around the world
After a weak second quarter, U.S. stock market averages rebounded in the third quarter, erasing earlier losses and boosting year-to-date returns well into double digits. Welcome news from Europe and additional quantitative easing in the United States by the Federal Reserve Board helped bolster the rally. The Standard & Poor's 500 Index (S&P 500 Index) rose 6.35% (total return) for the quarter. The Dow Jones Industrial Average advanced 4.32% for the same period. From the beginning of the calendar year through September 30, 2012, the S&P 500 Index was up 16.44% (total return). And, as of the end of September, the S&P 500 Index stood at 1,440 — approximately 8% below its all-time high of 1,565 that was set on October 9, 2007.
Outside the United States, stock markets of both developed and emerging market economies rebounded, as measured in U.S. dollars. Investors responded favorably to the announcement of policy measures aimed to resolve the eurozone crisis, which could potentially have a favorable impact on growth in emerging market economies. A weaker dollar also benefited returns to U.S. investors.
Solid gains for fixed income
Within fixed income, investors appeared to be increasingly willing to take on risk they abandoned higher quality sectors that dominated the performance rankings in the second quarter and favored riskier sectors, where yield spreads tightened by a significant margin. Fixed-income returns were strong, but unlike equities, they have been less volatile, accumulating steadily over the course of the year. Gains were the highest for high-yield and emerging market bonds. By contrast, government issued debt securities eked out smaller gains.
Stay on track with Columbia Management
Backed by more than 100 years of experience, Columbia Management is one of the nation's largest asset managers. At the heart of our success — and, most importantly, that of our investors — are highly talented industry professionals, brought together by a unique way of working. We are dedicated to helping you take advantage of today's opportunities and anticipate tomorrow's. We stay abreast of the latest investment trends and ideas, using our collective insight to evaluate events and transform them into solutions you can use.
Visit columbiamanagement.com for:
> The Columbia Management Perspectives blog, featuring timely posts by our investment teams
> Detailed up-to-date fund performance and portfolio information
> Economic analysis and market commentary
> Quarterly fund commentaries
> Columbia Management Investor, our award-winning quarterly newsletter for shareholders
Thank you for your continued support of the Columbia Funds. We look forward to serving your investment needs for many years to come.
Best Regards,

J. Kevin Connaughton
President, Columbia Funds
The S&P 500 Index, an unmanaged index, measures the performance of 500 widely held, large-capitalization U.S. stocks and is frequently used as a general measure of market performance. The Dow Jones Industrial Average is a price weighted average of 30 actively traded shares of blue chip US industrial corporations listed on the New York Stock Exchange. Indices are not available for investment, are not professionally managed and do not reflect sales charges, fees, brokerage commissions, taxes or other expenses of investing.
Investors should consider the investment objectives, risks, charges and expenses of a mutual fund carefully before investing. For a free prospectus, which contains this and other important information about a fund, visit columbiamanagement.com. The prospectus should be read carefully before investing.
Columbia Funds are distributed by Columbia Management Investment Distributors, Inc., member FINRA, and managed by Columbia Management Investment Advisers, LLC.
© 2012 Columbia Management Investment Advisers, LLC. All rights reserved.
Columbia California Tax-Exempt Fund
Performance Overview | | | 2 | | |
Manager Discussion of Fund Performance | | | 4 | | |
Understanding Your Fund's Expenses | | | 6 | | |
Portfolio of Investments | | | 7 | | |
Statement of Assets and Liabilities | | | 19 | | |
Statement of Operations | | | 21 | | |
Statement of Changes in Net Assets | | | 22 | | |
Financial Highlights | | | 24 | | |
Notes to Financial Statements | | | 28 | | |
Report of Independent Registered
Public Accounting Firm | | | 34 | | |
Federal Income Tax Information | | | 35 | | |
Trustees and Officers | | | 36 | | |
Board Consideration and Approval of Advisory Agreement | | | 39 | | |
Important Information About This Report | | | 45 | | |
Fund Investment Manager
Columbia Management Investment
Advisers, LLC
225 Franklin Street
Boston, MA 02110
Fund Distributor
Columbia Management Investment
Distributors, Inc.
225 Franklin Street
Boston, MA 02110
Fund Transfer Agent
Columbia Management Investment
Services Corp.
P.O. Box 8081
Boston, MA 02266-8081
For more information about any of the funds, please visit columbiamanagement.com or call 800.345.6611. Customer Service Representatives are available to answer your questions Monday through Friday from 8 a.m. to 8 p.m. Eastern time.
The views expressed in this report reflect the current views of the respective parties. These views are not guarantees of future performance and involve certain risks, uncertainties and assumptions that are difficult to predict, so actual outcomes and results may differ significantly from the views expressed. These views are subject to change at any time based upon economic, market or other conditions and the respective parties disclaim any responsibility to update such views. These views may not be relied on as investment advice and, because investment decisions for a Columbia Fund are based on numerous factors, may not be relied on as an indication of trading intent on behalf of any particular Columbia Fund. References to specific securities should not be construed as a recommendation or investment advice.
Columbia California Tax-Exempt Fund
Performance Summary
> Columbia California Tax-Exempt Fund (the Fund) Class A shares returned 12.63% excluding sales charges for the 12-month period that ended October 31, 2012.
> The Fund outperformed its benchmarks, the broader Barclays Municipal Bond Index and the Barclays California Municipal Bond Index, which returned 9.03% and 10.34%, respectively, for the period, as well as the average return of the Funds in its peer group, the Lipper California Municipal Debt Funds Classification, which returned 12.41% for the same 12 months.
> The Fund's credit-quality and interest-rate positioning aided performance, as did issue selection in certain sectors.
Average Annual Total Returns (%) (for period ended October 31, 2012)
| | Inception | | 1 Year | | 5 Years | | 10 Years | |
Class A | | 06/16/86 | | | | | | | | | | | | | |
Excluding sales charges | | | | | | | 12.63 | | | | 6.11 | | | | 5.26 | | |
Including sales charges | | | | | | | 7.25 | | | | 5.07 | | | | 4.75 | | |
Class B | | 08/04/92 | | | | | | | | | | | | | |
Excluding sales charges | | | | | | | 11.78 | | | | 5.32 | | | | 4.48 | | |
Including sales charges | | | | | | | 6.78 | | | | 4.99 | | | | 4.48 | | |
Class C | | 08/01/97 | | | | | | | | | | | | | |
Excluding sales charges | | | | | | | 12.12 | | | | 5.63 | | | | 4.79 | | |
Including sales charges | | | | | | | 11.12 | | | | 5.63 | | | | 4.79 | | |
Class Z* | | 09/19/05 | | | 13.05 | | | | 6.38 | | | | 5.45 | | |
Barclays Municipal Bond Index | | | | | | | 9.03 | | | | 6.02 | | | | 5.24 | | |
Barclays California Municipal Bond Index | | | | | | | 10.34 | | | | 6.10 | | | | 5.39 | | |
Lipper California Municipal Debt Funds Classification | | | | | | | 12.41 | | | | 5.34 | | | | 4.67 | | |
Returns for Class A are shown with and without the maximum initial sales charge of 4.75%. Returns for Class B are shown with and without the applicable contingent deferred sales charge (CDSC) of 5.00% in the first year, declining to 1.00% in the sixth year and eliminated thereafter. Returns for Class C are shown with and without the 1.00% CDSC for the first year only. The Fund's other classes are not subject to sales charges and have limited eligibility. Please see the Fund's prospectuses for details. Performance for different share classes will vary based on differences in sales charges and fees associated with each class. All results shown assume reinvestment of distributions during the period. Returns do not reflect the deduction of taxes that a shareholder may pay on Fund distributions or on the redemption of Fund shares. Performance results reflect the effect of any fee waivers or reimbursements of Fund expenses by Columbia Management Investment Advisers, LLC and/or any of its affiliates. Absent these fee waivers or expense reimbursement arrangements, performance results would have been lower.
The performance information shown represents past performance and is not a guarantee of future results. The investment return and principal value of your investment will fluctuate so that your shares, when redeemed, may be worth more or less than their original cost. Current performance may be lower or higher than the performance information shown. You may obtain performance information current to the most recent month-end by contacting your financial intermediary, visiting columbiamanagement.com or calling 800.345.6611.
*The returns shown for periods prior to the share class inception date (including returns since inception if shown, which are since Fund inception) include the returns of the Fund's oldest share class. These returns are adjusted to reflect any higher class-related operating expenses of the newer share classes, as applicable. Please visit columbiamanagement.com/mutual-funds/appended-performance for more information.
The Barclays California Municipal Bond Index is a subset of the Barclays Municipal Bond Index consisting solely of bonds issued by obligors located in the state of California.
The Barclays Municipal Bond Index is an unmanaged index considered representative of the broad market for investment-grade, tax-exempt bonds with a maturity of at least one year.
The Lipper California Municipal Debt Funds Classification is a calculation of average total returns of mutual funds that limit assets to those securities exempt from taxation in the state of California.
Indices are not available for investment, are not professionally managed and do not reflect sales charges, fees, brokerage commissions, taxes or other expenses of investing. Securities in the Fund may not match those in an index.
Annual Report 2012
2
Columbia California Tax-Exempt Fund
Performance Overview (continued)
Performance of a Hypothetical $10,000 Investment (November 1, 2002 – October 31, 2012)
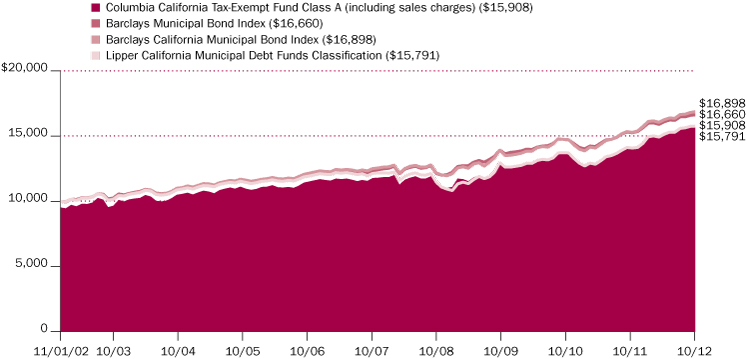
The chart above shows the change in value of a hypothetical $10,000 investment in Class A shares of Columbia California Tax-Exempt Fund during the stated time period, and does not reflect the deduction of taxes that a shareholder may pay on Fund distributions or on the redemption of Fund shares.
Annual Report 2012
3
Columbia California Tax-Exempt Fund
Manager Discussion of Fund Performance
For the 12-month period that ended October 31, 2012, the Fund's Class A shares returned 12.63% excluding sales charges, beating the broader Barclays Municipal Bond Index and the Barclays California Municipal Bond Index, which returned 9.03% and 10.34%, respectively. The Fund also edged out the 12.41% average return of its peer group, the Lipper California Municipal Debt Funds Classification. Overweights in longer-maturity, more interest-rate sensitive issues and higher-yielding, lower-quality investment-grade bonds helped relative performance. Positive security selection also aided results.
Municipal Bonds Rally as Yields Fall
Market conditions were favorable for municipal bonds over the 12-month period. Although the sovereign debt problems in Europe created global economic uncertainty, the U.S. economic outlook improved, with modest gains in employment, manufacturing and housing by period end. State tax collections rose, while budgets remained in check. Nationwide, strong investor demand for tax-exempt securities helped drive municipal bond yields down and prices up across all maturities. With interest rates declining and near all-time lows, investors sought the higher yields offered by bonds with maturities of 15 or more years and lower quality issues (with credit ratings of A or lower). Both market segments outperformed shorter-term and higher quality bonds by a sizable margin. Top performing sectors included industrial development/pollution control revenue, hospitals and leasing, all of which posted returns of 10% or more.
Gains from Long Maturity and Lower Credit Quality Bias
The Fund was well positioned to take advantage of the trends in force during the period, with an above-average sensitivity to interest rate changes and an overweight in longer-term bonds, whose yields declined the most across the maturity spectrum. In addition, long-term bond prices gained from a confluence of strong demand and decreased supply, which occurred as many issuers retired older, longer-maturity debt with higher interest costs and reFunded with new lower-rate, intermediate-maturity securities. An overweight in lower-quality investment-grade issues, notably hospital bonds, gave an additional boost as credit spreads — the difference between yields on high- and low-quality bonds — tightened. Strong security selection in the housing, education and industrial development/pollution control revenue sectors also helped. By contrast, issue selection in the water-and-sewer and hospital segments detracted from results, as did a small cash position.
Shifts in Sector Weights and Credit Exposure
To bolster total return, we increased the Fund's stake in higher-yielding, lower-quality investment-grade securities and trimmed exposure to higher quality issues. Additions included state-appropriated, special tax and BBB rated hospital debt. However, we reduced the Fund's investment in BBB-rated Commonwealth of Puerto Rico bonds because of mounting concerns about the issuer's fiscal health. We also lowered the weight in education and state general obligation (G.O.) bonds. The Fund maintained its sizable stake, however, in redevelopment agency (RDA) bonds even after a recent cost-saving measure eliminated the agencies. To prevent RDA bondholders from being harmed, the state set up successor agencies (SAs) tasked with ensuring timely interest and principal payments. Due to a lack of clarity about how the SAs would work, credit ratings agency Moody's downgraded all investment grade tax allocation municipal
Portfolio Management
Catherine Stienstra
Quality Breakdown (%)
(at October 31, 2012) | |
AAA rating | | | 2.0 | | |
AA rating | | | 18.2 | | |
A rating | | | 46.9 | | |
BBB rating | | | 21.7 | | |
Non-investment grade | | | 3.5 | | |
Not rated | | | 7.7 | | |
Total | | | 100.0 | | |
Percentages indicated are based upon total fixed income securities (excluding Money Market Funds).
Bond ratings apply to the underlying holdings of the Fund and not the Fund itself and are divided into categories ranging from AAA (highest) to D (lowest), and are subject to change. The ratings shown are determined by using the middle rating of Moody's, S&P, and Fitch after dropping the highest and lowest available ratings. When a rating from only two agencies is available, the lower rating is used. When a rating from only one agency is available, that rating is used. When a bond is not rated by any of these agencies, it is designated as Not rated. Credit ratings are subjective opinions and not statements of fact.
Annual Report 2012
4
Columbia California Tax-Exempt Fund
Manager Discussion of Fund Performance (continued)
bonds in the state to Ba1 in mid-June. We held on to the position, however, believing that strong security selection within the RDAs held in the Fund will benefit once the uncertainty dissipates.
Looking Ahead
Going forward, we will be monitoring closely what happens with the automatic federal spending cuts and tax increases scheduled for January 1, 2013. An increase in the tax rates for high-income earners, for example, would boost demand for municipal bonds, while potential elimination of the sector's tax-exempt status would pressure returns. As long as we expect credit spreads to tighten and short-term interest rates to remain low, the Fund will likely maintain a longer-maturity and lower quality bias within the investment-grade universe.
At period end, California — which has one of the highest tax rates nationwide — carried a low credit rating (A1), due in part to its high debt levels and tax revenue shortfalls. On the upside, voters recently passed Proposition 30, which temporarily raises both the personal income tax rate for higher-income filers and the sales tax, and Proposition 39, which requires multi-state businesses to calculate their California income tax liability based on the percentage of their sales in the state. Both measures should bolster future tax revenues, in turn aiding the credit outlook for state general obligation bonds. Given the ongoing possibility of more credit downgrades, however, we will rely heavily on the proprietary credit research of Columbia's in-house research team to guide security selection.
Annual Report 2012
5
Columbia California Tax-Exempt Fund
Understanding Your Fund's Expenses
(Unaudited)
As an investor, you incur two types of costs. There are transaction costs, which generally include sales charges on purchases and may include redemption fees. There are also ongoing costs, which generally include management fees, distribution and service (Rule 12b-1) fees, and other fund expenses. The following information is intended to help you understand your ongoing costs (in dollars) of investing in the Fund and to help you compare these costs with the ongoing costs of investing in other mutual funds.
Analyzing Your Fund's Expenses
To illustrate these ongoing costs, we have provided examples and calculated the expenses paid by investors in each share class of the Fund during the period. The actual and hypothetical information in the table is based on an initial investment of $1,000 at the beginning of the period indicated and held for the entire period. Expense information is calculated two ways and each method provides you with different information. The amount listed in the "Actual" column is calculated using the Fund's actual operating expenses and total return for the period. You may use the Actual information, together with the amount invested, to estimate the expenses that you paid over the period. Simply divide your account value by $1,000 (for example, an $8,600 account value divided by $1,000 = 8.6), then multiply the results by the expenses paid during the period under the Actual column. The amount listed in the "Hypothetical" column assumes a 5% annual rate of return before expenses (which is not the Fund's actual return) and then applies the Fund's actual expense ratio for the period to the hypothetical return. You should not use the hypothetical account values and expenses to estimate either your actual account balance at the end of the period or the expenses you paid during the period. See "Compare With Other Funds" below for details on how to use the hypothetical data.
Compare With Other Funds
Since all mutual funds are required to include the same hypothetical calculations about expenses in shareholder reports, you can use this information to compare the ongoing cost of investing in the Fund with other funds. To do so, compare the hypothetical example with the 5% hypothetical examples that appear in the shareholder reports of other funds. As you compare hypothetical examples of other funds, it is important to note that hypothetical examples are meant to highlight the ongoing costs of investing in a fund only and do not reflect any transaction costs, such as sales charges, or redemption or exchange fees. Therefore, the hypothetical calculations are useful in comparing ongoing costs only, and will not help you determine the relative total costs of owning different funds. If transaction costs were included in these calculations, your costs would be higher.
May 1, 2012 – October 31, 2012
| | Account Value at the Beginning
of the Period ($) | | Account Value at the End of the
Period ($) | | Expenses Paid During the
Period ($) | | Fund's Annualized
Expense Ratio (%) | |
| | Actual | | Hypothetical | | Actual | | Hypothetical | | Actual | | Hypothetical | | Actual | |
Class A | | | 1,000.00 | | | | 1,000.00 | | | | 1,047.30 | | | | 1,021.22 | | | | 4.01 | | | | 3.96 | | | | 0.78 | | |
Class B | | | 1,000.00 | | | | 1,000.00 | | | | 1,043.30 | | | | 1,017.44 | | | | 7.86 | | | | 7.76 | | | | 1.53 | | |
Class C | | | 1,000.00 | | | | 1,000.00 | | | | 1,044.90 | | | | 1,018.95 | | | | 6.32 | | | | 6.24 | | | | 1.23 | | |
Class Z | | | 1,000.00 | | | | 1,000.00 | | | | 1,049.90 | | | | 1,022.47 | | | | 2.73 | | | | 2.69 | | | | 0.53 | | |
Expenses paid during the period are equal to the annualized expense ratio for each class as indicated above, multiplied by the average account value over the period and then multiplied by the number of days in the Fund's most recent fiscal half year and divided by 366.
Expenses do not include fees and expenses incurred indirectly by the Fund from the underlying funds in which the Fund may invest (also referred to as "acquired funds"), including affiliated and non-affiliated pooled investment vehicles (including mutual funds and exchange-traded funds).
Had Columbia Management Investment Advisers, LLC and/or certain of its affiliates not waived/reimbursed certain fees and expenses, account value at the end of the period would have been reduced.
Annual Report 2012
6
Columbia California Tax-Exempt Fund
Portfolio of Investments
October 31, 2012
(Percentages represent value of investments compared to net assets)
Municipal Bonds 94.6%
Issue
Description | | Coupon
Rate | | Principal
Amount ($) | | Value ($) | |
Airport 3.0% | |
City of Los Angeles Department of Airports
Revenue Bonds
Series 2009A
05/15/34 | | | 5.000 | % | | | 1,000,000 | | | | 1,121,720 | | |
County of Orange Airport
Revenue Bonds
Series 2009A
07/01/39 | | | 5.250 | % | | | 2,500,000 | | | | 2,831,025 | | |
County of Sacramento Airport System
Revenue Bonds
Senior Series 2009B
07/01/39 | | | 5.750 | % | | | 3,000,000 | | | | 3,420,150 | | |
County of Sacramento Airport System(a)
Revenue Bonds
Senior Series 2008B (AGM) AMT
07/01/39 | | | 5.250 | % | | | 1,000,000 | | | | 1,082,250 | | |
San Diego County Regional Airport Authority
Refunding Revenue Bonds
Series 2005 (AMBAC) AMT(a)
07/01/20 | | | 5.250 | % | | | 750,000 | | | | 904,095 | | |
San Francisco City & County Airports Commission(a)
Refunding Revenue Bonds
2nd Series 2008-34E (AGM) AMT
05/01/25 | | | 5.750 | % | | | 1,500,000 | | | | 1,726,605 | | |
2nd Series 2011F AMT
05/01/29 | | | 5.000 | % | | | 5,210,000 | | | | 5,829,052 | | |
Total | | | | | | | 16,914,897 | | |
Disposal 0.4% | |
California Pollution Control Financing Authority
Refunding Revenue Bonds
Waste Management
Series 2002A AMT(a)
01/01/22 | | | 5.000 | % | | | 2,000,000 | | | | 2,198,560 | | |
Higher Education 4.6% | |
California Educational Facilities Authority
Revenue Bonds
California College of the Arts
Series 2005
06/01/26 | | | 5.000 | % | | | 1,000,000 | | | | 1,026,750 | | |
06/01/35 | | | 5.000 | % | | | 1,500,000 | | | | 1,529,775 | | |
California Lutheran University
Series 2008
10/01/21 | | | 5.250 | % | | | 665,000 | | | | 741,349 | | |
10/01/38 | | | 5.750 | % | | | 3,000,000 | | | | 3,220,140 | | |
Chapman University
Series 2011
04/01/31 | | | 5.000 | % | | | 4,375,000 | | | | 4,924,412 | | |
Loyola Marymount University
Series 2010A
10/01/40 | | | 5.125 | % | | | 1,250,000 | | | | 1,372,988 | | |
Municipal Bonds (continued)
Issue
Description | | Coupon
Rate | | Principal
Amount ($) | | Value ($) | |
Scripps College
Series 2001
08/01/31 | | | 5.000 | % | | | 1,500,000 | | | | 1,502,505 | | |
Woodbury University
Series 2006
01/01/25 | | | 5.000 | % | | | 1,830,000 | | | | 1,863,324 | | |
California Municipal Finance Authority
Revenue Bonds
Biola University
Series 2008
10/01/28 | | | 5.800 | % | | | 2,000,000 | | | | 2,199,220 | | |
Emerson College
Series 2011
01/01/42 | | | 6.000 | % | | | 1,250,000 | | | | 1,479,175 | | |
California State University
Revenue Bonds
Systemwide
Series 2009A
11/01/40 | | | 6.000 | % | | | 2,000,000 | | | | 2,355,820 | | |
California Statewide Communities Development Authority
Revenue Bonds
San Francisco Art Institute
Series 2002(b)
04/01/32 | | | 7.375 | % | | | 1,750,000 | | | | 1,775,042 | | |
University of California
Revenue Bonds
Series 2008D
05/15/27 | | | 5.000 | % | | | 1,500,000 | | | | 1,702,605 | | |
Total | | | | | | | 25,693,105 | | |
Hospital 14.3% | |
ABAG Finance Authority for Nonprofit Corps.
Revenue Bonds
Sharp Healthcare
Series 2012A
08/01/27 | | | 5.000 | % | | | 900,000 | | | | 1,027,557 | | |
California Health Facilities Financing Authority
Refunding Revenue Bonds
Cedars Sinai Medical Center
Series 2005
11/15/34 | | | 5.000 | % | | | 4,025,000 | | | | 4,363,462 | | |
Revenue Bonds
Adventist Health System West
Series 2009A
09/01/39 | | | 5.750 | % | | | 7,000,000 | | | | 8,073,590 | | |
Catholic Healthcare
Series 2011A
03/01/41 | | | 5.250 | % | | | 3,000,000 | | | | 3,346,650 | | |
Catholic Healthcare West
Series 2009A
07/01/39 | | | 6.000 | % | | | 1,000,000 | | | | 1,182,650 | | |
Series 2009E
07/01/25 | | | 5.625 | % | | | 1,125,000 | | | | 1,303,661 | | |
The accompanying Notes to Financial Statements are an integral part of this statement.
Annual Report 2012
7
Columbia California Tax-Exempt Fund
Portfolio of Investments (continued)
October 31, 2012
Municipal Bonds (continued)
Issue
Description | | Coupon
Rate | | Principal
Amount ($) | | Value ($) | |
Cedars Sinai Medical Center
Series 2009
08/15/39 | | | 5.000 | % | | | 8,150,000 | | | | 8,882,603 | | |
Children's Hospital
Series 2011A
11/01/41 | | | 5.250 | % | | | 5,000,000 | | | | 5,564,400 | | |
Kaiser Permanente
Series 2006A
04/01/39 | | | 5.250 | % | | | 3,350,000 | | | | 3,564,902 | | |
Providence Health & Services
Series 2008C
10/01/28 | | | 6.250 | % | | | 500,000 | | | | 595,545 | | |
Scripps Health
Series 2010A
11/15/36 | | | 5.000 | % | | | 750,000 | | | | 825,045 | | |
St. Joseph Health System
Series 2009A
07/01/29 | | | 5.500 | % | | | 1,500,000 | | | | 1,751,625 | | |
Sutter Health
Series 2008A
08/15/30 | | | 5.000 | % | | | 2,500,000 | | | | 2,738,725 | | |
Series 2011B
08/15/31 | | | 5.875 | % | | | 1,815,000 | | | | 2,190,360 | | |
Unrefunded Revenue Bonds
Providence Health
Series 2008
10/01/38 | | | 6.500 | % | | | 1,470,000 | | | | 1,749,609 | | |
California Municipal Finance Authority
Certificate of Participation
Community Hospital of Central California
Series 2007
02/01/37 | | | 5.250 | % | | | 2,500,000 | | | | 2,586,275 | | |
Revenue Bonds
Community Hospitals of Central California
Series 2009
02/01/39 | | | 5.500 | % | | | 4,000,000 | | | | 4,264,840 | | |
California Statewide Communities Development Authority
Revenue Bonds
Catholic Healthcare West
Series 2008B
07/01/30 | | | 5.500 | % | | | 1,950,000 | | | | 2,186,906 | | |
John Muir Health
Series 2006A
08/15/32 | | | 5.000 | % | | | 3,000,000 | | | | 3,298,890 | | |
Series 2009
07/01/39 | | | 5.125 | % | | | 500,000 | | | | 539,280 | | |
Kaiser Permanente
Series 2006B
03/01/45 | | | 5.250 | % | | | 1,000,000 | | | | 1,061,350 | | |
Series 2012A
04/01/42 | | | 5.000 | % | | | 2,500,000 | | | | 2,768,950 | | |
Sutter Health
Series 2011A
08/15/42 | | | 6.000 | % | | | 2,000,000 | | | | 2,403,120 | | |
Various Kaiser
Series 2001C
08/01/31 | | | 5.250 | % | | | 1,100,000 | | | | 1,229,030 | | |
Municipal Bonds (continued)
Issue
Description | | Coupon
Rate | | Principal
Amount ($) | | Value ($) | |
City of Marysville
Revenue Bonds
Fremont-Rideout Health
Series 2011
01/01/42 | | | 5.250 | % | | | 4,000,000 | | | | 4,356,840 | | |
City of Newport Beach
Revenue Bonds
Hoag Memorial Presbyterian Hospital
Series 2011
12/01/40 | | | 6.000 | % | | | 1,000,000 | | | | 1,232,480 | | |
City of Torrance
Revenue Bonds
Torrance Memorial Medical Center
Series 2010A
09/01/30 | | | 5.000 | % | | | 3,000,000 | | | | 3,292,920 | | |
Palomar Pomerado Health
Certificate of Participation
Series 2009
11/01/39 | | | 6.750 | % | | | 350,000 | | | | 395,273 | | |
Sierra View Local Health Care District
Revenue Bonds
Series 2007
07/01/37 | | | 5.250 | % | | | 3,500,000 | | | | 3,627,050 | | |
Total | | | | | | | 80,403,588 | | |
Investor Owned 0.9% | |
City of Chula Vista
Revenue Bonds
San Diego Gas & Electric Co.
Series 2004D
01/01/34 | | | 5.875 | % | | | 1,000,000 | | | | 1,179,730 | | |
City of Chula Vista(a)
Revenue Bonds
San Diego Gas & Electric Co.
Series 2005D AMT
12/01/27 | | | 5.000 | % | | | 3,500,000 | | | | 3,906,070 | | |
Total | | | | | | | 5,085,800 | | |
Joint Power Authority 0.4% | |
California Infrastructure & Economic Development Bank
Revenue Bonds
California Independent System Operator
Series 2009A
02/01/39 | | | 6.250 | % | | | 2,000,000 | | | | 2,188,800 | | |
Local Appropriation 3.0% | |
Anaheim Public Financing Authority
Subordinated Revenue Bonds
Public Improvements Project
Series 1997C (AGM)
09/01/14 | | | 6.000 | % | | | 2,000,000 | | | | 2,187,580 | | |
The accompanying Notes to Financial Statements are an integral part of this statement.
Annual Report 2012
8
Columbia California Tax-Exempt Fund
Portfolio of Investments (continued)
October 31, 2012
Municipal Bonds (continued)
Issue
Description | | Coupon
Rate | | Principal
Amount ($) | | Value ($) | |
City of Modesto
Certificate of Participation
Community Center Refinancing Project
Series 1993A (AMBAC)
11/01/23 | | | 5.000 | % | | | 2,235,000 | | | | 2,315,415 | | |
County of San Joaquin
Certificate of Participation
Capital Facilities Project
Series 1993 (NPFGC)
11/15/13 | | | 5.500 | % | | | 620,000 | | | | 628,079 | | |
Los Angeles Municipal Improvement Corp.
Revenue Bonds
Capital Equipment
Series 2008A
09/01/24 | | | 5.000 | % | | | 1,000,000 | | | | 1,104,370 | | |
Series 2008B | |
09/01/38 | | | 5.000 | % | | | 3,000,000 | | | | 3,215,820 | | |
Pico Rivera Public Financing Authority
Revenue Bonds
Series 2009
09/01/31 | | | 5.500 | % | | | 1,500,000 | | | | 1,698,375 | | |
San Mateo County Board of Education
Refunding Certificate of Participation
Series 2009
06/01/35 | | | 5.250 | % | | | 2,000,000 | | | | 2,255,500 | | |
Victor Elementary School District
Certificate of Participation
School Construction Refinancing
Series 1996 (NPFGC)
05/01/18 | | | 6.450 | % | | | 3,035,000 | | | | 3,272,792 | | |
Total | | | | | | | 16,677,931 | | |
Local General Obligation 5.9% | |
Central Valley Schools Financing Authority
Refunding Revenue Bonds
School District General Obligation Bond Program
Series 1998A (NPFGC)
02/01/18 | | | 6.450 | % | | | 855,000 | | | | 937,781 | | |
Culver City School Facilities Financing Authority
Revenue Bonds
Culver City United School District
Series 2005 (AGM)
08/01/26 | | | 5.500 | % | | | 1,750,000 | | | | 2,344,107 | | |
East Side Union High School District
Unlimited General Obligation Refunding Bonds
Series 2003B (NPFGC)
08/01/26 | | | 5.250 | % | | | 2,010,000 | | | | 2,451,979 | | |
Grossmont Healthcare District
Unlimited General Obligation Bonds
2006 Election
Series 2011B
07/15/34 | | | 6.000 | % | | | 2,000,000 | | | | 2,458,320 | | |
Municipal Bonds (continued)
Issue
Description | | Coupon
Rate | | Principal
Amount ($) | | Value ($) | |
Jefferson Union High School District
Unlimited General Obligation Refunding Bonds
Series 2000A (NPFGC)
08/01/25 | | | 6.450 | % | | | 1,000,000 | | | | 1,309,310 | | |
Lakeside Union School District San Diego County
Unlimited General Obligation Bonds
Series 2009
08/01/33 | | | 5.000 | % | | | 3,340,000 | | | | 3,797,747 | | |
Los Angeles Unified School District
Unlimited General Obligation Bonds
Series 2009D
01/01/34 | | | 5.000 | % | | | 750,000 | | | | 849,443 | | |
Manteca Unified School District
Unlimited General Obligation Bonds
Capital Appreciation-Election of 2004
Series 2006 (NPFGC)(c)
08/01/32 | | | 0.000 | % | | | 5,440,000 | | | | 1,780,131 | | |
Menifee Union School District
Unlimited General Obligation Bonds
Election of 2008
Series 2008A
08/01/33 | | | 5.500 | % | | | 3,125,000 | | | | 3,497,844 | | |
New Haven Unified School District
Unlimited General Obligation Refunding Bonds
Series 2002 (AGM)
08/01/17 | | | 12.000 | % | | | 1,565,000 | | | | 2,348,987 | | |
Oakland Unified School District/Alameda County
Unlimited General Obligation Bonds
Election of 2006
Series 2012A
08/01/22 | | | 5.000 | % | | | 750,000 | | | | 833,543 | | |
08/01/32 | | | 5.500 | % | | | 2,500,000 | | | | 2,785,175 | | |
Rocklin Unified School District
Unlimited General Obligation Bonds
Capital Appreciation
Series 1995C (NPFGC)(c)
07/01/20 | | | 0.000 | % | | | 3,460,000 | | | | 2,731,047 | | |
San Bernardino Community College District
Unlimited General Obligation Bonds
Election of 2002
Series 2008A
08/01/33 | | | 6.250 | % | | | 1,000,000 | | | | 1,197,860 | | |
San Marino Unified School District
Unlimited General Obligation Bonds
Series 1998B
06/01/23 | | | 5.000 | % | | | 1,000,000 | | | | 1,263,170 | | |
Simi Valley Unified School District
Refunding Certificate of Participation
Capital Improvement Projects
Series 1998 (AMBAC)
08/01/22 | | | 5.250 | % | | | 925,000 | | | | 1,029,386 | | |
The accompanying Notes to Financial Statements are an integral part of this statement.
Annual Report 2012
9
Columbia California Tax-Exempt Fund
Portfolio of Investments (continued)
October 31, 2012
Municipal Bonds (continued)
Issue
Description | | Coupon
Rate | | Principal
Amount ($) | | Value ($) | |
West Contra Costa Unified School District
Unlimited General Obligation Refunding Bonds
Series 2012
08/01/32 | | | 5.000 | % | | | 1,650,000 | | | | 1,860,144 | | |
Total | | | | | | | 33,475,974 | | |
Multi-Family 2.5% | |
California Housing Finance Agency
Revenue Bonds
Multifamily Housing III
Series 1999A AMT(a)
02/01/36 | | | 5.375 | % | | | 2,280,000 | | | | 2,281,824 | | |
California Statewide Communities Development Authority
Refunding Revenue Bonds
Quail Ridge Apartments
Senior Series 2002E-1
07/01/32 | | | 5.375 | % | | | 2,000,000 | | | | 1,693,200 | | |
University of California Irvine East Campus Apartments
Series 2006
05/15/38 | | | 5.000 | % | | | 2,500,000 | | | | 2,554,375 | | |
Series 2012
05/15/31 | | | 5.125 | % | | | 2,000,000 | | | | 2,181,000 | | |
Revenue Bonds
CHF-Irvine LLC-UCI East Campus
Series 2008
05/15/17 | | | 5.000 | % | | | 1,600,000 | | | | 1,816,192 | | |
University of California Irvine East Campus Apartments
Series 2008
05/15/32 | | | 5.750 | % | | | 1,500,000 | | | | 1,620,720 | | |
Munimae TE Bond Subsidiary LLC
Series 2004A-2 AMT(a)(b)(d)
06/29/49 | | | 4.900 | % | | | 2,000,000 | | | | 1,819,960 | | |
Total | | | | | | | 13,967,271 | | |
Municipal Power 4.6% | |
Anaheim Public Financing Authority
Revenue Bonds
Anaheim Electric Systems Distribution
Series 2009
10/01/25 | | | 5.000 | % | | | 1,000,000 | | | | 1,151,020 | | |
California State Department of Water Resources
Revenue Bonds
Series 2010M
05/01/15 | | | 5.000 | % | | | 4,500,000 | | | | 5,006,070 | | |
City of Redding
Certificate of Participation
Series 2008A (AGM)
06/01/27 | | | 5.000 | % | | | 865,000 | | | | 965,556 | | |
City of Riverside Electric
Revenue Bonds
Series 2008D (AGM)
10/01/28 | | | 5.000 | % | | | 1,325,000 | | | | 1,489,817 | | |
Municipal Bonds (continued)
Issue
Description | | Coupon
Rate | | Principal
Amount ($) | | Value ($) | |
City of Vernon Electric System
Revenue Bonds
Series 2009A
08/01/21 | | | 5.125 | % | | | 2,730,000 | | | | 3,073,106 | | |
Series 2012A
08/01/30 | | | 5.000 | % | | | 1,000,000 | | | | 1,090,140 | | |
Imperial Irrigation District
Refunding Revenue Bonds
System
Series 2011A
11/01/31 | | | 6.250 | % | | | 1,000,000 | | | | 1,242,090 | | |
Los Angeles Department of Water & Power
Revenue Bonds
Power System
Subordinated Series 2008A-1
07/01/38 | | | 5.250 | % | | | 1,750,000 | | | | 2,040,973 | | |
Modesto Irrigation District
Certificate of Participation
Series 2004B
07/01/35 | | | 5.500 | % | | | 2,000,000 | | | | 2,186,680 | | |
Puerto Rico Electric Power Authority
Revenue Bonds
Series 2008WW(e)
07/01/28 | | | 5.000 | % | | | 1,500,000 | | | | 1,534,050 | | |
Sacramento Municipal Utility District
Revenue Bonds
Series 1997K (AMBAC)
07/01/24 | | | 5.250 | % | | | 2,220,000 | | | | 2,760,637 | | |
Southern California Public Power Authority
Revenue Bonds
Milford Wind Corridor Project
Series 2010-1
07/01/30 | | | 5.000 | % | | | 500,000 | | | | 578,340 | | |
Walnut Energy Center Authority
Revenue Bonds
Series 2004A (AMBAC)
01/01/29 | | | 5.000 | % | | | 2,500,000 | | | | 2,561,150 | | |
Total | | | | | | | 25,679,629 | | |
Other Bond Issue 1.1% | |
California Infrastructure & Economic Development Bank
Revenue Bonds
Series 2008
02/01/33 | | | 5.250 | % | | | 3,000,000 | | | | 3,257,130 | | |
02/01/38 | | | 5.250 | % | | | 3,050,000 | | | | 3,270,515 | | |
Total | | | | | | | 6,527,645 | | |
Ports 1.0% | |
Port Commission of the City & County of San Francisco
Revenue Bonds
Series 2010A
03/01/40 | | | 5.125 | % | | | 5,000,000 | | | | 5,517,850 | | |
The accompanying Notes to Financial Statements are an integral part of this statement.
Annual Report 2012
10
Columbia California Tax-Exempt Fund
Portfolio of Investments (continued)
October 31, 2012
Municipal Bonds (continued)
Issue
Description | | Coupon
Rate | | Principal
Amount ($) | | Value ($) | |
Prep School 0.3% | |
California Statewide Communities Development Authority
Revenue Bonds
Aspire Public Schools
Series 2010
07/01/30 | | | 6.000 | % | | | 1,430,000 | | | | 1,475,889 | | |
Prepaid Gas 0.2% | |
M-S-R Energy Authority
Revenue Bonds
Series 2009B
11/01/34 | | | 7.000 | % | | | 1,000,000 | | | | 1,455,220 | | |
Refunded/Escrowed 3.0% | |
California Health Facilities Financing Authority
Prerefunded 10/01/18 Revenue Bonds
Providence Health
Series 2008
10/01/38 | | | 6.500 | % | | | 30,000 | | | | 39,421 | | |
City of Pomona
Refunding Revenue Bonds
Series 1990B Escrowed to Maturity (GNMA/FHLMC)
08/01/23 | | | 7.500 | % | | | 900,000 | | | | 1,198,125 | | |
City of Redding
Revenue Bonds
Series 1992 Escrowed to Maturity (NPFGC)(f)
07/01/22 | | | 12.132 | % | | | 435,000 | | | | 642,016 | | |
County of Riverside
Revenue Bonds
Series 1989A Escrowed to Maturity (GNMA) AMT(a)
05/01/21 | | | 7.800 | % | | | 2,500,000 | | | | 3,590,950 | | |
Los Angeles Harbor Department
Revenue Bonds
Series 1988 Escrowed to Maturity
10/01/18 | | | 7.600 | % | | | 530,000 | | | | 642,471 | | |
San Joaquin Hills Transportation Corridor Agency
Revenue Bonds
Senior Lien
Series 1993 Escrowed to Maturity(c)
01/01/20 | | | 0.000 | % | | | 12,000,000 | | | | 10,750,560 | | |
Total | | | | | | | 16,863,543 | | |
Resource Recovery 0.9% | |
California Municipal Finance Authority(a)(b)
Revenue Bonds
UTS Renewable Energy - Waste Water
Series 2011 AMT
12/01/15 | | | 3.950 | % | | | 2,100,000 | | | | 2,101,428 | | |
12/01/32 | | | 7.500 | % | | | 2,885,000 | | | | 3,058,215 | | |
Total | | | | | | | 5,159,643 | | |
Municipal Bonds (continued)
Issue
Description | | Coupon
Rate | | Principal
Amount ($) | | Value ($) | |
Retirement Communities 1.6% | |
ABAG Finance Authority for Nonprofit Corps.
Refunding Revenue Bonds
Episcopal Senior Communities
Series 2011
07/01/31 | | | 6.000 | % | | | 2,200,000 | | | | 2,531,628 | | |
Revenue Bonds
Odd Fellows Home of California
Series 2012A
04/01/42 | | | 5.000 | % | | | 1,000,000 | | | | 1,088,920 | | |
California Health Facilities Financing Authority
Revenue Bonds
Insured Episcopal Home
Series 2010B
02/01/32 | | | 6.000 | % | | | 2,000,000 | | | | 2,260,180 | | |
California Statewide Communities Development Authority
Revenue Bonds
American Baptist Homes West
Series 2010
10/01/39 | | | 6.250 | % | | | 1,500,000 | | | | 1,638,645 | | |
Eskaton Properties, Inc.
Series 2012
11/15/34 | | | 5.250 | % | | | 1,250,000 | | | | 1,331,275 | | |
Total | | | | | | | 8,850,648 | | |
Single Family 0.6% | |
California Housing Finance Agency(a)
Revenue Bonds
Home Mortgage
Series 2006H (FGIC) AMT
08/01/30 | | | 5.750 | % | | | 735,000 | | | | 766,686 | | |
Series 2006K AMT
08/01/26 | | | 4.625 | % | | | 2,500,000 | | | | 2,435,100 | | |
02/01/42 | | | 5.500 | % | | | 370,000 | | | | 383,102 | | |
Total | | | | | | | 3,584,888 | | |
Special Non Property Tax 1.0% | |
Riverside County Transportation Commission
Revenue Bonds
Limited Tax
Series 2010A
06/01/32 | | | 5.000 | % | | | 5,000,000 | | | | 5,659,150 | | |
Special Property Tax 17.4% | |
Anaheim Community Facilities District No. 06-2
Special Tax Bonds
Stadium Lofts
Series 2007
09/01/37 | | | 5.000 | % | | | 1,000,000 | | | | 987,320 | | |
Bakersfield Redevelopment Agency
Tax Allocation Bonds
Old Town Kern Pioneer
Series 2009A
08/01/29 | | | 7.500 | % | | | 1,845,000 | | | | 2,002,360 | | |
The accompanying Notes to Financial Statements are an integral part of this statement.
Annual Report 2012
11
Columbia California Tax-Exempt Fund
Portfolio of Investments (continued)
October 31, 2012
Municipal Bonds (continued)
Issue
Description | | Coupon
Rate | | Principal
Amount ($) | | Value ($) | |
Southeast Bakersfield
Series 2009B
08/01/29 | | | 7.250 | % | | | 860,000 | | | | 946,482 | | |
Carson Redevelopment Agency
Tax Allocation Bonds
Housing
Series 2010A
10/01/30 | | | 5.000 | % | | | 4,999,999 | | | | 5,284,100 | | |
Cerritos Public Financing Authority
Tax Allocation Bonds
Los Coyotes Redevelopment Project Loan
Series 1993A (AMBAC)
11/01/23 | | | 6.500 | % | | | 2,000,000 | | | | 2,357,400 | | |
Chino Public Financing Authority
Refunding Special Tax Bonds
Series 2012
09/01/30 | | | 5.000 | % | | | 2,500,000 | | | | 2,604,350 | | |
09/01/38 | | | 5.000 | % | | | 625,000 | | | | 634,669 | | |
City of Carson
Special Assessment Bonds
District No. 92-1
Series 1992
09/02/22 | | | 7.375 | % | | | 105,000 | | | | 105,718 | | |
City of Palo Alto
Refunding & Improvement Special Assessment Bonds
Limited Obligation-University Ave.
Series 2012
09/02/29 | | | 5.000 | % | | | 800,000 | | | | 883,664 | | |
City of Redwood
Special Tax Bonds
Community Facilities District 1
Series 2003B
09/01/28 | | | 5.950 | % | | | 750,000 | | | | 758,558 | | |
City of Yucaipa
Refunding Special Tax Bonds
Community Facilities District No. 98-1
Series 2011
09/01/30 | | | 5.375 | % | | | 1,500,000 | | | | 1,633,485 | | |
Eastern Municipal Water District
Special Tax Bonds
District No. 2004-27 Cottonwood
Series 2006
09/01/27 | | | 5.000 | % | | | 190,000 | | | | 194,148 | | |
09/01/36 | | | 5.000 | % | | | 480,000 | | | | 483,960 | | |
Elk Grove Unified School District
Refunding Special Tax Bonds
Community Facilities District No. 1
Series 1995 (AMBAC)
12/01/24 | | | 6.500 | % | | | 3,000,000 | | | | 3,680,580 | | |
Municipal Bonds (continued)
Issue
Description | | Coupon
Rate | | Principal
Amount ($) | | Value ($) | |
Elk Grove Unified School District(c)
Refunding Special Tax Bonds
Capital Appreciation-Community Facilities No. 1
Series 1995 (AMBAC)
12/01/18 | | | 0.000 | % | | | 2,720,000 | | | | 2,008,774 | | |
Folsom Redevelopment Agency
Tax Allocation Bonds
Central Folsom Redevelopment Project
Series 2009
08/01/29 | | | 5.125 | % | | | 1,000,000 | | | | 1,065,910 | | |
08/01/36 | | | 5.500 | % | | | 1,000,000 | | | | 1,072,610 | | |
Inglewood Redevelopment Agency
Refunding Tax Allocation Bonds
Merged Redevelopment Project
Series 1998A (AMBAC)
05/01/23 | | | 5.250 | % | | | 2,100,000 | | | | 2,323,272 | | |
Lammersville School District Community
Facilities District No. 2002
Special Tax Bonds
Mountain House
Series 2006
09/01/35 | | | 5.125 | % | | | 1,000,000 | | | | 1,003,900 | | |
Lancaster Financing Authority
Subordinated Tax Allocation Bonds
No. 5 & 6 Redevelopment Projects
Series 2003 (NPFGC)
02/01/17 | | | 5.125 | % | | | 1,270,000 | | | | 1,328,788 | | |
Long Beach Bond Finance Authority
Tax Allocation Bonds
Series 2006C (AMBAC)
08/01/31 | | | 5.500 | % | | | 3,250,000 | | | | 3,373,532 | | |
Los Angeles Community Redevelopment Agency
Tax Allocation Bonds
Hollywood Redevelopment Project
Series 1998C (NPFGC)
07/01/18 | | | 5.375 | % | | | 1,665,000 | | | | 1,844,870 | | |
Los Angeles County Public Works Financing Authority
Refunding Revenue Bonds
Senior Lien
Series 1996A (AGM)
10/01/18 | | | 5.500 | % | | | 1,780,000 | | | | 2,020,247 | | |
Mountain View Shoreline Regional Park Community
Tax Allocation Bonds
Series 2011A
08/01/35 | | | 5.625 | % | | | 1,300,000 | | | | 1,448,486 | | |
08/01/40 | | | 5.750 | % | | | 2,000,000 | | | | 2,235,760 | | |
Oakdale Public Financing Authority
Tax Allocation Bonds
Central City Redevelopment Project
Series 2004
06/01/33 | | | 5.375 | % | | | 1,500,000 | | | | 1,509,075 | | |
The accompanying Notes to Financial Statements are an integral part of this statement.
Annual Report 2012
12
Columbia California Tax-Exempt Fund
Portfolio of Investments (continued)
October 31, 2012
Municipal Bonds (continued)
Issue
Description | | Coupon
Rate | | Principal
Amount ($) | | Value ($) | |
Oakland Redevelopment Agency
Refunding Senior Tax Allocation Bonds
Central District Redevelopment
Series 1992 (AMBAC)
02/01/14 | | | 5.500 | % | | | 3,040,000 | | | | 3,127,491 | | |
Oceanside Community Facilities District
Special Tax Bonds
Ocean Ranch Corp.
Series 2004
09/01/34 | | | 5.875 | % | | | 1,000,000 | | | | 1,011,400 | | |
Orange County Community Facilities District
Special Tax Bonds
Ladera Ranch
Series 2004A
08/15/34 | | | 5.625 | % | | | 850,000 | | | | 857,761 | | |
Orange Unified School District Community
Facilities District No. 2005-2
Special Tax Bonds
Del Rio School Facilities
Series 2007
09/01/37 | | | 5.000 | % | | | 1,000,000 | | | | 987,320 | | |
Palmdale Civic Authority
Refunding Revenue Bonds
Redevelopment Project No. 1
Series 2009A
07/01/27 | | | 6.000 | % | | | 4,780,000 | | | | 5,484,811 | | |
Pittsburg Redevelopment Agency
Tax Allocation Bonds
Los Medanos Community Development Project
Series 1999 (AMBAC)(c)
08/01/24 | | | 0.000 | % | | | 2,100,000 | | | | 1,152,354 | | |
Poway Unified School District
Special Tax Bonds
Community Facilities District No. 6-4S Ranch
Series 2012
09/01/31 | | | 5.000 | % | | | 1,370,000 | | | | 1,478,093 | | |
09/01/33 | | | 5.000 | % | | | 1,000,000 | | | | 1,073,850 | | |
Rancho Cucamonga Redevelopment Agency
Tax Allocation Bonds
Housing Set Aside
Series 2007A (NPFGC)
09/01/34 | | | 5.000 | % | | | 3,200,000 | | | | 3,260,256 | | |
Riverside Public Financing Authority
Unrefunded Revenue Bonds
Multiple Loans
Series 1991A
02/01/18 | | | 8.000 | % | | | 15,000 | | | | 15,136 | | |
San Diego Redevelopment Agency
Tax Allocation Bonds
Capital Appreciation
Series 2001 (AGM)(c)
09/01/20 | | | 0.000 | % | | | 3,630,000 | | | | 2,831,436 | | |
Municipal Bonds (continued)
Issue
Description | | Coupon
Rate | | Principal
Amount ($) | | Value ($) | |
San Francisco City & County Redevelopment Agency
Tax Allocation Bonds
Mission Bay North Redevelopment
Series 2009C
08/01/29 | | | 6.000 | % | | | 1,035,000 | | | | 1,180,614 | | |
08/01/39 | | | 6.500 | % | | | 2,625,000 | | | | 3,050,092 | | |
Mission Bay South Redevelopment
Series 2009D
08/01/29 | | | 6.375 | % | | | 1,000,000 | | | | 1,108,640 | | |
Redevelopment Projects
Series 2009B
08/01/32 | | | 6.500 | % | | | 500,000 | | | | 577,100 | | |
Series 2011B
08/01/26 | | | 6.125 | % | | | 500,000 | | | | 595,455 | | |
08/01/41 | | | 6.625 | % | | | 1,600,000 | | | | 1,882,688 | | |
San Francisco Redevelopment Projects
Series 2009B
08/01/28 | | | 6.125 | % | | | 1,010,000 | | | | 1,163,348 | | |
Series 2011B
08/01/31 | | | 6.250 | % | | | 2,600,000 | | | | 3,047,330 | | |
Santa Monica Redevelopment Agency
Tax Allocation Bonds
Earthquake Recovery Redevelopment
Series 2011
07/01/36 | | | 5.875 | % | | | 1,250,000 | | | | 1,483,575 | | |
Santee Community Development Commission
Tax Allocation Bonds
Santee Community Redevelopment Project
Series 2011A
08/01/31 | | | 7.000 | % | | | 1,000,000 | | | | 1,224,730 | | |
Sulphur Springs Union School District
Refunding Special Tax Bonds
Community Facilities District No. 2002-1-SE
Series 2012
09/01/30 | | | 5.000 | % | | | 1,270,000 | | | | 1,373,416 | | |
09/01/31 | | | 5.000 | % | | | 1,365,000 | | | | 1,472,698 | | |
09/01/33 | | | 5.000 | % | | | 1,000,000 | | | | 1,073,850 | | |
Temecula Redevelopment Agency
Tax Allocation Bonds
Housing Redevelopment Project No. 1
Series 2011A
08/01/31 | | | 6.750 | % | | | 1,000,000 | | | | 1,217,780 | | |
08/01/39 | | | 7.000 | % | | | 2,100,000 | | | | 2,548,980 | | |
Union City Community Redevelopment Agency
Tax Allocation Bonds
Sub Lien- Community Redevelopment Project
Series 2011
12/01/12 | | | 3.000 | % | | | 1,000,000 | | | | 1,001,596 | | |
Subordinated Lien-Community Redevelopment Project
Series 2011
12/01/33 | | | 6.875 | % | | | 1,500,000 | | | | 1,837,230 | | |
The accompanying Notes to Financial Statements are an integral part of this statement.
Annual Report 2012
13
Columbia California Tax-Exempt Fund
Portfolio of Investments (continued)
October 31, 2012
Municipal Bonds (continued)
Issue
Description | | Coupon
Rate | | Principal
Amount ($) | | Value ($) | |
West Covina Community Development Commission
Refunding Special Tax Bonds
Fashion Plaza
Series 1996
09/01/17 | | | 6.000 | % | | | 2,905,000 | | | | 3,213,947 | | |
Yorba Linda Redevelopment Agency
Tax Allocation Bonds
Subordinated Lien-Redevelopment Project
Series 2011A
09/01/26 | | | 6.000 | % | | | 1,000,000 | | | | 1,192,970 | | |
09/01/32 | | | 6.500 | % | | | 2,000,000 | | | | 2,388,600 | | |
Total | | | | | | | 97,706,565 | | |
State Appropriated 6.4% | |
California State Public Works Board
Refunding Revenue Bonds
Department of Corrections State Prisons
Series 1993A (AMBAC)
12/01/19 | | | 5.000 | % | | | 6,000,000 | | | | 6,648,180 | | |
Revenue Bonds
Department of Mental Health Coalinga
Series 2004A-A
06/01/19 | | | 5.500 | % | | | 1,500,000 | | | | 1,604,550 | | |
Judicial Council Projects
Series 2011D
12/01/31 | | | 5.000 | % | | | 5,100,000 | | | | 5,678,136 | | |
State University Projects
Series 2011B
10/01/31 | | | 5.000 | % | | | 1,200,000 | | | | 1,344,132 | | |
Various Capital Projects
Series 2011A
10/01/31 | | | 5.125 | % | | | 5,000,000 | | | | 5,605,350 | | |
Series 2012A
04/01/32 | | | 5.000 | % | | | 5,000,000 | | | | 5,558,950 | | |
Subordinated Series 2009I-1
11/01/29 | | | 6.125 | % | | | 5,000,000 | | | | 6,150,100 | | |
Subordinated Series 2010A-1
03/01/35 | | | 6.000 | % | | | 2,750,000 | | | | 3,261,472 | | |
Total | | | | | | | 35,850,870 | | |
State General Obligation 16.9% | |
State of California
Unlimited General Obligation Bonds
Series 2003
02/01/20 | | | 5.250 | % | | | 1,250,000 | | | | 1,543,500 | | |
Series 2003 (AMBAC)
02/01/27 | | | 5.000 | % | | | 1,140,000 | | | | 1,423,187 | | |
Series 2004
02/01/22 | | | 5.000 | % | | | 1,000,000 | | | | 1,055,140 | | |
Series 2006
10/01/36 | | | 4.500 | % | | | 2,500,000 | | | | 2,569,475 | | |
Series 2008
08/01/34 | | | 5.000 | % | | | 3,000,000 | | | | 3,338,040 | | |
Series 2010
11/01/29 | | | 5.200 | % | | | 1,000,000 | | | | 1,170,640 | | |
Municipal Bonds (continued)
Issue
Description | | Coupon
Rate | | Principal
Amount ($) | | Value ($) | |
Various Purpose
Series 2003
11/01/24 | | | 5.125 | % | | | 2,000,000 | | | | 2,082,880 | | |
Series 2005
03/01/32 | | | 5.000 | % | | | 1,000,000 | | | | 1,073,470 | | |
Series 2007
12/01/28 | | | 5.000 | % | | | 1,000,000 | | | | 1,131,760 | | |
12/01/31 | | | 5.000 | % | | | 3,500,000 | | | | 3,904,145 | | |
12/01/32 | | | 5.000 | % | | | 5,000,000 | | | | 5,538,900 | | |
Series 2009
04/01/25 | | | 5.625 | % | | | 500,000 | | | | 594,220 | | |
10/01/29 | | | 5.000 | % | | | 4,500,000 | | | | 5,106,375 | | |
04/01/31 | | | 5.750 | % | | | 2,750,000 | | | | 3,258,860 | | |
04/01/35 | | | 6.000 | % | | | 4,000,000 | | | | 4,822,520 | | |
04/01/38 | | | 6.000 | % | | | 10,500,000 | | | | 12,617,745 | | |
11/01/39 | | | 5.500 | % | | | 4,965,000 | | | | 5,702,948 | | |
Series 2010
03/01/24 | | | 5.250 | % | | | 1,000,000 | | | | 1,184,050 | | |
03/01/30 | | | 5.250 | % | | | 1,000,000 | | | | 1,162,080 | | |
03/01/33 | | | 6.000 | % | | | 4,000,000 | | | | 4,959,840 | | |
03/01/40 | | | 5.500 | % | | | 4,800,000 | | | | 5,540,064 | | |
Unlimited General Obligation Refunding Bonds
Series 2005
05/01/29 | | | 4.625 | % | | | 2,000,000 | | | | 2,074,780 | | |
Series 2012
02/01/38 | | | 5.000 | % | | | 5,000,000 | | | | 5,558,800 | | |
Various Purpose
Series 2008
04/01/33 | | | 5.125 | % | | | 3,500,000 | | | | 3,896,970 | | |
04/01/38 | | | 5.000 | % | | | 12,110,000 | | | | 13,324,996 | | |
Unrefunded Unlimited General Obligation Bonds
Series 2000
05/01/26 | | | 5.625 | % | | | 160,000 | | | | 160,624 | | |
Series 2004
04/01/29 | | | 5.300 | % | | | 2,000 | | | | 2,103 | | |
Total | | | | | | | 94,798,112 | | |
Turnpike/Bridge/Toll Road 2.1% | |
Bay Area Toll Authority
Revenue Bonds
San Francisco Bay Area
Series 2008F1
04/01/47 | | | 5.125 | % | | | 2,500,000 | | | | 2,824,875 | | |
Foothill-Eastern Transportation Corridor Agency
Refunding Revenue Bonds
Series 1999
01/15/40 | | | 5.750 | % | | | 5,500,000 | | | | 5,502,310 | | |
Revenue Bonds
Senior Lien
Series 1995A (NPFGC)
01/01/35 | | | 5.000 | % | | | 2,000,000 | | | | 1,999,820 | | |
San Joaquin Hills Transportation Corridor Agency
Revenue Bonds
Senior Lien
Series 1993
01/01/33 | | | 5.000 | % | | | 1,700,000 | | | | 1,687,301 | | |
Total | | | | | | | 12,014,306 | | |
The accompanying Notes to Financial Statements are an integral part of this statement.
Annual Report 2012
14
Columbia California Tax-Exempt Fund
Portfolio of Investments (continued)
October 31, 2012
Municipal Bonds (continued)
Issue
Description | | Coupon
Rate | | Principal
Amount ($) | | Value ($) | |
Water & Sewer 2.5% | |
City of Big Bear Lake Water
Refunding Revenue Bonds
Series 1996 (NPFGC)
04/01/15 | | | 6.000 | % | | | 1,040,000 | | | | 1,091,324 | | |
City of Lodi
Certificate of Participation
Series 2007A (AGM)
10/01/37 | | | 5.000 | % | | | 1,250,000 | | | | 1,347,450 | | |
Eastern Municipal Water District
Certificate of Participation
Series 2008H
07/01/33 | | | 5.000 | % | | | 1,000,000 | | | | 1,105,120 | | |
Manteca Financing Authority
Revenue Bonds
Series 2003B (NPFGC)
12/01/33 | | | 5.000 | % | | | 430,000 | | | | 439,740 | | |
Rowland Water District
Certificate of Participation
Recycled Water Project
Series 2008
12/01/39 | | | 6.250 | % | | | 2,235,000 | | | | 2,584,308 | | |
San Diego Public Facilities Financing Authority Sewer
Revenue Bonds
Senior Series 2009A
05/15/34 | | | 5.250 | % | | | 1,500,000 | | | | 1,724,940 | | |
05/15/39 | | | 5.250 | % | | | 3,000,000 | | | | 3,424,800 | | |
San Diego Public Facilities Financing Authority
Revenue Bonds
Series 2009B
08/01/34 | | | 5.375 | % | | | 2,000,000 | | | | 2,349,600 | | |
Total | | | | | | | 14,067,282 | | |
Total Municipal Bonds
(Cost: $473,099,983) | | | | | | | 531,817,166 | | |
Floating Rate Notes 2.1%
Variable Rate Demand Notes 2.1% | |
ABAG Finance Authority for Nonprofit Corps.
Revenue Bonds
Hebrew Home Aged Disabled
VRDN Series 2005 (Wells Fargo Bank)(f)(g)
11/15/35 | | | 0.150 | % | | | 1,475,000 | | | | 1,475,000 | | |
Antelope Valley-East Kern Water Agency
Certificate of Participation
VRDN Series 2008A-2 (Wells Fargo Bank)(f)(g)
06/01/37 | | | 0.180 | % | | | 3,000,000 | | | | 3,000,000 | | |
Floating Rate Notes (continued)
Issue
Description | | Coupon
Rate | | Principal
Amount ($) | | Value ($) | |
California Health Facilities Financing Authority
Revenue Bonds
Adventist Health System West
VRDN Series 2009B (U.S. Bank)(f)(g)
09/01/38 | | | 0.170 | % | | | 5,000,000 | | | | 5,000,000 | | |
California Pollution Control Financing Authority
Refunding Revenue Bonds
Pacific Gas & Electric Co.
VRDN Series 1996C (JP Morgan Chase Bank)(f)(g)
11/01/26 | | | 0.220 | % | | | 2,500,000 | | | | 2,500,000 | | |
Total | | | | | | | 11,975,000 | | |
Total Floating Rate Notes
(Cost: $11,975,000) | | | | | | | 11,975,000 | | |
Municipal Short Term 0.9%
Local Appropriation 0.9% | |
California School Cash Reserve Program Authority
Revenue Notes
Series 2012U
12/31/12 | | | 2.000 | % | | | 5,000,000 | | | | 5,012,750 | | |
Total Municipal Short Term
(Cost: $5,012,279) | | | | | | | 5,012,750 | | |
Money Market Funds 1.2%
| | | Shares | | Value ($) | |
Dreyfus General California
Municipal Money Market Fund,
0.000%(h) | | | 2,211,911 | | | | 2,211,911 | | |
JPMorgan Tax Free Money Market Fund,
0.000%(h) | | | 4,308,023 | | | | 4,308,023 | | |
Total Money Market Funds
(Cost: $6,519,934) | | | | | 6,519,934 | | |
Total Investments
(Cost: $496,607,196) | | | | | 555,324,850 | | |
Other Assets & Liabilities, Net | | | | | 6,822,335 | | |
Total Net Assets | | | | | 562,147,185 | | |
The accompanying Notes to Financial Statements are an integral part of this statement.
Annual Report 2012
15
Columbia California Tax-Exempt Fund
Portfolio of Investments (continued)
October 31, 2012
Notes to Portfolio of Investments
(a) Income from this security may be subject to alternative minimum tax.
(b) Identifies issues considered to be illiquid as to their marketability. The aggregate value of such securities at October 31, 2012 was $8,754,645, representing 1.56% of net assets. Information concerning such security holdings at October 31, 2012 was as follows:
Security Description | | Acquisition Dates | | Cost ($) | |
California Municipal Finance Authority
Revenue Bonds
UTS Renewable Energy - Waste Water
Series 2011 AMT
12/01/15 3.950% | | 12/22/11 | | | 2,100,000 | | |
California Municipal Finance Authority
Revenue Bonds
UTS Renewable Energy - Waste Water
Series 2011 AMT
12/01/32 7.500% | | 12/22/11 | | | 2,885,000 | | |
California Statewide Communities Development Authority
Revenue Bonds
San Francisco Art Institute
Series 2002
04/01/32 7.375% | | 07/05/02 | | | 1,750,000 | | |
Munimae TE Bond Subsidiary LLC
Series 2004A-2 AMT
06/29/49 4.900% | | 10/15/04 | | | 2,000,000 | | |
(c) Zero coupon bond.
(d) Security exempt from registration pursuant to Rule 144A under the Securities Act of 1933. This security may be resold in transactions exempt from registration, normally to qualified institutional buyers. At October 31, 2012, the value of these securities amounted to $1,819,960 or 0.32% of net assets.
(e) Municipal obligations include debt obligations issued by or on behalf of territories, possessions, or sovereign nations within the territorial boundaries of the United States. At October 31, 2012, the value of these securities amounted to $1,534,050 or 0.27% of net assets.
(f) Variable rate security. The interest rate shown reflects the rate as of October 31, 2012.
(g) The Fund is entitled to receive principal and interest from the guarantor after a day or a week's notice or upon maturity. The maturity date disclosed represents the final maturity.
(h) The rate shown is the seven-day current annualized yield at October 31, 2012.
Abbreviation Legend
AGM Assured Guaranty Municipal Corporation
AMBAC Ambac Assurance Corporation
AMT Alternative Minimum Tax
FGIC Financial Guaranty Insurance Company
FHLMC Federal Home Loan Mortgage Corporation
GNMA Government National Mortgage Association
NPFGC National Public Finance Guarantee Corporation
VRDN Variable Rate Demand Note
The accompanying Notes to Financial Statements are an integral part of this statement.
Annual Report 2012
16
Columbia California Tax-Exempt Fund
Portfolio of Investments (continued)
October 31, 2012
Fair Value Measurements
Generally accepted accounting principles (GAAP) require disclosure regarding the inputs and valuation techniques used to measure fair value and any changes in valuation inputs or techniques. In addition, investments shall be disclosed by major category.
The Fund categorizes its fair value measurements according to a three-level hierarchy that maximizes the use of observable inputs and minimizes the use of unobservable inputs by prioritizing that the most observable input be used when available. Observable inputs are those that market participants would use in pricing an investment based on market data obtained from sources independent of the reporting entity. Unobservable inputs are those that reflect the Fund's assumptions about the information market participants would use in pricing an investment. An investment's level within the fair value hierarchy is based on the lowest level of any input that is deemed significant to the asset or liability's fair value measurement. The input levels are not necessarily an indication of the risk or liquidity associated with investments at that level. For example, certain U.S. government securities are generally high quality and liquid, however, they are reflected as Level 2 because the inputs used to determine fair value may not always be quoted prices in an active market.
Fair value inputs are summarized in the three broad levels listed below:
> Level 1 — Valuations based on quoted prices for investments in active markets that the Fund has the ability to access at the measurement date (including NAV for open-end mutual funds). Valuation adjustments are not applied to Level 1 investments.
> Level 2 — Valuations based on other significant observable inputs (including quoted prices for similar securities, interest rates, prepayment speeds, credit risks, etc.).
> Level 3 — Valuations based on significant unobservable inputs (including the Fund's own assumptions and judgment in determining the fair value of investments).
Inputs that are used in determining fair value of an investment may include price information, credit data, volatility statistics, and other factors. These inputs can be either observable or unobservable. The availability of observable inputs can vary between investments, and is affected by various factors such as the type of investment, and the volume and level of activity for that investment or similar investments in the marketplace. The inputs will be considered by the Investment Manager, along with any other relevant factors in the calculation of an investment's fair value. The Fund uses prices and inputs that are current as of the measurement date, which may include periods of market dislocations. During these periods, the availability of prices and inputs may be reduced for many investments. This condition could cause an investment to be reclassified between the various levels within the hierarchy.
Investments falling into the Level 3 category are primarily supported by quoted prices from brokers and dealers participating in the market for those investments. However, these may be classified as Level 3 investments due to lack of market transparency and corroboration to support these quoted prices. Additionally, valuation models may be used as the pricing source for any remaining investments classified as Level 3. These models rely on one or more significant unobservable inputs and/or significant assumptions by the Investment Manager. Inputs used in valuations may include, but are not limited to, financial statement analysis, capital account balances, discount rates and estimated cash flows, and comparable company data.
Under the direction of the Fund's Board of Trustees (the Board), the Investment Manager's Valuation Committee (the Committee) is responsible for carrying out the valuation procedures approved by the Board. The Committee consists of voting and non-voting members from various groups within the Investment Manager's organization, including operations and accounting, trading and investments, compliance, risk management and legal.
The Committee meets at least monthly to review and approve valuation matters, which may include a description of specific valuation determinations, data regarding pricing information received from approved pricing vendors and brokers and the results of Board-approved valuation control policies and procedures (the Policies). The Policies address, among other things, instances when market quotations are readily available, including recommendations of third party pricing vendors and a determination of appropriate pricing methodologies; events that require specific valuation determinations and assessment of fair value techniques; securities with a potential for stale pricing, including those that are illiquid, restricted, or in default; and the effectiveness of third-party pricing vendors, including periodic reviews of vendors. The Committee meets more frequently, as needed, to discuss additional valuation matters, which may include the need to review back-testing results, review time-sensitive information or approve related valuation actions. The Committee reports to the Board, with members of the Committee meeting with the Board at each of its regularly scheduled meetings to discuss valuation matters and actions during the period, similar to those described earlier.
For investments categorized as Level 3, the Committee monitors information similar to that described above, which may include: (i) data specific to the issuer or comparable issuers, (ii) general market or specific sector news and (iii) quoted prices and specific or similar security transactions. The Committee considers this data and any changes from prior periods in order to assess the reasonableness of observable and unobservable inputs, any assumptions or internal models used to value those securities and changes in fair value. This data is also used to corroborate, when available, information received from approved pricing vendors and brokers. Various factors impact the frequency of monitoring this information (which may occur as often as daily). However, the Committee may determine that changes to inputs, assumptions and models are not required as a result of the monitoring procedures performed.
The accompanying Notes to Financial Statements are an integral part of this statement.
Annual Report 2012
17
Columbia California Tax-Exempt Fund
Portfolio of Investments (continued)
October 31, 2012
Fair Value Measurements (continued)
The following table is a summary of the inputs used to value the Fund's investments at October 31, 2012:
Description | | Level 1
Quoted Prices in Active
Markets for Identical
Assets ($) | | Level 2
Other Significant
Observable Inputs ($) | | Level 3
Significant
Unobservable Inputs ($) | | Total ($) | |
Bonds | |
Municipal Bonds | | | — | | | | 531,817,166 | | | | — | | | | 531,817,166 | | |
Total Bonds | | | — | | | | 531,817,166 | | | | — | | | | 531,817,166 | | |
Short-Term Securities | |
Floating Rate Notes | | | — | | | | 11,975,000 | | | | — | | | | 11,975,000 | | |
Municipal Short Term | | | — | | | | 5,012,750 | | | | — | | | | 5,012,750 | | |
Total Short-Term Securities | | | — | | | | 16,987,750 | | | | — | | | | 16,987,750 | | |
Other | |
Money Market Funds | | | 6,519,934 | | | | — | | | | — | | | | 6,519,934 | | |
Total Other | | | 6,519,934 | | | | — | | | | — | | | | 6,519,934 | | |
Total | | | 6,519,934 | | | | 548,804,916 | | | | — | | | | 555,324,850 | | |
See the Portfolio of Investments for all investment classifications not indicated in the table.
The Fund's assets assigned to the Level 2 input category are generally valued using the market approach, in which a security's value is determined through reference to prices and information from market transactions for similar or identical assets.
There were no transfers of financial assets between Levels 1 and 2 during the period.
The accompanying Notes to Financial Statements are an integral part of this statement.
Annual Report 2012
18
Columbia California Tax-Exempt Fund
Statement of Assets and Liabilities
October 31, 2012
Assets | |
Investments, at value | |
(identified cost $496,607,196) | | $ | 555,324,850 | | |
Receivable for: | |
Investments sold | | | 1,595,088 | | |
Capital shares sold | | | 1,385,389 | | |
Interest | | | 6,881,797 | | |
Expense reimbursement due from Investment Manager | | | 5,510 | | |
Prepaid expenses | | | 7,093 | | |
Trustees' deferred compensation plan | | | 49,895 | | |
Total assets | | | 565,249,622 | | |
Liabilities | |
Payable for: | |
Capital shares purchased | | | 946,358 | | |
Dividend distributions to shareholders | | | 1,815,335 | | |
Investment management fees | | | 30,243 | | |
Distribution and service fees | | | 19,247 | | |
Transfer agent fees | | | 100,047 | | |
Administration fees | | | 5,153 | | |
Compensation of board members | | | 25,089 | | |
Chief compliance officer expenses | | | 161 | | |
Other expenses | | | 110,909 | | |
Trustees' deferred compensation plan | | | 49,895 | | |
Total liabilities | | | 3,102,437 | | |
Net assets applicable to outstanding capital stock | | $ | 562,147,185 | | |
Represented by | |
Paid-in capital | | $ | 503,539,056 | | |
Undistributed net investment income | | | 90,371 | | |
Accumulated net realized loss | | | (199,896 | ) | |
Unrealized appreciation (depreciation) on: | |
Investments | | | 58,717,654 | | |
Total — representing net assets applicable to outstanding capital stock | | $ | 562,147,185 | | |
The accompanying Notes to Financial Statements are an integral part of this statement.
Annual Report 2012
19
Columbia California Tax-Exempt Fund
Statement of Assets and Liabilities (continued)
October 31, 2012
Class A | |
Net assets | | $ | 430,657,228 | | |
Shares outstanding | | | 53,878,515 | | |
Net asset value per share | | $ | 7.99 | | |
Maximum offering price per share(a) | | $ | 8.39 | | |
Class B | |
Net assets | | $ | 1,455,768 | | |
Shares outstanding | | | 182,135 | | |
Net asset value per share | | $ | 7.99 | | |
Class C | |
Net assets | | $ | 45,680,258 | | |
Shares outstanding | | | 5,713,860 | | |
Net asset value per share | | $ | 7.99 | | |
Class Z | |
Net assets | | $ | 84,353,931 | | |
Shares outstanding | | | 10,550,057 | | |
Net asset value per share | | $ | 8.00 | | |
(a) The maximum offering price per share is calculated by dividing the net asset value by 1.0 minus the maximum sales charge of 4.75%.
The accompanying Notes to Financial Statements are an integral part of this statement.
Annual Report 2012
20
Columbia California Tax-Exempt Fund
Statement of Operations
Year Ended October 31, 2012
Net investment income | |
Income: | |
Dividends | | $ | 1,033 | | |
Interest | | | 26,091,807 | | |
Total income | | | 26,092,840 | | |
Expenses: | |
Investment management fees | | | 2,174,124 | | |
Distribution fees | |
Class B | | | 13,961 | | |
Class C | | | 316,512 | | |
Service fees | |
Class A | | | 1,061,446 | | |
Class B | | | 4,654 | | |
Class C | | | 105,548 | | |
Transfer agent fees | |
Class A | | | 495,531 | | |
Class B | | | 2,186 | | |
Class C | | | 49,943 | | |
Class Z | | | 94,051 | | |
Administration fees | | | 369,822 | | |
Compensation of board members | | | 32,331 | | |
Custodian fees | | | 9,161 | | |
Printing and postage fees | | | 31,055 | | |
Registration fees | | | 42,067 | | |
Professional fees | | | 51,681 | | |
Chief compliance officer expenses | | | 204 | | |
Total expenses | | | 4,854,277 | | |
Fees waived or expenses reimbursed by Investment Manager and its affiliates | | | (441,438 | ) | |
Fees waived by Distributor — Class C | | | (126,525 | ) | |
Expense reductions | | | (800 | ) | |
Total net expenses | | | 4,285,514 | | |
Net investment income | | | 21,807,326 | | |
Realized and unrealized gain (loss) — net | |
Net realized gain (loss) on: | |
Investments | | | 2,296,555 | | |
Net realized gain | | | 2,296,555 | | |
Net change in unrealized appreciation (depreciation) on: | |
Investments | | | 41,126,087 | | |
Net change in unrealized appreciation (depreciation) | | | 41,126,087 | | |
Net realized and unrealized gain | | | 43,422,642 | | |
Net increase in net assets resulting from operations | | $ | 65,229,968 | | |
The accompanying Notes to Financial Statements are an integral part of this statement.
Annual Report 2012
21
Columbia California Tax-Exempt Fund
Statement of Changes in Net Assets
| | | Year ended
October 31,
2012 | | Year ended
October 31,
2011 | |
Operations | |
Net investment income | | $ | 21,807,326 | | | $ | 18,027,959 | | |
Net realized gain | | | 2,296,555 | | | | 875,625 | | |
Net change in unrealized appreciation (depreciation) | | | 41,126,087 | | | | (3,925,815 | ) | |
Net increase in net assets resulting from operations | | | 65,229,968 | | | | 14,977,769 | | |
Distributions to shareholders | |
Net investment income | |
Class A | | | (16,846,780 | ) | | | (13,137,447 | ) | |
Class B | | | (59,769 | ) | | | (64,464 | ) | |
Class C | | | (1,480,827 | ) | | | (1,260,024 | ) | |
Class Z | | | (3,417,858 | ) | | | (3,601,746 | ) | |
Net realized gains | |
Class A | | | — | | | | (4,568,049 | ) | |
Class B | | | — | | | | (32,807 | ) | |
Class C | | | — | | | | (571,585 | ) | |
Class Z | | | — | | | | (1,657,571 | ) | |
Total distributions to shareholders | | | (21,805,234 | ) | | | (24,893,693 | ) | |
Increase (decrease) in net assets from capital stock activity | | | (6,354,597 | ) | | | 146,724,185 | | |
Total increase in net assets | | | 37,070,137 | | | | 136,808,261 | | |
Net assets at beginning of year | | | 525,077,048 | | | | 388,268,787 | | |
Net assets at end of year | | $ | 562,147,185 | | | $ | 525,077,048 | | |
Undistributed net investment income | | $ | 90,371 | | | $ | 88,279 | | |
The accompanying Notes to Financial Statements are an integral part of this statement.
Annual Report 2012
22
Columbia California Tax-Exempt Fund
Statement of Changes in Net Assets (continued)
| | | Year Ended October 31, 2012 | | Year Ended October 31, 2011 | |
| | | Shares | | Dollars ($) | | Shares | | Dollars ($) | |
Capital stock activity | |
Class A shares | |
Subscriptions(a) | | | 3,499,638 | | | | 27,061,115 | | | | 1,774,807 | | | | 12,875,405 | | |
Fund merger | | | — | | | | — | | | | 25,092,629 | | | | 179,929,484 | | |
Distributions reinvested | | | 1,535,440 | | | | 11,955,391 | | | | 1,493,775 | | | | 10,669,224 | | |
Redemptions | | | (6,376,320 | ) | | | (49,402,686 | ) | | | (7,099,287 | ) | | | (50,748,811 | ) | |
Net increase (decrease) | | | (1,341,242 | ) | | | (10,386,180 | ) | | | 21,261,924 | | | | 152,725,302 | | |
Class B shares | |
Subscriptions | | | 3,011 | | | | 23,390 | | | | 16,002 | | | | 115,287 | | |
Fund merger | | | — | | | | — | | | | 218,017 | | | | 1,562,262 | | |
Distributions reinvested | | | 6,146 | | | | 47,801 | | | | 8,201 | | | | 58,471 | | |
Redemptions(a) | | | (96,661 | ) | | | (756,737 | ) | | | (246,679 | ) | | | (1,770,621 | ) | |
Net decrease | | | (87,504 | ) | | | (685,546 | ) | | | (4,459 | ) | | | (34,601 | ) | |
Class C shares | |
Subscriptions | | | 1,162,896 | | | | 9,019,211 | | | | 729,676 | | | | 5,240,068 | | |
Fund merger | | | — | | | | — | | | | 1,427,288 | | | | 10,231,939 | | |
Distributions reinvested | | | 81,998 | | | | 639,123 | | | | 77,748 | | | | 554,405 | | |
Redemptions | | | (820,922 | ) | | | (6,316,408 | ) | | | (1,141,948 | ) | | | (8,086,535 | ) | |
Net increase | | | 423,972 | | | | 3,341,926 | | | | 1,092,764 | | | | 7,939,877 | | |
Class Z shares | |
Subscriptions | | | 1,687,077 | | | | 13,109,221 | | | | 1,491,393 | | | | 10,704,560 | | |
Distributions reinvested | | | 33,737 | | | | 263,937 | | | | 83,244 | | | | 587,566 | | |
Redemptions | | | (1,543,794 | ) | | | (11,997,955 | ) | | | (3,570,650 | ) | | | (25,198,519 | ) | |
Net increase (decrease) | | | 177,020 | | | | 1,375,203 | | | | (1,996,013 | ) | | | (13,906,393 | ) | |
Total net increase (decrease) | | | (827,754 | ) | | | (6,354,597 | ) | | | 20,354,216 | | | | 146,724,185 | | |
(a) Includes conversions of Class B to Class A, if any.
The accompanying Notes to Financial Statements are an integral part of this statement.
Annual Report 2012
23
Columbia California Tax-Exempt Fund
The following tables are intended to help you understand the Fund's financial performance. Certain information reflects financial results for a single share of a class held for the periods shown. Per share net investment income (loss) amounts are calculated based on average shares outstanding during the period. Total return assumes reinvestment of all dividends and distributions. Total return does not reflect payment of sales charges, if any, and is not annualized for periods of less than one year.
| | | Year Ended October 31, | |
Class A | | 2012 | | 2011 | | 2010 | | 2009 | | 2008 | |
Per share data | |
Net asset value, beginning of period | | $ | 7.38 | | | $ | 7.64 | | | $ | 7.30 | | | $ | 6.71 | | | $ | 7.55 | | |
Income from investment operations: | |
Net investment income | | | 0.31 | | | | 0.31 | | | | 0.32 | | | | 0.31 | | | | 0.30 | | |
Net realized and unrealized gain (loss) | | | 0.61 | | | | (0.12 | ) | | | 0.36 | | | | 0.59 | | | | (0.79 | ) | |
Total from investment operations | | | 0.92 | | | | 0.19 | | | | 0.68 | | | | 0.90 | | | | (0.49 | ) | |
Less distributions to shareholders: | |
Net investment income | | | (0.31 | ) | | | (0.31 | ) | | | (0.32 | ) | | | (0.30 | ) | | | (0.31 | ) | |
Net realized gains | | | — | | | | (0.14 | ) | | | (0.02 | ) | | | (0.01 | ) | | | (0.04 | ) | |
Total distributions to shareholders | | | (0.31 | ) | | | (0.45 | ) | | | (0.34 | ) | | | (0.31 | ) | | | (0.35 | ) | |
Proceeds from regulatory settlements | | | — | | | | — | | | | — | | | | 0.00 | (a) | | | — | | |
Net asset value, end of period | | $ | 7.99 | | | $ | 7.38 | | | $ | 7.64 | | | $ | 7.30 | | | $ | 6.71 | | |
Total return | | | 12.63 | % | | | 2.84 | % | | | 9.52 | % | | | 13.76 | % | | | (6.80 | %) | |
Ratios to average net assets(b) | |
Expenses prior to fees waived or expenses reimbursed | | | 0.86 | % | | | 0.92 | % | | | 0.87 | % | | | 0.86 | % | | | 0.85 | % | |
Net expenses after fees waived or expenses reimbursed(c) | | | 0.78 | %(d) | | | 0.81 | %(d) | | | 0.84 | %(d) | | | 0.84 | %(d) | | | 0.84 | %(d) | |
Net investment income | | | 3.97 | %(d) | | | 4.30 | %(d) | | | 4.25 | %(d) | | | 4.38 | %(d) | | | 4.14 | %(d) | |
Supplemental data | |
Net assets, end of period (in thousands) | | $ | 430,657 | | | $ | 407,479 | | | $ | 259,552 | | | $ | 265,594 | | | $ | 263,220 | | |
Portfolio turnover | | | 14 | % | | | 28 | % | | | 12 | % | | | 14 | % | | | 12 | % | |
Notes to Financial Highlights
(a) Rounds to less than $0.01.
(b) In addition to the fees and expenses which the Fund bears directly, the Fund indirectly bears a pro rata share of the fees and expenses of the acquired funds in which it invests. Such indirect expenses are not included in the reported expense ratios.
(c) The Investment Manager and certain of its affiliates agreed to waive/reimburse certain fees and expenses, if applicable.
(d) The benefits derived from expense reductions had an impact of less than 0.01%.
The accompanying Notes to Financial Statements are an integral part of this statement.
Annual Report 2012
24
Columbia California Tax-Exempt Fund
Financial Highlights (continued)
| | | Year Ended October 31, | |
Class B | | 2012 | | 2011 | | 2010 | | 2009 | | 2008 | |
Per share data | |
Net asset value, beginning of period | | $ | 7.38 | | | $ | 7.64 | | | $ | 7.30 | | | $ | 6.71 | | | $ | 7.55 | | |
Income from investment operations: | |
Net investment income | | | 0.25 | | | | 0.25 | | | | 0.26 | | | | 0.26 | | | | 0.25 | | |
Net realized and unrealized gain (loss) | | | 0.61 | | | | (0.12 | ) | | | 0.36 | | | | 0.59 | | | | (0.80 | ) | |
Total from investment operations | | | 0.86 | | | | 0.13 | | | | 0.62 | | | | 0.85 | | | | (0.55 | ) | |
Less distributions to shareholders: | |
Net investment income | | | (0.25 | ) | | | (0.25 | ) | | | (0.26 | ) | | | (0.25 | ) | | | (0.25 | ) | |
Net realized gains | | | — | | | | (0.14 | ) | | | (0.02 | ) | | | (0.01 | ) | | | (0.04 | ) | |
Total distributions to shareholders | | | (0.25 | ) | | | (0.39 | ) | | | (0.28 | ) | | | (0.26 | ) | | | (0.29 | ) | |
Proceeds from regulatory settlements | | | — | | | | — | | | | — | | | | 0.00 | (a) | | | — | | |
Net asset value, end of period | | $ | 7.99 | | | $ | 7.38 | | | $ | 7.64 | | | $ | 7.30 | | | $ | 6.71 | | |
Total return | | | 11.78 | % | | | 2.06 | % | | | 8.71 | % | | | 12.92 | % | | | (7.49 | %) | |
Ratios to average net assets(b) | |
Expenses prior to fees waived or expenses reimbursed | | | 1.61 | % | | | 1.68 | % | | | 1.62 | % | | | 1.61 | % | | | 1.60 | % | |
Net expenses after fees waived or expenses reimbursed(c) | | | 1.53 | %(d) | | | 1.58 | %(d) | | | 1.59 | %(d) | | | 1.59 | %(d) | | | 1.59 | %(d) | |
Net investment income | | | 3.22 | %(d) | | | 3.53 | %(d) | | | 3.52 | %(d) | | | 3.65 | %(d) | | | 3.38 | %(d) | |
Supplemental data | |
Net assets, end of period (in thousands) | | $ | 1,456 | | | $ | 1,989 | | | $ | 2,095 | | | $ | 5,377 | | | $ | 9,740 | | |
Portfolio turnover | | | 14 | % | | | 28 | % | | | 12 | % | | | 14 | % | | | 12 | % | |
Notes to Financial Highlights
(a) Rounds to less than $0.01.
(b) In addition to the fees and expenses which the Fund bears directly, the Fund indirectly bears a pro rata share of the fees and expenses of the acquired funds in which it invests. Such indirect expenses are not included in the reported expense ratios.
(c) The Investment Manager and certain of its affiliates agreed to waive/reimburse certain fees and expenses, if applicable.
(d) The benefits derived from expense reductions had an impact of less than 0.01%.
The accompanying Notes to Financial Statements are an integral part of this statement.
Annual Report 2012
25
Columbia California Tax-Exempt Fund
Financial Highlights (continued)
| | | Year Ended October 31, | |
Class C | | 2012 | | 2011 | | 2010 | | 2009 | | 2008 | |
Per share data | |
Net asset value, beginning of period | | $ | 7.38 | | | $ | 7.64 | | | $ | 7.30 | | | $ | 6.71 | | | $ | 7.55 | | |
Income from investment operations: | |
Net investment income | | | 0.27 | | | | 0.28 | | | | 0.28 | | | | 0.28 | | | | 0.27 | | |
Net realized and unrealized gain (loss) | | | 0.61 | | | | (0.13 | ) | | | 0.37 | | | | 0.59 | | | | (0.80 | ) | |
Total from investment operations | | | 0.88 | | | | 0.15 | | | | 0.65 | | | | 0.87 | | | | (0.53 | ) | |
Less distributions to shareholders: | |
Net investment income | | | (0.27 | ) | | | (0.27 | ) | | | (0.29 | ) | | | (0.27 | ) | | | (0.27 | ) | |
Net realized gains | | | — | | | | (0.14 | ) | | | (0.02 | ) | | | (0.01 | ) | | | (0.04 | ) | |
Total distributions to shareholders | | | (0.27 | ) | | | (0.41 | ) | | | (0.31 | ) | | | (0.28 | ) | | | (0.31 | ) | |
Proceeds from regulatory settlements | | | — | | | | — | | | | — | | | | 0.00 | (a) | | | — | | |
Net asset value, end of period | | $ | 7.99 | | | $ | 7.38 | | | $ | 7.64 | | | $ | 7.30 | | | $ | 6.71 | | |
Total return | | | 12.12 | % | | | 2.37 | % | | | 9.03 | % | | | 13.25 | % | | | (7.22 | %) | |
Ratios to average net assets(b) | |
Expenses prior to fees waived or expenses reimbursed | | | 1.61 | % | | | 1.69 | % | | | 1.62 | % | | | 1.61 | % | | | 1.60 | % | |
Net expenses after fees waived or expenses reimbursed(c) | | | 1.23 | %(d) | | | 1.27 | %(d) | | | 1.29 | %(d) | | | 1.29 | %(d) | | | 1.29 | %(d) | |
Net investment income | | | 3.52 | %(d) | | | 3.86 | %(d) | | | 3.79 | %(d) | | | 3.91 | %(d) | | | 3.69 | %(d) | |
Supplemental data | |
Net assets, end of period (in thousands) | | $ | 45,680 | | | $ | 39,040 | | | $ | 32,080 | | | $ | 28,928 | | | $ | 21,899 | | |
Portfolio turnover | | | 14 | % | | | 28 | % | | | 12 | % | | | 14 | % | | | 12 | % | |
Notes to Financial Highlights
(a) Rounds to less than $0.01.
(b) In addition to the fees and expenses which the Fund bears directly, the Fund indirectly bears a pro rata share of the fees and expenses of the acquired funds in which it invests. Such indirect expenses are not included in the reported expense ratios.
(c) The Investment Manager and certain of its affiliates agreed to waive/reimburse certain fees and expenses, if applicable.
(d) The benefits derived from expense reductions had an impact of less than 0.01%.
The accompanying Notes to Financial Statements are an integral part of this statement.
Annual Report 2012
26
Columbia California Tax-Exempt Fund
Financial Highlights (continued)
| | | Year Ended October 31, | |
Class Z | | 2012 | | 2011 | | 2010 | | 2009 | | 2008 | |
Per share data | |
Net asset value, beginning of period | | $ | 7.38 | | | $ | 7.64 | | | $ | 7.30 | | | $ | 6.71 | | | $ | 7.55 | | |
Income from investment operations: | |
Net investment income | | | 0.33 | | | | 0.33 | | | | 0.33 | | | | 0.32 | | | | 0.32 | | |
Net realized and unrealized gain (loss) | | | 0.62 | | | | (0.13 | ) | | | 0.37 | | | | 0.60 | | | | (0.80 | ) | |
Total from investment operations | | | 0.95 | | | | 0.20 | | | | 0.70 | | | | 0.92 | | | | (0.48 | ) | |
Less distributions to shareholders: | |
Net investment income | | | (0.33 | ) | | | (0.32 | ) | | | (0.34 | ) | | | (0.32 | ) | | | (0.32 | ) | |
Net realized gains | | | — | | | | (0.14 | ) | | | (0.02 | ) | | | (0.01 | ) | | | (0.04 | ) | |
Total distributions to shareholders | | | (0.33 | ) | | | (0.46 | ) | | | (0.36 | ) | | | (0.33 | ) | | | (0.36 | ) | |
Proceeds from regulatory settlements | | | — | | | | — | | | | — | | | | 0.00 | (a) | | | — | | |
Net asset value, end of period | | $ | 8.00 | | | $ | 7.38 | | | $ | 7.64 | | | $ | 7.30 | | | $ | 6.71 | | |
Total return | | | 13.05 | % | | | 3.05 | % | | | 9.78 | % | | | 14.03 | % | | | (6.57 | %) | |
Ratios to average net assets(b) | |
Expenses prior to fees waived or expenses reimbursed | | | 0.61 | % | | | 0.70 | % | | | 0.63 | % | | | 0.62 | % | | | 0.61 | % | |
Net expenses after fees waived or expenses reimbursed(c) | | | 0.53 | %(d) | | | 0.59 | %(d) | | | 0.60 | %(d) | | | 0.60 | %(d) | | | 0.60 | %(d) | |
Net investment income | | | 4.22 | %(d) | | | 4.57 | %(d) | | | 4.49 | %(d) | | | 4.61 | %(d) | | | 4.38 | %(d) | |
Supplemental data | |
Net assets, end of period (in thousands) | | $ | 84,354 | | | $ | 76,568 | | | $ | 94,541 | | | $ | 107,246 | | | $ | 107,591 | | |
Portfolio turnover | | | 14 | % | | | 28 | % | | | 12 | % | | | 14 | % | | | 12 | % | |
Notes to Financial Highlights
(a) Rounds to less than $0.01.
(b) In addition to the fees and expenses which the Fund bears directly, the Fund indirectly bears a pro rata share of the fees and expenses of the acquired funds in which it invests. Such indirect expenses are not included in the reported expense ratios.
(c) The Investment Manager and certain of its affiliates agreed to waive/reimburse certain fees and expenses, if applicable.
(d) The benefits derived from expense reductions had an impact of less than 0.01%.
The accompanying Notes to Financial Statements are an integral part of this statement.
Annual Report 2012
27
Columbia California Tax-Exempt Fund
Notes to Financial Statements
October 31, 2012
Note 1. Organization
Columbia California Tax-Exempt Fund (the Fund), a series of Columbia Funds Series Trust I (the Trust), is a non-diversified fund. The Trust is registered under the Investment Company Act of 1940, as amended (the 1940 Act), as an open-end management investment company organized as a Massachusetts business trust.
Fund Shares
The Trust may issue an unlimited number of shares (without par value). The Fund offers Class A, Class B, Class C and Class Z shares. All share classes have identical voting, dividend and liquidation rights. Each share class has its own expense structure and sales charges, as applicable.
Class A shares are subject to a maximum front-end sales charge of 4.75% based on the initial investment amount. Class A shares purchased without an initial sales charge in accounts aggregating $1 million to $50 million at the time of purchase are subject to a contingent deferred sales charge (CDSC) if the shares are sold within 18 months of purchase, charged as follows: 1.00% CDSC if redeemed within 12 months of purchase, and 0.50% CDSC if redeemed more than 12, but less than 18, months after purchase.
Class B shares may be subject to a maximum CDSC of 5.00% based upon the holding period after purchase. Class B shares will generally convert to Class A shares eight years after purchase. The Fund no longer accepts investments by new or existing investors in the Fund's Class B shares, except in connection with the reinvestment of any dividend and/or capital gain distributions in Class B shares of the Fund and exchanges by existing Class B shareholders of certain other funds within the Columbia Family of Funds.
Class C shares are subject to a 1.00% CDSC on shares redeemed within one year of purchase.
Class Z shares are not subject to sales charges, and are only available to certain investors.
Note 2. Summary of Significant Accounting Policies
Use of Estimates
The preparation of financial statements in accordance with U.S. generally accepted accounting principles (GAAP) requires management to make certain estimates and assumptions that affect the reported amounts of assets and liabilities, the disclosure of contingent assets and liabilities at the date of the financial statements and the reported amounts of revenue and expenses during the reporting period. Actual results could differ from those estimates.
The following is a summary of significant accounting policies consistently followed by the Fund in the preparation of its financial statements.
Security Valuation
Debt securities generally are valued by pricing services approved by the Board of Trustees (the Board) based upon market transactions for normal, institutional-size trading units of similar securities. The services may use various pricing techniques which take into account appropriate factors such as yield, quality, coupon rate, maturity, type of issue, trading characteristics and other data, as well as broker quotes. Debt securities for which quotations are readily available may also be valued based upon an over-the-counter or exchange bid quotation.
Investments in other open-end investment companies, including money market funds, are valued at net asset value.
Short-term securities purchased within 60 days to maturity are valued at amortized cost, which approximates market value. The value of short-term securities originally purchased with maturities greater than 60 days is determined based on an amortized value to par upon reaching 60 days to maturity. Short-term securities maturing in more than 60 days from the valuation date are valued at the market price or approximate market value based on current interest rates.
Investments for which market quotations are not readily available, or that have quotations which management believes are not reliable, are valued at fair value as determined in good faith under consistently applied procedures established by and under the general supervision of the Board. If a security or class of securities (such as foreign securities) is valued at fair value, such value is likely to be different from the last quoted market price for the security.
The determination of fair value often requires significant judgment. To determine fair value, management may use assumptions including but not limited to future cash flows and estimated risk premiums. Multiple inputs from various sources may be used to determine fair value.
Security Transactions
Security transactions are accounted for on the trade date. Cost is determined and gains (losses) are based upon the specific identification method for both financial statement and federal income tax purposes.
Income Recognition
Interest income is recorded on an accrual basis. Market premiums and discounts, including original issue discounts, are amortized and accreted, respectively, over the expected life of the security on all debt securities, unless otherwise noted.
Dividend income is recorded on the ex-dividend date.
Annual Report 2012
28
Columbia California Tax-Exempt Fund
Notes to Financial Statements (continued)
October 31, 2012
Expenses
General expenses of the Trust are allocated to the Fund and other funds of the Trust based upon relative net assets or other expense allocation methodologies determined by the nature of the expense. Expenses directly attributable to the Fund are charged to the Fund. Expenses directly attributable to a specific class of shares are charged to that share class.
Determination of Class Net Asset Value
All income, expenses (other than class-specific expenses, which are charged to that share class, as shown in the Statement of Operations) and realized and unrealized gains (losses) are allocated to each class of the Fund on a daily basis for purposes of determining the net asset value of each class. Income and expenses are allocated to each class based on the settled shares method, while realized and unrealized gains (losses) are allocated based on the relative net assets of each class.
Federal Income Tax Status
The Fund intends to qualify each year as a regulated investment company under Subchapter M of the Internal Revenue Code, as amended, and will distribute substantially all of its tax exempt income (including net short-term capital gains), if any, for its tax year, and as such will not be subject to federal income taxes. In addition, the Fund intends to distribute in each calendar year substantially all of its net investment income, capital gains and certain other amounts, if any, such that the Fund should not be subject to federal excise tax. Therefore, no federal income or excise tax provision is recorded.
Distributions to Shareholders
Distributions from net investment income, if any, are declared daily and paid monthly. Net realized capital gains, if any, are distributed at least annually. Income distributions and capital gain distributions are determined in accordance with federal income tax regulations, which may differ from GAAP.
Guarantees and Indemnifications
Under the Trust's organizational documents and, in some cases, by contract, its officers and trustees are indemnified against certain liabilities arising out of the performance of their duties to the Trust or its funds. In addition, certain of the Fund's contracts with its service providers contain general indemnification clauses. The Fund's maximum exposure under these arrangements is unknown since the amount of any future claims that may be made against the Fund cannot be determined, and the Fund has no historical basis for predicting the likelihood of any such claims.
Recent Accounting Pronouncement
Disclosures about Offsetting Assets and Liabilities
In December 2011, the Financial Accounting Standards Board (FASB) issued ASU No. 2011-11, Disclosures about Offsetting Assets and Liabilities. The objective of the FASB is to enhance current disclosure requirements on offsetting of certain assets and liabilities and to enable financial statement users to compare financial statements prepared under GAAP and International Financial Reporting Standards.
Specifically, ASU No. 2011-11 requires an entity to disclose both gross and net information for derivatives and other financial instruments that are subject to a master netting arrangement or similar agreement. The standard requires disclosure of collateral received in connection with the master netting agreements or similar agreements. The effective date of ASU No. 2011-11 is for interim and annual periods beginning on or after January 1, 2013. At this time, management is evaluating the implications of this guidance and the impact it will have on the financial statement amounts and footnote disclosures, if any.
Note 3. Fees and Compensation Paid to Affiliates
Investment Management Fees
Under an Investment Management Services Agreement, Columbia Management Investment Advisers, LLC (the Investment Manager), a wholly-owned subsidiary of Ameriprise Financial, Inc. (Ameriprise Financial), determines which securities will be purchased, held or sold. The investment management fee is an annual fee that is equal to a percentage of the Fund's average daily net assets that declines from 0.40% to 0.27% as the Fund's net assets increase. The annualized effective investment management fee rate for the year ended October 31, 2012 was 0.40% of the Fund's average daily net assets.
Administration Fees
Under an Administrative Services Agreement, the Investment Manager also serves as the Fund Administrator. The Fund pays the Fund Administrator an annual fee for administration and accounting services equal to a percentage of the Fund's average daily net assets that declines from 0.07% to 0.04% as the Fund's net assets increase. The annualized effective administration fee rate for the year ended October 31, 2012 was 0.07% of the Fund's average daily net assets.
Compensation of Board Members
Board members are compensated for their services to the Fund as disclosed in the Statement of Operations. The Trust's eligible Trustees may participate in a Deferred Compensation Plan (the Plan) which may be terminated at any time.
Annual Report 2012
29
Columbia California Tax-Exempt Fund
Notes to Financial Statements (continued)
October 31, 2012
Obligations of the Plan will be paid solely out of the Fund's assets.
Compensation of Chief Compliance Officer
The Board has appointed a Chief Compliance Officer to the Fund in accordance with federal securities regulations. The Fund pays its pro-rata share of the expenses associated with the Chief Compliance Officer. The Fund's expenses for the Chief Compliance Officer will not exceed $15,000 per year.
Transfer Agent Fees
Under a Transfer and Dividend Disbursing Agent Agreement, Columbia Management Investment Services Corp. (the Transfer Agent), an affiliate of the Investment Manager and a wholly-owned subsidiary of Ameriprise Financial, is responsible for providing transfer agency services to the Fund. The Transfer Agent has contracted with Boston Financial Data Services (BFDS) to serve as sub-transfer agent.
The Transfer Agent receives monthly account-based service fees based on the number of open accounts and is reimbursed by the Fund for the fees and expenses the Transfer Agent pays to financial intermediaries that maintain omnibus accounts with the Fund that is a percentage of the average aggregate value of the Fund's shares maintained in each such omnibus account (other than omnibus accounts for which American Enterprise Investment Services Inc. is the broker of record or accounts where the beneficial shareholder is a customer of Ameriprise Financial Services, Inc., which are paid a per account fee). The Transfer Agent pays the fees of BFDS for services as sub-transfer agent and is not entitled to reimbursement for such fees from the Fund (with the exception of out-of-pocket fees).
The Transfer Agent also receives compensation from fees for various shareholder services and reimbursements for certain out-of-pocket fees.
For the year ended October 31, 2012, the Fund's annualized effective transfer agent fee rates as a percentage of average daily net assets of each class were as follows:
Class A | | | 0.12 | % | |
Class B | | | 0.12 | | |
Class C | | | 0.12 | | |
Class Z | | | 0.12 | | |
In connection with the acquisition of Seligman California Municipal High-Yield Fund and Seligman California Municipal Quality Fund (see Note 8), the Fund assumed the assets and obligations of Seligman Municipal High-Yield Fund and Seligman California Municipal Quality Fund, which together with certain other associated investment companies (together, the Guarantors), have severally, but not jointly, guaranteed the performance and observance of all the terms
and conditions of a lease entered into by Seligman Data Corp. (SDC), the former transfer agent, including the payment of rent by SDC (the Guaranty). The lease and the Guaranty expire in January 2019. At October 31, 2012, the Fund's total potential future obligation over the life of the Guaranty is $77,350. The liability remaining at October 31, 2012 for non-recurring charges associated with the lease amounted to $39,953 and is included within other accrued expenses in the Statement of Assets and Liabilities.
An annual minimum account balance fee of $20 may apply to certain accounts with a value below the Fund's initial minimum investment requirements to reduce the impact of small accounts on transfer agent fees. These minimum account balance fees are recorded as part of expense reductions in the Statement of Operations. For the year ended October 31, 2012, these minimum account balance fees reduced total expenses by $800.
Distribution and Service Fees
The Fund has an agreement with Columbia Management Investment Distributors, Inc. (the Distributor), an affiliate of the Investment Manager and a wholly-owned subsidiary of Ameriprise Financial, for distribution and shareholder services. Pursuant to Rule 12b-1 under the 1940 Act, the Board has approved, and the Fund has adopted, distribution and shareholder service plans (the Plans) which set the distribution and service fees for the Fund. These fees are calculated daily and are intended to compensate the Distributor and/or eligible selling and/or servicing agents for selling shares of the Fund and providing services to investors.
The Plans require the payment of a monthly service fee to the Distributor at the maximum annual rate of 0.25% of the average daily net assets attributable to Class A, Class B and Class C shares of the Fund. The Plans also require the payment of a monthly distribution fee to the Distributor at the maximum annual rate of 0.75% of the average daily net assets attributable to Class B and Class C shares, only.
The Distributor has voluntarily agreed to waive a portion of the distribution fee for Class C shares so that the distribution fee does not exceed 0.45% annually of the average daily net assets attributable to Class C shares. This arrangement may be modified or terminated by the Distributor at any time.
Sales Charges
Sales charges, including front-end charges and CDSCs, received by the Distributor for distributing Fund shares were $273,778 for Class A, $2,692 for Class B and $3,580 for Class C shares for the year ended October 31, 2012.
Annual Report 2012
30
Columbia California Tax-Exempt Fund
Notes to Financial Statements (continued)
October 31, 2012
Expenses Waived/Reimbursed by the Investment Manager and its Affiliates
Effective March 1, 2012, the Investment Manager and certain of its affiliates have contractually agreed to waive fees and/or reimburse expenses (excluding certain fees and expenses described below), through February 28, 2013, unless sooner terminated at the sole discretion of the Board, so that the Fund's net operating expenses, after giving effect to fees waived/expenses reimbursed and/or overdraft charges from the Fund's custodian, do not exceed the following annual rates as a percentage of the class' average daily net assets:
Class A | | | 0.79 | % | |
Class B | | | 1.54 | | |
Class C | | | 1.54 | | |
Class Z | | | 0.54 | | |
Prior to March 1, 2012, the Investment Manager and its affiliates contractually agreed to waive fees and/or reimburse expenses (excluding certain fees and expenses described below), so that the Fund's net operating expenses, after giving effect to fees waived/expenses reimbursed and /or overdraft charges from the Fund's custodian, did not exceed the following annual rates as a percentage of the class' average daily net assets:
Class A | | | 0.79 | % | |
Class B | | | 1.54 | | |
Class C | | | 1.54 | | |
Class Z | | | 0.55 | | |
Under the agreement, the following fees and expenses are excluded from the waiver/reimbursement commitment, and therefore will be paid by the Fund, if applicable: taxes (including foreign transaction taxes), expenses associated with investments in affiliated and non-affiliated pooled investment vehicles (including mutual funds and exchange traded funds), transaction costs and brokerage commissions, costs related to any securities lending program, dividend expenses associated with securities sold short, inverse floater program fees and expenses, transaction charges and interest on borrowed money, interest, extraordinary expenses and any other expenses the exclusion of which is specifically approved by the Board. This agreement may be modified or amended only with approval from all parties. Class C distribution fees waived by the Distributor, as discussed above, are in addition to the waiver/reimbursement commitment under the agreement.
Note 4. Federal Tax Information
The timing and character of income and capital gain distributions are determined in accordance with income tax
regulations, which may differ from GAAP because of temporary or permanent book to tax differences.
At October 31, 2012, these differences are primarily due to differing treatment for Trustees' deferred compensation, market discount/premium, tax straddles and distributions. To the extent these differences are permanent, reclassifications are made among the components of the Fund's net assets in the Statement of Assets and Liabilities. Temporary differences do not require reclassifications.
The Fund did not have any permanent differences; therefore, no reclassifications were made to the Statement of Assets and Liabilities.
The tax character of distributions paid during the years indicated was as follows:
Year Ended October 31, | | 2012 | | 2011 | |
Tax exempt income | | $ | 21,740,939 | | | $ | 18,108,130 | | |
Ordinary income | | | 64,295 | | | | 202,635 | | |
Long-term capital gains | | | — | | | | 6,582,928 | | |
Total | | $ | 21,805,234 | | | $ | 24,893,693 | | |
Short-term capital gain distributions, if any, are considered ordinary income distributions for tax purposes.
At October 31, 2012, the components of distributable earnings on a tax basis were as follows:
Undistributed tax-exempt income | | $ | 1,968,327 | | |
Undistributed accumulated long-term capital gains | | | 331,653 | | |
Unrealized appreciation | | | 58,195,482 | | |
At October 31, 2012, the cost of investments for federal income tax purposes was $497,062,225 and the aggregate gross unrealized appreciation and depreciation based on that cost was:
Unrealized appreciation | | $ | 59,357,131 | | |
Unrealized depreciation | | | (1,094,506 | ) | |
Net unrealized appreciation | | $ | 58,262,625 | | |
For the year ended October 31, 2012, $1,773,937 of capital loss carryforward was utilized.
Management of the Fund has concluded that there are no significant uncertain tax positions that would require recognition in the financial statements. However, management's conclusion may be subject to review and adjustment at a later date based on factors including, but not limited to, new tax laws, regulations, and administrative interpretations (including relevant court decisions). Generally, the Fund's federal tax returns for the prior three fiscal years remain subject to examination by the Internal Revenue Service.
Annual Report 2012
31
Columbia California Tax-Exempt Fund
Notes to Financial Statements (continued)
October 31, 2012
Note 5. Portfolio Information
The cost of purchases and proceeds from sales of securities, excluding short-term obligations, aggregated to $73,889,762 and $94,248,015, respectively, for the year ended October 31, 2012.
Note 6. Shareholder Concentration
At October 31, 2012, one unaffiliated shareholder account owned 25.5% of the outstanding shares of the Fund. The Fund has no knowledge about whether any portion of those shares was owned beneficially by such account. Subscription and redemption activity by concentrated accounts may have a significant effect on the operations of the Fund.
Note 7. Line of Credit
The Fund has entered into a revolving credit facility with a syndicate of banks led by JPMorgan Chase Bank N.A. whereby the Fund may borrow for the temporary funding of shareholder redemptions or for other temporary or emergency purposes. The credit facility agreement, as amended, which is a collective agreement between the Fund and certain other funds managed by the Investment Manager, severally and not jointly, permits collective borrowings up to $500 million. Pursuant to a December 13, 2011 amendment to the credit facility agreement, interest is charged to each participating fund based on its borrowings at a rate equal to the higher of (i) the overnight federal funds rate plus 1.00% or (ii) the one-month LIBOR rate plus 1.00%. Each borrowing under the credit facility matures no later than 60 days after the date of borrowing. The Fund also pays a commitment fee equal to its pro rata share of the amount of the credit facility at a rate of 0.08% per annum.
Prior to December 13, 2011, interest was charged to each participating fund based on its borrowings at a rate equal to the sum of the federal funds rate plus (i) 1.25% per annum plus (ii) if one-month LIBOR exceeds the federal funds rate, the amount of such excess. The Fund also paid a commitment fee equal to its pro rata share of the amount of the credit facility at a rate of 0.10% per annum.
The Fund had no borrowings during the year ended October 31, 2012.
Note 8. Fund Merger
At the close of business on June 3, 2011, the Fund acquired the assets and assumed the identified liabilities of RiverSource California Tax-Exempt Fund, Seligman California Municipal High-Yield Fund and Seligman California Municipal Quality Fund. The acquisitions were completed after shareholders of the acquired funds approved the plan on February 15, 2011.
The aggregate net assets of the Fund immediately before the acquisitions were $332,108,133 and the combined net assets immediately after the acquisition were $523,831,818.
The acquistitions were accomplished by a tax-free exchange of 27,173,603 shares of RiverSource California Tax-Exempt Fund valued at $131,803,028 (including unrealized depreciation of $1,951,895); 4,558,463 shares of Seligman California Municipal High-Yield Fund valued at $28,374,254 (including unrealized depreciation of $309,020) and 5,050,016 shares of Seligman California Municipal Quality Fund valued at $31,546,403 (including unrealized appreciation of $335,251).
In exchange for shares of RiverSource California Tax-Exempt Fund, Seligman California Municipal High-Yield Fund and Seligman California Municipal Quality Fund shares, the Fund issued the following number of shares:
| | | RiverSource
California
Tax-Exempt
Fund | | Seligman
California
Municipal
High-Yield Fund | | Seligman
California
Municipal
Quality Fund | |
Class A | | | 17,755,478 | | | | 3,261,658 | | | | 4,075,493 | | |
Class B | | | 218,017 | | | | — | | | | — | | |
Class C | | | 408,374 | | | | 693,938 | | | | 324,976 | | |
For financial reporting purposes, net assets received and shares issued by the Fund were recorded at fair value; however, RiverSource California Tax-Exempt Fund, Seligman California Municipal High-Yield Fund and Seligman California Municipal Quality Fund's cost of investments were carried forward.
The financial statements reflect the operations of the Fund for the period prior to the merger and the combined fund for the period subsequent to the merger. Because the combined investment portfolios have been managed as a single integrated portfolio since the merger was completed, it is not practicable to separate the amounts of revenue and earnings of RiverSource California Tax-Exempt Fund, Seligman California Municipal High-Yield Fund and Seligman California Municipal Quality Fund that have been included in the combined Fund's Statement of Operations since the merger was completed.
Assuming the merger had been completed on November 1, 2010, the Fund's pro-forma net investment income, net gain on investments, net change in unrealized depreciation and net increase in net assets from operations for the year ended October 31, 2011, would have been approximately $23.2 million, $0.3 million, $(15.0) million and $8.5 million, respectively.
Annual Report 2012
32
Columbia California Tax-Exempt Fund
Notes to Financial Statements (continued)
October 31, 2012
Note 9. Significant Risks
Non-Diversification Risk
A non-diversified fund is permitted to invest a greater percentage of its total assets in fewer issuers than a diversified fund. The Fund may, therefore, have a greater risk of loss from a few issuers than a similar fund that invests more broadly.
Geographic Concentration Risk
Because state-specific tax-exempt funds invest primarily in the municipal securities issued by the state and political sub-divisions of the state, the Fund will be particularly affected by political and economic conditions and developments in the state in which it invests. The Fund may, therefore, have a greater risk than that of a municipal bond fund which is more geographically diversified. The value of the municipal securities owned by the Fund also may be adversely affected by future changes in federal or state income tax laws.
Note 10. Subsequent Events
Management has evaluated the events and transactions that have occurred through the date the financial statements were issued and noted no items requiring adjustment of the financial statements or additional disclosure.
Note 11. Information Regarding Pending and Settled Legal Proceedings
In December 2005, without admitting or denying the allegations, American Express Financial Corporation (AEFC, which is now known as Ameriprise Financial, Inc. (Ameriprise Financial)) entered into settlement agreements with the Securities and Exchange Commission (SEC) and Minnesota Department of Commerce (MDOC) related to market timing activities. As a result, AEFC was censured and ordered to cease and desist from committing or causing any violations of certain provisions of the Investment Advisers Act of 1940, the Investment Company Act of 1940, and various Minnesota laws. AEFC agreed to pay disgorgement of $10 million and civil money penalties of $7 million. AEFC also agreed to retain an independent distribution consultant to assist in developing a plan for distribution of all disgorgement and civil penalties ordered by the SEC in accordance with various undertakings detailed at www.sec.gov/litigation/admin/ia-2451.pdf. Ameriprise Financial and its affiliates have cooperated with the SEC and the MDOC in these legal proceedings, and have made regular reports to the funds' Boards of Trustees.
Ameriprise Financial and certain of its affiliates have historically been involved in a number of legal, arbitration and regulatory proceedings, including routine litigation, class actions, and governmental actions, concerning matters arising in connection with the conduct of their business activities.
Ameriprise Financial believes that the Funds are not currently the subject of, and that neither Ameriprise Financial nor any of its affiliates are the subject of, any pending legal, arbitration or regulatory proceedings that are likely to have a material adverse effect on the Funds or the ability of Ameriprise Financial or its affiliates to perform under their contracts with the Funds. Ameriprise Financial is required to make 10-Q, 10-K and, as necessary, 8-K filings with the Securities and Exchange Commission on legal and regulatory matters that relate to Ameriprise Financial and its affiliates. Copies of these filings may be obtained by accessing the SEC website at www.sec.gov.
There can be no assurance that these matters, or the adverse publicity associated with them, will not result in increased fund redemptions, reduced sale of fund shares or other adverse consequences to the Funds. Further, although we believe proceedings are not likely to have a material adverse effect on the Funds or the ability of Ameriprise Financial or its affiliates to perform under their contracts with the Funds, these proceedings are subject to uncertainties and, as such, we are unable to estimate the possible loss or range of loss that may result. An adverse outcome in one or more of these proceedings could result in adverse judgments, settlements, fines, penalties or other relief that could have a material adverse effect on the consolidated financial condition or results of operations of Ameriprise Financial.
Annual Report 2012
33
Columbia California Tax-Exempt Fund
Report of Independent Registered Public Accounting Firm
To the Trustees of Columbia Funds Series Trust I and
the Shareholders of Columbia California Tax-Exempt Fund
In our opinion, the accompanying statement of assets and liabilities, including the portfolio of investments, and the related statements of operations and of changes in net assets and the financial highlights present fairly, in all material respects, the financial position of Columbia California Tax-Exempt Fund (the "Fund") (a series of Columbia Funds Series Trust I) at October 31, 2012, the results of its operations for the year then ended, the changes in its net assets for each of the two years in the period then ended and the financial highlights for each of the periods indicated, in conformity with accounting principles generally accepted in the United States of America. These financial statements and financial highlights (hereafter referred to as "financial statements") are the responsibility of the Fund's management. Our responsibility is to express an opinion on these financial statements based on our audits. We conducted our audits of these financial statements in accordance with the standards of the Public Company Accounting Oversight Board (United States). Those standards require that we plan and perform the audit to obtain reasonable assurance about whether the financial statements are free of material misstatement. An audit includes examining, on a test basis, evidence supporting the amounts and disclosures in the financial statements, assessing the accounting principles used and significant estimates made by management, and evaluating the overall financial statement presentation. We believe that our audits, which included confirmation of securities at October 31, 2012 by correspondence with the custodian, brokers and transfer agent, provide a reasonable basis for our opinion.
PricewaterhouseCoopers LLP
Minneapolis, Minnesota
December 21, 2012
Annual Report 2012
34
Columbia California Tax-Exempt Fund
Federal Income Tax Information
(Unaudited)
The Fund hereby designates the following tax attributes for the fiscal year ended October 31, 2012. Shareholders will be notified in early 2013 of amounts for use in preparing 2012 income tax returns.
Tax Designations:
Capital Gain Dividend | | $ | 348,236 | | |
Exempt-Interest Dividends | | | 99.70 | % | |
Capital Gain Dividend — The Fund designates as a capital gain dividend the amount reflected above, or if subsequently determined to be different, the net capital gain of such fiscal period. The Fund also designates as capital gain dividends, to the extent necessary to fully distribute such capital gains, earnings and profits distributed to shareholders on the redemption of shares.
Exempt-Interest Dividends — The percentage of net investment income distributions paid during the fiscal year that qualifies as exempt-interest dividends for federal income tax purposes.
Annual Report 2012
35
Columbia California Tax-Exempt Fund
The Trustees serve terms of indefinite duration. The names, addresses and birth years of the Trustees and Officers of the Funds in Columbia Funds Series Trust I, the year each was first elected or appointed to office, their principal business occupations during at least the last five years, the number of Funds overseen by each Trustee and other directorships they hold are shown below. Each officer listed below serves as an officer of each Fund in Columbia Funds Series Trust I.
Independent Trustees
Name, Address and Year of Birth,
Position with Funds, Year First
Elected or Appointed to Office | | Principal Occupation(s) During Past Five Years, Number of Funds in Columbia
Funds Complex Overseen by Trustee, Other Directorships Held
| |
Rodman L. Drake (Born 1943)
c/o Columbia Management Investment Advisers, LLC
225 Franklin Street
Boston, MA 02110
Trustee (since 1994) and
Chairman of the Board (since 2009) | | Independent consultant since 2010; Co-Founder of Baringo Capital LLC (private equity) from 1997 to 2008; CEO of Crystal River Capital, Inc. (real estate investment trust) from 2003 to 2010; Oversees 52; Jackson Hewitt Tax Service Inc. (tax preparation services from 2004 to 2011); Celgene Corporation (global biotechnology company); Student Loan Corporation (student loan provider from 2005 to 2010); Celgene Corporation (global biotechnology company); The Helios Funds and Brookfield Funds (closed-end funds); Crystal River Capital, Inc. from 2005 to 2010; Parsons Brinckerhoff from 1995 to 2008; and Apex Silver Mines Ltd. from 2007 to 2009 | |
Douglas A. Hacker (Born 1955)
c/o Columbia Management Investment Advisers, LLC
225 Franklin Street
Boston, MA 02110
Trustee (since 1996) | | Independent business executive since May 2006; Executive Vice President — Strategy of United Airlines from December 2002 to May 2006; President of UAL Loyalty Services (airline marketing company) from September 2001 to December 2002; Executive Vice President and Chief Financial Officer of United Airlines from July 1999 to September 2001. Oversees 52; Nash Finch Company (food distributor); Aircastle Limited (aircraft leasing); and SeaCube Container Leasing Ltd. (container leasing) | |
Janet Langford Kelly (Born 1957)
c/o Columbia Management Investment Advisers, LLC
225 Franklin Street
Boston, MA 02110
Trustee (since 1996) | | Senior Vice President, General Counsel and Corporate Secretary, ConocoPhillips (integrated energy company) since September 2007; Deputy General Counsel — Corporate Legal Services, ConocoPhillips from August 2006 to August 2007; Partner, Zelle, Hofmann, Voelbel, Mason & Gette LLP (law firm) from March 2005 to July 2006; Adjunct Professor of Law, Northwestern University from September 2004 to June 2006; Director, UAL Corporation (airline) from February 2006 to July 2006; Chief Administrative Officer and Senior Vice President, Kmart Holding Corporation (consumer goods) from September 2003 to March 2004. Oversees 52; None | |
Nancy T. Lukitsh (Born 1956)
c/o Columbia Management Investment Advisers, LLC
225 Franklin Street
Boston, MA 02110
Trustee (since 2011) | | Senior Vice President, Partner and Director of Marketing, Wellington Management Company, LLP (investment adviser) from 1997 to 2010; Chair, Wellington Management Investment Portfolios (commingled non-U.S. investment pools) from 2007 to 2010; Director, Wellington Trust Company, NA and other Wellington affiliates from 1997 to 2010. Oversees 52; None | |
William E. Mayer (Born 1940)
c/o Columbia Management Investment Advisers, LLC
225 Franklin Street
Boston, MA 02110
Trustee (since 1994) | | Partner, Park Avenue Equity Partners (private equity) since February 1999; Dean and Professor, College of Business and Management, University of Maryland from 1992 to 1996. Oversees 52; DynaVox Inc. (speech creation); Lee Enterprises (print media); WR Hambrecht + Co. (financial service provider) from 2000 to 2012; BlackRock Kelso Capital Corporation (investment company) | |
David M. Moffett (Born 1952)
c/o Columbia Management Investment Advisers, LLC
225 Franklin Street
Boston, MA 02110
Trustee (since 2011) | | Retired. Chief Executive Officer, Federal Home Loan Mortgage Corporation, from 2008 to 2009; Senior Adviser, Global Financial Services Group, Carlyle Group, Inc., from 2007 to 2008; Vice Chairman and Chief Financial Officer, U.S. Bancorp, from 1993 to 2007. Oversees 52; CIT Group Inc. (commercial and consumer finance); eBay Inc. (online trading community); MBIA Inc. (financial service provider); E.W. Scripps Co. (print and television media), Building Materials Holding Corp. (building materials and construction services); and University of Oklahoma Foundation. | |
Charles R. Nelson (Born 1942)
c/o Columbia Management Investment Advisers, LLC
225 Franklin Street
Boston, MA 02110
Trustee (since 1981) | | Retired Professor Emeritus, University of Washington, since 2011; Professor of Economics, University of Washington from January 1976 to 2011; Ford and Louisa Van Voorhis Professor of Political Economy, University of Washington from 1993 to 2011; Adjunct Professor of Statistics, University of Washington from 1980 to 2011; Associate Editor, Journal of Money Credit and Banking from 1993 to 2008; consultant on econometric and statistical matters. Oversees 52; None | |
John J. Neuhauser (Born 1943)
c/o Columbia Management Investment Advisers, LLC
225 Franklin Street
Boston, MA 02110
Trustee (since 1984) | | President, Saint Michael's College, since August 2007; Director or Trustee of several non-profit organizations, including Fletcher Allen Health Care, Inc.; University Professor, Boston College from November 2005 to August 2007; Academic Vice President and Dean of Faculties, Boston College from August 1999 to October 2005. Oversees 52; Liberty All-Star Equity Fund and Liberty All-Star Growth Fund (closed-end funds) | |
Annual Report 2012
36
Columbia California Tax-Exempt Fund
Trustees and Officers (continued)
Independent Trustees (continued)
Name, Address and Year of Birth,
Position with Funds, Year First
Elected or Appointed to Office | | Principal Occupation(s) During Past Five Years, Number of Funds in Columbia
Funds Complex Overseen by Trustee, Other Directorships Held
| |
Patrick J. Simpson (Born 1944)
c/o Columbia Management Investment Advisers, LLC
225 Franklin Street
Boston, MA 02110
Trustee (since 2000) | | Partner, Perkins Coie LLP (law firm). Oversees 52; None | |
Anne-Lee Verville (Born 1945)
c/o Columbia Management Investment Advisers, LLC
225 Franklin Street
Boston, MA 02110
Trustee (since 1998) | | Retired. General Manager — Global Education Industry from 1994 to 1997, President — Application Systems Division from 1991 to 1994, Chief Financial Officer — US Marketing & Services from 1988 to 1991, and Chief Information Officer from 1987 to 1988, IBM Corporation (computer and technology). Oversees 52; Enesco Group, Inc. (producer of giftware and home and garden decor products) from 2001 to 2006 | |
Interested Trustee
Name, Address and Year of Birth,
Position with Funds, Year First
Elected or Appointed to Office | | Principal Occupation(s) During Past Five Years, Number of Funds in Columbia
Funds Complex Overseen by Trustee, Other Directorships Held
| |
William F. Truscott (born 1960)
53600 Ameriprise Financial Center
Minneapolis, MN 55474
Senior Vice President (since 2012) | | Chairman of the Board and President, Columbia Management Investment Advisers, LLC since May 2010 and February 2012, respectively (previously President, Chairman of the Board and Chief Investment Officer, from 2001 to April 2010); Chief Executive Officer, U.S. Asset Management & President, Annuities, Ameriprise Financial, Inc. since May 2010 (previously President — U.S. Asset Management and Chief Investment Officer from 2005 to April 2010, and Senior Vice President — Chief Investment Officer, from 2001 to 2005); Director, President and Chief Executive Officer, Ameriprise Certificate Company since 2006; Director and Chief Executive Officer, Columbia Management Investment Distributors, Inc. since May 2010 and February 2012, respectively (previously Chairman of the Board and Chief Executive Officer from 2008 to April 2010); Chairman of the Board and Chief Executive Officer, RiverSource Distributors, Inc. since 2006. Oversees 208; Columbia Funds Board. | |
The Statement of Additional Information includes additional information about the Trustees of the Funds and is available, without charge, upon request by calling 1-800-345-6611.
Officers
Name, Year of Birth and Address | | Principal Occupation(s) During the Past Five Years | |
J. Kevin Connaughton (Born 1964)
225 Franklin Street
Boston, MA 02110
President (since 2009) | | Senior Vice President and General Manager — Mutual Fund Products, Columbia Management Investment Advisers, LLC since May 2010; President, Columbia Funds, since 2009, and RiverSource Funds, since May 2010 (previously Senior Vice President and Chief Financial Officer, Columbia Funds, from June 2008 to January 2009, Treasurer, Columbia Funds, from October 2003 to May 2008, and senior officer of various other affiliated funds since 2000); Managing Director, Columbia Management Advisors, LLC from December 2004 to April 2010. | |
Michael G. Clarke (Born 1969)
225 Franklin Street
Boston, MA 02110
Treasurer (since 2011) and Chief Financial Officer (since 2009) | | Vice President, Columbia Management Investment Advisers, LLC since May 2010; Managing Director of Fund Administration, Columbia Management Advisors, LLC, from September 2004 to April 2010; senior officer of Columbia Funds and affiliated funds since 2002. | |
Scott R. Plummer (Born 1959)
5228 Ameriprise Financial Center
Minneapolis, MN 55474
Senior Vice President, Assistant Secretary and Chief Legal Officer (since 2010) | | Senior Vice President, Chief Legal Officer and Assistant Secretary, Columbia Management Investment Advisers, LLC since June 2005; Vice President and Lead Chief Counsel — Asset Management, Ameriprise Financial, Inc. since May 2010 (previously Vice President and Chief Counsel — Asset Management, from 2005 to April 2010); Vice President, Chief Counsel and Assistant Secretary, Columbia Management Investment Distributors, Inc. since 2008; Vice President, General Counsel and Secretary, Ameriprise Certificate Company since 2005; Chief Counsel, RiverSource Distributors, Inc. since 2006; Vice President, General Counsel and Secretary, RiverSource Funds since December 2006; Senior Vice President, Secretary and Chief Legal Officer, Columbia Funds, since May 2010. | |
Annual Report 2012
37
Columbia California Tax-Exempt Fund
Trustees and Officers (continued)
Officers (continued)
Name, Year of Birth and Address | | Principal Occupation(s) During the Past Five Years | |
William F. Truscott (Born 1960)
53600 Ameriprise Financial Center
Minneapolis, MN 55474
Senior Vice President (since 2010) | | Chairman of the Board and President, Columbia Management Investment Advisers, LLC since May 2010 and February 2012, respectively (previously President, Chairman of the Board and Chief Investment Officer, from 2001 to April 2010); Chief Executive Officer, U.S. Asset Management & President, Annuities, Ameriprise Financial, Inc. since May 2010 (previously President — U.S. Asset Management and Chief Investment Officer from 2005 to April 2010); Director, President and Chief Executive Officer, Ameriprise Certificate Company since 2006; Director and Chief Executive Officer, Columbia Management Investment Distributors, Inc. since May 2010 and February 2012, respectively (previously Chairman of the Board and Chief Executive Officer from 2008 to April 2010); Chairman of the Board and Chief Executive Officer, RiverSource Distributors, Inc. since 2006. | |
Thomas P. McGuire (Born 1972)
225 Franklin Street
Boston, MA 02110
Chief Compliance Officer (since 2012) | | Vice President — Asset Management Compliance, Columbia Management Investment Advisers, LLC since 2010; Chief Compliance Officer, Ameriprise Certificate Company, since September 2010; Compliance Executive, Bank of America, 2005-2010. | |
Colin Moore (Born 1958)
225 Franklin Street
Boston, MA 02110
Senior Vice President (since 2010) | | Director and Chief Investment Officer, Columbia Management Investment Advisers, LLC since May 2010; Manager, Managing Director and Chief Investment Officer of Columbia Management Advisors, LLC from 2007 to April 2010; Head of Equities, Columbia Management Advisors, LLC from 2002 to 2007. | |
Amy Johnson (Born 1965)
5228 Ameriprise Financial Center
Minneapolis, MN 55474
Vice President (since 2010) | | Senior Vice President and Chief Operating Officer, Columbia Management Investment Advisers, LLC since May 2010 (previously Chief Administrative Officer, from 2009 until April 2010, Vice President — Asset Management and Trust Company Services, from 2006 to 2009, and Vice President — Operations and Compliance from 2004 to 2006). | |
Joseph F. DiMaria (Born 1968)
225 Franklin Street
Boston, MA 02110
Vice President (since 2011) and Chief Accounting Officer (since 2008) | | Vice President, Mutual Fund Administration, Columbia Management Investment Advisers, LLC, since May 2010; Director of Fund Administration, Columbia Management Advisors, LLC from January 2006 to April 2010; Head of Tax/Compliance and Assistant Treasurer, Columbia Management Advisors, LLC, from November 2004 to December 2005. | |
Stephen T. Welsh (born 1957)
225 Franklin Street
Boston, MA 02110
Vice President (since 2006) | | President and Director, Columbia Management Investment Services Corp. since May 2010; President and Director, Columbia Management Services, Inc. from July 2004 to April 2010; Managing Director, Columbia Management Distributors, Inc. from August 2007 to April 2010. | |
Paul D. Pearson (born 1956)
10468 Ameriprise Financial Center
Minneapolis, MN 55474
Vice President and Assistant Treasurer (since 2011) | | Vice President, Investment Accounting, Columbia Management Investment Advisers, LLC, since May 2010; Vice President, Managed Assets, Investment Accounting, Ameriprise Financial Corporation. | |
Paul B. Goucher (born 1968)
5228 Ameriprise Financial Center
Minneapolis, MN 55474
Vice President and Assistant Secretary (since 2010) | | Vice President and Chief Counsel of Ameriprise Financial since January 2010 (formerly Vice President and Group Counsel from November 2008 to January 2010); Director, Managing Director and General Counsel of J. & W. Seligman & Co. Incorporated (Seligman) from July 2008 to November 2008 and Managing Director and Associate General Counsel of Seligman from January 2005 to July 2008. | |
Christopher O. Petersen (born 1970)
5228 Ameriprise Financial Center
Minneapolis, MN 55474
Vice President (since 2010) and Secretary (since 2011) | | Vice President and Chief Counsel, Ameriprise Financial since January 2010 (formerly Vice President and Group Counsel or Counsel from April 2004 to January 2010); Assistant Secretary of RiverSource Funds since January 2007; officer of Columbia Funds and affiliated funds since 2007. | |
Michael E. DeFao (born 1968)
225 Franklin Street
Boston, MA 02110
Vice President and Assistant Secretary (since 2011) | | Vice President and Chief Counsel, Ameriprise Financial since May 2010; Associate General Counsel, Bank of America from June 2005 to April 2010. | |
Annual Report 2012
38
Columbia California Tax-Exempt Fund
Board Consideration and Approval of
Advisory Agreement
On June 6, 2012, the Board of Trustees (the "Board") and the Trustees who are not interested persons (as defined in the Investment Company Act of 1940) of the Trust (the "Independent Trustees") unanimously approved the continuation of the Investment Management Services Agreement (the "Advisory Agreement") with Columbia Management Investment Advisers, LLC (the "Investment Manager") with respect to Columbia California Tax-Exempt Fund (the "Fund"), a series of the Trust. As detailed below, the Advisory Fees and Expenses Committee (the "Committee") and the Board met on multiple occasions to review and discuss, both among themselves and with the management team of the Investment Manager, materials provided by the Investment Manager before determining to approve the continuation of the Advisory Agreement.
In connection with their deliberations regarding the continuation of the Advisory Agreement, the Committee and the Board requested and evaluated materials from the Investment Manager regarding the Fund and the Advisory Agreement, and discussed these materials with representatives of the Investment Manager at the Committee meeting held on June 5, 2012 and at the Board meeting held on June 6, 2012. In addition, the Board considers matters bearing on the Advisory Agreement at most of its other meetings throughout the year and meets regularly with senior management of the Funds and the Investment Manager. Through the Board's Investment Oversight Committees, Trustees also meet with selected Fund portfolio managers and other investment personnel at various times throughout the year. The Committee and the Board also consulted with Fund counsel and with the Independent Trustees' independent legal counsel, who advised on the legal standard for consideration by the Board and otherwise assisted the Board in its deliberations. On June 5, 2012, the Committee recommended that the Board approve the continuation of the Advisory Agreement. On June 6, 2012, the Board, including the Independent Trustees, voting separately, unanimously approved the continuation of the Advisory Agreement for the Fund.
The Committee and the Board considered all information that they, their legal counsel, or the Investment Manager believed reasonably necessary to evaluate and to determine whether to approve the continuation of the Advisory Agreement. In their deliberations, the Trustees did not identify any particular information that was all-important or controlling, and individual Trustees may have attributed different weights to the various factors. The information and factors considered by the Committee and the Board in recommending for approval or approving the continuation of the Advisory Agreement for the Fund included the following:
• Information on the investment performance of the Fund relative to the performance of the Fund's benchmarks and the performance of a group of comparable mutual funds, as determined by an independent third-party data provider;
• Information on the Fund's advisory fees and total expenses, including information comparing the Fund's expenses to those of a group of comparable mutual funds, as determined by an independent third-party data provider;
• The Investment Manager's agreement to contractually limit or cap total operating expenses for the Fund so that total operating expenses (excluding certain fees and expenses, such as transaction costs and certain other investment related expenses, interest, taxes, acquired fund fees and expenses, and extraordinary expenses) would not exceed the median expenses of a group of comparable funds (as determined from time to time, generally annually, by an independent third-party data provider);
• The terms and conditions of the Advisory Agreement, including that the advisory fee rates payable by the Fund would not change;
• The terms and conditions of other agreements and arrangements with affiliates of the Investment Manager relating to the operations of the Fund, including the Administrative Services Agreement, the Distribution Agreement and the Transfer and Dividend Disbursing Agent Agreement, noting in the case of the Transfer and Dividend Disbursing Agent Agreement certain proposed changes to the fee rates payable thereunder;
• Descriptions of various functions performed by the Investment Manager under the Advisory Agreement, including portfolio management and portfolio trading practices;
• Information regarding the management fees and investment performance of any comparable portfolios of other clients of the Investment Manager, including institutional separate accounts; and
• The profitability to the Investment Manager and its affiliates from their relationships with the Fund.
Annual Report 2012
39
Columbia California Tax-Exempt Fund
Board Consideration and Approval of
Advisory Agreement (continued)
Nature, Extent and Quality of Services to be Provided under the Advisory Agreement
The Committee and the Board considered the nature, extent and quality of services provided to the Fund by the Investment Manager and its affiliates under the Advisory Agreement and under separate agreements for the provision of transfer agency and administrative services, and the resources dedicated to the Fund and the other Columbia Funds by the Investment Manager and its affiliates. The Committee and the Board considered, among other things, the Investment Manager's ability to attract, motivate and retain highly qualified research, advisory and supervisory investment professionals (including personnel and other resources, compensation programs for personnel involved in fund management, reputation and other attributes), the portfolio management services provided by those investment professionals, the quality of the Investment Manager's investment research capabilities and trade execution services, and the other resources that the Investment Manager devotes to the Fund. The Committee and the Board also considered the potential benefits to shareholders of investing in a mutual fund that is part of a fund complex offering exposure to a variety of asset classes and investment disciplines and providing a variety of fund and shareholder services.
The Committee and the Board also considered the professional experience and qualifications of the senior personnel of the Investment Manager. The Committee and the Board noted the compliance programs of and the compliance-related resources provided to the Fund by the Investment Manager and its affiliates, and considered the Investment Manager's ability to provide administrative services to the Fund pursuant to a separate administrative services agreement, including the Investment Manager's ability to coordinate the activities of the Fund's other service providers. After reviewing these and related factors, the Committee and the Board concluded, within the context of their overall conclusions, that the expected nature, extent and quality of the services to be provided to the Fund under the Advisory Agreement supported the continuation of such agreement.
Investment Performance
The Committee and the Board reviewed information about the performance of the Fund over various time periods, including performance information relative to benchmarks and information based on reports of an independent third-party data provider that compared the performance of the Fund to the performance of a group of comparable mutual funds. The Committee and the Board also reviewed a description of the third party's methodology for identifying the Fund's peer groups for purposes of performance and expense comparisons. In the case of each Fund whose performance lagged that of a relevant peer group for certain (although not necessarily all) periods, the Committee and the Board concluded that other factors relevant to performance were sufficient, in light of other considerations, to warrant continuation of the Fund's Advisory Agreement. Those factors varied from fund to fund, but included one or more of the following: (i) that the Fund's performance, although lagging in certain recent periods, was stronger over the longer term; (ii) that the underperformance was attributable, to a significant extent, to investment decisions that were reasonable and consistent with the Fund's investment strategy and policies and that the Fund was performing within a reasonable range of expectations, given those investment decisions, market conditions and the Fund's investment strategy; (iii) that the Fund's performance was competitive when compared to other relevant performance benchmarks or peer groups; and (iv) that the Investment Manager had taken or was taking steps designed to help improve the Fund's investment performance, including, but not limited to, replacing portfolio managers, enhancing the resources supporting the portfolio managers, or modifying investment strategies.
The Committee and the Board noted that, through December 31, 2011, the Fund's performance was in the twenty-eighth, sixty-ninth and fourteenth percentiles (where the best performance would be in the first percentile) of its category selected by an independent third-party data provider for the purposes of performance comparisons for the one-, three- and five- year periods, respectively.
The Committee and the Board also considered the Investment Manager's performance and reputation generally, the Investment Manager's historical responsiveness to Board concerns about performance and the Investment Manager's willingness to take steps intended to improve performance. After reviewing these and related factors, the Committee and the Board concluded, within the context of their overall conclusions regarding the Advisory Agreement, that the performance of the Fund and the Investment Manager was sufficient, in light of other considerations, to warrant the continuation of the Advisory Agreement.
Annual Report 2012
40
Columbia California Tax-Exempt Fund
Board Consideration and Approval of
Advisory Agreement (continued)
Investment Advisory Fee Rates and Other Expenses
The Committee and the Board considered the advisory fees to be charged to the Fund under the Advisory Agreement as well as the total expenses to be incurred by the Fund. In assessing the reasonableness of the fees under the Advisory Agreement, the Committee and the Board considered, among other information, the Fund's advisory fee and its expected total expense ratio as a percentage of average daily net assets. The Committee and the Board noted that the Fund's actual management fee and total net expense ratio are ranked in the second and third quintiles, respectively, against the Fund's expense universe as determined by an independent third-party data provider for purposes of expense comparison. The Committee and the Board also took into account the fee waiver and expense limitation arrangements agreed to by the Investment Manager, as noted above.
The Committee and the Board also considered the fact that the advisory fee rates payable by the Fund to the Investment Manager under the Advisory Agreement were the same as those currently paid by the Fund to the Investment Manager.
The Committee and the Board also received and considered information about the advisory fees charged by the Investment Manager to institutional separate accounts. In considering the fees charged to those accounts, the Committee and the Board took into account, among other things, the Investment Manager's representations about the differences between managing mutual funds as compared to other types of accounts, including differences in the services provided, differences in the risk profile of such business for the Investment Manager and the additional resources required to manage mutual funds effectively. In evaluating the Fund's advisory fees, the Committee and the Board also took into account the demands, complexity and quality of the investment management of the Fund.
After reviewing these and related factors, the Committee and the Board concluded, within the context of their overall conclusions, that the advisory fee rates and expenses of the Fund supported the continuation of the Advisory Agreement.
Costs of Services to be Provided and Profitability
The Committee and the Board also took note of the costs of the services provided (both on an absolute and relative basis) and the profitability to the Investment Manager and its affiliates in connection with their relationships with the Fund. In evaluating these considerations, the Committee and the Board took note of the advisory fees charged by the Investment Manager to other clients, including fees charged by the Investment Manager to any institutional separate account clients with similar investment strategies to those of the Fund.
The Committee and the Board also considered the compensation directly or indirectly received by the Investment Manager's affiliates in connection with their relationships with the Fund. The Committee and the Board reviewed information provided by management as to the profitability of the Investment Manager and its affiliates of their relationships with the Fund, and information about the allocation of expenses used to calculate profitability. When reviewing profitability, the Committee and the Board also considered court cases in which adviser profitability was an issue in whole or in part, the performance of the fund, the expense ratio of the fund, and the implementation of expense limitations with respect to the fund. The Committee and the Board also considered information provided by the Investment Manager regarding its financial condition and comparing its profitability to that of other asset management firms that are, or are subsidiaries of, publicly traded companies.
After reviewing these and related factors, the Committee and the Board concluded, within the context of their overall conclusions, that the profitability to the Investment Manager and its affiliates from their relationships with the Fund supported the continuation of the Advisory Agreement.
Economies of Scale
The Committee and the Board considered the potential existence of economies of scale in the provision by the Investment Manager of services to the Fund, to groups of related funds, and to the Investment Manager's investment advisory clients as a whole, and whether those economies of scale were shared with the Fund through breakpoints in investment advisory fees or other means, such as expense limitation arrangements and additional investments by the Investment Manager in investment, trading and compliance resources. The Committee and the Board noted that the investment advisory fee schedules for the Fund contained breakpoints that would reduce the fee rate on assets above specified threshold levels.
Annual Report 2012
41
Columbia California Tax-Exempt Fund
Board Consideration and Approval of
Advisory Agreement (continued)
In considering these issues, the Committee and the Board also considered the costs of the services provided (both on an absolute and relative basis) and the profitability to the Investment Manager and its affiliates from their relationships with the Fund, as discussed above. After reviewing these and related factors, the Committee and the Board concluded, within the context of their overall conclusions, that the extent to which economies of scale were expected to be shared with the Fund supported the continuation of the Advisory Agreement.
Other Benefits to the Investment Manager
The Committee and the Board received and considered information regarding "fall-out" or ancillary benefits received by the Investment Manager and its affiliates as a result of their relationships with the Fund, such as the engagement of the Investment Manager to provide administrative services to the Fund and the engagement of the Investment Manager's affiliates to provide distribution and transfer agency services to the Fund. The Committee and the Board considered that the Fund's distributor retains a portion of the distribution fees from the Fund and receives a portion of the sales charges on sales or redemptions of certain classes of shares of the Fund. The Committee and the Board also considered the benefits of research made available to the Investment Manager by reason of brokerage commissions generated by the Fund's securities transactions, and reviewed information about the Investment Manager's practices with respect to allocating portfolio brokerage for brokerage and research services. The Committee and the Board considered the possible conflicts of interest associated with certain fall-out or other ancillary benefits and the reporting, disclosure and other processes that would be in place to address such possible conflicts of interest. The Committee and the Board recognized that the Investment Manager's profitability would be somewhat lower without these benefits.
Conclusion
The Committee and the Board reviewed all of the above considerations in reaching their decisions to recommend or approve the continuation of the Advisory Agreement. No single item was identified as paramount or controlling, and individual Trustees may have attributed different weights to various factors. Based on their evaluation of all factors that they deemed to be material, including those factors described above, and assisted by the advice of independent legal counsel, the Board, including the Independent Trustees, voting separately, unanimously approved the continuation of the Advisory Agreement.
Annual Report 2012
42
This page intentionally left blank.
Annual Report 2012
43
This page intentionally left blank.
Annual Report 2012
44
Columbia California Tax-Exempt Fund
Important Information About This Report
Each fund mails one shareholder report to each shareholder address. If you would like more than one report, please call shareholder services at 800.345.6611 and additional reports will be sent to you.
The policy of the Board is to vote the proxies of the companies in which each fund holds investments consistent with the procedures as stated in the Statement of Additional Information (SAI). You may obtain a copy of the SAI without charge by calling 800.345.6611; contacting your financial intermediary; visiting columbiamanagement.com; or searching the website of the Securities and Exchange Commission (SEC) at sec.gov. Information regarding how each fund voted proxies relating to portfolio securities is filed with the SEC by August 31 for the most recent 12-month period ending June 30 of that year, and is available without charge by visiting columbiamanagement.com; or searching the website of the SEC at sec.gov.
Each fund files a complete schedule of portfolio holdings with the SEC for the first and third quarters of each fiscal year on Form N-Q. Each fund's Form N-Q is available on the SEC's website at sec.gov and may be reviewed and copied at the SEC's Public Reference Room in Washington, D.C. Information on the operation of the Public Reference Room may be obtained by calling 800.SEC.0330. Each fund's complete schedule of portfolio holdings, as filed on Form N-Q, can also be obtained without charge, upon request, by calling 800.345.6611.
Annual Report 2012
45

Columbia California Tax-Exempt Fund
P.O. Box 8081
Boston, MA 02266-8081
columbiamanagement.com
This information is for use with concurrent or prior delivery of a fund prospectus. Please read and consider the investment objectives, risks, charges and expenses for any fund carefully before investing. For a prospectus which contains this and other important information about the Fund go to columbiamanagement.com. The Fund is distributed by Columbia Management Investment Distributors, Inc., member FINRA, and managed by Columbia Management Investment Advisers, LLC.
© 2012 Columbia Management Investment Advisers, LLC. All rights reserved.
C-1006 D (12/12)
Annual Report
October 31, 2012

Columbia International Bond Fund
Not FDIC insured • No bank guarantee • May lose value
Columbia International Bond Fund
 Dear Shareholders,
Stocks rebound around the world
After a weak second quarter, U.S. stock market averages rebounded in the third quarter, erasing earlier losses and boosting year-to-date returns well into double digits. Welcome news from Europe and additional quantitative easing in the United States by the Federal Reserve Board helped bolster the rally. The Standard & Poor's 500 Index (S&P 500 Index) rose 6.35% (total return) for the quarter. The Dow Jones Industrial Average advanced 4.32% for the same period. From the beginning of the calendar year through September 30, 2012, the S&P 500 Index was up 16.44% (total return). And, as of the end of September, the S&P 500 Index stood at 1,440 — approximately 8% below its all-time high of 1,565 that was set on October 9, 2007.
Outside the United States, stock markets of both developed and emerging market economies rebounded, as measured in U.S. dollars. Investors responded favorably to the announcement of policy measures aimed to resolve the eurozone crisis, which could potentially have a favorable impact on growth in emerging market economies. A weaker dollar also benefited returns to U.S. investors.
Solid gains for fixed income
Within fixed income, investors appeared to be increasingly willing to take on risk as they abandoned higher quality sectors that dominated the performance rankings in the second quarter and favored riskier sectors, where yield spreads tightened by a significant margin. Fixed-income returns were strong, but unlike equities, they have been less volatile, accumulating steadily over the course of the year. Gains were the highest for high-yield and emerging market bonds. By contrast, government issued debt securities eked out smaller gains.
Stay on track with Columbia Management
Backed by more than 100 years of experience, Columbia Management is one of the nation's largest asset managers. At the heart of our success — and, most importantly, that of our investors — are highly talented industry professionals, brought together by a unique way of working. We are dedicated to helping you take advantage of today's opportunities and anticipate tomorrow's. We stay abreast of the latest investment trends and ideas, using our collective insight to evaluate events and transform them into solutions you can use.
Visit columbiamanagement.com for:
> The Columbia Management Perspectives blog, featuring timely posts by our investment teams
> Detailed up-to-date fund performance and portfolio information
> Economic analysis and market commentary
> Quarterly fund commentaries
> Columbia Management Investor, our award-winning quarterly newsletter for shareholders
Thank you for your continued support of the Columbia Funds. We look forward to serving your investment needs for many years to come.
Best Regards,

J. Kevin Connaughton
President, Columbia Funds
The S&P 500 Index, an unmanaged index, measures the performance of 500 widely held, large-capitalization U.S. stocks and is frequently used as a general measure of market performance. The Dow Jones Industrial Average is a price weighted average of 30 actively traded shares of blue chip US industrial corporations listed on the New York Stock Exchange. Indices are not available for investment, are not professionally managed and do not reflect sales charges, fees, brokerage commissions, taxes or other expenses of investing.
Investors should consider the investment objectives, risks, charges and expenses of a mutual fund carefully before investing. For a free prospectus, which contains this and other important information about a fund, visit columbiamanagement.com. The prospectus should be read carefully before investing.
Columbia Funds are distributed by Columbia Management Investment Distributors, Inc., member FINRA, and managed by Columbia Management Investment Advisers, LLC.
© 2012 Columbia Management Investment Advisers, LLC. All rights reserved.
Columbia International Bond Fund
Performance Overview | | | 2 | | |
Manager Discussion of Fund Performance | | | 4 | | |
Understanding Your Fund's Expenses | | | 6 | | |
Portfolio of Investments | | | 7 | | |
Statement of Assets and Liabilities | | | 14 | | |
Statement of Operations | | | 16 | | |
Statement of Changes in Net Assets | | | 17 | | |
Financial Highlights | | | 19 | | |
Notes to Financial Statements | | | 24 | | |
Report of Independent Registered
Public Accounting Firm | | | 33 | | |
Federal Income Tax Information | | | |
Trustees and Officers | | | 34 | | |
Board Consideration and Approval of Advisory Agreement | | | 37 | | |
Important Information About This Report | | | 41 | | |
Fund Investment Manager
Columbia Management Investment
Advisers, LLC
225 Franklin Street
Boston, MA 02110
Fund Distributor
Columbia Management Investment
Distributors, Inc.
225 Franklin Street
Boston, MA 02110
Fund Transfer Agent
Columbia Management Investment
Services Corp.
P.O. Box 8081
Boston, MA 02266-8081
For more information about any of the funds, please visit columbiamanagement.com or call 800.345.6611. Customer Service Representatives are available to answer your questions Monday through Friday from 8 a.m. to 8 p.m. Eastern time.
The views expressed in this report reflect the current views of the respective parties. These views are not guarantees of future performance and involve certain risks, uncertainties and assumptions that are difficult to predict, so actual outcomes and results may differ significantly from the views expressed. These views are subject to change at any time based upon economic, market or other conditions and the respective parties disclaim any responsibility to update such views. These views may not be relied on as investment advice and, because investment decisions for a Columbia Fund are based on numerous factors, may not be relied on as an indication of trading intent on behalf of any particular Columbia Fund. References to specific securities should not be construed as a recommendation or investment advice.
Columbia International Bond Fund
Performance Summary
> Columbia International Bond Fund (the Fund) Class A shares returned 5.70% excluding sales charges for the five-month period that ended October 31, 2012.
> The Fund outperformed its primary benchmark, the Citigroup Non-U.S. Dollar World Government Bond (All Maturities) Index — Unhedged (Citigroup Non-U.S. WGBI — Unhedged) which returned 3.36% for the same period.
> The Fund underperformed its secondary benchmark, a composite established by the Investment Manager, described below, which returned 6.58% for the reporting period.
> Currency positioning and exposure to emerging markets debt contributed positively to the Fund's relative results, while country allocation overall and an underweighted position in the euro detracted.
Average Annual Total Returns (%) (for period ended October 31, 2012)
| | Inception | | 5 Months
cumulative | | 1 Year | | Life | |
Class A | | 12/01/08 | | | | | | | | | | | | | |
Excluding sales charges | | | | | | | 5.70 | | | | 3.89 | | | | 6.37 | | |
Including sales charges | | | | | | | 0.69 | | | | -1.04 | | | | 5.05 | | |
Class C | | 12/01/08 | | | | | | | | | | | | | |
Excluding sales charges | | | | | | | 5.37 | | | | 3.15 | | | | 5.56 | | |
Including sales charges | | | | | | | 4.37 | | | | 2.15 | | | | 5.56 | | |
Class I* | | 09/27/10 | | | 5.82 | | | | 4.18 | | | | 6.52 | | |
Class W* | | 06/18/12 | | | 5.66 | | | | 3.52 | | | | 5.84 | | |
Class Z | | 12/01/08 | | | 5.81 | | | | 4.15 | | | | 6.63 | | |
Citigroup Non-U.S. WGBI — Unhedged | | | | | | | 3.36 | | | | 1.55 | | | | 6.60 | | |
Blended Benchmark | | | | | | | 6.58 | | | | 3.40 | | | | 8.51 | | |
Returns for Class A are shown with and without the maximum initial sales charge of 4.75%. Returns for Class C are shown with and without the applicable contingent deferred sales charge (CDSC) of 1.00% for the first year only. The Fund's other classes are not subject to sales charges and have limited eligibility. Please see the Fund's prospectuses for details. Performance for different share classes will vary based on differences in sales charges and fees associated with each class. All results shown assume reinvestment of distributions during the period. Returns do not reflect the deduction of taxes that a shareholder may pay on Fund distributions or on the redemption of Fund shares. Performance results reflect the effect of any fee waivers or reimbursements of Fund expenses by Columbia Management Investment Advisers, LLC and/or any of its affiliates. Absent these fee waivers or expense reimbursement arrangements, performance results would have been lower.
The performance information shown represents past performance and is not a guarantee of future results. The investment return and principal value of your investment will fluctuate so that your shares, when redeemed, may be worth more or less than their original cost. Current performance may be lower or higher than the performance information shown. You may obtain performance information current to the most recent month-end by contacting your financial intermediary, visiting columbiamanagement.com or calling 800.345.6611.
*The returns shown for periods prior to the share class inception date (including returns since inception if shown, which are since Fund inception) include the returns of the Fund's oldest share class. Since the Fund launched more than one share class at its inception, Class A shares were used. These returns are adjusted to reflect any higher class-related operating expenses of the newer share classes, as applicable. Please visit columbiamanagement.com/mutual-funds/appended-performance for more information.
The Citigroup Non-U.S. Dollar World Government Bond (All Maturities) Index — Unhedged (Citigroup Non-U.S. WGBI — Unhedged) is calculated on a market-weighted basis and includes investment-grade, fixed-rate bonds, issued by governments outside of the United States (currently, 21 countries), with a remaining maturity of one year or longer and with amounts outstanding of at least the equivalent of U.S. $25 million.
The Blended Benchmark, a weighted custom composite, established by the Investment Manager, consists of a 60% weighting in the Citigroup World Government Bond (excluding the U.S. and Japan) Index (the Citigroup WGBI — ex U.S./Japan), a 20% weighting in the Citigroup Japan Government Bond Index (the Citigroup Japan GBI) and a 20% weighting in the JPMorgan Government Bond Index — Emerging Markets Global Diversified Composite (the JPM GBI EM — Global Diversified). The Citigroup WGBI — ex U.S./Japan has the same calculation and inclusion criteria as the Fund's primary benchmark, the Citigroup Non-U.S. WGBI — Unhedged, while excluding issues from the United States and also Japan. The Citigroup Japan GBI is a market-weighted index based on Yen-denominated debt instruments issued by the government of Japan. The JPM GBI — EM Global Diversified tracks total returns for emerging markets local-currency denominated fixed income instruments.
Indices are not available for investment, are not professionally managed and do not reflect sales charges, fees, brokerage commissions, taxes or other expenses of investing. Securities in the Fund may not match those in an index.
Annual Report 2012
2
Columbia International Bond Fund
Performance Overview (continued)
Performance of a Hypothetical $10,000 Investment (December 1, 2008 – October 31, 2012)
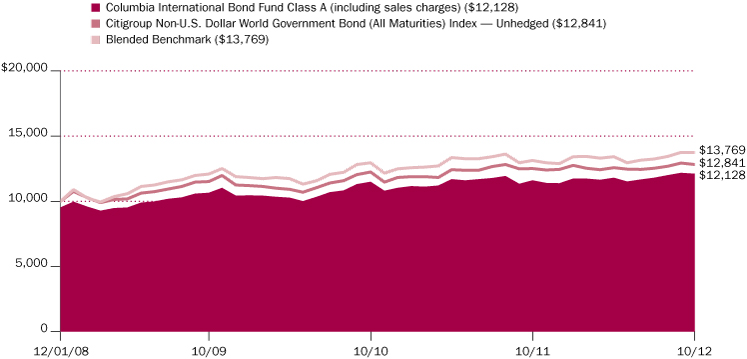
The chart above shows the change in value of a hypothetical $10,000 investment in Class A shares of Columbia International Bond Fund during the stated time period, and does not reflect the deduction of taxes that a shareholder may pay on Fund distributions or on the redemption of Fund shares.
Annual Report 2012
3
Columbia International Bond Fund
Manager Discussion of Fund Performance
The Board of Trustees for Columbia International Bond Fund has approved the change of the Fund's fiscal year end from May 31 to October 31. As a result, this report covers the five-month period since the last annual report. The next report you receive will be for the six-month period from November 1, 2012 through April 30, 2013.
At October 31, approximately 71% of the Fund's shares were owned in the aggregate by affiliated funds-of-funds managed by Columbia Management Investment Advisers, LLC (Columbia). As a result of asset allocation decisions by Columbia, it is possible that Columbia International Bond Fund may experience relatively large purchases or redemptions from affiliated funds-of-funds. Columbia seeks to minimize the impact of these transactions by structuring them over a reasonable period of time. Columbia International Bond Fund may experience increased expenses as it buys and sells securities as a result of purchases or redemptions by affiliated funds-of-funds.
For the five-month period that ended October 31, 2012, the Fund's Class A shares returned 5.70% excluding sales charges. The Fund outperformed its primary benchmark, the Citigroup Non-U.S. Dollar World Government Bond (All Maturities) Index — Unhedged (Citigroup Non-U.S. WGBI — Unhedged), which returned 3.36% for the same period. The Fund underperformed its secondary benchmark, which returned 6.58% for the reporting period. The Fund's secondary benchmark, which is a blended benchmark established by Columbia that was added effective July 1, 2012 because it is representative of the Fund's investment approach, consists 60% of the Citigroup World Government Bond (excluding the U.S. and Japan) Index, 20% of the Citigroup Japan Government Bond Index and 20% of the JPMorgan Government Bond Index — Emerging Markets Global Diversified Composite. Currency positioning and exposure to emerging markets debt contributed positively to the Fund's relative results, while country allocation overall and an underweighted position in the euro detracted.
Global Economy in Long Slog Back to Normalcy
Global economic activity seemed to have stabilized toward the end of the reporting period after its mid-year slowdown, but signs of a broad-based reacceleration in global activity remained limited. Indeed, the muddle-along, sluggish global economic growth scenario, in our view, remained very much intact. Highly accommodative monetary policies by several major central banks helped support economic activity and contain downside risk, but the underlying trajectory of global economic growth was still modest given lingering structural problems and the need for further deleveraging, especially in the key developed countries.
International Bond Market Returns Were Solid
The reporting period was characterized by deceleration in global economic growth, ongoing European sovereign debt drama and uncertainty regarding the U.S. presidential election and looming fiscal cliff, which we believe could push the U.S. economy back into recession if left fully or largely unaddressed. Despite these catalysts of volatility, international bonds, and risk assets broadly, performed surprisingly well during the five months ended October 31, 2012. International government bonds, emerging market debt and high yield corporate bonds each generated solid positive returns. This apparent disconnect was, in our view, fairly strong evidence that much of the liquidity being created by central banks was still having its greatest impact on financial assets rather than on any real economic activity or on prices of goods and services.
Portfolio Management
Nicholas Pifer, CFA
C. Michael Ng, CFA
Country Breakdown (%)
(at October 31, 2012) | |
Argentina | | | 0.4 | | |
Australia | | | 4.6 | | |
Austria | | | 0.4 | | |
Belgium | | | 0.1 | | |
Brazil | | | 0.6 | | |
Bulgaria | | | 0.1 | | |
Canada | | | 9.0 | | |
China | | | 0.1 | | |
Colombia | | | 0.9 | | |
Denmark | | | 0.2 | | |
Dominican Republic | | | 0.3 | | |
Finland | | | 0.3 | | |
France | | | 10.7 | | |
Germany | | | 11.3 | | |
Hungary | | | 0.1 | | |
Indonesia | | | 2.1 | | |
Japan | | | 10.2 | | |
Kazakhstan | | | 0.4 | | |
Lithuania | | | 0.2 | | |
Mexico | | | 6.4 | | |
Netherlands | | | 4.8 | | |
New Zealand | | | 1.0 | | |
Norway | | | 6.4 | | |
Panama | | | 0.1 | | |
Peru | | | 0.6 | | |
Philippines | | | 0.2 | | |
Poland | | | 4.9 | | |
Russian Federation | | | 2.5 | | |
South Africa | | | 2.3 | | |
Supra-National | | | 3.3 | | |
Sweden | | | 4.4 | | |
Turkey | | | 0.7 | | |
Ukraine | | | 0.1 | | |
United Kingdom | | | 8.9 | | |
United States(a) | | | 0.3 | | |
Uruguay | | | 0.3 | | |
Venezuela | | | 0.8 | | |
Total | | | 100.0 | | |
Percentages indicated are based upon total investments. The Fund's portfolio composition is subject to change.
(a) Includes investments in money market funds.
Annual Report 2012
4
Columbia International Bond Fund
Manager Discussion of Fund Performance (continued)
Effective Currency Positioning Overall and Emerging Markets Debt Exposure Offset by Underweight to Euro
During the reporting period, the Fund's currency positioning overall and exposure to emerging markets debt produced favorable results. However, given our concern about a long list of challenges that still lie ahead for Europe, the Fund was rather conservatively structured with an underweight in the euro and no exposure to the government bond markets of Italy, Spain and Ireland. Hence, the Fund missed out on the strong rallies in the euro and the peripheral Eurozone government bond markets that took place during this timeframe.
Looking Ahead
In our view, few developed countries have the room to ease fiscal policy and most still need to bring larger-than-normal budget deficits and government debt-to-GDP (Gross Domestic Product) ratios under control. As a result, we believe monetary policy remained, at the end of the reporting period, the only game in town as far as supporting demand goes. Thus, we expect the emphasis on activist central bank policy to continue in the major G10 countries until the structural impediments restraining economic growth finally fall by the wayside, allowing economic activity to accelerate to the point where inflation becomes a more pressing medium-term concern than it is now.
Over the next year or so, we see the U.K. and Eurozone economies stagnating, as austerity efforts restrain business and consumer confidence. We currently see the Japanese economy stagnating as well. The post-tsunami rebound in Japan has been disappointing in both its scope and duration, and recent data suggests the country is flirting with recession again. In contrast, we, at present, see the U.S. economy expanding in the 2.0% range. We also see the emerging market economies expanding at a trend-like pace, albeit with more country-by-country variability perhaps than seen in the past few years. All told, we see the global economy expanding at a below-trend pace of 3.0% to 3.5% in the year ahead. Given our sluggish economic growth outlook, we do not currently expect inflation to be a significant risk for markets this year or next.
From a currency perspective, we expect the U.S. dollar to move broadly sideways in the year ahead. With the U.S. Federal Reserve Board likely to keep short-term interest rates exceptionally low through at least mid-2015, a U.S. dollar-supportive interest rate environment appears a long way off. Still, the U.S. dollar was already cheap by historical standards at the end of October 2012, especially against the major currencies, and monetary policy remained highly accommodative in other major economies. Occasional bouts of U.S. dollar strength during periods of "risk off" behavior remain likely, in our view, as along as the world remains stuck in the current muddled global economic environment.
While the proposed bond-buying plan dubbed Outright Monetary Transactions (OMT) from the European Central Bank (ECB), announced in September 2012, is not a quantitative easing program in the strict sense, as any bond purchases will be fully sterilized, the plan could have a powerful portfolio balancing effect as riskier assets, such as Spanish government bonds, are taken out of investors' hands and replaced with very low risk assets, such as ECB bills. (Here, the ECB sterilizing of its bond purchases means that it will offset any effects they might have on the Eurozone's money supply.) Since the OMT seems to be a "game changer" and investment flows and supply/demand factors were overwhelming international bond fundamentals at the end of the reporting period, we intend to seek to use any market weakness to add risk assets to the Fund.
As always, we continue to monitor the international government bond markets for changing conditions and to adjust the Fund's country, currency, duration and yield curve positioning in an effort to seek an attractive balance between risk and potential return.
Quality Breakdown (%)
(at October 31, 2012) | |
AAA rating | | | 57.1 | | |
AA rating | | | 13.0 | | |
A rating | | | 11.5 | | |
BBB rating | | | 13.7 | | |
Non-investment grade | | | 4.7 | | |
Total | | | 100.0 | | |
Percentages indicated are based upon total fixed income securities (excluding money market funds).
Bond ratings apply to the underlying holdings of the Fund and not the Fund itself and are divided into categories ranging from AAA (highest) to D (lowest), and are subject to change. The ratings shown are determined by using the middle rating of Moody's, S&P, and Fitch after dropping the highest and lowest available ratings. When a rating from only two agencies is available, the lower rating is used. When a rating from only one agency is available, that rating is used. When a bond is not rated by any of these agencies, it is designated as Not rated. Credit ratings are subjective opinions and not statements of fact.
Annual Report 2012
5
Columbia International Bond Fund
Understanding Your Fund's Expenses
(Unaudited)
As an investor, you incur two types of costs. There are transaction costs, which generally include sales charges on purchases and may include redemption fees. There are also ongoing costs, which generally include management fees, distribution and service (Rule 12b-1) fees, and other fund expenses. The following information is intended to help you understand your ongoing costs (in dollars) of investing in the Fund and to help you compare these costs with the ongoing costs of investing in other mutual funds.
Analyzing Your Fund's Expenses
To illustrate these ongoing costs, we have provided examples and calculated the expenses paid by investors in each share class of the Fund during the period. The actual and hypothetical information in the table is based on an initial investment of $1,000 at the beginning of the period indicated and held for the entire period. Expense information is calculated two ways and each method provides you with different information. The amount listed in the "Actual" column is calculated using the Fund's actual operating expenses and total return for the period. You may use the Actual information, together with the amount invested, to estimate the expenses that you paid over the period. Simply divide your account value by $1,000 (for example, an $8,600 account value divided by $1,000 = 8.6), then multiply the results by the expenses paid during the period under the Actual column. The amount listed in the "Hypothetical" column assumes a 5% annual rate of return before expenses (which is not the Fund's actual return) and then applies the Fund's actual expense ratio for the period to the hypothetical return. You should not use the hypothetical account values and expenses to estimate either your actual account balance at the end of the period or the expenses you paid during the period. See "Compare With Other Funds" below for details on how to use the hypothetical data.
Compare With Other Funds
Since all mutual funds are required to include the same hypothetical calculations about expenses in shareholder reports, you can use this information to compare the ongoing cost of investing in the Fund with other funds. To do so, compare the hypothetical example with the 5% hypothetical examples that appear in the shareholder reports of other funds. As you compare hypothetical examples of other funds, it is important to note that hypothetical examples are meant to highlight the ongoing costs of investing in a fund only and do not reflect any transaction costs, such as sales charges, or redemption or exchange fees. Therefore, the hypothetical calculations are useful in comparing ongoing costs only, and will not help you determine the relative total costs of owning different funds. If transaction costs were included in these calculations, your costs would be higher.
May 1, 2012 – October 31, 2012
| | Account Value at the Beginning
of the Period ($) | | Account Value at the End of the
Period ($) | | Expenses Paid During the
Period ($) | | Fund's Annualized
Expense Ratio (%) | |
| | Actual | | Hypothetical | | Actual | | Hypothetical | | Actual | | Hypothetical | | Actual | |
Class A | | | 1,000.00 | | | | 1,000.00 | | | | 1,026.90 | | | | 1,019.66 | | | | 5.62 | | | | 5.60 | | | | 1.10 | | |
Class C | | | 1,000.00 | | | | 1,000.00 | | | | 1,023.20 | | | | 1,015.88 | | | | 9.43 | | | | 9.40 | | | | 1.85 | | |
Class I | | | 1,000.00 | | | | 1,000.00 | | | | 1,028.30 | | | | 1,021.17 | | | | 4.09 | | | | 4.08 | | | | 0.80 | | |
Class W | | | 1,000.00 | | | | 1,000.00 | | | | 1,042.70 | * | | | 1,019.66 | | | | 4.12 | * | | | 5.60 | | | | 1.10 | * | |
Class Z | | | 1,000.00 | | | | 1,000.00 | | | | 1,028.20 | | | | 1,020.92 | | | | 4.35 | | | | 4.33 | | | | 0.85 | | |
*For the period June 18, 2012 through October 31, 2012. Class W shares commenced operations on June 18, 2012.
Expenses paid during the period are equal to the annualized expense ratio for each class as indicated above, multiplied by the average account value over the period and then multiplied by the number of days in the Fund's most recent fiscal half year and divided by 365.
Expenses do not include fees and expenses incurred indirectly by the Fund from the underlying funds in which the Fund may invest (also referred to as "acquired funds"), including affiliated and non-affiliated pooled investment vehicles (including mutual funds and exchange-traded funds).
Had Columbia Management Investment Advisers, LLC and/or certain of its affiliates not waived/reimbursed certain fees and expenses, account value at the end of the period would have been reduced.
Columbia Management Investment Advisers, LLC and/or certain of its affiliates have contractually agreed to waive certain fees and to absorb certain expenses until February 28, 2014, unless sooner terminated at the sole discretion of the Fund's Board, such that net expenses (excluding fees and expenses of acquired funds) will not exceed 0.74 % for Class I. Any amounts waived will not be reimbursed by the Fund. This change was effective October 1, 2012. If this change had been in place for the entire six month period ended October 31, 2012, the actual expenses paid would have been $3.78 for Class I; the hypothetical expenses paid would have been $3.77 for Class I.
Annual Report 2012
6
Columbia International Bond Fund
Portfolio of Investments
October 31, 2012
(Percentages represent value of investments compared to net assets)
Corporate Bonds & Notes(a) 3.3%
Issuer | | Coupon
Rate | | Principal
Amount ($) | | Value ($) | |
Supra-National 3.2% | |
Asian Development Bank
Senior Unsecured
06/21/27 | | | 2.350 | % | | JPY | 50,000,000 | | | | 717,443 | | |
Eurofima
Senior Unsecured
10/21/19 | | | 4.375 | % | | EUR | 100,000 | | | | 151,098 | | |
European Investment Bank
Senior Unsecured
06/20/17 | | | 1.400 | % | | JPY | 49,000,000 | | | | 644,037 | | |
Nordic Investment Bank
Senior Unsecured
04/27/17 | | | 1.700 | % | | JPY | 50,000,000 | | | | 674,888 | | |
Total | | | | | | | 2,187,466 | | |
Ukraine 0.1% | |
MHP SA(b)
04/29/15 | | | 10.250 | % | | | 100,000 | | | | 102,750 | | |
Total Corporate Bonds & Notes
(Cost: $1,876,483) | | | | | | | 2,290,216 | | |
Inflation-Indexed Bonds(a) 0.2% | |
Uruguay 0.2% | |
Uruguay Government International Bond
04/05/27 | | | 4.250 | % | | UYU | 1,971,044 | | | | 116,049 | | |
Total Inflation-Indexed Bonds
(Cost: $112,346) | | | | | | | 116,049 | | |
Foreign Government Obligations(a) 93.2% | |
Argentina 0.4% | |
Argentina Boden Bonds
Senior Unsecured
10/03/15 | | | 7.000 | % | | | 100,000 | | | | 83,000 | | |
Argentina Bonar Bonds
Senior Unsecured
04/17/17 | | | 7.000 | % | | | 220,000 | | | | 162,800 | | |
Argentina Republic Government International Bond
Senior Unsecured
12/31/33 | | | 8.280 | % | | | 54,022 | | | | 37,005 | | |
Total | | | | | | | 282,805 | | |
Australia 4.4% | |
Australia Government Bond
Senior Unsecured
04/21/23 | | | 5.500 | % | | AUD | 160,000 | | | | 200,922 | | |
Foreign Government Obligations(a) (continued)
Issuer | | Coupon
Rate | | Principal
Amount ($) | | Value ($) | |
Treasury Corp. of Victoria
11/15/18 | | | 5.500 | % | | AUD | 1,500,000 | | | | 1,733,497 | | |
Local Government Guaranteed
11/15/16 | | | 5.750 | % | | AUD | 220,000 | | | | 250,711 | | |
06/15/20 | | | 6.000 | % | | AUD | 720,000 | | | | 867,458 | | |
Total | | | | | | | 3,052,588 | | |
Austria 0.4% | |
Austria Government Bond
Senior Unsecured(b)
09/15/17 | | | 4.300 | % | | EUR | 170,000 | | | | 256,561 | | |
Belgium 0.1% | |
Belgium Government Bond
03/28/15 | | | 3.500 | % | | EUR | 75,000 | | | | 104,492 | | |
Brazil 0.6% | |
Brazilian Government International Bond
01/20/34 | | | 8.250 | % | | | 70,000 | | | | 114,800 | | |
Senior Unsecured
02/03/15 | | | 7.375 | % | | EUR | 30,000 | | | | 44,503 | | |
03/07/15 | | | 7.875 | % | | | 50,000 | | | | 58,300 | | |
Petrobras International Finance Co.
01/27/21 | | | 5.375 | % | | | 150,000 | | | | 169,624 | | |
Total | | | | | | | 387,227 | | |
Bulgaria 0.1% | |
Bulgaria Government International Bond
Senior Unsecured
01/15/15 | | | 8.250 | % | | | 60,000 | | | | 68,940 | | |
Canada 8.7% | |
Canadian Government Bond
08/01/14 | | | 2.250 | % | | CAD | 1,600,000 | | | | 1,634,683 | | |
06/01/22 | | | 2.750 | % | | CAD | 300,000 | | | | 326,057 | | |
Province of Ontario
06/02/19 | | | 4.400 | % | | CAD | 2,800,000 | | | | 3,173,455 | | |
Province of Quebec
12/01/17 | | | 4.500 | % | | CAD | 700,000 | | | | 786,243 | | |
Senior Unsecured
04/29/19 | | | 5.000 | % | | EUR | 50,000 | | | | 78,994 | | |
Total | | | | | | | 5,999,432 | | |
China 0.1% | |
China Government International Bond
Senior Unsecured
10/29/13 | | | 4.750 | % | | | 50,000 | | | | 51,838 | | |
The accompanying Notes to Financial Statements are an integral part of this statement.
Annual Report 2012
7
Columbia International Bond Fund
Portfolio of Investments (continued)
October 31, 2012
Foreign Government Obligations(a) (continued)
Issuer | | Coupon
Rate | | Principal
Amount ($) | | Value ($) | |
Colombia 0.8% | |
Colombia Government International Bond
Senior Unsecured
07/12/21 | | | 4.375 | % | | | 200,000 | | | | 229,700 | | |
05/21/24 | | | 8.125 | % | | | 50,000 | | | | 74,875 | | |
Ecopetrol SA
Senior Unsecured
07/23/19 | | | 7.625 | % | | | 45,000 | | | | 58,275 | | |
Empresas Publicas de Medellin ESP
Senior Unsecured(b)
02/01/21 | | | 8.375 | % | | COP | 340,000,000 | | | | 209,650 | | |
Total | | | | | | | 572,500 | | |
Denmark 0.2% | |
Denmark Government Bond
11/15/13 | | | 5.000 | % | | DKK | 695,000 | | | | 127,065 | | |
Dominican Republic 0.3% | |
Dominican Republic International Bond
Senior Unsecured(b)
05/06/21 | | | 7.500 | % | | | 150,000 | | | | 175,686 | | |
Finland 0.3% | |
Finland Government Bond
Senior Unsecured
07/04/15 | | | 4.250 | % | | EUR | 145,000 | | | | 208,105 | | |
France 10.4% | |
France Government Bond OAT
04/25/17 | | | 3.750 | % | | EUR | 350,000 | | | | 511,493 | | |
10/25/18 | | | 4.250 | % | | EUR | 770,000 | | | | 1,167,501 | | |
04/25/19 | | | 4.250 | % | | EUR | 228,000 | | | | 346,671 | | |
10/25/20 | | | 2.500 | % | | EUR | 1,810,000 | | | | 2,463,097 | | |
04/25/29 | | | 5.500 | % | | EUR | 420,000 | | | | 733,556 | | |
French Treasury Note BTAN
02/25/16 | | | 2.250 | % | | EUR | 1,400,000 | | | | 1,919,904 | | |
Total | | | | | | | 7,142,222 | | |
Germany 10.9% | |
Bundesobligation
04/08/16 | | | 2.750 | % | | EUR | 700,000 | | | | 986,449 | | |
Bundesrepublik Deutschland
07/04/17 | | | 4.250 | % | | EUR | 555,000 | | | | 846,259 | | |
01/04/19 | | | 3.750 | % | | EUR | 1,010,000 | | | | 1,543,376 | | |
07/04/21 | | | 3.250 | % | | EUR | 1,600,000 | | | | 2,412,684 | | |
07/04/28 | | | 4.750 | % | | EUR | 700,000 | | | | 1,237,246 | | |
07/04/42 | | | 3.250 | % | | EUR | 300,000 | | | | 469,021 | | |
Total | | | | | | | 7,495,035 | | |
Foreign Government Obligations(a) (continued)
Issuer | | Coupon
Rate | | Principal
Amount ($) | | Value ($) | |
Hungary 0.1% | |
Hungary Government International Bond
Senior Unsecured
07/18/16 | | | 3.500 | % | | EUR | 40,000 | | | | 49,693 | | |
Indonesia 2.0% | |
Indonesia Government International Bond
Senior Unsecured
04/20/15 | | | 7.250 | % | | | 38,000 | | | | 42,940 | | |
Indonesia Government International Bond(b)
Senior Unsecured
04/20/15 | | | 7.250 | % | | | 80,000 | | | | 90,400 | | |
Indonesia Treasury Bond
Senior Unsecured
07/15/17 | | | 10.000 | % | | IDR | 3,800,000,000 | | | | 469,526 | | |
09/15/25 | | | 11.000 | % | | IDR | 1,330,000,000 | | | | 197,691 | | |
Majapahit Holding BV(b)
08/07/19 | | | 8.000 | % | | | 450,000 | | | | 571,500 | | |
Total | | | | | | | 1,372,057 | | |
Japan 9.9% | |
Japan Government 10-Year Bond
Senior Unsecured
09/20/18 | | | 1.500 | % | | JPY | 5,900,000 | | | | 79,172 | | |
12/20/18 | | | 1.400 | % | | JPY | 105,000,000 | | | | 1,403,315 | | |
06/20/20 | | | 1.100 | % | | JPY | 150,500,000 | | | | 1,969,348 | | |
Japan Government 20-Year Bond
Senior Unsecured
12/20/22 | | | 1.400 | % | | JPY | 70,000,000 | | | | 929,388 | | |
09/20/23 | | | 1.900 | % | | JPY | 29,000,000 | | | | 401,703 | | |
06/20/25 | | | 1.900 | % | | JPY | 50,000,000 | | | | 687,311 | | |
09/20/29 | | | 2.100 | % | | JPY | 80,000,000 | | | | 1,090,894 | | |
Japan Government 30-Year Bond
Senior Unsecured
09/20/40 | | | 2.000 | % | | JPY | 20,000,000 | | | | 255,199 | | |
Total | | | | | | | 6,816,330 | | |
Kazakhstan 0.4% | |
KazMunayGas National Co.(b)
05/05/20 | | | 7.000 | % | | | 200,000 | | | | 246,049 | | |
Lithuania 0.2% | |
Lithuania Government International Bond
Senior Unsecured(b)
03/09/21 | | | 6.125 | % | | | 120,000 | | | | 144,145 | | |
Mexico 6.3% | |
Comision Federal de Electricidad
Senior Unsecured(b)
05/26/21 | | | 4.875 | % | | | 200,000 | | | | 224,500 | | |
The accompanying Notes to Financial Statements are an integral part of this statement.
Annual Report 2012
8
Columbia International Bond Fund
Portfolio of Investments (continued)
October 31, 2012
Foreign Government Obligations(a) (continued)
Issuer | | Coupon
Rate | | Principal
Amount ($) | | Value ($) | |
Mexican Bonos
12/13/18 | | | 8.500 | % | | MXN | 1,120,500 | | | | 995,893 | | |
06/11/20 | | | 8.000 | % | | MXN | 830,000 | | | | 734,569 | | |
05/31/29 | | | 8.500 | % | | MXN | 1,900,000 | | | | 1,800,402 | | |
Mexico Government International Bond
Senior Unsecured
01/15/17 | | | 5.625 | % | | | 90,000 | | | | 105,210 | | |
01/11/40 | | | 6.050 | % | | | 40,000 | | | | 53,100 | | |
Pemex Project Funding Master Trust
01/21/21 | | | 5.500 | % | | | 300,000 | | | | 350,250 | | |
02/24/25 | | | 5.500 | % | | EUR | 20,000 | | | | 29,293 | | |
Total | | | | | | | 4,293,217 | | |
Netherlands 4.7% | |
Netherlands Government Bond(b)
07/15/16 | | | 4.000 | % | | EUR | 240,000 | | | | 351,205 | | |
07/15/18 | | | 4.000 | % | | EUR | 1,300,000 | | | | 1,966,506 | | |
07/15/20 | | | 3.500 | % | | EUR | 600,000 | | | | 896,303 | | |
Total | | | | | | | 3,214,014 | | |
New Zealand 1.0% | |
New Zealand Government Bond
Senior Unsecured
04/15/13 | | | 6.500 | % | | NZD | 55,000 | | | | 46,048 | | |
12/15/17 | | | 6.000 | % | | NZD | 500,000 | | | | 473,049 | | |
05/15/21 | | | 6.000 | % | | NZD | 150,000 | | | | 147,820 | | |
Total | | | | | | | 666,917 | | |
Norway 6.2% | |
Eksportfinans ASA
03/20/14 | | | 1.600 | % | | JPY | 65,000,000 | | | | 781,423 | | |
Norway Government Bond
05/15/13 | | | 6.500 | % | | NOK | 2,000,000 | | | | 359,406 | | |
05/15/15 | | | 5.000 | % | | NOK | 2,300,000 | | | | 438,433 | | |
05/19/17 | | | 4.250 | % | | NOK | 5,240,000 | | | | 1,026,971 | | |
05/22/19 | | | 4.500 | % | | NOK | 8,000,000 | | | | 1,642,433 | | |
Total | | | | | | | 4,248,666 | | |
Panama 0.1% | |
Panama Government International Bond
Senior Unsecured
01/26/36 | | | 6.700 | % | | | 65,000 | | | | 92,527 | | |
Peru 0.6% | |
Peruvian Government International Bond
Senior Unsecured
07/21/25 | | | 7.350 | % | | | 200,000 | | | | 291,000 | | |
11/21/33 | | | 8.750 | % | | | 27,000 | | | | 47,250 | | |
03/14/37 | | | 6.550 | % | | | 45,000 | | | | 65,925 | | |
Total | | | | | | | 404,175 | | |
Foreign Government Obligations(a) (continued)
Issuer | | Coupon
Rate | | Principal
Amount ($) | | Value ($) | |
Philippines 0.2% | |
Philippine Government International Bond
Senior Unsecured
03/17/15 | | | 8.875 | % | | | 105,000 | | | | 123,585 | | |
Poland 4.7% | |
Poland Government Bond
10/24/15 | | | 6.250 | % | | PLN | 1,600,000 | | | | 533,225 | | |
10/25/19 | | | 5.500 | % | | PLN | 7,900,000 | | | | 2,656,304 | | |
Poland Government International Bond
Senior Unsecured
10/19/15 | | | 5.000 | % | | | 50,000 | | | | 55,575 | | |
Total | | | | | | | 3,245,104 | | |
Russian Federation 2.5% | |
Gazprom OAO Via Gaz Capital SA(b)
Senior Unsecured
04/11/18 | | | 8.146 | % | | | 200,000 | | | | 245,026 | | |
03/07/22 | | | 6.510 | % | | | 400,000 | | | | 471,000 | | |
Gazprom OAO Via Gazprom International SA
Senior Unsecured
02/01/20 | | | 7.201 | % | | | 12,795 | | | | 14,331 | | |
Russian Foreign Bond - Eurobond(b)
Senior Unsecured
03/10/18 | | | 7.850 | % | | RUB | 15,000,000 | | | | 512,067 | | |
04/29/20 | | | 5.000 | % | | | 100,000 | | | | 116,150 | | |
03/31/30 | | | 7.500 | % | | | 155,000 | | | | 196,277 | | |
Russian Foreign Bond - Eurobond
Senior Unsecured
03/31/30 | | | 7.500 | % | | | 110,050 | | | | 139,356 | | |
Total | | | | | | | 1,694,207 | | |
South Africa 2.2% | |
South Africa Government Bond
Senior Unsecured
01/15/20 | | | 7.250 | % | | ZAR | 11,000,000 | | | | 1,324,014 | | |
South Africa Government International Bond
05/16/13 | | | 5.250 | % | | EUR | 50,000 | | | | 66,266 | | |
Senior Unsecured
03/08/41 | | | 6.250 | % | | | 120,000 | | | | 153,420 | | |
Total | | | | | | | 1,543,700 | | |
Sweden 4.2% | |
Sweden Government Bond
08/12/17 | | | 3.750 | % | | SEK | 17,080,000 | | | | 2,899,240 | | |
The accompanying Notes to Financial Statements are an integral part of this statement.
Annual Report 2012
9
Columbia International Bond Fund
Portfolio of Investments (continued)
October 31, 2012
Foreign Government Obligations(a) (continued)
Issuer | | Coupon
Rate | | Principal
Amount ($) | | Value ($) | |
Turkey 0.7% | |
Turkey Government International Bond
Senior Unsecured
03/30/21 | | | 5.625 | % | | | 250,000 | | | | 290,625 | | |
02/05/25 | | | 7.375 | % | | | 140,000 | | | | 183,050 | | |
Total | | | | | | | 473,675 | | |
United Kingdom 8.6% | |
Network Rail Infrastructure Finance PLC
Government Guaranteed
12/09/30 | | | 4.375 | % | | GBP | 60,000 | | | | 116,593 | | |
United Kingdom Gilt
03/07/19 | | | 4.500 | % | | GBP | 1,540,000 | | | | 3,003,978 | | |
09/07/20 | | | 3.750 | % | | GBP | 450,000 | | | | 852,660 | | |
09/07/21 | | | 3.750 | % | | GBP | 430,000 | | | | 815,526 | | |
03/07/25 | | | 5.000 | % | | GBP | 253,000 | | | | 538,609 | | |
03/07/36 | | | 4.250 | % | | GBP | 300,000 | | | | 593,014 | | |
Total | | | | | | | 5,920,380 | | |
Uruguay 0.1% | |
Uruguay Government International Bond
Senior Unsecured PIK
01/15/33 | | | 7.875 | % | | | 40,000 | | | | 62,000 | | |
Foreign Government Obligations(a) (continued)
Issuer | | Coupon
Rate | | Principal
Amount ($) | | Value ($) | |
Venezuela 0.8% | |
Petroleos de Venezuela SA
11/02/17 | | | 8.500 | % | | | 500,000 | | | | 448,750 | | |
Venezuela Government International Bond
Senior Unsecured
08/23/22 | | | 12.750 | % | | | 84,000 | | | | 90,090 | | |
Total | | | | | | | 538,840 | | |
Total Foreign Government Obligations
(Cost: $60,903,418) | | | | | | | 63,973,017 | | |
Money Market Funds 0.3% | |
| | | | | Shares | | Value | |
Columbia Short-Term Cash Fund,
0.149%(c)(d) | | | | | 198,636 | | | | 198,636 | | |
Total Money Market Funds
(Cost: $198,636) | | | | | | | 198,636 | | |
Total Investments
(Cost: $63,090,883) | | | | | | | 66,577,918 | | |
Other Assets & Liabilities, Net | | | | | | | 2,029,691 | | |
Net Assets | | | | | | | 68,607,609 | | |
Futures Contracts Outstanding at October 31, 2012
At October 31, 2012, cash of $6,850 was pledged as collateral for open futures contracts and was being held at the broker of the futures contracts.
Contract Description | | Number of
Contracts
Long (Short) | | Notional
Market
Value ($) | | Expiration
Date | | Unrealized
Appreciation ($) | | Unrealized
Depreciation ($) | |
U.S. Treasury Note, 2-year | | | (6 | ) | | | (1,321,969 | ) | | January 2013 | | | 460 | | | | — | | |
U.S. Treasury Note, 10-year | | | (5 | ) | | | (665,156 | ) | | December 2012 | | | — | | | | (1,922 | ) | |
Total | | | | | | | | | 460 | | | | (1,922 | ) | |
Forward Foreign Currency Exchange Contracts Open at October 31, 2012
Counterparty | | Exchange Date | | Currency to
be Delivered | | Currency to
be Received | | Unrealized
Appreciation ($) | | Unrealized
Depreciation ($) | |
Morgan Stanley & Co
| | November 29, 2012
| | | 157,989
(USD) | | | | 900,000
(SEK) | | | | —
| | | | (22,413
| ) | |
State Street Brokerage
| | December 4, 2012
| | | 500,000
(EUR) | | | | 646,425
(USD) | | | | —
| | | | (1,841
| ) | |
Standard Chartered Bank
| | December 5, 2012
| | | 1,374,840
(USD) | | | | 2,800,000
(BRL) | | | | —
| | | | (2,548
| ) | |
JP Morgan Chase Bank
| | December 5, 2012
| | | 2,000,000
(PLN) | | | | 618,965
(USD) | | | | —
| | | | (4,989
| ) | |
Total | | | | | | | | | — | | | | (31,791 | ) | |
The accompanying Notes to Financial Statements are an integral part of this statement.
Annual Report 2012
10
Columbia International Bond Fund
Portfolio of Investments (continued)
October 31, 2012
Notes to Portfolio of Investments
(a) Principal amounts are denominated in United States Dollars unless otherwise noted.
(b) Security exempt from registration pursuant to Rule 144A under the Securities Act of 1933. This security may be resold in transactions exempt from registration, normally to qualified institutional buyers. At October 31, 2012, the value of these securities amounted to $6,775,775 or 9.88% of net assets.
(c) The rate shown is the seven-day current annualized yield at October 31, 2012.
(d) As defined in the Investment Company Act of 1940, an affiliated company is one in which the Fund owns 5% or more of its outstanding voting securities, or a company which is under common ownership or control with the Fund. Holdings and transactions in these affiliated companies during the year ended October 31, 2012, are as follows:
Issuer | | Beginning
Cost ($) | | Purchase
Cost ($) | | Proceeds
From Sales ($) | | Realized
Gain/Loss ($) | | Ending
Cost ($) | | Capital Gain
Distributions ($) | | Dividends
or Interest
Income ($) | | Value ($) | |
Columbia
Short-Term
Cash Fund | | | — | | | | 5,731,982 | | | | (5,533,346) | | | | — | | | | 198,636 | | | | — | | | | 653 | | | | 198,636 | | |
Abbreviation Legend
PIK Payment-in-Kind
Currency Legend
AUD Australian Dollar
BRL Brazilian Real
CAD Canadian Dollar
COP Colombian Peso
DKK Danish Krone
EUR Euro
GBP British Pound
IDR Indonesian Rupiah
JPY Japanese Yen
MXN Mexican Peso
NOK Norwegian Krone
NZD New Zealand Dollar
PLN Polish Zloty
RUB Russian Rouble
SEK Swedish Krona
USD US Dollar
UYU Uruguay Pesos
ZAR South African Rand
The accompanying Notes to Financial Statements are an integral part of this statement.
Annual Report 2012
11
Columbia International Bond Fund
Portfolio of Investments (continued)
October 31, 2012
Fair Value Measurements
Generally accepted accounting principles (GAAP) require disclosure regarding the inputs and valuation techniques used to measure fair value and any changes in valuation inputs or techniques. In addition, investments shall be disclosed by major category.
The Fund categorizes its fair value measurements according to a three-level hierarchy that maximizes the use of observable inputs and minimizes the use of unobservable inputs by prioritizing that the most observable input be used when available. Observable inputs are those that market participants would use in pricing an investment based on market data obtained from sources independent of the reporting entity. Unobservable inputs are those that reflect the Fund's assumptions about the information market participants would use in pricing an investment. An investment's level within the fair value hierarchy is based on the lowest level of any input that is deemed significant to the asset or liability's fair value measurement. The input levels are not necessarily an indication of the risk or liquidity associated with investments at that level. For example, certain U.S. government securities are generally high quality and liquid, however, they are reflected as Level 2 because the inputs used to determine fair value may not always be quoted prices in an active market.
Fair value inputs are summarized in the three broad levels listed below:
> Level 1 — Valuations based on quoted prices for investments in active markets that the Fund has the ability to access at the measurement date (including NAV for open-end mutual funds). Valuation adjustments are not applied to Level 1 investments.
> Level 2 — Valuations based on other significant observable inputs (including quoted prices for similar securities, interest rates, prepayment speeds, credit risks, etc.).
> Level 3 — Valuations based on significant unobservable inputs (including the Fund's own assumptions and judgment in determining the fair value of investments).
Inputs that are used in determining fair value of an investment may include price information, credit data, volatility statistics, and other factors. These inputs can be either observable or unobservable. The availability of observable inputs can vary between investments, and is affected by various factors such as the type of investment, and the volume and level of activity for that investment or similar investments in the marketplace. The inputs will be considered by the Investment Manager, along with any other relevant factors in the calculation of an investment's fair value. The Fund uses prices and inputs that are current as of the measurement date, which may include periods of market dislocations. During these periods, the availability of prices and inputs may be reduced for many investments. This condition could cause an investment to be reclassified between the various levels within the hierarchy.
Investments falling into the Level 3 category are primarily supported by quoted prices from brokers and dealers participating in the market for those investments. However, these may be classified as Level 3 investments due to lack of market transparency and corroboration to support these quoted prices. Additionally, valuation models may be used as the pricing source for any remaining investments classified as Level 3. These models rely on one or more significant unobservable inputs and/or significant assumptions by the Investment Manager. Inputs used in valuations may include, but are not limited to, financial statement analysis, capital account balances, discount rates and estimated cash flows, and comparable company data.
Under the direction of the Fund's Board of Trustees (the Board), the Investment Manager's Valuation Committee (the Committee) is responsible for carrying out the valuation procedures approved by the Board. The Committee consists of voting and non-voting members from various groups within the Investment Manager's organization, including operations and accounting, trading and investments, compliance, risk management and legal.
The Committee meets at least monthly to review and approve valuation matters, which may include a description of specific valuation determinations, data regarding pricing information received from approved pricing vendors and brokers and the results of Board-approved valuation control policies and procedures (the Policies). The Policies address, among other things, instances when market quotations are readily available, including recommendations of third party pricing vendors and a determination of appropriate pricing methodologies; events that require specific valuation determinations and assessment of fair value techniques; securities with a potential for stale pricing, including those that are illiquid, restricted, or in default; and the effectiveness of third-party pricing vendors, including periodic reviews of vendors. The Committee meets more frequently, as needed, to discuss additional valuation matters, which may include the need to review back-testing results, review time-sensitive information or approve related valuation actions. The Committee reports to the Board, with members of the Committee meeting with the Board at each of its regularly scheduled meetings to discuss valuation matters and actions during the period, similar to those described earlier.
For investments categorized as Level 3, the Committee monitors information similar to that described above, which may include: (i) data specific to the issuer or comparable issuers, (ii) general market or specific sector news and (iii) quoted prices and specific or similar security transactions. The Committee considers this data and any changes from prior periods in order to assess the reasonableness of observable and unobservable inputs, any assumptions or internal models used to value those securities and changes in fair value. This data is also used to corroborate, when available, information received from approved pricing vendors and brokers. Various factors impact the frequency of monitoring this information (which may occur as often as daily). However, the Committee may determine that changes to inputs, assumptions and models are not required as a result of the monitoring procedures performed.
The accompanying Notes to Financial Statements are an integral part of this statement.
Annual Report 2012
12
Columbia International Bond Fund
Portfolio of Investments (continued)
October 31, 2012
Fair Value Measurements (continued)
The following table is a summary of the inputs used to value the Fund's investments at October 31, 2012:
Description | | Level 1
Quoted Prices in Active
Markets for Identical
Assets ($) | | Level 2
Other Significant
Observable Inputs ($) | | Level 3
Significant
Unobservable Inputs ($) | | Total ($) | |
Bonds | |
Corporate Bonds & Notes | | | — | | | | 2,290,216 | | | | — | | | | 2,290,216 | | |
Inflation-Indexed Bonds | | | — | | | | 116,049 | | | | — | | | | 116,049 | | |
Foreign Government Obligations | | | — | | | | 63,973,017 | | | | — | | | | 63,973,017 | | |
Total Bonds | | | — | | | | 66,379,282 | | | | — | | | | 66,379,282 | | |
Other | |
Money Market Funds | | | 198,636 | | | | — | | | | — | | | | 198,636 | | |
Total Other | | | 198,636 | | | | — | | | | — | | | | 198,636 | | |
Investments in Securities | | | 198,636 | | | | 66,379,282 | | | | — | | | | 66,577,918 | | |
Derivatives | |
Assets | |
Futures Contracts | | | 460 | | | | — | | | | — | | | | 460 | | |
Liabilities | |
Futures Contracts | | | (1,922 | ) | | | — | | | | — | | | | (1,922 | ) | |
Forward Foreign Currency Exchange Contracts | | | — | | | | (31,791 | ) | | | — | | | | (31,791 | ) | |
Total | | | 197,174 | | | | 66,347,491 | | | | — | | | | 66,544,665 | | |
See the Portfolio of Investments for all investment classifications not indicated in the table.
The Fund's assets assigned to the Level 2 input category are generally valued using the market approach, in which a security's value is determined through reference to prices and information from market transactions for similar or identical assets.
There were no transfers of financial assets between Levels 1 and 2 during the period.
Derivative instruments are valued at unrealized appreciation (depreciation).
The accompanying Notes to Financial Statements are an integral part of this statement.
Annual Report 2012
13
Columbia International Bond Fund
Statement of Assets and Liabilities
October 31, 2012
Assets | |
Investments, at value | |
Unaffiliated issuers (identified cost $62,892,247) | | $ | 66,379,282 | | |
Affiliated issuers (identified cost $198,636) | | | 198,636 | | |
Total investments (identified cost $63,090,883) | | | 66,577,918 | | |
Cash | | | 3,691 | | |
Foreign currency (identified cost $1,251,610) | | | 1,259,064 | | |
Margin deposits on futures contracts | | | 6,850 | | |
Receivable for: | |
Investments sold | | | 8,466 | | |
Capital shares sold | | | 120,460 | | |
Dividends | | | 31 | | |
Interest | | | 762,893 | | |
Reclaims | | | 3,708 | | |
Expense reimbursement due from Investment Manager | | | 15,766 | | |
Prepaid expenses | | | 792 | | |
Trustees' deferred compensation plan | | | 7,469 | | |
Total assets | | | 68,767,108 | | |
Liabilities | |
Unrealized depreciation on forward foreign currency exchange contracts | | | 31,791 | | |
Payable for: | |
Capital shares purchased | | | 69,714 | | |
Variation margin on futures contracts | | | 2,078 | | |
Investment management fees | | | 5,327 | | |
Distribution and service fees | | | 248 | | |
Transfer agent fees | | | 3,640 | | |
Administration fees | | | 748 | | |
Compensation of board members | | | 265 | | |
Chief compliance officer expenses | | | 18 | | |
Other expenses | | | 38,201 | | |
Trustees' deferred compensation plan | | | 7,469 | | |
Total liabilities | | | 159,499 | | |
Net assets applicable to outstanding capital stock | | $ | 68,607,609 | | |
Represented by | |
Paid-in capital | | $ | 65,376,629 | | |
Undistributed net investment income | | | 239,434 | | |
Accumulated net realized loss | | | (475,326 | ) | |
Unrealized appreciation (depreciation) on: | |
Investments | | | 3,487,035 | | |
Foreign currency translations | | | 13,090 | | |
Forward foreign currency exchange contracts | | | (31,791 | ) | |
Futures contracts | | | (1,462 | ) | |
Total — representing net assets applicable to outstanding capital stock | | $ | 68,607,609 | | |
The accompanying Notes to Financial Statements are an integral part of this statement.
Annual Report 2012
14
Columbia International Bond Fund
Statement of Assets and Liabilities (continued)
October 31, 2012
Class A | |
Net assets | | $ | 2,074,316 | | |
Shares outstanding | | | 178,522 | | |
Net asset value per share | | $ | 11.62 | | |
Maximum offering price per share(a) | | $ | 12.20 | | |
Class C | |
Net assets | | $ | 229,932 | | |
Shares outstanding | | | 19,813 | | |
Net asset value per share | | $ | 11.61 | | |
Class I | |
Net assets | | $ | 46,021,842 | | |
Shares outstanding | | | 3,961,686 | | |
Net asset value per share | | $ | 11.62 | | |
Class W | |
Net assets | | $ | 4,421,283 | | |
Shares outstanding | | | 380,502 | | |
Net asset value per share | | $ | 11.62 | | |
Class Z | |
Net assets | | $ | 15,860,236 | | |
Shares outstanding | | | 1,365,385 | | |
Net asset value per share | | $ | 11.62 | | |
(a) The maximum offering price per share is calculated by dividing the net asset value by 1.0 minus the maximum sales charge of 4.75%.
The accompanying Notes to Financial Statements are an integral part of this statement.
Annual Report 2012
15
Columbia International Bond Fund
| | | Period Ended
October 31, 2012(a)(b) | | Year Ended
May 31, 2012 | |
Net investment income | |
Income: | |
Dividends — affiliated issuers | | $ | 653 | | | $ | 1,246 | | |
Interest | | | 857,759 | | | | 2,009,798 | | |
Foreign taxes withheld | | | (3,444 | ) | | | (3,856 | ) | |
Total income | | | 854,968 | | | | 2,007,188 | | |
Expenses: | |
Investment management fees | | | 158,035 | | | | 336,309 | | |
Distribution fees | |
Class C | | | 715 | | | | 2,606 | | |
Service fees | |
Class A | | | 1,905 | | | | 4,913 | | |
Class C | | | 238 | | | | 869 | | |
Class W | | | 2,472 | | | | — | | |
Transfer agent fees | |
Class A | | | 1,359 | | | | 2,792 | | |
Class C | | | 167 | | | | 485 | | |
Class W | | | 2,022 | | | | — | | |
Class Z | | | 11,971 | | | | 21,829 | | |
Administration fees | | | 22,181 | | | | 46,151 | | |
Compensation of board members | | | 6,580 | | | | 21,508 | | |
Pricing and bookkeeping fees | | | — | | | | 3,373 | | |
Custodian fees | | | 6,178 | | | | 25,018 | | |
Printing and postage fees | | | 42,406 | | | | 26,439 | | |
Registration fees | | | 57,750 | | | | 56,749 | | |
Professional fees | | | 20,984 | | | | 49,624 | | |
Chief compliance officer expenses | | | — | | | | 588 | | |
Other | | | — | | | | 5,400 | | |
Total expenses | | | 334,963 | | | | 604,653 | | |
Fees waived or expenses reimbursed by Investment Manager and its affiliates | | | (104,067 | ) | | | (111,603 | ) | |
Total net expenses | | | 230,896 | | | | 493,050 | | |
Net investment income | | | 624,072 | | | | 1,514,138 | | |
Realized and unrealized gain (loss) — net | |
Net realized gain (loss) on: | |
Investments | | | (52,510 | ) | | | (556,478 | ) | |
Foreign currency translations | | | 41,066 | | | | (61,096 | ) | |
Forward foreign currency exchange contracts | | | 19,078 | | | | 259,877 | | |
Futures contracts | | | (4,841 | ) | | | (79,047 | ) | |
Net realized gain (loss) | | | 2,793 | | | | (436,744 | ) | |
Net change in unrealized appreciation (depreciation) on: | |
Investments | | | 3,111,834 | | | | (1,912,193 | ) | |
Foreign currency translations | | | 83,371 | | | | (87,301 | ) | |
Forward foreign currency exchange contracts | | | (138,590 | ) | | | 109,626 | | |
Futures contracts | | | 4,408 | | | | (5,372 | ) | |
Foreign capital gains tax | | | 233 | | | | (233 | ) | |
Net change in unrealized appreciation (depreciation) | | | 3,061,256 | | | | (1,895,473 | ) | |
Net realized and unrealized gain (loss) | | | 3,064,049 | | | | (2,332,217 | ) | |
Net change in net assets resulting from operations | | $ | 3,688,121 | | | $ | (818,079 | ) | |
(a) For the period from June 1, 2012 to October 31, 2012. During the period, the Fund's fiscal year end was changed from May 31 to October 31.
(b) Class W shares are for the period from June 18, 2012 (commencement of operations) to October 31, 2012.
The accompanying Notes to Financial Statements are an integral part of this statement.
Annual Report 2012
16
Columbia International Bond Fund
Statement of Changes in Net Assets
| | | Period Ended
October 31,
2012(a)(b) | | Year Ended
May 31,
2012 | | Year Ended
May 31,
2011(c) | |
Operations | |
Net investment income | | $ | 624,072 | | | $ | 1,514,138 | | | $ | 478,590 | | |
Net realized gain (loss) | | | 2,793 | | | | (436,744 | ) | | | 297,946 | | |
Net change in unrealized appreciation (depreciation) | | | 3,061,256 | | | | (1,895,473 | ) | | | 2,691,503 | | |
Net increase (decrease) in net assets resulting from operations | | | 3,688,121 | | | | (818,079 | ) | | | 3,468,039 | | |
Distributions to shareholders | |
Net investment income | |
Class A | | | (10,978 | ) | | | (51,907 | ) | | | (40,571 | ) | |
Class C | | | (657 | ) | | | (6,446 | ) | | | (11,080 | ) | |
Class I | | | (327,828 | ) | | | (1,107,171 | ) | | | (94,773 | ) | |
Class W | | | (17,188 | ) | | | — | | | | — | | |
Class Z | | | (116,180 | ) | | | (435,429 | ) | | | (535,996 | ) | |
Net realized gains | |
Class A | | | — | | | | — | | | | (2,451 | ) | |
Class C | | | — | | | | — | | | | (862 | ) | |
Class I | | | — | | | | — | | | | (5 | ) | |
Class Z | | | — | | | | — | | | | (29,528 | ) | |
Total distributions to shareholders | | | (472,831 | ) | | | (1,600,953 | ) | | | (715,266 | ) | |
Increase (decrease) in net assets from capital stock activity | | | 3,627,509 | | | | 16,897,307 | | | | 28,627,049 | | |
Total increase in net assets | | | 6,842,799 | | | | 14,478,275 | | | | 31,379,822 | | |
Net assets at beginning of year | | | 61,764,810 | | | | 47,286,535 | | | | 15,906,713 | | |
Net assets at end of year | | $ | 68,607,609 | | | $ | 61,764,810 | | | $ | 47,286,535 | | |
Undistributed net investment income | | $ | 239,434 | | | $ | 103,482 | | | $ | 179,889 | | |
(a) For the period from June 1, 2012 to October 31, 2012. During the period, the Fund's fiscal year end was changed from May 31 to October 31.
(b) Class W shares are for the period from June 18, 2012 (commencement of operations) to October 31, 2012.
(c) Class I shares are for the period from September 27, 2010 (commencement of operations) to May 31, 2011.
The accompanying Notes to Financial Statements are an integral part of this statement.
Annual Report 2012
17
Columbia International Bond Fund
Statement of Changes in Net Assets (continued)
| | | Period Ended October 31,
2012(a)(b) | | Year Ended May 31, 2012 | | Year Ended May 31, 2011(c) | |
| | | Shares | | Dollars ($) | | Shares | | Dollars ($) | | Shares | | Dollars ($) | |
Capital stock activity | |
Class A shares | |
Subscriptions | | | 45,328 | | | | 520,168 | | | | 142,437 | | | | 1,631,986 | | | | 113,078 | | | | 1,250,049 | | |
Distributions reinvested | | | 902 | | | | 10,366 | | | | 4,271 | | | | 47,730 | | | | 3,656 | | | | 39,797 | | |
Redemptions | | | (39,733 | ) | | | (444,736 | ) | | | (83,747 | ) | | | (948,460 | ) | | | (104,010 | ) | | | (1,168,412 | ) | |
Net increase | | | 6,497 | | | | 85,798 | | | | 62,961 | | | | 731,256 | | | | 12,724 | | | | 121,434 | | |
Class C shares | |
Subscriptions | | | 4 | | | | 39 | | | | 4,948 | | | | 56,340 | | | | 9,393 | | | | 102,727 | | |
Distributions reinvested | | | 51 | | | | 588 | | | | 488 | | | | 5,442 | | | | 880 | | | | 9,533 | | |
Redemptions | | | (1,982 | ) | | | (22,043 | ) | | | (20,105 | ) | | | (225,327 | ) | | | (8,389 | ) | | | (93,288 | ) | |
Net increase (decrease) | | | (1,927 | ) | | | (21,416 | ) | | | (14,669 | ) | | | (163,545 | ) | | | 1,884 | | | | 18,972 | | |
Class I shares | |
Subscriptions | | | 79,775 | | | | 910,924 | | | | 1,943,469 | | | | 22,284,538 | | | | 2,653,291 | | | | 29,563,477 | | |
Distributions reinvested | | | 28,563 | | | | 327,809 | | | | 98,887 | | | | 1,107,102 | | | | 8,366 | | | | 94,707 | | |
Redemptions | | | (154,195 | ) | | | (1,756,417 | ) | | | (635,599 | ) | | | (7,329,871 | ) | | | (60,871 | ) | | | (687,724 | ) | |
Net increase (decrease) | | | (45,857 | ) | | | (517,684 | ) | | | 1,406,757 | | | | 16,061,769 | | | | 2,600,786 | | | | 28,970,460 | | |
Class W shares | |
Subscriptions | | | 393,364 | | | | 4,507,037 | | | | — | | | | — | | | | — | | | | — | | |
Distributions reinvested | | | 1,483 | | | | 17,173 | | | | — | | | | — | | | | — | | | | — | | |
Redemptions | | | (14,345 | ) | | | (166,490 | ) | | | — | | | | — | | | | — | | | | — | | |
Net increase | | | 380,502 | | | | 4,357,720 | | | | — | | | | — | | | | — | | | | — | | |
Class Z shares | |
Subscriptions | | | 132,311 | | | | 1,476,140 | | | | 322,962 | | | | 3,720,761 | | | | 712,564 | | | | 8,201,837 | | |
Distributions reinvested | | | 593 | | | | 6,817 | | | | 1,351 | | | | 15,120 | | | | 5,500 | | | | 60,356 | | |
Redemptions | | | (152,222 | ) | | | (1,759,866 | ) | | | (309,422 | ) | | | (3,468,054 | ) | | | (765,179 | ) | | | (8,746,010 | ) | |
Net increase (decrease) | | | (19,318 | ) | | | (276,909 | ) | | | 14,891 | | | | 267,827 | | | | (47,115 | ) | | | (483,817 | ) | |
Total net increase | | | 319,897 | | | | 3,627,509 | | | | 1,469,940 | | | | 16,897,307 | | | | 2,568,279 | | | | 28,627,049 | | |
(a) For the period from June 1, 2012 to October 31, 2012. During the period, the Fund's fiscal year end was changed from May 31 to October 31.
(b) Class W shares are for the period from June 18, 2012 (commencement of operations) to October 31, 2012.
(c) Class I shares are for the period from September 27, 2010 (commencement of operations) to May 31, 2011.
The accompanying Notes to Financial Statements are an integral part of this statement.
Annual Report 2012
18
Columbia International Bond Fund
The following tables are intended to help you understand the Fund's financial performance. Certain information reflects financial results for a single share of a class held for the periods shown. Per share net investment income (loss) amounts are calculated based on average shares outstanding during the period. Total return assumes reinvestment of all dividends and distributions. Total return does not reflect payment of sales charges, if any, and is not annualized for periods of less than one year.
| | | Year Ended
October 31, | |
Year Ended May 31, | |
Class A | | 2012(a) | | 2012 | | 2011 | | 2010 | | 2009(b) | |
Per share data | |
Net asset value, beginning of period | | $ | 11.06 | | | $ | 11.50 | | | $ | 10.28 | | | $ | 10.39 | | | $ | 10.00 | | |
Income from investment operations: | |
Net investment income | | | 0.10 | | | | 0.26 | | | | 0.21 | | | | 0.19 | | | | 0.07 | | |
Net realized and unrealized gain (loss) | | | 0.53 | | | | (0.42 | ) | | | 1.39 | | | | (0.07 | ) | | | 0.36 | | |
Total from investment operations | | | 0.63 | | | | (0.16 | ) | | | 1.60 | | | | 0.12 | | | | 0.43 | | |
Less distributions to shareholders: | |
Net investment income | | | (0.07 | ) | | | (0.28 | ) | | | (0.36 | ) | | | (0.22 | ) | | | (0.04 | ) | |
Net realized gains | | | — | | | | — | | | | (0.02 | ) | | | (0.01 | ) | | | — | | |
Total distributions to shareholders | | | (0.07 | ) | | | (0.28 | ) | | | (0.38 | ) | | | (0.23 | ) | | | (0.04 | ) | |
Redemption fees: | |
Redemption fees added to paid-in-capital | | | — | | | | — | | | | — | | | | 0.00 | (c) | | | 0.00 | (c) | |
Net asset value, end of period | | $ | 11.62 | | | $ | 11.06 | | | $ | 11.50 | | | $ | 10.28 | | | $ | 10.39 | | |
Total return | | | 5.70 | % | | | (1.40 | %) | | | 15.86 | % | | | 1.07 | % | | | 4.35 | % | |
Ratios to average net assets(d) | |
Expenses prior to fees waived or expenses reimbursed | | | 1.57 | %(e) | | | 1.36 | % | | | 2.09 | % | | | 2.12 | % | | | 4.87 | %(e) | |
Net expenses after fees waived or expenses reimbursed(f) | | | 1.10 | %(e) | | | 1.10 | % | | | 1.07 | %(g) | | | 1.05 | %(g) | | | 1.05 | %(e)(g) | |
Net investment income | | | 1.99 | %(e) | | | 2.29 | % | | | 1.90 | %(g) | | | 1.78 | %(g) | | | 1.41 | %(e)(g) | |
Supplemental data | |
Net assets, end of period (in thousands) | | $ | 2,074 | | | $ | 1,903 | | | $ | 1,254 | | | $ | 990 | | | $ | 131 | | |
Portfolio turnover | | | 5 | % | | | 20 | % | | | 31 | % | | | 30 | % | | | 4 | % | |
Notes to Financial Highlights
(a) For the period from June 1, 2012 to October 31, 2012. During the period, the Fund's fiscal year end was changed from May 31 to October 31.
(b) For the period from December 1, 2008 (commencement of operations) to May 31, 2009.
(c) Rounds to less than $0.01.
(d) In addition to the fees and expenses which the Fund bears directly, the Fund indirectly bears a pro rata share of the fees and expenses of the acquired funds in which it invests. Such indirect expenses are not included in the reported expense ratios.
(e) Annualized.
(f) The Investment Manager and certain of its affiliates agreed to waive/reimburse certain fees and expenses, if applicable.
(g) The benefits derived from expense reductions had an impact of less than 0.01%.
The accompanying Notes to Financial Statements are an integral part of this statement.
Annual Report 2012
19
Columbia International Bond Fund
Financial Highlights (continued)
| | | Year Ended
October 31, | |
Year Ended May 31, | |
Class C | | 2012(a) | | 2012 | | 2011 | | 2010 | | 2009(b) | |
Per share data | |
Net asset value, beginning of period | | $ | 11.05 | | | $ | 11.49 | | | $ | 10.27 | | | $ | 10.39 | | | $ | 10.00 | | |
Income from investment operations: | |
Net investment income | | | 0.06 | | | | 0.18 | | | | 0.12 | | | | 0.11 | | | | 0.03 | | |
Net realized and unrealized gain (loss) | | | 0.53 | | | | (0.42 | ) | | | 1.40 | | | | (0.08 | ) | | | 0.37 | | |
Total from investment operations | | | 0.59 | | | | (0.24 | ) | | | 1.52 | | | | 0.03 | | | | 0.40 | | |
Less distributions to shareholders: | |
Net investment income | | | (0.03 | ) | | | (0.20 | ) | | | (0.28 | ) | | | (0.14 | ) | | | (0.01 | ) | |
Net realized gains | | | — | | | | — | | | | (0.02 | ) | | | (0.01 | ) | | | — | | |
Total distributions to shareholders | | | (0.03 | ) | | | (0.20 | ) | | | (0.30 | ) | | | (0.15 | ) | | | (0.01 | ) | |
Redemption fees: | |
Redemption fees added to paid-in-capital | | | — | | | | — | | | | — | | | | 0.00 | (c) | | | 0.00 | (c) | |
Net asset value, end of period | | $ | 11.61 | | | $ | 11.05 | | | $ | 11.49 | | | $ | 10.27 | | | $ | 10.39 | | |
Total return | | | 5.37 | % | | | (2.10 | %) | | | 15.01 | % | | | 0.21 | % | | | 3.97 | % | |
Ratios to average net assets(d) | |
Expenses prior to fees waived or expenses reimbursed | | | 2.30 | %(e) | | | 2.10 | % | | | 2.85 | % | | | 2.87 | % | | | 5.62 | %(e) | |
Net expenses after fees waived or expenses reimbursed(f) | | | 1.85 | %(e) | | | 1.85 | % | | | 1.83 | %(g) | | | 1.80 | %(g) | | | 1.80 | %(e)(g) | |
Net investment income | | | 1.23 | %(e) | | | 1.58 | % | | | 1.10 | %(g) | | | 1.06 | %(g) | | | 0.59 | %(e)(g) | |
Supplemental data | |
Net assets, end of period (in thousands) | | $ | 230 | | | $ | 240 | | | $ | 418 | | | $ | 355 | | | $ | 32 | | |
Portfolio turnover | | | 5 | % | | | 20 | % | | | 31 | % | | | 30 | % | | | 4 | % | |
Notes to Financial Highlights
(a) For the period from June 1, 2012 to October 31, 2012. During the period, the Fund's fiscal year end was changed from May 31 to October 31.
(b) For the period from December 1, 2008 (commencement of operations) to May 31, 2009.
(c) Rounds to less than $0.01.
(d) In addition to the fees and expenses which the Fund bears directly, the Fund indirectly bears a pro rata share of the fees and expenses of the acquired funds in which it invests. Such indirect expenses are not included in the reported expense ratios.
(e) Annualized.
(f) The Investment Manager and certain of its affiliates agreed to waive/reimburse certain fees and expenses, if applicable.
(g) The benefits derived from expense reductions had an impact of less than 0.01%.
The accompanying Notes to Financial Statements are an integral part of this statement.
Annual Report 2012
20
Columbia International Bond Fund
Financial Highlights (continued)
| | | Year Ended
October 31, | |
Year Ended May 31, | |
Class I | | 2012(a) | | 2012 | | 2011(b) | |
Per share data | |
Net asset value, beginning of period | | $ | 11.06 | | | $ | 11.48 | | | $ | 11.34 | | |
Income from investment operations: | |
Net investment income | | | 0.11 | | | | 0.29 | | | | 0.23 | | |
Net realized and unrealized gain (loss) | | | 0.53 | | | | (0.40 | ) | | | 0.25 | | |
Total from investment operations | | | 0.64 | | | | (0.11 | ) | | | 0.48 | | |
Less distributions to shareholders: | |
Net investment income | | | (0.08 | ) | | | (0.31 | ) | | | (0.32 | ) | |
Net realized gains | | | — | | | | — | | | | (0.02 | ) | |
Total distributions to shareholders | | | (0.08 | ) | | | (0.31 | ) | | | (0.34 | ) | |
Net asset value, end of period | | $ | 11.62 | | | $ | 11.06 | | | $ | 11.48 | | |
Total return | | | 5.82 | % | | | (0.95 | %) | | | 4.44 | % | |
Ratios to average net assets(c) | |
Expenses prior to fees waived or expenses reimbursed | | | 1.13 | %(d) | | | 0.97 | % | | | 1.33 | %(d) | |
Net expenses after fees waived or expenses reimbursed(e) | | | 0.79 | %(d) | | | 0.81 | % | | | 0.84 | %(d)(f) | |
Net investment income | | | 2.29 | %(d) | | | 2.59 | % | | | 2.96 | %(d)(f) | |
Supplemental data | |
Net assets, end of period (in thousands) | | $ | 46,022 | | | $ | 44,311 | | | $ | 29,870 | | |
Portfolio turnover | | | 5 | % | | | 20 | % | | | 31 | % | |
Notes to Financial Highlights
(a) For the period from June 1, 2012 to October 31, 2012. During the period, the Fund's fiscal year end was changed from May 31 to October 31.
(b) For the period from September 27, 2010 (commencement of operations) to May 31, 2011.
(c) In addition to the fees and expenses which the Fund bears directly, the Fund indirectly bears a pro rata share of the fees and expenses of the acquired funds in which it invests. Such indirect expenses are not included in the reported expense ratios.
(d) Annualized.
(e) The Investment Manager and certain of its affiliates agreed to waive/reimburse certain fees and expenses, if applicable.
(f) The benefits derived from expense reductions had an impact of less than 0.01%.
The accompanying Notes to Financial Statements are an integral part of this statement.
Annual Report 2012
21
Columbia International Bond Fund
Financial Highlights (continued)
Class W | | Year Ended
October 31,
2012(a) | |
Per share data | |
Net asset value, beginning of period | | $ | 11.21 | | |
Income from investment operations: | |
Net investment income | | | 0.09 | | |
Net realized and unrealized gain | | | 0.39 | | |
Total from investment operations | | | 0.48 | | |
Less distributions to shareholders: | |
Net investment income | | | (0.07 | ) | |
Total distributions to shareholders | | | (0.07 | ) | |
Net asset value, end of period | | $ | 11.62 | | |
Total return | | | 4.27 | % | |
Ratios to average net assets(b) | |
Expenses prior to fees waived or expenses reimbursed | | | 1.63 | %(b)(c) | |
Net expenses after fees waived or expenses reimbursed(d) | | | 1.10 | %(b)(c) | |
Net investment income | | | 2.04 | %(c) | |
Supplemental data | |
Net assets, end of period (in thousands) | | $ | 4,421 | | |
Portfolio turnover | | | 5 | % | |
Notes to Financial Highlights
(a) For the period from June 18, 2012 (commencement of operations) to October 31, 2012.
(b) In addition to the fees and expenses which the Fund bears directly, the Fund indirectly bears a pro rata share of the fees and expenses of the acquired funds in which it invests. Such indirect expenses are not included in the reported expense ratios.
(c) Annualized.
(d) The Investment Manager and certain of its affiliates agreed to waive/reimburse certain fees and expenses, if applicable.
The accompanying Notes to Financial Statements are an integral part of this statement.
Annual Report 2012
22
Columbia International Bond Fund
Financial Highlights (continued)
| | | Year Ended
October 31, | |
Year Ended May 31, | |
Class Z | | 2012(a) | | 2012 | | 2011 | | 2010 | | 2009(b) | |
Per share data | |
Net asset value, beginning of period | | $ | 11.06 | | | $ | 11.49 | | | $ | 10.28 | | | $ | 10.39 | | | $ | 10.00 | | |
Income from investment operations: | |
Net investment income | | | 0.11 | | | | 0.29 | | | | 0.23 | | | | 0.21 | | | | 0.07 | | |
Net realized and unrealized gain (loss) | | | 0.53 | | | | (0.41 | ) | | | 1.39 | | | | (0.06 | ) | | | 0.38 | | |
Total from investment operations | | | 0.64 | | | | (0.12 | ) | | | 1.62 | | | | 0.15 | | | | 0.45 | | |
Less distributions to shareholders: | |
Net investment income | | | (0.08 | ) | | | (0.31 | ) | | | (0.39 | ) | | | (0.25 | ) | | | (0.06 | ) | |
Net realized gains | | | — | | | | — | | | | (0.02 | ) | | | (0.01 | ) | | | — | | |
Total distributions to shareholders | | | (0.08 | ) | | | (0.31 | ) | | | (0.41 | ) | | | (0.26 | ) | | | (0.06 | ) | |
Redemption fees: | |
Redemption fees added to paid-in-capital | | | — | | | | — | | | | — | | | | 0.00 | (c) | | | 0.00 | (c) | |
Net asset value, end of period | | $ | 11.62 | | | $ | 11.06 | | | $ | 11.49 | | | $ | 10.28 | | | $ | 10.39 | | |
Total return | | | 5.81 | % | | | (1.06 | %) | | | 16.05 | % | | | 1.31 | % | | | 4.48 | % | |
Ratios to average net assets(d) | |
Expenses prior to fees waived or expenses reimbursed | | | 1.30 | %(e) | | | 1.10 | % | | | 1.85 | % | | | 1.87 | % | | | 4.62 | %(e) | |
Net expenses after fees waived or expenses reimbursed(f) | | | 0.85 | %(e) | | | 0.85 | % | | | 0.83 | %(g) | | | 0.80 | %(g) | | | 0.80 | %(e)(g) | |
Net investment income | | | 2.23 | %(e) | | | 2.56 | % | | | 2.11 | %(g) | | | 1.98 | %(g) | | | 1.50 | %(e)(g) | |
Supplemental data | |
Net assets, end of period (in thousands) | | $ | 15,860 | | | $ | 15,311 | | | $ | 15,745 | | | $ | 14,562 | | | $ | 8,790 | | |
Portfolio turnover | | | 5 | % | | | 20 | % | | | 31 | % | | | 30 | % | | | 4 | % | |
Notes to Financial Highlights
(a) For the period from June 1, 2012 to October 31, 2012. During the period, the Fund's fiscal year end was changed from May 31 to October 31.
(b) For the period from December 1, 2008 (commencement of operations) to May 31, 2009.
(c) Rounds to less than $0.01.
(d) In addition to the fees and expenses which the Fund bears directly, the Fund indirectly bears a pro rata share of the fees and expenses of the acquired funds in which it invests. Such indirect expenses are not included in the reported expense ratios.
(e) Annualized.
(f) The Investment Manager and certain of its affiliates agreed to waive/reimburse certain fees and expenses, if applicable.
(g) The benefits derived from expense reductions had an impact of less than 0.01%.
The accompanying Notes to Financial Statements are an integral part of this statement.
Annual Report 2012
23
Columbia International Bond Fund
Notes to Financial Statements
October 31, 2012
Note 1. Organization
Columbia International Bond Fund (the Fund), a series of Columbia Funds Series Trust I (the Trust), is a non-diversified fund. The Trust is registered under the Investment Company Act of 1940, as amended (the 1940 Act), as an open-end management investment company organized as a Massachusetts business trust.
Fiscal Year End Change
During the period, the Fund changed its fiscal year end from May 31 to October 31.
Fund Shares
The Trust may issue an unlimited number of shares (without par value). The Fund offers Class A, Class C, Class I, Class W and Class Z shares. All share classes have identical voting, dividend and liquidation rights. Each share class has its own expense structure and sales charges, as applicable.
Class A shares are subject to a maximum front-end sales charge of 4.75% based on the initial investment amount. Class A shares purchased without an initial sales charge in accounts aggregating $1 million to $50 million at the time of purchase are subject to a contingent deferred sales charge (CDSC) if the shares are sold within 18 months of purchase, charged as follows: 1.00% CDSC if redeemed within 12 months of purchase, and 0.50% CDSC if redeemed more than 12, but less than 18, months after purchase.
Class C shares are subject to a 1.00% CDSC on shares redeemed within one year of purchase.
Class I shares are not subject to sales charges and are only available to the Columbia Family of Funds.
Class W shares are not subject to sales charges and are only available to investors purchasing through authorized investment programs managed by investment professionals, including discretionary managed account programs. Class W shares commenced operations on June 18, 2012.
Class Z shares are not subject to sales charges, and are only available to certain investors.
Note 2. Summary of Significant Accounting Policies
Use of Estimates
The preparation of financial statements in accordance with U.S. generally accepted accounting principles (GAAP) requires management to make certain estimates and assumptions that affect the reported amounts of assets and liabilities, the disclosure of contingent assets and liabilities at the date of the financial statements and the reported amounts
of revenue and expenses during the reporting period. Actual results could differ from those estimates.
The following is a summary of significant accounting policies consistently followed by the Fund in the preparation of its financial statements.
Security Valuation
Debt securities generally are valued by pricing services approved by the Board of Trustees (the Board) based upon market transactions for normal, institutional-size trading units of similar securities. The services may use various pricing techniques which take into account appropriate factors such as yield, quality, coupon rate, maturity, type of issue, trading characteristics and other data, as well as broker quotes. Debt securities for which quotations are readily available may also be valued based upon an over-the-counter or exchange bid quotation.
Foreign securities are valued based on quotations from the principal market in which such securities are normally traded. If any foreign share prices are not readily available as a result of limited share activity the securities are valued at the mean of the latest quoted bid and ask prices on such exchanges or markets. Foreign currency exchange rates are generally determined at 4:00 p.m. Eastern (U.S.) time. However, many securities markets and exchanges outside the U.S. close prior to the close of the NYSE; therefore, the closing prices for securities in such markets or on such exchanges may not fully reflect events that occur after such close but before the close of the NYSE. In those situations, foreign securities will be fair valued pursuant to the policy adopted by the Board, including utilizing a third party pricing service to determine these fair values. The third party pricing service takes into account multiple factors, including, but not limited to, movements in the U.S. securities markets, certain depositary receipts, futures contracts and foreign exchange rates that have occurred subsequent to the close of the foreign exchange or market, to determine a good faith estimate that reasonably reflects the current market conditions as of the close of the NYSE. The fair value of a security is likely to be different from the quoted or published price, if available.
Investments in other open-end investment companies, including money market funds, are valued at net asset value.
Short-term securities purchased within 60 days to maturity are valued at amortized cost, which approximates market value. The value of short-term securities originally purchased with maturities greater than 60 days is determined based on an amortized value to par upon reaching 60 days to maturity. Short-term securities maturing in more than 60 days from the
Annual Report 2012
24
Columbia International Bond Fund
Notes to Financial Statements (continued)
October 31, 2012
valuation date are valued at the market price or approximate market value based on current interest rates.
Forward foreign currency exchange contracts are marked-to-market based upon foreign currency exchange rates provided by a pricing service.
Futures and options on futures contracts are valued based upon the settlement price established each day by the board of trade or exchange on which they are traded.
Investments for which market quotations are not readily available, or that have quotations which management believes are not reliable, are valued at fair value as determined in good faith under consistently applied procedures established by and under the general supervision of the Board. If a security or class of securities (such as foreign securities) is valued at fair value, such value is likely to be different from the last quoted market price for the security.
The determination of fair value often requires significant judgment. To determine fair value, management may use assumptions including but not limited to future cash flows and estimated risk premiums. Multiple inputs from various sources may be used to determine fair value.
Foreign Currency Transactions and Translations
The values of all assets and liabilities denominated in foreign currencies are translated into U.S. dollars at that day's exchange rates. Net realized and unrealized gains (losses) on foreign currency transactions and translations include gains (losses) arising from the fluctuation in exchange rates between trade and settlement dates on securities transactions, gains (losses) arising from the disposition of foreign currency and currency gains (losses) between the accrual and payment dates on dividends, interest income and foreign withholding taxes.
For financial statement purposes, the Fund does not distinguish that portion of gains (losses) on investments which is due to changes in foreign exchange rates from that which is due to changes in market prices of the investments. Such fluctuations are included with the net realized and unrealized gains (losses) on investments in the Statement of Operations.
Derivative Instruments
The Fund invests in certain derivative instruments, as detailed below, to meet its investment objectives. Derivatives are instruments whose values depend on, or are derived from, in whole or in part, the value of one or more other assets, such as securities, currencies, commodities or indices. Derivative instruments may be used to maintain cash reserves while maintaining exposure to certain other assets, to offset anticipated declines in values of investments, to facilitate trading, to reduce transaction costs and to pursue higher
investment returns. The Fund may also use derivative instruments to mitigate certain investment risks, such as foreign currency exchange rate risk, interest rate risk and credit risk. Derivatives may involve various risks, including the potential inability of the counterparty to fulfill its obligation under the terms of the contract, the potential for an illiquid secondary market and the potential for market movements which may expose the Fund to gains or losses in excess of the amount shown in the Statement of Assets and Liabilities.
The Fund and any counterparty are required to maintain an agreement that requires the Fund and that counterparty to monitor (on a daily basis) the net fair value of all derivatives entered into pursuant to the agreement between the Fund and such counterparty. If the net fair value of such derivatives between the Fund and that counterparty exceeds a certain threshold (as defined in the agreement), the Fund or the counterparty (as the case may be) is required to post cash and/or securities as collateral. Fair values of derivatives presented in the financial statements are not netted with the fair value of other derivatives or with any collateral amounts posted by the Fund or any counterparty.
Forward Foreign Currency Exchange Contracts
Forward foreign currency exchange contracts are agreements between two parties to buy and sell a currency at a set price on a future date. These contracts are intended to be used to minimize the exposure to foreign exchange rate fluctuations during the period between the trade and settlement dates of the contract. The Fund utilized forward foreign currency exchange contracts to hedge the currency exposure associated with some or all of the Fund's securities, to shift foreign currency exposure back to U.S. dollars, to shift investment exposure from one currency to another, and to shift U.S. dollar exposure to achieve a representative weighted mix of major currencies in its benchmark, and/or to recover an underweight country exposure in its portfolio.
The values of forward foreign currency exchange contracts fluctuate with changes in foreign currency exchange rates. The Fund will record a realized gain or loss when the forward foreign currency exchange contract expires.
The use of forward foreign currency exchange contracts does not eliminate fluctuations in the prices of the Fund's portfolio securities. The risks of forward foreign currency exchange contracts include movement in the values of the foreign currencies relative to the U.S. dollar (or other foreign currencies) and the possibility that counterparties will not complete their contractual obligations, which may be in excess of the amount reflected, if any, in the Statement of Assets and Liabilities.
Annual Report 2012
25
Columbia International Bond Fund
Notes to Financial Statements (continued)
October 31, 2012
Futures Contracts
Futures contracts represent commitments for the future purchase or sale of an asset at a specified price on a specified date. The Fund bought and sold futures contracts to manage the duration and yield curve exposure of the Fund versus the benchmark, manage exposure to movements in interest rates. Upon entering into futures contracts, the Fund bears risks which may include interest rates, exchange rates or securities prices moving unexpectedly, in which case, the Fund may not achieve the anticipated benefits of the futures contracts and may realize a loss. Additional risks include counterparty credit risk, the possibility of an illiquid market, and that a change in the value of the contract or option may not correlate with changes in the value of the underlying asset.
Upon entering into a futures contract, the Fund pledges cash or securities with the broker in an amount sufficient to meet the initial margin requirement. Subsequent payments (variation margin) are made or received by the Fund each day. The variation margin payments are equal to the daily change in the contract value and are recorded as variation margin receivable or payable and are offset in unrealized gains or losses. The Fund recognizes a realized gain or loss when the contract is closed or expires. Futures contracts involve, to varying degrees, risk of loss in excess of the variation margin disclosed in the Statement of Assets and Liabilities.
Effects of Derivative Transactions in the Financial Statements
The following tables are intended to provide additional information about the effect of derivatives on the financial statements of the Fund, including: the fair value of derivatives by risk category and the location of those fair values in the Statement of Assets and Liabilities; the impact of derivative transactions on the Fund's operations over the period including realized gains or losses and unrealized gains or losses. The derivative schedules following the Portfolio of Investments present additional information regarding derivative instruments outstanding at the end of the period, if any.
The following table is a summary of the fair value of derivative instruments at October 31, 2012:
Asset Derivatives | |
Risk Exposure
Category | | Statement of Assets
and Liabilities Location | | Fair Value ($) | |
Interest rate
contracts | | Net assets — unrealized
appreciation on futures
contracts | | | 460* | | |
Liability Derivatives | |
Risk Exposure
Category | | Statement of Assets
and Liabilities Location | | Fair Value ($) | |
Foreign exchange
contracts | | Unrealized depreciation on
forward foreign currency
exchange contracts | | | 31,791 | | |
Interest rate
contracts | | Net assets — unrealized
depreciation on futures
contracts | | | 1,922 | * | |
*Includes cumulative appreciation (depreciation) of futures contracts as reported in the Futures Contracts Outstanding table following the Portfolio of Investments. Only the current day's variation margin is reported in receivables or payables in the Statement of Assets and Liabilities.
The effect of derivative instruments in the Statement of Operations for the period ended October 31, 2012:
Amount of Realized Gain (Loss) on
Derivatives Recognized in Income | |
Risk Exposure
Category | | Forward Foreign
Currency Exchange
Contracts ($) | | Futures
Contracts ($) | | Total ($) | |
Foreign exchange
contracts | | | 19,078 | | | | — | | | | 19,078 | | |
Interest rate
contracts | | | — | | | | (4,841 | ) | | | (4,841 | ) | |
Total | | | 19,078 | | | | (4,841 | ) | | | 14,237 | | |
Change in Unrealized Appreciation (Depreciation) on
Derivatives Recognized in Income | |
Risk Exposure
Category | | Forward Foreign
Currency Exchange
Contracts ($) | | Futures
Contracts ($) | | Total ($) | |
Foreign exchange
contracts | | | (138,590 | ) | | | — | | | | (138,590 | ) | |
Interest rate
contracts | | | — | | | | 4,408 | | | | 4,408 | | |
Total | | | (138,590 | ) | | | 4,408 | | | | (134,182 | ) | |
The following table is a summary of the volume of derivative instruments for the period ended October 31, 2012:
Derivative Instrument | | Contracts Opened | |
Forward foreign currency exchange contracts | | | 20 | | |
Futures contracts | | | 11 | | |
Annual Report 2012
26
Columbia International Bond Fund
Notes to Financial Statements (continued)
October 31, 2012
The effect of derivative instruments in the Statement of Operations for the year ended May 31, 2012:
Amount of Realized Gain (Loss) on
Derivatives Recognized in Income | |
Risk Exposure
Category | | Forward Foreign
Currency Exchange
Contracts ($) | | Futures
Contracts ($) | | Total ($) | |
Foreign exchange
contracts | | | 259,877 | | | | — | | | | 259,877 | | |
Interest rate
contracts | | | — | | | | (79,047 | ) | | | (79,047 | ) | |
Total | | | 259,877 | | | | (79,047 | ) | | | 180,830 | | |
Change in Unrealized Appreciation (Depreciation) on
Derivatives Recognized in Income | |
Risk Exposure
Category | | Forward Foreign
Currency Exchange
Contracts ($) | | Futures
Contracts ($) | | Total ($) | |
Foreign exchange
contracts | | | 109,626 | | | | — | | | | 109,626 | | |
Interest rate
contracts | | | — | | | | (5,372 | ) | | | (5,372 | ) | |
Total | | | 109,626 | | | | (5,372 | ) | | | 104,254 | | |
The following table is a summary of the volume of derivative instruments for the year ended May 31, 2012:
Derivative Instrument | | Contracts Opened | |
Forward Foreign Currency Exchange Contracts | | | 66 | | |
Futures Contracts | | | 65 | | |
Repurchase Agreements
The Fund may engage in repurchase agreement transactions with institutions that management has determined are creditworthy. The Fund, through the custodian, receives delivery of the underlying securities collateralizing a repurchase agreement. Management is responsible for determining that the collateral is at least equal, at all times, to the value of the repurchase obligation including interest. A repurchase agreement transaction involves certain risks in the event of default or insolvency of the counterparty. These risks include possible delays in or restrictions on the Fund's ability to dispose of the underlying securities and a possible decline in the value of the underlying securities during the period while the Fund seeks to assert its rights.
Treasury Inflation Protected Securities
The Fund may invest in treasury inflation protected securities (TIPS). The principal amount of TIPS is adjusted periodically and is increased for inflation or decreased for deflation based on a monthly published index. Interest payments are based on the adjusted principal at the time the interest is paid. These adjustments are recorded as interest income in the Statement of Operations.
Security Transactions
Security transactions are accounted for on the trade date. Cost is determined and gains (losses) are based upon the specific identification method for both financial statement and federal income tax purposes.
Income Recognition
Interest income is recorded on an accrual basis. Market premiums and discounts, including original issue discounts, are amortized and accreted, respectively, over the expected life of the security on all debt securities, unless otherwise noted.
Dividend income is recorded on the ex-dividend date.
Expenses
General expenses of the Trust are allocated to the Fund and other funds of the Trust based upon relative net assets or other expense allocation methodologies determined by the nature of the expense. Expenses directly attributable to the Fund are charged to the Fund. Expenses directly attributable to a specific class of shares are charged to that share class.
Determination of Class Net Asset Value
All income, expenses (other than class-specific expenses, which are charged to that share class, as shown in the Statement of Operations) and realized and unrealized gains (losses) are allocated to each class of the Fund on a daily basis, based on the relative net assets of each class, for purposes of determining the net asset value of each class.
Federal Income Tax Status
The Fund intends to qualify each year as a regulated investment company under Subchapter M of the Internal Revenue Code, as amended, and will distribute substantially all of its tax exempt or taxable income (including net short-term capital gains), if any, for its tax year, and as such will not be subject to federal income taxes. In addition, the Fund intends to distribute in each calendar year substantially all of its net investment income, capital gains and certain other amounts, if any, such that the Fund should not be subject to federal excise tax. Therefore, no federal income or excise tax provision is recorded.
Foreign Taxes
The Fund may be subject to foreign taxes on income, gains on investments or currency repatriation, a portion of which may be recoverable. The Fund will accrue such taxes and recoveries, as applicable, based upon its current interpretation of tax rules and regulations that exist in the markets in which it invests.
Annual Report 2012
27
Columbia International Bond Fund
Notes to Financial Statements (continued)
October 31, 2012
Realized gains in certain countries may be subject to foreign taxes at the Fund level, based on statutory rates. The Fund accrues for such foreign taxes on net realized and unrealized gains at the appropriate rate for each jurisdiction, as applicable. The amount, if any, is disclosed as a liability on the Statement of Assets and Liabilities.
Distributions to Shareholders
Distributions from net investment income, if any, are declared and paid monthly. Net realized capital gains, if any, are distributed at least annually. Income distributions and capital gain distributions are determined in accordance with federal income tax regulations, which may differ from GAAP.
Guarantees and Indemnifications
Under the Trust's organizational documents and, in some cases, by contract, its officers and trustees are indemnified against certain liabilities arising out of the performance of their duties to the Trust or its funds. In addition, certain of the Fund's contracts with its service providers contain general indemnification clauses. The Fund's maximum exposure under these arrangements is unknown since the amount of any future claims that may be made against the Fund cannot be determined, and the Fund has no historical basis for predicting the likelihood of any such claims.
Recent Accounting Pronouncement
Disclosures about Offsetting Assets and Liabilities
In December 2011, the Financial Accounting Standards Board (FASB) issued ASU No. 2011-11, Disclosures about Offsetting Assets and Liabilities. The objective of the FASB is to enhance current disclosure requirements on offsetting of certain assets and liabilities and to enable financial statement users to compare financial statements prepared under GAAP and International Financial Reporting Standards.
Specifically, ASU No. 2011-11 requires an entity to disclose both gross and net information for derivatives and other financial instruments that are subject to a master netting arrangement or similar agreement. The standard requires disclosure of collateral received in connection with the master netting agreements or similar agreements. The effective date of ASU No. 2011-11 is for interim and annual periods beginning on or after January 1, 2013. At this time, management is evaluating the implications of this guidance and the impact it will have on the financial statement amounts and footnote disclosures, if any.
Note 3. Fees and Compensation Paid to Affiliates
Investment Management Fees
Under an Investment Management Services Agreement, Columbia Management Investment Advisers, LLC (the Investment Manager), a wholly-owned subsidiary of Ameriprise Financial, Inc. (Ameriprise Financial), determines which securities will be purchased, held or sold. The management fee is an annual fee that is equal to a percentage of the Fund's average daily net assets that declines from 0.57% to 0.47% as the Fund's net assets increase. Prior to July 1, 2011, the management fee was equal to a percentage of the Fund's average daily net assets that declined from 0.55% to 0.44% as the Fund's net assets increased. The annualized effective management fee rates for the period ended October 31, 2012 and for the year ended May 31, 2012 was 0.57% and 0.57%, respectively, of the Fund's average daily net assets.
Administration Fees
Under an Administrative Services Agreement, the Investment Manager also serves as the Fund Administrator. The Fund pays the Fund Administrator an annual fee for administration and accounting services equal to a percentage of the Fund's average daily net assets that declines from 0.08% to 0.05% as the Fund's net assets increase. Prior to July 1, 2011, the administration fee was equal to the annual rate of 0.05% of the Fund's average daily net assets. The annualized effective administration fee rates for the period ended October 31, 2012 and for the year ended May 31, 2012, was 0.08% and 0.08%, respectively, of the Fund's average daily net assets.
Pricing and Bookkeeping Fees
Prior to June 27, 2011, the Fund had entered into a Financial Reporting Services Agreement (the Financial Reporting Services Agreement) with State Street Bank and Trust Company (State Street) and the Investment Manager pursuant to which State Street provided financial reporting services to the Fund. The Fund also entered into an Accounting Services Agreement (collectively with the Financial Reporting Services Agreement, the State Street Agreements) with State Street and the Investment Manager pursuant to which State Street provided accounting services to the Fund. Under the State Street Agreements, the Fund paid State Street an annual fee of $38,000 paid monthly plus an additional monthly fee based on an annualized percentage rate of average daily net assets of the Fund for the month. The aggregate fee did not exceed $140,000 per year (exclusive of out-of-pocket expenses and
Annual Report 2012
28
Columbia International Bond Fund
Notes to Financial Statements (continued)
October 31, 2012
charges). The Fund also reimbursed State Street for certain out-of-pocket expenses and charges. Effective June 27, 2011, these services are provided under the Administrative Services Agreement discussed above.
Compensation of Board Members
Board members are compensated for their services to the Fund as disclosed in the Statement of Operations. The Trust's eligible Trustees may participate in a Deferred Compensation Plan (the Plan) which may be terminated at any time. Obligations of the Plan will be paid solely out of the Fund's assets.
Compensation of Chief Compliance Officer
The Board has appointed a Chief Compliance Officer to the Fund in accordance with federal securities regulations. The Fund pays its pro-rata share of the expenses associated with the Chief Compliance Officer. The Fund's expenses for the Chief Compliance Officer will not exceed $15,000 per year.
Transfer Agent Fees
Under a Transfer and Dividend Disbursing Agent Agreement, Columbia Management Investment Services Corp. (the Transfer Agent), an affiliate of the Investment Manager and a wholly-owned subsidiary of Ameriprise Financial, is responsible for providing transfer agency services to the Fund. The Transfer Agent has contracted with Boston Financial Data Services (BFDS) to serve as sub-transfer agent.
The Transfer Agent receives monthly account-based service fees based on the number of open accounts and is reimbursed by the Fund for the fees and expenses the Transfer Agent pays to financial intermediaries that maintain omnibus accounts with the Fund that is a percentage of the average aggregate value of the Fund's shares maintained in each such omnibus account (other than omnibus accounts for which American Enterprise Investment Services Inc. is the broker of record or accounts where the beneficial shareholder is a customer of Ameriprise Financial Services, Inc., which are paid a per account fee). The Transfer Agent pays the fees of BFDS for services as sub-transfer agent and is not entitled to reimbursement for such fees from the Fund (with the exception of out-of-pocket fees).
The Transfer Agent also receives compensation from fees for various shareholder services and reimbursements for certain out-of -pocket expenses. Class I shares do not pay transfer agent fees.
For the period ended October 31, 2012 and for the year ended May 31, 2012, the Fund's annualized effective transfer agent
fee rates as a percentage of average daily net assets of each class were as follows:
| | | Period Ended
October 31, 2012 | | Year Ended
May 31, 2012 | |
Class A | | | 0.18 | % | | | 0.14 | % | |
Class C | | | 0.17 | | | | 0.14 | | |
Class W | | | 0.20 | | | | N/A | | |
Class Z | | | 0.17 | | | | 0.14 | | |
An annual minimum account balance fee of $20 may apply to certain accounts with a value below the Fund's initial minimum investment requirements to reduce the impact of small accounts on transfer agent fees. These minimum account balance fees are recorded as part of expense reductions in the Statement of Operations. For the period ended October 31, 2012 and for the year ended May 31, 2012, no minimum account balance fees were charged by the Fund
Distribution and Service Fees
The Fund has an agreement with Columbia Management Investment Distributors, Inc. (the Distributor), an affiliate of the Investment Manager and a wholly-owned subsidiary of Ameriprise Financial, for distribution and shareholder services. Pursuant to Rule 12b-1 under the 1940 Act, the Board has approved, and the Fund has adopted, distribution and shareholder service plans (the Plans) which set the distribution and service fees for the Fund. These fees are calculated daily and are intended to compensate the Distributor and/or eligible selling and/or servicing agents for selling shares of the Fund and providing services to investors.
The Plans require the payment of a monthly service fee to the Distributor at the maximum annual rate of 0.25% of the average daily net assets attributable to Class A, Class C and Class W shares of the Fund. The Plans also require the payment of a monthly distribution fee to the Distributor at the maximum annual rates of 0.75% and 0.25% of the average daily net assets attributable to Class C and Class W shares, respectively.
Although the Fund may pay a distribution fee up to 0.25% of the Fund's average daily net assets attributable to Class W shares and a service fee of up to 0.25% of the Fund's average daily net assets attributable to Class W shares, the aggregate fee shall not exceed 0.25% of the Fund's average daily net assets attributable to Class W shares.
Sales Charges
Sales charges, including front-end charges and CDSCs, received by the Distributor for distributing Fund shares were $3,548 for Class A shares for the period ended October 31, 2012 and $16,071 for Class A shares and $64 for Class C shares for the year ended May 31, 2012.
Annual Report 2012
29
Columbia International Bond Fund
Notes to Financial Statements (continued)
October 31, 2012
Expenses Waived/Reimbursed by the Investment Manager and its Affiliates
Effective October 1, 2012, the Investment Manager and certain of its affiliates have contractually agreed to waive fees and/or reimburse expenses (excluding certain fees and expenses described below), through February 28, 2014, unless sooner terminated at the sole discretion of the Board, so that the Fund's net operating expenses, after giving effect to fees waived/expenses reimbursed and any balance credits and/or overdraft charges from the Fund's custodian, do not exceed the following annual rates as a percentage of the class' average daily net assets:
Class A | | | 1.09 | % | |
Class C | | | 1.84 | | |
Class I | | | 0.74 | | |
Class W | | | 1.09 | | |
Class Z | | | 0.84 | | |
For the period July 1, 2011 through September 30, 2012, the Investment Manager and certain of its affiliates contractually agreed to waive fees and/or reimburse expenses (excluding certain fees and expenses described below), so that the Fund's net operating expenses, after giving effect to fees waived/expenses reimbursed and any balance credits and/or overdraft charges from the Fund's custodian, did not exceed the following annual rates as a percentage of the class' average daily net assets:
Class A | | | 1.10 | % | |
Class C | | | 1.85 | | |
Class I | | | 0.81 | | |
Class W | | | 1.10 | | |
Class Z | | | 0.85 | | |
Prior to July 1, 2011, the Investment Manager and its affiliates contractually agreed to waive fees and/or reimburse expenses (excluding certain fees and expenses described below), so that the Fund's net operating expenses, after giving effect to fees waived/expenses reimbursed and any balance credits from the Fund's custodian, did not exceed the following annual rates as a percentage of the class' average daily net assets:
Class A | | | 1.10 | % | |
Class C | | | 1.85 | | |
Class I | | | 0.84 | | |
Class Z | | | 0.85 | | |
Under the agreement, the following fees and expenses are excluded from the waiver/reimbursement commitment, and therefore will be paid by the Fund, if applicable: taxes (including foreign transaction taxes), expenses associated with
investments in affiliated and non-affiliated pooled investment vehicles (including mutual funds and exchange traded funds), transaction costs and brokerage commissions, costs related to any securities lending program, dividend expenses associated with securities sold short, inverse floater program fees and expenses, transaction charges and interest on borrowed money, interest, extraordinary expenses and any other expenses the exclusion of which is specifically approved by the Board. This agreement may be modified or amended only with approval from all parties.
Note 4. Federal Tax Information
The timing and character of income and capital gain distributions are determined in accordance with income tax regulations, which may differ from GAAP because of temporary or permanent book to tax differences.
At October 31, 2012, these differences are primarily due to differing treatment for capital loss carryforwards, Trustees' deferred compensation, foreign currency transactions, principle and/or interest of fixed income securities, recognition of unrealized appreciation (depreciation) for certain derivative investments. To the extent these differences are permanent, reclassifications are made among the components of the Fund's net assets in the Statement of Assets and Liabilities. Temporary differences do not require reclassifications. In the Statement of Assets and Liabilities the following reclassifications were made:
Undistributed net investment income | | $ | (15,289 | ) | |
Accumulated net realized loss | | | 15,289 | | |
Net investment income and net realized gains (losses), as disclosed in the Statement of Operations, and net assets were not affected by this reclassification.
The tax character of distributions paid during the periods indicated was as follows:
| | | Period Ended
October 31,
2012 | | Year Ended
May 31,
2012 | | Year Ended
May 31,
2011 | |
Ordinary income | | $ | 472,830 | | | $ | 1,600,953 | | | $ | 695,472 | | |
Long-term capital gains | | | — | | | | — | | | | 19,794 | | |
Short-term capital gain distributions, if any, are considered ordinary income distributions for tax purposes.
At October 31, 2012, the components of distributable earnings on a tax basis were as follows:
Undistributed ordinary income | | $ | 218,678 | | |
Undistributed accumulated long-term loss | | | (476,788 | ) | |
Unrealized appreciation/depreciation | | | 3,515,960 | | |
Annual Report 2012
30
Columbia International Bond Fund
Notes to Financial Statements (continued)
October 31, 2012
At October 31, 2012, the cost of investments for federal income tax purposes was $63,095,211 and the aggregate gross unrealized appreciation and depreciation based on that cost was:
Unrealized appreciation | | $ | 3,935,412 | | |
Unrealized depreciation | | | (452,705 | ) | |
Net unrealized app/depreciation | | $ | 3,482,707 | | |
The following capital loss carryforward, determined at October 31, 2012, may be available to reduce taxable income arising from future net realized gains on investments, if any, to the extent permitted by the Internal Revenue Code:
Year of Expiration | | Amount | |
| | Unlimited short-term | | | $ | 254,516 | | |
| | Unlimited long-term | | | | 222,272 | | |
Total | | $ | 476,788 | | |
Management of the Fund has concluded that there are no significant uncertain tax positions that would require recognition in the financial statements. However, management's conclusion may be subject to review and adjustment at a later date based on factors including, but not limited to, new tax laws, regulations, and administrative interpretations (including relevant court decisions). Generally, the Fund's federal tax returns for the prior three fiscal years remain subject to examination by the Internal Revenue Service.
Note 5. Portfolio Information
The cost of purchases and proceeds from sales of securities, excluding short-term obligations, aggregated to $7,223,702 and $3,365,329, respectively, for the period ended October 31, 2012.
Note 6. Custody Credits
Prior to June 27, 2011, the Fund had an agreement with its custodian bank under which custody fees may have been reduced by balance credits. These credits are recorded as part of expense reductions on the Statement of Operations. The Fund could have invested a portion of the assets utilized in connection with the expense offset arrangement in an income-producing asset if they had not entered into such an agreement. Subsequent to this date, the Fund may invest its daily balance in an affiliated money market fund as detailed below. For the period June 1, 2011 through June 26, 2011, there were no custody credits.
Note 7. Affiliated Money Market Fund
Effective June 27, 2011, the Fund may invest its daily cash balances in Columbia Short-Term Cash Fund, an affiliated money market fund established for the exclusive use by the Fund and other affiliated funds. The income earned by the Fund from such investments is included as "Dividends — affiliated issuers" in the Statement of Operations. As an
investing fund, the Fund indirectly bears its proportionate share of the expenses of Columbia Short-Term Cash Fund.
Note 8. Shareholder Concentration
At October 31, 2012, one unaffiliated shareholder account owned 13.9% of the outstanding shares of the Fund. The Fund has no knowledge about whether any portion of those shares was owned beneficially by such account. Affiliated shareholder accounts owned 71.2% of the outstanding shares of the Fund. Subscription and redemption activity by concentrated accounts may have a significant effect on the operations of the Fund.
Note 9. Line of Credit
The Fund has entered into a revolving credit facility with a syndicate of banks led by JPMorgan Chase Bank N.A. whereby the Fund may borrow for the temporary funding of shareholder redemptions or for other temporary or emergency purposes. The credit facility became effective on June 27, 2011, replacing a prior credit facility. The credit facility agreement, as amended, which is a collective agreement between the Fund and certain other funds managed by the Investment Manager, severally and not jointly, permits collective borrowings up to $500 million. Pursuant to a December 13, 2011 amendment to the credit facility agreement, interest is charged to each participating fund based on its borrowings at a rate equal to the higher of (i) the overnight federal funds rate plus 1.00% or (ii) the one-month LIBOR rate plus 1.00%. Each borrowing under the credit facility matures no later than 60 days after the date of borrowing. The Fund also pays a commitment fee equal to its pro rata share of the amount of the credit facility at a rate of 0.08% per annum. For the period June 27, 2011 through December 12, 2011, interest was charged to each participating fund based on its borrowings at a rate equal to the sum of the federal funds rate plus (i) 1.25% per annum plus (ii) if one-month LIBOR exceeds the federal funds rate, the amount of such excess. The Fund also paid a commitment fee equal to its pro rata share of the amount of the credit facility at a rate of 0.10% per annum.
Prior to June 27, 2011, the Fund and certain other funds managed by the Investment Manager participated in a $150 million committed, unsecured revolving credit facility provided by State Street. Interest was charged to each fund based on its borrowings at a rate equal to the greater of the (i) federal funds rate plus 1.25% per annum or (ii) the overnight LIBOR rate plus 1.25% per annum. The Fund also paid a commitment fee equal to its pro rata share of the amount of the credit facility at a rate of 0.125% per annum.
The Fund had no borrowings during the period ended October 31, 2012 or for the year ended May 31, 2012.
Annual Report 2012
31
Columbia International Bond Fund
Notes to Financial Statements (continued)
October 31, 2012
Note 10. Significant Risks
Non-Diversification Risk
A non-diversified fund is permitted to invest a greater percentage of its total assets in fewer issuers than a diversified fund. The Fund may, therefore, have a greater risk of loss from a few issuers than a similar fund that invests more broadly.
Foreign Securities Risk
Investing in foreign securities may include certain risks and considerations not typically associated with investing in U.S. securities, such as fluctuating currency values and changing local and regional economic, political and social conditions, which may result in greater market volatility. In addition, certain foreign securities may not be as liquid as U.S. securities. Investing in emerging markets may accentuate these risks.
Investments in emerging market countries are subject to additional risk. The risk of foreign investments is typically increased in less developed countries. These countries are also more likely to experience high levels of inflation, deflation or currency devaluation which could hurt their economies and securities markets.
Note 11. Subsequent Events
Management has evaluated the events and transactions that have occurred through the date the financial statements were issued and noted no items requiring adjustment of the financial statements or additional disclosure.
Note 12. Information Regarding Pending and Settled Legal Proceedings
In December 2005, without admitting or denying the allegations, American Express Financial Corporation (AEFC, which is now known as Ameriprise Financial, Inc. (Ameriprise Financial)) entered into settlement agreements with the Securities and Exchange Commission (SEC) and Minnesota Department of Commerce (MDOC) related to market timing activities. As a result, AEFC was censured and ordered to cease and desist from committing or causing any violations of certain provisions of the Investment Advisers Act of 1940, the Investment Company Act of 1940, and various Minnesota laws. AEFC agreed to pay disgorgement of $10 million and civil money penalties of $7 million. AEFC also agreed to retain an independent distribution consultant to assist in developing a plan for distribution of all disgorgement and civil penalties ordered by the SEC in accordance with various undertakings detailed at www.sec.gov/litigation/admin/ia-2451.pdf. Ameriprise Financial and its affiliates have cooperated with
the SEC and the MDOC in these legal proceedings, and have made regular reports to the funds' Boards of Trustees.
Ameriprise Financial and certain of its affiliates have historically been involved in a number of legal, arbitration and regulatory proceedings, including routine litigation, class actions, and governmental actions, concerning matters arising in connection with the conduct of their business activities. Ameriprise Financial believes that the Funds are not currently the subject of, and that neither Ameriprise Financial nor any of its affiliates are the subject of, any pending legal, arbitration or regulatory proceedings that are likely to have a material adverse effect on the Funds or the ability of Ameriprise Financial or its affiliates to perform under their contracts with the Funds. Ameriprise Financial is required to make 10-Q, 10-K and, as necessary, 8-K filings with the Securities and Exchange Commission on legal and regulatory matters that relate to Ameriprise Financial and its affiliates. Copies of these filings may be obtained by accessing the SEC website at www.sec.gov.
There can be no assurance that these matters, or the adverse publicity associated with them, will not result in increased fund redemptions, reduced sale of fund shares or other adverse consequences to the Funds. Further, although we believe proceedings are not likely to have a material adverse effect on the Funds or the ability of Ameriprise Financial or its affiliates to perform under their contracts with the Funds, these proceedings are subject to uncertainties and, as such, we are unable to estimate the possible loss or range of loss that may result. An adverse outcome in one or more of these proceedings could result in adverse judgments, settlements, fines, penalties or other relief that could have a material adverse effect on the consolidated financial condition or results of operations of Ameriprise Financial.
Annual Report 2012
32
Columbia International Bond Fund
Report of Independent Registered Public Accounting Firm
To the Trustees of Columbia Funds Series Trust I and
the Shareholders of Columbia International Bond Fund
In our opinion, the accompanying statement of assets and liabilities, including the portfolio of investments, and the related statements of operations and of changes in net assets and the financial highlights present fairly, in all material respects, the financial position of Columbia International Bond Fund (the "Fund") (a series of Columbia Funds Series Trust I) at October 31, 2012, the results of its operations, the changes in its net assets and the financial highlights for each of the periods indicated, in conformity with accounting principles generally accepted in the United States of America. These financial statements and financial highlights (hereafter referred to as "financial statements") are the responsibility of the Fund's management. Our responsibility is to express an opinion on these financial statements based on our audits. We conducted our audits of these financial statements in accordance with the standards of the Public Company Accounting Oversight Board (United States). Those standards require that we plan and perform the audit to obtain reasonable assurance about whether the financial statements are free of material misstatement. An audit includes examining, on a test basis, evidence supporting the amounts and disclosures in the financial statements, assessing the accounting principles used and significant estimates made by management, and evaluating the overall financial statement presentation. We believe that our audits, which included confirmation of securities at October 31, 2012 by correspondence with the custodian, transfer agent and brokers, provide a reasonable basis for our opinion.
PricewaterhouseCoopers LLP
Minneapolis, Minnesota
December 21, 2012
Annual Report 2012
33
Columbia International Bond Fund
The Trustees serve terms of indefinite duration. The names, addresses and birth years of the Trustees and Officers of the Funds in Columbia Funds Series Trust I, the year each was first elected or appointed to office, their principal business occupations during at least the last five years, the number of Funds overseen by each Trustee and other directorships they hold are shown below. Each officer listed below serves as an officer of each Fund in Columbia Funds Series Trust I.
Independent Trustees
Name, Address and Year of Birth,
Position with Funds, Year First
Elected or Appointed to Office | | Principal Occupation(s) During Past Five Years, Number of Funds in Columbia
Funds Complex Overseen by Trustee, Other Directorships Held
| |
Rodman L. Drake (Born 1943)
c/o Columbia Management Investment Advisers, LLC
225 Franklin Street
Boston, MA 02110
Trustee (since 1994) and
Chairman of the Board (since 2009) | | Independent consultant since 2010; Co-Founder of Baringo Capital LLC (private equity) from 1997 to 2008; CEO of Crystal River Capital, Inc. (real estate investment trust) from 2003 to 2010; Oversees 52; Jackson Hewitt Tax Service Inc. (tax preparation services from 2004 to 2011); Celgene Corporation (global biotechnology company); Student Loan Corporation (student loan provider from 2005 to 2010); Celgene Corporation (global biotechnology company); The Helios Funds and Brookfield Funds (closed-end funds); Crystal River Capital, Inc. from 2005 to 2010; Parsons Brinckerhoff from 1995 to 2008; and Apex Silver Mines Ltd. from 2007 to 2009 | |
Douglas A. Hacker (Born 1955)
c/o Columbia Management Investment Advisers, LLC
225 Franklin Street
Boston, MA 02110
Trustee (since 1996) | | Independent business executive since May 2006; Executive Vice President — Strategy of United Airlines from December 2002 to May 2006; President of UAL Loyalty Services (airline marketing company) from September 2001 to December 2002; Executive Vice President and Chief Financial Officer of United Airlines from July 1999 to September 2001. Oversees 52; Nash Finch Company (food distributor); Aircastle Limited (aircraft leasing); and SeaCube Container Leasing Ltd. (container leasing) | |
Janet Langford Kelly (Born 1957)
c/o Columbia Management Investment Advisers, LLC
225 Franklin Street
Boston, MA 02110
Trustee (since 1996) | | Senior Vice President, General Counsel and Corporate Secretary, ConocoPhillips (integrated energy company) since September 2007; Deputy General Counsel — Corporate Legal Services, ConocoPhillips from August 2006 to August 2007; Partner, Zelle, Hofmann, Voelbel, Mason & Gette LLP (law firm) from March 2005 to July 2006; Adjunct Professor of Law, Northwestern University from September 2004 to June 2006; Director, UAL Corporation (airline) from February 2006 to July 2006; Chief Administrative Officer and Senior Vice President, Kmart Holding Corporation (consumer goods) from September 2003 to March 2004. Oversees 52; None | |
Nancy T. Lukitsh (Born 1956)
c/o Columbia Management Investment Advisers, LLC
225 Franklin Street
Boston, MA 02110
Trustee (since 2011) | | Senior Vice President, Partner and Director of Marketing, Wellington Management Company, LLP (investment adviser) from 1997 to 2010; Chair, Wellington Management Investment Portfolios (commingled non-U.S. investment pools) from 2007 to 2010; Director, Wellington Trust Company, NA and other Wellington affiliates from 1997 to 2010. Oversees 52; None | |
William E. Mayer (Born 1940)
c/o Columbia Management Investment Advisers, LLC
225 Franklin Street
Boston, MA 02110
Trustee (since 1994) | | Partner, Park Avenue Equity Partners (private equity) since February 1999; Dean and Professor, College of Business and Management, University of Maryland from 1992 to 1996. Oversees 52; DynaVox Inc. (speech creation); Lee Enterprises (print media); WR Hambrecht + Co. (financial service provider) from 2000 to 2012; BlackRock Kelso Capital Corporation (investment company) | |
David M. Moffett (Born 1952)
c/o Columbia Management Investment Advisers, LLC
225 Franklin Street
Boston, MA 02110
Trustee (since 2011) | | Retired. Chief Executive Officer, Federal Home Loan Mortgage Corporation, from 2008 to 2009; Senior Adviser, Global Financial Services Group, Carlyle Group, Inc., from 2007 to 2008; Vice Chairman and Chief Financial Officer, U.S. Bancorp, from 1993 to 2007. Oversees 52; CIT Group Inc. (commercial and consumer finance); eBay Inc. (online trading community); MBIA Inc. (financial service provider); E.W. Scripps Co. (print and television media), Building Materials Holding Corp. (building materials and construction services); and University of Oklahoma Foundation. | |
Charles R. Nelson (Born 1942)
c/o Columbia Management Investment Advisers, LLC
225 Franklin Street
Boston, MA 02110
Trustee (since 1981) | | Retired Professor Emeritus, University of Washington, since 2011; Professor of Economics, University of Washington from January 1976 to 2011; Ford and Louisa Van Voorhis Professor of Political Economy, University of Washington from 1993 to 2011; Adjunct Professor of Statistics, University of Washington from 1980 to 2011; Associate Editor, Journal of Money Credit and Banking from 1993 to 2008; consultant on econometric and statistical matters. Oversees 52; None | |
John J. Neuhauser (Born 1943)
c/o Columbia Management Investment Advisers, LLC
225 Franklin Street
Boston, MA 02110
Trustee (since 1984) | | President, Saint Michael's College, since August 2007; Director or Trustee of several non-profit organizations, including Fletcher Allen Health Care, Inc.; University Professor, Boston College from November 2005 to August 2007; Academic Vice President and Dean of Faculties, Boston College from August 1999 to October 2005. Oversees 52; Liberty All-Star Equity Fund and Liberty All-Star Growth Fund (closed-end funds) | |
Annual Report 2012
34
Columbia International Bond Fund
Trustees and Officers (continued)
Independent Trustees (continued)
Name, Address and Year of Birth,
Position with Funds, Year First
Elected or Appointed to Office | | Principal Occupation(s) During Past Five Years, Number of Funds in Columbia
Funds Complex Overseen by Trustee, Other Directorships Held
| |
Patrick J. Simpson (Born 1944)
c/o Columbia Management Investment Advisers, LLC
225 Franklin Street
Boston, MA 02110
Trustee (since 2000) | | Partner, Perkins Coie LLP (law firm). Oversees 52; None | |
Anne-Lee Verville (Born 1945)
c/o Columbia Management Investment Advisers, LLC
225 Franklin Street
Boston, MA 02110
Trustee (since 1998) | | Retired. General Manager — Global Education Industry from 1994 to 1997, President — Application Systems Division from 1991 to 1994, Chief Financial Officer — US Marketing & Services from 1988 to 1991, and Chief Information Officer from 1987 to 1988, IBM Corporation (computer and technology). Oversees 52; Enesco Group, Inc. (producer of giftware and home and garden decor products) from 2001 to 2006 | |
Interested Trustee
Name, Address and Year of Birth,
Position with Funds, Year First
Elected or Appointed to Office | | Principal Occupation(s) During Past Five Years, Number of Funds in Columbia
Funds Complex Overseen by Trustee, Other Directorships Held
| |
William F. Truscott (born 1960)
53600 Ameriprise Financial Center
Minneapolis, MN 55474
Senior Vice President (since 2012) | | Chairman of the Board and President, Columbia Management Investment Advisers, LLC since May 2010 and February 2012, respectively (previously President, Chairman of the Board and Chief Investment Officer, from 2001 to April 2010); Chief Executive Officer, U.S. Asset Management & President, Annuities, Ameriprise Financial, Inc. since May 2010 (previously President — U.S. Asset Management and Chief Investment Officer from 2005 to April 2010, and Senior Vice President — Chief Investment Officer, from 2001 to 2005); Director, President and Chief Executive Officer, Ameriprise Certificate Company since 2006; Director and Chief Executive Officer, Columbia Management Investment Distributors, Inc. since May 2010 and February 2012, respectively (previously Chairman of the Board and Chief Executive Officer from 2008 to April 2010); Chairman of the Board and Chief Executive Officer, RiverSource Distributors, Inc. since 2006. Oversees 208; Columbia Funds Board. | |
The Statement of Additional Information includes additional information about the Trustees of the Funds and is available, without charge, upon request by calling 1-800-345-6611.
Officers
Name, Year of Birth and Address | | Principal Occupation(s) During the Past Five Years | |
J. Kevin Connaughton (Born 1964)
225 Franklin Street
Boston, MA 02110
President (since 2009) | | Senior Vice President and General Manager — Mutual Fund Products, Columbia Management Investment Advisers, LLC since May 2010; President, Columbia Funds, since 2009, and RiverSource Funds, since May 2010 (previously Senior Vice President and Chief Financial Officer, Columbia Funds, from June 2008 to January 2009, Treasurer, Columbia Funds, from October 2003 to May 2008, and senior officer of various other affiliated funds since 2000); Managing Director, Columbia Management Advisors, LLC from December 2004 to April 2010. | |
Michael G. Clarke (Born 1969)
225 Franklin Street
Boston, MA 02110
Treasurer (since 2011) and Chief Financial Officer (since 2009) | | Vice President, Columbia Management Investment Advisers, LLC since May 2010; Managing Director of Fund Administration, Columbia Management Advisors, LLC, from September 2004 to April 2010; senior officer of Columbia Funds and affiliated funds since 2002. | |
Scott R. Plummer (Born 1959)
5228 Ameriprise Financial Center
Minneapolis, MN 55474
Senior Vice President, Assistant Secretary and Chief Legal Officer (since 2010) | | Senior Vice President, Chief Legal Officer and Assistant Secretary, Columbia Management Investment Advisers, LLC since June 2005; Vice President and Lead Chief Counsel — Asset Management, Ameriprise Financial, Inc. since May 2010 (previously Vice President and Chief Counsel — Asset Management, from 2005 to April 2010); Vice President, Chief Counsel and Assistant Secretary, Columbia Management Investment Distributors, Inc. since 2008; Vice President, General Counsel and Secretary, Ameriprise Certificate Company since 2005; Chief Counsel, RiverSource Distributors, Inc. since 2006; Vice President, General Counsel and Secretary, RiverSource Funds since December 2006; Senior Vice President, Secretary and Chief Legal Officer, Columbia Funds, since May 2010. | |
Annual Report 2012
35
Columbia International Bond Fund
Trustees and Officers (continued)
Officers (continued)
Name, Year of Birth and Address | | Principal Occupation(s) During the Past Five Years | |
William F. Truscott (Born 1960)
53600 Ameriprise Financial Center
Minneapolis, MN 55474
Senior Vice President (since 2010) | | Chairman of the Board and President, Columbia Management Investment Advisers, LLC since May 2010 and February 2012, respectively (previously President, Chairman of the Board and Chief Investment Officer, from 2001 to April 2010); Chief Executive Officer, U.S. Asset Management & President, Annuities, Ameriprise Financial, Inc. since May 2010 (previously President — U.S. Asset Management and Chief Investment Officer from 2005 to April 2010); Director, President and Chief Executive Officer, Ameriprise Certificate Company since 2006; Director and Chief Executive Officer, Columbia Management Investment Distributors, Inc. since May 2010 and February 2012, respectively (previously Chairman of the Board and Chief Executive Officer from 2008 to April 2010); Chairman of the Board and Chief Executive Officer, RiverSource Distributors, Inc. since 2006. | |
Thomas P. McGuire (Born 1972)
225 Franklin Street
Boston, MA 02110
Chief Compliance Officer (since 2012) | | Vice President — Asset Management Compliance, Columbia Management Investment Advisers, LLC since 2010; Chief Compliance Officer, Ameriprise Certificate Company, since September 2010; Compliance Executive, Bank of America, 2005-2010. | |
Colin Moore (Born 1958)
225 Franklin Street
Boston, MA 02110
Senior Vice President (since 2010) | | Director and Chief Investment Officer, Columbia Management Investment Advisers, LLC since May 2010; Manager, Managing Director and Chief Investment Officer of Columbia Management Advisors, LLC from 2007 to April 2010; Head of Equities, Columbia Management Advisors, LLC from 2002 to 2007. | |
Amy Johnson (Born 1965)
5228 Ameriprise Financial Center
Minneapolis, MN 55474
Vice President (since 2010) | | Senior Vice President and Chief Operating Officer, Columbia Management Investment Advisers, LLC since May 2010 (previously Chief Administrative Officer, from 2009 until April 2010, Vice President — Asset Management and Trust Company Services, from 2006 to 2009, and Vice President — Operations and Compliance from 2004 to 2006). | |
Joseph F. DiMaria (Born 1968)
225 Franklin Street
Boston, MA 02110
Vice President (since 2011) and Chief Accounting Officer (since 2008) | | Vice President, Mutual Fund Administration, Columbia Management Investment Advisers, LLC, since May 2010; Director of Fund Administration, Columbia Management Advisors, LLC from January 2006 to April 2010; Head of Tax/Compliance and Assistant Treasurer, Columbia Management Advisors, LLC, from November 2004 to December 2005. | |
Stephen T. Welsh (born 1957)
225 Franklin Street
Boston, MA 02110
Vice President (since 2006) | | President and Director, Columbia Management Investment Services Corp. since May 2010; President and Director, Columbia Management Services, Inc. from July 2004 to April 2010; Managing Director, Columbia Management Distributors, Inc. from August 2007 to April 2010. | |
Paul D. Pearson (born 1956)
10468 Ameriprise Financial Center
Minneapolis, MN 55474
Vice President and Assistant Treasurer (since 2011) | | Vice President, Investment Accounting, Columbia Management Investment Advisers, LLC, since May 2010; Vice President, Managed Assets, Investment Accounting, Ameriprise Financial Corporation. | |
Paul B. Goucher (born 1968)
5228 Ameriprise Financial Center
Minneapolis, MN 55474
Vice President and Assistant Secretary (since 2010) | | Vice President and Chief Counsel of Ameriprise Financial since January 2010 (formerly Vice President and Group Counsel from November 2008 to January 2010); Director, Managing Director and General Counsel of J. & W. Seligman & Co. Incorporated (Seligman) from July 2008 to November 2008 and Managing Director and Associate General Counsel of Seligman from January 2005 to July 2008. | |
Christopher O. Petersen (born 1970)
5228 Ameriprise Financial Center
Minneapolis, MN 55474
Vice President (since 2010) and Secretary (since 2011) | | Vice President and Chief Counsel, Ameriprise Financial since January 2010 (formerly Vice President and Group Counsel or Counsel from April 2004 to January 2010); Assistant Secretary of RiverSource Funds since January 2007; officer of Columbia Funds and affiliated funds since 2007. | |
Michael E. DeFao (born 1968)
225 Franklin Street
Boston, MA 02110
Vice President and Assistant Secretary (since 2011) | | Vice President and Chief Counsel, Ameriprise Financial since May 2010; Associate General Counsel, Bank of America from June 2005 to April 2010. | |
Annual Report 2012
36
Columbia International Bond Fund
Board Consideration and Approval of
Advisory Agreement
On June 6, 2012, the Board of Trustees (the "Board") and the Trustees who are not interested persons (as defined in the Investment Company Act of 1940) of the Trust (the "Independent Trustees") unanimously approved the continuation of the Investment Management Services Agreement (the "Advisory Agreement") with Columbia Management Investment Advisers, LLC (the "Investment Manager") with respect to Columbia International Bond Fund (the "Fund"), a series of the Trust. As detailed below, the Advisory Fees and Expenses Committee (the "Committee") and the Board met on multiple occasions to review and discuss, both among themselves and with the management team of the Investment Manager, materials provided by the Investment Manager before determining to approve the continuation of the Advisory Agreement.
In connection with their deliberations regarding the continuation of the Advisory Agreement, the Committee and the Board requested and evaluated materials from the Investment Manager regarding the Fund and the Advisory Agreement, and discussed these materials with representatives of the Investment Manager at the Committee meeting held on June 5, 2012 and at the Board meeting held on June 6, 2012. In addition, the Board considers matters bearing on the Advisory Agreement at most of its other meetings throughout the year and meets regularly with senior management of the Funds and the Investment Manager. Through the Board's Investment Oversight Committees, Trustees also meet with selected Fund portfolio managers and other investment personnel at various times throughout the year. The Committee and the Board also consulted with Fund counsel and with the Independent Trustees' independent legal counsel, who advised on the legal standard for consideration by the Board and otherwise assisted the Board in its deliberations. On June 5, 2012, the Committee recommended that the Board approve the continuation of the Advisory Agreement. On June 6, 2012, the Board, including the Independent Trustees, voting separately, unanimously approved the continuation of the Advisory Agreement for the Fund.
The Committee and the Board considered all information that they, their legal counsel, or the Investment Manager believed reasonably necessary to evaluate and to determine whether to approve the continuation of the Advisory Agreement. In their deliberations, the Trustees did not identify any particular information that was all-important or controlling, and individual Trustees may have attributed different weights to the various factors. The information and factors considered by the Committee and the Board in recommending for approval or approving the continuation of the Advisory Agreement for the Fund included the following:
• Information on the investment performance of the Fund relative to the performance of the Fund's benchmarks and the performance of a group of comparable mutual funds, as determined by an independent third-party data provider;
• Information on the Fund's advisory fees and total expenses, including information comparing the Fund's expenses to those of a group of comparable mutual funds, as determined by an independent third-party data provider;
• The Investment Manager's agreement to contractually limit or cap total operating expenses for the Fund so that total operating expenses (excluding certain fees and expenses, such as transaction costs and certain other investment related expenses, interest, taxes, acquired fund fees and expenses, and extraordinary expenses) would not exceed the median expenses of a group of comparable funds (as determined from time to time, generally annually, by an independent third-party data provider);
• The terms and conditions of the Advisory Agreement, including that the advisory fee rates payable by the Fund would not change;
• The terms and conditions of other agreements and arrangements with affiliates of the Investment Manager relating to the operations of the Fund, including the Administrative Services Agreement, the Distribution Agreement and the Transfer and Dividend Disbursing Agent Agreement, noting in the case of the Transfer and Dividend Disbursing Agent Agreement certain proposed changes to the fee rates payable thereunder;
• Descriptions of various functions performed by the Investment Manager under the Advisory Agreement, including portfolio management and portfolio trading practices;
• Information regarding the management fees and investment performance of any comparable portfolios of other clients of the Investment Manager, including institutional separate accounts; and
• The profitability to the Investment Manager and its affiliates from their relationships with the Fund.
Annual Report 2012
37
Columbia International Bond Fund
Board Consideration and Approval of
Advisory Agreement (continued)
Nature, Extent and Quality of Services to be Provided under the Advisory Agreement
The Committee and the Board considered the nature, extent and quality of services provided to the Fund by the Investment Manager and its affiliates under the Advisory Agreement and under separate agreements for the provision of transfer agency and administrative services, and the resources dedicated to the Fund and the other Columbia Funds by the Investment Manager and its affiliates. The Committee and the Board considered, among other things, the Investment Manager's ability to attract, motivate and retain highly qualified research, advisory and supervisory investment professionals (including personnel and other resources, compensation programs for personnel involved in fund management, reputation and other attributes), the portfolio management services provided by those investment professionals, the quality of the Investment Manager's investment research capabilities and trade execution services, and the other resources that the Investment Manager devotes to the Fund. The Committee and the Board also considered the potential benefits to shareholders of investing in a mutual fund that is part of a fund complex offering exposure to a variety of asset classes and investment disciplines and providing a variety of fund and shareholder services.
The Committee and the Board also considered the professional experience and qualifications of the senior personnel of the Investment Manager. The Committee and the Board noted the compliance programs of and the compliance-related resources provided to the Fund by the Investment Manager and its affiliates, and considered the Investment Manager's ability to provide administrative services to the Fund pursuant to a separate administrative services agreement, including the Investment Manager's ability to coordinate the activities of the Fund's other service providers. After reviewing these and related factors, the Committee and the Board concluded, within the context of their overall conclusions, that the expected nature, extent and quality of the services to be provided to the Fund under the Advisory Agreement supported the continuation of such agreement.
Investment Performance
The Committee and the Board reviewed information about the performance of the Fund over various time periods, including performance information relative to benchmarks and information based on reports of an independent third-party data provider that compared the performance of the Fund to the performance of a group of comparable mutual funds. The Committee and the Board also reviewed a description of the third party's methodology for identifying the Fund's peer groups for purposes of performance and expense comparisons. In the case of each Fund whose performance lagged that of a relevant peer group for certain (although not necessarily all) periods, the Committee and the Board concluded that other factors relevant to performance were sufficient, in light of other considerations, to warrant continuation of the Fund's Advisory Agreement. Those factors varied from fund to fund, but included one or more of the following: (i) that the Fund's performance, although lagging in certain recent periods, was stronger over the longer term; (ii) that the underperformance was attributable, to a significant extent, to investment decisions that were reasonable and consistent with the Fund's investment strategy and policies and that the Fund was performing within a reasonable range of expectations, given those investment decisions, market conditions and the Fund's investment strategy; (iii) that the Fund's performance was competitive when compared to other relevant performance benchmarks or peer groups; and (iv) that the Investment Manager had taken or was taking steps designed to help improve the Fund's investment performance, including, but not limited to, replacing portfolio managers, enhancing the resources supporting the portfolio managers, or modifying investment strategies.
The Committee and the Board noted that, through December 31, 2011, the Fund's performance was in the fiftieth and seventy-fifth percentiles (where the best performance would be in the first percentile) of its category selected by an independent third-party data provider for the purposes of performance comparisons for the one- and three- year periods, respectively.
The Committee and the Board also considered the Investment Manager's performance and reputation generally, the Investment Manager's historical responsiveness to Board concerns about performance and the Investment Manager's willingness to take steps intended to improve performance. After reviewing these and related factors, the Committee and the Board concluded, within the context of their overall conclusions regarding the Advisory Agreement, that the performance of the Fund and the Investment Manager was sufficient, in light of other considerations, to warrant the continuation of the Advisory Agreement.
Annual Report 2012
38
Columbia International Bond Fund
Board Consideration and Approval of
Advisory Agreement (continued)
Investment Advisory Fee Rates and Other Expenses
The Committee and the Board considered the advisory fees to be charged to the Fund under the Advisory Agreement as well as the total expenses to be incurred by the Fund. In assessing the reasonableness of the fees under the Advisory Agreement, the Committee and the Board considered, among other information, the Fund's advisory fee and its expected total expense ratio as a percentage of average daily net assets. The Committee and the Board noted that the Fund's actual management fee and total net expense ratio are ranked in the first and fourth quintiles, respectively, against the Fund's expense universe as determined by an independent third-party data provider for purposes of expense comparison. The Committee and the Board also took into account the fee waiver and expense limitation arrangements agreed to by the Investment Manager, as noted above.
The Committee and the Board also considered the fact that the advisory fee rates payable by the Fund to the Investment Manager under the Advisory Agreement were the same as those currently paid by the Fund to the Investment Manager.
The Committee and the Board also received and considered information about the advisory fees charged by the Investment Manager to institutional separate accounts. In considering the fees charged to those accounts, the Committee and the Board took into account, among other things, the Investment Manager's representations about the differences between managing mutual funds as compared to other types of accounts, including differences in the services provided, differences in the risk profile of such business for the Investment Manager and the additional resources required to manage mutual funds effectively. In evaluating the Fund's advisory fees, the Committee and the Board also took into account the demands, complexity and quality of the investment management of the Fund.
After reviewing these and related factors, the Committee and the Board concluded, within the context of their overall conclusions, that the advisory fee rates and expenses of the Fund supported the continuation of the Advisory Agreement.
Costs of Services to be Provided and Profitability
The Committee and the Board also took note of the costs of the services provided (both on an absolute and relative basis) and the profitability to the Investment Manager and its affiliates in connection with their relationships with the Fund. In evaluating these considerations, the Committee and the Board took note of the advisory fees charged by the Investment Manager to other clients, including fees charged by the Investment Manager to any institutional separate account clients with similar investment strategies to those of the Fund.
The Committee and the Board also considered the compensation directly or indirectly received by the Investment Manager's affiliates in connection with their relationships with the Fund. The Committee and the Board reviewed information provided by management as to the profitability of the Investment Manager and its affiliates of their relationships with the Fund, and information about the allocation of expenses used to calculate profitability. When reviewing profitability, the Committee and the Board also considered court cases in which adviser profitability was an issue in whole or in part, the performance of the fund, the expense ratio of the fund, and the implementation of expense limitations with respect to the fund. The Committee and the Board also considered information provided by the Investment Manager regarding its financial condition and comparing its profitability to that of other asset management firms that are, or are subsidiaries of, publicly traded companies.
After reviewing these and related factors, the Committee and the Board concluded, within the context of their overall conclusions, that the profitability to the Investment Manager and its affiliates from their relationships with the Fund supported the continuation of the Advisory Agreement.
Economies of Scale
The Committee and the Board considered the potential existence of economies of scale in the provision by the Investment Manager of services to the Fund, to groups of related funds, and to the Investment Manager's investment advisory clients as a whole, and whether those economies of scale were shared with the Fund through breakpoints in investment advisory fees or other means, such as expense limitation arrangements and additional investments by the Investment Manager in investment, trading and compliance resources. The Committee and the Board noted that the investment advisory fee schedules for the Fund contained breakpoints that would reduce the fee rate on assets above specified threshold levels.
Annual Report 2012
39
Columbia International Bond Fund
Board Consideration and Approval of
Advisory Agreement (continued)
In considering these issues, the Committee and the Board also considered the costs of the services provided (both on an absolute and relative basis) and the profitability to the Investment Manager and its affiliates from their relationships with the Fund, as discussed above. After reviewing these and related factors, the Committee and the Board concluded, within the context of their overall conclusions, that the extent to which economies of scale were expected to be shared with the Fund supported the continuation of the Advisory Agreement.
Other Benefits to the Investment Manager
The Committee and the Board received and considered information regarding "fall-out" or ancillary benefits received by the Investment Manager and its affiliates as a result of their relationships with the Fund, such as the engagement of the Investment Manager to provide administrative services to the Fund and the engagement of the Investment Manager's affiliates to provide distribution and transfer agency services to the Fund. The Committee and the Board considered that the Fund's distributor retains a portion of the distribution fees from the Fund and receives a portion of the sales charges on sales or redemptions of certain classes of shares of the Fund. The Committee and the Board also considered the benefits of research made available to the Investment Manager by reason of brokerage commissions generated by the Fund's securities transactions, and reviewed information about the Investment Manager's practices with respect to allocating portfolio brokerage for brokerage and research services. The Committee and the Board considered the possible conflicts of interest associated with certain fall-out or other ancillary benefits and the reporting, disclosure and other processes that would be in place to address such possible conflicts of interest. The Committee and the Board recognized that the Investment Manager's profitability would be somewhat lower without these benefits.
Conclusion
The Committee and the Board reviewed all of the above considerations in reaching their decisions to recommend or approve the continuation of the Advisory Agreement. No single item was identified as paramount or controlling, and individual Trustees may have attributed different weights to various factors. Based on their evaluation of all factors that they deemed to be material, including those factors described above, and assisted by the advice of independent legal counsel, the Board, including the Independent Trustees, voting separately, unanimously approved the continuation of the Advisory Agreement.
Annual Report 2012
40
Columbia International Bond Fund
Important Information About This Report
Each fund mails one shareholder report to each shareholder address. If you would like more than one report, please call shareholder services at 800.345.6611 and additional reports will be sent to you.
The policy of the Board is to vote the proxies of the companies in which each fund holds investments consistent with the procedures as stated in the Statement of Additional Information (SAI). You may obtain a copy of the SAI without charge by calling 800.345.6611; contacting your financial intermediary; visiting columbiamanagement.com; or searching the website of the Securities and Exchange Commission (SEC) at sec.gov. Information regarding how each fund voted proxies relating to portfolio securities is filed with the SEC by August 31 for the most recent 12-month period ending June 30 of that year, and is available without charge by visiting columbiamanagement.com; or searching the website of the SEC at sec.gov.
Each fund files a complete schedule of portfolio holdings with the SEC for the first and third quarters of each fiscal year on Form N-Q. Each fund's Form N-Q is available on the SEC's website at sec.gov and may be reviewed and copied at the SEC's Public Reference Room in Washington, D.C. Information on the operation of the Public Reference Room may be obtained by calling 800.SEC.0330. Each fund's complete schedule of portfolio holdings, as filed on Form N-Q, can also be obtained without charge, upon request, by calling 800.345.6611.
Annual Report 2012
41

Columbia International Bond Fund
P.O. Box 8081
Boston, MA 02266-8081
columbiamanagement.com
This information is for use with concurrent or prior delivery of a fund prospectus. Please read and consider the investment objectives, risks, charges and expenses for any fund carefully before investing. For a prospectus which contains this and other important information about the Fund go to columbiamanagement.com. The Fund is distributed by Columbia Management Investment Distributors, Inc., member FINRA, and managed by Columbia Management Investment Advisers, LLC.
© 2012 Columbia Management Investment Advisers, LLC. All rights reserved.
C-1046 E (12/12)
Item 2. Code of Ethics.
(a) The registrant has adopted a code of ethics that applies to the registrant’s principal executive officer, principal financial officer, principal accounting officer or controller, or persons performing similar functions, regardless of whether these individuals are employed by the registrant or a third party.
(b) During the period covered by this report, there were not any amendments to a provision of the code of ethics adopted in 2(a) above.
(c) During the period covered by this report, there were no waivers, including any implicit waivers, from a provision of the code of ethics described in 2(a) above that relates to one or more of the items set forth in paragraph (b) of this item’s instructions.
Item 3. Audit Committee Financial Expert.
The registrant’s Board of Trustees has determined that Douglas A. Hacker, David M. Moffett and Anne-Lee Verville, each of whom are members of the registrant’s Board of Trustees and Audit Committee, each qualify as an audit committee financial expert. Mr. Hacker, Mr. Moffett and Ms. Verville are each independent trustees, as defined in paragraph (a)(2) of this item’s instructions.
Item 4. Principal Accountant Fees and Services.
Fee information below is disclosed for the ten series of the registrant whose report to stockholders is included in this annual filing. Two series changed their fiscal year end during the period effective October 31, 2012, from May 31. The fees presented for 2012 represent the fiscal year ended October 31, 2012 for eight series and the five month period ended October 31, 2012 for two series. The fees presented for 2011 include information for the fiscal year ended October 31, 2011 for eight series and May 31, 2012 for two series.
(a) Audit Fees. Aggregate Audit Fees billed by the principal accountant for professional services rendered during the period ended October 31, 2012 and the indicated 2012 and 2011 fiscal years are approximately as follows:
2012 | | October 31, 2011
(for eight series) | | May 31, 2012
(for two series) | |
$ | 211,000 | | $ | 245,300 | | $ | 93,300 | |
| | | | | | | | |
Audit Fees include amounts related to the audit of the registrant’s annual financial statements or services that are normally provided by the accountant in connection with statutory and regulatory filings or engagements for those fiscal years. The 2011 and 2012 fiscal years also include audit fees for the review and provision of consent in connection with filing Form N-1A for new share classes.
(b) Audit-Related Fees. Aggregate Audit-Related Fees billed to the registrant by the principal accountant for professional services rendered during the period ended October 31, 2012 and the indicated 2012 and 2011 fiscal years are approximately as follows:
2012 | | October 31, 2011
(for eight series) | | May 31, 2012
(for two series) | |
$ | 3,200 | | $ | 100,000 | | $ | 8,800 | |
| | | | | | | | |
Audit-Related Fees include amounts for assurance and related services by the principal accountant that are reasonably related to the performance of the audit of the registrant’s financial statements and are not reported in Audit Fees above. In both fiscal period 2012 and the 2011 fiscal year, Audit-Related Fees consist of agreed-upon procedures performed for semi-annual shareholder reports. The 2011 fiscal year also includes Audit-Related Fees for agreed-upon procedures related to fund mergers and fund accounting and custody conversions.
During the period ended October 31, 2012 and the indicated 2012 and 2011 fiscal years, there were no Audit-Related Fees billed by the registrant’s principal accountant to the registrant’s investment adviser (not including any sub-adviser whose role is primarily portfolio management and is subcontracted with or overseen by another investment adviser) and any entity controlling, controlled by, or under common control with the adviser that provides ongoing services to the registrant for an engagement that related directly to the operations and financial reporting of the registrant.
(c) Tax Fees. Aggregate Tax Fees billed by the principal accountant to the registrant for professional services rendered during the period ended October 31, 2012 and the indicated 2012 and 2011 fiscal years are approximately as follows:
2012 | | October 31, 2011
(for eight series) | | May 31, 2012
(for two series) | |
$ | 31,700 | | $ | 83,300 | | $ | 10,000 | |
| | | | | | | | |
Tax Fees include amounts for the review of annual tax returns, the review of required shareholder distribution calculations and typically include amounts for professional services by the principal accountant for tax compliance, tax advice and tax planning. The
2011 fiscal year also includes Tax Fees for agreed-upon procedures related to fund mergers and the review of final tax returns and amortization and accretion testing.
During the period ended October 31, 2012 and the indicated 2012 and 2011 fiscal years, there were no Tax Fees billed by the registrant’s principal accountant to the registrant’s investment adviser (not including any sub-adviser whose role is primarily portfolio management and is subcontracted with or overseen by another investment adviser) and any entity controlling, controlled by, or under common control with the adviser that provides ongoing services to the registrant for an engagement that related directly to the operations and financial reporting of the registrant.
(d) All Other Fees. Aggregate All Other Fees billed by the principal accountant to the registrant for professional services rendered during the period ended October 31, 2012 and the indicated 2012 and 2011 fiscal years are approximately as follows:
2012 | | October 31, 2011
(for eight series) | | May 31, 2012
(for two series) | |
$ | 0 | | $ | 0 | | $ | 0 | |
| | | | | | | | |
All Other Fees include amounts for products and services provided by the principal accountant, other than the services reported in paragraphs (a) through (c) above.
Aggregate All Other Fees billed by the registrant’s principal accountant to the registrant’s investment adviser (not including any sub-adviser whose role is primarily portfolio management and is subcontracted with or overseen by another investment adviser) and any entity controlling, controlled by, or under common control with the adviser that provides ongoing services to the registrant for an engagement that related directly to the operations and financial reporting of the registrant during the period ended October 31, 2012 and the indicated 2012 and 2011fiscal years are approximately as follows:
2012 | | October 31, 2011
(for eight series) | | May 31, 2012
(for two series) | |
$ | 460,800 | | $ | 215,300 | | $ | 395,800 | |
| | | | | | | | |
In both fiscal period 2012 and the 2011 fiscal years, All Other Fees consist of fees billed for internal control examinations of the registrant’s transfer agent and investment advisor.
(e)(1) Audit Committee Pre-Approval Policies and Procedures
The registrant’s Audit Committee is required to pre-approve the engagement of the registrant’s independent accountants to provide audit and non-audit services to the registrant and non-audit services to its investment adviser (not including any sub-adviser whose role is primarily portfolio management and is subcontracted with or overseen by another investment adviser) or any entity controlling, controlled by or under common control with such investment adviser that provides ongoing services to the registrant
(“Adviser Affiliates”), if the engagement relates directly to the operations and financial reporting of the registrant.
The Audit Committee has adopted a Policy for Engagement of Independent Accountants for Audit and Non-Audit Services (“Policy”). The Policy sets forth the understanding of the Audit Committee regarding the engagement of the registrant’s independent accountants to provide (i) audit and permissible audit-related, tax and other services to the registrant (collectively “Fund Services”); (ii) non-audit services to the registrant’s investment adviser (not including any sub-adviser whose role is primarily portfolio management and is subcontracted with or overseen by another investment adviser) and Adviser Affiliates, if the engagement relates directly to the operations or financial reporting of a Fund (collectively “Fund-related Adviser Services”); and (iii) certain other audit and non-audit services to the registrant’s investment adviser (not including any sub-adviser whose role is primarily portfolio management and is subcontracted with or overseen by another investment adviser) and Adviser Affiliates. As set forth in this Fund Policy, a service will require specific pre-approval by the Audit Committee if it is to be provided by the Fund’s independent auditor; provided, however, that pre-approval of non-audit services to the Fund, the Adviser or Control Affiliates may be waived if certain de minimis requirements set forth in the SEC’s rules are met.
Under the Policy, the Audit Committee may delegate pre-approval authority to any pre-designated member or members who are Independent Trustees/Directors. The member(s) to whom such authority is delegated must report, for informational purposes only, any pre-approval decisions to the Audit Committee at its next regular meeting. The Audit Committee’s responsibilities with respect to the pre-approval of services performed by the independent accountants may not be delegated to management.
On an annual basis, at a regularly scheduled Audit Committee meeting, the Fund’s Treasurer or other Fund Officer shall submit to the Audit Committee a schedule of the types of Fund Services and Fund-related Adviser Services that are subject to specific pre-approval.
This schedule will provide a description of each type of service that is subject to specific pre-approval, along with total projected fees for each service. The pre-approval will generally cover a one-year period. The Audit Committee will review and approve the types of services and the projected fees for the next one-year period and may add to, or subtract from, the list of pre-approved services from time to time, based on subsequent determinations. This specific approval acknowledges that the Audit Committee is in agreement with the types of services that the independent accountants will be permitted to perform.
The Fund’s Treasurer or other Fund Officer shall report to the Audit Committee at each of its regular meetings regarding all Fund Services or Fund-related Adviser Services initiated since the last such report was rendered, including a general description of the services with forecasted fees for the annual period, proposed changes requiring specific pre-approval and a description of services provided by the independent auditor with actual fees during the current reporting period.
*****
(e)(2) The percentage of services described in paragraphs (b) through (d) of this Item approved pursuant to the “de minimis” exception under paragraph (c)(7)(i)(C) of Rule 2-01 of Regulation S-X during the period ended October 31, 2012 and the indicated 2012 and 2011 fiscal years was zero.
(f) Not applicable.
(g) The aggregate non-audit fees billed by the registrant’s accountant for services rendered to the registrant, and rendered to the registrant’s investment adviser (not including any sub-adviser whose role is primarily portfolio management and is subcontracted with or overseen by another investment adviser), and any entity controlling, controlled by, or under common control with the adviser that provides ongoing services to the registrant for the period ended October 31, 2012 and the indicated 2012 and 2011 fiscal years are approximately as follows:
2012 | | October 31, 2011
(for eight series) | | May 31, 2012
(for two series) | |
$ | 495,700 | | $ | 398,600 | | $ | 414,600 | |
| | | | | | | | |
(h) The registrant’s Audit Committee of the Board of Directors has considered whether the provision of non-audit services that were rendered to the registrant’s adviser (not including any sub-adviser whose role is primarily portfolio management and is subcontracted with or overseen by another investment adviser), and any entity controlling, controlled by, or under common control with the investment adviser that provides ongoing services to the registrant that were not pre-approved pursuant to paragraph (c)(7)(ii) of Rule 2-01 of Regulation S-X, is compatible with maintaining the principal accountant’s independence.
Item 5. Audit Committee of Listed Registrants.
Not applicable.
Item 6. Investments
(a) The registrant’s “Schedule I — Investments in securities of unaffiliated issuers” (as set forth in 17 CFR 210.12-12) is included in Item 1 of this Form N-CSR.
(b) Not applicable.
Item 7. Disclosure of Proxy Voting Policies and Procedures for Closed-End Management Investment Companies.
Not applicable.
Item 8. Portfolio Managers of Closed-End Management Investment Companies.
Not applicable.
Item 9. Purchases of Equity Securities by Closed-End Management Investment Company and Affiliated Purchasers.
Not applicable.
Item 10. Submission of Matters to a Vote of Security Holders.
There were no material changes to the procedures by which shareholders may recommend nominees to the registrant’s board of directors.
Item 11. Controls and Procedures.
(a) The registrant’s principal executive officer and principal financial officers, based on their evaluation of the registrant’s disclosure controls and procedures as of a date within 90 days of the filing of this report, have concluded that such controls and procedures are adequately designed to ensure that material information required to be disclosed by the registrant in Form N-CSR is accumulated and communicated to the registrant’s management, including the principal executive officer and principal financial officer, or persons performing similar functions, as appropriate to allow timely decisions regarding required disclosure.
(b) There was no change in the registrant’s internal control over financial reporting that occurred during the registrant’s second fiscal quarter of the period covered by this report that has materially affected, or is reasonably likely to materially affect, the registrant’s internal control over financial reporting.
Item 12. Exhibits.
(a)(1) Code of ethics required to be disclosed under Item 2 of Form N-CSR attached hereto as Exhibit 99.CODE ETH.
(a)(2) Certifications pursuant to Rule 30a-2(a) under the Investment Company Act of 1940 (17 CFR 270.30a-2(a)) attached hereto as Exhibit 99.CERT.
(a)(3) Not applicable.
(b) Certification pursuant to Rule 30a-2(b) under the Investment Company Act of 1940 (17 CFR 270.30a-2(b)) attached hereto as Exhibit 99.906CERT.
SIGNATURES
Pursuant to the requirements of the Securities Exchange Act of 1934 and the Investment Company Act of 1940, the registrant has duly caused this report to be signed on its behalf by the undersigned, thereunto duly authorized.
(registrant) | | Columbia Funds Series Trust I | |
| | | |
| | | |
By (Signature and Title) | | /s/ J. Kevin Connaughton | |
| | J. Kevin Connaughton, President and Principal Executive Officer | |
| | | |
| | | |
Date | | December 21, 2012 | |
| | | |
| | | |
Pursuant to the requirements of the Securities Exchange Act of 1934 and the Investment Company Act of 1940, this report has been signed below by the following persons on behalf of the registrant and in the capacities and on the dates indicated. |
| | | |
| | | |
By (Signature and Title) | | /s/ J. Kevin Connaughton | |
| | J. Kevin Connaughton, President and Principal Executive Officer | |
| | | |
| | | |
Date | | December 21, 2012 | |
| | | |
| | | |
By (Signature and Title) | | /s/ Michael G. Clarke | |
| | Michael G. Clarke, Treasurer and Chief Financial Officer | |
| | | |
| | | |
Date | | December 21, 2012 | |
| | | | | |