UNITED STATES
SECURITIES AND EXCHANGE COMMISSION
Washington, D.C. 20549
FORM N-CSR
CERTIFIED SHAREHOLDER REPORT OF REGISTERED
MANAGEMENT INVESTMENT COMPANIES
Investment Company Act file number | 811-04367 |
|
Columbia Funds Series Trust I |
(Exact name of registrant as specified in charter) |
|
225 Franklin Street, Boston, Massachusetts | | 02110 |
(Address of principal executive offices) | | (Zip code) |
|
Scott R. Plummer 5228 Ameriprise Financial Center Minneapolis, MN 55474 |
(Name and address of agent for service) |
|
Registrant’s telephone number, including area code: | 1-612-671-1947 | |
|
Date of fiscal year end: | December 31 | |
|
Date of reporting period: | December 31, 2012 | |
| | | | | | | | |
Form N-CSR is to be used by management investment companies to file reports with the Commission not later than 10 days after the transmission to stockholders of any report that is required to be transmitted to stockholders under Rule 30e-1 under the Investment Company Act of 1940 (17 CFR 270.30e-1). The Commission may use the information provided on Form N-CSR in its regulatory, disclosure review, inspection, and policymaking roles.
A registrant is required to disclose the information specified by Form N-CSR, and the Commission will make this information public. A registrant is not required to respond to the collection of information contained in Form N-CSR unless the Form displays a currently valid Office of Management and Budget (“OMB”) control number. Please direct comments concerning the accuracy of the information collection burden estimate and any suggestions for reducing the burden to Secretary, Securities and Exchange Commission, 450 Fifth Street, NW, Washington, DC 20549-0609. The OMB has reviewed this collection of information under the clearance requirements of 44 U.S.C. § 3507.
Item 1. Reports to Stockholders.
Annual Report
December 31, 2012

Columbia Real Estate Equity Fund
Not FDIC insured • No bank guarantee • May lose value
Columbia Real Estate Equity Fund
 Dear Shareholders,
U.S. stocks flat, foreign markets strong in 2012 finale
After a strong third quarter, U.S. stock market averages treaded water as 2012 came to a close. However, they ended the year up strongly, as first and third quarter gains more than offset second and fourth quarter weakness. Typically a strong quarter for domestic small and mid cap issues, the fourth quarter of 2012 indeed proved to be another year-end positive for small stocks. For the full calendar year 2012, the S&P 500 Index rose 16.00%.
Stock markets outside the United States generated some of the best returns for the fourth quarter, as optimism rebounded, thanks to the September actions of the European Central Bank in support of the euro and an improving outlook from China. Both developed and emerging foreign markets topped U.S. stocks by a solid margin.
Corporate and emerging markets led fixed income
Fixed-income investors took their cue from the equity markets and continued to favor the highest risk sectors through the end of 2012. Global fixed-income returns posted mixed results in the final quarter of the year. Gains were the highest for corporate high-yield and emerging market bonds. Although investors remained cautious ahead of the year-end budget negotiations, better economic data and a further improvement in the European sovereign debt crisis supported riskier assets and depressed government bond prices. In December, the Fed announced its intention to continue to purchase both Treasury and mortgage-backed securities and said that it would seek to keep short-term interest rates unchanged until the unemployment rate reaches 6.5%, or inflation turned noticeably higher.
Stay on track with Columbia Management
Backed by more than 100 years of experience, Columbia Management is one of the nation's largest asset managers. At the heart of our success — and, most importantly, that of our investors — are highly talented industry professionals, brought together by a unique way of working. We are dedicated to helping you take advantage of today's opportunities and anticipate tomorrow's. We stay abreast of the latest investment trends and ideas, using our collective insight to evaluate events and transform them into solutions you can use.
Visit columbiamanagement.com for:
> The Columbia Management Perspectives blog, featuring timely posts by our investment teams
> Detailed up-to-date fund performance and portfolio information
> Economic analysis and market commentary
> Quarterly fund commentaries
> Columbia Management Investor, our award-winning quarterly newsletter for shareholders
Thank you for your continued support of the Columbia Funds. We look forward to serving your investment needs for many years to come.
Best Regards,

J. Kevin Connaughton
President, Columbia Funds
The S&P 500 Index, an unmanaged index, measures the performance of 500 widely held, large-capitalization U.S. stocks and is frequently used as a general measure of market performance. The Dow Jones Industrial Average is a price weighted average of 30 actively traded shares of blue chip US industrial corporations listed on the New York Stock Exchange. Indices are not available for investment, are not professionally managed and do not reflect sales charges, fees, brokerage commissions, taxes or other expenses of investing.
Investors should consider the investment objectives, risks, charges and expenses of a mutual fund carefully before investing. For a free prospectus, which contains this and other important information about a fund, visit columbiamanagement.com. The prospectus should be read carefully before investing.
Columbia Funds are distributed by Columbia Management Investment Distributors, Inc., member FINRA, and managed by Columbia Management Investment Advisers, LLC.
© 2013 Columbia Management Investment Advisers, LLC. All rights reserved.
Columbia Real Estate Equity Fund
Performance Overview | | | 2 | | |
Manager Discussion of Fund Performance | | | 4 | | |
Understanding Your Fund's Expenses | | | 6 | | |
Portfolio of Investments | | | 7 | | |
Statement of Assets and Liabilities | | | 10 | | |
Statement of Operations | | | 12 | | |
Statement of Changes in Net Assets | | | 13 | | |
Financial Highlights | | | 16 | | |
Notes to Financial Statements | | | 26 | | |
Report of Independent Registered
Public Accounting Firm | | | 35 | | |
Federal Income Tax Information | | | 36 | | |
Trustees and Officers | | | 37 | | |
Important Information About This Report | | | 41 | | |
Fund Investment Manager
Columbia Management Investment
Advisers, LLC
225 Franklin Street
Boston, MA 02110
Fund Distributor
Columbia Management Investment
Distributors, Inc.
225 Franklin Street
Boston, MA 02110
Fund Transfer Agent
Columbia Management Investment
Services Corp.
P.O. Box 8081
Boston, MA 02266-8081
For more information about any of the funds, please visit columbiamanagement.com or call 800.345.6611. Customer Service Representatives are available to answer your questions Monday through Friday from 8 a.m. to 8 p.m. Eastern time.
The views expressed in this report reflect the current views of the respective parties. These views are not guarantees of future performance and involve certain risks, uncertainties and assumptions that are difficult to predict, so actual outcomes and results may differ significantly from the views expressed. These views are subject to change at any time based upon economic, market or other conditions and the respective parties disclaim any responsibility to update such views. These views may not be relied on as investment advice and, because investment decisions for a Columbia Fund are based on numerous factors, may not be relied on as an indication of trading intent on behalf of any particular Columbia Fund. References to specific securities should not be construed as a recommendation or investment advice.
Columbia Real Estate Equity Fund
Performance Summary
> Columbia Real Estate Equity Fund (the Fund) Class A shares returned 16.92% excluding sales charges for the 12-month period that ended December 31, 2012.
> The Fund's benchmark, the FTSE NAREIT Equity REITs Index returned 18.06% for the same 12-month period.
> Strong results in the overweighted retailing and self-storage industries helped Fund performance but not enough to overcome disappointments in the apartment property group.
Average Annual Total Returns (%) (for period ended December 31, 2012)
| | | | 1 Year | | 5 Years | | 10 Years | |
Class A | | 11/01/02 | | | | | | | | | | | | | |
Excluding sales charges | | | | | | | 16.92 | | | | 5.37 | | | | 10.43 | | |
Including sales charges | | | | | | | 10.23 | | | | 4.14 | | | | 9.78 | | |
Class B | | 11/01/02 | | | | | | | | | | | | | |
Excluding sales charges | | | | | | | 16.10 | | | | 4.59 | | | | 9.61 | | |
Including sales charges | | | | | | | 11.10 | | | | 4.25 | | | | 9.61 | | |
Class C* | | 10/13/03 | | | | | | | | | | | |
Excluding sales charges | | | | | | | 16.06 | | | | 4.58 | | | | 9.62 | | |
Including sales charges | | | | | | | 15.06 | | | | 4.58 | | | | 9.62 | | |
Class I* | | 09/27/10 | | | 17.48 | | | | 5.74 | | | | 10.78 | | |
Class K* (Formerly Class R4) | | 03/07/11 | | | 17.09 | | | | 5.52 | | | | 10.60 | | |
Class R* | | 09/27/10 | | | 16.74 | | | | 4.97 | | | | 9.97 | | |
Class R4* | | 11/08/12 | | | 17.28 | | | | 5.63 | | | | 10.72 | | |
Class R5* | | 03/07/11 | | | 17.24 | | | | 5.67 | | | | 10.74 | | |
Class W* | | 09/27/10 | | | 17.00 | | | | 5.42 | | | | 10.50 | | |
Class Z | | 04/01/94 | | | 17.28 | | | | 5.62 | | | | 10.72 | | |
FTSE NAREIT Equity REITs Index | | | | | | | 18.06 | | | | 5.45 | | | | 11.63 | | |
Returns for Class A are shown with and without the maximum initial sales charge of 5.75%. Returns for Class B are shown with and without the applicable contingent deferred sales charge (CDSC) of 5.00% in the first year, declining to 1.00% in the sixth year and eliminated thereafter. Returns for Class C are shown with and without the 1.00% CDSC for the first year only. The Fund's other classes are not subject to sales charges and have limited eligibility. Please see the Fund's prospectuses for details. Performance for different share classes will vary based on differences in sales charges and fees associated with each class. All results shown assume reinvestment of distributions during the period. Returns do not reflect the deduction of taxes that a shareholder may pay on Fund distributions or on the redemption of Fund shares. Performance results reflect the effect of any fee waivers or reimbursements of Fund expenses by Columbia Management Investment Advisers, LLC and/or any of its affiliates. Absent these fee waivers or expense reimbursement arrangements, performance results would have been lower.
The performance information shown represents past performance and is not a guarantee of future results. The investment return and principal value of your investment will fluctuate so that your shares, when redeemed, may be worth more or less than their original cost. Current performance may be lower or higher than the performance information shown. You may obtain performance information current to the most recent month-end by contacting your financial intermediary, visiting columbiamanagement.com or calling 800.345.6611.
*The returns shown for periods prior to the share class inception date (including returns for the Life of the Fund, if shown, which are since Fund inception) include the returns of the Fund's oldest share class. These returns are adjusted to reflect any higher class-related operating expenses of the newer share classes, as applicable. Please visit columbiamanagement.com/mutual-funds/appended-performance for more information.
The FTSE NAREIT Equity REITs Index reflects performance of all publicly traded equity real estate investment trusts (REITs), other than those designated as timber REITs.
Indices are not available for investment, are not professionally managed and do not reflect sales charges, fees, brokerage commissions, taxes or other expenses of investing. Securities in the Fund may not match those in an index.
Annual Report 2012
2
Columbia Real Estate Equity Fund
Performance Overview (continued)
Performance of a Hypothetical $10,000 Investment (January 1, 2003 – December 31, 2012)
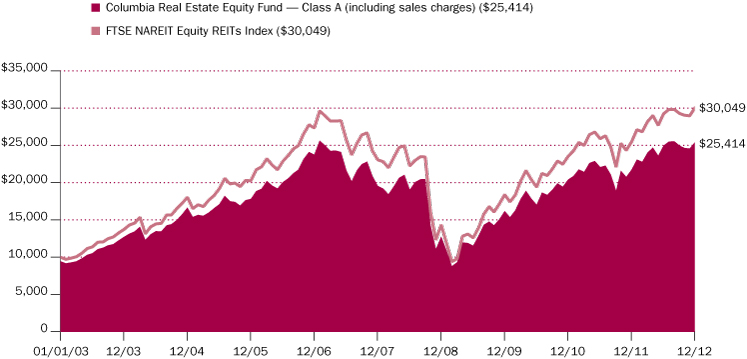
The chart above shows the change in value of a hypothetical $10,000 investment in Class A shares of Columbia Real Estate Equity Fund during the stated time period, and does not reflect the deduction of taxes that a shareholder may pay on Fund distributions or on the redemption of Fund shares.
Annual Report 2012
3
Columbia Real Estate Equity Fund
Manager Discussion of Fund Performance
For the 12 months ended December 31, 2012, the Fund's Class A shares returned 16.92% excluding sales charges, while the benchmark FTSE NAREIT Equity REITs Index gained 18.06%. Overweights relative to the benchmark in the retail and self-storage property groups helped performance for the year, while investments in apartment complex properties accounted for the modest shortfall relative to the index in a stellar year for real estate investments.
Modest Economic Growth
The U.S. economy expanded at a modest but sluggish pace in 2012. Job growth picked up but failed to reach a level that could drive unemployment significantly lower. Manufacturing activity stalled during the summer and again late in the year, a sign that the engine of this recovery had lost some steam. The housing market showed steady improvement throughout the year, but its contribution to growth was modest. A host of other factors weighed on the economy. Superstorm Sandy battered the Northeast in October, with damage estimated to exceed $65 billion. Europe's debt woes, economic slowdown in China and Congressional wrangling over the fiscal cliff of tax increases and spending cuts scheduled for year end all contributed to an uncertain environment. At the very last minute, Congress raised income, dividend, capital gains and estate taxes on the wealthiest Americans. However, it failed to produce meaningful spending cuts that would reduce the budget deficit or address the debt-ceiling limit that the federal government will reach early in 2013.
Despite these challenges, the financial markets were buoyed by the actions of European and U.S. policymakers, who opened the liquidity spigots. In August, the European Central Bank unveiled a package of measures that involved buying sovereign bonds to ease the strain of Europe's debt crisis and safeguard the euro. In the United States, the Federal Reserve (the Fed) announced that it would keep short-term interest rates near zero until unemployment declined to 6.5% or inflation exceeded 2.5%. The Fed also extended its purchase of long-term Treasury and agency-backed mortgage securities to maintain downward pressure on longer-term interest rates, support mortgage markets and help make broader financial conditions more accommodative.
In this environment, real estate investment trusts (REITs) outperformed the overall equity market, as measured by the S&P 500 Index, aided by strong industry fundamentals, continued access to low-cost capital and healthy earnings gains.
Retail, Self-Storage Holdings Outperformed
The Fund's overweight positions, combined with good security selection, in retail and self-storage REITs helped support Fund results. Both groups featured companies with strong fundamentals that included healthy occupancy rates and good pricing power. In retail, the industry group that was the biggest contributor to relative results, two standouts were CBL & Associates and Simon Properties. A mid-sized owner of regional shopping malls and other properties in 26 states, CBL was aided by improving fundamentals that allowed it to strengthen its balance sheet and reduce its cost of capital. Simon Properties, the nation's largest owner of regional malls, features a portfolio of high-quality malls that generated rising revenues based on higher rents, growing occupancy rates and increased sales per-square-foot. Other retail REITs that supported performance included DDR, which owns a network of Power Center shopping centers, and Weingarten Realty Investors.
Portfolio Management
Arthur Hurley, CFA
Morningstar Style BoxTM

The Morningstar Style BoxTM is based on a fund's portfolio holdings. For equity funds, the vertical axis shows the market capitalization of the stocks owned, and the horizontal axis shows investment style (value, blend, or growth). Information shown is based on the most recent data provided by Morningstar.
© 2013 Morningstar, Inc. All rights reserved. The Morningstar information contained herein: (1) is proprietary to Morningstar and/or its content providers; (2) may not be copied or distributed; and (3) is not warranted to be accurate, complete or timely. Neither Morningstar nor its content providers are responsible for any damages or losses arising from any use of this information.
Top Ten Holdings (%)
(at December 31, 2012) | |
Simon Property Group, Inc. | | | 13.7 | | |
Ventas, Inc. | | | 6.2 | | |
ProLogis, Inc. | | | 6.0 | | |
Boston Properties, Inc. | | | 5.0 | | |
AvalonBay Communities, Inc. | | | 4.9 | | |
Equity Residential | | | 4.8 | | |
HCP, Inc. | | | 4.5 | | |
DDR Corp. | | | 3.1 | | |
CubeSmart | | | 3.1 | | |
Public Storage | | | 2.8 | | |
Percentages indicated are based upon total investments (excluding Money Market Funds).
For further detail about these holdings, please refer to the section entitled "Portfolio of Investments."
Fund holdings are as of the date given, are subject to change at any time, and are not recommendations to buy or sell any security.
Annual Report 2012
4
Columbia Real Estate Equity Fund
Manager Discussion of Fund Performance (continued)
Throughout the year, we retained overweights in self-storage REITs, a group that was able to take advantage of scale and generate both top-line revenue growth and bottom-line profit growth. However, we reduced this emphasis near the end of the year when we believed that current prices more fully reflected the fundamental strengths of companies. Notable among the Fund's self-storage outperformers was Extra Space Storage.
Apartments Lagged
The Fund's emphasis on apartment complex REITs accounted for the modest shortfall relative to the index. AvalonBay Communities REIT was a significant disappointment. While the company's underlying fundamentals were good, investors became worried that Avalon could be vulnerable to competition from an improving single-family home market because of its emphasis on higher-quality apartment complexes in coastal regions. DuPont Fabros Technology, the owner of properties housing data centers operated by other corporations, was another significant detractor. The company was unable to duplicate its strong earnings from the first calendar quarter of 2012, and investors worried that it was losing pricing power as it negotiated new leases.
Looking Ahead
At present, we remain bullish on real estate investment trusts, which continue to be attractive for the three key reasons that drove their outperformance in 2012: 1) Fundamentals: REITs continue to produce attractive same-property income, rising occupancy rates and the ability to raise rents. While overall economic growth has been slow, it has been vigorous enough to create increased demand for REIT owned and operated properties. 2) Credit market volatility: it has impaired the ability of other types of commercial real estate owners to obtain credit while REITs have demonstrated a superior ability to access capital. 3) Slow economic growth, low borrowing costs: what's more, yields paid by REITs currently look attractive against fixed-income alternatives, while their returns rival those of many equity groups. This is not to say that there are no potential hurdles in the road ahead. We plan to continue to watch closely for any developments that could affect the REIT industry or any parts of it.
Portfolio Breakdown (%)
(at December 31, 2012) | |
Common Stocks | | | 98.7 | | |
Real Estate Investment Trusts | | | 98.7 | | |
Exchange-Traded Funds | | | 0.9 | | |
Money Market Funds | | | 0.4 | | |
Total | | | 100.0 | | |
Percentages indicated are based upon total investments. The Fund's portfolio composition is subject to change.
Annual Report 2012
5
Columbia Real Estate Equity Fund
Understanding Your Fund's Expenses
(Unaudited)
As an investor, you incur two types of costs. There are transaction costs, which generally include sales charges on purchases and may include redemption fees. There are also ongoing costs, which generally include management fees, distribution and service (Rule 12b-1) fees, and other fund expenses. The following information is intended to help you understand your ongoing costs (in dollars) of investing in the Fund and to help you compare these costs with the ongoing costs of investing in other mutual funds.
Analyzing Your Fund's Expenses
To illustrate these ongoing costs, we have provided examples and calculated the expenses paid by investors in each share class of the Fund during the period. The actual and hypothetical information in the table is based on an initial investment of $1,000 at the beginning of the period indicated and held for the entire period. Expense information is calculated two ways and each method provides you with different information. The amount listed in the "Actual" column is calculated using the Fund's actual operating expenses and total return for the period. You may use the Actual information, together with the amount invested, to estimate the expenses that you paid over the period. Simply divide your account value by $1,000 (for example, an $8,600 account value divided by $1,000 = 8.6), then multiply the results by the expenses paid during the period under the Actual column. The amount listed in the "Hypothetical" column assumes a 5% annual rate of return before expenses (which is not the Fund's actual return) and then applies the Fund's actual expense ratio for the period to the hypothetical return. You should not use the hypothetical account values and expenses to estimate either your actual account balance at the end of the period or the expenses you paid during the period. See "Compare With Other Funds" below for details on how to use the hypothetical data.
Compare With Other Funds
Since all mutual funds are required to include the same hypothetical calculations about expenses in shareholder reports, you can use this information to compare the ongoing cost of investing in the Fund with other funds. To do so, compare the hypothetical example with the 5% hypothetical examples that appear in the shareholder reports of other funds. As you compare hypothetical examples of other funds, it is important to note that hypothetical examples are meant to highlight the ongoing costs of investing in a fund only and do not reflect any transaction costs, such as sales charges, or redemption or exchange fees. Therefore, the hypothetical calculations are useful in comparing ongoing costs only, and will not help you determine the relative total costs of owning different funds. If transaction costs were included in these calculations, your costs would be higher.
July 1, 2012 – December 31, 2012
| | Account Value at the Beginning
of the Period ($) | | Account Value at the End of the
Period ($) | | Expenses Paid During the
Period ($) | | Fund's Annualized
Expense Ratio (%) | |
| | Actual | | Hypothetical | | Actual | | Hypothetical | | Actual | | Hypothetical | | Actual | |
Class A | | | 1,000.00 | | | | 1,000.00 | | | | 1,019.00 | | | | 1,018.60 | | | | 6.74 | | | | 6.73 | | | | 1.32 | | |
Class B | | | 1,000.00 | | | | 1,000.00 | | | | 1,015.10 | | | | 1,014.81 | | | | 10.54 | | | | 10.54 | | | | 2.07 | | |
Class C | | | 1,000.00 | | | | 1,000.00 | | | | 1,014.40 | | | | 1,014.81 | | | | 10.54 | | | | 10.54 | | | | 2.07 | | |
Class I | | | 1,000.00 | | | | 1,000.00 | | | | 1,021.30 | | | | 1,021.03 | | | | 4.29 | | | | 4.29 | | | | 0.84 | | |
Class K(a) | | | 1,000.00 | | | | 1,000.00 | | | | 1,019.20 | | | | 1,019.41 | | | | 5.92 | | | | 5.92 | | | | 1.16 | | |
Class R | | | 1,000.00 | | | | 1,000.00 | | | | 1,017.70 | | | | 1,017.34 | | | | 8.01 | | | | 8.00 | | | | 1.57 | | |
Class R4 | | | 1,000.00 | | | | 1,000.00 | | | | 1,040.80 | * | | | 1,019.86 | | | | 1.55 | * | | | 5.46 | | | | 1.07 | * | |
Class R5 | | | 1,000.00 | | | | 1,000.00 | | | | 1,018.50 | | | | 1,021.03 | | | | 4.29 | | | | 4.29 | | | | 0.84 | | |
Class W | | | 1,000.00 | | | | 1,000.00 | | | | 1,018.90 | | | | 1,018.60 | | | | 6.74 | | | | 6.73 | | | | 1.32 | | |
Class Z | | | 1,000.00 | | | | 1,000.00 | | | | 1,019.50 | | | | 1,019.86 | | | | 5.46 | | | | 5.46 | | | | 1.07 | | |
(a) Effective October 25, 2012, Class R4 shares were renamed Class K shares.
*For the period November 8, 2012 through December 31, 2012. Class R4 shares commenced operations on November 8, 2012.
Expenses paid during the period are equal to the annualized expense ratio for each class as indicated above, multiplied by the average account value over the period and then multiplied by the number of days in the Fund's most recent fiscal half year and divided by 366.
Expenses do not include fees and expenses incurred indirectly by the Fund from the underlying funds in which the Fund may invest (also referred to as "acquired funds"), including affiliated and non-affiliated pooled investment vehicles (including mutual funds and exchange-traded funds).
Annual Report 2012
6
Columbia Real Estate Equity Fund
Portfolio of Investments
December 31, 2012
(Percentages represent value of investments compared to net assets)
Common Stocks 98.4%
Issuer | | Shares | | Value ($) | |
Financials 98.4% | |
Real Estate Investment Trusts (REITs) 98.4% | |
Alexandria Real Estate Equities, Inc. | | | 43,900 | | | | 3,043,148 | | |
American Campus Communities, Inc. | | | 251,289 | | | | 11,591,961 | | |
AvalonBay Communities, Inc. | | | 217,279 | | | | 29,460,860 | | |
Boston Properties, Inc. | | | 286,254 | | | | 30,288,536 | | |
CBL & Associates Properties, Inc. | | | 651,044 | | | | 13,808,643 | | |
Coresite Realty Corp. | | | 235,200 | | | | 6,505,632 | | |
Corporate Office Properties Trust | | | 346,500 | | | | 8,655,570 | | |
CubeSmart | | | 1,284,370 | | | | 18,713,271 | | |
DDR Corp. | | | 1,214,172 | | | | 19,013,933 | | |
Digital Realty Trust, Inc. | | | 30,200 | | | | 2,050,278 | | |
Douglas Emmett, Inc. | | | 415,200 | | | | 9,674,160 | | |
Duke Realty Corp. | | | 375,300 | | | | 5,205,411 | | |
DuPont Fabros Technology, Inc. | | | 336,000 | | | | 8,117,760 | | |
EastGroup Properties, Inc. | | | 95,190 | | | | 5,122,174 | | |
Education Realty Trust, Inc. | | | 330,900 | | | | 3,520,776 | | |
Equity Residential | | | 509,474 | | | | 28,871,892 | | |
Essex Property Trust, Inc. | | | 66,300 | | | | 9,722,895 | | |
Federal Realty Investment Trust | | | 93,200 | | | | 9,694,664 | | |
First Industrial Realty Trust, Inc.(a) | | | 247,700 | | | | 3,487,616 | | |
General Growth Properties, Inc. | | | 501,900 | | | | 9,962,715 | | |
Glimcher Realty Trust | | | 736,600 | | | | 8,168,894 | | |
HCP, Inc. | | | 596,409 | | | | 26,945,759 | | |
Health Care REIT, Inc. | | | 186,600 | | | | 11,436,714 | | |
Home Properties, Inc. | | | 266,500 | | | | 16,339,115 | | |
Host Hotels & Resorts, Inc. | | | 817,856 | | | | 12,815,803 | | |
Kimco Realty Corp. | | | 532,300 | | | | 10,284,036 | | |
LaSalle Hotel Properties | | | 284,135 | | | | 7,214,188 | | |
Lexington Realty Trust | | | 476,584 | | | | 4,980,303 | | |
National Retail Properties, Inc. | | | 450,400 | | | | 14,052,480 | | |
Omega Healthcare Investors, Inc. | | | 411,100 | | | | 9,804,735 | | |
Common Stocks (continued)
Issuer | | Shares | | Value ($) | |
Piedmont Office Realty Trust, Inc., Class A | | | 570,200 | | | | 10,292,110 | | |
Post Properties, Inc. | | | 316,178 | | | | 15,793,091 | | |
ProLogis, Inc. | | | 986,369 | | | | 35,992,605 | | |
Public Storage | | | 115,459 | | | | 16,736,937 | | |
Simon Property Group, Inc. | | | 523,354 | | | | 82,737,034 | | |
SL Green Realty Corp. | | | 121,178 | | | | 9,288,294 | | |
Strategic Hotels & Resorts, Inc.(a) | | | 534,000 | | | | 3,417,600 | | |
Sunstone Hotel Investors, Inc.(a) | | | 525,400 | | | | 5,627,034 | | |
Tanger Factory Outlet Centers | | | 236,500 | | | | 8,088,300 | | |
Ventas, Inc. | | | 576,774 | | | | 37,328,813 | | |
Vornado Realty Trust | | | 57,600 | | | | 4,612,608 | | |
Weingarten Realty Investors | | | 379,902 | | | | 10,169,976 | | |
Total | | | | | 598,638,324 | | |
Total Financials | | | | | 598,638,324 | | |
Total Common Stocks
(Cost: $452,312,251) | | | | | 598,638,324 | | |
Exchange-Traded Funds 0.9%
iShares Dow Jones US Real Estate
Index Fund | | | 88,700 | | | | 5,740,664 | | |
Total Exchange-Traded Funds
(Cost: $5,741,006) | | | | | 5,740,664 | | |
Money Market Funds 0.4% | |
Columbia Short-Term Cash Fund,
0.142%(b)(c) | | | 2,179,641 | | | | 2,179,641 | | |
Total Money Market Funds
(Cost: $2,179,641) | | | | | 2,179,641 | | |
Total Investments
(Cost: $460,232,898) | | | | | 606,558,629 | | |
Other Assets & Liabilities, Net | | | | | 2,089,920 | | |
Net Assets | | | | | 608,648,549 | | |
Notes to Portfolio of Investments
(a) Non-income producing.
(b) The rate shown is the seven-day current annualized yield at December 31, 2012.
The accompanying Notes to Financial Statements are an integral part of this statement.
Annual Report 2012
7
Columbia Real Estate Equity Fund
Portfolio of Investments (continued)
December 31, 2012
Notes to Portfolio of Investments (continued)
(c) As defined in the Investment Company Act of 1940, an affiliated company is one in which the Fund owns 5% or more of its outstanding voting securities, or a company which is under common ownership or control with the Fund. Holdings and transactions in these affiliated companies during the year ended December 31, 2012, are as follows:
Issuer | | Beginning
Cost ($) | | Purchase
Cost ($) | | Proceeds
From Sales ($) | | Realized
Gain/Loss ($) | | Ending
Cost ($) | | Dividends
or Interest
Income ($) | | Value ($) | |
Columbia Short-Term
Cash Fund | | | 153,606 | | | | 158,815,911 | | | | (156,789,876) | | | | — | | | | 2,179,641 | | | | 4,546 | | | | 2,179,641 | | |
Fair Value Measurements
Generally accepted accounting principles (GAAP) require disclosure regarding the inputs and valuation techniques used to measure fair value and any changes in valuation inputs or techniques. In addition, investments shall be disclosed by major category.
The Fund categorizes its fair value measurements according to a three-level hierarchy that maximizes the use of observable inputs and minimizes the use of unobservable inputs by prioritizing that the most observable input be used when available. Observable inputs are those that market participants would use in pricing an investment based on market data obtained from sources independent of the reporting entity. Unobservable inputs are those that reflect the Fund's assumptions about the information market participants would use in pricing an investment. An investment's level within the fair value hierarchy is based on the lowest level of any input that is deemed significant to the asset or liability's fair value measurement. The input levels are not necessarily an indication of the risk or liquidity associated with investments at that level. For example, certain U.S. government securities are generally high quality and liquid, however, they are reflected as Level 2 because the inputs used to determine fair value may not always be quoted prices in an active market.
Fair value inputs are summarized in the three broad levels listed below:
> Level 1 — Valuations based on quoted prices for investments in active markets that the Fund has the ability to access at the measurement date (including NAV for open-end mutual funds). Valuation adjustments are not applied to Level 1 investments.
> Level 2 — Valuations based on other significant observable inputs (including quoted prices for similar securities, interest rates, prepayment speeds, credit risks, etc.).
> Level 3 — Valuations based on significant unobservable inputs (including the Fund's own assumptions and judgment in determining the fair value of investments).
Inputs that are used in determining fair value of an investment may include price information, credit data, volatility statistics, and other factors. These inputs can be either observable or unobservable. The availability of observable inputs can vary between investments, and is affected by various factors such as the type of investment, and the volume and level of activity for that investment or similar investments in the marketplace. The inputs will be considered by the Investment Manager, along with any other relevant factors in the calculation of an investment's fair value. The Fund uses prices and inputs that are current as of the measurement date, which may include periods of market dislocations. During these periods, the availability of prices and inputs may be reduced for many investments. This condition could cause an investment to be reclassified between the various levels within the hierarchy.
Investments falling into the Level 3 category are primarily supported by quoted prices from brokers and dealers participating in the market for those investments. However, these may be classified as Level 3 investments due to lack of market transparency and corroboration to support these quoted prices. Additionally, valuation models may be used as the pricing source for any remaining investments classified as Level 3. These models rely on one or more significant unobservable inputs and/or significant assumptions by the Investment Manager. Inputs used in valuations may include, but are not limited to, financial statement analysis, capital account balances, discount rates and estimated cash flows, and comparable company data.
Under the direction of the Fund's Board of Trustees (the Board), the Investment Manager's Valuation Committee (the Committee) is responsible for carrying out the valuation procedures approved by the Board. The Committee consists of voting and non-voting members from various groups within the Investment Manager's organization, including operations and accounting, trading and investments, compliance, risk management and legal.
The Committee meets at least monthly to review and approve valuation matters, which may include a description of specific valuation determinations, data regarding pricing information received from approved pricing vendors and brokers and the results of Board-approved valuation control policies and procedures (the Policies). The Policies address, among other things, instances when market quotations are readily available, including recommendations of third party pricing vendors and a determination of appropriate pricing methodologies; events that require specific valuation determinations and assessment of fair value techniques; securities with a potential for stale pricing, including those that are illiquid, restricted, or in default; and the effectiveness of third-party pricing vendors, including periodic reviews of vendors. The Committee meets more frequently, as needed, to discuss additional valuation matters, which may include the need to review back-testing results, review time-sensitive information or approve related valuation actions. The Committee reports to the Board, with members of the Committee meeting with the Board at each of its regularly scheduled meetings to discuss valuation matters and actions during the period, similar to those described earlier.
The accompanying Notes to Financial Statements are an integral part of this statement.
Annual Report 2012
8
Columbia Real Estate Equity Fund
Portfolio of Investments (continued)
December 31, 2012
Fair Value Measurements (continued)
For investments categorized as Level 3, the Committee monitors information similar to that described above, which may include: (i) data specific to the issuer or comparable issuers, (ii) general market or specific sector news and (iii) quoted prices and specific or similar security transactions. The Committee considers this data and any changes from prior periods in order to assess the reasonableness of observable and unobservable inputs, any assumptions or internal models used to value those securities and changes in fair value. This data is also used to corroborate, when available, information received from approved pricing vendors and brokers. Various factors impact the frequency of monitoring this information (which may occur as often as daily). However, the Committee may determine that changes to inputs, assumptions and models are not required as a result of the monitoring procedures performed.
The following table is a summary of the inputs used to value the Fund's investments at December 31, 2012:
Description | | Level 1
Quoted Prices in Active
Markets for Identical
Assets ($) | | Level 2
Other Significant
Observable Inputs ($) | | Level 3
Significant
Unobservable Inputs ($) | | Total ($) | |
Equity Securities | |
Common Stocks | |
Financials | | | 598,638,324 | | | | — | | | | — | | | | 598,638,324 | | |
Exchange-Traded Funds | | | 5,740,664 | | | | — | | | | — | | | | 5,740,664 | | |
Total Equity Securities | | | 604,378,988 | | | | — | | | | — | | | | 604,378,988 | | |
Other | |
Money Market Funds | | | 2,179,641 | | | | — | | | | — | | | | 2,179,641 | | |
Total Other | | | 2,179,641 | | | | — | | | | — | | | | 2,179,641 | | |
Total | | | 606,558,629 | | | | — | | | | — | | | | 606,558,629 | | |
See the Portfolio of Investments for all investment classifications not indicated in the table.
There were no transfers of financial assets between Levels 1 and 2 during the period.
The accompanying Notes to Financial Statements are an integral part of this statement.
Annual Report 2012
9
Columbia Real Estate Equity Fund
Statement of Assets and Liabilities
December 31, 2012
Assets | |
Investments, at value | |
Unaffiliated issuers (identified cost $458,053,257) | | $ | 604,378,988 | | |
Affiliated issuers (identified cost $2,179,641) | | | 2,179,641 | | |
Total investments (identified cost $460,232,898) | | | 606,558,629 | | |
Receivable for: | |
Investments sold | | | 3,159,061 | | |
Capital shares sold | | | 1,280,380 | | |
Dividends | | | 2,240,100 | | |
Reclaims | | | 61,296 | | |
Prepaid expenses | | | 5,568 | | |
Trustees' deferred compensation plan | | | 45,114 | | |
Total assets | | | 613,350,148 | | |
Liabilities | |
Payable for: | |
Investments purchased | | | 2,989,410 | | |
Capital shares purchased | | | 1,348,746 | | |
Investment management fees | | | 34,042 | | |
Distribution and/or service fees | | | 4,868 | | |
Transfer agent fees | | | 130,834 | | |
Administration fees | | | 2,918 | | |
Plan administration fees | | | 30 | | |
Compensation of board members | | | 7,346 | | |
Chief compliance officer expenses | | | 117 | | |
Other expenses | | | 138,174 | | |
Trustees' deferred compensation plan | | | 45,114 | | |
Total liabilities | | | 4,701,599 | | |
Net assets applicable to outstanding capital stock | | $ | 608,648,549 | | |
Represented by | |
Paid-in capital | | $ | 504,451,458 | | |
Excess of distributions over net investment income | | | (50,351 | ) | |
Accumulated net realized loss | | | (42,072,570 | ) | |
Unrealized appreciation (depreciation) on: | |
Investments | | | 146,325,731 | | |
Foreign currency translations | | | (5,719 | ) | |
Total — representing net assets applicable to outstanding capital stock | | $ | 608,648,549 | | |
The accompanying Notes to Financial Statements are an integral part of this statement.
Annual Report 2012
10
Columbia Real Estate Equity Fund
Statement of Assets and Liabilities (continued)
December 31, 2012
Class A | |
Net assets | | $ | 112,409,837 | | |
Shares outstanding | | | 7,833,817 | | |
Net asset value per share | | $ | 14.35 | | |
Maximum offering price per share(a) | | $ | 15.23 | | |
Class B | |
Net assets | | $ | 5,340,649 | | |
Shares outstanding | | | 371,465 | | |
Net asset value per share | | $ | 14.38 | | |
Class C | |
Net assets | | $ | 21,001,147 | | |
Shares outstanding | | | 1,464,184 | | |
Net asset value per share | | $ | 14.34 | | |
Class I | |
Net assets | | $ | 70,213,388 | | |
Shares outstanding | | | 4,878,575 | | |
Net asset value per share | | $ | 14.39 | | |
Class K(b) | |
Net assets | | $ | 74,256 | | |
Shares outstanding | | | 5,162 | | |
Net asset value per share(c) | | $ | 14.38 | | |
Class R | |
Net assets | | $ | 6,131,389 | | |
Shares outstanding | | | 427,626 | | |
Net asset value per share | | $ | 14.34 | | |
Class R4(d) | |
Net assets | | $ | 2,549 | | |
Shares outstanding | | | 175 | | |
Net asset value per share(c) | | $ | 14.56 | | |
Class R5 | |
Net assets | | $ | 36,727 | | |
Shares outstanding | | | 2,560 | | |
Net asset value per share | | $ | 14.35 | | |
Class W | |
Net assets | | $ | 9,431,699 | | |
Shares outstanding | | | 656,793 | | |
Net asset value per share | | $ | 14.36 | | |
Class Z | |
Net assets | | $ | 384,006,908 | | |
Shares outstanding | | | 26,721,351 | | |
Net asset value per share | | $ | 14.37 | | |
(a) The maximum offering price per share is calculated by dividing the net asset value by 1.0 minus the maximum sales charge of 5.75%.
(b) Effective October 25, 2012, Class R4 shares were renamed Class K shares.
(c) Net asset value per share rounds to this amount due to fractional shares outstanding.
(d) Class R4 shares commenced operations on November 8, 2012.
The accompanying Notes to Financial Statements are an integral part of this statement.
Annual Report 2012
11
Columbia Real Estate Equity Fund
Statement of Operations
Year Ended December 31, 2012
Net investment income | |
Income: | |
Dividends — unaffiliated issuers | | $ | 15,684,690 | | |
Dividends — affiliated issuers | | | 4,546 | | |
Income from securities lending — net | | | 282,959 | | |
Foreign taxes withheld | | | (14,257 | ) | |
Total income | | | 15,957,938 | | |
Expenses: | |
Investment management fees | | | 3,927,019 | | |
Distribution and/or service fees | |
Class A | | | 267,832 | | |
Class B | | | 64,078 | | |
Class C | | | 205,949 | | |
Class R | | | 28,562 | | |
Class W | | | 19,849 | | |
Transfer agent fees | |
Class A | | | 234,287 | | |
Class B | | | 13,790 | | |
Class C | | | 44,938 | | |
Class K(a) | | | 30 | | |
Class R | | | 12,467 | | |
Class R4(b) | | | 1 | | |
Class R5 | | | 241 | | |
Class W | | | 17,797 | | |
Class Z | | | 775,881 | | |
Administration fees | | | 338,092 | | |
Plan administration fees | |
Class K(a) | | | 189 | | |
Compensation of board members | | | 36,986 | | |
Custodian fees | | | 8,622 | | |
Printing and postage fees | | | 201,601 | | |
Registration fees | | | 174,915 | | |
Professional fees | | | 60,567 | | |
Line of credit interest expense | | | 675 | | |
Chief compliance officer expenses | | | 898 | | |
Other | | | 17,867 | | |
Total expenses | | | 6,453,133 | | |
Fees waived or expenses reimbursed by Investment Manager and its affiliates | | | (17,962 | ) | |
Expense reductions | | | (3,713 | ) | |
Total net expenses | | | 6,431,458 | | |
Net investment income | | | 9,526,480 | | |
Realized and unrealized gain (loss) — net | |
Net realized gain (loss) on: | |
Investments | | $ | 37,688,822 | | |
Foreign currency translations | | | (80 | ) | |
Options contracts written | | | 12,780 | | |
Net realized gain | | | 37,701,522 | | |
Net change in unrealized appreciation (depreciation) on: | |
Investments | | | 37,382,324 | | |
Foreign currency translations | | | 2,437 | | |
Net change in unrealized appreciation (depreciation) | | | 37,384,761 | | |
Net realized and unrealized gain | | | 75,086,283 | | |
Net increase in net assets resulting from operations | | $ | 84,612,763 | | |
(a) Effective October 25, 2012, Class R4 shares were renamed Class K shares.
(b) For the period from November 8, 2012 (commencement of operations) to December 31, 2012.
The accompanying Notes to Financial Statements are an integral part of this statement.
Annual Report 2012
12
Columbia Real Estate Equity Fund
Statement of Changes in Net Assets
| | | Year Ended
December 31,
2012 | | Year Ended
December 31,
2011 | |
Operations | |
Net investment income | | $ | 9,526,480 | | | $ | 8,258,601 | | |
Net realized gain | | | 37,701,522 | | | | 42,428,961 | | |
Net change in unrealized appreciation (depreciation) | | | 37,384,761 | | | | (19,640,428 | ) | |
Net increase in net assets resulting from operations | | | 84,612,763 | | | | 31,047,134 | | |
Distributions to shareholders | |
Net investment income | |
Class A | | | (1,636,170 | ) | | | (1,285,956 | ) | |
Class B | | | (49,027 | ) | | | (58,245 | ) | |
Class C | | | (159,752 | ) | | | (135,252 | ) | |
Class I | | | (1,241,379 | ) | | | (2,269,688 | ) | |
Class K(a) | | | (1,266 | ) | | | (931 | ) | |
Class R | | | (72,709 | ) | | | (55,319 | ) | |
Class R4(b) | | | (7 | ) | | | — | | |
Class R5 | | | (39,462 | ) | | | (50,673 | ) | |
Class W | | | (134,660 | ) | | | (76 | ) | |
Class Z | | | (6,390,691 | ) | | | (5,275,846 | ) | |
Net realized gains | |
Class A | | | (1,990,794 | ) | | | (2,497,428 | ) | |
Class B | | | (96,113 | ) | | | (186,608 | ) | |
Class C | | | (373,543 | ) | | | (504,795 | ) | |
Class I | | | (1,127,169 | ) | | | (1,694,822 | ) | |
Class K(a) | | | (1,307 | ) | | | (1,862 | ) | |
Class R | | | (107,507 | ) | | | (154,019 | ) | |
Class R4(b) | | | (45 | ) | | | — | | |
Class R5 | | | (643 | ) | | | (86,370 | ) | |
Class W | | | (164,986 | ) | | | (147 | ) | |
Class Z | | | (6,803,625 | ) | | | (7,727,009 | ) | |
Total distributions to shareholders | | | (20,390,855 | ) | | | (21,985,046 | ) | |
Increase (decrease) in net assets from capital stock activity | | | 36,019,833 | | | | 120,981,625 | | |
Redemption fees | | | 60,080 | | | | 1,016,032 | | |
Total increase in net assets | | | 100,301,821 | | | | 131,059,745 | | |
Net assets at beginning of year | | | 508,346,728 | | | | 377,286,983 | | |
Net assets at end of year | | $ | 608,648,549 | | | $ | 508,346,728 | | |
Excess of distributions over net investment income | | $ | (50,351 | ) | | $ | (50,270 | ) | |
(a) Effective October 25, 2012, Class R4 shares were renamed Class K shares.
(b) For the period from November 8, 2012 (commencement of operations) to December 31, 2012.
The accompanying Notes to Financial Statements are an integral part of this statement.
Annual Report 2012
13
Columbia Real Estate Equity Fund
Statement of Changes in Net Assets (continued)
| | | Year Ended December 31, 2012 | | Year Ended December 31, 2011 | |
| | | Shares | | Dollars ($) | | Shares | | Dollars ($) | |
Capital stock activity | |
Class A shares | |
Subscriptions(a) | | | 1,749,453 | | | | 24,910,747 | | | | 1,281,729 | | | | 16,462,771 | | |
Fund merger | | | — | | | | — | | | | 5,887,790 | | | | 75,122,126 | | |
Distributions reinvested | | | 242,678 | | | | 3,407,604 | | | | 277,501 | | | | 3,360,077 | | |
Redemptions | | | (1,989,024 | ) | | | (27,678,129 | ) | | | (1,833,805 | ) | | | (23,303,168 | ) | |
Net increase | | | 3,107 | | | | 640,222 | | | | 5,613,215 | | | | 71,641,806 | | |
Class B shares | |
Subscriptions | | | 34,109 | | | | 486,666 | | | | 30,609 | | | | 395,556 | | |
Fund merger | | | — | | | | — | | | | 643,986 | | | | 8,227,953 | | |
Distributions reinvested | | | 9,932 | | | | 139,758 | | | | 18,347 | | | | 222,458 | | |
Redemptions(a) | | | (244,866 | ) | | | (3,474,903 | ) | | | (360,874 | ) | | | (4,668,213 | ) | |
Net increase (decrease) | | | (200,825 | ) | | | (2,848,479 | ) | | | 332,068 | | | | 4,177,754 | | |
Class C shares | |
Subscriptions | | | 449,010 | | | | 6,214,397 | | | | 224,751 | | | | 2,861,797 | | |
Fund merger | | | — | | | | — | | | | 1,118,143 | | | | 14,261,923 | | |
Distributions reinvested | | | 29,032 | | | | 408,023 | | | | 35,511 | | | | 429,040 | | |
Redemptions | | | (575,582 | ) | | | (7,958,590 | ) | | | (373,163 | ) | | | (4,744,141 | ) | |
Net increase (decrease) | | | (97,540 | ) | | | (1,336,170 | ) | | | 1,005,242 | | | | 12,808,619 | | |
Class I shares | |
Subscriptions | | | 774,657 | | | | 10,840,434 | | | | 2,432,283 | | | | 31,136,486 | | |
Fund merger | | | — | | | | — | | | | 12,295,219 | | | | 157,105,589 | | |
Distributions reinvested | | | 168,308 | | | | 2,367,523 | | | | 322,913 | | | | 3,963,514 | | |
Redemptions | | | (1,450,628 | ) | | | (20,304,256 | ) | | | (12,512,568 | ) | | | (160,768,109 | ) | |
Net increase (decrease) | | | (507,663 | ) | | | (7,096,299 | ) | | | 2,537,847 | | | | 31,437,480 | | |
Class K shares(b) | |
Subscriptions | | | — | | | | — | | | | 197 | | | | 2,507 | | |
Fund merger | | | — | | | | — | | | | 5,523 | | | | 70,653 | | |
Distributions reinvested | | | 116 | | | | 1,630 | | | | 154 | | | | 1,870 | | |
Redemptions | | | (828 | ) | | | (11,918 | ) | | | — | | | | — | | |
Net increase (decrease) | | | (712 | ) | | | (10,288 | ) | | | 5,874 | | | | 75,030 | | |
Class R shares | |
Subscriptions | | | 305,703 | | | | 4,220,892 | | | | 192,665 | | | | 2,374,729 | | |
Fund merger | | | — | | | | — | | | | 472,472 | | | | 6,026,815 | | |
Distributions reinvested | | | 7,504 | | | | 105,381 | | | | 5,723 | | | | 69,061 | | |
Redemptions | | | (359,265 | ) | | | (4,883,339 | ) | | | (197,389 | ) | | | (2,558,695 | ) | |
Net increase (decrease) | | | (46,058 | ) | | | (557,066 | ) | | | 473,471 | | | | 5,911,910 | | |
Class R4 shares(c) | |
Subscriptions | | | 175 | | | | 2,500 | | | | — | | | | — | | |
Net increase | | | 175 | | | | 2,500 | | | | — | | | | — | | |
The accompanying Notes to Financial Statements are an integral part of this statement.
Annual Report 2012
14
Columbia Real Estate Equity Fund
Statement of Changes in Net Assets (continued)
| | | Year Ended December 31, 2012 | | Year Ended December 31, 2011 | |
| | | Shares | | Dollars ($) | | Shares | | Dollars ($) | |
Capital stock activity (continued) | |
Class R5 shares | |
Subscriptions | | | — | | | | — | | | | 197 | | | | 2,818 | | |
Fund merger | | | — | | | | — | | | | 267,025 | | | | 3,414,970 | | |
Distributions reinvested | | | 88 | | | | 1,229 | | | | 5,616 | | | | 67,904 | | |
Redemptions | | | (269,956 | ) | | | (4,054,463 | ) | | | (410 | ) | | | (5,135 | ) | |
Net increase (decrease) | | | (269,868 | ) | | | (4,053,234 | ) | | | 272,428 | | | | 3,480,557 | | |
Class W shares | |
Subscriptions | | | 774,760 | | | | 10,741,486 | | | | — | | | | — | | |
Fund merger | | | — | | | | — | | | | 241 | | | | 3,075 | | |
Distributions reinvested | | | 21,306 | | | | 299,432 | | | | — | | | | — | | |
Redemptions | | | (139,727 | ) | | | (1,975,283 | ) | | | — | | | | — | | |
Net increase | | | 656,339 | | | | 9,065,635 | | | | 241 | | | | 3,075 | | |
Class Z shares | |
Subscriptions | | | 10,357,301 | | | | 149,050,712 | | | | 3,377,420 | | | | 43,202,907 | | |
Fund merger | | | — | | | | — | | | | 7,642,501 | | | | 97,647,633 | | |
Distributions reinvested | | | 515,196 | | | | 7,239,677 | | | | 644,315 | | | | 7,841,788 | | |
Redemptions | | | (8,070,651 | ) | | | (114,077,377 | ) | | | (12,243,417 | ) | | | (157,246,934 | ) | |
Net increase (decrease) | | | 2,801,846 | | | | 42,213,012 | | | | (579,181 | ) | | | (8,554,606 | ) | |
Total net increase | | | 2,338,801 | | | | 36,019,833 | | | | 9,661,205 | | | | 120,981,625 | | |
(a) Includes conversions of Class B shares to Class A shares, if any.
(b) Effective October 25, 2012, Class R4 shares were renamed Class K shares.
(c) For the period from November 8, 2012 (commencement of operations) to December 31, 2012.
The accompanying Notes to Financial Statements are an integral part of this statement.
Annual Report 2012
15
Columbia Real Estate Equity Fund
The following tables are intended to help you understand the Fund's financial performance. Certain information reflects financial results for a single share of a class held for the periods shown. Per share net investment income (loss) amounts are calculated based on average shares outstanding during the period. Total return assumes reinvestment of all dividends and distributions. Total return does not reflect payment of sales charges, if any, and is not annualized for periods of less than one year.
| | | Year Ended December 31, | | Year Ended August 31, | |
Class A | | 2012 | | 2011 | | 2010 | | 2009(a) | | 2009 | | 2008 | |
Per share data | |
Net asset value, beginning of period | | $ | 12.69 | | | $ | 12.41 | | | $ | 10.07 | | | $ | 9.11 | | | $ | 13.85 | | | $ | 20.72 | | |
Income from investment operations: | |
Net investment income | | | 0.21 | | | | 0.18 | | | | 0.12 | | | | 0.06 | | | | 0.22 | | | | 0.29 | | |
Net realized and unrealized gain (loss) | | | 1.92 | | | | 0.59 | | | | 2.48 | | | | 1.10 | | | | (4.46 | ) | | | (1.10 | ) | |
Total from investment operations | | | 2.13 | | | | 0.77 | | | | 2.60 | | | | 1.16 | | | | (4.24 | ) | | | (0.81 | ) | |
Less distributions to shareholders: | |
Net investment income | | | (0.21 | ) | | | (0.19 | ) | | | (0.26 | ) | | | (0.12 | ) | | | (0.33 | ) | | | (0.16 | ) | |
Net realized gains | | | (0.26 | ) | | | (0.32 | ) | | | — | | | | — | | | | — | | | | (5.90 | ) | |
Tax return of capital | | | — | | | | — | | | | — | | | | (0.08 | ) | | | (0.17 | ) | | | — | | |
Total distributions to shareholders | | | (0.47 | ) | | | (0.51 | ) | | | (0.26 | ) | | | (0.20 | ) | | | (0.50 | ) | | | (6.06 | ) | |
Proceeds from regulatory settlements | | | — | | | | — | | | | 0.00 | (b) | | | — | | | | — | | | | — | | |
Redemption fees: | |
Redemption fees added to paid-in capital | | | 0.00 | (b) | | | 0.02 | | | | — | | | | — | | | | — | | | | — | | |
Net asset value, end of period | | $ | 14.35 | | | $ | 12.69 | | | $ | 12.41 | | | $ | 10.07 | | | $ | 9.11 | | | $ | 13.85 | | |
Total return | | | 16.92 | % | | | 6.59 | % | | | 26.04 | %(c) | | | 12.86 | % | | | (29.89 | %) | | | (5.46 | %) | |
Ratios to average net assets(d) | |
Total gross expenses | | | 1.31 | %(e) | | | 1.26 | % | | | 1.27 | %(e) | | | 1.39 | %(f) | | | 1.31 | % | | | 1.28 | %(e) | |
Total net expenses(g) | | | 1.30 | %(e)(h) | | | 1.24 | %(h) | | | 1.27 | %(e)(h) | | | 1.39 | %(f)(h) | | | 1.31 | %(h) | | | 1.28 | %(e)(h) | |
Net investment income | | | 1.49 | % | | | 1.44 | % | | | 1.04 | % | | | 1.99 | %(f) | | | 2.69 | % | | | 1.93 | % | |
Supplemental data | |
Net assets, end of period (in thousands) | | $ | 112,410 | | | $ | 99,335 | | | $ | 27,511 | | | $ | 18,245 | | | $ | 17,114 | | | $ | 22,321 | | |
Portfolio turnover | | | 65 | % | | | 72 | % | | | 108 | % | | | 32 | % | | | 110 | % | | | 78 | % | |
Notes to Financial Highlights
(a) For the period from September 1, 2009 to December 31, 2009. During the period, the Fund's fiscal year end was changed from August 31 to December 31.
(b) Rounds to less than $0.01.
(c) Total return includes a reimbursement of a loss experienced by the Fund due to a compliance violation. The reimbursement had an impact of less than 0.01% on total return.
(d) In addition to the fees and expenses which the Fund bears directly, the Fund indirectly bears a pro rata share of the fees and expenses of the acquired funds in which it invests. Such indirect expenses are not included in the reported expense ratios.
(e) Includes interest expense which rounds to less than 0.01%.
(f) Annualized.
(g) Total net expenses include the impact of certain waivers/reimbursements made by the Investment Manager and certain of its affiliates, if applicable.
(h) The benefits derived from expense reductions had an impact of less than 0.01%.
The accompanying Notes to Financial Statements are an integral part of this statement.
Annual Report 2012
16
Columbia Real Estate Equity Fund
Financial Highlights (continued)
| | | Year Ended December 31, | | Year Ended August 31, | |
Class B | | 2012 | | 2011 | | 2010 | | 2009(a) | | 2009 | | 2008 | |
Per share data | |
Net asset value, beginning of period | | $ | 12.71 | | | $ | 12.43 | | | $ | 10.09 | | | $ | 9.12 | | | $ | 13.85 | | | $ | 20.76 | | |
Income from investment operations: | |
Net investment income | | | 0.10 | | | | 0.08 | | | | 0.02 | | | | 0.04 | | | | 0.16 | | | | 0.20 | | |
Net realized and unrealized gain (loss) | | | 1.94 | | | | 0.58 | | | | 2.50 | | | | 1.10 | | | | (4.46 | ) | | | (1.14 | ) | |
Total from investment operations | | | 2.04 | | | | 0.66 | | | | 2.52 | | | | 1.14 | | | | (4.30 | ) | | | (0.94 | ) | |
Less distributions to shareholders: | |
Net investment income | | | (0.11 | ) | | | (0.09 | ) | | | (0.18 | ) | | | (0.09 | ) | | | (0.26 | ) | | | (0.07 | ) | |
Net realized gains | | | (0.26 | ) | | | (0.32 | ) | | | — | | | | — | | | | — | | | | (5.90 | ) | |
Tax return of capital | | | — | | | | — | | | | — | | | | (0.08 | ) | | | (0.17 | ) | | | — | | |
Total distributions to shareholders | | | (0.37 | ) | | | (0.41 | ) | | | (0.18 | ) | | | (0.17 | ) | | | (0.43 | ) | | | (5.97 | ) | |
Proceeds from regulatory settlements | | | — | | | | — | | | | 0.00 | (b) | | | — | | | | — | | | | — | | |
Redemption fees: | |
Redemption fees added to paid-in capital | | | 0.00 | (b) | | | 0.03 | | | | — | | | | — | | | | — | | | | — | | |
Net asset value, end of period | | $ | 14.38 | | | $ | 12.71 | | | $ | 12.43 | | | $ | 10.09 | | | $ | 9.12 | | | $ | 13.85 | | |
Total return | | | 16.10 | % | | | 5.76 | % | | | 25.07 | %(c) | | | 12.57 | % | | | (30.38 | %) | | | (6.21 | %) | |
Ratios to average net assets(d) | |
Total gross expenses | | | 2.05 | %(e) | | | 2.02 | % | | | 2.02 | %(e) | | | 2.14 | %(f) | | | 2.06 | % | | | 2.03 | %(e) | |
Total net expenses(g) | | | 2.05 | %(e)(h) | | | 2.01 | %(h) | | | 2.02 | %(e)(h) | | | 2.14 | %(f)(h) | | | 2.06 | %(h) | | | 2.03 | %(e)(h) | |
Net investment income | | | 0.68 | % | | | 0.61 | % | | | 0.21 | % | | | 1.22 | %(f) | | | 1.96 | % | | | 1.30 | % | |
Supplemental data | |
Net assets, end of period (in thousands) | | $ | 5,341 | | | $ | 7,274 | | | $ | 2,986 | | | $ | 3,348 | | | $ | 3,356 | | | $ | 7,123 | | |
Portfolio turnover | | | 65 | % | | | 72 | % | | | 108 | % | | | 32 | % | | | 110 | % | | | 78 | % | |
Notes to Financial Highlights
(a) For the period from September 1, 2009 to December 31, 2009. During the period, the Fund's fiscal year end was changed from August 31 to December 31.
(b) Rounds to less than $0.01.
(c) Total return includes a reimbursement of a loss experienced by the Fund due to a compliance violation. The reimbursement had an impact of less than 0.01% on total return.
(d) In addition to the fees and expenses which the Fund bears directly, the Fund indirectly bears a pro rata share of the fees and expenses of the acquired funds in which it invests. Such indirect expenses are not included in the reported expense ratios.
(e) Includes interest expense which rounds to less than 0.01%.
(f) Annualized.
(g) Total net expenses include the impact of certain waivers/reimbursements made by the Investment Manager and certain of its affiliates, if applicable.
(h) The benefits derived from expense reductions had an impact of less than 0.01%.
The accompanying Notes to Financial Statements are an integral part of this statement.
Annual Report 2012
17
Columbia Real Estate Equity Fund
Financial Highlights (continued)
| | | Year Ended December 31, | | Year Ended August 31, | |
Class C | | 2012 | | 2011 | | 2010 | | 2009(a) | | 2009 | | 2008 | |
Per share data | |
Net asset value, beginning of period | | $ | 12.68 | | | $ | 12.40 | | | $ | 10.07 | | | $ | 9.10 | | | $ | 13.82 | | | $ | 20.72 | | |
Income from investment operations: | |
Net investment income | | | 0.10 | | | | 0.08 | | | | 0.03 | | | | 0.04 | | | | 0.16 | | | | 0.19 | | |
Net realized and unrealized gain (loss) | | | 1.93 | | | | 0.59 | | | | 2.48 | | | | 1.10 | | | | (4.45 | ) | | | (1.12 | ) | |
Total from investment operations | | | 2.03 | | | | 0.67 | | | | 2.51 | | | | 1.14 | | | | (4.29 | ) | | | (0.93 | ) | |
Less distributions to shareholders: | |
Net investment income | | | (0.11 | ) | | | (0.09 | ) | | | (0.18 | ) | | | (0.09 | ) | | | (0.26 | ) | | | (0.07 | ) | |
Net realized gains | | | (0.26 | ) | | | (0.32 | ) | | | — | | | | — | | | | — | | | | (5.90 | ) | |
Tax return of capital | | | — | | | | — | | | | — | | | | (0.08 | ) | | | (0.17 | ) | | | — | | |
Total distributions to shareholders | | | (0.37 | ) | | | (0.41 | ) | | | (0.18 | ) | | | (0.17 | ) | | | (0.43 | ) | | | (5.97 | ) | |
Proceeds from regulatory settlements | | | — | | | | — | | | | 0.00 | (b) | | | — | | | | — | | | | — | | |
Redemption fees: | |
Redemption fees added to paid-in capital | | | 0.00 | (b) | | | 0.02 | | | | — | | | | — | | | | — | | | | — | | |
Net asset value, end of period | | $ | 14.34 | | | $ | 12.68 | | | $ | 12.40 | | | $ | 10.07 | | | $ | 9.10 | | | $ | 13.82 | | |
Total return | | | 16.06 | % | | | 5.77 | % | | | 25.02 | %(c) | | | 12.60 | % | | | (30.37 | %) | | | (6.18 | %) | |
Ratios to average net assets(d) | |
Total gross expenses | | | 2.06 | %(e) | | | 2.01 | % | | | 2.02 | %(e) | | | 2.14 | %(f) | | | 2.06 | % | | | 2.03 | %(e) | |
Total net expenses(g) | | | 2.05 | %(e)(h) | | | 2.00 | %(h) | | | 2.02 | %(e)(h) | | | 2.14 | %(f)(h) | | | 2.06 | %(h) | | | 2.03 | %(e)(h) | |
Net investment income | | | 0.72 | % | | | 0.67 | % | | | 0.28 | % | | | 1.37 | %(f) | | | 1.95 | % | | | 1.26 | % | |
Supplemental data | |
Net assets, end of period (in thousands) | | $ | 21,001 | | | $ | 19,802 | | | $ | 6,900 | | | $ | 4,777 | | | $ | 3,553 | | | $ | 6,462 | | |
Portfolio turnover | | | 65 | % | | | 72 | % | | | 108 | % | | | 32 | % | | | 110 | % | | | 78 | % | |
Notes to Financial Highlights
(a) For the period from September 1, 2009 to December 31, 2009. During the period, the Fund's fiscal year end was changed from August 31 to December 31.
(b) Rounds to less than $0.01.
(c) Total return includes a reimbursement of a loss experienced by the Fund due to a compliance violation. The reimbursement had an impact of less than 0.01% on total return.
(d) In addition to the fees and expenses which the Fund bears directly, the Fund indirectly bears a pro rata share of the fees and expenses of the acquired funds in which it invests. Such indirect expenses are not included in the reported expense ratios.
(e) Includes interest expense which rounds to less than 0.01%.
(f) Annualized.
(g) Total net expenses include the impact of certain waivers/reimbursements made by the Investment Manager and certain of its affiliates, if applicable.
(h) The benefits derived from expense reductions had an impact of less than 0.01%.
The accompanying Notes to Financial Statements are an integral part of this statement.
Annual Report 2012
18
Columbia Real Estate Equity Fund
Financial Highlights (continued)
| | | Year Ended December 31, | |
Class I | | 2012 | | 2011 | | 2010(a) | |
Per share data | |
Net asset value, beginning of period | | $ | 12.72 | | | $ | 12.42 | | | $ | 11.77 | | |
Income from investment operations: | |
Net investment income | | | 0.27 | | | | 0.21 | | | | 0.07 | | |
Net realized and unrealized gain | | | 1.93 | | | | 0.62 | | | | 0.70 | | |
Total from investment operations | | | 2.20 | | | | 0.83 | | | | 0.77 | | |
Less distributions to shareholders: | |
Net investment income | | | (0.27 | ) | | | (0.24 | ) | | | (0.12 | ) | |
Net realized gains | | | (0.26 | ) | | | (0.32 | ) | | | — | | |
Total distributions to shareholders | | | (0.53 | ) | | | (0.56 | ) | | | (0.12 | ) | |
Redemption fees: | |
Redemption fees added to paid-in capital | | | 0.00 | (b) | | | 0.03 | | | | — | | |
Net asset value, end of period | | $ | 14.39 | | | $ | 12.72 | | | $ | 12.42 | | |
Total return | | | 17.48 | % | | | 7.19 | % | | | 6.52 | %(c) | |
Ratios to average net assets(d) | |
Total gross expenses | | | 0.84 | %(e) | | | 0.80 | % | | | 0.96 | %(e)(f) | |
Total net expenses(g) | | | 0.84 | %(e) | | | 0.80 | %(h) | | | 0.96 | %(e)(f)(h) | |
Net investment income | | | 1.95 | % | | | 1.65 | % | | | 2.34 | %(f) | |
Supplemental data | |
Net assets, end of period (in thousands) | | $ | 70,213 | | | $ | 68,508 | | | $ | 35,388 | | |
Portfolio turnover | | | 65 | % | | | 72 | % | | | 108 | % | |
Notes to Financial Highlights
(a) For the period from September 27, 2010 (commencement of operations) to December 31, 2010.
(b) Rounds to less than $0.01.
(c) Total return includes a reimbursement of a loss experienced by the Fund due to a compliance violation. The reimbursement had an impact of less than 0.01% on total return.
(d) In addition to the fees and expenses which the Fund bears directly, the Fund indirectly bears a pro rata share of the fees and expenses of the acquired funds in which it invests. Such indirect expenses are not included in the reported expense ratios.
(e) Includes interest expense which rounds to less than 0.01%.
(f) Annualized.
(g) Total net expenses include the impact of certain waivers/reimbursements made by the Investment Manager and certain of its affiliates, if applicable.
(h) The benefits derived from expense reductions had an impact of less than 0.01%.
The accompanying Notes to Financial Statements are an integral part of this statement.
Annual Report 2012
19
Columbia Real Estate Equity Fund
Financial Highlights (continued)
| | | Year Ended December 31, | |
Class K(a) | | 2012 | | 2011(b) | |
Per share data | |
Net asset value, beginning of period | | $ | 12.72 | | | $ | 12.73 | | |
Income from investment operations: | |
Net investment income | | | 0.23 | | | | 0.18 | | |
Net realized and unrealized gain | | | 1.93 | | | | 0.31 | | |
Total from investment operations | | | 2.16 | | | | 0.49 | | |
Less distributions to shareholders: | |
Net investment income | | | (0.24 | ) | | | (0.20 | ) | |
Net realized gains | | | (0.26 | ) | | | (0.32 | ) | |
Total distributions to shareholders | | | (0.50 | ) | | | (0.52 | ) | |
Redemption fees: | |
Redemption fees added to paid-in capital | | | 0.00 | (c) | | | 0.02 | | |
Net asset value, end of period | | $ | 14.38 | | | $ | 12.72 | | |
Total return | | | 17.09 | % | | | 4.24 | % | |
Ratios to average net assets(d) | |
Total gross expenses | | | 1.13 | %(e) | | | 1.12 | %(f) | |
Total net expenses(g) | | | 1.13 | %(e) | | | 1.12 | %(f)(h) | |
Net investment income | | | 1.64 | % | | | 1.66 | %(f) | |
Supplemental data | |
Net assets, end of period (in thousands) | | $ | 74 | | | $ | 75 | | |
Portfolio turnover | | | 65 | % | | | 72 | % | |
Notes to Financial Highlights
(a) Effective October 25, 2012, Class R4 shares were renamed Class K shares.
(b) For the period from March 7, 2011 (commencement of operations) to December 31, 2011.
(c) Rounds to less than $0.01.
(d) In addition to the fees and expenses which the Fund bears directly, the Fund indirectly bears a pro rata share of the fees and expenses of the acquired funds in which it invests. Such indirect expenses are not included in the reported expense ratios.
(e) Includes interest expense which rounds to less than 0.01%.
(f) Annualized.
(g) Total net expenses include the impact of certain waivers/reimbursements made by the Investment Manager and certain of its affiliates, if applicable.
(h) The benefits derived from expense reductions had an impact of less than 0.01%.
The accompanying Notes to Financial Statements are an integral part of this statement.
Annual Report 2012
20
Columbia Real Estate Equity Fund
Financial Highlights (continued)
| | | Year Ended December 31, | |
Class R | | 2012 | | 2011 | | 2010(a) | |
Per share data | |
Net asset value, beginning of period | | $ | 12.67 | | | $ | 12.40 | | | $ | 11.75 | | |
Income from investment operations: | |
Net investment income (loss) | | | 0.17 | | | | 0.16 | | | | (0.07 | ) | |
Net realized and unrealized gain | | | 1.94 | | | | 0.56 | | | | 0.82 | | |
Total from investment operations | | | 2.11 | | | | 0.72 | | | | 0.75 | | |
Less distributions to shareholders: | |
Net investment income | | | (0.18 | ) | | | (0.16 | ) | | | (0.10 | ) | |
Net realized gains | | | (0.26 | ) | | | (0.32 | ) | | | — | | |
Total distributions to shareholders | | | (0.44 | ) | | | (0.48 | ) | | | (0.10 | ) | |
Redemption fees: | |
Redemption fees added to paid-in capital | | | 0.00 | (b) | | | 0.03 | | | | — | | |
Net asset value, end of period | | $ | 14.34 | | | $ | 12.67 | | | $ | 12.40 | | |
Total return | | | 16.74 | % | | | 6.25 | % | | | 6.36 | %(c) | |
Ratios to average net assets(d) | |
Total gross expenses | | | 1.55 | %(e) | | | 1.51 | % | | | 1.76 | %(e)(f) | |
Total net expenses(g) | | | 1.55 | %(e)(h) | | | 1.49 | %(h) | | | 1.76 | %(e)(f)(h) | |
Net investment income (loss) | | | 1.20 | % | | | 1.29 | % | | | (2.20 | %)(f) | |
Supplemental data | |
Net assets, end of period (in thousands) | | $ | 6,131 | | | $ | 6,004 | | | $ | 3 | | |
Portfolio turnover | | | 65 | % | | | 72 | % | | | 108 | % | |
Notes to Financial Highlights
(a) For the period from September 27, 2010 (commencement of operations) to December 31, 2010.
(b) Rounds to less than $0.01.
(c) Total return includes a reimbursement of a loss experienced by the Fund due to a compliance violation. The reimbursement had an impact of less than 0.01% on total return.
(d) In addition to the fees and expenses which the Fund bears directly, the Fund indirectly bears a pro rata share of the fees and expenses of the acquired funds in which it invests. Such indirect expenses are not included in the reported expense ratios.
(e) Includes interest expense which rounds to less than 0.01%.
(f) Annualized.
(g) Total net expenses include the impact of certain waivers/reimbursements made by the Investment Manager and certain of its affiliates, if applicable.
(h) The benefits derived from expense reductions had an impact of less than 0.01%.
The accompanying Notes to Financial Statements are an integral part of this statement.
Annual Report 2012
21
Columbia Real Estate Equity Fund
Financial Highlights (continued)
Class R4 | | Year Ended
December 31,
2012(a) | |
Per share data | |
Net asset value, beginning of period | | $ | 14.28 | | |
Income from investment operations: | |
Net investment income | | | (0.00 | )(b) | |
Net realized and unrealized gain | | | 0.58 | | |
Total from investment operations | | | 0.58 | | |
Less distributions to shareholders: | |
Net investment income | | | (0.04 | ) | |
Net realized gains | | | (0.26 | ) | |
Total distributions to shareholders | | | (0.30 | ) | |
Net asset value, end of period | | $ | 14.56 | | |
Total return | | | 4.08 | % | |
Ratios to average net assets(c) | |
Total gross expenses | | | 1.07 | %(d)(e) | |
Total net expenses(f) | | | 1.07 | %(d)(e) | |
Net investment income | | | (0.01 | %)(e) | |
Supplemental data | |
Net assets, end of period (in thousands) | | $ | 3 | | |
Portfolio turnover | | | 65 | % | |
Notes to Financial Highlights
(a) For the period from November 8, 2012 (commencement of operations) to December 31, 2012.
(b) Rounds to less than $0.01.
(c) In addition to the fees and expenses which the Fund bears directly, the Fund indirectly bears a pro rata share of the fees and expenses of the acquired funds in which it invests. Such indirect expenses are not included in the reported expense ratios.
(d) Includes interest expense which rounds to less than 0.01%.
(e) Annualized.
(f) Total net expenses include the impact of certain waivers/reimbursements made by the Investment Manager and certain of its affiliates, if applicable.
The accompanying Notes to Financial Statements are an integral part of this statement.
Annual Report 2012
22
Columbia Real Estate Equity Fund
Financial Highlights (continued)
| | | Year Ended December 31, | |
Class R5 | | 2012 | | 2011(a) | |
Per share data | |
Net asset value, beginning of period | | $ | 12.71 | | | $ | 12.73 | | |
Income from investment operations: | |
Net investment income | | | 0.21 | | | | 0.21 | | |
Net realized and unrealized gain | | | 1.96 | | | | 0.31 | | |
Total from investment operations | | | 2.17 | | | | 0.52 | | |
Less distributions to shareholders: | |
Net investment income | | | (0.27 | ) | | | (0.24 | ) | |
Net realized gains | | | (0.26 | ) | | | (0.32 | ) | |
Total distributions to shareholders | | | (0.53 | ) | | | (0.56 | ) | |
Redemption fees: | |
Redemption fees added to paid-in capital | | | 0.00 | (b) | | | 0.02 | | |
Net asset value, end of period | | $ | 14.35 | | | $ | 12.71 | | |
Total return | | | 17.24 | % | | | 4.47 | % | |
Ratios to average net assets(c) | |
Total gross expenses | | | 0.84 | %(d) | | | 0.79 | %(e) | |
Total net expenses(f) | | | 0.84 | %(d) | | | 0.79 | %(e)(g) | |
Net investment income | | | 1.52 | % | | | 1.99 | %(e) | |
Supplemental data | |
Net assets, end of period (in thousands) | | $ | 37 | | | $ | 3,463 | | |
Portfolio turnover | | | 65 | % | | | 72 | % | |
Notes to Financial Highlights
(a) For the period from March 7, 2011 (commencement of operations) to December 31, 2011.
(b) Rounds to less than $0.01.
(c) In addition to the fees and expenses which the Fund bears directly, the Fund indirectly bears a pro rata share of the fees and expenses of the acquired funds in which it invests. Such indirect expenses are not included in the reported expense ratios.
(d) Includes interest expense which rounds to less than 0.01%.
(e) Annualized.
(f) Total net expenses include the impact of certain waivers/reimbursements made by the Investment Manager and certain of its affiliates, if applicable.
(g) The benefits derived from expense reductions had an impact of less than 0.01%.
The accompanying Notes to Financial Statements are an integral part of this statement.
Annual Report 2012
23
Columbia Real Estate Equity Fund
Financial Highlights (continued)
| | | Year Ended December 31, | |
Class W | | 2012 | | 2011 | | 2010(a) | |
Per share data | |
Net asset value, beginning of period | | $ | 12.69 | | | $ | 12.41 | | | $ | 11.75 | | |
Income from investment operations: | |
Net investment income (loss) | | | 0.24 | | | | 0.18 | | | | (0.05 | ) | |
Net realized and unrealized gain | | | 1.90 | | | | 0.59 | | | | 0.81 | | |
Total from investment operations | | | 2.14 | | | | 0.77 | | | | 0.76 | | |
Less distributions to shareholders: | |
Net investment income | | | (0.21 | ) | | | (0.19 | ) | | | (0.10 | ) | |
Net realized gains | | | (0.26 | ) | | | (0.32 | ) | | | — | | |
Total distributions to shareholders | | | (0.47 | ) | | | (0.51 | ) | | | (0.10 | ) | |
Redemption fees: | |
Redemption fees added to paid-in capital | | | 0.00 | (b) | | | 0.02 | | | | — | | |
Net asset value, end of period | | $ | 14.36 | | | $ | 12.69 | | | $ | 12.41 | | |
Total return | | | 17.00 | % | | | 6.58 | % | | | 6.51 | %(c) | |
Ratios to average net assets(d) | |
Total gross expenses | | | 1.32 | %(e) | | | 1.27 | % | | | 1.22 | %(e)(f) | |
Total net expenses(g) | | | 1.31 | %(e)(h) | | | 1.24 | %(h) | | | 1.22 | %(e)(f)(h) | |
Net investment income (loss) | | | 1.69 | % | | | 1.41 | % | | | (1.64 | %)(f) | |
Supplemental data | |
Net assets, end of period (in thousands) | | $ | 9,432 | | | $ | 6 | | | $ | 3 | | |
Portfolio turnover | | | 65 | % | | | 72 | % | | | 108 | % | |
Notes to Financial Highlights
(a) For the period from September 27, 2010 (commencement of operations) to December 31, 2010.
(b) Rounds to less than $0.01.
(c) Total return includes a reimbursement of a loss experienced by the Fund due to a compliance violation. The reimbursement had an impact of less than 0.01% on total return.
(d) In addition to the fees and expenses which the Fund bears directly, the Fund indirectly bears a pro rata share of the fees and expenses of the acquired funds in which it invests. Such indirect expenses are not included in the reported expense ratios.
(e) Includes interest expense which rounds to less than 0.01%.
(f) Annualized.
(g) Total net expenses include the impact of certain waivers/reimbursements made by the Investment Manager and certain of its affiliates, if applicable.
(h) The benefits derived from expense reductions had an impact of less than 0.01%.
The accompanying Notes to Financial Statements are an integral part of this statement.
Annual Report 2012
24
Columbia Real Estate Equity Fund
Financial Highlights (continued)
| | | Year Ended December 31, | | Year Ended August 31, | |
Class Z | | 2012 | | 2011 | | 2010 | | 2009(a) | | 2009 | | 2008 | |
Per share data | |
Net asset value, beginning of period | | $ | 12.70 | | | $ | 12.43 | | | $ | 10.09 | | | $ | 9.13 | | | $ | 13.88 | | | $ | 20.74 | | |
Income from investment operations: | |
Net investment income | | | 0.25 | | | | 0.19 | | | | 0.14 | | | | 0.07 | | | | 0.24 | | | | 0.33 | | |
Net realized and unrealized gain (loss) | | | 1.93 | | | | 0.60 | | | | 2.49 | | | | 1.10 | | | | (4.47 | ) | | | (1.10 | ) | |
Total from investment operations | | | 2.18 | | | | 0.79 | | | | 2.63 | | | | 1.17 | | | | (4.23 | ) | | | (0.77 | ) | |
Less distributions to shareholders: | |
Net investment income | | | (0.25 | ) | | | (0.22 | ) | | | (0.29 | ) | | | (0.13 | ) | | | (0.35 | ) | | | (0.19 | ) | |
Net realized gains | | | (0.26 | ) | | | (0.32 | ) | | | — | | | | — | | | | — | | | | (5.90 | ) | |
Tax return of capital | | | — | | | | — | | | | — | | | | (0.08 | ) | | | (0.17 | ) | | | — | | |
Total distributions to shareholders | | | (0.51 | ) | | | (0.54 | ) | | | (0.29 | ) | | | (0.21 | ) | | | (0.52 | ) | | | (6.09 | ) | |
Proceeds from regulatory settlements | | | — | | | | — | | | | 0.00 | (b) | | | — | | | | — | | | | — | | |
Redemption fees: | |
Redemption fees added to paid-in capital | | | 0.00 | (b) | | | 0.02 | | | | — | | | | — | | | | — | | | | — | | |
Net asset value, end of period | | $ | 14.37 | | | $ | 12.70 | | | $ | 12.43 | | | $ | 10.09 | | | $ | 9.13 | | | $ | 13.88 | | |
Total return | | | 17.28 | % | | | 6.73 | % | | | 26.29 | %(c) | | | 12.97 | % | | | (29.71 | %) | | | (5.21 | %) | |
Ratios to average net assets(d) | |
Total gross expenses | | | 1.06 | %(e) | | | 1.03 | % | | | 1.02 | %(e) | | | 1.14 | %(f) | | | 1.06 | % | | | 1.03 | %(e) | |
Total net expenses(g) | | | 1.05 | %(e)(h) | | | 1.01 | %(h) | | | 1.02 | %(e)(h) | | | 1.14 | %(f)(h) | | | 1.06 | %(h) | | | 1.03 | %(e)(h) | |
Net investment income | | | 1.76 | % | | | 1.52 | % | | | 1.23 | % | | | 2.28 | %(f) | | | 2.96 | % | | | 2.17 | % | |
Supplemental data | |
Net assets, end of period (in thousands) | | $ | 384,007 | | | $ | 303,881 | | | $ | 304,497 | | | $ | 273,528 | | | $ | 238,485 | | | $ | 282,293 | | |
Portfolio turnover | | | 65 | % | | | 72 | % | | | 108 | % | | | 32 | % | | | 110 | % | | | 78 | % | |
Notes to Financial Highlights
(a) For the period from September 1, 2009 to December 31, 2009. During the period, the Fund's fiscal year end was changed from August 31 to December 31.
(b) Rounds to less than $0.01.
(c) Total return includes a reimbursement of a loss experienced by the Fund due to a compliance violation. The reimbursement had an impact of less than 0.01% on total return.
(d) In addition to the fees and expenses which the Fund bears directly, the Fund indirectly bears a pro rata share of the fees and expenses of the acquired funds in which it invests. Such indirect expenses are not included in the reported expense ratios.
(e) Includes interest expense which rounds to less than 0.01%.
(f) Annualized.
(g) Total net expenses include the impact of certain waivers/reimbursements made by the Investment Manager and certain of its affiliates, if applicable.
(h) The benefits derived from expense reductions had an impact of less than 0.01%.
The accompanying Notes to Financial Statements are an integral part of this statement.
Annual Report 2012
25
Columbia Real Estate Equity Fund
Notes to Financial Statements
December 31, 2012
Note 1. Organization
Columbia Real Estate Equity Fund (the Fund), a series of Columbia Funds Series Trust I (the Trust), is a non-diversified fund. The Trust is registered under the Investment Company Act of 1940, as amended (the 1940 Act), as an open-end management investment company organized as a Massachusetts business trust.
Fund Shares
The Trust may issue an unlimited number of shares (without par value). The Fund offers Class A, Class B, Class C, Class I, Class K, Class R, Class R4, Class R5, Class W and Class Z shares. All share classes have identical voting, dividend and liquidation rights. Each share class has its own expense structure and sales charges, as applicable.
Class A shares are subject to a maximum front-end sales charge of 5.75% based on the initial investment amount. Class A shares purchased without an initial sales charge in accounts aggregating $1 million to $50 million at the time of purchase are subject to a contingent deferred sales charge (CDSC) if the shares are sold within 18 months of purchase, charged as follows: 1.00% CDSC if redeemed within 12 months of purchase, and 0.50% CDSC if redeemed more than 12, but less than 18, months after purchase.
Class B shares may be subject to a maximum CDSC of 5.00% based upon the holding period after purchase. Class B shares will generally convert to Class A shares eight years after purchase. The Fund no longer accepts investments by new or existing investors in the Fund's Class B shares, except in connection with the reinvestment of any dividend and/or capital gain distributions in Class B shares of the Fund and exchanges by existing Class B shareholders of certain other funds within the Columbia Family of Funds.
Class C shares are subject to a 1.00% CDSC on shares redeemed within one year of purchase.
Class I shares are not subject to sales charges and are only available to the Columbia Family of Funds.
Class K shares (formerly Class R4 shares) are not subject to sales charges; however, this share class is closed to new investors. Effective October 25, 2012, Class R4 shares were renamed Class K shares.
Class R shares are not subject to sales charges and are only available to qualifying institutional investors.
Class R4 shares are not subject to sales charges and are only available to investors purchasing through authorized investment professionals. Class R4 shares commenced operations on November 8, 2012.
Class R5 shares are not subject to sales charges. Effective November 8, 2012, Class R5 shares are only available to investors purchasing through authorized investment professionals. Prior to November 8, 2012, Class R5 shares were closed to new investors.
Class W shares are not subject to sales charges and are only available to investors purchasing through authorized investment programs managed by investment professionals, including discretionary managed account programs.
Class Z shares are not subject to sales charges, and are only available to certain investors.
Note 2. Summary of Significant Accounting Policies
Use of Estimates
The preparation of financial statements in accordance with U.S. generally accepted accounting principles (GAAP) requires management to make certain estimates and assumptions that affect the reported amounts of assets and liabilities, the disclosure of contingent assets and liabilities at the date of the financial statements and the reported amounts of revenue and expenses during the reporting period. Actual results could differ from those estimates.
The following is a summary of significant accounting policies consistently followed by the Fund in the preparation of its financial statements.
Security Valuation
All equity securities are valued at the close of business of the New York Stock Exchange (NYSE). Equity securities are valued at the last quoted sales price on the principal exchange or market on which they trade, except for securities traded on the NASDAQ Stock Market, which are valued at the NASDAQ official close price. Unlisted securities or listed securities for which there were no sales during the day are valued at the mean of the latest quoted bid and ask prices on such exchanges or markets.
Debt securities generally are valued by pricing services approved by the Board of Trustees (the Board) based upon market transactions for normal, institutional-size trading units of similar securities. The services may use various pricing techniques which take into account appropriate factors such as yield, quality, coupon rate, maturity, type of issue, trading characteristics and other data, as well as broker quotes. Debt securities for which quotations are readily available may also be valued based upon an over-the-counter or exchange bid quotation.
Annual Report 2012
26
Columbia Real Estate Equity Fund
Notes to Financial Statements (continued)
December 31, 2012
Investments in other open-end investment companies, including money market funds, are valued at net asset value.
Short-term securities purchased within 60 days to maturity are valued at amortized cost, which approximates market value. The value of short-term securities originally purchased with maturities greater than 60 days is determined based on an amortized value to par upon reaching 60 days to maturity. Short-term securities maturing in more than 60 days from the valuation date are valued at the market price or approximate market value based on current interest rates.
Option contracts are valued at the mean of the latest quoted bid and asked prices on their primary exchanges. Option contracts, including over-the-counter (OTC) option contracts, with no readily available market value are valued using quotations obtained from independent brokers as of the close of the NYSE.
Investments for which market quotations are not readily available, or that have quotations which management believes are not reliable, are valued at fair value as determined in good faith under consistently applied procedures established by and under the general supervision of the Board. If a security or class of securities (such as foreign securities) is valued at fair value, such value is likely to be different from the last quoted market price for the security.
The determination of fair value often requires significant judgment. To determine fair value, management may use assumptions including but not limited to future cash flows and estimated risk premiums. Multiple inputs from various sources may be used to determine fair value.
Derivative Instruments
The Fund invests in certain derivative instruments, as detailed below, to meet its investment objectives. Derivatives are instruments whose values depend on, or are derived from, in whole or in part, the value of one or more other assets, such as securities, currencies, commodities or indices. Derivative instruments may be used to maintain cash reserves while maintaining exposure to certain other assets, to offset anticipated declines in values of investments, to facilitate trading, to reduce transaction costs and to pursue higher investment returns. The Fund may also use derivative instruments to mitigate certain investment risks, such as foreign currency exchange rate risk, interest rate risk and credit risk. Derivatives may involve various risks, including the potential inability of the counterparty to fulfill its obligation under the terms of the contract, the potential for an illiquid secondary market and the potential for market movements which may expose the Fund to gains or losses in excess of the amount shown in the Statement of Assets and Liabilities.
The Fund and any counterparty are required to maintain an agreement that requires the Fund and that counterparty to monitor (on a daily basis) the net fair value of all derivatives entered into pursuant to the agreement between the Fund and such counterparty. If the net fair value of such derivatives between the Fund and that counterparty exceeds a certain threshold (as defined in the agreement), the Fund or the counterparty (as the case may be) is required to post cash and/or securities as collateral. Fair values of derivatives presented in the financial statements are not netted with the fair value of other derivatives or with any collateral amounts posted by the Fund or any counterparty.
Options Contracts
Options are contracts which entitle the holder to purchase or sell securities or other identified assets at a specified price, or in the case of index option contracts, to receive or pay the difference between the index value and the strike price of the index option contract. The Fund wrote covered call options to produce incremental income, consistent with the Fund's principal investment strategies and policies. Completion of transactions for option contracts traded in the OTC market depends upon the performance of the other party. Cash collateral may be collected or posted by the Fund to secure certain OTC option contract trades. Cash collateral held or posted by the Fund for such option contract trades must be returned to the counterparty or the Fund upon closure, exercise or expiration of the contract.
Option contracts purchased are recorded as investments and options contracts written are recorded as liabilities of the Fund. The Fund will realize a gain or loss when the option contract expires. When option contracts are exercised, the proceeds on sales for a written call or purchased put option contract, or the purchase cost for a written put or purchased call option contract, is adjusted by the amount of premium received or paid.
The risk in buying an option contract is that the Fund pays a premium whether or not the option contract is exercised. The Fund also has the additional risk of being unable to enter into a closing transaction if a liquid secondary market does not exist. The risk in writing a call option contract is that the Fund gives up the opportunity for profit if the market price of the security increases. The risk in writing a put option contract is that the Fund may incur a loss if the market price of the security decreases and the option contract is exercised. The Fund's maximum payout in the case of written put option contracts represents the maximum potential amount of future payments (undiscounted) that the Fund could be required to make under the contract. For OTC options contracts, the transaction is also subject to counterparty credit risk. The
Annual Report 2012
27
Columbia Real Estate Equity Fund
Notes to Financial Statements (continued)
December 31, 2012
maximum payout amount may be offset by the subsequent sale, if any, of assets obtained upon the exercise of the put option contracts by holders of the option contracts or proceeds received upon entering into the contracts.
Contracts and premiums associated with options contracts written for the year ended December 31, 2012 are as follows:
| | | Calls | |
| | | Contracts | | Premiums | |
Balance at December 31, 2011 | | | — | | | $ | — | | |
Opened | | | 420 | | | | 12,780 | | |
Closed | | | — | | | | — | | |
Expired | | | (420 | ) | | | (12,780 | ) | |
Balance at December 31, 2012 | | | — | | | $ | — | | |
Effects of Derivative Transactions in the Financial Statements
The following tables are intended to provide additional information about the effect of derivatives on the financial statements of the Fund, including: the fair value of derivatives by risk category and the location of those fair values in the Statement of Assets and Liabilities; the impact of derivative transactions on the Fund's operations over the period including realized gains or losses and unrealized gains or losses. The derivative schedules following the Portfolio of Investments present additional information regarding derivative instruments outstanding at the end of the period, if any.
At December 31, 2012, the fund had no outstanding derivatives.
The effect of derivative instruments in the Statement of Operations for the year ended December 31, 2012:
Amount of Realized Gain (Loss) on Derivatives Recognized in Income | |
Risk Exposure
Category | | Call Options
Contracts
Written | | Total | |
Equity contracts | | $ | 12,780 | | | $ | 12,780 | | |
Total | | $ | 12,780 | | | $ | 12,780 | | |
The following table is a summary of the volume of derivative instruments for the year ended December 31, 2012:
Derivative Instrument | | Contracts Opened | |
Options contracts | | | 420 | | |
Repurchase Agreements
The Fund may engage in repurchase agreement transactions with institutions that management has determined are creditworthy. The Fund, through the custodian, receives delivery of the underlying securities collateralizing a repurchase agreement. Management is responsible for
determining that the collateral is at least equal, at all times, to the value of the repurchase obligation including interest. A repurchase agreement transaction involves certain risks in the event of default or insolvency of the counterparty. These risks include possible delays in or restrictions on the Fund's ability to dispose of the underlying securities and a possible decline in the value of the underlying securities during the period while the Fund seeks to assert its rights.
Security Transactions
Security transactions are accounted for on the trade date. Cost is determined and gains (losses) are based upon the specific identification method for both financial statement and federal income tax purposes.
Income Recognition
Interest income is recorded on an accrual basis.
The Fund may receive distributions from holdings in business development companies (BDCs), exchange traded funds (ETFs) and real estate investment trusts (REITs), which report information on the character of their distributions annually. These distributions are allocated to dividend income, capital gain and return of capital based on estimates made by the Fund's management if actual information has not yet been reported. Return of capital is recorded as a reduction of the cost basis of securities held. If the Fund no longer owns the applicable securities, return of capital is recorded as realized gain. Management's estimates are subsequently adjusted when the actual character of the distributions is disclosed by the BDCs, ETFs and REITs, which could result in a proportionate change in return of capital to shareholders.
Expenses
General expenses of the Trust are allocated to the Fund and other funds of the Trust based upon relative net assets or other expense allocation methodologies determined by the nature of the expense. Expenses directly attributable to the Fund are charged to the Fund. Expenses directly attributable to a specific class of shares are charged to that share class.
Determination of Class Net Asset Value
All income, expenses (other than class-specific expenses, which are charged to that share class, as shown in the Statement of Operations) and realized and unrealized gains (losses) are allocated to each class of the Fund on a daily basis, based on the relative net assets of each class, for purposes of determining the net asset value of each class.
Federal Income Tax Status
The Fund intends to qualify each year as a regulated investment company under Subchapter M of the Internal Revenue Code, as amended, and will distribute substantially
Annual Report 2012
28
Columbia Real Estate Equity Fund
Notes to Financial Statements (continued)
December 31, 2012
all of its tax exempt and taxable income (including net short-term capital gains), if any, for its tax year, and as such will not be subject to federal income taxes. In addition, the Fund intends to distribute in each calendar year substantially all of its net investment income, capital gains and certain other amounts, if any, such that the Fund should not be subject to federal excise tax. Therefore, no federal income or excise tax provision is recorded.
Distributions to Shareholders
Distributions from net investment income, if any, are declared and paid each calendar quarter. Net realized capital gains, if any, are distributed at least annually. Income distributions and capital gain distributions are determined in accordance with federal income tax regulations, which may differ from GAAP.
Guarantees and Indemnifications
Under the Trust's organizational documents and, in some cases, by contract, its officers and trustees are indemnified against certain liabilities arising out of the performance of their duties to the Trust or its funds. In addition, certain of the Fund's contracts with its service providers contain general indemnification clauses. The Fund's maximum exposure under these arrangements is unknown since the amount of any future claims that may be made against the Fund cannot be determined, and the Fund has no historical basis for predicting the likelihood of any such claims.
Recent Accounting Pronouncement
Disclosures about Offsetting Assets and Liabilities
In December 2011, the Financial Accounting Standards Board (FASB) issued Accounting Standards Update (ASU) No. 2011-11, Disclosures about Offsetting Assets and Liabilities. The objective of the FASB is to enhance current disclosure requirements on offsetting of certain assets and liabilities and to enable financial statement users to compare financial statements prepared under GAAP and International Financial Reporting Standards.
Specifically, ASU No. 2011-11 requires an entity to disclose both gross and net information for derivatives and other financial instruments that are subject to a master netting arrangement or similar agreement. The standard requires disclosure of collateral received in connection with the master netting agreements or similar agreements. The effective date of ASU No. 2011-11 is for interim and annual periods beginning on or after January 1, 2013. At this time, management is evaluating the implications of this guidance and the impact it will have on the financial statement amounts and footnote disclosures, if any.
Note 3. Fees and Compensation Paid to Affiliates
Investment Management Fees
Under an Investment Management Services Agreement, Columbia Management Investment Advisers, LLC (the Investment Manager), a wholly-owned subsidiary of Ameriprise Financial, Inc. (Ameriprise Financial), determines which securities will be purchased, held or sold. The investment management fee is an annual fee that is equal to a percentage of the Fund's average daily net assets that declines from 0.69% to 0.62% as the Fund's net assets increase. The effective investment management fee rate for the year ended December 31, 2012 was 0.69% of the Fund's average daily net assets.
Administration Fees
Under an Administrative Services Agreement, the Investment Manager also serves as the Fund Administrator. The Fund pays the Fund Administrator an annual fee for administration and accounting services equal to a percentage of the Fund's average daily net assets that declines from 0.06% to 0.04% as the Fund's net assets increase. The effective administration fee rate for the year ended December 31, 2012 was 0.06% of the Fund's average daily net assets.
Compensation of Board Members
Board members are compensated for their services to the Fund as disclosed in the Statement of Operations. The Trust's eligible Trustees may participate in a Deferred Compensation Plan (the Plan) which may be terminated at any time. Obligations of the Plan will be paid solely out of the Fund's assets.
Compensation of Chief Compliance Officer
The Board has appointed a Chief Compliance Officer to the Fund in accordance with federal securities regulations. The Fund pays its pro-rata share of the expenses associated with the Chief Compliance Officer. The Fund's expenses for the Chief Compliance Officer will not exceed $15,000 per year.
Transfer Agent Fees
Under a Transfer and Dividend Disbursing Agent Agreement, Columbia Management Investment Services Corp. (the Transfer Agent), an affiliate of the Investment Manager and a wholly-owned subsidiary of Ameriprise Financial, is responsible for providing transfer agency services to the Fund. The Transfer Agent has contracted with Boston Financial Data Services (BFDS) to serve as sub-transfer agent.
The Transfer Agent receives monthly account-based service fees based on the number of open accounts and is reimbursed
Annual Report 2012
29
Columbia Real Estate Equity Fund
Notes to Financial Statements (continued)
December 31, 2012
by the Fund for the fees and expenses the Transfer Agent pays to financial intermediaries that maintain omnibus accounts with the Fund that is a percentage of the average aggregate value of the Fund's shares maintained in each such omnibus account (other than omnibus accounts for which American Enterprise Investment Services Inc. is the broker of record or accounts where the beneficial shareholder is a customer of Ameriprise Financial Services, Inc., which are paid a per account fee). The Transfer Agent pays the fees of BFDS for services as sub-transfer agent and is not entitled to reimbursement for such fees from the Fund (with the exception of out-of-pocket fees).
The Transfer Agent also receives compensation from fees for various shareholder services and reimbursements for certain out-of-pocket fees. Class I shares do not pay transfer agent fees. Total transfer agent fees for Class K and Class R5 shares are subject to an annual limitation of not more than 0.05% of the average daily net assets attributable to each share class.
For the year ended December 31, 2012, the Fund's effective transfer agent fee rates as a percentage of average daily net assets of each class were as follows:
Class A | | | 0.22 | % | |
Class B | | | 0.22 | | |
Class C | | | 0.22 | | |
Class K | | | 0.04 | | |
Class R | | | 0.22 | | |
Class R4 | | | 0.17 | | |
Class R5 | | | 0.01 | | |
Class W | | | 0.22 | | |
Class Z | | | 0.22 | | |
An annual minimum account balance fee of $20 may apply to certain accounts with a value below the Fund's initial minimum investment requirements to reduce the impact of small accounts on transfer agent fees. These minimum account balance fees are recorded as part of expense reductions in the Statement of Operations. For the year ended December 31, 2012, these minimum account balance fees reduced total expenses by $3,713.
The Fund and certain other associated investment companies, have severally, but not jointly, guaranteed the performance and observance of all the terms and conditions of a lease entered into by Seligman Data Corp. (SDC), the former transfer agent, including the payment of rent by SDC (the Guaranty). The lease and the Guaranty expire in January 2019. At December 31, 2012, the Fund's total potential future obligation over the life of the Guaranty is $35,654. The liability remaining at December 31, 2012 for non-recurring charges associated with the lease amounted to $19,259 and is
recorded as a part of payable for other expenses in the Statement of Assets and Liabilities.
Plan Administration Fees
Under a Plan Administration Services Agreement with the Transfer Agent, the Fund pays an annual fee at a rate of 0.25% of the Fund's average daily net assets attributable to Class K shares for the provision of various administrative, recordkeeping, communication and educational services.
Distribution and Service Fees
The Fund has an agreement with Columbia Management Investment Distributors, Inc. (the Distributor), an affiliate of the Investment Manager and a wholly-owned subsidiary of Ameriprise Financial, for distribution and shareholder services. Pursuant to Rule 12b-1 under the 1940 Act, the Board has approved, and the Fund has adopted, distribution and shareholder service plans (the Plans) which set the distribution and service fees for the Fund. These fees are calculated daily and are intended to compensate the Distributor and/or eligible selling and/or servicing agents for selling shares of the Fund and providing services to investors.
The Plans require the payment of a monthly service fee to the Distributor at the maximum annual rate of 0.25% of the average daily net assets attributable to Class A, Class B, Class C and Class W shares of the Fund. The Plans also require the payment of a monthly distribution fee to the Distributor at the maximum annual rates of 0.10%, 0.75%, 0.75%, 0.50% and 0.25% of the average daily net assets attributable to Class A, Class B, Class C, Class R and Class W shares, respectively.
The Fund may pay distribution and service fees up to a maximum annual rate of 0.35% of the Fund's average daily net assets attributable to Class A shares (comprised of up to 0.10% for distribution services and up to 0.25% for shareholder liaison services), but currently limit such fees to an aggregate fee of not more than 0.25% of the Fund's average daily net assets attributable to Class A shares.
The Fund may pay a distribution fee up to 0.25% of the Fund's average daily net assets attributable to Class W shares and a service fee of up to 0.25% of the Fund's average daily net assets attributable to Class W shares, provided, however, that the aggregate fee shall not exceed 0.25% of the Fund's average daily net assets attributable to Class W shares.
Sales Charges
Sales charges, including front-end charges and CDSCs, received by the Distributor for distributing Fund shares were $151,515 for Class A, $3,035 for Class B and $608 for Class C shares for the year ended December 31, 2012.
Annual Report 2012
30
Columbia Real Estate Equity Fund
Notes to Financial Statements (continued)
December 31, 2012
Expenses Waived/Reimbursed by the Investment Manager and its Affiliates
Effective May 1, 2012, the Investment Manager and certain of its affiliates have contractually agreed to waive fees and/or reimburse expenses (excluding certain fees and expenses described below), through April 30, 2013, unless sooner terminated at the sole discretion of the Board, so that the Fund's net operating expenses, after giving effect to fees waived/expenses reimbursed and any balance credits and/or overdraft charges from the Fund's custodian, do not exceed the following annual rates as a percentage of the class' average daily net assets:
Class A | | | 1.38 | % | |
Class B | | | 2.13 | | |
Class C | | | 2.13 | | |
Class I | | | 0.97 | | |
Class K | | | 1.27 | | |
Class R | | | 1.63 | | |
Class R4* | | | 1.13 | | |
Class R5 | | | 1.02 | | |
Class W | | | 1.38 | | |
Class Z | | | 1.13 | | |
*Annual rate is contractual from November 8, 2012 (the commencement of operations of Class R4 shares) through November 8, 2013.
Prior to May 1, 2012, the Investment Manager and certain of its affiliates contractually agreed to waive fees and/or reimburse expenses (excluding certain fees and expenses described below), so that the Fund's net operating expenses, after giving effect to fees waived/expenses reimbursed and any balance credits and/or overdraft charges from the Fund's custodian, did not exceed the following annual rates as a percentage of the class' average daily net assets:
Class A | | | 1.26 | % | |
Class B | | | 2.01 | | |
Class C | | | 2.01 | | |
Class I | | | 0.90 | | |
Class K | | | 1.20 | | |
Class R | | | 1.51 | | |
Class R5 | | | 0.95 | | |
Class W | | | 1.26 | | |
Class Z | | | 1.01 | | |
Under the agreement governing these fee waivers and/or expense reimbursement arrangements, the following fees and
expenses are excluded from the waiver/reimbursement commitment, and therefore will be paid by the Fund, if applicable: taxes (including foreign transaction taxes), expenses associated with investments in affiliated and non-affiliated pooled investment vehicles (including mutual funds and exchange traded funds), transaction costs and brokerage commissions, costs related to any securities lending program, dividend expenses associated with securities sold short, inverse floater program fees and expenses, transaction charges and interest on borrowed money, interest, extraordinary expenses and any other expenses the exclusion of which is specifically approved by the Board. This agreement may be modified or amended only with approval from all parties.
Note 4. Federal Tax Information
The timing and character of income and capital gain distributions are determined in accordance with income tax regulations, which may differ from GAAP because of temporary or permanent book to tax differences.
At December 31, 2012, these differences are primarily due to differing treatment for capital loss carryforwards, deferral/reversal of wash sale losses, Trustees' deferred compensation, distribution reclassifications, foreign currency transactions, and re-characterization of distributions from investments. To the extent these differences are permanent, reclassifications are made among the components of the Fund's net assets in the Statement of Assets and Liabilities. Temporary differences do not require reclassifications. In the Statement of Assets and Liabilities the following reclassifications were made:
Excess of distributions over net investment income | | $ | 198,562 | | |
Accumulated net realized loss | | | 96,912 | | |
Paid-in capital | | | (295,474 | ) | |
Net investment income and net realized gains (losses), as disclosed in the Statement of Operations, and net assets were not affected by this reclassification.
The tax character of distributions paid during the years indicated was as follows:
Year Ended December 31, | | 2012 | | 2011 | |
Ordinary income | | $ | 9,725,123 | | | $ | 9,131,986 | | |
Long-term capital gains | | | 10,665,732 | | | | 12,853,060 | | |
Total | | $ | 20,390,855 | | | $ | 21,985,046 | | |
Short-term capital gain distributions, if any, are considered ordinary income distributions for tax purposes.
Annual Report 2012
31
Columbia Real Estate Equity Fund
Notes to Financial Statements (continued)
December 31, 2012
At December 31, 2012, the components of distributable earnings on a tax basis were as follows:
Undistributed accumulated long-term gain | | $ | 3,717,327 | | |
Accumulated realized loss | | | (43,062,452 | ) | |
Unrealized appreciation | | | 143,598,288 | | |
At December 31, 2012, the cost of investments for federal income tax purposes was $462,960,341 and the aggregate gross unrealized appreciation and depreciation based on that cost was:
Unrealized appreciation | | $ | 144,465,846 | | |
Unrealized depreciation | | | (867,558 | ) | |
Net unrealized appreciation | | $ | 143,598,288 | | |
The following capital loss carryforward, determined at December 31, 2012, may be available to reduce taxable income arising from future net realized gains on investments, if any, to the extent permitted by the Internal Revenue Code:
Year of Expiration | | Amount | |
2015 | | $ | 21,403,060 | | |
2016 | | | 10,496,317 | | |
2017 | | | 11,163,075 | | |
Total | | $ | 43,062,452 | | |
For the year ended December 31, 2012, $20,239,680 of capital loss carryforward was utilized.
Management of the Fund has concluded that there are no significant uncertain tax positions that would require recognition in the financial statements. However, management's conclusion may be subject to review and adjustment at a later date based on factors including, but not limited to, new tax laws, regulations, and administrative interpretations (including relevant court decisions). Generally, the Fund's federal tax returns for the prior three fiscal years remain subject to examination by the Internal Revenue Service.
Note 5. Portfolio Information
The cost of purchases and proceeds from sales of securities, excluding short-term obligations, aggregated to $390,669,403 and $365,670,263, respectively, for the year ended December 31, 2012.
Note 6. Redemption Fees
The Fund assessed a 2.00% redemption fee on the proceeds from fund shares only to shareholders who received their Class Z shares pursuant to the reorganization of RiverSource LaSalle International Real Estate Fund (see Note 11. Fund Merger) and only if such shareholders redeemed such shares (by sale or exchange) on or before April 11, 2012.
The redemption fee is designed to offset brokerage commissions and other costs associated with short term trading of fund shares. The redemption fee, which is retained by the Fund, is accounted for as an addition to paid-in capital. Redemption fees received by the Fund for the years ended December 31, 2012 and December 31, 2011 are disclosed in the Statement of Changes in Net Assets.
Note 7. Lending of Portfolio Securities
Effective December 31, 2012, the Fund no longer participates in securities lending activity. Prior to that date, the Fund had entered into a Master Securities Lending Agreement (the Agreement) with JPMorgan Chase Bank, N.A. (JPMorgan). The Agreement authorized JPMorgan as lending agent to lend securities to authorized borrowers in order to generate additional income on behalf of the Fund. Pursuant to the Agreement, the securities loaned were secured by cash or securities that either were issued or guaranteed as to principal and interest by the U.S. government, its agencies, authorities or instrumentalities with value equal to at least 100% of the market value of the loaned securities. Any additional collateral required to maintain those levels due to market fluctuations of the loaned securities was requested to be delivered the following business day. Cash collateral received was invested by the lending agent on behalf of the Fund into authorized investments pursuant to the Agreement.
Pursuant to the Agreement, the Fund received income for lending its securities either in the form of fees or by earning interest on invested cash collateral, net of negotiated rebates paid to borrowers and fees paid to the lending agent for services provided and any other securities lending expenses. Net income earned from securities lending for the year ended December 31, 2012 is disclosed in the Statement of Operations. The Fund continued to earn and accrue interest and dividends on the securities loaned. At December 31, 2012, the Fund did not have any securities on loan.
Note 8. Affiliated Money Market Fund
The Fund invests its daily cash balances in Columbia Short-Term Cash Fund, an affiliated money market fund established for the exclusive use by the Fund and other affiliated funds. The income earned by the Fund from such investments is included as "Dividends — affiliated issuers" in the Statement of Operations. As an investing fund, the Fund indirectly bears its proportionate share of the expenses of Columbia Short-Term Cash Fund.
Annual Report 2012
32
Columbia Real Estate Equity Fund
Notes to Financial Statements (continued)
December 31, 2012
Note 9. Shareholder Concentration
At December 31, 2012, two unaffiliated shareholder accounts owned an aggregate of 41.5% of the outstanding shares of the Fund. The Fund has no knowledge about whether any portion of those shares was owned beneficially by such accounts. Affiliated shareholder accounts owned 11.5% of the outstanding shares of the Fund. Subscription and redemption activity by concentrated accounts may have a significant effect on the operations of the Fund.
Note 10. Line of Credit
The Fund has entered into a revolving credit facility with a syndicate of banks led by JPMorgan whereby the Fund may borrow for the temporary funding of shareholder redemptions or for other temporary or emergency purposes. The credit facility agreement, as amended, which is a collective agreement between the Fund and certain other funds managed by the Investment Manager, severally and not jointly, permits collective borrowings up to $500 million. Interest is charged to each participating fund based on its borrowings at a rate equal to the higher of (i) the overnight federal funds rate plus 1.00% or (ii) the one-month LIBOR rate plus 1.00%. Each borrowing under the credit facility matures no later than 60 days after the date of borrowing. The Fund also pays a commitment fee equal to its pro rata share of the amount of the credit facility at a rate of 0.08% per annum.
For the year ended December 31, 2012, the average daily loan balance outstanding on days when borrowing existed was $6,700,000 at a weighted average interest rate of 1.21%.
Note 11. Fund Merger
At the close of business on April 8, 2011, Columbia Real Estate Equity Fund acquired the assets and assumed the identified liabilities of RiverSource LaSalle Monthly Dividend Real Estate Fund, RiverSource Real Estate Fund, RiverSource LaSalle Global Real Estate Fund, and RiverSource LaSalle International Real Estate Fund. The mergers were completed after shareholders of the acquired funds approved the plan on February 15, 2011.
The aggregate net assets of Columbia Real Estate Equity Fund immediately before the acquisitions were $376,118,171 and the combined net assets immediately after the acquisitions were $737,998,908. The acquisitions were accomplished by a tax-free exchange of 6,732,469 shares of RiverSource LaSalle Monthly Dividend Real Estate Fund valued at $32,200,020 (including unrealized appreciation of $10,826,277); 19,288,542 shares of RiverSource Real Estate Fund valued at
$217,100,607 (including unrealized appreciation of $26,920,212); 3,559,733 shares of RiverSource LaSalle Global Real Estate Fund valued at $14,932,477 (including unrealized appreciation of $2,556,790) and 9,613,304 shares of RiverSource LaSalle International Real Estate Fund valued at $97,647,633 (including unrealized appreciation of $9,524,654).
In exchange for shares of RiverSource LaSalle Monthly Dividend Real Estate Fund, RiverSource Real Estate Fund, RiverSource LaSalle Global Real Estate Fund and RiverSource LaSalle International Real Estate Fund, Columbia Real Estate Equity Fund issued the following number of shares:
| | | RiverSource
LaSalle
Monthly
Dividend
Real Estate
Fund | | RiverSource
Real Estate
Fund | | RiverSource
LaSalle
Global
Real Estate
Fund | | RiverSource
LaSalle
International
Real Estate
Fund | |
Class A | | | 766,429 | | | | 4,843,064 | | | | 278,297 | | | | — | | |
Class B | | | 165,212 | | | | 478,774 | | | | — | | | | — | | |
Class C | | | 811,623 | | | | 149,525 | | | | 156,995 | | | | — | | |
Class I | | | 181,168 | | | | 11,523,095 | | | | 590,956 | | | | — | | |
Class K | | | 1,955 | | | | 2,808 | | | | 760 | | | | — | | |
Class R | | | 456,117 | | | | — | | | | 16,355 | | | | — | | |
Class R5 | | | 141,132 | | | | — | | | | 125,893 | | | | — | | |
Class W | | | — | | | | 241 | | | | — | | | | — | | |
Class Z | | | — | | | | — | | | | — | | | | 7,642,501 | | |
For financial reporting purposes, net assets received and shares issued by Columbia Real Estate Equity Fund were recorded at fair value; however, RiverSource LaSalle Monthly Dividend Real Estate Fund, RiverSource Real Estate Fund, RiverSource LaSalle Global Real Estate Fund, and RiverSource LaSalle International Real Estate Fund's cost of investments were carried forward.
The financial statements reflect the operations of Columbia Real Estate Equity Fund for the period prior to the mergers and the combined fund for the period subsequent to the mergers. Because the combined investment portfolios have been managed as a single integrated portfolio since the mergers were completed, it is not practicable to separate the amounts of revenue and earnings of RiverSource LaSalle Monthly Dividend Real Estate Fund, RiverSource Real Estate Fund, RiverSource LaSalle Global Real Estate Fund, and RiverSource LaSalle International Real Estate Fund that have been included in the combined Fund's Statement of Operations since the mergers were completed.
Assuming the mergers had been completed on January 1, 2011, Columbia Real Estate Equity Fund's pro-forma net
Annual Report 2012
33
Columbia Real Estate Equity Fund
Notes to Financial Statements (continued)
December 31, 2012
investment income, net gain on investments, net change in unrealized depreciation and net increase in net assets from operations for the year ended December 31, 2011 would have been $14.1 million, $46.6 million, $(14.7) million and $46.0 million, respectively.
Note 12. Significant Risks
Non-Diversification Risk
A non-diversified fund is permitted to invest a greater percentage of its total assets in fewer issuers than a diversified fund. The Fund may, therefore, have a greater risk of loss from a few issuers than a similar fund that invests more broadly.
Real Estate Sector Risk
The risks associated with the ownership of real estate and the real estate industry in general can include fluctuations in the value of the properties underlying the Fund's portfolio holdings, defaults by borrowers or tenants, market saturation, decreases in market rates for rents, and other economic, political, or regulatory occurrences affecting the real estate industry, including REITs.
REITs depend upon specialized management skills, may have limited financial resources, may have less trading volume, and may be subject to more abrupt or erratic price movements than the overall securities markets. REITs are also subject to the risk of failing to qualify for tax-free pass-through of income. Some REITs (especially mortgage REITs) are affected by risks similar to those associated with investments in debt securities including changes in interest rates and the quality of credit extended.
Note 13. Subsequent Events
Management has evaluated the events and transactions that have occurred through the date the financial statements were issued and noted no items requiring adjustment of the financial statements or additional disclosure.
Note 14. Information Regarding Pending and Settled Legal Proceedings
In December 2005, without admitting or denying the allegations, American Express Financial Corporation (AEFC, which is now known as Ameriprise Financial, Inc. (Ameriprise Financial)) entered into settlement agreements with the Securities and Exchange Commission (SEC) and Minnesota Department of Commerce (MDOC) related to market timing activities. As a result, AEFC was censured and ordered to cease and desist from committing or causing any violations of certain provisions of the Investment Advisers Act of 1940, the Investment Company Act of 1940, and various Minnesota laws. AEFC agreed to pay disgorgement of $10 million and civil money penalties of $7 million. AEFC also agreed to retain an
independent distribution consultant to assist in developing a plan for distribution of all disgorgement and civil penalties ordered by the SEC in accordance with various undertakings detailed at www.sec.gov/litigation/admin/ia-2451.pdf. Ameriprise Financial and its affiliates have cooperated with the SEC and the MDOC in these legal proceedings, and have made regular reports to the funds' Boards of Trustees.
Ameriprise Financial and certain of its affiliates have historically been involved in a number of legal, arbitration and regulatory proceedings, including routine litigation, class actions, and governmental actions, concerning matters arising in connection with the conduct of their business activities. Ameriprise Financial believes that the Funds are not currently the subject of, and that neither Ameriprise Financial nor any of its affiliates are the subject of, any pending legal, arbitration or regulatory proceedings that are likely to have a material adverse effect on the Funds or the ability of Ameriprise Financial or its affiliates to perform under their contracts with the Funds. Ameriprise Financial is required to make 10-Q, 10-K and, as necessary, 8-K filings with the Securities and Exchange Commission on legal and regulatory matters that relate to Ameriprise Financial and its affiliates. Copies of these filings may be obtained by accessing the SEC website at www.sec.gov.
There can be no assurance that these matters, or the adverse publicity associated with them, will not result in increased fund redemptions, reduced sale of fund shares or other adverse consequences to the Funds. Further, although we believe proceedings are not likely to have a material adverse effect on the Funds or the ability of Ameriprise Financial or its affiliates to perform under their contracts with the Funds, these proceedings are subject to uncertainties and, as such, we are unable to estimate the possible loss or range of loss that may result. An adverse outcome in one or more of these proceedings could result in adverse judgments, settlements, fines, penalties or other relief that could have a material adverse effect on the consolidated financial condition or results of operations of Ameriprise Financial.
Annual Report 2012
34
Columbia Real Estate Equity Fund
Report of Independent Registered Public Accounting Firm
To the Trustees of Columbia Funds Series Trust I and
the Shareholders of Columbia Real Estate Equity Fund
In our opinion, the accompanying statement of assets and liabilities, including the portfolio of investments, and the related statements of operations and of changes in net assets and the financial highlights present fairly, in all material respects, the financial position of Columbia Real Estate Equity Fund (the "Fund") (a series of Columbia Funds Series Trust I) at December 31, 2012, the results of its operations, the changes in its net assets, and the financial highlights for each of the periods indicated, in conformity with accounting principles generally accepted in the United States of America. These financial statements and financial highlights (hereafter referred to as "financial statements") are the responsibility of the Fund's management. Our responsibility is to express an opinion on these financial statements based on our audit. We conducted our audit of these financial statements in accordance with the standards of the Public Company Accounting Oversight Board (United States). Those standards require that we plan and perform the audit to obtain reasonable assurance about whether the financial statements are free of material misstatement. An audit includes examining, on a test basis, evidence supporting the amounts and disclosures in the financial statements, assessing the accounting principles used and significant estimates made by management, and evaluating the overall financial statement presentation. We believe that our audits, which included confirmation of securities at December 31, 2012 by correspondence with the custodian, transfer agent and brokers, provides a reasonable basis for our opinion.
PricewaterhouseCoopers LLP
Minneapolis, Minnesota
February 21, 2013
Annual Report 2012
35
Columbia Real Estate Equity Fund
Federal Income Tax Information
(Unaudited)
The Fund hereby designates the following tax attributes for the fiscal year ended December 31, 2012. Shareholders will be notified in early 2013 of the amounts for use in preparing 2012 income tax returns.
Tax Designations:
| Qualified Dividend Income | | | 1.76 | % | |
| Dividends Received Deduction | | | 1.35 | % | |
| Capital Gain Dividend | | $ | 15,102,210 | | |
Qualified Dividend Income. For taxable, non-corporate shareholders, the percentage of ordinary income dividends paid during the fiscal year that represents qualified dividend income subject to reduced tax rates under the Jobs and Growth Tax Relief Reconciliation Act of 2003.
Dividend Received Deduction. The percentage of ordinary income dividends paid during the fiscal year that qualifies for the corporate dividend received deduction.
Capital Gain Dividend. The Fund designates as a capital gain dividend the amount reflected above, or if subsequently determined to be different, the net capital gain of such fiscal period. The Fund also designates as capital gain dividends, to the extent necessary to fully distribute such capital gains, earnings and profits distributed to shareholders on the redemption of shares.
Annual Report 2012
36
Columbia Real Estate Equity Fund
The Trustees serve terms of indefinite duration. The names, addresses and birth years of the Trustees and Officers of the Funds in Columbia Funds Series Trust I, the year each was first elected or appointed to office, their principal business occupations during at least the last five years, the number of Funds overseen by each Trustee and other directorships they hold are shown below. Each officer listed below serves as an officer of each Fund in Columbia Funds Series Trust I.
Independent Trustees
Name, Address and Year of Birth,
Position with Funds, Year First
Elected or Appointed to Office | | Principal Occupation(s) During Past Five Years, Number of Funds in Columbia
Funds Complex Overseen by Trustee, Other Directorships Held
| |
Rodman L. Drake (Born 1943)
c/o Columbia Management Investment Advisers, LLC
225 Franklin Street
Boston, MA 02110
Trustee (since 1994) and
Chairman of the Board (since 2009) | | Independent consultant since 2010; Co-Founder of Baringo Capital LLC (private equity) from 1997 to 2008; CEO of Crystal River Capital, Inc. (real estate investment trust) from 2003 to 2010; Oversees 52; Jackson Hewitt Tax Service Inc. (tax preparation services from 2004 to 2011); Celgene Corporation (global biotechnology company); Student Loan Corporation (student loan provider from 2005 to 2010); Celgene Corporation (global biotechnology company); The Helios Funds and Brookfield Funds (closed-end funds); Crystal River Capital, Inc. from 2005 to 2010; Parsons Brinckerhoff from 1995 to 2008; and Apex Silver Mines Ltd. from 2007 to 2009 | |
Douglas A. Hacker (Born 1955)
c/o Columbia Management Investment Advisers, LLC
225 Franklin Street
Boston, MA 02110
Trustee (since 1996) | | Independent business executive since May 2006; Executive Vice President — Strategy of United Airlines from December 2002 to May 2006; President of UAL Loyalty Services (airline marketing company) from September 2001 to December 2002; Executive Vice President and Chief Financial Officer of United Airlines from July 1999 to September 2001. Oversees 52; Nash Finch Company (food distributor); Aircastle Limited (aircraft leasing); and SeaCube Container Leasing Ltd. (container leasing) | |
Janet Langford Kelly (Born 1957)
c/o Columbia Management Investment Advisers, LLC
225 Franklin Street
Boston, MA 02110
Trustee (since 1996) | | Senior Vice President, General Counsel and Corporate Secretary, ConocoPhillips (integrated energy company) since September 2007; Deputy General Counsel — Corporate Legal Services, ConocoPhillips from August 2006 to August 2007; Partner, Zelle, Hofmann, Voelbel, Mason & Gette LLP (law firm) from March 2005 to July 2006; Adjunct Professor of Law, Northwestern University from September 2004 to June 2006; Director, UAL Corporation (airline) from February 2006 to July 2006; Chief Administrative Officer and Senior Vice President, Kmart Holding Corporation (consumer goods) from September 2003 to March 2004. Oversees 52; None | |
Nancy T. Lukitsh (Born 1956)
c/o Columbia Management Investment Advisers, LLC
225 Franklin Street
Boston, MA 02110
Trustee (since 2011) | | Senior Vice President, Partner and Director of Marketing, Wellington Management Company, LLP (investment adviser) from 1997 to 2010; Chair, Wellington Management Investment Portfolios (commingled non-U.S. investment pools) from 2007 to 2010; Director, Wellington Trust Company, NA and other Wellington affiliates from 1997 to 2010. Oversees 52; None | |
William E. Mayer (Born 1940)
c/o Columbia Management Investment Advisers, LLC
225 Franklin Street
Boston, MA 02110
Trustee (since 1994) | | Partner, Park Avenue Equity Partners (private equity) since February 1999; Dean and Professor, College of Business and Management, University of Maryland from 1992 to 1996. Oversees 52; DynaVox Inc. (speech creation); Lee Enterprises (print media); WR Hambrecht + Co. (financial service provider) from 2000 to 2012; BlackRock Kelso Capital Corporation (investment company) | |
David M. Moffett (Born 1952)
c/o Columbia Management Investment Advisers, LLC
225 Franklin Street
Boston, MA 02110
Trustee (since 2011) | | Retired. Chief Executive Officer, Federal Home Loan Mortgage Corporation, from 2008 to 2009; Senior Adviser, Global Financial Services Group, Carlyle Group, Inc., from 2007 to 2008; Vice Chairman and Chief Financial Officer, U.S. Bancorp, from 1993 to 2007. Oversees 52; CIT Group Inc. (commercial and consumer finance); eBay Inc. (online trading community); MBIA Inc. (financial service provider); E.W. Scripps Co. (print and television media), Building Materials Holding Corp. (building materials and construction services); and University of Oklahoma Foundation. | |
Charles R. Nelson (Born 1942)
c/o Columbia Management Investment Advisers, LLC
225 Franklin Street
Boston, MA 02110
Trustee (since 1981) | | Retired Professor Emeritus, University of Washington, since 2011; Professor of Economics, University of Washington from January 1976 to 2011; Ford and Louisa Van Voorhis Professor of Political Economy, University of Washington from 1993 to 2011; Adjunct Professor of Statistics, University of Washington from 1980 to 2011; Associate Editor, Journal of Money Credit and Banking from 1993 to 2008; consultant on econometric and statistical matters. Oversees 52; None | |
John J. Neuhauser (Born 1943)
c/o Columbia Management Investment Advisers, LLC
225 Franklin Street
Boston, MA 02110
Trustee (since 1984) | | President, Saint Michael's College, since August 2007; Director or Trustee of several non-profit organizations, including Fletcher Allen Health Care, Inc.; University Professor, Boston College from November 2005 to August 2007; Academic Vice President and Dean of Faculties, Boston College from August 1999 to October 2005. Oversees 52; Liberty All-Star Equity Fund and Liberty All-Star Growth Fund (closed-end funds) | |
Annual Report 2012
37
Columbia Real Estate Equity Fund
Trustees and Officers (continued)
Independent Trustees (continued)
Name, Address and Year of Birth,
Position with Funds, Year First
Elected or Appointed to Office | | Principal Occupation(s) During Past Five Years, Number of Funds in Columbia
Funds Complex Overseen by Trustee, Other Directorships Held
| |
Patrick J. Simpson (Born 1944)
c/o Columbia Management Investment Advisers, LLC
225 Franklin Street
Boston, MA 02110
Trustee (since 2000) | | Partner, Perkins Coie LLP (law firm). Oversees 52; None | |
Anne-Lee Verville (Born 1945)
c/o Columbia Management Investment Advisers, LLC
225 Franklin Street
Boston, MA 02110
Trustee (since 1998) | | Retired. General Manager — Global Education Industry from 1994 to 1997, President — Application Systems Division from 1991 to 1994, Chief Financial Officer — US Marketing & Services from 1988 to 1991, and Chief Information Officer from 1987 to 1988, IBM Corporation (computer and technology). Oversees 52; Enesco Group, Inc. (producer of giftware and home and garden decor products) from 2001 to 2006 | |
Interested Trustee
Name, Address and Year of Birth,
Position with Funds, Year First
Elected or Appointed to Office | | Principal Occupation(s) During Past Five Years, Number of Funds in Columbia
Funds Complex Overseen by Trustee, Other Directorships Held
| |
William F. Truscott (born 1960)
53600 Ameriprise Financial Center
Minneapolis, MN 55474
Senior Vice President (since 2012) | | President, Columbia Management Investment Advisers, LLC since February 2012, (previously President, Chairman of the Board and Chief Investment Officer, 2001-April 2010); Chief Executive Officer, Global Asset Management, Ameriprise Financial, Inc. since September 2012 (previously Chief Executive Officer, U.S. Asset Management & President, Annuities, May 2010-September 2012 and President — U.S. Asset Management and Chief Investment Officer, 2005-April 2010); President and Chief Executive Officer, Ameriprise Certificate Company 2006-August 2012; Chief Executive Officer, Columbia Management Investment Distributors, Inc. since February 2012, (previously Chairman of the Board and Chief Executive Officer, 2006-April 2010); Chairman of the Board and Chief Executive Officer, RiverSource Distributors, Inc. since 2006. Oversees 208; Columbia Funds Board. | |
The Statement of Additional Information includes additional information about the Trustees of the Funds and is available, without charge, upon request by calling 1-800-345-6611.
The Board has appointed officers who are responsible for day-to-day business decisions based on policies it has established. The officers serve at the pleasure of the Board. In addition to Mr. Truscott, who is Senior Vice President, the Funds' other officers are:
Officers
Name, Year of Birth and Address | | Principal Occupation(s) During the Past Five Years | |
J. Kevin Connaughton (Born 1964)
225 Franklin Street
Boston, MA 02110
President (since 2009) | | Senior Vice President and General Manager — Mutual Fund Products, Columbia Management Investment Advisers, LLC since May 2010; President, Columbia Funds, since 2009, and RiverSource Funds, since May 2010 (previously Senior Vice President and Chief Financial Officer, Columbia Funds, from June 2008 to January 2009, Treasurer, Columbia Funds, from October 2003 to May 2008, and senior officer of various other affiliated funds since 2000); Managing Director, Columbia Management Advisors, LLC from December 2004 to April 2010. | |
Michael G. Clarke (Born 1969)
225 Franklin Street
Boston, MA 02110
Treasurer (since 2011) and Chief Financial Officer (since 2009) | | Vice President, Columbia Management Investment Advisers, LLC since May 2010; Managing Director of Fund Administration, Columbia Management Advisors, LLC, from September 2004 to April 2010; senior officer of Columbia Funds and affiliated funds since 2002. | |
Scott R. Plummer (Born 1959)
5228 Ameriprise Financial Center
Minneapolis, MN 55474
Senior Vice President, Assistant Secretary and Chief Legal Officer (since 2010) | | Senior Vice President, Chief Legal Officer and Assistant Secretary, Columbia Management Investment Advisers, LLC since June 2005; Vice President and Lead Chief Counsel — Asset Management, Ameriprise Financial, Inc. since May 2010 (previously Vice President and Chief Counsel — Asset Management, from 2005 to April 2010); Vice President, Chief Counsel and Assistant Secretary, Columbia Management Investment Distributors, Inc. since 2008; Vice President, General Counsel and Secretary, Ameriprise Certificate Company since 2005; Chief Counsel, RiverSource Distributors, Inc. since 2006; Vice President, General Counsel and Secretary, RiverSource Funds since December 2006; Senior Vice President, Secretary and Chief Legal Officer, Columbia Funds, since May 2010. | |
Annual Report 2012
38
Columbia Real Estate Equity Fund
Trustees and Officers (continued)
Officers (continued)
Name, Year of Birth and Address | | Principal Occupation(s) During the Past Five Years | |
Thomas P. McGuire (Born 1972)
225 Franklin Street
Boston, MA 02110
Chief Compliance Officer (since 2012) | | Vice President — Asset Management Compliance, Columbia Management Investment Advisers, LLC since 2010; Chief Compliance Officer, Ameriprise Certificate Company, since September 2010; Compliance Executive, Bank of America, 2005-2010. | |
Colin Moore (Born 1958)
225 Franklin Street
Boston, MA 02110
Senior Vice President (since 2010) | | Director and Chief Investment Officer, Columbia Management Investment Advisers, LLC since May 2010; Manager, Managing Director and Chief Investment Officer of Columbia Management Advisors, LLC from 2007 to April 2010; Head of Equities, Columbia Management Advisors, LLC from 2002 to 2007. | |
Amy Johnson (Born 1965)
5228 Ameriprise Financial Center
Minneapolis, MN 55474
Vice President (since 2010) | | Senior Vice President and Chief Operating Officer, Columbia Management Investment Advisers, LLC since May 2010 (previously Chief Administrative Officer, from 2009 until April 2010, Vice President — Asset Management and Trust Company Services, from 2006 to 2009, and Vice President — Operations and Compliance from 2004 to 2006). | |
Joseph F. DiMaria (Born 1968)
225 Franklin Street
Boston, MA 02110
Vice President (since 2011) and Chief Accounting Officer (since 2008) | | Vice President, Mutual Fund Administration, Columbia Management Investment Advisers, LLC, since May 2010; Director of Fund Administration, Columbia Management Advisors, LLC from January 2006 to April 2010; Head of Tax/Compliance and Assistant Treasurer, Columbia Management Advisors, LLC, from November 2004 to December 2005. | |
Stephen T. Welsh (born 1957)
225 Franklin Street
Boston, MA 02110
Vice President (since 2006) | | President and Director, Columbia Management Investment Services Corp. since May 2010; President and Director, Columbia Management Services, Inc. from July 2004 to April 2010; Managing Director, Columbia Management Distributors, Inc. from August 2007 to April 2010. | |
Paul D. Pearson (born 1956)
10468 Ameriprise Financial Center
Minneapolis, MN 55474
Vice President and Assistant Treasurer (since 2011) | | Vice President, Investment Accounting, Columbia Management Investment Advisers, LLC, since May 2010; Vice President, Managed Assets, Investment Accounting, Ameriprise Financial Corporation. | |
Paul B. Goucher (born 1968)
5228 Ameriprise Financial Center
Minneapolis, MN 55474
Vice President and Assistant Secretary (since 2010) | | Vice President and Lead Chief Counsel, Ameriprise Financial, Inc. since November 2008 and January 2013, respectively (formerly, Chief Counsel from January 2010-January 2013 and Group Counsel from November 2008-January 2010); Director, Managing Director and General Counsel, J. & W. Seligman & Co. Incorporated, July 2008-November 2008 (previously, Managing Director and Associate General Counsel, January 2005-July 2008) | |
Christopher O. Petersen (born 1970)
5228 Ameriprise Financial Center
Minneapolis, MN 55474
Vice President (since 2010) and Secretary (since 2011) | | Vice President and Chief Counsel, Ameriprise Financial since January 2010 (formerly Vice President and Group Counsel or Counsel from April 2004 to January 2010); Assistant Secretary of RiverSource Funds since January 2007; officer of Columbia Funds and affiliated funds since 2007. | |
Michael E. DeFao (born 1968)
225 Franklin Street
Boston, MA 02110
Vice President and Assistant Secretary (since 2011) | | Vice President and Chief Counsel, Ameriprise Financial since May 2010; Associate General Counsel, Bank of America from June 2005 to April 2010. | |
Annual Report 2012
39
This page intentionally left blank.
Annual Report 2012
40
Columbia Real Estate Equity Fund
Important Information About This Report
Each fund mails one shareholder report to each shareholder address. If you would like more than one report, please call shareholder services at 800.345.6611 and additional reports will be sent to you.
The policy of the Board is to vote the proxies of the companies in which each fund holds investments consistent with the procedures as stated in the Statement of Additional Information (SAI). You may obtain a copy of the SAI without charge by calling 800.345.6611; contacting your financial intermediary; visiting columbiamanagement.com; or searching the website of the Securities and Exchange Commission (SEC) at sec.gov. Information regarding how each fund voted proxies relating to portfolio securities is filed with the SEC by August 31 for the most recent 12-month period ending June 30 of that year, and is available without charge by visiting columbiamanagement.com; or searching the website of the SEC at sec.gov.
Each fund files a complete schedule of portfolio holdings with the SEC for the first and third quarters of each fiscal year on Form N-Q. Each fund's Form N-Q is available on the SEC's website at sec.gov and may be reviewed and copied at the SEC's Public Reference Room in Washington, D.C. Information on the operation of the Public Reference Room may be obtained by calling 800.SEC.0330. Each fund's complete schedule of portfolio holdings, as filed on Form N-Q, can also be obtained without charge, upon request, by calling 800.345.6611.
Annual Report 2012
41

Columbia Real Estate Equity Fund
P.O. Box 8081
Boston, MA 02266-8081
columbiamanagement.com
This information is for use with concurrent or prior delivery of a fund prospectus. Please read and consider the investment objectives, risks, charges and expenses for any fund carefully before investing. For a prospectus which contains this and other important information about the Fund go to columbiamanagement.com. The Fund is distributed by Columbia Management Investment Distributors, Inc., member FINRA, and managed by Columbia Management Investment Advisers, LLC.
© 2013 Columbia Management Investment Advisers, LLC. All rights reserved.
C-1441 D (3/13)
Item 2. Code of Ethics.
(a) The registrant has adopted a code of ethics that applies to the registrant’s principal executive officer, principal financial officer, principal accounting officer or controller, or persons performing similar functions, regardless of whether these individuals are employed by the registrant or a third party.
(b) During the period covered by this report, there were not any amendments to a provision of the code of ethics adopted in 2(a) above.
(c) During the period covered by this report, there were no waivers, including any implicit waivers, from a provision of the code of ethics described in 2(a) above that relates to one or more of the items set forth in paragraph (b) of this item’s instructions.
Item 3. Audit Committee Financial Expert.
The registrant’s Board of Trustees has determined that Douglas A. Hacker, David M. Moffett and Anne-Lee Verville, each of whom are members of the registrant’s Board of Trustees and Audit Committee, each qualify as an audit committee financial expert. Mr. Hacker, Mr. Moffett and Ms. Verville are each independent trustees, as defined in paragraph (a)(2) of this item’s instructions.
Item 4. Principal Accountant Fees and Services.
Fee information below is disclosed for the one series of the registrant whose report to stockholders is included in this annual filing.
(a) Audit Fees. Aggregate Audit Fees billed by the principal accountant for professional services rendered during the fiscal years ended December 31, 2012 and December 31, 2011 are approximately $23,300 and $29,300, respectively.
Audit Fees include amounts related to the audit of the registrant’s annual financial statements or services that are normally provided by the accountant in connection with statutory and regulatory filings or engagements for those fiscal years.
(b) Audit-Related Fees. Aggregate Audit-Related Fees billed to the registrant by the principal accountant for professional services rendered during the fiscal years ended December 31, 2012 and December 31, 2011 are approximately $400 and $9,100, respectively.
Audit-Related Fees include amounts for assurance and related services by the principal accountant that are reasonably related to the performance of the audit of the registrant’s financial statements and are not reported in Audit Fees above. In both fiscal years 2012 and 2011, Audit-Related Fees consist of agreed-upon procedures performed for semi-annual shareholder reports. Fiscal year 2011, also includes agreed-upon procedures related to fund mergers and for fund accounting and custody conversions.
During the fiscal years ended December 31, 2012 and December 31, 2011, there were no Audit-Related Fees billed by the registrant’s principal accountant to the registrant’s investment adviser (not including any sub-adviser whose role is primarily portfolio management and is subcontracted with or overseen by another investment adviser) and any entity controlling, controlled by, or under common control with the adviser that provides ongoing services to the registrant for an engagement that related directly to the operations and financial reporting of the registrant.
(c) Tax Fees. Aggregate Tax Fees billed by the principal accountant to the registrant for professional services rendered during the fiscal years ended December 31, 2012 and December 31, 2011 are approximately $6,500 and $6,900, respectively.
Tax Fees include amounts for the review of annual tax returns, the review of required shareholder distribution calculations and typically include amounts for professional services by the principal accountant for tax compliance, tax advice and tax planning.
During the fiscal years ended December 31, 2012 and December 31, 2011, there were no Tax Fees billed by the registrant’s principal accountant to the registrant’s investment adviser (not including any sub-adviser whose role is primarily portfolio management and is subcontracted with or overseen by another investment adviser) and any entity controlling, controlled by, or under common control with the adviser that provides ongoing services to the registrant for an engagement that related directly to the operations and financial reporting of the registrant.
(d) All Other Fees. There were no aggregate All Other Fees billed by the principal accountant to the registrant for professional services rendered during the fiscal years ended December 31, 2012 and December 31, 2011.
All Other Fees include amounts for products and services provided by the principal accountant, other than the services reported in paragraphs (a) through (c) above.
Aggregate All Other Fees billed by the registrant’s principal accountant to the registrant’s investment adviser (not including any sub-adviser whose role is primarily portfolio management and is subcontracted with or overseen by another investment adviser) and
any entity controlling, controlled by, or under common control with the adviser that provides ongoing services to the registrant for an engagement that related directly to the operations and financial reporting of the registrant during the fiscal years ended December 31, 2012 and December 31, 2011 are approximately $260,800 and $225,000, respectively.
In both fiscal years 2012 and 2011, All Other Fees consist of fees billed for internal control examinations of the registrant’s transfer agent and investment advisor.
(e)(1) Audit Committee Pre-Approval Policies and Procedures
The registrant’s Audit Committee is required to pre-approve the engagement of the registrant’s independent accountants to provide audit and non-audit services to the registrant and non-audit services to its investment adviser (not including any sub-adviser whose role is primarily portfolio management and is subcontracted with or overseen by another investment adviser) or any entity controlling, controlled by or under common control with such investment adviser that provides ongoing services to the registrant (“Adviser Affiliates”), if the engagement relates directly to the operations and financial reporting of the registrant.
The Audit Committee has adopted a Policy for Engagement of Independent Accountants for Audit and Non-Audit Services (“Policy”). The Policy sets forth the understanding of the Audit Committee regarding the engagement of the registrant’s independent accountants to provide (i) audit and permissible audit-related, tax and other services to the registrant (collectively “Fund Services”); (ii) non-audit services to the registrant’s investment adviser (not including any sub-adviser whose role is primarily portfolio management and is subcontracted with or overseen by another investment adviser) and Adviser Affiliates, if the engagement relates directly to the operations or financial reporting of a Fund (collectively “Fund-related Adviser Services”); and (iii) certain other audit and non-audit services to the registrant’s investment adviser (not including any sub-adviser whose role is primarily portfolio management and is subcontracted with or overseen by another investment adviser) and Adviser Affiliates. As set forth in this Fund Policy, a service will require specific pre-approval by the Audit Committee if it is to be provided by the Fund’s independent auditor; provided, however, that pre-approval of non-audit services to the Fund, the Adviser or Control Affiliates may be waived if certain de minimis requirements set forth in the SEC’s rules are met.
Under the Policy, the Audit Committee may delegate pre-approval authority to any pre-designated member or members who are Independent Trustees/Directors. The member(s) to whom such authority is delegated must report, for informational purposes only, any pre-approval decisions to the Audit Committee at its next regular meeting. The Audit Committee’s responsibilities with respect to the pre-approval of services performed by the independent accountants may not be delegated to management.
On an annual basis, at a regularly scheduled Audit Committee meeting, the Fund’s Treasurer or other Fund Officer shall submit to the Audit Committee a schedule of the
types of Fund Services and Fund-related Adviser Services that are subject to specific pre-approval.
This schedule will provide a description of each type of service that is subject to specific pre-approval, along with total projected fees for each service. The pre-approval will generally cover a one-year period. The Audit Committee will review and approve the types of services and the projected fees for the next one-year period and may add to, or subtract from, the list of pre-approved services from time to time, based on subsequent determinations. This specific approval acknowledges that the Audit Committee is in agreement with the types of services that the independent accountants will be permitted to perform.
The Fund’s Treasurer or other Fund Officer shall report to the Audit Committee at each of its regular meetings regarding all Fund Services or Fund-related Adviser Services initiated since the last such report was rendered, including a general description of the services with forecasted fees for the annual period, proposed changes requiring specific pre-approval and a description of services provided by the independent auditor with actual fees during the current reporting period.
*****
(e)(2) 100% of the services performed for items (b) through (d) above during 2012 and 2011 were pre-approved by the registrant’s Audit Committee.
(f) Not applicable.
(g) The aggregate non-audit fees billed by the registrant’s accountant for services rendered to the registrant, and rendered to the registrant’s investment adviser (not including any sub-adviser whose role is primarily portfolio management and is subcontracted with or overseen by another investment adviser), and any entity controlling, controlled by, or under common control with the adviser that provides ongoing services to the registrant for the fiscal years ended December 31, 2012 and December 31, 2011 are approximately $267,700 and $241,000, respectively.
(h) The registrant’s Audit Committee of the Board of Directors has considered whether the provision of non-audit services that were rendered to the registrant’s adviser (not including any sub-adviser whose role is primarily portfolio management and is subcontracted with or overseen by another investment adviser), and any entity controlling, controlled by, or under common control with the investment adviser that provides ongoing services to the registrant that were not pre-approved pursuant to paragraph (c)(7)(ii) of Rule 2-01 of Regulation S-X, is compatible with maintaining the principal accountant’s independence.
Item 5. Audit Committee of Listed Registrants.
Not applicable.
Item 6. Investments
(a) The registrant’s “Schedule I — Investments in securities of unaffiliated issuers” (as set forth in 17 CFR 210.12-12) is included in Item 1 of this Form N-CSR.
(b) Not applicable.
Item 7. Disclosure of Proxy Voting Policies and Procedures for Closed-End Management Investment Companies.
Not applicable.
Item 8. Portfolio Managers of Closed-End Management Investment Companies.
Not applicable.
Item 9. Purchases of Equity Securities by Closed-End Management Investment Company and Affiliated Purchasers.
Not applicable.
Item 10. Submission of Matters to a Vote of Security Holders.
There were no material changes to the procedures by which shareholders may recommend nominees to the registrant’s board of directors.
Item 11. Controls and Procedures.
(a) The registrant’s principal executive officer and principal financial officers, based on their evaluation of the registrant’s disclosure controls and procedures as of a date within 90 days of the filing of this report, have concluded that such controls and procedures are adequately designed to ensure that material information required to be disclosed by the registrant in Form N-CSR is accumulated and communicated to the registrant’s management, including the principal executive officer and principal financial officer, or persons performing similar functions, as appropriate to allow timely decisions regarding required disclosure.
(b) During November 2012, the registrant enhanced internal controls over financial reporting relating to the recording of certain last day trades. These controls include (i) additional analysis of last day security purchase prices, (ii) comparisons of cost and market value for last day trades and (iii) analytical review of per share changes resulting from financial statement adjustments.
Item 12. Exhibits.
(a)(1) Code of ethics required to be disclosed under Item 2 of Form N-CSR attached hereto as Exhibit 99.CODE ETH.
(a)(2) Certifications pursuant to Rule 30a-2(a) under the Investment Company Act of 1940 (17 CFR 270.30a-2(a)) attached hereto as Exhibit 99.CERT.
(a)(3) Not applicable.
(b) Certification pursuant to Rule 30a-2(b) under the Investment Company Act of 1940 (17 CFR 270.30a-2(b)) attached hereto as Exhibit 99.906CERT.
SIGNATURES
Pursuant to the requirements of the Securities Exchange Act of 1934 and the Investment Company Act of 1940, the registrant has duly caused this report to be signed on its behalf by the undersigned, thereunto duly authorized.
(registrant) | | Columbia Funds Series Trust I | |
| | |
| | |
By (Signature and Title) | /s/ J. Kevin Connaughton | |
| J. Kevin Connaughton, President and Principal Executive Officer |
| | |
| | |
Date | | February 21, 2013 | |
| | |
| | |
Pursuant to the requirements of the Securities Exchange Act of 1934 and the Investment Company Act of 1940, this report has been signed below by the following persons on behalf of the registrant and in the capacities and on the dates indicated. |
| | |
| | |
By (Signature and Title) | /s/ J. Kevin Connaughton | |
| J. Kevin Connaughton, President and Principal Executive Officer |
| | |
| | |
Date | | February 21, 2013 | |
| | |
| | |
By (Signature and Title) | /s/ Michael G. Clarke | |
| Michael G. Clarke, Treasurer and Chief Financial Officer |
| | |
| | |
Date | | February 21, 2013 | |
| | | | |