UNITED STATES
SECURITIES AND EXCHANGE COMMISSION
Washington, D.C. 20549
FORM N-CSR
CERTIFIED SHAREHOLDER REPORT OF REGISTERED
MANAGEMENT INVESTMENT COMPANIES
Investment Company Act file number | 811-04367 |
|
Columbia Funds Series Trust I |
(Exact name of registrant as specified in charter) |
|
225 Franklin Street, Boston, Massachusetts | | 02110 |
(Address of principal executive offices) | | (Zip code) |
|
Scott R. Plummer 5228 Ameriprise Financial Center Minneapolis, MN 55474 |
(Name and address of agent for service) |
|
Registrant’s telephone number, including area code: | 1-612-671-1947 | |
|
Date of fiscal year end: | May 31 | |
|
Date of reporting period: | May 31, 2013 | |
| | | | | | | | |
Form N-CSR is to be used by management investment companies to file reports with the Commission not later than 10 days after the transmission to stockholders of any report that is required to be transmitted to stockholders under Rule 30e-1 under the Investment Company Act of 1940 (17 CFR 270.30e-1). The Commission may use the information provided on Form N-CSR in its regulatory, disclosure review, inspection, and policymaking roles.
A registrant is required to disclose the information specified by Form N-CSR, and the Commission will make this information public. A registrant is not required to respond to the collection of information contained in Form N-CSR unless the Form displays a currently valid Office of Management and Budget ("OMB") control number. Please direct comments concerning the accuracy of the information collection burden estimate and any suggestions for reducing the burden to Secretary, Securities and Exchange Commission, 450 Fifth Street, NW, Washington, DC 20549-0609. The OMB has reviewed this collection of information under the clearance requirements of 44 U.S.C. § 3507.
Item 1. Reports to Stockholders.
Annual Report
May 31, 2013

Columbia Dividend Income Fund
Not FDIC insured • No bank guarantee • May lose value
Columbia Dividend Income Fund
 Dear Shareholders,
U.S. equities had a strong first quarter
Similar to 2012, equities once again were the best performing asset class in the first quarter of 2013. The S&P 500 Index reached an all-time closing high on the last trading day of the quarter and pushed through its October 2007 peak. Although global equities have performed well year-to-date, there is significant performance divergence among regions. In local currency terms, Japanese equities were the best performing developed market globally, and U.S. stocks outperformed most other global equity markets. European equities rose in the first quarter but trailed U.S. stocks and had a turbulent March, as investors were reminded of instability in the eurozone with news of a banking crisis in Cyprus.
Although all 10 sectors of the S&P 500 Index delivered positive returns, this was a rally led by defensive stocks such as those in health care, consumer staples and utilities. Materials and technology stocks were the weakest sectors.
High yield leads fixed income; most sectors flat to down
The fixed-income markets lagged equities with modest, single-digit returns coming from municipals and high-yield sectors in the United States. Most government and investment-grade credit sectors were roughly flat to down for the first quarter of 2013. Emerging market bonds were the biggest disappointment with single-digit losses.
Columbia Management to begin delivering summary prospectuses
Each Columbia fund is required to update its prospectus on an annual basis. Beginning with June 2013 prospectus updates, shareholders of Columbia retail mutual funds will start to receive a summary prospectus, rather than the full length (statutory) mutual fund prospectus they have received in the past.
Each fund's summary prospectus will include the following key information:
> Investment objective
> Fee and expense table
> Portfolio turnover rate information
> Principal investment strategies, principal risks and performance information
> Management information
> Purchase and sale information
> Tax information
> Financial intermediary compensation information
Each fund's statutory prospectus will contain additional information about the fund and its risks. Both the statutory and summary prospectus will be updated each year, and will be available at columbiamanagement.com. Shareholders may request a printed version of a statutory prospectus at no cost by calling 800.345.6611 or sending an email to serviceinquiries@columbiamanagement.com.
Stay on track with Columbia Management
Backed by more than 100 years of experience, Columbia Management is one of the nation's largest asset managers. At the heart of our success — and, most importantly, that of our investors — are highly talented industry professionals, brought together by a unique way of working. We are dedicated to helping you take advantage of today's opportunities and anticipate tomorrow's. We stay abreast of the latest investment trends and ideas, using our collective insight to evaluate events and transform them into solutions you can use.
Visit columbiamanagement.com for:
> The Columbia Management Perspectives blog, featuring timely posts by our investment teams
> Detailed up-to-date fund performance and portfolio information
> Economic analysis and market commentary
> Quarterly fund commentaries
> Columbia Management Investor, our award-winning quarterly newsletter for shareholders
Thank you for your continued support of the Columbia Funds. We look forward to serving your investment needs for many years to come.
Best Regards,

J. Kevin Connaughton
President, Columbia Funds
The S&P 500 Index, an unmanaged index, measures the performance of 500 large-capitalization U.S. stocks and is frequently used as a general measure of market performance. Indices are not available for investment, are not professionally managed and do not reflect sales charges, fees, brokerage commissions, taxes or other expenses of investing.
Investors should consider the investment objectives, risks, charges and expenses of a mutual fund carefully before investing. For a free prospectus, which contains this and other important information about a fund, visit columbiamanagement.com. The prospectus should be read carefully before investing.
Columbia Funds are distributed by Columbia Management Investment Distributors, Inc., member FINRA, and managed by Columbia Management Investment Advisers, LLC.
© 2013 Columbia Management Investment Advisers, LLC. All rights reserved.
Columbia Dividend Income Fund
Performance Overview | | | 2 | | |
Manager Discussion of Fund Performance | | | 4 | | |
Understanding Your Fund's Expenses | | | 6 | | |
Portfolio of Investments | | | 7 | | |
Statement of Assets and Liabilities | | | 12 | | |
Statement of Operations | | | 14 | | |
Statement of Changes in Net Assets | | | 15 | | |
Financial Highlights | | | 18 | | |
Notes to Financial Statements | | | 29 | | |
Report of Independent Registered
Public Accounting Firm | | | 36 | | |
Federal Income Tax Information | | | 37 | | |
Trustees and Officers | | | 38 | | |
Important Information About This Report | | | 41 | | |
Fund Investment Manager
Columbia Management Investment
Advisers, LLC
225 Franklin Street
Boston, MA 02110
Fund Distributor
Columbia Management Investment
Distributors, Inc.
225 Franklin Street
Boston, MA 02110
Fund Transfer Agent
Columbia Management Investment
Services Corp.
P.O. Box 8081
Boston, MA 02266-8081
For more information about any of the funds, please visit columbiamanagement.com or call 800.345.6611. Customer Service Representatives are available to answer your questions Monday through Friday from 8 a.m. to 8 p.m. Eastern time.
The views expressed in this report reflect the current views of the respective parties. These views are not guarantees of future performance and involve certain risks, uncertainties and assumptions that are difficult to predict, so actual outcomes and results may differ significantly from the views expressed. These views are subject to change at any time based upon economic, market or other conditions and the respective parties disclaim any responsibility to update such views. These views may not be relied on as investment advice and, because investment decisions for a Columbia Fund are based on numerous factors, may not be relied on as an indication of trading intent on behalf of any particular Columbia Fund. References to specific securities should not be construed as a recommendation or investment advice.
Columbia Dividend Income Fund
Performance Summary
> Columbia Dividend Income Fund (the Fund) Class A shares returned 24.91% excluding sales charges for the 12-month period that ended May 31, 2013.
> The Fund underperformed its benchmark, the Russell 1000 Index, which returned 27.62% for the same 12-month period.
> In an environment of generally soaring stock prices, the Fund produced a strong total return but fell modestly short of the return of its benchmark, due primarily to stock selection in the financials sector
Average Annual Total Returns (%) (for period ended May 31, 2013)
| | | Inception | | 1 Year | | 5 Years | | 10 Years | |
Class A | | 11/25/02 | | | | | | | |
Excluding sales charges | | | | | | | 24.91 | | | | 6.57 | | | | 8.87 | | |
Including sales charges | | | | | | | 17.74 | | | | 5.32 | | | | 8.23 | | |
Class B | | 11/25/02 | | | | | | | |
Excluding sales charges | | | | | | | 23.99 | | | | 5.79 | | | | 8.05 | | |
Including sales charges | | | | | | | 18.99 | | | | 5.47 | | | | 8.05 | | |
Class C | | 11/25/02 | | | | | | | |
Excluding sales charges | | | | | | | 24.00 | | | | 5.79 | | | | 8.06 | | |
Including sales charges | | | | | | | 23.00 | | | | 5.79 | | | | 8.06 | | |
Class I* | | 09/27/10 | | | 25.42 | | | | 6.94 | | | | 9.20 | | |
Class R* | | 03/28/08 | | | 24.60 | | | | 6.32 | | | | 8.61 | | |
Class R4* | | 11/08/12 | | | 25.29 | | | | 6.85 | | | | 9.15 | | |
Class R5* | | 11/08/12 | | | 25.34 | | | | 6.86 | | | | 9.16 | | |
Class T | | 03/04/98 | | | | | | | |
Excluding sales charges | | | | | | | 24.85 | | | | 6.52 | | | | 8.81 | | |
Including sales charges | | | | | | | 17.68 | | | | 5.27 | | | | 8.17 | | |
Class W* | | 09/27/10 | | | 24.91 | | | | 6.60 | | | | 8.92 | | |
Class Y* | | 11/08/12 | | | 25.35 | | | | 6.86 | | | | 9.16 | | |
Class Z | | 03/04/98 | | | 25.27 | | | | 6.84 | | | | 9.15 | | |
Russell 1000 Index | | | | | | | 27.62 | | | | 5.57 | | | | 7.96 | | |
Returns for Class A and Class T are shown with and without the maximum initial sales charge of 5.75%. Returns for Class B are shown with and without the applicable contingent deferred sales charge (CDSC) of 5.00% in the first year, declining to 1.00% in the sixth year and eliminated thereafter. Returns for Class C are shown with and without the 1.00% CDSC for the first year only. The Fund's other classes are not subject to sales charges and have limited eligibility. Please see the Fund's prospectuses for details. Performance for different share classes will vary based on differences in sales charges and fees associated with each class. All results shown assume reinvestment of distributions during the period. Returns do not reflect the deduction of taxes that a shareholder may pay on Fund distributions or on the redemption of Fund shares. Performance results reflect the effect of any fee waivers or reimbursements of Fund expenses by Columbia Management Investment Advisers, LLC and/or any of its affiliates. Absent these fee waivers or expense reimbursement arrangements, performance results would have been lower.
The performance information shown represents past performance and is not a guarantee of future results. The investment return and principal value of your investment will fluctuate so that your shares, when redeemed, may be worth more or less than their original cost. Current performance may be lower or higher than the performance information shown. You may obtain performance information current to the most recent month-end by contacting your financial intermediary, visiting columbiamanagement.com or calling 800.345.6611.
*The returns shown for periods prior to the share class inception date (including returns for the Life of the Fund, if shown, which are since Fund inception) include the returns of the Fund's oldest share class. Since the Fund launched more than one share class at its inception, Class Z shares were used. These returns are adjusted to reflect any higher class-related operating expenses of the newer share classes, as applicable. Please visit columbiamanagement.com/mutual-funds/appended-performance for more information.
The Russell 1000 Index measures the performance of the large-cap segment of the U.S. equity universe. It is a subset of the Russell 3000 Index and includes approximately 1000 of the largest securities based on a combination of their market cap and current index membership. The Russell 1000 Index represents approximately 92% of the U.S. market.
Indices are not available for investment, are not professionally managed and do not reflect sales charges, fees, brokerage commissions, taxes or other expenses of investing. Securities in the Fund may not match those in an index.
Annual Report 2013
2
Columbia Dividend Income Fund
Performance Overview (continued)
Performance of a Hypothetical $10,000 Investment (June 1, 2003 – May 31, 2013)
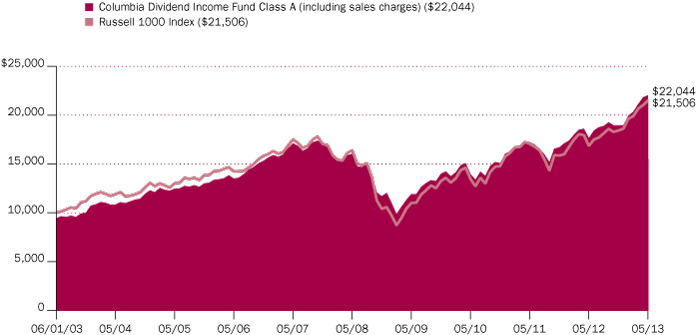
The chart above shows the change in value of a hypothetical $10,000 investment in Class A shares of Columbia Dividend Income Fund during the stated time period, and does not reflect the deduction of taxes that a shareholder may pay on Fund distributions or on the redemption of Fund shares.
Annual Report 2013
3
Columbia Dividend Income Fund
Manager Discussion of Fund Performance
For the 12-month period that ended May 31, 2013, the Fund's Class A shares returned 24.91%, excluding sales charges. The Fund's benchmark, the Russell 1000 Index returned 27.62% over the same period. The Fund captured approximately 90% of the benchmark's results without compromising its focus on high quality, dividend-paying stocks in a period that favored risk-taking. Stock selection in the financials sector and the sector weight in telecommunication services detracted from relative results.
Sectors that performed well for the Fund relative to the benchmark were information technology, materials, utilities and consumer discretionary. Investments in companies that benefited from an improved housing market helped lift results for the fiscal year. In addition, an overweight relative to the benchmark in pharmaceutical companies drove strong relative results in the period's second half.
A Positive for Dividend Investors
The clarification of the tax treatment of qualified dividends early in 2013 was a positive for dividend investors. The American Taxpayer Relief Act of 2012, signed by President Obama on January 3, 2013, continued the prior tax law which had established that most qualified dividends are taxed at an equal rate with long-term capital gains. For a vast majority of dividend-earning Americans the tax rate on qualified dividends and long-term capital gains remains at a 15% rate at the federal level, as opposed to their higher ordinary income tax rate. For individuals with modified adjusted gross incomes exceeding $200,000 and marrieds, filing jointly, with modified adjusted gross incomes exceeding $250,000, a 3.8% tax on net investment income associated with the 2010 Affordable Care Act will kick in, creating an 18.8% tax rate on qualified dividend income. A 23.8% tax rate for individuals with taxable incomes in excess of $400,000 and marrieds, filing jointly, with taxable incomes in excess of $450,000 will apply in 2013, reflecting a higher 20% tax rate on qualified dividends and long-term capital gains added by the American Taxpayer Relief Act. This outcome can result in a tax rate lower than at times in the past and removes a major uncertainty for investors going forward.
A Modest Pickup in U.S. Economic Growth
Despite the domestic fiscal drag resulting from higher payroll taxes and spending cuts, the U.S. economy has continued to create jobs and grow modestly. During the fiscal year, the U.S. economy expanded at an annual rate of approximately 1.8%, with a pickup in growth to 2.4% in the first quarter of 2013. Price inflation has been low, with a decline in energy prices and a deceleration in food prices. An increase in consumer spending, improved residential investment and increased inventory investment were the major contributors to growth. Even though there has been only modest improvement in the overall pace of economic growth since the current cycle of recovery began in 2009, the trend remains positive. Against this backdrop, U.S. investors bid prices higher on stocks and other riskier assets as central banks continued to pour liquidity into the markets. However, volatility reduced those gains in the final month of the period, as investors attempt to gauge when the Federal Reserve will reduce its bond purchases.
Housing, Pharmaceutical and Information Technology Stocks Aided Results
A recovery in the U.S. housing market led to strong gains by several housing-sensitive companies, including Home Depot and Sherwin-Williams. While the
Portfolio Management
Richard Dahlberg, CFA
Scott Davis
David King, CFA
Michael Barclay, CFA
Morningstar Style BoxTM
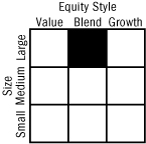
The Morningstar Style BoxTM is based on a fund's portfolio holdings. For equity funds, the vertical axis shows the market capitalization of the stocks owned, and the horizontal axis shows investment style (value, blend, or growth). Information shown is based on the most recent data provided by Morningstar.
© 2013 Morningstar, Inc. All rights reserved. The Morningstar information contained herein: (1) is proprietary to Morningstar and/or its content providers; (2) may not be copied or distributed; and (3) is not warranted to be accurate, complete or timely. Neither Morningstar nor its content providers are responsible for any damages or losses arising from any use of this information.
Top Ten Holdings (%)
(at May 31, 2013) | |
Verizon Communications, Inc. | | | 3.4 | | |
Philip Morris International, Inc. | | | 3.1 | | |
Bristol-Myers Squibb Co. | | | 3.0 | | |
Microsoft Corp. | | | 2.9 | | |
Pfizer, Inc. | | | 2.7 | | |
International Business
Machines Corp. | | | 2.7 | | |
Exxon Mobil Corp. | | | 2.6 | | |
Sherwin-Williams Co. (The) | | | 2.6 | | |
AT&T, Inc. | | | 2.6 | | |
Johnson & Johnson | | | 2.5 | | |
Percentages indicated are based upon total investments (excluding Money Market Funds).
For further detail about these holdings, please refer to the section entitled "Portfolio of Investments."
Fund holdings are as of the date given, are subject to change at any time, and are not recommendations to buy or sell any security.
Annual Report 2013
4
Columbia Dividend Income Fund
Manager Discussion of Fund Performance (continued)
Fund's positioning in health care stocks had a slightly negative impact on relative results for the 12 months, an overweight position relative to the benchmark and stock selection within pharmaceuticals bolstered the Fund's performance during the final six months of the period. In fact, two of the Fund's top contributors to relative results for the 12 months were pharmaceutical companies Bristol-Myers Squibb and Pfizer. Bristol-Myers advanced, based on new product introductions and a promising drug pipeline, which has the potential to fuel future long term growth. Pfizer, meanwhile, sold off and spun off some non-core businesses to concentrate on its improving pharmaceuticals business.
An underweight in information technology stocks relative to the benchmark had a positive effect on relative performance. The Fund's limited exposure to Apple relative to the benchmark significantly helped performance due to the decline in Apple's share price over the past year. We sold Apple prior to the end of our fiscal year to recognize a loss, which offset a large portion of the gains realized from other stock sales taken previously in the year. Within information technology, the Fund benefited from its positioning in services and systems companies.
Financials Led Disappointments
We did not participate in the significant gains generated by two large financial companies that paid minimal dividends and to which the Fund had no exposure. Both were severely hurt in the financial crisis of 2008 and 2009 and advanced as they improved their earnings and strengthened their balance sheets. Elsewhere in the financials sector, investments in Digital Realty, a real estate investment trust, and auto insurer Progressive (sold during the period) underperformed as each company faced increasing competition. Higher quality financial stocks held in the portfolio, such as U.S. Bancorp and Chubb, which have performed well over the long term, lagged the performance of recovery stories over the past year. The Fund's top stock contributor for the period, however, was JPMorgan Chase, whose share price recovered from a price decline caused by the May, 2012 disclosure of a large trading loss in a hedging operation. Solid operational performance by JPMorgan has restored investor confidence.
Within the energy sector, Royal Dutch Shell, a Netherlands-based integrated energy company, detracted from results. The company was affected by weak economic conditions in Europe which led to declining fuel sales. Within the telecommunication services sector, Verizon and AT&T produced dividend income and appreciation for the Fund but lagged the performance of the benchmark over the past year
Looking Ahead
We plan to maintain our emphasis on companies we believe to be high quality and are able to generate substantial and sustainable free cash flow from operations. Cash generation enables a corporation to pay and increase dividends and to fund stock buybacks. While we focus on selecting dividend-paying companies, we are careful to keep the portfolio well diversified, with healthy representation in all sectors. Given the strong performance by the equity market, we believe we should be cautious in an environment in which economic growth remains moderate at best. We remain careful not to reach for yield or compromise on quality in a period when people are reaching for yield and return without being properly compensated for the increased risks they are taking. Nevertheless, we see reason to be confident in corporations that have successfully strengthened their balance sheets while improving their earnings.
Portfolio Breakdown (%)
(at May 31, 2013) | |
Common Stocks | | | 94.5 | | |
Consumer Discretionary | | | 8.2 | | |
Consumer Staples | | | 9.1 | | |
Energy | | | 9.4 | | |
Financials | | | 16.6 | | |
Health Care | | | 14.9 | | |
Industrials | | | 8.5 | | |
Information Technology | | | 12.3 | | |
Materials | | | 5.1 | | |
Telecommunication Services | | | 5.7 | | |
Utilities | | | 4.7 | | |
Convertible Preferred Stocks | | | 0.6 | | |
Consumer Discretionary | | | 0.2 | | |
Financials | | | 0.4 | | |
Exchange-Traded Funds | | | 1.8 | | |
Money Market Funds | | | 3.1 | | |
Total | | | 100.0 | | |
Percentages indicated are based upon total investments. The Fund's portfolio composition is subject to change.
Investment Risks
Risks include stock market fluctuations due to business and economic developments. Value stocks may also be subject to specific business risks that have caused the stocks to be out of favor. Lower-rated and medium-quality debt securities are more speculative and incur more risk. Dividend payments are not guaranteed. The amount of a dividend payment, if any, can vary over time and issuers may reduce dividends paid on securities in the event of a recession or adverse event affecting a specific industry or issuer.
Annual Report 2013
5
Columbia Dividend Income Fund
Understanding Your Fund's Expenses
(Unaudited)
As an investor, you incur two types of costs. There are transaction costs, which generally include sales charges on purchases and may include redemption fees. There are also ongoing costs, which generally include management fees, distribution and service (Rule 12b-1) fees, and other fund expenses. The following information is intended to help you understand your ongoing costs (in dollars) of investing in the Fund and to help you compare these costs with the ongoing costs of investing in other mutual funds.
Analyzing Your Fund's Expenses
To illustrate these ongoing costs, we have provided examples and calculated the expenses paid by investors in each share class of the Fund during the period. The actual and hypothetical information in the table is based on an initial investment of $1,000 at the beginning of the period indicated and held for the entire period. Expense information is calculated two ways and each method provides you with different information. The amount listed in the "Actual" column is calculated using the Fund's actual operating expenses and total return for the period. You may use the Actual information, together with the amount invested, to estimate the expenses that you paid over the period. Simply divide your account value by $1,000 (for example, an $8,600 account value divided by $1,000 = 8.6), then multiply the results by the expenses paid during the period under the Actual column. The amount listed in the "Hypothetical" column assumes a 5% annual rate of return before expenses (which is not the Fund's actual return) and then applies the Fund's actual expense ratio for the period to the hypothetical return. You should not use the hypothetical account values and expenses to estimate either your actual account balance at the end of the period or the expenses you paid during the period. See "Compare With Other Funds" below for details on how to use the hypothetical data.
Compare With Other Funds
Since all mutual funds are required to include the same hypothetical calculations about expenses in shareholder reports, you can use this information to compare the ongoing cost of investing in the Fund with other funds. To do so, compare the hypothetical example with the 5% hypothetical examples that appear in the shareholder reports of other funds. As you compare hypothetical examples of other funds, it is important to note that hypothetical examples are meant to highlight the ongoing costs of investing in a fund only and do not reflect any transaction costs, such as sales charges, or redemption or exchange fees. Therefore, the hypothetical calculations are useful in comparing ongoing costs only, and will not help you determine the relative total costs of owning different funds. If transaction costs were included in these calculations, your costs would be higher.
December 1, 2012 – May 31, 2013
| | | Account Value at the Beginning
of the Period ($) | | Account Value at the End of the
Period ($) | | Expenses Paid During the
Period ($) | | Fund's
Annualized
Expense
Ratio (%) | |
| | | Actual | | Hypothetical | | Actual | | Hypothetical | | Actual | | Hypothetical | | Actual | |
Class A | | | 1,000.00 | | | | 1,000.00 | | | | 1,162.80 | | | | 1,019.75 | | | | 5.61 | | | | 5.24 | | | | 1.04 | | |
Class B | | | 1,000.00 | | | | 1,000.00 | | | | 1,159.10 | | | | 1,016.01 | | | | 9.64 | | | | 9.00 | | | | 1.79 | | |
Class C | | | 1,000.00 | | | | 1,000.00 | | | | 1,159.20 | | | | 1,016.01 | | | | 9.64 | | | | 9.00 | | | | 1.79 | | |
Class I | | | 1,000.00 | | | | 1,000.00 | | | | 1,165.50 | | | | 1,021.94 | | | | 3.24 | | | | 3.02 | | | | 0.60 | | |
Class R | | | 1,000.00 | | | | 1,000.00 | | | | 1,161.30 | | | | 1,018.50 | | | | 6.95 | | | | 6.49 | | | | 1.29 | | |
Class R4 | | | 1,000.00 | | | | 1,000.00 | | | | 1,165.20 | | | | 1,020.84 | | | | 4.43 | | | | 4.13 | | | | 0.82 | | |
Class R5 | | | 1,000.00 | | | | 1,000.00 | | | | 1,165.70 | | | | 1,021.69 | | | | 3.51 | | | | 3.28 | | | | 0.65 | | |
Class T | | | 1,000.00 | | | | 1,000.00 | | | | 1,162.50 | | | | 1,019.50 | | | | 5.88 | | | | 5.49 | | | | 1.09 | | |
Class W | | | 1,000.00 | | | | 1,000.00 | | | | 1,162.80 | | | | 1,019.80 | | | | 5.55 | | | | 5.19 | | | | 1.03 | | |
Class Y | | | 1,000.00 | | | | 1,000.00 | | | | 1,165.90 | | | | 1,021.94 | | | | 3.24 | | | | 3.02 | | | | 0.60 | | |
Class Z | | | 1,000.00 | | | | 1,000.00 | | | | 1,164.70 | | | | 1,020.99 | | | | 4.26 | | | | 3.98 | | | | 0.79 | | |
Expenses paid during the period are equal to the annualized expense ratio for each class as indicated above, multiplied by the average account value over the period and then multiplied by the number of days in the Fund's most recent fiscal half year and divided by 365.
Expenses do not include fees and expenses incurred indirectly by the Fund from the underlying funds in which the Fund may invest (also referred to as "acquired funds"), including affiliated and non-affiliated pooled investment vehicles (including mutual funds and exchange-traded funds).
Annual Report 2013
6
Columbia Dividend Income Fund
Portfolio of Investments
May 31, 2013
(Percentages represent value of investments compared to net assets)
Common Stocks 94.4%
Issuer | | Shares | | Value ($) | |
Consumer Discretionary 8.2% | |
Hotels, Restaurants & Leisure 1.5% | |
McDonald's Corp. | | | 1,293,950 | | | | 124,956,751 | | |
Leisure Equipment & Products 0.7% | |
Mattel, Inc. | | | 1,356,850 | | | | 60,719,038 | | |
Media 1.4% | |
Time Warner, Inc. | | | 2,021,800 | | | | 118,012,466 | | |
Multiline Retail 1.1% | |
Macy's, Inc. | | | 970,900 | | | | 46,933,306 | | |
Nordstrom, Inc. | | | 809,225 | | | | 47,598,614 | | |
Total | | | | | 94,531,920 | | |
Specialty Retail 3.0% | |
Home Depot, Inc. (The) | | | 2,443,550 | | | | 192,209,643 | | |
TJX Companies, Inc. | | | 1,134,900 | | | | 57,437,289 | | |
Total | | | | | 249,646,932 | | |
Textiles, Apparel & Luxury Goods 0.5% | |
VF Corp. | | | 235,650 | | | | 43,326,609 | | |
Total Consumer Discretionary | | | | | 691,193,716 | | |
Consumer Staples 9.1% | |
Beverages 0.9% | |
Coca-Cola Co. (The) | | | 1,822,550 | | | | 72,883,775 | | |
Food & Staples Retailing 0.9% | |
Wal-Mart Stores, Inc. | | | 1,034,957 | | | | 77,456,182 | | |
Food Products 0.6% | |
General Mills, Inc. | | | 1,138,000 | | | | 53,577,040 | | |
Household Products 2.5% | |
Kimberly-Clark Corp. | | | 909,675 | | | | 88,083,830 | | |
Procter & Gamble Co. (The) | | | 1,550,525 | | | | 119,018,299 | | |
Total | | | | | 207,102,129 | | |
Tobacco 4.2% | |
Altria Group, Inc. | | | 2,807,325 | | | | 101,344,432 | | |
Philip Morris International, Inc. | | | 2,754,525 | | | | 250,413,868 | | |
Total | | | | | 351,758,300 | | |
Total Consumer Staples | | | | | 762,777,426 | | |
Energy 9.4% | |
Oil, Gas & Consumable Fuels 9.4% | |
Chevron Corp. | | | 1,401,339 | | | | 172,014,362 | | |
ConocoPhillips | | | 1,016,700 | | | | 62,364,378 | | |
Common Stocks (continued)
Issuer | | Shares | | Value ($) | |
Exxon Mobil Corp. | | | 2,359,150 | | | | 213,432,300 | | |
Kinder Morgan, Inc. | | | 2,223,725 | | | | 84,457,076 | | |
Occidental Petroleum Corp. | | | 926,550 | | | | 85,307,459 | | |
Phillips 66 | | | 815,375 | | | | 54,279,514 | | |
Royal Dutch Shell PLC, ADR | | | 1,819,550 | | | | 120,763,533 | | |
Total | | | | | 792,618,622 | | |
Total Energy | | | | | 792,618,622 | | |
Financials 16.6% | |
Capital Markets 2.7% | |
BlackRock, Inc. | | | 429,775 | | | | 119,993,180 | | |
Northern Trust Corp. | | | 1,010,950 | | | | 58,786,743 | | |
T. Rowe Price Group, Inc. | | | 678,250 | | | | 51,452,045 | | |
Total | | | | | 230,231,968 | | |
Commercial Banks 3.7% | |
PNC Financial Services Group, Inc. (The) | | | 1,000,500 | | | | 71,675,820 | | |
U.S. Bancorp | | | 3,200,250 | | | | 112,200,765 | | |
Wells Fargo & Co. | | | 3,073,075 | | | | 124,613,191 | | |
Total | | | | | 308,489,776 | | |
Consumer Finance 1.2% | |
American Express Co. | | | 1,357,475 | | | | 102,774,432 | | |
Diversified Financial Services 3.5% | |
CME Group, Inc. | | | 959,550 | | | | 65,182,231 | | |
JPMorgan Chase & Co. | | | 3,327,300 | | | | 181,637,307 | | |
McGraw Hill Financial, Inc. | | | 895,325 | | | | 48,839,979 | | |
Total | | | | | 295,659,517 | | |
Insurance 3.5% | |
ACE Ltd. | | | 736,650 | | | | 66,062,772 | | |
Chubb Corp. (The) | | | 677,300 | | | | 58,992,830 | | |
Marsh & McLennan Companies, Inc. | | | 2,209,125 | | | | 88,409,182 | | |
MetLife, Inc. | | | 905,275 | | | | 40,022,208 | | |
Unum Group | | | 1,502,900 | | | | 42,802,592 | | |
Total | | | | | 296,289,584 | | |
Real Estate Investment Trusts (REITs) 1.6% | |
Digital Realty Trust, Inc. | | | 660,400 | | | | 40,224,964 | | |
Public Storage | | | 333,050 | | | | 50,556,990 | | |
Simon Property Group, Inc. | | | 234,965 | | | | 39,107,575 | | |
Total | | | | | 129,889,529 | | |
The accompanying Notes to Financial Statements are an integral part of this statement.
Annual Report 2013
7
Columbia Dividend Income Fund
Portfolio of Investments (continued)
May 31, 2013
Common Stocks (continued)
Issuer | | Shares | | Value ($) | |
Thrifts & Mortgage Finance 0.4% | |
People's United Financial, Inc. | | | 2,634,075 | | | | 36,244,872 | | |
Total Financials | | | | | 1,399,579,678 | | |
Health Care 14.8% | |
Biotechnology 1.7% | |
Amgen, Inc. | | | 1,475,350 | | | | 148,316,935 | | |
Health Care Equipment & Supplies 1.1% | |
Abbott Laboratories | | | 2,467,775 | | | | 90,493,309 | | |
Pharmaceuticals 12.0% | |
AbbVie, Inc. | | | 3,402,650 | | | | 145,259,129 | | |
Bristol-Myers Squibb Co. | | | 5,394,250 | | | | 248,189,442 | | |
Johnson & Johnson | | | 2,445,000 | | | | 205,820,100 | | |
Merck & Co., Inc. | | | 4,075,325 | | | | 190,317,678 | | |
Pfizer, Inc. | | | 8,124,875 | | | | 221,240,346 | | |
Total | | | | | 1,010,826,695 | | |
Total Health Care | | | | | 1,249,636,939 | | |
Industrials 8.5% | |
Aerospace & Defense 4.2% | |
Boeing Co. (The) | | | 1,016,950 | | | | 100,698,389 | | |
Honeywell International, Inc. | | | 1,562,650 | | | | 122,605,519 | | |
Raytheon Co. | | | 1,296,850 | | | | 86,422,084 | | |
United Technologies Corp. | | | 458,605 | | | | 43,521,614 | | |
Total | | | | | 353,247,606 | | |
Air Freight & Logistics 0.7% | |
United Parcel Service, Inc., Class B | | | 697,625 | | | | 59,925,987 | | |
Commercial Services & Supplies 0.7% | |
Waste Management, Inc. | | | 1,313,050 | | | | 55,056,187 | | |
Electrical Equipment 0.5% | |
Emerson Electric Co. | | | 745,250 | | | | 42,822,065 | | |
Machinery 2.4% | |
Deere & Co. | | | 442,525 | | | | 38,548,353 | | |
Dover Corp. | | | 841,075 | | | | 65,814,119 | | |
Illinois Tool Works, Inc. | | | 553,150 | | | | 38,792,409 | | |
Parker Hannifin Corp. | | | 582,050 | | | | 58,065,308 | | |
Total | | | | | 201,220,189 | | |
Total Industrials | | | | | 712,272,034 | | |
Common Stocks (continued)
Issuer | | Shares | | Value ($) | |
Information Technology 12.3% | |
Communications Equipment 1.1% | |
Cisco Systems, Inc. | | | 3,734,500 | | | | 89,926,760 | | |
IT Services 5.2% | |
Accenture PLC, Class A | | | 1,709,850 | | | | 140,395,784 | | |
Automatic Data Processing, Inc. | | | 1,196,050 | | | | 82,192,556 | | |
International Business Machines Corp. | | | 1,056,350 | | | | 219,741,927 | | |
Total | | | | | 442,330,267 | | |
Semiconductors & Semiconductor Equipment 3.2% | |
Intel Corp. | | | 5,517,600 | | | | 133,967,328 | | |
KLA-Tencor Corp. | | | 1,360,400 | | | | 76,576,916 | | |
Texas Instruments, Inc. | | | 1,574,025 | | | | 56,491,757 | | |
Total | | | | | 267,036,001 | | |
Software 2.8% | |
Microsoft Corp. | | | 6,797,775 | | | | 237,106,392 | | |
Total Information Technology | | | | | 1,036,399,420 | | |
Materials 5.1% | |
Chemicals 4.6% | |
EI du Pont de Nemours & Co. | | | 1,580,275 | | | | 88,163,542 | | |
LyondellBasell Industries NV, Class A | | | 677,450 | | | | 45,152,043 | | |
RPM International, Inc. | | | 1,327,025 | | | | 43,964,338 | | |
Sherwin-Williams Co. (The) | | | 1,129,850 | | | | 213,010,621 | | |
Total | | | | | 390,290,544 | | |
Containers & Packaging 0.5% | |
Sonoco Products Co. | | | 1,088,950 | | | | 38,135,029 | | |
Total Materials | | | | | 428,425,573 | | |
Telecommunication Services 5.7% | |
Diversified Telecommunication Services 5.7% | |
AT&T, Inc. | | | 5,949,050 | | | | 208,157,260 | | |
Verizon Communications, Inc. | | | 5,635,100 | | | | 273,189,648 | | |
Total | | | | | 481,346,908 | | |
Total Telecommunication Services | | | | | 481,346,908 | | |
Utilities 4.7% | |
Electric Utilities 2.5% | |
American Electric Power Co., Inc. | | | 1,195,700 | | | | 54,786,974 | | |
Duke Energy Corp. | | | 567,825 | | | | 38,004,527 | | |
NextEra Energy, Inc. | | | 508,325 | | | | 38,439,537 | | |
Northeast Utilities | | | 1,015,475 | | | | 42,314,843 | | |
The accompanying Notes to Financial Statements are an integral part of this statement.
Annual Report 2013
8
Columbia Dividend Income Fund
Portfolio of Investments (continued)
May 31, 2013
Common Stocks (continued)
Issuer | | Shares | | Value ($) | |
Westar Energy, Inc. | | | 1,237,175 | | | | 39,243,191 | | |
Total | | | | | 212,789,072 | | |
Multi-Utilities 2.2% | |
CMS Energy Corp. | | | 1,548,075 | | | | 41,720,621 | | |
Dominion Resources, Inc. | | | 683,900 | | | | 38,674,545 | | |
Sempra Energy | | | 811,700 | | | | 65,991,210 | | |
Wisconsin Energy Corp. | | | 978,075 | | | | 39,915,241 | | |
Total | | | | | 186,301,617 | | |
Total Utilities | | | | | 399,090,689 | | |
Total Common Stocks
(Cost: $5,938,818,931) | | | | | 7,953,341,005 | | |
Convertible Preferred Stocks 0.6%
Consumer Discretionary 0.2% | |
Automobiles 0.2% | |
General Motors Co., 4.750% | | | 420,558 | | | | 20,527,436 | | |
Total Consumer Discretionary | | | | | 20,527,436 | | |
Convertible Preferred Stocks (continued)
Issuer | | Shares | | Value ($) | |
Financials 0.4% | |
Commercial Banks 0.4% | |
Fifth Third Bancorp, 8.500% | | | 200,000 | | | | 32,124,000 | | |
Total Financials | | | | | 32,124,000 | | |
Total Convertible Preferred Stocks
(Cost: $48,078,534) | | | | | 52,651,436 | | |
Exchange-Traded Funds 1.8%
SPDR S&P 500 ETF Trust | | | 910,700 | | | | 148,662,668 | | |
Total Exchange-Traded Funds
(Cost: $130,779,330) | | | 148,662,668 | | |
Money Market Funds 3.0%
Columbia Short-Term Cash Fund,
0.109% (a)(b) | | | 256,826,440 | | | | 256,826,440 | | |
Total Money Market Funds
(Cost: $256,826,440) | | | | | 256,826,440 | | |
Total Investments
(Cost: $6,374,503,235) | | | | | 8,411,481,549 | | |
Other Assets & Liabilities, Net | | | | | 19,264,391 | | |
Net Assets | | | | | 8,430,745,940 | | |
Notes to Portfolio of Investments
(a) The rate shown is the seven-day current annualized yield at May 31, 2013.
(b) As defined in the Investment Company Act of 1940, an affiliated company is one in which the Fund owns 5% or more of its outstanding voting securities, or a company which is under common ownership or control with the Fund. Holdings and transactions in these affiliated companies during the year ended May 31, 2013, are as follows:
Issuer | | Beginning
Cost ($) | | Purchase
Cost ($) | | Proceeds
from Sales ($) | | Realized
Gain (Loss) ($) | | Ending
Cost ($) | | Dividends —
Affiliated
Issuers ($) | | Value ($) | |
Columbia
Short–Term
Cash Fund | | | 201,123,460 | | | | 1,666,123,352 | | | | (1,610,420,372) | | | | — | | | | 256,826,440 | | | | 348,518 | | | | 256,826,440 | | |
Abbreviation Legend
ADR American Depositary Receipt
Fair Value Measurements
Generally accepted accounting principles (GAAP) require disclosure regarding the inputs and valuation techniques used to measure fair value and any changes in valuation inputs or techniques. In addition, investments shall be disclosed by major category.
The Fund categorizes its fair value measurements according to a three-level hierarchy that maximizes the use of observable inputs and minimizes the use of unobservable inputs by prioritizing that the most observable input be used when available. Observable inputs are those that market participants would use in pricing an investment based on market data obtained from sources independent of the reporting entity.
The accompanying Notes to Financial Statements are an integral part of this statement.
Annual Report 2013
9
Columbia Dividend Income Fund
Portfolio of Investments (continued)
May 31, 2013
Fair Value Measurements (continued)
Unobservable inputs are those that reflect the Fund's assumptions about the information market participants would use in pricing an investment. An investment's level within the fair value hierarchy is based on the lowest level of any input that is deemed significant to the asset or liability's fair value measurement. The input levels are not necessarily an indication of the risk or liquidity associated with investments at that level. For example, certain U.S. government securities are generally high quality and liquid, however, they are reflected as Level 2 because the inputs used to determine fair value may not always be quoted prices in an active market.
Fair value inputs are summarized in the three broad levels listed below:
> Level 1 — Valuations based on quoted prices for investments in active markets that the Fund has the ability to access at the measurement date (including NAV for open-end mutual funds). Valuation adjustments are not applied to Level 1 investments.
> Level 2 — Valuations based on other significant observable inputs (including quoted prices for similar securities, interest rates, prepayment speeds, credit risks, etc.).
> Level 3 — Valuations based on significant unobservable inputs (including the Fund's own assumptions and judgment in determining the fair value of investments).
Inputs that are used in determining fair value of an investment may include price information, credit data, volatility statistics, and other factors. These inputs can be either observable or unobservable. The availability of observable inputs can vary between investments, and is affected by various factors such as the type of investment, and the volume and level of activity for that investment or similar investments in the marketplace. The inputs will be considered by the Investment Manager, along with any other relevant factors in the calculation of an investment's fair value. The Fund uses prices and inputs that are current as of the measurement date, which may include periods of market dislocations. During these periods, the availability of prices and inputs may be reduced for many investments. This condition could cause an investment to be reclassified between the various levels within the hierarchy.
Investments falling into the Level 3 category are primarily supported by quoted prices from brokers and dealers participating in the market for those investments. However, these may be classified as Level 3 investments due to lack of market transparency and corroboration to support these quoted prices. Additionally, valuation models may be used as the pricing source for any remaining investments classified as Level 3. These models may rely on one or more significant unobservable inputs and/or significant assumptions by the Investment Manager. Inputs used in valuations may include, but are not limited to, financial statement analysis, capital account balances, discount rates and estimated cash flows, and comparable company data.
Under the direction of the Fund's Board of Trustees (the Board), the Investment Manager's Valuation Committee (the Committee) is responsible for carrying out the valuation procedures approved by the Board. The Committee consists of voting and non-voting members from various groups within the Investment Manager's organization, including operations and accounting, trading and investments, compliance, risk management and legal.
The Committee meets at least monthly to review and approve valuation matters, which may include a description of specific valuation determinations, data regarding pricing information received from approved pricing vendors and brokers and the results of Board-approved valuation control policies and procedures (the Policies). The Policies address, among other things, instances when market quotations are readily available, including recommendations of third party pricing vendors and a determination of appropriate pricing methodologies; events that require specific valuation determinations and assessment of fair value techniques; securities with a potential for stale pricing, including those that are illiquid, restricted, or in default; and the effectiveness of third-party pricing vendors, including periodic reviews of vendors. The Committee meets more frequently, as needed, to discuss additional valuation matters, which may include the need to review back-testing results, review time-sensitive information or approve related valuation actions. The Committee reports to the Board, with members of the Committee meeting with the Board at each of its regularly scheduled meetings to discuss valuation matters and actions during the period, similar to those described earlier.
For investments categorized as Level 3, the Committee monitors information similar to that described above, which may include: (i) data specific to the issuer or comparable issuers, (ii) general market or specific sector news and (iii) quoted prices and specific or similar security transactions. The Committee considers this data and any changes from prior periods in order to assess the reasonableness of observable and unobservable inputs, any assumptions or internal models used to value those securities and changes in fair value. This data is also used to corroborate, when available, information received from approved pricing vendors and brokers. Various factors impact the frequency of monitoring this information (which may occur as often as daily). However, the Committee may determine that changes to inputs, assumptions and models are not required as a result of the monitoring procedures performed.
The accompanying Notes to Financial Statements are an integral part of this statement.
Annual Report 2013
10
Columbia Dividend Income Fund
Portfolio of Investments (continued)
May 31, 2013
Fair Value Measurements (continued)
The following table is a summary of the inputs used to value the Fund's investments at May 31, 2013:
Description | | Level 1
Quoted Prices in
Active Markets for
Identical Assets ($) | | Level 2
Other Significant
Observable
Inputs ($) | | Level 3
Significant
Unobservable
Inputs ($) | |
Total ($) | |
Equity Securities | |
Common Stocks | |
Consumer Discretionary | | | 691,193,716 | | | | — | | | | — | | | | 691,193,716 | | |
Consumer Staples | | | 762,777,426 | | | | — | | | | — | | | | 762,777,426 | | |
Energy | | | 792,618,622 | | | | — | | | | — | | | | 792,618,622 | | |
Financials | | | 1,399,579,678 | | | | — | | | | — | | | | 1,399,579,678 | | |
Health Care | | | 1,249,636,939 | | | | — | | | | — | | | | 1,249,636,939 | | |
Industrials | | | 712,272,034 | | | | — | | | | — | | | | 712,272,034 | | |
Information Technology | | | 1,036,399,420 | | | | — | | | | — | | | | 1,036,399,420 | | |
Materials | | | 428,425,573 | | | | — | | | | — | | | | 428,425,573 | | |
Telecommunication Services | | | 481,346,908 | | | | — | | | | — | | | | 481,346,908 | | |
Utilities | | | 399,090,689 | | | | — | | | | — | | | | 399,090,689 | | |
Convertible Preferred Stocks | |
Consumer Discretionary | | | 20,527,436 | | | | — | | | | — | | | | 20,527,436 | | |
Financials | | | 32,124,000 | | | | — | | | | — | | | | 32,124,000 | | |
Exchange-Traded Funds | | | 148,662,668 | | | | — | | | | — | | | | 148,662,668 | | |
Total Equity Securities | | | 8,154,655,109 | | | | — | | | | — | | | | 8,154,655,109 | | |
Other | |
Money Market Funds | | | 256,826,440 | | | | — | | | | — | | | | 256,826,440 | | |
Total Other | | | 256,826,440 | | | | — | | | | — | | | | 256,826,440 | | |
Total | | | 8,411,481,549 | | | | — | | | | — | | | | 8,411,481,549 | | |
See the Portfolio of Investments for all investment classifications not indicated in the table.
There were no transfers of financial assets between Levels 1 and 2 during the period.
The accompanying Notes to Financial Statements are an integral part of this statement.
Annual Report 2013
11
Columbia Dividend Income Fund
Statement of Assets and Liabilities
May 31, 2013
Assets | |
Investments, at value | |
Unaffiliated issuers (identified cost $6,117,676,795) | | $ | 8,154,655,109 | | |
Affiliated issuers (identified cost $256,826,440) | | | 256,826,440 | | |
Total investments (identified cost $6,374,503,235) | | | 8,411,481,549 | | |
Receivable for: | |
Capital shares sold | | | 11,684,211 | | |
Dividends | | | 24,048,451 | | |
Prepaid expenses | | | 8,907 | | |
Trustees' deferred compensation plan | | | 141,173 | | |
Total assets | | | 8,447,364,291 | | |
Liabilities | |
Payable for: | |
Capital shares purchased | | | 14,716,342 | | |
Investment management fees | | | 122,873 | | |
Distribution and/or service fees | | | 32,465 | | |
Transfer agent fees | | | 1,383,855 | | |
Administration fees | | | 10,404 | | |
Chief compliance officer expenses | | | 865 | | |
Other expenses | | | 210,374 | | |
Trustees' deferred compensation plan | | | 141,173 | | |
Total liabilities | | | 16,618,351 | | |
Net assets applicable to outstanding capital stock | | $ | 8,430,745,940 | | |
Represented by | |
Paid-in capital | | $ | 6,358,784,404 | | |
Undistributed net investment income | | | 30,930,058 | | |
Accumulated net realized gain | | | 4,053,164 | | |
Unrealized appreciation (depreciation) on: | |
Investments | | | 2,036,978,314 | | |
Total — representing net assets applicable to outstanding capital stock | | $ | 8,430,745,940 | | |
The accompanying Notes to Financial Statements are an integral part of this statement.
Annual Report 2013
12
Columbia Dividend Income Fund
Statement of Assets and Liabilities (continued)
May 31, 2013
Class A | |
Net assets | | $ | 2,518,406,302 | | |
Shares outstanding | | | 147,691,901 | | |
Net asset value per share | | $ | 17.05 | | |
Maximum offering price per share(a) | | $ | 18.09 | | |
Class B | |
Net assets | | $ | 15,034,341 | | |
Shares outstanding | | | 903,752 | | |
Net asset value per share | | $ | 16.64 | | |
Class C | |
Net assets | | $ | 459,966,196 | | |
Shares outstanding | | | 27,666,947 | | |
Net asset value per share | | $ | 16.63 | | |
Class I | |
Net assets | | $ | 320,523,825 | | |
Shares outstanding | | | 18,759,466 | | |
Net asset value per share | | $ | 17.09 | | |
Class R | |
Net assets | | $ | 72,978,665 | | |
Shares outstanding | | | 4,279,373 | | |
Net asset value per share | | $ | 17.05 | | |
Class R4 | |
Net assets | | $ | 37,358,950 | | |
Shares outstanding | | | 2,163,646 | | |
Net asset value per share | | $ | 17.27 | | |
Class R5 | |
Net assets | | $ | 64,986,134 | | |
Shares outstanding | | | 3,764,352 | | |
Net asset value per share | | $ | 17.26 | | |
Class T | |
Net assets | | $ | 84,341,713 | | |
Shares outstanding | | | 4,946,037 | | |
Net asset value per share | | $ | 17.05 | | |
Maximum offering price per share(a) | | $ | 18.09 | | |
Class W | |
Net assets | | $ | 9,373,382 | | |
Shares outstanding | | | 549,711 | | |
Net asset value per share | | $ | 17.05 | | |
Class Y | |
Net assets | | $ | 1,190,432 | | |
Shares outstanding | | | 68,919 | | |
Net asset value per share | | $ | 17.27 | | |
Class Z | |
Net assets | | $ | 4,846,586,000 | | |
Shares outstanding | | | 283,978,200 | | |
Net asset value per share | | $ | 17.07 | | |
(a) The maximum offering price per share is calculated by dividing the net asset value by 1.0 minus the maximum sales charge of 5.75%.
The accompanying Notes to Financial Statements are an integral part of this statement.
Annual Report 2013
13
Columbia Dividend Income Fund
Statement of Operations
Year Ended May 31, 2013
Net investment income | |
Income: | |
Dividends — unaffiliated issuers | | $ | 228,942,009 | | |
Dividends — affiliated issuers | | | 348,518 | | |
Income from securities lending — net | | | 2,564,571 | | |
Foreign taxes withheld | | | (1,068,826 | ) | |
Total income | | | 230,786,272 | | |
Expenses: | |
Investment management fees | | | 37,839,114 | | |
Distribution and/or service fees | |
Class A | | | 5,212,345 | | |
Class B | | | 149,527 | | |
Class C | | | 3,606,391 | | |
Class R | | | 258,639 | | |
Class T | | | 241,466 | | |
Class W | | | 105,818 | | |
Transfer agent fees | |
Class A | | | 3,932,540 | | |
Class B | | | 28,124 | | |
Class C | | | 680,757 | | |
Class R | | | 97,845 | | |
Class R4(a) | | | 8,089 | | |
Class R5(a) | | | 5,656 | | |
Class T | | | 151,495 | | |
Class W | | | 79,157 | | |
Class Z | | | 7,855,530 | | |
Administration fees | | | 3,225,004 | | |
Compensation of board members | | | 162,446 | | |
Printing and postage fees | | | 694,116 | | |
Registration fees | | | 451,265 | | |
Professional fees | | | 257,247 | | |
Chief compliance officer expenses | | | 6,404 | | |
Other | | | 155,687 | | |
Total expenses | | | 65,204,662 | | |
Fees waived or expenses reimbursed by Investment Manager and its affiliates | | | (674,160 | ) | |
Expense reductions | | | (9,091 | ) | |
Total net expenses | | | 64,521,411 | | |
Net investment income | | | 166,264,861 | | |
Realized and unrealized gain (loss) — net | |
Net realized gain (loss) on: | |
Investments | | | 69,902,737 | | |
Foreign currency translations | | | 2,758 | | |
Net realized gain | | | 69,905,495 | | |
Net change in unrealized appreciation (depreciation) on: | |
Investments | | | 1,378,068,459 | | |
Net change in unrealized appreciation (depreciation) | | | 1,378,068,459 | | |
Net realized and unrealized gain | | | 1,447,973,954 | | |
Net increase in net assets resulting from operations | | $ | 1,614,238,815 | | |
(a) For the period from November 8, 2012 (commencement of operations) to May 31, 2013.
The accompanying Notes to Financial Statements are an integral part of this statement.
Annual Report 2013
14
Columbia Dividend Income Fund
Statement of Changes in Net Assets
| | | Year Ended
May 31,
2013(a) | | Year Ended
May 31,
2012(b) | | Year Ended
September 30,
2011 | |
Operations | |
Net investment income | | $ | 166,264,861 | | | $ | 96,508,501 | | | $ | 80,954,053 | | |
Net realized gain | | | 69,905,495 | | | | 16,303,380 | | | | 16,570,289 | | |
Net change in unrealized appreciation (depreciation) | | | 1,378,068,459 | | | | 546,819,311 | | | | (125,203,225 | ) | |
Net increase (decrease) in net assets resulting from operations | | | 1,614,238,815 | | | | 659,631,192 | | | | (27,678,883 | ) | |
Distributions to shareholders | |
Net investment income | |
Class A | | | (45,439,482 | ) | | | (18,711,324 | ) | | | (22,582,632 | ) | |
Class B | | | (231,152 | ) | | | (149,656 | ) | | | (274,525 | ) | |
Class C | | | (5,327,096 | ) | | | (2,239,333 | ) | | | (2,356,214 | ) | |
Class I | | | (7,854,718 | ) | | | (3,932,492 | ) | | | (3,517,020 | ) | |
Class R | | | (962,094 | ) | | | (259,671 | ) | | | (247,636 | ) | |
Class R4 | | | (4,354 | ) | | | — | | | | — | | |
Class R5 | | | (195,539 | ) | | | — | | | | — | | |
Class T | | | (1,758,903 | ) | | | (987,754 | ) | | | (1,721,136 | ) | |
Class W | | | (1,042,733 | ) | | | (606,798 | ) | | | (740,376 | ) | |
Class Y | | | (36 | ) | | | — | | | | — | | |
Class Z | | | (100,753,258 | ) | | | (41,629,351 | ) | | | (49,919,726 | ) | |
Total distributions to shareholders | | | (163,569,365 | ) | | | (68,516,379 | ) | | | (81,359,265 | ) | |
Increase (decrease) in net assets from capital stock activity | | | 1,131,235,200 | | | | 1,350,220,709 | | | | 1,492,699,841 | | |
Total increase in net assets | | | 2,581,904,650 | | | | 1,941,335,522 | | | | 1,383,661,693 | | |
Net assets at beginning of year | | | 5,848,841,290 | | | | 3,907,505,768 | | | | 2,523,844,075 | | |
Net assets at end of year | | $ | 8,430,745,940 | | | $ | 5,848,841,290 | | | $ | 3,907,505,768 | | |
Undistributed net investment income | | $ | 30,930,058 | | | $ | 28,231,804 | | | $ | 244,845 | | |
(a) Class R4, Class R5 and Class Y shares are for the period from November 8, 2012 (commencement of operations) to May 31, 2013.
(b) For the period from October 1, 2011 to May 31, 2012. During the period, the Fund's fiscal year end was changed from September 30 to May 31.
The accompanying Notes to Financial Statements are an integral part of this statement.
Annual Report 2013
15
Columbia Dividend Income Fund
Statement of Changes in Net Assets (continued)
| | | Year Ended May 31,
2013(a) | | Year Ended May 31,
2012(b) | | Year Ended September 30,
2011 | |
| | | Shares | | Dollars ($) | | Shares | | Dollars ($) | | Shares | | Dollars ($) | |
Capital stock activity | |
Class A shares | |
Subscriptions(c) | | | 55,134,578 | | | | 848,069,779 | | | | 48,546,597 | | | | 672,368,710 | | | | 48,175,528 | | | | 634,891,354 | | |
Distributions reinvested | | | 2,786,791 | | | | 42,003,889 | | | | 1,151,653 | | | | 16,100,090 | | | | 1,446,142 | | | | 18,598,042 | | |
Redemptions | | | (34,094,313 | ) | | | (526,484,838 | ) | | | (16,542,347 | ) | | | (228,949,914 | ) | | | (18,973,244 | ) | | | (248,181,551 | ) | |
Net increase | | | 23,827,056 | | | | 363,588,830 | | | | 33,155,903 | | | | 459,518,886 | | | | 30,648,426 | | | | 405,307,845 | | |
Class B shares | |
Subscriptions | | | 155,626 | | | | 2,307,875 | | | | 193,082 | | | | 2,583,203 | | | | 342,782 | | | | 4,373,503 | | |
Distributions reinvested | | | 12,336 | | | | 180,553 | | | | 8,376 | | | | 113,803 | | | | 15,508 | | | | 195,603 | | |
Redemptions(c) | | | (371,808 | ) | | | (5,525,464 | ) | | | (410,573 | ) | | | (5,513,011 | ) | | | (823,282 | ) | | | (10,545,800 | ) | |
Net decrease | | | (203,846 | ) | | | (3,037,036 | ) | | | (209,115 | ) | | | (2,816,005 | ) | | | (464,992 | ) | | | (5,976,694 | ) | |
Class C shares | |
Subscriptions | | | 10,095,798 | | | | 151,475,120 | | | | 6,603,537 | | | | 89,285,490 | | | | 9,101,453 | | | | 116,817,556 | | |
Distributions reinvested | | | 286,010 | | | | 4,207,040 | | | | 126,063 | | | | 1,717,923 | | | | 132,150 | | | | 1,655,855 | | |
Redemptions | | | (3,206,220 | ) | | | (48,033,266 | ) | | | (1,542,136 | ) | | | (20,780,156 | ) | | | (1,871,114 | ) | | | (23,806,169 | ) | |
Net increase | | | 7,175,588 | | | | 107,648,894 | | | | 5,187,464 | | | | 70,223,257 | | | | 7,362,489 | | | | 94,667,242 | | |
Class I shares | |
Subscriptions | | | 7,977,018 | | | | 121,334,158 | | | | 5,520,881 | | | | 75,970,455 | | | | 24,078,342 | | | | 320,170,838 | | |
Distributions reinvested | | | 520,345 | | | | 7,854,636 | | | | 282,493 | | | | 3,932,450 | | | | 276,223 | | | | 3,516,952 | | |
Redemptions | | | (9,164,265 | ) | | | (145,535,773 | ) | | | (6,890,933 | ) | | | (93,486,923 | ) | | | (3,840,844 | ) | | | (50,294,066 | ) | |
Net increase (decrease) | | | (666,902 | ) | | | (16,346,979 | ) | | | (1,087,559 | ) | | | (13,584,018 | ) | | | 20,513,721 | | | | 273,393,724 | | |
Class R shares | |
Subscriptions | | | 2,893,563 | | | | 44,275,976 | | | | 1,511,426 | | | | 21,095,800 | | | | 742,217 | | | | 9,640,024 | | |
Distributions reinvested | | | 49,849 | | | | 756,171 | | | | 14,515 | | | | 203,218 | | | | 15,585 | | | | 200,423 | | |
Redemptions | | | (968,736 | ) | | | (14,935,561 | ) | | | (297,634 | ) | | | (4,166,692 | ) | | | (388,469 | ) | | | (5,161,722 | ) | |
Net increase | | | 1,974,676 | | | | 30,096,586 | | | | 1,228,307 | | | | 17,132,326 | | | | 369,333 | | | | 4,678,725 | | |
Class R4 shares | |
Subscriptions | | | 2,232,048 | | | | 37,798,375 | | | | — | | | | — | | | | — | | | | — | | |
Distributions reinvested | | | 264 | | | | 4,324 | | | | — | | | | — | | | | — | | | | — | | |
Redemptions | | | (68,666 | ) | | | (1,166,135 | ) | | | — | | | | — | | | | — | | | | — | | |
Net increase | | | 2,163,646 | | | | 36,636,564 | | | | — | | | | — | | | | — | | | | — | | |
Class R5 shares | |
Subscriptions | | | 3,881,879 | | | | 64,071,911 | | | | — | | | | — | | | | — | | | | — | | |
Distributions reinvested | | | 11,861 | | | | 194,042 | | | | — | | | | — | | | | — | | | | — | | |
Redemptions | | | (129,388 | ) | | | (2,244,114 | ) | | | — | | | | — | | | | — | | | | — | | |
Net increase | | | 3,764,352 | | | | 62,021,839 | | | | — | | | | — | | | | — | | | | — | | |
The accompanying Notes to Financial Statements are an integral part of this statement.
Annual Report 2013
16
Columbia Dividend Income Fund
Statement of Changes in Net Assets (continued)
| | | Year Ended May 31,
2013(a) | | Year Ended May 31,
2012(b) | | Year Ended September 30,
2011 | |
| | | Shares | | Dollars ($) | | Shares | | Dollars ($) | | Shares | | Dollars ($) | |
Capital stock activity (continued) | |
Class T shares | |
Subscriptions | | | 67,273 | | | | 1,012,626 | | | | 55,561 | | | | 761,410 | | | | 150,886 | | | | 1,961,263 | | |
Distributions reinvested | | | 96,746 | | | | 1,453,424 | | | | 58,440 | | | | 812,871 | | | | 109,642 | | | | 1,414,376 | | |
Redemptions | | | (757,086 | ) | | | (11,608,520 | ) | | | (527,656 | ) | | | (7,286,576 | ) | | | (938,084 | ) | | | (12,332,826 | ) | |
Net decrease | | | (593,067 | ) | | | (9,142,470 | ) | | | (413,655 | ) | | | (5,712,295 | ) | | | (677,556 | ) | | | (8,957,187 | ) | |
Class W shares | |
Subscriptions | | | 1,292,912 | | | | 19,320,811 | | | | 746,557 | | | | 10,264,661 | | | | 4,878,494 | | | | 64,001,093 | | |
Distributions reinvested | | | 70,316 | | | | 1,042,663 | | | | 43,651 | | | | 606,762 | | | | 58,168 | | | | 740,317 | | |
Redemptions | | | (4,226,000 | ) | | | (65,642,521 | ) | | | (955,633 | ) | | | (13,161,521 | ) | | | (1,358,960 | ) | | | (17,428,109 | ) | |
Net increase (decrease) | | | (2,862,772 | ) | | | (45,279,047 | ) | | | (165,425 | ) | | | (2,290,098 | ) | | | 3,577,702 | | | | 47,313,301 | | |
Class Y shares | |
Subscriptions | | | 76,146 | | | | 1,255,551 | | | | — | | | | — | | | | — | | | | — | | |
Distributions reinvested | | | — | (d) | | | 3 | | | | — | | | | — | | | | — | | | | — | | |
Redemptions | | | (7,227 | ) | | | (120,046 | ) | | | — | | | | — | | | | — | | | | — | | |
Net increase | | | 68,919 | | | | 1,135,508 | | | | — | | | | — | | | | — | | | | — | | |
Class Z shares | |
Subscriptions | | | 102,903,567 | | | | 1,567,502,490 | | | | 89,060,506 | | | | 1,229,645,133 | | | | 86,848,555 | | | | 1,140,726,956 | | |
Distributions reinvested | | | 3,458,110 | | | | 52,224,138 | | | | 1,312,934 | | | | 18,342,883 | | | | 1,553,333 | | | | 19,960,237 | | |
Redemptions | | | (65,428,661 | ) | | | (1,015,814,117 | ) | | | (30,405,107 | ) | | | (420,239,360 | ) | | | (36,526,580 | ) | | | (478,414,308 | ) | |
Net increase | | | 40,933,016 | | | | 603,912,511 | | | | 59,968,333 | | | | 827,748,656 | | | | 51,875,308 | | | | 682,272,885 | | |
Total net increase | | | 75,580,666 | | | | 1,131,235,200 | | | | 97,664,253 | | | | 1,350,220,709 | | | | 113,204,431 | | | | 1,492,699,841 | | |
(a) Class R4, Class R5 and Class Y shares are for the period from November 8, 2012 (commencement of operations) to May 31, 2013.
(b) For the period from October 1, 2011 to May 31, 2012. During the period, the Fund's fiscal year end was changed from September 30 to May 31.
(c) Includes conversions of Class B shares to Class A shares, if any.
(d) Rounds to zero.
The accompanying Notes to Financial Statements are an integral part of this statement.
Annual Report 2013
17
Columbia Dividend Income Fund
The following tables are intended to help you understand the Fund's financial performance. Certain information reflects financial results for a single share of a class held for the periods shown. Per share net investment income (loss) amounts are calculated based on average shares outstanding during the period. Total return assumes reinvestment of all dividends and distributions, if any. Total return does not reflect payment of sales charges, if any, and is not annualized for periods of less than one year.
| | | Year Ended May 31, | | Year Ended September 30, | |
Class A | | 2013 | | 2012(a) | | 2011 | | 2010 | | 2009 | | 2008 | |
Per share data | |
Net asset value, beginning of period | | $ | 13.96 | | | $ | 12.16 | | | $ | 12.12 | | | $ | 11.18 | | | $ | 12.01 | | | $ | 15.35 | | |
Income from investment operations: | |
Net investment income | | | 0.34 | | | | 0.25 | | | | 0.29 | | | | 0.28 | | | | 0.29 | | | | 0.31 | | |
Net realized and unrealized gain (loss) | | | 3.09 | | | | 1.73 | | | | 0.03 | (b) | | | 0.94 | | | | (0.86 | ) | | | (3.18 | ) | |
Total from investment operations | | | 3.43 | | | | 1.98 | | | | 0.32 | | | | 1.22 | | | | (0.57 | ) | | | (2.87 | ) | |
Less distributions to shareholders: | |
Net investment income | | | (0.34 | ) | | | (0.18 | ) | | | (0.28 | ) | | | (0.28 | ) | | | (0.27 | ) | | | (0.31 | ) | |
Net realized gains | | | — | | | | — | | | | — | | | | — | | | | — | | | | (0.16 | ) | |
Total distributions to shareholders | | | (0.34 | ) | | | (0.18 | ) | | | (0.28 | ) | | | (0.28 | ) | | | (0.27 | ) | | | (0.47 | ) | |
Proceeds from regulatory settlements | | | — | | | | — | | | | — | | | | — | | | | 0.01 | | | | — | | |
Net asset value, end of period | | $ | 17.05 | | | $ | 13.96 | | | $ | 12.16 | | | $ | 12.12 | | | $ | 11.18 | | | $ | 12.01 | | |
Total return | | | 24.91 | % | | | 16.26 | % | | | 2.56 | % | | | 11.02 | % | | | (4.33 | %) | | | (19.06 | %) | |
Ratios to average net assets(c) | |
Total gross expenses | | | 1.04 | % | | | 1.06 | %(d) | | | 1.09 | % | | | 1.07 | % | | | 1.11 | % | | | 1.11 | % | |
Total net expenses(e) | | | 1.03 | %(f) | | | 1.00 | %(d) | | | 1.03 | %(f) | | | 1.05 | %(f) | | | 1.05 | %(f) | | | 1.05 | %(f) | |
Net investment income | | | 2.20 | % | | | 2.71 | %(d) | | | 2.23 | % | | | 2.41 | % | | | 2.88 | % | | | 2.24 | % | |
Supplemental data | |
Net assets, end of period (in thousands) | | $ | 2,518,406 | | | $ | 1,729,495 | | | $ | 1,103,389 | | | $ | 728,219 | | | $ | 483,916 | | | $ | 278,122 | | |
Portfolio turnover | | | 24 | % | | | 23 | % | | | 20 | % | | | 17 | % | | | 23 | % | | | 16 | % | |
Notes to Financial Highlights
(a) For the period from October 1, 2011 to May 31, 2012. During the period, the Fund's fiscal year end was changed from September 30 to May 31.
(b) Calculation of the net gain (loss) per share (both realized and unrealized) does not correlate to the aggregate realized and unrealized gain (loss) presented in the Statement of Operations due to the timing of sales and repurchases of Fund shares in relation to fluctuations in the market value of the portfolio.
(c) In addition to the fees and expenses which the Fund bears directly, the Fund indirectly bears a pro rata share of the fees and expenses of the acquired funds in which it invests. Such indirect expenses are not included in the reported expense ratios.
(d) Annualized.
(e) Total net expenses include the impact of certain waivers/reimbursements made by the Investment Manager and certain of its affiliates, if applicable.
(f) The benefits derived from expense reductions had an impact of less than 0.01%.
The accompanying Notes to Financial Statements are an integral part of this statement.
Annual Report 2013
18
Columbia Dividend Income Fund
Financial Highlights (continued)
| | | Year Ended May 31, | | Year Ended September 30, | |
Class B | | 2013 | | 2012(a) | | 2011 | | 2010 | | 2009 | | 2008 | |
Per share data | |
Net asset value, beginning of period | | $ | 13.63 | | | $ | 11.89 | | | $ | 11.86 | | | $ | 10.94 | | | $ | 11.75 | | | $ | 15.03 | | |
Income from investment operations: | |
Net investment income | | | 0.22 | | | | 0.18 | | | | 0.19 | | | | 0.19 | | | | 0.21 | | | | 0.20 | | |
Net realized and unrealized gain (loss) | | | 3.02 | | | | 1.69 | | | | 0.03 | (b) | | | 0.93 | | | | (0.82 | ) | | | (3.11 | ) | |
Total from investment operations | | | 3.24 | | | | 1.87 | | | | 0.22 | | | | 1.12 | | | | (0.61 | ) | | | (2.91 | ) | |
Less distributions to shareholders: | |
Net investment income | | | (0.23 | ) | | | (0.13 | ) | | | (0.19 | ) | | | (0.20 | ) | | | (0.20 | ) | | | (0.21 | ) | |
Net realized gains | | | — | | | | — | | | | — | | | | — | | | | — | | | | (0.16 | ) | |
Total distributions to shareholders | | | (0.23 | ) | | | (0.13 | ) | | | (0.19 | ) | | | (0.20 | ) | | | (0.20 | ) | | | (0.37 | ) | |
Proceeds from regulatory settlements | | | — | | | | — | | | | — | | | | — | | | | 0.00 | (c) | | | — | | |
Net asset value, end of period | | $ | 16.64 | | | $ | 13.63 | | | $ | 11.89 | | | $ | 11.86 | | | $ | 10.94 | | | $ | 11.75 | | |
Total return | | | 23.99 | % | | | 15.69 | % | | | 1.74 | % | | | 10.24 | % | | | (4.97 | %) | | | (19.71 | %) | |
Ratios to average net assets(d) | |
Total gross expenses | | | 1.79 | % | | | 1.81 | %(e) | | | 1.85 | % | | | 1.82 | % | | | 1.86 | % | | | 1.86 | % | |
Total net expenses(f) | | | 1.77 | %(g) | | | 1.75 | %(e) | | | 1.79 | %(g) | | | 1.80 | %(g) | | | 1.80 | %(g) | | | 1.80 | %(g) | |
Net investment income | | | 1.47 | % | | | 1.96 | %(e) | | | 1.48 | % | | | 1.67 | % | | | 2.18 | % | | | 1.48 | % | |
Supplemental data | |
Net assets, end of period (in thousands) | | $ | 15,034 | | | $ | 15,095 | | | $ | 15,659 | | | $ | 21,126 | | | $ | 28,006 | | | $ | 31,307 | | |
Portfolio turnover | | | 24 | % | | | 23 | % | | | 20 | % | | | 17 | % | | | 23 | % | | | 16 | % | |
Notes to Financial Highlights
(a) For the period from October 1, 2011 to May 31, 2012. During the period, the Fund's fiscal year end was changed from September 30 to May 31.
(b) Calculation of the net gain (loss) per share (both realized and unrealized) does not correlate to the aggregate realized and unrealized gain (loss) presented in the Statement of Operations due to the timing of sales and repurchases of Fund shares in relation to fluctuations in the market value of the portfolio.
(c) Rounds to zero.
(d) In addition to the fees and expenses which the Fund bears directly, the Fund indirectly bears a pro rata share of the fees and expenses of the acquired funds in which it invests. Such indirect expenses are not included in the reported expense ratios.
(e) Annualized.
(f) Total net expenses include the impact of certain waivers/reimbursements made by the Investment Manager and certain of its affiliates, if applicable.
(g) The benefits derived from expense reductions had an impact of less than 0.01%.
The accompanying Notes to Financial Statements are an integral part of this statement.
Annual Report 2013
19
Columbia Dividend Income Fund
Financial Highlights (continued)
| | | Year Ended May 31, | | Year Ended September 30, | |
Class C | | 2013 | | 2012(a) | | 2011 | | 2010 | | 2009 | | 2008 | |
Per share data | |
Net asset value, beginning of period | | $ | 13.62 | | | $ | 11.88 | | | $ | 11.85 | | | $ | 10.93 | | | $ | 11.74 | | | $ | 15.02 | | |
Income from investment operations: | |
Net investment income | | | 0.22 | | | | 0.18 | | | | 0.19 | | | | 0.19 | | | | 0.20 | | | | 0.20 | | |
Net realized and unrealized gain (loss) | | | 3.02 | | | | 1.69 | | | | 0.03 | (b) | | | 0.93 | | | | (0.82 | ) | | | (3.11 | ) | |
Total from investment operations | | | 3.24 | | | | 1.87 | | | | 0.22 | | | | 1.12 | | | | (0.62 | ) | | | (2.91 | ) | |
Less distributions to shareholders: | |
Net investment income | | | (0.23 | ) | | | (0.13 | ) | | | (0.19 | ) | | | (0.20 | ) | | | (0.20 | ) | | | (0.21 | ) | |
Net realized gains | | | — | | | | — | | | | — | | | | — | | | | — | | | | (0.16 | ) | |
Total distributions to shareholders | | | (0.23 | ) | | | (0.13 | ) | | | (0.19 | ) | | | (0.20 | ) | | | (0.20 | ) | | | (0.37 | ) | |
Proceeds from regulatory settlements | | | — | | | | — | | | | — | | | | — | | | | 0.01 | | | | — | | |
Net asset value, end of period | | $ | 16.63 | | | $ | 13.62 | | | $ | 11.88 | | | $ | 11.85 | | | $ | 10.93 | | | $ | 11.74 | | |
Total return | | | 24.00 | % | | | 15.71 | % | | | 1.74 | % | | | 10.25 | % | | | (4.98 | %) | | | (19.72 | %) | |
Ratios to average net assets(c) | |
Total gross expenses | | | 1.79 | % | | | 1.81 | %(d) | | | 1.84 | % | | | 1.82 | % | | | 1.86 | % | | | 1.86 | % | |
Total net expenses(e) | | | 1.78 | %(f) | | | 1.75 | %(d) | | | 1.78 | %(f) | | | 1.80 | %(f) | | | 1.80 | %(f) | | | 1.80 | %(f) | |
Net investment income | | | 1.45 | % | | | 1.96 | %(d) | | | 1.49 | % | | | 1.66 | % | | | 2.08 | % | | | 1.48 | % | |
Supplemental data | |
Net assets, end of period (in thousands) | | $ | 459,966 | | | $ | 279,093 | | | $ | 181,875 | | | $ | 94,091 | | | $ | 48,438 | | | $ | 12,635 | | |
Portfolio turnover | | | 24 | % | | | 23 | % | | | 20 | % | | | 17 | % | | | 23 | % | | | 16 | % | |
Notes to Financial Highlights
(a) For the period from October 1, 2011 to May 31, 2012. During the period, the Fund's fiscal year end was changed from September 30 to May 31.
(b) Calculation of the net gain (loss) per share (both realized and unrealized) does not correlate to the aggregate realized and unrealized gain (loss) presented in the Statement of Operations due to the timing of sales and repurchases of Fund shares in relation to fluctuations in the market value of the portfolio.
(c) In addition to the fees and expenses which the Fund bears directly, the Fund indirectly bears a pro rata share of the fees and expenses of the acquired funds in which it invests. Such indirect expenses are not included in the reported expense ratios.
(d) Annualized.
(e) Total net expenses include the impact of certain waivers/reimbursements made by the Investment Manager and certain of its affiliates, if applicable.
(f) The benefits derived from expense reductions had an impact of less than 0.01%.
The accompanying Notes to Financial Statements are an integral part of this statement.
Annual Report 2013
20
Columbia Dividend Income Fund
Financial Highlights (continued)
| | | Year Ended May 31, | | Year Ended September 30, | |
Class I | | 2013 | | 2012(a) | | 2011 | | 2010(b) | |
Per share data | |
Net asset value, beginning of period | | $ | 13.99 | | | $ | 12.18 | | | $ | 12.13 | | | $ | 12.14 | | |
Income from investment operations: | |
Net investment income | | | 0.41 | | | | 0.28 | | | | 0.35 | | | | 0.01 | | |
Net realized and unrealized gain (loss) | | | 3.09 | | | | 1.73 | | | | 0.03 | (c) | | | (0.02 | ) | |
Total from investment operations | | | 3.50 | | | | 2.01 | | | | 0.38 | | | | (0.01 | ) | |
Less distributions to shareholders: | |
Net investment income | | | (0.40 | ) | | | (0.20 | ) | | | (0.33 | ) | | | — | | |
Total distributions to shareholders | | | (0.40 | ) | | | (0.20 | ) | | | (0.33 | ) | | | — | | |
Net asset value, end of period | | $ | 17.09 | | | $ | 13.99 | | | $ | 12.18 | | | $ | 12.13 | | |
Total return | | | 25.42 | % | | | 16.53 | % | | | 3.02 | % | | | (0.08 | %) | |
Ratios to average net assets(d) | |
Total gross expenses | | | 0.60 | % | | | 0.63 | %(e) | | | 0.67 | % | | | 0.71 | %(e) | |
Total net expenses(f) | | | 0.60 | % | | | 0.63 | %(e) | | | 0.67 | %(g) | | | 0.71 | %(e)(g) | |
Net investment income | | | 2.64 | % | | | 3.08 | %(e) | | | 2.62 | % | | | 8.17 | %(e) | |
Supplemental data | |
Net assets, end of period (in thousands) | | $ | 320,524 | | | $ | 271,694 | | | $ | 249,778 | | | $ | 2 | | |
Portfolio turnover | | | 24 | % | | | 23 | % | | | 20 | % | | | 17 | % | |
Notes to Financial Highlights
(a) For the period from October 1, 2011 to May 31, 2012. During the period, the Fund's fiscal year end was changed from September 30 to May 31.
(b) For the period from September 27, 2010 (commencement of operations) to September 30, 2010.
(c) Calculation of the net gain (loss) per share (both realized and unrealized) does not correlate to the aggregate realized and unrealized gain (loss) presented in the Statement of Operations due to the timing of sales and repurchases of Fund shares in relation to fluctuations in the market value of the portfolio.
(d) In addition to the fees and expenses which the Fund bears directly, the Fund indirectly bears a pro rata share of the fees and expenses of the acquired funds in which it invests. Such indirect expenses are not included in the reported expense ratios.
(e) Annualized.
(f) Total net expenses include the impact of certain waivers/reimbursements made by the Investment Manager and certain of its affiliates, if applicable.
(g) The benefits derived from expense reductions had an impact of less than 0.01%.
The accompanying Notes to Financial Statements are an integral part of this statement.
Annual Report 2013
21
Columbia Dividend Income Fund
Financial Highlights (continued)
| | | Year Ended May 31, | | Year Ended September 30, | |
Class R | | 2013 | | 2012(a) | | 2011 | | 2010 | | 2009 | | 2008(b) | |
Per share data | |
Net asset value, beginning of period | | $ | 13.96 | | | $ | 12.17 | | | $ | 12.13 | | | $ | 11.18 | | | $ | 12.01 | | | $ | 13.39 | | |
Income from investment operations: | |
Net investment income | | | 0.30 | | | | 0.23 | | | | 0.26 | | | | 0.27 | | | | 0.28 | | | | 0.14 | | |
Net realized and unrealized gain (loss) | | | 3.09 | | | | 1.72 | | | | 0.03 | (c) | | | 0.93 | | | | (0.86 | ) | | | (1.38 | ) | |
Total from investment operations | | | 3.39 | | | | 1.95 | | | | 0.29 | | | | 1.20 | | | | (0.58 | ) | | | (1.24 | ) | |
Less distributions to shareholders: | |
Net investment income | | | (0.30 | ) | | | (0.16 | ) | | | (0.25 | ) | | | (0.25 | ) | | | (0.25 | ) | | | (0.14 | ) | |
Total distributions to shareholders | | | (0.30 | ) | | | (0.16 | ) | | | (0.25 | ) | | | (0.25 | ) | | | (0.25 | ) | | | (0.14 | ) | |
Proceeds from regulatory settlements | | | — | | | | — | | | | — | | | | — | | | | 0.00 | (d) | | | — | | |
Net asset value, end of period | | $ | 17.05 | | | $ | 13.96 | | | $ | 12.17 | | | $ | 12.13 | | | $ | 11.18 | | | $ | 12.01 | | |
Total return | | | 24.60 | % | | | 16.03 | % | | | 2.30 | % | | | 10.84 | % | | | (4.57 | %) | | | (9.28 | %) | |
Ratios to average net assets(e) | |
Total gross expenses | | | 1.29 | % | | | 1.31 | %(f) | | | 1.34 | % | | | 1.32 | % | | | 1.36 | % | | | 1.36 | %(f) | |
Total net expenses(g) | | | 1.28 | %(h) | | | 1.25 | %(f) | | | 1.28 | %(h) | | | 1.30 | %(h) | | | 1.30 | %(h) | | | 1.30 | %(f)(h) | |
Net investment income | | | 1.95 | % | | | 2.46 | %(f) | | | 1.98 | % | | | 2.27 | % | | | 2.59 | % | | | 2.10 | %(f) | |
Supplemental data | |
Net assets, end of period (in thousands) | | $ | 72,979 | | | $ | 32,183 | | | $ | 13,101 | | | $ | 8,577 | | | $ | 657 | | | $ | 11 | | |
Portfolio turnover | | | 24 | % | | | 23 | % | | | 20 | % | | | 17 | % | | | 23 | % | | | 16 | % | |
Notes to Financial Highlights
(a) For the period from October 1, 2011 to May 31, 2012. During the period, the Fund's fiscal year end was changed from September 30 to May 31.
(b) For the period from March 28, 2008 (commencement of operations) to September 30, 2008.
(c) Calculation of the net gain (loss) per share (both realized and unrealized) does not correlate to the aggregate realized and unrealized gain (loss) presented in the Statement of Operations due to the timing of sales and repurchases of Fund shares in relation to fluctuations in the market value of the portfolio.
(d) Rounds to zero.
(e) In addition to the fees and expenses which the Fund bears directly, the Fund indirectly bears a pro rata share of the fees and expenses of the acquired funds in which it invests. Such indirect expenses are not included in the reported expense ratios.
(f) Annualized.
(g) Total net expenses include the impact of certain waivers/reimbursements made by the Investment Manager and certain of its affiliates, if applicable.
(h) The benefits derived from expense reductions had an impact of less than 0.01%.
The accompanying Notes to Financial Statements are an integral part of this statement.
Annual Report 2013
22
Columbia Dividend Income Fund
Financial Highlights (continued)
Class R4 | | Year Ended
May 31,
2013(a) | |
Per share data | |
Net asset value, beginning of period | | $ | 14.65 | | |
Income from investment operations: | |
Net investment income | | | 0.20 | | |
Net realized and unrealized gain | | | 2.60 | | |
Total from investment operations | | | 2.80 | | |
Less distributions to shareholders: | |
Net investment income | | | (0.18 | ) | |
Total distributions to shareholders | | | (0.18 | ) | |
Net asset value, end of period | | $ | 17.27 | | |
Total return | | | 19.22 | % | |
Ratios to average net assets(b) | |
Total gross expenses | | | 0.82 | %(c) | |
Total net expenses(d) | | | 0.82 | %(c) | |
Net investment income | | | 2.17 | %(c) | |
Supplemental data | |
Net assets, end of period (in thousands) | | $ | 37,359 | | |
Portfolio turnover | | | 24 | % | |
Notes to Financial Highlights
(a) For the period from November 8, 2012 (commencement of operations) to May 31, 2013.
(b) In addition to the fees and expenses which the Fund bears directly, the Fund indirectly bears a pro rata share of the fees and expenses of the acquired funds in which it invests. Such indirect expenses are not included in the reported expense ratios.
(c) Annualized.
(d) Total net expenses include the impact of certain waivers/reimbursements made by the Investment Manager and certain of its affiliates, if applicable.
The accompanying Notes to Financial Statements are an integral part of this statement.
Annual Report 2013
23
Columbia Dividend Income Fund
Financial Highlights (continued)
Class R5 | | Year Ended
May 31,
2013(a) | |
Per share data | |
Net asset value, beginning of period | | $ | 14.65 | | |
Income from investment operations: | |
Net investment income | | | 0.22 | | |
Net realized and unrealized gain | | | 2.58 | | |
Total from investment operations | | | 2.80 | | |
Less distributions to shareholders: | |
Net investment income | | | (0.19 | ) | |
Total distributions to shareholders | | | (0.19 | ) | |
Net asset value, end of period | | $ | 17.26 | | |
Total return | | | 19.27 | % | |
Ratios to average net assets(b) | |
Total gross expenses | | | 0.65 | %(c) | |
Total net expenses(d) | | | 0.65 | %(c) | |
Net investment income | | | 2.41 | %(c) | |
Supplemental data | |
Net assets, end of period (in thousands) | | $ | 64,986 | | |
Portfolio turnover | | | 24 | % | |
Notes to Financial Highlights
(a) For the period from November 8, 2012 (commencement of operations) to May 31, 2013.
(b) In addition to the fees and expenses which the Fund bears directly, the Fund indirectly bears a pro rata share of the fees and expenses of the acquired funds in which it invests. Such indirect expenses are not included in the reported expense ratios.
(c) Annualized.
(d) Total net expenses include the impact of certain waivers/reimbursements made by the Investment Manager and certain of its affiliates, if applicable.
The accompanying Notes to Financial Statements are an integral part of this statement.
Annual Report 2013
24
Columbia Dividend Income Fund
Financial Highlights (continued)
| | | Year Ended May 31, | | Year Ended September 30, | |
Class T | | 2013 | | 2012(a) | | 2011 | | 2010 | | 2009 | | 2008 | |
Per share data | |
Net asset value, beginning of period | | $ | 13.96 | | | $ | 12.17 | | | $ | 12.13 | | | $ | 11.18 | | | $ | 12.01 | | | $ | 15.35 | | |
Income from investment operations: | |
Net investment income | | | 0.33 | | | | 0.24 | | | | 0.29 | | | | 0.28 | | | | 0.29 | | | | 0.30 | | |
Net realized and unrealized gain (loss) | | | 3.09 | | | | 1.72 | | | | 0.03 | (b) | | | 0.95 | | | | (0.85 | ) | | | (3.18 | ) | |
Total from investment operations | | | 3.42 | | | | 1.96 | | | | 0.32 | | | | 1.23 | | | | (0.56 | ) | | | (2.88 | ) | |
Less distributions to shareholders: | |
Net investment income | | | (0.33 | ) | | | (0.17 | ) | | | (0.28 | ) | | | (0.28 | ) | | | (0.27 | ) | | | (0.30 | ) | |
Net realized gains | | | — | | | | — | | | | — | | | | — | | | | — | | | | (0.16 | ) | |
Total distributions to shareholders | | | (0.33 | ) | | | (0.17 | ) | | | (0.28 | ) | | | (0.28 | ) | | | (0.27 | ) | | | (0.46 | ) | |
Proceeds from regulatory settlements | | | — | | | | — | | | | — | | | | — | | | | 0.00 | (c) | | | — | | |
Net asset value, end of period | | $ | 17.05 | | | $ | 13.96 | | | $ | 12.17 | | | $ | 12.13 | | | $ | 11.18 | | | $ | 12.01 | | |
Total return | | | 24.85 | % | | | 16.14 | % | | | 2.51 | % | | | 11.06 | % | | | (4.38 | %) | | | (19.10 | %) | |
Ratios to average net assets(d) | |
Total gross expenses | | | 1.09 | % | | | 1.11 | %(e) | | | 1.15 | % | | | 1.12 | % | | | 1.16 | % | | | 1.16 | % | |
Total net expenses(f) | | | 1.08 | %(g) | | | 1.05 | %(e) | | | 1.09 | %(g) | | | 1.10 | %(g) | | | 1.10 | %(g) | | | 1.10 | %(g) | |
Net investment income | | | 2.16 | % | | | 2.65 | %(e) | | | 2.18 | % | | | 2.36 | % | | | 2.87 | % | | | 2.19 | % | |
Supplemental data | |
Net assets, end of period (in thousands) | | $ | 84,342 | | | $ | 77,344 | | | $ | 72,421 | | | $ | 80,405 | | | $ | 73,773 | | | $ | 72,213 | | |
Portfolio turnover | | | 24 | % | | | 23 | % | | | 20 | % | | | 17 | % | | | 23 | % | | | 16 | % | |
Notes to Financial Highlights
(a) For the period from October 1, 2011 to May 31, 2012. During the period, the Fund's fiscal year end was changed from September 30 to May 31.
(b) Calculation of the net gain (loss) per share (both realized and unrealized) does not correlate to the aggregate realized and unrealized gain (loss) presented in the Statement of Operations due to the timing of sales and repurchases of Fund shares in relation to fluctuations in the market value of the portfolio.
(c) Rounds to zero.
(d) In addition to the fees and expenses which the Fund bears directly, the Fund indirectly bears a pro rata share of the fees and expenses of the acquired funds in which it invests. Such indirect expenses are not included in the reported expense ratios.
(e) Annualized.
(f) Total net expenses include the impact of certain waivers/reimbursements made by the Investment Manager and certain of its affiliates, if applicable.
(g) The benefits derived from expense reductions had an impact of less than 0.01%.
The accompanying Notes to Financial Statements are an integral part of this statement.
Annual Report 2013
25
Columbia Dividend Income Fund
Financial Highlights (continued)
| | | Year Ended May 31, | | Year Ended September 30, | |
Class W | | 2013 | | 2012(a) | | 2011 | | 2010(b) | |
Per share data | |
Net asset value, beginning of period | | $ | 13.96 | | | $ | 12.16 | | | $ | 12.12 | | | $ | 12.13 | | |
Income from investment operations: | |
Net investment income | | | 0.33 | | | | 0.25 | | | | 0.30 | | | | 0.01 | | |
Net realized and unrealized gain (loss) | | | 3.10 | | | | 1.73 | | | | 0.02 | (c) | | | (0.02 | ) | |
Total from investment operations | | | 3.43 | | | | 1.98 | | | | 0.32 | | | | (0.01 | ) | |
Less distributions to shareholders: | |
Net investment income | | | (0.34 | ) | | | (0.18 | ) | | | (0.28 | ) | | | — | | |
Total distributions to shareholders | | | (0.34 | ) | | | (0.18 | ) | | | (0.28 | ) | | | — | | |
Net asset value, end of period | | $ | 17.05 | | | $ | 13.96 | | | $ | 12.16 | | | $ | 12.12 | | |
Total return | | | 24.91 | % | | | 16.27 | % | | | 2.57 | % | | | (0.08 | %) | |
Ratios to average net assets(d) | |
Total gross expenses | | | 1.04 | % | | | 1.05 | %(e) | | | 1.08 | % | | | 1.06 | %(e) | |
Total net expenses(f) | | | 1.02 | %(g) | | | 1.00 | %(e) | | | 1.00 | %(g) | | | 1.05 | %(e)(g) | |
Net investment income | | | 2.20 | % | | | 2.71 | %(e) | | | 2.28 | % | | | 7.83 | %(e) | |
Supplemental data | |
Net assets, end of period (in thousands) | | $ | 9,373 | | | $ | 47,647 | | | $ | 43,525 | | | $ | 2 | | |
Portfolio turnover | | | 24 | % | | | 23 | % | | | 20 | % | | | 17 | % | |
Notes to Financial Highlights
(a) For the period from October 1, 2011 to May 31, 2012. During the period, the Fund's fiscal year end was changed from September 30 to May 31.
(b) For the period from September 27, 2010 (commencement of operations) to September 30, 2010.
(c) Calculation of the net gain (loss) per share (both realized and unrealized) does not correlate to the aggregate realized and unrealized gain (loss) presented in the Statement of Operations due to the timing of sales and repurchases of Fund shares in relation to fluctuations in the market value of the portfolio.
(d) In addition to the fees and expenses which the Fund bears directly, the Fund indirectly bears a pro rata share of the fees and expenses of the acquired funds in which it invests. Such indirect expenses are not included in the reported expense ratios.
(e) Annualized.
(f) Total net expenses include the impact of certain waivers/reimbursements made by the Investment Manager and certain of its affiliates, if applicable.
(g) The benefits derived from expense reductions had an impact of less than 0.01%.
The accompanying Notes to Financial Statements are an integral part of this statement.
Annual Report 2013
26
Columbia Dividend Income Fund
Financial Highlights (continued)
Class Y | | Year Ended
May 31,
2013(a) | |
Per share data | |
Net asset value, beginning of period | | $ | 14.66 | | |
Income from investment operations | |
Net investment income | | | 0.23 | | |
Net realized and unrealized gain | | | 2.58 | | |
Total from investment operations | | | 2.81 | | |
Less distributions to shareholders: | |
Net investment income | | | (0.20 | ) | |
Total distributions to shareholders | | | (0.20 | ) | |
Net asset value, end of period | | $ | 17.27 | | |
Total return | | | 19.29 | % | |
Ratios to average net assets(b) | |
Total gross expenses | | | 0.60 | %(c) | |
Total net expenses(d) | | | 0.60 | %(c) | |
Net investment income | | | 2.49 | %(c) | |
Supplemental data | |
Net assets, end of period (in thousands) | | $ | 1,190 | | |
Portfolio turnover | | | 24 | % | |
Notes to Financial Highlights
(a) For the period from November 8, 2012 (commencement of operations) to May 31, 2013.
(b) In addition to the fees and expenses which the Fund bears directly, the Fund indirectly bears a pro rata share of the fees and expenses of the acquired funds in which it invests. Such indirect expenses are not included in the reported expense ratios.
(c) Annualized.
(d) Total net expenses include the impact of certain waivers/reimbursements made by the Investment Manager and certain of its affiliates, if applicable.
The accompanying Notes to Financial Statements are an integral part of this statement.
Annual Report 2013
27
Columbia Dividend Income Fund
Financial Highlights (continued)
| | | Year Ended May 31, | | Year Ended September 30, | |
Class Z | | 2013 | | 2012(a) | | 2011 | | 2010 | | 2009 | | 2008 | |
Per share data | |
Net asset value, beginning of period | | $ | 13.97 | | | $ | 12.17 | | | $ | 12.13 | | | $ | 11.18 | | | $ | 12.01 | | | $ | 15.36 | | |
Income from investment operations: | |
Net investment income | | | 0.38 | | | | 0.27 | | | | 0.33 | | | | 0.31 | | | | 0.31 | | | | 0.34 | | |
Net realized and unrealized gain (loss) | | | 3.10 | | | | 1.72 | | | | 0.03 | (b) | | | 0.95 | | | | (0.85 | ) | | | (3.19 | ) | |
Total from investment operations | | | 3.48 | | | | 1.99 | | | | 0.36 | | | | 1.26 | | | | (0.54 | ) | | | (2.85 | ) | |
Less distributions to shareholders: | |
Net investment income | | | (0.38 | ) | | | (0.19 | ) | | | (0.32 | ) | | | (0.31 | ) | | | (0.30 | ) | | | (0.34 | ) | |
Net realized gains | | | — | | | | — | | | | — | | | | — | | | | — | | | | (0.16 | ) | |
Total distributions to shareholders | | | (0.38 | ) | | | (0.19 | ) | | | (0.32 | ) | | | (0.31 | ) | | | (0.30 | ) | | | (0.50 | ) | |
Proceeds from regulatory settlements | | | — | | | | — | | | | — | | | | — | | | | 0.01 | | | | — | | |
Net asset value, end of period | | $ | 17.07 | | | $ | 13.97 | | | $ | 12.17 | | | $ | 12.13 | | | $ | 11.18 | | | $ | 12.01 | | |
Total return | | | 25.27 | % | | | 16.39 | % | | | 2.82 | % | | | 11.38 | % | | | (4.10 | %) | | | (18.90 | %) | |
Ratios to average net assets(c) | |
Total gross expenses | | | 0.79 | % | | | 0.80 | %(d) | | | 0.84 | % | | | 0.82 | % | | | 0.86 | % | | | 0.86 | % | |
Total net expenses(e) | | | 0.78 | %(f) | | | 0.75 | %(d) | | | 0.79 | %(f) | | | 0.80 | %(f) | | | 0.80 | %(f) | | | 0.80 | %(f) | |
Net investment income | | | 2.46 | % | | | 2.96 | %(d) | | | 2.48 | % | | | 2.66 | % | | | 3.15 | % | | | 2.51 | % | |
Supplemental data | |
Net assets, end of period (in thousands) | | $ | 4,846,586 | | | $ | 3,396,290 | | | $ | 2,227,757 | | | $ | 1,591,420 | | | $ | 1,060,268 | | | $ | 671,700 | | |
Portfolio turnover | | | 24 | % | | | 23 | % | | | 20 | % | | | 17 | % | | | 23 | % | | | 16 | % | |
Notes to Financial Highlights
(a) For the period from October 1, 2011 to May 31, 2012. During the period, the Fund's fiscal year end was changed from September 30 to May 31.
(b) Calculation of the net gain (loss) per share (both realized and unrealized) does not correlate to the aggregate realized and unrealized gain (loss) presented in the Statement of Operations due to the timing of sales and repurchases of Fund shares in relation to fluctuations in the market value of the portfolio.
(c) In addition to the fees and expenses which the Fund bears directly, the Fund indirectly bears a pro rata share of the fees and expenses of the acquired funds in which it invests. Such indirect expenses are not included in the reported expense ratios.
(d) Annualized.
(e) Total net expenses include the impact of certain waivers/reimbursements made by the Investment Manager and certain of its affiliates, if applicable.
(f) The benefits derived from expense reductions had an impact of less than 0.01%.
The accompanying Notes to Financial Statements are an integral part of this statement.
Annual Report 2013
28
Columbia Dividend Income Fund
Notes to Financial Statements
May 31, 2013
Note 1. Organization
Columbia Dividend Income Fund (the Fund), a series of Columbia Funds Series Trust I (the Trust), is a diversified fund. The Trust is registered under the Investment Company Act of 1940, as amended (the 1940 Act), as an open-end management investment company organized as a Massachusetts business trust.
Fund Shares
The Trust may issue an unlimited number of shares (without par value). The Fund offers Class A, Class B, Class C, Class I, Class R, Class R4, Class R5, Class T, Class W, Class Y and Class Z shares. Although all share classes generally have identical voting, dividend and liquidation rights, each class votes separately when required by law. Different share classes pay different distribution amounts to the extent the expenses of such class differ, and distributions in liquidation will be proportional to the net asset value of each share class. Each share class has its own expense structure and sales charges, as applicable.
Class A shares are subject to a maximum front-end sales charge of 5.75% based on the initial investment amount. Class A shares purchased without an initial sales charge in accounts aggregating $1 million to $50 million at the time of purchase are subject to a contingent deferred sales charge (CDSC) if the shares are sold within 18 months of purchase, charged as follows: 1.00% CDSC if redeemed within 12 months of purchase, and 0.50% CDSC if redeemed more than 12, but less than 18, months after purchase.
Class B shares may be subject to a maximum CDSC of 5.00% based upon the holding period after purchase. Class B shares will generally convert to Class A shares eight years after purchase. The Fund no longer accepts investments by new or existing investors in the Fund's Class B shares, except in connection with the reinvestment of any dividend and/or capital gain distributions in Class B shares of the Fund and exchanges by existing Class B shareholders of certain other funds within the Columbia Family of Funds.
Class C shares are subject to a 1.00% CDSC on shares redeemed within one year of purchase.
Class I shares are not subject to sales charges and are available only to the Columbia Family of Funds.
Class R shares are not subject to sales charges and are available only to certain retirement plans and other eligible investors.
Class R4 shares are not subject to sales charges and are generally available only to omnibus retirement plans and
certain other eligible investors. Class R4 shares commenced operations on November 8, 2012.
Class R5 shares are not subject to sales charges and are generally available only to investors purchasing through authorized investment professionals and omnibus retirement plans. Class R5 shares commenced operations on November 8, 2012.
Class T shares are subject to a maximum front-end sales charge of 5.75% based on the investment amount. Class T shares purchased without an initial sales charge in accounts aggregating $1 million to $50 million at the time of purchase are subject to a CDSC if the shares are sold within 18 months of purchase, charged as follows: 1.00% CDSC if redeemed within 12 months of purchase, and 0.50% CDSC if redeemed more than 12, but less than 18, months after purchase. Class T shares are available only to investors who received (and who have continuously held) Class T shares in connection with the merger of certain Galaxy Funds into various Columbia Funds (formerly named Liberty Funds).
Class W shares are not subject to sales charges and are available only to investors purchasing through authorized investment programs managed by investment professionals, including discretionary managed account programs.
Class Y shares are not subject to sales charges and are generally available only to certain retirement plans. Class Y shares commenced operations on November 8, 2012.
Class Z shares are not subject to sales charges and are available only to certain investors.
Note 2. Summary of Significant Accounting Policies
Use of Estimates
The preparation of financial statements in accordance with U.S. generally accepted accounting principles (GAAP) requires management to make certain estimates and assumptions that affect the reported amounts of assets and liabilities, the disclosure of contingent assets and liabilities at the date of the financial statements and the reported amounts of revenue and expenses during the reporting period. Actual results could differ from those estimates.
The following is a summary of significant accounting policies consistently followed by the Fund in the preparation of its financial statements.
Security Valuation
All equity securities are valued at the close of business of the New York Stock Exchange (NYSE). Equity securities are valued at the last quoted sales price on the principal exchange
Annual Report 2013
29
Columbia Dividend Income Fund
Notes to Financial Statements (continued)
May 31, 2013
or market on which they trade, except for securities traded on the NASDAQ Stock Market, which are valued at the NASDAQ official close price. Unlisted securities or listed securities for which there were no sales during the day are valued at the mean of the latest quoted bid and ask prices on such exchanges or markets.
Foreign equity securities are valued based on quotations from the principal market in which such securities are normally traded. If any foreign share prices are not readily available as a result of limited share activity the securities are valued at the mean of the latest quoted bid and ask prices on such exchanges or markets. Foreign currency exchange rates are generally determined at 4:00 p.m. Eastern (U.S.) time. However, many securities markets and exchanges outside the U.S. close prior to the close of the NYSE; therefore, the closing prices for securities in such markets or on such exchanges may not fully reflect events that occur after such close but before the close of the NYSE. In those situations, foreign securities will be fair valued pursuant to the policy adopted by the Board of Trustees (the Board), including utilizing a third party pricing service to determine these fair values. The third party pricing service takes into account multiple factors, including, but not limited to, movements in the U.S. securities markets, certain depositary receipts, futures contracts and foreign exchange rates that have occurred subsequent to the close of the foreign exchange or market, to determine a good faith estimate that reasonably reflects the current market conditions as of the close of the NYSE. The fair value of a security is likely to be different from the quoted or published price, if available.
Investments in other open-end investment companies, including money market funds, are valued at net asset value.
Investments for which market quotations are not readily available, or that have quotations which management believes are not reliable, are valued at fair value as determined in good faith under consistently applied procedures established by and under the general supervision of the Board. If a security or class of securities (such as foreign securities) is valued at fair value, such value is likely to be different from the last quoted market price for the security.
The determination of fair value often requires significant judgment. To determine fair value, management may use assumptions including but not limited to future cash flows and estimated risk premiums. Multiple inputs from various sources may be used to determine fair value.
Foreign Currency Transactions and Translations
The values of all assets and liabilities denominated in foreign currencies are translated into U.S. dollars at that day's
exchange rates. Net realized and unrealized gains (losses) on foreign currency transactions and translations include gains (losses) arising from the fluctuation in exchange rates between trade and settlement dates on securities transactions, gains (losses) arising from the disposition of foreign currency and currency gains (losses) between the accrual and payment dates on dividends, interest income and foreign withholding taxes.
For financial statement purposes, the Fund does not distinguish that portion of gains (losses) on investments which is due to changes in foreign exchange rates from that which is due to changes in market prices of the investments. Such fluctuations are included with the net realized and unrealized gains (losses) on investments in the Statement of Operations.
Security Transactions
Security transactions are accounted for on the trade date. Cost is determined and gains (losses) are based upon the specific identification method for both financial statement and federal income tax purposes.
Income Recognition
Corporate actions and dividend income are recorded net of any non-reclaimable tax withholdings, on the ex-dividend date or upon receipt of ex-dividend notification in the case of certain foreign securities.
The Fund may receive distributions from holdings in business development companies (BDCs), exchange traded funds (ETFs) and real estate investment trusts (REITs), which report information on the character of their distributions annually. These distributions are allocated to dividend income, capital gain and return of capital based on estimates made by the Fund's management if actual information has not yet been reported. Return of capital is recorded as a reduction of the cost basis of securities held. If the Fund no longer owns the applicable securities, return of capital is recorded as a realized gain. Management's estimates are subsequently adjusted when the actual character of the distributions is disclosed by the BDCs, ETFs and REITs, which could result in a proportionate change in return of capital to shareholders.
Awards from class action litigation are recorded as a reduction of cost basis if the Fund still owns the applicable securities on the payment date. If the Fund no longer owns the applicable securities, the proceeds are recorded as realized gains.
Expenses
General expenses of the Trust are allocated to the Fund and other funds of the Trust based upon relative net assets or other expense allocation methodologies determined by the nature of the expense. Expenses directly attributable to the Fund are
Annual Report 2013
30
Columbia Dividend Income Fund
Notes to Financial Statements (continued)
May 31, 2013
charged to the Fund. Expenses directly attributable to a specific class of shares are charged to that share class.
Determination of Class Net Asset Value
All income, expenses (other than class-specific expenses, which are charged to that share class, as shown in the Statement of Operations) and realized and unrealized gains (losses) are allocated to each class of the Fund on a daily basis, based on the relative net assets of each class, for purposes of determining the net asset value of each class.
Federal Income Tax Status
The Fund intends to qualify each year as a regulated investment company under Subchapter M of the Internal Revenue Code, as amended, and will distribute substantially all of its taxable income (including net short-term capital gains), if any, for its tax year, and as such will not be subject to federal income taxes. In addition, the Fund intends to distribute in each calendar year substantially all of its net investment income, capital gains and certain other amounts, if any, such that the Fund should not be subject to federal excise tax. Therefore, no federal income or excise tax provision is recorded.
Foreign Taxes
The Fund may be subject to foreign taxes on income, gains on investments or currency repatriation, a portion of which may be recoverable. The Fund will accrue such taxes and recoveries, as applicable, based upon its current interpretation of tax rules and regulations that exist in the markets in which it invests.
Realized gains in certain countries may be subject to foreign taxes at the Fund level, based on statutory rates. The Fund accrues for such foreign taxes on net realized and unrealized gains at the appropriate rate for each jurisdiction, as applicable. The amount, if any, is disclosed as a liability on the Statement of Assets and Liabilities.
Distributions to Shareholders
Distributions from net investment income, if any, are declared and paid each calendar quarter. Net realized capital gains, if any, are distributed at least annually. Income distributions and capital gain distributions are determined in accordance with federal income tax regulations, which may differ from GAAP.
Guarantees and Indemnifications
Under the Trust's organizational documents and, in some cases, by contract, its officers and trustees are indemnified against certain liabilities arising out of the performance of their duties to the Trust or its funds. In addition, certain of the Fund's contracts with its service providers contain general
indemnification clauses. The Fund's maximum exposure under these arrangements is unknown since the amount of any future claims that may be made against the Fund cannot be determined, and the Fund has no historical basis for predicting the likelihood of any such claims.
Recent Accounting Pronouncement
Disclosures about Offsetting Assets and Liabilities
In December 2011, the Financial Accounting Standards Board (FASB) issued Accounting Standards Update (ASU) No. 2011-11, Disclosures about Offsetting Assets and Liabilities and in January 2013, ASU No. 2013-1, Clarifying the Scope of Disclosures about Offsetting Assets and Liabilities (collectively, the ASUs). Specifically, the ASUs require an entity to disclose both gross and net information for derivatives and other financial instruments that are subject to a master netting arrangement or similar agreement. The ASUs require disclosure of collateral received in connection with the master netting agreements or similar agreements. The disclosure requirements are effective for interim and annual periods beginning on or after January 1, 2013. At this time, management is evaluating the implications of this guidance and the impact it will have on the financial statement amounts and footnote disclosures, if any.
Note 3. Fees and Compensation Paid to Affiliates
Investment Management Fees
Under an Investment Management Services Agreement, Columbia Management Investment Advisers, LLC (the Investment Manager), a wholly-owned subsidiary of Ameriprise Financial, Inc. (Ameriprise Financial), determines which securities will be purchased, held or sold. The investment management fee is an annual fee that is equal to a percentage of the Fund's average daily net assets that declines from 0.66% to 0.49% as the Fund's net assets increase. The effective investment management fee rate for the year ended May 31, 2013 was 0.53% of the Fund's average daily net assets.
Administration Fees
Under an Administrative Services Agreement, the Investment Manager also serves as the Fund Administrator. The Fund pays the Fund Administrator an annual fee for administration and accounting services equal to a percentage of the Fund's average daily net assets that declines from 0.06% to 0.03% as the Fund's net assets increase. The effective administration fee rate for the year ended May 31, 2013 was 0.05% of the Fund's average daily net assets.
Annual Report 2013
31
Columbia Dividend Income Fund
Notes to Financial Statements (continued)
May 31, 2013
Compensation of Board Members
Board members are compensated for their services to the Fund as disclosed in the Statement of Operations. The Trust's eligible Trustees may participate in a Deferred Compensation Plan (the Plan) which may be terminated at any time. Obligations of the Plan will be paid solely out of the Fund's assets.
Compensation of Chief Compliance Officer
The Board has appointed a Chief Compliance Officer to the Fund in accordance with federal securities regulations. The Fund pays its pro-rata share of the expenses associated with the Chief Compliance Officer. The Fund's expenses for the Chief Compliance Officer will not exceed $15,000 per year.
Transfer Agent Fees
Under a Transfer and Dividend Disbursing Agent Agreement, Columbia Management Investment Services Corp. (the Transfer Agent), an affiliate of the Investment Manager and a wholly-owned subsidiary of Ameriprise Financial, is responsible for providing transfer agency services to the Fund. The Transfer Agent has contracted with Boston Financial Data Services (BFDS) to serve as sub-transfer agent.
The Transfer Agent receives monthly account-based service fees based on the number of open accounts and also receives sub-transfer agency fees based on a percentage of the average aggregate value of the Fund's shares maintained in omnibus accounts (other than omnibus accounts for which American Enterprise Investment Services Inc. is the broker of record or accounts where the beneficial shareholder is a customer of Ameriprise Financial Services, Inc., which are paid a per account fee). The Transfer Agent pays the fees of BFDS for services as sub-transfer agent and is not entitled to reimbursement for such fees from the Fund (with the exception of out-of-pocket fees).
The Transfer Agent also receives compensation from fees for various shareholder services and reimbursements for certain out-of-pocket fees. Class I shares do not pay transfer agent fees. Total transfer agent fees for Class R5 shares are subject to an annual limitation of not more than 0.05% of the average daily net assets attributable to Class R5 shares. Effective November 8, 2012, Class Y shares will not pay transfer agent fees for at least twelve months.
For the year ended May 31, 2013, the Fund's effective transfer agent fee rates as a percentage of average daily net assets of each class were as follows:
Class A | | | 0.19 | % | |
Class B | | | 0.19 | | |
Class C | | | 0.19 | | |
Class R | | | 0.19 | | |
Class R4* | | | 0.20 | % | |
Class R5* | | | 0.05 | | |
Class T | | | 0.19 | | |
Class W | | | 0.19 | | |
Class Z | | | 0.19 | | |
*Annualized.
An annual minimum account balance fee of $20 may apply to certain accounts with a value below the Fund's initial minimum investment requirements to reduce the impact of small accounts on transfer agent fees. These minimum account balance fees are recorded as part of expense reductions in the Statement of Operations. For the year ended May 31, 2013, these minimum account balance fees reduced total expenses by $9,091.
Distribution and Service Fees
The Fund has an agreement with Columbia Management Investment Distributors, Inc. (the Distributor), an affiliate of the Investment Manager and a wholly-owned subsidiary of Ameriprise Financial, for distribution and shareholder services. Pursuant to Rule 12b-1 under the 1940 Act, the Board has approved, and the Fund has adopted, distribution and shareholder service plans (the Plans) which set the distribution and service fees for the Fund. These fees are calculated daily and are intended to compensate the Distributor and/or eligible selling and/or servicing agents for selling shares of the Fund and providing services to investors.
The Plans require the payment of a monthly service fee to the Distributor at the maximum annual rate of 0.25% of the average daily net assets attributable to Class A, Class B, Class C and Class W shares of the Fund. The Plans also require the payment of a monthly distribution fee to the Distributor at the maximum annual rates of 0.10%, 0.75%, 0.75%, 0.50% and 0.25% of the average daily net assets attributable to Class A, Class B, Class C, Class R and Class W shares, respectively.
The Fund may pay distribution and service fees up to a maximum annual rate of 0.35% of the Fund's average daily net assets attributable to Class A shares (comprised of up to 0.10% for distribution services and up to 0.25% for shareholder liaison services), but currently limit such fees to an aggregate fee of not more than 0.25% of the Fund's average daily net assets attributable to Class A shares.
The Fund may pay a distribution fee up to 0.25% of the Fund's average daily net assets attributable to Class W shares and a service fee of up to 0.25% of the Fund's average daily net assets attributable to Class W shares, provided, however, that the aggregate fee shall not exceed 0.25% of the Fund's average daily net assets attributable to Class W shares.
Annual Report 2013
32
Columbia Dividend Income Fund
Notes to Financial Statements (continued)
May 31, 2013
Shareholder Services Fees
The Fund has adopted a shareholder services plan that permits it to pay for certain services provided to Class T shareholders by their selling and/or servicing agents. The Fund may pay shareholder servicing fees up to an aggregate annual rate of 0.50% of the Fund's average daily net assets attributable to Class T shares (comprised of up to 0.25% for shareholder liaison services and up to 0.25% for administrative support services). These fees are currently limited to an aggregate annual rate of not more than 0.30% of the Fund's average daily net assets attributable to Class T shares. The effective shareholder services fee rate for the year ended May 31, 2013 was 0.30% of the Fund's average daily net assets attributable to Class T shares.
Sales Charges
Sales charges, including front-end charges and CDSCs, received by the Distributor for distributing Fund shares were $2,680,047 for Class A, $9,232 for Class B, $37,274 for Class C and $3,253 for Class T shares for the year ended May 31, 2013.
Expenses Waived/Reimbursed by the Investment Manager and its Affiliates
The Investment Manager and certain of its affiliates have contractually agreed to waive fees and/or reimburse expenses (excluding certain fees and expenses described below) for the periods disclosed below, unless sooner terminated at the sole discretion of the Board, so that the Fund's net operating expenses, after giving effect to fees waived/expenses reimbursed and any balance credits and/or overdraft charges from the Fund's custodian, do not exceed the following annual rates as a percentage of the class' average daily net assets:
| | | October 1, 2012
through
September 30, 2013 | | Prior to
October 1, 2012 | |
Class A | | | 1.19 | % | | | 1.00 | % | |
Class B | | | 1.94 | | | | 1.75 | | |
Class C | | | 1.94 | | | | 1.75 | | |
Class I | | | 0.81 | | | | 0.67 | | |
Class R | | | 1.44 | | | | 1.25 | | |
Class R4 | | | 0.94 | * | | | — | | |
Class R5 | | | 0.86 | * | | | — | | |
Class T | | | 1.24 | | | | 1.05 | | |
Class W | | | 1.19 | | | | 1.00 | | |
Class Y | | | 0.81 | * | | | — | | |
Class Z | | | 0.94 | | | | 0.75 | | |
*Annual rates are contractual from November 8, 2012 (the commencement of operations of each share class) through November 8, 2013.
Under the agreement governing these fee waivers and/or expense reimbursement arrangements, the following fees and expenses are excluded from the waiver/reimbursement commitment, and therefore will be paid by the Fund, if applicable: taxes (including foreign transaction taxes), expenses associated with investments in affiliated and non-affiliated pooled investment vehicles (including mutual funds and exchange traded funds), transaction costs and brokerage commissions, costs related to any securities lending program, dividend expenses associated with securities sold short, inverse floater program fees and expenses, transaction charges and interest on borrowed money, interest, extraordinary expenses and any other expenses the exclusion of which is specifically approved by the Board. This agreement may be modified or amended only with approval from all parties.
Note 4. Federal Tax Information
The timing and character of income and capital gain distributions are determined in accordance with income tax regulations, which may differ from GAAP because of temporary or permanent book to tax differences.
At May 31, 2013, these differences are primarily due to differing treatment for foreign currency transactions, capital loss carryforwards, deferral/reversal of wash sale losses and Trustees' deferred compensation. To the extent these differences are permanent, reclassifications are made among the components of the Fund's net assets in the Statement of Assets and Liabilities. Temporary differences do not require reclassifications. In the Statement of Assets and Liabilities the following reclassifications were made:
Undistributed net investment income | | $ | 2,758 | | |
Accumulated net realized gain | | | (2,758 | ) | |
Net investment income and net realized gains (losses), as disclosed in the Statement of Operations, and net assets were not affected by this reclassification.
The tax character of distributions paid during the periods indicated was as follows:
| | | Year Ended
May 31,
2013 | | Period Ended
May 31,
2012 | | Year Ended
September 30,
2011 | |
Ordinary income | | $ | 163,569,365 | | | $ | 68,516,379 | | | $ | 81,359,265 | | |
Long-term capital | | | — | | | | — | | | | —
gains | | |
Tax return of capital | | | — | | | | — | | | | — | | |
Total | | | 163,569,365 | | | | 68,516,379 | | | | 81,359,265 | | |
Short-term capital gain distributions, if any, are considered ordinary income distributions for tax purposes.
Annual Report 2013
33
Columbia Dividend Income Fund
Notes to Financial Statements (continued)
May 31, 2013
At May 31, 2013, the components of distributable earnings on a tax basis were as follows:
Undistributed ordinary income | | $ | 31,071,230 | | |
Undistributed accumulated long-term capital gains | | | 13,137,075 | | |
Unrealized appreciation | | | 2,029,160,513 | | |
At May 31, 2013, the cost of investments for federal income tax purposes was $6,382,321,036 and the aggregate gross unrealized appreciation and depreciation based on that cost was:
Unrealized appreciation | | $ | 2,032,699,264 | | |
Unrealized depreciation | | | (3,538,751 | ) | |
Net unrealized appreciation | | | 2,029,160,513 | | |
The following capital loss carryforward, determined at May 31, 2013, may be available to reduce taxable income arising from future net realized gains on investments, if any, to the extent permitted by the Internal Revenue Code:
Year of Expiration | | Amount ($) | |
2014 | | | 1,266,110 | | |
For the year ended May 31, 2013, $64,179,737 of capital loss carryforward was utilized.
Management of the Fund has concluded that there are no significant uncertain tax positions that would require recognition in the financial statements. However, management's conclusion may be subject to review and adjustment at a later date based on factors including, but not limited to, new tax laws, regulations, and administrative interpretations (including relevant court decisions). Generally, the Fund's federal tax returns for the prior three fiscal years remain subject to examination by the Internal Revenue Service.
Note 5. Portfolio Information
The cost of purchases and proceeds from sales of securities, excluding short-term obligations, aggregated to $2,690,286,934 and $1,615,874,920, respectively.
Note 6. Lending of Portfolio Securities
Effective December 19, 2012, the Fund no longer participates in securities lending activity. Prior to that date, the Fund participated, or was eligible to participate, in securities lending activity pursuant to a Master Securities Lending Agreement (the Agreement) with JPMorgan Chase Bank, N.A. (JPMorgan). The Agreement authorized JPMorgan as lending agent to lend securities to authorized borrowers in order to generate additional income on behalf of the Fund. Pursuant to the Agreement, the securities loaned were secured by cash or securities that either were issued or guaranteed as to principal
and interest by the U.S. government, its agencies, authorities or instrumentalities with value equal to at least 100% of the market value of the loaned securities. Any additional collateral required to maintain those levels due to market fluctuations of the loaned securities was requested to be delivered the following business day. Cash collateral received was invested by the lending agent on behalf of the Fund into authorized investments pursuant to the Agreement.
Pursuant to the Agreement, the Fund received income for lending its securities either in the form of fees or by earning interest on invested cash collateral, net of negotiated rebates paid to borrowers and fees paid to the lending agent for services provided and any other securities lending expenses. Net income earned from securities lending for the year ended May 31, 2013 is disclosed in the Statement of Operations. The Fund continued to earn and accrue interest and dividends on the securities loaned.
Note 7. Shareholder Concentration
At May 31, 2013, one unaffiliated shareholder account owned 30.0% of the outstanding shares of the Fund. The Fund has no knowledge about whether any portion of those shares was owned beneficially by such accounts. Affiliated shareholder accounts owned 12.0% of the outstanding shares of the Fund. Subscription and redemption activity by concentrated accounts may have a significant effect on the operations of the Fund.
Note 8. Line of Credit
The Fund has entered into a revolving credit facility with a syndicate of banks led by JPMorgan whereby the Fund may borrow for the temporary funding of shareholder redemptions or for other temporary or emergency purposes. The credit facility agreement, as amended, which is a collective agreement between the Fund and certain other funds managed by the Investment Manager, severally and not jointly, permits collective borrowings up to $500 million. Interest is charged to each participating fund based on its borrowings at a rate equal to the higher of (i) the overnight federal funds rate plus 1.00% or (ii) the one-month LIBOR rate plus 1.00%. Each borrowing under the credit facility matures no later than 60 days after the date of borrowing. The Fund also pays a commitment fee equal to its pro rata share of the amount of the credit facility at a rate of 0.08% per annum.
The Fund had no borrowings during the year ended May 31, 2013.
Note 9. Subsequent Events
Management has evaluated the events and transactions that have occurred through the date the financial statements were
Annual Report 2013
34
Columbia Dividend Income Fund
Notes to Financial Statements (continued)
May 31, 2013
issued and noted no items requiring adjustment of the financial statements or additional disclosure.
Note 10. Information Regarding Pending and Settled Legal Proceedings
In December 2005, without admitting or denying the allegations, American Express Financial Corporation (AEFC, which is now known as Ameriprise Financial, Inc. (Ameriprise Financial)) entered into settlement agreements with the Securities and Exchange Commission (SEC) and Minnesota Department of Commerce (MDOC) related to market timing activities. As a result, AEFC was censured and ordered to cease and desist from committing or causing any violations of certain provisions of the Investment Advisers Act of 1940, the Investment Company Act of 1940, and various Minnesota laws. AEFC agreed to pay disgorgement of $10 million and civil money penalties of $7 million. AEFC also agreed to retain an independent distribution consultant to assist in developing a plan for distribution of all disgorgement and civil penalties ordered by the SEC in accordance with various undertakings detailed at www.sec.gov/litigation/admin/ia-2451.pdf. Ameriprise Financial and its affiliates have cooperated with the SEC and the MDOC in these legal proceedings, and have made regular reports to the funds' Boards of Trustees.
Ameriprise Financial and certain of its affiliates have historically been involved in a number of legal, arbitration and regulatory proceedings, including routine litigation, class actions, and governmental actions, concerning matters arising in connection with the conduct of their business activities. Ameriprise Financial believes that the Funds are not currently the subject of, and that neither Ameriprise Financial nor any of its affiliates are the subject of, any pending legal, arbitration or regulatory proceedings that are likely to have a material adverse effect on the Funds or the ability of Ameriprise Financial or its affiliates to perform under their contracts with the Funds. Ameriprise Financial is required to make 10-Q, 10-K and, as necessary, 8-K filings with the Securities and Exchange Commission on legal and regulatory matters that relate to Ameriprise Financial and its affiliates. Copies of these filings may be obtained by accessing the SEC website at www.sec.gov.
There can be no assurance that these matters, or the adverse publicity associated with them, will not result in increased fund redemptions, reduced sale of fund shares or other adverse consequences to the Funds. Further, although we believe proceedings are not likely to have a material adverse effect on the Funds or the ability of Ameriprise Financial or its affiliates to perform under their contracts with the Funds, these proceedings are subject to uncertainties and, as such, we are unable to estimate the possible loss or range of loss that may
result. An adverse outcome in one or more of these proceedings could result in adverse judgments, settlements, fines, penalties or other relief that could have a material adverse effect on the consolidated financial condition or results of operations of Ameriprise Financial.
Annual Report 2013
35
Columbia Dividend Income Fund
Report of Independent Registered Public Accounting Firm
To the Trustees of Columbia Funds Series Trust I and the Shareholders of Columbia Dividend Income Fund
In our opinion, the accompanying statement of assets and liabilities, including the portfolio of investments, and the related statements of operations and of changes in net assets and the financial highlights present fairly, in all material respects, the financial position of Columbia Dividend Income Fund (the "Fund") (a series of Columbia Funds Series Trust I) at May 31, 2013, the results of its operations, the changes in its net assets and the financial highlights for the periods indicated, in conformity with accounting principles generally accepted in the United States of America. These financial statements and financial highlights (hereafter referred to as "financial statements") are the responsibility of the Fund's management. Our responsibility is to express an opinion on these financial statements based on our audits. We conducted our audits of these financial statements in accordance with the standards of the Public Company Accounting Oversight Board (United States). Those standards require that we plan and perform the audit to obtain reasonable assurance about whether the financial statements are free of material misstatement. An audit includes examining, on a test basis, evidence supporting the amounts and disclosures in the financial statements, assessing the accounting principles used and significant estimates made by management, and evaluating the overall financial statement presentation. We believe that our audits, which included confirmation of securities at May 31, 2013 by correspondence with the custodian, transfer agent and brokers, provide a reasonable basis for our opinion.
PricewaterhouseCoopers LLP
Minneapolis, Minnesota
July 24, 2013
Annual Report 2013
36
Columbia Dividend Income Fund
Federal Income Tax Information
(Unaudited)
The Fund hereby designates the following tax attributes for the fiscal year ended May 31, 2013. Shareholders will be notified in early 2014 of the amounts for use in preparing 2013 income tax returns.
Tax Designations
| Qualified Dividend Income | | | 99.79 | % | |
| Dividends Received Deduction | | | 98.25 | % | |
Capital Gain Dividend | | $ | 13,793,929 | | |
Qualified Dividend Income. For taxable, non-corporate shareholders, the percentage of ordinary income dividends paid during the fiscal year that represents qualified dividend income subject to reduced tax rates.
Dividends Received Deduction. The percentage of ordinary income dividends paid during the fiscal year that qualifies for the corporate dividends received deduction.
Capital Gain Dividend. The Fund designates as a capital gain dividend the amount reflected above, or if subsequently determined to be different, the net capital gain of such fiscal period. The Fund also designates as capital gain dividends, to the extent necessary to fully distribute such capital gains, earnings and profits distributed to shareholders on the redemption of shares.
Annual Report 2013
37
Columbia Dividend Income Fund
The Trustees serve terms of indefinite duration. The names, addresses and birth years of the Trustees and Officers of the Funds in Columbia Funds Series Trust I, the year each was first elected or appointed to office, their principal business occupations during at least the last five years, the number of Funds overseen by each Trustee and other directorships they hold are shown below. Each officer listed below serves as an officer of each Fund in Columbia Funds Series Trust I.
Independent Trustees
Name, Address and Year of Birth,
Position with Funds, Year First
Elected or Appointed to Office | | Principal Occupation(s) During Past Five Years, Number of Funds in Columbia
Funds Complex Overseen by Trustee, Other Directorships Held | |
Rodman L. Drake (Born 1943)
c/o Columbia Management
Investment Advisers, LLC
225 Franklin Street
Boston, MA 02110
Trustee (since 1994) and
Chairman of the Board (since 2009) | | Independent consultant since 2010; Co-Founder of Baringo Capital LLC (private equity) from 1997 to 2008; Chairman (from 2003 to 2010) and CEO (from 2008 to 2010) of Crystal River Capital, Inc. (real estate investment trust); Oversees 52; Jackson Hewitt Tax Service Inc. (tax preparation services) from 2004 to 2011; Student Loan Corporation (student loan provider) from 2005 to 2010; Celgene Corporation (global biotechnology company); The Helios Funds and Brookfield Funds (closed-end funds); Crystal River Capital, Inc. from 2005 to 2010; Parsons Brinckerhoff from 1995 to 2008; and Apex Silver Mines Ltd. from 2007 to 2009 | |
Douglas A. Hacker (Born 1955)
c/o Columbia Management
Investment Advisers, LLC
225 Franklin Street
Boston, MA 02110
Trustee (since 1996) | | Independent business executive since May 2006; Executive Vice President — Strategy of United Airlines from December 2002 to May 2006; President of UAL Loyalty Services (airline marketing company) from September 2001 to December 2002; Executive Vice President and Chief Financial Officer of United Airlines from July 1999 to September 2001. Oversees 52; Nash Finch Company (food distributor); Aircastle Limited (aircraft leasing); and SeaCube Container Leasing Ltd. (container leasing) | |
Janet Langford Kelly (Born 1957)
c/o Columbia Management
Investment Advisers, LLC
225 Franklin Street
Boston, MA 02110
Trustee (since 1996) | | Senior Vice President, General Counsel and Corporate Secretary, ConocoPhillips (integrated energy company) since September 2007; Deputy General Counsel — Corporate Legal Services, ConocoPhillips from August 2006 to August 2007; Partner, Zelle, Hofmann, Voelbel, Mason & Gette LLP (law firm) from March 2005 to July 2006; Adjunct Professor of Law, Northwestern University from September 2004 to June 2006; Director, UAL Corporation (airline) from February 2006 to July 2006; Chief Administrative Officer and Senior Vice President, Kmart Holding Corporation (consumer goods) from September 2003 to March 2004. Oversees 52; None | |
Nancy T. Lukitsh (Born 1956)
c/o Columbia Management
Investment Advisers, LLC
225 Franklin Street
Boston, MA 02110
Trustee (since 2011) | | Senior Vice President, Partner and Director of Marketing, Wellington Management Company, LLP (investment adviser) from 1997 to 2010; Chair, Wellington Management Investment Portfolios (commingled non-U.S. investment pools) from 2007 to 2010; Director, Wellington Trust Company, NA and other Wellington affiliates from 1997 to 2010. Oversees 52; None | |
William E. Mayer (Born 1940)
c/o Columbia Management
Investment Advisers, LLC
225 Franklin Street
Boston, MA 02110
Trustee (since 1994) | | Partner, Park Avenue Equity Partners (private equity) since February 1999; Dean and Professor, College of Business and Management, University of Maryland from 1992 to 1996. Oversees 52; DynaVox Inc. (speech creation); Lee Enterprises (print media); WR Hambrecht + Co. (financial service provider) from 2000 to 2012; BlackRock Kelso Capital Corporation (investment company) | |
David M. Moffett (Born 1952)
c/o Columbia Management
Investment Advisers, LLC
225 Franklin Street
Boston, MA 02110
Trustee (since 2011) | | Retired. Chief Executive Officer, Federal Home Loan Mortgage Corporation, from 2008 to 2009; Senior Adviser, Global Financial Services Group, Carlyle Group, Inc., from 2007 to 2008; Vice Chairman and Chief Financial Officer, U.S. Bancorp, from 1993 to 2007. Oversees 52; CIT Group Inc. (commercial and consumer finance); eBay Inc. (online trading community); MBIA Inc. (financial service provider); E.W. Scripps Co. (print and television media), Building Materials Holding Corp. (building materials and construction services); Genworth Financial, Inc. (financial and insurance products and services); and University of Oklahoma Foundation. | |
Charles R. Nelson (Born 1942)
c/o Columbia Management
Investment Advisers, LLC
225 Franklin Street
Boston, MA 02110
Trustee (since 1981) | | Retired. Professor Emeritus, University of Washington, since 2011; Professor of Economics, University of Washington from January 1976 to 2011; Ford and Louisa Van Voorhis Professor of Political Economy, University of Washington from 1993 to 2011; Adjunct Professor of Statistics, University of Washington from 1980 to 2011; Associate Editor, Journal of Money, Credit and Banking from September 1993 to 2008; consultant on econometric and statistical matters. Oversees 52; None | |
John J. Neuhauser (Born 1943)
c/o Columbia Management
Investment Advisers, LLC
225 Franklin Street
Boston, MA 02110
Trustee (since 1984) | | President, Saint Michael's College, since August 2007; Director or Trustee of several non-profit organizations, including Fletcher Allen Health Care, Inc.; University Professor, Boston College from November 2005 to August 2007; Academic Vice President and Dean of Faculties, Boston College from August 1999 to October 2005. Oversees 52; Liberty All-Star Equity Fund and Liberty All-Star Growth Fund (closed-end funds) | |
Annual Report 2013
38
Columbia Dividend Income Fund
Trustees and Officers (continued)
Independent Trustees (continued)
Name, Address and Year of Birth,
Position with Funds, Year First
Elected or Appointed to Office | | Principal Occupation(s) During Past Five Years, Number of Funds in Columbia
Funds Complex Overseen by Trustee, Other Directorships Held | |
Patrick J. Simpson (Born 1944)
c/o Columbia Management
Investment Advisers, LLC
225 Franklin Street
Boston, MA 02110
Trustee (since 2000) | | Partner, Perkins Coie LLP (law firm). Oversees 52; None | |
Anne-Lee Verville (Born 1945)
c/o Columbia Management
Investment Advisers, LLC
225 Franklin Street
Boston, MA 02110
Trustee (since 1998) | | Retired. General Manager — Global Education Industry from 1994 to 1997, President — Application Systems Division from 1991 to 1994, Chief Financial Officer — US Marketing & Services from 1988 to 1991, and Chief Information Officer from 1987 to 1988, IBM Corporation (computer and technology). Oversees 52; Enesco Group, Inc. (producer of giftware and home and garden decor products) from 2001 to 2006 | |
Interested Trustee
Name, Address and Year of Birth,
Position with Funds, Year First
Elected or Appointed to Office | | Principal Occupation(s) During Past Five Years, Number of Funds in Columbia
Funds Complex Overseen by Trustee, Other Directorships Held | |
William F. Truscott (born 1960)
53600 Ameriprise Financial Center
Minneapolis, MN 55474
Senior Vice President (since 2012) | | President and Chairman of the Board, Columbia Management Investment Advisers, LLC since May 2010 and February 2012, respectively (previously President and Chief Investment Officer, from 2001 to April 2010); Chief Executive Officer, Global Asset Management, Ameriprise Financial, Inc. since September 2012 (previously, Chief Executive Officer, U.S. Asset Management & President, Annuities, from May 2010 to September 2012 and President — U.S. Asset Management and Chief Investment Officer from 2005 to April 2010); Director and Chief Executive Officer, Columbia Management Investment Distributors, Inc. since May 2010 and February 2012, respectively (previously Chairman of the Board and Chief Executive Officer from 2006 to April 2010); Chairman of the Board and Chief Executive Officer, RiverSource Distributors, Inc. since 2006; President and Chief Executive Officer, Ameriprise Certificate Company, 2006 to August 2012; Oversees 184; Director, Ameriprise Certificate Company, 2006-January 2013 | |
The Statement of Additional Information includes additional information about the Trustees of the Funds and is available, without charge, upon request by calling 800.345.6611.
The Board has appointed officers who are responsible for day-to-day business decisions based on policies it has established. The officers serve at the pleasure of the Board. In addition to Mr. Truscott, who is Senior Vice President, the Funds' other officers are:
Officers
Name, Year of Birth and Address | | Principal Occupation(s) During the Past Five Years | |
J. Kevin Connaughton (Born 1964)
225 Franklin Street
Boston, MA 02110
President (since 2009) | | Senior Vice President and General Manager — Mutual Fund Products, Columbia Management Investment Advisers, LLC since May 2010; President, Columbia Funds since 2009 and RiverSource Funds since May 2010; Managing Director, Columbia Management Advisors, LLC, December 2004-April 2010; Senior Vice President and Chief Financial Officer, Columbia Funds, June 2008-January 2009; Treasurer, Columbia Funds, October 2003-May 2008; and senior officer of various other affiliated funds since 2000 | |
Amy Johnson (Born 1965)
5228 Ameriprise Financial Center
Minneapolis, MN 55474
Vice President (since 2010) | | Senior Vice President and Chief Operating Officer, Columbia Management Investment Advisers, LLC since May 2010 (previously Chief Administrative Officer, from 2009-April 2010, Vice President — Asset Management and Trust Company Services, from 2006-2009) | |
Michael G. Clarke (Born 1969)
225 Franklin Street
Boston, MA 02110
Treasurer (since 2011) and Chief
Financial Officer (since 2009) | | Vice President, Columbia Management Investment Advisers, LLC since May 2010; Managing Director of Fund Administration, Columbia Management Advisors, LLC, September 2004-April 2010; senior officer of Columbia Funds and affiliated funds since 2002 | |
Annual Report 2013
39
Columbia Dividend Income Fund
Trustees and Officers (continued)
Officers (continued)
Name, Year of Birth and Address | | Principal Occupation(s) During the Past Five Years | |
Scott R. Plummer (Born 1959)
5228 Ameriprise Financial Center
Minneapolis, MN 55474
Senior Vice President, Assistant
Secretary and Chief Legal Officer
(since 2010) | | Senior Vice President, Chief Legal Officer and Assistant Secretary, Columbia Management Investment Advisers, LLC since June 2005; Vice President and Lead Chief Counsel — Asset Management, Ameriprise Financial, Inc. since May 2010 (previously Vice President and Chief Counsel — Asset Management, 2005-April 2010); Vice President, Chief Counsel and Assistant Secretary, Columbia Management Investment Distributors, Inc. since 2008; Vice President, General Counsel and Secretary, Ameriprise Certificate Company since 2005; Chief Counsel, RiverSource Distributors, Inc. since 2006; senior officer of Columbia Funds and affiliated funds since 2010 | |
Colin Moore (Born 1958)
225 Franklin Street
Boston, MA 02110
Senior Vice President (since 2010) | | Executive Vice President and Global Chief Investment Officer, Ameriprise Financial, Inc. since July 2013; Director and Global Chief Investment Officer, Columbia Management Investment Advisers, LLC since May 2010; Manager, Managing Director and Chief Investment Officer of Columbia Management Advisors, LLC, 2007-April 2010 | |
Thomas P. McGuire (Born 1972)
225 Franklin Street
Boston, MA 02110
Chief Compliance Officer
(since 2012) | | Vice President — Asset Management Compliance, Columbia Management Investment Advisers, LLC since 2010; Chief Compliance Officer, Ameriprise Certificate Company, since September 2010; Compliance Executive, Bank of America, N.A. 2005-2010 | |
Stephen T. Welsh (born 1957)
225 Franklin Street
Boston, MA 02110
Vice President (since 2006) | | President and Director, Columbia Management Investment Services Corp. since May 2010; President and Director, Columbia Management Services, Inc., July 2004-April 2010; Managing Director, Columbia Management Distributors, Inc., August 2007-April 2010 | |
Christopher O. Petersen (born 1970)
5228 Ameriprise Financial Center
Minneapolis, MN 55474
Vice President (since 2010) and
Secretary (since 2011) | | Vice President and Chief Counsel, Ameriprise Financial Inc. since January 2010 (formerly Vice President and Group Counsel or Counsel, April 2004-January 2010); Assistant Secretary of Columbia Funds, January 2007-April 2011 | |
Paul D. Pearson (born 1956)
10468 Ameriprise Financial Center
Minneapolis, MN 55474
Vice President and Assistant
Treasurer (since 2011) | | Vice President, Investment Accounting, Columbia Management Investment Advisers, LLC, since May 2010; Vice President — Managed Assets, Investment Accounting, Ameriprise Financial Inc., February 1998-May 2010 | |
Joseph F. DiMaria (Born 1968)
225 Franklin Street
Boston, MA 02110
Vice President (since 2011) and
Chief Accounting Officer (since 2008) | | Vice President, Mutual Fund Administration, Columbia Management Investment Advisers, LLC, since May 2010; Director of Fund Administration, Columbia Management Advisors, LLC, January 2006-April 2010 | |
Paul B. Goucher (born 1968)
100 Park Avenue
New York, NY 10017
Vice President and Assistant
Secretary (since 2010) | | Vice President and Lead Chief Counsel, Ameriprise Financial, Inc. since November 2008 and January 2013, respectively (formerly, Chief Counsel from January 2010-January 2013 and Group Counsel from November 2008-January 2010); Director, Managing Director and General Counsel, J. & W. Seligman & Co. Incorporated, July 2008-November 2008 (previously, Managing Director and Associate General Counsel, January 2005-July 2008) | |
Michael E. DeFao (born 1968)
225 Franklin Street
Boston, MA 02110
Vice President and Assistant
Secretary (since 2011) | | Vice President and Chief Counsel, Ameriprise Financial Inc. since May 2010; Associate General Counsel, Bank of America, N.A. June 2005-April 2010 | |
Annual Report 2013
40
Columbia Dividend Income Fund
Important Information About This Report
Each fund mails one shareholder report to each shareholder address. If you would like more than one report, please call shareholder services at 800.345.6611 and additional reports will be sent to you.
The policy of the Board is to vote the proxies of the companies in which each fund holds investments consistent with the procedures as stated in the Statement of Additional Information (SAI). You may obtain a copy of the SAI without charge by calling 800.345.6611; contacting your financial intermediary; visiting columbiamanagement.com; or searching the website of the Securities and Exchange Commission (SEC) at sec.gov. Information regarding how each fund voted proxies relating to portfolio securities is filed with the SEC by August 31 for the most recent 12-month period ending June 30 of that year, and is available without charge by visiting columbiamanagement.com; or searching the website of the SEC at sec.gov.
Each fund files a complete schedule of portfolio holdings with the SEC for the first and third quarters of each fiscal year on Form N-Q. Each fund's Form N-Q is available on the SEC's website at sec.gov and may be reviewed and copied at the SEC's Public Reference Room in Washington, D.C. Information on the operation of the Public Reference Room may be obtained by calling 800.SEC.0330. Each fund's complete schedule of portfolio holdings, as filed on Form N-Q, can also be obtained without charge, upon request, by calling 800.345.6611.
Annual Report 2013
41

Columbia Dividend Income Fund
P.O. Box 8081
Boston, MA 02266-8081
columbiamanagement.com
This information is for use with concurrent or prior delivery of a fund prospectus. Please read and consider the investment objectives, risks, charges and expenses for any fund carefully before investing. For a prospectus which contains this and other important information about the Fund go to columbiamanagement.com. The Fund is distributed by Columbia Management Investment Distributors, Inc., member FINRA, and managed by Columbia Management Investment Advisers, LLC.
© 2013 Columbia Management Investment Advisers, LLC. All rights reserved.
ANN139_05_C01_(07/13)
Annual Report
May 31, 2013

Columbia High Yield Municipal Fund
Not FDIC insured • No bank guarantee • May lose value
Columbia High Yield Municipal Fund
 Dear Shareholders,
U.S. equities had a strong first quarter
Similar to 2012, equities once again were the best performing asset class in the first quarter of 2013. The S&P 500 Index reached an all-time closing high on the last trading day of the quarter and pushed through its October 2007 peak. Although global equities have performed well year-to-date, there is significant performance divergence among regions. In local currency terms, Japanese equities were the best performing developed market globally, and U.S. stocks outperformed most other global equity markets. European equities rose in the first quarter but trailed U.S. stocks and had a turbulent March, as investors were reminded of instability in the eurozone with news of a banking crisis in Cyprus.
Although all 10 sectors of the S&P 500 Index delivered positive returns, this was a rally led by defensive stocks such as those in health care, consumer staples and utilities. Materials and technology stocks were the weakest sectors.
High yield leads fixed income; most sectors flat to down
The fixed-income markets lagged equities with modest, single-digit returns coming from municipals and high-yield sectors in the United States. Most government and investment-grade credit sectors were roughly flat to down for the first quarter of 2013. Emerging market bonds were the biggest disappointment with single-digit losses.
Columbia Management to begin delivering summary prospectuses
Each Columbia fund is required to update its prospectus on an annual basis. Beginning with June 2013 prospectus updates, shareholders of Columbia retail mutual funds will start to receive a summary prospectus, rather than the full length (statutory) mutual fund prospectus they have received in the past.
Each fund's summary prospectus will include the following key information:
> Investment objective
> Fee and expense table
> Portfolio turnover rate information
> Principal investment strategies, principal risks and performance information
> Management information
> Purchase and sale information
> Tax information
> Financial intermediary compensation information
Each fund's statutory prospectus will contain additional information about the fund and its risks. Both the statutory and summary prospectus will be updated each year, and will be available at columbiamanagement.com. Shareholders may request a printed version of a statutory prospectus at no cost by calling 800.345.6611 or sending an email to serviceinquiries@columbiamanagement.com.
Stay on track with Columbia Management
Backed by more than 100 years of experience, Columbia Management is one of the nation's largest asset managers. At the heart of our success — and, most importantly, that of our investors — are highly talented industry professionals, brought together by a unique way of working. We are dedicated to helping you take advantage of today's opportunities and anticipate tomorrow's. We stay abreast of the latest investment trends and ideas, using our collective insight to evaluate events and transform them into solutions you can use.
Visit columbiamanagement.com for:
> The Columbia Management Perspectives blog, featuring timely posts by our investment teams
> Detailed up-to-date fund performance and portfolio information
> Economic analysis and market commentary
> Quarterly fund commentaries
> Columbia Management Investor, our award-winning quarterly newsletter for shareholders
Thank you for your continued support of the Columbia Funds. We look forward to serving your investment needs for many years to come.
Best Regards,

J. Kevin Connaughton
President, Columbia Funds
The S&P 500 Index, an unmanaged index, measures the performance of 500 large-capitalization U.S. stocks and is frequently used as a general measure of market performance. Indices are not available for investment, are not professionally managed and do not reflect sales charges, fees, brokerage commissions, taxes or other expenses of investing.
Investors should consider the investment objectives, risks, charges and expenses of a mutual fund carefully before investing. For a free prospectus, which contains this and other important information about a fund, visit columbiamanagement.com. The prospectus should be read carefully before investing.
Columbia Funds are distributed by Columbia Management Investment Distributors, Inc., member FINRA, and managed by Columbia Management Investment Advisers, LLC.
© 2013 Columbia Management Investment Advisers, LLC. All rights reserved.
Columbia High Yield Municipal Fund
Performance Overview | | | 2 | | |
Manager Discussion of Fund Performance | | | 4 | | |
Understanding Your Fund's Expenses | | | 6 | | |
Portfolio of Investments | | | 7 | | |
Statement of Assets and Liabilities | | | 28 | | |
Statement of Operations | | | 30 | | |
Statement of Changes in Net Assets | | | 31 | | |
Financial Highlights | | | 33 | | |
Notes to Financial Statements | | | 39 | | |
Report of Independent Registered
Public Accounting Firm | | | 45 | | |
Federal Income Tax Information | | | 46 | | |
Trustees and Officers | | | 47 | | |
Important Information About This Report | | | 53 | | |
Fund Investment Manager
Columbia Management Investment
Advisers, LLC
225 Franklin Street
Boston, MA 02110
Fund Distributor
Columbia Management Investment
Distributors, Inc.
225 Franklin Street
Boston, MA 02110
Fund Transfer Agent
Columbia Management Investment
Services Corp.
P.O. Box 8081
Boston, MA 02266-8081
For more information about any of the funds, please visit columbiamanagement.com or call 800.345.6611. Customer Service Representatives are available to answer your questions Monday through Friday from 8 a.m. to 8 p.m. Eastern time.
The views expressed in this report reflect the current views of the respective parties. These views are not guarantees of future performance and involve certain risks, uncertainties and assumptions that are difficult to predict, so actual outcomes and results may differ significantly from the views expressed. These views are subject to change at any time based upon economic, market or other conditions and the respective parties disclaim any responsibility to update such views. These views may not be relied on as investment advice and, because investment decisions for a Columbia Fund are based on numerous factors, may not be relied on as an indication of trading intent on behalf of any particular Columbia Fund. References to specific securities should not be construed as a recommendation or investment advice.
Columbia High Yield Municipal Fund
Performance Summary
> Columbia High Yield Municipal Fund (the Fund) Class A shares returned 6.44% for the 12-month period ended May 31, 2013.
> The Fund underperformed the Barclays High Yield Municipal Bond Index, which returned 11.88%, as well as the Blended Benchmark, which returned 8.27% for the same 12-month period.
> An above-average cash position and a sizable underweight in the top-performing tobacco sector hindered relative performance.
Average Annual Total Returns (%) (for period ended May 31, 2013)
| | Inception | | 1 Year | | 5 Years | | 10 Years | |
Class A | | 07/31/00 | | | | | | | | | | | | | |
Excluding sales charges | | | | | | | 6.44 | | | | 5.67 | | | | 4.45 | | |
Including sales charges | | | | | | | 1.42 | | | | 4.65 | | | | 3.94 | | |
Class B | | 07/15/02 | | | | | | | | | | | | | |
Excluding sales charges | | | | | | | 5.65 | | | | 4.88 | | | | 3.67 | | |
Including sales charges | | | | | | | 0.65 | | | | 4.55 | | | | 3.67 | | |
Class C | | 07/15/02 | | | | | | | | | | | | | |
Excluding sales charges | | | | | | | 5.81 | | | | 5.04 | | | | 3.82 | | |
Including sales charges | | | | | | | 4.81 | | | | 5.04 | | | | 3.82 | | |
Class R4* | | 03/19/13 | | | 6.74 | | | | 5.89 | | | | 4.67 | | |
Class R5* | | 11/08/12 | | | 6.79 | | | | 5.90 | | | | 4.67 | | |
Class Z | | 03/05/84 | | | 6.65 | | | | 5.88 | | | | 4.66 | | |
Barclays High Yield Municipal Bond Index | | | | | | | 11.88 | | | | 7.24 | | | | 6.92 | | |
Blended Benchmark | | | | | | | 8.27 | | | | 6.70 | | | | 6.07 | | |
Returns for Class A are shown with and without the maximum initial sales charge of 4.75%. Returns for Class B are shown with and without the applicable contingent deferred sales charge (CDSC) of 5.00% in the first year, declining to 1.00% in the sixth year and eliminated thereafter. Returns for Class C are shown with and without the 1.00% CDSC for the first year only. The Fund's other classes are not subject to sales charges and have limited eligibility. Please see the Fund's prospectuses for details. Performance for different share classes will vary based on differences in sales charges and fees associated with each class. All results shown assume reinvestment of distributions during the period. Returns do not reflect the deduction of taxes that a shareholder may pay on Fund distributions or on the redemption of Fund shares. Performance results reflect the effect of any fee waivers or reimbursements of Fund expenses by Columbia Management Investment Advisers, LLC and/or any of its affiliates. Absent these fee waivers or expense reimbursement arrangements, performance results would have been lower.
The performance information shown represents past performance and is not a guarantee of future results. The investment return and principal value of your investment will fluctuate so that your shares, when redeemed, may be worth more or less than their original cost. Current performance may be lower or higher than the performance information shown. You may obtain performance information current to the most recent month-end by contacting your financial intermediary, visiting columbiamanagement.com or calling 800.345.6611.
* The returns shown for periods prior to the share class inception date (including returns for the Life of the Fund, if shown, which are since Fund inception) include the returns of the Fund's oldest share class. These returns are adjusted to reflect any higher class-related operating expenses of the newer share classes, as applicable. Please visit columbiamanagement.com/mutual-funds/appended-performance for more information.
The Barclays High Yield Municipal Bond Index is comprised of bonds with maturities greater than one-year, having a par value of at least $3 million issued as part of a transaction size greater than $20 million, and rated no higher than "BB+" or equivalent by any of the three principal rating agencies.
The Blended Benchmark, established by the Investment Manager, consists of a 60% weighting of the Barclays High Yield Municipal Bond Index and a 40% weighting of the Barclays Municipal Bond Index. The Barclays Municipal Bond Index is considered representative of the broad market for investment-grade, tax-exempt bonds with a maturity of at least one year.
Indices are not available for investment, are not professionally managed and do not reflect sales charges, fees, brokerage commissions, taxes or other expenses of investing. Securities in the Fund may not match those in an index.
Annual Report 2013
2
Columbia High Yield Municipal Fund
Performance Overview (continued)
Performance of a Hypothetical $10,000 Investment (June 1, 2003 – May 31, 2013)
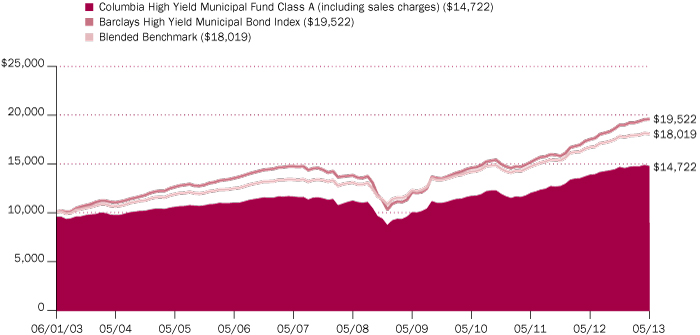
The chart above shows the change in value of a hypothetical $10,000 investment in Class A shares of Columbia High Yield Municipal Fund during the stated time period, and does not reflect the deduction of taxes that a shareholder may pay on fund distributions or on the redemption of fund shares.
Annual Report 2013
3
Columbia High Yield Municipal Fund
Manager Discussion of Fund Performance
For the 12-month period that ended May 31, 2013, Class A shares of the Fund returned 6.44% excluding sales charges. The Fund underperformed the Barclays High Yield Municipal Bond Index, which returned 11.88%, as well as the Blended Benchmark, which returned 8.27% for the same 12-month period. An above-average cash position and a sizable underweight in the top-performing tobacco sector hindered performance versus both benchmarks. We focused on total return and tried to limit volatility through a bias toward higher quality, high-yield municipal bonds with BBB or single A credit ratings.
Tepid Growth, Low Interest Rates Favorable for High-Yield Bonds
U.S. economic growth showed only modest improvement this past fiscal period, despite ultra-low short-term interest rates and government bond buyback programs aimed at bolstering borrowing and hiring. Worries over a year-end fiscal cliff of tax increases and various spending cuts kept capital spending in check in the first half of the reporting period. These were replaced in the new year by concerns over the impact of payroll tax increases and across-the-board budget cuts (commonly referred to as the sequester). More encouraging were signs of recovery in the housing market, unemployment that stayed below 8% and continued low inflation, which drove investors toward higher risk assets. High-yield municipal bonds benefited from strong demand that outstripped supply, particularly in the first half of the reporting period. The sector's high yields looked especially attractive, as credit conditions stabilized and concerns lessened that municipal bonds would lose their tax-exempt status any time soon. As investors reached for yield, the best performers were lower quality and longer maturity issues.
Cash Overweight and Tobacco Underweight Held Back Results
An above-average position in cash detracted from relative performance as high-yield municipal bonds rallied. The Fund had significant inflows, particularly during the first half of the period, which we put to work as quickly as we could. However, a shortage of attractive high-yield bonds hindered our ability to become fully invested. We purchased some higher quality bonds with 8- to 12-year maturities, which produced better returns than cash but detracted from results versus the Fund's benchmarks.
An underweight in below-investment-grade municipal bonds hurt relative performance as lower quality assets outperformed. Of note was the Fund's significant underexposure to tobacco securitization bonds, a below investment-grade segment that is a large component of both indices and was the top performing sector by far. Tobacco bonds benefited from a lower rate of decline in tobacco consumption, as well as stabilizing credit conditions and high yields that attracted investors.
Individual Disappointments Included Retirement Community Issues
Overweights versus both indices in Continuing Care Retirement Communities (CCRCs) — a somewhat out-of-favor sector where additional yield is typically available — also hampered relative performance, as CCRCs lagged tobacco bonds by a wide margin. Individual detractors included non-rated CCRC bonds issued
Portfolio Management
Chad Farrington, CFA
Top Ten States (%)
(at May 31, 2013) | |
California | | | 12.9 | | |
Florida | | | 8.8 | | |
Illinois | | | 8.8 | | |
Texas | | | 8.2 | | |
Michigan | | | 4.1 | | |
New York | | | 4.1 | | |
Missouri | | | 3.7 | | |
Pennsylvania | | | 3.6 | | |
Virginia | | | 3.2 | | |
Massachusetts | | | 2.9 | | |
Percentages indicated are based upon total investments (excluding Money Market Funds).
Fund holdings are as of the date given, are subject to change at any time, and are not recommendations to buy or sell any security.
Quality Breakdown (%)
(at May 31, 2013) | |
AAA rating | | | 0.4 | | |
AA rating | | | 8.7 | | |
A rating | | | 19.2 | | |
BBB rating | | | 25.6 | | |
BB rating | | | 8.7 | | |
B rating | | | 6.6 | | |
Non-investment grade | | | 0.2 | | |
Not rated | | | 30.6 | | |
Total | | | 100.0 | | |
Percentages indicated are based upon total fixed income securities (excluding Money Market Funds).
Bond ratings apply to the underlying holdings of the Fund and not the Fund itself and are divided into categories ranging from AAA (highest) to D (lowest), and are subject to change. The ratings shown are determined by using the middle rating of Moody's, S&P, and Fitch after dropping the highest and lowest available ratings. When a rating from only two agencies is available, the lower rating is used. When a rating from only one agency is available, that rating is used. When a bond is not rated by any of these agencies, it is designated as Not rated. Credit ratings are subjective opinions and not statements of fact.
Annual Report 2013
4
Columbia High Yield Municipal Fund
Manager Discussion of Fund Performance (continued)
for Groves at Lincoln, in Lincoln, Massachusetts, which filed for bankruptcy, and Deerfield Retirement Community in Iowa, which has struggled to reach full occupancy. Other disappointments included bonds issued by Cabazon Band Mission Indians, a casino operator in California facing financial difficulty.
Overweight in Longest Maturity Bonds Helped Relative Performance
Having an overweight — and about 45% of the Fund's assets — in bonds with maturities of 22 years or more gave the biggest boost to relative performance, as longer maturity issues outperformed. In terms of top individual contributors, a long-maturity, single-A rated zero coupon sales tax bond issued by Miami/Dade County stood out. Zero coupon bonds pay no interest while the loan is outstanding, but repay both principal and interest in one lump sum at maturity. Security selection in the tobacco sector was favorable.
Looking Ahead
We currently expect to see the economy gradually improve and interest rates move higher over the next couple of years. Better economic growth typically helps the fundamental credit quality of many high-yield municipal bonds, which can lead to better performance relative to more interest-rate sensitive higher quality bonds as rates move higher. The Fund was positioned somewhat defensively at period end with just under 10% of assets in 8- to 12-year issues that may offer some price protection if interest rates rise, and a continued focus on higher quality, high-yield assets. Going forward, our focus will be on limiting volatility, while trying to add value through credit research.
Investment Risks
There are risks associated with an investment in a bond fund, including credit risk, interest rate risk, and prepayment and extension risk. In general, bond prices rise when interest rates fall and vice versa. This effect is more pronounced for longer-term securities. Non-investment grade securities, commonly called "high-yield" or "junk" bonds, have more volatile prices and carry more risk to principal and income than investment grade securities. Income from tax-exempt funds may be subject to state and local taxes and a portion of income may be subject to the federal and/or state alternative minimum tax for certain investors. Federal and state income tax rules will apply to any capital gain distributions and any gains or losses on sales.
Annual Report 2013
5
Columbia High Yield Municipal Fund
Understanding Your Fund's Expenses
(Unaudited)
As an investor, you incur two types of costs. There are transaction costs, which generally include sales charges on purchases and may include redemption fees. There are also ongoing costs, which generally include management fees, distribution and service (Rule 12b-1) fees, and other fund expenses. The following information is intended to help you understand your ongoing costs (in dollars) of investing in the Fund and to help you compare these costs with the ongoing costs of investing in other mutual funds.
Analyzing Your Fund's Expenses
To illustrate these ongoing costs, we have provided examples and calculated the expenses paid by investors in each share class of the Fund during the period. The actual and hypothetical information in the table is based on an initial investment of $1,000 at the beginning of the period indicated and held for the entire period. Expense information is calculated two ways and each method provides you with different information. The amount listed in the "Actual" column is calculated using the Fund's actual operating expenses and total return for the period. You may use the Actual information, together with the amount invested, to estimate the expenses that you paid over the period. Simply divide your account value by $1,000 (for example, an $8,600 account value divided by $1,000 = 8.6), then multiply the results by the expenses paid during the period under the Actual column. The amount listed in the "Hypothetical" column assumes a 5% annual rate of return before expenses (which is not the Fund's actual return) and then applies the Fund's actual expense ratio for the period to the hypothetical return. You should not use the hypothetical account values and expenses to estimate either your actual account balance at the end of the period or the expenses you paid during the period. See "Compare With Other Funds" below for details on how to use the hypothetical data.
Compare With Other Funds
Since all mutual funds are required to include the same hypothetical calculations about expenses in shareholder reports, you can use this information to compare the ongoing cost of investing in the Fund with other funds. To do so, compare the hypothetical example with the 5% hypothetical examples that appear in the shareholder reports of other funds. As you compare hypothetical examples of other funds, it is important to note that hypothetical examples are meant to highlight the ongoing costs of investing in a fund only and do not reflect any transaction costs, such as sales charges, or redemption or exchange fees. Therefore, the hypothetical calculations are useful in comparing ongoing costs only, and will not help you determine the relative total costs of owning different funds. If transaction costs were included in these calculations, your costs would be higher.
December 1, 2012 – May 31, 2013
| | Account Value at the Beginning
of the Period ($) | | Account Value at the End of the
Period ($) | | Expenses Paid During the
Period ($) | | Fund's Annualized
Expense Ratio (%) | |
| | Actual | | Hypothetical | | Actual | | Hypothetical | | Actual | | Hypothetical | | Actual | |
Class A | | | 1,000.00 | | | | 1,000.00 | | | | 1,006.40 | | | | 1,020.49 | | | | 4.45 | | | | 4.48 | | | | 0.89 | | |
Class B | | | 1,000.00 | | | | 1,000.00 | | | | 1,002.70 | | | | 1,016.75 | | | | 8.19 | | | | 8.25 | | | | 1.64 | | |
Class C | | | 1,000.00 | | | | 1,000.00 | | | | 1,003.40 | | | | 1,017.50 | | | | 7.44 | | | | 7.49 | | | | 1.49 | | |
Class R4 | | | 1,000.00 | | | | 1,000.00 | | | | 1,005.00 | * | | | 1,021.54 | | | | 1.34 | * | | | 3.43 | | | | 0.68 | * | |
Class R5 | | | 1,000.00 | | | | 1,000.00 | | | | 1,008.70 | | | | 1,021.89 | | | | 3.05 | | | | 3.07 | | | | 0.61 | | |
Class Z | | | 1,000.00 | | | | 1,000.00 | | | | 1,007.40 | | | | 1,021.49 | | | | 3.45 | | | | 3.48 | | | | 0.69 | | |
*For the period March 19, 2013 through May 31, 2013. Class R4 shares commenced operations on March 19, 2013.
Expenses paid during the period are equal to the annualized expense ratio for each class as indicated above, multiplied by the average account value over the period and then multiplied by the number of days in the Fund's most recent fiscal half year and divided by 365.
Expenses do not include fees and expenses incurred indirectly by the Fund from the underlying funds in which the Fund may invest (also referred to as "acquired funds"), including affiliated and non-affiliated pooled investment vehicles (including mutual funds and exchange-traded funds).
Had Columbia Management Investment Advisers, LLC and/or certain of its affiliates not waived/reimbursed certain fees and expenses, account value at the end of the period would have been reduced.
Annual Report 2013
6
Columbia High Yield Municipal Fund
Portfolio of Investments
May 31, 2013
(Percentages represent value of investments compared to net assets)
Municipal Bonds 96.2%
Issue
Description | | Coupon
Rate | | Principal
Amount ($) | | Value ($) | |
Alabama 0.4% | |
Camden Industrial Development Board
Prerefunded 12/01/13 Revenue Bonds
Weyerhaeuser Co.
Series 2003B AMT(a)
12/01/24 | | | 6.375 | % | | | 275,000 | | | | 283,300 | | |
Courtland Industrial Development Board(a)
Refunding Revenue Bonds
International Paper Co. Projects
Series 2003B AMT
08/01/25 | | | 6.250 | % | | | 2,000,000 | | | | 2,016,480 | | |
Series 2005A AMT
06/01/25 | | | 5.200 | % | | | 1,000,000 | | | | 1,046,170 | | |
Total | | | | | | | 3,345,950 | | |
Alaska 0.6% | |
City of Koyukuk
Revenue Bonds
Tanana Chiefs Conference Health Care
Series 2011
10/01/41 | | | 7.750 | % | | | 5,000,000 | | | | 5,645,500 | | |
Arizona 2.2% | |
Maricopa County Pollution Control Corp.
Revenue Bonds
El Paso Electric Co. Project
Series 2009B
04/01/40 | | | 7.250 | % | | | 3,600,000 | | | | 4,221,504 | | |
Pima County Industrial Development Authority
Refunding Revenue Bonds
Facility-Edkey Charter Schools Project
Series 2013
07/01/33 | | | 6.000 | % | | | 2,000,000 | | | | 2,074,280 | | |
07/01/43 | | | 6.000 | % | | | 2,500,000 | | | | 2,507,000 | | |
07/01/48 | | | 6.000 | % | | | 2,500,000 | | | | 2,496,350 | | |
Revenue Bonds
American Charter Schools Foundation
Series 2007A
07/01/38 | | | 5.625 | % | | | 3,840,000 | | | | 3,751,526 | | |
Surprise Municipal Property Corp.
Revenue Bonds
Series 2007
04/01/32 | | | 4.900 | % | | | 2,000,000 | | | | 2,030,580 | | |
Yavapai County Industrial Development Authority
Revenue Bonds
Yavapai Regional Medical Center
Series 2008B
08/01/37 | | | 5.625 | % | | | 3,500,000 | | | | 3,682,770 | | |
Total | | | | | | | 20,764,010 | | |
Municipal Bonds (continued)
Issue
Description | | Coupon
Rate | | Principal
Amount ($) | | Value ($) | |
Arkansas 0.1% | |
City of Camden
Refunding Revenue Bonds
International Paper Co. Project
Series 2004A AMT(a)
11/01/18 | | | 5.000 | % | | | 250,000 | | | | 261,460 | | |
City of Fort Smith
Refunding Revenue Bonds
Sales & Use Tax
Series 2012
05/01/26 | | | 3.600 | % | | | 955,000 | | | | 978,550 | | |
Total | | | | | | | 1,240,010 | | |
California 12.9% | |
ABAG Finance Authority for Nonprofit Corps.
Revenue Bonds
Odd Fellows Home of California
Series 2012-A
04/01/32 | | | 5.000 | % | | | 3,000,000 | | | | 3,280,050 | | |
Agua Caliente Band of Cahuilla Indians
Revenue Bonds
Series 2003(b)
07/01/18 | | | 6.000 | % | | | 2,000,000 | | | | 1,951,440 | | |
Cabazon Band Mission Indians(b)(c)(d)(e)
Revenue Bonds
Series 2004
10/01/11 | | | 13.000 | % | | | 405,000 | | | | 186,300 | | |
10/01/15 | | | 8.375 | % | | | 560,000 | | | | 241,450 | | |
10/01/19 | | | 8.750 | % | | | 2,785,000 | | | | 1,154,020 | | |
Series 2010
10/01/20 | | | 8.375 | % | | | 1,420,000 | | | | 572,544 | | |
California Housing Finance Agency(a)
Revenue Bonds
Home Mortgage
Series 2006K AMT
08/01/26 | | | 4.625 | % | | | 5,000,000 | | | | 4,919,800 | | |
Series 2008K AMT
08/01/33 | | | 5.550 | % | | | 2,545,000 | | | | 2,601,346 | | |
California Infrastructure & Economic Development Bank
Revenue Bonds
Broad Museum Project
Series 2011A
06/01/21 | | | 5.000 | % | | | 5,000,000 | | | | 6,084,000 | | |
California Municipal Finance Authority
Revenue Bonds
UTS Renewable Energy - Waste Water
Series 2011 AMT(a)(b)(c)
12/01/32 | | | 7.500 | % | | | 1,925,000 | | | | 2,026,890 | | |
California State Department of Veterans Affairs
Revenue Bonds
Series 2012A
12/01/25 | | | 3.500 | % | | | 5,000,000 | | | | 5,024,300 | | |
The accompanying Notes to Financial Statements are an integral part of this statement.
Annual Report 2013
7
Columbia High Yield Municipal Fund
Portfolio of Investments (continued)
May 31, 2013
Municipal Bonds (continued)
Issue
Description | | Coupon
Rate | | Principal
Amount ($) | | Value ($) | |
California State Public Works Board
Refunding Revenue Bonds
Various Capital Projects
Series 2012-G
11/01/37 | | | 5.000 | % | | | 1,250,000 | | | | 1,338,113 | | |
Revenue Bonds
Various Capital Projects
Subordinated Series 2009I-1
11/01/34 | | | 6.375 | % | | | 5,000,000 | | | | 6,134,750 | | |
California Statewide Communities Development Authority
Refunding Revenue Bonds
Quail Ridge Apartments
Senior Series 2002E-1
07/01/32 | | | 5.375 | % | | | 2,000,000 | | | | 1,514,520 | | |
Revenue Bonds
American Baptist Homes West
Series 2010
10/01/39 | | | 6.250 | % | | | 2,750,000 | | | | 3,073,428 | | |
Aspire Public Schools
Series 2010
07/01/46 | | | 6.125 | % | | | 3,000,000 | | | | 3,161,010 | | |
Chino Public Financing Authority
Refunding Special Tax Bonds
Series 2012
09/01/34 | | | 5.000 | % | | | 1,775,000 | | | | 1,831,924 | | |
City of Carson
Special Assessment Bonds
District No. 92-1
Series 1992
09/02/22 | | | 7.375 | % | | | 95,000 | | | | 95,496 | | |
City of Lincoln
Prerefunded 09/01/13 Special Tax Bonds
Community Facilities District
Series 2004-1
09/01/20 | | | 5.750 | % | | | 450,000 | | | | 465,035 | | |
09/01/24 | | | 5.900 | % | | | 445,000 | | | | 460,032 | | |
City of Santa Maria Water & Wastewater
Refunding Revenue Bonds
Series 2012A(f)
02/01/25 | | | 0.000 | % | | | 3,100,000 | | | | 1,816,848 | | |
City of Upland
Certificate of Participation
San Antonio Community Hospital
Series 2011
01/01/41 | | | 6.500 | % | | | 5,000,000 | | | | 5,878,450 | | |
Compton Unified School District
Unlimited General Obligation Bonds
Election of 2002 - Capital Appreciation
Series 2006C(f)
06/01/25 | | | 0.000 | % | | | 2,310,000 | | | | 1,347,492 | | |
County of Sacramento
Revenue Bonds
Subordinated Series 2009D
07/01/35 | | | 6.000 | % | | | 2,500,000 | | | | 2,921,075 | | |
Municipal Bonds (continued)
Issue
Description | | Coupon
Rate | | Principal
Amount ($) | | Value ($) | |
Empire Union School District
Special Tax Bonds
Communities Facilities District No. 1987-1
Series 2002A (AMBAC)(f)
10/01/21 | | | 0.000 | % | | | 1,665,000 | | | | 1,212,703 | | |
Foothill-Eastern Transportation Corridor Agency
Refunding Revenue Bonds
Series 1999
01/15/40 | | | 5.750 | % | | | 3,000,000 | | | | 3,000,900 | | |
Foothill-Eastern Transportation Corridor Agency(f)
Refunding Revenue Bonds
Capital Appreciation
Series 1999
01/15/30 | | | 0.000 | % | | | 11,520,000 | | | | 4,290,970 | | |
Golden State Tobacco Securitization Corp.
Asset-Backed Revenue Bonds
Senior Series 2007A-1
06/01/47 | | | 5.125 | % | | | 5,000,000 | | | | 4,368,550 | | |
Prerefunded 06/01/13 Revenue Bonds
Series 2003A-1
06/01/39 | | | 6.750 | % | | | 200,000 | | | | 200,000 | | |
Hesperia Public Financing Authority
Tax Allocation Bonds
Redevelopment & Housing Projects
Series 2007A
09/01/27 | | | 5.500 | % | | | 5,430,000 | | | | 5,546,908 | | |
Huntington Beach Community Facilities District
Special Tax Bonds
Grand Coast Resort No. 2000-1
Series 2001
09/01/31 | | | 6.450 | % | | | 1,250,000 | | | | 1,254,600 | | |
Los Angeles Department of Water & Power
Revenue Bonds
Power System
Series 2011A
07/01/19 | | | 5.000 | % | | | 2,000,000 | | | | 2,414,600 | | |
Los Angeles Municipal Improvement Corp.
Refunding Revenue Bonds
Real Property
Series 2012C
03/01/24 | | | 5.000 | % | | | 2,225,000 | | | | 2,567,939 | | |
M-S-R Energy Authority
Revenue Bonds
Series 2009B
11/01/39 | | | 6.500 | % | | | 5,000,000 | | | | 6,621,000 | | |
Northern California Power Agency
Refunding Revenue Bonds
Hydroelectric Project No.1 SE
Series 2012
07/01/28 | | | 5.000 | % | | | 2,000,000 | | | | 2,290,260 | | |
Oakdale Public Financing Authority
Tax Allocation Bonds
Central City Redevelopment Project
Series 2004
06/01/33 | | | 5.375 | % | | | 2,000,000 | | | | 2,009,860 | | |
The accompanying Notes to Financial Statements are an integral part of this statement.
Annual Report 2013
8
Columbia High Yield Municipal Fund
Portfolio of Investments (continued)
May 31, 2013
Municipal Bonds (continued)
Issue
Description | | Coupon
Rate | | Principal
Amount ($) | | Value ($) | |
Palomar Health
Certificate of Participation
Series 2010
11/01/41 | | | 6.000 | % | | | 2,500,000 | | | | 2,688,475 | | |
Richmond Joint Powers Financing Authority
Refunding Revenue Bonds
Lease-Civic Center Project
Series 2009 (AGM)
08/01/37 | | | 5.875 | % | | | 3,500,000 | | | | 3,902,850 | | |
Riverside County Public Financing Authority
Certificate of Participation
Series 1999
05/15/29 | | | 5.800 | % | | | 5,650,000 | | | | 3,161,796 | | |
San Francisco City & County Redevelopment Agency
Tax Allocation Bonds
Mission Bay South Redevelopment
Series 2009D
08/01/39 | | | 6.625 | % | | | 1,500,000 | | | | 1,692,600 | | |
San Joaquin Hills Transportation Corridor Agency
Revenue Bonds
Senior Lien
Series 1993
01/01/33 | | | 5.000 | % | | | 5,000,000 | | | | 4,925,550 | | |
State of California
Unlimited General Obligation Bonds
Various Purpose
Series 2007
11/01/37 | | | 5.000 | % | | | 2,475,000 | | | | 2,680,400 | | |
Series 2012
04/01/42 | | | 5.000 | % | | | 3,000,000 | | | | 3,258,450 | | |
Unlimited General Obligation Refunding Bonds
Series 2012
02/01/27 | | | 5.000 | % | | | 5,000,000 | | | | 5,680,000 | | |
Twin Rivers Unified School District
Certificate of Participation
Series 2007 (AGM)
School Facility Bridge Funding Program(g)
06/01/27 | | | 3.200 | % | | | 2,000,000 | | | | 1,981,320 | | |
Total | | | | | | | 123,830,044 | | |
Colorado 2.4% | |
Anthem West Metropolitan District
Limited Tax General Obligation Bonds
Series 2005
12/01/35 | | | 6.250 | % | | | 2,000,000 | | | | 1,973,860 | | |
Colorado Educational & Cultural Facilities Authority
Refunding Revenue Bonds
Student Housing-Campus Village Apartment
Series 2008
06/01/38 | | | 5.500 | % | | | 5,000,000 | | | | 5,473,600 | | |
Municipal Bonds (continued)
Issue
Description | | Coupon
Rate | | Principal
Amount ($) | | Value ($) | |
Colorado Health Facilities Authority
Prerefunded 06/01/14 Revenue Bonds
Evangelical Lutheran
Series 2009A
06/01/38 | | | 6.125 | % | | | 5,750,000 | | | | 6,081,775 | | |
E-470 Public Highway Authority(f)
Revenue Bonds
Capital Appreciation
Senior Series 2000B (NPFGC)
09/01/18 | | | 0.000 | % | | | 4,000,000 | | | | 3,440,600 | | |
Senior Capital Appreciation
Series 1997B (NPFGC)
09/01/16 | | | 0.000 | % | | | 5,000,000 | | | | 4,620,500 | | |
Red Sky Ranch Metropolitan District
Limited General Obligation Bonds
Series 2003
12/01/33 | | | 6.050 | % | | | 1,000,000 | | | | 1,004,290 | | |
Total | | | | | | | 22,594,625 | | |
Connecticut 1.6% | |
Connecticut State Development Authority
Revenue Bonds
Alzheimer's Resource Center Project
Series 2007
08/15/21 | | | 5.400 | % | | | 1,080,000 | | | | 1,145,307 | | |
08/15/27 | | | 5.500 | % | | | 1,000,000 | | | | 1,045,650 | | |
Harbor Point Infrastructure Improvement District
Tax Allocation Bonds
Harbor Point Project
Series 2010A
04/01/39 | | | 7.875 | % | | | 5,000,000 | | | | 5,650,050 | | |
Mashantucket Western Pequot Tribe
Revenue Bonds
Subordinated Series 1999B(b)(c)(d)(e)(f)
09/01/15 | | | 0.000 | % | | | 2,000,000 | | | | 715,800 | | |
Mohegan Tribe of Indians of Connecticut(b)(d)
Revenue Bonds
Public Improvement-Priority Distribution
Series 2001
01/01/31 | | | 6.250 | % | | | 5,475,000 | | | | 5,478,778 | | |
Series 2003
01/01/33 | | | 5.250 | % | | | 1,000,000 | | | | 983,140 | | |
Total | | | | | | | 15,018,725 | | |
Delaware 0.2% | |
Centerline Equity Issuer Trust
Secured(a)(b)
05/15/19 | | | 6.300 | % | | | 1,000,000 | | | | 1,190,430 | | |
City of Wilmington
Revenue Bonds
Housing-Electra Arms Senior Associates Project
Series 1998 AMT(a)(c)
06/01/28 | | | 6.250 | % | | | 730,000 | | | | 721,620 | | |
Total | | | | | | | 1,912,050 | | |
The accompanying Notes to Financial Statements are an integral part of this statement.
Annual Report 2013
9
Columbia High Yield Municipal Fund
Portfolio of Investments (continued)
May 31, 2013
Municipal Bonds (continued)
Issue
Description | | Coupon
Rate | | Principal
Amount ($) | | Value ($) | |
District of Columbia 0.5% | |
Metropolitan Washington Airports Authority
Revenue Bonds
Airport System
Series 2012A AMT(a)
10/01/24 | | | 5.000 | % | | | 4,000,000 | | | | 4,670,800 | | |
Resolution Trust Corp.
Pass-Through Certificates
Series 1993A(c)
12/01/16 | | | 8.500 | % | | | 455,481 | | | | 452,648 | | |
Total | | | | | | | 5,123,448 | | |
Florida 8.8% | |
Broward County Housing Finance Authority
Revenue Bonds
Chaves Lake Apartments Project
Series 2000A AMT(a)(c)
07/01/40 | | | 7.500 | % | | | 1,500,000 | | | | 1,501,575 | | |
Capital Trust Agency, Inc.
Revenue Bonds
Atlantic Housing Foundation
Subordinated Series 2008B(c)
07/15/32 | | | 7.000 | % | | | 1,370,000 | | | | 616,185 | | |
Celebration Community Development District
Special Assessment Bonds
Series 2003A
05/01/34 | | | 6.400 | % | | | 860,000 | | | | 867,078 | | |
Citizens Property Insurance Corp.
Revenue Bonds
Senior Secured
Series 2012A-1
06/01/21 | | | 5.000 | % | | | 2,400,000 | | | | 2,823,144 | | |
Citizens Property Insurance Corp.(h)
Revenue Bonds
High Risk
Series 2010A3
06/01/13 | | | 1.870 | % | | | 5,000,000 | | | | 5,000,208 | | |
City of Lakeland
Refunding Revenue Bonds
1st Mortgage-Carpenters Home Estates
Series 2008
01/01/28 | | | 6.250 | % | | | 675,000 | | | | 737,242 | | |
01/01/43 | | | 6.375 | % | | | 2,250,000 | | | | 2,425,072 | | |
County of Broward Airport System
Refunding Revenue Bonds
Series 2012P-1 AMT(a)
10/01/23 | | | 5.000 | % | | | 5,000,000 | | | | 5,771,200 | | |
County of Lee Solid Waste System
Revenue Bonds
Series 2006A (AMBAC) AMT(a)
10/01/17 | | | 5.000 | % | | | 2,010,000 | | | | 2,132,268 | | |
Municipal Bonds (continued)
Issue
Description | | Coupon
Rate | | Principal
Amount ($) | | Value ($) | |
County of Miami-Dade
Refunding Revenue Bonds
Subordinated Series 2012-B
10/01/37 | | | 5.000 | % | | | 1,530,000 | | | | 1,663,033 | | |
County of Miami-Dade(f)
Subordinated Revenue Bonds
Capital Appreciation
Series 2009B
10/01/41 | | | 0.000 | % | | | 30,000,000 | | | | 7,031,100 | | |
Florida Development Finance Corp.
Revenue Bonds
Renaissance Charter School
Series 2010A
09/15/40 | | | 6.000 | % | | | 3,750,000 | | | | 3,969,337 | | |
Series 2012-A
06/15/43 | | | 6.125 | % | | | 5,000,000 | | | | 4,908,950 | | |
Lee County Industrial Development Authority
Refunding Revenue Bonds
Shell PT/Alliance Community Project
Series 2007
11/15/29 | | | 5.000 | % | | | 4,000,000 | | | | 4,153,840 | | |
Mid-Bay Bridge Authority
Revenue Bonds
Series 2011A
10/01/40 | | | 7.250 | % | | | 4,000,000 | | | | 4,971,080 | | |
Middle Village Community Development District
Special Assessment Bonds
Series 2004A(c)
05/01/35 | | | 6.000 | % | | | 2,000,000 | | | | 1,671,280 | | |
North Brevard County Hospital District
Refunding Revenue Bonds
Parrish Medical Center Project
Series 2008
10/01/38 | | | 5.750 | % | | | 4,000,000 | | | | 4,385,240 | | |
Orange County Health Facilities Authority
Refunding Revenue Bonds
Health Care-Orlando Lutheran
Series 2005
07/01/26 | | | 5.700 | % | | | 2,000,000 | | | | 2,038,200 | | |
Mayflower Retirement Center
Series 2012
06/01/42 | | | 5.125 | % | | | 750,000 | | | | 782,228 | | |
Revenue Bonds
1st Mortgage-Orlando Lutheran Tower
Series 2007
07/01/32 | | | 5.500 | % | | | 350,000 | | | | 355,471 | | |
07/01/38 | | | 5.500 | % | | | 1,750,000 | | | | 1,772,207 | | |
Sarasota County Health Facilities Authority
Refunding Revenue Bonds
Village on the Isle Project
Series 2007
01/01/32 | | | 5.500 | % | | | 4,000,000 | | | | 4,204,400 | | |
The accompanying Notes to Financial Statements are an integral part of this statement.
Annual Report 2013
10
Columbia High Yield Municipal Fund
Portfolio of Investments (continued)
May 31, 2013
Municipal Bonds (continued)
Issue
Description | | Coupon
Rate | | Principal
Amount ($) | | Value ($) | |
Seminole Indian Tribe of Florida
Revenue Bonds
Series 2007A(b)(d)
10/01/24 | | | 5.500 | % | | | 2,000,000 | | | | 2,172,840 | | |
Seven Oaks Community Development District II
Special Assessment Bonds
Series 2004A
05/01/35 | | | 5.875 | % | | | 430,000 | | | | 326,413 | | |
Series 2004B
05/01/16 | | | 7.500 | % | | | 1,725,000 | | | | 1,666,333 | | |
South Lake County Hospital District
Revenue Bonds
South Lake Hospital, Inc.
Series 2003
10/01/28 | | | 6.375 | % | | | 750,000 | | | | 762,353 | | |
10/01/34 | | | 6.375 | % | | | 500,000 | | | | 508,405 | | |
Series 2010A
04/01/39 | | | 6.250 | % | | | 2,000,000 | | | | 2,255,200 | | |
St. Johns County Industrial Development Authority
Refunding Revenue Bonds
Bayview Project
Series 2007A
10/01/41 | | | 5.250 | % | | | 3,725,000 | | | | 3,195,677 | | |
Vicars Landing Project
Series 2007
02/15/27 | | | 5.000 | % | | | 2,500,000 | | | | 2,588,425 | | |
Revenue Bonds
Glenmoor Project
Series 2006A
01/01/40 | | | 5.375 | % | | | 4,275,000 | | | | 2,938,165 | | |
Waterset North Community Development District
Special Assessment Bonds
Series 2007A
05/01/39 | | | 6.600 | % | | | 1,905,000 | | | | 1,786,928 | | |
West Villages Improvement District
Special Assessment Bonds
Unit of Development No. 3
Series 2006(c)(e)
05/01/37 | | | 5.500 | % | | | 1,645,000 | | | | 773,150 | | |
Westchester Community Development District No. 1
Special Assessment Bonds
Community Infrastructure
Series 2003
05/01/35 | | | 6.125 | % | | | 800,000 | | | | 807,712 | | |
Westridge Community Development District
Special Assessment Bonds
Series 2005(c)(e)
05/01/37 | | | 5.800 | % | | | 2,650,000 | | | | 1,010,843 | | |
Total | | | | | | | 84,572,782 | | |
Municipal Bonds (continued)
Issue
Description | | Coupon
Rate | | Principal
Amount ($) | | Value ($) | |
Georgia 2.5% | |
County of Fulton Water & Sewerage
Refunding Revenue Bonds
Series 2011
01/01/21 | | | 5.000 | % | | | 3,500,000 | | | | 4,229,890 | | |
DeKalb County Hospital Authority
Revenue Bonds
DeKalb Medical Center, Inc. Project
Series 2010
09/01/40 | | | 6.125 | % | | | 4,500,000 | | | | 5,181,885 | | |
Fulton County Residential Care Facilities for the Elderly Authority
Revenue Bonds
1st Mortgage-Lenbrook Project
Series 2006A
07/01/17 | | | 5.000 | % | | | 1,700,000 | | | | 1,777,095 | | |
07/01/29 | | | 5.000 | % | | | 3,000,000 | | | | 3,004,260 | | |
Municipal Electric Authority of Georgia
Revenue Bonds
Series 1991V
01/01/18 | | | 6.600 | % | | | 65,000 | | | | 69,120 | | |
Series 1991V Escrowed to Maturity
01/01/18 | | | 6.600 | % | | | 690,000 | | | | 795,459 | | |
Rockdale County Development Authority
Revenue Bonds
Visy Paper Project
Series 2007A AMT(a)
01/01/34 | | | 6.125 | % | | | 5,000,000 | | | | 5,199,650 | | |
Savannah Economic Development Authority
Revenue Bonds
1st Mortgage-Marshes of Skidaway
Series 2003A
01/01/24 | | | 7.400 | % | | | 500,000 | | | | 513,040 | | |
01/01/34 | | | 7.400 | % | | | 3,000,000 | | | | 3,064,080 | | |
Total | | | | | | | 23,834,479 | | |
Guam 0.7% | |
Guam Department of Education
Certificate of Participation
John F. Kennedy High School
Series 2010A(d)
12/01/40 | | | 6.875 | % | | | 4,750,000 | | | | 5,241,245 | | |
Guam Power Authority
Refunding Revenue Bonds
Series 2012-A(d)
10/01/30 | | | 5.000 | % | | | 1,250,000 | | | | 1,402,375 | | |
Total | | | | | | | 6,643,620 | | |
The accompanying Notes to Financial Statements are an integral part of this statement.
Annual Report 2013
11
Columbia High Yield Municipal Fund
Portfolio of Investments (continued)
May 31, 2013
Municipal Bonds (continued)
Issue
Description | | Coupon
Rate | | Principal
Amount ($) | | Value ($) | |
Hawaii 0.5% | |
Hawaii State Department of Budget & Finance
Revenue Bonds
15 Craigside Project
Series 2009A
11/15/44 | | | 9.000 | % | | | 2,375,000 | | | | 2,835,726 | | |
Hawaiian Electric Co. Subsidiary
Series 2009
07/01/39 | | | 6.500 | % | | | 1,750,000 | | | | 2,047,903 | | |
Total | | | | | | | 4,883,629 | | |
Illinois 8.8% | |
City of Chicago
Tax Allocation Bonds
Pilsen Redevelopment
Series 2004B
06/01/22 | | | 6.750 | % | | | 1,225,000 | | | | 1,265,878 | | |
County of Cook
Unlimited General Obligation Refunding Bonds
Series 2011A
11/15/19 | | | 5.000 | % | | | 5,000,000 | | | | 5,967,250 | | |
Du Page County Special Service Area No. 31
Special Tax Bonds
Monarch Landing Project
Series 2006
03/01/36 | | | 5.625 | % | | | 750,000 | | | | 759,533 | | |
Illinois Finance Authority
Refunding Revenue Bonds
Chicago Charter School Project
Series 2007
12/01/36 | | | 5.000 | % | | | 1,750,000 | | | | 1,792,263 | | |
Uno Charter School Network, Inc. Project
Series 2011A
10/01/31 | | | 6.875 | % | | | 2,500,000 | | | | 2,959,675 | | |
Revenue Bonds
CHF-Normal LLC-Illinois State University
Series 2011
04/01/43 | | | 7.000 | % | | | 3,450,000 | | | | 4,038,639 | | |
Columbia College
Series 2007 (NPFGC)
12/01/37 | | | 5.000 | % | | | 5,000,000 | | | | 5,195,700 | | |
OSF Healthcare System
Series 2012-A
05/15/22 | | | 5.000 | % | | | 2,000,000 | | | | 2,323,640 | | |
Provena Health
Series 2009A
08/15/34 | | | 7.750 | % | | | 4,000,000 | | | | 5,078,640 | | |
Riverside Health System
Series 2009
11/15/35 | | | 6.250 | % | | | 3,000,000 | | | | 3,437,520 | | |
Series 2003A
11/15/32 | | | 7.000 | % | | | 1,000,000 | | | | 1,006,720 | | |
Silver Cross & Medical Centers
Series 2009
08/15/44 | | | 7.000 | % | | | 5,000,000 | | | | 5,928,350 | | |
Municipal Bonds (continued)
Issue
Description | | Coupon
Rate | | Principal
Amount ($) | | Value ($) | |
Smith Village Project
Series 2005A
11/15/35 | | | 6.250 | % | | | 2,750,000 | | | | 2,829,117 | | |
Illinois Finance Authority(c)(e)
Revenue Bonds
Leafs Hockey Club Project
Series 2007A
03/01/37 | | | 6.000 | % | | | 1,000,000 | | | | 326,820 | | |
Metropolitan Pier & Exposition Authority
Refunding Revenue Bonds
McCormick
Series 2010B-2
06/15/50 | | | 5.000 | % | | | 5,000,000 | | | | 5,304,050 | | |
Plano Special Service Area No. 4
Special Tax Bonds
Lakewood Springs Project Unit 5
Series 2005 B
03/01/35 | | | 6.000 | % | | | 2,922,000 | | | | 2,991,456 | | |
Railsplitter Tobacco Settlement Authority
Revenue Bonds
Series 2010
06/01/28 | | | 6.000 | % | | | 5,000,000 | | | | 5,961,800 | | |
Southwestern Illinois Development Authority
Revenue Bonds
Anderson Hospital
Series 2006
08/15/26 | | | 5.125 | % | | | 1,245,000 | | | | 1,267,335 | | |
State of Illinois
Unlimited General Obligation Bonds
Series 2012
03/01/20 | | | 5.000 | % | | | 1,250,000 | | | | 1,420,238 | | |
Unlimited General Obligation Refunding Bonds
Series 2010
01/01/20 | | | 5.000 | % | | | 2,650,000 | | | | 3,006,743 | | |
Series 2012
08/01/21 | | | 5.000 | % | | | 2,500,000 | | | | 2,834,025 | | |
08/01/23 | | | 5.000 | % | | | 2,500,000 | | | | 2,823,500 | | |
Village of Annawan
Tax Allocation Bonds
Patriot Renewable Fuels LLC Project
Series 2007
01/01/18 | | | 5.625 | % | | | 3,390,000 | | | | 3,113,545 | | |
Village of Bolingbrook
Sales Tax Revenue Bonds
Series 2005(c)
01/01/24 | | | 6.250 | % | | | 1,500,000 | | | | 1,162,875 | | |
Village of Hillside
Tax Allocation Bonds
Senior Lien-Mannheim Redevelopment Project
Series 2008
01/01/28 | | | 7.000 | % | | | 5,240,000 | | | | 5,333,324 | | |
The accompanying Notes to Financial Statements are an integral part of this statement.
Annual Report 2013
12
Columbia High Yield Municipal Fund
Portfolio of Investments (continued)
May 31, 2013
Municipal Bonds (continued)
Issue
Description | | Coupon
Rate | | Principal
Amount ($) | | Value ($) | |
Village of Lincolnshire
Special Tax Bonds
Sedgebrook Project
Series 2004
03/01/34 | | | 6.250 | % | | | 713,000 | | | | 737,713 | | |
Village of Rosemont
Tax Allocation Bonds
River Road Hotel Partners Project
Series 2007
12/30/23 | | | 5.100 | % | | | 2,300,000 | | | | 2,049,737 | | |
Volo Village Special Service Area No. 3
Special Tax Bonds
Symphony Meadows Project
Series 2006-1
03/01/36 | | | 6.000 | % | | | 3,709,000 | | | | 3,281,760 | | |
Total | | | | | | | 84,197,846 | | |
Indiana 0.4% | |
City of Portage
Tax Allocation Bonds
Ameriplex Project
Series 2006
07/15/23 | | | 5.000 | % | | | 700,000 | | | | 733,943 | | |
Indiana Health & Educational Facilities Financing Authority
Revenue Bonds
Baptist Homes of Indiana
Series 2005
11/15/35 | | | 5.250 | % | | | 2,750,000 | | | | 2,823,095 | | |
Total | | | | | | | 3,557,038 | | |
Iowa 1.3% | |
City of Marion
Refunding Revenue Bonds
1st Mortgage
Series 2003
01/01/29 | | | 8.000 | % | | | 187,000 | | | | 194,495 | | |
Iowa Finance Authority
Revenue Bonds
Care Initiatives Project
Series 1998B
07/01/18 | | | 5.750 | % | | | 380,000 | | | | 380,790 | | |
07/01/28 | | | 5.750 | % | | | 1,475,000 | | | | 1,477,095 | | |
Series 2013
Iowa Fertilizer Co. Project
12/01/22 | | | 5.500 | % | | | 5,000,000 | | | | 5,206,650 | | |
Iowa Finance Authority(c)
Revenue Bonds
Deerfield Retirement Community, Inc.
Series 2007A
11/15/15 | | | 5.000 | % | | | 2,210,000 | | | | 1,581,321 | | |
11/15/27 | | | 5.500 | % | | | 1,135,000 | | | | 785,375 | | |
11/15/37 | | | 5.500 | % | | | 750,000 | | | | 505,695 | | |
Municipal Bonds (continued)
Issue
Description | | Coupon
Rate | | Principal
Amount ($) | | Value ($) | |
Iowa Student Loan Liquidity Corp.
Revenue Bonds
Senior Series 2011A-2 AMT(a)
12/01/30 | | | 5.850 | % | | | 2,370,000 | | | | 2,672,886 | | |
Total | | | | | | | 12,804,307 | | |
Kansas 2.1% | |
City of Lenexa
Revenue Bonds
Lakeview Village, Inc. Project
Series 2009
05/15/29 | | | 7.125 | % | | | 500,000 | | | | 563,305 | | |
05/15/39 | | | 7.250 | % | | | 1,500,000 | | | | 1,672,350 | | |
City of Manhattan
Revenue Bonds
Meadowlark Hills Retirement
Series 2007A
05/15/24 | | | 5.000 | % | | | 3,000,000 | | | | 3,038,550 | | |
05/15/29 | | | 5.000 | % | | | 2,680,000 | | | | 2,683,752 | | |
City of Overland Park KS
Revenue Bonds
Prairiefire-Lionsgate Project
Series 2012
12/15/32 | | | 6.000 | % | | | 6,000,000 | | | | 5,904,960 | | |
Wyandotte County-Kansas City Unified Government
Revenue Bonds
Legends Village West Project
Series 2006
10/01/28 | | | 4.875 | % | | | 6,245,000 | | | | 6,151,825 | | |
Total | | | | | | | 20,014,742 | | |
Kentucky 0.2% | |
Kentucky Economic Development Finance Authority
Refunding Revenue Bonds
1st Mortgage-AHF/KY-IA, Inc. Project
Series 2003
01/01/29 | | | 8.000 | % | | | 610,000 | | | | 634,449 | | |
Revenue Bonds
Louisville Arena
Subordinated Series 2008A-1 (AGM)
12/01/38 | | | 6.000 | % | | | 1,150,000 | | | | 1,237,653 | | |
Total | | | | | | | 1,872,102 | | |
Louisiana 1.9% | |
Louisiana Local Government Environmental Facilities &
Community Development Authority
Revenue Bonds
Westlake Chemical Corp.
Series 2010A-2
11/01/35 | | | 6.500 | % | | | 5,000,000 | | | | 5,936,300 | | |
The accompanying Notes to Financial Statements are an integral part of this statement.
Annual Report 2013
13
Columbia High Yield Municipal Fund
Portfolio of Investments (continued)
May 31, 2013
Municipal Bonds (continued)
Issue
Description | | Coupon
Rate | | Principal
Amount ($) | | Value ($) | |
New Orleans Aviation Board
Revenue Bonds
Consolidated Rental Car
Series 2009A
01/01/40 | | | 6.500 | % | | | 5,000,000 | | | | 5,834,600 | | |
Parish of St. Charles
Revenue Bonds
Valero Energy Corp.
Series 2010
12/01/40 | | | 4.000 | % | | | 1,400,000 | | | | 1,514,296 | | |
Parish of St. John the Baptist
Revenue Bonds
Marathon Oil Corp.
Series 2007A
06/01/37 | | | 5.125 | % | | | 5,000,000 | | | | 5,270,250 | | |
Total | | | | | | | 18,555,446 | | |
Maryland 0.6% | |
City of Westminster
Revenue Bonds
Carroll Lutheran Village
Series 2004A
05/01/34 | | | 6.250 | % | | | 1,750,000 | | | | 1,758,768 | | |
Maryland Economic Development Corp.
Refunding Revenue Bonds
CNX Marine Terminals, Inc.
Series 2010
09/01/25 | | | 5.750 | % | | | 1,000,000 | | | | 1,106,140 | | |
Revenue Bonds
University of Maryland-College Park Projects
Series 2008
06/01/43 | | | 5.875 | % | | | 2,590,000 | | | | 2,796,552 | | |
Total | | | | | | | 5,661,460 | | |
Massachusetts 2.9% | |
Massachusetts Development Finance Agency
Refunding Revenue Bonds
1st Mortgage-VOA Concord
Series 2007
11/01/41 | | | 5.200 | % | | | 1,000,000 | | | | 957,350 | | |
Revenue Bonds
Foxborough Regional Charter School
Series 2010A
07/01/42 | | | 7.000 | % | | | 4,200,000 | | | | 4,922,316 | | |
Linden Ponds, Inc. Facility
Series 2011A-1
11/15/31 | | | 6.250 | % | | | 2,112,442 | | | | 1,989,118 | | |
11/15/39 | | | 6.250 | % | | | 634,649 | | | | 578,343 | | |
11/15/46 | | | 6.250 | % | | | 2,502,917 | | | | 2,235,105 | | |
Series 2011A-2
11/15/46 | | | 5.500 | % | | | 279,667 | | | | 223,034 | | |
Municipal Bonds (continued)
Issue
Description | | Coupon
Rate | | Principal
Amount ($) | | Value ($) | |
Massachusetts Development Finance Agency(c)
Revenue Bonds
Groves-Lincoln
Series 2009A
06/01/44 | | | 7.875 | % | | | 1,500,000 | | | | 705,060 | | |
Series 2009B-1
06/01/16 | | | 7.250 | % | | | 3,500,000 | | | | 1,645,140 | | |
Health Care Facility-Alliance
Series 1999A
07/01/32 | | | 7.100 | % | | | 2,035,000 | | | | 2,035,936 | | |
Massachusetts Development Finance Agency(f)
Revenue Bonds
Linden Ponds, Inc. Facility
Series 2011B
11/15/56 | | | 0.000 | % | | | 1,391,019 | | | | 9,793 | | |
Massachusetts Educational Financing Authority(a)
Revenue Bonds
Series 2008H (AGM) AMT
01/01/30 | | | 6.350 | % | | | 2,630,000 | | | | 2,878,325 | | |
Series 2012J AMT
07/01/21 | | | 5.000 | % | | | 3,000,000 | | | | 3,316,650 | | |
Massachusetts Health & Educational Facilities Authority
Revenue Bonds
Boston Medical Center Project
Series 2008
07/01/38 | | | 5.250 | % | | | 5,000,000 | | | | 5,280,050 | | |
Milford Regional Medical
Series 2007E
07/15/32 | | | 5.000 | % | | | 1,250,000 | | | | 1,256,862 | | |
Total | | | | | | | 28,033,082 | | |
Michigan 4.1% | |
Allen Academy
Refunding Revenue Bonds
Public School Academy
Series 2013
06/01/33 | | | 6.000 | % | | | 5,750,000 | | | | 5,893,347 | | |
City of Detroit Sewage Disposal System
Refunding Revenue Bonds
Senior Lien
Series 2012A
07/01/23 | | | 5.000 | % | | | 3,025,000 | | | | 3,408,025 | | |
07/01/39 | | | 5.250 | % | | | 1,375,000 | | | | 1,464,870 | | |
County of Wayne
Limited General Obligation Bonds
Building Improvement
Series 2009A
11/01/39 | | | 6.750 | % | | | 4,805,000 | | | | 5,425,758 | | |
Michigan Finance Authority
Revenue Bonds
School District
Series 2012
06/01/20 | | | 5.000 | % | | | 1,400,000 | | | | 1,625,358 | | |
The accompanying Notes to Financial Statements are an integral part of this statement.
Annual Report 2013
14
Columbia High Yield Municipal Fund
Portfolio of Investments (continued)
May 31, 2013
Municipal Bonds (continued)
Issue
Description | | Coupon
Rate | | Principal
Amount ($) | | Value ($) | |
Michigan State Hospital Finance Authority
Refunding Revenue Bonds
Henry Ford Health System
Series 2006A
11/15/46 | | | 5.250 | % | | | 3,000,000 | | | | 3,133,410 | | |
Oakwood Obligation Group
Series 2007A
07/15/37 | | | 5.000 | % | | | 5,000,000 | | | | 5,193,850 | | |
Michigan Strategic Fund
Refunding Revenue Bonds
Michigan Sugar Co.- Carollton
Series 1998C AMT(a)(c)
11/01/25 | | | 6.550 | % | | | 1,500,000 | | | | 1,449,180 | | |
Michigan Tobacco Settlement Finance Authority
Revenue Bonds
Senior Series 2007A
06/01/34 | | | 6.000 | % | | | 1,000,000 | | | | 948,630 | | |
06/01/48 | | | 6.000 | % | | | 11,000,000 | | | | 10,173,130 | | |
Summit Academy North
Refunding Revenue Bonds
Series 2005
11/01/35 | | | 5.500 | % | | | 750,000 | | | | 678,428 | | |
Total | | | | | | | 39,393,986 | | |
Minnesota 1.9% | |
City of Anoka
Revenue Bonds
Homestead Anoka, Inc. Project
Series 2011A
11/01/46 | | | 7.000 | % | | | 4,070,000 | | | | 4,346,394 | | |
City of Columbia Heights
Refunding Revenue Bonds
Crest View Corp. Projects
Series 2007A
07/01/27 | | | 5.550 | % | | | 1,000,000 | | | | 914,790 | | |
07/01/42 | | | 5.700 | % | | | 2,000,000 | | | | 1,708,780 | | |
City of Eveleth
Refunding Revenue Bonds
Arrowhead Senior Living Community
Series 2007
10/01/27 | | | 5.200 | % | | | 2,375,000 | | | | 2,385,687 | | |
City of Minneapolis
Revenue Bonds
Riverton Community Housing Project
Series 2006A
08/01/40 | | | 5.700 | % | | | 1,600,000 | | | | 1,601,248 | | |
Minneapolis & St. Paul Housing & Redevelopment Authority
Revenue Bonds
HealthPartners Obligation Group Project
Series 2003
12/01/29 | | | 5.875 | % | | | 400,000 | | | | 409,384 | | |
Municipal Bonds (continued)
Issue
Description | | Coupon
Rate | | Principal
Amount ($) | | Value ($) | |
Minneapolis/St. Paul Housing Finance Board
Revenue Bonds
Mortgage-Backed Securities Program-Cityliving
Series 2006A-2 (GNMA/FNMA) AMT(a)
12/01/38 | | | 5.000 | % | | | 28,984 | | | | 29,716 | | |
St. Paul Housing & Redevelopment Authority
Revenue Bonds
Healtheast Project
Series 2005
11/15/30 | | | 6.000 | % | | | 4,000,000 | | | | 4,267,280 | | |
11/15/35 | | | 6.000 | % | | | 2,000,000 | | | | 2,126,820 | | |
Total | | | | | | | 17,790,099 | | |
Mississippi 0.5% | |
County of Lowndes
Refunding Revenue Bonds
Weyerhaeuser Co. Project
Series 1992A
04/01/22 | | | 6.800 | % | | | 1,995,000 | | | | 2,381,671 | | |
Series 1992B
04/01/22 | | | 6.700 | % | | | 230,000 | | | | 271,959 | | |
County of Warren
Revenue Bonds
International Paper Co.
Series 2008A
09/01/32 | | | 6.500 | % | | | 2,000,000 | | | | 2,275,580 | | |
Rankin County Five Lakes Utility District
Series 1994(c)
07/15/37 | | | 7.000 | % | | | 250,000 | | | | 250,137 | | |
Total | | | | | | | 5,179,347 | | |
Missouri 3.7% | |
Cape Girardeau County Industrial Development Authority
Revenue Bonds
Southeast Missouri Hospital Association
Series 2007
06/01/27 | | | 5.000 | % | | | 1,800,000 | | | | 1,841,328 | | |
City of Fenton
Refunding Tax Allocation Bonds
Gravois Bluffs Redevelopment Project
Series 2006
04/01/21 | | | 4.500 | % | | | 90,000 | | | | 91,189 | | |
City of Kansas City
Tax Allocation Bonds
Kansas City-Maincor Project
Series 2007A
03/01/18 | | | 5.250 | % | | | 900,000 | | | | 943,011 | | |
Shoal Creek Parkway Project
Series 2011
06/01/25 | | | 6.500 | % | | | 3,100,000 | | | | 3,201,928 | | |
The accompanying Notes to Financial Statements are an integral part of this statement.
Annual Report 2013
15
Columbia High Yield Municipal Fund
Portfolio of Investments (continued)
May 31, 2013
Municipal Bonds (continued)
Issue
Description | | Coupon
Rate | | Principal
Amount ($) | | Value ($) | |
City of Manchester
Refunding Tax Allocation Bonds
Highway 141/Manchester Road Project
Series 2010
11/01/39 | | | 6.875 | % | | | 5,000,000 | | | | 5,361,600 | | |
City of Riverside
Tax Allocation Bonds
L-385 Levee Project
Series 2004
05/01/20 | | | 5.250 | % | | | 1,275,000 | | | | 1,340,765 | | |
Grundy County Industrial Development Authority
Revenue Bonds
Wright Memorial Hospital
Series 2009
09/01/34 | | | 6.750 | % | | | 2,250,000 | | | | 2,495,812 | | |
Kirkwood Industrial Development Authority
Revenue Bonds
Aberdeen Heights
Series 2010A
05/15/45 | | | 8.250 | % | | | 4,500,000 | | | | 5,331,285 | | |
Saline County Industrial Development Authority
Revenue Bonds
John Fitzgibbon Memorial Hospital, Inc.
Series 2005
12/01/35 | | | 5.625 | % | | | 5,485,000 | | | | 5,679,224 | | |
St. Louis County Industrial Development Authority
Refunding Revenue Bonds
Ranken Jordan Project
Series 2007
11/15/35 | | | 5.000 | % | | | 1,300,000 | | | | 1,301,144 | | |
Revenue Bonds
St. Andrews Residence for Seniors
Series 2007A
12/01/26 | | | 6.250 | % | | | 2,000,000 | | | | 2,114,460 | | |
12/01/41 | | | 6.375 | % | | | 3,000,000 | | | | 3,131,580 | | |
St. Louis County Industrial Development Authority(f)
Revenue Bonds
Convention Center Hotel
Series 2000 (AMBAC)
07/15/18 | | | 0.000 | % | | | 3,000,000 | | | | 2,500,800 | | |
Total | | | | | | | 35,334,126 | | |
Montana 0.1% | |
Montana Facility Finance Authority
Revenue Bonds
Senior Living-St. John's Lutheran
Series 2006A
05/15/36 | | | 6.125 | % | | | 1,000,000 | | | | 1,028,520 | | |
Municipal Bonds (continued)
Issue
Description | | Coupon
Rate | | Principal
Amount ($) | | Value ($) | |
Nebraska 0.6% | |
Central Plains Energy Project
Revenue Bonds
Project #3
Series 2012
09/01/42 | | | 5.000 | % | | | 5,000,000 | | | | 5,371,700 | | |
Nevada 0.5% | |
City of Sparks
Senior Sales Tax Anticipation Revenue Bonds
Series 2008A(b)
06/15/28 | | | 6.750 | % | | | 5,000,000 | | | | 5,132,450 | | |
New Hampshire —% | |
New Hampshire Business Finance Authority
Revenue Bonds
Pennichuck Water Works, Inc. Project
Series 1988 Escrowed to Maturity AMT(a)
07/01/18 | | | 7.500 | % | | | 180,000 | | | | 207,661 | | |
New Jersey 2.5% | |
Middlesex County Improvement Authority(c)(e)
Revenue Bonds
Heldrich Center Hotel
Series 2005C
01/01/37 | | | 8.750 | % | | | 1,250,000 | | | | 87,500 | | |
Subordinated Revenue Bonds
Heldrich Center Hotel
Series 2005B
01/01/25 | | | 6.125 | % | | | 2,750,000 | | | | 192,500 | | |
01/01/37 | | | 6.250 | % | | | 6,450,000 | | | | 451,500 | | |
New Jersey Economic Development Authority
Prerefunded 06/15/14 Revenue Bonds
Cigarette Tax
Series 2004
06/15/29 | | | 5.750 | % | | | 1,000,000 | | | | 1,056,000 | | |
Refunding Revenue Bonds
Seabrook Village, Inc. Facility
Series 2006
11/15/36 | | | 5.250 | % | | | 2,250,000 | | | | 2,306,655 | | |
New Jersey Economic Development Authority(a)
Refunding Revenue Bonds
Series 2006B AMT
01/01/37 | | | 6.875 | % | | | 4,000,000 | | | | 4,054,720 | | |
Revenue Bonds
Continental Airlines, Inc. Project
Series 2003 AMT
06/01/33 | | | 9.000 | % | | | 1,000,000 | | | | 1,029,960 | | |
UMM Energy Partners
Series 2012A AMT
06/15/43 | | | 5.125 | % | | | 2,000,000 | | | | 2,110,200 | | |
The accompanying Notes to Financial Statements are an integral part of this statement.
Annual Report 2013
16
Columbia High Yield Municipal Fund
Portfolio of Investments (continued)
May 31, 2013
Municipal Bonds (continued)
Issue
Description | | Coupon
Rate | | Principal
Amount ($) | | Value ($) | |
New Jersey Health Care Facilities Financing Authority
Revenue Bonds
St. Josephs Healthcare Systems
Series 2008
07/01/38 | | | 6.625 | % | | | 3,000,000 | | | | 3,412,050 | | |
New Jersey Higher Education Student Assistance Authority(a)(g)
Revenue Bonds
Senior Series 2013-1B AMT
12/01/43 | | | 4.750 | % | | | 5,000,000 | | | | 4,851,100 | | |
Series 2013-1A AMT
12/01/21 | | | 5.000 | % | | | 1,500,000 | | | | 1,690,020 | | |
Tobacco Settlement Financing Corp.
Prerefunded 06/01/13 Revenue Bonds
Series 2003
06/01/39 | | | 6.750 | % | | | 2,000,000 | | | | 2,000,000 | | |
Tobacco Settlement Financing Corp.(f)
Revenue Bonds
Capital Appreciation
Series 2007-1C
06/01/41 | | | 0.000 | % | | | 7,500,000 | | | | 378,225 | | |
Total | | | | | | | 23,620,430 | | |
New York 4.0% | |
Broome County Industrial Development Agency
Revenue Bonds
Good Shepard Village
Series 2008A
07/01/40 | | | 6.875 | % | | | 4,000,000 | | | | 4,280,960 | | |
Build NYC Resource Corp.
Revenue Bonds
Series 2013
International Leadership Charter School
07/01/43 | | | 6.000 | % | | | 4,330,000 | | | | 4,323,722 | | |
County of Rockland
General Obligation Limited Notes
BAN Series 2012B
06/06/13 | | | 4.000 | % | | | 1,250,000 | | | | 1,250,227 | | |
Huntington Housing Authority
Revenue Bonds
Gurwin Jewish Senior Residences
Series 1999A
05/01/19 | | | 5.875 | % | | | 1,265,000 | | | | 1,266,834 | | |
05/01/29 | | | 6.000 | % | | | 625,000 | | | | 625,531 | | |
Nassau County Tobacco Settlement Corp.
Asset-Backed Revenue Bonds
Capital Appreciation
Third Series 2006D(f)
06/01/60 | | | 0.000 | % | | | 25,000,000 | | | | 164,250 | | |
New York State Dormitory Authority
Revenue Bonds
NYU Hospital Center
Series 2007B
07/01/37 | | | 5.625 | % | | | 2,000,000 | | | | 2,171,060 | | |
Municipal Bonds (continued)
Issue
Description | | Coupon
Rate | | Principal
Amount ($) | | Value ($) | |
Series 2011A
07/01/40 | | | 6.000 | % | | | 1,000,000 | | | | 1,155,610 | | |
The New School
Series 2010
07/01/50 | | | 6.000 | % | | | 5,000,000 | | | | 5,781,450 | | |
Port Authority of New York & New Jersey
Revenue Bonds
JFK International Air Terminal
Series 2010
12/01/42 | | | 6.000 | % | | | 1,350,000 | | | | 1,567,755 | | |
Port Authority of New York & New Jersey(a)
Revenue Bonds
5th Installment-Special Project
Series 1996-4 AMT
10/01/19 | | | 6.750 | % | | | 120,000 | | | | 119,693 | | |
Seneca County Industrial Development Agency
Revenue Bonds
Seneca Meadows, Inc. Project
Series 2005 AMT(a)(b)
10/01/35 | | | 6.625 | % | | | 5,000,000 | | | | 5,051,800 | | |
Suffolk County Industrial Development Agency
Revenue Bonds
Gurwin Jewish-Phase II
Series 2004
05/01/39 | | | 6.700 | % | | | 470,000 | | | | 485,670 | | |
Town of Ramapo
Refunding General Obligation Limited Notes
BAN Series 2013
05/28/14 | | | 4.700 | % | | | 3,500,000 | | | | 3,539,165 | | |
Triborough Bridge & Tunnel Authority
Refunding Revenue Bonds
General
Series 2012B(f)
11/15/32 | | | 0.000 | % | | | 13,185,000 | | | | 6,355,829 | | |
Total | | | | | | | 38,139,556 | | |
North Carolina 1.5% | |
Charlotte-Mecklenburg Hospital Authority
Refunding Revenue Bonds
Carolinas Health Care System Group
Series 2008A
01/15/24 | | | 5.250 | % | | | 5,000,000 | | | | 5,600,850 | | |
Durham Housing Authority
Revenue Bonds
Series 2005 AMT(a)(c)
02/01/38 | | | 5.650 | % | | | 3,168,278 | | | | 3,198,756 | | |
North Carolina Eastern Municipal Power Agency
Revenue Bonds
Series 1991A Escrowed to Maturity
01/01/18 | | | 6.500 | % | | | 3,320,000 | | | | 4,124,204 | | |
The accompanying Notes to Financial Statements are an integral part of this statement.
Annual Report 2013
17
Columbia High Yield Municipal Fund
Portfolio of Investments (continued)
May 31, 2013
Municipal Bonds (continued)
Issue
Description | | Coupon
Rate | | Principal
Amount ($) | | Value ($) | |
North Carolina Medical Care Commission
Revenue Bonds
Health Care Housing Arc Projects
Series 2004A
10/01/34 | | | 5.800 | % | | | 1,550,000 | | | | 1,622,385 | | |
Total | | | | | | | 14,546,195 | | |
North Dakota 0.3% | |
City of Fargo
Revenue Bonds
Sanford
Series 2011
11/01/31 | | | 6.250 | % | | | 2,500,000 | | | | 3,062,775 | | |
Ohio 1.6% | |
American Municipal Power, Inc.
Revenue Bonds
AMP Fremont Energy Center Project
Series 2012
02/15/21 | | | 5.000 | % | | | 1,300,000 | | | | 1,534,832 | | |
Buckeye Tobacco Settlement Financing Authority
Asset-Backed Revenue Bonds
Senior Turbo Series 2007A-2
06/01/24 | | | 5.125 | % | | | 7,000,000 | | | | 6,549,410 | | |
Cleveland-Cuyahoga County Port Authority
Revenue Bonds
Fairmount Montessori Association
Series 2005B (Fifth Third Bank)
05/15/25 | | | 5.125 | % | | | 600,000 | | | | 608,220 | | |
County of Lucas
Improvement Refunding Revenue Bonds
Lutheran Homes
Series 2010A
11/01/45 | | | 7.000 | % | | | 5,000,000 | | | | 5,606,500 | | |
Hickory Chase Community Authority
Revenue Bonds
Hickory Chase Project
Series 2008(c)(e)
12/01/38 | | | 7.000 | % | | | 2,300,000 | | | | 1,035,000 | | |
Summit County Port Authority
Revenue Bonds
Seville Projects
Series 2005A
05/15/25 | | | 5.100 | % | | | 375,000 | | | | 375,439 | | |
Total | | | | | | | 15,709,401 | | |
Oklahoma 1.0% | |
Oklahoma County Finance Authority
Revenue Bonds
Epworth Villa Project
Series 2012A
04/01/23 | | | 5.000 | % | | | 2,100,000 | | | | 2,228,856 | | |
04/01/29 | | | 5.000 | % | | | 1,440,000 | | | | 1,476,086 | | |
04/01/42 | | | 5.125 | % | | | 2,750,000 | | | | 2,761,935 | | |
Municipal Bonds (continued)
Issue
Description | | Coupon
Rate | | Principal
Amount ($) | | Value ($) | |
Oklahoma Development Finance Authority
Refunding Revenue Bonds
Inverness Village Community
Series 2012
01/01/32 | | | 6.000 | % | | | 3,000,000 | | | | 3,263,880 | | |
Total | | | | | | | 9,730,757 | | |
Oregon 1.2% | |
City of Forest Grove
Revenue Bonds
Campus Improvement-Pacific University Project
Series 2009
05/01/39 | | | 6.375 | % | | | 2,000,000 | | | | 2,047,520 | | |
Oak Tree Foundation Project
Series 2007
03/01/37 | | | 5.500 | % | | | 2,900,000 | | | | 2,957,710 | | |
Cow Creek Band of Umpqua Tribe of Indians
Revenue Bonds
Series 2006C(b)(d)
10/01/26 | | | 5.625 | % | | | 1,700,000 | | | | 1,639,633 | | |
Warm Springs Reservation Confederated Tribe
Revenue Bonds
Pelton Round Butte Tribal
Series 2009B(d)
11/01/33 | | | 6.375 | % | | | 2,410,000 | | | | 2,747,087 | | |
Western Generation Agency
Revenue Bonds
Wauna Cogeneration Project
Series 2006A
01/01/20 | | | 5.000 | % | | | 2,235,000 | | | | 2,242,420 | | |
Total | | | | | | | 11,634,370 | | |
Pennsylvania 3.7% | |
Bucks County Industrial Development Authority
Revenue Bonds
Ann's Choice, Inc. Facility
Series 2005A
01/01/35 | | | 6.250 | % | | | 1,750,000 | | | | 1,775,322 | | |
Chester County Industrial Development Authority
1st Mortgage
RHA/Pennsylvania Nursing Home
Series 2002(c)
05/01/32 | | | 8.500 | % | | | 345,000 | | | | 352,221 | | |
Dauphin County Industrial Development Authority
Revenue Bonds
Dauphin Consolidated Water Supply
Series 1992A AMT(a)
06/01/24 | | | 6.900 | % | | | 3,200,000 | | | | 4,070,016 | | |
Montgomery County Industrial Development Authority
Revenue Bonds
Whitemarsh Community Project
Series 2008
02/01/36 | | | 7.000 | % | | | 2,000,000 | | | | 2,120,120 | | |
The accompanying Notes to Financial Statements are an integral part of this statement.
Annual Report 2013
18
Columbia High Yield Municipal Fund
Portfolio of Investments (continued)
May 31, 2013
Municipal Bonds (continued)
Issue
Description | | Coupon
Rate | | Principal
Amount ($) | | Value ($) | |
Whitemarsh Continuing Care
Series 2005
02/01/28 | | | 6.125 | % | | | 1,400,000 | | | | 1,421,308 | | |
02/01/35 | | | 6.250 | % | | | 1,350,000 | | | | 1,367,820 | | |
Pennsylvania Economic Development Financing Authority
Revenue Bonds
Allegheny Energy Supply Co.
Series 2009
07/15/39 | | | 7.000 | % | | | 4,000,000 | | | | 4,737,440 | | |
Philadelphia Biosolids Facility
Series 2009
01/01/32 | | | 6.250 | % | | | 3,375,000 | | | | 3,808,485 | | |
Pennsylvania Higher Educational Facilities Authority
Revenue Bonds
Edinboro University Foundation
Series 2010
07/01/30 | | | 5.800 | % | | | 2,500,000 | | | | 2,783,250 | | |
Shippensburg University
Series 2011
10/01/43 | | | 6.250 | % | | | 2,000,000 | | | | 2,326,880 | | |
Pennsylvania Housing Finance Agency
Revenue Bonds
Subordinated Series 2013-115A AMT(a)
10/01/33 | | | 4.200 | % | | | 5,000,000 | | | | 5,049,800 | | |
Pennsylvania Industrial Development Authority
Prerefunded 07/01/18 Revenue Bonds
Economic Development
Series 2008
07/01/23 | | | 5.500 | % | | | 295,000 | | | | 359,083 | | |
Refunding Revenue Bonds
Economic Development
Series 2008
07/01/23 | | | 5.500 | % | | | 2,060,000 | | | | 2,429,688 | | |
Philadelphia Redevelopment Authority
Revenue Bonds
Transformation Initiative
Series 2012
04/15/21 | | | 5.000 | % | | | 2,000,000 | | | | 2,340,540 | | |
Total | | | | | | | 34,941,973 | | |
Puerto Rico 0.6% | |
Puerto Rico Electric Power Authority
Revenue Bonds
Series 2010XX(d)
07/01/40 | | | 5.250 | % | | | 2,000,000 | | | | 1,985,620 | | |
Puerto Rico Industrial Tourist Educational, Medical &
Environmental Control Facilities Financing Authority
Revenue Bonds
AES Puerto Rico Project
Series 2000 AMT(a)(d)
06/01/26 | | | 6.625 | % | | | 3,820,000 | | | | 3,817,020 | | |
Total | | | | | | | 5,802,640 | | |
Municipal Bonds (continued)
Issue
Description | | Coupon
Rate | | Principal
Amount ($) | | Value ($) | |
South Carolina 1.6% | |
Laurens County School District No. 055
Revenue Bonds
Series 2005
12/01/30 | | | 5.250 | % | | | 1,300,000 | | | | 1,341,730 | | |
South Carolina Jobs-Economic Development Authority
Refunding Revenue Bonds
1st Mortgage-Lutheran Homes
Series 2007
05/01/21 | | | 5.375 | % | | | 1,000,000 | | | | 1,058,280 | | |
05/01/28 | | | 5.500 | % | | | 2,300,000 | | | | 2,392,529 | | |
1st Mortgage-Wesley Commons
Series 2006
10/01/36 | | | 5.300 | % | | | 3,000,000 | | | | 3,008,670 | | |
Revenue Bonds
Kershaw County Medical Center Project
Series 2008
09/15/38 | | | 6.000 | % | | | 5,050,000 | | | | 5,504,197 | | |
South Carolina Jobs-Economic Development Authority(g)
Revenue Bonds
Series 2013
Lutheran Homes South Carolina Inc. Obligation Group
05/01/43 | | | 5.000 | % | | | 750,000 | | | | 735,135 | | |
05/01/48 | | | 5.125 | % | | | 1,500,000 | | | | 1,482,300 | | |
Total | | | | | | | 15,522,841 | | |
South Dakota 0.2% | |
South Dakota Economic Development Finance Authority
Revenue Bonds
Pooled Loan Program-Davis Family
Series 2004-4A AMT(a)
04/01/29 | | | 6.000 | % | | | 1,400,000 | | | | 1,450,554 | | |
South Dakota Health & Educational Facilities Authority
Revenue Bonds
Avera Health
Series 2012A
07/01/42 | | | 5.000 | % | | | 600,000 | | | | 638,940 | | |
Total | | | | | | | 2,089,494 | | |
Tennessee 0.1% | |
Shelby County Health Educational & Housing Facilities Board
Prerefunded 12/01/13 Revenue Bonds
Germantown Village
Series 2003A
12/01/34 | | | 7.250 | % | | | 675,000 | | | | 698,315 | | |
Prerefunded 12/01/16 Revenue Bonds
Germantown Village
Series 2006
12/01/34 | | | 6.250 | % | | | 475,000 | | | | 542,635 | | |
Total | | | | | | | 1,240,950 | | |
The accompanying Notes to Financial Statements are an integral part of this statement.
Annual Report 2013
19
Columbia High Yield Municipal Fund
Portfolio of Investments (continued)
May 31, 2013
Municipal Bonds (continued)
Issue
Description | | Coupon
Rate | | Principal
Amount ($) | | Value ($) | |
Texas 8.2% | |
Abilene Health Facilities Development Corp.
Prerefunded 11/15/13 Revenue Bonds
Series 2003
Sears Methodist Retirement System
11/15/33 | | | 7.000 | % | | | 100,000 | | | | 104,061 | | |
Capital Area Cultural Education Facilities Finance Corp.
Revenue Bonds
Roman Catholic Diocese
Series 2005B
04/01/45 | | | 6.125 | % | | | 5,000,000 | | | | 5,541,250 | | |
Central Texas Regional Mobility Authority
Revenue Bonds
Subordinated Lien
Series 2011
01/01/41 | | | 6.750 | % | | | 5,000,000 | | | | 5,809,900 | | |
City of Houston Airport System(a)
Refunding Revenue Bonds
Special Facilities Continental
Series 2011A AMT
07/15/38 | | | 6.625 | % | | | 4,000,000 | | | | 4,555,200 | | |
Subordinate Lien
Series 2012A AMT
07/01/25 | | | 5.000 | % | | | 5,000,000 | | | | 5,620,550 | | |
Dallas County Flood Control District No. 1
Unlimited General Obligation Refunding Bonds
Series 2002
04/01/32 | | | 7.250 | % | | | 1,000,000 | | | | 1,003,050 | | |
Dallas-Fort Worth International Airport
Refunding Revenue Bonds
Series 2012-F AMT(a)
11/01/21 | | | 5.000 | % | | | 2,000,000 | | | | 2,304,080 | | |
Deaf Smith County Hospital District
Limited General Obligation Bonds
Series 2010A
03/01/40 | | | 6.500 | % | | | 4,000,000 | | | | 4,565,840 | | |
Gulf Coast Industrial Development Authority
Revenue Bonds
Citgo Petroleum Project
Series 1998 AMT(a)
04/01/28 | | | 8.000 | % | | | 875,000 | | | | 876,435 | | |
HFDC of Central Texas, Inc.
Revenue Bonds
Sears Tyler Methodist
Series 2009A
11/15/44 | | | 7.750 | % | | | 4,000,000 | | | | 3,019,600 | | |
Series 2006A
11/01/36 | | | 5.750 | % | | | 5,000,000 | | | | 5,184,450 | | |
Houston Health Facilities Development Corp.
Revenue Bonds
Buckingham Senior Living Community
Series 2004A
02/15/34 | | | 7.125 | % | | | 1,000,000 | | | | 1,058,170 | | |
Municipal Bonds (continued)
Issue
Description | | Coupon
Rate | | Principal
Amount ($) | | Value ($) | |
La Vernia Higher Education Finance Corp.
Revenue Bonds
Kipp, Inc.
Series 2009A
08/15/29 | | | 6.000 | % | | | 1,000,000 | | | | 1,136,510 | | |
08/15/39 | | | 6.250 | % | | | 1,500,000 | | | | 1,730,925 | | |
Mission Economic Development Corp
Revenue Bonds
Dallas Clean Energy McCommas
Series 2011 AMT(a)
12/01/24 | | | 6.875 | % | | | 5,000,000 | | | | 5,336,350 | | |
North Texas Tollway Authority
Refunding Revenue Bonds
Toll 2nd Tier
Series 2008F
01/01/38 | | | 5.750 | % | | | 2,645,000 | | | | 2,903,919 | | |
Revenue Bonds
1st Tier
Series 2009A
01/01/39 | | | 6.250 | % | | | 1,500,000 | | | | 1,709,550 | | |
Pharr Higher Education Finance Authority
Revenue Bonds
Idea Public Schools
Series 2009A
08/15/39 | | | 6.500 | % | | | 3,000,000 | | | | 3,424,260 | | |
Red River Health Facilities Development Corp.
Revenue Bonds
Series 2013
Sears Methodist Retirement System
11/15/49 | | | 6.150 | % | | | 800,000 | | | | 779,568 | | |
05/09/53 | | | 6.250 | % | | | 52,000 | | | | 51,024 | | |
Sears Methodist Retirement System Obligation Group
11/15/38 | | | 5.450 | % | | | 1,300,000 | | | | 1,179,009 | | |
11/15/46 | | | 6.050 | % | | | 589,000 | | | | 570,134 | | |
11/15/46 | | | 6.050 | % | | | 101,000 | | | | 97,765 | | |
Sanger Industrial Development Corp.
Revenue Bonds
Texas Pellets Project
Series 2012B AMT(a)
07/01/38 | | | 8.000 | % | | | 5,000,000 | | | | 5,305,600 | | |
Tarrant County Cultural Education Facilities Finance Corp.
Revenue Bonds
Air Force Village
Series 2009
11/15/44 | | | 6.375 | % | | | 4,250,000 | | | | 4,649,755 | | |
CC Young Memorial Home
Series 2009A
02/15/38 | | | 8.000 | % | | | 4,000,000 | | | | 4,558,800 | | |
Texas Municipal Gas Acquisition & Supply Corp. III
Revenue Bonds
Series 2012
12/15/21 | | | 5.000 | % | | | 3,500,000 | | | | 3,971,030 | | |
12/15/32 | | | 5.000 | % | | | 1,250,000 | | | | 1,321,863 | | |
Total | | | | | | | 78,368,648 | | |
The accompanying Notes to Financial Statements are an integral part of this statement.
Annual Report 2013
20
Columbia High Yield Municipal Fund
Portfolio of Investments (continued)
May 31, 2013
Municipal Bonds (continued)
Issue
Description | | Coupon
Rate | | Principal
Amount ($) | | Value ($) | |
Vermont 0.1% | |
Vermont Educational & Health Buildings Financing Agency
Prerefunded 01/01/14 Revenue Bonds
Vermont Law School Project
Series 2003A
01/01/33 | | | 5.500 | % | | | 500,000 | | | | 515,170 | | |
Virgin Islands 1.0% | |
Virgin Islands Public Finance Authority
Revenue Bonds
Matching Fund Loan Notes
Series 2012-A(d)
10/01/32 | | | 5.000 | % | | | 3,785,000 | | | | 4,132,690 | | |
Virgin Islands Water & Power Authority
Refunding Revenue Bonds
Series 2012A(d)
07/01/21 | | | 4.000 | % | | | 5,000,000 | | | | 5,065,550 | | |
Total | | | | | | | 9,198,240 | | |
Virginia 2.7% | |
City of Chesapeake Expressway Toll Road
Refunding Revenue Bonds
Transportation System
Series 2012
07/15/40 | | | 0.000 | % | | | 7,530,000 | | | | 4,269,962 | | |
Mosaic District Community Development Authority
Special Assessment Bonds
Series 2011A
03/01/36 | | | 6.875 | % | | | 2,500,000 | | | | 2,870,550 | | |
Tobacco Settlement Financing Corp.
Revenue Bonds
Senior Series 2007-B1
06/01/47 | | | 5.000 | % | | | 19,000,000 | | | | 15,947,080 | | |
Virginia Small Business Financing Authority
Revenue Bonds
Hampton Roads Proton
Series 2009B
07/01/19 | | | 8.000 | % | | | 2,635,000 | | | | 2,822,533 | | |
Total | | | | | | | 25,910,125 | | |
Washington 1.6% | |
Greater Wenatchee Regional Events Center Public
Facilities District
Revenue Bonds
Series 2012-A
09/01/42 | | | 5.500 | % | | | 2,150,000 | | | | 2,273,517 | | |
Port of Seattle Industrial Development Corp.
Refunding Revenue Bonds
Special Facilities Delta Air Lines
Series 2012 A.M.T.(a)
04/01/30 | | | 5.000 | % | | | 2,500,000 | | | | 2,562,325 | | |
Municipal Bonds (continued)
Issue
Description | | Coupon
Rate | | Principal
Amount ($) | | Value ($) | |
Seattle Housing Authority
Revenue Bonds
Capital Fund Program-High Rise Rehab
Series 2005I (AGM) AMT(a)
11/01/25 | | | 5.000 | % | | | 1,000,000 | | | | 1,066,430 | | |
Tacoma Consolidated Local Improvement Districts
Special Assessment Bonds
Series 2013
No. 65
04/01/43 | | | 5.750 | % | | | 2,500,000 | | | | 2,461,100 | | |
Washington State Housing Finance Commission
Refunding Revenue Bonds
Nonprofit Housing Revenue-Mirabella
Series 2012
10/01/47 | | | 6.750 | % | | | 7,000,000 | | | | 7,049,980 | | |
Total | | | | | | | 15,413,352 | | |
West Virginia 0.1% | |
West Virginia Economic Development Authority
Revenue Bonds
Appalachian Power Co.-Amos Project
Series 2011A AMT(a)
01/01/41 | | | 2.250 | % | | | 1,250,000 | | | | 1,272,475 | | |
Wisconsin 0.8% | |
Wisconsin Health & Educational Facilities Authority
Revenue Bonds
Medical College of Wisconsin
Series 2008A
12/01/35 | | | 5.250 | % | | | 5,000,000 | | | | 5,349,100 | | |
St. John's Community, Inc.
Series 2009A
09/15/39 | | | 7.625 | % | | | 1,750,000 | | | | 2,009,823 | | |
Total | | | | | | | 7,358,923 | | |
Wyoming 0.4% | |
County of Campbell
Pollution Control Refunding Revenue Bonds
Black Hills Power, Inc. Project
Series 2004
10/01/24 | | | 5.350 | % | | | 3,250,000 | | | | 3,375,223 | | |
Total Municipal Bonds
(Cost: $864,706,952) | | | | | | | 920,996,322 | | |
Municipal Preferred Stocks 0.1%
Maryland 0.1% | |
Munimae TE Bond Subsidiary LLC(a)(b)(c)
06/30/49 | | | 5.800 | % | | | 1,000,000 | | | | 889,970 | | |
Total Municipal Preferred Stocks
(Cost: $1,000,000) | | | | | | | 889,970 | | |
The accompanying Notes to Financial Statements are an integral part of this statement.
Annual Report 2013
21
Columbia High Yield Municipal Fund
Portfolio of Investments (continued)
May 31, 2013
Floating Rate Notes 2.6%
Issue
Description | | Effective
Yield | | Amount
Payable at
Maturity ($) | | Value ($) | |
Nebraska 1.1% | |
Nebraska Educational Finance Authority
Refunding Revenue Bonds
Creighton University Projects
VRDN Series 2008 (JPMorgan Chase Bank)(i)(j)
07/01/35 | | | 0.030 | % | | | 10,000,000 | | | | 10,000,000 | | |
Nevada 0.5% | |
Las Vegas Valley Water District
Limited General Obligation Bonds
Water Improvement
VRDN Series 2006C (Dexia Credit Local)(i)(j)
06/01/36 | | | 0.250 | % | | | 4,900,000 | | | | 4,900,000 | | |
South Carolina 0.5% | |
City of Columbia Waterworks & Sewer System
Revenue Bonds
VRDN Series 2009 (US Bank)(i)(j)
02/01/38 | | | 0.050 | % | | | 5,000,000 | | | | 5,000,000 | | |
Virginia 0.5% | |
Albermarle County Economic Development Authority
Revenue Bonds
Martha Jefferson Hospital
VRDN Series 2008D(i)
10/01/48 | | | 0.030 | % | | | 5,000,000 | | | | 5,000,000 | | |
Total Floating Rate Notes
(Cost: $24,900,000) | | | | | | | 24,900,000 | | |
Municipal Short Term 1.3%
Issue
Description | | Coupon
Rate | | Principal
Amount ($) | | Value ($) | |
Kentucky 0.5% | |
Louisville & Jefferson County Metropolitan Sewer District
Revenue Notes
Subordinated Series 2012-A BAN
12/04/13 | | | 2.000 | % | | | 5,000,000 | | | | 5,040,300 | | |
Louisiana 0.4% | |
Louisiana Public Facilities Authority
Revenue Bonds
Louisiana Pellets, Inc. Project
Series 2013A AMT(a)
08/01/14 | | | 9.750 | % | | | 3,890,000 | | | | 3,889,533 | | |
Municipal Short Term (continued)
Issue
Description | | Coupon
Rate | | Principal
Amount ($) | | Value ($) | |
New Jersey 0.3% | |
City of Newark NJ
Unlimited General Obligation Notes
Series 2012-D BANS
12/11/13 | | | 2.000 | % | | | 3,000,000 | | | | 3,011,070 | | |
New York 0.1% | |
County of Rockland
General Obligation Limited Notes
Series 2012-C RAN
09/24/13 | | | 2.500 | % | | | 1,000,000 | | | | 1,002,350 | | |
Total Municipal Short Term
(Cost: $12,935,905) | | | | | | | 12,943,253 | | |
Money Market Funds 0.1%
| | | | | Shares | | Value ($) | |
Dreyfus Tax-Exempt Cash Management Fund,
0.000%(k) | | | | | 384,522 | | | | 384,522 | | |
JPMorgan Municipal Money Market Fund,
0.000%(k) | | | | | 389,899 | | | | 389,899 | | |
Total Money Market Funds
(Cost: $774,421) | | | | | | | | | | | 774,421 | | |
Total Investments
(Cost: $904,317,278) | | | | | | | | | | | 960,503,966 | | |
Other Assets & Liabilities, Net | | | | | | | | | | | (3,336,631 | ) | |
Net Assets | | | | | | | | | | | 957,167,335 | | |
Notes to Portfolio of Investments
(a) Income from this security may be subject to alternative minimum tax.
(b) Security exempt from registration pursuant to Rule 144A under the Securities Act of 1933. This security may be resold in transactions exempt from registration, normally to qualified institutional buyers. At May 31, 2013, the value of these securities amounted to $29,387,485 or 3.07% of net assets.
The accompanying Notes to Financial Statements are an integral part of this statement.
Annual Report 2013
22
Columbia High Yield Municipal Fund
Portfolio of Investments (continued)
May 31, 2013
Notes to Portfolio of Investments (continued)
(c) Identifies issues considered to be illiquid as to their marketability. The aggregate value of such securities at May 31, 2013 was $28,299,291, representing 2.96% of net assets. Information concerning such security holdings at May 31, 2013 is as follows:
Security Description | | Acquisition Dates | | Cost ($) | |
Village of Bolingbrook
Sales Tax Revenue Bonds
Series 2005
01/01/24 6.250% | | 12/14/05 | | | 1,370,393 | | |
Broward County Housing Finance Authority
Revenue Bonds
Chaves Lake Apartments Project
Series 2000A AMT
07/01/40 7.500% | | 03/07/00 - 05/21/07 | | | 1,496,928 | | |
Cabazon Band Mission Indians
Revenue Bonds
Series 2004
10/01/11 13.000% | | 05/14/10 | | | 370,523 | | |
Cabazon Band Mission Indians
Revenue Bonds
Series 2004
10/01/15 8.375% | | 10/04/04 - 05/14/10 | | | 510,005 | | |
Cabazon Band Mission Indians
Revenue Bonds
Series 2004
10/01/19 8.750% | | 10/04/04 - 05/14/10 | | | 2,498,267 | | |
Cabazon Band Mission Indians
Revenue Bonds
Series 2010
10/01/20 8.375% | | 05/14/10 | | | 1,420,000 | | |
California Municipal Finance Authority
Revenue Bonds
UTS Renewable Energy - Waste Water
Series 2011 AMT
12/01/32 7.500% | | 12/22/11 | | | 1,925,000 | | |
Capital Trust Agency, Inc.
Revenue Bonds
Atlantic Housing Foundation
Subordinated Series 2008B
07/15/32 7.000% | | 07/23/08 | | | 1,370,000 | | |
Chester County Industrial Development Authority
1st Mortgage RHA/Pennsylvania Nursing Home
Series 2002
05/01/32 8.500% | | 05/01/02 | | | 321,835 | | |
Durham Housing Authority
Revenue Bonds
Series 2005 AMT
02/01/38 5.650% | | 12/18/06 | | | 3,168,278 | | |
Hickory Chase Community Authority
Revenue Bonds
Hickory Chase Project
Series 2008
12/01/38 7.000% | | 04/23/08 | | | 2,300,000 | | |
The accompanying Notes to Financial Statements are an integral part of this statement.
Annual Report 2013
23
Columbia High Yield Municipal Fund
Portfolio of Investments (continued)
May 31, 2013
Notes to Portfolio of Investments (continued)
Security Description | | Acquisition Dates | | Cost ($) | |
Illinois Finance Authority
Revenue Bonds
Leafs Hockey Club Project
Series 2007A
03/01/37 6.000% | | 02/14/07 | | | 972,870 | | |
Iowa Finance Authority
Revenue Bonds
Deerfield Retirement Community, Inc.
Series 2007A
11/15/15 5.000% | | 11/06/09 | | | 2,032,538 | | |
Iowa Finance Authority
Revenue Bonds
Deerfield Retirement Community, Inc.
Series 2007A
11/15/27 5.500% | | 04/19/07 | | | 1,148,804 | | |
Iowa Finance Authority
Revenue Bonds
Deerfield Retirement Community, Inc.
Series 2007A
11/15/37 5.500% | | 05/20/09 | | | 433,307 | | |
Mashantucket Western Pequot Tribe
Revenue Bonds
Subordinated Series 1999B
09/01/15 0.000% | | 01/09/04 | | | 1,507,523 | | |
Massachusetts Development Finance Agency
Revenue Bonds
Groves-Lincoln
Series 2009A
06/01/44 7.875% | | 11/12/09 | | | 1,478,612 | | |
Massachusetts Development Finance Agency
Revenue Bonds
Groves-Lincoln
Series 2009B-1
06/01/16 7.250% | | 11/12/09 | | | 3,500,000 | | |
Massachusetts Development Finance Agency
Revenue Bonds
Health Care Facility-Alliance
Series 1999A
07/01/32 7.100% | | 09/02/99 | | | 2,024,197 | | |
Michigan Strategic Fund
Refunding Revenue Bonds
Michigan Sugar Co.- Carollton
Series 1998C AMT
11/01/25 6.550% | | 11/24/98 | | | 1,500,000 | | |
Middle Village Community Development District
Special Assessment Bonds
Series 2004A
05/01/35 6.000% | | 01/21/04 | | | 1,993,312 | | |
Middlesex County Improvement Authority
Subordinated Revenue Bonds
Heldrich Center Hotel
Series 2005B
01/01/25 6.125% | | 10/01/09 | | | 508,750 | | |
The accompanying Notes to Financial Statements are an integral part of this statement.
Annual Report 2013
24
Columbia High Yield Municipal Fund
Portfolio of Investments (continued)
May 31, 2013
Notes to Portfolio of Investments (continued)
Security Description | | Acquisition Dates | | Cost ($) | |
Middlesex County Improvement Authority
Subordinated Revenue Bonds
Heldrich Center Hotel
Series 2005B
01/01/37 6.250% | | 03/18/05 - 10/01/09 | | | 4,614,875 | | |
Middlesex County Improvement Authority
Revenue Bonds
Heldrich Center Hotel
Series 2005C
01/01/37 8.750% | | 06/28/06 | | | 1,228,125 | | |
Munimae TE Bond Subsidiary LLC
06/30/49 5.800% | | 10/14/04 | | | 1,000,000 | | |
Resolution Trust Corp.
Pass-Through Certificates
Series 1993A
12/01/16 8.500% | | 11/12/93 | | | 458,375 | | |
Rankin County Five Lakes Utility District
Series 1994
07/15/37 7.000% | | 10/02/07 | | | 250,000 | | |
West Villages Improvement District
Special Assessment Bonds
Unit of Development No. 3
Series 2006
05/01/37 5.500% | | 04/19/06 - 05/18/06 | | | 1,646,024 | | |
Westridge Community Development District
Special Assessment Bonds
Series 2005
05/01/37 5.800% | | 12/22/05 | | | 2,650,000 | | |
City of Wilmington
Revenue Bonds
Housing-Electra Arms Senior Associates Project
Series 1998 AMT
06/01/28 6.250% | | 10/08/98 | | | 719,497 | | |
(d) Municipal obligations include debt obligations issued by or on behalf of territories, possessions, or sovereign nations within the territorial boundaries of the United States. At May 31, 2013, the value of these securities amounted to $37,536,092 or 3.92% of net assets.
(e) Represents securities that have defaulted on payment of interest. The Fund has stopped accruing interest on these securities. At May 31, 2013, the value of these securities amounted to $6,747,427, which represents 0.70% of net assets.
(f) Zero coupon bond.
(g) Represents a security purchased on a when-issued or delayed delivery basis.
(h) Variable rate security.
(i) Interest rate varies to reflect current market conditions; rate shown is the effective rate on May 31, 2013.
(j) The Fund is entitled to receive principal and interest from the guarantor after a day or a week's notice or upon maturity. The maturity date disclosed represents the final maturity.
(k) The rate shown is the seven-day current annualized yield at May 31, 2013.
The accompanying Notes to Financial Statements are an integral part of this statement.
Annual Report 2013
25
Columbia High Yield Municipal Fund
Portfolio of Investments (continued)
May 31, 2013
Abbreviation Legend
AGM Assured Guaranty Municipal Corporation
AMBAC Ambac Assurance Corporation
AMT Alternative Minimum Tax
BAN Bond Anticipation Note
CHF Collegiate Housing Foundation
FNMA Federal National Mortgage Association
GNMA Government National Mortgage Association
NPFGC National Public Finance Guarantee Corporation
RAN Revenue Anticipation Note
VRDN Variable Rate Demand Note
Fair Value Measurements
Generally accepted accounting principles (GAAP) require disclosure regarding the inputs and valuation techniques used to measure fair value and any changes in valuation inputs or techniques. In addition, investments shall be disclosed by major category.
The Fund categorizes its fair value measurements according to a three-level hierarchy that maximizes the use of observable inputs and minimizes the use of unobservable inputs by prioritizing that the most observable input be used when available. Observable inputs are those that market participants would use in pricing an investment based on market data obtained from sources independent of the reporting entity. Unobservable inputs are those that reflect the Fund's assumptions about the information market participants would use in pricing an investment. An investment's level within the fair value hierarchy is based on the lowest level of any input that is deemed significant to the asset or liability's fair value measurement. The input levels are not necessarily an indication of the risk or liquidity associated with investments at that level. For example, certain U.S. government securities are generally high quality and liquid, however, they are reflected as Level 2 because the inputs used to determine fair value may not always be quoted prices in an active market.
Fair value inputs are summarized in the three broad levels listed below:
> Level 1 — Valuations based on quoted prices for investments in active markets that the Fund has the ability to access at the measurement date (including NAV for open-end mutual funds). Valuation adjustments are not applied to Level 1 investments.
> Level 2 — Valuations based on other significant observable inputs (including quoted prices for similar securities, interest rates, prepayment speeds, credit risks, etc.).
> Level 3 — Valuations based on significant unobservable inputs (including the Fund's own assumptions and judgment in determining the fair value of investments).
Inputs that are used in determining fair value of an investment may include price information, credit data, volatility statistics, and other factors. These inputs can be either observable or unobservable. The availability of observable inputs can vary between investments, and is affected by various factors such as the type of investment, and the volume and level of activity for that investment or similar investments in the marketplace. The inputs will be considered by the Investment Manager, along with any other relevant factors in the calculation of an investment's fair value. The Fund uses prices and inputs that are current as of the measurement date, which may include periods of market dislocations. During these periods, the availability of prices and inputs may be reduced for many investments. This condition could cause an investment to be reclassified between the various levels within the hierarchy.
Investments falling into the Level 3 category are primarily supported by quoted prices from brokers and dealers participating in the market for those investments. However, these may be classified as Level 3 investments due to lack of market transparency and corroboration to support these quoted prices. Additionally, valuation models may be used as the pricing source for any remaining investments classified as Level 3. These models may rely on one or more significant unobservable inputs and/or significant assumptions by the Investment Manager. Inputs used in valuations may include, but are not limited to, financial statement analysis, capital account balances, discount rates and estimated cash flows, and comparable company data.
Under the direction of the Fund's Board of Trustees (the Board), the Investment Manager's Valuation Committee (the Committee) is responsible for carrying out the valuation procedures approved by the Board. The Committee consists of voting and non-voting members from various groups within the Investment Manager's organization, including operations and accounting, trading and investments, compliance, risk management and legal.
The accompanying Notes to Financial Statements are an integral part of this statement.
Annual Report 2013
26
Columbia High Yield Municipal Fund
Portfolio of Investments (continued)
May 31, 2013
Fair Value Measurements (continued)
The Committee meets at least monthly to review and approve valuation matters, which may include a description of specific valuation determinations, data regarding pricing information received from approved pricing vendors and brokers and the results of Board-approved valuation control policies and procedures (the Policies). The Policies address, among other things, instances when market quotations are readily available, including recommendations of third party pricing vendors and a determination of appropriate pricing methodologies; events that require specific valuation determinations and assessment of fair value techniques; securities with a potential for stale pricing, including those that are illiquid, restricted, or in default; and the effectiveness of third-party pricing vendors, including periodic reviews of vendors. The Committee meets more frequently, as needed, to discuss additional valuation matters, which may include the need to review back-testing results, review time-sensitive information or approve related valuation actions. The Committee reports to the Board, with members of the Committee meeting with the Board at each of its regularly scheduled meetings to discuss valuation matters and actions during the period, similar to those described earlier.
For investments categorized as Level 3, the Committee monitors information similar to that described above, which may include: (i) data specific to the issuer or comparable issuers, (ii) general market or specific sector news and (iii) quoted prices and specific or similar security transactions. The Committee considers this data and any changes from prior periods in order to assess the reasonableness of observable and unobservable inputs, any assumptions or internal models used to value those securities and changes in fair value. This data is also used to corroborate, when available, information received from approved pricing vendors and brokers. Various factors impact the frequency of monitoring this information (which may occur as often as daily). However, the Committee may determine that changes to inputs, assumptions and models are not required as a result of the monitoring procedures performed.
The following table is a summary of the inputs used to value the Fund's investments at May 31, 2013:
Description | | Level 1
Quoted Prices in Active
Markets for Identical
Assets ($) | |
Level 2
Other Significant
Observable Inputs ($) | |
Level 3
Significant
Unobservable Inputs ($) | |
Total ($) | |
Bonds | |
Municipal Bonds | | | — | | | | 920,996,322 | | | | — | | | | 920,996,322 | | |
Total Bonds | | | — | | | | 920,996,322 | | | | — | | | | 920,996,322 | | |
Equity Securities | |
Municipal Preferred Stocks | | | — | | | | 889,970 | | | | — | | | | 889,970 | | |
Total Equity Securities | | | — | | | | 889,970 | | | | — | | | | 889,970 | | |
Short-Term Securities | |
Floating Rate Notes | | | — | | | | 24,900,000 | | | | — | | | | 24,900,000 | | |
Municipal Short Term | | | — | | | | 12,943,253 | | | | — | | | | 12,943,253 | | |
Total Short-Term Securities | | | — | | | | 37,843,253 | | | | — | | | | 37,843,253 | | |
Other | |
Money Market Funds | | | 774,421 | | | | — | | | | — | | | | 774,421 | | |
Total Other | | | 774,421 | | | | — | | | | — | | | | 774,421 | | |
Total | | | 774,421 | | | | 959,729,545 | | | | — | | | | 960,503,966 | | |
See the Portfolio of Investments for all investment classifications not indicated in the table.
The Fund's assets assigned to the Level 2 input category are generally valued using the market approach, in which a security's value is determined through reference to prices and information from market transactions for similar or identical assets.
There were no transfers of financial assets between Levels 1 and 2 during the period.
The accompanying Notes to Financial Statements are an integral part of this statement.
Annual Report 2013
27
Columbia High Yield Municipal Fund
Statement of Assets and Liabilities
May 31, 2013
Assets | |
Investments, at value | |
(identified cost $904,317,278) | | $ | 960,503,966 | | |
Receivable for: | |
Investments sold | | | 634,315 | | |
Capital shares sold | | | 1,452,575 | | |
Dividends | | | 2 | | |
Interest | | | 14,699,691 | | |
Expense reimbursement due from Investment Manager | | | 692 | | |
Prepaid expenses | | | 3,219 | | |
Trustees' deferred compensation plan | | | 63,872 | | |
Total assets | | | 977,358,332 | | |
Liabilities | |
Payable for: | |
Investments purchased on a delayed delivery basis | | | 10,845,158 | | |
Capital shares purchased | | | 5,461,281 | | |
Dividend distributions to shareholders | | | 3,616,650 | | |
Investment management fees | | | 12,396 | | |
Distribution and/or service fees | | | 857 | | |
Transfer agent fees | | | 151,738 | | |
Administration fees | | | 1,783 | | |
Chief compliance officer expenses | | | 145 | | |
Other expenses | | | 37,117 | | |
Trustees' deferred compensation plan | | | 63,872 | | |
Total liabilities | | | 20,190,997 | | |
Net assets applicable to outstanding capital stock | | $ | 957,167,335 | | |
Represented by | |
Paid-in capital | | $ | 980,369,932 | | |
Undistributed net investment income | | | 5,111,117 | | |
Accumulated net realized loss | | | (84,500,402 | ) | |
Unrealized appreciation (depreciation) on: | |
Investments | | | 56,186,688 | | |
Total — representing net assets applicable to outstanding capital stock | | $ | 957,167,335 | | |
The accompanying Notes to Financial Statements are an integral part of this statement.
Annual Report 2013
28
Columbia High Yield Municipal Fund
Statement of Assets and Liabilities (continued)
May 31, 2013
Class A | |
Net assets | | $ | 91,422,436 | | |
Shares outstanding | | | 8,526,506 | | |
Net asset value per share | | $ | 10.72 | | |
Maximum offering price per share(a) | | $ | 11.25 | | |
Class B | |
Net assets | | $ | 1,217,269 | | |
Shares outstanding | | | 113,534 | | |
Net asset value per share | | $ | 10.72 | | |
Class C | |
Net assets | | $ | 14,683,918 | | |
Shares outstanding | | | 1,369,610 | | |
Net asset value per share | | $ | 10.72 | | |
Class R4 | |
Net assets | | $ | 2,500 | | |
Shares outstanding | | | 233 | | |
Net asset value per share | | $ | 10.73 | | |
Class R5 | |
Net assets | | $ | 509,104 | | |
Shares outstanding | | | 47,540 | | |
Net asset value per share | | $ | 10.71 | | |
Class Z | |
Net assets | | $ | 849,332,108 | | |
Shares outstanding | | | 79,203,831 | | |
Net asset value per share | | $ | 10.72 | | |
(a) The maximum offering price per share is calculated by dividing the net asset value by 1.0 minus the maximum sales charge of 4.75%.
The accompanying Notes to Financial Statements are an integral part of this statement.
Annual Report 2013
29
Columbia High Yield Municipal Fund
Statement of Operations
Year Ended May 31, 2013
Net investment income | |
Income: | |
Dividends | | $ | 12,913 | | |
Interest | | | 49,498,239 | | |
Total income | | | 49,511,152 | | |
Expenses: | |
Investment management fees | | | 4,621,066 | | |
Distribution and/or service fees | |
Class A | | | 189,090 | | |
Class B | | | 16,524 | | |
Class C | | | 131,424 | | |
Transfer agent fees | |
Class A | | | 174,311 | | |
Class B | | | 3,202 | | |
Class C | | | 25,497 | | |
Class R4(a) | | | 1 | | |
Class R5(b) | | | 21 | | |
Class Z | | | 1,610,973 | | |
Administration fees | | | 663,990 | | |
Compensation of board members | | | 38,941 | | |
Custodian fees | | | 11,044 | | |
Printing and postage fees | | | 100,494 | | |
Registration fees | | | 120,312 | | |
Professional fees | | | 61,325 | | |
Chief compliance officer expenses | | | 826 | | |
Other | | | 29,675 | | |
Total expenses | | | 7,798,716 | | |
Fees waived or expenses reimbursed by Investment Manager and its affiliates | | | (1,028,930 | ) | |
Fees waived by Distributor — Class C | | | (20,886 | ) | |
Expense reductions | | | (860 | ) | |
Total net expenses | | | 6,748,040 | | |
Net investment income | | | 42,763,112 | | |
Realized and unrealized gain (loss) — net | |
Net realized gain (loss) on: | |
Investments | | | (8,077,988 | ) | |
Net realized loss | | | (8,077,988 | ) | |
Net change in unrealized appreciation (depreciation) on: | |
Investments | | | 28,156,737 | | |
Net change in unrealized appreciation (depreciation) | | | 28,156,737 | | |
Net realized and unrealized gain | | | 20,078,749 | | |
Net increase in net assets resulting from operations | | $ | 62,841,861 | | |
(a) For the period from March 19, 2013 (commencement of operations) to May 31, 2013.
(b) For the period from November 8, 2012 (commencement of operations) to May 31, 2013.
The accompanying Notes to Financial Statements are an integral part of this statement.
Annual Report 2013
30
Columbia High Yield Municipal Fund
Statement of Changes in Net Assets
| | | Year Ended
May 31,
2013(a)(b) | | Year Ended
May 31,
2012(c) | | Year Ended
June 30,
2011 | |
Operations | |
Net investment income | | $ | 42,763,112 | | | $ | 37,166,346 | | | $ | 42,331,100 | | |
Net realized loss | | | (8,077,988 | ) | | | (4,840,201 | ) | | | (7,614,866 | ) | |
Net change in unrealized appreciation (depreciation) | | | 28,156,737 | | | | 74,277,418 | | | | (9,701,549 | ) | |
Net increase in net assets resulting from operations | | | 62,841,861 | | | | 106,603,563 | | | | 25,014,685 | | |
Distributions to shareholders | |
Net investment income | |
Class A | | | (3,866,763 | ) | | | (3,362,006 | ) | | | (3,762,746 | ) | |
Class B | | | (57,965 | ) | | | (93,334 | ) | | | (213,473 | ) | |
Class C | | | (482,603 | ) | | | (380,756 | ) | | | (440,310 | ) | |
Class R4 | | | (22 | ) | | | — | | | | — | | |
Class R5 | | | (2,139 | ) | | | — | | | | — | | |
Class Z | | | (37,468,261 | ) | | | (32,363,711 | ) | | | (36,635,531 | ) | |
Total distributions to shareholders | | | (41,877,753 | ) | | | (36,199,807 | ) | | | (41,052,060 | ) | |
Increase (decrease) in net assets from capital stock activity | | | (2,043,493 | ) | | | 151,225,492 | | | | (32,194,792 | ) | |
Total increase (decrease) in net assets | | | 18,920,615 | | | | 221,629,248 | | | | (48,232,167 | ) | |
Net assets at beginning of year | | | 938,246,720 | | | | 716,617,472 | | | | 764,849,639 | | |
Net assets at end of year | | $ | 957,167,335 | | | $ | 938,246,720 | | | $ | 716,617,472 | | |
Undistributed net investment income | | $ | 5,111,117 | | | $ | 4,144,228 | | | $ | 3,211,890 | | |
(a) Class R4 shares are for the period from March 19, 2013 (commencement of operations) to May 31, 2013.
(b) Class R5 shares are for the period from November 8, 2012 (commencement of operations) to May 31, 2013.
(c) For the period from July 1, 2011 to May 31, 2012. During the period, the Fund's fiscal year end was changed from June 30 to May 31.
The accompanying Notes to Financial Statements are an integral part of this statement.
Annual Report 2013
31
Columbia High Yield Municipal Fund
Statement of Changes in Net Assets (continued)
| | | Year Ended May 31, 2013(a)(b) | | Year Ended May 31, 2012(c) | | Year Ended June 30, 2011 | |
| | | Shares | | Dollars ($) | | Shares | | Dollars ($) | | Shares | | Dollars ($) | |
Capital stock activity | |
Class A shares | |
Subscriptions(d) | | | 4,409,463 | | | | 47,154,347 | | | | 3,421,975 | | | | 34,610,259 | | | | 1,137,035 | | | | 11,028,366 | | |
Distributions reinvested | | | 293,226 | | | | 3,145,455 | | | | 206,541 | | | | 2,083,885 | | | | 187,768 | | | | 1,805,692 | | |
Redemptions | | | (5,083,754 | ) | | | (54,363,465 | ) | | | (1,351,141 | ) | | | (13,709,963 | ) | | | (2,956,583 | ) | | | (28,527,441 | ) | |
Net increase (decrease) | | | (381,065 | ) | | | (4,063,663 | ) | | | 2,277,375 | | | | 22,984,181 | | | | (1,631,780 | ) | | | (15,693,383 | ) | |
Class B shares | |
Subscriptions | | | 49,824 | | | | 534,204 | | | | 11,671 | | | | 116,434 | | | | 16,363 | | | | 164,369 | | |
Distributions reinvested | | | 2,702 | | | | 28,972 | | | | 4,199 | | | | 42,087 | | | | 8,469 | | | | 81,838 | | |
Redemptions(d) | | | (143,124 | ) | | | (1,535,572 | ) | | | (129,615 | ) | | | (1,285,280 | ) | | | (320,806 | ) | | | (3,058,590 | ) | |
Net decrease | | | (90,598 | ) | | | (972,396 | ) | | | (113,745 | ) | | | (1,126,759 | ) | | | (295,974 | ) | | | (2,812,383 | ) | |
Class C shares | |
Subscriptions | | | 417,007 | | | | 4,468,619 | | | | 422,422 | | | | 4,279,116 | | | | 252,510 | | | | 2,460,215 | | |
Distributions reinvested | | | 30,724 | | | | 329,681 | | | | 19,728 | | | | 199,180 | | | | 20,046 | | | | 193,009 | | |
Redemptions | | | (272,023 | ) | | | (2,913,697 | ) | | | (134,415 | ) | | | (1,351,969 | ) | | | (337,433 | ) | | | (3,210,904 | ) | |
Net increase (decrease) | | | 175,708 | | | | 1,884,603 | | | | 307,735 | | | | 3,126,327 | | | | (64,877 | ) | | | (557,680 | ) | |
Class R4 shares | |
Subscriptions | | | 232 | | | | 2,500 | | | | — | | | | — | | | | — | | | | — | | |
Distributions reinvested | | | 1 | | | | 9 | | | | — | | | | — | | | | — | | | | — | | |
Net increase | | | 233 | | | | 2,509 | | | | — | | | | — | | | | — | | | | — | | |
Class R5 shares | |
Subscriptions | | | 47,345 | | | | 512,734 | | | | — | | | | — | | | | — | | | | — | | |
Distributions reinvested | | | 195 | | | | 2,088 | | | | — | | | | — | | | | — | | | | — | | |
Net increase | | | 47,540 | | | | 514,822 | | | | — | | | | — | | | | — | | | | — | | |
Class Z shares | |
Subscriptions | | | 21,122,398 | | | | 226,557,842 | | | | 25,571,720 | | | | 259,607,470 | | | | 17,348,274 | | | | 168,309,034 | | |
Distributions reinvested | | | 531,718 | | | | 5,704,086 | | | | 439,402 | | | | 4,424,413 | | | | 492,648 | | | | 4,744,603 | | |
Redemptions | | | (21,564,469 | ) | | | (231,671,296 | ) | | | (13,684,041 | ) | | | (137,790,140 | ) | | | (19,542,118 | ) | | | (186,184,983 | ) | |
Net increase (decrease) | | | 89,647 | | | | 590,632 | | | | 12,327,081 | | | | 126,241,743 | | | | (1,701,196 | ) | | | (13,131,346 | ) | |
Total net increase (decrease) | | | (158,535 | ) | | | (2,043,493 | ) | | | 14,798,446 | | | | 151,225,492 | | | | (3,693,827 | ) | | | (32,194,792 | ) | |
(a) Class R4 shares are for the period from March 19, 2013 (commencement of operations) to May 31, 2013.
(b) Class R5 shares are for the period from November 8, 2012 (commencement of operations) to May 31, 2013.
(c) For the period from July 1, 2011 to May 31, 2012. During the period, the Fund's fiscal year end was changed from June 30 to May 31.
(d) Includes conversions of Class B shares to Class A shares, if any.
The accompanying Notes to Financial Statements are an integral part of this statement.
Annual Report 2013
32
Columbia High Yield Municipal Fund
The following tables are intended to help you understand the Fund's financial performance. Certain information reflects financial results for a single share of a class held for the periods shown. Per share net investment income (loss) amounts are calculated based on average shares outstanding during the period. Total return assumes reinvestment of all dividends and distributions, if any. Total return does not reflect payment of sales charges, if any, and is not annualized for periods of less than one year.
| | | Year Ended May 31, | | Year Ended June 30, | |
Class A | | 2013 | | 2012(a) | | 2011 | | 2010 | | 2009 | | 2008 | |
Per share data | |
Net asset value, beginning of period | | $ | 10.49 | | | $ | 9.60 | | | $ | 9.77 | | | $ | 8.79 | | | $ | 10.32 | | | $ | 11.33 | | |
Income from investment operations: | |
Net investment income | | | 0.45 | | | | 0.45 | | | | 0.53 | | | | 0.52 | | | | 0.53 | | | | 0.52 | | |
Net realized and unrealized gain (loss) | | | 0.22 | | | | 0.88 | | | | (0.19 | ) | | | 0.97 | | | | (1.53 | ) | | | (1.01 | ) | |
Total from investment operations | | | 0.67 | | | | 1.33 | | | | 0.34 | | | | 1.49 | | | | (1.00 | ) | | | (0.49 | ) | |
Less distributions to shareholders: | |
Net investment income | | | (0.44 | ) | | | (0.44 | ) | | | (0.51 | ) | | | (0.51 | ) | | | (0.53 | ) | | | (0.52 | ) | |
Total distributions to shareholders | | | (0.44 | ) | | | (0.44 | ) | | | (0.51 | ) | | | (0.51 | ) | | | (0.53 | ) | | | (0.52 | ) | |
Net asset value, end of period | | $ | 10.72 | | | $ | 10.49 | | | $ | 9.60 | | | $ | 9.77 | | | $ | 8.79 | | | $ | 10.32 | | |
Total return | | | 6.44 | % | | | 14.19 | % | | | 3.63 | % | | | 17.25 | % | | | (9.60 | %) | | | (4.39 | %) | |
Ratios to average net assets(b)(c) | |
Total gross expenses | | | 0.96 | % | | | 0.96 | %(d) | | | 0.91 | % | | | 0.85 | % | | | 0.90 | % | | | 0.95 | %(e) | |
Total net expenses(f) | | | 0.85 | %(g) | | | 0.80 | %(d)(g) | | | 0.85 | %(g) | | | 0.85 | %(g) | | | 0.90 | %(g) | | | 0.95 | %(e)(g) | |
Net investment income | | | 4.17 | % | | | 4.92 | %(d) | | | 5.46 | % | | | 5.44 | % | | | 5.90 | % | | | 4.84 | % | |
Supplemental data | |
Net assets, end of period (in thousands) | | $ | 91,422 | | | $ | 93,456 | | | $ | 63,669 | | | $ | 80,691 | | | $ | 59,189 | | | $ | 74,593 | | |
Portfolio turnover | | | 9 | % | | | 9 | % | | | 23 | % | | | 18 | % | | | 26 | % | | | 32 | % | |
Notes to Financial Highlights
(a) For the period from July 1, 2011 to May 31, 2012. During the period, the Fund's fiscal year end was changed from June 30 to May 31.
(b) Certain line items from prior years have been reclassified to conform to the current presentation.
(c) In addition to the fees and expenses which the Fund bears directly, the Fund indirectly bears a pro rata share of the fees and expenses of the acquired funds in which it invests. Such indirect expenses are not included in the reported expense ratios.
(d) Annualized.
(e) Ratios include interest and fee expense related to the participation in certain inverse floater programs. If interest and fee expense related to the participation in certain inverse floater programs had been excluded, expenses would have been lower by 0.05% for the year ended June 30, 2008. Due to an equal increase in interest income from fixed rate municipal bonds held in trust, there is no impact on the Fund's net assets, net asset value per share, total return or net investment income.
(f) Total net expenses include the impact of certain waivers/reimbursements made by the Investment Manager and certain of its affiliates, if applicable.
(g) The benefits derived from expense reductions had an impact of less than 0.01%.
The accompanying Notes to Financial Statements are an integral part of this statement.
Annual Report 2013
33
Columbia High Yield Municipal Fund
Financial Highlights (continued)
| | | Year Ended May 31, | | Year Ended June 30, | |
Class B | | 2013 | | 2012(a) | | 2011 | | 2010 | | 2009 | | 2008 | |
Per share data | |
Net asset value, beginning of period | | $ | 10.49 | | | $ | 9.60 | | | $ | 9.77 | | | $ | 8.79 | | | $ | 10.32 | | | $ | 11.33 | | |
Income from investment operations: | |
Net investment income | | | 0.37 | | | | 0.39 | | | | 0.46 | | | | 0.45 | | | | 0.46 | | | | 0.44 | | |
Net realized and unrealized gain (loss) | | | 0.22 | | | | 0.87 | | | | (0.19 | ) | | | 0.97 | | | | (1.53 | ) | | | (1.01 | ) | |
Total from investment operations | | | 0.59 | | | | 1.26 | | | | 0.27 | | | | 1.42 | | | | (1.07 | ) | | | (0.57 | ) | |
Less distributions to shareholders: | |
Net investment income | | | (0.36 | ) | | | (0.37 | ) | | | (0.44 | ) | | | (0.44 | ) | | | (0.46 | ) | | | (0.44 | ) | |
Total distributions to shareholders | | | (0.36 | ) | | | (0.37 | ) | | | (0.44 | ) | | | (0.44 | ) | | | (0.46 | ) | | | (0.44 | ) | |
Net asset value, end of period | | $ | 10.72 | | | $ | 10.49 | | | $ | 9.60 | | | $ | 9.77 | | | $ | 8.79 | | | $ | 10.32 | | |
Total return | | | 5.65 | % | | | 13.41 | % | | | 2.85 | % | | | 16.39 | % | | | (10.27 | %) | | | (5.10 | %) | |
Ratios to average net assets(b)(c) | |
Total gross expenses | | | 1.70 | % | | | 1.72 | %(d) | | | 1.65 | % | | | 1.60 | % | | | 1.65 | % | | | 1.70 | %(e) | |
Total net expenses(f) | | | 1.60 | %(g) | | | 1.55 | %(d)(g) | | | 1.60 | %(g) | | | 1.60 | %(g) | | | 1.65 | %(g) | | | 1.70 | %(e)(g) | |
Net investment income | | | 3.41 | % | | | 4.24 | %(d) | | | 4.69 | % | | | 4.72 | % | | | 5.13 | % | | | 4.09 | % | |
Supplemental data | |
Net assets, end of period (in thousands) | | $ | 1,217 | | | $ | 2,142 | | | $ | 3,052 | | | $ | 5,995 | | | $ | 8,392 | | | $ | 11,945 | | |
Portfolio turnover | | | 9 | % | | | 9 | % | | | 23 | % | | | 18 | % | | | 26 | % | | | 32 | % | |
Notes to Financial Highlights
(a) For the period from July 1, 2011 to May 31, 2012. During the period, the Fund's fiscal year end was changed from June 30 to May 31.
(b) Certain line items from prior years have been reclassified to conform to the current presentation.
(c) In addition to the fees and expenses which the Fund bears directly, the Fund indirectly bears a pro rata share of the fees and expenses of the acquired funds in which it invests. Such indirect expenses are not included in the reported expense ratios.
(d) Annualized.
(e) Ratios include interest and fee expense related to the participation in certain inverse floater programs. If interest and fee expense related to the participation in certain inverse floater programs had been excluded, expenses would have been lower by 0.05% for the year ended June 30, 2008. Due to an equal increase in interest income from fixed rate municipal bonds held in trust, there is no impact on the Fund's net assets, net asset value per share, total return or net investment income.
(f) Total net expenses include the impact of certain waivers/reimbursements made by the Investment Manager and certain of its affiliates, if applicable.
(g) The benefits derived from expense reductions had an impact of less than 0.01%.
The accompanying Notes to Financial Statements are an integral part of this statement.
Annual Report 2013
34
Columbia High Yield Municipal Fund
Financial Highlights (continued)
| | | Year Ended May 31, | | Year Ended June 30, | |
Class C | | 2013 | | 2012(a) | | 2011 | | 2010 | | 2009 | | 2008 | |
Per share data | |
Net asset value, beginning of period | | $ | 10.49 | | | $ | 9.60 | | | $ | 9.77 | | | $ | 8.79 | | | $ | 10.32 | | | $ | 11.33 | | |
Income from investment operations: | |
Net investment income | | | 0.38 | | | | 0.40 | | | | 0.48 | | | | 0.46 | | | | 0.48 | | | | 0.46 | | |
Net realized and unrealized gain (loss) | | | 0.22 | | | | 0.88 | | | | (0.20 | ) | | | 0.97 | | | | (1.54 | ) | | | (1.01 | ) | |
Total from investment operations | | | 0.60 | | | | 1.28 | | | | 0.28 | | | | 1.43 | | | | (1.06 | ) | | | (0.55 | ) | |
Less distributions to shareholders: | |
Net investment income | | | (0.37 | ) | | | (0.39 | ) | | | (0.45 | ) | | | (0.45 | ) | | | (0.47 | ) | | | (0.46 | ) | |
Total distributions to shareholders | | | (0.37 | ) | | | (0.39 | ) | | | (0.45 | ) | | | (0.45 | ) | | | (0.47 | ) | | | (0.46 | ) | |
Net asset value, end of period | | $ | 10.72 | | | $ | 10.49 | | | $ | 9.60 | | | $ | 9.77 | | | $ | 8.79 | | | $ | 10.32 | | |
Total return | | | 5.81 | % | | | 13.56 | % | | | 3.01 | % | | | 16.55 | % | | | (10.14 | %) | | | (4.96 | %) | |
Ratios to average net assets(b)(c) | |
Total gross expenses | | | 1.71 | % | | | 1.71 | %(d) | | | 1.66 | % | | | 1.60 | % | | | 1.65 | % | | | 1.70 | %(e) | |
Total net expenses(f) | | | 1.45 | %(g) | | | 1.40 | %(d)(g) | | | 1.45 | %(g) | | | 1.45 | %(g) | | | 1.50 | %(g) | | | 1.55 | %(e)(g) | |
Net investment income | | | 3.57 | % | | | 4.30 | %(d) | | | 4.88 | % | | | 4.85 | % | | | 5.29 | % | | | 4.24 | % | |
Supplemental data | |
Net assets, end of period (in thousands) | | $ | 14,684 | | | $ | 12,525 | | | $ | 8,509 | | | $ | 9,288 | | | $ | 8,341 | | | $ | 11,090 | | |
Portfolio turnover | | | 9 | % | | | 9 | % | | | 23 | % | | | 18 | % | | | 26 | % | | | 32 | % | |
Notes to Financial Highlights
(a) For the period from July 1, 2011 to May 31, 2012. During the period, the Fund's fiscal year end was changed from June 30 to May 31.
(b) Certain line items from prior years have been reclassified to conform to the current presentation.
(c) In addition to the fees and expenses which the Fund bears directly, the Fund indirectly bears a pro rata share of the fees and expenses of the acquired funds in which it invests. Such indirect expenses are not included in the reported expense ratios.
(d) Annualized.
(e) Ratios include interest and fee expense related to the participation in certain inverse floater programs. If interest and fee expense related to the participation in certain inverse floater programs had been excluded, expenses would have been lower by 0.05% for the year ended June 30, 2008. Due to an equal increase in interest income from fixed rate municipal bonds held in trust, there is no impact on the Fund's net assets, net asset value per share, total return or net investment income.
(f) Total net expenses include the impact of certain waivers/reimbursements made by the Investment Manager and certain of its affiliates, if applicable.
(g) The benefits derived from expense reductions had an impact of less than 0.01%.
The accompanying Notes to Financial Statements are an integral part of this statement.
Annual Report 2013
35
Columbia High Yield Municipal Fund
Financial Highlights (continued)
Class R4 | | Year Ended
May 31,
2013(a) | |
Per share data | |
Net asset value, beginning of period | | $ | 10.77 | | |
Income from investment operations: | |
Net investment income | | | 0.10 | | |
Net realized and unrealized loss | | | (0.05 | )(b) | |
Total from investment operations | | | 0.05 | | |
Less distributions to shareholders: | |
Net investment income | | | (0.09 | ) | |
Total distributions to shareholders | | | (0.09 | ) | |
Net asset value, end of period | | $ | 10.73 | | |
Total return | | | 0.50 | % | |
Ratios to average net assets(c) | |
Total gross expenses | | | 0.71 | %(d) | |
Total net expenses(e) | | | 0.68 | %(d) | |
Net investment income | | | 4.54 | %(d) | |
Supplemental data | |
Net assets, end of period (in thousands) | | $ | 3 | | |
Portfolio turnover | | | 9 | % | |
Notes to Financial Highlights
(a) For the period from March 19, 2013 (commencement of operations) to May 31, 2013.
(b) Calculation of the net gain (loss) per share (both realized and unrealized) does not correlate to the aggregate realized and unrealized gain (loss) presented in the Statement of Operations due to the timing of sales and repurchases of Fund shares in relation to fluctuations in the market value of the portfolio.
(c) In addition to the fees and expenses which the Fund bears directly, the Fund indirectly bears a pro rata share of the fees and expenses of the acquired funds in which it invests. Such indirect expenses are not included in the reported expense ratios.
(d) Annualized.
(e) Total net expenses include the impact of certain waivers/reimbursements made by the Investment Manager and certain of its affiliates, if applicable.
The accompanying Notes to Financial Statements are an integral part of this statement.
Annual Report 2013
36
Columbia High Yield Municipal Fund
Financial Highlights (continued)
Class R5 | | Year Ended
May 31,
2013(a) | |
Per share data | |
Net asset value, beginning of period | | $ | 10.75 | | |
Income from investment operations: | |
Net investment income | | | 0.28 | | |
Net realized and unrealized loss | | | (0.06 | )(b) | |
Total from investment operations | | | 0.22 | | |
Less distributions to shareholders: | |
Net investment income | | | (0.26 | ) | |
Total distributions to shareholders | | | (0.26 | ) | |
Net asset value, end of period | | $ | 10.71 | | |
Total return | | | 2.05 | % | |
Ratios to average net assets(c) | |
Total gross expenses | | | 0.61 | %(d) | |
Total net expenses(e) | | | 0.61 | %(d) | |
Net investment income | | | 4.76 | %(d) | |
Supplemental data | |
Net assets, end of period (in thousands) | | $ | 509 | | |
Portfolio turnover | | | 9 | % | |
Notes to Financial Highlights
(a) For the period from November 8, 2012 (commencement of operations) to May 31, 2013.
(b) Calculation of the net gain (loss) per share (both realized and unrealized) does not correlate to the aggregate realized and unrealized gain (loss) presented in the Statement of Operations due to the timing of sales and repurchases of Fund shares in relation to fluctuations in the market value of the portfolio.
(c) In addition to the fees and expenses which the Fund bears directly, the Fund indirectly bears a pro rata share of the fees and expenses of the acquired funds in which it invests. Such indirect expenses are not included in the reported expense ratios.
(d) Annualized.
(e) Total net expenses include the impact of certain waivers/reimbursements made by the Investment Manager and certain of its affiliates, if applicable.
The accompanying Notes to Financial Statements are an integral part of this statement.
Annual Report 2013
37
Columbia High Yield Municipal Fund
Financial Highlights (continued)
| | | Year Ended May 31, | | Year Ended June 30, | |
Class Z | | 2013 | | 2012(a) | | 2011 | | 2010 | | 2009 | | 2008 | |
Per share data | |
Net asset value, beginning of period | | $ | 10.49 | | | $ | 9.60 | | | $ | 9.77 | | | $ | 8.79 | | | $ | 10.32 | | | $ | 11.33 | | |
Income from investment operations: | |
Net investment income | | | 0.47 | | | | 0.47 | | | | 0.55 | | | | 0.54 | | | | 0.55 | | | | 0.54 | | |
Net realized and unrealized gain (loss) | | | 0.22 | | | | 0.88 | | | | (0.19 | ) | | | 0.97 | | | | (1.54 | ) | | | (1.01 | ) | |
Total from investment operations | | | 0.69 | | | | 1.35 | | | | 0.36 | | | | 1.51 | | | | (0.99 | ) | | | (0.47 | ) | |
Less distributions to shareholders: | |
Net investment income | | | (0.46 | ) | | | (0.46 | ) | | | (0.53 | ) | | | (0.53 | ) | | | (0.54 | ) | | | (0.54 | ) | |
Total distributions to shareholders | | | (0.46 | ) | | | (0.46 | ) | | | (0.53 | ) | | | (0.53 | ) | | | (0.54 | ) | | | (0.54 | ) | |
Net asset value, end of period | | $ | 10.72 | | | $ | 10.49 | | | $ | 9.60 | | | $ | 9.77 | | | $ | 8.79 | | | $ | 10.32 | | |
Total return | | | 6.65 | % | | | 14.39 | % | | | 3.82 | % | | | 17.48 | % | | | (9.42 | %) | | | (4.20 | %) | |
Ratios to average net assets(b)(c) | |
Total gross expenses | | | 0.76 | % | | | 0.76 | %(d) | | | 0.71 | % | | | 0.65 | % | | | 0.70 | % | | | 0.75 | %(e) | |
Total net expenses(f) | | | 0.65 | %(g) | | | 0.60 | %(d)(g) | | | 0.65 | %(g) | | | 0.65 | %(g) | | | 0.70 | %(g) | | | 0.75 | %(e)(g) | |
Net investment income | | | 4.37 | % | | | 5.12 | %(d) | | | 5.68 | % | | | 5.64 | % | | | 6.07 | % | | | 5.03 | % | |
Supplemental data | |
Net assets, end of period (in thousands) | | $ | 849,332 | | | $ | 830,124 | | | $ | 641,387 | | | $ | 668,875 | | | $ | 498,734 | | | $ | 629,219 | | |
Portfolio turnover | | | 9 | % | | | 9 | % | | | 23 | % | | | 18 | % | | | 26 | % | | | 32 | % | |
Notes to Financial Highlights
(a) For the period from July 1, 2011 to May 31, 2012. During the period, the Fund's fiscal year end was changed from June 30 to May 31.
(b) Certain line items from prior years have been reclassified to conform to the current presentation.
(c) In addition to the fees and expenses which the Fund bears directly, the Fund indirectly bears a pro rata share of the fees and expenses of the acquired funds in which it invests. Such indirect expenses are not included in the reported expense ratios.
(d) Annualized.
(e) Ratios include interest and fee expense related to the participation in certain inverse floater programs. If interest and fee expense related to the participation in certain inverse floater programs had been excluded, expenses would have been lower by 0.05% for the year ended June 30, 2008. Due to an equal increase in interest income from fixed rate municipal bonds held in trust, there is no impact on the Fund's net assets, net asset value per share, total return or net investment income.
(f) Total net expenses include the impact of certain waivers/reimbursements made by the Investment Manager and certain of its affiliates, if applicable.
(g) The benefits derived from expense reductions had an impact of less than 0.01%.
The accompanying Notes to Financial Statements are an integral part of this statement.
Annual Report 2013
38
Columbia High Yield Municipal Fund
Notes to Financial Statements
May 31, 2013
Note 1. Organization
Columbia High Yield Municipal Fund (the Fund), a series of Columbia Funds Series Trust I (the Trust), is a diversified fund. The Trust is registered under the Investment Company Act of 1940, as amended (the 1940 Act), as an open-end management investment company organized as a Massachusetts business trust.
Fund Shares
The Trust may issue an unlimited number of shares (without par value). The Fund offers Class A, Class B, Class C, Class R4, Class R5 and Class Z shares. Although all share classes generally have identical voting, dividend and liquidation rights, each class votes separately when required by law. Different share classes pay different distribution amounts to the extent the expense of such class differ, and distributions in liquidation will be proportional to the net asset value of each share class. Each share class has its own expense structure and sales charges, as applicable.
Class A shares are subject to a maximum front-end sales charge of 4.75% based on the initial investment amount. Class A shares purchased without an initial sales charge in accounts aggregating $1 million to $50 million at the time of purchase are subject to a contingent deferred sales charge (CDSC) if the shares are sold within 18 months of purchase, charged as follows: 1.00% CDSC if redeemed within 12 months of purchase, and 0.50% CDSC if redeemed more than 12, but less than 18, months after purchase.
Class B shares may be subject to a maximum CDSC of 5.00% based upon the holding period after purchase. Class B shares will generally convert to Class A shares eight years after purchase. The Fund no longer accepts investments by new or existing investors in the Fund's Class B shares, except in connection with the reinvestment of any dividend and/or capital gain distributions in Class B shares of the Fund and exchanges by existing Class B shareholders of certain other funds within the Columbia Family of Funds.
Class C shares are subject to a 1.00% CDSC on shares redeemed within one year of purchase.
Class R4 shares are not subject to sales charges and are generally available only to omnibus retirement plans and certain other eligible investors. Class R4 shares commenced operations on March 19, 2013.
Class R5 shares are not subject to sales charges and are generally available only to investors purchasing through authorized investment professionals and omnibus retirement plans. Class R5 shares commenced operations on November 8, 2012.
Class Z shares are not subject to sales charges and are available only to certain investors.
Note 2. Summary of Significant Accounting Policies
Use of Estimates
The preparation of financial statements in accordance with U.S. generally accepted accounting principles (GAAP) requires management to make certain estimates and assumptions that affect the reported amounts of assets and liabilities, the disclosure of contingent assets and liabilities at the date of the financial statements and the reported amounts of revenue and expenses during the reporting period. Actual results could differ from those estimates.
The following is a summary of significant accounting policies consistently followed by the Fund in the preparation of its financial statements.
Security Valuation
Debt securities generally are valued by pricing services approved by the Board of Trustees (the Board) based upon market transactions for normal, institutional-size trading units of similar securities. The services may use various pricing techniques which take into account appropriate factors such as yield, quality, coupon rate, maturity, type of issue, trading characteristics and other data, as well as broker quotes. Debt securities for which quotations are readily available may also be valued based upon an over-the-counter or exchange bid quotation.
All equity securities are valued at the close of business of the New York Stock Exchange (NYSE). Equity securities are valued at the last quoted sales price on the principal exchange or market on which they trade, except for securities traded on the NASDAQ Stock Market, which are valued at the NASDAQ official close price. Unlisted securities or listed securities for which there were no sales during the day are valued at the mean of the latest quoted bid and ask prices on such exchanges or markets.
Investments in other open-end investment companies, including money market funds, are valued at net asset value.
Short-term securities purchased within 60 days to maturity are valued at amortized cost, which approximates market value. The value of short-term securities originally purchased with maturities greater than 60 days is determined based on an amortized value to par upon reaching 60 days to maturity. Short-term securities maturing in more than 60 days from the valuation date are valued at the market price or approximate market value based on current interest rates.
Annual Report 2013
39
Columbia High Yield Municipal Fund
Notes to Financial Statements (continued)
May 31, 2013
Investments for which market quotations are not readily available, or that have quotations which management believes are not reliable, are valued at fair value as determined in good faith under consistently applied procedures established by and under the general supervision of the Board. If a security or class of securities (such as foreign securities) is valued at fair value, such value is likely to be different from the last quoted market price for the security.
The determination of fair value often requires significant judgment. To determine fair value, management may use assumptions including but not limited to future cash flows and estimated risk premiums. Multiple inputs from various sources may be used to determine fair value.
Delayed Delivery Securities
The Fund may trade securities on other than normal settlement terms, including securities purchased or sold on a "when-issued" basis. This may increase the risk if the other party to the transaction fails to deliver and causes the Fund to subsequently invest at less advantageous prices. The Fund designates cash or liquid securities in an amount equal to the delayed delivery commitment.
Restricted Securities
Restricted securities are securities that may only be resold upon registration under federal securities laws or in transactions exempt from registration. In some cases, the issuer of restricted securities has agreed to register such securities for resale at the issuer's expense either upon demand by the Fund or in connection with another registered offering of the securities. Many restricted securities may be resold in the secondary market in transactions exempt from registration. Such restricted securities may be determined to be liquid under criteria established by the Board. The Fund will not incur any registration costs upon such resale.
Security Transactions
Security transactions are accounted for on the trade date. Cost is determined and gains (losses) are based upon the specific identification method for both financial statement and federal income tax purposes.
Income Recognition
Interest income is recorded on an accrual basis. Market premiums and discounts, including original issue discounts, are amortized and accreted, respectively, over the expected life of the security on all debt securities, unless otherwise noted.
Dividend income is recorded on the ex-dividend date.
Expenses
General expenses of the Trust are allocated to the Fund and other funds of the Trust based upon relative net assets or other
expense allocation methodologies determined by the nature of the expense. Expenses directly attributable to the Fund are charged to the Fund. Expenses directly attributable to a specific class of shares are charged to that share class.
Determination of Class Net Asset Value
All income, expenses (other than class-specific expenses, which are charged to that share class, as shown in the Statement of Operations) and realized and unrealized gains (losses) are allocated to each class of the Fund on a daily basis, based on the relative net assets of each class, for purposes of determining the net asset value of each class.
Federal Income Tax Status
The Fund intends to qualify each year as a regulated investment company under Subchapter M of the Internal Revenue Code, as amended, and will distribute substantially all of its tax exempt and taxable income (including net short-term capital gains), if any, for its tax year, and as such will not be subject to federal income taxes. In addition, the Fund intends to distribute in each calendar year substantially all of its net investment income, capital gains and certain other amounts, if any, such that the Fund should not be subject to federal excise tax. Therefore, no federal income or excise tax provision is recorded.
Distributions to Shareholders
Distributions from net investment income, if any, are declared daily and paid monthly. Net realized capital gains, if any, are distributed at least annually. Income distributions and capital gain distributions are determined in accordance with federal income tax regulations, which may differ from GAAP.
Guarantees and Indemnifications
Under the Trust's organizational documents and, in some cases, by contract, its officers and trustees are indemnified against certain liabilities arising out of the performance of their duties to the Trust or its funds. In addition, certain of the Fund's contracts with its service providers contain general indemnification clauses. The Fund's maximum exposure under these arrangements is unknown since the amount of any future claims that may be made against the Fund cannot be determined, and the Fund has no historical basis for predicting the likelihood of any such claims.
Recent Accounting Pronouncement
Disclosures about Offsetting Assets and Liabilities
In December 2011, the Financial Accounting Standards Board (FASB) issued Accounting Standards Update (ASU) No. 2011-11, Disclosures about Offsetting Assets and Liabilities and in January 2013, ASU No. 2013-1, Clarifying the Scope of Disclosures about Offsetting Assets and Liabilities (collectively, the ASUs). Specifically, the ASUs require an entity to disclose both gross and net information for
Annual Report 2013
40
Columbia High Yield Municipal Fund
Notes to Financial Statements (continued)
May 31, 2013
derivatives and other financial instruments that are subject to a master netting arrangement or similar agreement. The ASUs require disclosure of collateral received in connection with the master netting agreements or similar agreements. The disclosure requirements are effective for interim and annual periods beginning on or after January 1, 2013. At this time, management is evaluating the implications of this guidance and the impact it will have on the financial statement amounts and footnote disclosures, if any.
Note 3. Fees and Compensation Paid to Affiliates
Investment Management Fees
Under an Investment Management Services Agreement, Columbia Management Investment Advisers, LLC (the Investment Manager), a wholly-owned subsidiary of Ameriprise Financial, Inc. (Ameriprise Financial), determines which securities will be purchased, held or sold. The investment management fee is an annual fee that is equal to a percentage of the Fund's average daily net assets that declines from 0.47% to 0.30% as the Fund's net assets increase. The effective investment management fee rate for the year ended May 31, 2013 was 0.47% of the Fund's average daily net assets.
Administration Fees
Under an Administrative Services Agreement, the Investment Manager also serves as the Fund Administrator. The Fund pays the Fund Administrator an annual fee for administration and accounting services equal to a percentage of the Fund's average daily net assets that declines from 0.07% to 0.04% as the Fund's net assets increase. The effective administration fee rate for the year ended May 31, 2013 was 0.07% of the Fund's average daily net assets.
Compensation of Board Members
Board members are compensated for their services to the Fund as disclosed in the Statement of Operations. The Trust's eligible Trustees may participate in a Deferred Compensation Plan (the Plan) which may be terminated at any time. Obligations of the Plan will be paid solely out of the Fund's assets.
Compensation of Chief Compliance Officer
The Board has appointed a Chief Compliance Officer to the Fund in accordance with federal securities regulations. The Fund pays its pro-rata share of the expenses associated with the Chief Compliance Officer. The Fund's expenses for the Chief Compliance Officer will not exceed $15,000 per year.
Transfer Agent Fees
Under a Transfer and Dividend Disbursing Agent Agreement, Columbia Management Investment Services Corp. (the Transfer Agent), an affiliate of the Investment Manager and a wholly-owned subsidiary of Ameriprise Financial, is responsible for providing transfer agency services to the Fund. The Transfer Agent has contracted with Boston Financial Data Services (BFDS) to serve as sub-transfer agent.
The Transfer Agent receives monthly account-based service fees based on the number of open accounts and also receives sub-transfer agency fees based on a percentage of the average aggregate value of the Fund's shares maintained in omnibus accounts (other than omnibus accounts for which American Enterprise Investment Services Inc. is the broker of record or accounts where the beneficial shareholder is a customer of Ameriprise Financial Services, Inc., which are paid a per account fee). The Transfer Agent pays the fees of BFDS for services as sub-transfer agent and is not entitled to reimbursement for such fees from the Fund (with the exception of out-of-pocket fees).
The Transfer Agent also receives compensation from fees for various shareholder services and reimbursements for certain out-of-pocket fees. Total transfer agent fees for Class R5 shares are subject to an annual limitation of not more than 0.05% of the average daily net assets attributable to Class R5 shares.
For the year ended May 31, 2013, the Fund's effective transfer agent fee rates as a percentage of average daily net assets of each class were as follows:
Class A | | | 0.18 | % | |
Class B | | | 0.18 | | |
Class C | | | 0.18 | | |
Class R4* | | | 0.12 | | |
Class R5* | | | 0.05 | | |
Class Z | | | 0.18 | | |
*Annualized
An annual minimum account balance fee of $20 may apply to certain accounts with a value below the Fund's initial minimum investment requirements to reduce the impact of small accounts on transfer agent fees. These minimum account balance fees are recorded as part of expense reductions in the Statement of Operations. For the year ended May 31, 2013, these minimum account balance fees reduced total expenses by $860.
Distribution and Service Fees
The Fund has an agreement with Columbia Management Investment Distributors, Inc. (the Distributor), an affiliate of the Investment Manager and a wholly-owned subsidiary of Ameriprise Financial, for distribution and shareholder
Annual Report 2013
41
Columbia High Yield Municipal Fund
Notes to Financial Statements (continued)
May 31, 2013
services. Pursuant to Rule 12b-1 under the 1940 Act, the Board has approved, and the Fund has adopted, distribution and shareholder service plans (the Plans) which set the distribution and service fees for the Fund. These fees are calculated daily and are intended to compensate the Distributor and/or eligible selling and/or servicing agents for selling shares of the Fund and providing services to investors.
The Plans require the payment of a monthly service fee to the Distributor at the maximum annual rate of 0.20% of the average daily net assets attributable to Class A, Class B and Class C shares of the Fund. The Plans also require the payment of a monthly distribution fee to the Distributor at the maximum annual rates of 0.75% of the average daily net assets attributable to Class B and Class C shares only.
The Distributor has voluntarily agreed to waive a portion of the distribution fee for Class C shares so that it does not exceed 0.60% annually of the average daily net assets attributable to Class C shares. This arrangement may be modified or terminated by the Distributor at any time.
Sales Charges
Sales charges, including front-end charges and CDSCs, received by the Distributor for distributing Fund shares were $234,454 for Class A, $2,218 for Class B and $2,365 for Class C shares for the year ended May 31, 2013.
Expenses Waived/Reimbursed by the Investment Manager and its Affiliates
The Investment Manager and certain of its affiliates have contractually agreed to waive fees and/or reimburse expenses (excluding certain fees and expenses described below) for the periods disclosed below, unless sooner terminated at the sole discretion of the Board, so that the Fund's net operating expenses, after giving effect to fees waived/expenses reimbursed and any balance credits and/or overdraft charges from the Fund's custodian, do not exceed the following annual rates as a percentage of the class' average daily net assets:
| | | November 1, 2012
through
September 30, 2013 | | Prior to
November 1, 2012 | |
Class A | | | 0.89 | % | | | 0.80 | % | |
Class B | | | 1.64 | | | | 1.55 | | |
Class C | | | 1.64 | | | | 1.55 | | |
Class R4 | | | 0.69 | * | | | — | | |
Class R5 | | | 0.61 | ** | | | — | | |
Class Z | | | 0.69 | | | | 0.60 | | |
*Annual rate is contractual from March 19, 2013 (the commencement of operations of Class R4 shares) through February 28, 2014.
**Annual rate is contractual from November 8, 2012 (the commencement of operations of Class R5 shares) through November 8, 2013.
Under the agreement governing these fee waivers and/or expense reimbursement arrangements, the following fees and expenses are excluded from the waiver/reimbursement commitment, and therefore will be paid by the Fund, if applicable: taxes (including foreign transaction taxes), expenses associated with investments in affiliated and non-affiliated pooled investment vehicles (including mutual funds and exchange traded funds), transaction costs and brokerage commissions, costs related to any securities lending program, dividend expenses associated with securities sold short, inverse floater program fees and expenses, transaction charges and interest on borrowed money, interest, extraordinary expenses and any other expenses the exclusion of which is specifically approved by the Board. This agreement may be modified or amended only with approval from all parties. Class C distribution fees waived by the Distributor, as discussed above, are in addition to the waiver/reimbursement commitment under the agreement.
Note 4. Federal Tax Information
The timing and character of income and capital gain distributions are determined in accordance with income tax regulations, which may differ from GAAP because of temporary or permanent book to tax differences.
At May 31, 2013, these differences are primarily due to differing treatment for defaulted bonds, Trustees' deferred compensation, distributions, capital loss carryforwards, market discount, post-October capital losses and tax straddles. To the extent these differences are permanent, reclassifications are made among the components of the Fund's net assets in the Statement of Assets and Liabilities. Temporary differences do not require reclassifications. In the Statement of Assets and Liabilities the following reclassifications were made:
Undistributed net investment income | | $ | 81,530 | | |
Accumulated net realized loss | | | 5,540,042 | | |
Paid-in capital | | | (5,621,572 | ) | |
Net investment income and net realized gains (losses), as disclosed in the Statement of Operations, and net assets were not affected by this reclassification.
The tax character of distributions paid during the periods indicated was as follows:
| | | Year Ended
May 31,
2013 | | Period Ended
May 31,
2012 | | Year Ended
June 30,
2011 | |
Tax-Exempt income | | $ | 41,620,958 | | | $ | 36,072,556 | | | $ | 40,757,181 | | |
Ordinary income | | | 256,795 | | | | 127,251 | | | | 294,879 | | |
Total | | $ | 41,877,753 | | | $ | 36,199,807 | | | $ | 41,052,060 | | |
Short-term capital gain distributions, if any, are considered ordinary income distributions for tax purposes.
Annual Report 2013
42
Columbia High Yield Municipal Fund
Notes to Financial Statements (continued)
May 31, 2013
At May 31, 2013, the components of distributable earnings on a tax basis were as follows:
Undistributed tax-exempt income | | $ | 9,570,623 | | |
Undistributed accumulated long-term gain | | | — | | |
Unrealized appreciation | | | 58,696,601 | | |
At May 31, 2013, the cost of investments for federal income tax purposes was $901,807,365 and the aggregate gross unrealized appreciation and depreciation based on that cost was:
Unrealized appreciation | | $ | 84,053,994 | | |
Unrealized depreciation | | | (25,357,393 | ) | |
Net unrealized appreciation | | $ | 58,696,601 | | |
The following capital loss carryforward, determined at May 31, 2013, may be available to reduce taxable income arising from future net realized gains on investments, if any, to the extent permitted by the Internal Revenue Code:
Year of Expiration | | Amount | |
2014 | | $ | 466,991 | | |
2015 | | | 1,471,699 | | |
2016 | | | 5,694,295 | | |
2017 | | | 17,741,445 | | |
2018 | | | 35,721,468 | | |
2019 | | | 4,244,605 | | |
Unlimited short-term | | | 152,354 | | |
Unlimited long-term | | | 18,854,141 | | |
Total | | $ | 84,346,998 | | |
Unlimited capital loss carryforwards are required to be utilized prior to any capital losses which carry an expiration date. As a result of this ordering rule, capital loss carryforwards which carry an expiration date may be more likely to expire unused.
For the year ended May 31, 2013, $5,621,572 of capital loss carryforward was expired unused.
Management of the Fund has concluded that there are no significant uncertain tax positions that would require recognition in the financial statements. However, management's conclusion may be subject to review and adjustment at a later date based on factors including, but not limited to, new tax laws, regulations, and administrative interpretations (including relevant court decisions). Generally, the Fund's federal tax returns for the prior three fiscal years remain subject to examination by the Internal Revenue Service.
Note 5. Portfolio Information
The cost of purchases and proceeds from sales of securities, excluding short-term obligations, aggregated to $150,032,938 and $79,480,893, respectively, for the year ended May 31, 2013.
Note 6. Shareholder Concentration
At May 31, 2013, one unaffiliated shareholder account owned 75.2% of the outstanding shares of the Fund. The Fund has no knowledge about whether any portion of those shares was owned beneficially by such account. Subscription and redemption activity by concentrated accounts may have a significant effect on the operations of the Fund.
Note 7. Line of Credit
The Fund has entered into a revolving credit facility with a syndicate of banks led by JPMorgan Chase Bank N.A. whereby the Fund may borrow for the temporary funding of shareholder redemptions or for other temporary or emergency purposes. The credit facility agreement, as amended, which is a collective agreement between the Fund and certain other funds managed by the Investment Manager, severally and not jointly, permits collective borrowings up to $500 million. Interest is charged to each participating fund based on its borrowings at a rate equal to the higher of (i) the overnight federal funds rate plus 1.00% or (ii) the one-month LIBOR rate plus 1.00%. Each borrowing under the credit facility matures no later than 60 days after the date of borrowing. The Fund also pays a commitment fee equal to its pro rata share of the amount of the credit facility at a rate of 0.08% per annum.
The Fund had no borrowings during the year ended May 31, 2013.
Note 8. Significant Risks
Low and Below Investment Grade (High-Yield) Securities Risk
Securities with the lowest investment grade rating, securities rated below investment grade (commonly called "high-yield" or "junk" bonds) and unrated securities of comparable quality expose the Fund to a greater risk of loss of principal and income than a fund that invests solely or primarily in investment grade securities. In addition, these investments have greater price fluctuations, are less liquid and are more likely to experience a default than higher-rated securities. High-yield securities are considered to be predominantly speculative with respect to the issuer's capacity to pay interest and repay principal.
Note 9. Subsequent Events
Management has evaluated the events and transactions that have occurred through the date the financial statements were
Annual Report 2013
43
Columbia High Yield Municipal Fund
Notes to Financial Statements (continued)
May 31, 2013
issued and noted no items requiring adjustment of the financial statements or additional disclosure.
Note 10. Information Regarding Pending and Settled Legal Proceedings
In December 2005, without admitting or denying the allegations, American Express Financial Corporation (AEFC, which is now known as Ameriprise Financial, Inc. (Ameriprise Financial)) entered into settlement agreements with the Securities and Exchange Commission (SEC) and Minnesota Department of Commerce (MDOC) related to market timing activities. As a result, AEFC was censured and ordered to cease and desist from committing or causing any violations of certain provisions of the Investment Advisers Act of 1940, the Investment Company Act of 1940, and various Minnesota laws. AEFC agreed to pay disgorgement of $10 million and civil money penalties of $7 million. AEFC also agreed to retain an independent distribution consultant to assist in developing a plan for distribution of all disgorgement and civil penalties ordered by the SEC in accordance with various undertakings detailed at www.sec.gov/litigation/admin/ia-2451.pdf. Ameriprise Financial and its affiliates have cooperated with the SEC and the MDOC in these legal proceedings, and have made regular reports to the funds' Boards of Trustees.
Ameriprise Financial and certain of its affiliates have historically been involved in a number of legal, arbitration and regulatory proceedings, including routine litigation, class actions, and governmental actions, concerning matters arising in connection with the conduct of their business activities. Ameriprise Financial believes that the Funds are not currently the subject of, and that neither Ameriprise Financial nor any of its affiliates are the subject of, any pending legal, arbitration or regulatory proceedings that are likely to have a material adverse effect on the Funds or the ability of Ameriprise Financial or its affiliates to perform under their contracts with the Funds. Ameriprise Financial is required to make 10-Q, 10-K and, as necessary, 8-K filings with the Securities and Exchange Commission on legal and regulatory matters that relate to Ameriprise Financial and its affiliates. Copies of these filings may be obtained by accessing the SEC website at www.sec.gov.
There can be no assurance that these matters, or the adverse publicity associated with them, will not result in increased fund redemptions, reduced sale of fund shares or other adverse consequences to the Funds. Further, although we believe proceedings are not likely to have a material adverse effect on the Funds or the ability of Ameriprise Financial or its affiliates to perform under their contracts with the Funds, these proceedings are subject to uncertainties and, as such, we are unable to estimate the possible loss or range of loss that may
result. An adverse outcome in one or more of these proceedings could result in adverse judgments, settlements, fines, penalties or other relief that could have a material adverse effect on the consolidated financial condition or results of operations of Ameriprise Financial.
Annual Report 2013
44
Columbia High Yield Municipal Fund
Report of Independent Registered Public Accounting Firm
To the Trustees of Columbia Funds Series Trust I and the Shareholders of Columbia High Yield Municipal Fund
In our opinion, the accompanying statement of assets and liabilities, including the portfolio of investments, and the related statements of operations and of changes in net assets and the financial highlights present fairly, in all material respects, the financial position of Columbia High Yield Municipal Fund (the "Fund") (a series of Columbia Funds Series Trust I) at May 31, 2013, the results of its operations, the changes in its net assets and the financial highlights for the periods indicated, in conformity with accounting principles generally accepted in the United States of America. These financial statements and financial highlights (hereafter referred to as "financial statements") are the responsibility of the Fund's management. Our responsibility is to express an opinion on these financial statements based on our audits. We conducted our audits of these financial statements in accordance with the standards of the Public Company Accounting Oversight Board (United States). Those standards require that we plan and perform the audits to obtain reasonable assurance about whether the financial statements are free of material misstatement. An audit includes examining, on a test basis, evidence supporting the amounts and disclosures in the financial statements, assessing the accounting principles used and significant estimates made by management, and evaluating the overall financial statement presentation. We believe that our audits, which included confirmation of securities at May 31, 2013 by correspondence with the custodian and brokers, provide a reasonable basis for our opinion.
PricewaterhouseCoopers LLP
Minneapolis, Minnesota
July 24, 2013
Annual Report 2013
45
Columbia High Yield Municipal Fund
Federal Income Tax Information
(Unaudited)
The Fund hereby designates the following tax attributes for the fiscal year ended May 31, 2013. Shareholders will be notified in early 2014 of amounts for use in preparing 2013 income tax returns
Tax Designations:
| Exempt-Interest Dividends | | | 99.39 | % | |
Exempt-Interest Dividends. The percentage of net investment income dividends paid during the fiscal year that qualifies as exempt-interest dividends for federal income tax purposes.
Annual Report 2013
46
Columbia High Yield Municipal Fund
The Trustees serve terms of indefinite duration. The names, addresses and birth years of the Trustees and Officers of the Funds in Columbia Funds Series Trust I, the year each was first elected or appointed to office, their principal business occupations during at least the last five years, the number of Funds overseen by each Trustee and other directorships they hold are shown below. Each officer listed below serves as an officer of each Fund in Columbia Funds Series Trust I.
Independent Trustees
Name, Address and Year of Birth,
Position with Funds, Year First
Elected or Appointed to Office | | Principal Occupation(s) During Past Five Years, Number of Funds in Columbia
Funds Complex Overseen by Trustee, Other Directorships Held | |
Rodman L. Drake (Born 1943)
c/o Columbia Management
Investment Advisers, LLC
225 Franklin Street
Boston, MA 02110
Trustee (since 1994) and
Chairman of the Board (since 2009) | | Independent consultant since 2010; Co-Founder of Baringo Capital LLC (private equity) from 1997 to 2008; Chairman (from 2003 to 2010) and CEO (from 2008 to 2010) of Crystal River Capital, Inc. (real estate investment trust); Oversees 52; Jackson Hewitt Tax Service Inc. (tax preparation services) from 2004 to 2011; Student Loan Corporation (student loan provider) from 2005 to 2010; Celgene Corporation (global biotechnology company); The Helios Funds and Brookfield Funds (closed-end funds); Crystal River Capital, Inc. from 2005 to 2010; Parsons Brinckerhoff from 1995 to 2008; and Apex Silver Mines Ltd. from 2007 to 2009 | |
Douglas A. Hacker (Born 1955)
c/o Columbia Management
Investment Advisers, LLC
225 Franklin Street
Boston, MA 02110
Trustee (since 1996) | | Independent business executive since May 2006; Executive Vice President — Strategy of United Airlines from December 2002 to May 2006; President of UAL Loyalty Services (airline marketing company) from September 2001 to December 2002; Executive Vice President and Chief Financial Officer of United Airlines from July 1999 to September 2001. Oversees 52; Nash Finch Company (food distributor); Aircastle Limited (aircraft leasing); and SeaCube Container Leasing Ltd. (container leasing) | |
Janet Langford Kelly (Born 1957)
c/o Columbia Management
Investment Advisers, LLC
225 Franklin Street
Boston, MA 02110
Trustee (since 1996) | | Senior Vice President, General Counsel and Corporate Secretary, ConocoPhillips (integrated energy company) since September 2007; Deputy General Counsel — Corporate Legal Services, ConocoPhillips from August 2006 to August 2007; Partner, Zelle, Hofmann, Voelbel, Mason & Gette LLP (law firm) from March 2005 to July 2006; Adjunct Professor of Law, Northwestern University from September 2004 to June 2006; Director, UAL Corporation (airline) from February 2006 to July 2006; Chief Administrative Officer and Senior Vice President, Kmart Holding Corporation (consumer goods) from September 2003 to March 2004. Oversees 52; None | |
Nancy T. Lukitsh (Born 1956)
c/o Columbia Management
Investment Advisers, LLC
225 Franklin Street
Boston, MA 02110
Trustee (since 2011) | | Senior Vice President, Partner and Director of Marketing, Wellington Management Company, LLP (investment adviser) from 1997 to 2010; Chair, Wellington Management Investment Portfolios (commingled non-U.S. investment pools) from 2007 to 2010; Director, Wellington Trust Company, NA and other Wellington affiliates from 1997 to 2010. Oversees 52; None | |
William E. Mayer (Born 1940)
c/o Columbia Management
Investment Advisers, LLC
225 Franklin Street
Boston, MA 02110
Trustee (since 1994) | | Partner, Park Avenue Equity Partners (private equity) since February 1999; Dean and Professor, College of Business and Management, University of Maryland from 1992 to 1996. Oversees 52; DynaVox Inc. (speech creation); Lee Enterprises (print media); WR Hambrecht + Co. (financial service provider) from 2000 to 2012; BlackRock Kelso Capital Corporation (investment company) | |
David M. Moffett (Born 1952)
c/o Columbia Management
Investment Advisers, LLC
225 Franklin Street
Boston, MA 02110
Trustee (since 2011) | | Retired. Chief Executive Officer, Federal Home Loan Mortgage Corporation, from 2008 to 2009; Senior Adviser, Global Financial Services Group, Carlyle Group, Inc., from 2007 to 2008; Vice Chairman and Chief Financial Officer, U.S. Bancorp, from 1993 to 2007. Oversees 52; CIT Group Inc. (commercial and consumer finance); eBay Inc. (online trading community); MBIA Inc. (financial service provider); E.W. Scripps Co. (print and television media), Building Materials Holding Corp. (building materials and construction services); Genworth Financial, Inc. (financial and insurance products and services); and University of Oklahoma Foundation. | |
Charles R. Nelson (Born 1942)
c/o Columbia Management
Investment Advisers, LLC
225 Franklin Street
Boston, MA 02110
Trustee (since 1981) | | Retired. Professor Emeritus, University of Washington, since 2011; Professor of Economics, University of Washington from January 1976 to 2011; Ford and Louisa Van Voorhis Professor of Political Economy, University of Washington from 1993 to 2011; Adjunct Professor of Statistics, University of Washington from 1980 to 2011; Associate Editor, Journal of Money, Credit and Banking from September 1993 to 2008; consultant on econometric and statistical matters. Oversees 52; None | |
John J. Neuhauser (Born 1943)
c/o Columbia Management
Investment Advisers, LLC
225 Franklin Street
Boston, MA 02110
Trustee (since 1984) | | President, Saint Michael's College, since August 2007; Director or Trustee of several non-profit organizations, including Fletcher Allen Health Care, Inc.; University Professor, Boston College from November 2005 to August 2007; Academic Vice President and Dean of Faculties, Boston College from August 1999 to October 2005. Oversees 52; Liberty All-Star Equity Fund and Liberty All-Star Growth Fund (closed-end funds) | |
Annual Report 2013
47
Columbia High Yield Municipal Fund
Trustees and Officers (continued)
Independent Trustees (continued)
Name, Address and Year of Birth,
Position with Funds, Year First
Elected or Appointed to Office | | Principal Occupation(s) During Past Five Years, Number of Funds in Columbia
Funds Complex Overseen by Trustee, Other Directorships Held | |
Patrick J. Simpson (Born 1944)
c/o Columbia Management
Investment Advisers, LLC
225 Franklin Street
Boston, MA 02110
Trustee (since 2000) | | Partner, Perkins Coie LLP (law firm). Oversees 52; None | |
Anne-Lee Verville (Born 1945)
c/o Columbia Management
Investment Advisers, LLC
225 Franklin Street
Boston, MA 02110
Trustee (since 1998) | | Retired. General Manager — Global Education Industry from 1994 to 1997, President — Application Systems Division from 1991 to 1994, Chief Financial Officer — US Marketing & Services from 1988 to 1991, and Chief Information Officer from 1987 to 1988, IBM Corporation (computer and technology). Oversees 52; Enesco Group, Inc. (producer of giftware and home and garden decor products) from 2001 to 2006 | |
Interested Trustee
Name, Address and Year of Birth,
Position with Funds, Year First
Elected or Appointed to Office | | Principal Occupation(s) During Past Five Years, Number of Funds in Columbia
Funds Complex Overseen by Trustee, Other Directorships Held | |
William F. Truscott (born 1960)
53600 Ameriprise Financial Center
Minneapolis, MN 55474
Senior Vice President (since 2012) | | President and Chairman of the Board, Columbia Management Investment Advisers, LLC since May 2010 and February 2012, respectively (previously President and Chief Investment Officer, from 2001 to April 2010); Chief Executive Officer, Global Asset Management, Ameriprise Financial, Inc. since September 2012 (previously, Chief Executive Officer, U.S. Asset Management & President, Annuities, from May 2010 to September 2012 and President — U.S. Asset Management and Chief Investment Officer from 2005 to April 2010); Director and Chief Executive Officer, Columbia Management Investment Distributors, Inc. since May 2010 and February 2012, respectively (previously Chairman of the Board and Chief Executive Officer from 2006 to April 2010); Chairman of the Board and Chief Executive Officer, RiverSource Distributors, Inc. since 2006; President and Chief Executive Officer, Ameriprise Certificate Company, 2006 to August 2012; Oversees 184; Director, Ameriprise Certificate Company, 2006-January 2013 | |
The Statement of Additional Information includes additional information about the Trustees of the Funds and is available, without charge, upon request by calling 800.345.6611.
The Board has appointed officers who are responsible for day-to-day business decisions based on policies it has established. The officers serve at the pleasure of the Board. In addition to Mr. Truscott, who is Senior Vice President, the Funds' other officers are:
Officers
Name, Year of Birth and Address | | Principal Occupation(s) During the Past Five Years | |
J. Kevin Connaughton (Born 1964)
225 Franklin Street
Boston, MA 02110
President (since 2009) | | Senior Vice President and General Manager — Mutual Fund Products, Columbia Management Investment Advisers, LLC since May 2010; President, Columbia Funds since 2009 and RiverSource Funds since May 2010; Managing Director, Columbia Management Advisors, LLC, December 2004-April 2010; Senior Vice President and Chief Financial Officer, Columbia Funds, June 2008-January 2009; Treasurer, Columbia Funds, October 2003-May 2008; and senior officer of various other affiliated funds since 2000 | |
Amy Johnson (Born 1965)
5228 Ameriprise Financial Center
Minneapolis, MN 55474
Vice President (since 2010) | | Senior Vice President and Chief Operating Officer, Columbia Management Investment Advisers, LLC since May 2010 (previously Chief Administrative Officer, from 2009-April 2010, Vice President — Asset Management and Trust Company Services, from 2006-2009) | |
Michael G. Clarke (Born 1969)
225 Franklin Street
Boston, MA 02110
Treasurer (since 2011) and Chief
Financial Officer (since 2009) | | Vice President, Columbia Management Investment Advisers, LLC since May 2010; Managing Director of Fund Administration, Columbia Management Advisors, LLC, September 2004-April 2010; senior officer of Columbia Funds and affiliated funds since 2002 | |
Annual Report 2013
48
Columbia High Yield Municipal Fund
Trustees and Officers (continued)
Officers (continued)
Name, Year of Birth and Address | | Principal Occupation(s) During the Past Five Years | |
Scott R. Plummer (Born 1959)
5228 Ameriprise Financial Center
Minneapolis, MN 55474
Senior Vice President, Assistant
Secretary and Chief Legal Officer
(since 2010) | | Senior Vice President, Chief Legal Officer and Assistant Secretary, Columbia Management Investment Advisers, LLC since June 2005; Vice President and Lead Chief Counsel — Asset Management, Ameriprise Financial, Inc. since May 2010 (previously Vice President and Chief Counsel — Asset Management, 2005-April 2010); Vice President, Chief Counsel and Assistant Secretary, Columbia Management Investment Distributors, Inc. since 2008; Vice President, General Counsel and Secretary, Ameriprise Certificate Company since 2005; Chief Counsel, RiverSource Distributors, Inc. since 2006; senior officer of Columbia Funds and affiliated funds since 2010 | |
Colin Moore (Born 1958)
225 Franklin Street
Boston, MA 02110
Senior Vice President (since 2010) | | Executive Vice President and Global Chief Investment Officer, Ameriprise Financial, Inc. since July 2013; Director and Global Chief Investment Officer, Columbia Management Investment Advisers, LLC since May 2010; Manager, Managing Director and Chief Investment Officer of Columbia Management Advisors, LLC, 2007-April 2010 | |
Thomas P. McGuire (Born 1972)
225 Franklin Street
Boston, MA 02110
Chief Compliance Officer
(since 2012) | | Vice President — Asset Management Compliance, Columbia Management Investment Advisers, LLC since 2010; Chief Compliance Officer, Ameriprise Certificate Company, since September 2010; Compliance Executive, Bank of America, N.A. 2005-2010 | |
Stephen T. Welsh (born 1957)
225 Franklin Street
Boston, MA 02110
Vice President (since 2006) | | President and Director, Columbia Management Investment Services Corp. since May 2010; President and Director, Columbia Management Services, Inc., July 2004-April 2010; Managing Director, Columbia Management Distributors, Inc., August 2007-April 2010 | |
Christopher O. Petersen (born 1970)
5228 Ameriprise Financial Center
Minneapolis, MN 55474
Vice President (since 2010) and
Secretary (since 2011) | | Vice President and Chief Counsel, Ameriprise Financial Inc. since January 2010 (formerly Vice President and Group Counsel or Counsel, April 2004-January 2010); Assistant Secretary of Columbia Funds, January 2007-April 2011 | |
Paul D. Pearson (born 1956)
10468 Ameriprise Financial Center
Minneapolis, MN 55474
Vice President and Assistant
Treasurer (since 2011) | | Vice President, Investment Accounting, Columbia Management Investment Advisers, LLC, since May 2010; Vice President — Managed Assets, Investment Accounting, Ameriprise Financial Inc., February 1998-May 2010 | |
Joseph F. DiMaria (Born 1968)
225 Franklin Street
Boston, MA 02110
Vice President (since 2011) and
Chief Accounting Officer (since 2008) | | Vice President, Mutual Fund Administration, Columbia Management Investment Advisers, LLC, since May 2010; Director of Fund Administration, Columbia Management Advisors, LLC, January 2006-April 2010 | |
Paul B. Goucher (born 1968)
100 Park Avenue
New York, NY 10017
Vice President and Assistant
Secretary (since 2010) | | Vice President and Lead Chief Counsel, Ameriprise Financial, Inc. since November 2008 and January 2013, respectively (formerly, Chief Counsel from January 2010-January 2013 and Group Counsel from November 2008-January 2010); Director, Managing Director and General Counsel, J. & W. Seligman & Co. Incorporated, July 2008-November 2008 (previously, Managing Director and Associate General Counsel, January 2005-July 2008) | |
Michael E. DeFao (born 1968)
225 Franklin Street
Boston, MA 02110
Vice President and Assistant
Secretary (since 2011) | | Vice President and Chief Counsel, Ameriprise Financial Inc. since May 2010; Associate General Counsel, Bank of America, N.A. June 2005-April 2010 | |
Annual Report 2013
49
This page intentionally left blank.
Annual Report 2013
50
This page intentionally left blank.
Annual Report 2013
51
This page intentionally left blank.
Annual Report 2013
52
Columbia High Yield Municipal Fund
Important Information About This Report
Each fund mails one shareholder report to each shareholder address. If you would like more than one report, please call shareholder services at 800.345.6611 and additional reports will be sent to you.
The policy of the Board is to vote the proxies of the companies in which each fund holds investments consistent with the procedures as stated in the Statement of Additional Information (SAI). You may obtain a copy of the SAI without charge by calling 800.345.6611; contacting your financial intermediary; visiting columbiamanagement.com; or searching the website of the Securities and Exchange Commission (SEC) at sec.gov. Information regarding how each fund voted proxies relating to portfolio securities is filed with the SEC by August 31 for the most recent 12-month period ending June 30 of that year, and is available without charge by visiting columbiamanagement.com; or searching the website of the SEC at sec.gov.
Each fund files a complete schedule of portfolio holdings with the SEC for the first and third quarters of each fiscal year on Form N-Q. Each fund's Form N-Q is available on the SEC's website at sec.gov and may be reviewed and copied at the SEC's Public Reference Room in Washington, D.C. Information on the operation of the Public Reference Room may be obtained by calling 800.SEC.0330. Each fund's complete schedule of portfolio holdings, as filed on Form N-Q, can also be obtained without charge, upon request, by calling 800.345.6611.
Annual Report 2013
53

Columbia High Yield Municipal Fund
P.O. Box 8081
Boston, MA 02266-8081
columbiamanagement.com
This information is for use with concurrent or prior delivery of a fund prospectus. Please read and consider the investment objectives, risks, charges and expenses for any fund carefully before investing. For a prospectus which contains this and other important information about the Fund go to columbiamanagement.com. The Fund is distributed by Columbia Management Investment Distributors, Inc., member FINRA, and managed by Columbia Management Investment Advisers, LLC.
© 2013 Columbia Management Investment Advisers, LLC. All rights reserved.
ANN161_05_C01_(07/13)
Annual Report
May 31, 2013

Columbia Risk Allocation Fund
Not FDIC insured • No bank guarantee • May lose value
Columbia Risk Allocation Fund
 Dear Shareholders,
U.S. equities had a strong first quarter
Similar to 2012, equities once again were the best performing asset class in the first quarter of 2013. The S&P 500 Index reached an all-time closing high on the last trading day of the quarter and pushed through its October 2007 peak. Although global equities have performed well year-to-date, there is significant performance divergence among regions. In local currency terms, Japanese equities were the best performing developed market globally, and U.S. stocks outperformed most other global equity markets. European equities rose in the first quarter but trailed U.S. stocks and had a turbulent March, as investors were reminded of instability in the eurozone with news of a banking crisis in Cyprus.
Although all 10 sectors of the S&P 500 Index delivered positive returns, this was a rally led by defensive stocks such as those in health care, consumer staples and utilities. Materials and technology stocks were the weakest sectors.
High yield leads fixed income; most sectors flat to down
The fixed-income markets lagged equities with modest, single-digit returns coming from municipals and high-yield sectors in the United States. Most government and investment-grade credit sectors were roughly flat to down for the first quarter of 2013. Emerging market bonds were the biggest disappointment with single-digit losses.
Columbia Management to begin delivering summary prospectuses
Each Columbia fund is required to update its prospectus on an annual basis. Beginning with June 2013 prospectus updates, shareholders of Columbia retail mutual funds will start to receive a summary prospectus, rather than the full length (statutory) mutual fund prospectus they have received in the past.
Each fund's summary prospectus will include the following key information:
> Investment objective
> Fee and expense table
> Portfolio turnover rate information
> Principal investment strategies, principal risks and performance information
> Management information
> Purchase and sale information
> Tax information
> Financial intermediary compensation information
Each fund's statutory prospectus will contain additional information about the fund and its risks. Both the statutory and summary prospectus will be updated each year, and will be available at columbiamanagement.com. Shareholders may request a printed version of a statutory prospectus at no cost by calling 800.345.6611 or sending an email to serviceinquiries@columbiamanagement.com.
Stay on track with Columbia Management
Backed by more than 100 years of experience, Columbia Management is one of the nation's largest asset managers. At the heart of our success — and, most importantly, that of our investors — are highly talented industry professionals, brought together by a unique way of working. We are dedicated to helping you take advantage of today's opportunities and anticipate tomorrow's. We stay abreast of the latest investment trends and ideas, using our collective insight to evaluate events and transform them into solutions you can use.
Visit columbiamanagement.com for:
> The Columbia Management Perspectives blog, featuring timely posts by our investment teams
> Detailed up-to-date fund performance and portfolio information
> Economic analysis and market commentary
> Quarterly fund commentaries
> Columbia Management Investor, our award-winning quarterly newsletter for shareholders
Thank you for your continued support of the Columbia Funds. We look forward to serving your investment needs for many years to come.
Best Regards,

J. Kevin Connaughton
President, Columbia Funds
The S&P 500 Index, an unmanaged index, measures the performance of 500 large-capitalization U.S. stocks and is frequently used as a general measure of market performance. Indices are not available for investment, are not professionally managed and do not reflect sales charges, fees, brokerage commissions, taxes or other expenses of investing.
Investors should consider the investment objectives, risks, charges and expenses of a mutual fund carefully before investing. For a free prospectus, which contains this and other important information about a fund, visit columbiamanagement.com. The prospectus should be read carefully before investing.
Columbia Funds are distributed by Columbia Management Investment Distributors, Inc., member FINRA, and managed by Columbia Management Investment Advisers, LLC.
© 2013 Columbia Management Investment Advisers, LLC. All rights reserved.
Columbia Risk Allocation Fund
Performance Overview | | | 2 | | |
Manager Discussion of Fund Performance | | | 4 | | |
Understanding Your Fund's Expenses | | | 6 | | |
Portfolio of Investments | | | 7 | | |
Statement of Assets and Liabilities | | | 11 | | |
Statement of Operations | | | 13 | | |
Statement of Changes in Net Assets | | | 14 | | |
Financial Highlights | | | 16 | | |
Notes to Financial Statements | | | 23 | | |
Report of Independent Registered
Public Accounting Firm | | | 32 | | |
Federal Income Tax Information | | | 33 | | |
Trustees and Officers | | | 34 | | |
Important Information About This Report | | | 37 | | |
Fund Investment Manager
Columbia Management Investment
Advisers, LLC
225 Franklin Street
Boston, MA 02110
Fund Distributor
Columbia Management Investment
Distributors, Inc.
225 Franklin Street
Boston, MA 02110
Fund Transfer Agent
Columbia Management Investment
Services Corp.
P.O. Box 8081
Boston, MA 02266-8081
For more information about any of the funds, please visit columbiamanagement.com or call 800.345.6611. Customer Service Representatives are available to answer your questions Monday through Friday from 8 a.m. to 8 p.m. Eastern time.
The views expressed in this report reflect the current views of the respective parties. These views are not guarantees of future performance and involve certain risks, uncertainties and assumptions that are difficult to predict, so actual outcomes and results may differ significantly from the views expressed. These views are subject to change at any time based upon economic, market or other conditions and the respective parties disclaim any responsibility to update such views. These views may not be relied on as investment advice and, because investment decisions for a Columbia Fund are based on numerous factors, may not be relied on as an indication of trading intent on behalf of any particular Columbia Fund. References to specific securities should not be construed as a recommendation or investment advice.
Columbia Risk Allocation Fund
Performance Summary
> Columbia Risk Allocation Fund (the Fund) Class A shares returned 4.15% excluding sales charges for the period from inception on June 19, 2012 through May 31, 2013.
> The Fund underperformed its Blended Benchmark, which returned 13.59% over the same period.
> The Fund outperformed the Citigroup 3-Month U.S. Treasury Bill Index, which returned 0.08% during the reporting period.
> The Fund takes a risk-based approach to allocating assets. The Fund's equity allocation contributed favorably to the Fund's returns relative to its Blended Benchmark, while its fixed income and inflation-hedging asset allocations detracted from overall relative results.
Average Annual Total Returns (%) (for period ended May 31, 2013)
| | Inception | | Life | |
Class A | | 06/19/12 | | | | | |
Excluding sales charges | | | | | | | 4.15 | | |
Including sales charges | | | | | | | -1.84 | | |
Class C | | 06/19/12 | | | | | |
Excluding sales charges | | | | | | | 3.43 | | |
Including sales charges | | | | | | | 2.43 | | |
Class K (formerly Class R4) | | 06/19/12 | | | 4.13 | | |
Class R | | 06/19/12 | | | 3.90 | | |
Class R5 | | 06/19/12 | | | 4.37 | | |
Class W | | 06/19/12 | | | 4.15 | | |
Class Z | | 06/19/12 | | | 4.39 | | |
Blended Benchmark | | | | | | | 13.59 | | |
Citigroup 3-Month U.S. Treasury Bill Index | | | | | | | 0.08 | | |
Returns for Class A are shown with and without the maximum initial sales charge of 5.75%. Returns for Class C are shown with and without the 1.00% contingent deferred sales charge (CDSC) for the first year only. The Fund's other classes are not subject to sales charges and have limited eligibility. Please see the Fund's prospectuses for details. Performance for different share classes will vary based on differences in sales charges and fees associated with each class. All results shown assume reinvestment of distributions during the period. Returns do not reflect the deduction of taxes that a shareholder may pay on Fund distributions or on the redemption of Fund shares. Performance results reflect the effect of any fee waivers or reimbursements of Fund expenses by Columbia Management Investment Advisers, LLC and/or any of its affiliates. Absent these fee waivers or expense reimbursement arrangements, performance results would have been lower.
The performance information shown represents past performance and is not a guarantee of future results. The investment return and principal value of your investment will fluctuate so that your shares, when redeemed, may be worth more or less than their original cost. Current performance may be lower or higher than the performance information shown. You may obtain performance information current to the most recent month-end by contacting your financial intermediary, visiting columbiamanagement.com or calling 800.345.6611.
The Blended Benchmark, a weighted custom composite established by the Investment Manager, consists of a 60% weighting of the S&P 500 Index and a 40% weighting of the Barclays U.S. Aggregate Bond Index. The S&P 500 Index tracks the performance of 500 widely held, large-capitalization U.S. stocks, and the Barclays U.S. Aggregate Bond Index is a market value-weighted index that tracks the daily price, coupon, pay-downs and total return performance of fixed-rate, publicly placed, dollar-denominated and non-convertible investment grade debt issues with at least $250 million par amount outstanding and with at least one year to final maturity.
The Citigroup 3-Month U.S. Treasury Bill Index is an unmanaged index that represents the performance of three-month Treasury bills and reflects reinvestment of all distributions and changes in market prices.
Indices are not available for investment, are not professionally managed and do not reflect sales charges, fees, brokerage commissions, taxes or other expenses of investing. Securities in the Fund may not match those in an index.
Annual Report 2013
2
Columbia Risk Allocation Fund
Performance Overview (continued)
Performance of a Hypothetical $10,000 Investment (June 19, 2012 – May 31, 2013)

The chart above shows the change in value of a hypothetical $10,000 investment in Class A shares of Columbia Risk Allocation Fund during the stated time period, and does not reflect the deduction of taxes that a shareholder may pay on Fund distributions or on the redemption of Fund shares.
Annual Report 2013
3
Columbia Risk Allocation Fund
Manager Discussion of Fund Performance
For the period from its inception on June 19, 2012 through May 31, 2013, the Fund's Class A shares returned 4.15% excluding sales charges. The Fund underperformed its Blended Benchmark, which returned 13.59% over the same period. The Fund outperformed the Citigroup 3-Month U.S. Treasury Bill Index, which returned 0.08% during the reporting period. The Fund takes a risk-based approach to allocating assets.
Financial Markets Advanced Despite Conflicting Data
There were a number of drivers influencing the financial markets during the reporting period. In Europe, fiscal rectitude followed questions about the ability of some Mediterranean countries to service the debt burdens they built up in better years. The European Central Bank generally acted with greater caution than some of its developed market peers. In North America, primarily in the U.S., aggressive fiscal spending — coupled with loose monetary policy — led to significantly bullish moves, initially in bonds and subsequently in equities. There was turbulence in Asian fundamentals. An economic slowdown in China brought large swings in commodity prices, which, in turn, led to large swings in the currencies of commodity-producing countries, such as Australia. Further, Japan, so long a dormant economy, showed signs of life again after promises of greater central bank accommodation under its new leader Haruhiko Kuroda, prompted by the nation's new prime minister Shinzo Abe.
Asset Class Positioning and Underlying Fund Performance Generated Mixed Results
The Fund takes a risk-based approach to allocating assets with the aim to improve upon the capital-based approach to asset allocation. The capital-based approach has tended to result in risk-concentrated portfolios — specifically in equities — over time. By balancing risk (or volatility) across asset classes that are expected to respond differently under various economic and market conditions, we expect the Fund to provide a more consistent return over the long term, while minimizing the severity and duration of peak-to-trough declines, relative to the traditional 60% equities/40% fixed income portfolio.
The Fund's overall equity allocation contributed favorably to the Fund's returns relative to its Blended Benchmark. The Fund had exposure within its equity allocation to TOPIX (Tokyo Stock Price Index) futures, FTSE (stocks listed on the London Stock Exchange) futures, Euro Stoxx (an index that represents companies across 12 eurozone countries) futures, S&P 500 Index futures and to an investment in the Columbia Emerging Markets Fund. Conversely, detracting from the Fund's relative results were its fixed income and inflation-hedging asset allocations. The Fund's fixed income allocation was comprised of Australian, Canadian, Euro, Japanese, U.K. and U.S. bond futures as well as of interest rate swaps. The Fund's inflation-hedging asset allocation was comprised of investments in Powershares DB Gold Fund, Central Fund of Canada and Threadneedle Commodity Fund.
A Period of Building
The reporting period was not one of making changes, but rather of building the portfolio as we sought to meet the Fund's objective. At the end of May 2013, the Fund had its greatest allocation in fixed income, followed by equities and then inflation-hedging assets.
Portfolio Management
Todd White
Jeffrey Knight, CFA
Kent Peterson, PhD
Anwiti Bahuguna, Ph.D.
Beth Vanney, CFA
Fred Copper, CFA
Portfolio Breakdown (%)
(at May 31, 2013) | |
Equity Funds | | | 13.1 | | |
Alternative Investment Funds | | | 28.5 | | |
Exchange-Traded Funds | | | 0.8 | | |
Money Market Funds(a) | | | 57.6 | | |
Total | | | 100.0 | | |
Percentages indicated are based upon total investments. The Fund's portfolio composition is subject to change.
(a) Includes investments in Money Market Funds (amounting to $8.4 million) which have been segregated to cover obligations related to the Fund's investment in derivatives which provides exposure to multiple markets. For a description of the Fund's investments in derivatives, see Investments in Derivatives following the Portfolio of Investments, and Note 2 to the financial statements.
Market Exposure
By Asset Class
Categories(a) | | As a Percent
of Fund
Net Assets
(at May 31, 2013) | |
Fixed Income | | | 138.2 | % | |
Equity | | | 37.7 | % | |
Inflation-hedging assets(b) | | | 29.1 | % | |
(a) The percentages do not equal 100% due to the effects of leverage within the Fund's portfolio. Leverage exists when the Fund purchases or sells an instrument or enters into a transaction without investing cash in an amount equal to the full economic exposure of the instrument or transaction. The Fund's portfolio composition and its market exposure is subject to change.
(b) Inflation-hedging assets may include, but are not limited to, direct or indirect investments in commodity-related investments, including certain types of commodities-linked derivatives, and U.S. and non-U.S. inflation-linked bonds.
Annual Report 2013
4
Columbia Risk Allocation Fund
Manager Discussion of Fund Performance (continued)
Looking Ahead
We currently expect 2013 overall to be marked by global economic growth. While we believe this growth will remain weak, we believe it may likely be a little better than seen in 2012, despite the drag from potential fiscal policy and debt issues in the U.S., Japan and the eurozone.
Unfortunately, the global economy appears to be stuck in neutral. With improved U.S. economic data, the U.S. financial markets overall have seen positive returns. We remain concerned, however, that such data remain inconsistent. The Federal Reserve's (the Fed's) accommodative monetary policy has supported the financial markets as a whole. Yet the sustainability of such a rally is a concern. There was hinting toward the end of the reporting period of a potential change in the Fed's bond-buying program, which could dramatically affect both the U.S. equity and fixed income markets. Timing of any future U.S. interest rate hikes could be critical to the success of the U.S. fixed income markets. Further, worries about higher income taxes, implementation of new health care laws and possible budget cuts may weigh on consumer confidence.
Most of Europe remained, at the end of the reporting period, in a recession, and prospects for economic growth ahead appeared restrained. We continue to see select European debt and currency strength, but we believe meaningful steps are still needed to improve the continent's balance sheet before we see any lasting long term sustainable strength.
China's ability to sustain high economic growth also remains a concern. That said, any re-acceleration of economic growth in China is anticipated to help both fiscal policy and debt issues arithmetically and is also likely, in our view, to have a disproportionate impact on investor confidence through much of the world.
We believed the primary question at the end of the reporting period was global central bank policy. With sluggish economic growth still expected in Europe, Japan and much of the Australia-Asia region, there is currently good reason to believe that central banks may continue to be accommodative. However, as signs of asset price inflation, especially in North America, begin to appear, there may be pressure on some central banks to begin tapering their accommodative policies. How the dynamic between anemic economic growth in some parts of the globe and asset price acceleration in other parts of the world plays out could be, we believe, a determining factor in asset performance, including the tendency of some sectors and countries to relatively outperform over the months ahead.
We also expect markets to focus on how effectively developing governments address their fiscal deficits. We believe these longer term policy choices will likely continue to contribute to market volatility. By diversifying similar amounts of the Fund's risk taking across equity, fixed income and inflation-sensitive assets, we believe this risk-balanced approach has the potential to deliver a more consistent pattern of returns than traditional asset allocation strategies across a variety of economic and market conditions. During the reporting period, equity markets outperformed other asset classes by a wide margin. While the Fund performed in line with our expectations during this period, we remind investors that, since our strategy purposefully avoids a disproportionate allocation of risk to equity markets relative to the traditional 60/40 balanced portfolio, returns from the Fund can be expected to be lower than more equity-focused investment strategies in such a market environment.
We continue to believe the Fund's approach can make it an attractive diversifier in the long term within portfolios maintaining a traditional 60/40 balanced allocation to both stocks and bonds.
Investment Risks
The Fund may invest in equity securities, fixed income securities and derivative instruments. The Fund may utilize significant amounts of leverage. Leveraging exposes the Fund to greater risks due to unanticipated market movements, which may magnify losses and increase volatility of returns. The Fund uses asset and risk allocation strategies, which may rely on fundamental and/or quantitative methods. There can be no assurance that these strategies and methods will be successful or enable to fund to achieve its objective and their use may cause the Fund to perform differently from the market as a whole. The Fund is non-diversified, and may be more exposed to the risks of loss and volatility than a fund that invests more broadly. The Fund may take short positions, primarily for hedging purposes. Short positions introduce more risk than long positions, and use of short sales in effect "leverages" the Fund. The Fund and certain underlying funds may invest in illiquid securities and there is a risk that the Fund or underlying funds may not be able to sell such securities at an opportune time without adversely affecting their price. The market value of securities may fluctuate, sometimes rapidly and unpredictably. Exposure to commodities and commodities markets may subject the Fund to greater volatility than investments in traditional securities. The use of derivatives introduces risks possibly greater than the risks associated with investing directly in the underlying the derivatives. A relatively small price movement in an underlying investment may result in a substantial gain or loss. Investments in foreign securities involve certain risks not associated with investments in U.S. companies, including political, regulatory, economic, social and other conditions or events occurring in the particular country, as well as fluctuations in its currency and the risks associated with less developed custody and settlement practices. Risks are particularly significant in emerging markets. There are risks associated with fixed income investments, including credit risk, interest rate risk, and prepayment and extension risk. Non-investment grade securities, commonly called "high-yield" or "junk" bonds, have more volatile prices and carry more risk to principal and income than investment grade securities. Additional risks associated with an investment in the Fund include but are not limited to convertible securities and frequent trading risk.
Annual Report 2013
5
Columbia Risk Allocation Fund
Understanding Your Fund's Expenses
(Unaudited)
As an investor, you incur two types of costs. There are transaction costs, which generally include sales charges on purchases and may include redemption fees. There are also ongoing costs, which generally include management fees, distribution and service (Rule 12b-1) fees, and other fund expenses. The following information is intended to help you understand your ongoing costs (in dollars) of investing in the Fund and to help you compare these costs with the ongoing costs of investing in other mutual funds.
Analyzing Your Fund's Expenses
To illustrate these ongoing costs, we have provided examples and calculated the expenses paid by investors in each share class of the Fund during the period. The actual and hypothetical information in the table is based on an initial investment of $1,000 at the beginning of the period indicated and held for the entire period. Expense information is calculated two ways and each method provides you with different information. The amount listed in the "Actual" column is calculated using the Fund's actual operating expenses and total return for the period. You may use the Actual information, together with the amount invested, to estimate the expenses that you paid over the period. Simply divide your account value by $1,000 (for example, an $8,600 account value divided by $1,000 = 8.6), then multiply the results by the expenses paid during the period under the Actual column. The amount listed in the "Hypothetical" column assumes a 5% annual rate of return before expenses (which is not the Fund's actual return) and then applies the Fund's actual expense ratio for the period to the hypothetical return. You should not use the hypothetical account values and expenses to estimate either your actual account balance at the end of the period or the expenses you paid during the period. See "Compare With Other Funds" below for details on how to use the hypothetical data.
Compare With Other Funds
Since all mutual funds are required to include the same hypothetical calculations about expenses in shareholder reports, you can use this information to compare the ongoing cost of investing in the Fund with other funds. To do so, compare the hypothetical example with the 5% hypothetical examples that appear in the shareholder reports of other funds. As you compare hypothetical examples of other funds, it is important to note that hypothetical examples are meant to highlight the ongoing costs of investing in a fund only and do not reflect any transaction costs, such as sales charges, or redemption or exchange fees. Therefore, the hypothetical calculations are useful in comparing ongoing costs only, and will not help you determine the relative total costs of owning different funds. If transaction costs were included in these calculations, your costs would be higher.
December 1, 2012 – May 31, 2013
| | Account Value at the
Beginning of the
Period ($) | | Account Value at
the End of the
Period ($) | | Expenses Paid During
the Period ($) | | Fund's
Annualized
Expense
Ratio (%) | | Effective Expenses
Paid During the
Period ($) | | Fund's
Effective
Annualized
Expense
Ratio (%) | |
| | Actual | | Hypothetical | | Actual | | Hypothetical | | Actual | | Hypothetical | | Actual | | Actual | | Hypothetical | | Actual | |
Class A | | | 1,000.00 | | | | 1,000.00 | | | | 950.20 | | | | 1,021.89 | | | | 2.97 | | | | 3.07 | | | | 0.61 | | | | 4.76 | | | | 4.94 | | | | 0.98 | | |
Class C | | | 1,000.00 | | | | 1,000.00 | | | | 946.30 | | | | 1,018.30 | | | | 6.45 | | | | 6.69 | | | | 1.33 | | | | 8.25 | | | | 8.55 | | | | 1.70 | | |
Class K | | | 1,000.00 | | | | 1,000.00 | | | | 950.10 | | | | 1,021.79 | | | | 3.06 | | | | 3.18 | | | | 0.63 | | | | 4.86 | | | | 5.04 | | | | 1.00 | | |
Class R | | | 1,000.00 | | | | 1,000.00 | | | | 948.90 | | | | 1,020.44 | | | | 4.37 | | | | 4.53 | | | | 0.90 | | | | 6.17 | | | | 6.40 | | | | 1.27 | | |
Class R5 | | | 1,000.00 | | | | 1,000.00 | | | | 950.50 | | | | 1,022.99 | | | | 1.90 | | | | 1.97 | | | | 0.39 | | | | 3.70 | | | | 3.83 | | | | 0.76 | | |
Class W | | | 1,000.00 | | | | 1,000.00 | | | | 949.40 | | | | 1,021.64 | | | | 3.21 | | | | 3.33 | | | | 0.66 | | | | 5.01 | | | | 5.19 | | | | 1.03 | | |
Class Z | | | 1,000.00 | | | | 1,000.00 | | | | 950.70 | | | | 1,023.09 | | | | 1.80 | | | | 1.87 | | | | 0.37 | | | | 3.60 | | | | 3.73 | | | | 0.74 | | |
Expenses paid during the period are equal to the Fund's annualized expense ratio for each class as indicated above, multiplied by the average account value over the period and then multiplied by the number of days in the Fund's most recent fiscal half year and divided by 365.
Effective expenses paid during the period and the Fund's effective annualized expense ratio include expenses borne directly to the class plus the Fund's pro rata portion of the ongoing expenses charged by the underlying funds using the expense ratio of each class of the underlying funds as of the underlying fund's most recent shareholder report.
Had Columbia Management Investment Advisers, LLC and/or certain of its affiliates not waived/reimbursed certain fees and expenses, account value at the end of the period would have been reduced.
Annual Report 2013
6
Columbia Risk Allocation Fund
Portfolio of Investments
May 31, 2013
(Percentages represent value of investments compared to net assets)
Equity Funds 13.1%
| | | Shares | | Value ($) | |
International 13.1% | |
Columbia Emerging Markets Fund,
Class I Shares(b) | | | 184,627 | | | | 1,920,123 | | |
Total Equity Funds
(Cost: $1,798,701) | | | | | 1,920,123 | | |
Alternative Investment Funds 28.3%
Central Fund of Canada Ltd.,
Class A Shares | | | 82,093 | | | | 1,310,204 | | |
Columbia Commodity Strategy Fund,
Class I Shares(a)(b) | | | 331,141 | | | | 2,844,500 | | |
Total Alternative Investment Funds
(Cost: $4,616,275) | | | | | 4,154,704 | | |
Exchange-Traded Funds 0.8%
| | | Shares | | Value ($) | |
PowerShares DB Gold Fund(a) | | | 2,708 | | | | 127,141 | | |
Total Exchange-Traded Funds
(Cost: $149,419) | | | | | 127,141 | | |
Money Market Funds 57.4%
Columbia Short-Term Cash Fund,
0.109%(b)(c) | | | 8,436,243 | | | | 8,436,243 | | |
Total Money Market Funds
(Cost: $8,436,243) | | | 8,436,243 | | |
Total Investments
(Cost: $15,000,638) | | | 14,638,211 | | |
Other Assets and Liabilities | | | 54,020 | | |
Net Assets | | | 14,692,231 | | |
Investments in Derivatives
Futures Contracts Outstanding at May 31, 2013
At May 31, 2013, $373,114 was held in a margin deposit account as collateral to cover initial margin requirements on open futures contracts.
Contract Description | | Number of
Contracts
Long (Short) | | Notional
Market
Value ($) | | Expiration
Date | | Unrealized
Appreciation ($) | | Unrealized
Depreciation ($) | |
Canadian Bond, 10-year | | | 12 | | | | 1,565,932 | | | September 2013 | | | — | | | | (7,095 | ) | |
E-Mini S&P 500 Index | | | 23 | | | | 1,873,350 | | | June 2013 | | | 113,568 | | | | — | | |
Euro Stoxx 50 | | | 16 | | | | 576,881 | | | June 2013 | | | 33,828 | | | | — | | |
Euro-Bund, 10-year | | | 17 | | | | 3,175,379 | | | June 2013 | | | — | | | | (509 | ) | |
FTSE 100 Index | | | 6 | | | | 599,266 | | | June 2013 | | | 20,387 | | | | — | | |
Japanese Government Bond, 10-year | | | 23 | | | | 3,263,342 | | | June 2013 | | | — | | | | (45,449 | ) | |
Tokyo Price Index | | | 5 | | | | 563,685 | | | June 2013 | | | 70,859 | | | | — | | |
United Kingdom Long GILT, 10-year | | | 8 | | | | 1,407,693 | | | September 2013 | | | — | | | | (8,235 | ) | |
U.S. Treasury Long Bond, 20-year | | | 27 | | | | 3,780,844 | | | September 2013 | | | — | | | | (19,460 | ) | |
Total | | | | | | | | | 238,642 | | | | (80,748 | ) | |
The accompanying Notes to Financial Statements are an integral part of this statement.
Annual Report 2013
7
Columbia Risk Allocation Fund
Portfolio of Investments (continued)
May 31, 2013
Interest Rate Swap Contracts Outstanding at May 31, 2013
Counterparty | | Floating
Rate Index | | Fund
Pay/Receive
Floating Rate | | Fixed
Rate (%) | | Expiration
Date | | Notional
Currency | | Notional
Amount | | Unrealized
Appreciation ($) | | Unrealized
Depreciation ($) | |
Wells Fargo
Bank | | 6-Month
AUD Bankbills | | Pay | | | 3.915 | | | May 8, 2025 | | AUD | | | | | 1,600,000 | | | | — | | | | (28,462 | ) | |
Wells Fargo
Bank | | 6-Month
EURIBOR | | Pay | | | 1.808 | | | May 9, 2025 | | EUR | | | | | 1,300,000 | | | | — | | | | (23,736 | ) | |
Wells Fargo
Bank | | 6-Month
JPY LIBOR | | Pay | | | 0.923 | | | May 9, 2025 | | JPY | | | | | 170,000,000 | | | | — | | | | (54,467 | ) | |
Wells Fargo
Bank | | 3-Month
USD LIBOR | | Pay | | | 2.928 | | | May 9, 2043 | | USD | | | | | 2,200,000 | | | | — | | | | (142,333 | ) | |
Total | | | | | | | | | | | | | | | — | | | | (248,998 | ) | |
Notes to Portfolio of Investments
(a) Non-income producing.
(b) As defined in the Investment Company Act of 1940, an affiliated company is one in which the Fund owns 5% or more of its outstanding voting securities, or a company which is under common ownership or control with the Fund. Holdings and transactions in these affiliated companies during the year ended May 31, 2013, are as follows:
Issuer | | Beginning
Cost ($) | | Purchase
Cost ($) | | Proceeds
From Sales ($) | | Realized
Gain (Loss) ($) | | Ending
Cost ($) | | Capital Gain
Distributions ($) | | Dividends —
Affiliated
Issuers ($) | | Value ($) | |
Columbia
Commodity
Strategy Fund,
Class I Shares | | | — | | | | 5,343,550 | | | | (2,419,000 | ) | | | 83,451 | | | | 3,008,001 | | | | — | | | | — | | | | 2,844,500 | | |
Columbia
Emerging
Markets Fund,
Class I Shares | | | — | | | | 3,368,866 | | | | (1,688,000 | ) | | | 117,835 | | | | 1,798,701 | | | | 64,658 | | | | 13,675 | | | | 1,920,123 | | |
Columbia
Short-Term
Cash Fund | | | 10,000,000 | | | | 14,512,128 | | | | (16,075,885 | ) | | | — | | | | 8,436,243 | | | | — | | | | 7,780 | | | | 8,436,243 | | |
Total | | | 10,000,000 | | | | 23,224,544 | | | | (20,182,885 | ) | | | 201,286 | | | | 13,242,945 | | | | 64,658 | | | | 21,455 | | | | 13,200,866 | | |
(c) The rate shown is the seven-day current annualized yield at May 31, 2013.
Fair Value Measurements
Generally accepted accounting principles (GAAP) require disclosure regarding the inputs and valuation techniques used to measure fair value and any changes in valuation inputs or techniques. In addition, investments shall be disclosed by major category.
The Fund categorizes its fair value measurements according to a three-level hierarchy that maximizes the use of observable inputs and minimizes the use of unobservable inputs by prioritizing that the most observable input be used when available. Observable inputs are those that market participants would use in pricing an investment based on market data obtained from sources independent of the reporting entity. Unobservable inputs are those that reflect the Fund's assumptions about the information market participants would use in pricing an investment. An investment's level within the fair value hierarchy is based on the lowest level of any input that is deemed significant to the asset or liability's fair value measurement. The input levels are not necessarily an indication of the risk or liquidity associated with investments at that level. For example, certain U.S. government securities are generally high quality and liquid, however, they are reflected as Level 2 because the inputs used to determine fair value may not always be quoted prices in an active market.
The accompanying Notes to Financial Statements are an integral part of this statement.
Annual Report 2013
8
Columbia Risk Allocation Fund
Portfolio of Investments (continued)
May 31, 2013
Fair Value Measurements (continued)
Fair value inputs are summarized in the three broad levels listed below:
> Level 1 — Valuations based on quoted prices for investments in active markets that the Fund has the ability to access at the measurement date (including NAV for open-end mutual funds). Valuation adjustments are not applied to Level 1 investments.
> Level 2 — Valuations based on other significant observable inputs (including quoted prices for similar securities, interest rates, prepayment speeds, credit risks, etc.).
> Level 3 — Valuations based on significant unobservable inputs (including the Fund's own assumptions and judgment in determining the fair value of investments).
Inputs that are used in determining fair value of an investment may include price information, credit data, volatility statistics, and other factors. These inputs can be either observable or unobservable. The availability of observable inputs can vary between investments, and is affected by various factors such as the type of investment, and the volume and level of activity for that investment or similar investments in the marketplace. The inputs will be considered by the Investment Manager, along with any other relevant factors in the calculation of an investment's fair value. The Fund uses prices and inputs that are current as of the measurement date, which may include periods of market dislocations. During these periods, the availability of prices and inputs may be reduced for many investments. This condition could cause an investment to be reclassified between the various levels within the hierarchy.
Investments falling into the Level 3 category are primarily supported by quoted prices from brokers and dealers participating in the market for those investments. However, these may be classified as Level 3 investments due to lack of market transparency and corroboration to support these quoted prices. Additionally, valuation models may be used as the pricing source for any remaining investments classified as Level 3. These models may rely on one or more significant unobservable inputs and/or significant assumptions by the Investment Manager. Inputs used in valuations may include, but are not limited to, financial statement analysis, capital account balances, discount rates and estimated cash flows, and comparable company data.
Under the direction of the Fund's Board of Trustees (the Board), the Investment Manager's Valuation Committee (the Committee) is responsible for carrying out the valuation procedures approved by the Board. The Committee consists of voting and non-voting members from various groups within the Investment Manager's organization, including operations and accounting, trading and investments, compliance, risk management and legal.
The Committee meets at least monthly to review and approve valuation matters, which may include a description of specific valuation determinations, data regarding pricing information received from approved pricing vendors and brokers and the results of Board-approved valuation control policies and procedures (the Policies). The Policies address, among other things, instances when market quotations are readily available, including recommendations of third party pricing vendors and a determination of appropriate pricing methodologies; events that require specific valuation determinations and assessment of fair value techniques; securities with a potential for stale pricing, including those that are illiquid, restricted, or in default; and the effectiveness of third-party pricing vendors, including periodic reviews of vendors. The Committee meets more frequently, as needed, to discuss additional valuation matters, which may include the need to review back-testing results, review time-sensitive information or approve related valuation actions. The Committee reports to the Board, with members of the Committee meeting with the Board at each of its regularly scheduled meetings to discuss valuation matters and actions during the period, similar to those described earlier.
For investments categorized as Level 3, the Committee monitors information similar to that described above, which may include: (i) data specific to the issuer or comparable issuers, (ii) general market or specific sector news and (iii) quoted prices and specific or similar security transactions. The Committee considers this data and any changes from prior periods in order to assess the reasonableness of observable and unobservable inputs, any assumptions or internal models used to value those securities and changes in fair value. This data is also used to corroborate, when available, information received from approved pricing vendors and brokers. Various factors impact the frequency of monitoring this information (which may occur as often as daily). However, the Committee may determine that changes to inputs, assumptions and models are not required as a result of the monitoring procedures performed.
The accompanying Notes to Financial Statements are an integral part of this statement.
Annual Report 2013
9
Columbia Risk Allocation Fund
Portfolio of Investments (continued)
May 31, 2013
Fair Value Measurements (continued)
The following table is a summary of the inputs used to value the Fund's investments at May 31, 2013:
| Description | | Level 1
Quoted Prices in Active
Markets for Identical
Assets ($) | | Level 2
Other Significant
Observable Inputs ($) | | Level 3
Significant
Unobservable Inputs ($) | | Total ($) | |
Mutual Funds | |
Equity Funds | | | 1,920,123 | | | | — | | | | — | | | | 1,920,123 | | |
Alternative Investment Funds | | | 4,154,704 | | | | — | | | | — | | | | 4,154,704 | | |
Total Mutual Funds | | | 6,074,827 | | | | — | | | | — | | | | 6,074,827 | | |
Equity Securities | |
Exchange-Traded Funds | | | 127,141 | | | | — | | | | — | | | | 127,141 | | |
Total Equity Securities | | | 127,141 | | | | — | | | | — | | | | 127,141 | | |
Other | |
Money Market Funds | | | 8,436,243 | | | | — | | | | — | | | | 8,436,243 | | |
Total Other | | | 8,436,243 | | | | — | | | | — | | | | 8,436,243 | | |
Investments in Securities | | | 14,638,211 | | | | — | | | | — | | | | 14,638,211 | | |
Derivatives | |
Assets | |
Futures Contracts | | | 238,642 | | | | — | | | | — | | | | 238,642 | | |
Liabilities | |
Futures Contracts | | | (80,748 | ) | | | — | | | | — | | | | (80,748 | ) | |
Swap Contracts | | | — | | | | (248,998 | ) | | | — | | | | (248,998 | ) | |
Total | | | 14,796,105 | | | | (248,998 | ) | | | — | | | | 14,547,107 | | |
See the Portfolio of Investments for all investment classifications not indicated in the table.
There were no transfers of financial assets between Levels 1 and 2 during the period.
Derivative instruments are valued at unrealized appreciation (depreciation).
The accompanying Notes to Financial Statements are an integral part of this statement.
Annual Report 2013
10
Columbia Risk Allocation Fund
Statement of Assets and Liabilities
May 31, 2013
Assets | |
Investments, at value | |
Unaffiliated issuers (identified cost $1,757,693) | | $ | 1,437,345 | | |
Affiliated issuers (identified cost $13,242,945) | | | 13,200,866 | | |
Total investments (identified cost $15,000,638) | | | 14,638,211 | | |
Margin deposits on futures contracts | | | 373,114 | | |
Receivable for: | |
Capital shares sold | | | 12,061 | | |
Dividends | | | 872 | | |
Expense reimbursement due from Investment Manager | | | 1,165 | | |
Prepaid expenses | | | 15 | | |
Trustees' deferred compensation plan | | | 1,392 | | |
Other assets | | | 7,942 | | |
Total assets | | | 15,034,772 | | |
Liabilities | |
Unrealized depreciation on swap contracts | | | 248,998 | | |
Payable for: | |
Variation margin on futures contracts | | | 53,412 | | |
Investment management fees | | | 191 | | |
Distribution and/or service fees | | | 95 | | |
Transfer agent fees | | | 295 | | |
Administration fees | | | 24 | | |
Chief compliance officer expenses | | | 2 | | |
Other expenses | | | 38,132 | | |
Trustees' deferred compensation plan | | | 1,392 | | |
Total liabilities | | | 342,541 | | |
Net assets applicable to outstanding capital stock | | $ | 14,692,231 | | |
Represented by | |
Paid-in capital | | $ | 14,841,921 | | |
Undistributed net investment income | | | 44,645 | | |
Accumulated net realized gain | | | 266,584 | | |
Unrealized appreciation (depreciation) on: | |
Investments | | | (362,427 | ) | |
Foreign currency translations | | | (7,388 | ) | |
Futures contracts | | | 157,894 | | |
Swap contracts | | | (248,998 | ) | |
Total — representing net assets applicable to outstanding capital stock | | $ | 14,692,231 | | |
The accompanying Notes to Financial Statements are an integral part of this statement.
Annual Report 2013
11
Columbia Risk Allocation Fund
Statement of Assets and Liabilities (continued)
May 31, 2013
Class A | |
Net assets | | $ | 8,139,010 | | |
Shares outstanding | | | 809,171 | | |
Net asset value per share | | $ | 10.06 | | |
Maximum offering price per share(a) | | $ | 10.67 | | |
Class C | |
Net assets | | $ | 1,387,104 | | |
Shares outstanding | | | 138,346 | | |
Net asset value per share | | $ | 10.03 | | |
Class K(b) | |
Net assets | | $ | 2,514 | | |
Shares outstanding | | | 250 | | |
Net asset value per share | | $ | 10.06 | | |
Class R | |
Net assets | | $ | 2,511 | | |
Shares outstanding | | | 250 | | |
Net asset value per share(c) | | $ | 10.05 | | |
Class R5 | |
Net assets | | $ | 2,517 | | |
Shares outstanding | | | 250 | | |
Net asset value per share | | $ | 10.07 | | |
Class W | |
Net assets | | $ | 2,514 | | |
Shares outstanding | | | 250 | | |
Net asset value per share | | $ | 10.06 | | |
Class Z | |
Net assets | | $ | 5,156,061 | | |
Shares outstanding | | | 512,088 | | |
Net asset value per share | | $ | 10.07 | | |
(a) The maximum offering price per share is calculated by dividing the net asset value by 1.0 minus the maximum sales charge of 5.75%.
(b) Effective October 25, 2012, Class R4 shares were renamed Class K shares.
(c) Net asset value per share rounds to this amount due to fractional shares outstanding.
The accompanying Notes to Financial Statements are an integral part of this statement.
Annual Report 2013
12
Columbia Risk Allocation Fund
Statement of Operations
Year Ended May 31, 2013(a)
Net investment income | |
Income: | |
Dividends — unaffiliated issuers | | $ | 718 | | |
Dividends — affiliated issuers | | | 21,455 | | |
Foreign taxes withheld | | | (108 | ) | |
Total income | | | 22,065 | | |
Expenses: | |
Investment management fees | | | 51,020 | | |
Distribution and/or service fees | |
Class A | | | 16,647 | | |
Class C | | | 6,280 | | |
Class R | | | 12 | | |
Class W | | | 6 | | |
Transfer agent fees | |
Class A | | | 1,180 | | |
Class C | | | 13 | | |
Class K(b) | | | 1 | | |
Class R | | | 1 | | |
Class R5 | | | 1 | | |
Class W | | | 1 | | |
Class Z | | | 1,020 | | |
Administration fees | | | 7,391 | | |
Plan administration fees | |
Class K(b) | | | 6 | | |
Compensation of board members | | | 13,972 | | |
Custodian fees | | | 20,859 | | |
Printing and postage fees | | | 13,900 | | |
Registration fees | | | 52,989 | | |
Professional fees | | | 32,908 | | |
Offering costs | | | 129,135 | | |
Chief compliance officer expenses | | | 9 | | |
Other | | | 10,095 | | |
Total expenses | | | 357,446 | | |
Fees waived or expenses reimbursed by Investment Manager and its affiliates | | | (291,148 | ) | |
Total net expenses | | | 66,298 | | |
Net investment loss | | | (44,233 | ) | |
Realized and unrealized gain (loss) — net | |
Net realized gain (loss) on: | |
Investments | | | 98,823 | | |
Capital gain distributions from underlying affiliated funds | | | 64,658 | | |
Foreign currency translations | | | (18,397 | ) | |
Futures contracts | | | 654,944 | | |
Swap contracts | | | 885 | | |
Net realized gain | | | 800,913 | | |
Net change in unrealized appreciation (depreciation) on: | |
Investments | | | (362,427 | ) | |
Foreign currency translations | | | (7,388 | ) | |
Futures contracts | | | 157,894 | | |
Swap contracts | | | (248,998 | ) | |
Net change in unrealized appreciation (depreciation) | | | (460,919 | ) | |
Net realized and unrealized gain | | | 339,994 | | |
Net increase in net assets resulting from operations | | $ | 295,761 | | |
(a) For the period from June 19, 2012 (commencement of operations) to May 31, 2013.
(b) Effective October 25, 2012, Class R4 shares were renamed Class K shares.
The accompanying Notes to Financial Statements are an integral part of this statement.
Annual Report 2013
13
Columbia Risk Allocation Fund
Statement of Changes in Net Assets
| | | Year Ended
May 31,
2013(a) | |
Operations | |
Net investment loss | | $ | (44,233 | ) | |
Net realized gain | | | 800,913 | | |
Net change in unrealized appreciation (depreciation) | | | (460,919 | ) | |
Net increase in net assets resulting from operations | | | 295,761 | | |
Distributions to shareholders | |
Net investment income | |
Class A | | | (92,647 | ) | |
Class C | | | (5,059 | ) | |
Class K(b) | | | (35 | ) | |
Class R | | | (31 | ) | |
Class R5 | | | (38 | ) | |
Class W | | | (35 | ) | |
Class Z | | | (77,174 | ) | |
Net realized gains | |
Class A | | | (151,405 | ) | |
Class C | | | (11,866 | ) | |
Class K(b) | | | (57 | ) | |
Class R | | | (57 | ) | |
Class R5 | | | (57 | ) | |
Class W | | | (57 | ) | |
Class Z | | | (114,400 | ) | |
Total distributions to shareholders | | | (452,918 | ) | |
Increase (decrease) in net assets from capital stock activity | | | 4,849,388 | | |
Total increase in net assets | | | 4,692,231 | | |
Net assets at beginning of year | | | 10,000,000 | | |
Net assets at end of year | | $ | 14,692,231 | | |
Undistributed net investment income | | $ | 44,645 | | |
(a) For the period from June 19, 2012 (commencement of operations) to May 31, 2013.
(b) Effective October 25, 2012, Class R4 shares were renamed Class K shares.
The accompanying Notes to Financial Statements are an integral part of this statement.
Annual Report 2013
14
Columbia Risk Allocation Fund
Statement of Changes in Net Assets (continued)
| | | Year Ended May 31,
2013(a) | |
| | | Shares | | Dollars ($) | |
Capital stock activity | |
Class A shares | |
Subscriptions | | | 338,036 | | | | 3,552,279 | | |
Distributions reinvested | | | 5,774 | | | | 60,283 | | |
Redemptions | | | (34,014 | ) | | | (356,482 | ) | |
Net increase | | | 309,796 | | | | 3,256,080 | | |
Class C shares | |
Subscriptions | | | 137,812 | | | | 1,455,041 | | |
Distributions reinvested | | | 1,613 | | | | 16,844 | | |
Redemptions | | | (1,329 | ) | | | (13,996 | ) | |
Net increase | | | 138,096 | | | | 1,457,889 | | |
Class Z shares | |
Subscriptions | | | 13,192 | | | | 140,629 | | |
Distributions reinvested | | | 63 | | | | 657 | | |
Redemptions | | | (542 | ) | | | (5,867 | ) | |
Net increase | | | 12,713 | | | | 135,419 | | |
Total net increase | | | 460,605 | | | | 4,849,388 | | |
(a) For the period from June 19, 2012 (commencement of operations) to May 31, 2013.
The accompanying Notes to Financial Statements are an integral part of this statement.
Annual Report 2013
15
Columbia Risk Allocation Fund
The following tables are intended to help you understand the Fund's financial performance. Certain information reflects financial results for a single share of a class held for the periods shown. Per share net investment income (loss) amounts are calculated based on average shares outstanding during the period. Total return assumes reinvestment of all dividends and distributions, if any. Total return does not reflect payment of sales charges, if any, and is not annualized for periods of less than one year.
Class A | | Year Ended
May 31,
2013(a) | |
Per share data | |
Net asset value, beginning of period | | $ | 10.00 | | |
Income from investment operations: | |
Net investment loss | | | (0.04 | ) | |
Net realized and unrealized gain | | | 0.47 | | |
Total from investment operations | | | 0.43 | | |
Less distributions to shareholders: | |
Net investment income | | | (0.14 | ) | |
Net realized gains | | | (0.23 | ) | |
Total distributions to shareholders | | | (0.37 | ) | |
Net asset value, end of period | | $ | 10.06 | | |
Total return | | | 4.15 | % | |
Ratios to average net assets(b) | |
Total gross expenses | | | 2.97 | %(c) | |
Total net expenses(d) | | | 0.60 | %(c) | |
Net investment loss | | | (0.42 | %)(c) | |
Supplemental data | |
Net assets, end of period (in thousands) | | $ | 8,139 | | |
Portfolio turnover | | | 76 | % | |
Notes to Financial Highlights
(a) For the period from June 19, 2012 (commencement of operations) to May 31, 2013.
(b) In addition to the fees and expenses which the Fund bears directly, the Fund indirectly bears a pro rata share of the fees and expenses of the acquired funds in which it invests. Such indirect expenses are not included in the reported expense ratios.
(c) Annualized.
(d) Total net expenses include the impact of certain waivers/reimbursements made by the Investment Manager and certain of its affiliates, if applicable.
The accompanying Notes to Financial Statements are an integral part of this statement.
Annual Report 2013
16
Columbia Risk Allocation Fund
Financial Highlights (continued)
Class C | | Year Ended
May 31,
2013(a) | |
Per share data | |
Net asset value, beginning of period | | $ | 10.00 | | |
Income from investment operations: | |
Net investment loss | | | (0.12 | ) | |
Net realized and unrealized gain | | | 0.48 | | |
Total from investment operations | | | 0.36 | | |
Less distributions to shareholders: | |
Net investment income | | | (0.10 | ) | |
Net realized gains | | | (0.23 | ) | |
Total distributions to shareholders | | | (0.33 | ) | |
Net asset value, end of period | | $ | 10.03 | | |
Total return | | | 3.43 | % | |
Ratios to average net assets(b) | |
Total gross expenses | | | 3.69 | %(c) | |
Total net expenses(d) | | | 1.33 | %(c) | |
Net investment loss | | | (1.19 | %)(c) | |
Supplemental data | |
Net assets, end of period (in thousands) | | $ | 1,387 | | |
Portfolio turnover | | | 76 | % | |
Notes to Financial Highlights
(a) For the period from June 19, 2012 (commencement of operations) to May 31, 2013.
(b) In addition to the fees and expenses which the Fund bears directly, the Fund indirectly bears a pro rata share of the fees and expenses of the acquired funds in which it invests. Such indirect expenses are not included in the reported expense ratios.
(c) Annualized.
(d) Total net expenses include the impact of certain waivers/reimbursements made by the Investment Manager and certain of its affiliates, if applicable.
The accompanying Notes to Financial Statements are an integral part of this statement.
Annual Report 2013
17
Columbia Risk Allocation Fund
Financial Highlights (continued)
Class K(a) | | Year Ended
May 31,
2013(b) | |
Per share data | |
Net asset value, beginning of period | | $ | 10.00 | | |
Income from investment operations: | |
Net investment loss | | | (0.04 | ) | |
Net realized and unrealized gain | | | 0.47 | | |
Total from investment operations | | | 0.43 | | |
Less distributions to shareholders: | |
Net investment income | | | (0.14 | ) | |
Net realized gains | | | (0.23 | ) | |
Total distributions to shareholders | | | (0.37 | ) | |
Net asset value, end of period | | $ | 10.06 | | |
Total return | | | 4.13 | % | |
Ratios to average net assets(c) | |
Total gross expenses | | | 2.90 | %(d) | |
Total net expenses(e) | | | 0.63 | %(d) | |
Net investment loss | | | (0.37 | %)(d) | |
Supplemental data | |
Net assets, end of period (in thousands) | | $ | 3 | | |
Portfolio turnover | | | 76 | % | |
Notes to Financial Highlights
(a) Effective October 25, 2012, Class R4 shares were renamed Class K shares.
(b) For the period from June 19, 2012 (commencement of operations) to May 31, 2013.
(c) In addition to the fees and expenses which the Fund bears directly, the Fund indirectly bears a pro rata share of the fees and expenses of the acquired funds in which it invests. Such indirect expenses are not included in the reported expense ratios.
(d) Annualized.
(e) Total net expenses include the impact of certain waivers/reimbursements made by the Investment Manager and certain of its affiliates, if applicable.
The accompanying Notes to Financial Statements are an integral part of this statement.
Annual Report 2013
18
Columbia Risk Allocation Fund
Financial Highlights (continued)
Class R | | Year Ended
May 31,
2013(a) | |
Per share data | |
Net asset value, beginning of period | | $ | 10.00 | | |
Income from investment operations: | |
Net investment loss | | | (0.07 | ) | |
Net realized and unrealized gain | | | 0.47 | | |
Total from investment operations | | | 0.40 | | |
Less distributions to shareholders: | |
Net investment income | | | (0.12 | ) | |
Net realized gains | | | (0.23 | ) | |
Total distributions to shareholders | | | (0.35 | ) | |
Net asset value, end of period | | $ | 10.05 | | |
Total return | | | 3.90 | % | |
Ratios to average net assets(b) | |
Total gross expenses | | | 3.14 | %(c) | |
Total net expenses(d) | | | 0.87 | %(c) | |
Net investment loss | | | (0.74 | %)(c) | |
Supplemental data | |
Net assets, end of period (in thousands) | | $ | 3 | | |
Portfolio turnover | | | 76 | % | |
Notes to Financial Highlights
(a) For the period from June 19, 2012 (commencement of operations) to May 31, 2013.
(b) In addition to the fees and expenses which the Fund bears directly, the Fund indirectly bears a pro rata share of the fees and expenses of the acquired funds in which it invests. Such indirect expenses are not included in the reported expense ratios.
(c) Annualized.
(d) Total net expenses include the impact of certain waivers/reimbursements made by the Investment Manager and certain of its affiliates, if applicable.
The accompanying Notes to Financial Statements are an integral part of this statement.
Annual Report 2013
19
Columbia Risk Allocation Fund
Financial Highlights (continued)
Class R5 | | Year Ended
May 31,
2013(a) | |
Per share data | |
Net asset value, beginning of period | | $ | 10.00 | | |
Income from investment operations: | |
Net investment loss | | | (0.03 | ) | |
Net realized and unrealized gain | | | 0.48 | | |
Total from investment operations | | | 0.45 | | |
Less distributions to shareholders: | |
Net investment income | | | (0.15 | ) | |
Net realized gains | | | (0.23 | ) | |
Total distributions to shareholders | | | (0.38 | ) | |
Net asset value, end of period | | $ | 10.07 | | |
Total return | | | 4.37 | % | |
Ratios to average net assets(b) | |
Total gross expenses | | | 2.66 | %(c) | |
Total net expenses(d) | | | 0.38 | %(c) | |
Net investment loss | | | (0.25 | %)(c) | |
Supplemental data | |
Net assets, end of period (in thousands) | | $ | 3 | | |
Portfolio turnover | | | 76 | % | |
Notes to Financial Highlights
(a) For the period from June 19, 2012 (commencement of operations) to May 31, 2013.
(b) In addition to the fees and expenses which the Fund bears directly, the Fund indirectly bears a pro rata share of the fees and expenses of the acquired funds in which it invests. Such indirect expenses are not included in the reported expense ratios.
(c) Annualized.
(d) Total net expenses include the impact of certain waivers/reimbursements made by the Investment Manager and certain of its affiliates, if applicable.
The accompanying Notes to Financial Statements are an integral part of this statement.
Annual Report 2013
20
Columbia Risk Allocation Fund
Financial Highlights (continued)
Class W | | Year Ended
May 31,
2013(a) | |
Per share data | |
Net asset value, beginning of period | | $ | 10.00 | | |
Income from investment operations: | |
Net investment loss | | | (0.04 | ) | |
Net realized and unrealized gain | | | 0.47 | | |
Total from investment operations | | | 0.43 | | |
Less distributions to shareholders: | |
Net investment income | | | (0.14 | ) | |
Net realized gains | | | (0.23 | ) | |
Total distributions to shareholders | | | (0.37 | ) | |
Net asset value, end of period | | $ | 10.06 | | |
Total return | | | 4.15 | % | |
Ratios to average net assets(b) | |
Total gross expenses | | | 2.90 | %(c) | |
Total net expenses(d) | | | 0.62 | %(c) | |
Net investment loss | | | (0.42 | %)(c) | |
Supplemental data | |
Net assets, end of period (in thousands) | | $ | 3 | | |
Portfolio turnover | | | 76 | % | |
Notes to Financial Highlights
(a) For the period from June 19, 2012 (commencement of operations) to May 31, 2013.
(b) In addition to the fees and expenses which the Fund bears directly, the Fund indirectly bears a pro rata share of the fees and expenses of the acquired funds in which it invests. Such indirect expenses are not included in the reported expense ratios.
(c) Annualized.
(d) Total net expenses include the impact of certain waivers/reimbursements made by the Investment Manager and certain of its affiliates, if applicable.
The accompanying Notes to Financial Statements are an integral part of this statement.
Annual Report 2013
21
Columbia Risk Allocation Fund
Financial Highlights (continued)
Class Z | | Year Ended
May 31,
2013(a) | |
Per share data | |
Net asset value, beginning of period | | $ | 10.00 | | |
Income from investment operations: | |
Net investment loss | | | (0.02 | ) | |
Net realized and unrealized gain | | | 0.47 | | |
Total from investment operations | | | 0.45 | | |
Less distributions to shareholders: | |
Net investment income | | | (0.15 | ) | |
Net realized gains | | | (0.23 | ) | |
Total distributions to shareholders | | | (0.38 | ) | |
Net asset value, end of period | | $ | 10.07 | | |
Total return | | | 4.39 | % | |
Ratios to average net assets(b) | |
Total gross expenses | | | 2.66 | %(c) | |
Total net expenses(d) | | | 0.35 | %(c) | |
Net investment loss | | | (0.17 | %)(c) | |
Supplemental data | |
Net assets, end of period (in thousands) | | $ | 5,156 | | |
Portfolio turnover | | | 76 | % | |
Notes to Financial Highlights
(a) For the period from June 19, 2012 (commencement of operations) to May 31, 2013.
(b) In addition to the fees and expenses which the Fund bears directly, the Fund indirectly bears a pro rata share of the fees and expenses of the acquired funds in which it invests. Such indirect expenses are not included in the reported expense ratios.
(c) Annualized.
(d) Total net expenses include the impact of certain waivers/reimbursements made by the Investment Manager and certain of its affiliates, if applicable.
The accompanying Notes to Financial Statements are an integral part of this statement.
Annual Report 2013
22
Columbia Risk Allocation Fund
Notes to Financial Statements
May 31, 2013
Note 1. Organization
Columbia Risk Allocation Fund (the Fund), a series of Columbia Funds Series Trust I (the Trust), is a non-diversified fund. The Trust is registered under the Investment Company Act of 1940, as amended (the 1940 Act), as an open-end management investment company organized as a Massachusetts business trust.
The Fund may invest significantly in Class I shares of mutual funds managed by Columbia Management Investment Advisers, LLC (the Investment Manager), a wholly-owned subsidiary of Ameriprise Financial, Inc. (Ameriprise Financial), or its affiliates (Columbia Funds), exchange-traded funds (ETFs) and third party-advised funds (collectively, Underlying Funds). The financial statements of the Underlying Funds in which the Fund invests should be read in conjunction with the Fund's financial statements. The Fund also invests significantly in derivatives.
On June 18, 2012, the Investment Manager, a wholly-owned subsidiary of Ameriprise Financial, invested $10,000,000 in the Fund (499,375 shares for Class A, 250 shares for Class C, 250 shares for Class K, 250 shares for Class R, 250 shares for Class R5, 250 shares for Class W and 499,375 shares for Class Z), which represented the initial capital for each class at $10.00 per share. Shares of the Fund were first offered to the public on June 21, 2012.
These financial statements cover the period from June 19, 2012 (commencement of operations) to May 31, 2013.
Fund Shares
The Trust may issue an unlimited number of shares (without par value). The Fund offers Class A, Class C, Class K, Class R, Class R5, Class W and Class Z shares. Although all share classes generally have identical voting, dividend and liquidation rights, each class votes separately when required by law. Different share classes pay different distribution amounts to the extent the expenses of such class differ, and distributions in liquidation will be proportional to the net asset value of each share class. Each share class has its own expense structure and sales charges, as applicable.
Class A shares are subject to a maximum front-end sales charge of 5.75% based on the initial investment amount. Class A shares purchased without an initial sales charge in accounts aggregating $1 million to $50 million at the time of purchase are subject to a contingent deferred sales charge (CDSC) if the shares are sold within 18 months of purchase, charged as follows: 1.00% CDSC if redeemed within 12 months of purchase, and 0.50% CDSC if redeemed more than 12, but less than 18, months after purchase.
Class C shares are subject to a 1.00% CDSC on shares redeemed within one year of purchase.
Class K shares (formerly Class R4 shares) are not subject to sales charges; however, this share class is closed to new investors. Effective October 25, 2012, Class R4 shares were renamed Class K shares.
Class R shares are not subject to sales charges and are available only to certain retirement plans and other eligible investors.
Class R5 shares are not subject to sales charges. Effective November 8, 2012, Class R5 shares are generally available only to investors purchasing through authorized investment professionals and omnibus retirement plans. Prior to November 8, 2012, Class R5 shares were closed to new investors.
Class W shares are not subject to sales charges and are available only to investors purchasing through authorized investment programs managed by investment professionals, including discretionary managed account programs.
Class Z shares are not subject to sales charges and are available only to certain investors.
Note 2. Summary of Significant Accounting Policies
Use of Estimates
The preparation of financial statements in accordance with U.S. generally accepted accounting principles (GAAP) requires management to make certain estimates and assumptions that affect the reported amounts of assets and liabilities, the disclosure of contingent assets and liabilities at the date of the financial statements and the reported amounts of revenue and expenses during the reporting period. Actual results could differ from those estimates.
The following is a summary of significant accounting policies consistently followed by the Fund in the preparation of its financial statements.
Security Valuation
All equity securities and exchange traded funds (ETFs) are valued at the close of business of the New York Stock Exchange (NYSE). Equity securities and ETFs are valued at the last quoted sales price on the principal exchange or market on which they trade, except for securities traded on the NASDAQ Stock Market, which are valued at the NASDAQ official close price. Unlisted securities or listed securities for which there were no sales during the day are valued at the mean of the latest quoted bid and ask prices on such exchanges or markets.
Annual Report 2013
23
Columbia Risk Allocation Fund
Notes to Financial Statements (continued)
May 31, 2013
Investments in the underlying funds are valued at the net asset value of each class of the respective underlying fund determined as of the close of the New York Stock Exchange on the valuation date.
Futures and options on futures contracts are valued based upon the settlement price established each day by the board of trade or exchange on which they are traded.
Swap transactions are valued through an independent pricing service or broker, or if neither is available, through an internal model based upon observable inputs.
Investments for which market quotations are not readily available, or that have quotations which management believes are not reliable, are valued at fair value as determined in good faith under consistently applied procedures established by and under the general supervision of the Board. If a security or class of securities (such as foreign securities) is valued at fair value, such value is likely to be different from the last quoted market price for the security.
The determination of fair value often requires significant judgment. To determine fair value, management may use assumptions including but not limited to future cash flows and estimated risk premiums. Multiple inputs from various sources may be used to determine fair value.
Foreign Currency Transactions and Translations
The values of all assets and liabilities denominated in foreign currencies are translated into U.S. dollars at that day's exchange rates. Net realized and unrealized gains (losses) on foreign currency transactions and translations include gains (losses) arising from the fluctuation in exchange rates between trade and settlement dates on securities transactions, gains (losses) arising from the disposition of foreign currency and currency gains (losses) between the accrual and payment dates on dividends, interest income and foreign withholding taxes.
For financial statement purposes, the Fund does not distinguish that portion of gains (losses) on investments which is due to changes in foreign exchange rates from that which is due to changes in market prices of the investments. Such fluctuations are included with the net realized and unrealized gains (losses) on investments in the Statement of Operations.
Derivative Instruments
The Fund invests in certain derivative instruments, as detailed below, to meet its investment objectives. Derivatives are instruments whose values depend on, or are derived from, in whole or in part, the value of one or more other assets, such as securities, currencies, commodities or indices. Derivative instruments may be used to maintain cash reserves while maintaining exposure to certain other assets, to offset anticipated declines in values of investments, to facilitate trading, to reduce transaction costs and to pursue higher
investment returns. The Fund may also use derivative instruments to mitigate certain investment risks, such as foreign currency exchange rate risk, interest rate risk and credit risk. Derivatives may involve various risks, including the potential inability of the counterparty to fulfill its obligation under the terms of the contract, the potential for an illiquid secondary market and the potential for market movements which may expose the Fund to gains or losses in excess of the amount shown in the Statement of Assets and Liabilities.
The Fund and any counterparty are required to maintain an agreement that requires the Fund and that counterparty to monitor (on a daily basis) the net fair value of all derivatives entered into pursuant to the agreement between the Fund and such counterparty. If the net fair value of such derivatives between the Fund and that counterparty exceeds a certain threshold (as defined in the agreement), the Fund or the counterparty (as the case may be) is required to post cash and/or securities as collateral. Fair values of derivatives presented in the financial statements are not netted with the fair value of other derivatives or with any collateral amounts posted by the Fund or any counterparty.
Futures Contracts
Futures contracts represent commitments for the future purchase or sale of an asset at a specified price on a specified date. The Fund bought and sold futures contracts to produce incremental earnings, manage the duration and yield curve exposure of the Fund versus the benchmark, manage exposure to movements in interest rates, manage exposure to the securities market, and maintain appropriate equity market exposure while keeping sufficient cash to accommodate daily redemptions. Upon entering into futures contracts, the Fund bears risks which may include interest rates, exchange rates or securities prices moving unexpectedly, in which case, the Fund may not achieve the anticipated benefits of the futures contracts and may realize a loss. Additional risks include counterparty credit risk, the possibility of an illiquid market, and that a change in the value of the contract or option may not correlate with changes in the value of the underlying asset.
Upon entering into a futures contract, the Fund pledges cash or securities with the broker in an amount sufficient to meet the initial margin requirement. Subsequent payments (variation margin) are made or received by the Fund each day. The variation margin payments are equal to the daily change in the contract value and are recorded as variation margin receivable or payable and are offset in unrealized gains or losses. The Fund recognizes a realized gain or loss when the contract is closed or expires. Futures contracts involve, to varying degrees, risk of loss in excess of the variation margin disclosed in the Statement of Assets and Liabilities.
Annual Report 2013
24
Columbia Risk Allocation Fund
Notes to Financial Statements (continued)
May 31, 2013
Interest Rate Swap Contracts
The Fund entered into interest rate swap transactions to produce incremental earnings, gain exposure to or protect itself from market rate changes, and to synthetically add or subtract principal exposure to a market. Interest rate swaps are agreements between two parties that involve the exchange of one type of interest rate for another type of interest rate cash flow on specified dates in the future, based on a predetermined, specified notional amount. Certain interest rate swaps are considered forward-starting, whereby the accrual for the exchange of cash flows does not begin until a specified date in the future (the effective date). The net cash flow for a standard interest rate swap transaction is generally the difference between a floating market interest rate versus a fixed interest rate.
Interest rate swaps are valued daily and unrealized appreciation (depreciation) is recorded. Certain interest rate swaps may accrue periodic interest on a daily basis as a component of unrealized appreciation (depreciation); the Fund will realize a gain or loss upon the payment or receipt of accrued interest. The Fund will realize a gain or a loss when the interest rate swap is terminated.
Risks of entering into interest rate swaps include a lack of correlation between the swaps and the portfolio of bonds the swaps are designed to hedge or replicate. A lack of correlation may cause the interest rate swaps to experience adverse changes in value relative to expectations. In addition, interest rate swaps are subject to the risk of default of a counterparty, and the risk of adverse movements in market interest rates relative to the interest rate swap positions taken. The Fund's maximum risk of loss from counterparty credit risk is the discounted net value of the cash flows to be received from/paid to the counterparty over the contract's remaining life to the extent that such amount is positive, plus the cost of entering into a similar transaction with another counterparty.
The Fund attempts to mitigate counterparty credit risk by entering into interest rate swap transactions only with counterparties that meet prescribed levels of creditworthiness, as determined by the Investment Manager. The Fund and any counterparty are required to maintain an agreement that requires the Fund and that counterparty to monitor (on a daily basis) the net market value of all derivative transactions entered into pursuant to the contract between the Fund and such counterparty. If the net market value of such derivatives transactions between the Fund and that counterparty exceeds a certain threshold (as defined in the agreement), the Fund or the counterparty is required to post cash and/or securities as collateral. Market values of derivatives transactions presented in the financial statements are not netted with the market
values of other derivatives transactions or with any collateral amounts posted by the Fund or any counterparty.
Effects of Derivative Transactions in the Financial Statements
The following tables are intended to provide additional information about the effect of derivatives on the financial statements of the Fund, including: the fair value of derivatives by risk category and the location of those fair values in the Statement of Assets and Liabilities; the impact of derivative transactions on the Fund's operations over the period including realized gains or losses and unrealized gains or losses. The derivative schedules following the Portfolio of Investments present additional information regarding derivative instruments outstanding at the end of the period, if any.
The following table is a summary of the fair value of derivative instruments at May 31, 2013:
Asset Derivatives | |
Risk Exposure
Category | | Statement of Assets and
Liabilities Location | | Fair Value ($) | |
Equity contracts | | Net assets — unrealized
appreciation on futures
contracts | | | 238,642 | * | |
Liability Derivatives | |
Risk Exposure
Category | | Statement of Assets and
Liabilities Location | | Fair Value ($) | |
Interest rate contracts | | Unrealized depreciation
on swap contracts | | | 248,998 | | |
Interest rate contracts | | Net assets — unrealized
depreciation on futures
contracts | | | 80,748 | * | |
Total | | | | | 329,746 | | |
*Includes cumulative appreciation (depreciation) of futures contracts as reported in the Futures Contracts Outstanding table following the Portfolio of Investments. Only the current day's variation margin is reported in receivables or payables in the Statement of Assets and Liabilities.
The following table indicates the effect of derivative instruments in the Statement of Operations for the period ended May 31, 2013:
Amount of Realized Gain (Loss) on Derivatives Recognized in Income | |
Risk Exposure
Category | | Futures
Contracts ($) | | Swap
Contracts ($) | | Total ($) | |
Equity contracts | | | 661,279 | | | | — | | | | 661,279 | | |
Interest rate contracts | | | (6,335 | ) | | | 885 | | | | (5,450 | ) | |
Total | | | 654,944 | | | | 885 | | | | 655,829 | | |
Annual Report 2013
25
Columbia Risk Allocation Fund
Notes to Financial Statements (continued)
May 31, 2013
Change in Unrealized Appreciation (Depreciation) on Derivatives Recognized in Income | |
Risk Exposure
Category | | Futures
Contracts ($) | | Swap
Contracts ($) | | Total ($) | |
Equity contracts | | | 238,642 | | | | — | | | | 238,642 | | |
Interest rate contracts | | | (80,748 | ) | | | (248,998 | ) | | | (329,746 | ) | |
Total | | | 157,894 | | | | (248,998 | ) | | | (91,104 | ) | |
The following table is a summary of the volume of derivative instruments for the period ended May 31, 2013:
Derivative Instrument | | Contracts Opened | |
Futures contracts | | | 686 | | |
Swap contracts | | | 16 | | |
Security Transactions
Security transactions are accounted for on the trade date. Cost is determined and gains (losses) are based upon the specific identification method for both financial statement and federal income tax purposes.
Income Recognition
Income and capital gain distributions from the underlying funds, if any, are recorded on the ex-dividend date.
The Fund may receive distributions from holdings in business development companies (BDCs), exchange traded funds (ETFs) and real estate investment trusts (REITs), which report information on the character of their distributions annually. These distributions are allocated to dividend income, capital gain and return of capital based on estimates made by the Fund's management if actual information has not yet been reported. Return of capital is recorded as a reduction of the cost basis of securities held. If the Fund no longer owns the applicable securities, return of capital is recorded as a realized gain. Management's estimates are subsequently adjusted when the actual character of the distributions is disclosed by the BDCs, ETFs and REITs, which could result in a proportionate change in return of capital to shareholders.
Expenses
General expenses of the Trust are allocated to the Fund and other funds of the Trust based upon relative net assets or other expense allocation methodologies determined by the nature of the expense. Expenses directly attributable to the Fund are charged to the Fund. Expenses directly attributable to a specific class of shares are charged to that share class.
Determination of Class Net Asset Value
All income, expenses (other than class-specific expenses, which are charged to that share class, as shown in the Statement of Operations) and realized and unrealized gains
(losses) are allocated to each class of the Fund on a daily basis, based on the relative net assets of each class, for purposes of determining the net asset value of each class.
Federal Income Tax Status
The Fund intends to qualify each year as a regulated investment company under Subchapter M of the Internal Revenue Code, as amended, and will distribute substantially all of its taxable income (including net short-term capital gains), if any, for its tax year, and as such will not be subject to federal income taxes. In addition, the Fund intends to distribute in each calendar year substantially all of its net investment income, capital gains and certain other amounts, if any, such that the Fund should not be subject to federal excise tax. Therefore, no federal income or excise tax provision is recorded.
Foreign Taxes
The Fund may be subject to foreign taxes on income, gains on investments or currency repatriation, a portion of which may be recoverable. The Fund will accrue such taxes and recoveries, as applicable, based upon its current interpretation of tax rules and regulations that exist in the markets in which it invests.
Realized gains in certain countries may be subject to foreign taxes at the Fund level, based on statutory rates. The Fund accrues for such foreign taxes on net realized and unrealized gains at the appropriate rate for each jurisdiction, as applicable. The amount, if any, is disclosed as a liability on the Statement of Assets and Liabilities.
Distributions to Shareholders
Distributions from net investment income, if any, are declared and paid annually. Net realized capital gains, if any, are distributed along with the income distribution. Income distributions and capital gain distributions are determined in accordance with federal income tax regulations, which may differ from GAAP.
Guarantees and Indemnifications
Under the Trust's organizational documents and, in some cases, by contract, its officers and trustees are indemnified against certain liabilities arising out of the performance of their duties to the Trust or its funds. In addition, certain of the Fund's contracts with its service providers contain general indemnification clauses. The Fund's maximum exposure under these arrangements is unknown since the amount of any future claims that may be made against the Fund cannot be determined, and the Fund has no historical basis for predicting the likelihood of any such claims.
Annual Report 2013
26
Columbia Risk Allocation Fund
Notes to Financial Statements (continued)
May 31, 2013
Recent Accounting Pronouncement
Disclosures about Offsetting Assets and Liabilities
In December 2011, the Financial Accounting Standards Board (FASB) issued Accounting Standards Update (ASU) No. 2011-11, Disclosures about Offsetting Assets and Liabilities and in January 2013, ASU No. 2013-1, Clarifying the Scope of Disclosures about Offsetting Assets and Liabilities (collectively, the ASUs). Specifically, the ASUs require an entity to disclose both gross and net information for derivatives and other financial instruments that are subject to a master netting arrangement or similar agreement. The ASUs require disclosure of collateral received in connection with the master netting agreements or similar agreements. The disclosure requirements are effective for interim and annual periods beginning on or after January 1, 2013. At this time, management is evaluating the implications of this guidance and the impact it will have on the financial statement amounts and footnote disclosures, if any.
Note 3. Fees and Compensation Paid to Affiliates
Investment Management Fees
Under an Investment Management Services Agreement, the Investment Manager determines which securities will be purchased, held or sold. The investment management fee is an annual fee that is a blend of (i) 0.00% on assets invested in affiliated mutual funds, ETFs and closed-end funds that pay an investment advisory fee to the Investment Manager, (ii) 0.10% on assets invested in ETFs and mutual funds that are not managed by the Investment Manager or its affiliates and (iii) an advisory fee that declines from 0.70% to 0.60%, depending on asset levels, on assets invested in securities, instruments and other assets not described above, including affiliated mutual funds, ETFs and closed-end funds advised by the Investment Manager that do not pay an investment advisory fee, third party closed-end funds, derivatives and individual securities. The annualized effective investment management fee rate for the period ended May 31, 2013 was 0.41% of the Fund's average daily net assets.
Administration Fees
Under an Administrative Services Agreement, the Investment Manager also serves as the Fund Administrator. The Fund pays the Fund Administrator an annual fee for administration and accounting services equal to a percentage of the Fund's average daily net assets that declines from 0.06% to 0.03% as the Fund's net assets increase. The annualized effective administration fee rate for the period ended May 31, 2013 was 0.06% of the Fund's average daily net assets.
Other Expenses
Other expenses are for, among other things, certain expenses of the Fund or the Board, including: Fund boardroom and office expense, employee compensation, employee health and retirement benefits, and certain other expenses. Payment of these Fund and Board expenses is facilitated by a company providing limited administrative services to the Fund and the Board.
For the period ended May 31, 2013, there were no expenses incurred for these particular items.
Offering Costs
Offering costs were incurred prior to the shares of the Fund being offered. Offering costs include, among other things, state registration filing fees and printing costs. The Fund amortizes offering costs over a period of 12 months from the commencement of operations.
Compensation of Board Members
Board members are compensated for their services to the Fund as disclosed in the Statement of Operations. The Trust's eligible Trustees may participate in a Deferred Compensation Plan (the Plan) which may be terminated at any time. Obligations of the Plan will be paid solely out of the Fund's assets.
Compensation of Chief Compliance Officer
The Board has appointed a Chief Compliance Officer to the Fund in accordance with federal securities regulations. The Fund pays its pro-rata share of the expenses associated with the Chief Compliance Officer. The Fund's expenses for the Chief Compliance Officer will not exceed $15,000 per year.
Transfer Agent Fees
Under a Transfer and Dividend Disbursing Agent Agreement, Columbia Management Investment Services Corp. (the Transfer Agent), an affiliate of the Investment Manager and a wholly-owned subsidiary of Ameriprise Financial, is responsible for providing transfer agency services to the Fund. The Transfer Agent has contracted with Boston Financial Data Services (BFDS) to serve as sub-transfer agent.
The Transfer Agent receives monthly account-based service fees based on the number of open accounts and also receives sub-transfer agency fees based on a percentage of the average aggregate value of the Fund's shares maintained in omnibus accounts (other than omnibus accounts for which American Enterprise Investment Services Inc. is the broker of record or accounts where the beneficial shareholder is a customer of Ameriprise Financial Services, Inc., which are paid a per
Annual Report 2013
27
Columbia Risk Allocation Fund
Notes to Financial Statements (continued)
May 31, 2013
account fee). The Transfer Agent pays the fees of BFDS for services as sub-transfer agent and is not entitled to reimbursement for such fees from the Fund (with the exception of out-of-pocket fees).
The Transfer Agent also receives compensation from fees for various shareholder services and reimbursements for certain out-of-pocket fees. Total transfer agent fees for Class K and Class R5 shares are subject to an annual limitation of not more than 0.05% of the average daily net assets attributable to each share class.
For the period ended May 31, 2013, the Fund's annualized effective transfer agent fee rates as a percentage of average daily net assets of each class were as follows:
Class A | | | 0.02 | % | |
Class C | | | 0.00 | * | |
Class K | | | 0.05 | | |
Class R | | | 0.04 | | |
Class R5 | | | 0.05 | | |
Class W | | | 0.04 | | |
Class Z | | | 0.02 | | |
*Rounds to zero.
An annual minimum account balance fee of $20 may apply to certain accounts with a value below the Fund's initial minimum investment requirements to reduce the impact of small accounts on transfer agent fees. These minimum account balance fees are recorded as part of expense reductions in the Statement of Operations. For the period ended May 31, 2013, no minimum account balance fees were charged by the Fund.
Plan Administration Fees
Under a Plan Administration Services Agreement with the Transfer Agent, the Fund pays an annual fee at a rate of 0.25% of the Fund's average daily net assets attributable to Class K shares for the provision of various administrative, recordkeeping, communication and educational services.
Distribution and Service Fees
The Fund has an agreement with Columbia Management Investment Distributors, Inc. (the Distributor), an affiliate of the Investment Manager and a wholly-owned subsidiary of Ameriprise Financial, for distribution and shareholder services. Pursuant to Rule 12b-1 under the 1940 Act, the Board has approved, and the Fund has adopted, distribution and shareholder service plans (the Plans) which set the distribution and service fees for the Fund. These fees are calculated daily and are intended to compensate the Distributor and/or eligible selling and/or servicing agents for selling shares of the Fund and providing services to investors.
The Plans require the payment of a monthly service fee to the Distributor at the maximum annual rate of 0.25% of the average daily net assets attributable to Class A, Class C and Class W shares of the Fund. The Plans also require the payment of a monthly distribution fee to the Distributor at the maximum annual rates of 0.10%, 0.75%, 0.50% and 0.25% of the average daily net assets attributable to Class A, Class C, Class R, and Class W shares, respectively.
The Fund may pay distribution and service fees up to a maximum annual rate of 0.35% of the Fund's average daily net assets attributable to Class A shares (comprised of up to 0.10% for distribution services and up to 0.25% for shareholder liaison services), but currently limit such fees to an aggregate fee of not more than 0.25% of the Fund's average daily net assets attributable to Class A shares.
The Fund may pay a distribution fee up to 0.25% of the Fund's average daily net assets attributable to Class W shares and a service fee of up to 0.25% of the Fund's average daily net assets attributable to Class W shares, provided, however, that the aggregate fee shall not exceed 0.25% of the Fund's average daily net assets attributable to Class W shares.
Sales Charges
Sales charges, including front-end charges and CDSCs, received by the Distributor for distributing Fund shares were $28,521 for Class A for the period ended May 31, 2013.
Expenses Waived/Reimbursed by the Investment Manager and its Affiliates
The Investment Manager and certain of its affiliates have contractually agreed to waive fees and/or reimburse expenses (excluding certain fees and expenses described below), for the period disclosed below, unless sooner terminated at the sole discretion of the Board, so that the Fund's net operating expenses, after giving effect to fees waived/expenses reimbursed and any balance credits and/or overdraft charges from the Fund's custodian, do not exceed the following annual rates as a percentage of the class' average daily net assets:
| | Fee Rates Contractual
through
September 30, 2014 | |
Class A | | | 0.75 | % | |
Class C | | | 1.50 | | |
Class K | | | 0.63 | | |
Class R | | | 1.00 | | |
Class R5 | | | 0.38 | | |
Class W | | | 0.75 | | |
Class Z | | | 0.50 | | |
Annual Report 2013
28
Columbia Risk Allocation Fund
Notes to Financial Statements (continued)
May 31, 2013
Under the agreement, the following fees and expenses are excluded from the waiver/reimbursement commitment, and therefore will be paid by the Fund, if applicable: taxes (including foreign transaction taxes), expenses associated with investments in affiliated and non-affiliated pooled investment vehicles (including mutual funds and exchange traded funds), transaction costs and brokerage commissions, costs related to any securities lending program, dividend expenses associated with securities sold short, inverse floater program fees and expenses, transaction charges and interest on borrowed money, interest, extraordinary expenses and any other expenses the exclusion of which is specifically approved by the Board. This agreement may be modified or amended only with approval from all parties.
Note 4. Federal Tax Information
The timing and character of income and capital gain distributions are determined in accordance with income tax regulations, which may differ from GAAP because of temporary or permanent book to tax differences.
At May 31, 2013, these differences are primarily due to differing treatment for deferral/reversal of wash sales losses, Trustees' deferred compensation, passive foreign investment company (PFIC) holdings, foreign currency transactions, partnerships, non-deductible organizational costs and derivative investments. To the extent these differences are permanent, reclassifications are made among the components of the Fund's net assets in the Statement of Assets and Liabilities. Temporary differences do not require reclassifications. In the Statement of Assets and Liabilities the following reclassifications were made:
Undistributed net investment income | | $ | 263,897 | | |
Accumulated net realized gain | | | (256,430 | ) | |
Paid-in capital | | | (7,467 | ) | |
Net investment income and net realized gains (losses), as disclosed in the Statement of Operations, and net assets were not affected by this reclassification.
The tax character of distributions paid during the years indicated was as follows:
Period Ended May 31 | | 2013 | |
Ordinary income | | $ | 347,321 | | |
Long-term capital gains | | | 105,597 | | |
Total | | | 452,918 | | |
Short-term capital gain distributions, if any, are considered ordinary income distributions for tax purposes.
At May 31, 2013, the components of distributable earnings on a tax basis were as follows:
Undistributed ordinary income | | $ | 329,880 | | |
Undistributed long-term gain | | | 286,591 | | |
Unrealized depreciation | | | (473,938 | ) | |
At May 31, 2013, the cost of investments for federal income tax purposes was $15,112,149 and the aggregate gross unrealized appreciation and depreciation based on that cost was:
Unrealized appreciation | | $ | 121,421 | | |
Unrealized depreciation | | | (595,359 | ) | |
Net unrealized depreciation | | $ | (473,938 | ) | |
Management of the Fund has concluded that there are no significant uncertain tax positions that would require recognition in the financial statements. However, management's conclusion may be subject to review and adjustment at a later date based on factors including, but not limited to, new tax laws, regulations, and administrative interpretations (including relevant court decisions). Generally, the Fund's federal tax returns for the prior three fiscal years remain subject to examination by the Internal Revenue Service.
Note 5. Portfolio Information
The cost of purchases and proceeds from sales of securities, excluding short-term obligations, aggregated to $11,665,122 and $5,199,550, respectively, for the period ended May 31, 2013.
Note 6. Affiliated Money Market Fund
The Fund significantly invests in Columbia Short-Term Cash Fund, an affiliated money market fund established for the exclusive use by the Fund and other affiliated funds. The income earned by the Fund from such investments is included as "Dividends — affiliated issuers" in the Statement of Operations. As an investing fund, the Fund indirectly bears its proportionate share of the expenses of Columbia Short-Term Cash Fund.
Note 7. Shareholder Concentration
At May 31, 2013, affiliated shareholder accounts owned 95.0% of the outstanding shares of the Fund. Subscription and redemption activity by concentrated accounts may have a significant effect on the operations of the Fund.
Annual Report 2013
29
Columbia Risk Allocation Fund
Notes to Financial Statements (continued)
May 31, 2013
Note 8. Line of Credit
The Fund has entered into a revolving credit facility with a syndicate of banks led by JPMorgan Chase Bank N.A. whereby the Fund may borrow for the temporary funding of shareholder redemptions or for other temporary or emergency purposes. The credit facility agreement, as amended, which is a collective agreement between the Fund and certain other funds managed by the Investment Manager, severally and not jointly, permits collective borrowings up to $500 million. Interest is charged to each participating fund based on its borrowings at a rate equal to the higher of (i) the overnight federal funds rate plus 1.00% or (ii) the one-month LIBOR rate plus 1.00%. Each borrowing under the credit facility matures no later than 60 days after the date of borrowing. The Fund also pays a commitment fee equal to its pro rata share of the amount of the credit facility at a rate of 0.08% per annum.
The Fund had no borrowings during the period ended May 31, 2013.
Note 9. Significant Risks
Non-Diversification Risk
A non-diversified fund is permitted to invest a greater percentage of its total assets in fewer issuers than a diversified fund. The Fund may, therefore, have a greater risk of loss from a few issuers than a similar fund that invests more broadly.
Commodity-related Investment Risk
The value of commodities investments will generally be affected by overall market movements and factors specific to a particular industry or commodity, which may include demand for the commodity, weather, embargoes, tariffs, and economic health, political, international, regulatory and other developments. Commodities investments may also subject the Fund to counterparty risk and liquidity risk. The Fund invests in an underlying fund that makes commodity-related investments through a wholly owned subsidiary organized outside the U.S. that is generally not subject to U.S. laws (including securities laws) and their protections.
Leverage Risk
Leverage occurs when the Fund increases its assets available for investment using borrowings, short sales, derivatives, or similar instruments or techniques. The use of leverage may make any change in the Fund's net asset value (NAV) even greater and thus result in increased volatility of returns. Because short sales involve borrowing securities and then selling them, the Fund's short sales effectively leverage the Fund's assets. The Fund's assets that are used as collateral to secure the Fund's obligations to return the securities sold short
may decrease in value while the short positions are outstanding, which may force the Fund to use its other assets to increase the collateral. Leverage can create an interest expense that may lower the Fund's overall returns. Leverage presents the opportunity for increased net income and capital gains, but also exaggerates the Fund's risk of loss. There can be no guarantee that a leveraging strategy will be successful.
Derivatives Risk
Losses involving derivative instruments may be substantial, because a relatively small price movement in the underlying security(ies) instrument, commodity, currency or index may result in a substantial loss for the Fund. In addition to the potential for increased losses, the use of derivative instruments may lead to increased volatility within the Fund. Derivatives will typically increase the Fund's exposure to principal risks to which it is otherwise exposed, and may expose the Fund to additional risks, including correlation risk, counterparty risk, hedging risk, leverage risk and liquidity risk.
Note 10. Subsequent Events
Management has evaluated the events and transactions that have occurred through the date the financial statements were issued and noted no items requiring adjustment of the financial statements or additional disclosure.
Note 11. Information Regarding Pending and Settled Legal Proceedings
In December 2005, without admitting or denying the allegations, American Express Financial Corporation (AEFC, which is now known as Ameriprise Financial, Inc. (Ameriprise Financial)) entered into settlement agreements with the Securities and Exchange Commission (SEC) and Minnesota Department of Commerce (MDOC) related to market timing activities. As a result, AEFC was censured and ordered to cease and desist from committing or causing any violations of certain provisions of the Investment Advisers Act of 1940, the Investment Company Act of 1940, and various Minnesota laws. AEFC agreed to pay disgorgement of $10 million and civil money penalties of $7 million. AEFC also agreed to retain an independent distribution consultant to assist in developing a plan for distribution of all disgorgement and civil penalties ordered by the SEC in accordance with various undertakings detailed at www.sec.gov/litigation/admin/ia-2451.pdf. Ameriprise Financial and its affiliates have cooperated with the SEC and the MDOC in these legal proceedings, and have made regular reports to the funds' Boards of Trustees.
Ameriprise Financial and certain of its affiliates have historically been involved in a number of legal, arbitration and regulatory proceedings, including routine litigation, class
Annual Report 2013
30
Columbia Risk Allocation Fund
Notes to Financial Statements (continued)
May 31, 2013
actions, and governmental actions, concerning matters arising in connection with the conduct of their business activities. Ameriprise Financial believes that the Funds are not currently the subject of, and that neither Ameriprise Financial nor any of its affiliates are the subject of, any pending legal, arbitration or regulatory proceedings that are likely to have a material adverse effect on the Funds or the ability of Ameriprise Financial or its affiliates to perform under their contracts with the Funds. Ameriprise Financial is required to make 10-Q, 10-K and, as necessary, 8-K filings with the Securities and Exchange Commission on legal and regulatory matters that relate to Ameriprise Financial and its affiliates. Copies of these filings may be obtained by accessing the SEC website at www.sec.gov.
There can be no assurance that these matters, or the adverse publicity associated with them, will not result in increased fund redemptions, reduced sale of fund shares or other adverse consequences to the Funds. Further, although we believe proceedings are not likely to have a material adverse effect on the Funds or the ability of Ameriprise Financial or its affiliates to perform under their contracts with the Funds, these proceedings are subject to uncertainties and, as such, we are unable to estimate the possible loss or range of loss that may result. An adverse outcome in one or more of these proceedings could result in adverse judgments, settlements, fines, penalties or other relief that could have a material adverse effect on the consolidated financial condition or results of operations of Ameriprise Financial.
Annual Report 2013
31
Columbia Risk Allocation Fund
Report of Independent Registered Public Accounting Firm
To the Trustees of Columbia Funds Series Trust I and the Shareholders of
Columbia Risk Allocation Fund
In our opinion, the accompanying statement of assets and liabilities, including the portfolio of investments, and the related statements of operations and of changes in net assets and the financial highlights present fairly, in all material respects, the financial position of Columbia Risk Allocation Fund (the "Fund") (a series of Columbia Funds Series Trust I) at May 31 2013, the results of its operations, the changes in its net assets and the financial highlights for the period then ended, in conformity with accounting principles generally accepted in the United States of America. These financial statements and financial highlights (hereafter referred to as "financial statements") are the responsibility of the Fund's management. Our responsibility is to express an opinion on these financial statements based on our audit. We conducted our audit of these financial statements in accordance with the standards of the Public Company Accounting Oversight Board (United States). Those standards require that we plan and perform the audit to obtain reasonable assurance about whether the financial statements are free of material misstatement. An audit includes examining, on a test basis, evidence supporting the amounts and disclosures in the financial statements, assessing the accounting principles used and significant estimates made by management, and evaluating the overall financial statement presentation. We believe that our audit, which included confirmation of securities at May 31, 2013 by correspondence with the custodian, transfer agent and brokers, provides a reasonable basis for our opinion.
PricewaterhouseCoopers LLP
Minneapolis, Minnesota
July 24, 2013
Annual Report 2013
32
Columbia Risk Allocation Fund
Federal Income Tax Information
(Unaudited)
The Fund hereby designates the following tax attributes for the fiscal year ended May 31, 2013. Shareholders will be notified in early 2014 of the amounts for use in preparing 2013 income tax returns.
Tax Designations
Qualified Dividend Income | | | 3.02 | % | |
Dividends Received Deduction | | | 0.13 | % | |
Capital Gain Dividend | | $ | 411,797 | | |
Qualified Dividend Income. For taxable, non-corporate shareholders, the percentage of ordinary income dividends paid during the fiscal year that represents qualified dividend income subject to reduced tax rates.
Dividends Received Deduction. The percentage of ordinary income dividends paid during the fiscal year that qualifies for the corporate dividends received deduction.
Capital Gain Dividend. The Fund designates as a capital gain dividend the amount reflected above, or if subsequently determined to be different, the net capital gain of such fiscal period.
Annual Report 2013
33
Columbia Risk Allocation Fund
The Trustees serve terms of indefinite duration. The names, addresses and birth years of the Trustees and Officers of the Funds in Columbia Funds Series Trust I, the year each was first elected or appointed to office, their principal business occupations during at least the last five years, the number of Funds overseen by each Trustee and other directorships they hold are shown below. Each officer listed below serves as an officer of each Fund in Columbia Funds Series Trust I.
Independent Trustees
Name, Address and Year of Birth,
Position with Funds, Year First
Elected or Appointed to Office | | Principal Occupation(s) During Past Five Years, Number of Funds in Columbia
Funds Complex Overseen by Trustee, Other Directorships Held | |
Rodman L. Drake (Born 1943)
c/o Columbia Management
Investment Advisers, LLC
225 Franklin Street
Boston, MA 02110
Trustee (since 1994) and
Chairman of the Board (since 2009) | | Independent consultant since 2010; Co-Founder of Baringo Capital LLC (private equity) from 1997 to 2008; Chairman (from 2003 to 2010) and CEO (from 2008 to 2010) of Crystal River Capital, Inc. (real estate investment trust); Oversees 52; Jackson Hewitt Tax Service Inc. (tax preparation services) from 2004 to 2011; Student Loan Corporation (student loan provider) from 2005 to 2010; Celgene Corporation (global biotechnology company); The Helios Funds and Brookfield Funds (closed-end funds); Crystal River Capital, Inc. from 2005 to 2010; Parsons Brinckerhoff from 1995 to 2008; and Apex Silver Mines Ltd. from 2007 to 2009 | |
Douglas A. Hacker (Born 1955)
c/o Columbia Management
Investment Advisers, LLC
225 Franklin Street
Boston, MA 02110
Trustee (since 1996) | | Independent business executive since May 2006; Executive Vice President — Strategy of United Airlines from December 2002 to May 2006; President of UAL Loyalty Services (airline marketing company) from September 2001 to December 2002; Executive Vice President and Chief Financial Officer of United Airlines from July 1999 to September 2001. Oversees 52; Nash Finch Company (food distributor); Aircastle Limited (aircraft leasing); and SeaCube Container Leasing Ltd. (container leasing) | |
Janet Langford Kelly (Born 1957)
c/o Columbia Management
Investment Advisers, LLC
225 Franklin Street
Boston, MA 02110
Trustee (since 1996) | | Senior Vice President, General Counsel and Corporate Secretary, ConocoPhillips (integrated energy company) since September 2007; Deputy General Counsel — Corporate Legal Services, ConocoPhillips from August 2006 to August 2007; Partner, Zelle, Hofmann, Voelbel, Mason & Gette LLP (law firm) from March 2005 to July 2006; Adjunct Professor of Law, Northwestern University from September 2004 to June 2006; Director, UAL Corporation (airline) from February 2006 to July 2006; Chief Administrative Officer and Senior Vice President, Kmart Holding Corporation (consumer goods) from September 2003 to March 2004. Oversees 52; None | |
Nancy T. Lukitsh (Born 1956)
c/o Columbia Management
Investment Advisers, LLC
225 Franklin Street
Boston, MA 02110
Trustee (since 2011) | | Senior Vice President, Partner and Director of Marketing, Wellington Management Company, LLP (investment adviser) from 1997 to 2010; Chair, Wellington Management Investment Portfolios (commingled non-U.S. investment pools) from 2007 to 2010; Director, Wellington Trust Company, NA and other Wellington affiliates from 1997 to 2010. Oversees 52; None | |
William E. Mayer (Born 1940)
c/o Columbia Management
Investment Advisers, LLC
225 Franklin Street
Boston, MA 02110
Trustee (since 1994) | | Partner, Park Avenue Equity Partners (private equity) since February 1999; Dean and Professor, College of Business and Management, University of Maryland from 1992 to 1996. Oversees 52; DynaVox Inc. (speech creation); Lee Enterprises (print media); WR Hambrecht + Co. (financial service provider) from 2000 to 2012; BlackRock Kelso Capital Corporation (investment company) | |
David M. Moffett (Born 1952)
c/o Columbia Management
Investment Advisers, LLC
225 Franklin Street
Boston, MA 02110
Trustee (since 2011) | | Retired. Chief Executive Officer, Federal Home Loan Mortgage Corporation, from 2008 to 2009; Senior Adviser, Global Financial Services Group, Carlyle Group, Inc., from 2007 to 2008; Vice Chairman and Chief Financial Officer, U.S. Bancorp, from 1993 to 2007. Oversees 52; CIT Group Inc. (commercial and consumer finance); eBay Inc. (online trading community); MBIA Inc. (financial service provider); E.W. Scripps Co. (print and television media), Building Materials Holding Corp. (building materials and construction services); Genworth Financial, Inc. (financial and insurance products and services); and University of Oklahoma Foundation. | |
Charles R. Nelson (Born 1942)
c/o Columbia Management
Investment Advisers, LLC
225 Franklin Street
Boston, MA 02110
Trustee (since 1981) | | Retired. Professor Emeritus, University of Washington, since 2011; Professor of Economics, University of Washington from January 1976 to 2011; Ford and Louisa Van Voorhis Professor of Political Economy, University of Washington from 1993 to 2011; Adjunct Professor of Statistics, University of Washington from 1980 to 2011; Associate Editor, Journal of Money, Credit and Banking from September 1993 to 2008; consultant on econometric and statistical matters. Oversees 52; None | |
John J. Neuhauser (Born 1943)
c/o Columbia Management
Investment Advisers, LLC
225 Franklin Street
Boston, MA 02110
Trustee (since 1984) | | President, Saint Michael's College, since August 2007; Director or Trustee of several non-profit organizations, including Fletcher Allen Health Care, Inc.; University Professor, Boston College from November 2005 to August 2007; Academic Vice President and Dean of Faculties, Boston College from August 1999 to October 2005. Oversees 52; Liberty All-Star Equity Fund and Liberty All-Star Growth Fund (closed-end funds) | |
Annual Report 2013
34
Columbia Risk Allocation Fund
Trustees and Officers (continued)
Independent Trustees (continued)
Name, Address and Year of Birth,
Position with Funds, Year First
Elected or Appointed to Office | | Principal Occupation(s) During Past Five Years, Number of Funds in Columbia
Funds Complex Overseen by Trustee, Other Directorships Held | |
Patrick J. Simpson (Born 1944)
c/o Columbia Management
Investment Advisers, LLC
225 Franklin Street
Boston, MA 02110
Trustee (since 2000) | | Partner, Perkins Coie LLP (law firm). Oversees 52; None | |
Anne-Lee Verville (Born 1945)
c/o Columbia Management
Investment Advisers, LLC
225 Franklin Street
Boston, MA 02110
Trustee (since 1998) | | Retired. General Manager — Global Education Industry from 1994 to 1997, President — Application Systems Division from 1991 to 1994, Chief Financial Officer — US Marketing & Services from 1988 to 1991, and Chief Information Officer from 1987 to 1988, IBM Corporation (computer and technology). Oversees 52; Enesco Group, Inc. (producer of giftware and home and garden decor products) from 2001 to 2006 | |
Interested Trustee
Name, Address and Year of Birth,
Position with Funds, Year First
Elected or Appointed to Office | | Principal Occupation(s) During Past Five Years, Number of Funds in Columbia
Funds Complex Overseen by Trustee, Other Directorships Held | |
William F. Truscott (born 1960)
53600 Ameriprise Financial Center
Minneapolis, MN 55474
Senior Vice President (since 2012) | | President and Chairman of the Board, Columbia Management Investment Advisers, LLC since February 2012 and 2001, respectively (previously President and Chief Investment Officer, from 2001 to April 2010); Chief Executive Officer, Global Asset Management, Ameriprise Financial, Inc. since September 2012 (previously, Chief Executive Officer, U.S. Asset Management & President, Annuities, from May 2010 to September 2012 and President — U.S. Asset Management and Chief Investment Officer from 2005 to April 2010); Director and Chief Executive Officer, Columbia Management Investment Distributors, Inc. since May 2010 and February 2012, respectively (previously Chairman of the Board and Chief Executive Officer from 2006 to April 2010); Chairman of the Board and Chief Executive Officer, RiverSource Distributors, Inc. since 2006; President and Chief Executive Officer, Ameriprise Certificate Company, 2006 to August 2012; Oversees 184; Director, Ameriprise Certificate Company, 2006-January 2013 | |
The Statement of Additional Information includes additional information about the Trustees of the Funds and is available, without charge, upon request by calling 800.345.6611.
The Board has appointed officers who are responsible for day-to-day business decisions based on policies it has established. The officers serve at the pleasure of the Board. In addition to Mr. Truscott, who is Senior Vice President, the Funds' other officers are:
Officers
Name, Year of Birth and Address | | Principal Occupation(s) During the Past Five Years | |
J. Kevin Connaughton (Born 1964)
225 Franklin Street
Boston, MA 02110
President (since 2009) | | Senior Vice President and General Manager — Mutual Fund Products, Columbia Management Investment Advisers, LLC since May 2010; President, Columbia Funds since 2009 and RiverSource Funds since May 2010; Managing Director, Columbia Management Advisors, LLC, December 2004-April 2010; Senior Vice President and Chief Financial Officer, Columbia Funds, June 2008-January 2009; Treasurer, Columbia Funds, October 2003-May 2008; and senior officer of various other affiliated funds since 2000 | |
Amy Johnson (Born 1965)
5228 Ameriprise Financial Center
Minneapolis, MN 55474
Vice President (since 2010) | | Senior Vice President and Chief Operating Officer, Columbia Management Investment Advisers, LLC since May 2010 (previously Chief Administrative Officer, from 2009-April 2010, Vice President — Asset Management and Trust Company Services, from 2006-2009) | |
Michael G. Clarke (Born 1969)
225 Franklin Street
Boston, MA 02110
Treasurer (since 2011) and Chief
Financial Officer (since 2009) | | Vice President, Columbia Management Investment Advisers, LLC since May 2010; Managing Director of Fund Administration, Columbia Management Advisors, LLC, September 2004-April 2010; senior officer of Columbia Funds and affiliated funds since 2002 | |
Annual Report 2013
35
Columbia Risk Allocation Fund
Trustees and Officers (continued)
Officers (continued)
Name, Year of Birth and Address | | Principal Occupation(s) During the Past Five Years | |
Scott R. Plummer (Born 1959)
5228 Ameriprise Financial Center
Minneapolis, MN 55474
Senior Vice President, Assistant
Secretary and Chief Legal Officer
(since 2010) | | Senior Vice President, Chief Legal Officer and Assistant Secretary, Columbia Management Investment Advisers, LLC since June 2005; Vice President and Lead Chief Counsel — Asset Management, Ameriprise Financial, Inc. since May 2010 (previously Vice President and Chief Counsel — Asset Management, 2005-April 2010); Vice President, Chief Counsel and Assistant Secretary, Columbia Management Investment Distributors, Inc. since 2008; Vice President, General Counsel and Secretary, Ameriprise Certificate Company since 2005; Chief Counsel, RiverSource Distributors, Inc. since 2006; senior officer of Columbia Funds and affiliated funds since 2010 | |
Colin Moore (Born 1958)
225 Franklin Street
Boston, MA 02110
Senior Vice President (since 2010) | | Director and Chief Investment Officer, Columbia Management Investment Advisers, LLC since May 2010; Global Manager, Managing Director and Chief Investment Officer of Columbia Management Advisors, LLC, 2007-April 2010 | |
Thomas P. McGuire (Born 1972)
225 Franklin Street
Boston, MA 02110
Chief Compliance Officer
(since 2012) | | Vice President — Asset Management Compliance, Columbia Management Investment Advisers, LLC since 2010; Chief Compliance Officer, Ameriprise Certificate Company, since September 2010; Compliance Executive, Bank of America, 2005-2010 | |
Stephen T. Welsh (born 1957)
225 Franklin Street
Boston, MA 02110
Vice President (since 2006) | | President and Director, Columbia Management Investment Services Corp. since May 2010; President and Director, Columbia Management Services, Inc., July 2004-April 2010; Managing Director, Columbia Management Distributors, Inc., August 2007-April 2010 | |
Christopher O. Petersen (born 1970)
5228 Ameriprise Financial Center
Minneapolis, MN 55474
Vice President (since 2010) and
Secretary (since 2011) | | Vice President and Chief Counsel, Ameriprise Financial Inc. since January 2010 (formerly Vice President and Group Counsel or Counsel, April 2004-January 2010); Assistant Secretary of Legacy RiverSource Funds, January 2007-April 2011 and of the Nations Funds, May 2010-March 2011 | |
Paul D. Pearson (born 1956)
10468 Ameriprise Financial Center
Minneapolis, MN 55474
Vice President and Assistant
Treasurer (since 2011) | | Vice President, Investment Accounting, Columbia Management Investment Advisers, LLC, since May 2010; Vice President — Managed Assets, Investment Accounting, Ameriprise Financial Inc., February 1998-May 2010 | |
Joseph F. DiMaria (Born 1968)
225 Franklin Street
Boston, MA 02110
Vice President (since 2011) and
Chief Accounting Officer (since 2008) | | Vice President, Mutual Fund Administration, Columbia Management Investment Advisers, LLC, since May 2010; Director of Fund Administration, Columbia Management Advisors, LLC, January 2006-April 2010 | |
Paul B. Goucher (born 1968)
100 Park Avenue
New York, NY 10017
Vice President and Assistant
Secretary (since 2010) | | Vice President and Lead Chief Counsel, Ameriprise Financial, Inc. since November 2008 and January 2013, respectively (formerly, Chief Counsel from January 2010-January 2013 and Group Counsel from November 2008-January 2010); Director, Managing Director and General Counsel, J. & W. Seligman & Co. Incorporated, July 2008-November 2008 (previously, Managing Director and Associate General Counsel, January 2005-July 2008) | |
Michael E. DeFao (born 1968)
225 Franklin Street
Boston, MA 02110
Vice President and Assistant
Secretary (since 2011) | | Vice President and Chief Counsel, Ameriprise Financial Inc. since May 2010; Associate General Counsel, Bank of America, June 2005-April 2010 | |
Annual Report 2013
36
Columbia Risk Allocation Fund
Important Information About This Report
Each fund mails one shareholder report to each shareholder address. If you would like more than one report, please call shareholder services at 800.345.6611 and additional reports will be sent to you.
The policy of the Board is to vote the proxies of the companies in which each fund holds investments consistent with the procedures as stated in the Statement of Additional Information (SAI). You may obtain a copy of the SAI without charge by calling 800.345.6611; contacting your financial intermediary; visiting columbiamanagement.com; or searching the website of the Securities and Exchange Commission (SEC) at sec.gov. Information regarding how each fund voted proxies relating to portfolio securities is filed with the SEC by August 31 for the most recent 12-month period ending June 30 of that year, and is available without charge by visiting columbiamanagement.com; or searching the website of the SEC at sec.gov.
Each fund files a complete schedule of portfolio holdings with the SEC for the first and third quarters of each fiscal year on Form N-Q. Each fund's Form N-Q is available on the SEC's website at sec.gov and may be reviewed and copied at the SEC's Public Reference Room in Washington, D.C. Information on the operation of the Public Reference Room may be obtained by calling 800.SEC.0330. Each fund's complete schedule of portfolio holdings, as filed on Form N-Q, can also be obtained without charge, upon request, by calling 800.345.6611.
Annual Report 2013
37

Columbia Risk Allocation Fund
P.O. Box 8081
Boston, MA 02266-8081
columbiamanagement.com
This information is for use with concurrent or prior delivery of a fund prospectus. Please read and consider the investment objectives, risks, charges and expenses for any fund carefully before investing. For a prospectus which contains this and other important information about the Fund go to columbiamanagement.com. The Fund is distributed by Columbia Management Investment Distributors, Inc., member FINRA, and managed by Columbia Management Investment Advisers, LLC.
© 2013 Columbia Management Investment Advisers, LLC. All rights reserved.
ANN214_05_C01_(07/13 )
Item 2. Code of Ethics.
(a) The registrant has adopted a code of ethics that applies to the registrant’s principal executive officer, principal financial officer, principal accounting officer or controller, or persons performing similar functions, regardless of whether these individuals are employed by the registrant or a third party.
(b) During the period covered by this report, there were not any amendments to a provision of the code of ethics adopted in 2(a) above.
(c) During the period covered by this report, there were no waivers, including any implicit waivers, from a provision of the code of ethics described in 2(a) above that relates to one or more of the items set forth in paragraph (b) of this item’s instructions.
Item 3. Audit Committee Financial Expert.
The registrant’s Board of Trustees has determined that Douglas A. Hacker, David M. Moffett and Anne-Lee Verville, each of whom are members of the registrant’s Board of Trustees and Audit Committee, each qualify as an audit committee financial expert. Mr. Hacker, Mr. Moffett and Ms. Verville are each independent trustees, as defined in paragraph (a)(2) of this item’s instructions.
Item 4. Principal Accountant Fees and Services.
Fee information below is disclosed for the three series of the registrant whose reports to stockholders are included in this annual filing. Of those three series, one commenced operations on June 19, 2012 and as a result, its fees are only included in the May 31, 2013 amounts. In addition, a fourth series merged away on April 26, 2013 and the fees incurred by that series through its merger date are included in the response to this Item.
(a) Audit Fees. Aggregate Audit Fees billed by the principal accountant for professional services rendered during the fiscal years ended May 31, 2013 and May 31, 2012 are approximately as follows:
2013 | | 2012 | |
$ | 80,100 | | $ | 103,000 | |
| | | | | |
Audit Fees include amounts related to the audit of the registrant’s annual financial statements or services that are normally provided by the accountant in connection with statutory and regulatory filings or engagements for those fiscal years. Fiscal year 2013 also includes audit fees for the review and provision of consent in connection with filing Form N-1A for a new fund.
(b) Audit-Related Fees. Aggregate Audit-Related Fees billed to the registrant by the principal accountant for professional services rendered during the fiscal years ended May 31, 2013 and May 31, 2012 are approximately as follows:
Audit-Related Fees include amounts for assurance and related services by the principal accountant that are reasonably related to the performance of the audit of the registrant’s financial statements and are not reported in Audit Fees above. In fiscal years 2013 and 2012, Audit-Related Fees consist of agreed-upon procedures performed for semi-annual shareholder reports.
During the fiscal years ended May 31, 2013 and May 31, 2012, there were no Audit-Related Fees billed by the registrant’s principal accountant to the registrant’s investment adviser (not including any sub-adviser whose role is primarily portfolio management and is subcontracted with or overseen by another investment adviser) and any entity controlling, controlled by, or under common control with the adviser that provides ongoing services to the registrant for an engagement that related directly to the operations and financial reporting of the registrant.
(c) Tax Fees. Aggregate Tax Fees billed by the principal accountant to the registrant for professional services rendered during the fiscal years ended May 31, 2013 and May 31, 2012 are approximately as follows:
2013 | | 2012 | |
$ | 23,600 | | $ | 11,200 | |
| | | | | |
Tax Fees include amounts for the review of annual tax returns, the review of required shareholder distribution calculations and typically include amounts for professional services by the principal accountant for tax compliance, tax advice and tax planning. Fiscal year 2013 also includes Tax Fees for agreed-upon procedures for a fund merger and the review of a final tax return.
During the fiscal years ended May 31, 2013 and May 31, 2012, there were no Tax Fees billed by the registrant’s principal accountant to the registrant’s investment adviser (not including any sub-adviser whose role is primarily portfolio management and is subcontracted with or overseen by another investment adviser) and any entity controlling, controlled by, or under common control with the adviser that provides ongoing services to the registrant for an engagement that related directly to the operations and financial reporting of the registrant.
(d) All Other Fees. Aggregate All Other Fees billed by the principal accountant to the registrant for professional services rendered during the fiscal years ended May 31, 2013 and May 31, 2012 are approximately as follows:
All Other Fees include amounts for products and services provided by the principal accountant, other than the services reported in paragraphs (a) through (c) above.
Aggregate All Other Fees billed by the registrant’s principal accountant to the registrant’s investment adviser (not including any sub-adviser whose role is primarily portfolio management and is subcontracted with or overseen by another investment adviser) and any entity controlling, controlled by, or under common control with the adviser that provides ongoing services to the registrant for an engagement that related directly to the operations and financial reporting of the registrant during the fiscal years ended May 31, 2013 and May 31, 2012 are approximately as follows:
2013 | | 2012 | |
$ | 232,300 | | $ | 395,800 | |
| | | | | |
In fiscal years 2013 and 2012, All Other Fees consist of fees billed for internal control examinations of the registrant’s transfer agent and investment advisor.
(e)(1) Audit Committee Pre-Approval Policies and Procedures
The registrant’s Audit Committee is required to pre-approve the engagement of the registrant’s independent accountants to provide audit and non-audit services to the registrant and non-audit services to its investment adviser (not including any sub-adviser whose role is primarily portfolio management and is subcontracted with or overseen by another investment adviser) or any entity controlling, controlled by or under common control with such investment adviser that provides
ongoing services to the registrant (“Adviser Affiliates”), if the engagement relates directly to the operations and financial reporting of the registrant.
The Audit Committee has adopted a Policy for Engagement of Independent Accountants for Audit and Non-Audit Services (“Policy”). The Policy sets forth the understanding of the Audit Committee regarding the engagement of the registrant’s independent accountants to provide (i) audit and permissible audit-related, tax and other services to the registrant (collectively “Fund Services”); (ii) non-audit services to the registrant’s investment adviser (not including any sub-adviser whose role is primarily portfolio management and is subcontracted with or overseen by another investment adviser) and Adviser Affiliates, if the engagement relates directly to the operations or financial reporting of a Fund (collectively “Fund-related Adviser Services”); and (iii) certain other audit and non-audit services to the registrant’s investment adviser (not including any sub-adviser whose role is primarily portfolio management and is subcontracted with or overseen by another investment adviser) and Adviser Affiliates. As set forth in this Fund Policy, a service will require specific pre-approval by the Audit Committee if it is to be provided by the Fund’s independent auditor; provided, however, that pre-approval of non-audit services to the Fund, the Adviser or Control Affiliates may be waived if certain de minimis requirements set forth in the SEC’s rules are met.
Under the Policy, the Audit Committee may delegate pre-approval authority to any pre-designated member or members who are Independent Trustees/Directors. The member(s) to whom such authority is delegated must report, for informational purposes only, any pre-approval decisions to the Audit Committee at its next regular meeting. The Audit Committee’s responsibilities with respect to the pre-approval of services performed by the independent accountants may not be delegated to management.
On an annual basis, at a regularly scheduled Audit Committee meeting, the Fund’s Treasurer or other Fund Officer shall submit to the Audit Committee a schedule of the types of Fund Services and Fund-related Adviser Services that are subject to specific pre-approval.
This schedule will provide a description of each type of service that is subject to specific pre-approval, along with total projected fees for each service. The pre-approval will generally cover a one-year period. The Audit Committee will review and approve the types of services and the projected fees for the next one-year period and may add to, or subtract from, the list of pre-approved services from time to time, based on subsequent determinations. This specific approval acknowledges that the Audit Committee is in agreement with the types of services that the independent accountants will be permitted to perform.
The Fund’s Treasurer or other Fund Officer shall report to the Audit Committee at each of its regular meetings regarding all Fund Services or Fund-related Adviser Services initiated since the last such report was rendered, including a general description of the services with forecasted fees for the annual period, proposed changes requiring specific pre-approval and a description of services provided by the independent auditor with actual fees during the current reporting period.
*****
(e)(2) 100% of the services performed for items (b) through (d) above during 2013 and 2012 were pre-approved by the registrant’s Audit Committee.
(f) Not applicable.
(g) The aggregate non-audit fees billed by the registrant’s accountant for services rendered to the registrant, and rendered to the registrant’s investment adviser (not including any sub-adviser whose role is primarily portfolio management and is subcontracted with or overseen by another investment adviser), and any entity controlling, controlled by, or under common control with the adviser that provides ongoing services to the registrant during the fiscal years ended May 31, 2013 and May 31, 2012 are approximately as follows:
2013 | | 2012 | |
$ | 257,500 | | $ | 415,700 | |
| | | | | |
(h) The registrant’s Audit Committee of the Board of Directors has considered whether the provision of non-audit services that were rendered to the registrant’s adviser (not including any sub-adviser whose role is primarily portfolio management and is subcontracted with or overseen by another investment adviser), and any entity controlling, controlled by, or under common control with the investment adviser that provides ongoing services to the registrant that were not pre-approved pursuant to paragraph (c)(7)(ii) of Rule 2-01 of Regulation S-X, is compatible with maintaining the principal accountant’s independence.
Item 5. Audit Committee of Listed Registrants.
Not applicable.
Item 6. Investments
(a) The registrant’s “Schedule I — Investments in securities of unaffiliated issuers” (as set forth in 17 CFR 210.12-12) is included in Item 1 of this Form N-CSR.
(b) Not applicable.
Item 7. Disclosure of Proxy Voting Policies and Procedures for Closed-End Management Investment Companies.
Not applicable.
Item 8. Portfolio Managers of Closed-End Management Investment Companies.
Not applicable.
Item 9. Purchases of Equity Securities by Closed-End Management Investment Company and Affiliated Purchasers.
Not applicable.
Item 10. Submission of Matters to a Vote of Security Holders.
There were no material changes to the procedures by which shareholders may recommend nominees to the registrant’s board of directors.
Item 11. Controls and Procedures.
(a) The registrant’s principal executive officer and principal financial officers, based on their evaluation of the registrant’s disclosure controls and procedures as of a date within 90 days of the filing of this report, have concluded that such controls and procedures are adequately designed to ensure that material information required to be disclosed by the registrant in Form N-CSR is accumulated and communicated to the registrant’s management, including the principal executive officer and principal financial officer, or persons performing similar functions, as appropriate to allow timely decisions regarding required disclosure.
(b) There was no change in the registrant’s internal control over financial reporting that occurred during the registrant’s second fiscal quarter of the period covered by this report that has materially affected, or is reasonably likely to materially affect, the registrant’s internal control over financial reporting.
Item 12. Exhibits.
(a)(1) Code of ethics required to be disclosed under Item 2 of Form N-CSR attached hereto as Exhibit 99.CODE ETH.
(a)(2) Certifications pursuant to Rule 30a-2(a) under the Investment Company Act of 1940 (17 CFR 270.30a-2(a)) attached hereto as Exhibit 99.CERT.
(a)(3) Not applicable.
(b) Certification pursuant to Rule 30a-2(b) under the Investment Company Act of 1940 (17 CFR 270.30a-2(b)) attached hereto as Exhibit 99.906CERT.
SIGNATURES
Pursuant to the requirements of the Securities Exchange Act of 1934 and the Investment Company Act of 1940, the registrant has duly caused this report to be signed on its behalf by the undersigned, thereunto duly authorized.
(registrant) | | Columbia Funds Series Trust I | |
| | | |
| | | |
By (Signature and Title) | | /s/ J. Kevin Connaughton | |
| | J. Kevin Connaughton, President and Principal Executive Officer |
| | | |
| | | |
Date | | July 24, 2013 | |
|
|
Pursuant to the requirements of the Securities Exchange Act of 1934 and the Investment Company Act of 1940, this report has been signed below by the following persons on behalf of the registrant and in the capacities and on the dates indicated. |
|
|
By (Signature and Title) | | /s/ J. Kevin Connaughton | |
| | J. Kevin Connaughton, President and Principal Executive Officer |
| | | |
| | | |
Date | | July 24, 2013 | |
| | | |
| | | |
By (Signature and Title) | | /s/ Michael G. Clarke | |
| | Michael G. Clarke, Treasurer and Chief Financial Officer | |
| | | |
| | | |
Date | | July 24, 2013 | |
| | | | | | | |