UNITED STATES
SECURITIES AND EXCHANGE COMMISSION
Washington, D.C. 20549
FORM N-CSR
CERTIFIED SHAREHOLDER REPORT OF REGISTERED
MANAGEMENT INVESTMENT COMPANIES
Investment Company Act file number | 811-04367 |
|
Columbia Funds Series Trust I |
(Exact name of registrant as specified in charter) |
|
225 Franklin Street, Boston, Massachusetts | | 02110 |
(Address of principal executive offices) | | (Zip code) |
|
Christopher O. Petersen, Esq. c/o Columbia Management Investment Advisers, LLC 225 Franklin Street Boston, MA 02110 |
(Name and address of agent for service) |
|
Registrant’s telephone number, including area code: | (800) 345-6611 | |
|
Date of fiscal year end: | August 31 | |
|
Date of reporting period: | August 31, 2013 | |
| | | | | | | | |
Form N-CSR is to be used by management investment companies to file reports with the Commission not later than 10 days after the transmission to stockholders of any report that is required to be transmitted to stockholders under Rule 30e-1 under the Investment Company Act of 1940 (17 CFR 270.30e-1). The Commission may use the information provided on Form N-CSR in its regulatory, disclosure review, inspection, and policymaking roles.
A registrant is required to disclose the information specified by Form N-CSR, and the Commission will make this information public. A registrant is not required to respond to the collection of information contained in Form N-CSR unless the Form displays a currently valid Office of Management and Budget ("OMB") control number. Please direct comments concerning the accuracy of the information collection burden estimate and any suggestions for reducing the burden to Secretary, Securities and Exchange Commission, 450 Fifth Street, NW, Washington, DC 20549-0609. The OMB has reviewed this collection of information under the clearance requirements of 44 U.S.C. § 3507.
Item 1. Reports to Stockholders.
Annual Report
August 31, 2013

Columbia Emerging Markets Fund
Not FDIC insured • No bank guarantee • May lose value
 Dear Shareholders,
A return to volatility
Volatility returned to the financial markets in the second quarter of 2013, as uncertainty about the global economy, monetary policy and the impact of the sequester's spending cuts weighed on investors. Households advanced their spending but also allocated less to savings. Labor markets continued to crank out jobs at a steady pace, slowly reducing unemployment. Housing activity remained strong and retail sales were higher despite no real increase in income. The single weak spot was in the manufacturing sector, where activity slowed. While the consumer has weathered the domestic drag well, business has been closer to the global slowdown and effects of sequestration. Businesses remain very cautious, keeping inventories and staffs lean, and are planning for but not yet confident enough to make capital expenditures.
Against this backdrop, equities outperformed fixed income during the second quarter of 2013. Small-cap stocks outperformed large- and mid-cap stocks, and growth outperformed value except for in the large-cap sector. Outside the United States, foreign stock markets generally lost ground, with the most significant losses sustained by emerging markets.
Columbia Management to begin delivering summary prospectuses
Each Columbia fund is required to update its prospectus on an annual basis. Beginning with June 2013 prospectus updates, shareholders of Columbia retail mutual funds will start to receive a summary prospectus, rather than the full length (statutory) mutual fund prospectus they have received in the past.
Each fund's summary prospectus will include the following key information:
> Investment objective
> Fee and expense table
> Portfolio turnover rate information
> Principal investment strategies, principal risks and performance information
> Management information
> Purchase and sale information
> Tax information
> Financial intermediary compensation information
Each fund's statutory prospectus will contain additional information about the fund and its risks. Both the statutory and summary prospectus will be updated each year, and will be available at columbiamanagement.com. Shareholders may request a printed version of a statutory prospectus at no cost by calling 800.345.6611 or sending an email to serviceinquiries@columbiamanagement.com.
Stay on track with Columbia Management
Backed by more than 100 years of experience, Columbia Management is one of the nation's largest asset managers. At the heart of our success — and, most importantly, that of our investors — are highly talented industry professionals, brought together by a unique way of working. We are dedicated to helping you take advantage of today's opportunities and anticipate tomorrow's. We stay abreast of the latest investment trends and ideas, using our collective insight to evaluate events and transform them into solutions you can use.
Visit columbiamanagement.com for:
> The Columbia Management Perspectives blog, featuring timely posts by our investment teams
> Detailed up-to-date fund performance and portfolio information
> Economic analysis and market commentary
> Quarterly fund commentaries
> Columbia Management Investor, our award-winning quarterly newsletter for shareholders
Thank you for your continued support of the Columbia Funds. We look forward to serving your investment needs for many years to come.
Best Regards,

J. Kevin Connaughton
President, Columbia Funds
Investors should consider the investment objectives, risks, charges and expenses of a mutual fund carefully before investing. For a free prospectus, which contains this and other important information about a fund, visit columbiamanagement.com. The prospectus should be read carefully before investing.
Columbia Funds are distributed by Columbia Management Investment Distributors, Inc., member FINRA, and managed by Columbia Management Investment Advisers, LLC.
© 2013 Columbia Management Investment Advisers, LLC. All rights reserved.
Columbia Emerging Markets Fund
Performance Overview | | | 2 | | |
Manager Discussion of Fund Performance | | | 4 | | |
Understanding Your Fund's Expenses | | | 7 | | |
Portfolio of Investments | | | 8 | | |
Statement of Assets and Liabilities | | | 15 | | |
Statement of Operations | | | 17 | | |
Statement of Changes in Net Assets | | | 18 | | |
Financial Highlights | | | 21 | | |
Notes to Financial Statements | | | 32 | | |
Report of Independent Registered
Public Accounting Firm | | | 40 | | |
Federal Income Tax Information | | | 41 | | |
Trustees and Officers | | | 42 | | |
Board Consideration and Approval of Advisory Agreement | | | 45 | | |
Important Information About This Report | | | 49 | | |
Fund Investment Manager
Columbia Management Investment
Advisers, LLC
225 Franklin Street
Boston, MA 02110
Fund Distributor
Columbia Management Investment
Distributors, Inc.
225 Franklin Street
Boston, MA 02110
Fund Transfer Agent
Columbia Management Investment
Services Corp.
P.O. Box 8081
Boston, MA 02266-8081
For more information about any of the funds, please visit columbiamanagement.com or call 800.345.6611. Customer Service Representatives are available to answer your questions Monday through Friday from 8 a.m. to 8 p.m. Eastern time.
The views expressed in this report reflect the current views of the respective parties. These views are not guarantees of future performance and involve certain risks, uncertainties and assumptions that are difficult to predict, so actual outcomes and results may differ significantly from the views expressed. These views are subject to change at any time based upon economic, market or other conditions and the respective parties disclaim any responsibility to update such views. These views may not be relied on as investment advice and, because investment decisions for a Columbia Fund are based on numerous factors, may not be relied on as an indication of trading intent on behalf of any particular Columbia Fund. References to specific securities should not be construed as a recommendation or investment advice.
Columbia Emerging Markets Fund
Performance Summary
> Columbia Emerging Markets Fund (the Fund) Class A shares returned 0.98% excluding sales charges for the 12-month period that ended August 31, 2013.
> The Fund outperformed the MSCI Emerging Markets Index (Net), which returned 0.54% during the same period. The MSCI EAFE Index (Net), which tracks performance in more developed foreign markets, rose 18.66% for the same 12-month period.
> The Fund's significant overweight in information technology and good stock selection in utilities helped the Fund's results vs. the MSCI Emerging Markets Index (Net), as did selections in Russia, Mexico and the Philippines.
Average Annual Total Returns (%) (for period ended August 31, 2013)
| | Inception | | 1 Year | | 5 Years | | 10 Years | |
Class A* | | 09/28/07 | | | | | | | |
Excluding sales charges | | | | | 0.98 | | | | 1.49 | | | | 11.04 | | |
Including sales charges | | | | | -4.79 | | | | 0.30 | | | | 10.38 | | |
Class B* | | 02/28/13 | | | | | | | |
Excluding sales charges | | | | | 0.30 | | | | 0.74 | | | | 10.19 | | |
Including sales charges | | | | | -4.70 | | | | 0.42 | | | | 10.19 | | |
Class C* | | 09/28/07 | | | | | | | |
Excluding sales charges | | | | | 0.26 | | | | 0.70 | | | | 10.20 | | |
Including sales charges | | | | | -0.74 | | | | 0.70 | | | | 10.20 | | |
Class I* | | 09/27/10 | | | 1.47 | | | | 1.84 | | | | 11.34 | | |
Class K* | | 02/28/13 | | | 1.23 | | | | 1.66 | | | | 11.19 | | |
Class R* | | 09/27/10 | | | 0.67 | | | | 1.25 | | | | 10.74 | | |
Class R4* | | 03/19/13 | | | 1.27 | | | | 1.75 | | | | 11.29 | | |
Class R5* | | 11/08/12 | | | 1.37 | | | | 1.77 | | | | 11.30 | | |
Class W* | | 09/27/10 | | | 1.09 | | | | 1.50 | | | | 11.02 | | |
Class Y* | | 11/08/12 | | | 1.40 | | | | 1.77 | | | | 11.30 | | |
Class Z | | 01/02/98 | | | 1.29 | | | | 1.75 | | | | 11.29 | | |
MSCI Emerging Markets Index (Net) | | | | | 0.54 | | | | 1.88 | | | | 12.17 | | |
MSCI EAFE Index (Net) | | | | | 18.66 | | | | 1.62 | | | | 7.57 | | |
Returns for Class A are shown with and without the maximum initial sales charge of 5.75%. Returns for Class B are shown with and without the applicable contingent deferred sales charge (CDSC) of 5.00% in the first year, declining to 1.00% in the sixth year and eliminated thereafter. Returns for Class C are shown with and without the 1.00% CDSC for the first year only. The Fund's other classes are not subject to sales charges and have limited eligibility. Please see the Fund's prospectus for details. Performance for different share classes will vary based on differences in sales charges and fees associated with each class. All results shown assume reinvestment of distributions during the period. Returns do not reflect the deduction of taxes that a shareholder may pay on Fund distributions or on the redemption of Fund shares. Performance results reflect the effect of any fee waivers or reimbursements of Fund expenses by Columbia Management Investment Advisers, LLC and/or any of its affiliates. Absent these fee waivers or expense reimbursement arrangements, performance results would have been lower.
The performance information shown represents past performance and is not a guarantee of future results. The investment return and principal value of your investment will fluctuate so that your shares, when redeemed, may be worth more or less than their original cost. Current performance may be lower or higher than the performance information shown. You may obtain performance information current to the most recent month-end by contacting your financial intermediary, visiting columbiamanagement.com or calling 800.345.6611.
* The returns shown for periods prior to the share class inception date (including returns for the Life of the Fund, if shown, which are since Fund inception) include the returns of the Fund's oldest share class. These returns are adjusted to reflect any higher class-related operating expenses of the newer share classes, as applicable. Please visit columbiamanagement.com/mutual-funds/appended-performance for more information.
The MSCI Emerging Markets Index (Net) is a free float-adjusted market capitalization index that is designed to measure equity market performance of emerging markets.
The MSCI EAFE (Europe, Australasia, Far East) Index (Net) is a free float-adjusted market capitalization index that is designed to measure the equity market performance of developed markets, excluding the U.S. and Canada. The index is compiled from a composite of securities markets of Europe, Australasia and the Far East and is widely recognized by investors in foreign markets as the measurement index for portfolios of non-North American securities.
Indices are not available for investment, are not professionally managed and do not reflect sales charges, fees, brokerage commissions, taxes or other expenses of investing. Securities in the Fund may not match those in an index.
Annual Report 2013
2
Columbia Emerging Markets Fund
Performance Overview (continued)
Performance of a Hypothetical $10,000 Investment (September 1, 2003 – August 31, 2013)

The chart above shows the change in value of a hypothetical $10,000 investment in Class A shares of Columbia Emerging Markets Fund during the stated time period, and does not reflect the deduction of taxes that a shareholder may pay on Fund distributions or on the redemption of Fund shares.
Annual Report 2013
3
Columbia Emerging Markets Fund
Manager Discussion of Fund Performance
For the 12-month period that ended August 31, 2013, the Fund's Class A shares returned 0.98% excluding sales charges. The MSCI Emerging Markets Index (Net), returned 0.54% for the same period. In comparison, the MSCI EAFE Index (Net), which is designed to track the performance of more developed foreign equity markets, returned 18.66% for the same 12-month period. Stock selection in Russia, Mexico and the Philippines helped support the Fund's performance relative to the MSCI Emerging Markets Index (Net), as did an overweight in information technology stocks and positioning among utilities. However, selections in health care did relatively poorly, as did an overweight in India and exposure to Taiwan that was below that of the MSCI Emerging Markets Index (Net).
Europe, China Weigh on Global Growth
Europe's lingering problems and decelerating growth in China weighed on the global economy during the 12-month period, but growth began to firm as eurozone recessions showed signs of ending and job growth and a revitalized housing market bolstered the U.S. economy. Within emerging markets, the Chinese economy continued to slow in the first half of 2013. However, we expect a steadier second half as China's large trading partners, the United States and Europe, have allowed exports to stabilize. A more severe economic slowdown has been avoided as the Chinese government took measures to boost economic recovery, including expediting numerous small infrastructure stimulus projects, kicking off tax reform by reducing the tax burden for corporations and implementing measures to bolster export trade.
Growth in India and Thailand has also been subpar in 2013. Weak demand from Europe, the United States and China has been a drag on Thailand's export business and the domestic economy has weakened. Our mid-term growth outlook for Thailand, however, is favorable and we believe its equities are attractively priced. Elsewhere in the world, growth in Brazil continued to disappoint and Mexico has come in below expectations. However, our mid-term growth outlook for Mexico is more positive, given its leverage to the U.S. economy, continued gains in cost competitiveness in the manufacturing sector vs. China and a string of important economic reforms on the agenda.
Although emerging market equities generated solid returns early in the 12-month period, they pulled back after remarks by U.S. Federal Reserve (Fed) chairman Ben Bernanke that the Fed may start tapering its bond-buying program later this year and end the program by mid 2014. (Following the close of the reporting period, the Fed announced that it will continue its bond-buying program.) Several major emerging market currencies weakened significantly. Markets such as India and Indonesia, with large current account deficits, performed particularly poorly, but even healthier economies, such as the Philippines, suffered as emerging economies fell into disfavor.
Investments in Technology, Utilities Helped Drive Results
The Fund's overweight relative to the MSCI Emerging Markets Index (Net) in information technology aided results. Seen as a growth area that would benefit from improving economies in the United States and Europe, technology was the best-performing sector in emerging markets. Technology holdings that did particularly well included internet companies NAVER of South Korea, Tencent Holdings in China and QIWI, a Russian processor of electronic payments.
Portfolio Management
Dara White, CFA
Jasmine Weili Huang, CFA, CPA (U.S. and China), CFM
Robert Cameron
Morningstar Style BoxTM

The Morningstar Style BoxTM is based on a fund's portfolio holdings. For equity funds, the vertical axis shows the market capitalization of the stocks owned, and the horizontal axis shows investment style (value, blend, or growth). Information shown is based on the most recent data provided by Morningstar.
©2013 Morningstar, Inc. All rights reserved. The Morningstar information contained herein: (1) is proprietary to Morningstar and/or its content providers; (2) may not be copied or distributed; and (3) is not warranted to be accurate, complete or timely. Neither Morningstar nor its content providers are responsible for any damages or losses arising from any use of this information.
Top Ten Holdings (%)
(at August 31, 2013) | |
Samsung Electronics Co., Ltd.
(South Korea) | | | 4.9 | | |
Grupo Financiero Banorte
SAB de CV, Class O (Mexico) | | | 1.8 | | |
Hyundai Motor Co.
(South Korea) | | | 1.6 | | |
Sands China Ltd. (Hong Kong) | | | 1.6 | | |
Metropolitan Bank & Trust
(Philippines) | | | 1.6 | | |
Banco Bradesco SA, ADR
(Brazil) | | | 1.4 | | |
Kasikornbank PCL, Foreign
Registered Shares (Thailand) | | | 1.4 | | |
Credicorp Ltd. (Peru) | | | 1.4 | | |
China Overseas Land &
Investment Ltd. (China) | | | 1.3 | | |
SK Telecom Co., Ltd.
(South Korea) | | | 1.3 | | |
Percentages indicated are based upon total investments (excluding Money Market Funds).
For further detail about these holdings, please refer to the section entitled "Portfolio of Investments."
Fund holdings are as of the date given, are subject to change at any time, and are not recommendations to buy or sell any security.
Annual Report 2013
4
Columbia Emerging Markets Fund
Manager Discussion of Fund Performance (continued)
Stock-picking in Russia also helped results, led by supermarket chain Magnit. Security selection in Mexico aided returns relative to the MSCI Emerging Markets Index (Net). Mexico did well both because its manufacturing sector became more price-competitive with China and because of its close ties to the improving U.S. economy. Standouts in Mexico included Alfa, an industrial conglomerate, and banking firm Grupo Financiero Santander Mexico. The Fund's large overweight relative to the MSCI Emerging Markets Index (Net) in the Philippines also helped, with the Fund's stock selections significantly outperforming those in the MSCI Emerging Markets Index (Net). A strong contribution came from Universal Robina, a consumer staples producer, which we sold after its share price appreciated significantly. In the utilities sector, natural gas utilities ENN Energy and Towngas China benefited from China's decision to begin favoring natural gas over coal because of environmental concerns.
Health Care Investments Lagged
Although health care stocks did generally well, our selections underperformed the MSCI Emerging Markets Index (Net). One notable disappointment was Wockhardt Limited, an Indian generic drug manufacturer that ran into difficulties with the U.S. Food and Drug Administration. We sold the position. Health care stocks in Brazil also did poorly, as health care spending failed to meet expectations, leading to poor results by companies such as Fleury, an operator of diagnostic and treatment centers, and Qualicorp, a health care insurer. When emerging market trends turned negative in the final months of the period, the Fund's overweight in India hurt performance, as investors worried about that nation's large current account deficit, rising inflation and higher interest rates. Conversely, an underweight in Taiwan hurt results, as that market was seen as a relatively safer place in emerging markets.
Looking Ahead
After underperforming other markets for a prolonged period, emerging market equities were trading at significant discounts to more developed nations at the end of the period. However, the long-term trends favoring developing markets currently remain intact. Emerging markets continue to gain a larger share of global gross domestic product, and their growing middle class populations have the potential to create many good opportunities.
With these trends in mind, we reduced exposure to India and Indonesia, which we think carry larger structural economic risk, and have maintained weights below the MSCI Emerging Markets Index (Net) in other countries with what we believe are large structural risks, including South Africa, Brazil, Malaysia and some Central European markets. We have increased Fund positions in Korea and China, exporting economies positioned to benefit from improving demand from the United States and Europe, and we have maintained healthy exposure to Thailand and the Philippines, which we believe have been unfairly punished in the recent market downturn. By sector, we have reduced positions in consumer staples on valuation concerns after stellar performance over the last few years, and kept the portfolio underexposed (as of period-end) to materials and energy sectors, as heavy industrial infrastructure investments in emerging markets have slowed. We continue to find many quality companies with what we believe to be solid long-term growth prospects whose stocks are trading at attractive prices and that should have the potential to do well over time.
Country Breakdown (%)
(at August 31, 2013) | |
Brazil | | | 8.1 | | |
Canada | | | 0.4 | | |
Chile | | | 1.1 | | |
China | | | 17.4 | | |
Hong Kong | | | 2.7 | | |
India | | | 6.0 | | |
Indonesia | | | 3.9 | | |
Malaysia | | | 1.7 | | |
Mexico | | | 6.1 | | |
Panama | | | 1.1 | | |
Peru | | | 1.9 | | |
Philippines | | | 5.0 | | |
Poland | | | 0.6 | | |
Russian Federation | | | 6.5 | | |
Singapore | | | 0.3 | | |
South Africa | | | 2.2 | | |
South Korea | | | 16.6 | | |
Taiwan | | | 7.3 | | |
Thailand | | | 4.8 | | |
Turkey | | | 2.4 | | |
United Kingdom | | | 0.6 | | |
United States(a) | | | 3.3 | | |
Total | | | 100.0 | | |
Percentages indicated are based upon total investments. The Fund's portfolio composition is subject to change.
(a) Includes investments in Money Market Funds.
Investment Risks
Funds which concentrate their investments in a geographic region may expose an investor to greater volatility: for example, currency fluctuations, differences in security regulation, accounting standards, foreign taxation regulations and political risks. These risks may be enhanced in emerging markets. Investments in equity securities are subject to sudden and unpredictable drops in value and periods of lackluster performance. See the Fund's prospectus for information on these and other risks.
Annual Report 2013
5
Columbia Emerging Markets Fund
Manager Discussion of Fund Performance (continued)
Summary of Investments in Securities
by Industry (%) (at August 31, 2013) | |
Airlines | | | 1.1 | | |
Auto Components | | | 0.5 | | |
Automobiles | | | 3.6 | | |
Beverages | | | 2.4 | | |
Capital Markets | | | 0.2 | | |
Chemicals | | | 2.2 | | |
Commercial Banks | | | 17.3 | | |
Computers & Peripherals | | | 0.7 | | |
Construction & Engineering | | | 0.6 | | |
Construction Materials | | | 1.9 | | |
Diversified Financial Services | | | 3.0 | | |
Diversified Telecommunication
Services | | | 0.5 | | |
Electric Utilities | | | 0.7 | | |
Electrical Equipment | | | 0.9 | | |
Electronic Equipment,
Instruments & Components | | | 3.2 | | |
Energy Equipment & Services | | | 0.6 | | |
Food & Staples Retailing | | | 2.1 | | |
Food Products | | | 2.1 | | |
Gas Utilities | | | 1.4 | | |
Health Care Providers & Services | | | 1.4 | | |
Hotels, Restaurants & Leisure | | | 2.5 | | |
Household Durables | | | 1.4 | | |
Independent Power Producers &
Energy Traders | | | 1.4 | | |
Industrial Conglomerates | | | 1.1 | | |
Insurance | | | 0.6 | | |
Internet Software & Services | | | 3.8 | | |
IT Services | | | 2.3 | | |
Leisure Equipment & Products | | | 0.4 | | |
Life Sciences Tools & Services | | | 0.5 | | |
Machinery | | | 1.1 | | |
Media | | | 0.4 | | |
Metals & Mining | | | 1.5 | | |
Multiline Retail | | | 1.3 | | |
Oil, Gas & Consumable Fuels | | | 7.2 | | |
Personal Products | | | 0.4 | | |
Pharmaceuticals | | | 0.7 | | |
Real Estate Management &
Development | | | 1.7 | | |
Semiconductors &
Semiconductor Equipment | | | 11.1 | | |
Software | | | 1.0 | | |
Specialty Retail | | | 1.1 | | |
Textiles, Apparel & Luxury Goods | | | 0.9 | | |
Tobacco | | | 0.3 | | |
Trading Companies & Distributors | | | 1.2 | | |
Transportation Infrastructure | | | 1.1 | | |
Water Utilities | | | 0.5 | | |
Wireless Telecommunication
Services | | | 4.9 | | |
Money Market Funds | | | 1.4 | | |
Total | | | 98.2 | | |
Percentages indicated are based upon net assets. The Fund's portfolio composition is subject to change.
Annual Report 2013
6
Columbia Emerging Markets Fund
Understanding Your Fund's Expenses
(Unaudited)
As an investor, you incur two types of costs. There are transaction costs, which generally include sales charges on purchases and may include redemption fees. There are also ongoing costs, which generally include management fees, distribution and service (Rule 12b-1) fees, and other fund expenses. The following information is intended to help you understand your ongoing costs (in dollars) of investing in the Fund and to help you compare these costs with the ongoing costs of investing in other mutual funds.
Analyzing Your Fund's Expenses
To illustrate these ongoing costs, we have provided examples and calculated the expenses paid by investors in each share class of the Fund during the period. The actual and hypothetical information in the table is based on an initial investment of $1,000 at the beginning of the period indicated and held for the entire period. Expense information is calculated two ways and each method provides you with different information. The amount listed in the "Actual" column is calculated using the Fund's actual operating expenses and total return for the period. You may use the Actual information, together with the amount invested, to estimate the expenses that you paid over the period. Simply divide your account value by $1,000 (for example, an $8,600 account value divided by $1,000 = 8.6), then multiply the results by the expenses paid during the period under the Actual column. The amount listed in the "Hypothetical" column assumes a 5% annual rate of return before expenses (which is not the Fund's actual return) and then applies the Fund's actual expense ratio for the period to the hypothetical return. You should not use the hypothetical account values and expenses to estimate either your actual account balance at the end of the period or the expenses you paid during the period. See "Compare With Other Funds" below for details on how to use the hypothetical data.
Compare With Other Funds
Since all mutual funds are required to include the same hypothetical calculations about expenses in shareholder reports, you can use this information to compare the ongoing cost of investing in the Fund with other funds. To do so, compare the hypothetical example with the 5% hypothetical examples that appear in the shareholder reports of other funds. As you compare hypothetical examples of other funds, it is important to note that hypothetical examples are meant to highlight the ongoing costs of investing in a fund only and do not reflect any transaction costs, such as sales charges, or redemption or exchange fees. Therefore, the hypothetical calculations are useful in comparing ongoing costs only, and will not help you determine the relative total costs of owning different funds. If transaction costs were included in these calculations, your costs would be higher.
March 1, 2013 – August 31, 2013
| | Account Value at the Beginning
of the Period ($) | | Account Value at the End of the
Period ($) | | Expenses Paid During the
Period ($) | | Fund's Annualized
Expense Ratio (%) | |
| | Actual | | Hypothetical | | Actual | | Hypothetical | | Actual | | Hypothetical | | Actual | |
Class A | | | 1,000.00 | | | | 1,000.00 | | | | 877.00 | | | | 1,016.29 | | | | 8.23 | | | | 8.85 | | | | 1.75 | | |
Class B | | | 1,000.00 | | | | 1,000.00 | | | | 874.10 | | | | 1,012.58 | | | | 11.63 | | | | 12.56 | | | | 2.49 | | |
Class C | | | 1,000.00 | | | | 1,000.00 | | | | 873.40 | | | | 1,012.53 | | | | 11.74 | | | | 12.61 | | | | 2.50 | | |
Class I | | | 1,000.00 | | | | 1,000.00 | | | | 879.70 | | | | 1,018.90 | | | | 5.80 | | | | 6.23 | | | | 1.23 | | |
Class K | | | 1,000.00 | | | | 1,000.00 | | | | 878.40 | | | | 1,017.50 | | | | 7.07 | | | | 7.64 | | | | 1.51 | | |
Class R | | | 1,000.00 | | | | 1,000.00 | | | | 875.70 | | | | 1,015.04 | | | | 9.40 | | | | 10.10 | | | | 2.00 | | |
Class R4 | | | 1,000.00 | | | | 1,000.00 | | | | 886.80 | * | | | 1,017.40 | | | | 6.45 | * | | | 7.74 | | | | 1.53 | * | |
Class R5 | | | 1,000.00 | | | | 1,000.00 | | | | 878.90 | | | | 1,018.60 | | | | 6.08 | | | | 6.53 | | | | 1.29 | | |
Class W | | | 1,000.00 | | | | 1,000.00 | | | | 877.90 | | | | 1,016.24 | | | | 8.29 | | | | 8.90 | | | | 1.76 | | |
Class Y | | | 1,000.00 | | | | 1,000.00 | | | | 879.20 | | | | 1,018.50 | | | | 6.17 | | | | 6.63 | | | | 1.31 | | |
Class Z | | | 1,000.00 | | | | 1,000.00 | | | | 878.50 | | | | 1,017.45 | | | | 7.16 | | | | 7.69 | | | | 1.52 | | |
*For the period March 19, 2013 through August 31, 2013. Class R4 shares commenced operations on March 19, 2013.
Expenses paid during the period are equal to the annualized expense ratio for each class as indicated above, multiplied by the average account value over the period and then multiplied by the number of days in the Fund's most recent fiscal half year and divided by 365.
Expenses do not include fees and expenses incurred indirectly by the Fund from the underlying funds in which the Fund may invest (also referred to as "acquired funds"), including affiliated and non-affiliated pooled investment vehicles (including mutual funds and exchange-traded funds).
Had Columbia Management Investment Advisers, LLC and/or certain of its affiliates not waived/reimbursed certain fees and expenses, account value at the end of the period would have been reduced.
Annual Report 2013
7
Columbia Emerging Markets Fund
Portfolio of Investments
August 31, 2013
(Percentages represent value of investments compared to net assets)
Common Stocks 93.7%
Issuer | | Shares | | Value ($) | |
Brazil 7.2% | |
Arezzo Industria e Comercio SA | | | 426,300 | | | | 5,955,103 | | |
Banco Bradesco SA, ADR | | | 1,421,360 | | | | 16,516,203 | | |
Cielo SA | | | 229,660 | | | | 5,563,548 | | |
Companhia de Bebidas das
Americas, ADR | | | 406,637 | | | | 14,142,835 | | |
Cosan Ltd., Class A | | | 353,796 | | | | 4,733,791 | | |
Hypermarcas SA | | | 676,900 | | | | 4,590,307 | | |
Linx SA | | | 357,100 | | | | 5,754,729 | | |
Mills Estruturas e Servicos de
Engenharia SA | | | 809,000 | | | | 10,019,468 | | |
Qualicorp SA(a) | | | 613,000 | | | | 4,737,618 | | |
Raia Drogasil SA | | | 230,800 | | | | 1,623,179 | | |
Ultrapar Participacoes SA | | | 454,600 | | | | 9,924,816 | | |
Vale SA | | | 207,200 | | | | 2,960,434 | | |
Total | | | | | 86,522,031 | | |
Canada 0.3% | |
Pacific Rubiales Energy Corp. | | | 222,578 | | | | 4,211,506 | | |
Chile 1.1% | |
Inversiones La Construccion SA | | | 202,505 | | | | 2,539,994 | | |
SACI Falabella | | | 1,043,559 | | | | 10,326,172 | | |
Total | | | | | 12,866,166 | | |
China 17.1% | |
Anhui Conch Cement Co., Ltd., Class H | | | 2,877,000 | | | | 9,251,545 | | |
Anton Oilfield Services Group Ltd. | | | 6,842,000 | | | | 4,346,451 | | |
Baidu, Inc., ADR(a) | | | 29,208 | | | | 3,958,560 | | |
China Communications Construction
Co., Ltd., Class H | | | 9,694,000 | | | | 7,392,285 | | |
China Merchants Holdings
International Co., Ltd. | | | 1,494,000 | | | | 5,025,750 | | |
China Overseas Land & Investment Ltd. | | | 5,280,000 | | | | 15,668,662 | | |
China Petroleum & Chemical Corp.,
Class H | | | 16,592,000 | | | | 11,947,571 | | |
China Resources Power Holdings
Co., Ltd. | | | 2,506,000 | | | | 5,738,676 | | |
China Vanke Co., Ltd., Class B | | | 2,612,914 | | | | 5,233,523 | | |
CIMC Enric Holdings Ltd. | | | 3,872,000 | | | | 4,031,985 | | |
CNOOC Ltd. | | | 6,442,000 | | | | 12,737,714 | | |
ENN Energy Holdings Ltd. | | | 2,520,000 | | | | 12,486,982 | | |
GCL-Poly Energy Holdings Ltd.(a) | | | 27,375,000 | | | | 7,194,244 | | |
Common Stocks (continued)
Issuer | | Shares | | Value ($) | |
Guangdong Investment Ltd. | | | 7,660,000 | | | | 6,333,373 | | |
Haier Electronics Group Co., Ltd. | | | 2,179,000 | | | | 3,805,395 | | |
Haitong Securities Co., Ltd., Class H | | | 1,853,200 | | | | 2,671,353 | | |
Huaneng Power International, Inc.,
Class H | | | 11,106,000 | | | | 11,041,499 | | |
Industrial & Commercial Bank of
China Ltd., Class H | | | 23,067,000 | | | | 15,083,646 | | |
Lenovo Group Ltd. | | | 9,212,000 | | | | 8,883,558 | | |
PetroChina Co., Ltd., Class H | | | 7,502,000 | | | | 8,165,279 | | |
SINA Corp.(a) | | | 55,571 | | | | 4,302,307 | | |
Tencent Holdings Ltd. | | | 223,300 | | | | 10,428,622 | | |
Termbray Petro-King Oilfield
Services Ltd.(a) | | | 4,987,000 | | | | 2,641,914 | | |
Want Want China Holdings Ltd. | | | 6,300,000 | | | | 9,314,494 | | |
WuXi PharmaTech (Cayman), Inc. ADR(a) | | | 240,012 | | | | 5,760,288 | | |
Youku Tudou, Inc., ADR(a) | | | 227,886 | | | | 5,284,676 | | |
Zhuzhou CSR Times Electric Co., Ltd.,
Class H | | | 2,344,000 | | | | 7,360,717 | | |
Total | | | | | 206,091,069 | | |
Hong Kong 2.7% | |
Sa Sa International Holdings Ltd. | | | 8,342,000 | | | | 8,916,367 | | |
Sands China Ltd. | | | 3,329,200 | | | | 19,079,664 | | |
Towngas China Co., Ltd. | | | 4,539,000 | | | | 4,269,540 | | |
Total | | | | | 32,265,571 | | |
India 5.9% | |
Apollo Hospitals Enterprise Ltd. | | | 528,957 | | | | 6,921,595 | | |
Eicher Motors Ltd. | | | 62,055 | | | | 2,995,960 | | |
Havells India Ltd | | | 354,200 | | | | 3,226,313 | | |
HCL Technologies Ltd. | | | 516,805 | | | | 8,120,983 | | |
HDFC Bank Ltd., ADR | | | 339,341 | | | | 9,834,102 | | |
Hexaware Technologies Ltd. | | | 2,043,226 | | | | 3,970,524 | | |
ICICI Bank Ltd., ADR | | | 374,818 | | | | 9,752,764 | | |
Just Dial Ltd.(a) | | | 322,124 | | | | 3,307,293 | | |
Lupin Ltd. | | | 649,869 | | | | 7,838,736 | | |
Motherson Sumi Systems Ltd. | | | 1,987,496 | | | | 5,841,177 | | |
Tata Motors Ltd. | | | 1,376,932 | | | | 6,178,490 | | |
TTK Prestige Ltd. | | | 64,864 | | | | 3,275,022 | | |
Total | | | | | 71,262,959 | | |
Indonesia 3.9% | |
PT Ace Hardware Indonesia Tbk | | | 65,895,500 | | | | 4,276,110 | | |
The accompanying Notes to Financial Statements are an integral part of this statement.
Annual Report 2013
8
Columbia Emerging Markets Fund
Portfolio of Investments (continued)
August 31, 2013
Common Stocks (continued)
Issuer | | Shares | | Value ($) | |
PT AKR Corporindo Tbk | | | 13,469,000 | | | | 4,887,395 | | |
PT Bank Negara Indonesia Persero Tbk | | | 17,838,000 | | | | 6,267,431 | | |
PT Bank Tabungan Pensiunan
Nasional Tbk(a) | | | 9,394,500 | | | | 3,352,868 | | |
PT Gudang Garam Tbk | | | 1,142,000 | | | | 3,955,644 | | |
PT Jasa Marga Persero Tbk | | | 9,370,000 | | | | 4,663,328 | | |
PT Nippon Indosari Corpindo Tbk | | | 8,421,000 | | | | 5,079,038 | | |
PT Sumber Alfaria Trijaya Tbk | | | 76,500,000 | | | | 3,993,132 | | |
PT Telekomunikasi Tbk | | | 30,480,000 | | | | 6,122,500 | | |
PT Tower Bersama Infrastructure Tbk(a) | | | 8,300,000 | | | | 3,941,443 | | |
Total | | | | | 46,538,889 | | |
Malaysia 1.6% | |
CIMB Group Holdings Bhd | | | 5,082,300 | | | | 11,241,484 | | |
Tenaga Nasional Bhd | | | 3,146,200 | | | | 8,356,066 | | |
Total | | | | | 19,597,550 | | |
Mexico 6.0% | |
Alfa SAB de CV, Class A | | | 5,225,600 | | | | 12,965,245 | | |
Cemex SAB de CV, ADR(a) | | | 1,247,299 | | | | 14,019,641 | | |
Fomento Economico Mexicano
SAB de CV, ADR | | | 91,934 | | | | 8,676,731 | | |
Grupo Financiero Banorte SAB de CV,
Class O | | | 3,411,600 | | | | 21,006,836 | | |
Grupo Financiero Santander Mexico
SAB de CV, ADR, Class B | | | 924,837 | | | | 12,614,777 | | |
Grupo Mexico SAB de CV, Class B | | | 823,490 | | | | 2,354,413 | | |
Total | | | | | 71,637,643 | | |
Panama 1.1% | |
Copa Holdings SA, Class A | | | 98,720 | | | | 12,910,602 | | |
Peru 1.8% | |
Credicorp Ltd. | | | 133,057 | | | | 16,131,831 | | |
Southern Copper Corp. | | | 208,559 | | | | 5,735,372 | | |
Total | | | | | 21,867,203 | | |
Philippines 4.9% | |
BDO Unibank, Inc. | | | 177,439 | | | | 293,395 | | |
Bloomberry Resorts Corp.(a) | | | 15,108,500 | | | | 3,646,790 | | |
GT Capital Holdings, Inc. | | | 668,560 | | | | 11,579,594 | | |
LT Group, Inc. | | | 14,182,700 | | | | 6,158,010 | | |
Metropolitan Bank & Trust | | | 10,339,973 | | | | 18,822,792 | | |
Philippine Long Distance Telephone Co. | | | 135,060 | | | | 8,644,838 | | |
Common Stocks (continued)
Issuer | | Shares | | Value ($) | |
Security Bank Corp. | | | 2,711,030 | | | | 7,134,340 | | |
Semirara Mining Corp. | | | 513,250 | | | | 2,780,256 | | |
Total | | | | | 59,060,015 | | |
Poland 0.6% | |
Eurocash SA | | | 473,006 | | | | 7,595,492 | | |
Russian Federation 6.3% | |
Gazprom OAO, ADR | | | 857,395 | | | | 6,739,125 | | |
Lukoil OAO, ADR | | | 215,005 | | | | 12,428,364 | | |
Magnit OJSC, GDR(b) | | | 152,002 | | | | 8,436,111 | | |
Mail.ru Group Ltd., GDR(b) | | | 316,603 | | | | 10,337,088 | | |
MD Medical Group Investments
PLC, GDR(b) | | | 58,697 | | | | 587,557 | | |
Mobile Telesystems OJSC, ADR | | | 566,032 | | | | 11,977,237 | | |
NovaTek OAO | | | 787,647 | | | | 8,537,222 | | |
QIWI PLC, ADR | | | 140,379 | | | | 4,183,294 | | |
Sberbank of Russia | | | 4,901,665 | | | | 13,136,462 | | |
Total | | | | | 76,362,460 | | |
Singapore 0.3% | |
Hutchison Port Holdings Trust | | | 5,305,000 | | | | 3,916,936 | | |
South Africa 2.2% | |
AVI Ltd. | | | 1,500,791 | | | | 8,028,353 | | |
Clicks Group Ltd. | | | 753,278 | | | | 4,017,141 | | |
Discovery Ltd. | | | 539,646 | | | | 4,441,982 | | |
FirstRand Ltd. | | | 1,686,500 | | | | 4,932,457 | | |
Life Healthcare Group Holdings Ltd. | | | 1,342,107 | | | | 4,620,978 | | |
Total | | | | | 26,040,911 | | |
South Korea 15.4% | |
Cheil Industries, Inc. | | | 70,834 | | | | 5,606,524 | | |
Duksan Hi-Metal Co., Ltd.(a) | | | 347,739 | | | | 7,519,748 | | |
Gamevil, Inc.(a) | | | 67,679 | | | | 3,383,255 | | |
Hotel Shilla Co., Ltd. | | | 128,764 | | | | 7,772,131 | | |
Hyundai Motor Co. | | | 85,801 | | | | 19,133,140 | | |
InkTec Co., Ltd.(a) | | | 97,864 | | | | 2,196,850 | | |
Kia Motors Corp. | | | 175,594 | | | | 10,564,197 | | |
LG Chem Ltd. | | | 32,199 | | | | 8,283,330 | | |
NAVER Corp. | | | 19,085 | | | | 7,676,537 | | |
NHN Entertainment Corp.(a)(c) | | | — | | | | 25 | | |
Samsung Electronics Co., Ltd. | | | 46,395 | | | | 56,880,755 | | |
The accompanying Notes to Financial Statements are an integral part of this statement.
Annual Report 2013
9
Columbia Emerging Markets Fund
Portfolio of Investments (continued)
August 31, 2013
Common Stocks (continued)
Issuer | | Shares | | Value ($) | |
Samsung SDI Co., Ltd. | | | 90,424 | | | | 13,680,418 | | |
Seoul Semiconductor Co., Ltd. | | | 134,158 | | | | 4,495,622 | | |
SK Hynix, Inc.(a) | | | 520,230 | | | | 13,147,852 | | |
SK Telecom Co., Ltd. | | | 78,026 | | | | 15,538,406 | | |
Suprema, Inc.(a) | | | 302,478 | | | | 6,026,431 | | |
WeMade Entertainment Co., Ltd.(a) | | | 75,829 | | | | 3,462,365 | | |
Total | | | | | 185,367,586 | | |
Taiwan 7.1% | |
Airtac International Group | | | 552,210 | | | | 3,627,719 | | |
CTBC Financial Holding Co., Ltd. | | | 19,612,662 | | | | 12,303,238 | | |
Delta Electronics, Inc. | | | 819,000 | | | | 3,687,154 | | |
Far EasTone Telecommunications
Co., Ltd. | | | 4,472,000 | | | | 11,285,686 | | |
Giant Manufacturing Co., Ltd. | | | 648,800 | | | | 4,348,170 | | |
Giga Solar Materials Corp. | | | 505,000 | | | | 4,050,694 | | |
Hermes Microvision, Inc. | | | 153,000 | | | | 4,108,557 | | |
MediaTek, Inc. | | | 868,000 | | | | 10,594,498 | | |
Standard Foods Corp. | | | 841,000 | | | | 2,464,367 | | |
Taiwan Semiconductor
Manufacturing Co., Ltd. | | | 4,223,048 | | | | 14,000,995 | | |
Tong Hsing Electronic Industries Ltd. | | | 1,290,000 | | | | 6,650,623 | | |
TPK Holding Co., Ltd. | | | 842,000 | | | | 8,883,156 | | |
Total | | | | | 86,004,857 | | |
Thailand 4.7% | |
Advanced Information Service PCL,
Foreign Registered Shares | | | 988,800 | | | | 7,339,115 | | |
Bangkok Bank PCL, Foreign Registered
Shares | | | 2,227,900 | | | | 12,476,594 | | |
BEC World PCL, Foreign Registered
Shares | | | 3,045,900 | | | | 5,133,339 | | |
Kasikornbank PCL, Foreign Registered
Shares | | | 3,330,000 | | | | 16,364,321 | | |
PTT Global Chemical PCL, Foreign
Registered Shares | | | 5,004,300 | | | | 10,671,779 | | |
Robinson Department Store PCL,
Foreign Registered Shares | | | 3,600,900 | | | | 5,114,850 | | |
Total | | | | | 57,099,998 | | |
Turkey 2.4% | |
Anadolu Hayat Emeklilik AS | | | 1,456,673 | | | | 2,601,813 | | |
Arcelik AS | | | 2,046,812 | | | | 10,195,938 | | |
Common Stocks (continued)
Issuer | | Shares | | Value ($) | |
Tofas Turk Otomobil Fabrikasi AS | | | 1,404,014 | | | | 7,202,265 | | |
Turk Traktor ve Ziraat Makineleri AS | | | 82,725 | | | | 2,171,361 | | |
Turkiye Halk Bankasi AS | | | 972,243 | | | | 6,147,547 | | |
Total | | | | | 28,318,924 | | |
United Kingdom 0.6% | |
Lonmin PLC(a) | | | 890,287 | | | | 4,696,424 | | |
Randgold Resources Ltd. | | | 29,451 | | | | 2,320,806 | | |
Total | | | | | 7,017,230 | | |
United States 0.5% | |
Cognizant Technology Solutions Corp.,
Class A(a) | | | 83,240 | | | | 6,101,492 | | |
Total Common Stocks
(Cost: $1,114,618,291) | | | | | 1,128,657,090 | | |
Preferred Stocks 1.7%
Brazil 0.8% | |
Alpargatas SA | | | 925,300 | | | | 4,754,575 | | |
Petroleo Brasileiro SA | | | 667,900 | | | | 4,686,035 | | |
Total | | | | | 9,440,610 | | |
South Korea 0.9% | |
Samsung Electronics Co., Ltd. | | | 13,410 | | | | 11,060,455 | | |
Total Preferred Stocks
(Cost: $18,507,691) | | | | | 20,501,065 | | |
Exchange-Traded Funds 1.4%
Vanguard Emerging Markets ETF | | | 321,244 | | | | 12,117,324 | | |
iShares MSCI Taiwan Index Fund | | | 338,483 | | | | 4,562,751 | | |
Total Exchange-Traded Funds
(Cost: $16,874,407) | | | | | 16,680,075 | | |
Money Market Funds 1.4%
Columbia Short-Term Cash Fund,
0.097%(d)(e) | | | 16,536,242 | | | | 16,536,242 | | |
Total Money Market Funds
(Cost: $16,536,242) | | | | | 16,536,242 | | |
Total Investments
(Cost: $1,166,536,631) | | | 1,182,374,472 | | |
Other Assets & Liabilities, Net | | | 21,538,597 | | |
Net Assets | | | 1,203,913,069 | | |
The accompanying Notes to Financial Statements are an integral part of this statement.
Annual Report 2013
10
Columbia Emerging Markets Fund
Portfolio of Investments (continued)
August 31, 2013
Notes to Portfolio of Investments
(a) Non-income producing.
(b) Security exempt from registration pursuant to Rule 144A under the Securities Act of 1933. This security may be resold in transactions exempt from registration, normally to qualified institutional buyers. At August 31, 2013, the value of these securities amounted to $19,360,756 or 1.61% of net assets.
(c) Represents fractional shares.
(d) The rate shown is the seven-day current annualized yield at August 31, 2013.
(e) As defined in the Investment Company Act of 1940, an affiliated company is one in which the Fund owns 5% or more of its outstanding voting securities, or a company which is under common ownership or control with the Fund. Holdings and transactions in these affiliated companies during the year ended August 31, 2013, are as follows:
Issuer | | Beginning
Cost ($) | | Purchase
Cost ($) | | Proceeds
From Sales ($) | | Ending
Cost ($) | | Dividends —
Affiliated
Issuers ($) | | Value ($) | |
Columbia Short-Term Cash Fund | | | 6,468,836 | | | | 484,564,455 | | | | (474,497,049 | ) | | | 16,536,242 | | | | 31,426 | | | | 16,536,242 | | |
Abbreviation Legend
ADR American Depositary Receipt
GDR Global Depositary Receipt
Fair Value Measurements
Generally accepted accounting principles (GAAP) require disclosure regarding the inputs and valuation techniques used to measure fair value and any changes in valuation inputs or techniques. In addition, investments shall be disclosed by major category.
The Fund categorizes its fair value measurements according to a three-level hierarchy that maximizes the use of observable inputs and minimizes the use of unobservable inputs by prioritizing that the most observable input be used when available. Observable inputs are those that market participants would use in pricing an investment based on market data obtained from sources independent of the reporting entity. Unobservable inputs are those that reflect the Fund's assumptions about the information market participants would use in pricing an investment. An investment's level within the fair value hierarchy is based on the lowest level of any input that is deemed significant to the asset or liability's fair value measurement. The input levels are not necessarily an indication of the risk or liquidity associated with investments at that level. For example, certain U.S. government securities are generally high quality and liquid, however, they are reflected as Level 2 because the inputs used to determine fair value may not always be quoted prices in an active market.
Fair value inputs are summarized in the three broad levels listed below:
> Level 1 — Valuations based on quoted prices for investments in active markets that the Fund has the ability to access at the measurement date (including NAV for open-end mutual funds). Valuation adjustments are not applied to Level 1 investments.
> Level 2 — Valuations based on other significant observable inputs (including quoted prices for similar securities, interest rates, prepayment speeds, credit risks, etc.).
> Level 3 — Valuations based on significant unobservable inputs (including the Fund's own assumptions and judgment in determining the fair value of investments).
Inputs that are used in determining fair value of an investment may include price information, credit data, volatility statistics, and other factors. These inputs can be either observable or unobservable. The availability of observable inputs can vary between investments, and is affected by various factors such as the type of investment, and the volume and level of activity for that investment or similar investments in the marketplace. The inputs will be considered by the Investment Manager, along with any other relevant factors in the calculation of an investment's fair value. The Fund uses prices and inputs that are current as of the measurement date, which may include periods of market dislocations. During these periods, the availability of prices and inputs may be reduced for many investments. This condition could cause an investment to be reclassified between the various levels within the hierarchy.
Foreign equity securities actively traded in markets where there is a significant delay in the local close relative to the New York Stock Exchange (NYSE) are classified as Level 2. The values of these securities may include an adjustment to reflect the impact of significant market movements following the close of local trading, as described in Note 2 to the financial statements — Security Valuation.
The accompanying Notes to Financial Statements are an integral part of this statement.
Annual Report 2013
11
Columbia Emerging Markets Fund
Portfolio of Investments (continued)
August 31, 2013
Fair Value Measurements (continued)
Investments falling into the Level 3 category are primarily supported by quoted prices from brokers and dealers participating in the market for those investments. However, these may be classified as Level 3 investments due to lack of market transparency and corroboration to support these quoted prices. Additionally, valuation models may be used as the pricing source for any remaining investments classified as Level 3. These models may rely on one or more significant unobservable inputs and/or significant assumptions by the Investment Manager. Inputs used in valuations may include, but are not limited to, financial statement analysis, capital account balances, discount rates and estimated cash flows, and comparable company data.
Under the direction of the Fund's Board of Trustees (the Board), the Investment Manager's Valuation Committee (the Committee) is responsible for carrying out the valuation procedures approved by the Board. The Committee consists of voting and non-voting members from various groups within the Investment Manager's organization, including operations and accounting, trading and investments, compliance, risk management and legal.
The Committee meets at least monthly to review and approve valuation matters, which may include a description of specific valuation determinations, data regarding pricing information received from approved pricing vendors and brokers and the results of Board-approved valuation control policies and procedures (the Policies). The Policies address, among other things, instances when market quotations are or are not readily available, including recommendations of third party pricing vendors and a determination of appropriate pricing methodologies; events that require specific valuation determinations and assessment of fair value techniques; securities with a potential for stale pricing, including those that are illiquid, restricted, or in default; and the effectiveness of third-party pricing vendors, including periodic reviews of vendors. The Committee meets more frequently, as needed, to discuss additional valuation matters, which may include the need to review back-testing results, review time-sensitive information or approve related valuation actions. The Committee reports to the Board, with members of the Committee meeting with the Board at each of its regularly scheduled meetings to discuss valuation matters and actions during the period, similar to those described earlier.
For investments categorized as Level 3, the Committee monitors information similar to that described above, which may include: (i) data specific to the issuer or comparable issuers, (ii) general market or specific sector news and (iii) quoted prices and specific or similar security transactions. The Committee considers this data and any changes from prior periods in order to assess the reasonableness of observable and unobservable inputs, any assumptions or internal models used to value those securities and changes in fair value. This data is also used to corroborate, when available, information received from approved pricing vendors and brokers. Various factors impact the frequency of monitoring this information (which may occur as often as daily). However, the Committee may determine that changes to inputs, assumptions and models are not required as a result of the monitoring procedures performed.
The accompanying Notes to Financial Statements are an integral part of this statement.
Annual Report 2013
12
Columbia Emerging Markets Fund
Portfolio of Investments (continued)
August 31, 2013
Fair Value Measurements (continued)
The following table is a summary of the inputs used to value the Fund's investments at August 31, 2013:
Description | | Level 1
Quoted Prices in Active
Markets for Identical
Assets ($) | |
Level 2
Other Significant
Observable Inputs ($) | |
Level 3
Significant
Unobservable Inputs ($) | |
Total ($) | |
Equity Securities | |
Common Stocks | |
Consumer Discretionary | | | 16,281,276 | | | | 124,483,046 | | | | — | | | | 140,764,322 | | |
Consumer Staples | | | 29,033,051 | | | | 59,041,781 | | | | — | | | | 88,074,832 | | |
Energy | | | 31,298,476 | | | | 57,895,531 | | | | — | | | | 89,194,007 | | |
Financials | | | 88,396,507 | | | | 169,753,503 | | | | — | | | | 258,150,010 | | |
Health Care | | | 10,497,906 | | | | 19,968,866 | | | | — | | | | 30,466,772 | | |
Industrials | | | 35,895,315 | | | | 49,299,750 | | | | — | | | | 85,195,065 | | |
Information Technology | | | 35,148,607 | | | | 220,490,995 | | | | — | | | | 255,639,602 | | |
Materials | | | 25,069,861 | | | | 43,027,258 | | | | — | | | | 68,097,119 | | |
Telecommunication Services | | | 11,977,237 | | | | 52,871,988 | | | | — | | | | 64,849,225 | | |
Utilities | | | — | | | | 48,226,136 | | | | — | | | | 48,226,136 | | |
Preferred Stocks | |
Consumer Discretionary | | | 4,754,575 | | | | — | | | | — | | | | 4,754,575 | | |
Energy | | | 4,686,035 | | | | — | | | | — | | | | 4,686,035 | | |
Information Technology | | | — | | | | 11,060,455 | | | | — | | | | 11,060,455 | | |
Exchange-Traded Funds | | | 16,680,075 | | | | — | | | | — | | | | 16,680,075 | | |
Total Equity Securities | | | 309,718,921 | | | | 856,119,309 | | | | — | | | | 1,165,838,230 | | |
Mutual Funds | |
Money Market Funds | | | 16,536,242 | | | | — | | | | — | | | | 16,536,242 | | |
Total Mutual Funds | | | 16,536,242 | | | | — | | | | — | | | | 16,536,242 | | |
Total | | | 326,255,163 | | | | 856,119,309 | | | | — | | | | 1,182,374,472 | | |
See the Portfolio of Investments for all investment classifications not indicated in the table.
The Fund's assets assigned to the Level 2 input category are generally valued using the market approach, in which a security's value is determined through reference to prices and information from market transactions for similar or identical assets. These assets include certain foreign securities for which a third party statistical pricing service may be employed for purposes of fair market valuation. The models utilized by the third party statistical pricing service take into account a security's correlation to available market data including, but not limited to, intraday index, ADR, and ETF movements.
There were no transfers of financial assets between Levels 1 and 2 during the period.
The accompanying Notes to Financial Statements are an integral part of this statement.
Annual Report 2013
13
Columbia Emerging Markets Fund
Portfolio of Investments (continued)
August 31, 2013
Fair Value Measurements (continued)
The following table is a reconciliation of Level 3 assets for which significant observable and/or unobservable inputs were used to determine fair value.
| | | Common Stocks ($) | |
Balance as of August 31, 2012 | | | 2,906,255 | | |
Accrued discounts/premiums | | | — | | |
Realized gain (loss) | | | — | | |
Change in unrealized appreciation (depreciation) | | | — | | |
Sales | | | — | | |
Purchases | | | — | | |
Transfers into Level 3 | | | — | | |
Transfers out of Level 3 | | | (2,906,255 | ) | |
Balance as of August 31, 2013 | | | — | | |
Financial assets were transferred from Level 3 to Level 2 as observable market inputs were utilized and management's determination that there was sufficient, reliable and observable market data to value these assets as of period end.
Transfers in and/or out of Level 3 are determined based on the fair value at the beginning of the period for security positions held throughout the period.
The accompanying Notes to Financial Statements are an integral part of this statement.
Annual Report 2013
14
Columbia Emerging Markets Fund
Statement of Assets and Liabilities
August 31, 2013
Assets | |
Investments, at value | |
Unaffiliated issuers (identified cost $1,150,000,389) | | $ | 1,165,838,230 | | |
Affiliated issuers (identified cost $16,536,242) | | | 16,536,242 | | |
Total investments (identified cost $1,166,536,631) | | | 1,182,374,472 | | |
Foreign currency (identified cost $6,948,094) | | | 6,940,673 | | |
Receivable for: | |
Investments sold | | | 20,077,308 | | |
Capital shares sold | | | 2,426,640 | | |
Dividends | | | 1,823,174 | | |
Reclaims | | | 42,199 | | |
Prepaid expenses | | | 15,149 | | |
Trustees' deferred compensation plan | | | 27,623 | | |
Total assets | | | 1,213,727,238 | | |
Liabilities | |
Payable for: | |
Investments purchased | | | 7,456,331 | | |
Capital shares purchased | | | 1,901,867 | | |
Investment management fees | | | 33,650 | | |
Distribution and/or service fees | | | 3,234 | | |
Transfer agent fees | | | 167,168 | | |
Administration fees | | | 2,537 | | |
Plan administration fees | | | 112 | | |
Compensation of board members | | | 24,048 | | |
Chief compliance officer expenses | | | 58 | | |
Other expenses | | | 189,184 | | |
Trustees' deferred compensation plan | | | 27,623 | | |
Other liabilities | | | 8,357 | | |
Total liabilities | | | 9,814,169 | | |
Net assets applicable to outstanding capital stock | | $ | 1,203,913,069 | | |
Represented by | |
Paid-in capital | | $ | 1,202,079,940 | | |
Undistributed net investment income | | | 4,297,316 | | |
Accumulated net realized loss | | | (18,273,957 | ) | |
Unrealized appreciation (depreciation) on: | |
Investments | | | 15,837,841 | | |
Foreign currency translations | | | (28,071 | ) | |
Total — representing net assets applicable to outstanding capital stock | | $ | 1,203,913,069 | | |
The accompanying Notes to Financial Statements are an integral part of this statement.
Annual Report 2013
15
Columbia Emerging Markets Fund
Statement of Assets and Liabilities (continued)
August 31, 2013
Class A | |
Net assets | | $ | 300,600,973 | | |
Shares outstanding | | | 32,915,770 | | |
Net asset value per share | | $ | 9.13 | | |
Maximum offering price per share(a) | | $ | 9.69 | | |
Class B | |
Net assets | | $ | 8,712,980 | | |
Shares outstanding | | | 980,144 | | |
Net asset value per share | | $ | 8.89 | | |
Class C | |
Net assets | | $ | 23,756,062 | | |
Shares outstanding | | | 2,668,451 | | |
Net asset value per share | | $ | 8.90 | | |
Class I | |
Net assets | | $ | 184,936,690 | | |
Shares outstanding | | | 20,078,645 | | |
Net asset value per share | | $ | 9.21 | | |
Class K | |
Net assets | | $ | 506,456 | | |
Shares outstanding | | | 55,239 | | |
Net asset value per share | | $ | 9.17 | | |
Class R | |
Net assets | | $ | 5,862,749 | | |
Shares outstanding | | | 644,625 | | |
Net asset value per share | | $ | 9.09 | | |
Class R4 | |
Net assets | | $ | 37,377 | | |
Shares outstanding | | | 4,043 | | |
Net asset value per share | | $ | 9.24 | | |
Class R5 | |
Net assets | | $ | 1,381,156 | | |
Shares outstanding | | | 149,740 | | |
Net asset value per share | | $ | 9.22 | | |
Class W | |
Net assets | | $ | 31,425,780 | | |
Shares outstanding | | | 3,443,211 | | |
Net asset value per share | | $ | 9.13 | | |
Class Y | |
Net assets | | $ | 464,895 | | |
Shares outstanding | | | 50,296 | | |
Net asset value per share | | $ | 9.24 | | |
Class Z | |
Net assets | | $ | 646,227,951 | | |
Shares outstanding | | | 70,385,677 | | |
Net asset value per share | | $ | 9.18 | | |
(a) The maximum offering price per share is calculated by dividing the net asset value per share by 1.0 minus the maximum sales charge of 5.75%.
The accompanying Notes to Financial Statements are an integral part of this statement.
Annual Report 2013
16
Columbia Emerging Markets Fund
Statement of Operations
Year Ended August 31, 2013
Net investment income | |
Income: | |
Dividends — unaffiliated issuers | | $ | 22,376,270 | | |
Dividends — affiliated issuers | | | 31,426 | | |
Income from securities lending — net | | | 42,054 | | |
Foreign taxes withheld | | | (2,406,216 | ) | |
Total income | | | 20,043,534 | | |
Expenses: | |
Investment management fees | | | 8,951,551 | | |
Distribution and/or service fees | |
Class A | | | 405,085 | | |
Class B(a) | | | 53,722 | | |
Class C | | | 137,266 | | |
Class R | | | 16,252 | | |
Class W | | | 80,442 | | |
Transfer agent fees | |
Class A | | | 446,288 | | |
Class B(a) | | | 14,703 | | |
Class C | | | 38,158 | | |
Class K(a) | | | 129 | | |
Class R | | | 9,000 | | |
Class R4(b) | | | 29 | | |
Class R5(c) | | | 424 | | |
Class W | | | 94,071 | | |
Class Z | | | 1,018,326 | | |
Administration fees | | | 631,189 | | |
Plan administration fees | |
Class K(a) | | | 647 | | |
Compensation of board members | | | 30,723 | | |
Custodian fees | | | 450,809 | | |
Printing and postage fees | | | 245,022 | | |
Registration fees | | | 115,672 | | |
Professional fees | | | 85,152 | | |
Chief compliance officer expenses | | | 450 | | |
Other | | | 94,108 | | |
Total expenses | | | 12,919,218 | | |
Fees waived or expenses reimbursed by Investment Manager and its affiliates | | | (531,115 | ) | |
Expense reductions | | | (3,600 | ) | |
Total net expenses | | | 12,384,503 | | |
Net investment income | | | 7,659,031 | | |
Realized and unrealized gain (loss) — net | |
Net realized gain (loss) on: | |
Investments | | | (4,567,528 | ) | |
Foreign currency translations | | | (2,231,491 | ) | |
Net realized loss | | | (6,799,019 | ) | |
Net change in unrealized appreciation (depreciation) on: | |
Investments | | | (94,693,687 | ) | |
Foreign currency translations | | | (19,088 | ) | |
Foreign capital gains tax | | | 2,002,125 | | |
Net change in unrealized appreciation (depreciation) | | | (92,710,650 | ) | |
Net realized and unrealized loss | | | (99,509,669 | ) | |
Net decrease in net assets from operations | | $ | (91,850,638 | ) | |
(a) Class B shares and Class K shares are for the period from February 28, 2013 (commencement of operations) to August 31, 2013.
(b) Class R4 shares are for the period from March 19, 2013 (commencement of operations) to August 31, 2013.
(c) Class R5 shares are for the period from November 8, 2012 (commencement of operations) to August 31, 2013.
The accompanying Notes to Financial Statements are an integral part of this statement.
Annual Report 2013
17
Columbia Emerging Markets Fund
Statement of Changes in Net Assets
| | | Year Ended
August 31,
2013(a) | | Year Ended
August 31,
2012(b) | | Year Ended
March 31,
2012 | |
Operations | |
Net investment income | | $ | 7,659,031 | | | $ | 3,367,642 | | | $ | 3,450,760 | | |
Net realized gain (loss) | | | (6,799,019 | ) | | | (10,607,643 | ) | | | 19,330,314 | | |
Net change in unrealized appreciation (depreciation) | | | (92,710,650 | ) | | | (16,444,132 | ) | | | (65,783,832 | ) | |
Net decrease in net assets resulting from operations | | | (91,850,638 | ) | | | (23,684,133 | ) | | | (43,002,758 | ) | |
Distributions to shareholders | |
Net investment income | |
Class A | | | (52,693 | ) | | | — | | | | — | | |
Class C | | | (4,710 | ) | | | — | | | | — | | |
Class I | | | (1,395,035 | ) | | | — | | | | — | | |
Class R | | | (1,660 | ) | | | — | | | | — | | |
Class R5 | | | (15 | ) | | | — | | | | — | | |
Class W | | | (147,818 | ) | | | — | | | | — | | |
Class Y | | | (16 | ) | | | — | | | | — | | |
Class Z | | | (1,091,744 | ) | | | — | | | | — | | |
Net realized gains | |
Class A | | | — | | | | (512,127 | ) | | | (592,509 | ) | |
Class C | | | — | | | | (127,996 | ) | | | (98,528 | ) | |
Class I | | | — | | | | (10,754,774 | ) | | | (4,482,137 | ) | |
Class R | | | — | | | | (22,097 | ) | | | (121 | ) | |
Class W | | | — | | | | (1,438,404 | ) | | | (2,457,505 | ) | |
Class Z | | | — | | | | (8,210,326 | ) | | | (15,459,948 | ) | |
Total distributions to shareholders | | | (2,693,691 | ) | | | (21,065,724 | ) | | | (23,090,748 | ) | |
Increase (decrease) in net assets from capital stock activity | | | 838,326,071 | | | | 37,390,292 | | | | 37,201,115 | | |
Total increase (decrease) in net assets | | | 743,781,742 | | | | (7,359,565 | ) | | | (28,892,391 | ) | |
Net assets at beginning of year | | | 460,131,327 | | | | 467,490,892 | | | | 496,383,283 | | |
Net assets at end of year | | $ | 1,203,913,069 | | | $ | 460,131,327 | | | $ | 467,490,892 | | |
Undistributed (excess of distributions over) net investment income | | $ | 4,297,316 | | | $ | 2,472,104 | | | $ | (897,513 | ) | |
(a) Class R5 shares and Class Y shares are for the period from November 8, 2012 (commencement of operations) to August 31, 2013.
(b) For the period from April 1, 2012 to August 31, 2012. During the period, the Fund's fiscal year end was changed from March 31 to August 31.
The accompanying Notes to Financial Statements are an integral part of this statement.
Annual Report 2013
18
Columbia Emerging Markets Fund
Statement of Changes in Net Assets (continued)
| | | Year Ended August 31,
2013(a)(b)(c) | | Year Ended August 31,
2012(d) | | Year Ended March 31,
2012 | |
| | | Shares | | Dollars ($) | | Shares | | Dollars ($) | | Shares | | Dollars ($) | |
Capital stock activity | |
Class A shares | |
Subscriptions(e) | | | 2,636,881 | | | | 26,583,598 | | | | 162,311 | | | | 1,508,117 | | | | 555,663 | | | | 5,446,196 | | |
Fund merger | | | 32,834,274 | | | | 343,952,533 | | | | — | | | | — | | | | — | | | | — | | |
Distributions reinvested | | | 4,600 | | | | 47,103 | | | | 53,170 | | | | 458,327 | | | | 44,090 | | | | 458,094 | | |
Redemptions | | | (3,791,329 | ) | | | (37,797,872 | ) | | | (209,407 | ) | | | (1,946,160 | ) | | | (453,183 | ) | | | (4,533,244 | ) | |
Net increase | | | 31,684,426 | | | | 332,785,362 | | | | 6,074 | | | | 20,284 | | | | 146,570 | | | | 1,371,046 | | |
Class B shares | |
Subscriptions | | | 23,449 | | | | 233,508 | | | | — | | | | — | | | | — | | | | — | | |
Fund merger | | | 1,298,485 | | | | 13,280,157 | | | | — | | | | — | | | | — | | | | — | | |
Redemptions(e) | | | (341,790 | ) | | | (3,267,161 | ) | | | — | | | | — | | | | — | | | | — | | |
Net increase | | | 980,144 | | | | 10,246,504 | | | | — | | | | — | | | | — | | | | — | | |
Class C shares | |
Subscriptions | | | 474,898 | | | | 4,689,298 | | | | 66,130 | | | | 597,104 | | | | 196,797 | | | | 1,842,538 | | |
Fund merger | | | 2,350,220 | | | | 24,070,065 | | | | — | | | | — | | | | — | | | | — | | |
Distributions reinvested | | | 434 | | | | 4,355 | | | | 13,992 | | | | 118,375 | | | | 7,347 | | | | 75,603 | | |
Redemptions | | | (474,174 | ) | | | (4,602,908 | ) | | | (55,595 | ) | | | (489,620 | ) | | | (95,911 | ) | | | (934,131 | ) | |
Net increase | | | 2,351,378 | | | | 24,160,810 | | | | 24,527 | | | | 225,859 | | | | 108,233 | | | | 984,010 | | |
Class I shares | |
Subscriptions | | | 535,621 | | | | 5,294,155 | | | | 4,799,454 | | | | 47,189,400 | | | | 17,888,097 | | | | 179,326,082 | | |
Fund merger | | | 1,255 | | | | 13,231 | | | | — | | | | — | | | | — | | | | — | | |
Distributions reinvested | | | 135,571 | | | | 1,395,022 | | | | 1,241,880 | | | | 10,754,682 | | | | 430,963 | | | | 4,482,016 | | |
Redemptions | | | (6,842,882 | ) | | | (67,045,926 | ) | | | (1,156,924 | ) | | | (10,483,515 | ) | | | (6,063,738 | ) | | | (63,290,156 | ) | |
Net increase (decrease) | | | (6,170,435 | ) | | | (60,343,518 | ) | | | 4,884,410 | | | | 47,460,567 | | | | 12,255,322 | | | | 120,517,942 | | |
Class K shares | |
Subscriptions | | | 267 | | | | 2,768 | | | | — | | | | — | | | | — | | | | — | | |
Fund merger | | | 56,204 | | | | 589,942 | | | | — | | | | — | | | | — | | | | — | | |
Redemptions | | | (1,232 | ) | | | (12,270 | ) | | | — | | | | — | | | | — | | | | — | | |
Net increase | | | 55,239 | | | | 580,440 | | | | — | | | | — | | | | — | | | | — | | |
Class R shares | |
Subscriptions | | | 180,415 | | | | 1,796,815 | | | | 4,178 | | | | 38,451 | | | | 54,120 | | | | 491,245 | | |
Fund merger | | | 604,088 | | | | 6,305,185 | | | | — | | | | — | | | | — | | | | — | | |
Distributions reinvested | | | 162 | | | | 1,653 | | | | 2,559 | | | | 22,006 | | | | — | | | | — | | |
Redemptions | | | (194,289 | ) | | | (1,947,977 | ) | | | (3,907 | ) | | | (35,413 | ) | | | (2,915 | ) | | | (28,812 | ) | |
Net increase | | | 590,376 | | | | 6,155,676 | | | | 2,830 | | | | 25,044 | | | | 51,205 | | | | 462,433 | | |
Class R4 shares | |
Subscriptions | | | 4,043 | | | | 41,531 | | | | — | | | | — | | | | — | | | | — | | |
Net increase | | | 4,043 | | | | 41,531 | | | | — | | | | — | | | | — | | | | — | | |
The accompanying Notes to Financial Statements are an integral part of this statement.
Annual Report 2013
19
Columbia Emerging Markets Fund
Statement of Changes in Net Assets (continued)
| | | Year Ended August 31,
2013(a)(b)(c) | | Year Ended August 31,
2012(d) | | Year Ended March 31,
2012 | |
| | | Shares | | Dollars ($) | | Shares | | Dollars ($) | | Shares | | Dollars ($) | |
Capital stock activity (continued) | |
Class R5 shares | |
Subscriptions | | | 157,427 | | | | 1,641,613 | | | | — | | | | — | | | | — | | | | — | | |
Fund merger | | | 7,415 | | | | 78,238 | | | | — | | | | — | | | | — | | | | — | | |
Redemptions | | | (15,102 | ) | | | (150,186 | ) | | | — | | | | — | | | | — | | | | — | | |
Net increase | | | 149,740 | | | | 1,569,665 | | | | — | | | | — | | | | — | | | | — | | |
Class W shares | |
Subscriptions | | | 1,198,209 | | | | 11,876,193 | | | | 592,737 | | | | 5,381,728 | | | | 2,191,717 | | | | 22,357,223 | | |
Fund merger | | | 2,037 | | | | 21,335 | | | | — | | | | — | | | | — | | | | — | | |
Distributions reinvested | | | 14,449 | | | | 147,809 | | | | 166,858 | | | | 1,438,313 | | | | 236,514 | | | | 2,457,384 | | |
Redemptions | | | (1,239,286 | ) | | | (12,558,608 | ) | | | (377,133 | ) | | | (3,465,882 | ) | | | (3,750,857 | ) | | | (36,168,400 | ) | |
Net increase (decrease) | | | (24,591 | ) | | | (513,271 | ) | | | 382,462 | | | | 3,354,159 | | | | (1,322,626 | ) | | | (11,353,793 | ) | |
Class Y shares | |
Subscriptions | | | 77,955 | | | | 746,157 | | | | — | | | | — | | | | — | | | | — | | |
Redemptions | | | (27,659 | ) | | | (268,119 | ) | | | — | | | | — | | | | — | | | | — | | |
Net increase | | | 50,296 | | | | 478,038 | | | | — | | | | — | | | | — | | | | — | | |
Class Z shares | |
Subscriptions | | | 60,811,078 | | | | 617,216,504 | | | | 941,857 | | | | 8,507,338 | | | | 3,480,320 | | | | 34,454,928 | | |
Fund merger | | | 294,617 | | | | 3,095,702 | | | | — | | | | — | | | | — | | | | — | | |
Distributions reinvested | | | 64,663 | | | | 664,735 | | | | 635,329 | | | | 5,495,596 | | | | 889,517 | | | | 9,250,974 | | |
Redemptions | | | (9,939,321 | ) | | | (97,812,107 | ) | | | (3,000,548 | ) | | | (27,698,555 | ) | | | (12,230,897 | ) | | | (118,486,425 | ) | |
Net increase (decrease) | | | 51,231,037 | | | | 523,164,834 | | | | (1,423,362 | ) | | | (13,695,621 | ) | | | (7,861,060 | ) | | | (74,780,523 | ) | |
Total net increase | | | 80,901,653 | | | | 838,326,071 | | | | 3,876,941 | | | | 37,390,292 | | | | 3,377,644 | | | | 37,201,115 | | |
(a) Class B and Class K shares are for the period from February 28, 2013 (commencement of operations) to August 31, 2013.
(b) Class R4 shares are for the period from March 19, 2013 (commencement of operations) to August 31, 2013.
(c) Class R5 and Class Y shares are for the period from November 8, 2012 (commencement of operations) to August 31, 2013.
(d) For the period from April 1, 2012 to August 31, 2012. During the period, the Fund's fiscal year end was changed from March 31 to August 31.
(e) Includes conversions of Class B shares to Class A shares, if any.
The accompanying Notes to Financial Statements are an integral part of this statement.
Annual Report 2013
20
Columbia Emerging Markets Fund
The following tables are intended to help you understand the Fund's financial performance. Certain information reflects financial results for a single share of a class held for the periods shown. Per share net investment income (loss) amounts are calculated based on average shares outstanding during the period. Total return assumes reinvestment of all dividends and distributions, if any. Total return does not reflect payment of sales charges, if any, and is not annualized for periods of less than one year.
| | | Year Ended August 31, | | Year Ended March 31, | |
Class A | | 2013 | | 2012(a) | | 2012 | | 2011 | | 2010 | | 2009 | |
Per share data | |
Net asset value, beginning of period | | $ | 9.08 | | | $ | 10.01 | | | $ | 11.48 | | | $ | 11.27 | | | $ | 6.42 | | | $ | 14.96 | | |
Income from investment operations: | |
Net investment income (loss) | | | 0.14 | | | | 0.05 | | | | 0.05 | | | | 0.01 | | | | (0.01 | ) | | | 0.07 | | |
Net realized and unrealized gain (loss) | | | (0.05 | ) | | | (0.55 | ) | | | (0.95 | ) | | | 1.75 | | | | 5.00 | | | | (6.36 | ) | |
Total from investment operations | | | 0.09 | | | | (0.50 | ) | | | (0.90 | ) | | | 1.76 | | | | 4.99 | | | | (6.29 | ) | |
Less distributions to shareholders: | |
Net investment income | | | (0.04 | ) | | | — | | | | — | | | | (0.09 | ) | | | (0.14 | ) | | | — | | |
Net realized gains | | | — | | | | (0.43 | ) | | | (0.57 | ) | | | (1.46 | ) | | | — | | | | (2.26 | ) | |
Total distributions to shareholders | | | (0.04 | ) | | | (0.43 | ) | | | (0.57 | ) | | | (1.55 | ) | | | (0.14 | ) | | | (2.26 | ) | |
Redemption fees: | |
Redemption fees added to paid-in capital | | | — | | | | — | | | | — | | | | — | | | | 0.00 | (b) | | | 0.01 | | |
Net asset value, end of period | | $ | 9.13 | | | $ | 9.08 | | | $ | 10.01 | | | $ | 11.48 | | | $ | 11.27 | | | $ | 6.42 | | |
Total return | | | 0.98 | % | | | (4.80 | %) | | | (8.06 | %) | | | 16.74 | % | | | 78.17 | % | | | (49.44 | %) | |
Ratios to average net assets(c)(d) | |
Total gross expenses | | | 1.76 | % | | | 2.08 | %(e) | | | 2.08 | %(f) | | | 1.96 | %(f) | | | 1.77 | %(f) | | | 2.14 | %(g) | |
Total net expenses(h) | | | 1.75 | %(i) | | | 1.92 | %(e)(i) | | | 1.87 | %(f)(i) | | | 1.65 | %(f)(i) | | | 1.74 | %(f)(i) | | | 1.96 | %(g)(i) | |
Net investment income (loss) | | | 1.42 | % | | | 1.41 | %(e) | | | 0.54 | % | | | 0.07 | % | | | (0.12 | %) | | | 0.71 | % | |
Supplemental data | |
Net assets, end of period (in thousands) | | $ | 300,601 | | | $ | 11,177 | | | $ | 12,260 | | | $ | 12,388 | | | $ | 6,362 | | | $ | 917 | | |
Portfolio turnover | | | 81 | % | | | 35 | % | | | 117 | % | | | 78 | % | | | 74 | % | | | 82 | % | |
Notes to Financial Highlights
(a) For the period from April 1, 2012 to August 31, 2012. During the period, the Fund's fiscal year end was changed from March 31 to August 31.
(b) Rounds to zero.
(c) In addition to the fees and expenses which the Fund bears directly, the Fund indirectly bears a pro rata share of the fees and expenses of the acquired funds in which it invests. Such indirect expenses are not included in the reported expense ratios.
(d) Certain line items from prior years have been reclassified to conform to the current presentation.
(e) Annualized.
(f) Ratios include line of credit interest expense which rounds to less than 0.01%.
(g) Ratios include line of credit interest expense. If line of credit interest expense had been excluded, expenses would have been lower by 0.01% for the year ended March 31, 2009.
(h) Total net expenses include the impact of certain waivers/reimbursements made by the Investment Manager and certain of its affiliates, if applicable.
(i) The benefits derived from expense reductions had an impact of less than 0.01%.
The accompanying Notes to Financial Statements are an integral part of this statement.
Annual Report 2013
21
Columbia Emerging Markets Fund
Financial Highlights (continued)
Class B | | Year Ended
August 31,
2013(a) | |
Per share data | |
Net asset value, beginning of period | | $ | 10.17 | | |
Income from investment operations: | |
Net investment income | | | 0.04 | | |
Net realized and unrealized loss | | | (1.32 | ) | |
Total from investment operations | | | (1.28 | ) | |
Net asset value, end of period | | $ | 8.89 | | |
Total return | | | (12.59 | %) | |
Ratios to average net assets(b) | |
Total gross expenses | | | 2.49 | %(c) | |
Total net expenses(d) | | | 2.49 | %(c)(e) | |
Net investment income | | | 0.81 | %(c) | |
Supplemental data | |
Net assets, end of period (in thousands) | | $ | 8,713 | | |
Portfolio turnover | | | 81 | % | |
Notes to Financial Highlights
(a) For the period from February 28, 2013 (commencement of operations) to August 31, 2013.
(b) In addition to the fees and expenses which the Fund bears directly, the Fund indirectly bears a pro rata share of the fees and expenses of the acquired funds in which it invests. Such indirect expenses are not included in the reported expense ratios.
(c) Annualized.
(d) Total net expenses include the impact of certain waivers/reimbursements made by the Investment Manager and certain of its affiliates, if applicable.
(e) The benefits derived from expense reductions had an impact of less than 0.01%.
The accompanying Notes to Financial Statements are an integral part of this statement.
Annual Report 2013
22
Columbia Emerging Markets Fund
Financial Highlights (continued)
| | | Year Ended August 31, | | Year Ended March 31, | |
Class C | | 2013 | | 2012(a) | | 2012 | | 2011 | | 2010 | | 2009 | |
Per share data | |
Net asset value, beginning of period | | $ | 8.89 | | | $ | 9.84 | | | $ | 11.39 | | | $ | 11.21 | | | $ | 6.36 | | | $ | 14.94 | | |
Income from investment operations: | |
Net investment income (loss) | | | 0.05 | | | | 0.02 | | | | (0.03 | ) | | | (0.07 | ) | | | (0.09 | ) | | | 0.00 | (b) | |
Net realized and unrealized gain (loss) | | | (0.03 | ) | | | (0.54 | ) | | | (0.95 | ) | | | 1.73 | | | | 4.97 | | | | (6.33 | ) | |
Total from investment operations | | | 0.02 | | | | (0.52 | ) | | | (0.98 | ) | | | 1.66 | | | | 4.88 | | | | (6.33 | ) | |
Less distributions to shareholders: | |
Net investment income | | | (0.01 | ) | | | — | | | | — | | | | (0.02 | ) | | | (0.03 | ) | | | — | | |
Net realized gains | | | — | | | | (0.43 | ) | | | (0.57 | ) | | | (1.46 | ) | | | — | | | | (2.26 | ) | |
Total distributions to shareholders | | | (0.01 | ) | | | (0.43 | ) | | | (0.57 | ) | | | (1.48 | ) | | | (0.03 | ) | | | (2.26 | ) | |
Redemption fees: | |
Redemption fees added to paid-in capital | | | — | | | | — | | | | — | | | | — | | | | 0.00 | (b) | | | 0.01 | | |
Net asset value, end of period | | $ | 8.90 | | | $ | 8.89 | | | $ | 9.84 | | | $ | 11.39 | | | $ | 11.21 | | | $ | 6.36 | | |
Total return | | | 0.26 | % | | | (5.09 | %) | | | (8.86 | %) | | | 15.92 | % | | | 76.73 | % | | | (49.82 | %) | |
Ratios to average net assets(c)(d) | |
Total gross expenses | | | 2.53 | % | | | 2.83 | %(e) | | | 2.83 | %(f) | | | 2.71 | %(f) | | | 2.52 | %(f) | | | 2.89 | %(g) | |
Total net expenses(h) | | | 2.50 | %(i) | | | 2.67 | %(e)(i) | | | 2.62 | %(f)(i) | | | 2.40 | %(f)(i) | | | 2.49 | %(f)(i) | | | 2.71 | %(g)(i) | |
Net investment income (loss) | | | 0.49 | % | | | 0.65 | %(e) | | | (0.27 | %) | | | (0.62 | %) | | | (0.86 | %) | | | (0.01 | %) | |
Supplemental data | |
Net assets, end of period (in thousands) | | $ | 23,756 | | | $ | 2,820 | | | $ | 2,879 | | | $ | 2,100 | | | $ | 1,540 | | | $ | 242 | | |
Portfolio turnover | | | 81 | % | | | 35 | % | | | 117 | % | | | 78 | % | | | 74 | % | | | 82 | % | |
Notes to Financial Highlights
(a) For the period from April 1, 2012 to August 31, 2012. During the period, the Fund's fiscal year end was changed from March 31 to August 31.
(b) Rounds to zero.
(c) In addition to the fees and expenses which the Fund bears directly, the Fund indirectly bears a pro rata share of the fees and expenses of the acquired funds in which it invests. Such indirect expenses are not included in the reported expense ratios.
(d) Certain line items from prior years have been reclassified to conform to the current presentation.
(e) Annualized.
(f) Ratios include line of credit interest expense which rounds to less than 0.01%.
(g) Ratios include line of credit interest expense. If line of credit interest expense had been excluded, expenses would have been lower by 0.01% for the year ended March 31, 2009.
(h) Total net expenses include the impact of certain waivers/reimbursements made by the Investment Manager and certain of its affiliates, if applicable.
(i) The benefits derived from expense reductions had an impact of less than 0.01%.
The accompanying Notes to Financial Statements are an integral part of this statement.
Annual Report 2013
23
Columbia Emerging Markets Fund
Financial Highlights (continued)
| | | Year Ended August 31, | | Year Ended March 31, | |
Class I | | 2013 | | 2012(a) | | 2012 | | 2011(b) | |
Per share data | |
Net asset value, beginning of period | | $ | 9.13 | | | $ | 10.04 | | | $ | 11.48 | | | $ | 11.71 | | |
Income from investment operations: | |
Net investment income (loss) | | | 0.08 | | | | 0.07 | | | | 0.06 | | | | (0.01 | ) | |
Net realized and unrealized gain (loss) | | | 0.06 | (c) | | | (0.55 | ) | | | (0.93 | ) | | | 0.88 | | |
Total from investment operations | | | 0.14 | | | | (0.48 | ) | | | (0.87 | ) | | | 0.87 | | |
Less distributions to shareholders: | |
Net investment income | | | (0.06 | ) | | | — | | | | — | | | | (0.10 | ) | |
Net realized gains | | | — | | | | (0.43 | ) | | | (0.57 | ) | | | (1.00 | ) | |
Total distributions to shareholders | | | (0.06 | ) | | | (0.43 | ) | | | (0.57 | ) | | | (1.10 | ) | |
Net asset value, end of period | | $ | 9.21 | | | $ | 9.13 | | | $ | 10.04 | | | $ | 11.48 | | |
Total return | | | 1.47 | % | | | (4.58 | %) | | | (7.79 | %) | | | 7.75 | % | |
Ratios to average net assets(d)(e) | |
Total gross expenses | | | 1.37 | % | | | 1.53 | %(f) | | | 1.56 | %(g) | | | 1.59 | %(f)(g) | |
Total net expenses(h) | | | 1.29 | % | | | 1.48 | %(f) | | | 1.51 | %(g) | | | 1.33 | %(f)(g) | |
Net investment income (loss) | | | 0.75 | % | | | 1.86 | %(f) | | | 0.65 | % | | | (0.09 | %)(f) | |
Supplemental data | |
Net assets, end of period (in thousands) | | $ | 184,937 | | | $ | 239,618 | | | $ | 214,524 | | | $ | 104,595 | | |
Portfolio turnover | | | 81 | % | | | 35 | % | | | 117 | % | | | 78 | % | |
Notes to Financial Highlights
(a) For the period from April 1, 2012 to August 31, 2012. During the period, the Fund's fiscal year end was changed from March 31 to August 31.
(b) For the period from September 27, 2010 (commencement of operations) to March 31, 2011.
(c) Calculation of the net gain (loss) per share (both realized and unrealized) does not correlate to the aggregate realized and unrealized gain (loss) presented in the Statement of Operations due to the timing of sales and repurchases of Fund shares in relation to fluctuations in the market value of the portfolio.
(d) In addition to the fees and expenses which the Fund bears directly, the Fund indirectly bears a pro rata share of the fees and expenses of the acquired funds in which it invests. Such indirect expenses are not included in the reported expense ratios.
(e) Certain line items from prior years have been reclassified to conform to the current presentation.
(f) Annualized.
(g) Ratios include line of credit interest expense which rounds to less than 0.01%.
(h) Total net expenses include the impact of certain waivers/reimbursements made by the Investment Manager and certain of its affiliates, if applicable.
The accompanying Notes to Financial Statements are an integral part of this statement.
Annual Report 2013
24
Columbia Emerging Markets Fund
Financial Highlights (continued)
Class K | | Year Ended
August 31,
2013(a) | |
Per share data | |
Net asset value, beginning of period | | $ | 10.44 | | |
Income from investment operations: | |
Net investment income | | | 0.11 | | |
Net realized and unrealized loss | | | (1.38 | ) | |
Total from investment operations | | | (1.27 | ) | |
Net asset value, end of period | | $ | 9.17 | | |
Total return | | | (12.16 | %) | |
Ratios to average net assets(b) | |
Total gross expenses | | | 1.51 | %(c) | |
Total net expenses(d) | | | 1.51 | %(c) | |
Net investment income | | | 2.21 | %(c) | |
Supplemental data | |
Net assets, end of period (in thousands) | | $ | 506 | | |
Portfolio turnover | | | 81 | % | |
Notes to Financial Highlights
(a) For the period from February 28, 2013 (commencement of operations) to August 31, 2013.
(b) In addition to the fees and expenses which the Fund bears directly, the Fund indirectly bears a pro rata share of the fees and expenses of the acquired funds in which it invests. Such indirect expenses are not included in the reported expense ratios.
(c) Annualized.
(d) Total net expenses include the impact of certain waivers/reimbursements made by the Investment Manager and certain of its affiliates, if applicable.
The accompanying Notes to Financial Statements are an integral part of this statement.
Annual Report 2013
25
Columbia Emerging Markets Fund
Financial Highlights (continued)
| | | Year Ended August 31, | | Year Ended March 31, | |
Class R | | 2013 | | 2012(a) | | 2012 | | 2011(b) | |
Per share data | |
Net asset value, beginning of period | | $ | 9.06 | | | $ | 9.99 | | | $ | 11.49 | | | $ | 11.70 | | |
Income from investment operations: | |
Net investment income (loss) | | | 0.11 | | | | 0.04 | | | | (0.06 | ) | | | (0.06 | ) | |
Net realized and unrealized gain (loss) | | | (0.05 | ) | | | (0.54 | ) | | | (0.87 | ) | | | 0.91 | | |
Total from investment operations | | | 0.06 | | | | (0.50 | ) | | | (0.93 | ) | | | 0.85 | | |
Less distributions to shareholders: | |
Net investment income | | | (0.03 | ) | | | — | | | | — | | | | (0.06 | ) | |
Net realized gains | | | — | | | | (0.43 | ) | | | (0.57 | ) | | | (1.00 | ) | |
Total distributions to shareholders | | | (0.03 | ) | | | (0.43 | ) | | | (0.57 | ) | | | (1.06 | ) | |
Net asset value, end of period | | $ | 9.09 | | | $ | 9.06 | | | $ | 9.99 | | | $ | 11.49 | | |
Total return | | | 0.67 | % | | | (4.81 | %) | | | (8.32 | %) | | | 7.50 | % | |
Ratios to average net assets(c)(d) | |
Total gross expenses | | | 2.02 | % | | | 2.33 | %(e) | | | 2.37 | %(f) | | | 2.21 | %(e)(f) | |
Total net expenses(g) | | | 2.00 | %(h) | | | 2.17 | %(e)(h) | | | 2.20 | %(f)(h) | | | 1.91 | %(e)(f)(h) | |
Net investment income (loss) | | | 1.09 | % | | | 1.15 | %(e) | | | (0.58 | %) | | | (0.97 | %)(e) | |
Supplemental data | |
Net assets, end of period (in thousands) | | $ | 5,863 | | | $ | 491 | | | $ | 514 | | | $ | 2 | | |
Portfolio turnover | | | 81 | % | | | 35 | % | | | 117 | % | | | 78 | % | |
Notes to Financial Highlights
(a) For the period from April 1, 2012 to August 31, 2012. During the period, the Fund's fiscal year end was changed from March 31 to August 31.
(b) For the period from September 27, 2010 (commencement of operations) to March 31, 2011.
(c) In addition to the fees and expenses which the Fund bears directly, the Fund indirectly bears a pro rata share of the fees and expenses of the acquired funds in which it invests. Such indirect expenses are not included in the reported expense ratios.
(d) Certain line items from prior years have been reclassified to conform to the current presentation.
(e) Annualized.
(f) Ratios include line of credit interest expense which rounds to less than 0.01%.
(g) Total net expenses include the impact of certain waivers/reimbursements made by the Investment Manager and certain of its affiliates, if applicable.
(h) The benefits derived from expense reductions had an impact of less than 0.01%.
The accompanying Notes to Financial Statements are an integral part of this statement.
Annual Report 2013
26
Columbia Emerging Markets Fund
Financial Highlights (continued)
Class R4 | | Year Ended
August 31,
2013(a) | |
Per share data | |
Net asset value, beginning of period | | $ | 10.42 | | |
Income from investment operations: | |
Net investment income | | | 0.06 | | |
Net realized and unrealized loss | | | (1.24 | ) | |
Total from investment operations | | | (1.18 | ) | |
Net asset value, end of period | | $ | 9.24 | | |
Total return | | | (11.32 | %) | |
Ratios to average net assets(b) | |
Total gross expenses | | | 1.54 | %(c) | |
Total net expenses(d) | | | 1.53 | %(c)(e) | |
Net investment income | | | 1.31 | %(c) | |
Supplemental data | |
Net assets, end of period (in thousands) | | $ | 37 | | |
Portfolio turnover | | | 81 | % | |
Notes to Financial Highlights
(a) For the period from March 19, 2013 (commencement of operations) to August 31, 2013.
(b) In addition to the fees and expenses which the Fund bears directly, the Fund indirectly bears a pro rata share of the fees and expenses of the acquired funds in which it invests. Such indirect expenses are not included in the reported expense ratios.
(c) Annualized.
(d) Total net expenses include the impact of certain waivers/reimbursements made by the Investment Manager and certain of its affiliates, if applicable.
(e) The benefits derived from expense reductions had an impact of less than 0.01%.
The accompanying Notes to Financial Statements are an integral part of this statement.
Annual Report 2013
27
Columbia Emerging Markets Fund
Financial Highlights (continued)
Class R5 | | Year Ended
August 31,
2013(a) | |
Per share data | |
Net asset value, beginning of period | | $ | 9.72 | | |
Income from investment operations: | |
Net investment income | | | 0.13 | | |
Net realized and unrealized loss | | | (0.57 | ) | |
Total from investment operations | | | (0.44 | ) | |
Less distributions to shareholders: | |
Net investment income | | | (0.06 | ) | |
Total distributions to shareholders | | | (0.06 | ) | |
Net asset value, end of period | | $ | 9.22 | | |
Total return | | | (4.60 | %) | |
Ratios to average net assets(b) | |
Total gross expenses | | | 1.32 | %(c) | |
Total net expenses(d) | | | 1.29 | %(c) | |
Net investment income | | | 1.65 | %(c) | |
Supplemental data | |
Net assets, end of period (in thousands) | | $ | 1,381 | | |
Portfolio turnover | | | 81 | % | |
Notes to Financial Highlights
(a) For the period from November 8, 2012 (commencement of operations) to August 31, 2013.
(b) In addition to the fees and expenses which the Fund bears directly, the Fund indirectly bears a pro rata share of the fees and expenses of the acquired funds in which it invests. Such indirect expenses are not included in the reported expense ratios.
(c) Annualized.
(d) Total net expenses include the impact of certain waivers/reimbursements made by the Investment Manager and certain of its affiliates, if applicable.
The accompanying Notes to Financial Statements are an integral part of this statement.
Annual Report 2013
28
Columbia Emerging Markets Fund
Financial Highlights (continued)
| | | Year Ended August 31, | | Year Ended March 31, | |
Class W | | 2013 | | 2012(a) | | 2012 | | 2011(b) | |
Per share data | |
Net asset value, beginning of period | | $ | 9.07 | | | $ | 10.00 | | | $ | 11.48 | | | $ | 11.70 | | |
Income from investment operations: | |
Net investment income (loss) | | | 0.02 | | | | 0.05 | | | | 0.07 | | | | (0.02 | ) | |
Net realized and unrealized gain (loss) | | | 0.08 | (c) | | | (0.55 | ) | | | (0.98 | ) | | | 0.88 | | |
Total from investment operations | | | 0.10 | | | | (0.50 | ) | | | (0.91 | ) | | | 0.86 | | |
Less distributions to shareholders: | |
Net investment income | | | (0.04 | ) | | | — | | | | — | | | | (0.08 | ) | |
Net realized gains | | | — | | | | (0.43 | ) | | | (0.57 | ) | | | (1.00 | ) | |
Total distributions to shareholders | | | (0.04 | ) | | | (0.43 | ) | | | (0.57 | ) | | | (1.08 | ) | |
Net asset value, end of period | | $ | 9.13 | | | $ | 9.07 | | | $ | 10.00 | | | $ | 11.48 | | |
Total return | | | 1.09 | % | | | (4.81 | %) | | | (8.15 | %) | | | 7.61 | % | |
Ratios to average net assets(d)(e) | |
Total gross expenses | | | 1.91 | % | | | 2.09 | %(f) | | | 2.09 | %(g) | | | 1.95 | %(f)(g) | |
Total net expenses(h) | | | 1.77 | %(i) | | | 1.92 | %(f)(i) | | | 1.85 | %(g)(i) | | | 1.65 | %(f)(g)(i) | |
Net investment income (loss) | | | 0.25 | % | | | 1.41 | %(f) | | | 0.73 | % | | | (0.41 | %)(f) | |
Supplemental data | |
Net assets, end of period (in thousands) | | $ | 31,426 | | | $ | 31,470 | | | $ | 30,863 | | | $ | 50,623 | | |
Portfolio turnover | | | 81 | % | | | 35 | % | | | 117 | % | | | 78 | % | |
Notes to Financial Highlights
(a) For the period from April 1, 2012 to August 31, 2012. During the period, the Fund's fiscal year end was changed from March 31 to August 31.
(b) For the period from September 27, 2010 (commencement of operations) to March 31, 2011.
(c) Calculation of the net gain (loss) per share (both realized and unrealized) does not correlate to the aggregate realized and unrealized gain (loss) presented in the Statement of Operations due to the timing of sales and repurchases of Fund shares in relation to fluctuations in the market value of the portfolio.
(d) In addition to the fees and expenses which the Fund bears directly, the Fund indirectly bears a pro rata share of the fees and expenses of the acquired funds in which it invests. Such indirect expenses are not included in the reported expense ratios.
(e) Certain line items from prior years have been reclassified to conform to the current presentation.
(f) Annualized.
(g) Ratios include line of credit interest expense which rounds to less than 0.01%.
(h) Total net expenses include the impact of certain waivers/reimbursements made by the Investment Manager and certain of its affiliates, if applicable.
(i) The benefits derived from expense reductions had an impact of less than 0.01%.
The accompanying Notes to Financial Statements are an integral part of this statement.
Annual Report 2013
29
Columbia Emerging Markets Fund
Financial Highlights (continued)
Class Y | | Year Ended
August 31,
2013(a) | |
Per share data | |
Net asset value, beginning of period | | $ | 9.74 | | |
Income from investment operations: | |
Net investment income | | | 0.09 | | |
Net realized and unrealized loss | | | (0.53 | ) | |
Total from investment operations | | | (0.44 | ) | |
Less distributions to shareholders: | |
Net investment income | | | (0.06 | ) | |
Total distributions to shareholders | | | (0.06 | ) | |
Net asset value, end of period | | $ | 9.24 | | |
Total return | | | (4.57 | %) | |
Ratios to average net assets(b) | |
Total gross expenses | | | 1.31 | %(c) | |
Total net expenses(d) | | | 1.31 | %(c) | |
Net investment income | | | 1.16 | %(c) | |
Supplemental data | |
Net assets, end of period (in thousands) | | $ | 465 | | |
Portfolio turnover | | | 81 | % | |
Notes to Financial Highlights
(a) For the period from November 8, 2012 (commencement of operations) to August 31, 2013.
(b) In addition to the fees and expenses which the Fund bears directly, the Fund indirectly bears a pro rata share of the fees and expenses of the acquired funds in which it invests. Such indirect expenses are not included in the reported expense ratios.
(c) Annualized.
(d) Total net expenses include the impact of certain waivers/reimbursements made by the Investment Manager and certain of its affiliates, if applicable.
The accompanying Notes to Financial Statements are an integral part of this statement.
Annual Report 2013
30
Columbia Emerging Markets Fund
Financial Highlights (continued)
| | | Year Ended August 31, | | Year Ended March 31, | |
Class Z | | 2013 | | 2012(a) | | 2012 | | 2011 | | 2010 | | 2009 | |
Per share data | |
Net asset value, beginning of period | | $ | 9.11 | | | $ | 10.03 | | | $ | 11.49 | | | $ | 11.26 | | | $ | 6.42 | | | $ | 14.94 | | |
Income from investment operations: | |
Net investment income | | | 0.09 | | | | 0.06 | | | | 0.09 | | | | 0.06 | | | | 0.05 | | | | 0.11 | | |
Net realized and unrealized gain (loss) | | | 0.03 | (b) | | | (0.55 | ) | | | (0.98 | ) | | | 1.74 | | | | 4.97 | | | | (6.38 | ) | |
Total from investment operations | | | 0.12 | | | | (0.49 | ) | | | (0.89 | ) | | | 1.80 | | | | 5.02 | | | | (6.27 | ) | |
Less distributions to shareholders: | |
Net investment income | | | (0.05 | ) | | | — | | | | — | | | | (0.11 | ) | | | (0.18 | ) | | | — | | |
Net realized gains | | | — | | | | (0.43 | ) | | | (0.57 | ) | | | (1.46 | ) | | | — | | | | (2.26 | ) | |
Total distributions to shareholders | | | (0.05 | ) | | | (0.43 | ) | | | (0.57 | ) | | | (1.57 | ) | | | (0.18 | ) | | | (2.26 | ) | |
Redemption fees: | |
Redemption fees added to paid-in capital | | | — | | | | — | | | | — | | | | — | | | | 0.00 | (c) | | | 0.01 | | |
Net asset value, end of period | | $ | 9.18 | | | $ | 9.11 | | | $ | 10.03 | | | $ | 11.49 | | | $ | 11.26 | | | $ | 6.42 | | |
Total return | | | 1.29 | % | | | (4.69 | %) | | | (7.96 | %) | | | 17.16 | % | | | 78.84 | % | | | (49.37 | %) | |
Ratios to average net assets(d)(e) | |
Total gross expenses | | | 1.60 | % | | | 1.83 | %(f) | | | 1.83 | %(g) | | | 1.71 | %(g) | | | 1.52 | %(g) | | | 1.89 | %(h) | |
Total net expenses(i) | | | 1.52 | %(j) | | | 1.67 | %(f)(j) | | | 1.61 | %(g)(j) | | | 1.40 | %(g)(j) | | | 1.49 | %(g)(j) | | | 1.71 | %(h)(j) | |
Net investment income | | | 0.94 | % | | | 1.65 | %(f) | | | 0.87 | % | | | 0.52 | % | | | 0.47 | % | | | 1.01 | % | |
Supplemental data | |
Net assets, end of period (in thousands) | | $ | 646,228 | | | $ | 174,554 | | | $ | 206,451 | | | $ | 326,675 | | | $ | 396,849 | | | $ | 237,412 | | |
Portfolio turnover | | | 81 | % | | | 35 | % | | | 117 | % | | | 78 | % | | | 74 | % | | | 82 | % | |
Notes to Financial Highlights
(a) For the period from April 1, 2012 to August 31, 2012. During the period, the Fund's fiscal year end was changed from March 31 to August 31.
(b) Calculation of the net gain (loss) per share (both realized and unrealized) does not correlate to the aggregate realized and unrealized gain (loss) presented in the Statement of Operations due to the timing of sales and repurchases of Fund shares in relation to fluctuations in the market value of the portfolio.
(c) Rounds to zero.
(d) In addition to the fees and expenses which the Fund bears directly, the Fund indirectly bears a pro rata share of the fees and expenses of the acquired funds in which it invests. Such indirect expenses are not included in the reported expense ratios.
(e) Certain line items from prior years have been reclassified to conform to the current presentation.
(f) Annualized.
(g) Ratios include line of credit interest expense which rounds to less than 0.01%.
(h) Ratios include line of credit interest expense. If line of credit interest expense had been excluded, expenses would have been lower by 0.01% for the year ended March 31, 2009.
(i) Total net expenses include the impact of certain waivers/reimbursements made by the Investment Manager and certain of its affiliates, if applicable.
(j) The benefits derived from expense reductions had an impact of less than 0.01%.
The accompanying Notes to Financial Statements are an integral part of this statement.
Annual Report 2013
31
Columbia Emerging Markets Fund
Notes to Financial Statements
August 31, 2013
Note 1. Organization
Columbia Emerging Markets Fund (the Fund), a series of Columbia Funds Series Trust I (the Trust), is a diversified fund. The Trust is registered under the Investment Company Act of 1940, as amended (the 1940 Act), as an open-end management investment company organized as a Massachusetts business trust.
Fund Shares
The Trust may issue an unlimited number of shares (without par value). The Fund offers Class A, Class B, Class C, Class I, Class K, Class R, Class R4, Class R5, Class W, Class Y and Class Z shares. Although all share classes generally have identical voting, dividend and liquidation rights, each share class votes separately when required by law. Different share classes pay different distribution amounts to the extent the expenses of such share classes differ, and distributions in liquidation will be proportional to the net asset value of each share class. Each share class has its own expense structure and sales charges, as applicable.
Class A shares are subject to a maximum front-end sales charge of 5.75% based on the initial investment amount. Class A shares purchased without an initial sales charge in accounts aggregating $1 million to $50 million at the time of purchase are subject to a contingent deferred sales charge (CDSC) if the shares are sold within 18 months of purchase, charged as follows: 1.00% CDSC if redeemed within 12 months of purchase, and 0.50% CDSC if redeemed more than 12, but less than 18, months after purchase.
Class B shares may be subject to a maximum CDSC of 5.00% based upon the holding period after purchase. Class B shares will generally convert to Class A shares eight years after purchase. The Fund no longer accepts investments by new or existing investors in the Fund's Class B shares, except in connection with the reinvestment of any dividend and/or capital gain distributions in Class B shares of the Fund and exchanges by existing Class B shareholders of certain other funds within the Columbia Family of Funds. Class B shares commenced operations on February 28, 2013.
Class C shares are subject to a 1.00% CDSC on shares redeemed within one year of purchase.
Class I shares are not subject to sales charges and are available only to the Columbia Family of Funds.
Class K shares are not subject to sales charges and are closed to new investors. Class K shares commenced operations on February 28, 2013.
Class R shares are not subject to sales charges and are generally available only to certain retirement plans and other eligible investors.
Class R4 shares are not subject to sales charges and are generally available only to omnibus retirement plans and certain other eligible investors. Class R4 shares commenced operations on March 19, 2013.
Class R5 shares are not subject to sales charges and are generally available only to investors purchasing through authorized investment professionals and omnibus retirement plans. Class R5 shares commenced operations on November 8, 2012.
Class W shares are not subject to sales charges and are available only to investors purchasing through authorized investment programs managed by investment professionals, including discretionary managed account programs.
Class Y shares are not subject to sales charges and are generally available only to certain retirement plans. Class Y shares commenced operations on November 8, 2012.
Class Z shares are not subject to sales charges and are available only to certain eligible investors, which are subject to different investment minimums.
Note 2. Summary of Significant Accounting Policies
Use of Estimates
The preparation of financial statements in accordance with U.S. generally accepted accounting principles (GAAP) requires management to make certain estimates and assumptions that affect the reported amounts of assets and liabilities, the disclosure of contingent assets and liabilities at the date of the financial statements and the reported amounts of revenue and expenses during the reporting period. Actual results could differ from those estimates.
The following is a summary of significant accounting policies consistently followed by the Fund in the preparation of its financial statements.
Security Valuation
All equity securities and exchange traded funds (ETFs) are valued at the close of business of the New York Stock Exchange (NYSE). Equity securities and ETFs are valued at the last quoted sales price on the principal exchange or market on which they trade, except for securities traded on the NASDAQ Stock Market, which are valued at the NASDAQ official close price. Unlisted securities or listed securities for which there were no sales during the day are valued at the
Annual Report 2013
32
Columbia Emerging Markets Fund
Notes to Financial Statements (continued)
August 31, 2013
mean of the latest quoted bid and ask prices on such exchanges or markets.
Foreign equity securities are valued based on quotations from the principal market in which such securities are normally traded. If any foreign share prices are not readily available as a result of limited share activity the securities are valued at the mean of the latest quoted bid and ask prices on such exchanges or markets. Foreign currency exchange rates are generally determined at 4:00 p.m. Eastern (U.S.) time. However, many securities markets and exchanges outside the U.S. close prior to the close of the NYSE; therefore, the closing prices for securities in such markets or on such exchanges may not fully reflect events that occur after such close but before the close of the NYSE. In those situations, foreign securities will be fair valued pursuant to the policy adopted by the Board of Trustees (the Board), including utilizing a third party pricing service to determine these fair values. The third party pricing service takes into account multiple factors, including, but not limited to, movements in the U.S. securities markets, certain depositary receipts, futures contracts and foreign exchange rates that have occurred subsequent to the close of the foreign exchange or market, to determine a good faith estimate that reasonably reflects the current market conditions as of the close of the NYSE. The fair value of a security is likely to be different from the quoted or published price, if available.
Investments in open-end investment companies, including money market funds, are valued at net asset value.
Investments for which market quotations are not readily available, or that have quotations which management believes are not reliable, are valued at fair value as determined in good faith under consistently applied procedures established by and under the general supervision of the Board. If a security or class of securities (such as foreign securities) is valued at fair value, such value is likely to be different from the last quoted market price for the security.
The determination of fair value often requires significant judgment. To determine fair value, management may use assumptions including but not limited to future cash flows and estimated risk premiums. Multiple inputs from various sources may be used to determine fair value.
Foreign Currency Transactions and Translations
The values of all assets and liabilities denominated in foreign currencies are translated into U.S. dollars at that day's exchange rates. Net realized and unrealized gains (losses) on foreign currency transactions and translations include gains (losses) arising from the fluctuation in exchange rates between trade and settlement dates on securities transactions, gains
(losses) arising from the disposition of foreign currency and currency gains (losses) between the accrual and payment dates on dividends, interest income and foreign withholding taxes.
For financial statement purposes, the Fund does not distinguish that portion of gains (losses) on investments which is due to changes in foreign exchange rates from that which is due to changes in market prices of the investments. Such fluctuations are included with the net realized and unrealized gains (losses) on investments in the Statement of Operations.
Security Transactions
Security transactions are accounted for on the trade date. Cost is determined and gains (losses) are based upon the specific identification method for both financial statement and federal income tax purposes.
Income Recognition
Corporate actions and dividend income are generally recorded net of any non-reclaimable tax withholdings, on the ex-dividend date or upon receipt of ex-dividend notification in the case of certain foreign securities.
Awards from class action litigation are recorded as a reduction of cost basis if the Fund still owns the applicable securities on the payment date. If the Fund no longer owns the applicable securities, the proceeds are recorded as realized gains.
Expenses
General expenses of the Trust are allocated to the Fund and other funds of the Trust based upon relative net assets or other expense allocation methodologies determined by the nature of the expense. Expenses directly attributable to the Fund are charged to the Fund. Expenses directly attributable to a specific class of shares are charged to that share class.
Determination of Class Net Asset Value
All income, expenses (other than class-specific expenses, which are charged to that share class, as shown in the Statement of Operations) and realized and unrealized gains (losses) are allocated to each class of the Fund on a daily basis, based on the relative net assets of each class, for purposes of determining the net asset value of each class.
Federal Income Tax Status
The Fund intends to qualify each year as a regulated investment company under Subchapter M of the Internal Revenue Code, as amended, and will distribute substantially all of its taxable income (including net short-term capital gains), if any, for its tax year, and as such will not be subject to federal income taxes. In addition, the Fund intends to distribute in each calendar year substantially all of its net
Annual Report 2013
33
Columbia Emerging Markets Fund
Notes to Financial Statements (continued)
August 31, 2013
investment income, capital gains and certain other amounts, if any, such that the Fund should not be subject to federal excise tax. Therefore, no federal income or excise tax provision is recorded.
Foreign Taxes
The Fund may be subject to foreign taxes on income, gains on investments or currency repatriation, a portion of which may be recoverable. The Fund will accrue such taxes and recoveries, as applicable, based upon its current interpretation of tax rules and regulations that exist in the markets in which it invests.
Realized gains in certain countries may be subject to foreign taxes at the Fund level, based on statutory rates. The Fund accrues for such foreign taxes on realized and unrealized gains at the appropriate rate for each jurisdiction, as applicable. The amount, if any, is disclosed as a liability on the Statement of Assets and Liabilities.
Distributions to Shareholders
Effective June 21, 2013, distributions from net investment income, if any, are declared and paid annually. Prior to June 21, 2013, distribution from net investment income, if any, were declared and paid semi-annually. Net realized capital gains, if any, are distributed along with the income distribution. Income distributions and capital gain distributions are determined in accordance with federal income tax regulations, which may differ from GAAP.
Guarantees and Indemnifications
Under the Trust's organizational documents and, in some cases, by contract, its officers and trustees are indemnified against certain liabilities arising out of the performance of their duties to the Trust or its funds. In addition, certain of the Fund's contracts with its service providers contain general indemnification clauses. The Fund's maximum exposure under these arrangements is unknown since the amount of any future claims that may be made against the Fund cannot be determined, and the Fund has no historical basis for predicting the likelihood of any such claims.
Recent Accounting Pronouncement
Disclosures about Offsetting Assets and Liabilities
In December 2011, the Financial Accounting Standards Board (FASB) issued Accounting Standards Update (ASU) No. 2011-11, Disclosures about Offsetting Assets and Liabilities and in January 2013, ASU No. 2013-1, Clarifying the Scope of Disclosures about Offsetting Assets and Liabilities (collectively, the ASUs). Specifically, the ASUs require an entity to disclose both gross and net information for derivatives and other financial instruments that are subject to a
master netting arrangement or similar agreement. The ASUs require disclosure of collateral received in connection with the master netting agreements or similar agreements. The disclosure requirements are effective for interim and annual periods beginning on or after January 1, 2013. At this time, management is evaluating the implications of this guidance and the impact it will have on the financial statement amounts and footnote disclosures, if any.
Note 3. Fees and Compensation Paid to Affiliates
Investment Management Fees
Under an Investment Management Services Agreement, Columbia Management Investment Advisers, LLC (the Investment Manager), a wholly-owned subsidiary of Ameriprise Financial, Inc. (Ameriprise Financial), determines which securities will be purchased, held or sold. Effective March 16, 2013, the investment management fee is an annual fee that is equal to a percentage of the Fund's average daily net assets that declines from 1.10% to 0.66% as the Fund's net assets increase. Prior to March 16, 2013, the investment management fee was equal to a percentage of the Fund's average daily net assets that declined from 1.27% to 0.66% as the Fund's net assets increased. The effective investment management fee rate for the year ended August 31, 2013 was 1.11% of the Fund's average daily net assets.
Administration Fees
Under an Administrative Services Agreement, the Investment Manager also serves as the Fund Administrator. The Fund pays the Fund Administrator an annual fee for administration and accounting services equal to a percentage of the Fund's average daily net assets that declines from 0.08% to 0.06% as the Fund's net assets increase. The effective administration fee rate for the year ended August 31, 2013 was 0.08% of the Fund's average daily net assets.
Compensation of Board Members
Board members are compensated for their services to the Fund as disclosed in the Statement of Operations. The Trust's eligible Trustees may participate in a Deferred Compensation Plan (the Plan) which may be terminated at any time. Obligations of the Plan will be paid solely out of the Fund's assets.
Compensation of Chief Compliance Officer
The Board has appointed a Chief Compliance Officer to the Fund in accordance with federal securities regulations. The Fund pays its pro-rata share of the expenses associated with the Chief Compliance Officer. The Fund's expenses for the Chief Compliance Officer will not exceed $15,000 per year.
Annual Report 2013
34
Columbia Emerging Markets Fund
Notes to Financial Statements (continued)
August 31, 2013
Transfer Agent Fees
Under a Transfer and Dividend Disbursing Agent Agreement, Columbia Management Investment Services Corp. (the Transfer Agent), an affiliate of the Investment Manager and a wholly-owned subsidiary of Ameriprise Financial, is responsible for providing transfer agency services to the Fund. The Transfer Agent has contracted with Boston Financial Data Services (BFDS) to serve as sub-transfer agent.
The Transfer Agent receives monthly account-based service fees based on the number of open accounts and also receives sub-transfer agency fees based on a percentage of the average aggregate value of the Fund's shares maintained in omnibus accounts (other than omnibus accounts for which American Enterprise Investment Services Inc. is the broker of record or accounts where the beneficial shareholder is a customer of Ameriprise Financial Services, Inc., which are paid a per account fee). The Transfer Agent pays the fees of BFDS for services as sub-transfer agent and is not entitled to reimbursement for such fees from the Fund (with the exception of out-of-pocket fees).
The Transfer Agent also receives compensation from fees for various shareholder services and reimbursements for certain out-of-pocket fees. Class I shares do not pay transfer agent fees. Total transfer agent fees for Class K and Class R5 shares are subject to an annual limitation of not more than 0.05% of the average daily net assets attributable to each share class. Beginning November 8, 2012, Class Y shares are not subject to transfer agent fees for at least twelve months.
For the year ended August 31, 2013, the Fund's effective transfer agent fee rates as a percentage of average daily net assets of each class were as follows:
Class A | | | 0.28 | % | |
Class B | | | 0.27 | * | |
Class C | | | 0.28 | | |
Class K | | | 0.05 | * | |
Class R | | | 0.28 | | |
Class R4 | | | 0.28 | * | |
Class R5 | | | 0.05 | * | |
Class W | | | 0.29 | | |
Class Z | | | 0.28 | | |
*Annualized
An annual minimum account balance fee of $20 may apply to certain accounts with a value below the applicable share class' initial minimum investment requirements to reduce the impact of small accounts on transfer agent fees. These minimum account balance fees are recorded as part of expense reductions in the Statement of Operations. For the year ended
August 31, 2013, these minimum account balance fees reduced total expenses by $3,600.
Plan Administration Fees
Under a Plan Administration Services Agreement with the Transfer Agent, the Fund pays an annual fee at a rate of 0.25% of the Fund's average daily net assets attributable to Class K shares for the provision of various administrative, recordkeeping, communication and educational services.
Distribution and Service Fees
The Fund has an agreement with Columbia Management Investment Distributors, Inc. (the Distributor), an affiliate of the Investment Manager and a wholly-owned subsidiary of Ameriprise Financial, for distribution and shareholder services. Pursuant to Rule 12b-1 under the 1940 Act, the Board has approved, and the Fund has adopted, distribution and shareholder service plans (the Plans) which set the distribution and service fees for the Fund. These fees are calculated daily and are intended to compensate the Distributor and/or eligible selling and/or servicing agents for selling shares of the Fund and providing services to investors.
Under the Plans, the Fund pays a monthly service fee to the Distributor at the maximum annual rate of 0.25% of the average daily net assets attributable to Class A, Class B, Class C and Class W shares of the Fund. Also under the Plans, the Fund pays a monthly distribution fee to the Distributor at the maximum annual rates of 0.75%, 0.75%, 0.50% and 0.25% of the average daily net assets attributable to Class B, Class C, Class R and Class W shares, respectively.
The Fund may pay a distribution fee up to 0.25% of the Fund's average daily net assets attributable to Class W shares and a service fee of up to 0.25% of the Fund's average daily net assets attributable to Class W shares, provided, however, that the aggregate fee shall not exceed 0.25% of the Fund's average daily net assets attributable to Class W shares.
Sales Charges
Sales charges, including front-end charges and CDSCs, received by the Distributor for distributing Fund shares were $256,977 for Class A, $1,477 for Class B and $252 for Class C shares for the year ended August 31, 2013.
Expenses Waived/Reimbursed by the Investment Manager and its Affiliates
The Investment Manager and certain of its affiliates have contractually agreed to waive fees and/or reimburse expenses (excluding certain fees and expenses described below as well as any reorganization costs allocated to the Fund) for the periods disclosed below, unless sooner terminated at the sole discretion of the Board, so that the Fund's net operating
Annual Report 2013
35
Columbia Emerging Markets Fund
Notes to Financial Statements (continued)
August 31, 2013
expenses, after giving effect to fees waived/expenses reimbursed and any balance credits and/or overdraft charges from the Fund's custodian, do not exceed the following annual rates as a percentage of the class' average daily net assets:
| | | March 16, 2013
through
December 31, 2014 | | Prior to
March 16, 2013 | |
Class A | | | 1.78 | % | | | 1.79 | % | |
Class B | | | 2.53 | | | | 2.54 | | |
Class C | | | 2.53 | | | | 2.54 | | |
Class I | | | 1.33 | | | | 1.34 | | |
Class K | | | 1.63 | | | | 1.64 | | |
Class R | | | 2.03 | | | | 2.04 | | |
Class R4 | | | 1.53 | | | | — | | |
Class R5 | | | 1.38 | | | | 1.39 | | |
Class W | | | 1.78 | | | | 1.79 | | |
Class Y | | | 1.33 | | | | 1.34 | | |
Class Z | | | 1.53 | | | | 1.54 | | |
Under the agreement governing these fee waivers and/or expense reimbursement arrangements, the following fees and expenses are excluded from the waiver/reimbursement commitment, and therefore will be paid by the Fund, if applicable: taxes (including foreign transaction taxes), expenses associated with investments in affiliated and non-affiliated pooled investment vehicles (including mutual funds and exchange traded funds), transaction costs and brokerage commissions, costs related to any securities lending program, dividend expenses associated with securities sold short, inverse floater program fees and expenses, transaction charges and interest on borrowed money, interest, extraordinary expenses and any other expenses the exclusion of which is specifically approved by the Board. This agreement may be modified or amended only with approval from all parties. Reorganization (see Note 10) costs were allocated to the Fund only to the extent they are expected to be offset by the anticipated reduction in expenses borne by the Fund's shareholders during the first year following the reorganization.
Note 4. Federal Tax Information
The timing and character of income and capital gain distributions are determined in accordance with income tax regulations, which may differ from GAAP because of temporary or permanent book to tax differences.
At August 31, 2013, these differences are primarily due to differing treatment for deferral/reversal of wash sales losses, Trustees' deferred compensation, foreign currency transactions and post-October capital losses. To the extent these differences are permanent, reclassifications are made among the components of the Fund's net assets in the
Statement of Assets and Liabilities. Temporary differences do not require reclassifications. In the Statement of Assets and Liabilities the following reclassifications were made:
Undistributed net investment income | | $ | (1,389,990 | ) | |
Accumulated net realized loss | | | 1,963,875 | | |
Paid-in capital | | | (573,885 | ) | |
Net investment income and net realized gains (losses), as disclosed in the Statement of Operations, and net assets were not affected by this reclassification.
The tax character of distributions paid during the years indicated was as follows:
Year Ended August 31, | | 2013 | | 2012 | |
Ordinary income | | $ | 2,693,691 | | | $ | 199,759 | | |
Long-term capital gains | | | — | | | | 20,865,965 | | |
Total | | $ | 2,693,691 | | | $ | 21,065,724 | | |
Short-term capital gain distributions, if any, are considered ordinary income distributions for tax purposes.
At August 31, 2013, the components of distributable earnings on a tax basis were as follows:
Undistributed ordinary income | | $ | 4,319,952 | | |
Unrealized appreciation | | | 13,748,778 | | |
At August 31, 2013, the cost of investments for federal income tax purposes was $1,168,625,694 and the aggregate gross unrealized appreciation and depreciation based on that cost was:
Unrealized appreciation | | $ | 89,160,400 | | |
Unrealized depreciation | | | (75,411,622 | ) | |
Net unrealized appreciation | | $ | 13,748,778 | | |
For the year ended August 31, 2013, $11,367,014 of capital loss carryforward was utilized.
Under current tax rules, regulated investment companies can elect to treat certain late-year ordinary losses incurred and post-October capital losses (capital losses realized after October 31) as arising on the first day of the following taxable year. As of August 31, 2013, the Fund will elect to treat post-October capital losses of $16,184,894 as arising on September 1, 2013
Management of the Fund has concluded that there are no significant uncertain tax positions that would require recognition in the financial statements. However, management's conclusion may be subject to review and adjustment at a later date based on factors including, but not limited to, new tax laws, regulations, and administrative interpretations (including relevant court decisions). Generally, the Fund's federal tax returns for the prior three fiscal years
Annual Report 2013
36
Columbia Emerging Markets Fund
Notes to Financial Statements (continued)
August 31, 2013
remain subject to examination by the Internal Revenue Service.
Note 5. Portfolio Information
The cost of purchases and proceeds from sales of securities, excluding short-term obligations, aggregated to $1,029,108,436 and $634,235,589, respectively, for the year ended August 31, 2013.
Transactions to realign the Fund's portfolio following the merger as described in Note 10 are excluded for purposes of calculating the Fund's portfolio turnover rate. These realignment transactions amounted to cost of purchases and proceeds from sales of $113,951,869 and $68,570,928, respectively.
Note 6. Lending of Portfolio Securities
Effective December 19, 2012, the Fund no longer participates in securities lending activity. Prior to that date, the Fund participated, or was eligible to participate, in securities lending activity pursuant to a Master Securities Lending Agreement (the Agreement) with JPMorgan Chase Bank, N.A. (JPMorgan). The Agreement authorized JPMorgan as lending agent to lend securities to authorized borrowers in order to generate additional income on behalf of the Fund. Pursuant to the Agreement, the securities loaned were secured by cash or securities that either were issued or guaranteed as to principal and interest by the U.S. government, its agencies, authorities or instrumentalities with value equal to at least 100% of the market value of the loaned securities. Any additional collateral required to maintain those levels due to market fluctuations of the loaned securities was requested to be delivered the following business day. Cash collateral received was invested by the lending agent on behalf of the Fund into authorized investments pursuant to the Agreement.
Pursuant to the Agreement, the Fund received income for lending its securities either in the form of fees or by earning interest on invested cash collateral, net of negotiated rebates paid to borrowers and fees paid to the lending agent for services provided and any other securities lending expenses. Net income earned from securities lending for the year ended August 31, 2013 is disclosed in the Statement of Operations. The Fund continued to earn and accrue interest and dividends on the securities loaned.
Note 7. Affiliated Money Market Fund
The Fund invests its daily cash balances in Columbia Short-Term Cash Fund, an affiliated money market fund established for the exclusive use by the Fund and other affiliated funds. The income earned by the Fund from such investments is included as "Dividends — affiliated issuers" in the Statement
of Operations. As an investing fund, the Fund indirectly bears its proportionate share of the expenses of Columbia Short-Term Cash Fund.
Note 8. Shareholder Concentration
At August 31, 2013, one unaffiliated shareholder account owned 46.1% of the outstanding shares of the Fund. The Fund has no knowledge about whether any portion of those shares was owned beneficially by such account. Affiliated shareholder accounts owned 15.3% of the outstanding shares of the Fund. Subscription and redemption activity by concentrated accounts may have a significant effect on the operations of the Fund.
Note 9. Line of Credit
The Fund has entered into a revolving credit facility with a syndicate of banks led by JPMorgan whereby the Fund may borrow for the temporary funding of shareholder redemptions or for other temporary or emergency purposes. The credit facility agreement, as amended, which is a collective agreement between the Fund and certain other funds managed by the Investment Manager, severally and not jointly, permits collective borrowings up to $500 million. Interest is charged to each participating fund based on its borrowings at a rate equal to the higher of (i) the overnight federal funds rate plus 1.00% or (ii) the one-month LIBOR rate plus 1.00%. Each borrowing under the credit facility matures no later than 60 days after the date of borrowing. The Fund also pays a commitment fee equal to its pro rata share of the amount of the credit facility at a rate of 0.08% per annum. The commitment fee is included in other expenses in the Statement of Operations.
The Fund had no borrowings during the year ended August 31, 2013.
Note 10. Fund Merger
At the close of business on March 15, 2013, the Fund acquired the assets and assumed the identified liabilities of Columbia Emerging Markets Opportunity Fund, a series of Columbia Funds Series Trust II (the acquired fund). The reorganization was completed after shareholders of the acquired fund approved a plan of reorganization on February 27, 2013. The purpose of the transaction was to combine two funds managed by the Investment Manager with comparable investment objectives and strategies.
The aggregate net assets of the Fund immediately before the acquisition were $608,114,120 and the combined net assets immediately after the acquisition were $999,520,508.
The merger was accomplished by a tax-free exchange of 49,244,644 shares of the acquired fund valued at
Annual Report 2013
37
Columbia Emerging Markets Fund
Notes to Financial Statements (continued)
August 31, 2013
$391,406,388 (including $26,662,659 of unrealized appreciation).
In exchange for the acquired fund's shares, the Fund issued the following number of shares:
| | | Shares | |
Class A | | | 32,834,274 | | |
Class B | | | 1,298,485 | | |
Class C | | | 2,350,220 | | |
Class I | | | 1,255 | | |
Class K | | | 56,204 | | |
Class R | | | 604,088 | | |
Class R5 | | | 7,415 | | |
Class W | | | 2,037 | | |
Class Z | | | 294,617 | | |
For financial reporting purposes, net assets received and shares issued by the Fund were recorded at fair value; however, the acquired fund's cost of investments was carried forward.
The financial statements reflect the operations of the Fund for the period prior to the merger and the combined fund for the period subsequent to the merger. Because the combined investment portfolios have been managed as a single integrated portfolio since the merger was completed, it is not practicable to separate the amounts of revenue and earnings of the acquired fund that have been included in the combined Fund's Statement of Operations since the merger was completed.
Assuming the merger had been completed on September 1, 2012 the Fund's pro-forma net investment income, net gain on investments, net change in unrealized depreciation and net decrease in net assets from operations for the year ended August 31, 2013 would have been approximately $6.4 million, $49.3 million, $(103.1) million and $(47.4) million, respectively.
Note 11. Significant Risks
Foreign Securities Risk
Investing in foreign securities may include certain risks and considerations not typically associated with investing in U.S. securities, such as fluctuating currency values and changing local and regional economic, political and social conditions, which may result in greater market volatility. In addition, certain foreign securities may not be as liquid as U.S. securities. Investing in emerging markets may accentuate these risks.
Investments in emerging market countries are subject to additional risk. The risk of foreign investments is typically increased in less developed countries. These countries are also
more likely to experience high levels of inflation, deflation or currency devaluation which could hurt their economies and securities markets.
Financial Sector Risk
The Fund's portfolio managers may invest significantly in issuers operating in the financial sector. The Fund may be more susceptible to the particular risks of this sector than if the Fund were invested in a wider variety of issuers operating in unrelated sectors.
Information Technology Sector Risk
The Fund's portfolio managers may invest significantly in issuers operating in the information technology sector. The Fund may be more susceptible to the particular risks of this sector than if the Fund were invested in a wider variety of issuers operating in unrelated sectors.
Note 12. Subsequent Events
Management has evaluated the events and transactions that have occurred through the date the financial statements were issued and noted no items requiring adjustment of the financial statements or additional disclosure.
Note 13. Information Regarding Pending and Settled Legal Proceedings
In December 2005, without admitting or denying the allegations, American Express Financial Corporation (AEFC, which is now known as Ameriprise Financial, Inc. (Ameriprise Financial)) entered into settlement agreements with the Securities and Exchange Commission (SEC) and Minnesota Department of Commerce (MDOC) related to market timing activities. As a result, AEFC was censured and ordered to cease and desist from committing or causing any violations of certain provisions of the Investment Advisers Act of 1940, the Investment Company Act of 1940, and various Minnesota laws. AEFC agreed to pay disgorgement of $10 million and civil money penalties of $7 million. AEFC also agreed to retain an independent distribution consultant to assist in developing a plan for distribution of all disgorgement and civil penalties ordered by the SEC in accordance with various undertakings detailed at www.sec.gov/litigation/admin/ia-2451.pdf. Ameriprise Financial and its affiliates have cooperated with the SEC and the MDOC in these legal proceedings, and have made regular reports to the funds' Boards of Trustees.
Ameriprise Financial and certain of its affiliates have historically been involved in a number of legal, arbitration and regulatory proceedings, including routine litigation, class actions, and governmental actions, concerning matters arising in connection with the conduct of their business activities.
Annual Report 2013
38
Columbia Emerging Markets Fund
Notes to Financial Statements (continued)
August 31, 2013
Ameriprise Financial believes that the Funds are not currently the subject of, and that neither Ameriprise Financial nor any of its affiliates are the subject of, any pending legal, arbitration or regulatory proceedings that are likely to have a material adverse effect on the Funds or the ability of Ameriprise Financial or its affiliates to perform under their contracts with the Funds. Ameriprise Financial is required to make 10-Q, 10-K and, as necessary, 8-K filings with the Securities and Exchange Commission on legal and regulatory matters that relate to Ameriprise Financial and its affiliates. Copies of these filings may be obtained by accessing the SEC website at www.sec.gov.
There can be no assurance that these matters, or the adverse publicity associated with them, will not result in increased fund redemptions, reduced sale of fund shares or other adverse consequences to the Funds. Further, although we believe proceedings are not likely to have a material adverse effect on the Funds or the ability of Ameriprise Financial or its affiliates to perform under their contracts with the Funds, these proceedings are subject to uncertainties and, as such, we are unable to estimate the possible loss or range of loss that may result. An adverse outcome in one or more of these proceedings could result in adverse judgments, settlements, fines, penalties or other relief that could have a material adverse effect on the consolidated financial condition or results of operations of Ameriprise Financial.
Annual Report 2013
39
Columbia Emerging Markets Fund
Report of Independent Registered Public Accounting Firm
To the Trustees of Columbia Funds Series Trust I and the Shareholders of Columbia Emerging Markets Fund
In our opinion, the accompanying statement of assets and liabilities, including the portfolio of investments, and the related statements of operations and of changes in net assets and the financial highlights present fairly, in all material respects, the financial position of Columbia Emerging Markets Fund (the "Fund") (a series of Columbia Funds Series Trust I) at August 31, 2013, the results of its operations, the changes in its net assets and the financial highlights for the periods indicated, in conformity with accounting principles generally accepted in the United States of America. These financial statements and financial highlights (hereafter referred to as "financial statements") are the responsibility of the Fund's management. Our responsibility is to express an opinion on these financial statements based on our audits. We conducted our audits of these financial statements in accordance with the standards of the Public Company Accounting Oversight Board (United States). Those standards require that we plan and perform the audit to obtain reasonable assurance about whether the financial statements are free of material misstatement. An audit includes examining, on a test basis, evidence supporting the amounts and disclosures in the financial statements, assessing the accounting principles used and significant estimates made by management, and evaluating the overall financial statement presentation. We believe that our audits, which included confirmation of securities at August 31, 2013 by correspondence with the custodian, brokers and transfer agent, provide a reasonable basis for our opinion.
PricewaterhouseCoopers LLP
Minneapolis, Minnesota
October 22, 2013
Annual Report 2013
40
Columbia Emerging Markets Fund
Federal Income Tax Information
(Unaudited)
The Fund hereby designates the following tax attributes for the fiscal year ended August 31, 2013. Shareholders will be notified in early 2014 of the amounts for use in preparing 2013 income tax returns.
Tax Designations:
| Qualified Dividend Income | | | 7.13 | % | |
| Dividends Received Deduction | | | 0.09 | % | |
Foreign Taxes Paid | | $ | 2,403,925 | | |
Foreign Source Income | | $ | 22,320,647 | | |
Qualified Dividend Income. For taxable, non-corporate shareholders, the percentage of ordinary income dividends paid during the fiscal year that represents qualified dividend income subject to reduced tax rates.
Dividends Received Deduction. The percentage of ordinary income dividends paid during the fiscal year that qualifies for the corporate dividends received deduction.
Foreign Taxes. The Fund makes the election to pass through to shareholders the foreign taxes paid. These taxes, and the corresponding foreign source income, are provided.
Annual Report 2013
41
Columbia Emerging Markets Fund
The Trustees serve terms of indefinite duration. The names, addresses and birth years of the Trustees and Officers of the Funds in Columbia Funds Series Trust I, the year each was first elected or appointed to office, their principal business occupations during at least the last five years, the number of Funds overseen by each Trustee and other directorships they hold are shown below. Each officer listed below serves as an officer of each Fund in Columbia Funds Series Trust I.
Independent Trustees
Name, Address and Year of Birth,
Position with Funds, Year First
Elected or Appointed to Office | | Principal Occupation(s) During Past Five Years, Number of Funds in Columbia
Funds Complex Overseen by Trustee, Other Directorships Held | |
Rodman L. Drake (Born 1943)
c/o Columbia Management
Investment Advisers, LLC
225 Franklin Street
Boston, MA 02110
Trustee (since 1994) and
Chairman of the Board (since 2009) | | Independent consultant since 2010; Co-Founder of Baringo Capital LLC (private equity) from 1997 to 2008; Chairman (from 2003 to 2010) and CEO (from 2008 to 2010) of Crystal River Capital, Inc. (real estate investment trust); Oversees 52; Jackson Hewitt Tax Service Inc. (tax preparation services) from 2004 to 2011; Student Loan Corporation (student loan provider) from 2005 to 2010; Celgene Corporation (global biotechnology company); The Helios Funds and Brookfield Funds (closed-end funds); Chimerix, Inc. (biopharmaceutical company) since August 1, 2013; Crystal River Capital, Inc. from 2005 to 2010; Parsons Brinckerhoff from 1995 to 2008; and Apex Silver Mines Ltd. from 2007 to 2009 | |
Douglas A. Hacker (Born 1955)
c/o Columbia Management
Investment Advisers, LLC
225 Franklin Street
Boston, MA 02110
Trustee (since 1996) | | Independent business executive since May 2006; Executive Vice President — Strategy of United Airlines from December 2002 to May 2006; President of UAL Loyalty Services (airline marketing company) from September 2001 to December 2002; Executive Vice President and Chief Financial Officer of United Airlines from July 1999 to September 2001. Oversees 52; Nash Finch Company (food distributor); Aircastle Limited (aircraft leasing); and SeaCube Container Leasing Ltd. (container leasing) | |
Janet Langford Kelly (Born 1957)
c/o Columbia Management
Investment Advisers, LLC
225 Franklin Street
Boston, MA 02110
Trustee (since 1996) | | Senior Vice President, General Counsel and Corporate Secretary, ConocoPhillips (integrated energy company) since September 2007; Deputy General Counsel — Corporate Legal Services, ConocoPhillips from August 2006 to August 2007; Partner, Zelle, Hofmann, Voelbel, Mason & Gette LLP (law firm) from March 2005 to July 2006; Adjunct Professor of Law, Northwestern University from September 2004 to June 2006; Director, UAL Corporation (airline) from February 2006 to July 2006; Chief Administrative Officer and Senior Vice President, Kmart Holding Corporation (consumer goods) from September 2003 to March 2004. Oversees 52; None | |
Nancy T. Lukitsh (Born 1956)
c/o Columbia Management
Investment Advisers, LLC
225 Franklin Street
Boston, MA 02110
Trustee (since 2011) | | Senior Vice President, Partner and Director of Marketing, Wellington Management Company, LLP (investment adviser) from 1997 to 2010; Chair, Wellington Management Investment Portfolios (commingled non-U.S. investment pools) from 2007 to 2010; Director, Wellington Trust Company, NA and other Wellington affiliates from 1997 to 2010. Oversees 52; None | |
William E. Mayer (Born 1940)
c/o Columbia Management
Investment Advisers, LLC
225 Franklin Street
Boston, MA 02110
Trustee (since 1994) | | Partner, Park Avenue Equity Partners (private equity) since February 1999; Dean and Professor, College of Business and Management, University of Maryland from 1992 to 1996. Oversees 52; DynaVox Inc. (speech creation); Lee Enterprises (print media); WR Hambrecht + Co. (financial service provider) from 2000 to 2012; BlackRock Kelso Capital Corporation (investment company) | |
David M. Moffett (Born 1952)
c/o Columbia Management
Investment Advisers, LLC
225 Franklin Street
Boston, MA 02110
Trustee (since 2011) | | Retired. Chief Executive Officer, Federal Home Loan Mortgage Corporation, from 2008 to 2009; Senior Adviser, Global Financial Services Group, Carlyle Group, Inc., from 2007 to 2008; Vice Chairman and Chief Financial Officer, U.S. Bancorp, from 1993 to 2007. Oversees 52; CIT Group Inc. (commercial and consumer finance); eBay Inc. (online trading community); MBIA Inc. (financial service provider); E.W. Scripps Co. (print and television media), Building Materials Holding Corp. (building materials and construction services); Genworth Financial, Inc. (financial and insurance products and services); and University of Oklahoma Foundation | |
Charles R. Nelson (Born 1942)
c/o Columbia Management
Investment Advisers, LLC
225 Franklin Street
Boston, MA 02110
Trustee (since 1981) | | Retired. Professor Emeritus, University of Washington, since 2011; Professor of Economics, University of Washington from 1976 to 2011; Ford and Louisa Van Voorhis Professor of Political Economy, University of Washington from 1993 to 2011; Adjunct Professor of Statistics, University of Washington from 1980 to 2011; Associate Editor, Journal of Money, Credit and Banking from September 1993 to 2008; consultant on econometric and statistical matters. Oversees 52; None | |
John J. Neuhauser (Born 1943)
c/o Columbia Management
Investment Advisers, LLC
225 Franklin Street
Boston, MA 02110
Trustee (since 1984) | | President, Saint Michael's College, since August 2007; Director or Trustee of several non-profit organizations, including Fletcher Allen Health Care, Inc.; University Professor, Boston College from November 2005 to August 2007; Academic Vice President and Dean of Faculties, Boston College from August 1999 to October 2005. Oversees 52; Liberty All-Star Equity Fund and Liberty All-Star Growth Fund (closed-end funds) | |
Annual Report 2013
42
Columbia Emerging Markets Fund
Trustees and Officers (continued)
Independent Trustees (continued)
Name, Address and Year of Birth,
Position with Funds, Year First
Elected or Appointed to Office | | Principal Occupation(s) During Past Five Years, Number of Funds in Columbia
Funds Complex Overseen by Trustee, Other Directorships Held | |
Patrick J. Simpson (Born 1944)
c/o Columbia Management
Investment Advisers, LLC
225 Franklin Street
Boston, MA 02110
Trustee (since 2000) | | Partner, Perkins Coie LLP (law firm). Oversees 52; None | |
Anne-Lee Verville (Born 1945)
c/o Columbia Management
Investment Advisers, LLC
225 Franklin Street
Boston, MA 02110
Trustee (since 1998) | | Retired. General Manager — Global Education Industry from 1994 to 1997, President — Application Systems Division from 1991 to 1994, Chief Financial Officer — US Marketing & Services from 1988 to 1991, and Chief Information Officer from 1987 to 1988, IBM Corporation (computer and technology). Oversees 52; Enesco Group, Inc. (producer of giftware and home and garden decor products) from 2001 to 2006 | |
Interested Trustee
Name, Address and Year of Birth,
Position with Funds, Year First
Elected or Appointed to Office | | Principal Occupation(s) During Past Five Years, Number of Funds in Columbia
Funds Complex Overseen by Trustee, Other Directorships Held | |
William F. Truscott (born 1960)
53600 Ameriprise Financial Center
Minneapolis, MN 55474
Senior Vice President (since 2012) | | Chairman of the Board and President, Columbia Management Investment Advisers, LLC since May 2010 and February 2012 (previously President and Chief Investment Officer, from 2001 to April 2010); Chief Executive Officer, Global Asset Management, Ameriprise Financial, Inc. since September 2012 (previously, Chief Executive Officer, U.S. Asset Management & President, Annuities, from May 2010 to September 2012 and President — U.S. Asset Management and Chief Investment Officer from 2005 to April 2010); Director and Chief Executive Officer, Columbia Management Investment Distributors, Inc. since May 2010 and February 2012, respectively (previously Chairman of the Board and Chief Executive Officer from 2006 to April 2010); Chairman of the Board and Chief Executive Officer, RiverSource Distributors, Inc. since 2006; President and Chief Executive Officer, Ameriprise Certificate Company, 2006 to August 2012; Oversees 184; Director, Ameriprise Certificate Company, 2006-January 2013 | |
The Statement of Additional Information includes additional information about the Trustees of the Funds and is available, without charge, upon request by calling 800.345.6611.
The Board has appointed officers who are responsible for day-to-day business decisions based on policies it has established. The officers serve at the pleasure of the Board. In addition to Mr. Truscott, who is Senior Vice President, the Funds' other officers are:
Officers
Name, Year of Birth and Address | | Principal Occupation(s) During the Past Five Years | |
J. Kevin Connaughton (Born 1964)
225 Franklin Street
Boston, MA 02110
President (since 2009) | | Senior Vice President and General Manager — Mutual Fund Products, Columbia Management Investment Advisers, LLC since May 2010; President, Columbia Funds since 2009 and RiverSource Funds since May 2010; Managing Director, Columbia Management Advisors, LLC, December 2004-April 2010; Senior Vice President and Chief Financial Officer, Columbia Funds, June 2008-January 2009; Treasurer, Columbia Funds, October 2003-May 2008; and senior officer of various other affiliated funds since 2000 | |
Amy Johnson (Born 1965)
5228 Ameriprise Financial Center
Minneapolis, MN 55474
Vice President (since 2010) | | Senior Vice President and Chief Operating Officer, Columbia Management Investment Advisers, LLC since May 2010 (previously Chief Administrative Officer, from 2009-April 2010, Vice President — Asset Management and Trust Company Services, from 2006-2009) | |
Michael G. Clarke (Born 1969)
225 Franklin Street
Boston, MA 02110
Treasurer (since 2011) and Chief
Financial Officer (since 2009) | | Vice President, Columbia Management Investment Advisers, LLC since May 2010; Managing Director of Fund Administration, Columbia Management Advisors, LLC, September 2004-April 2010; senior officer of Columbia Funds and affiliated funds since 2002 | |
Annual Report 2013
43
Columbia Emerging Markets Fund
Trustees and Officers (continued)
Officers (continued)
Name, Year of Birth and Address | | Principal Occupation(s) During the Past Five Years | |
Scott R. Plummer (Born 1959)
5228 Ameriprise Financial Center
Minneapolis, MN 55474
Senior Vice President, Assistant
Secretary and Chief Legal Officer
(since 2010) | | Senior Vice President, Chief Legal Officer and Assistant Secretary, Columbia Management Investment Advisers, LLC since June 2005; Senior Vice President and Lead Chief Counsel — Asset Management, Ameriprise Financial, Inc. since May 2010 (previously Vice President and Chief Counsel — Asset Management, 2005-April 2010); Vice President, Chief Counsel and Assistant Secretary, Columbia Management Investment Distributors, Inc. since 2008; Vice President, General Counsel and Secretary, Ameriprise Certificate Company since 2005; Chief Counsel, RiverSource Distributors, Inc. since 2006; senior officer of Columbia Funds and affiliated funds since 2010 | |
Colin Moore (Born 1958)
225 Franklin Street
Boston, MA 02110
Senior Vice President (since 2010) | | Executive Vice President and Global Chief Investment Officer, Ameriprise Financial, Inc. since July 2013; Director and Global Chief Investment Officer, Columbia Management Investment Advisers, LLC since May 2010; Manager, Managing Director and Chief Investment Officer of Columbia Management Advisors, LLC, 2007-April 2010 | |
Thomas P. McGuire (Born 1972)
225 Franklin Street
Boston, MA 02110
Chief Compliance Officer
(since 2012) | | Vice President — Asset Management Compliance, Columbia Management Investment Advisers, LLC since 2010; Chief Compliance Officer, Ameriprise Certificate Company, since September 2010; Compliance Executive, Bank of America, N.A. 2005-2010 | |
Stephen T. Welsh (born 1957)
225 Franklin Street
Boston, MA 02110
Vice President (since 2006) | | President and Director, Columbia Management Investment Services Corp. since May 2010; President and Director, Columbia Management Services, Inc., July 2004-April 2010; Managing Director, Columbia Management Distributors, Inc., August 2007-April 2010 | |
Christopher O. Petersen (born 1970)
5228 Ameriprise Financial Center
Minneapolis, MN 55474
Vice President (since 2010) and
Secretary (since 2011) | | Vice President and Chief Counsel, Ameriprise Financial, Inc. since January 2010 (formerly Vice President and Group Counsel or Counsel, April 2004-January 2010); Assistant Secretary of Columbia Funds, January 2007-April 2011 | |
Paul D. Pearson (born 1956)
10468 Ameriprise Financial Center
Minneapolis, MN 55474
Vice President and Assistant
Treasurer (since 2011) | | Vice President, Investment Accounting, Columbia Management Investment Advisers, LLC, since May 2010; Vice President — Managed Assets, Investment Accounting, Ameriprise Financial, Inc., February 1998-May 2010 | |
Joseph F. DiMaria (Born 1968)
225 Franklin Street
Boston, MA 02110
Vice President (since 2011) and
Chief Accounting Officer (since 2008) | | Vice President, Mutual Fund Administration, Columbia Management Investment Advisers, LLC, since May 2010; Director of Fund Administration, Columbia Management Advisors, LLC, January 2006-April 2010 | |
Paul B. Goucher (born 1968)
100 Park Avenue
New York, NY 10017
Vice President and Assistant
Secretary (since 2010) | | Vice President and Lead Chief Counsel, Ameriprise Financial, Inc. since November 2008 and January 2013, respectively (formerly, Chief Counsel from January 2010-January 2013 and Group Counsel from November 2008-January 2010); Director, Managing Director and General Counsel, J. & W. Seligman & Co. Incorporated, July 2008-November 2008 (previously, Managing Director and Associate General Counsel, January 2005-July 2008) | |
Michael E. DeFao (born 1968)
225 Franklin Street
Boston, MA 02110
Vice President and Assistant
Secretary (since 2011) | | Vice President and Chief Counsel, Ameriprise Financial, Inc. since May 2010; Associate General Counsel, Bank of America, N.A. June 2005-April 2010 | |
Annual Report 2013
44
Columbia Emerging Markets Fund
Board Consideration and Approval of
Advisory Agreement
On June 14, 2013, the Board of Trustees (the "Board") and the Trustees who are not interested persons (as defined in the Investment Company Act of 1940) of the Trust (the "Independent Trustees") unanimously approved the continuation of the Investment Management Services Agreement (the "Advisory Agreement") with Columbia Management Investment Advisers, LLC (the "Investment Manager") with respect to Columbia Emerging Markets Fund (the "Fund"), a series of the Trust. As detailed below, the Advisory Fees and Expenses Committee (the "Committee") and the Board met on multiple occasions to review and discuss, both among themselves and with the management team of the Investment Manager, materials provided by the Investment Manager before determining to approve the continuation of the Advisory Agreement.
In connection with their deliberations regarding the continuation of the Advisory Agreement, the Committee and the Board evaluated materials requested from the Investment Manager regarding the Fund and the Advisory Agreement, and discussed these materials with representatives of the Investment Manager at Committee meetings held on March 5, 2013, April 24, 2013 and June 13, 2013, and at the Board meeting held on June 14, 2013. In addition, the Board considers matters bearing on the Advisory Agreement at most of its other meetings throughout the year and meets regularly with senior management of the Funds and the Investment Manager. Through the Board's Investment Oversight Committees, Trustees also meet with selected Fund portfolio managers and other investment personnel at various times throughout the year. The Committee and the Board also consulted with Fund counsel and with the Independent Trustees' independent legal counsel, who advised on various matters with respect to the Committee's and the Board's considerations and otherwise assisted the Committee and the Board in their deliberations. On June 13, 2013, the Committee recommended that the Board approve the continuation of the Advisory Agreement. On June 14, 2013, the Board, including the Independent Trustees, voting separately, unanimously approved the continuation of the Advisory Agreement for the Fund.
The Committee and the Board considered all information that they, their legal counsel, or the Investment Manager believed reasonably necessary to evaluate and to determine whether to approve the continuation of the Advisory Agreement. The information and factors considered by the Committee and the Board in recommending for approval or approving the continuation of the Advisory Agreement for the Fund included the following:
• Information on the investment performance of the Fund relative to the performance of a group of mutual funds determined to be comparable to the Fund by an independent third-party data provider, as well as performance relative to benchmarks;
• Information on the Fund's advisory fees and total expenses, including information comparing the Fund's expenses to those of a group of comparable mutual funds, as determined by the independent third-party data provider;
• The Investment Manager's agreement to contractually limit or cap total operating expenses for the Fund so that total operating expenses (excluding certain fees and expenses, such as transaction costs and certain other investment related expenses, interest, taxes, acquired fund fees and expenses, and extraordinary expenses) would not exceed the median expenses of a group of comparable funds (as determined from time to time, generally annually, by the independent third-party data provider);
• The terms and conditions of the Advisory Agreement;
• The terms and conditions of other agreements and arrangements with affiliates of the Investment Manager relating to the operations of the Fund, including the Administrative Services Agreement, the Distribution Agreement and the Transfer and Dividend Disbursing Agent Agreement;
• Descriptions of various functions performed by the Investment Manager under the Advisory Agreement, including portfolio management and portfolio trading practices;
• Information regarding the management fees and investment performance of comparable portfolios of other clients of the Investment Manager, including institutional separate accounts;
• Information regarding the reputation, regulatory history and resources of the Investment Manager, including information regarding senior management, portfolio managers and other personnel;
• Information regarding the capabilities of the Investment Manager with respect to compliance monitoring services, including an assessment of the Investment Manager's compliance system by the Fund's Chief Compliance Officer; and
• The profitability to the Investment Manager and its affiliates from their relationships with the Fund.
Annual Report 2013
45
Columbia Emerging Markets Fund
Board Consideration and Approval of
Advisory Agreement (continued)
Nature, Extent and Quality of Services Provided under the Advisory Agreement
The Committee and the Board considered the nature, extent and quality of services provided to the Fund by the Investment Manager and its affiliates under the Advisory Agreement and under separate agreements for the provision of transfer agency and administrative services, and the resources dedicated to the Fund and the other Columbia Funds by the Investment Manager and its affiliates. The Committee and the Board considered, among other things, the Investment Manager's ability to attract, motivate and retain highly qualified research, advisory and supervisory investment professionals (including personnel and other resources, compensation programs for personnel involved in fund management, reputation and other attributes), the portfolio management services provided by those investment professionals, and the quality of the Investment Manager's investment research capabilities and trade execution services. The Committee and the Board also considered the potential benefits to shareholders of investing in a mutual fund that is part of a fund complex offering exposure to a variety of asset classes and investment disciplines and providing a variety of fund and shareholder services.
The Committee and the Board also considered the professional experience and qualifications of the senior personnel of the Investment Manager, which included consideration of the Investment Manager's experience with similarly-structured funds. The Committee and the Board noted the compliance programs of and the compliance-related resources provided to the Fund by the Investment Manager and its affiliates, and considered the Investment Manager's ability to provide administrative services to the Fund pursuant to a separate Administrative Services Agreement, including the Investment Manager's ability to coordinate the activities of the Fund's other service providers. After reviewing these and related factors, the Committee and the Board concluded, within the context of their overall conclusions, that the nature, extent and quality of the services provided to the Fund under the Advisory Agreement supported the continuation of the Advisory Agreement.
Investment Performance
The Committee and the Board reviewed information about the performance of the Fund over various time periods, including performance information relative to benchmarks and information based on reports of the independent third-party data provider that compared the performance of the Fund to the performance of a group of comparable mutual funds. The Committee and the Board also reviewed a description of the third party's methodology for identifying the Fund's peer groups for purposes of performance and expense comparisons.
The Committee and the Board noted that, through December 31, 2012, the Fund's performance was in the sixteenth, twenty-third and thirty-eighth percentile (where the best performance would be in the first percentile) of its category selected by the independent third-party data provider for the purposes of performance comparisons for the one-, three- and five- year periods, respectively.
The Committee and the Board also considered the Investment Manager's performance and reputation generally, the Investment Manager's historical responsiveness to Board concerns about performance, and the Investment Manager's willingness to take steps intended to improve performance. After reviewing these and related factors, the Committee and the Board concluded, within the context of their overall conclusions, that the performance of the Fund supported the continuation of the Advisory Agreement.
Investment Advisory Fee Rates and Other Expenses
The Committee and the Board considered the advisory fees charged to the Fund under the Advisory Agreement as well as the total expenses incurred by the Fund. In assessing the reasonableness of the fees under the Advisory Agreement, the Committee and the Board considered, among other information, the Fund's advisory fee and its total expense ratio as a percentage of average daily net assets. The Committee and the Board noted that the Fund's actual management fee and net expense ratio are ranked in the fourth and third quintiles, respectively, (where the lowest fees and expenses would be in the first quintile) against the Fund's expense universe as determined by the independent third-party data provider for purposes of expense comparison. The Committee and the Board also took into account the fee waiver and expense limitation arrangements agreed to by the Investment Manager, as noted above.
The Committee and the Board also received and considered information about the advisory fees charged by the Investment Manager to institutional separate accounts. In considering the fees charged to those accounts, the Committee and the Board took into account, among other things, the Investment Manager's representations about the differences between managing mutual funds as compared to other types of accounts, including differences in the services provided, differences in the risk
Annual Report 2013
46
Columbia Emerging Markets Fund
Board Consideration and Approval of
Advisory Agreement (continued)
profile of such business for the Investment Manager and the additional resources required to manage mutual funds effectively. In evaluating the Fund's advisory fees, the Committee and the Board also took into account the demands, complexity and quality of the investment management of the Fund.
After reviewing these and related factors, the Committee and the Board concluded, within the context of their overall conclusions, that the advisory fee rates and expenses of the Fund supported the continuation of the Advisory Agreement.
Costs of Services Provided and Profitability
The Committee and the Board also took note of the costs of the services provided (both on an absolute and relative basis) and the profitability to the Investment Manager and its affiliates in connection with their relationships with the Fund. In evaluating these considerations, the Committee and the Board took note of the advisory fees charged by the Investment Manager to other clients, including fees charged by the Investment Manager to institutional separate account clients with similar investment strategies to those of the Fund.
The Committee and the Board also considered the compensation directly or indirectly received by the Investment Manager's affiliates in connection with their relationships with the Fund. The Committee and the Board reviewed information provided by management as to the profitability of the Investment Manager and its affiliates of their relationships with the Fund, information about the allocation of expenses used to calculate profitability, and comparisons of profitability levels realized in 2012 to profitability levels realized in 2011. When reviewing profitability, the Committee and the Board also considered court cases in which adviser profitability was an issue in whole or in part, the performance of the Fund, the expense ratio of the Fund, and the implementation of expense limitations with respect to the Fund. The Committee and the Board also considered information provided by the Investment Manager regarding its financial condition and comparing its profitability to that of other asset management firms that are, or are subsidiaries of, publicly traded companies.
After reviewing these and related factors, the Committee and the Board concluded, within the context of their overall conclusions, that the costs of services provided and the profitability to the Investment Manager and its affiliates from their relationships with the Fund supported the continuation of the Advisory Agreement.
Economies of Scale
The Committee and the Board considered the potential existence of economies of scale in the provision by the Investment Manager of services to the Fund, to groups of related funds, and to the Investment Manager's investment advisory clients as a whole, and whether those economies of scale were shared with the Fund through breakpoints in investment advisory fees or other means, such as expense limitation arrangements and additional investments by the Investment Manager in investment, trading and compliance resources. The Committee and the Board noted that the investment advisory fee schedules for the Fund contained breakpoints that would reduce the fee rate on assets above specified threshold levels.
In considering these matters, the Committee and the Board also considered the costs of the services provided and the profitability to the Investment Manager and its affiliates from their relationships with the Fund, as discussed above. After reviewing these and related factors, the Committee and the Board concluded, within the context of their overall conclusions, that the extent to which any economies of scale were expected to be shared with the Fund supported the continuation of the Advisory Agreement.
Other Benefits to the Investment Manager
The Committee and the Board received and considered information regarding "fall-out" or ancillary benefits received by the Investment Manager and its affiliates as a result of their relationships with the Fund, such as the engagement of the Investment Manager to provide administrative services to the Fund and the engagement of the Investment Manager's affiliates to provide distribution and transfer agency services to the Fund. The Committee and the Board considered that the Fund's distributor retains a portion of the distribution fees from the Fund. The Committee and the Board also considered the benefits of research made available to the Investment Manager by reason of brokerage commissions generated by the Fund's securities transactions, and reviewed information about the Investment Manager's practices with respect to allocating portfolio transactions for brokerage and research services. The Committee and the Board considered the possible conflicts of interest associated with certain fall-out or other ancillary benefits and the reporting, disclosure and other processes that
Annual Report 2013
47
Columbia Emerging Markets Fund
Board Consideration and Approval of
Advisory Agreement (continued)
are in place to address such possible conflicts of interest. The Committee and the Board recognized that the Investment Manager's profitability would be somewhat lower without these benefits.
Conclusion
The Committee and the Board reviewed all of the above considerations in reaching their decisions to recommend or approve the continuation of the Advisory Agreement. In their deliberations, the Trustees did not identify any particular information that was all-important or controlling, and individual Trustees may have attributed different weights to the various factors. Based on their evaluation of all factors that they deemed to be material, including those factors described above, and assisted by the advice of independent legal counsel, the Board, including the Independent Trustees, voting separately, unanimously approved the continuation of the Advisory Agreement.
Annual Report 2013
48
Columbia Emerging Markets Fund
Important Information About This Report
Each fund mails one shareholder report to each shareholder address. If you would like more than one report, please call shareholder services at 800.345.6611 and additional reports will be sent to you.
The policy of the Board is to vote the proxies of the companies in which each fund holds investments consistent with the procedures as stated in the Statement of Additional Information (SAI). You may obtain a copy of the SAI without charge by calling 800.345.6611; contacting your financial intermediary; visiting columbiamanagement.com; or searching the website of the Securities and Exchange Commission (SEC) at sec.gov. Information regarding how each fund voted proxies relating to portfolio securities is filed with the SEC by August 31 for the most recent 12-month period ending June 30 of that year, and is available without charge by visiting columbiamanagement.com; or searching the website of the SEC at sec.gov.
Each fund files a complete schedule of portfolio holdings with the SEC for the first and third quarters of each fiscal year on Form N-Q. Each fund's Form N-Q is available on the SEC's website at sec.gov and may be reviewed and copied at the SEC's Public Reference Room in Washington, D.C. Information on the operation of the Public Reference Room may be obtained by calling 800.SEC.0330. Each fund's complete schedule of portfolio holdings, as filed on Form N-Q, can also be obtained without charge, upon request, by calling 800.345.6611.
Annual Report 2013
49

Columbia Emerging Markets Fund
P.O. Box 8081
Boston, MA 02266-8081
columbiamanagement.com
This information is for use with concurrent or prior delivery of a fund prospectus. Please read and consider the investment objectives, risks, charges and expenses for any fund carefully before investing. For a prospectus which contains this and other important information about the Fund go to columbiamanagement.com. The Fund is distributed by Columbia Management Investment Distributors, Inc., member FINRA, and managed by Columbia Management Investment Advisers, LLC.
© 2013 Columbia Management Investment Advisers, LLC. All rights reserved.
ANN142_08_C01_(10/13)
Annual Report
August 31, 2013

Columbia Global Dividend Opportunity Fund
Not FDIC insured • No bank guarantee • May lose value
 Dear Shareholders,
A return to volatility
Volatility returned to the financial markets in the second quarter of 2013, as uncertainty about the global economy, monetary policy and the impact of the sequester's spending cuts weighed on investors. Households advanced their spending but also allocated less to savings. Labor markets continued to crank out jobs at a steady pace, slowly reducing unemployment. Housing activity remained strong and retail sales were higher despite no real increase in income. The single weak spot was in the manufacturing sector, where activity slowed. While the consumer has weathered the domestic drag well, business has been closer to the global slowdown and effects of sequestration. Businesses remain very cautious, keeping inventories and staffs lean, and are planning for but not yet confident enough to make capital expenditures.
Against this backdrop, equities outperformed fixed income during the second quarter of 2013. Small-cap stocks outperformed large- and mid-cap stocks, and growth outperformed value except for in the large-cap sector. Outside the United States, foreign stock markets generally lost ground, with the most significant losses sustained by emerging markets.
Columbia Management to begin delivering summary prospectuses
Each Columbia fund is required to update its prospectus on an annual basis. Beginning with June 2013 prospectus updates, shareholders of Columbia retail mutual funds will start to receive a summary prospectus, rather than the full length (statutory) mutual fund prospectus they have received in the past.
Each fund's summary prospectus will include the following key information:
> Investment objective
> Fee and expense table
> Portfolio turnover rate information
> Principal investment strategies, principal risks and performance information
> Management information
> Purchase and sale information
> Tax information
> Financial intermediary compensation information
Each fund's statutory prospectus will contain additional information about the fund and its risks. Both the statutory and summary prospectus will be updated each year, and will be available at columbiamanagement.com. Shareholders may request a printed version of a statutory prospectus at no cost by calling 800.345.6611 or sending an email to serviceinquiries@columbiamanagement.com.
Stay on track with Columbia Management
Backed by more than 100 years of experience, Columbia Management is one of the nation's largest asset managers. At the heart of our success — and, most importantly, that of our investors — are highly talented industry professionals, brought together by a unique way of working. We are dedicated to helping you take advantage of today's opportunities and anticipate tomorrow's. We stay abreast of the latest investment trends and ideas, using our collective insight to evaluate events and transform them into solutions you can use.
Visit columbiamanagement.com for:
> The Columbia Management Perspectives blog, featuring timely posts by our investment teams
> Detailed up-to-date fund performance and portfolio information
> Economic analysis and market commentary
> Quarterly fund commentaries
> Columbia Management Investor, our award-winning quarterly newsletter for shareholders
Thank you for your continued support of the Columbia Funds. We look forward to serving your investment needs for many years to come.
Best Regards,

J. Kevin Connaughton
President, Columbia Funds
Investors should consider the investment objectives, risks, charges and expenses of a mutual fund carefully before investing. For a free prospectus, which contains this and other important information about a fund, visit columbiamanagement.com. The prospectus should be read carefully before investing.
Columbia Funds are distributed by Columbia Management Investment Distributors, Inc., member FINRA, and managed by Columbia Management Investment Advisers, LLC.
© 2013 Columbia Management Investment Advisers, LLC. All rights reserved.
Columbia Global Dividend Opportunity Fund
Performance Overview | | | 2 | | |
Manager Discussion of Fund Performance | | | 4 | | |
Understanding Your Fund's Expenses | | | 7 | | |
Portfolio of Investments | | | 8 | | |
Statement of Assets and Liabilities | | | 14 | | |
Statement of Operations | | | 16 | | |
Statement of Changes in Net Assets | | | 17 | | |
Financial Highlights | | | 20 | | |
Notes to Financial Statements | | | 29 | | |
Report of Independent Registered
Public Accounting Firm | | | 38 | | |
Federal Income Tax Information | | | 39 | | |
Trustees and Officers | | | 40 | | |
Board Consideration and Approval of Advisory Agreement | | | 43 | | |
Important Information About This Report | | | 49 | | |
Fund Investment Manager
Columbia Management Investment
Advisers, LLC
225 Franklin Street
Boston, MA 02110
Fund Distributor
Columbia Management Investment
Distributors, Inc.
225 Franklin Street
Boston, MA 02110
Fund Transfer Agent
Columbia Management Investment
Services Corp.
P.O. Box 8081
Boston, MA 02266-8081
For more information about any of the funds, please visit columbiamanagement.com or call 800.345.6611. Customer Service Representatives are available to answer your questions Monday through Friday from 8 a.m. to 8 p.m. Eastern time.
The views expressed in this report reflect the current views of the respective parties. These views are not guarantees of future performance and involve certain risks, uncertainties and assumptions that are difficult to predict, so actual outcomes and results may differ significantly from the views expressed. These views are subject to change at any time based upon economic, market or other conditions and the respective parties disclaim any responsibility to update such views. These views may not be relied on as investment advice and, because investment decisions for a Columbia Fund are based on numerous factors, may not be relied on as an indication of trading intent on behalf of any particular Columbia Fund. References to specific securities should not be construed as a recommendation or investment advice.
Annual Report 2013
Columbia Global Dividend Opportunity Fund
Performance Summary
> Columbia Global Dividend Opportunity Fund (the Fund) Class A shares returned 12.48% excluding sales charges for the 12-month period that ended August 31, 2013.
> The Fund underperformed its benchmark, the MSCI All Country World Index (Net), which returned 15.48% for the same 12-month period.
> While generating solid absolute gains, the Fund's relative results were hurt by its emphasis on high dividend-yielding stocks, which were seen as most vulnerable to both the anticipation and actuality of rapidly rising interest rates.
Average Annual Total Returns (%) (for period ended August 31, 2013)
| | | Inception | | 1 Year | | 5 Years | | 10 Years | |
Class A | | 11/01/02 | | | | | | | | | | | | | |
Excluding sales charges | | | | | | | 12.48 | | | | 4.37 | | | | 6.95 | | |
Including sales charges | | | | | | | 5.99 | | | | 3.14 | | | | 6.32 | | |
Class B | | 11/01/02 | | | | | | | | | | | | | |
Excluding sales charges | | | | | | | 11.61 | | | | 3.58 | | | | 6.16 | | |
Including sales charges | | | | | | | 6.61 | | | | 3.23 | | | | 6.16 | | |
Class C * | | 10/13/03 | | | | | | | | | | | | | |
Excluding sales charges | | | | | | | 11.66 | | | | 3.58 | | | | 6.16 | | |
Including sales charges | | | | | | | 10.66 | | | | 3.58 | | | | 6.16 | | |
Class I * | | 09/27/10 | | | 12.98 | | | | 4.74 | | | | 7.28 | | |
Class R * | | 09/27/10 | | | 12.25 | | | | 4.11 | | | | 6.69 | | |
Class R4 * | | 03/19/13 | | | 12.75 | | | | 4.63 | | | | 7.22 | | |
Class W * | | 09/27/10 | | | 12.48 | | | | 4.41 | | | | 7.03 | | |
Class Y * | | 07/15/09 | | | 12.93 | | | | 4.76 | | | | 7.29 | | |
Class Z | | 11/09/00 | | | 12.76 | | | | 4.63 | | | | 7.22 | | |
MSCI All Country World Index (Net) | | | | | | | 15.48 | | | | 3.82 | | | | 7.38 | | |
Returns for Class A are shown with and without the maximum initial sales charge of 5.75%. Returns for Class B are shown with and without the applicable contingent deferred sales charge (CDSC) of 5.00% in the first year, declining to 1.00% in the sixth year and eliminated thereafter. Returns for Class C are shown with and without the 1.00% CDSC for the first year only. The Fund's other classes are not subject to sales charges and have limited eligibility. Please see the Fund's prospectus for details. Performance for different share classes will vary based on differences in sales charges and fees associated with each class. All results shown assume reinvestment of distributions during the period. Returns do not reflect the deduction of taxes that a shareholder may pay on Fund distributions or on the redemption of Fund shares. Performance results reflect the effect of any fee waivers or reimbursements of Fund expenses by Columbia Management Investment Advisers, LLC and/or any of its affiliates. Absent these fee waivers or expense reimbursement arrangements, performance results would have been lower.
The performance information shown represents past performance and is not a guarantee of future results. The investment return and principal value of your investment will fluctuate so that your shares, when redeemed, may be worth more or less than their original cost. Current performance may be lower or higher than the performance information shown. You may obtain performance information current to the most recent month-end by contacting your financial intermediary, visiting columbiamanagement.com or calling 800.345.6611.
* The returns shown for periods prior to the share class inception date (including returns for the Life of the Fund, if shown, which are since Fund inception) include the returns of the Fund's oldest share class. These returns are adjusted to reflect any higher class-related operating expenses of the newer share classes, as applicable. Please visit columbiamanagement.com/mutual-funds/appended-performance for more information.
The MSCI All Country World Index (Net) is a free float-adjusted market capitalization weighted index that is designed to measure the equity market performance of developed and emerging markets. The index consists of 45 country indices comprising 24 developed and 21 emerging market country indices.
Indices are not available for investment, are not professionally managed and do not reflect sales charges, fees, brokerage commissions, taxes or other expenses of investing. Securities in the Fund may not match those in an index.
Annual Report 2013
2
Columbia Global Dividend Opportunity Fund
Performance Overview (continued)
Performance of a Hypothetical $10,000 Investment (September 1, 2003 – August 31, 2013)
The chart above shows the change in value of a hypothetical $10,000 investment in Class A shares of Columbia Global Dividend Opportunity Fund during the stated time period, and does not reflect the deduction of taxes that a shareholder may pay on Fund distributions or on the redemption of Fund shares.
Annual Report 2013
3
Columbia Global Dividend Opportunity Fund
Manager Discussion of Fund Performance
For the 12-month period that ended August 31, 2013, the Fund's Class A shares gained 12.48% excluding sales charges. The Fund underperformed its benchmark, the MSCI All Country World Index (Net), which returned 15.48% for the same time period. While generating solid absolute gains, the Fund's relative results were hurt by its emphasis on high dividend-yielding stocks, which were seen as most vulnerable to both the anticipation and actuality of rapidly rising interest rates.
Global Equity Markets Seesawed Way to New Highs
Global equity markets weathered multiple headwinds through the 12-month period ended August 31, 2013 but seesawed their way to repeated new highs. Challenges included sluggish domestic and international economic growth; uncertainty over the fiscal cliff of tax increases and spending cuts in the U.S., natural disasters such as Hurricane Sandy, a banking crisis in Cyprus, and worsening geopolitical tensions in Egypt and Syria. Balancing these challenges were strong commitments to low interest rates and accommodative monetary policy from central banks in the U.S., Europe and Japan, positive U.S. economic releases, especially regarding the U.S. housing market, and some degree of improved consumer confidence. The European Central Bank's commitment to the euro and its Outright Monetary Transactions program to buy unlimited amounts of short-term government bonds; the Bank of Japan's increase of its asset purchase program and the election of new Prime Minister Shinzo Abe in Japan; and the U.S. Federal Reserve's (Fed) extension of quantitative easing supported the global equity markets' rally most — although the latter roiled U.S. equity markets late in the annual period on concerns the program of asset purchases would be "tapered" later in 2013, driving interest rates higher. (Following the close of the reporting period, The Fed announced that it will continue its bond-buying program.)
In short, the frequent juxtaposition of positive and negative drivers produced volatile markets for global equities. For the annual period overall, the U.S., Japanese and European equity markets achieved robust double-digit gains. Emerging market equities lagged, pressured by currency fluctuations, geopolitical tensions and heightened investor risk aversion.
Consumer Discretionary Stock Selection Hampered Results Most
The Fund's results were hurt most by industry and stock selection in the consumer discretionary sector. Having an underweighted allocation in the media industry and a lack of exposure to the auto components industry, each of which performed strongly, hurt. Individual disappointments included Canadian loyalty management services provider Aimia and Hong Kong-based local television program producer Television Broadcasts. On the positive side, positions in several automobile manufacturers added value.
Industry and stock selection in the health care sector detracted from the Fund's results. The Fund had no exposure to the biotechnology industry and only a modest allocation to the health care providers industry during the period. Each of these segments significantly outpaced the benchmark during the period, however we had found it challenging to find companies with the valuation and dividend characteristics that met the Fund's investment criteria. Further, within the pharmaceuticals industry, those companies that featured the highest yielding
Portfolio Management
Paul Stocking
Steven Schroll
Dean Ramos, CFA
Morningstar Style BoxTM

The Morningstar Style BoxTM is based on a fund's portfolio holdings. For equity funds, the vertical axis shows the market capitalization of the stocks owned, and the horizontal axis shows investment style (value, blend, or growth). Information shown is based on the most recent data provided by Morningstar.
©2013 Morningstar, Inc. All rights reserved. The Morningstar information contained herein: (1) is proprietary to Morningstar and/or its content providers; (2) may not be copied or distributed; and (3) is not warranted to be accurate, complete or timely. Neither Morningstar nor its content providers are responsible for any damages or losses arising from any use of this information.
Top Ten Holdings (%)
(at August 31, 2013) | |
JPMorgan Chase & Co.
(United States) | | | 3.2 | | |
Wells Fargo & Co. (United States) | | | 2.1 | | |
Pfizer, Inc. (United States) | | | 2.1 | | |
General Electric Co. (United States) | | | 1.7 | | |
HSBC Holdings PLC, ADR
(United Kingdom) | | | 1.7 | | |
LyondellBasell Industries NV,
Class A (United States) | | | 1.6 | | |
Johnson & Johnson (United States) | | | 1.6 | | |
Apple, Inc. (United States) | | | 1.5 | | |
Cisco Systems, Inc. (United States) | | | 1.3 | | |
PepsiCo, Inc. (United States) | | | 1.3 | | |
Percentages indicated are based upon total investments (excluding Money Market Funds).
For further detail about these holdings, please refer to the section entitled "Portfolio of Investments."
Fund holdings are as of the date given, are subject to change at any time, and are not recommendations to buy or sell any security.
Annual Report 2013
4
Columbia Global Dividend Opportunity Fund
Manager Discussion of Fund Performance (continued)
stocks, such as Eli Lilly, Merck and Sanofi where the Fund was invested, were weak relative to their peers on concerns about rising interest rates.
Stock selection in, and overweight allocations to, utilities and telecommunication services, each of which lagged the benchmark, detracted from Fund results. Performance by Czech utility CEZ and German utility E.ON fell short of expectations. In telecommunication services, a position in Telefonica Czech Republic disappointed.
From a country perspective, overweight allocations to the Czech Republic, Turkey and the U.K. detracted. Shifts in the Fund's U.S. positioning also detracted from performance. These shifts were a result of our continued transition to the Fund's global investment mandate, which began implementation in the previous fiscal year.
Materials and Information Technology Positioning Buoyed Fund Results
Industry and stock selection in materials added value, with an underweight to metals and mining and an overweight to chemicals proving most beneficial. In the chemicals industry, positions in LyondellBasell Industries, Dow Chemical and Nitto Denko were notably strong performers.
Stock selection in information technology was effective. Having an underweight position in the computers and peripherals industry — in Apple, particularly — helped, as weakness was seen in both. Having overweight positions in the stronger communications equipment industry boosted results, with notable contributions from Cisco Systems and Telefonaktiebolaget LM Ericsson.
While stock selection in financials also proved effective, especially an emphasis on banking and insurance firms and a de-emphasis on real estate investment trusts, this was offset by an underweight position in the strongly performing sector.
Our team's hedging strategies within some of the Fund's international currency exposures, including both the Japanese yen and the British pound, provided an offset to currency weakness in Japan and the United Kingdom and contributed positively to the Fund's results.
From a country perspective, having underweighted exposure to several emerging equity markets — most notably Brazil, South Korea, South Africa, India and Mexico, which lagged the benchmark, buoyed the Fund's relative results.
Various Factors Drove Country and Sector Weighting Changes
As part of the ongoing process to implement the global nature of the Fund's investment mandate, we reduced the Fund's U.S. equity market exposure and increased the Fund's international exposure, including allocations to developed and developing markets in Europe, Latin America and Asia.
Based on fundamental, bottom-up stock selection, the Fund's allocations to the energy, utilities and information technology sectors decreased, and its exposure to the industrials, financials and materials sectors increased.
Country Breakdown (%)
(at August 31, 2013) | |
Australia | | | 1.8 | | |
Brazil | | | 0.2 | | |
Canada | | | 5.6 | | |
Chile | | | 0.6 | | |
China | | | 0.5 | | |
France | | | 3.5 | | |
Germany | | | 3.0 | | |
Greece | | | 0.3 | | |
Hong Kong | | | 0.3 | | |
Indonesia | | | 0.5 | | |
Israel | | | 0.6 | | |
Italy | | | 0.7 | | |
Japan | | | 8.2 | | |
Malaysia | | | 0.6 | | |
Netherlands | | | 1.8 | | |
Norway | | | 1.2 | | |
Peru | | | 0.4 | | |
Poland | | | 1.1 | | |
Singapore | | | 0.6 | | |
Spain | | | 0.9 | | |
Sweden | | | 1.1 | | |
Switzerland | | | 2.7 | | |
Taiwan | | | 1.2 | | |
Thailand | | | 0.3 | | |
Turkey | | | 1.3 | | |
United Kingdom | | | 8.3 | | |
United States(a) | | | 52.7 | | |
Total | | | 100.0 | | |
Percentages indicated are based upon total investments. The Fund's portfolio composition is subject to change.
(a) Includes investments in Money Market Funds.
Investment Risks
International investing involves increased risk and volatility due to potential political and economic instability, currency fluctuations, and differences in financial reporting and accounting standards and oversight. Risks are particularly significant in emerging markets. Dividend payments are not guaranteed. The amount of a dividend payment, if any, can vary over time and issuers may reduce dividends paid on securities in the event of a recession or adverse event affecting a specific industry or issuer. See the Fund's prospectus for information on these and other risks.
Annual Report 2013
5
Columbia Global Dividend Opportunity Fund
Manager Discussion of Fund Performance (continued)
Looking Ahead
Our current view ahead for the global economy is one of modest expansion. Europe reported 0.3% Gross Domestic Product growth for the second quarter of 2013, ending six consecutive quarters of economic contraction. U.S. economic growth remains positive — but not accelerating — at present. In our view, the biggest uncertainty on this front is China, which we believe is sending mixed signals. Without concern of overheating global economic growth, we do not currently anticipate a rapid rise in interest rates going forward, but rather a more gradual increase. That said, the heightened sensitivity to interest rates pervading investor sentiment of late may mean some greater volatility in the equity markets going forward.
Importantly, we do not believe high-yielding dividend-paying equities necessarily underperform in a rising interest rate environment. Indeed, rising interest rates and advancing equity markets are not always mutually exclusive, especially when there is improving economic growth and when interest rates are still historically low. While some investors make the assumption high-yielding dividend-paying stocks have to underperform and thus sell them, creating an emotion-driven correction, we believe improved broad investor sentiment and increased flows into equities could be catalysts for the global equity markets in the months ahead. We further believe a disciplined focus on business fundamentals should ultimately reward investors maintaining a long-term perspective.
Going forward, we believe the Fund is positioned well in companies whose fundamentals are capable of weathering a gradually rising interest rate environment, and we intend to continue to use dividend yield as an important component in our stock selection process.
Summary of Investments in Securities
by Industry (%) (at August 31, 2013) | |
Industry | | Percentage of
Net Assets (%) | |
Aerospace & Defense | | | 2.8 | | |
Automobiles | | | 2.9 | | |
Beverages | | | 1.9 | | |
Capital Markets | | | 0.7 | | |
Chemicals | | | 3.2 | | |
Commercial Banks | | | 9.7 | | |
Commercial Services &
Supplies | | | 0.8 | | |
Communications Equipment | | | 2.0 | | |
Computers & Peripherals | | | 1.4 | | |
Construction & Engineering | | | 0.9 | | |
Diversified Financial Services | | | 4.3 | | |
Diversified Telecommunication
Services | | | 5.7 | | |
Electric Utilities | | | 1.3 | | |
Electrical Equipment | | | 0.0 | (a) | |
Energy Equipment & Services | | | 1.2 | | |
Food & Staples Retailing | | | 1.7 | | |
Food Products | | | 3.1 | | |
Health Care Providers & Services | | | 0.8 | | |
Hotels, Restaurants & Leisure | | | 1.7 | | |
Household Durables | | | 0.4 | | |
Household Products | | | 0.6 | | |
Industrial Conglomerates | | | 3.0 | | |
Insurance | | | 4.1 | | |
Machinery | | | 1.1 | | |
Media | | | 2.0 | | |
Metals & Mining | | | 1.0 | | |
Multiline Retail | | | 0.7 | | |
Multi-Utilities | | | 4.0 | | |
Office Electronics | | | 0.1 | | |
Oil, Gas & Consumable Fuels | | | 6.7 | | |
Paper & Forest Products | | | 1.0 | | |
Personal Products | | | 0.2 | | |
Pharmaceuticals | | | 9.7 | | |
Real Estate Investment Trusts
(REITs) | | | 0.0 | (a) | |
Semiconductors &
Semiconductor Equipment | | | 3.3 | | |
Software | | | 2.3 | | |
Specialty Retail | | | 0.5 | | |
Tobacco | | | 3.7 | | |
Trading Companies & Distributors | | | 1.6 | | |
Transportation Infrastructure | | | 0.3 | | |
Wireless Telecommunication
Services | | | 2.6 | | |
Money Market Funds | | | 4.0 | | |
Total | | | 99.0 | | |
Percentages indicated are based upon net assets. The Fund's portfolio composition is subject to change.
(a) Rounds to zero.
Annual Report 2013
6
Columbia Global Dividend Opportunity Fund
Understanding Your Fund's Expenses
(Unaudited)
As an investor, you incur two types of costs. There are transaction costs, which generally include sales charges on purchases and may include redemption fees. There are also ongoing costs, which generally include management fees, distribution and service (Rule 12b-1) fees, and other fund expenses. The following information is intended to help you understand your ongoing costs (in dollars) of investing in the Fund and to help you compare these costs with the ongoing costs of investing in other mutual funds.
Analyzing Your Fund's Expenses
To illustrate these ongoing costs, we have provided examples and calculated the expenses paid by investors in each share class of the Fund during the period. The actual and hypothetical information in the table is based on an initial investment of $1,000 at the beginning of the period indicated and held for the entire period. Expense information is calculated two ways and each method provides you with different information. The amount listed in the "Actual" column is calculated using the Fund's actual operating expenses and total return for the period. You may use the Actual information, together with the amount invested, to estimate the expenses that you paid over the period. Simply divide your account value by $1,000 (for example, an $8,600 account value divided by $1,000 = 8.6), then multiply the results by the expenses paid during the period under the Actual column. The amount listed in the "Hypothetical" column assumes a 5% annual rate of return before expenses (which is not the Fund's actual return) and then applies the Fund's actual expense ratio for the period to the hypothetical return. You should not use the hypothetical account values and expenses to estimate either your actual account balance at the end of the period or the expenses you paid during the period. See "Compare With Other Funds" below for details on how to use the hypothetical data.
Compare With Other Funds
Since all mutual funds are required to include the same hypothetical calculations about expenses in shareholder reports, you can use this information to compare the ongoing cost of investing in the Fund with other funds. To do so, compare the hypothetical example with the 5% hypothetical examples that appear in the shareholder reports of other funds. As you compare hypothetical examples of other funds, it is important to note that hypothetical examples are meant to highlight the ongoing costs of investing in a fund only and do not reflect any transaction costs, such as sales charges, or redemption or exchange fees. Therefore, the hypothetical calculations are useful in comparing ongoing costs only, and will not help you determine the relative total costs of owning different funds. If transaction costs were included in these calculations, your costs would be higher.
March 1, 2013 – August 31, 2013
| | | Account Value at the Beginning
of the Period ($) | | Account Value at the End of the
Period ($) | | Expenses Paid During the
Period ($) | | Fund's Annualized
Expense Ratio (%) | |
| | | Actual | | Hypothetical | | Actual | | Hypothetical | | Actual | | Hypothetical | | Actual | |
Class A | | | 1,000.00 | | | | 1,000.00 | | | | 1,045.60 | | | | 1,018.60 | | | | 6.62 | | | | 6.53 | | | | 1.29 | | |
Class B | | | 1,000.00 | | | | 1,000.00 | | | | 1,041.10 | | | | 1,014.84 | | | | 10.44 | | | | 10.30 | | | | 2.04 | | |
Class C | | | 1,000.00 | | | | 1,000.00 | | | | 1,041.10 | | | | 1,014.84 | | | | 10.44 | | | | 10.30 | | | | 2.04 | | |
Class I | | | 1,000.00 | | | | 1,000.00 | | | | 1,047.90 | | | | 1,020.91 | | | | 4.26 | | | | 4.20 | | | | 0.83 | | |
Class R | | | 1,000.00 | | | | 1,000.00 | | | | 1,044.40 | | | | 1,017.35 | | | | 7.89 | | | | 7.79 | | | | 1.54 | | |
Class R4 | | | 1,000.00 | | | | 1,000.00 | | | | 1,030.20 | * | | | 1,019.85 | | | | 4.71 | * | | | 5.27 | | | | 1.04 | * | |
Class W | | | 1,000.00 | | | | 1,000.00 | | | | 1,045.10 | | | | 1,018.60 | | | | 6.61 | | | | 6.53 | | | | 1.29 | | |
Class Y | | | 1,000.00 | | | | 1,000.00 | | | | 1,047.80 | | | | 1,020.96 | | | | 4.21 | | | | 4.15 | | | | 0.82 | | |
Class Z | | | 1,000.00 | | | | 1,000.00 | | | | 1,046.80 | | | | 1,019.85 | | | | 5.34 | | | | 5.27 | | | | 1.04 | | |
*For the period March 19, 2013 through August 31, 2013. Class R4 shares commenced operations on March 19, 2013.
Expenses paid during the period are equal to the annualized expense ratio for each class as indicated above, multiplied by the average account value over the period and then multiplied by the number of days in the Fund's most recent fiscal half year and divided by 365.
Expenses do not include fees and expenses incurred indirectly by the Fund from the underlying funds in which the Fund may invest (also referred to as "acquired funds"), including affiliated and non-affiliated pooled investment vehicles (including mutual funds and exchange-traded funds).
Had Columbia Management Investment Advisers, LLC and/or certain of its affiliates not waived/reimbursed certain fees and expenses, account value at the end of the period would have been reduced.
Annual Report 2013
7
Columbia Global Dividend Opportunity Fund
Portfolio of Investments
August 31, 2013
(Percentages represent value of investments compared to net assets)
Common Stocks 94.8%
Issuer | | Shares | | Value ($) | |
Australia 1.7% | |
AMP Ltd. | | | 870,438 | | | | 3,651,422 | | |
Australia and New Zealand Banking
Group Ltd. | | | 211,574 | | | | 5,554,669 | | |
BHP Billiton Ltd. | | | 172,440 | | | | 5,453,198 | | |
Total | | | | | 14,659,289 | | |
Brazil 0.2% | |
Natura Cosmeticos SA | | | 91,327 | | | | 1,714,809 | | |
Canada 5.5% | |
Aimia, Inc. | | | 439,900 | | | | 6,690,590 | | |
BCE, Inc. | | | 108,639 | | | | 4,449,853 | | |
Enbridge, Inc. | | | 205,591 | | | | 8,418,951 | | |
Sun Life Financial, Inc. | | | 247,421 | | | | 7,529,021 | | |
Suncor Energy, Inc. | | | 291,063 | | | | 9,858,304 | | |
TELUS Corp. | | | 74,494 | | | | 2,285,812 | | |
Toronto-Dominion Bank (The) | | | 86,778 | | | | 7,421,255 | | |
Total | | | | | 46,653,786 | | |
Chile 0.6% | |
Banco de Chile, ADR | | | 57,939 | | | | 4,791,555 | | |
China 0.5% | |
China Mobile Ltd., ADR | | | 75,753 | | | | 4,088,389 | | |
France 3.4% | |
Bouygues SA | | | 67,602 | | | | 2,114,378 | | |
Danone SA | | | 69,192 | | | | 5,152,158 | | |
GDF Suez | | | 206,926 | | | | 4,485,133 | | |
Sanofi | | | 49,442 | | | | 4,749,929 | | |
Veolia Environnement SA | | | 284,573 | | | | 4,383,514 | | |
Vivendi SA | | | 392,905 | | | | 7,968,396 | | |
Total | | | | | 28,853,508 | | |
Germany 3.0% | |
Allianz SE, Registered Shares | | | 56,415 | | | | 8,082,400 | | |
Daimler AG, Registered Shares | | | 78,400 | | | | 5,379,813 | | |
E.ON SE | | | 149,934 | | | | 2,373,960 | | |
Infineon Technologies AG | | | 271,970 | | | | 2,465,821 | | |
OSRAM Licht AG(a) | | | 6,527 | | | | 261,294 | | |
Siemens AG, Registered Shares | | | 65,272 | | | | 6,909,103 | | |
Total | | | | | 25,472,391 | | |
Common Stocks (continued)
Issuer | | Shares | | Value ($) | |
Greece 0.3% | |
OPAP SA | | | 274,038 | | | | 2,716,367 | | |
Hong Kong 0.3% | |
Television Broadcasts Ltd. | | | 433,600 | | | | 2,833,355 | | |
Indonesia 0.5% | |
PT Telekomunikasi Tbk | | | 22,272,500 | | | | 4,473,864 | | |
Israel 0.6% | |
Bezeq Israeli Telecommunication
Corp. Ltd. (The), ADR | | | 626,823 | | | | 5,161,887 | | |
Italy 0.7% | |
ENI SpA | | | 259,198 | | | | 5,919,593 | | |
Japan 8.1% | |
Astellas Pharma, Inc. | | | 76,200 | | | | 3,876,896 | | |
Canon, Inc. | | | 26,100 | | | | 780,615 | | |
FANUC CORP. | | | 29,200 | | | | 4,431,382 | | |
ITOCHU Corp. | | | 519,600 | | | | 5,849,256 | | |
Komatsu Ltd. | | | 182,300 | | | | 3,959,359 | | |
Lawson, Inc. | | | 83,200 | | | | 6,248,391 | | |
Mitsubishi Corp. | | | 218,900 | | | | 4,072,371 | | |
Mitsui & Co., Ltd. | | | 287,700 | | | | 3,978,568 | | |
Mizuho Financial Group, Inc. | | | 3,628,300 | | | | 7,354,189 | | |
Nissan Motor Co., Ltd. | | | 676,400 | | | | 6,691,312 | | |
Nitto Denko Corp. | | | 57,100 | | | | 3,019,753 | | |
NTT DoCoMo, Inc. | | | 4,108 | | | | 6,567,166 | | |
Ono Pharmaceutical Co., Ltd. | | | 32,400 | | | | 1,944,643 | | |
Sumitomo Mitsui Financial Group, Inc. | | | 129,400 | | | | 5,687,889 | | |
Toyota Motor Corp. | | | 75,800 | | | | 4,559,479 | | |
Total | | | | | 69,021,269 | | |
Malaysia 0.6% | |
Malayan Banking Bhd | | | 1,677,100 | | | | 5,098,805 | | |
Netherlands 1.5% | |
Reed Elsevier NV | | | 163,118 | | | | 2,945,968 | | |
Unilever NV — NY Shares | | | 260,015 | | | | 9,784,364 | | |
Total | | | | | 12,730,332 | | |
Norway 1.2% | |
Seadrill Ltd. | | | 217,027 | | | | 10,039,669 | | |
The accompanying Notes to Financial Statements are an integral part of this statement.
Annual Report 2013
8
Columbia Global Dividend Opportunity Fund
Portfolio of Investments (continued)
August 31, 2013
Common Stocks (continued)
Issuer | | Shares | | Value ($) | |
Peru 0.4% | |
Southern Copper Corp. | | | 109,958 | | | | 3,023,845 | | |
Poland 1.1% | |
Powszechna Kasa Oszczednosci
Bank Polski SA(a) | | | 394,493 | | | | 4,675,988 | | |
Powszechny Zaklad Ubezpieczen SA | | | 36,174 | | | | 4,901,658 | | |
Total | | | | | 9,577,646 | | |
Singapore 0.6% | |
Keppel REIT | | | 157,200 | | | | 147,427 | | |
Keppel Corp., Ltd. | | | 570,000 | | | | 4,503,702 | | |
Total | | | | | 4,651,129 | | |
Spain 0.9% | |
Banco Bilbao Vizcaya Argentaria SA | | | 251,191 | | | | 2,396,943 | | |
Ferrovial SA | | | 167,864 | | | | 2,784,311 | | |
Iberdrola SA | | | 435,626 | | | | 2,309,889 | | |
Total | | | | | 7,491,143 | | |
Sweden 1.1% | |
Skanska AB, Class B | | | 143,911 | | | | 2,577,536 | | |
Telefonaktiebolaget LM Ericsson, ADR | | | 597,174 | | | | 7,034,710 | | |
Total | | | | | 9,612,246 | | |
Switzerland 2.7% | |
ACE Ltd. | | | 52,775 | | | | 4,629,423 | | |
Novartis AG, ADR | | | 60,546 | | | | 4,418,647 | | |
Roche Holding AG, Genusschein Shares | | | 37,358 | | | | 9,318,923 | | |
Syngenta AG, Registered Shares | | | 11,849 | | | | 4,645,618 | | |
Total | | | | | 23,012,611 | | |
Taiwan 1.2% | |
Far EasTone Telecommunications
Co., Ltd. | | | 1,894,000 | | | | 4,779,760 | | |
Taiwan Semiconductor
Manufacturing Co., Ltd. | | | 1,087,000 | | | | 3,603,814 | | |
United Microelectronics Corp. | | | 4,963,000 | | | | 2,027,844 | | |
Total | | | | | 10,411,418 | | |
Thailand 0.3% | |
Bangkok Expressway PCL, Foreign
Registered Shares | | | 2,563,400 | | | | 2,698,415 | | |
Common Stocks (continued)
Issuer | | Shares | | Value ($) | |
Turkey 1.3% | |
Arcelik AS | | | 756,150 | | | | 3,766,667 | | |
Ford Otomotiv Sanayi AS | | | 424,926 | | | | 5,261,759 | | |
Turk Telekomunikasyon AS | | | 754,150 | | | | 2,283,752 | | |
Total | | | | | 11,312,178 | | |
United Kingdom 8.2% | |
BAE Systems PLC, ADR | | | 101,086 | | | | 2,729,322 | | |
British American Tobacco PLC | | | 126,790 | | | | 6,395,636 | | |
Britvic PLC | | | 629,558 | | | | 5,595,217 | | |
GlaxoSmithKline PLC, ADR | | | 103,679 | | | | 5,276,224 | | |
HSBC Holdings PLC, ADR | | | 268,133 | | | | 14,055,532 | | |
Imperial Tobacco Group PLC | | | 246,094 | | | | 8,130,851 | | |
Inmarsat PLC | | | 387,079 | | | | 4,169,003 | | |
Intercontinental Hotels Group PLC | | | 74,409 | | | | 2,079,069 | | |
Marks & Spencer Group PLC | | | 568,645 | | | | 4,156,759 | | |
National Grid PLC | | | 493,027 | | | | 5,673,028 | | |
Vodafone Group PLC, ADR | | | 197,938 | | | | 6,403,294 | | |
WPP PLC | | | 263,849 | | | | 4,886,199 | | |
Total | | | | | 69,550,134 | | |
United States 48.3% | |
AbbVie, Inc. | | | 154,748 | | | | 6,593,812 | | |
Altria Group, Inc. | | | 114,788 | | | | 3,889,017 | | |
Analog Devices, Inc. | | | 118,132 | | | | 5,467,149 | | |
Apple, Inc. | | | 25,293 | | | | 12,318,956 | | |
AT&T, Inc. | | | 259,337 | | | | 8,773,371 | | |
Bank of America Corp. | | | 352,773 | | | | 4,981,155 | | |
Bristol-Myers Squibb Co. | | | 48,413 | | | | 2,018,338 | | |
CA, Inc. | | | 183,643 | | | | 5,371,558 | | |
Cardinal Health, Inc. | | | 83,452 | | | | 4,195,967 | | |
Caterpillar, Inc. | | | 15,215 | | | | 1,255,846 | | |
CenturyLink, Inc. | | | 93,208 | | | | 3,087,049 | | |
Chevron Corp. | | | 67,704 | | | | 8,153,593 | | |
Cisco Systems, Inc. | | | 439,943 | | | | 10,255,071 | | |
Citigroup, Inc. | | | 124,681 | | | | 6,025,833 | | |
ConocoPhillips | | | 134,776 | | | | 8,935,649 | | |
Dow Chemical Co. (The) | | | 182,432 | | | | 6,822,957 | | |
Duke Energy Corp. | | | 61,295 | | | | 4,020,952 | | |
Eli Lilly & Co. | | | 119,806 | | | | 6,158,028 | | |
The accompanying Notes to Financial Statements are an integral part of this statement.
Annual Report 2013
9
Columbia Global Dividend Opportunity Fund
Portfolio of Investments (continued)
August 31, 2013
Common Stocks (continued)
Issuer | | Shares | | Value ($) | |
General Electric Co. | | | 611,270 | | | | 14,144,788 | | |
HollyFrontier Corp. | | | 152,569 | | | | 6,786,269 | | |
Home Depot, Inc. (The) | | | 60,207 | | | | 4,484,819 | | |
Honeywell International, Inc. | | | 108,930 | | | | 8,667,560 | | |
Intel Corp. | | | 333,615 | | | | 7,332,858 | | |
International Paper Co. | | | 173,507 | | | | 8,191,265 | | |
Johnson & Johnson | | | 145,550 | | | | 12,576,975 | | |
JPMorgan Chase & Co. | | | 508,353 | | | | 25,687,077 | | |
Kinder Morgan, Inc. | | | 115,982 | | | | 4,399,197 | | |
Kohl's Corp. | | | 36,993 | | | | 1,898,111 | | |
Kraft Foods Group, Inc. | | | 109,912 | | | | 5,690,144 | | |
Las Vegas Sands Corp. | | | 53,833 | | | | 3,033,490 | | |
Lockheed Martin Corp. | | | 47,120 | | | | 5,768,430 | | |
Lorillard, Inc. | | | 200,852 | | | | 8,496,040 | | |
LyondellBasell Industries NV, Class A | | | 184,408 | | | | 12,936,221 | | |
Marsh & McLennan Companies, Inc. | | | 152,632 | | | | 6,293,017 | | |
Maxim Integrated Products, Inc. | | | 78,903 | | | | 2,197,054 | | |
McDonald's Corp. | | | 66,515 | | | | 6,276,355 | | |
Mead Johnson Nutrition Co. | | | 29,161 | | | | 2,187,950 | | |
Merck & Co., Inc. | | | 178,968 | | | | 8,463,397 | | |
Microchip Technology, Inc. | | | 119,508 | | | | 4,638,105 | | |
Microsoft Corp. | | | 238,454 | | | | 7,964,364 | | |
Mondelez International, Inc., Class A | | | 110,508 | | | | 3,389,280 | | |
Morgan Stanley | | | 242,349 | | | | 6,242,910 | | |
Oracle Corp. | | | 191,478 | | | | 6,100,489 | | |
PepsiCo, Inc. | | | 127,344 | | | | 10,153,137 | | |
Pfizer, Inc. | | | 608,022 | | | | 17,152,301 | | |
PG&E Corp. | | | 147,004 | | | | 6,080,085 | | |
Philip Morris International, Inc. | | | 54,024 | | | | 4,507,763 | | |
PPL Corp. | | | 142,344 | | | | 4,369,961 | | |
Procter & Gamble Co. (The) | | | 65,300 | | | | 5,086,217 | | |
Public Service Enterprise Group, Inc. | | | 112,026 | | | | 3,631,883 | | |
RR Donnelley & Sons Co. | | | 423,206 | | | | 7,059,076 | | |
Sempra Energy | | | 86,664 | | | | 7,316,175 | | |
SYSCO Corp. | | | 126,089 | | | | 4,037,370 | | |
U.S. Bancorp | | | 221,913 | | | | 8,017,717 | | |
United Technologies Corp. | | | 63,974 | | | | 6,403,797 | | |
UnitedHealth Group, Inc. | | | 31,722 | | | | 2,275,736 | | |
Verizon Communications, Inc. | | | 124,467 | | | | 5,897,246 | | |
Common Stocks (continued)
Issuer | | Shares | | Value ($) | |
Walgreen Co. | | | 88,237 | | | | 4,241,553 | | |
Wells Fargo & Co. | | | 422,010 | | | | 17,336,171 | | |
Williams Companies, Inc. (The) | | | 126,186 | | | | 4,572,981 | | |
Total | | | | | 410,309,635 | | |
Total Common Stocks
(Cost: $711,973,388) | | | | | 805,879,268 | | |
Convertible Bonds 0.3%
Issuer | | Coupon
Rate | | Principal
Amount | | Value ($) | |
Netherlands 0.3% | |
Volkswagen International
Finance NV(b)
11/09/15 | | | 5.500 | % | | | 1,700,000 | | | | 2,467,216 | | |
Total Convertible Bonds
(Cost: $2,220,845) | | | | | | | 2,467,216 | | |
Money Market Funds 4.0%
| | | Shares | | Value ($) | |
Columbia Short-Term Cash Fund,
0.097%(c)(d) | | | 34,056,432 | | | | 34,056,432 | | |
Total Money Market Funds
(Cost: $34,056,432) | | | | | 34,056,432 | | |
Total Investments
(Cost: $748,250,665) | | | | | 842,402,916 | | |
Other Assets & Liabilities, Net | | | | | 7,474,621 | | |
Net Assets | | | | | 849,877,537 | | |
The accompanying Notes to Financial Statements are an integral part of this statement.
Annual Report 2013
10
Columbia Global Dividend Opportunity Fund
Portfolio of Investments (continued)
August 31, 2013
Investments in Derivatives
Forward Foreign Currency Exchange Contracts Open at August 31, 2013
Counterparty | |
Exchange Date | | Currency to
be Delivered | | Currency to
be Received | | Unrealized
Appreciation ($) | | Unrealized
Depreciation ($) | |
Citigroup
| | September 27, 2013
| | | 11,123,000
(GBP) | | | | 16,951,230
(USD) | | | | —
| | | | (283,017
| ) | |
Citigroup
| | September 27, 2013
| | | 993,281,000
(JPY) | | | | 10,171,223
(USD) | | | | 53,773
| | | | —
| | |
Total | | | | | | | | | 53,773 | | | | (283,017 | ) | |
Notes to Portfolio of Investments
(a) Non-income producing.
(b) Security exempt from registration pursuant to Rule 144A under the Securities Act of 1933. This security may be resold in transactions exempt from registration, normally to qualified institutional buyers. At August 31, 2013, the value of these securities amounted to $2,467,216 or 0.29% of net assets.
(c) The rate shown is the seven-day current annualized yield at August 31, 2013.
(d) As defined in the Investment Company Act of 1940, an affiliated company is one in which the Fund owns 5% or more of its outstanding voting securities, or a company which is under common ownership or control with the Fund. Holdings and transactions in these affiliated companies during the year ended August 31, 2013, are as follows:
Issuer | | Beginning
Cost ($) | | Purchase
Cost ($) | | Proceeds
from Sales ($) | | Ending
Cost ($) | | Dividends —
Affiliated
Issuers ($) | | Value ($) | |
Columbia Short-Term Cash Fund | | | 10,863,036 | | | | 333,355,395 | | | | (310,161,999 | ) | | | 34,056,432 | | | | 19,564 | | | | 34,056,432 | | |
Abbreviation Legend
ADR American Depositary Receipt
Currency Legend
GBP British Pound
JPY Japanese Yen
USD US Dollar
The accompanying Notes to Financial Statements are an integral part of this statement.
Annual Report 2013
11
Columbia Global Dividend Opportunity Fund
Portfolio of Investments (continued)
August 31, 2013
Fair Value Measurements
Generally accepted accounting principles (GAAP) require disclosure regarding the inputs and valuation techniques used to measure fair value and any changes in valuation inputs or techniques. In addition, investments shall be disclosed by major category.
The Fund categorizes its fair value measurements according to a three-level hierarchy that maximizes the use of observable inputs and minimizes the use of unobservable inputs by prioritizing that the most observable input be used when available. Observable inputs are those that market participants would use in pricing an investment based on market data obtained from sources independent of the reporting entity. Unobservable inputs are those that reflect the Fund's assumptions about the information market participants would use in pricing an investment. An investment's level within the fair value hierarchy is based on the lowest level of any input that is deemed significant to the asset or liability's fair value measurement. The input levels are not necessarily an indication of the risk or liquidity associated with investments at that level. For example, certain U.S. government securities are generally high quality and liquid, however, they are reflected as Level 2 because the inputs used to determine fair value may not always be quoted prices in an active market.
Fair value inputs are summarized in the three broad levels listed below:
> Level 1 — Valuations based on quoted prices for investments in active markets that the Fund has the ability to access at the measurement date (including NAV for open-end mutual funds). Valuation adjustments are not applied to Level 1 investments.
> Level 2 — Valuations based on other significant observable inputs (including quoted prices for similar securities, interest rates, prepayment speeds, credit risks, etc.).
> Level 3 — Valuations based on significant unobservable inputs (including the Fund's own assumptions and judgment in determining the fair value of investments).
Inputs that are used in determining fair value of an investment may include price information, credit data, volatility statistics, and other factors. These inputs can be either observable or unobservable. The availability of observable inputs can vary between investments, and is affected by various factors such as the type of investment, and the volume and level of activity for that investment or similar investments in the marketplace. The inputs will be considered by the Investment Manager, along with any other relevant factors in the calculation of an investment's fair value. The Fund uses prices and inputs that are current as of the measurement date, which may include periods of market dislocations. During these periods, the availability of prices and inputs may be reduced for many investments. This condition could cause an investment to be reclassified between the various levels within the hierarchy.
Foreign equity securities actively traded in markets where there is a significant delay in the local close relative to the New York Stock Exchange (NYSE) are classified as Level 2. The values of these securities may include an adjustment to reflect the impact of significant market movements following the close of local trading, as described in Note 2 to the financial statements — Security Valuation.
Investments falling into the Level 3 category are primarily supported by quoted prices from brokers and dealers participating in the market for those investments. However, these may be classified as Level 3 investments due to lack of market transparency and corroboration to support these quoted prices. Additionally, valuation models may be used as the pricing source for any remaining investments classified as Level 3. These models may rely on one or more significant unobservable inputs and/or significant assumptions by the Investment Manager. Inputs used in valuations may include, but are not limited to, financial statement analysis, capital account balances, discount rates and estimated cash flows, and comparable company data.
Under the direction of the Fund's Board of Trustees (the Board), the Investment Manager's Valuation Committee (the Committee) is responsible for carrying out the valuation procedures approved by the Board. The Committee consists of voting and non-voting members from various groups within the Investment Manager's organization, including operations and accounting, trading and investments, compliance, risk management and legal.
The Committee meets at least monthly to review and approve valuation matters, which may include a description of specific valuation determinations, data regarding pricing information received from approved pricing vendors and brokers and the results of Board-approved valuation control policies and procedures (the Policies). The Policies address, among other things, instances when market quotations are or are not readily available, including recommendations of third party pricing vendors and a determination of appropriate pricing methodologies; events that require specific valuation determinations and assessment of fair value techniques; securities with a potential for stale pricing, including those that are illiquid, restricted, or in default; and the effectiveness of third-party pricing vendors, including periodic reviews of vendors. The Committee meets more frequently, as needed, to discuss additional valuation matters, which may include the need to review back-testing results, review time-sensitive information or approve related valuation actions. The Committee reports to the Board, with members of the Committee meeting with the Board at each of its regularly scheduled meetings to discuss valuation matters and actions during the period, similar to those described earlier.
For investments categorized as Level 3, the Committee monitors information similar to that described above, which may include: (i) data specific to the issuer or comparable issuers, (ii) general market or specific sector news and (iii) quoted prices and specific or similar security transactions. The Committee considers this data and any changes from prior periods in order to assess the reasonableness of observable and unobservable inputs, any assumptions or internal models used to value those securities and changes in fair value. This data is also used to corroborate, when available, information received from approved pricing vendors and brokers. Various factors impact the frequency of monitoring this information (which may occur as often as daily). However, the Committee may determine that changes to inputs, assumptions and models are not required as a result of the monitoring procedures performed.
The accompanying Notes to Financial Statements are an integral part of this statement.
Annual Report 2013
12
Columbia Global Dividend Opportunity Fund
Portfolio of Investments (continued)
August 31, 2013
Fair Value Measurements (continued)
The following table is a summary of the inputs used to value the Fund's investments at August 31, 2013:
Description | | Level 1
Quoted Prices in Active
Markets for Identical
Assets ($) | | Level 2
Other Significant
Observable Inputs ($) | | Level 3
Significant
Unobservable Inputs ($) | | Total ($) | |
Equity Securities | |
Common Stocks | |
Consumer Discretionary | | | 22,383,365 | | | | 45,276,747 | | | | — | | | | 67,660,112 | | |
Consumer Staples | | | 63,177,644 | | | | 31,522,253 | | | | — | | | | 94,699,897 | | |
Energy | | | 61,164,613 | | | | 5,919,593 | | | | — | | | | 67,084,206 | | |
Financials | | | 113,010,665 | | | | 47,551,388 | | | | — | | | | 160,562,053 | | |
Health Care | | | 69,129,426 | | | | 19,890,391 | | | | — | | | | 89,019,817 | | |
Industrials | | | 46,028,820 | | | | 44,139,674 | | | | — | | | | 90,168,494 | | |
Information Technology | | | 68,680,313 | | | | 8,878,094 | | | | — | | | | 77,558,407 | | |
Materials | | | 30,974,288 | | | | 13,118,569 | | | | — | | | | 44,092,857 | | |
Telecommunication Services | | | 40,146,903 | | | | 30,241,941 | | | | — | | | | 70,388,844 | | |
Utilities | | | 25,419,056 | | | | 19,225,525 | | | | — | | | | 44,644,581 | | |
Total Equity Securities | | | 540,115,093 | | | | 265,764,175 | | | | — | | | | 805,879,268 | | |
Bonds | |
Convertible Bonds | | | — | | | | 2,467,216 | | | | — | | | | 2,467,216 | | |
Total Bonds | | | — | | | | 2,467,216 | | | | — | | | | 2,467,216 | | |
Mutual Funds | |
Money Market Funds | | | 34,056,432 | | | | — | | | | — | | | | 34,056,432 | | |
Total Mutual Funds | | | 34,056,432 | | | | — | | | | — | | | | 34,056,432 | | |
Investments in Securities | | | 574,171,525 | | | | 268,231,391 | | | | — | | | | 842,402,916 | | |
Derivatives | |
Assets | |
Forward Foreign Currency Exchange Contracts | | | — | | | | 53,773 | | | | — | | | | 53,773 | | |
Liabilities | |
Forward Foreign Currency Exchange Contracts | | | — | | | | (283,017 | ) | | | — | | | | (283,017 | ) | |
Total | | | 574,171,525 | | | | 268,002,147 | | | | — | | | | 842,173,672 | | |
See the Portfolio of Investments for all investment classifications not indicated in the table.
The Fund's assets assigned to the Level 2 input category are generally valued using the market approach, in which a security's value is determined through reference to prices and information from market transactions for similar or identical assets. These assets include certain foreign securities for which a third party statistical pricing service may be employed for purposes of fair market valuation. The models utilized by the third party statistical pricing service take into account a security's correlation to available market data including, but not limited to, intraday index, ADR, and ETF movements.
There were no transfers of financial assets between Levels 1 and 2 during the period.
Derivative instruments are valued at unrealized appreciation (depreciation).
The accompanying Notes to Financial Statements are an integral part of this statement.
Annual Report 2013
13
Columbia Global Dividend Opportunity Fund
Statement of Assets and Liabilities
August 31, 2013
Assets | |
Investments, at value | |
Unaffiliated issuers (identified cost $714,194,233) | | $ | 808,346,484 | | |
Affiliated issuers (identified cost $34,056,432) | | | 34,056,432 | | |
Total investments (identified cost $748,250,665) | | | 842,402,916 | | |
Foreign currency (identified cost $280) | | | 280 | | |
Unrealized appreciation on forward foreign currency exchange contracts | | | 53,773 | | |
Receivable for: | |
Investments sold | | | 4,752,636 | | |
Capital shares sold | | | 483,325 | | |
Dividends | | | 2,407,429 | | |
Interest | | | 28,100 | | |
Reclaims | | | 465,389 | | |
Expense reimbursement due from Investment Manager | | | 959 | | |
Prepaid expenses | | | 9,512 | | |
Trustees' deferred compensation plan | | | 122,400 | | |
Total assets | | | 850,726,719 | | |
Liabilities | |
Disbursements in excess of cash | | | 322 | | |
Unrealized depreciation on forward foreign currency exchange contracts | | | 283,017 | | |
Payable for: | |
Capital shares purchased | | | 258,102 | | |
Investment management fees | | | 16,183 | | |
Distribution and/or service fees | | | 1,467 | | |
Transfer agent fees | | | 49,243 | | |
Administration fees | | | 1,356 | | |
Chief compliance officer expenses | | | 119 | | |
Other expenses | | | 116,973 | | |
Trustees' deferred compensation plan | | | 122,400 | | |
Total liabilities | | | 849,182 | | |
Net assets applicable to outstanding capital stock | | $ | 849,877,537 | | |
Represented by | |
Paid-in capital | | $ | 739,183,690 | | |
Undistributed net investment income | | | 6,282,736 | | |
Accumulated net realized gain | | | 10,493,946 | | |
Unrealized appreciation (depreciation) on: | |
Investments | | | 94,152,251 | | |
Foreign currency translations | | | (5,842 | ) | |
Forward foreign currency exchange contracts | | | (229,244 | ) | |
Total — representing net assets applicable to outstanding capital stock | | $ | 849,877,537 | | |
The accompanying Notes to Financial Statements are an integral part of this statement.
Annual Report 2013
14
Columbia Global Dividend Opportunity Fund
Statement of Assets and Liabilities (continued)
August 31, 2013
Class A | |
Net assets | | $ | 140,796,335 | | |
Shares outstanding | | | 7,093,413 | | |
Net asset value per share | | $ | 19.85 | | |
Maximum offering price per share(a) | | $ | 21.06 | | |
Class B | |
Net assets | | $ | 3,968,463 | | |
Shares outstanding | | | 210,476 | | |
Net asset value per share | | $ | 18.85 | | |
Class C | |
Net assets | | $ | 13,438,685 | | |
Shares outstanding | | | 712,411 | | |
Net asset value per share | | $ | 18.86 | | |
Class I | |
Net assets | | $ | 127,948,521 | | |
Shares outstanding | | | 6,438,707 | | |
Net asset value per share | | $ | 19.87 | | |
Class R | |
Net assets | | $ | 1,296,904 | | |
Shares outstanding | | | 65,415 | | |
Net asset value per share | | $ | 19.83 | | |
Class R4 | |
Net assets | | $ | 29,187 | | |
Shares outstanding | | | 1,461 | | |
Net asset value per share(b) | | $ | 19.97 | | |
Class W | |
Net assets | | $ | 2,922 | | |
Shares outstanding | | | 147 | | |
Net asset value per share(b) | | $ | 19.83 | | |
Class Y | |
Net assets | | $ | 2,510 | | |
Shares outstanding | | | 126 | | |
Net asset value per share(b) | | $ | 19.89 | | |
Class Z | |
Net assets | | $ | 562,394,010 | | |
Shares outstanding | | | 28,258,296 | | |
Net asset value per share | | $ | 19.90 | | |
(a) The maximum offering price per share is calculated by dividing the net asset value per share by 1.0 minus the maximum sales charge of 5.75%.
(b) Net asset value per share rounds to this amount due to fractional shares outstanding.
The accompanying Notes to Financial Statements are an integral part of this statement.
Annual Report 2013
15
Columbia Global Dividend Opportunity Fund
Statement of Operations
Year Ended August 31, 2013
Net investment income | |
Income: | |
Dividends — unaffiliated issuers | | $ | 32,254,762 | | |
Dividends — affiliated issuers | | | 19,564 | | |
Interest | | | 81,702 | | |
Income from securities lending — net | | | 80,026 | | |
Foreign taxes withheld | | | (1,934,980 | ) | |
Total income | | | 30,501,074 | | |
Expenses: | |
Investment management fees | | | 5,493,181 | | |
Distribution and/or service fees | |
Class A | | | 343,049 | | |
Class B | | | 65,895 | | |
Class C | | | 130,498 | | |
Class R | | | 6,306 | | |
Class W | | | 7 | | |
Transfer agent fees | |
Class A | | | 353,059 | | |
Class B | | | 17,217 | | |
Class C | | | 33,614 | | |
Class R | | | 3,240 | | |
Class R4(a) | | | 19 | | |
Class W | | | 9 | | |
Class Y | | | 4 | | |
Class Z | | | 1,490,448 | | |
Administration fees | | | 460,691 | | |
Compensation of board members | | | 34,762 | | |
Custodian fees | | | 98,987 | | |
Printing and postage fees | | | 289,561 | | |
Registration fees | | | 67,544 | | |
Professional fees | | | 55,957 | | |
Chief compliance officer expenses | | | 564 | | |
Other | | | 83,935 | | |
Total expenses | | | 9,028,547 | | |
Fees waived or expenses reimbursed by Investment Manager and its affiliates | | | (365,991 | ) | |
Expense reductions | | | (205,802 | ) | |
Total net expenses | | | 8,456,754 | | |
Net investment income | | | 22,044,320 | | |
Realized and unrealized gain (loss) — net | |
Net realized gain (loss) on: | |
Investments | | | 56,840,919 | | |
Foreign currency translations | | | (7,109 | ) | |
Forward foreign currency exchange contracts | | | 3,001,870 | | |
Net realized gain | | | 59,835,680 | | |
Net change in unrealized appreciation (depreciation) on: | |
Investments | | | 11,831,746 | | |
Foreign currency translations | | | 1,624 | | |
Forward foreign currency exchange contracts | | | (229,244 | ) | |
Foreign capital gains tax | | | 76,551 | | |
Net change in unrealized appreciation (depreciation) | | | 11,680,677 | | |
Net realized and unrealized gain | | | 71,516,357 | | |
Net increase in net assets resulting from operations | | $ | 93,560,677 | | |
(a) For the period from March 19, 2013 (commencement of operations) to August 31, 2013.
The accompanying Notes to Financial Statements are an integral part of this statement.
Annual Report 2013
16
Columbia Global Dividend Opportunity Fund
Statement of Changes in Net Assets
| | | Year Ended
August 31, 2013(a) | | Year Ended
August 31, 2012 | |
Operations | |
Net investment income | | $ | 22,044,320 | | | $ | 13,213,354 | | |
Net realized gain | | | 59,835,680 | | | | 98,491,817 | | |
Net change in unrealized appreciation (depreciation) | | | 11,680,677 | | | | (29,536,372 | ) | |
Net increase in net assets resulting from operations | | | 93,560,677 | | | | 82,168,799 | | |
Distributions to shareholders | |
Net investment income | |
Class A | | | (4,649,200 | ) | | | (396,683 | ) | |
Class B | | | (164,707 | ) | | | — | | |
Class C | | | (319,104 | ) | | | — | | |
Class I | | | (1,874,616 | ) | | | (22 | ) | |
Class R | | | (37,984 | ) | | | (310 | ) | |
Class R4 | | | (210 | ) | | | — | | |
Class W | | | (100 | ) | | | (11 | ) | |
Class Y | | | (99 | ) | | | (111,896 | ) | |
Class Z | | | (21,880,895 | ) | | | (3,560,604 | ) | |
Net realized gains | |
Class A | | | (8,633,525 | ) | | | — | | |
Class B | | | (553,180 | ) | | | — | | |
Class C | | | (881,135 | ) | | | — | | |
Class I | | | (3,859,833 | ) | | | — | | |
Class R | | | (77,203 | ) | | | — | | |
Class W | | | (193 | ) | | | — | | |
Class Y | | | (165 | ) | | | — | | |
Class Z | | | (37,388,752 | ) | | | — | | |
Total distributions to shareholders | | | (80,320,901 | ) | | | (4,069,526 | ) | |
Increase (decrease) in net assets from capital stock activity | | | 93,987,900 | | | | (196,189,369 | ) | |
Proceeds from regulatory settlements (Note 6) | | | — | | | | 34,306 | | |
Total increase (decrease) in net assets | | | 107,227,676 | | | | (118,055,790 | ) | |
Net assets at beginning of year | | | 742,649,861 | | | | 860,705,651 | | |
Net assets at end of year | | $ | 849,877,537 | | | $ | 742,649,861 | | |
Undistributed net investment income | | $ | 6,282,736 | | | $ | 10,084,051 | | |
(a) Class R4 shares are for the period from March 19, 2013 (commencement of operations) to August 31, 2013.
The accompanying Notes to Financial Statements are an integral part of this statement.
Annual Report 2013
17
Columbia Global Dividend Opportunity Fund
Statement of Changes in Net Assets (continued)
| | | Year Ended August 31, 2013(a) | | Year Ended August 31, 2012 | |
| | | Shares | | Dollars ($) | | Shares | | Dollars ($) | |
Capital stock activity | |
Class A shares | |
Subscriptions(b) | | | 866,303 | | | | 17,067,361 | | | | 555,619 | | | | 10,280,768 | | |
Distributions reinvested | | | 655,285 | | | | 12,083,694 | | | | 20,291 | | | | 354,272 | | |
Redemptions | | | (1,245,670 | ) | | | (24,507,516 | ) | | | (1,793,250 | ) | | | (32,747,909 | ) | |
Net increase (decrease) | | | 275,918 | | | | 4,643,539 | | | | (1,217,340 | ) | | | (22,112,869 | ) | |
Class B shares | |
Subscriptions | | | 15,219 | | | | 272,377 | | | | 5,259 | | | | 94,474 | | |
Distributions reinvested | | | 29,750 | | | | 518,076 | | | | — | | | | — | | |
Redemptions(b) | | | (339,853 | ) | | | (6,351,183 | ) | | | (451,814 | ) | | | (7,960,419 | ) | |
Net decrease | | | (294,884 | ) | | | (5,560,730 | ) | | | (446,555 | ) | | | (7,865,945 | ) | |
Class C shares | |
Subscriptions | | | 122,017 | | | | 2,289,642 | | | | 27,319 | | | | 471,731 | | |
Distributions reinvested | | | 55,452 | | | | 968,065 | | | | — | | | | — | | |
Redemptions | | | (179,822 | ) | | | (3,368,702 | ) | | | (213,305 | ) | | | (3,708,923 | ) | |
Net decrease | | | (2,353 | ) | | | (110,995 | ) | | | (185,986 | ) | | | (3,237,192 | ) | |
Class I shares | |
Subscriptions | | | 6,342,428 | | | | 126,780,708 | | | | — | | | | — | | |
Distributions reinvested | | | 312,186 | | | | 5,734,139 | | | | — | | | | — | | |
Redemptions | | | (216,054 | ) | | | (4,220,466 | ) | | | — | | | | — | | |
Net increase | | | 6,438,560 | | | | 128,294,381 | | | | — | | | | — | | |
Class R shares | |
Subscriptions | | | 11,382 | | | | 223,970 | | | | 14,404 | | | | 259,895 | | |
Distributions reinvested | | | 6,245 | | | | 114,904 | | | | 18 | | | | 310 | | |
Redemptions | | | (7,557 | ) | | | (151,511 | ) | | | (19,698 | ) | | | (368,073 | ) | |
Net increase (decrease) | | | 10,070 | | | | 187,363 | | | | (5,276 | ) | | | (107,868 | ) | |
Class R4 shares | |
Subscriptions | | | 1,455 | | | | 29,589 | | | | — | | | | — | | |
Distributions reinvested | | | 9 | | | | 172 | | | | — | | | | — | | |
Redemptions | | | (3 | ) | | | (60 | ) | | | — | | | | — | | |
Net increase | | | 1,461 | | | | 29,701 | | | | — | | | | — | | |
Class Y shares | |
Subscriptions | | | — | | | | — | | | | 41,108 | | | | 719,639 | | |
Distributions reinvested | | | — | | | | — | | | | 6 | | | | 99 | | |
Redemptions | | | — | | | | — | | | | (915,557 | ) | | | (17,884,605 | ) | |
Net decrease | | | — | | | | — | | | | (874,443 | ) | | | (17,164,867 | ) | |
The accompanying Notes to Financial Statements are an integral part of this statement.
Annual Report 2013
18
Columbia Global Dividend Opportunity Fund
Statement of Changes in Net Assets (continued)
| | | Year Ended August 31, 2013(a) | | Year Ended August 31, 2012 | |
| | | Shares | | Dollars ($) | | Shares | | Dollars ($) | |
Capital stock activity (continued) | |
Class Z shares | |
Subscriptions | | | 812,217 | | | | 16,021,564 | | | | 995,866 | | | | 18,048,370 | | |
Distributions reinvested | | | 3,067,570 | | | | 56,781,325 | | | | 174,611 | | | | 3,053,944 | | |
Redemptions | | | (5,392,007 | ) | | | (106,298,248 | ) | | | (9,093,362 | ) | | | (166,802,942 | ) | |
Net decrease | | | (1,512,220 | ) | | | (33,495,359 | ) | | | (7,922,885 | ) | | | (145,700,628 | ) | |
Total net increase (decrease) | | | 4,916,552 | | | | 93,987,900 | | | | (10,652,485 | ) | | | (196,189,369 | ) | |
(a) Class R4 shares are for the period from March 19, 2013 (commencement of operations) to August 31, 2013.
(b) Includes conversions of Class B shares to Class A shares, if any.
The accompanying Notes to Financial Statements are an integral part of this statement.
Annual Report 2013
19
Columbia Global Dividend Opportunity Fund
The following tables are intended to help you understand the Fund's financial performance. Certain information reflects financial results for a single share of a class held for the periods shown. Per share net investment income (loss) amounts are calculated based on average shares outstanding during the period. Total return assumes reinvestment of all dividends and distributions, if any. Total return does not reflect payment of sales charges, if any, and is not annualized for periods of less than one year.
| | | Year Ended August 31, | |
Class A | | 2013 | | 2012 | | 2011 | | 2010 | | 2009 | |
Per share data | |
Net asset value, beginning of period | | $ | 19.59 | | | $ | 17.72 | | | $ | 15.28 | | | $ | 14.62 | | | $ | 18.01 | | |
Income from investment operations: | |
Net investment income | | | 0.51 | | | | 0.27 | | | | 0.01 | | | | 0.00 | (a) | | | 0.09 | | |
Net realized and unrealized gain (loss) | | | 1.74 | | | | 1.65 | | | | 2.43 | | | | 0.73 | | | | (3.42 | ) | |
Total from investment operations | | | 2.25 | | | | 1.92 | | | | 2.44 | | | | 0.73 | | | | (3.33 | ) | |
Less distributions to shareholders: | |
Net investment income | | | (0.68 | ) | | | (0.05 | ) | | | — | | | | (0.07 | ) | | | (0.06 | ) | |
Net realized gains | | | (1.31 | ) | | | — | | | | — | | | | — | | | | — | | |
Total distributions to shareholders | | | (1.99 | ) | | | (0.05 | ) | | | — | | | | (0.07 | ) | | | (0.06 | ) | |
Proceeds from regulatory settlements | | | — | | | | 0.00 | (a) | | | — | | | | — | | | | 0.00 | (a) | |
Net asset value, end of period | | $ | 19.85 | | | $ | 19.59 | | | $ | 17.72 | | | $ | 15.28 | | | $ | 14.62 | | |
Total return | | | 12.48 | % | | | 10.88 | % | | | 15.97 | % | | | 5.00 | % | | | (18.44 | %) | |
Ratios to average net assets(b) | |
Total gross expenses | | | 1.34 | % | | | 1.28 | % | | | 1.29 | % | | | 1.43 | % | | | 1.47 | % | |
Total net expenses(c) | | | 1.26 | %(d) | | | 1.21 | %(d) | | | 1.25 | %(e) | | | 1.25 | %(e) | | | 1.24 | %(e) | |
Net investment income | | | 2.59 | % | | | 1.49 | % | | | 0.07 | % | | | 0.01 | % | | | 0.70 | % | |
Supplemental data | |
Net assets, end of period (in thousands) | | $ | 140,796 | | | $ | 133,541 | | | $ | 142,349 | | | $ | 141,137 | | | $ | 158,624 | | |
Portfolio turnover | | | 60 | % | | | 97 | % | | | 62 | % | | | 67 | % | | | 117 | % | |
Notes to Financial Highlights
(a) Rounds to zero.
(b) In addition to the fees and expenses which the Fund bears directly, the Fund indirectly bears a pro rata share of the fees and expenses of the acquired funds in which it invests. Such indirect expenses are not included in the reported expense ratios.
(c) Total net expenses include the impact of certain waivers/reimbursements made by the Investment Manager and certain of its affiliates, if applicable.
(d) The benefits derived from expense reductions had an impact of 0.03% and 0.07% for the years ended 2013 and 2012, respectively.
(e) The benefits derived from expense reductions had an impact of less than 0.01%.
The accompanying Notes to Financial Statements are an integral part of this statement.
Annual Report 2013
20
Columbia Global Dividend Opportunity Fund
Financial Highlights (continued)
| | | Year Ended August 31, | |
Class B | | 2013 | | 2012 | | 2011 | | 2010 | | 2009 | |
Per share data | |
Net asset value, beginning of period | | $ | 18.63 | | | $ | 16.93 | | | $ | 14.71 | | | $ | 14.12 | | | $ | 17.45 | | |
Income from investment operations: | |
Net investment income (loss) | | | 0.34 | | | | 0.10 | | | | (0.12 | ) | | | (0.11 | ) | | | (0.01 | ) | |
Net realized and unrealized gain (loss) | | | 1.66 | | | | 1.60 | | | | 2.34 | | | | 0.71 | | | | (3.32 | ) | |
Total from investment operations | | | 2.00 | | | | 1.70 | | | | 2.22 | | | | 0.60 | | | | (3.33 | ) | |
Less distributions to shareholders: | |
Net investment income | | | (0.47 | ) | | | — | | | | — | | | | (0.01 | ) | | | — | | |
Net realized gains | | | (1.31 | ) | | | — | | | | — | | | | — | | | | — | | |
Total distributions to shareholders | | | (1.78 | ) | | | — | | | | — | | | | (0.01 | ) | | | — | | |
Proceeds from regulatory settlements | | | — | | | | 0.00 | (a) | | | — | | | | — | | | | 0.00 | (a) | |
Net asset value, end of period | | $ | 18.85 | | | $ | 18.63 | | | $ | 16.93 | | | $ | 14.71 | | | $ | 14.12 | | |
Total return | | | 11.61 | % | | | 10.04 | % | | | 15.09 | % | | | 4.26 | % | | | (19.08 | %) | |
Ratios to average net assets(b) | |
Total gross expenses | | | 2.09 | % | | | 2.03 | % | | | 2.04 | % | | | 2.18 | % | | | 2.22 | % | |
Total net expenses(c) | | | 2.01 | %(d) | | | 1.95 | %(d) | | | 2.00 | %(e) | | | 2.00 | %(e) | | | 1.99 | %(e) | |
Net investment income (loss) | | | 1.83 | % | | | 0.59 | % | | | (0.70 | %) | | | (0.74 | %) | | | (0.05 | %) | |
Supplemental data | |
Net assets, end of period (in thousands) | | $ | 3,968 | | | $ | 9,414 | | | $ | 16,112 | | | $ | 19,861 | | | $ | 24,933 | | |
Portfolio turnover | | | 60 | % | | | 97 | % | | | 62 | % | | | 67 | % | | | 117 | % | |
Notes to Financial Highlights
(a) Rounds to zero.
(b) In addition to the fees and expenses which the Fund bears directly, the Fund indirectly bears a pro rata share of the fees and expenses of the acquired funds in which it invests. Such indirect expenses are not included in the reported expense ratios.
(c) Total net expenses include the impact of certain waivers/reimbursements made by the Investment Manager and certain of its affiliates, if applicable.
(d) The benefits derived from expense reductions had an impact of 0.02% and 0.08% for the years ended 2013 and 2012, respectively.
(e) The benefits derived from expense reductions had an impact of less than 0.01%.
The accompanying Notes to Financial Statements are an integral part of this statement.
Annual Report 2013
21
Columbia Global Dividend Opportunity Fund
Financial Highlights (continued)
| | | Year Ended August 31, | |
Class C | | 2013 | | 2012 | | 2011 | | 2010 | | 2009 | |
Per share data | |
Net asset value, beginning of period | | $ | 18.63 | | | $ | 16.93 | | | $ | 14.71 | | | $ | 14.13 | | | $ | 17.46 | | |
Income from investment operations: | |
Net investment income (loss) | | | 0.35 | | | | 0.12 | | | | (0.12 | ) | | | (0.11 | ) | | | (0.01 | ) | |
Net realized and unrealized gain (loss) | | | 1.66 | | | | 1.58 | | | | 2.34 | | | | 0.70 | | | | (3.32 | ) | |
Total from investment operations | | | 2.01 | | | | 1.70 | | | | 2.22 | | | | 0.59 | | | | (3.33 | ) | |
Less distributions to shareholders: | |
Net investment income | | | (0.47 | ) | | | — | | | | — | | | | (0.01 | ) | | | — | | |
Net realized gains | | | (1.31 | ) | | | — | | | | — | | | | — | | | | — | | |
Total distributions to shareholders | | | (1.78 | ) | | | — | | | | — | | | | (0.01 | ) | | | — | | |
Proceeds from regulatory settlements | | | — | | | | 0.00 | (a) | | | — | | | | — | | | | 0.00 | (a) | |
Net asset value, end of period | | $ | 18.86 | | | $ | 18.63 | | | $ | 16.93 | | | $ | 14.71 | | | $ | 14.13 | | |
Total return | | | 11.66 | % | | | 10.04 | % | | | 15.09 | % | | | 4.18 | % | | | (19.07 | %) | |
Ratios to average net assets(b) | |
Total gross expenses | | | 2.09 | % | | | 2.04 | % | | | 2.04 | % | | | 2.18 | % | | | 2.22 | % | |
Total net expenses(c) | | | 2.01 | %(d) | | | 1.95 | %(d) | | | 2.00 | %(e) | | | 2.00 | %(e) | | | 1.99 | %(e) | |
Net investment income (loss) | | | 1.84 | % | | | 0.72 | % | | | (0.68 | %) | | | (0.74 | %) | | | (0.05 | %) | |
Supplemental data | |
Net assets, end of period (in thousands) | | $ | 13,439 | | | $ | 13,319 | | | $ | 15,251 | | | $ | 15,994 | | | $ | 19,874 | | |
Portfolio turnover | | | 60 | % | | | 97 | % | | | 62 | % | | | 67 | % | | | 117 | % | |
Notes to Financial Highlights
(a) Rounds to zero.
(b) In addition to the fees and expenses which the Fund bears directly, the Fund indirectly bears a pro rata share of the fees and expenses of the acquired funds in which it invests. Such indirect expenses are not included in the reported expense ratios.
(c) Total net expenses include the impact of certain waivers/reimbursements made by the Investment Manager and certain of its affiliates, if applicable.
(d) The benefits derived from expense reductions had an impact of 0.03% and 0.09% for the years ended 2013 and 2012, respectively.
(e) The benefits derived from expense reductions had an impact of less than 0.01%.
The accompanying Notes to Financial Statements are an integral part of this statement.
Annual Report 2013
22
Columbia Global Dividend Opportunity Fund
Financial Highlights (continued)
| | | Year Ended August 31, | |
Class I | | 2013 | | 2012 | | 2011(a) | |
Per share data | |
Net asset value, beginning of period | | $ | 19.64 | | | $ | 17.80 | | | $ | 17.01 | | |
Income from investment operations: | |
Net investment income | | | 0.58 | | | | 0.35 | | | | 0.09 | | |
Net realized and unrealized gain | | | 1.76 | | | | 1.64 | | | | 0.74 | | |
Total from investment operations | | | 2.34 | | | | 1.99 | | | | 0.83 | | |
Less distributions to shareholders: | |
Net investment income | | | (0.80 | ) | | | (0.15 | ) | | | (0.04 | ) | |
Net realized gains | | | (1.31 | ) | | | — | | | | — | | |
Total distributions to shareholders | | | (2.11 | ) | | | (0.15 | ) | | | (0.04 | ) | |
Proceeds from regulatory settlements | | | — | | | | 0.00 | (b) | | | — | | |
Net asset value, end of period | | $ | 19.87 | | | $ | 19.64 | | | $ | 17.80 | | |
Total return | | | 12.98 | % | | | 11.27 | % | | | 4.90 | % | |
Ratios to average net assets(c) | |
Total gross expenses | | | 0.84 | % | | | 0.85 | % | | | 0.75 | %(d) | |
Total net expenses(e) | | | 0.83 | % | | | 0.83 | % | | | 0.75 | %(d)(f) | |
Net investment income | | | 2.94 | % | | | 1.91 | % | | | 0.57 | %(d) | |
Supplemental data | |
Net assets, end of period (in thousands) | | $ | 127,949 | | | $ | 3 | | | $ | 3 | | |
Portfolio turnover | | | 60 | % | | | 97 | % | | | 62 | % | |
Notes to Financial Highlights
(a) For the period from September 27, 2010 (commencement of operations) to August 31, 2011.
(b) Rounds to zero.
(c) In addition to the fees and expenses which the Fund bears directly, the Fund indirectly bears a pro rata share of the fees and expenses of the acquired funds in which it invests. Such indirect expenses are not included in the reported expense ratios.
(d) Annualized.
(e) Total net expenses include the impact of certain waivers/reimbursements made by the Investment Manager and certain of its affiliates, if applicable.
(f) The benefits derived from expense reductions had an impact of less than 0.01%.
The accompanying Notes to Financial Statements are an integral part of this statement.
Annual Report 2013
23
Columbia Global Dividend Opportunity Fund
Financial Highlights (continued)
| | | Year Ended August 31, | |
Class R | | 2013 | | 2012 | | 2011(a) | |
Per share data | |
Net asset value, beginning of period | | $ | 19.54 | | | $ | 17.67 | | | $ | 16.97 | | |
Income from investment operations: | |
Net investment income | | | 0.46 | | | | 0.23 | | | | 0.00 | (b) | |
Net realized and unrealized gain | | | 1.75 | | | | 1.64 | | | | 0.70 | | |
Total from investment operations | | | 2.21 | | | | 1.87 | | | | 0.70 | | |
Less distributions to shareholders: | |
Net investment income | | | (0.61 | ) | | | (0.00 | )(b) | | | — | | |
Net realized gains | | | (1.31 | ) | | | — | | | | — | | |
Total distributions to shareholders | | | (1.92 | ) | | | (0.00 | )(b) | | | — | | |
Proceeds from regulatory settlements | | | — | | | | 0.00 | (b) | | | — | | |
Net asset value, end of period | | $ | 19.83 | | | $ | 19.54 | | | $ | 17.67 | | |
Total return | | | 12.25 | % | | | 10.61 | % | | | 4.12 | % | |
Ratios to average net assets(c) | |
Total gross expenses | | | 1.59 | % | | | 1.53 | % | | | 1.54 | %(d) | |
Total net expenses(e) | | | 1.51 | %(f) | | | 1.46 | %(f) | | | 1.50 | %(d)(g) | |
Net investment income | | | 2.33 | % | | | 1.24 | % | | | 0.02 | %(d) | |
Supplemental data | |
Net assets, end of period (in thousands) | | $ | 1,297 | | | $ | 1,082 | | | $ | 1,071 | | |
Portfolio turnover | | | 60 | % | | | 97 | % | | | 62 | % | |
Notes to Financial Highlights
(a) For the period from September 27, 2010 (commencement of operations) to August 31, 2011.
(b) Rounds to zero.
(c) In addition to the fees and expenses which the Fund bears directly, the Fund indirectly bears a pro rata share of the fees and expenses of the acquired funds in which it invests. Such indirect expenses are not included in the reported expense ratios.
(d) Annualized.
(e) Total net expenses include the impact of certain waivers/reimbursements made by the Investment Manager and certain of its affiliates, if applicable.
(f) The benefits derived from expense reductions had an impact of 0.03% and 0.07% for the years ended 2013 and 2012, respectively.
(g) The benefits derived from expense reductions had an impact of less than 0.01%.
The accompanying Notes to Financial Statements are an integral part of this statement.
Annual Report 2013
24
Columbia Global Dividend Opportunity Fund
Financial Highlights (continued)
Class R4 | | Year Ended
August 31,
2013(a) | |
Per share data | |
Net asset value, beginning of period | | $ | 19.69 | | |
Income from investment operations: | |
Net investment income | | | 0.25 | | |
Net realized and unrealized gain | | | 0.33 | | |
Total from investment operations | | | 0.58 | | |
Less distributions to shareholders: | |
Net investment income | | | (0.30 | ) | |
Total distributions to shareholders | | | (0.30 | ) | |
Net asset value, end of period | | $ | 19.97 | | |
Total return | | | 3.02 | % | |
Ratios to average net assets(b) | |
Total gross expenses | | | 1.07 | %(c) | |
Total net expenses(d) | | | 1.01 | %(c)(e) | |
Net investment income | | | 2.78 | %(c) | |
Supplemental data | |
Net assets, end of period (in thousands) | | $ | 29 | | |
Portfolio turnover | | | 60 | % | |
Notes to Financial Highlights
(a) For the period from March 19, 2013 (commencement of operations) to August 31, 2013.
(b) In addition to the fees and expenses which the Fund bears directly, the Fund indirectly bears a pro rata share of the fees and expenses of the acquired funds in which it invests. Such indirect expenses are not included in the reported expense ratios.
(c) Annualized.
(d) Total net expenses include the impact of certain waivers/reimbursements made by the Investment Manager and certain of its affiliates, if applicable.
(e) The benefits derived from expense reductions had an impact of 0.05%.
The accompanying Notes to Financial Statements are an integral part of this statement.
Annual Report 2013
25
Columbia Global Dividend Opportunity Fund
Financial Highlights (continued)
| | | Year Ended August 31, | |
Class W | | 2013 | | 2012 | | 2011(a) | |
Per share data | |
Net asset value, beginning of period | | $ | 19.57 | | | $ | 17.73 | | | $ | 16.97 | | |
Income from investment operations: | |
Net investment income | | | 0.51 | | | | 0.28 | | | | 0.03 | | |
Net realized and unrealized gain | | | 1.74 | | | | 1.64 | | | | 0.73 | | |
Total from investment operations | | | 2.25 | | | | 1.92 | | | | 0.76 | | |
Less distributions to shareholders: | |
Net investment income | | | (0.68 | ) | | | (0.08 | ) | | | — | | |
Net realized gains | | | (1.31 | ) | | | — | | | | — | | |
Total distributions to shareholders | | | (1.99 | ) | | | (0.08 | ) | | | — | | |
Proceeds from regulatory settlements | | | — | | | | 0.00 | (b) | | | — | | |
Net asset value, end of period | | $ | 19.83 | | | $ | 19.57 | | | $ | 17.73 | | |
Total return | | | 12.48 | % | | | 10.86 | % | | | 4.48 | % | |
Ratios to average net assets(c) | |
Total gross expenses | | | 1.33 | % | | | 1.33 | % | | | 1.21 | %(d) | |
Total net expenses(e) | | | 1.26 | %(f) | | | 1.23 | %(f) | | | 1.16 | %(d)(g) | |
Net investment income | | | 2.60 | % | | | 1.51 | % | | | 0.15 | %(d) | |
Supplemental data | |
Net assets, end of period (in thousands) | | $ | 3 | | | $ | 3 | | | $ | 3 | | |
Portfolio turnover | | | 60 | % | | | 97 | % | | | 62 | % | |
Notes to Financial Highlights
(a) For the period from September 27, 2010 (commencement of operations) to August 31, 2011.
(b) Rounds to zero.
(c) In addition to the fees and expenses which the Fund bears directly, the Fund indirectly bears a pro rata share of the fees and expenses of the acquired funds in which it invests. Such indirect expenses are not included in the reported expense ratios.
(d) Annualized.
(e) Total net expenses include the impact of certain waivers/reimbursements made by the Investment Manager and certain of its affiliates, if applicable.
(f) The benefits derived from expense reductions had an impact of 0.03% and 0.08% for the years ended 2013 and 2012, respectively.
(g) The benefits derived from expense reductions had an impact of less than 0.01%.
The accompanying Notes to Financial Statements are an integral part of this statement.
Annual Report 2013
26
Columbia Global Dividend Opportunity Fund
Financial Highlights (continued)
| | | Year Ended August 31, | |
Class Y | | 2013 | | 2012 | | 2011 | | 2010 | | 2009(a) | |
Per share data | |
Net asset value, beginning of period | | $ | 19.65 | | | $ | 17.79 | | | $ | 15.32 | | | $ | 14.64 | | | $ | 13.32 | | |
Income from investment operations | |
Net investment income | | | 0.59 | | | | 0.31 | | | | 0.09 | | | | 0.07 | | | | 0.02 | | |
Net realized and unrealized gain | | | 1.74 | | | | 1.68 | | | | 2.42 | | | | 0.74 | | | | 1.30 | | |
Total from investment operations | | | 2.33 | | | | 1.99 | | | | 2.51 | | | | 0.81 | | | | 1.32 | | |
Less distributions to shareholders: | |
Net investment income | | | (0.78 | ) | | | (0.13 | ) | | | (0.04 | ) | | | (0.13 | ) | | | — | | |
Net realized gains | | | (1.31 | ) | | | — | | | | — | | | | — | | | | — | | |
Total distributions to shareholders | | | (2.09 | ) | | | (0.13 | ) | | | (0.04 | ) | | | (0.13 | ) | | | — | | |
Proceeds from regulatory settlements | | | — | | | | 0.00 | (b) | | | — | | | | — | | | | — | | |
Net asset value, end of period | | $ | 19.89 | | | $ | 19.65 | | | $ | 17.79 | | | $ | 15.32 | | | $ | 14.64 | | |
Total return | | | 12.93 | % | | | 11.28 | % | | | 16.40 | % | | | 5.51 | % | | | 9.91 | % | |
Ratios to average net assets(c) | |
Total gross expenses | | | 0.96 | % | | | 0.82 | % | | | 0.83 | % | | | 0.83 | % | | | 0.72 | %(d) | |
Total net expenses(e) | | | 0.88 | % | | | 0.82 | % | | | 0.83 | %(f) | | | 0.83 | %(f) | | | 0.72 | %(d)(f) | |
Net investment income | | | 2.97 | % | | | 1.70 | % | | | 0.51 | % | | | 0.43 | % | | | 0.99 | %(d) | |
Supplemental data | |
Net assets, end of period (in thousands) | | $ | 3 | | | $ | 2 | | | $ | 15,557 | | | $ | 9,826 | | | $ | 9,630 | | |
Portfolio turnover | | | 60 | % | | | 97 | % | | | 62 | % | | | 67 | % | | | 117 | % | |
Notes to Financial Highlights
(a) For the period from July 15, 2009 (commencement of operations) to August 31, 2009.
(b) Rounds to zero.
(c) In addition to the fees and expenses which the Fund bears directly, the Fund indirectly bears a pro rata share of the fees and expenses of the acquired funds in which it invests. Such indirect expenses are not included in the reported expense ratios.
(d) Annualized.
(e) Total net expenses include the impact of certain waivers/reimbursements made by the Investment Manager and certain of its affiliates, if applicable.
(f) The benefits derived from expense reductions had an impact of less than 0.01%.
The accompanying Notes to Financial Statements are an integral part of this statement.
Annual Report 2013
27
Columbia Global Dividend Opportunity Fund
Financial Highlights (continued)
| | | Year Ended August 31, | |
Class Z | | 2013 | | 2012 | | 2011 | | 2010 | | 2009 | |
Per share data | |
Net asset value, beginning of period | | $ | 19.66 | | | $ | 17.78 | | | $ | 15.32 | | | $ | 14.64 | | | $ | 18.06 | | |
Income from investment operations: | |
Net investment income | | | 0.56 | | | | 0.31 | | | | 0.06 | | | | 0.04 | | | | 0.12 | | |
Net realized and unrealized gain (loss) | | | 1.75 | | | | 1.67 | | | | 2.42 | | | | 0.74 | | | | (3.44 | ) | |
Total from investment operations | | | 2.31 | | | | 1.98 | | | | 2.48 | | | | 0.78 | | | | (3.32 | ) | |
Less distributions to shareholders: | |
Net investment income | | | (0.76 | ) | | | (0.10 | ) | | | (0.02 | ) | | | (0.10 | ) | | | (0.10 | ) | |
Net realized gains | | | (1.31 | ) | | | — | | | | — | | | | — | | | | — | | |
Total distributions to shareholders | | | (2.07 | ) | | | (0.10 | ) | | | (0.02 | ) | | | (0.10 | ) | | | (0.10 | ) | |
Proceeds from regulatory settlements | | | — | | | | 0.00 | (a) | | | — | | | | — | | | | 0.00 | (a) | |
Net asset value, end of period | | $ | 19.90 | | | $ | 19.66 | | | $ | 17.78 | | | $ | 15.32 | | | $ | 14.64 | | |
Total return | | | 12.76 | % | | | 11.20 | % | | | 16.17 | % | | | 5.31 | % | | | (18.26 | %) | |
Ratios to average net assets(b) | |
Total gross expenses | | | 1.09 | % | | | 1.03 | % | | | 1.04 | % | | | 1.18 | % | | | 1.22 | % | |
Total net expenses(c) | | | 1.01 | %(d) | | | 0.95 | %(d) | | | 1.00 | %(e) | | | 1.00 | %(e) | | | 0.99 | %(e) | |
Net investment income | | | 2.84 | % | | | 1.72 | % | | | 0.34 | % | | | 0.26 | % | | | 0.94 | % | |
Supplemental data | |
Net assets, end of period (in thousands) | | $ | 562,394 | | | $ | 585,285 | | | $ | 670,362 | | | $ | 525,150 | | | $ | 571,175 | | |
Portfolio turnover | | | 60 | % | | | 97 | % | | | 62 | % | | | 67 | % | | | 117 | % | |
Notes to Financial Highlights
(a) Rounds to zero.
(b) In addition to the fees and expenses which the Fund bears directly, the Fund indirectly bears a pro rata share of the fees and expenses of the acquired funds in which it invests. Such indirect expenses are not included in the reported expense ratios.
(c) Total net expenses include the impact of certain waivers/reimbursements made by the Investment Manager and certain of its affiliates, if applicable.
(d) The benefits derived from expense reductions had an impact of 0.03% and 0.08% for the years ended 2013 and 2012, respectively.
(e) The benefits derived from expense reductions had an impact of less than 0.01%.
The accompanying Notes to Financial Statements are an integral part of this statement.
Annual Report 2013
28
Columbia Global Dividend Opportunity Fund
Notes to Financial Statements
August 31, 2013
Note 1. Organization
Columbia Global Dividend Opportunity Fund (the Fund), a series of Columbia Funds Series Trust I (the Trust), is a diversified fund. The Trust is registered under the Investment Company Act of 1940, as amended (the 1940 Act), as an open-end management investment company organized as a Massachusetts business trust.
Fund Shares
The Trust may issue an unlimited number of shares (without par value). The Fund offers Class A, Class B, Class C, Class I, Class R, Class R4, Class W, Class Y and Class Z shares. Although all share classes generally have identical voting, dividend and liquidation rights, each share class votes separately when required by law. Different share classes pay different distribution amounts to the extent the expenses of such share classes differ, and distributions in liquidation will be proportional to the net asset value of each share class. Each share class has its own expense structure and sales charges, as applicable.
Class A shares are subject to a maximum front-end sales charge of 5.75% based on the initial investment amount. Class A shares purchased without an initial sales charge in accounts aggregating $1 million to $50 million at the time of purchase are subject to a contingent deferred sales charge (CDSC) if the shares are sold within 18 months of purchase, charged as follows: 1.00% CDSC if redeemed within 12 months of purchase, and 0.50% CDSC if redeemed more than 12, but less than 18, months after purchase.
Class B shares may be subject to a maximum CDSC of 5.00% based upon the holding period after purchase. Class B shares will generally convert to Class A shares eight years after purchase. The Fund no longer accepts investments by new or existing investors in the Fund's Class B shares, except in connection with the reinvestment of any dividend and/or capital gain distributions in Class B shares of the Fund and exchanges by existing Class B shareholders of certain other funds within the Columbia Family of Funds.
Class C shares are subject to a 1.00% CDSC on shares redeemed within one year of purchase.
Class I shares are not subject to sales charges and are available only to the Columbia Family of Funds.
Class R shares are not subject to sales charges and are generally available only to certain retirement plans and other eligible investors.
Class R4 shares are not subject to sales charges and are generally available only to omnibus retirement plans and certain other eligible investors. Class R4 shares commenced operations on March 19, 2013.
Class W shares are not subject to sales charges and are available only to investors purchasing through authorized investment programs managed by investment professionals, including discretionary managed account programs.
Class Y shares are not subject to sales charges and are generally available only to certain retirement plans.
Class Z shares are not subject to sales charges and are available only to certain eligible investors, which are subject to different investment minimums.
Note 2. Summary of Significant Accounting Policies
Use of Estimates
The preparation of financial statements in accordance with U.S. generally accepted accounting principles (GAAP) requires management to make certain estimates and assumptions that affect the reported amounts of assets and liabilities, the disclosure of contingent assets and liabilities at the date of the financial statements and the reported amounts of revenue and expenses during the reporting period. Actual results could differ from those estimates.
The following is a summary of significant accounting policies consistently followed by the Fund in the preparation of its financial statements.
Security Valuation
All equity securities are valued at the close of business of the New York Stock Exchange (NYSE). Equity securities are valued at the last quoted sales price on the principal exchange or market on which they trade, except for securities traded on the NASDAQ Stock Market, which are valued at the NASDAQ official close price. Unlisted securities or listed securities for which there were no sales during the day are valued at the mean of the latest quoted bid and ask prices on such exchanges or markets.
Foreign equity securities are valued based on quotations from the principal market in which such securities are normally traded. If any foreign share prices are not readily available as a result of limited share activity the securities are valued at the mean of the latest quoted bid and ask prices on such exchanges or markets. Foreign currency exchange rates are generally determined at 4:00 p.m. Eastern (U.S.) time. However, many securities markets and exchanges outside the U.S. close prior to the close of the NYSE; therefore, the closing prices for securities in such markets or on such exchanges may not fully reflect events that occur after such close but before the close of the NYSE. In those situations, foreign securities will be fair valued pursuant to the policy adopted by the Board of Trustees (the Board), including
Annual Report 2013
29
Columbia Global Dividend Opportunity Fund
Notes to Financial Statements (continued)
August 31, 2013
utilizing a third party pricing service to determine these fair values. The third party pricing service takes into account multiple factors, including, but not limited to, movements in the U.S. securities markets, certain depositary receipts, futures contracts and foreign exchange rates that have occurred subsequent to the close of the foreign exchange or market, to determine a good faith estimate that reasonably reflects the current market conditions as of the close of the NYSE. The fair value of a security is likely to be different from the quoted or published price, if available.
Forward foreign currency exchange contracts are marked-to-market based upon foreign currency exchange rates provided by a pricing service.
Investments in open-end investment companies, including money market funds, are valued at net asset value.
Investments for which market quotations are not readily available, or that have quotations which management believes are not reliable, are valued at fair value as determined in good faith under consistently applied procedures established by and under the general supervision of the Board. If a security or class of securities (such as foreign securities) is valued at fair value, such value is likely to be different from the last quoted market price for the security.
The determination of fair value often requires significant judgment. To determine fair value, management may use assumptions including but not limited to future cash flows and estimated risk premiums. Multiple inputs from various sources may be used to determine fair value.
Foreign Currency Transactions and Translations
The values of all assets and liabilities denominated in foreign currencies are translated into U.S. dollars at that day's exchange rates. Net realized and unrealized gains (losses) on foreign currency transactions and translations include gains (losses) arising from the fluctuation in exchange rates between trade and settlement dates on securities transactions, gains (losses) arising from the disposition of foreign currency and currency gains (losses) between the accrual and payment dates on dividends, interest income and foreign withholding taxes.
For financial statement purposes, the Fund does not distinguish that portion of gains (losses) on investments which is due to changes in foreign exchange rates from that which is due to changes in market prices of the investments. Such fluctuations are included with the net realized and unrealized gains (losses) on investments in the Statement of Operations.
Derivative Instruments
The Fund invests in certain derivative instruments, as detailed below, to meet its investment objectives. Derivatives are
instruments whose values depend on, or are derived from, in whole or in part, the value of one or more other assets, such as securities, currencies, commodities or indices. Derivative instruments may be used to maintain cash reserves while maintaining exposure to certain other assets, to offset anticipated declines in values of investments, to facilitate trading, to reduce transaction costs and to pursue higher investment returns. The Fund may also use derivative instruments to mitigate certain investment risks, such as foreign currency exchange rate risk, interest rate risk and credit risk. Derivatives may involve various risks, including the potential inability of the counterparty to fulfill its obligation under the terms of the contract, the potential for an illiquid secondary market (making it difficult for the Fund to sell, including at favorable prices) and the potential for market movements which may expose the Fund to gains or losses in excess of the amount shown in the Statement of Assets and Liabilities. The notional amounts of derivative instruments, if applicable, are not recorded in the financial statements.
A derivative instrument may suffer a mark to market loss if the value of the contract decreases due to an unfavorable change in the market rates or values of the underlying instrument. Losses can also occur if the counterparty does not perform under the contract. A Fund's risk of loss from counterparty credit risk on over-the-counter (OTC) derivatives is generally limited to the aggregate unrealized gain netted against any collateral held by the Fund and the amount of any initial margin held by the counterparty. With exchange traded or centrally cleared derivatives, there is minimal counterparty credit risk to the Fund since the exchange's clearinghouse, as counterparty to such instruments, guarantees against a possible default. The clearinghouse stands between the buyer and the seller of the contract; therefore, the counterparty credit risk is limited to failure of the clearinghouse. However, credit risk still exists in exchange traded or centrally cleared derivatives with respect to initial and variation margin that is held in a broker's customer accounts. While brokers are required to segregate customer margin from their own assets, in the event that a broker becomes insolvent or goes into bankruptcy and at that time there is a shortfall in the aggregate amount of margin held by the broker for all its clients, U.S. bankruptcy laws will typically allocate that shortfall on a pro-rata basis across all the broker's customers, potentially resulting in losses to the Fund.
In order to better define its contractual rights and to secure rights that will help the Fund mitigate its counterparty risk, the Fund may enter into an International Swaps and Derivatives Association, Inc. Master Agreement (ISDA Master Agreement) or similar agreement with its derivative contract counterparties. An ISDA Master Agreement is an agreement between a Fund and a counterparty that governs OTC
Annual Report 2013
30
Columbia Global Dividend Opportunity Fund
Notes to Financial Statements (continued)
August 31, 2013
derivatives and forward foreign currency exchange contracts and typically contains, among other things, collateral posting terms and netting provisions in the event of a default and/or termination event. Under an ISDA Master Agreement, the Fund may, under certain circumstances, offset with the counterparty certain derivative instrument's payables and/or receivables with collateral held and/or posted and create one single net payment. The provisions of the ISDA Master Agreement typically permit a single net payment in the event of default (close-out netting) including the bankruptcy or insolvency of the counterparty. Note, however, that bankruptcy or insolvency laws of a particular jurisdiction may impose restrictions on or prohibitions against the right of offset in bankruptcy, insolvency or other events.
Collateral (margin) requirements differ by type of derivative. Margin requirements are established by the exchange or clearinghouse for exchange traded and centrally cleared derivatives. Brokers can ask for margin in excess of the minimum in certain circumstances. Collateral terms are contract specific for OTC derivatives. For OTC derivatives traded under an ISDA Master Agreement, the collateral requirements are typically calculated by netting the mark to market amount for each transaction under such agreement and comparing that amount to the value of any variation margin currently pledged by the Fund and/or the counterparty. Generally, the amount of collateral due from or to a party has to exceed a minimum transfer amount threshold (e.g. $500,000) before a transfer has to be made. To the extent amounts due to the Fund from its counterparties are not fully collateralized, contractually or otherwise, the Fund bears the risk of loss from counterparty nonperformance. The Fund attempts to mitigate counterparty risk by only entering into agreements with counterparties that it believes have the financial resources to honor their obligations and by monitoring the financial stability of those counterparties.
Certain ISDA Master Agreements allow counterparties to OTC derivatives to terminate derivative contracts prior to maturity in the event the Fund's net assets decline by a stated percentage over a specified time period or the Fund fails to meet the terms of the ISDA Master Agreement, which would cause the Fund to accelerate payment of any net liability owed to the counterparty. The Fund also has termination rights if the counterparty fails to meet the terms of the ISDA Master Agreement. In addition to considering counterparty credit risk, the Fund would consider terminating the derivative contracts based on whether termination would result in a net liability owed from the counterparty.
For financial reporting purposes, the Fund does not offset derivative assets and derivative liabilities that are subject to netting arrangements in the Statement of Assets and Liabilities.
Forward Foreign Currency Exchange Contracts
Forward foreign currency exchange contracts are OTC agreements between two parties to buy and sell a currency at a set price on a future date. These contracts are typically intended to be used to minimize the exposure to foreign exchange rate fluctuations during the period between the trade and settlement dates of the contract. The Fund utilized forward foreign currency exchange contracts to hedge the currency exposure associated with some or all of the Fund's securities and to shift foreign currency exposure back to U.S. dollars. These instruments may be used for other purposes in future periods.
The values of forward foreign currency exchange contracts fluctuate with changes in foreign currency exchange rates. The Fund will record a realized gain or loss when the forward foreign currency exchange contract expires or is closed.
The use of forward foreign currency exchange contracts does not eliminate fluctuations in the prices of the Fund's portfolio securities. The risks of forward foreign currency exchange contracts include movement in the values of the foreign currencies relative to the U.S. dollar (or other foreign currencies) and the possibility that counterparties will not complete their contractual obligations, which may be in excess of the amount reflected, if any, in the Statement of Assets and Liabilities.
Effects of Derivative Transactions in the Financial Statements
The following tables are intended to provide additional information about the effect of derivatives on the financial statements of the Fund, including: the fair value of derivatives by risk category and the location of those fair values in the Statement of Assets and Liabilities; the impact of derivative transactions over the period in the Statement of Operations including realized gains or losses and unrealized gains or losses. The derivative schedules following the Portfolio of Investments present additional information regarding derivative instruments outstanding at the end of the period, if any.
The following table is a summary of the fair value of derivative instruments at August 31, 2013:
Asset Derivatives | |
Risk Exposure
Category | | Statement of Assets and
Liabilities Location | | Fair Value ($) | |
Foreign exchange
risk | | Unrealized appreciation on
forward foreign currency
exchange contracts | | | 53,773
| | |
Annual Report 2013
31
Columbia Global Dividend Opportunity Fund
Notes to Financial Statements (continued)
August 31, 2013
Liability Derivatives | |
Risk Exposure
Category | | Statement of Assets and
Liabilities Location | | Fair Value ($) | |
Foreign exchange
risk | | Unrealized depreciation on
forward foreign currency
exchange contracts | | | 283,017
| | |
The following table indicates the effect of derivative instruments in the Statement of Operations for the year ended August 31, 2013:
Amount of Realized Gain (Loss) on Derivatives Recognized in Income | |
| Risk Exposure Category | | Forward Foreign
Currency Exchange
Contracts ($) | |
Foreign exchange risk | | | 3,001,870 | | |
Change in Unrealized Appreciation (Depreciation) on
Derivatives Recognized in Income | |
| Risk Exposure Category | | Forward Foreign
Currency Exchange
Contracts ($) | |
Foreign exchange risk | | | (229,244 | ) | |
The following table is a summary of the volume of derivative instruments for the year ended August 31, 2013:
Derivative Instrument | | Contracts Opened | |
Forward foreign currency exchange contracts | | | 20 | | |
Security Transactions
Security transactions are accounted for on the trade date. Cost is determined and gains (losses) are based upon the specific identification method for both financial statement and federal income tax purposes.
Income Recognition
Corporate actions and dividend income are generally recorded net of any non-reclaimable tax withholdings, on the ex-dividend date or upon receipt of ex-dividend notification in the case of certain foreign securities.
Interest income is recorded on an accrual basis. Market premiums and discounts, including original issue discounts, are amortized and accreted, respectively, over the expected life of the security on all debt securities, unless otherwise noted.
The Fund may receive distributions from holdings in business development companies (BDCs), exchange traded funds (ETFs) and real estate investment trusts (REITs), which report information on the character of their distributions annually. These distributions are allocated to dividend income, capital gain and return of capital based on estimates made by the Fund's management if actual information has not yet been reported. Return of capital is recorded as a reduction of the cost basis of securities held. If the Fund no longer owns the
applicable securities, return of capital is recorded as a realized gain. Management's estimates are subsequently adjusted when the actual character of the distributions is disclosed by the BDCs, ETFs and REITs, which could result in a proportionate change in return of capital to shareholders.
Awards from class action litigation are recorded as a reduction of cost basis if the Fund still owns the applicable securities on the payment date. If the Fund no longer owns the applicable securities, the proceeds are recorded as realized gains.
Expenses
General expenses of the Trust are allocated to the Fund and other funds of the Trust based upon relative net assets or other expense allocation methodologies determined by the nature of the expense. Expenses directly attributable to the Fund are charged to the Fund. Expenses directly attributable to a specific class of shares are charged to that share class.
Determination of Class Net Asset Value
All income, expenses (other than class-specific expenses, which are charged to that share class, as shown in the Statement of Operations) and realized and unrealized gains (losses) are allocated to each class of the Fund on a daily basis, based on the relative net assets of each class, for purposes of determining the net asset value of each class.
Federal Income Tax Status
The Fund intends to qualify each year as a regulated investment company under Subchapter M of the Internal Revenue Code, as amended, and will distribute substantially all of its taxable income (including net short-term capital gains), if any, for its tax year, and as such will not be subject to federal income taxes. In addition, the Fund intends to distribute in each calendar year substantially all of its net investment income, capital gains and certain other amounts, if any, such that the Fund should not be subject to federal excise tax. Therefore, no federal income or excise tax provision is recorded.
Foreign Taxes
The Fund may be subject to foreign taxes on income, gains on investments or currency repatriation, a portion of which may be recoverable. The Fund will accrue such taxes and recoveries, as applicable, based upon its current interpretation of tax rules and regulations that exist in the markets in which it invests.
Realized gains in certain countries may be subject to foreign taxes at the Fund level, based on statutory rates. The Fund accrues for such foreign taxes on realized and unrealized gains at the appropriate rate for each jurisdiction, as applicable. The amount, if any, is disclosed as a liability on the Statement of Assets and Liabilities.
Annual Report 2013
32
Columbia Global Dividend Opportunity Fund
Notes to Financial Statements (continued)
August 31, 2013
Distributions to Shareholders
Distributions from net investment income, if any, are declared and paid each calendar quarter. Net realized capital gains, if any, are distributed at least annually. Income distributions and capital gain distributions are determined in accordance with federal income tax regulations, which may differ from GAAP.
Guarantees and Indemnifications
Under the Trust's organizational documents and, in some cases, by contract, its officers and trustees are indemnified against certain liabilities arising out of the performance of their duties to the Trust or its funds. In addition, certain of the Fund's contracts with its service providers contain general indemnification clauses. The Fund's maximum exposure under these arrangements is unknown since the amount of any future claims that may be made against the Fund cannot be determined, and the Fund has no historical basis for predicting the likelihood of any such claims.
Recent Accounting Pronouncement
Disclosures about Offsetting Assets and Liabilities
In December 2011, the Financial Accounting Standards Board (FASB) issued Accounting Standards Update (ASU) No. 2011-11, Disclosures about Offsetting Assets and Liabilities and in January 2013, ASU No. 2013-1, Clarifying the Scope of Disclosures about Offsetting Assets and Liabilities (collectively, the ASUs). Specifically, the ASUs require an entity to disclose both gross and net information for derivatives and other financial instruments that are subject to a master netting arrangement or similar agreement. The ASUs require disclosure of collateral received in connection with the master netting agreements or similar agreements. The disclosure requirements are effective for interim and annual periods beginning on or after January 1, 2013. At this time, management is evaluating the implications of this guidance and the impact it will have on the financial statement amounts and footnote disclosures, if any.
Note 3. Fees and Compensation Paid to Affiliates
Investment Management Fees
Under an Investment Management Services Agreement, Columbia Management Investment Advisers, LLC (the Investment Manager), a wholly-owned subsidiary of Ameriprise Financial, Inc. (Ameriprise Financial), determines which securities will be purchased, held or sold. The investment management fee is an annual fee that is equal to a percentage of the Fund's average daily net assets that declines from 0.71% to 0.54% as the Fund's net assets increase. The effective
investment management fee rate for the year ended August 31, 2013 was 0.69% of the Fund's average daily net assets.
Administration Fees
Under an Administrative Services Agreement, the Investment Manager also serves as the Fund Administrator. The Fund pays the Fund Administrator an annual fee for administration and accounting services equal to a percentage of the Fund's average daily net assets that declines from 0.06% to 0.03% as the Fund's net assets increase. The effective administration fee rate for the year ended August 31, 2013 was 0.06% of the Fund's average daily net assets.
Compensation of Board Members
Board members are compensated for their services to the Fund as disclosed in the Statement of Operations. The Trust's eligible Trustees may participate in a Deferred Compensation Plan (the Plan) which may be terminated at any time. Obligations of the Plan will be paid solely out of the Fund's assets.
Compensation of Chief Compliance Officer
The Board has appointed a Chief Compliance Officer to the Fund in accordance with federal securities regulations. The Fund pays its pro-rata share of the expenses associated with the Chief Compliance Officer. The Fund's expenses for the Chief Compliance Officer will not exceed $15,000 per year.
Transfer Agent Fees
Under a Transfer and Dividend Disbursing Agent Agreement, Columbia Management Investment Services Corp. (the Transfer Agent), an affiliate of the Investment Manager and a wholly-owned subsidiary of Ameriprise Financial, is responsible for providing transfer agency services to the Fund. The Transfer Agent has contracted with Boston Financial Data Services (BFDS) to serve as sub-transfer agent.
The Transfer Agent receives monthly account-based service fees based on the number of open accounts and also receives sub-transfer agency fees based on a percentage of the average aggregate value of the Fund's shares maintained in omnibus accounts (other than omnibus accounts for which American Enterprise Investment Services Inc. is the broker of record or accounts where the beneficial shareholder is a customer of Ameriprise Financial Services, Inc., which are paid a per account fee). The Transfer Agent pays the fees of BFDS for services as sub-transfer agent and is not entitled to reimbursement for such fees from the Fund (with the exception of out-of-pocket fees).
The Transfer Agent also receives compensation from fees for various shareholder services and reimbursements for certain out-of-pocket fees. Class I shares do not pay transfer agent
Annual Report 2013
33
Columbia Global Dividend Opportunity Fund
Notes to Financial Statements (continued)
August 31, 2013
fees. Beginning November 1, 2012, Class Y shares are not subject to transfer agent fees for at least twelve months.
For the year ended August 31, 2013, the Fund's effective transfer agent fee rates as a percentage of average daily net assets of each class were as follows:
Class A | | | 0.26 | % | |
Class B | | | 0.26 | | |
Class C | | | 0.26 | | |
Class R | | | 0.26 | | |
Class R4 | | | 0.24 | * | |
Class W | | | 0.26 | | |
Class Y | | | 0.16 | | |
Class Z | | | 0.26 | | |
*Annualized.
An annual minimum account balance fee of $20 may apply to certain accounts with a value below the applicable share class' initial minimum investment requirements to reduce the impact of small accounts on transfer agent fees. These minimum account balance fees are recorded as part of expense reductions in the Statement of Operations. For the year ended August 31, 2013, these minimum account balance fees reduced total expenses by $205,802.
Distribution and Service Fees
The Fund has an agreement with Columbia Management Investment Distributors, Inc. (the Distributor), an affiliate of the Investment Manager and a wholly-owned subsidiary of Ameriprise Financial, for distribution and shareholder services. Pursuant to Rule 12b-1 under the 1940 Act, the Board has approved, and the Fund has adopted, distribution and shareholder service plans (the Plans) which set the distribution and service fees for the Fund. These fees are calculated daily and are intended to compensate the Distributor and/or eligible selling and/or servicing agents for selling shares of the Fund and providing services to investors.
Under the Plans, the Fund pays a monthly service fee to the Distributor at the maximum annual rate of 0.25% of the average daily net assets attributable to Class A, Class B, Class C and Class W shares of the Fund. Also under the Plans, the Fund pays a monthly distribution fee to the Distributor at the maximum annual rates of 0.75%, 0.75%, 0.50% and 0.25% of the average daily net assets attributable to Class B, Class C, Class R and Class W shares, respectively.
The Fund may pay a distribution fee up to 0.25% of the Fund's average daily net assets attributable to Class W shares and a service fee of up to 0.25% of the Fund's average daily net assets attributable to Class W shares, provided, however,
that the aggregate fee shall not exceed 0.25% of the Fund's average daily net assets attributable to Class W shares.
Sales Charges
Sales charges, including front-end charges and CDSCs, received by the Distributor for distributing Fund shares were $134,570 for Class A, $2,067 for Class B and $494 for Class C shares for the year ended August 31, 2013.
Expenses Waived/Reimbursed by the Investment Manager and its Affiliates
The Investment Manager and certain of its affiliates have contractually agreed to waive fees and/or reimburse expenses (excluding certain fees and expenses described below) for the periods disclosed below, unless sooner terminated at the sole discretion of the Board, so that the Fund's net operating expenses, after giving effect to fees waived/expenses reimbursed and any balance credits and/or overdraft charges from the Fund's custodian, do not exceed the following annual rates as a percentage of the class' average daily net assets:
| | | January 1, 2013
through
December 31, 2013 | | Prior to
January 1, 2013 | |
Class A | | | 1.26 | % | | | 1.26 | % | |
Class B | | | 2.01 | | | | 2.01 | | |
Class C | | | 2.01 | | | | 2.01 | | |
Class I | | | 0.84 | | | | 0.83 | | |
Class R | | | 1.51 | | | | 1.51 | | |
Class R4 | | | 1.01 | * | | | — | | |
Class W | | | 1.26 | | | | 1.26 | | |
Class Y | | | 0.84 | | | | 1.01 | | |
Class Z | | | 1.01 | | | | 1.01 | | |
*Annual rate is contractual from March 19, 2013 (the commencement of operations of Class R4 shares) through February 28, 2014.
Under the agreement governing these fee waivers and/or expense reimbursement arrangements, the following fees and expenses are excluded from the waiver/reimbursement commitment, and therefore will be paid by the Fund, if applicable: taxes (including foreign transaction taxes), expenses associated with investments in affiliated and non-affiliated pooled investment vehicles (including mutual funds and exchange traded funds), transaction costs and brokerage commissions, costs related to any securities lending program, dividend expenses associated with securities sold short, inverse floater program fees and expenses, transaction charges and interest on borrowed money, interest, extraordinary expenses and any other expenses the exclusion of which is specifically approved by the Board. This agreement may be modified or amended only with approval from all parties.
Annual Report 2013
34
Columbia Global Dividend Opportunity Fund
Notes to Financial Statements (continued)
August 31, 2013
Note 4. Federal Tax Information
The timing and character of income and capital gain distributions are determined in accordance with income tax regulations, which may differ from GAAP because of temporary or permanent book to tax differences.
At August 31, 2013, these differences are primarily due to differing treatment for capital loss carryforwards, deferral/reversal of wash sales losses, Trustees' deferred compensation, passive foreign investment company (PFIC) holdings, foreign currency transactions, re-characterization of distributions for investments and derivative investments. To the extent these differences are permanent, reclassifications are made among the components of the Fund's net assets in the Statement of Assets and Liabilities. Temporary differences do not require reclassifications. In the Statement of Assets and Liabilities the following reclassifications were made:
Undistributed net investment income | | $ | 3,081,280 | | |
Accumulated net realized gain | | | (2,843,559 | ) | |
Paid-in capital | | | (237,721 | ) | |
Net investment income and net realized gains (losses), as disclosed in the Statement of Operations, and net assets were not affected by this reclassification.
The tax character of distributions paid during the years indicated was as follows:
Year Ended August 31, | | 2013 | | 2012 | |
Ordinary income | | $ | 28,926,916 | | | $ | 4,069,526 | | |
Long-term capital gains | | | 51,393,986 | | | | — | | |
Total | | $ | 80,320,902 | | | $ | 4,069,526 | | |
Short-term capital gain distributions, if any, are considered ordinary income distributions for tax purposes.
At August 31, 2013, the components of distributable earnings on a tax basis were as follows:
Undistributed ordinary income | | $ | 13,553,545 | | |
Undistributed accumulated long-term gain | | | 24,271,093 | | |
Accumulated realized gain | | | — | | |
Unrealized appreciation | | | 92,836,135 | | |
At August 31, 2013, the cost of investments for federal income tax purposes was $749,566,781 and the aggregate gross unrealized appreciation and depreciation based on that cost was:
Unrealized appreciation | | $ | 105,578,763 | | |
Unrealized depreciation | | | (12,742,628 | ) | |
Net unrealized appreciation | | | 92,836,135 | | |
The following capital loss carryforward, determined at August 31, 2013, may be available to reduce taxable income arising from future net realized gains on investments, if any, to the extent permitted by the Internal Revenue Code:
Year of Expiration | | Amount ($) | |
| | 2017 | | | | 19,838,683 | | |
For the year ended August 31, 2013, $5,093,758 of capital loss carryforward was utilized and $237,722 expired unused.
Management of the Fund has concluded that there are no significant uncertain tax positions that would require recognition in the financial statements. However, management's conclusion may be subject to review and adjustment at a later date based on factors including, but not limited to, new tax laws, regulations, and administrative interpretations (including relevant court decisions). Generally, the Fund's federal tax returns for the prior three fiscal years remain subject to examination by the Internal Revenue Service.
Note 5. Portfolio Information
The cost of purchases and proceeds from sales of securities, excluding short-term obligations, aggregated to $477,277,626 and $463,792,913, respectively, for the year ended August 31, 2013.
Note 6. Regulatory Settlements
During the year ended August 31, 2012, the Fund received $34,306 as a result of a regulatory settlement proceeding brought by the Securities and Exchange Commission against an unaffiliated third party relating to market timing and/or late trading of mutual funds. This amount represented the Fund's portion of the proceeds from the settlement (the Fund was not a party to the proceeding). The payments have been included in "Proceeds from regulatory settlements" in the Statement of Changes in Net Assets.
Note 7. Lending of Portfolio Securities
Effective December 19, 2012, the Fund no longer participates in securities lending activity. Prior to that date, the Fund participated, or was eligible to participate, in securities lending activity pursuant to a Master Securities Lending Agreement (the Agreement) with JPMorgan Chase Bank, N.A. (JPMorgan). The Agreement authorized JPMorgan as lending agent to lend securities to authorized borrowers in order to generate additional income on behalf of the Fund. Pursuant to the Agreement, the securities loaned were secured by cash or securities that either were issued or guaranteed as to principal and interest by the U.S. government, its agencies, authorities or instrumentalities with value equal to at least 100% of the
Annual Report 2013
35
Columbia Global Dividend Opportunity Fund
Notes to Financial Statements (continued)
August 31, 2013
market value of the loaned securities. Any additional collateral required to maintain those levels due to market fluctuations of the loaned securities was requested to be delivered the following business day. Cash collateral received was invested by the lending agent on behalf of the Fund into authorized investments pursuant to the Agreement.
Pursuant to the Agreement, the Fund received income for lending its securities either in the form of fees or by earning interest on invested cash collateral, net of negotiated rebates paid to borrowers and fees paid to the lending agent for services provided and any other securities lending expenses. Net income earned from securities lending for the year ended August 31, 2013 is disclosed in the Statement of Operations. The Fund continued to earn and accrue interest and dividends on the securities loaned.
Note 8. Affiliated Money Market Fund
The Fund invests its daily cash balances in Columbia Short-Term Cash Fund, an affiliated money market fund established for the exclusive use by the Fund and other affiliated funds. The income earned by the Fund from such investments is included as "Dividends — affiliated issuers" in the Statement of Operations. As an investing fund, the Fund indirectly bears its proportionate share of the expenses of Columbia Short-Term Cash Fund.
Note 9. Shareholder Concentration
At August 31, 2013, affiliated shareholder accounts owned 16.8% of the outstanding shares of the Fund. Subscription and redemption activity by concentrated accounts may have a significant effect on the operations of the Fund.
Note 10. Line of Credit
The Fund has entered into a revolving credit facility with a syndicate of banks led by JPMorgan whereby the Fund may borrow for the temporary funding of shareholder redemptions or for other temporary or emergency purposes. The credit facility agreement, as amended, which is a collective agreement between the Fund and certain other funds managed by the Investment Manager, severally and not jointly, permits collective borrowings up to $500 million. Interest is charged to each participating fund based on its borrowings at a rate equal to the higher of (i) the overnight federal funds rate plus 1.00% or (ii) the one-month LIBOR rate plus 1.00%. Each borrowing under the credit facility matures no later than 60 days after the date of borrowing. The Fund also pays a commitment fee equal to its pro rata share of the amount of the credit facility at a rate of 0.08% per annum. The commitment fee is included in other expenses in the Statement of Operations.
The Fund had no borrowings during the year ended August 31, 2013.
Note 11. Significant Risks
Foreign Securities Risk
Investing in foreign securities may include certain risks and considerations not typically associated with investing in U.S. securities, such as fluctuating currency values and changing local and regional economic, political and social conditions, which may result in greater market volatility. In addition, certain foreign securities may not be as liquid as U.S. securities.
Note 12. Subsequent Events
Management has evaluated the events and transactions that have occurred through the date the financial statements were issued and noted no items requiring adjustment of the financial statements or additional disclosure.
Note 13. Information Regarding Pending and Settled Legal Proceedings
In December 2005, without admitting or denying the allegations, American Express Financial Corporation (AEFC, which is now known as Ameriprise Financial, Inc. (Ameriprise Financial)) entered into settlement agreements with the Securities and Exchange Commission (SEC) and Minnesota Department of Commerce (MDOC) related to market timing activities. As a result, AEFC was censured and ordered to cease and desist from committing or causing any violations of certain provisions of the Investment Advisers Act of 1940, the Investment Company Act of 1940, and various Minnesota laws. AEFC agreed to pay disgorgement of $10 million and civil money penalties of $7 million. AEFC also agreed to retain an independent distribution consultant to assist in developing a plan for distribution of all disgorgement and civil penalties ordered by the SEC in accordance with various undertakings detailed at www.sec.gov/litigation/admin/ia-2451.pdf. Ameriprise Financial and its affiliates have cooperated with the SEC and the MDOC in these legal proceedings, and have made regular reports to the funds' Boards of Trustees.
Ameriprise Financial and certain of its affiliates have historically been involved in a number of legal, arbitration and regulatory proceedings, including routine litigation, class actions, and governmental actions, concerning matters arising in connection with the conduct of their business activities. Ameriprise Financial believes that the Funds are not currently the subject of, and that neither Ameriprise Financial nor any of its affiliates are the subject of, any pending legal, arbitration or regulatory proceedings that are likely to have a material adverse effect on the Funds or the ability of Ameriprise
Annual Report 2013
36
Columbia Global Dividend Opportunity Fund
Notes to Financial Statements (continued)
August 31, 2013
Financial or its affiliates to perform under their contracts with the Funds. Ameriprise Financial is required to make 10-Q, 10-K and, as necessary, 8-K filings with the Securities and Exchange Commission on legal and regulatory matters that relate to Ameriprise Financial and its affiliates. Copies of these filings may be obtained by accessing the SEC website at www.sec.gov.
There can be no assurance that these matters, or the adverse publicity associated with them, will not result in increased fund redemptions, reduced sale of fund shares or other adverse consequences to the Funds. Further, although we believe proceedings are not likely to have a material adverse effect on the Funds or the ability of Ameriprise Financial or its affiliates to perform under their contracts with the Funds, these proceedings are subject to uncertainties and, as such, we are unable to estimate the possible loss or range of loss that may result. An adverse outcome in one or more of these proceedings could result in adverse judgments, settlements, fines, penalties or other relief that could have a material adverse effect on the consolidated financial condition or results of operations of Ameriprise Financial.
Annual Report 2013
37
Columbia Global Dividend Opportunity Fund
Report of Independent Registered Public Accounting Firm
To the Trustees of Columbia Funds Series Trust I and the Shareholders of
Columbia Global Dividend Opportunity Fund
In our opinion, the accompanying statement of assets and liabilities, including the portfolio of investments, and the related statements of operations and of changes in net assets and the financial highlights present fairly, in all material respects, the financial position of Columbia Global Dividend Opportunity Fund (the "Fund") (a series of Columbia Funds Series Trust I) at August 31, 2013, the results of its operations, the changes in its net assets and the financial highlights for the periods indicated, in conformity with accounting principles generally accepted in the United States of America. These financial statements and financial highlights (hereafter referred to as "financial statements") are the responsibility of the Fund's management. Our responsibility is to express an opinion on these financial statements based on our audits. We conducted our audits of these financial statements in accordance with the standards of the Public Company Accounting Oversight Board (United States). Those standards require that we plan and perform the audit to obtain reasonable assurance about whether the financial statements are free of material misstatement. An audit includes examining, on a test basis, evidence supporting the amounts and disclosures in the financial statements, assessing the accounting principles used and significant estimates made by management, and evaluating the overall financial statement presentation. We believe that our audits, which included confirmation of securities at August 31, 2013 by correspondence with the custodian, brokers and transfer agent, provide a reasonable basis for our opinion.
PricewaterhouseCoopers LLP
Minneapolis, Minnesota
October 22, 2013
Annual Report 2013
38
Columbia Global Dividend Opportunity Fund
Federal Income Tax Information
(Unaudited)
The Fund hereby designates the following tax attributes for the fiscal year ended August 31, 2013. Shareholders will be notified in early 2014 of the amounts for use in preparing 2013 income tax returns.
Tax Designations
| Qualified Dividend Income | | | 91.44 | % | |
| Dividends Received Deduction | | | 58.12 | % | |
| Capital Gain Dividend | | $ | 47,281,837 | | |
Qualified Dividend Income. For taxable, non-corporate shareholders, the percentage of ordinary income dividends paid during the fiscal year that represents qualified dividend income subject to reduced tax rates.
Dividends Received Deduction. The percentage of ordinary income dividends paid during the fiscal year that qualifies for the corporate dividends received deduction.
Capital Gain Dividend. The Fund designates as a capital gain dividend the amount reflected above, or if subsequently determined to be different, the net capital gain of such fiscal period. The Fund also designates as capital gain dividends, to the extent necessary to fully distribute such capital gains, earnings and profits distributed to shareholders on the redemption of shares.
Annual Report 2013
39
Columbia Global Dividend Opportunity Fund
The Trustees serve terms of indefinite duration. The names, addresses and birth years of the Trustees and Officers of the Funds in Columbia Funds Series Trust I, the year each was first elected or appointed to office, their principal business occupations during at least the last five years, the number of Funds overseen by each Trustee and other directorships they hold are shown below. Each officer listed below serves as an officer of each Fund in Columbia Funds Series Trust I.
Independent Trustees
Name, Address and Year of Birth,
Position with Funds, Year First
Elected or Appointed to Office | | Principal Occupation(s) During Past Five Years, Number of Funds in Columbia
Funds Complex Overseen by Trustee, Other Directorships Held | |
Rodman L. Drake (Born 1943)
c/o Columbia Management
Investment Advisers, LLC
225 Franklin Street
Boston, MA 02110
Trustee (since 1994) and
Chairman of the Board (since 2009) | | Independent consultant since 2010; Co-Founder of Baringo Capital LLC (private equity) from 1997 to 2008; Chairman (from 2003 to 2010) and CEO (from 2008 to 2010) of Crystal River Capital, Inc. (real estate investment trust); Oversees 52; Jackson Hewitt Tax Service Inc. (tax preparation services) from 2004 to 2011; Student Loan Corporation (student loan provider) from 2005 to 2010; Celgene Corporation (global biotechnology company); The Helios Funds and Brookfield Funds (closed-end funds); Chimerix, Inc. (biopharmaceutical company) since August 1, 2013; Crystal River Capital, Inc. from 2005 to 2010; Parsons Brinckerhoff from 1995 to 2008; and Apex Silver Mines Ltd. from 2007 to 2009 | |
Douglas A. Hacker (Born 1955)
c/o Columbia Management
Investment Advisers, LLC
225 Franklin Street
Boston, MA 02110
Trustee (since 1996) | | Independent business executive since May 2006; Executive Vice President — Strategy of United Airlines from December 2002 to May 2006; President of UAL Loyalty Services (airline marketing company) from September 2001 to December 2002; Executive Vice President and Chief Financial Officer of United Airlines from July 1999 to September 2001. Oversees 52; Nash Finch Company (food distributor); Aircastle Limited (aircraft leasing); and SeaCube Container Leasing Ltd. (container leasing) | |
Janet Langford Kelly (Born 1957)
c/o Columbia Management
Investment Advisers, LLC
225 Franklin Street
Boston, MA 02110
Trustee (since 1996) | | Senior Vice President, General Counsel and Corporate Secretary, ConocoPhillips (integrated energy company) since September 2007; Deputy General Counsel — Corporate Legal Services, ConocoPhillips from August 2006 to August 2007; Partner, Zelle, Hofmann, Voelbel, Mason & Gette LLP (law firm) from March 2005 to July 2006; Adjunct Professor of Law, Northwestern University from September 2004 to June 2006; Director, UAL Corporation (airline) from February 2006 to July 2006; Chief Administrative Officer and Senior Vice President, Kmart Holding Corporation (consumer goods) from September 2003 to March 2004. Oversees 52; None | |
Nancy T. Lukitsh (Born 1956)
c/o Columbia Management
Investment Advisers, LLC
225 Franklin Street
Boston, MA 02110
Trustee (since 2011) | | Senior Vice President, Partner and Director of Marketing, Wellington Management Company, LLP (investment adviser) from 1997 to 2010; Chair, Wellington Management Investment Portfolios (commingled non-U.S. investment pools) from 2007 to 2010; Director, Wellington Trust Company, NA and other Wellington affiliates from 1997 to 2010. Oversees 52; None | |
William E. Mayer (Born 1940)
c/o Columbia Management
Investment Advisers, LLC
225 Franklin Street
Boston, MA 02110
Trustee (since 1994) | | Partner, Park Avenue Equity Partners (private equity) since February 1999; Dean and Professor, College of Business and Management, University of Maryland from 1992 to 1996. Oversees 52; DynaVox Inc. (speech creation); Lee Enterprises (print media); WR Hambrecht + Co. (financial service provider) from 2000 to 2012; BlackRock Kelso Capital Corporation (investment company) | |
David M. Moffett (Born 1952)
c/o Columbia Management
Investment Advisers, LLC
225 Franklin Street
Boston, MA 02110
Trustee (since 2011) | | Retired. Chief Executive Officer, Federal Home Loan Mortgage Corporation, from 2008 to 2009; Senior Adviser, Global Financial Services Group, Carlyle Group, Inc., from 2007 to 2008; Vice Chairman and Chief Financial Officer, U.S. Bancorp, from 1993 to 2007. Oversees 52; CIT Group Inc. (commercial and consumer finance); eBay Inc. (online trading community); MBIA Inc. (financial service provider); E.W. Scripps Co. (print and television media), Building Materials Holding Corp. (building materials and construction services); Genworth Financial, Inc. (financial and insurance products and services); and University of Oklahoma Foundation | |
Charles R. Nelson (Born 1942)
c/o Columbia Management
Investment Advisers, LLC
225 Franklin Street
Boston, MA 02110
Trustee (since 1981) | | Retired. Professor Emeritus, University of Washington, since 2011; Professor of Economics, University of Washington from 1976 to 2011; Ford and Louisa Van Voorhis Professor of Political Economy, University of Washington from 1993 to 2011; Adjunct Professor of Statistics, University of Washington from 1980 to 2011; Associate Editor, Journal of Money, Credit and Banking from September 1993 to 2008; consultant on econometric and statistical matters. Oversees 52; None | |
John J. Neuhauser (Born 1943)
c/o Columbia Management
Investment Advisers, LLC
225 Franklin Street
Boston, MA 02110
Trustee (since 1984) | | President, Saint Michael's College, since August 2007; Director or Trustee of several non-profit organizations, including Fletcher Allen Health Care, Inc.; University Professor, Boston College from November 2005 to August 2007; Academic Vice President and Dean of Faculties, Boston College from August 1999 to October 2005. Oversees 52; Liberty All-Star Equity Fund and Liberty All-Star Growth Fund (closed-end funds) | |
Annual Report 2013
40
Columbia Global Dividend Opportunity Fund
Trustees and Officers (continued)
Independent Trustees (continued)
Name, Address and Year of Birth,
Position with Funds, Year First
Elected or Appointed to Office | | Principal Occupation(s) During Past Five Years, Number of Funds in Columbia
Funds Complex Overseen by Trustee, Other Directorships Held | |
Patrick J. Simpson (Born 1944)
c/o Columbia Management
Investment Advisers, LLC
225 Franklin Street
Boston, MA 02110
Trustee (since 2000) | | Partner, Perkins Coie LLP (law firm). Oversees 52; None | |
Anne-Lee Verville (Born 1945)
c/o Columbia Management
Investment Advisers, LLC
225 Franklin Street
Boston, MA 02110
Trustee (since 1998) | | Retired. General Manager — Global Education Industry from 1994 to 1997, President — Application Systems Division from 1991 to 1994, Chief Financial Officer — US Marketing & Services from 1988 to 1991, and Chief Information Officer from 1987 to 1988, IBM Corporation (computer and technology). Oversees 52; Enesco Group, Inc. (producer of giftware and home and garden decor products) from 2001 to 2006 | |
Interested Trustee
Name, Address and Year of Birth,
Position with Funds, Year First
Elected or Appointed to Office | | Principal Occupation(s) During Past Five Years, Number of Funds in Columbia
Funds Complex Overseen by Trustee, Other Directorships Held | |
William F. Truscott (born 1960)
53600 Ameriprise Financial Center
Minneapolis, MN 55474
Senior Vice President (since 2012) | | Chairman of the Board and President, Columbia Management Investment Advisers, LLC since May 2010 and February 2012 (previously President and Chief Investment Officer, from 2001 to April 2010); Chief Executive Officer, Global Asset Management, Ameriprise Financial, Inc. since September 2012 (previously, Chief Executive Officer, U.S. Asset Management & President, Annuities, from May 2010 to September 2012 and President — U.S. Asset Management and Chief Investment Officer from 2005 to April 2010); Director and Chief Executive Officer, Columbia Management Investment Distributors, Inc. since May 2010 and February 2012, respectively (previously Chairman of the Board and Chief Executive Officer from 2006 to April 2010); Chairman of the Board and Chief Executive Officer, RiverSource Distributors, Inc. since 2006; President and Chief Executive Officer, Ameriprise Certificate Company, 2006 to August 2012; Oversees 184; Director, Ameriprise Certificate Company, 2006-January 2013 | |
The Statement of Additional Information includes additional information about the Trustees of the Funds and is available, without charge, upon request by calling 800.345.6611.
The Board has appointed officers who are responsible for day-to-day business decisions based on policies it has established. The officers serve at the pleasure of the Board. In addition to Mr. Truscott, who is Senior Vice President, the Funds' other officers are:
Officers
Name, Year of Birth and Address | | Principal Occupation(s) During the Past Five Years | |
J. Kevin Connaughton (Born 1964)
225 Franklin Street
Boston, MA 02110
President (since 2009) | | Senior Vice President and General Manager — Mutual Fund Products, Columbia Management Investment Advisers, LLC since May 2010; President, Columbia Funds since 2009 and RiverSource Funds since May 2010; Managing Director, Columbia Management Advisors, LLC, December 2004-April 2010; Senior Vice President and Chief Financial Officer, Columbia Funds, June 2008-January 2009; Treasurer, Columbia Funds, October 2003-May 2008; and senior officer of various other affiliated funds since 2000 | |
Amy Johnson (Born 1965)
5228 Ameriprise Financial Center
Minneapolis, MN 55474
Vice President (since 2010) | | Senior Vice President and Chief Operating Officer, Columbia Management Investment Advisers, LLC since May 2010 (previously Chief Administrative Officer, from 2009-April 2010, Vice President — Asset Management and Trust Company Services, from 2006-2009) | |
Michael G. Clarke (Born 1969)
225 Franklin Street
Boston, MA 02110
Treasurer (since 2011) and Chief
Financial Officer (since 2009) | | Vice President, Columbia Management Investment Advisers, LLC since May 2010; Managing Director of Fund Administration, Columbia Management Advisors, LLC, September 2004-April 2010; senior officer of Columbia Funds and affiliated funds since 2002 | |
Annual Report 2013
41
Columbia Global Dividend Opportunity Fund
Trustees and Officers (continued)
Officers (continued)
Name, Year of Birth and Address | | Principal Occupation(s) During the Past Five Years | |
Scott R. Plummer (Born 1959)
5228 Ameriprise Financial Center
Minneapolis, MN 55474
Senior Vice President, Assistant
Secretary and Chief Legal Officer
(since 2010) | | Senior Vice President, Chief Legal Officer and Assistant Secretary, Columbia Management Investment Advisers, LLC since June 2005; Senior Vice President and Lead Chief Counsel — Asset Management, Ameriprise Financial, Inc. since May 2010 (previously Vice President and Chief Counsel — Asset Management, 2005-April 2010); Vice President, Chief Counsel and Assistant Secretary, Columbia Management Investment Distributors, Inc. since 2008; Vice President, General Counsel and Secretary, Ameriprise Certificate Company since 2005; Chief Counsel, RiverSource Distributors, Inc. since 2006; senior officer of Columbia Funds and affiliated funds since 2010 | |
Colin Moore (Born 1958)
225 Franklin Street
Boston, MA 02110
Senior Vice President (since 2010) | | Executive Vice President and Global Chief Investment Officer, Ameriprise Financial, Inc. since July 2013; Director and Global Chief Investment Officer, Columbia Management Investment Advisers, LLC since May 2010; Manager, Managing Director and Chief Investment Officer of Columbia Management Advisors, LLC, 2007-April 2010 | |
Thomas P. McGuire (Born 1972)
225 Franklin Street
Boston, MA 02110
Chief Compliance Officer
(since 2012) | | Vice President — Asset Management Compliance, Columbia Management Investment Advisers, LLC since 2010; Chief Compliance Officer, Ameriprise Certificate Company, since September 2010; Compliance Executive, Bank of America, N.A. 2005-2010 | |
Stephen T. Welsh (born 1957)
225 Franklin Street
Boston, MA 02110
Vice President (since 2006) | | President and Director, Columbia Management Investment Services Corp. since May 2010; President and Director, Columbia Management Services, Inc., July 2004-April 2010; Managing Director, Columbia Management Distributors, Inc., August 2007-April 2010 | |
Christopher O. Petersen (born 1970)
5228 Ameriprise Financial Center
Minneapolis, MN 55474
Vice President (since 2010) and
Secretary (since 2011) | | Vice President and Chief Counsel, Ameriprise Financial, Inc. since January 2010 (formerly Vice President and Group Counsel or Counsel, April 2004-January 2010); Assistant Secretary of Columbia Funds, January 2007-April 2011 | |
Paul D. Pearson (born 1956)
10468 Ameriprise Financial Center
Minneapolis, MN 55474
Vice President and Assistant
Treasurer (since 2011) | | Vice President, Investment Accounting, Columbia Management Investment Advisers, LLC, since May 2010; Vice President — Managed Assets, Investment Accounting, Ameriprise Financial, Inc., February 1998-May 2010 | |
Joseph F. DiMaria (Born 1968)
225 Franklin Street
Boston, MA 02110
Vice President (since 2011) and
Chief Accounting Officer (since 2008) | | Vice President, Mutual Fund Administration, Columbia Management Investment Advisers, LLC, since May 2010; Director of Fund Administration, Columbia Management Advisors, LLC, January 2006-April 2010 | |
Paul B. Goucher (born 1968)
100 Park Avenue
New York, NY 10017
Vice President and Assistant
Secretary (since 2010) | | Vice President and Lead Chief Counsel, Ameriprise Financial, Inc. since November 2008 and January 2013, respectively (formerly, Chief Counsel from January 2010-January 2013 and Group Counsel from November 2008-January 2010); Director, Managing Director and General Counsel, J. & W. Seligman & Co. Incorporated, July 2008-November 2008 (previously, Managing Director and Associate General Counsel, January 2005-July 2008) | |
Michael E. DeFao (born 1968)
225 Franklin Street
Boston, MA 02110
Vice President and Assistant
Secretary (since 2011) | | Vice President and Chief Counsel, Ameriprise Financial, Inc. since May 2010; Associate General Counsel, Bank of America, N.A. June 2005-April 2010 | |
Annual Report 2013
42
Columbia Global Dividend Opportunity Fund
Board Consideration and Approval of Advisory Agreement
On June 14, 2013, the Board of Trustees (the "Board") and the Trustees who are not interested persons (as defined in the Investment Company Act of 1940) of the Trust (the "Independent Trustees") unanimously approved the continuation of the Investment Management Services Agreement (the "Advisory Agreement") with Columbia Management Investment Advisers, LLC (the "Investment Manager") with respect to Columbia Global Dividend Opportunity Fund (the "Fund"), a series of the Trust. As detailed below, the Advisory Fees and Expenses Committee (the "Committee") and the Board met on multiple occasions to review and discuss, both among themselves and with the management team of the Investment Manager, materials provided by the Investment Manager before determining to approve the continuation of the Advisory Agreement.
In connection with their deliberations regarding the continuation of the Advisory Agreement, the Committee and the Board evaluated materials requested from the Investment Manager regarding the Fund and the Advisory Agreement, and discussed these materials with representatives of the Investment Manager at Committee meetings held on March 5, 2013, April 24, 2013 and June 13, 2013, and at the Board meeting held on June 14, 2013. In addition, the Board considers matters bearing on the Advisory Agreement at most of its other meetings throughout the year and meets regularly with senior management of the Funds and the Investment Manager. Through the Board's Investment Oversight Committees, Trustees also meet with selected Fund portfolio managers and other investment personnel at various times throughout the year. The Committee and the Board also consulted with Fund counsel and with the Independent Trustees' independent legal counsel, who advised on various matters with respect to the Committee's and the Board's considerations and otherwise assisted the Committee and the Board in their deliberations. On June 13, 2013, the Committee recommended that the Board approve the continuation of the Advisory Agreement. On June 14, 2013, the Board, including the Independent Trustees, voting separately, unanimously approved the continuation of the Advisory Agreement for the Fund.
The Committee and the Board considered all information that they, their legal counsel, or the Investment Manager believed reasonably necessary to evaluate and to determine whether to approve the continuation of the Advisory Agreement. The information and factors considered by the Committee and the Board in recommending for approval or approving the continuation of the Advisory Agreement for the Fund included the following:
• Information on the investment performance of the Fund relative to the performance of a group of mutual funds determined to be comparable to the Fund by an independent third-party data provider, as well as performance relative to benchmarks;
• Information on the Fund's advisory fees and total expenses, including information comparing the Fund's expenses to those of a group of comparable mutual funds, as determined by the independent third-party data provider;
• The Investment Manager's agreement to contractually limit or cap total operating expenses for the Fund so that total operating expenses (excluding certain fees and expenses, such as transaction costs and certain other investment related expenses, interest, taxes, acquired fund fees and expenses, and extraordinary expenses) would not exceed the median expenses of a group of comparable funds (as determined from time to time, generally annually, by the independent third-party data provider);
• The terms and conditions of the Advisory Agreement;
• The terms and conditions of other agreements and arrangements with affiliates of the Investment Manager relating to the operations of the Fund, including the Administrative Services Agreement, the Distribution Agreement and the Transfer and Dividend Disbursing Agent Agreement;
• Descriptions of various functions performed by the Investment Manager under the Advisory Agreement, including portfolio management and portfolio trading practices;
• Information regarding the management fees and investment performance of comparable portfolios of other clients of the Investment Manager, including institutional separate accounts;
• Information regarding the reputation, regulatory history and resources of the Investment Manager, including information regarding senior management, portfolio managers and other personnel;
• Information regarding the capabilities of the Investment Manager with respect to compliance monitoring services, including an assessment of the Investment Manager's compliance system by the Fund's Chief Compliance Officer; and
• The profitability to the Investment Manager and its affiliates from their relationships with the Fund.
Annual Report 2013
43
Columbia Global Dividend Opportunity Fund
Board Consideration and Approval of Advisory Agreement (continued)
Nature, Extent and Quality of Services Provided under the Advisory Agreement
The Committee and the Board considered the nature, extent and quality of services provided to the Fund by the Investment Manager and its affiliates under the Advisory Agreement and under separate agreements for the provision of transfer agency and administrative services, and the resources dedicated to the Fund and the other Columbia Funds by the Investment Manager and its affiliates. The Committee and the Board considered, among other things, the Investment Manager's ability to attract, motivate and retain highly qualified research, advisory and supervisory investment professionals (including personnel and other resources, compensation programs for personnel involved in fund management, reputation and other attributes), the portfolio management services provided by those investment professionals, and the quality of the Investment Manager's investment research capabilities and trade execution services. The Committee and the Board also considered the potential benefits to shareholders of investing in a mutual fund that is part of a fund complex offering exposure to a variety of asset classes and investment disciplines and providing a variety of fund and shareholder services.
The Committee and the Board also considered the professional experience and qualifications of the senior personnel of the Investment Manager, which included consideration of the Investment Manager's experience with similarly-structured funds. The Committee and the Board noted the compliance programs of and the compliance-related resources provided to the Fund by the Investment Manager and its affiliates, and considered the Investment Manager's ability to provide administrative services to the Fund pursuant to a separate Administrative Services Agreement, including the Investment Manager's ability to coordinate the activities of the Fund's other service providers. After reviewing these and related factors, the Committee and the Board concluded, within the context of their overall conclusions, that the nature, extent and quality of the services provided to the Fund under the Advisory Agreement supported the continuation of the Advisory Agreement.
Investment Performance
The Committee and the Board reviewed information about the performance of the Fund over various time periods, including performance information relative to benchmarks and information based on reports of the independent third-party data provider that compared the performance of the Fund to the performance of a group of comparable mutual funds. The Committee and the Board also reviewed a description of the third party's methodology for identifying the Fund's peer groups for purposes of performance and expense comparisons.
The Committee and the Board noted that, through December 31, 2012, the Fund's performance was in the eleventh, twenty-ninth and thirtieth percentiles (where the best performance would be in the first percentile) of its category selected by the independent third-party data provider for the purposes of performance comparisons for the one-, three- and five-year periods, respectively.
The Committee and the Board also considered the Investment Manager's performance and reputation generally, the Investment Manager's historical responsiveness to Board concerns about performance, and the Investment Manager's willingness to take steps intended to improve performance. After reviewing these and related factors, the Committee and the Board concluded, within the context of their overall conclusions, that the performance of the Fund supported the continuation of the Advisory Agreement.
Investment Advisory Fee Rates and Other Expenses
The Committee and the Board considered the advisory fees charged to the Fund under the Advisory Agreement as well as the total expenses incurred by the Fund. In assessing the reasonableness of the fees under the Advisory Agreement, the Committee and the Board considered, among other information, the Fund's advisory fee and its total expense ratio as a percentage of average daily net assets. The Committee and the Board noted that the Fund's actual management fee and net expense ratio are both ranked in the second quintile (where the lowest fees and expenses would be in the first quintile) against the Fund's expense universe as determined by the independent third-party data provider for purposes of expense comparison. The Committee and the Board also took into account the fee waiver and expense limitation arrangements agreed to by the Investment Manager, as noted above.
The Committee and the Board also received and considered information about the advisory fees charged by the Investment Manager to institutional separate accounts. In considering the fees charged to those accounts, the Committee and the Board took into account, among other things, the Investment Manager's representations about the differences between managing mutual funds as compared to other types of accounts, including differences in the services provided, differences in the risk
Annual Report 2013
44
Columbia Global Dividend Opportunity Fund
Board Consideration and Approval of Advisory Agreement (continued)
profile of such business for the Investment Manager and the additional resources required to manage mutual funds effectively. In evaluating the Fund's advisory fees, the Committee and the Board also took into account the demands, complexity and quality of the investment management of the Fund.
After reviewing these and related factors, the Committee and the Board concluded, within the context of their overall conclusions, that the advisory fee rates and expenses of the Fund supported the continuation of the Advisory Agreement.
Costs of Services Provided and Profitability
The Committee and the Board also took note of the costs of the services provided (both on an absolute and relative basis) and the profitability to the Investment Manager and its affiliates in connection with their relationships with the Fund. In evaluating these considerations, the Committee and the Board took note of the advisory fees charged by the Investment Manager to other clients, including fees charged by the Investment Manager to institutional separate account clients with similar investment strategies to those of the Fund.
The Committee and the Board also considered the compensation directly or indirectly received by the Investment Manager's affiliates in connection with their relationships with the Fund. The Committee and the Board reviewed information provided by management as to the profitability of the Investment Manager and its affiliates of their relationships with the Fund, information about the allocation of expenses used to calculate profitability, and comparisons of profitability levels realized in 2012 to profitability levels realized in 2011. When reviewing profitability, the Committee and the Board also considered court cases in which adviser profitability was an issue in whole or in part, the performance of the Fund, the expense ratio of the Fund, and the implementation of expense limitations with respect to the Fund. The Committee and the Board also considered information provided by the Investment Manager regarding its financial condition and comparing its profitability to that of other asset management firms that are, or are subsidiaries of, publicly traded companies.
After reviewing these and related factors, the Committee and the Board concluded, within the context of their overall conclusions, that the costs of services provided and the profitability to the Investment Manager and its affiliates from their relationships with the Fund supported the continuation of the Advisory Agreement.
Economies of Scale
The Committee and the Board considered the potential existence of economies of scale in the provision by the Investment Manager of services to the Fund, to groups of related funds, and to the Investment Manager's investment advisory clients as a whole, and whether those economies of scale were shared with the Fund through breakpoints in investment advisory fees or other means, such as expense limitation arrangements and additional investments by the Investment Manager in investment, trading and compliance resources. The Committee and the Board noted that the investment advisory fee schedules for the Fund contained breakpoints that would reduce the fee rate on assets above specified threshold levels.
In considering these matters, the Committee and the Board also considered the costs of the services provided and the profitability to the Investment Manager and its affiliates from their relationships with the Fund, as discussed above. After reviewing these and related factors, the Committee and the Board concluded, within the context of their overall conclusions, that the extent to which any economies of scale were expected to be shared with the Fund supported the continuation of the Advisory Agreement.
Other Benefits to the Investment Manager
The Committee and the Board received and considered information regarding "fall-out" or ancillary benefits received by the Investment Manager and its affiliates as a result of their relationships with the Fund, such as the engagement of the Investment Manager to provide administrative services to the Fund and the engagement of the Investment Manager's affiliates to provide distribution and transfer agency services to the Fund. The Committee and the Board considered that the Fund's distributor retains a portion of the distribution fees from the Fund. The Committee and the Board also considered the benefits of research made available to the Investment Manager by reason of brokerage commissions generated by the Fund's securities transactions, and reviewed information about the Investment Manager's practices with respect to allocating portfolio transactions for brokerage and research services. The Committee and the Board considered the possible conflicts of interest associated with certain fall-out or other ancillary benefits and the reporting, disclosure and other processes that
Annual Report 2013
45
Columbia Global Dividend Opportunity Fund
Board Consideration and Approval of Advisory Agreement (continued)
are in place to address such possible conflicts of interest. The Committee and the Board recognized that the Investment Manager's profitability would be somewhat lower without these benefits.
Conclusion
The Committee and the Board reviewed all of the above considerations in reaching their decisions to recommend or approve the continuation of the Advisory Agreement. In their deliberations, the Trustees did not identify any particular information that was all-important or controlling, and individual Trustees may have attributed different weights to the various factors. Based on their evaluation of all factors that they deemed to be material, including those factors described above, and assisted by the advice of independent legal counsel, the Board, including the Independent Trustees, voting separately, unanimously approved the continuation of the Advisory Agreement.
Annual Report 2013
46
This page intentionally left blank.
Annual Report 2013
47
This page intentionally left blank.
Annual Report 2013
48
Columbia Global Dividend Opportunity Fund
Important Information About This Report
Each fund mails one shareholder report to each shareholder address. If you would like more than one report, please call shareholder services at 800.345.6611 and additional reports will be sent to you.
The policy of the Board is to vote the proxies of the companies in which each fund holds investments consistent with the procedures as stated in the Statement of Additional Information (SAI). You may obtain a copy of the SAI without charge by calling 800.345.6611; contacting your financial intermediary; visiting columbiamanagement.com; or searching the website of the Securities and Exchange Commission (SEC) at sec.gov. Information regarding how each fund voted proxies relating to portfolio securities is filed with the SEC by August 31 for the most recent 12-month period ending June 30 of that year, and is available without charge by visiting columbiamanagement.com; or searching the website of the SEC at sec.gov.
Each fund files a complete schedule of portfolio holdings with the SEC for the first and third quarters of each fiscal year on Form N-Q. Each fund's Form N-Q is available on the SEC's website at sec.gov and may be reviewed and copied at the SEC's Public Reference Room in Washington, D.C. Information on the operation of the Public Reference Room may be obtained by calling 800.SEC.0330. Each fund's complete schedule of portfolio holdings, as filed on Form N-Q, can also be obtained without charge, upon request, by calling 800.345.6611.
Annual Report 2013
49

Columbia Global Dividend Opportunity Fund
P.O. Box 8081
Boston, MA 02266-8081
columbiamanagement.com
This information is for use with concurrent or prior delivery of a fund prospectus. Please read and consider the investment objectives, risks, charges and expenses for any fund carefully before investing. For a prospectus which contains this and other important information about the Fund go to columbiamanagement.com. The Fund is distributed by Columbia Management Investment Distributors, Inc., member FINRA, and managed by Columbia Management Investment Advisers, LLC.
© 2013 Columbia Management Investment Advisers, LLC. All rights reserved.
ANN154_08_C01_(10/13)
Annual Report
August 31, 2013

Columbia Greater China Fund
Not FDIC insured • No bank guarantee • May lose value
 Dear Shareholders,
A return to volatility
Volatility returned to the financial markets in the second quarter of 2013, as uncertainty about the global economy, monetary policy and the impact of the sequester's spending cuts weighed on investors. Households advanced their spending but also allocated less to savings. Labor markets continued to crank out jobs at a steady pace, slowly reducing unemployment. Housing activity remained strong and retail sales were higher despite no real increase in income. The single weak spot was in the manufacturing sector, where activity slowed. While the consumer has weathered the domestic drag well, business has been closer to the global slowdown and effects of sequestration. Businesses remain very cautious, keeping inventories and staffs lean, and are planning for but not yet confident enough to make capital expenditures.
Against this backdrop, equities outperformed fixed income during the second quarter of 2013. Small-cap stocks outperformed large- and mid-cap stocks, and growth outperformed value except for in the large-cap sector. Outside the United States, foreign stock markets generally lost ground, with the most significant losses sustained by emerging markets.
Columbia Management to begin delivering summary prospectuses
Each Columbia fund is required to update its prospectus on an annual basis. Beginning with June 2013 prospectus updates, shareholders of Columbia retail mutual funds will start to receive a summary prospectus, rather than the full length (statutory) mutual fund prospectus they have received in the past.
Each fund's summary prospectus will include the following key information:
> Investment objective
> Fee and expense table
> Portfolio turnover rate information
> Principal investment strategies, principal risks and performance information
> Management information
> Purchase and sale information
> Tax information
> Financial intermediary compensation information
Each fund's statutory prospectus will contain additional information about the fund and its risks. Both the statutory and summary prospectus will be updated each year, and will be available at columbiamanagement.com. Shareholders may request a printed version of a statutory prospectus at no cost by calling 800.345.6611 or sending an email to serviceinquiries@columbiamanagement.com.
Stay on track with Columbia Management
Backed by more than 100 years of experience, Columbia Management is one of the nation's largest asset managers. At the heart of our success — and, most importantly, that of our investors — are highly talented industry professionals, brought together by a unique way of working. We are dedicated to helping you take advantage of today's opportunities and anticipate tomorrow's. We stay abreast of the latest investment trends and ideas, using our collective insight to evaluate events and transform them into solutions you can use.
Visit columbiamanagement.com for:
> The Columbia Management Perspectives blog, featuring timely posts by our investment teams
> Detailed up-to-date fund performance and portfolio information
> Economic analysis and market commentary
> Quarterly fund commentaries
> Columbia Management Investor, our award-winning quarterly newsletter for shareholders
Thank you for your continued support of the Columbia Funds. We look forward to serving your investment needs for many years to come.
Best Regards,

J. Kevin Connaughton
President, Columbia Funds
Investors should consider the investment objectives, risks, charges and expenses of a mutual fund carefully before investing. For a free prospectus, which contains this and other important information about a fund, visit columbiamanagement.com. The prospectus should be read carefully before investing.
Columbia Funds are distributed by Columbia Management Investment Distributors, Inc., member FINRA, and managed by Columbia Management Investment Advisers, LLC.
© 2013 Columbia Management Investment Advisers, LLC. All rights reserved.
Columbia Greater China Fund
Performance Overview | | | 2 | | |
Manager Discussion of Fund Performance | | | 4 | | |
Understanding Your Fund's Expenses | | | 6 | | |
Portfolio of Investments | | | 7 | | |
Statement of Assets and Liabilities | | | 11 | | |
Statement of Operations | | | 13 | | |
Statement of Changes in Net Assets | | | 14 | | |
Financial Highlights | | | 16 | | |
Notes to Financial Statements | | | 24 | | |
Report of Independent Registered
Public Accounting Firm | | | 31 | | |
Federal Income Tax Information | | | 32 | | |
Trustees and Officers | | | 33 | | |
Board Consideration and Approval of Advisory Agreement | | | 36 | | |
Important Information About This Report | | | 41 | | |
Fund Investment Manager
Columbia Management Investment
Advisers, LLC
225 Franklin Street
Boston, MA 02110
Fund Distributor
Columbia Management Investment
Distributors, Inc.
225 Franklin Street
Boston, MA 02110
Fund Transfer Agent
Columbia Management Investment
Services Corp.
P.O. Box 8081
Boston, MA 02266-8081
For more information about any of the funds, please visit columbiamanagement.com or call 800.345.6611. Customer Service Representatives are available to answer your questions Monday through Friday from 8 a.m. to 8 p.m. Eastern time.
The views expressed in this report reflect the current views of the respective parties. These views are not guarantees of future performance and involve certain risks, uncertainties and assumptions that are difficult to predict, so actual outcomes and results may differ significantly from the views expressed. These views are subject to change at any time based upon economic, market or other conditions and the respective parties disclaim any responsibility to update such views. These views may not be relied on as investment advice and, because investment decisions for a Columbia Fund are based on numerous factors, may not be relied on as an indication of trading intent on behalf of any particular Columbia Fund. References to specific securities should not be construed as a recommendation or investment advice.
Annual Report 2013
Columbia Greater China Fund
Performance Summary
> Columbia Greater China Fund (the Fund) Class A shares returned 17.24% excluding sales charges for the 12-month period that ended August 31, 2013.
> The Fund outperformed its two benchmarks, the MSCI China Index (Net) and the Hang Seng Index, which returned 14.07% and 11.56%, respectively, during the same 12 months.
> Strong stock selection, particularly in the consumer discretionary and health care sectors, helped drive the Fund's performance.
Average Annual Total Returns (%) (for period ended August 31, 2013)
| | Inception | | 1 Year | | 5 Years | | 10 Years | |
Class A | | 05/16/97 | | | | | | | | | | | | | |
Excluding sales charges | | | | | | | 17.24 | | | | 3.41 | | | | 12.41 | | |
Including sales charges | | | | | | | 10.49 | | | | 2.19 | | | | 11.75 | | |
Class B | | 05/16/97 | | | | | | | | | | | | | |
Excluding sales charges | | | | | | | 16.36 | | | | 2.63 | | | | 11.58 | | |
Including sales charges | | | | | | | 11.36 | | | | 2.27 | | | | 11.58 | | |
Class C | | 05/16/97 | | | | | | | | | | | | | |
Excluding sales charges | | | | | | | 16.33 | | | | 2.64 | | | | 11.57 | | |
Including sales charges | | | | | | | 15.33 | | | | 2.64 | | | | 11.57 | | |
Class I* | | 08/02/11 | | | 17.75 | | | | 3.61 | | | | 12.52 | | |
Class R4* | | 03/19/13 | | | 17.36 | | | | 3.43 | | | | 12.42 | | |
Class R5* | | 11/08/12 | | | 17.61 | | | | 3.47 | | | | 12.45 | | |
Class W* | | 06/18/12 | | | 17.30 | | | | 3.43 | | | | 12.42 | | |
Class Z | | 05/16/97 | | | 17.54 | | | | 3.67 | | | | 12.71 | | |
MSCI China Index (Net) | | | | | | | 14.07 | | | | 2.77 | | | | 14.84 | | |
Hang Seng Index | | | | | | | 11.56 | | | | 0.56 | | | | 7.20 | | |
Returns for Class A are shown with and without the maximum initial sales charge of 5.75%. Returns for Class B are shown with and without the applicable contingent deferred sales charge (CDSC) of 5.00% in the first year, declining to 1.00% in the sixth year and eliminated thereafter. Returns for Class C are shown with and without the 1.00% CDSC for the first year only. The Fund's other classes are not subject to sales charges and have limited eligibility. Please see the Fund's prospectus for details. Performance for different share classes will vary based on differences in sales charges and fees associated with each class. All results shown assume reinvestment of distributions during the period. Returns do not reflect the deduction of taxes that a shareholder may pay on Fund distributions or on the redemption of Fund shares. Performance results reflect the effect of any fee waivers or reimbursements of Fund expenses by Columbia Management Investment Advisers, LLC and/or any of its affiliates. Absent these fee waivers or expense reimbursement arrangements, performance results would have been lower.
The performance information shown represents past performance and is not a guarantee of future results. The investment return and principal value of your investment will fluctuate so that your shares, when redeemed, may be worth more or less than their original cost. Current performance may be lower or higher than the performance information shown. You may obtain performance information current to the most recent month-end by contacting your financial intermediary, visiting columbiamanagement.com or calling 800.345.6611.
* The returns shown for periods prior to the share class inception date (including returns for the Life of the Fund, if shown, which are since Fund inception) include the returns of the Fund's oldest share class. Since the Fund launched more than one share class at its inception, Class A shares were used. These returns are adjusted to reflect any higher class-related operating expenses of the newer share classes, as applicable. Please visit columbiamanagement.com/mutual-funds/appended-performance for more information.
The MSCI China Index (Net) is designed to broadly and fairly represent the full diversity of business activities in China. This index aims to capture 85% of the free float adjusted market capitalization in each industry group.
The Hang Seng Index tracks the performance of approximately 70% of the total market capitalization of the stock exchange of Hong Kong.
Indices are not available for investment, are not professionally managed and do not reflect sales charges, fees, brokerage commissions, taxes or other expenses of investing. Securities in the Fund may not match those in an index.
Annual Report 2013
2
Columbia Greater China Fund
Performance Overview (continued)
Performance of a Hypothetical $10,000 Investment (September 1, 2003 – August 31, 2013)
The chart above shows the change in value of a hypothetical $10,000 investment in Class A shares of Columbia Greater China Fund during the stated time period, and does not reflect the deduction of taxes that a shareholder may pay on Fund distributions or on the redemption of Fund shares.
Annual Report 2013
3
Columbia Greater China Fund
Manager Discussion of Fund Performance
For the 12-month period that ended August 31, 2013, the Fund's Class A shares returned 17.24% excluding sales charges. The Fund outperformed its benchmarks, the MSCI China Index (Net) and the Hang Seng Index, which returned 14.07% and 11.56%, respectively, for the same 12-month period. Stock selection drove the Fund's performance higher than the benchmarks, with selections in the consumer discretionary and health care sectors performing particularly well, despite some disappointments from a few holdings.
Shifting Trends Moved Chinese Stocks Throughout the Period
While Chinese equities delivered healthy returns over the 12 months ended August 31, 2013, the overall numbers masked significant short-term volatility in reaction to varying government policy emphases, a continuing cycle of inventory de-stocking and re-stocking by Chinese companies and changing global equity market sentiment. In the early months of the period, stocks rallied in response to government stimulus aimed at reversing slowing economic trends. However, equity prices fell between January and June 2013. The decline was caused both because of worries of a potential economic hard landing and because of concerns that global economic growth might slow if the U.S. Federal Reserve started removing monetary stimulus. However, stocks rallied again from June through August on improved export sales, stable consumer spending and rising confidence that the new government had stabilized growth.
Yet, the period ended with continuing longer-term concerns about structural problems in the Chinese economy, and investors anticipated new economic reforms expected to emerge from a government economic planning meeting in November 2013. Among the issues of concern were crony capitalism, high local government debt level, growing wealth inequality, an aging population and a shrinking young labor force.
Stock Selection Helped Propel Strong Results
In a volatile period for Chinese equities, we maintained a focus on individual stock picking, while keeping the portfolio defensively positioned by emphasizing companies with more stable, less cyclical earnings characteristics. Investments in the consumer discretionary and health care sectors performed particularly well. An overweight in technology relative to the MSCI China Index also helped relative returns, as did an underweight in the materials and telecommunication services sectors. Among consumer discretionary holdings, the top performer was Great Wall Motor, an automotive company whose line of reasonably priced sports utility vehicles gained market share by appealing to the growing number of Chinese consumers looking for alternatives to sedans. Vipshop Holdings, an Internet retailer focused on discount-priced apparel, also did well, benefiting from rapid growth in e-commerce in China. Fast-food restaurant chain Tsui Wah Holdings and Macau casino operator Galaxy Entertainment also gave significant support to results. Health care holdings benefited from long-term demographic trends, including the aging of China's population, and we had solid results from several pharmaceutical company selections, including CSPC Pharmaceutical Group, Sino Biopharmaceutical, Wuxi Pharmaceutical Technology and China Medical Systems. In the financials sector, our decision to de-emphasize banks and focus on real estate companies proved timely, as many developers benefited from pent-up demand for housing and a shortage of available housing due to previous regulatory controls. Real estate company China Vanke was the Fund's top overall contributor to results.
Portfolio Management
Jasmine (Weili) Huang, CFA, CPA (U.S. and China), CFM
Morningstar Style BoxTM

The Morningstar Style BoxTM is based on a fund's portfolio holdings. For equity funds, the vertical axis shows the market capitalization of the stocks owned, and the horizontal axis shows investment style (value, blend, or growth). Information shown is based on the most recent data provided by Morningstar.
©2013 Morningstar, Inc. All rights reserved. The Morningstar information contained herein: (1) is proprietary to Morningstar and/or its content providers; (2) may not be copied or distributed; and (3) is not warranted to be accurate, complete or timely. Neither Morningstar nor its content providers are responsible for any damages or losses arising from any use of this information.
Top Ten Holdings (%)
(at August 31, 2013) | |
Tencent Holdings Ltd. | | | 8.3 | | |
CNOOC Ltd. | | | 8.0 | | |
Industrial & Commercial Bank of
China Ltd., Class H | | | 6.6 | | |
China Mobile Ltd. | | | 6.3 | | |
China Vanke Co., Ltd., Class B | | | 5.4 | | |
China Construction Bank Corp., Class H | | | 5.1 | | |
China Overseas Land &
Investment Ltd. | | | 3.3 | | |
Ping An Insurance Group Co. of
China Ltd., Class H | | | 3.0 | | |
China Life Insurance Co., Ltd., Class H | | | 2.9 | | |
Great Wall Motor Co., Ltd., Class H | | | 2.5 | | |
Percentages indicated are based upon total investments (excluding Money Market Funds).
For further detail about these holdings, please refer to the section entitled "Portfolio of Investments."
Fund holdings are as of the date given, are subject to change at any time, and are not recommendations to buy or sell any security.
Annual Report 2013
4
Columbia Greater China Fund
Manager Discussion of Fund Performance (continued)
Shifting Priorities Hurt Some Holdings
Despite the overall good results from the Fund's consumer discretionary holdings, men's retailer Trinity, was the single most influential detractor from performance relative to the MSCI China Index. Trinity's emphasis on higher-priced, name-brand menswear proved to be a disadvantage as the Chinese government cracked down on corruption among China's elite and encouraged less conspicuous buying habits. We sold the investment in Trinity but retained a position in another disappointing performer, coal company China Shenua Energy. Coal miners were hard hit by falling prices for the commodity as China began emphasizing other energy sources and rising coal supply, but we held China Shenhua because of its high quality of assets with an integrated portfolio in coal mining, power generation and a strong coal logistics network with the potential to drive a more sustainable earning's profile.
Looking Ahead
We currently believe that China is in a transition period and will see positive, but more modest, growth than that of the last two decades. The new government has been emphasizing that the country will extract a "reform dividend" from the economy. This also implies that China's new leadership is increasingly willing to accept a slower economic growth rate to accommodate reforms to rebuild a foundation for a more sustainable and better quality of growth. We expect that the government is likely to push out reforms in areas such as financial market, fiscal reform and residency reform over time. We will be watching carefully for the government announcement of new economic reform measures during the upcoming economic planning meeting in November 2013.
Overall, we remain focused on individual company analysis and stock-selection, and we would like to emphasize that we continue to see significant opportunities within the backdrop of China's dynamic economic changes, even in a slower growth environment. We see substantial investment opportunities, especially in the consumer discretionary, health care, logistics and Internet areas. E-commerce, in particular, has become a high-growth industry, and we expect e-commerce sales as a percentage of total retail sales in China to soon surpass the United States. As bottom-up investors, we welcome this kind of treasure hunt opportunity that has historically made investing in China so exciting.
Country Breakdown (%)
(at August 31, 2013) | |
China | | | 88.5 | | |
Hong Kong | | | 9.7 | | |
Taiwan | | | 0.9 | | |
United States(a) | | | 0.9 | | |
Total | | | 100.0 | | |
Percentages indicated are based upon total investments. The Fund's portfolio composition is subject to change.
(a) Includes investments in Money Market Funds.
Investment Risks
International investments involve greater potential risks, including less regulation, currency fluctuations, economic instability and political developments. The Fund's concentration in a specific geographic region may also result in increased volatility. See the Fund's prospectus for information on these and other risks.
Annual Report 2013
5
Columbia Greater China Fund
Understanding Your Fund's Expenses
(Unaudited)
As an investor, you incur two types of costs. There are transaction costs, which generally include sales charges on purchases and may include redemption fees. There are also ongoing costs, which generally include management fees, distribution and service (Rule 12b-1) fees, and other fund expenses. The following information is intended to help you understand your ongoing costs (in dollars) of investing in the Fund and to help you compare these costs with the ongoing costs of investing in other mutual funds.
Analyzing Your Fund's Expenses
To illustrate these ongoing costs, we have provided examples and calculated the expenses paid by investors in each share class of the Fund during the period. The actual and hypothetical information in the table is based on an initial investment of $1,000 at the beginning of the period indicated and held for the entire period. Expense information is calculated two ways and each method provides you with different information. The amount listed in the "Actual" column is calculated using the Fund's actual operating expenses and total return for the period. You may use the Actual information, together with the amount invested, to estimate the expenses that you paid over the period. Simply divide your account value by $1,000 (for example, an $8,600 account value divided by $1,000 = 8.6), then multiply the results by the expenses paid during the period under the Actual column. The amount listed in the "Hypothetical" column assumes a 5% annual rate of return before expenses (which is not the Fund's actual return) and then applies the Fund's actual expense ratio for the period to the hypothetical return. You should not use the hypothetical account values and expenses to estimate either your actual account balance at the end of the period or the expenses you paid during the period. See "Compare With Other Funds" below for details on how to use the hypothetical data.
Compare With Other Funds
Since all mutual funds are required to include the same hypothetical calculations about expenses in shareholder reports, you can use this information to compare the ongoing cost of investing in the Fund with other funds. To do so, compare the hypothetical example with the 5% hypothetical examples that appear in the shareholder reports of other funds. As you compare hypothetical examples of other funds, it is important to note that hypothetical examples are meant to highlight the ongoing costs of investing in a fund only and do not reflect any transaction costs, such as sales charges, or redemption or exchange fees. Therefore, the hypothetical calculations are useful in comparing ongoing costs only, and will not help you determine the relative total costs of owning different funds. If transaction costs were included in these calculations, your costs would be higher.
March 1, 2013 – August 31, 2013
| | Account Value at the Beginning
of the Period ($) | | Account Value at the End of the
Period ($) | | Expenses Paid During the
Period ($) | | Fund's Annualized
Expense Ratio (%) | |
| | Actual | | Hypothetical | | Actual | | Hypothetical | | Actual | | Hypothetical | | Actual | |
Class A | | | 1,000.00 | | | | 1,000.00 | | | | 1,001.00 | | | | 1,017.25 | | | | 7.83 | | | | 7.89 | | | | 1.56 | | |
Class B | | | 1,000.00 | | | | 1,000.00 | | | | 997.40 | | | | 1,013.49 | | | | 11.57 | | | | 11.66 | | | | 2.31 | | |
Class C | | | 1,000.00 | | | | 1,000.00 | | | | 997.20 | | | | 1,013.49 | | | | 11.57 | | | | 11.66 | | | | 2.31 | | |
Class I | | | 1,000.00 | | | | 1,000.00 | | | | 1,003.30 | | | | 1,019.55 | | | | 5.52 | | | | 5.57 | | | | 1.10 | | |
Class R4 | | | 1,000.00 | | | | 1,000.00 | | | | 1,051.70 | * | | | 1,018.45 | | | | 6.05 | * | | | 6.68 | | | | 1.32 | * | |
Class R5 | | | 1,000.00 | | | | 1,000.00 | | | | 1,003.10 | | | | 1,019.20 | | | | 5.88 | | | | 5.92 | | | | 1.17 | | |
Class W | | | 1,000.00 | | | | 1,000.00 | | | | 1,001.40 | | | | 1,017.65 | | | | 7.43 | | | | 7.49 | | | | 1.48 | | |
Class Z | | | 1,000.00 | | | | 1,000.00 | | | | 1,002.40 | | | | 1,018.50 | | | | 6.58 | | | | 6.63 | | | | 1.31 | | |
*For the period March 19, 2013 through August 31, 2013. Class R4 shares commenced operations on March 19, 2013.
Expenses paid during the period are equal to the annualized expense ratio for each class as indicated above, multiplied by the average account value over the period and then multiplied by the number of days in the Fund's most recent fiscal half year and divided by 365.
Expenses do not include fees and expenses incurred indirectly by the Fund from the underlying funds in which the Fund may invest (also referred to as "acquired funds"), including affiliated and non-affiliated pooled investment vehicles (including mutual funds and exchange-traded funds).
Annual Report 2013
6
Columbia Greater China Fund
Portfolio of Investments
August 31, 2013
(Percentages represent value of investments compared to net assets)
Common Stocks 99.4%
Issuer | | Shares | | Value ($) | |
Consumer Discretionary 14.3% | |
Automobiles 2.5% | |
Great Wall Motor Co., Ltd., Class H | | | 889,000 | | | | 4,505,932 | | |
Diversified Consumer Services 1.7% | |
New Oriental Education & Technology
Group, ADR | | | 143,135 | | | | 3,038,756 | | |
Hotels, Restaurants & Leisure 3.6% | |
Galaxy Entertainment Group Ltd.(a) | | | 457,000 | | | | 2,768,854 | | |
Sands China Ltd. | | | 366,800 | | | | 2,102,133 | | |
Tsui Wah Holdings Ltd. | | | 2,868,000 | | | | 1,758,844 | | |
Total | | | | | 6,629,831 | | |
Household Durables 1.1% | |
Haier Electronics Group Co., Ltd. | | | 1,113,000 | | | | 1,943,738 | | |
Internet & Catalog Retail 2.0% | |
Vipshop Holdings Ltd., ADS(a) | | | 82,286 | | | | 3,562,984 | | |
Multiline Retail 0.5% | |
Lifestyle International Holdings Ltd. | | | 435,500 | | | | 936,074 | | |
Specialty Retail 0.9% | |
Sa Sa International Holdings Ltd. | | | 1,566,000 | | | | 1,673,823 | | |
Textiles, Apparel & Luxury Goods 2.0% | |
Anta Sports Products Ltd. | | | 1,361,000 | | | | 1,754,304 | | |
Li Ning Co., Ltd.(a) | | | 662,500 | | | | 498,939 | | |
Luthai Textile Co., Ltd., Class B | | | 1,172,326 | | | | 1,376,271 | | |
Total | | | | | 3,629,514 | | |
Total Consumer Discretionary | | | | | 25,920,652 | | |
Consumer Staples 4.9% | |
Food & Staples Retailing 1.1% | |
Sun Art Retail Group Ltd. | | | 1,390,000 | | | | 1,889,737 | | |
Food Products 1.9% | |
China Mengniu Dairy Co., Ltd. | | | 560,000 | | | | 2,365,617 | | |
Want Want China Holdings Ltd. | | | 732,000 | | | | 1,082,256 | | |
Total | | | | | 3,447,873 | | |
Personal Products 1.9% | |
Hengan International Group Co., Ltd. | | | 158,500 | | | | 1,732,017 | | |
Prince Frog International Holdings Ltd. | | | 2,854,000 | | | | 1,781,319 | | |
Total | | | | | 3,513,336 | | |
Total Consumer Staples | | | | | 8,850,946 | | |
Common Stocks (continued)
Issuer | | Shares | | Value ($) | |
Energy 13.5% | |
Energy Equipment & Services 0.3% | |
Termbray Petro-King Oilfield
Services Ltd.(a) | | | 1,227,000 | | | | 650,016 | | |
Oil, Gas & Consumable Fuels 13.2% | |
China Petroleum & Chemical Corp.,
Class H | | | 5,126,000 | | | | 3,691,131 | | |
China Shenhua Energy Co., Ltd.,
Class H | | | 1,247,500 | | | | 3,863,908 | | |
CNOOC Ltd. | | | 7,333,500 | | | | 14,500,470 | | |
PetroChina Co., Ltd., Class H | | | 1,668,000 | | | | 1,815,474 | | |
Total | | | | | 23,870,983 | | |
Total Energy | | | | | 24,520,999 | | |
Financials 32.1% | |
Capital Markets 1.7% | |
Haitong Securities Co., Ltd., Class H | | | 2,184,400 | | | | 3,148,772 | | |
Commercial Banks 14.6% | |
Bank of China Ltd., Class H | | | 8,578,000 | | | | 3,596,901 | | |
BOC Hong Kong Holdings Ltd. | | | 604,500 | | | | 1,900,939 | | |
China Construction Bank Corp.,
Class H | | | 12,591,340 | | | | 9,184,572 | | |
Industrial & Commercial Bank of
China Ltd., Class H | | | 18,076,000 | | | | 11,820,002 | | |
Total | | | | | 26,502,414 | | |
Insurance 5.9% | |
China Life Insurance Co., Ltd., Class H | | | 2,176,000 | | | | 5,316,737 | | |
Ping An Insurance Group Co. of
China Ltd., Class H | | | 766,000 | | | | 5,349,044 | | |
Total | | | | | 10,665,781 | | |
Real Estate Management & Development 9.9% | |
China Overseas Land & Investment Ltd. | | | 2,012,320 | | | | 5,971,659 | | |
China Vanke Co., Ltd., Class B | | | 4,896,710 | | | | 9,807,840 | | |
Wharf Holdings Ltd. | | | 265,000 | | | | 2,168,745 | | |
Total | | | | | 17,948,244 | | |
Total Financials | | | | | 58,265,211 | | |
Health Care 4.3% | |
Health Care Equipment & Supplies 0.4% | |
St. Shine Optical Co., Ltd. | | | 27,000 | | | | 731,486 | | |
The accompanying Notes to Financial Statements are an integral part of this statement.
Annual Report 2013
7
Columbia Greater China Fund
Portfolio of Investments (continued)
August 31, 2013
Common Stocks (continued)
Issuer | | Shares | | Value ($) | |
Life Sciences Tools & Services 1.6% | |
WuXi PharmaTech (Cayman), Inc. ADR(a) | | | 125,122 | | | | 3,002,928 | | |
Pharmaceuticals 2.3% | |
CSPC Pharmaceutical Group Ltd. | | | 5,748,000 | | | | 2,992,473 | | |
Sino Biopharmaceutical | | | 1,556,000 | | | | 1,108,895 | | |
Total | | | | | 4,101,368 | | |
Total Health Care | | | | | 7,835,782 | | |
Industrials 5.5% | |
Construction & Engineering 1.3% | |
China Communications
Construction Co., Ltd., Class H | | | 3,006,000 | | | | 2,292,264 | | |
Electrical Equipment 1.1% | |
Zhuzhou CSR Times Electric Co., Ltd.,
Class H | | | 636,000 | | | | 1,997,191 | | |
Industrial Conglomerates 0.5% | |
Hutchison Whampoa Ltd. | | | 70,000 | | | | 809,150 | | |
Machinery 0.7% | |
CIMC Enric Holdings Ltd. | | | 1,272,000 | | | | 1,324,557 | | |
Road & Rail 1.0% | |
Guangshen Railway Co., Ltd., Class H | | | 3,948,000 | | | | 1,892,210 | | |
Transportation Infrastructure 0.9% | |
China Merchants Holdings
International Co., Ltd. | | | 504,000 | | | | 1,695,434 | | |
Total Industrials | | | | | 10,010,806 | | |
Information Technology 13.5% | |
Computers & Peripherals 1.1% | |
Lenovo Group Ltd. | | | 2,034,000 | | | | 1,961,480 | | |
Electronic Equipment, Instruments & Components 1.0% | |
Tong Hsing Electronic Industries Ltd. | | | 159,000 | | | | 819,728 | | |
Wasion Group Holdings Ltd. | | | 1,550,000 | | | | 954,608 | | |
Total | | | | | 1,774,336 | | |
Internet Software & Services 11.4% | |
Baidu, Inc., ADR(a) | | | 23,786 | | | | 3,223,717 | | |
SINA Corp.(a) | | | 32,719 | | | | 2,533,105 | | |
Tencent Holdings Ltd. | | | 318,600 | | | | 14,879,350 | | |
Total | | | | | 20,636,172 | | |
Total Information Technology | | | | | 24,371,988 | | |
Common Stocks (continued)
Issuer | | Shares | | Value ($) | |
Materials 1.1% | |
Construction Materials 0.6% | |
Anhui Conch Cement Co., Ltd., Class H | | | 366,500 | | | | 1,178,551 | | |
Metals & Mining 0.5% | |
Jiangxi Copper Co., Ltd., Class H | | | 427,000 | | | | 818,466 | | |
Total Materials | | | | | 1,997,017 | | |
Telecommunication Services 6.3% | |
Wireless Telecommunication Services 6.3% | |
China Mobile Ltd. | | | 1,053,500 | | | | 11,354,321 | | |
Total Telecommunication Services | | | | | 11,354,321 | | |
Utilities 3.9% | |
Gas Utilities 1.3% | |
ENN Energy Holdings Ltd. | | | 484,000 | | | | 2,398,294 | | |
Independent Power Producers & Energy Traders 1.6% | |
China Resources Power Holdings Co., Ltd. | | | 402,000 | | | | 920,570 | | |
Huaneng Power International, Inc.,
Class H | | | 2,068,000 | | | | 2,055,989 | | |
Total | | | | | 2,976,559 | | |
Water Utilities 1.0% | |
Guangdong Investment Ltd. | | | 2,110,000 | | | | 1,744,571 | | |
Total Utilities | | | | | 7,119,424 | | |
Total Common Stocks
(Cost: $115,661,601) | | | | | 180,247,146 | | |
Money Market Funds 0.9%
Columbia Short-Term Cash Fund,
0.097%(b)(c) | | | 1,703,539 | | | | 1,703,539 | | |
Total Money Market Funds
(Cost: $1,703,539) | | | | | 1,703,539 | | |
Total Investments
(Cost: $117,365,140) | | | | | 181,950,685 | | |
Other Assets & Liabilities, Net | | | | | (599,953 | ) | |
Net Assets | | | | | 181,350,732 | | |
Notes to Portfolio of Investments
(a) Non-income producing.
(b) The rate shown is the seven-day current annualized yield at August 31, 2013.
The accompanying Notes to Financial Statements are an integral part of this statement.
Annual Report 2013
8
Columbia Greater China Fund
Portfolio of Investments (continued)
August 31, 2013
Notes to Portfolio of Investments (continued)
(c) As defined in the Investment Company Act of 1940, an affiliated company is one in which the Fund owns 5% or more of its outstanding voting securities, or a company which is under common ownership or control with the Fund. Holdings and transactions in these affiliated companies during the year ended August 31, 2013, are as follows:
Issuer | | Beginning
Cost ($) | | Purchase
Cost ($) | | Proceeds
From Sales ($) | | Ending
Cost ($) | | Dividends —
Affiliated
Issuers ($) | | Value ($) | |
Columbia Short-Term Cash Fund | | | 1,577,521 | | | | 62,147,293 | | | | (62,021,275 | ) | | | 1,703,539 | | | | 1,802 | | | | 1,703,539 | | |
Abbreviation Legend
ADR American Depositary Receipt
ADS American Depositary Share
Fair Value Measurements
Generally accepted accounting principles (GAAP) require disclosure regarding the inputs and valuation techniques used to measure fair value and any changes in valuation inputs or techniques. In addition, investments shall be disclosed by major category.
The Fund categorizes its fair value measurements according to a three-level hierarchy that maximizes the use of observable inputs and minimizes the use of unobservable inputs by prioritizing that the most observable input be used when available. Observable inputs are those that market participants would use in pricing an investment based on market data obtained from sources independent of the reporting entity. Unobservable inputs are those that reflect the Fund's assumptions about the information market participants would use in pricing an investment. An investment's level within the fair value hierarchy is based on the lowest level of any input that is deemed significant to the asset or liability's fair value measurement. The input levels are not necessarily an indication of the risk or liquidity associated with investments at that level. For example, certain U.S. government securities are generally high quality and liquid, however, they are reflected as Level 2 because the inputs used to determine fair value may not always be quoted prices in an active market.
Fair value inputs are summarized in the three broad levels listed below:
> Level 1 — Valuations based on quoted prices for investments in active markets that the Fund has the ability to access at the measurement date (including NAV for open-end mutual funds). Valuation adjustments are not applied to Level 1 investments.
> Level 2 — Valuations based on other significant observable inputs (including quoted prices for similar securities, interest rates, prepayment speeds, credit risks, etc.).
> Level 3 — Valuations based on significant unobservable inputs (including the Fund's own assumptions and judgment in determining the fair value of investments).
Inputs that are used in determining fair value of an investment may include price information, credit data, volatility statistics, and other factors. These inputs can be either observable or unobservable. The availability of observable inputs can vary between investments, and is affected by various factors such as the type of investment, and the volume and level of activity for that investment or similar investments in the marketplace. The inputs will be considered by the Investment Manager, along with any other relevant factors in the calculation of an investment's fair value. The Fund uses prices and inputs that are current as of the measurement date, which may include periods of market dislocations. During these periods, the availability of prices and inputs may be reduced for many investments. This condition could cause an investment to be reclassified between the various levels within the hierarchy.
Foreign equity securities actively traded in markets where there is a significant delay in the local close relative to the New York Stock Exchange (NYSE) are classified as Level 2. The values of these securities may include an adjustment to reflect the impact of significant market movements following the close of local trading, as described in Note 2 to the financial statements — Security Valuation.
Investments falling into the Level 3 category are primarily supported by quoted prices from brokers and dealers participating in the market for those investments. However, these may be classified as Level 3 investments due to lack of market transparency and corroboration to support these quoted prices. Additionally, valuation models may be used as the pricing source for any remaining investments classified as Level 3. These models may rely on one or more significant unobservable inputs and/or significant assumptions by the Investment Manager. Inputs used in valuations may include, but are not limited to, financial statement analysis, capital account balances, discount rates and estimated cash flows, and comparable company data.
Under the direction of the Fund's Board of Trustees (the Board), the Investment Manager's Valuation Committee (the Committee) is responsible for carrying out the valuation procedures approved by the Board. The Committee consists of voting and non-voting members from various groups within the Investment Manager's organization, including operations and accounting, trading and investments, compliance, risk management and legal.
The accompanying Notes to Financial Statements are an integral part of this statement.
Annual Report 2013
9
Columbia Greater China Fund
Portfolio of Investments (continued)
August 31, 2013
Fair Value Measurements (continued)
The Committee meets at least monthly to review and approve valuation matters, which may include a description of specific valuation determinations, data regarding pricing information received from approved pricing vendors and brokers and the results of Board-approved valuation control policies and procedures (the Policies). The Policies address, among other things, instances when market quotations are or are not readily available, including recommendations of third party pricing vendors and a determination of appropriate pricing methodologies; events that require specific valuation determinations and assessment of fair value techniques; securities with a potential for stale pricing, including those that are illiquid, restricted, or in default; and the effectiveness of third-party pricing vendors, including periodic reviews of vendors. The Committee meets more frequently, as needed, to discuss additional valuation matters, which may include the need to review back-testing results, review time-sensitive information or approve related valuation actions. The Committee reports to the Board, with members of the Committee meeting with the Board at each of its regularly scheduled meetings to discuss valuation matters and actions during the period, similar to those described earlier.
For investments categorized as Level 3, the Committee monitors information similar to that described above, which may include: (i) data specific to the issuer or comparable issuers, (ii) general market or specific sector news and (iii) quoted prices and specific or similar security transactions. The Committee considers this data and any changes from prior periods in order to assess the reasonableness of observable and unobservable inputs, any assumptions or internal models used to value those securities and changes in fair value. This data is also used to corroborate, when available, information received from approved pricing vendors and brokers. Various factors impact the frequency of monitoring this information (which may occur as often as daily). However, the Committee may determine that changes to inputs, assumptions and models are not required as a result of the monitoring procedures performed.
The following table is a summary of the inputs used to value the Fund's investments at August 31, 2013:
Description | | Level 1
Quoted Prices in Active
Markets for Identical
Assets ($) | | Level 2
Other Significant
Observable Inputs ($) | | Level 3
Significant
Unobservable Inputs ($) | | Total ($) | |
Equity Securities | |
Common Stocks | |
Consumer Discretionary | | | 6,601,740 | | | | 19,318,912 | | | | — | | | | 25,920,652 | | |
Consumer Staples | | | — | | | | 8,850,946 | | | | — | | | | 8,850,946 | | |
Energy | | | — | | | | 24,520,999 | | | | — | | | | 24,520,999 | | |
Financials | | | — | | | | 58,265,211 | | | | — | | | | 58,265,211 | | |
Health Care | | | 3,002,928 | | | | 4,832,854 | | | | — | | | | 7,835,782 | | |
Industrials | | | — | | | | 10,010,806 | | | | — | | | | 10,010,806 | | |
Information Technology | | | 5,756,822 | | | | 18,615,166 | | | | — | | | | 24,371,988 | | |
Materials | | | — | | | | 1,997,017 | | | | — | | | | 1,997,017 | | |
Telecommunication Services | | | — | | | | 11,354,321 | | | | — | | | | 11,354,321 | | |
Utilities | | | — | | | | 7,119,424 | | | | — | | | | 7,119,424 | | |
Total Equity Securities | | | 15,361,490 | | | | 164,885,656 | | | | — | | | | 180,247,146 | | |
Mutual Funds | |
Money Market Funds | | | 1,703,539 | | | | — | | | | — | | | | 1,703,539 | | |
Total Mutual Funds | | | 1,703,539 | | | | — | | | | — | | | | 1,703,539 | | |
Total | | | 17,065,029 | | | | 164,885,656 | | | | — | | | | 181,950,685 | | |
See the Portfolio of Investments for all investment classifications not indicated in the table.
The Fund's assets assigned to the Level 2 input category are generally valued using the market approach, in which a security's value is determined through reference to prices and information from market transactions for similar or identical assets. These assets include certain foreign securities for which a third party statistical pricing service may be employed for purposes of fair market valuation. The models utilized by the third party statistical pricing service take into account a security's correlation to available market data including, but not limited to, intraday index, ADR, and ETF movements.
There were no transfers of financial assets between Levels 1 and 2 during the period.
The accompanying Notes to Financial Statements are an integral part of this statement.
Annual Report 2013
10
Columbia Greater China Fund
Statement of Assets and Liabilities
August 31, 2013
Assets | |
Investments, at value | |
Unaffiliated issuers (identified cost $115,661,601) | | $ | 180,247,146 | | |
Affiliated issuers (identified cost $1,703,539) | | | 1,703,539 | | |
Total investments (identified cost $117,365,140) | | | 181,950,685 | | |
Foreign currency (identified cost $0) | | | 680,351 | | |
Receivable for: | |
Investments sold | | | 1,345,772 | | |
Capital shares sold | | | 46,770 | | |
Dividends | | | 164,677 | | |
Prepaid expenses | | | 2,298 | | |
Trustees' deferred compensation plan | | | 31,137 | | |
Total assets | | | 184,221,690 | | |
Liabilities | |
Payable for: | |
Investments purchased | | | 2,586,961 | | |
Capital shares purchased | | | 166,202 | | |
Investment management fees | | | 4,424 | | |
Distribution and/or service fees | | | 1,116 | | |
Transfer agent fees | | | 23,115 | | |
Administration fees | | | 407 | | |
Chief compliance officer expenses | | | 52 | | |
Other expenses | | | 57,544 | | |
Trustees' deferred compensation plan | | | 31,137 | | |
Total liabilities | | | 2,870,958 | | |
Net assets applicable to outstanding capital stock | | $ | 181,350,732 | | |
Represented by | |
Paid-in capital | | $ | 102,410,440 | | |
Undistributed net investment income | | | 1,885,121 | | |
Accumulated net realized gain | | | 12,469,675 | | |
Unrealized appreciation (depreciation) on: | |
Investments | | | 64,585,545 | | |
Foreign currency translations | | | (49 | ) | |
Total — representing net assets applicable to outstanding capital stock | | $ | 181,350,732 | | |
The accompanying Notes to Financial Statements are an integral part of this statement.
Annual Report 2013
11
Columbia Greater China Fund
Statement of Assets and Liabilities (continued)
August 31, 2013
Class A | |
Net assets | | $ | 78,119,062 | | |
Shares outstanding | | | 1,600,790 | | |
Net asset value per share | | $ | 48.80 | | |
Maximum offering price per share(a) | | $ | 51.78 | | |
Class B | |
Net assets | | $ | 4,264,761 | | |
Shares outstanding | | | 92,239 | | |
Net asset value per share | | $ | 46.24 | | |
Class C | |
Net assets | | $ | 17,055,528 | | |
Shares outstanding | | | 363,315 | | |
Net asset value per share | | $ | 46.94 | | |
Class I | |
Net assets | | $ | 52,946,310 | | |
Shares outstanding | | | 1,032,030 | | |
Net asset value per share | | $ | 51.30 | | |
Class R4 | |
Net assets | | $ | 11,806 | | |
Shares outstanding | | | 228 | | |
Net asset value per share(b) | | $ | 51.71 | | |
Class R5 | |
Net assets | | $ | 2,649 | | |
Shares outstanding | | | 51 | | |
Net asset value per share(b) | | $ | 51.76 | | |
Class W | |
Net assets | | $ | 2,800 | | |
Shares outstanding | | | 57 | | |
Net asset value per share(b) | | $ | 48.82 | | |
Class Z | |
Net assets | | $ | 28,947,816 | | |
Shares outstanding | | | 565,872 | | |
Net asset value per share | | $ | 51.16 | | |
(a) The maximum offering price per share is calculated by dividing the net asset value per share by 1.0 minus the maximum sales charge of 5.75%.
(b) Net asset value per share rounds to this amount due to fractional shares outstanding.
The accompanying Notes to Financial Statements are an integral part of this statement.
Annual Report 2013
12
Columbia Greater China Fund
Statement of Operations
Year Ended August 31, 2013
Net investment income | |
Income: | |
Dividends — unaffiliated issuers | | $ | 5,653,049 | | |
Dividends — affiliated issuers | | | 1,802 | | |
Interest | | | 3 | | |
Income from securities lending — net | | | 35,173 | | |
Foreign taxes withheld | | | (455,532 | ) | |
Total income | | | 5,234,495 | | |
Expenses: | |
Investment management fees | | | 1,833,662 | | |
Distribution and/or service fees | |
Class A | | | 204,593 | | |
Class B | | | 52,588 | | |
Class C | | | 194,289 | | |
Class W | | | 7 | | |
Transfer agent fees | |
Class A | | | 165,196 | | |
Class B | | | 10,594 | | |
Class C | | | 39,186 | | |
Class R4(a) | | | 9 | | |
Class R5(b) | | | 1 | | |
Class W | | | 4 | | |
Class Z | | | 63,231 | | |
Administration fees | | | 168,613 | | |
Compensation of board members | | | 21,762 | | |
Custodian fees | | | 51,966 | | |
Printing and postage fees | | | 84,993 | | |
Registration fees | | | 75,740 | | |
Professional fees | | | 44,015 | | |
Chief compliance officer expenses | | | 174 | | |
Other | | | 21,776 | | |
Total expenses | | | 3,032,399 | | |
Expense reductions | | | (1,204 | ) | |
Total net expenses | | | 3,031,195 | | |
Net investment income | | | 2,203,300 | | |
Realized and unrealized gain (loss) — net | |
Net realized gain (loss) on: | |
Investments | | | 20,127,543 | | |
Foreign currency translations | | | (1,399 | ) | |
Net realized gain | | | 20,126,144 | | |
Net change in unrealized appreciation (depreciation) on: | |
Investments | | | 11,619,759 | | |
Foreign currency translations | | | (61 | ) | |
Net change in unrealized appreciation (depreciation) | | | 11,619,698 | | |
Net realized and unrealized gain | | | 31,745,842 | | |
Net increase in net assets resulting from operations | | $ | 33,949,142 | | |
(a) Class R4 shares are for the period from March 19, 2013 (commencement of operations) to August 31, 2013.
(b) Class R5 shares are for the period from November 8, 2012 (commencement of operations) to August 31, 2013.
The accompanying Notes to Financial Statements are an integral part of this statement.
Annual Report 2013
13
Columbia Greater China Fund
Statement of Changes in Net Assets
| | | Year Ended
August 31,
2013(a)(b) | | Year Ended
August 31,
2012(c) | |
Operations | |
Net investment income | | $ | 2,203,300 | | | $ | 2,585,556 | | |
Net realized gain (loss) | | | 20,126,144 | | | | (5,651,893 | ) | |
Net change in unrealized appreciation (depreciation) | | | 11,619,698 | | | | (24,883,712 | ) | |
Net increase (decrease) in net assets resulting from operations | | | 33,949,142 | | | | (27,950,049 | ) | |
Distributions to shareholders | |
Net investment income | |
Class A | | | (945,413 | ) | | | (95,694 | ) | |
Class B | | | (23,715 | ) | | | — | | |
Class C | | | (82,750 | ) | | | — | | |
Class I | | | (1,089,184 | ) | | | (315,543 | ) | |
Class R5 | | | (35 | ) | | | — | | |
Class W | | | (32 | ) | | | — | | |
Class Z | | | (413,305 | ) | | | (175,192 | ) | |
Net realized gains | |
Class A | | | — | | | | (4,895,233 | ) | |
Class B | | | — | | | | (571,491 | ) | |
Class C | | | — | | | | (1,483,438 | ) | |
Class I | | | — | | | | (4,251,213 | ) | |
Class Z | | | — | | | | (2,229,930 | ) | |
Total distributions to shareholders | | | (2,554,434 | ) | | | (14,017,734 | ) | |
Increase (decrease) in net assets from capital stock activity | | | (51,596,422 | ) | | | 29,558,357 | | |
Total decrease in net assets | | | (20,201,714 | ) | | | (12,409,426 | ) | |
Net assets at beginning of year | | | 201,552,446 | | | | 213,961,872 | | |
Net assets at end of year | | $ | 181,350,732 | | | $ | 201,552,446 | | |
Undistributed net investment income | | $ | 1,885,121 | | | $ | 2,503,442 | | |
(a) Class R4 shares are for the period from March 19, 2013 (commencement of operations) to August 31, 2013.
(b) Class R5 shares are for the period from November 8, 2012 (commencement of operations) to August 31, 2013.
(c) Class W shares are for the period from June 18, 2012 (commencement of operations) to August 31, 2012.
The accompanying Notes to Financial Statements are an integral part of this statement.
Annual Report 2013
14
Columbia Greater China Fund
Statement of Changes in Net Assets (continued)
| | | Year Ended August 31, 2013(a)(b) | | Year Ended August 31, 2012(c) | |
| | | Shares | | Dollars ($) | | Shares | | Dollars ($) | |
Capital stock activity | |
Class A shares | |
Subscriptions(d) | | | 237,091 | | | | 11,257,322 | | | | 263,332 | | | | 11,950,251 | | |
Distributions reinvested | | | 16,934 | | | | 816,550 | | | | 102,174 | | | | 4,132,927 | | |
Redemptions | | | (475,341 | ) | | | (22,538,902 | ) | | | (529,763 | ) | | | (23,675,554 | ) | |
Net decrease | | | (221,316 | ) | | | (10,465,030 | ) | | | (164,257 | ) | | | (7,592,376 | ) | |
Class B shares | |
Subscriptions | | | 105 | | | | 4,811 | | | | 2,747 | | | | 109,479 | | |
Distributions reinvested | | | 395 | | | | 18,146 | | | | 9,574 | | | | 369,086 | | |
Redemptions(d) | | | (52,861 | ) | | | (2,364,714 | ) | | | (141,425 | ) | | | (6,084,993 | ) | |
Net decrease | | | (52,361 | ) | | | (2,341,757 | ) | | | (129,104 | ) | | | (5,606,428 | ) | |
Class C shares | |
Subscriptions | | | 13,076 | | | | 607,853 | | | | 29,732 | | | | 1,258,930 | | |
Distributions reinvested | | | 1,279 | | | | 59,624 | | | | 26,356 | | | | 1,031,593 | | |
Redemptions | | | (154,682 | ) | | | (7,002,047 | ) | | | (167,590 | ) | | | (7,224,467 | ) | |
Net decrease | | | (140,327 | ) | | | (6,334,570 | ) | | | (111,502 | ) | | | (4,933,944 | ) | |
Class I shares | |
Subscriptions | | | 29,806 | | | | 1,423,893 | | | | 1,443,525 | | | | 72,093,909 | | |
Distributions reinvested | | | 21,555 | | | | 1,089,152 | | | | 107,856 | | | | 4,566,638 | | |
Redemptions | | | (592,463 | ) | | | (30,197,569 | ) | | | (325,529 | ) | | | (15,923,851 | ) | |
Net increase (decrease) | | | (541,102 | ) | | | (27,684,524 | ) | | | 1,225,852 | | | | 60,736,696 | | |
Class R4 shares | |
Subscriptions | | | 228 | | | | 11,108 | | | | — | | | | — | | |
Net increase | | | 228 | | | | 11,108 | | | | — | | | | — | | |
Class R5 shares | |
Subscriptions | | | 51 | | | | 2,500 | | | | — | | | | — | | |
Net increase | | | 51 | | | | 2,500 | | | | — | | | | — | | |
Class W shares | |
Subscriptions | | | — | | | | — | | | | 57 | | | | 2,500 | | |
Net increase | | | — | | | | — | | | | 57 | | | | 2,500 | | |
Class Z shares | |
Subscriptions | | | 201,119 | | | | 9,930,032 | | | | 108,920 | | | | 5,075,749 | | |
Distributions reinvested | | | 5,843 | | | | 294,856 | | | | 31,619 | | | | 1,337,189 | | |
Redemptions | | | (302,689 | ) | | | (15,009,037 | ) | | | (421,034 | ) | | | (19,461,029 | ) | |
Net decrease | | | (95,727 | ) | | | (4,784,149 | ) | | | (280,495 | ) | | | (13,048,091 | ) | |
Total net increase (decrease) | | | (1,050,554 | ) | | | (51,596,422 | ) | | | 540,551 | | | | 29,558,357 | | |
(a) Class R4 shares are for the period from March 19, 2013 (commencement of operations) to August 31, 2013.
(b) Class R5 shares are for the period from November 8, 2012 (commencement of operations) to August 31, 2013.
(c) Class W shares are for the period from June 18, 2012 (commencement of operations) to August 31, 2012.
(d) Includes conversions of Class B shares to Class A shares, if any.
The accompanying Notes to Financial Statements are an integral part of this statement.
Annual Report 2013
15
Columbia Greater China Fund
The following tables are intended to help you understand the Fund's financial performance. Certain information reflects financial results for a single share of a class held for the periods shown. Per share net investment income (loss) amounts are calculated based on average shares outstanding during the period. Total return assumes reinvestment of all dividends and distributions, if any. Total return does not reflect payment of sales charges, if any, and is not annualized for periods of less than one year.
| | | Year Ended August 31, | |
Class A | | 2013 | | 2012 | | 2011 | | 2010 | | 2009 | |
Per share data | |
Net asset value, beginning of period | | $ | 42.08 | | | $ | 51.02 | | | $ | 51.35 | | | $ | 44.30 | | | $ | 46.54 | | |
Income from investment operations: | |
Net investment income | | | 0.44 | | | | 0.50 | | | | 0.15 | | | | 0.17 | | | | 0.34 | | |
Net realized and unrealized gain (loss) | | | 6.81 | | | | (6.83 | ) | | | 1.05 | | | | 7.06 | | | | (2.08 | ) | |
Total from investment operations | | | 7.25 | | | | (6.33 | ) | | | 1.20 | | | | 7.23 | | | | (1.74 | ) | |
Less distributions to shareholders: | |
Net investment income | | | (0.53 | ) | | | (0.05 | ) | | | (0.17 | ) | | | (0.22 | ) | | | — | | |
Net realized gains | | | — | | | | (2.56 | ) | | | (1.36 | ) | | | — | | | | (0.54 | ) | |
Total distributions to shareholders | | | (0.53 | ) | | | (2.61 | ) | | | (1.53 | ) | | | (0.22 | ) | | | (0.54 | ) | |
Proceeds from regulatory settlements | | | — | | | | — | | | | — | | | | 0.03 | | | | 0.02 | | |
Redemption fees: | |
Redemption fees added to paid-in capital | | | — | | | | — | | | | — | | | | 0.01 | | | | 0.02 | | |
Net asset value, end of period | | $ | 48.80 | | | $ | 42.08 | | | $ | 51.02 | | | $ | 51.35 | | | $ | 44.30 | | |
Total return | | | 17.24 | % | | | (12.20 | %) | | | 2.03 | % | | | 16.42 | % | | | (3.30 | %) | |
Ratios to average net assets(a)(b) | |
Total gross expenses | | | 1.54 | % | | | 1.53 | % | | | 1.58 | %(c) | | | 1.62 | %(c) | | | 1.69 | %(c) | |
Total net expenses(d) | | | 1.54 | %(e) | | | 1.53 | %(e) | | | 1.58 | %(c)(e) | | | 1.62 | %(c)(e) | | | 1.69 | %(c)(e) | |
Net investment income | | | 0.94 | % | | | 1.11 | % | | | 0.26 | % | | | 0.33 | % | | | 0.96 | % | |
Supplemental data | |
Net assets, end of period (in thousands) | | $ | 78,119 | | | $ | 76,683 | | | $ | 101,344 | | | $ | 116,870 | | | $ | 122,314 | | |
Portfolio turnover | | | 39 | % | | | 38 | % | | | 36 | % | | | 23 | % | | | 39 | % | |
Notes to Financial Highlights
(a) In addition to the fees and expenses which the Fund bears directly, the Fund indirectly bears a pro rata share of the fees and expenses of the acquired funds in which it invests. Such indirect expenses are not included in the reported expense ratios.
(b) Certain line items from prior years have been reclassified to conform to the current presentation.
(c) Ratios include line of credit interest expense which rounds to less than 0.01%.
(d) Total net expenses include the impact of certain waivers/reimbursements made by the Investment Manager and certain of its affiliates, if applicable.
(e) The benefits derived from expense reductions had an impact of less than 0.01%.
The accompanying Notes to Financial Statements are an integral part of this statement.
Annual Report 2013
16
Columbia Greater China Fund
Financial Highlights (continued)
| | | Year Ended August 31, | |
Class B | | 2013 | | 2012 | | 2011 | | 2010 | | 2009 | |
Per share data | |
Net asset value, beginning of period | | $ | 39.90 | | | $ | 48.83 | | | $ | 49.42 | | | $ | 42.77 | | | $ | 45.29 | | |
Income from investment operations: | |
Net investment income (loss) | | | 0.04 | | | | 0.10 | | | | (0.28 | ) | | | (0.20 | ) | | | 0.07 | | |
Net realized and unrealized gain (loss) | | | 6.49 | | | | (6.47 | ) | | | 1.05 | | | | 6.81 | | | | (2.09 | ) | |
Total from investment operations | | | 6.53 | | | | (6.37 | ) | | | 0.77 | | | | 6.61 | | | | (2.02 | ) | |
Less distributions to shareholders: | |
Net investment income | | | (0.19 | ) | | | — | | | | — | | | | — | | | | — | | |
Net realized gains | | | — | | | | (2.56 | ) | | | (1.36 | ) | | | — | | | | (0.54 | ) | |
Total distributions to shareholders | | | (0.19 | ) | | | (2.56 | ) | | | (1.36 | ) | | | — | | | | (0.54 | ) | |
Proceeds from regulatory settlements | | | — | | | | — | | | | — | | | | 0.03 | | | | 0.02 | | |
Redemption fees: | |
Redemption fees added to paid-in capital | | | — | | | | — | | | | — | | | | 0.01 | | | | 0.02 | | |
Net asset value, end of period | | $ | 46.24 | | | $ | 39.90 | | | $ | 48.83 | | | $ | 49.42 | | | $ | 42.77 | | |
Total return | | | 16.36 | % | | | (12.86 | %) | | | 1.27 | % | | | 15.55 | % | | | (4.02 | %) | |
Ratios to average net assets(a)(b) | |
Total gross expenses | | | 2.29 | % | | | 2.28 | % | | | 2.33 | %(c) | | | 2.37 | %(c) | | | 2.44 | %(c) | |
Total net expenses(d) | | | 2.29 | %(e) | | | 2.28 | %(e) | | | 2.33 | %(c)(e) | | | 2.37 | %(c)(e) | | | 2.44 | %(c)(e) | |
Net investment income (loss) | | | 0.09 | % | | | 0.22 | % | | | (0.50 | %) | | | (0.42 | %) | | | 0.21 | % | |
Supplemental data | |
Net assets, end of period (in thousands) | | $ | 4,265 | | | $ | 5,769 | | | $ | 13,364 | | | $ | 16,718 | | | $ | 17,813 | | |
Portfolio turnover | | | 39 | % | | | 38 | % | | | 36 | % | | | 23 | % | | | 39 | % | |
Notes to Financial Highlights
(a) In addition to the fees and expenses which the Fund bears directly, the Fund indirectly bears a pro rata share of the fees and expenses of the acquired funds in which it invests. Such indirect expenses are not included in the reported expense ratios.
(b) Certain line items from prior years have been reclassified to conform to the current presentation.
(c) Ratios include line of credit interest expense which rounds to less than 0.01%.
(d) Total net expenses include the impact of certain waivers/reimbursements made by the Investment Manager and certain of its affiliates, if applicable.
(e) The benefits derived from expense reductions had an impact of less than 0.01%.
The accompanying Notes to Financial Statements are an integral part of this statement.
Annual Report 2013
17
Columbia Greater China Fund
Financial Highlights (continued)
| | | Year Ended August 31, | |
Class C | | 2013 | | 2012 | | 2011 | | 2010 | | 2009 | |
Per share data | |
Net asset value, beginning of period | | $ | 40.51 | | | $ | 49.52 | | | $ | 50.10 | | | $ | 43.36 | | | $ | 45.89 | | |
Income from investment operations: | |
Net investment income (loss) | | | 0.07 | | | | 0.14 | | | | (0.28 | ) | | | (0.21 | ) | | | 0.09 | | |
Net realized and unrealized gain (loss) | | | 6.55 | | | | (6.59 | ) | | | 1.06 | | | | 6.91 | | | | (2.12 | ) | |
Total from investment operations | | | 6.62 | | | | (6.45 | ) | | | 0.78 | | | | 6.70 | | | | (2.03 | ) | |
Less distributions to shareholders: | |
Net investment income | | | (0.19 | ) | | | — | | | | — | | | | — | | | | — | | |
Net realized gains | | | — | | | | (2.56 | ) | | | (1.36 | ) | | | — | | | | (0.54 | ) | |
Total distributions to shareholders | | | (0.19 | ) | | | (2.56 | ) | | | (1.36 | ) | | | — | | | | (0.54 | ) | |
Proceeds from regulatory settlements | | | — | | | | — | | | | — | | | | 0.03 | | | | 0.02 | | |
Redemption fees: | |
Redemption fees added to paid-in capital | | | — | | | | — | | | | — | | | | 0.01 | | | | 0.02 | | |
Net asset value, end of period | | $ | 46.94 | | | $ | 40.51 | | | $ | 49.52 | | | $ | 50.10 | | | $ | 43.36 | | |
Total return | | | 16.33 | % | | | (12.84 | %) | | | 1.28 | % | | | 15.54 | % | | | (3.99 | %) | |
Ratios to average net assets(a)(b) | |
Total gross expenses | | | 2.29 | % | | | 2.28 | % | | | 2.33 | %(c) | | | 2.37 | %(c) | | | 2.44 | %(c) | |
Total net expenses(d) | | | 2.29 | %(e) | | | 2.28 | %(e) | | | 2.33 | %(c)(e) | | | 2.37 | %(c)(e) | | | 2.44 | %(c)(e) | |
Net investment income (loss) | | | 0.15 | % | | | 0.33 | % | | | (0.50 | %) | | | (0.43 | %) | | | 0.24 | % | |
Supplemental data | |
Net assets, end of period (in thousands) | | $ | 17,056 | | | $ | 20,401 | | | $ | 30,461 | | | $ | 36,371 | | | $ | 36,395 | | |
Portfolio turnover | | | 39 | % | | | 38 | % | | | 36 | % | | | 23 | % | | | 39 | % | |
Notes to Financial Highlights
(a) In addition to the fees and expenses which the Fund bears directly, the Fund indirectly bears a pro rata share of the fees and expenses of the acquired funds in which it invests. Such indirect expenses are not included in the reported expense ratios.
(b) Certain line items from prior years have been reclassified to conform to the current presentation.
(c) Ratios include line of credit interest expense which rounds to less than 0.01%.
(d) Total net expenses include the impact of certain waivers/reimbursements made by the Investment Manager and certain of its affiliates, if applicable.
(e) The benefits derived from expense reductions had an impact of less than 0.01%.
The accompanying Notes to Financial Statements are an integral part of this statement.
Annual Report 2013
18
Columbia Greater China Fund
Financial Highlights (continued)
| | | Year Ended August 31, | |
Class I | | 2013 | | 2012 | | 2011(a) | |
Per share data | |
Net asset value, beginning of period | | $ | 44.20 | | | $ | 53.36 | | | $ | 57.86 | | |
Income from investment operations: | |
Net investment income | | | 0.70 | | | | 0.73 | | | | 0.09 | | |
Net realized and unrealized gain (loss) | | | 7.13 | | | | (7.14 | ) | | | (4.59 | ) | |
Total from investment operations | | | 7.83 | | | | (6.41 | ) | | | (4.50 | ) | |
Less distributions to shareholders: | |
Net investment income | | | (0.73 | ) | | | (0.19 | ) | | | — | | |
Net realized gains | | | — | | | | (2.56 | ) | | | — | | |
Total distributions to shareholders | | | (0.73 | ) | | | (2.75 | ) | | | — | | |
Net asset value, end of period | | $ | 51.30 | | | $ | 44.20 | | | $ | 53.36 | | |
Total return | | | 17.75 | % | | | (11.78 | %) | | | (7.78 | %) | |
Ratios to average net assets(b)(c) | |
Total gross expenses | | | 1.09 | % | | | 1.08 | % | | | 3.00 | %(d)(e) | |
Total net expenses(f) | | | 1.09 | % | | | 1.08 | %(g) | | | 1.56 | %(d)(e)(g) | |
Net investment income | | | 1.41 | % | | | 1.57 | % | | | 2.28 | %(d) | |
Supplemental data | |
Net assets, end of period (in thousands) | | $ | 52,946 | | | $ | 69,532 | | | $ | 18,532 | | |
Portfolio turnover | | | 39 | % | | | 38 | % | | | 36 | % | |
Notes to Financial Highlights
(a) For the period from August 2, 2011 (commencement of operations) to August 31, 2011.
(b) In addition to the fees and expenses which the Fund bears directly, the Fund indirectly bears a pro rata share of the fees and expenses of the acquired funds in which it invests. Such indirect expenses are not included in the reported expense ratios.
(c) Certain line items from prior years have been reclassified to conform to the current presentation.
(d) Annualized.
(e) Ratios include line of credit interest expense which rounds to less than 0.01%.
(f) Total net expenses include the impact of certain waivers/reimbursements made by the Investment Manager and certain of its affiliates, if applicable.
(g) The benefits derived from expense reductions had an impact of less than 0.01%.
The accompanying Notes to Financial Statements are an integral part of this statement.
Annual Report 2013
19
Columbia Greater China Fund
Financial Highlights (continued)
Class R4 | | Year Ended
August 31,
2013(a) | |
Per share data | |
Net asset value, beginning of period | | $ | 49.17 | | |
Income from investment operations: | |
Net investment income | | | 0.88 | | |
Net realized and unrealized gain | | | 1.66 | | |
Total from investment operations | | | 2.54 | | |
Net asset value, end of period | | $ | 51.71 | | |
Total return | | | 5.17 | % | |
Ratios to average net assets(b) | |
Total gross expenses | | | 1.32 | %(c) | |
Total net expenses(d) | | | 1.32 | %(c)(e) | |
Net investment income | | | 4.00 | %(c) | |
Supplemental data | |
Net assets, end of period (in thousands) | | $ | 12 | | |
Portfolio turnover | | | 39 | % | |
Notes to Financial Highlights
(a) For the period from March 19, 2013 (commencement of operations) to August 31, 2013.
(b) In addition to the fees and expenses which the Fund bears directly, the Fund indirectly bears a pro rata share of the fees and expenses of the acquired funds in which it invests. Such indirect expenses are not included in the reported expense ratios.
(c) Annualized.
(d) Total net expenses include the impact of certain waivers/reimbursements made by the Investment Manager and certain of its affiliates, if applicable.
(e) The benefits derived from expense reductions had an impact of less than 0.01%.
The accompanying Notes to Financial Statements are an integral part of this statement.
Annual Report 2013
20
Columbia Greater China Fund
Financial Highlights (continued)
Class R5 | | Year Ended
August 31,
2013(a) | |
Per share data | |
Net asset value, beginning of period | | $ | 48.84 | | |
Income from investment operations: | |
Net investment income | | | 0.63 | | |
Net realized and unrealized gain | | | 2.97 | | |
Total from investment operations | | | 3.60 | | |
Less distributions to shareholders: | |
Net investment income | | | (0.68 | ) | |
Total distributions to shareholders | | | (0.68 | ) | |
Net asset value, end of period | | $ | 51.76 | | |
Total return | | | 7.40 | % | |
Ratios to average net assets(b) | |
Total gross expenses | | | 1.16 | %(c) | |
Total net expenses(d) | | | 1.16 | %(c) | |
Net investment income | | | 1.53 | %(c) | |
Supplemental data | |
Net assets, end of period (in thousands) | | $ | 3 | | |
Portfolio turnover | | | 39 | % | |
Notes to Financial Highlights
(a) For the period from November 8, 2012 (commencement of operations) to August 31, 2013.
(b) In addition to the fees and expenses which the Fund bears directly, the Fund indirectly bears a pro rata share of the fees and expenses of the acquired funds in which it invests. Such indirect expenses are not included in the reported expense ratios.
(c) Annualized.
(d) Total net expenses include the impact of certain waivers/reimbursements made by the Investment Manager and certain of its affiliates, if applicable.
The accompanying Notes to Financial Statements are an integral part of this statement.
Annual Report 2013
21
Columbia Greater China Fund
Financial Highlights (continued)
| | | Year Ended August 31, | |
Class W | | 2013 | | 2012(a) | |
Per share data | |
Net asset value, beginning of period | | $ | 42.10 | | | $ | 43.58 | | |
Income from investment operations: | |
Net investment income (loss) | | | 0.51 | | | | (0.05 | ) | |
Net realized and unrealized gain (loss) | | | 6.77 | | | | (1.43 | ) | |
Total from investment operations | | | 7.28 | | | | (1.48 | ) | |
Less distributions to shareholders: | |
Net investment income | | | (0.56 | ) | | | — | | |
Total distributions to shareholders | | | (0.56 | ) | | | — | | |
Net asset value, end of period | | $ | 48.82 | | | $ | 42.10 | | |
Total return | | | 17.30 | % | | | (3.40 | %) | |
Ratios to average net assets(b)(c) | |
Total gross expenses | | | 1.49 | % | | | 1.47 | %(d) | |
Total net expenses(e) | | | 1.49 | %(f) | | | 1.47 | %(d) | |
Net investment income (loss) | | | 1.07 | % | | | (0.55 | %)(d) | |
Supplemental data | |
Net assets, end of period (in thousands) | | $ | 3 | | | $ | 2 | | |
Portfolio turnover | | | 39 | % | | | 38 | % | |
Notes to Financial Highlights
(a) For the period from June 18, 2012 (commencement of operations) to August 31, 2012.
(b) In addition to the fees and expenses which the Fund bears directly, the Fund indirectly bears a pro rata share of the fees and expenses of the acquired funds in which it invests. Such indirect expenses are not included in the reported expense ratios.
(c) Certain line items from prior years have been reclassified to conform to the current presentation.
(d) Annualized.
(e) Total net expenses include the impact of certain waivers/reimbursements made by the Investment Manager and certain of its affiliates, if applicable.
(f) The benefits derived from expense reductions had an impact of less than 0.01%.
The accompanying Notes to Financial Statements are an integral part of this statement.
Annual Report 2013
22
Columbia Greater China Fund
Financial Highlights (continued)
| | | Year Ended August 31, | |
Class Z | | 2013 | | 2012 | | 2011 | | 2010 | | 2009 | |
Per share data | |
Net asset value, beginning of period | | $ | 44.08 | | | $ | 53.35 | | | $ | 53.60 | | | $ | 46.20 | | | $ | 48.38 | | |
Income from investment operations: | |
Net investment income | | | 0.59 | | | | 0.63 | | | | 0.53 | | | | 0.30 | | | | 0.44 | | |
Net realized and unrealized gain (loss) | | | 7.13 | | | | (7.14 | ) | | | 0.87 | | | | 7.37 | | | | (2.12 | ) | |
Total from investment operations | | | 7.72 | | | | (6.51 | ) | | | 1.40 | | | | 7.67 | | | | (1.68 | ) | |
Less distributions to shareholders: | |
Net investment income | | | (0.64 | ) | | | (0.20 | ) | | | (0.29 | ) | | | (0.31 | ) | | | — | | |
Net realized gains | | | — | | | | (2.56 | ) | | | (1.36 | ) | | | — | | | | (0.54 | ) | |
Total distributions to shareholders | | | (0.64 | ) | | | (2.76 | ) | | | (1.65 | ) | | | (0.31 | ) | | | (0.54 | ) | |
Proceeds from regulatory settlements | | | — | | | | — | | | | — | | | | 0.03 | | | | 0.02 | | |
Redemption fees: | |
Redemption fees added to paid-in capital | | | — | | | | — | | | | — | | | | 0.01 | | | | 0.02 | | |
Net asset value, end of period | | $ | 51.16 | | | $ | 44.08 | | | $ | 53.35 | | | $ | 53.60 | | | $ | 46.20 | | |
Total return | | | 17.54 | % | | | (11.98 | %) | | | 2.31 | % | | | 16.71 | % | | | (3.05 | %) | |
Ratios to average net assets(a)(b) | |
Total gross expenses | | | 1.29 | % | | | 1.28 | % | | | 1.31 | %(c) | | | 1.37 | %(c) | | | 1.44 | %(c) | |
Total net expenses(d) | | | 1.29 | %(e) | | | 1.28 | %(e) | | | 1.31 | %(c)(e) | | | 1.37 | %(c)(e) | | | 1.44 | %(c)(e) | |
Net investment income | | | 1.18 | % | | | 1.34 | % | | | 0.88 | % | | | 0.58 | % | | | 1.17 | % | |
Supplemental data | |
Net assets, end of period (in thousands) | | $ | 28,948 | | | $ | 29,165 | | | $ | 50,261 | | | $ | 55,021 | | | $ | 47,266 | | |
Portfolio turnover | | | 39 | % | | | 38 | % | | | 36 | % | | | 23 | % | | | 39 | % | |
Notes to Financial Highlights
(a) In addition to the fees and expenses which the Fund bears directly, the Fund indirectly bears a pro rata share of the fees and expenses of the acquired funds in which it invests. Such indirect expenses are not included in the reported expense ratios.
(b) Certain line items from prior years have been reclassified to conform to the current presentation.
(c) Ratios include line of credit interest expense which rounds to less than 0.01%.
(d) Total net expenses include the impact of certain waivers/reimbursements made by the Investment Manager and certain of its affiliates, if applicable.
(e) The benefits derived from expense reductions had an impact of less than 0.01%.
The accompanying Notes to Financial Statements are an integral part of this statement.
Annual Report 2013
23
Columbia Greater China Fund
Notes to Financial Statements
August 31, 2013
Note 1. Organization
Columbia Greater China Fund (the Fund), a series of Columbia Funds Series Trust I (the Trust), is a non-diversified fund. The Trust is registered under the Investment Company Act of 1940, as amended (the 1940 Act), as an open-end management investment company organized as a Massachusetts business trust.
Fund Shares
The Trust may issue an unlimited number of shares (without par value). The Fund offers Class A, Class B, Class C, Class I, Class R4, Class R5, Class W and Class Z shares. Although all share classes generally have identical voting, dividend and liquidation rights, each share class votes separately when required by law. Different share classes pay different distribution amounts to the extent the expenses of such share classes differ, and distributions in liquidation will be proportional to the net asset value of each share class. Each share class has its own expense structure and sales charges, as applicable.
Class A shares are subject to a maximum front-end sales charge of 5.75% based on the initial investment amount. Class A shares purchased without an initial sales charge in accounts aggregating $1 million to $50 million at the time of purchase are subject to a contingent deferred sales charge (CDSC) if the shares are sold within 18 months of purchase, charged as follows: 1.00% CDSC if redeemed within 12 months of purchase, and 0.50% CDSC if redeemed more than 12, but less than 18, months after purchase.
Class B shares may be subject to a maximum CDSC of 5.00% based upon the holding period after purchase. Class B shares will generally convert to Class A shares eight years after purchase. The Fund no longer accepts investments by new or existing investors in the Fund's Class B shares, except in connection with the reinvestment of any dividend and/or capital gain distributions in Class B shares of the Fund and exchanges by existing Class B shareholders of certain other funds within the Columbia Family of Funds.
Class C shares are subject to a 1.00% CDSC on shares redeemed within one year of purchase.
Class I shares are not subject to sales charges and are available only to the Columbia Family of Funds.
Class R4 shares are not subject to sales charges and are generally available only to omnibus retirement plans and certain other eligible investors. Class R4 shares commenced operations on March 19, 2013.
Class R5 shares are not subject to sales charges and are generally available only to investors purchasing through
authorized investment professionals and omnibus retirement plans. Class R5 shares commenced operations on November 8, 2012.
Class W shares are not subject to sales charges and are available only to investors purchasing through authorized investment programs managed by investment professionals, including discretionary managed account programs.
Class Z shares are not subject to sales charges and are available only to certain eligible investors, which are subject to different investment minimums.
Note 2. Summary of Significant Accounting Policies
Use of Estimates
The preparation of financial statements in accordance with U.S. generally accepted accounting principles (GAAP) requires management to make certain estimates and assumptions that affect the reported amounts of assets and liabilities, the disclosure of contingent assets and liabilities at the date of the financial statements and the reported amounts of revenue and expenses during the reporting period. Actual results could differ from those estimates.
The following is a summary of significant accounting policies consistently followed by the Fund in the preparation of its financial statements.
Security Valuation
All equity securities are valued at the close of business of the New York Stock Exchange (NYSE). Equity securities are valued at the last quoted sales price on the principal exchange or market on which they trade, except for securities traded on the NASDAQ Stock Market, which are valued at the NASDAQ official close price. Unlisted securities or listed securities for which there were no sales during the day are valued at the mean of the latest quoted bid and ask prices on such exchanges or markets.
Foreign equity securities are valued based on quotations from the principal market in which such securities are normally traded. If any foreign share prices are not readily available as a result of limited share activity the securities are valued at the mean of the latest quoted bid and ask prices on such exchanges or markets. Foreign currency exchange rates are generally determined at 4:00 p.m. Eastern (U.S.) time. However, many securities markets and exchanges outside the U.S. close prior to the close of the NYSE; therefore, the closing prices for securities in such markets or on such exchanges may not fully reflect events that occur after such close but before the close of the NYSE. In those situations, foreign securities will be fair valued pursuant to the policy
Annual Report 2013
24
Columbia Greater China Fund
Notes to Financial Statements (continued)
August 31, 2013
adopted by the Board of Trustees (the Board), including utilizing a third party pricing service to determine these fair values. The third party pricing service takes into account multiple factors, including, but not limited to, movements in the U.S. securities markets, certain depositary receipts, futures contracts and foreign exchange rates that have occurred subsequent to the close of the foreign exchange or market, to determine a good faith estimate that reasonably reflects the current market conditions as of the close of the NYSE. The fair value of a security is likely to be different from the quoted or published price, if available.
Investments in open-end investment companies, including money market funds, are valued at net asset value.
Investments for which market quotations are not readily available, or that have quotations which management believes are not reliable, are valued at fair value as determined in good faith under consistently applied procedures established by and under the general supervision of the Board. If a security or class of securities (such as foreign securities) is valued at fair value, such value is likely to be different from the last quoted market price for the security.
The determination of fair value often requires significant judgment. To determine fair value, management may use assumptions including but not limited to future cash flows and estimated risk premiums. Multiple inputs from various sources may be used to determine fair value.
Foreign Currency Transactions and Translations
The values of all assets and liabilities denominated in foreign currencies are translated into U.S. dollars at that day's exchange rates. Net realized and unrealized gains (losses) on foreign currency transactions and translations include gains (losses) arising from the fluctuation in exchange rates between trade and settlement dates on securities transactions, gains (losses) arising from the disposition of foreign currency and currency gains (losses) between the accrual and payment dates on dividends, interest income and foreign withholding taxes.
For financial statement purposes, the Fund does not distinguish that portion of gains (losses) on investments which is due to changes in foreign exchange rates from that which is due to changes in market prices of the investments. Such fluctuations are included with the net realized and unrealized gains (losses) on investments in the Statement of Operations.
Security Transactions
Security transactions are accounted for on the trade date. Cost is determined and gains (losses) are based upon the specific identification method for both financial statement and federal income tax purposes.
Income Recognition
Corporate actions and dividend income are generally recorded net of any non-reclaimable tax withholdings, on the ex-dividend date or upon receipt of ex-dividend notification in the case of certain foreign securities.
Awards from class action litigation are recorded as a reduction of cost basis if the Fund still owns the applicable securities on the payment date. If the Fund no longer owns the applicable securities, the proceeds are recorded as realized gains.
Expenses
General expenses of the Trust are allocated to the Fund and other funds of the Trust based upon relative net assets or other expense allocation methodologies determined by the nature of the expense. Expenses directly attributable to the Fund are charged to the Fund. Expenses directly attributable to a specific class of shares are charged to that share class.
Determination of Class Net Asset Value
All income, expenses (other than class-specific expenses, which are charged to that share class, as shown in the Statement of Operations) and realized and unrealized gains (losses) are allocated to each class of the Fund on a daily basis, based on the relative net assets of each class, for purposes of determining the net asset value of each class.
Federal Income Tax Status
The Fund intends to qualify each year as a regulated investment company under Subchapter M of the Internal Revenue Code, as amended, and will distribute substantially all of its taxable income (including net short-term capital gains), if any, for its tax year, and as such will not be subject to federal income taxes. In addition, the Fund intends to distribute in each calendar year substantially all of its net investment income, capital gains and certain other amounts, if any, such that the Fund should not be subject to federal excise tax. Therefore, no federal income or excise tax provision is recorded.
Foreign Taxes
The Fund may be subject to foreign taxes on income, gains on investments or currency repatriation, a portion of which may be recoverable. The Fund will accrue such taxes and recoveries, as applicable, based upon its current interpretation of tax rules and regulations that exist in the markets in which it invests.
Realized gains in certain countries may be subject to foreign taxes at the Fund level, based on statutory rates. The Fund accrues for such foreign taxes on realized and unrealized gains at the appropriate rate for each jurisdiction, as applicable. The amount, if any, is disclosed as a liability on the Statement of Assets and Liabilities.
Annual Report 2013
25
Columbia Greater China Fund
Notes to Financial Statements (continued)
August 31, 2013
Distributions to Shareholders
Distributions from net investment income, if any, are declared and paid annually. Net realized capital gains, if any, are distributed along with the income distribution. Income distributions and capital gain distributions are determined in accordance with federal income tax regulations, which may differ from GAAP.
Guarantees and Indemnifications
Under the Trust's organizational documents and, in some cases, by contract, its officers and trustees are indemnified against certain liabilities arising out of the performance of their duties to the Trust or its funds. In addition, certain of the Fund's contracts with its service providers contain general indemnification clauses. The Fund's maximum exposure under these arrangements is unknown since the amount of any future claims that may be made against the Fund cannot be determined, and the Fund has no historical basis for predicting the likelihood of any such claims.
Recent Accounting Pronouncement
Disclosures about Offsetting Assets and Liabilities
In December 2011, the Financial Accounting Standards Board (FASB) issued Accounting Standards Update (ASU) No. 2011-11, Disclosures about Offsetting Assets and Liabilities and in January 2013, ASU No. 2013-1, Clarifying the Scope of Disclosures about Offsetting Assets and Liabilities (collectively, the ASUs). Specifically, the ASUs require an entity to disclose both gross and net information for derivatives and other financial instruments that are subject to a master netting arrangement or similar agreement. The ASUs require disclosure of collateral received in connection with the master netting agreements or similar agreements. The disclosure requirements are effective for interim and annual periods beginning on or after January 1, 2013. At this time, management is evaluating the implications of this guidance and the impact it will have on the financial statement amounts and footnote disclosures, if any.
Note 3. Fees and Compensation Paid to Affiliates
Investment Management Fees
Under an Investment Management Services Agreement, Columbia Management Investment Advisers, LLC (the Investment Manager), a wholly-owned subsidiary of Ameriprise Financial, Inc. (Ameriprise Financial), determines which securities will be purchased, held or sold. The investment management fee is an annual fee that is equal to a percentage of the Fund's average daily net assets that declines from 0.87% to 0.68% as the Fund's net assets increase. The effective investment management fee rate for the year ended August 31, 2013 was 0.87% of the Fund's average daily net assets.
Administration Fees
Under an Administrative Services Agreement, the Investment Manager also serves as the Fund Administrator. The Fund pays the Fund Administrator an annual fee for administration and accounting services equal to a percentage of the Fund's average daily net assets that declines from 0.08% to 0.04% as the Fund's net assets increase. The effective administration fee rate for the year ended August 31, 2013 was 0.08% of the Fund's average daily net assets.
Compensation of Board Members
Board members are compensated for their services to the Fund as disclosed in the Statement of Operations. The Trust's eligible Trustees may participate in a Deferred Compensation Plan (the Plan) which may be terminated at any time. Obligations of the Plan will be paid solely out of the Fund's assets.
Compensation of Chief Compliance Officer
The Board has appointed a Chief Compliance Officer to the Fund in accordance with federal securities regulations. The Fund pays its pro-rata share of the expenses associated with the Chief Compliance Officer. The Fund's expenses for the Chief Compliance Officer will not exceed $15,000 per year.
Transfer Agent Fees
Under a Transfer and Dividend Disbursing Agent Agreement, Columbia Management Investment Services Corp. (the Transfer Agent), an affiliate of the Investment Manager and a wholly-owned subsidiary of Ameriprise Financial, is responsible for providing transfer agency services to the Fund. The Transfer Agent has contracted with Boston Financial Data Services (BFDS) to serve as sub-transfer agent.
The Transfer Agent receives monthly account-based service fees based on the number of open accounts and also receives sub-transfer agency fees based on a percentage of the average aggregate value of the Fund's shares maintained in omnibus accounts (other than omnibus accounts for which American Enterprise Investment Services Inc. is the broker of record or accounts where the beneficial shareholder is a customer of Ameriprise Financial Services, Inc., which are paid a per account fee). The Transfer Agent pays the fees of BFDS for services as sub-transfer agent and is not entitled to reimbursement for such fees from the Fund (with the exception of out-of-pocket fees).
The Transfer Agent also receives compensation from fees for various shareholder services and reimbursements for certain out-of-pocket fees. Class I shares do not pay transfer agent fees. Total transfer agent fees for Class R5 shares are subject to an annual limitation of not more than 0.05% of the average daily net assets attributable to Class R5 shares.
Annual Report 2013
26
Columbia Greater China Fund
Notes to Financial Statements (continued)
August 31, 2013
For the year ended August 31, 2013, the Fund's effective transfer agent fee rates as a percentage of average daily net assets of each class were as follows:
Class A | | | 0.20 | % | |
Class B | | | 0.20 | | |
Class C | | | 0.20 | | |
Class R4 | | | 0.20 | * | |
Class R5 | | | 0.05 | * | |
Class W | | | 0.16 | | |
Class Z | | | 0.20 | | |
*Annualized.
An annual minimum account balance fee of $20 may apply to certain accounts with a value below the applicable share class' initial minimum investment requirements to reduce the impact of small accounts on transfer agent fees. These minimum account balance fees are recorded as part of expense reductions in the Statement of Operations For the year ended August 31, 2013, these minimum account balance fees reduced total expenses by $1,204.
Distribution and Service Fees
The Fund has an agreement with Columbia Management Investment Distributors, Inc. (the Distributor), an affiliate of the Investment Manager and a wholly-owned subsidiary of Ameriprise Financial, for distribution and shareholder services. Pursuant to Rule 12b-1 under the 1940 Act, the Board has approved, and the Fund has adopted, distribution and shareholder service plans (the Plans) which set the distribution and service fees for the Fund. These fees are calculated daily and are intended to compensate the Distributor and/or eligible selling and/or servicing agents for selling shares of the Fund and providing services to investors.
Under the Plans, the Fund pays a monthly service fee to the Distributor at the maximum annual rate of 0.25% of the average daily net assets attributable to Class A, Class B, Class C and Class W shares of the Fund. Also under the Plans, the Fund pays a monthly distribution fee to the Distributor at the maximum annual rate of 0.75% of the average daily net assets attributable to Class B and Class C shares only.
Sales Charges
Sales charges, including front-end charges and CDSCs, received by the Distributor for distributing Fund shares were $31,777 for Class A, $6,901 for Class B and $792 for Class C shares for the year ended August 31, 2013.
Expenses Waived/Reimbursed by the Investment Manager and its Affiliates
The Investment Manager and certain of its affiliates have contractually agreed to waive fees and/or reimburse expenses
(excluding certain fees and expenses described below) for the periods disclosed below, unless sooner terminated at the sole discretion of the Board, so that the Fund's net operating expenses, after giving effect to fees waived/expenses reimbursed and any balance credits and/or overdraft charges from the Fund's custodian, do not exceed the following annual rates as a percentage of the class' average daily net assets:
| | | January 1, 2013
through
December 31, 2013 | | Prior to
January 1, 2013 | |
Class A | | | 1.88 | % | | | 1.93 | % | |
Class B | | | 2.63 | | | | 2.68 | | |
Class C | | | 2.63 | | | | 2.68 | | |
Class I | | | 1.50 | | | | 1.56 | | |
Class R4 | | | 1.63 | * | | | — | | |
Class R5 | | | 1.55 | | | | 1.61 | | |
Class W | | | 1.88 | | | | 1.93 | | |
Class Z | | | 1.63 | | | | 1.68 | | |
*Annual rate is contractual from March 19, 2013 (the commencement of operations of Class R4 shares) through February 28, 2014.
Under the agreement governing these fee waivers and/or expense reimbursement arrangements, the following fees and expenses are excluded from the waiver/reimbursement commitment, and therefore will be paid by the Fund, if applicable: taxes (including foreign transaction taxes), expenses associated with investments in affiliated and non-affiliated pooled investment vehicles (including mutual funds and exchange traded funds), transaction costs and brokerage commissions, costs related to any securities lending program, dividend expenses associated with securities sold short, inverse floater program fees and expenses, transaction charges and interest on borrowed money, interest, extraordinary expenses and any other expenses the exclusion of which is specifically approved by the Board. This agreement may be modified or amended only with approval from all parties.
Note 4. Federal Tax Information
The timing and character of income and capital gain distributions are determined in accordance with income tax regulations, which may differ from GAAP because of temporary or permanent book to tax differences.
At August 31, 2013, these differences are primarily due to differing treatment for deferral/reversal of wash sales losses, Trustees' deferred compensation and earnings and profits distributed to shareholders on the redemption of shares. To the extent these differences are permanent, reclassifications are made among the components of the Fund's net assets in the Statement of Assets and Liabilities. Temporary differences do
Annual Report 2013
27
Columbia Greater China Fund
Notes to Financial Statements (continued)
August 31, 2013
not require reclassifications. In the Statement of Assets and Liabilities the following reclassifications were made:
Undistributed net investment income | | $ | (267,187 | ) | |
Accumulated net realized gain | | | (1,866,274 | ) | |
Paid-in capital | | | 2,133,461 | | |
Net investment income and net realized gains (losses), as disclosed in the Statement of Operations, and net assets were not affected by this reclassification.
The tax character of distributions paid during the years indicated was as follows:
Year Ended August 31, | | 2013 | | 2012 | |
Ordinary income | | $ | 2,554,434 | | | $ | 610,716 | | |
Long-term capital gains | | | — | | | | 13,407,018 | | |
Total | | $ | 2,554,434 | | | $ | 14,017,734 | | |
Short-term capital gain distributions, if any, are considered ordinary income distributions for tax purposes.
At August 31, 2013, the components of distributable earnings on a tax basis were as follows:
Undistributed ordinary income | | $ | 1,916,258 | | |
Undistributed accumulated long-term gain | | | 13,465,380 | | |
Unrealized appreciation | | | 63,589,840 | | |
At August 31, 2013, the cost of investments for federal income tax purposes was $118,360,845 and the aggregate gross unrealized appreciation and depreciation based on that cost was:
Unrealized appreciation | | $ | 65,328,143 | | |
Unrealized depreciation | | | (1,738,303 | ) | |
Net unrealized appreciation | | $ | 63,589,840 | | |
Management of the Fund has concluded that there are no significant uncertain tax positions that would require recognition in the financial statements. However, management's conclusion may be subject to review and adjustment at a later date based on factors including, but not limited to, new tax laws, regulations, and administrative interpretations (including relevant court decisions). Generally, the Fund's federal tax returns for the prior three fiscal years remain subject to examination by the Internal Revenue Service.
Note 5. Portfolio Information
The cost of purchases and proceeds from sales of securities, excluding short-term obligations, aggregated to $81,635,086 and $133,290,432, respectively, for the year ended August 31, 2013.
Note 6. Lending of Portfolio Securities
Effective December 19, 2012, the Fund no longer participates in securities lending activity. Prior to that date, the Fund participated, or was eligible to participate, in securities lending activity pursuant to a Master Securities Lending Agreement (the Agreement) with JPMorgan Chase Bank, N.A. (JPMorgan). The Agreement authorized JPMorgan as lending agent to lend securities to authorized borrowers in order to generate additional income on behalf of the Fund. Pursuant to the Agreement, the securities loaned were secured by cash or securities that either were issued or guaranteed as to principal and interest by the U.S. government, its agencies, authorities or instrumentalities with value equal to at least 100% of the market value of the loaned securities. Any additional collateral required to maintain those levels due to market fluctuations of the loaned securities was requested to be delivered the following business day. Cash collateral received was invested by the lending agent on behalf of the Fund into authorized investments pursuant to the Agreement.
Pursuant to the Agreement, the Fund received income for lending its securities either in the form of fees or by earning interest on invested cash collateral, net of negotiated rebates paid to borrowers and fees paid to the lending agent for services provided and any other securities lending expenses. Net income earned from securities lending for the year ended August 31, 2013 is disclosed in the Statement of Operations. The Fund continued to earn and accrue interest and dividends on the securities loaned.
Note 7. Affiliated Money Market Fund
The Fund invests its daily cash balances in Columbia Short-Term Cash Fund, an affiliated money market fund established for the exclusive use by the Fund and other affiliated funds. The income earned by the Fund from such investments is included as "Dividends — affiliated issuers" in the Statement of Operations. As an investing fund, the Fund indirectly bears its proportionate share of the expenses of Columbia Short-Term Cash Fund.
Note 8. Shareholder Concentration
At August 31, 2013, one unaffiliated shareholder account owned 11.0 % of the outstanding shares of the Fund. The Fund has no knowledge about whether any portion of those shares was owned beneficially by such account. Affiliated shareholder accounts owned 27.9% of the outstanding shares of the Fund. Subscription and redemption activity by concentrated accounts may have a significant effect on the operations of the Fund.
Annual Report 2013
28
Columbia Greater China Fund
Notes to Financial Statements (continued)
August 31, 2013
Note 9. Line of Credit
The Fund has entered into a revolving credit facility with a syndicate of banks led by JPMorgan whereby the Fund may borrow for the temporary funding of shareholder redemptions or for other temporary or emergency purposes. The credit facility agreement, as amended, which is a collective agreement between the Fund and certain other funds managed by the Investment Manager, severally and not jointly, permits collective borrowings up to $500 million. Interest is charged to each participating fund based on its borrowings at a rate equal to the higher of (i) the overnight federal funds rate plus 1.00% or (ii) the one-month LIBOR rate plus 1.00%. Each borrowing under the credit facility matures no later than 60 days after the date of borrowing. The Fund also pays a commitment fee equal to its pro rata share of the amount of the credit facility at a rate of 0.08% per annum. The commitment fee is included in other expenses in the Statement of Operations.
The Fund had no borrowings during the year ended August 31, 2013.
Note 10. Significant Risks
Non-Diversification Risk
A non-diversified fund is permitted to invest a greater percentage of its total assets in fewer issuers than a diversified fund. The Fund may, therefore, have a greater risk of loss from a few issuers than a similar fund that invests more broadly.
Foreign Securities Risk
Investing in foreign securities may include certain risks and considerations not typically associated with investing in U.S. securities, such as fluctuating currency values and changing local and regional economic, political and social conditions, which may result in greater market volatility. In addition, certain foreign securities may not be as liquid as U.S. securities.
Financial Sector Risk
The Fund's portfolio managers may invest significantly in issuers operating in the financial sector. The Fund may be more susceptible to the particular risks of this sector than if the Fund were invested in a wider variety of issuers operating in unrelated sectors.
Geographic Concentration Risk
The Fund may be particularly susceptible to economic, political, regulatory or other events or conditions affecting issuers and countries within the specific geographic regions in which the Fund invests. Currency devaluation could occur in countries that have not yet experienced currency devaluation to
date, or could continue to occur in countries that have already experienced such devaluations. As a result, the Fund may be more volatile than a more geographically diversified fund.
Note 11. Subsequent Events
Management has evaluated the events and transactions that have occurred through the date the financial statements were issued and noted no items requiring adjustment of the financial statements or additional disclosure.
Note 12. Information Regarding Pending and Settled Legal Proceedings
In December 2005, without admitting or denying the allegations, American Express Financial Corporation (AEFC, which is now known as Ameriprise Financial, Inc. (Ameriprise Financial)) entered into settlement agreements with the Securities and Exchange Commission (SEC) and Minnesota Department of Commerce (MDOC) related to market timing activities. As a result, AEFC was censured and ordered to cease and desist from committing or causing any violations of certain provisions of the Investment Advisers Act of 1940, the Investment Company Act of 1940, and various Minnesota laws. AEFC agreed to pay disgorgement of $10 million and civil money penalties of $7 million. AEFC also agreed to retain an independent distribution consultant to assist in developing a plan for distribution of all disgorgement and civil penalties ordered by the SEC in accordance with various undertakings detailed at www.sec.gov/litigation/admin/ia-2451.pdf. Ameriprise Financial and its affiliates have cooperated with the SEC and the MDOC in these legal proceedings, and have made regular reports to the funds' Boards of Trustees.
Ameriprise Financial and certain of its affiliates have historically been involved in a number of legal, arbitration and regulatory proceedings, including routine litigation, class actions, and governmental actions, concerning matters arising in connection with the conduct of their business activities. Ameriprise Financial believes that the Funds are not currently the subject of, and that neither Ameriprise Financial nor any of its affiliates are the subject of, any pending legal, arbitration or regulatory proceedings that are likely to have a material adverse effect on the Funds or the ability of Ameriprise Financial or its affiliates to perform under their contracts with the Funds. Ameriprise Financial is required to make 10-Q, 10-K and, as necessary, 8-K filings with the Securities and Exchange Commission on legal and regulatory matters that relate to Ameriprise Financial and its affiliates. Copies of these filings may be obtained by accessing the SEC website at www.sec.gov.
Annual Report 2013
29
Columbia Greater China Fund
Notes to Financial Statements (continued)
August 31, 2013
There can be no assurance that these matters, or the adverse publicity associated with them, will not result in increased fund redemptions, reduced sale of fund shares or other adverse consequences to the Funds. Further, although we believe proceedings are not likely to have a material adverse effect on the Funds or the ability of Ameriprise Financial or its affiliates to perform under their contracts with the Funds, these proceedings are subject to uncertainties and, as such, we are unable to estimate the possible loss or range of loss that may result. An adverse outcome in one or more of these proceedings could result in adverse judgments, settlements, fines, penalties or other relief that could have a material adverse effect on the consolidated financial condition or results of operations of Ameriprise Financial.
Annual Report 2013
30
Columbia Greater China Fund
Report of Independent Registered Public Accounting Firm
To the Trustees of Columbia Funds Series Trust I and the Shareholders of
Columbia Greater China Fund
In our opinion, the accompanying statement of assets and liabilities, including the portfolio of investments, and the related statements of operations and of changes in net assets and the financial highlights present fairly, in all material respects, the financial position of Columbia Greater China Fund (the "Fund") (a series of Columbia Funds Series Trust I) at August 31, 2013, the results of its operations, the changes in its net assets and the financial highlights for the periods indicated, in conformity with accounting principles generally accepted in the United States of America. These financial statements and financial highlights (hereafter referred to as "financial statements") are the responsibility of the Fund's management. Our responsibility is to express an opinion on these financial statements based on our audits. We conducted our audits of these financial statements in accordance with the standards of the Public Company Accounting Oversight Board (United States). Those standards require that we plan and perform the audit to obtain reasonable assurance about whether the financial statements are free of material misstatement. An audit includes examining, on a test basis, evidence supporting the amounts and disclosures in the financial statements, assessing the accounting principles used and significant estimates made by management, and evaluating the overall financial statement presentation. We believe that our audits, which included confirmation of securities at August 31, 2013 by correspondence with the custodian, brokers and transfer agent, provide a reasonable basis for our opinion.
PricewaterhouseCoopers LLP
Minneapolis, Minnesota
October 22, 2013
Annual Report 2013
31
Columbia Greater China Fund
Federal Income Tax Information
(Unaudited)
The Fund hereby designates the following tax attributes for the fiscal year ended August 31, 2013. Shareholders will be notified in early 2014 of the amounts for use in preparing 2013 income tax returns.
Tax Designations:
| Qualified Dividend Income | | | 100.00 | % | |
Capital Gain Dividend | | $ | 16,099,706 | | |
Foreign Taxes Paid | | $ | 455,532 | | |
Foreign Source Income | | $ | 5,636,007 | | |
Qualified Dividend Income. For taxable, non-corporate shareholders, the percentage of ordinary income dividends paid during the fiscal year that represents qualified dividend income subject to reduced tax rates.
Capital Gain Dividend. The Fund designates as a capital gain dividend the amount reflected above, or if subsequently determined to be different, the net capital gain of such fiscal period. The Fund also designates as capital gain dividends, to the extent necessary to fully distribute such capital gains, earnings and profits distributed to shareholders on the redemption of shares.
Foreign Taxes. The Fund makes the election to pass through to shareholders the foreign taxes paid. These taxes, and the corresponding foreign source income, are provided.
Annual Report 2013
32
Columbia Greater China Fund
The Trustees serve terms of indefinite duration. The names, addresses and birth years of the Trustees and Officers of the Funds in Columbia Funds Series Trust I, the year each was first elected or appointed to office, their principal business occupations during at least the last five years, the number of Funds overseen by each Trustee and other directorships they hold are shown below. Each officer listed below serves as an officer of each Fund in Columbia Funds Series Trust I.
Independent Trustees
Name, Address and Year of Birth,
Position with Funds, Year First
Elected or Appointed to Office | | Principal Occupation(s) During Past Five Years, Number of Funds in Columbia
Funds Complex Overseen by Trustee, Other Directorships Held | |
Rodman L. Drake (Born 1943)
c/o Columbia Management
Investment Advisers, LLC
225 Franklin Street
Boston, MA 02110
Trustee (since 1994) and
Chairman of the Board (since 2009) | | Independent consultant since 2010; Co-Founder of Baringo Capital LLC (private equity) from 1997 to 2008; Chairman (from 2003 to 2010) and CEO (from 2008 to 2010) of Crystal River Capital, Inc. (real estate investment trust); Oversees 52; Jackson Hewitt Tax Service Inc. (tax preparation services) from 2004 to 2011; Student Loan Corporation (student loan provider) from 2005 to 2010; Celgene Corporation (global biotechnology company); The Helios Funds and Brookfield Funds (closed-end funds); Chimerix, Inc. (biopharmaceutical company) since August 1, 2013; Crystal River Capital, Inc. from 2005 to 2010; Parsons Brinckerhoff from 1995 to 2008; and Apex Silver Mines Ltd. from 2007 to 2009 | |
Douglas A. Hacker (Born 1955)
c/o Columbia Management
Investment Advisers, LLC
225 Franklin Street
Boston, MA 02110
Trustee (since 1996) | | Independent business executive since May 2006; Executive Vice President — Strategy of United Airlines from December 2002 to May 2006; President of UAL Loyalty Services (airline marketing company) from September 2001 to December 2002; Executive Vice President and Chief Financial Officer of United Airlines from July 1999 to September 2001. Oversees 52; Nash Finch Company (food distributor); Aircastle Limited (aircraft leasing); and SeaCube Container Leasing Ltd. (container leasing) | |
Janet Langford Kelly (Born 1957)
c/o Columbia Management
Investment Advisers, LLC
225 Franklin Street
Boston, MA 02110
Trustee (since 1996) | | Senior Vice President, General Counsel and Corporate Secretary, ConocoPhillips (integrated energy company) since September 2007; Deputy General Counsel — Corporate Legal Services, ConocoPhillips from August 2006 to August 2007; Partner, Zelle, Hofmann, Voelbel, Mason & Gette LLP (law firm) from March 2005 to July 2006; Adjunct Professor of Law, Northwestern University from September 2004 to June 2006; Director, UAL Corporation (airline) from February 2006 to July 2006; Chief Administrative Officer and Senior Vice President, Kmart Holding Corporation (consumer goods) from September 2003 to March 2004. Oversees 52; None | |
Nancy T. Lukitsh (Born 1956)
c/o Columbia Management
Investment Advisers, LLC
225 Franklin Street
Boston, MA 02110
Trustee (since 2011) | | Senior Vice President, Partner and Director of Marketing, Wellington Management Company, LLP (investment adviser) from 1997 to 2010; Chair, Wellington Management Investment Portfolios (commingled non-U.S. investment pools) from 2007 to 2010; Director, Wellington Trust Company, NA and other Wellington affiliates from 1997 to 2010. Oversees 52; None | |
William E. Mayer (Born 1940)
c/o Columbia Management
Investment Advisers, LLC
225 Franklin Street
Boston, MA 02110
Trustee (since 1994) | | Partner, Park Avenue Equity Partners (private equity) since February 1999; Dean and Professor, College of Business and Management, University of Maryland from 1992 to 1996. Oversees 52; DynaVox Inc. (speech creation); Lee Enterprises (print media); WR Hambrecht + Co. (financial service provider) from 2000 to 2012; BlackRock Kelso Capital Corporation (investment company) | |
David M. Moffett (Born 1952)
c/o Columbia Management
Investment Advisers, LLC
225 Franklin Street
Boston, MA 02110
Trustee (since 2011) | | Retired. Chief Executive Officer, Federal Home Loan Mortgage Corporation, from 2008 to 2009; Senior Adviser, Global Financial Services Group, Carlyle Group, Inc., from 2007 to 2008; Vice Chairman and Chief Financial Officer, U.S. Bancorp, from 1993 to 2007. Oversees 52; CIT Group Inc. (commercial and consumer finance); eBay Inc. (online trading community); MBIA Inc. (financial service provider); E.W. Scripps Co. (print and television media), Building Materials Holding Corp. (building materials and construction services); Genworth Financial, Inc. (financial and insurance products and services); and University of Oklahoma Foundation | |
Charles R. Nelson (Born 1942)
c/o Columbia Management
Investment Advisers, LLC
225 Franklin Street
Boston, MA 02110
Trustee (since 1981) | | Retired. Professor Emeritus, University of Washington, since 2011; Professor of Economics, University of Washington from 1976 to 2011; Ford and Louisa Van Voorhis Professor of Political Economy, University of Washington from 1993 to 2011; Adjunct Professor of Statistics, University of Washington from 1980 to 2011; Associate Editor, Journal of Money, Credit and Banking from September 1993 to 2008; consultant on econometric and statistical matters. Oversees 52; None | |
John J. Neuhauser (Born 1943)
c/o Columbia Management
Investment Advisers, LLC
225 Franklin Street
Boston, MA 02110
Trustee (since 1984) | | President, Saint Michael's College, since August 2007; Director or Trustee of several non-profit organizations, including Fletcher Allen Health Care, Inc.; University Professor, Boston College from November 2005 to August 2007; Academic Vice President and Dean of Faculties, Boston College from August 1999 to October 2005. Oversees 52; Liberty All-Star Equity Fund and Liberty All-Star Growth Fund (closed-end funds) | |
Annual Report 2013
33
Columbia Greater China Fund
Trustees and Officers (continued)
Independent Trustees (continued)
Name, Address and Year of Birth,
Position with Funds, Year First
Elected or Appointed to Office | | Principal Occupation(s) During Past Five Years, Number of Funds in Columbia
Funds Complex Overseen by Trustee, Other Directorships Held | |
Patrick J. Simpson (Born 1944)
c/o Columbia Management
Investment Advisers, LLC
225 Franklin Street
Boston, MA 02110
Trustee (since 2000) | | Partner, Perkins Coie LLP (law firm). Oversees 52; None | |
Anne-Lee Verville (Born 1945)
c/o Columbia Management
Investment Advisers, LLC
225 Franklin Street
Boston, MA 02110
Trustee (since 1998) | | Retired. General Manager — Global Education Industry from 1994 to 1997, President — Application Systems Division from 1991 to 1994, Chief Financial Officer — US Marketing & Services from 1988 to 1991, and Chief Information Officer from 1987 to 1988, IBM Corporation (computer and technology). Oversees 52; Enesco Group, Inc. (producer of giftware and home and garden decor products) from 2001 to 2006 | |
Interested Trustee
Name, Address and Year of Birth,
Position with Funds, Year First
Elected or Appointed to Office | | Principal Occupation(s) During Past Five Years, Number of Funds in Columbia
Funds Complex Overseen by Trustee, Other Directorships Held | |
William F. Truscott (born 1960)
53600 Ameriprise Financial Center
Minneapolis, MN 55474
Senior Vice President (since 2012) | | Chairman of the Board and President, Columbia Management Investment Advisers, LLC since May 2010 and February 2012 (previously President and Chief Investment Officer, from 2001 to April 2010); Chief Executive Officer, Global Asset Management, Ameriprise Financial, Inc. since September 2012 (previously, Chief Executive Officer, U.S. Asset Management & President, Annuities, from May 2010 to September 2012 and President — U.S. Asset Management and Chief Investment Officer from 2005 to April 2010); Director and Chief Executive Officer, Columbia Management Investment Distributors, Inc. since May 2010 and February 2012, respectively (previously Chairman of the Board and Chief Executive Officer from 2006 to April 2010); Chairman of the Board and Chief Executive Officer, RiverSource Distributors, Inc. since 2006; President and Chief Executive Officer, Ameriprise Certificate Company, 2006 to August 2012; Oversees 184; Director, Ameriprise Certificate Company, 2006-January 2013 | |
The Statement of Additional Information includes additional information about the Trustees of the Funds and is available, without charge, upon request by calling 800.345.6611.
The Board has appointed officers who are responsible for day-to-day business decisions based on policies it has established. The officers serve at the pleasure of the Board. In addition to Mr. Truscott, who is Senior Vice President, the Funds' other officers are:
Officers
Name, Year of Birth and Address | | Principal Occupation(s) During the Past Five Years | |
J. Kevin Connaughton (Born 1964)
225 Franklin Street
Boston, MA 02110
President (since 2009) | | Senior Vice President and General Manager — Mutual Fund Products, Columbia Management Investment Advisers, LLC since May 2010; President, Columbia Funds since 2009 and RiverSource Funds since May 2010; Managing Director, Columbia Management Advisors, LLC, December 2004-April 2010; Senior Vice President and Chief Financial Officer, Columbia Funds, June 2008-January 2009; Treasurer, Columbia Funds, October 2003-May 2008; and senior officer of various other affiliated funds since 2000 | |
Amy Johnson (Born 1965)
5228 Ameriprise Financial Center
Minneapolis, MN 55474
Vice President (since 2010) | | Senior Vice President and Chief Operating Officer, Columbia Management Investment Advisers, LLC since May 2010 (previously Chief Administrative Officer, from 2009-April 2010, Vice President — Asset Management and Trust Company Services, from 2006-2009) | |
Michael G. Clarke (Born 1969)
225 Franklin Street
Boston, MA 02110
Treasurer (since 2011) and Chief
Financial Officer (since 2009) | | Vice President, Columbia Management Investment Advisers, LLC since May 2010; Managing Director of Fund Administration, Columbia Management Advisors, LLC, September 2004-April 2010; senior officer of Columbia Funds and affiliated funds since 2002 | |
Annual Report 2013
34
Columbia Greater China Fund
Trustees and Officers (continued)
Officers (continued)
Name, Year of Birth and Address | | Principal Occupation(s) During the Past Five Years | |
Scott R. Plummer (Born 1959)
5228 Ameriprise Financial Center
Minneapolis, MN 55474
Senior Vice President, Assistant
Secretary and Chief Legal Officer
(since 2010) | | Senior Vice President, Chief Legal Officer and Assistant Secretary, Columbia Management Investment Advisers, LLC since June 2005; Senior Vice President and Lead Chief Counsel — Asset Management, Ameriprise Financial, Inc. since May 2010 (previously Vice President and Chief Counsel — Asset Management, 2005-April 2010); Vice President, Chief Counsel and Assistant Secretary, Columbia Management Investment Distributors, Inc. since 2008; Vice President, General Counsel and Secretary, Ameriprise Certificate Company since 2005; Chief Counsel, RiverSource Distributors, Inc. since 2006; senior officer of Columbia Funds and affiliated funds since 2010 | |
Colin Moore (Born 1958)
225 Franklin Street
Boston, MA 02110
Senior Vice President (since 2010) | | Executive Vice President and Global Chief Investment Officer, Ameriprise Financial, Inc. since July 2013; Director and Global Chief Investment Officer, Columbia Management Investment Advisers, LLC since May 2010; Manager, Managing Director and Chief Investment Officer of Columbia Management Advisors, LLC, 2007-April 2010 | |
Thomas P. McGuire (Born 1972)
225 Franklin Street
Boston, MA 02110
Chief Compliance Officer
(since 2012) | | Vice President — Asset Management Compliance, Columbia Management Investment Advisers, LLC since 2010; Chief Compliance Officer, Ameriprise Certificate Company, since September 2010; Compliance Executive, Bank of America, N.A. 2005-2010 | |
Stephen T. Welsh (born 1957)
225 Franklin Street
Boston, MA 02110
Vice President (since 2006) | | President and Director, Columbia Management Investment Services Corp. since May 2010; President and Director, Columbia Management Services, Inc., July 2004-April 2010; Managing Director, Columbia Management Distributors, Inc., August 2007-April 2010 | |
Christopher O. Petersen (born 1970)
5228 Ameriprise Financial Center
Minneapolis, MN 55474
Vice President (since 2010) and
Secretary (since 2011) | | Vice President and Chief Counsel, Ameriprise Financial, Inc. since January 2010 (formerly Vice President and Group Counsel or Counsel, April 2004-January 2010); Assistant Secretary of Columbia Funds, January 2007-April 2011 | |
Paul D. Pearson (born 1956)
10468 Ameriprise Financial Center
Minneapolis, MN 55474
Vice President and Assistant
Treasurer (since 2011) | | Vice President, Investment Accounting, Columbia Management Investment Advisers, LLC, since May 2010; Vice President — Managed Assets, Investment Accounting, Ameriprise Financial, Inc., February 1998-May 2010 | |
Joseph F. DiMaria (Born 1968)
225 Franklin Street
Boston, MA 02110
Vice President (since 2011) and
Chief Accounting Officer (since 2008) | | Vice President, Mutual Fund Administration, Columbia Management Investment Advisers, LLC, since May 2010; Director of Fund Administration, Columbia Management Advisors, LLC, January 2006-April 2010 | |
Paul B. Goucher (born 1968)
100 Park Avenue
New York, NY 10017
Vice President and Assistant
Secretary (since 2010) | | Vice President and Lead Chief Counsel, Ameriprise Financial, Inc. since November 2008 and January 2013, respectively (formerly, Chief Counsel from January 2010-January 2013 and Group Counsel from November 2008-January 2010); Director, Managing Director and General Counsel, J. & W. Seligman & Co. Incorporated, July 2008-November 2008 (previously, Managing Director and Associate General Counsel, January 2005-July 2008) | |
Michael E. DeFao (born 1968)
225 Franklin Street
Boston, MA 02110
Vice President and Assistant
Secretary (since 2011) | | Vice President and Chief Counsel, Ameriprise Financial, Inc. since May 2010; Associate General Counsel, Bank of America, N.A. June 2005-April 2010 | |
Annual Report 2013
35
Columbia Greater China Fund
Board Consideration and Approval of Advisory Agreement
On June 14, 2013, the Board of Trustees (the "Board") and the Trustees who are not interested persons (as defined in the Investment Company Act of 1940) of the Trust (the "Independent Trustees") unanimously approved the continuation of the Investment Management Services Agreement (the "Advisory Agreement") with Columbia Management Investment Advisers, LLC (the "Investment Manager") with respect to Columbia Greater China Fund (the "Fund"), a series of the Trust. As detailed below, the Advisory Fees and Expenses Committee (the "Committee") and the Board met on multiple occasions to review and discuss, both among themselves and with the management team of the Investment Manager, materials provided by the Investment Manager before determining to approve the continuation of the Advisory Agreement.
In connection with their deliberations regarding the continuation of the Advisory Agreement, the Committee and the Board evaluated materials requested from the Investment Manager regarding the Fund and the Advisory Agreement, and discussed these materials with representatives of the Investment Manager at Committee meetings held on March 5, 2013, April 24, 2013 and June 13, 2013, and at the Board meeting held on June 14, 2013. In addition, the Board considers matters bearing on the Advisory Agreement at most of its other meetings throughout the year and meets regularly with senior management of the Funds and the Investment Manager. Through the Board's Investment Oversight Committees, Trustees also meet with selected Fund portfolio managers and other investment personnel at various times throughout the year. The Committee and the Board also consulted with Fund counsel and with the Independent Trustees' independent legal counsel, who advised on various matters with respect to the Committee's and the Board's considerations and otherwise assisted the Committee and the Board in their deliberations. On June 13, 2013, the Committee recommended that the Board approve the continuation of the Advisory Agreement. On June 14, 2013, the Board, including the Independent Trustees, voting separately, unanimously approved the continuation of the Advisory Agreement for the Fund.
The Committee and the Board considered all information that they, their legal counsel, or the Investment Manager believed reasonably necessary to evaluate and to determine whether to approve the continuation of the Advisory Agreement. The information and factors considered by the Committee and the Board in recommending for approval or approving the continuation of the Advisory Agreement for the Fund included the following:
• Information on the investment performance of the Fund relative to the performance of a group of mutual funds determined to be comparable to the Fund by an independent third-party data provider, as well as performance relative to benchmarks;
• Information on the Fund's advisory fees and total expenses, including information comparing the Fund's expenses to those of a group of comparable mutual funds, as determined by the independent third-party data provider;
• The Investment Manager's agreement to contractually limit or cap total operating expenses for the Fund so that total operating expenses (excluding certain fees and expenses, such as transaction costs and certain other investment related expenses, interest, taxes, acquired fund fees and expenses, and extraordinary expenses) would not exceed the median expenses of a group of comparable funds (as determined from time to time, generally annually, by the independent third-party data provider);
• The terms and conditions of the Advisory Agreement;
• The terms and conditions of other agreements and arrangements with affiliates of the Investment Manager relating to the operations of the Fund, including the Administrative Services Agreement, the Distribution Agreement and the Transfer and Dividend Disbursing Agent Agreement;
• Descriptions of various functions performed by the Investment Manager under the Advisory Agreement, including portfolio management and portfolio trading practices;
• Information regarding the management fees and investment performance of comparable portfolios of other clients of the Investment Manager, including institutional separate accounts;
• Information regarding the reputation, regulatory history and resources of the Investment Manager, including information regarding senior management, portfolio managers and other personnel;
• Information regarding the capabilities of the Investment Manager with respect to compliance monitoring services, including an assessment of the Investment Manager's compliance system by the Fund's Chief Compliance Officer; and
• The profitability to the Investment Manager and its affiliates from their relationships with the Fund.
Annual Report 2013
36
Columbia Greater China Fund
Board Consideration and Approval of Advisory Agreement (continued)
Nature, Extent and Quality of Services Provided under the Advisory Agreement
The Committee and the Board considered the nature, extent and quality of services provided to the Fund by the Investment Manager and its affiliates under the Advisory Agreement and under separate agreements for the provision of transfer agency and administrative services, and the resources dedicated to the Fund and the other Columbia Funds by the Investment Manager and its affiliates. The Committee and the Board considered, among other things, the Investment Manager's ability to attract, motivate and retain highly qualified research, advisory and supervisory investment professionals (including personnel and other resources, compensation programs for personnel involved in fund management, reputation and other attributes), the portfolio management services provided by those investment professionals, and the quality of the Investment Manager's investment research capabilities and trade execution services. The Committee and the Board also considered the potential benefits to shareholders of investing in a mutual fund that is part of a fund complex offering exposure to a variety of asset classes and investment disciplines and providing a variety of fund and shareholder services.
The Committee and the Board also considered the professional experience and qualifications of the senior personnel of the Investment Manager, which included consideration of the Investment Manager's experience with similarly-structured funds. The Committee and the Board noted the compliance programs of and the compliance-related resources provided to the Fund by the Investment Manager and its affiliates, and considered the Investment Manager's ability to provide administrative services to the Fund pursuant to a separate Administrative Services Agreement, including the Investment Manager's ability to coordinate the activities of the Fund's other service providers. After reviewing these and related factors, the Committee and the Board concluded, within the context of their overall conclusions, that the nature, extent and quality of the services provided to the Fund under the Advisory Agreement supported the continuation of the Advisory Agreement.
Investment Performance
The Committee and the Board reviewed information about the performance of the Fund over various time periods, including performance information relative to benchmarks and information based on reports of the independent third-party data provider that compared the performance of the Fund to the performance of a group of comparable mutual funds. The Committee and the Board also reviewed a description of the third party's methodology for identifying the Fund's peer groups for purposes of performance and expense comparisons. Although the Fund's performance lagged that of a relevant peer group for certain (although not necessarily all) periods, the Committee and the Board concluded that other factors relevant to performance were sufficient, in light of other considerations, to warrant continuation of the Fund's Advisory Agreement. Those factors included one or more of the following: (i) that the Fund's performance, although lagging in certain recent periods, was stronger over the longer term; (ii) that the underperformance was attributable, to a significant extent, to investment decisions that were reasonable and consistent with the Fund's investment strategy and policies and that the Fund was performing within a reasonable range of expectations, given those investment decisions, market conditions and the Fund's investment strategy; (iii) that the Fund's performance was competitive when compared to other relevant performance benchmarks or peer groups; and (iv) that the Investment Manager had taken or was taking steps designed to help improve the Fund's investment performance, including, but not limited to, replacing portfolio managers, enhancing the resources supporting the portfolio managers, or modifying investment strategies.
The Committee and the Board noted that, through December 31, 2012, the Fund's performance was in the fifty-fourth, forty-third and fiftieth percentile (where the best performance would be in the first percentile) of its category selected by the independent third-party data provider for the purposes of performance comparisons for the one-, three- and five- year periods, respectively.
The Committee and the Board also considered the Investment Manager's performance and reputation generally, the Investment Manager's historical responsiveness to Board concerns about performance, and the Investment Manager's willingness to take steps intended to improve performance. After reviewing these and related factors, the Committee and the Board concluded, within the context of their overall conclusions, that the performance of the Fund and the Investment Manager was sufficient, in light of other considerations, to warrant the continuation of the Advisory Agreement.
Investment Advisory Fee Rates and Other Expenses
The Committee and the Board considered the advisory fees charged to the Fund under the Advisory Agreement as well as the total expenses incurred by the Fund. In assessing the reasonableness of the fees under the Advisory Agreement, the
Annual Report 2013
37
Columbia Greater China Fund
Board Consideration and Approval of Advisory Agreement (continued)
Committee and the Board considered, among other information, the Fund's advisory fee and its total expense ratio as a percentage of average daily net assets. The Committee and the Board noted that [to be tailored for each Fund]'s actual management fee and net expense ratio are ranked in the second and first quintiles, respectively, (where the lowest fees and expenses would be in the first quintile) against the Fund's expense universe as determined by the independent third-party data provider for purposes of expense comparison. The Committee and the Board also took into account the fee waiver and expense limitation arrangements agreed to by the Investment Manager, as noted above.
The Committee and the Board also received and considered information about the advisory fees charged by the Investment Manager to institutional separate accounts. In considering the fees charged to those accounts, the Committee and the Board took into account, among other things, the Investment Manager's representations about the differences between managing mutual funds as compared to other types of accounts, including differences in the services provided, differences in the risk profile of such business for the Investment Manager and the additional resources required to manage mutual funds effectively. In evaluating the Fund's advisory fees, the Committee and the Board also took into account the demands, complexity and quality of the investment management of the Fund.
After reviewing these and related factors, the Committee and the Board concluded, within the context of their overall conclusions, that the advisory fee rates and expenses of the Fund supported the continuation of the Advisory Agreement.
Costs of Services Provided and Profitability
The Committee and the Board also took note of the costs of the services provided (both on an absolute and relative basis) and the profitability to the Investment Manager and its affiliates in connection with their relationships with the Fund. In evaluating these considerations, the Committee and the Board took note of the advisory fees charged by the Investment Manager to other clients, including fees charged by the Investment Manager to institutional separate account clients with similar investment strategies to those of the Fund.
The Committee and the Board also considered the compensation directly or indirectly received by the Investment Manager's affiliates in connection with their relationships with the Fund. The Committee and the Board reviewed information provided by management as to the profitability of the Investment Manager and its affiliates of their relationships with the Fund, information about the allocation of expenses used to calculate profitability, and comparisons of profitability levels realized in 2012 to profitability levels realized in 2011. When reviewing profitability, the Committee and the Board also considered court cases in which adviser profitability was an issue in whole or in part, the performance of the Fund, the expense ratio of the Fund, and the implementation of expense limitations with respect to the Fund. The Committee and the Board also considered information provided by the Investment Manager regarding its financial condition and comparing its profitability to that of other asset management firms that are, or are subsidiaries of, publicly traded companies.
After reviewing these and related factors, the Committee and the Board concluded, within the context of their overall conclusions, that the costs of services provided and the profitability to the Investment Manager and its affiliates from their relationships with the Fund supported the continuation of the Advisory Agreement.
Economies of Scale
The Committee and the Board considered the potential existence of economies of scale in the provision by the Investment Manager of services to the Fund, to groups of related funds, and to the Investment Manager's investment advisory clients as a whole, and whether those economies of scale were shared with the Fund through breakpoints in investment advisory fees or other means, such as expense limitation arrangements and additional investments by the Investment Manager in investment, trading and compliance resources. The Committee and the Board noted that the investment advisory fee schedules for the Fund contained breakpoints that would reduce the fee rate on assets above specified threshold levels.
In considering these matters, the Committee and the Board also considered the costs of the services provided and the profitability to the Investment Manager and its affiliates from their relationships with the Fund, as discussed above. After reviewing these and related factors, the Committee and the Board concluded, within the context of their overall conclusions, that the extent to which any economies of scale were expected to be shared with the Fund supported the continuation of the Advisory Agreement.
Annual Report 2013
38
Columbia Greater China Fund
Board Consideration and Approval of Advisory Agreement (continued)
Other Benefits to the Investment Manager
The Committee and the Board received and considered information regarding "fall-out" or ancillary benefits received by the Investment Manager and its affiliates as a result of their relationships with the Fund, such as the engagement of the Investment Manager to provide administrative services to the Fund and the engagement of the Investment Manager's affiliates to provide distribution and transfer agency services to the Fund. The Committee and the Board considered that the Fund's distributor retains a portion of the distribution fees from the Fund. The Committee and the Board also considered the benefits of research made available to the Investment Manager by reason of brokerage commissions generated by the Fund's securities transactions, and reviewed information about the Investment Manager's practices with respect to allocating portfolio transactions for brokerage and research services. The Committee and the Board considered the possible conflicts of interest associated with certain fall-out or other ancillary benefits and the reporting, disclosure and other processes that are in place to address such possible conflicts of interest. The Committee and the Board recognized that the Investment Manager's profitability would be somewhat lower without these benefits.
Conclusion
The Committee and the Board reviewed all of the above considerations in reaching their decisions to recommend or approve the continuation of the Advisory Agreement. In their deliberations, the Trustees did not identify any particular information that was all-important or controlling, and individual Trustees may have attributed different weights to the various factors. Based on their evaluation of all factors that they deemed to be material, including those factors described above, and assisted by the advice of independent legal counsel, the Board, including the Independent Trustees, voting separately, unanimously approved the continuation of the Advisory Agreement.
Annual Report 2013
39
This page intentionally left blank.
Annual Report 2013
40
Columbia Greater China Fund
Important Information About This Report
Each fund mails one shareholder report to each shareholder address. If you would like more than one report, please call shareholder services at 800.345.6611 and additional reports will be sent to you.
The policy of the Board is to vote the proxies of the companies in which each fund holds investments consistent with the procedures as stated in the Statement of Additional Information (SAI). You may obtain a copy of the SAI without charge by calling 800.345.6611; contacting your financial intermediary; visiting columbiamanagement.com; or searching the website of the Securities and Exchange Commission (SEC) at sec.gov. Information regarding how each fund voted proxies relating to portfolio securities is filed with the SEC by August 31 for the most recent 12-month period ending June 30 of that year, and is available without charge by visiting columbiamanagement.com; or searching the website of the SEC at sec.gov.
Each fund files a complete schedule of portfolio holdings with the SEC for the first and third quarters of each fiscal year on Form N-Q. Each fund's Form N-Q is available on the SEC's website at sec.gov and may be reviewed and copied at the SEC's Public Reference Room in Washington, D.C. Information on the operation of the Public Reference Room may be obtained by calling 800.SEC.0330. Each fund's complete schedule of portfolio holdings, as filed on Form N-Q, can also be obtained without charge, upon request, by calling 800.345.6611.
Annual Report 2013
41

Columbia Greater China Fund
P.O. Box 8081
Boston, MA 02266-8081
columbiamanagement.com
This information is for use with concurrent or prior delivery of a fund prospectus. Please read and consider the investment objectives, risks, charges and expenses for any fund carefully before investing. For a prospectus which contains this and other important information about the Fund go to columbiamanagement.com. The Fund is distributed by Columbia Management Investment Distributors, Inc., member FINRA, and managed by Columbia Management Investment Advisers, LLC.
© 2013 Columbia Management Investment Advisers, LLC. All rights reserved.
ANN158_08_C01_(10/13)
Annual Report
August 31, 2013

Columbia Mid Cap Growth Fund
Not FDIC insured • No bank guarantee • May lose value
 Dear Shareholders,
A return to volatility
Volatility returned to the financial markets in the second quarter of 2013, as uncertainty about the global economy, monetary policy and the impact of the sequester's spending cuts weighed on investors. Households advanced their spending but also allocated less to savings. Labor markets continued to crank out jobs at a steady pace, slowly reducing unemployment. Housing activity remained strong and retail sales were higher despite no real increase in income. The single weak spot was in the manufacturing sector, where activity slowed. While the consumer has weathered the domestic drag well, business has been closer to the global slowdown and effects of sequestration. Businesses remain very cautious, keeping inventories and staffs lean, and are planning for but not yet confident enough to make capital expenditures.
Against this backdrop, equities outperformed fixed income during the second quarter of 2013. Small-cap stocks outperformed large- and mid-cap stocks, and growth outperformed value except for in the large-cap sector. Outside the United States, foreign stock markets generally lost ground, with the most significant losses sustained by emerging markets.
Columbia Management to begin delivering summary prospectuses
Each Columbia fund is required to update its prospectus on an annual basis. Beginning with June 2013 prospectus updates, shareholders of Columbia retail mutual funds will start to receive a summary prospectus, rather than the full length (statutory) mutual fund prospectus they have received in the past.
Each fund's summary prospectus will include the following key information:
> Investment objective
> Fee and expense table
> Portfolio turnover rate information
> Principal investment strategies, principal risks and performance information
> Management information
> Purchase and sale information
> Tax information
> Financial intermediary compensation information
Each fund's statutory prospectus will contain additional information about the fund and its risks. Both the statutory and summary prospectus will be updated each year, and will be available at columbiamanagement.com. Shareholders may request a printed version of a statutory prospectus at no cost by calling 800.345.6611 or sending an email to serviceinquiries@columbiamanagement.com.
Stay on track with Columbia Management
Backed by more than 100 years of experience, Columbia Management is one of the nation's largest asset managers. At the heart of our success — and, most importantly, that of our investors — are highly talented industry professionals, brought together by a unique way of working. We are dedicated to helping you take advantage of today's opportunities and anticipate tomorrow's. We stay abreast of the latest investment trends and ideas, using our collective insight to evaluate events and transform them into solutions you can use.
Visit columbiamanagement.com for:
> The Columbia Management Perspectives blog, featuring timely posts by our investment teams
> Detailed up-to-date fund performance and portfolio information
> Economic analysis and market commentary
> Quarterly fund commentaries
> Columbia Management Investor, our award-winning quarterly newsletter for shareholders
Thank you for your continued support of the Columbia Funds. We look forward to serving your investment needs for many years to come.
Best Regards,

J. Kevin Connaughton
President, Columbia Funds
Investors should consider the investment objectives, risks, charges and expenses of a mutual fund carefully before investing. For a free prospectus, which contains this and other important information about a fund, visit columbiamanagement.com. The prospectus should be read carefully before investing.
Columbia Funds are distributed by Columbia Management Investment Distributors, Inc., member FINRA, and managed by Columbia Management Investment Advisers, LLC.
© 2013 Columbia Management Investment Advisers, LLC. All rights reserved.
Columbia Mid Cap Growth Fund
Performance Overview | | | 2 | | |
Manager Discussion of Fund Performance | | | 4 | | |
Understanding Your Fund's Expenses | | | 7 | | |
Portfolio of Investments | | | 8 | | |
Statement of Assets and Liabilities | | | 13 | | |
Statement of Operations | | | 16 | | |
Statement of Changes in Net Assets | | | 17 | | |
Financial Highlights | | | 20 | | |
Notes to Financial Statements | | | 32 | | |
Report of Independent Registered
Public Accounting Firm | | | 41 | | |
Federal Income Tax Information | | | 42 | | |
Trustees and Officers | | | 43 | | |
Board Consideration and Approval of Advisory Agreement | | | 46 | | |
Important Information About This Report | | | 53 | | |
Fund Investment Manager
Columbia Management Investment
Advisers, LLC
225 Franklin Street
Boston, MA 02110
Fund Distributor
Columbia Management Investment
Distributors, Inc.
225 Franklin Street
Boston, MA 02110
Fund Transfer Agent
Columbia Management Investment
Services Corp.
P.O. Box 8081
Boston, MA 02266-8081
For more information about any of the funds, please visit columbiamanagement.com or call 800.345.6611. Customer Service Representatives are available to answer your questions Monday through Friday from 8 a.m. to 8 p.m. Eastern time.
The views expressed in this report reflect the current views of the respective parties. These views are not guarantees of future performance and involve certain risks, uncertainties and assumptions that are difficult to predict, so actual outcomes and results may differ significantly from the views expressed. These views are subject to change at any time based upon economic, market or other conditions and the respective parties disclaim any responsibility to update such views. These views may not be relied on as investment advice and, because investment decisions for a Columbia Fund are based on numerous factors, may not be relied on as an indication of trading intent on behalf of any particular Columbia Fund. References to specific securities should not be construed as a recommendation or investment advice.
Columbia Mid Cap Growth Fund
Performance Summary
> Columbia Mid Cap Growth Fund (the Fund) Class A shares returned 16.60% excluding sales charges for the 12-month period that ended August 31, 2013.
> The Fund underperformed its benchmarks, the Russell Midcap Growth Index and the Russell Midcap Index, which returned 23.97% and 24.91%, respectively, for the same 12-month period.
> In an environment that favored companies with lower valuations, slower growth, higher dividends and higher leverage, the Fund's emphasis on higher quality companies generally accounted for its shortfall versus both benchmarks.
Average Annual Total Returns (%) (for period ended August 31, 2013)
| | Inception | | 1 Year | | 5 Years | | 10 Years | |
Class A | | 11/01/02 | | | | | | | | | | | | | |
Excluding sales charges | | | | | | | 16.60 | | | | 7.04 | | | | 8.40 | | |
Including sales charges | | | | | | | 9.90 | | | | 5.78 | | | | 7.76 | | |
Class B | | 11/01/02 | | | | | | | | | | | | | |
Excluding sales charges | | | | | | | 15.68 | | | | 6.22 | | | | 7.58 | | |
Including sales charges | | | | | | | 10.68 | | | | 5.90 | | | | 7.58 | | |
Class C* | | 10/13/03 | | | | | | | | | | | | | |
Excluding sales charges | | | | | | | 15.71 | | | | 6.24 | | | | 7.61 | | |
Including sales charges | | | | | | | 14.71 | | | | 6.24 | | | | 7.61 | | |
Class I* | | 09/27/10 | | | 17.08 | | | | 7.42 | | | | 8.74 | | |
Class K* | | 02/28/13 | | | 16.74 | | | | 7.19 | | | | 8.57 | | |
Class R* | | 01/23/06 | | | 16.27 | | | | 6.76 | | | | 8.15 | | |
Class R4* | | 11/08/12 | | | 16.75 | | | | 7.29 | | | | 8.67 | | |
Class R5* | | 03/07/11 | | | 16.94 | | | | 7.38 | | | | 8.72 | | |
Class T | | 11/01/02 | | | | | | | | | | | | | |
Excluding sales charges | | | | | | | 16.51 | | | | 6.98 | | | | 8.35 | | |
Including sales charges | | | | | | | 9.81 | | | | 5.72 | | | | 7.71 | | |
Class W* | | 09/27/10 | | | 16.59 | | | | 7.05 | | | | 8.43 | | |
Class Y* | | 07/15/09 | | | 17.09 | | | | 7.40 | | | | 8.73 | | |
Class Z | | 11/20/85 | | | 16.84 | | | | 7.30 | | | | 8.68 | | |
Russell Midcap Growth Index | | | | | | | 23.97 | | | | 9.14 | | | | 9.42 | | |
Russell Midcap Index | | | | | | | 24.91 | | | | 9.08 | | | | 10.14 | | |
Returns for Class A and Class T are shown with and without the maximum initial sales charge of 5.75%. Returns for Class B are shown with and without the applicable contingent deferred sales charge (CDSC) of 5.00% in the first year, declining to 1.00% in the sixth year and eliminated thereafter. Returns for Class C are shown with and without the 1.00% CDSC for the first year only. The Fund's other classes are not subject to sales charges and have limited eligibility. Please see the Fund's prospectus for details. Performance for different share classes will vary based on differences in sales charges and fees associated with each class. All results shown assume reinvestment of distributions during the period. Returns do not reflect the deduction of taxes that a shareholder may pay on Fund distributions or on the redemption of Fund shares. Performance results reflect the effect of any fee waivers or reimbursements of Fund expenses by Columbia Management Investment Advisers, LLC and/or any of its affiliates. Absent these fee waivers or expense reimbursement arrangements, performance results would have been lower.
The performance information shown represents past performance and is not a guarantee of future results. The investment return and principal value of your investment will fluctuate so that your shares, when redeemed, may be worth more or less than their original cost. Current performance may be lower or higher than the performance information shown. You may obtain performance information current to the most recent month-end by contacting your financial intermediary, visiting columbiamanagement.com or calling 800.345.6611.
* The returns shown for periods prior to the share class inception date (including returns for the Life of the Fund, if shown, which are since Fund inception) include the returns of the Fund's oldest share class. These returns are adjusted to reflect any higher class-related operating expenses of the newer share classes, as applicable. Please visit columbiamanagement.com/mutual-funds/appended-performance for more information.
The Russell Midcap Growth Index, an unmanaged index, measures the performance of those Russell Midcap Index companies with higher price-to-book ratios and forecasted growth values.
The Russell Midcap Index, an unmanaged index, measures the performance of the 800 smallest companies in the Russell 1000 Index, which represents approximately 25% of the total market capitalization or the Russell 1000 Index.
Indices are not available for investment, are not professionally managed and do not reflect sales charges, fees, brokerage commissions, taxes or other expenses of investing. Securities in the Fund may not match those in an index.
Annual Report 2013
2
Columbia Mid Cap Growth Fund
Performance Overview (continued)
Performance of a Hypothetical $10,000 Investment (September 1, 2003 – August 31, 2013)
The chart above shows the change in value of a hypothetical $10,000 investment in Class A shares of Columbia Mid Cap Growth Fund during the stated time period, and does not reflect the deduction of taxes that a shareholder may pay on Fund distributions or on the redemption of Fund shares.
Annual Report 2013
3
Columbia Mid Cap Growth Fund
Manager Discussion of Fund Performance
For the 12-month period that ended August 31, 2013, the Fund's Class A shares returned 16.60% excluding sales charges. The Fund underperformed its benchmarks, the Russell Midcap Growth Index and the Russell Midcap Index, which returned 23.97% and 24.91%, respectively, for the same 12-month period. Stock selection generally accounted for the shortfall versus both benchmarks. Stock selection in the health care and consumer discretionary sectors was a particular drag on results. During the period, the market favored companies with lower valuations, slower growth potential, higher dividends and higher leverage. The Fund tends to emphasize higher quality companies, with higher growth potential, attractive valuations and sufficient cash flow to support future growth.
Economy Poised to Break out of Doldrums
Concerns about the impact of tax increases and enforced federal spending cuts, another showdown over the debt ceiling and the possibility of an attack on Syria clouded the outlook during the 12-month period ended August 31, 2013. However, steady job growth and a solid rebound in the housing market helped keep economic growth afloat. Pent-up demand, low mortgage rates and an improving labor market have worked to lift home sales. After a brief pullback in the manufacturing sector, manufacturing activity picked up late in the period — a sign that the economy has the potential to break out of the doldrums if confidence rises among consumers and businesses alike. Consumer spending growth has slowed to a crawl, but business surveys and recent demand measures hint that business could be ready to pick up the pace of spending later this year. Against this backdrop, investors bid prices higher on stocks and other riskier assets, as central banks continued to pour liquidity into key markets. However, these sectors pulled back in July and August as civil war in Syria intensified and the Federal Reserve began to talk about removing some of its support.
Stock Selection Detracted from Return
Stock selection generally accounted for the Fund's shortfall relative to the Russell MidCap Growth Index, with the most significant disappointments in the consumer discretionary and health care sectors, where the Fund lost ground on top-performing stocks it did not own. In the consumer discretionary sector, the Fund did not fully enjoy the outsized gains from Tesla Motors, which skyrocketed during the period. We had only a small position in the stock, which was added late in the period. Tesla is an electric vehicle manufacturer whose cars are attempting to upend the automotive industry paradigm that a tradeoff exists between vehicle performance and efficiency. The company's stock began its rise after the company said it had sold enough cars to put it on a pace to outsell other luxury brands. The Fund also missed out on a portion of the significant gains generated by Vertex Pharmaceuticals, which rallied on news that one of its drug trials showed significant improvements in lung function among patients with cystic fibrosis. In addition, certain health care stocks that have driven outperformance in prior periods fell behind during this 12-month period, as investors realized gains in the face of uncertainty regarding the impact of tax hikes and enforced spending cuts. Alexion Pharmaceuticals and Edwards Lifesciences are two such names that detracted from performance during the period.
Portfolio Management
George Myers, CFA
Brian Neigut
James King*
William Chamberlain, CFA*
*Effective September 12, 2013, Mr. King and Mr. Chamberlain assumed responsibility for the day-to-day portfolio management of the Fund, replacing Wayne Collette and Lawrence Lin.
Morningstar Style BoxTM
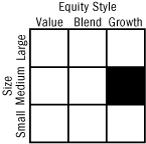
The Morningstar Style BoxTM is based on a fund's portfolio holdings. For equity funds, the vertical axis shows the market capitalization of the stocks owned, and the horizontal axis shows investment style (value, blend, or growth). Information shown is based on the most recent data provided by Morningstar.
©2013 Morningstar, Inc. All rights reserved. The Morningstar information contained herein: (1) is proprietary to Morningstar and/or its content providers; (2) may not be copied or distributed; and (3) is not warranted to be accurate, complete or timely. Neither Morningstar nor its content providers are responsible for any damages or losses arising from any use of this information.
Annual Report 2013
4
Columbia Mid Cap Growth Fund
Manager Discussion of Fund Performance (continued)
Solid Results from Financials, Utilities and Telecommunication Services
Stock selection in financials, utilities and telecommunication services made a positive contribution to the Fund's performance relative to its Russell Midcap Growth Index. Within financials, a significant overweight relative to the Russell Midcap Growth Index in Moody's Corporation aided results as the stock was the top performer in the Fund for the period. Historically low interest rates that created attractive debt issuance costs aided Moody's high margin credit rating business. The company also increased its dividend and share buybacks, both of which were well-received by investors. The Fund's exposure to ITC Holdings, its only position in the utilities sector, was significantly larger than the Russell Midcap Growth Index, which benefited the Fund's relative results with its solid return. The company is the largest independent electricity transmission company in the United States. In telecommunication services, an overweight relative to the Russell Midcap Growth Index in SBA Communications, which owns and operates wireless telecommunications towers, also aided relative performance.
The top individual stock contributor in the portfolio for the period was Onyx Pharmaceuticals. The biotech company, which focuses on the development and commercialization of innovative therapies to improve the lives of cancer patients, rallied on news that it is set to be acquired by Amgen Pharmaceuticals. We sold the stock prior to the end of the period. Other top contributors included Charter Communications and Splunk. Charter Communications, which provides cable services to residential and commercial customers in the United States, reported solid results in the period, the first strong evidence that the turnaround being led by former Cablevision COO Tom Rutledge is beginning to yield results. Splunk provides software that collects and indexes data regardless of format or source, and enables users to search, correlate, analyze, monitor and report on this data, all in real time. Splunk's stock rallied despite a challenging IT spending environment. The company has successfully tapped into the strong secular trend of "big data" — data sets so large and complex that it becomes difficult to process using normal database management tools or traditional data processing applications.
Fund Positioning and Activity
In general, we aim to maintain sector weights that are similar to those of the Russell Midcap Growth Index. Typically, a slight sector over or underweight is more of a reflection of bottom-up stock selection than any top-down call we are making on one sector versus another. Over the course of this 12-month period, the Fund maintained slight overweights in the energy, financials and materials sectors and underweights in the industrials, consumer staples, information technology and consumer discretionary sectors. The overweight in financials represents a change from the beginning of the period, when financials were underweight relative to the Russell Midcap Growth Index. The overweight in the energy sector helped performance, as did the underweight in information technology. On the downside, underweights in consumer staples and consumer discretionary detracted from performance.
Top Ten Holdings (%)
(at August 31, 2013) | |
Sherwin-Williams Co. (The) | | | 2.2 | | |
Affiliated Managers Group, Inc. | | | 1.6 | | |
Alliance Data Systems Corp. | | | 1.5 | | |
Intuit, Inc. | | | 1.5 | | |
Starwood Hotels & Resorts
Worldwide, Inc. | | | 1.5 | | |
Delphi Automotive PLC | | | 1.5 | | |
Cameron International Corp. | | | 1.4 | | |
Actavis, Inc. | | | 1.3 | | |
Delta Air Lines, Inc. | | | 1.3 | | |
SBA Communications Corp.,
Class A | | | 1.3 | | |
Percentages indicated are based upon total investments (excluding Money Market Funds).
For further detail about these holdings, please refer to the section entitled "Portfolio of Investments."
Fund holdings are as of the date given, are subject to change at any time, and are not recommendations to buy or sell any security.
Portfolio Breakdown (%)
(at August 31, 2013) | |
Common Stocks | | | 98.3 | | |
Consumer Discretionary | | | 23.5 | | |
Consumer Staples | | | 6.2 | | |
Energy | | | 6.4 | | |
Financials | | | 9.8 | | |
Health Care | | | 13.1 | | |
Industrials | | | 14.2 | | |
Information Technology | | | 16.3 | | |
Materials | | | 6.6 | | |
Telecommunication Services | | | 1.3 | | |
Utilities | | | 0.9 | | |
Money Market Funds | | | 1.7 | | |
Total | | | 100.0 | | |
Percentages indicated are based upon total investments. The Fund's portfolio composition is subject to change.
Annual Report 2013
5
Columbia Mid Cap Growth Fund
Manager Discussion of Fund Performance (continued)
Looking Ahead
While stocks have held up well during the most recent reporting season, the environment faced by the corporate sector currently looks more like an ebbing than a rising tide. In the absence of a rising tide, investors have appeared satisfied with companies that meet subdued expectations. Price gains have gone mostly to firms that gained market share, capitalized on pockets of sales growth or overcame skepticism that had built up over the period. So while earnings gains have been somewhat uninspiring, we bottom-up stock pickers are probably finding a bit more inspiration than those investors focused on macroeconomic trends. With growth hard to come by, our focus will continue to be on company-specific factors, such as market share and capital deployment, to help us identify businesses that we believe are poised to outperform.
Investment Risks
Risks include stock market fluctuations due to business and economic developments. Investments in small- and mid-cap companies may be subject to greater volatility and price fluctuations because they may be thinly traded and less liquid. See the Fund's prospectus for information on these and other risks.
Annual Report 2013
6
Columbia Mid Cap Growth Fund
Understanding Your Fund's Expenses
(Unaudited)
As an investor, you incur two types of costs. There are transaction costs, which generally include sales charges on purchases and may include redemption fees. There are also ongoing costs, which generally include management fees, distribution and service (Rule 12b-1) fees, and other fund expenses. The following information is intended to help you understand your ongoing costs (in dollars) of investing in the Fund and to help you compare these costs with the ongoing costs of investing in other mutual funds.
Analyzing Your Fund's Expenses
To illustrate these ongoing costs, we have provided examples and calculated the expenses paid by investors in each share class of the Fund during the period. The actual and hypothetical information in the table is based on an initial investment of $1,000 at the beginning of the period indicated and held for the entire period. Expense information is calculated two ways and each method provides you with different information. The amount listed in the "Actual" column is calculated using the Fund's actual operating expenses and total return for the period. You may use the Actual information, together with the amount invested, to estimate the expenses that you paid over the period. Simply divide your account value by $1,000 (for example, an $8,600 account value divided by $1,000 = 8.6), then multiply the results by the expenses paid during the period under the Actual column. The amount listed in the "Hypothetical" column assumes a 5% annual rate of return before expenses (which is not the Fund's actual return) and then applies the Fund's actual expense ratio for the period to the hypothetical return. You should not use the hypothetical account values and expenses to estimate either your actual account balance at the end of the period or the expenses you paid during the period. See "Compare With Other Funds" below for details on how to use the hypothetical data.
Compare With Other Funds
Since all mutual funds are required to include the same hypothetical calculations about expenses in shareholder reports, you can use this information to compare the ongoing cost of investing in the Fund with other funds. To do so, compare the hypothetical example with the 5% hypothetical examples that appear in the shareholder reports of other funds. As you compare hypothetical examples of other funds, it is important to note that hypothetical examples are meant to highlight the ongoing costs of investing in a fund only and do not reflect any transaction costs, such as sales charges, or redemption or exchange fees. Therefore, the hypothetical calculations are useful in comparing ongoing costs only, and will not help you determine the relative total costs of owning different funds. If transaction costs were included in these calculations, your costs would be higher.
March 1, 2013 – August 31, 2013
| | Account Value at the Beginning
of the Period ($) | | Account Value at the End of the
Period ($) | | Expenses Paid During the
Period ($) | | Fund's Annualized
Expense Ratio (%) | |
| | Actual | | Hypothetical | | Actual | | Hypothetical | | Actual | | Hypothetical | | Actual | |
Class A | | | 1,000.00 | | | | 1,000.00 | | | | 1,099.30 | | | | 1,019.05 | | | | 6.32 | | | | 6.07 | | | | 1.20 | | |
Class B | | | 1,000.00 | | | | 1,000.00 | | | | 1,095.00 | | | | 1,015.29 | | | | 10.24 | | | | 9.85 | | | | 1.95 | | |
Class C | | | 1,000.00 | | | | 1,000.00 | | | | 1,095.50 | | | | 1,015.29 | | | | 10.24 | | | | 9.85 | | | | 1.95 | | |
Class I | | | 1,000.00 | | | | 1,000.00 | | | | 1,101.70 | | | | 1,021.26 | | | | 4.00 | | | | 3.85 | | | | 0.76 | | |
Class K | | | 1,000.00 | | | | 1,000.00 | | | | 1,100.10 | | | | 1,019.80 | | | | 5.50 | | | | 5.32 | | | | 1.05 | | |
Class R | | | 1,000.00 | | | | 1,000.00 | | | | 1,097.90 | | | | 1,017.80 | | | | 7.63 | | | | 7.33 | | | | 1.45 | | |
Class R4 | | | 1,000.00 | | | | 1,000.00 | | | | 1,099.40 | | | | 1,020.31 | | | | 5.00 | | | | 4.81 | | | | 0.95 | | |
Class R5 | | | 1,000.00 | | | | 1,000.00 | | | | 1,101.50 | | | | 1,020.96 | | | | 4.32 | | | | 4.15 | | | | 0.82 | | |
Class T | | | 1,000.00 | | | | 1,000.00 | | | | 1,098.70 | | | | 1,018.80 | | | | 6.58 | | | | 6.33 | | | | 1.25 | | |
Class W | | | 1,000.00 | | | | 1,000.00 | | | | 1,099.60 | | | | 1,019.00 | | | | 6.37 | | | | 6.12 | | | | 1.21 | | |
Class Y | | | 1,000.00 | | | | 1,000.00 | | | | 1,102.00 | | | | 1,020.91 | | | | 4.37 | | | | 4.20 | | | | 0.83 | | |
Class Z | | | 1,000.00 | | | | 1,000.00 | | | | 1,100.40 | | | | 1,020.31 | | | | 5.00 | | | | 4.81 | | | | 0.95 | | |
Expenses paid during the period are equal to the annualized expense ratio for each class as indicated above, multiplied by the average account value over the period and then multiplied by the number of days in the Fund's most recent fiscal half year and divided by 365.
Expenses do not include fees and expenses incurred indirectly by the Fund from the underlying funds in which the Fund may invest (also referred to as "acquired funds"), including affiliated and non-affiliated pooled investment vehicles (including mutual funds and exchange-traded funds).
Annual Report 2013
7
Columbia Mid Cap Growth Fund
Portfolio of Investments
August 31, 2013
(Percentages represent value of investments compared to net assets)
Common Stocks 98.3%
Issuer | | Shares | | Value ($) | |
Consumer Discretionary 23.5% | |
Auto Components 2.1% | |
BorgWarner, Inc. | | | 186,110 | | | | 17,974,504 | | |
Delphi Automotive PLC | | | 689,513 | | | | 37,937,005 | | |
Total | | | | | 55,911,509 | | |
Automobiles 0.2% | |
Tesla Motors, Inc.(a) | | | 36,190 | | | | 6,116,110 | | |
Distributors 0.8% | |
LKQ Corp.(a) | | | 665,407 | | | | 19,456,501 | | |
Hotels, Restaurants & Leisure 4.1% | |
Chipotle Mexican Grill, Inc.(a) | | | 40,160 | | | | 16,392,107 | | |
Dunkin' Brands Group, Inc. | | | 370,730 | | | | 15,974,756 | | |
SeaWorld Entertainment, Inc. | | | 536,028 | | | | 16,043,318 | | |
Starwood Hotels & Resorts Worldwide, Inc. | | | 595,376 | | | | 38,068,342 | | |
Wynn Resorts Ltd. | | | 150,658 | | | | 21,248,804 | | |
Total | | | | | 107,727,327 | | |
Internet & Catalog Retail 2.6% | |
Expedia, Inc. | | | 290,845 | | | | 13,599,912 | | |
Netflix, Inc.(a) | | | 101,210 | | | | 28,734,531 | | |
TripAdvisor, Inc.(a) | | | 368,866 | | | | 27,285,018 | | |
Total | | | | | 69,619,461 | | |
Leisure Equipment & Products 1.1% | |
Polaris Industries, Inc. | | | 265,635 | | | | 29,009,998 | | |
Media 4.3% | |
AMC Networks, Inc., Class A(a) | | | 302,540 | | | | 18,751,429 | | |
Charter Communications Operating LLC,
Class A(a) | | | 278,355 | | | | 33,797,864 | | |
Discovery Communications, Inc.,
Class A(a) | | | 438,907 | | | | 34,019,682 | | |
DISH Network Corp., Class A | | | 316,430 | | | | 14,226,693 | | |
Interpublic Group of Companies, Inc. (The) | | | 855,750 | | | | 13,452,390 | | |
Total | | | | | 114,248,058 | | |
Multiline Retail 1.9% | |
Dollar Tree, Inc.(a) | | | 614,406 | | | | 32,379,196 | | |
Macy's, Inc. | | | 422,989 | | | | 18,793,401 | | |
Total | | | | | 51,172,597 | | |
Specialty Retail 3.7% | |
AutoZone, Inc.(a) | | | 52,676 | | | | 22,120,759 | | |
Foot Locker, Inc. | | | 508,339 | | | | 16,368,516 | | |
Common Stocks (continued)
Issuer | | Shares | | Value ($) | |
PetSmart, Inc. | | | 187,102 | | | | 13,177,594 | | |
TJX Companies, Inc. | | | 356,943 | | | | 18,818,035 | | |
Ulta Salon Cosmetics & Fragrance, Inc.(a) | | | 271,484 | | | | 26,942,072 | | |
Total | | | | | 97,426,976 | | |
Textiles, Apparel & Luxury Goods 2.7% | |
lululemon athletica, Inc.(a) | | | 262,130 | | | | 18,569,289 | | |
Michael Kors Holdings Ltd.(a) | | | 408,362 | | | | 30,255,541 | | |
VF Corp. | | | 122,880 | | | | 23,004,365 | | |
Total | | | | | 71,829,195 | | |
Total Consumer Discretionary | | | | | 622,517,732 | | |
Consumer Staples 6.2% | |
Beverages 1.8% | |
Constellation Brands, Inc., Class A(a) | | | 535,730 | | | | 29,063,353 | | |
Monster Beverage Corp.(a) | | | 301,532 | | | | 17,304,921 | | |
Total | | | | | 46,368,274 | | |
Food & Staples Retailing 1.5% | |
Kroger Co. (The) | | | 598,950 | | | | 21,921,570 | | |
Whole Foods Market, Inc. | | | 352,734 | | | | 18,606,718 | | |
Total | | | | | 40,528,288 | | |
Food Products 2.4% | |
Green Mountain Coffee Roasters, Inc.(a) | | | 181,670 | | | | 15,679,938 | | |
Hershey Co. (The) | | | 290,159 | | | | 26,680,120 | | |
Mead Johnson Nutrition Co. | | | 286,067 | | | | 21,463,607 | | |
Total | | | | | 63,823,665 | | |
Personal Products 0.5% | |
Herbalife Ltd. | | | 217,801 | | | | 13,288,039 | | |
Total Consumer Staples | | | | | 164,008,266 | | |
Energy 6.4% | |
Energy Equipment & Services 2.6% | |
Cameron International Corp.(a) | | | 629,675 | | | | 35,759,244 | | |
Oceaneering International, Inc. | | | 253,121 | | | | 19,637,127 | | |
Seadrill Ltd. | | | 325,170 | | | | 15,042,364 | | |
Total | | | | | 70,438,735 | | |
Oil, Gas & Consumable Fuels 3.8% | |
Cabot Oil & Gas Corp. | | | 682,006 | | | | 26,686,895 | | |
Cobalt International Energy, Inc.(a) | | | 420,000 | | | | 10,248,000 | | |
Concho Resources, Inc.(a) | | | 147,367 | | | | 14,222,389 | | |
The accompanying Notes to Financial Statements are an integral part of this statement.
Annual Report 2013
8
Columbia Mid Cap Growth Fund
Portfolio of Investments (continued)
August 31, 2013
Common Stocks (continued)
Issuer | | Shares | | Value ($) | |
Continental Resources, Inc.(a) | | | 144,861 | | | | 13,364,876 | | |
Gulfport Energy Corp.(a) | | | 296,808 | | | | 17,511,672 | | |
SM Energy Co. | | | 259,330 | | | | 17,717,425 | | |
Total | | | | | 99,751,257 | | |
Total Energy | | | | | 170,189,992 | | |
Financials 9.8% | |
Capital Markets 1.6% | |
Affiliated Managers Group, Inc.(a) | | | 244,156 | | | | 42,561,274 | | |
Commercial Banks 1.7% | |
BankUnited, Inc. | | | 475,417 | | | | 14,048,572 | | |
First Republic Bank | | | 317,192 | | | | 14,045,262 | | |
Signature Bank(a) | | | 192,811 | | | | 16,913,381 | | |
Total | | | | | 45,007,215 | | |
Diversified Financial Services 2.0% | |
IntercontinentalExchange, Inc.(a) | | | 99,924 | | | | 17,961,339 | | |
McGraw Hill Financial, Inc. | | | 295,090 | | | | 17,224,403 | | |
Moody's Corp. | | | 306,649 | | | | 19,490,611 | | |
Total | | | | | 54,676,353 | | |
Real Estate Investment Trusts (REITs) 2.6% | |
Alexandria Real Estate Equities, Inc. | | | 199,260 | | | | 12,288,364 | | |
Home Properties, Inc. | | | 273,099 | | | | 15,757,812 | | |
Plum Creek Timber Co., Inc. | | | 384,416 | | | | 17,033,473 | | |
Rayonier, Inc. | | | 439,081 | | | | 24,254,835 | | |
Total | | | | | 69,334,484 | | |
Real Estate Management & Development 1.3% | |
CBRE Group, Inc., Class A(a) | | | 736,604 | | | | 16,109,529 | | |
Realogy Holdings Corp.(a) | | | 416,790 | | | | 17,642,721 | | |
Total | | | | | 33,752,250 | | |
Thrifts & Mortgage Finance 0.6% | |
Ocwen Financial Corp.(a) | | | 307,795 | | | | 15,525,180 | | |
Total Financials | | | | | 260,856,756 | | |
Health Care 13.1% | |
Biotechnology 3.4% | |
Alexion Pharmaceuticals, Inc.(a) | | | 187,354 | | | | 20,189,267 | | |
Ariad Pharmaceuticals, Inc.(a) | | | 980,825 | | | | 18,243,345 | | |
Pharmacyclics, Inc.(a) | | | 187,040 | | | | 20,854,960 | | |
Vertex Pharmaceuticals, Inc.(a) | | | 397,090 | | | | 29,841,314 | | |
Total | | | | | 89,128,886 | | |
Common Stocks (continued)
Issuer | | Shares | | Value ($) | |
Health Care Equipment & Supplies 0.7% | |
Sirona Dental Systems, Inc.(a) | | | 310,060 | | | | 20,082,586 | | |
Health Care Providers & Services 3.6% | |
Brookdale Senior Living, Inc.(a) | | | 861,915 | | | | 21,565,113 | | |
Cardinal Health, Inc. | | | 426,370 | | | | 21,437,884 | | |
Catamaran Corp.(a) | | | 461,881 | | | | 25,361,886 | | |
CHS/Community Health Systems, Inc. | | | 318,170 | | | | 12,491,354 | | |
DaVita HealthCare Partners, Inc.(a) | | | 137,550 | | | | 14,788,000 | | |
Total | | | | | 95,644,237 | | |
Health Care Technology 1.4% | |
Cerner Corp.(a) | | | 520,432 | | | | 23,971,098 | | |
HMS Holdings Corp.(a) | | | 572,047 | | | | 14,295,455 | | |
Total | | | | | 38,266,553 | | |
Life Sciences Tools & Services 1.5% | |
Illumina, Inc.(a) | | | 254,270 | | | | 19,792,377 | | |
Waters Corp.(a) | | | 192,160 | | | | 18,995,016 | | |
Total | | | | | 38,787,393 | | |
Pharmaceuticals 2.5% | |
Actavis, Inc.(a) | | | 256,772 | | | | 34,710,439 | | |
Perrigo Co. | | | 263,855 | | | | 32,071,575 | | |
Total | | | | | 66,782,014 | | |
Total Health Care | | | | | 348,691,669 | | |
Industrials 14.2% | |
Aerospace & Defense 0.6% | |
TransDigm Group, Inc. | | | 118,470 | | | | 16,230,390 | | |
Airlines 1.3% | |
Delta Air Lines, Inc. | | | 1,755,665 | | | | 34,639,270 | | |
Building Products 1.1% | |
Fortune Brands Home & Security, Inc. | | | 774,000 | | | | 28,514,160 | | |
Commercial Services & Supplies 0.8% | |
Stericycle, Inc.(a) | | | 188,913 | | | | 21,264,047 | | |
Construction & Engineering 0.6% | |
KBR, Inc. | | | 540,631 | | | | 16,143,242 | | |
Electrical Equipment 1.8% | |
AMETEK, Inc. | | | 568,183 | | | | 24,386,415 | | |
Rockwell Automation, Inc. | | | 244,723 | | | | 23,794,417 | | |
Total | | | | | 48,180,832 | | |
The accompanying Notes to Financial Statements are an integral part of this statement.
Annual Report 2013
9
Columbia Mid Cap Growth Fund
Portfolio of Investments (continued)
August 31, 2013
Common Stocks (continued)
Issuer | | Shares | | Value ($) | |
Machinery 2.2% | |
Cummins, Inc. | | | 110,214 | | | | 13,578,365 | | |
Ingersoll-Rand PLC | | | 404,210 | | | | 23,904,979 | | |
Pall Corp. | | | 291,230 | | | | 20,135,642 | | |
Total | | | | | 57,618,986 | | |
Professional Services 2.0% | |
Equifax, Inc. | | | 218,550 | | | | 12,914,120 | | |
IHS, Inc., Class A(a) | | | 122,340 | | | | 13,108,731 | | |
Verisk Analytics, Inc., Class A(a) | | | 450,151 | | | | 27,990,389 | | |
Total | | | | | 54,013,240 | | |
Road & Rail 2.2% | |
CSX Corp. | | | 646,953 | | | | 15,921,513 | | |
JB Hunt Transport Services, Inc. | | | 254,515 | | | | 18,325,080 | | |
Kansas City Southern | | | 221,592 | | | | 23,360,229 | | |
Total | | | | | 57,606,822 | | |
Trading Companies & Distributors 1.6% | |
United Rentals, Inc.(a) | | | 351,548 | | | | 19,254,284 | | |
WW Grainger, Inc. | | | 90,228 | | | | 22,317,896 | | |
Total | | | | | 41,572,180 | | |
Total Industrials | | | | | 375,783,169 | | |
Information Technology 16.3% | |
Electronic Equipment, Instruments & Components 0.5% | |
Amphenol Corp., Class A | | | 165,584 | | | | 12,546,299 | | |
Internet Software & Services 2.8% | |
CoStar Group, Inc.(a) | | | 125,349 | | | | 18,615,580 | | |
Equinix, Inc.(a) | | | 76,217 | | | | 13,241,941 | | |
LinkedIn Corp., Class A(a) | | | 101,790 | | | | 24,433,672 | | |
Pandora Media, Inc.(a) | | | 567,730 | | | | 10,457,587 | | |
Yelp, Inc.(a) | | | 152,250 | | | | 7,913,955 | | |
Total | | | | | 74,662,735 | | |
IT Services 4.2% | |
Alliance Data Systems Corp.(a) | | | 197,500 | | | | 38,650,750 | | |
Cognizant Technology Solutions Corp.,
Class A(a) | | | 207,700 | | | | 15,224,410 | | |
Gartner, Inc.(a) | | | 304,750 | | | | 17,666,358 | | |
Teradata Corp.(a) | | | 416,484 | | | | 24,389,303 | | |
Vantiv, Inc., Class A(a) | | | 535,667 | | | | 14,146,965 | | |
Total | | | | | 110,077,786 | | |
Common Stocks (continued)
Issuer | | Shares | | Value ($) | |
Semiconductors & Semiconductor Equipment 2.7% | |
Analog Devices, Inc. | | | 312,840 | | | | 14,478,235 | | |
Applied Materials, Inc. | | | 1,013,320 | | | | 15,209,933 | | |
Avago Technologies Ltd. | | | 227,345 | | | | 8,755,056 | | |
Cree, Inc.(a) | | | 118,770 | | | | 6,590,547 | | |
KLA-Tencor Corp. | | | 237,912 | | | | 13,120,847 | | |
Xilinx, Inc. | | | 330,285 | | | | 14,340,975 | | |
Total | | | | | 72,495,593 | | |
Software 6.1% | |
Citrix Systems, Inc.(a) | | | 238,073 | | | | 16,848,426 | | |
CommVault Systems, Inc.(a) | | | 161,760 | | | | 13,560,341 | | |
Electronic Arts, Inc.(a) | | | 943,080 | | | | 25,123,651 | | |
Informatica Corp.(a) | | | 252,040 | | | | 9,015,471 | | |
Intuit, Inc. | | | 600,145 | | | | 38,127,212 | | |
Salesforce.com, Inc.(a) | | | 466,004 | | | | 22,894,777 | | |
ServiceNow, Inc.(a) | | | 365,150 | | | | 17,118,232 | | |
Splunk, Inc.(a) | | | 336,531 | | | | 18,579,876 | | |
Total | | | | | 161,267,986 | | |
Total Information Technology | | | | | 431,050,399 | | |
Materials 6.6% | |
Chemicals 3.7% | |
CF Industries Holdings, Inc. | | | 117,250 | | | | 22,317,365 | | |
Eastman Chemical Co. | | | 254,213 | | | | 19,320,188 | | |
Sherwin-Williams Co. (The) | | | 328,385 | | | | 56,613,574 | | |
Total | | | | | 98,251,127 | | |
Containers & Packaging 1.3% | |
Crown Holdings, Inc.(a) | | | 384,910 | | | | 16,728,189 | | |
Rock Tenn Co., Class A | | | 150,896 | | | | 16,766,054 | | |
Total | | | | | 33,494,243 | | |
Metals & Mining 0.6% | |
Royal Gold, Inc. | | | 297,254 | | | | 17,249,649 | | |
Paper & Forest Products 1.0% | |
International Paper Co. | | | 540,765 | | | | 25,529,516 | | |
Total Materials | | | | | 174,524,535 | | |
Telecommunication Services 1.3% | |
Wireless Telecommunication Services 1.3% | |
SBA Communications Corp., Class A(a) | | | 456,351 | | | | 34,226,325 | | |
Total Telecommunication Services | | | | | 34,226,325 | | |
The accompanying Notes to Financial Statements are an integral part of this statement.
Annual Report 2013
10
Columbia Mid Cap Growth Fund
Portfolio of Investments (continued)
August 31, 2013
Common Stocks (continued)
Issuer | | Shares | | Value ($) | |
Utilities 0.9% | |
Electric Utilities 0.9% | |
ITC Holdings Corp. | | | 278,531 | | | | 24,758,621 | | |
Total Utilities | | | | | 24,758,621 | | |
Total Common Stocks
(Cost: $2,052,864,514) | | | | | 2,606,607,464 | | |
Money Market Funds 1.7%
| | | Shares | | Value ($) | |
Columbia Short-Term Cash Fund,
0.097%(b)(c) | | | 45,743,876 | | | | 45,743,876 | | |
Total Money Market Funds
(Cost: $45,743,876) | | | | | 45,743,876 | | |
Total Investments
(Cost: $2,098,608,390) | | | | | 2,652,351,340 | | |
Other Assets & Liabilities, Net | | | | | 1,191,249 | | |
Net Assets | | | | | 2,653,542,589 | | |
Notes to Portfolio of Investments
(a) Non-income producing.
(b) The rate shown is the seven-day current annualized yield at August 31, 2013.
(c) As defined in the Investment Company Act of 1940, an affiliated company is one in which the Fund owns 5% or more of its outstanding voting securities, or a company which is under common ownership or control with the Fund. Holdings and transactions in these affiliated companies during the year ended August 31, 2013, are as follows:
Issuer | | Beginning
Cost ($) | | Purchase
Cost ($) | | Proceeds
From Sales ($) | | Ending
Cost ($) | | Dividends —
Affiliated
Issuers ($) | | Value ($) | |
Columbia Short-Term Cash Fund | | | 60,584,979 | | | | 872,423,871 | | | | (887,264,974 | ) | | | 45,743,876 | | | | 59,391 | | | | 45,743,876 | | |
Fair Value Measurements
Generally accepted accounting principles (GAAP) require disclosure regarding the inputs and valuation techniques used to measure fair value and any changes in valuation inputs or techniques. In addition, investments shall be disclosed by major category.
The Fund categorizes its fair value measurements according to a three-level hierarchy that maximizes the use of observable inputs and minimizes the use of unobservable inputs by prioritizing that the most observable input be used when available. Observable inputs are those that market participants would use in pricing an investment based on market data obtained from sources independent of the reporting entity. Unobservable inputs are those that reflect the Fund's assumptions about the information market participants would use in pricing an investment. An investment's level within the fair value hierarchy is based on the lowest level of any input that is deemed significant to the asset or liability's fair value measurement. The input levels are not necessarily an indication of the risk or liquidity associated with investments at that level. For example, certain U.S. government securities are generally high quality and liquid, however, they are reflected as Level 2 because the inputs used to determine fair value may not always be quoted prices in an active market.
Fair value inputs are summarized in the three broad levels listed below:
> Level 1 — Valuations based on quoted prices for investments in active markets that the Fund has the ability to access at the measurement date (including NAV for open-end mutual funds). Valuation adjustments are not applied to Level 1 investments.
> Level 2 — Valuations based on other significant observable inputs (including quoted prices for similar securities, interest rates, prepayment speeds, credit risks, etc.).
> Level 3 — Valuations based on significant unobservable inputs (including the Fund's own assumptions and judgment in determining the fair value of investments).
Inputs that are used in determining fair value of an investment may include price information, credit data, volatility statistics, and other factors. These inputs can be either observable or unobservable. The availability of observable inputs can vary between investments, and is affected by various factors such as the type of investment, and the volume and level of activity for that investment or similar investments in the marketplace. The inputs will be considered by the Investment Manager, along with any other relevant factors in the calculation of an investment's fair value. The Fund uses prices and inputs that are current as of the measurement date, which may include periods of market dislocations. During these periods, the availability of prices and inputs may be reduced for many investments. This condition could cause an investment to be reclassified between the various levels within the hierarchy.
The accompanying Notes to Financial Statements are an integral part of this statement.
Annual Report 2013
11
Columbia Mid Cap Growth Fund
Portfolio of Investments (continued)
August 31, 2013
Fair Value Measurements (continued)
Investments falling into the Level 3 category are primarily supported by quoted prices from brokers and dealers participating in the market for those investments. However, these may be classified as Level 3 investments due to lack of market transparency and corroboration to support these quoted prices. Additionally, valuation models may be used as the pricing source for any remaining investments classified as Level 3. These models may rely on one or more significant unobservable inputs and/or significant assumptions by the Investment Manager. Inputs used in valuations may include, but are not limited to, financial statement analysis, capital account balances, discount rates and estimated cash flows, and comparable company data.
Under the direction of the Fund's Board of Trustees (the Board), the Investment Manager's Valuation Committee (the Committee) is responsible for carrying out the valuation procedures approved by the Board. The Committee consists of voting and non-voting members from various groups within the Investment Manager's organization, including operations and accounting, trading and investments, compliance, risk management and legal.
The Committee meets at least monthly to review and approve valuation matters, which may include a description of specific valuation determinations, data regarding pricing information received from approved pricing vendors and brokers and the results of Board-approved valuation control policies and procedures (the Policies). The Policies address, among other things, instances when market quotations are or are not readily available, including recommendations of third party pricing vendors and a determination of appropriate pricing methodologies; events that require specific valuation determinations and assessment of fair value techniques; securities with a potential for stale pricing, including those that are illiquid, restricted, or in default; and the effectiveness of third-party pricing vendors, including periodic reviews of vendors. The Committee meets more frequently, as needed, to discuss additional valuation matters, which may include the need to review back-testing results, review time-sensitive information or approve related valuation actions. The Committee reports to the Board, with members of the Committee meeting with the Board at each of its regularly scheduled meetings to discuss valuation matters and actions during the period, similar to those described earlier.
For investments categorized as Level 3, the Committee monitors information similar to that described above, which may include: (i) data specific to the issuer or comparable issuers, (ii) general market or specific sector news and (iii) quoted prices and specific or similar security transactions. The Committee considers this data and any changes from prior periods in order to assess the reasonableness of observable and unobservable inputs, any assumptions or internal models used to value those securities and changes in fair value. This data is also used to corroborate, when available, information received from approved pricing vendors and brokers. Various factors impact the frequency of monitoring this information (which may occur as often as daily). However, the Committee may determine that changes to inputs, assumptions and models are not required as a result of the monitoring procedures performed.
The following table is a summary of the inputs used to value the Fund's investments at August 31, 2013:
Description | | Level 1
Quoted Prices in Active
Markets for Identical
Assets ($) | |
Level 2
Other Significant
Observable Inputs ($) | |
Level 3
Significant
Unobservable Inputs ($) | |
Total ($) | |
Equity Securities | |
Common Stocks | |
Consumer Discretionary | | | 622,517,732 | | | | — | | | | — | | | | 622,517,732 | | |
Consumer Staples | | | 164,008,266 | | | | — | | | | — | | | | 164,008,266 | | |
Energy | | | 170,189,992 | | | | — | | | | — | | | | 170,189,992 | | |
Financials | | | 260,856,756 | | | | — | | | | — | | | | 260,856,756 | | |
Health Care | | | 348,691,669 | | | | — | | | | — | | | | 348,691,669 | | |
Industrials | | | 375,783,169 | | | | — | | | | — | | | | 375,783,169 | | |
Information Technology | | | 431,050,399 | | | | — | | | | — | | | | 431,050,399 | | |
Materials | | | 174,524,535 | | | | — | | | | — | | | | 174,524,535 | | |
Telecommunication Services | | | 34,226,325 | | | | — | | | | — | | | | 34,226,325 | | |
Utilities | | | 24,758,621 | | | | — | | | | — | | | | 24,758,621 | | |
Total Equity Securities | | | 2,606,607,464 | | | | — | | | | — | | | | 2,606,607,464 | | |
Mutual Funds | |
Money Market Funds | | | 45,743,876 | | | | — | | | | — | | | | 45,743,876 | | |
Total Mutual Funds | | | 45,743,876 | | | | — | | | | — | | | | 45,743,876 | | |
Total | | | 2,652,351,340 | | | | — | | | | — | | | | 2,652,351,340 | | |
See the Portfolio of Investments for all investment classifications not indicated in the table.
There were no transfers of financial assets between Levels 1 and 2 during the period.
The accompanying Notes to Financial Statements are an integral part of this statement.
Annual Report 2013
12
Columbia Mid Cap Growth Fund
Statement of Assets and Liabilities
August 31, 2013
Assets | |
Investments, at value | |
Unaffiliated issuers (identified cost $2,052,864,514) | | $ | 2,606,607,464 | | |
Affiliated issuers (identified cost $45,743,876) | | | 45,743,876 | | |
Total investments (identified cost $2,098,608,390) | | | 2,652,351,340 | | |
Receivable for: | |
Investments sold | | | 39,783,447 | | |
Capital shares sold | | | 756,122 | | |
Dividends | | | 2,169,510 | | |
Prepaid expenses | | | 32,252 | | |
Trustees' deferred compensation plan | | | 83,730 | | |
Other assets | | | 2,197 | | |
Total assets | | | 2,695,178,598 | | |
Liabilities | |
Payable for: | |
Investments purchased | | | 39,111,936 | | |
Capital shares purchased | | | 1,575,014 | | |
Investment management fees | | | 49,279 | | |
Distribution and/or service fees | | | 10,018 | | |
Transfer agent fees | | | 399,706 | | |
Administration fees | | | 3,865 | | |
Plan administration fees | | | 90 | | |
Compensation of board members | | | 78,416 | | |
Chief compliance officer expenses | | | 392 | | |
Other expenses | | | 323,563 | | |
Trustees' deferred compensation plan | | | 83,730 | | |
Total liabilities | | | 41,636,009 | | |
Net assets applicable to outstanding capital stock | | $ | 2,653,542,589 | | |
Represented by | |
Paid-in capital | | $ | 1,994,096,256 | | |
Excess of distributions over net investment income | | | (163,569 | ) | |
Accumulated net realized gain | | | 105,866,952 | | |
Unrealized appreciation (depreciation) on: | |
Investments | | | 553,742,950 | | |
Total — representing net assets applicable to outstanding capital stock | | $ | 2,653,542,589 | | |
The accompanying Notes to Financial Statements are an integral part of this statement.
Annual Report 2013
13
Columbia Mid Cap Growth Fund
Statement of Assets and Liabilities (continued)
August 31, 2013
Class A | |
Net assets | | $ | 986,482,089 | | |
Shares outstanding | | | 33,003,751 | | |
Net asset value per share | | $ | 29.89 | | |
Maximum offering price per share(a) | | $ | 31.71 | | |
Class B | |
Net assets | | $ | 17,993,864 | | |
Shares outstanding | | | 661,466 | | |
Net asset value per share | | $ | 27.20 | | |
Class C | |
Net assets | | $ | 52,284,283 | | |
Shares outstanding | | | 1,915,501 | | |
Net asset value per share | | $ | 27.30 | | |
Class I | |
Net assets | | $ | 240,973,678 | | |
Shares outstanding | | | 7,750,972 | | |
Net asset value per share | | $ | 31.09 | | |
Class K | |
Net assets | | $ | 396,297 | | |
Shares outstanding | | | 12,828 | | |
Net asset value per share | | $ | 30.89 | | |
Class R | |
Net assets | | $ | 27,574,057 | | |
Shares outstanding | | | 941,684 | | |
Net asset value per share | | $ | 29.28 | | |
Class R4 | |
Net assets | | $ | 30,058 | | |
Shares outstanding | | | 957 | | |
Net asset value per share(b) | | $ | 31.42 | | |
Class R5 | |
Net assets | | $ | 3,846,849 | | |
Shares outstanding | | | 123,988 | | |
Net asset value per share | | $ | 31.03 | | |
Class T | |
Net assets | | $ | 22,026,849 | | |
Shares outstanding | | | 738,590 | | |
Net asset value per share | | $ | 29.82 | | |
Maximum offering price per share(a) | | $ | 31.64 | | |
Class W | |
Net assets | | $ | 104,751,754 | | |
Shares outstanding | | | 3,502,730 | | |
Net asset value per share | | $ | 29.91 | | |
The accompanying Notes to Financial Statements are an integral part of this statement.
Annual Report 2013
14
Columbia Mid Cap Growth Fund
Statement of Assets and Liabilities (continued)
August 31, 2013
Class Y | |
Net assets | | $ | 229,422 | | |
Shares outstanding | | | 7,399 | | |
Net asset value per share | | $ | 31.01 | | |
Class Z | |
Net assets | | $ | 1,196,953,389 | | |
Shares outstanding | | | 38,719,324 | | |
Net asset value per share | | $ | 30.91 | | |
(a) The maximum offering price per share is calculated by dividing the net asset value per share by 1.0 minus the maximum sales charge of 5.75%.
(b) Net asset value per share rounds to this amount due to fractional shares outstanding.
The accompanying Notes to Financial Statements are an integral part of this statement.
Annual Report 2013
15
Columbia Mid Cap Growth Fund
Statement of Operations
Year Ended August 31, 2013
Net investment income | |
Income: | |
Dividends — unaffiliated issuers | | $ | 20,239,169 | | |
Dividends — affiliated issuers | | | 59,391 | | |
Interest | | | 174,857 | | |
Income from securities lending — net | | | 319,797 | | |
Foreign taxes withheld | | | (10,998 | ) | |
Total income | | | 20,782,216 | | |
Expenses: | |
Investment management fees | | | 15,698,296 | | |
Distribution and/or service fees | |
Class A | | | 1,551,563 | | |
Class B | | | 120,026 | | |
Class C | | | 476,978 | | |
Class R | | | 133,490 | | |
Class T | | | 63,649 | | |
Class W | | | 197,722 | | |
Transfer agent fees | |
Class A | | | 1,169,546 | | |
Class B | | | 22,664 | | |
Class C | | | 89,302 | | |
Class K(a) | | | 106 | | |
Class R | | | 49,944 | | |
Class R4(b) | | | 30 | | |
Class R5 | | | 460 | | |
Class T | | | 39,683 | | |
Class W | | | 148,125 | | |
Class Y | | | 4 | | |
Class Z | | | 2,290,549 | | |
Administration fees | | | 1,226,218 | | |
Plan administration fees | |
Class K | | | 531 | | |
Compensation of board members | | | 76,628 | | |
Custodian fees | | | 23,819 | | |
Printing and postage fees | | | 424,179 | | |
Registration fees | | | 120,769 | | |
Professional fees | | | 88,650 | | |
Chief compliance officer expenses | | | 1,640 | | |
Other | | | 73,195 | | |
Total expenses | | | 24,087,766 | | |
Expense reductions | | | (13,714 | ) | |
Total net expenses | | | 24,074,052 | | |
Net investment loss | | | (3,291,836 | ) | |
Realized and unrealized gain (loss) — net | |
Net realized gain (loss) on: | |
Investments | | | 250,851,971 | | |
Foreign currency translations | | | 2,538 | | |
Net realized gain | | | 250,854,509 | | |
Net change in unrealized appreciation (depreciation) on: | |
Investments | | | 109,728,859 | | |
Foreign currency translations | | | (2,947 | ) | |
Net change in unrealized appreciation (depreciation) | | | 109,725,912 | | |
Net realized and unrealized gain | | | 360,580,421 | | |
Net increase in net assets resulting from operations | | $ | 357,288,585 | | |
(a) For the period from February 28, 2013 (commencement of operations) to August 31, 2013.
(b) For the period from November 8, 2012 (commencement of operations) to August 31, 2013.
The accompanying Notes to Financial Statements are an integral part of this statement.
Annual Report 2013
16
Columbia Mid Cap Growth Fund
Statement of Changes in Net Assets
| | | Year Ended
August 31,
2013(a)(b) | | Year Ended
August 31,
2012 | |
Operations | |
Net investment loss | | $ | (3,291,836 | ) | | $ | (677,356 | ) | |
Net realized gain | | | 250,854,509 | | | | 66,339,006 | | |
Net change in unrealized appreciation (depreciation) | | | 109,725,912 | | | | 64,405,118 | | |
Net increase in net assets resulting from operations | | | 357,288,585 | | | | 130,066,768 | | |
Distributions to shareholders | |
Net realized gains | |
Class A | | | (9,008,327 | ) | | | (10,402,453 | ) | |
Class B | | | (148,454 | ) | | | (244,122 | ) | |
Class C | | | (1,367,235 | ) | | | (1,847,175 | ) | |
Class I | | | (7,549,768 | ) | | | (7,452,588 | ) | |
Class R | | | (743,840 | ) | | | (898,218 | ) | |
Class R4 | | | (72 | ) | | | — | | |
Class R5 | | | (797 | ) | | | (68,559 | ) | |
Class T | | | (596,346 | ) | | | (689,253 | ) | |
Class W | | | (1,984,787 | ) | | | (2,109,978 | ) | |
Class Y | | | (462 | ) | | | (1,009 | ) | |
Class Z | | | (34,501,877 | ) | | | (38,781,757 | ) | |
Total distributions to shareholders | | | (55,901,965 | ) | | | (62,495,112 | ) | |
Increase (decrease) in net assets from capital stock activity | | | 313,216,538 | | | | 130,317,525 | | |
Proceeds from regulatory settlements (Note 6) | | | — | | | | 26,617 | | |
Total increase in net assets | | | 614,603,158 | | | | 197,915,798 | | |
Net assets at beginning of year | | | 2,038,939,431 | | | | 1,841,023,633 | | |
Net assets at end of year | | $ | 2,653,542,589 | | | $ | 2,038,939,431 | | |
Excess of distributions over net investment income | | $ | (163,569 | ) | | $ | (637,724 | ) | |
(a) Class K shares are for the period from February 28, 2013 (commencement of operations) to August 31, 2013.
(b) Class R4 shares are for the period from November 8, 2012 (commencement of operations) to August 31, 2013.
The accompanying Notes to Financial Statements are an integral part of this statement.
Annual Report 2013
17
Columbia Mid Cap Growth Fund
Statement of Changes in Net Assets (continued)
| | | Year Ended August 31, 2013(a)(b) | | Year Ended August 31, 2012 | |
| | | Shares | | Dollars ($) | | Shares | | Dollars ($) | |
Capital stock activity | |
Class A shares | |
Subscriptions(c) | | | 2,132,441 | | | | 60,131,106 | | | | 3,669,127 | | | | 93,936,684 | | |
Fund merger | | | 22,792,214 | | | | 634,205,775 | | | | — | | | | — | | |
Distributions reinvested | | | 316,741 | | | | 8,019,884 | | | | 362,319 | | | | 9,010,863 | | |
Redemptions | | | (4,742,085 | ) | | | (132,095,393 | ) | | | (3,342,581 | ) | | | (85,793,496 | ) | |
Net increase | | | 20,499,311 | | | | 570,261,372 | | | | 688,865 | | | | 17,154,051 | | |
Class B shares | |
Subscriptions | | | 10,356 | | | | 266,150 | | | | 15,611 | | | | 364,311 | | |
Fund merger | | | 692,621 | | | | 17,602,015 | | | | — | | | | — | | |
Distributions reinvested | | | 5,429 | | | | 125,783 | | | | 8,783 | | | | 202,000 | | |
Redemptions(c) | | | (258,587 | ) | | | (6,823,327 | ) | | | (130,645 | ) | | | (3,092,296 | ) | |
Net increase (decrease) | | | 449,819 | | | | 11,170,621 | | | | (106,251 | ) | | | (2,525,985 | ) | |
Class C shares | |
Subscriptions | | | 169,335 | | | | 4,271,385 | | | | 318,841 | | | | 7,522,254 | | |
Fund merger | | | 327,825 | | | | 8,360,268 | | | | — | | | | — | | |
Distributions reinvested | | | 47,498 | | | | 1,104,318 | | | | 61,012 | | | | 1,407,536 | | |
Redemptions | | | (485,648 | ) | | | (12,252,188 | ) | | | (783,350 | ) | | | (18,459,578 | ) | |
Net increase (decrease) | | | 59,010 | | | | 1,483,783 | | | | (403,497 | ) | | | (9,529,788 | ) | |
Class I shares | |
Subscriptions | | | 122,602 | | | | 3,326,010 | | | | 5,178,378 | | | | 132,843,374 | | |
Fund merger | | | 417 | | | | 12,034 | | | | — | | | | — | | |
Distributions reinvested | | | 287,599 | | | | 7,549,478 | | | | 290,650 | | | | 7,452,275 | | |
Redemptions | | | (2,488,726 | ) | | | (75,107,256 | ) | | | (2,448,515 | ) | | | (64,528,346 | ) | |
Net increase (decrease) | | | (2,078,108 | ) | | | (64,219,734 | ) | | | 3,020,513 | | | | 75,767,303 | | |
Class K shares | |
Subscriptions | | | 2,379 | | | | 71,450 | | | | — | | | | — | | |
Fund merger | | | 17,936 | | | | 515,477 | | | | — | | | | — | | |
Redemptions | | | (7,487 | ) | | | (228,679 | ) | | | — | | | | — | | |
Net increase | | | 12,828 | | | | 358,248 | | | | — | | | | — | | |
Class R shares | |
Subscriptions | | | 258,541 | | | | 6,929,458 | | | | 571,120 | | | | 14,387,473 | | |
Fund merger | | | 1,849 | | | | 50,460 | | | | — | | | | — | | |
Distributions reinvested | | | 23,306 | | | | 579,143 | | | | 24,943 | | | | 610,857 | | |
Redemptions | | | (328,787 | ) | | | (8,916,344 | ) | | | (641,469 | ) | | | (16,077,744 | ) | |
Net decrease | | | (45,091 | ) | | | (1,357,283 | ) | | | (45,406 | ) | | | (1,079,414 | ) | |
The accompanying Notes to Financial Statements are an integral part of this statement.
Annual Report 2013
18
Columbia Mid Cap Growth Fund
Statement of Changes in Net Assets (continued)
| | | Year Ended August 31, 2013(a)(b) | | Year Ended August 31, 2012 | |
| | | Shares | | Dollars ($) | | Shares | | Dollars ($) | |
Capital stock activity (continued) | |
Class R4 shares | |
Subscriptions | | | 675 | | | | 19,618 | | | | — | | | | — | | |
Fund merger | | | 282 | | | | 8,249 | | | | — | | | | — | | |
Net increase | | | 957 | | | | 27,867 | | | | — | | | | — | | |
Class R5 shares | |
Subscriptions | | | 253,260 | | | | 7,855,744 | | | | — | | | | — | | |
Distributions reinvested | | | 28 | | | | 728 | | | | 2,673 | | | | 68,485 | | |
Redemptions | | | (214,834 | ) | | | (6,554,386 | ) | | | (164 | ) | | | (4,325 | ) | |
Net increase | | | 38,454 | | | | 1,302,086 | | | | 2,509 | | | | 64,160 | | |
Class T shares | |
Subscriptions | | | 5,163 | | | | 136,645 | | | | 12,737 | | | | 321,169 | | |
Distributions reinvested | | | 19,642 | | | | 496,360 | | | | 22,729 | | | | 564,595 | | |
Redemptions | | | (81,218 | ) | | | (2,232,305 | ) | | | (100,762 | ) | | | (2,598,819 | ) | |
Net decrease | | | (56,413 | ) | | | (1,599,300 | ) | | | (65,296 | ) | | | (1,713,055 | ) | |
Class W shares | |
Subscriptions | | | 1,492,129 | | | | 42,509,692 | | | | 1,503,688 | | | | 38,209,460 | | |
Distributions reinvested | | | 78,354 | | | | 1,984,703 | | | | 84,803 | | | | 2,109,887 | | |
Redemptions | | | (591,709 | ) | | | (16,466,168 | ) | | | (816,211 | ) | | | (20,826,294 | ) | |
Net increase | | | 978,774 | | | | 28,028,227 | | | | 772,280 | | | | 19,493,053 | | |
Class Y shares | |
Subscriptions | | | 6,796 | | | | 210,137 | | | | — | | | | — | | |
Distributions reinvested | | | — | | | | — | | | | 20 | | | | 511 | | |
Redemptions | | | — | | | | — | | | | (639 | ) | | | (17,508 | ) | |
Net increase (decrease) | | | 6,796 | | | | 210,137 | | | | (619 | ) | | | (16,997 | ) | |
Class Z shares | |
Subscriptions | | | 2,978,798 | | | | 83,552,744 | | | | 12,346,093 | | | | 321,362,441 | | |
Fund merger | | | 51,867 | | | | 1,490,949 | | | | — | | | | — | | |
Distributions reinvested | | | 826,522 | | | | 21,605,284 | | | | 854,749 | | | | 21,873,025 | | |
Redemptions | | | (11,931,071 | ) | | | (339,098,463 | ) | | | (11,739,452 | ) | | | (310,531,269 | ) | |
Net increase (decrease) | | | (8,073,884 | ) | | | (232,449,486 | ) | | | 1,461,390 | | | | 32,704,197 | | |
Total net increase | | | 11,792,453 | | | | 313,216,538 | | | | 5,324,488 | | | | 130,317,525 | | |
(a) Class K shares are for the period from February 28, 2013 (commencement of operations) to August 31, 2013.
(b) Class R4 shares are for the period from November 8, 2012 (commencement of operations) to August 31, 2013.
(c) Includes conversions of Class B shares to Class A shares, if any.
The accompanying Notes to Financial Statements are an integral part of this statement.
Annual Report 2013
19
Columbia Mid Cap Growth Fund
The following tables are intended to help you understand the Fund's financial performance. Certain information reflects financial results for a single share of a class held for the periods shown. Per share net investment income (loss) amounts are calculated based on average shares outstanding during the period. Total return assumes reinvestment of all dividends and distributions, if any. Total return does not reflect payment of sales charges, if any, and is not annualized for periods of less than one year.
| | | Year Ended August 31, | |
Class A | | 2013 | | 2012 | | 2011 | | 2010 | | 2009 | |
Per share data | |
Net asset value, beginning of period | | $ | 26.41 | | | $ | 25.75 | | | $ | 20.22 | | | $ | 17.58 | | | $ | 23.47 | | |
Income from investment operations: | |
Net investment loss | | | (0.11 | ) | | | (0.06 | ) | | | (0.17 | ) | | | (0.10 | ) | | | (0.03 | ) | |
Net realized and unrealized gain (loss) | | | 4.36 | | | | 1.55 | | | | 5.70 | | | | 2.74 | | | | (5.37 | ) | |
Total from investment operations | | | 4.25 | | | | 1.49 | | | | 5.53 | | | | 2.64 | | | | (5.40 | ) | |
Less distributions to shareholders: | |
Net realized gains | | | (0.77 | ) | | | (0.83 | ) | | | — | | | | — | | | | (0.49 | ) | |
Total distributions to shareholders | | | (0.77 | ) | | | (0.83 | ) | | | — | | | | — | | | | (0.49 | ) | |
Proceeds from regulatory settlements | | | — | | | | 0.00 | (a) | | | 0.00 | (a) | | | — | | | | 0.00 | (a) | |
Net asset value, end of period | | $ | 29.89 | | | $ | 26.41 | | | $ | 25.75 | | | $ | 20.22 | | | $ | 17.58 | | |
Total return | | | 16.60 | % | | | 5.97 | % | | | 27.35 | % | | | 15.02 | % | | | (22.38 | %) | |
Ratios to average net assets(b)(c) | |
Total gross expenses | | | 1.20 | % | | | 1.22 | % | | | 1.19 | %(d) | | | 1.23 | %(d) | | | 1.26 | % | |
Total net expenses(e) | | | 1.20 | %(f) | | | 1.22 | %(f) | | | 1.19 | %(d)(f) | | | 1.23 | %(d)(f) | | | 1.26 | %(f) | |
Net investment loss | | | (0.40 | %) | | | (0.22 | %) | | | (0.63 | %) | | | (0.49 | %) | | | (0.20 | %) | |
Supplemental data | |
Net assets, end of period (in thousands) | | $ | 986,482 | | | $ | 330,302 | | | $ | 304,214 | | | $ | 65,123 | | | $ | 53,881 | | |
Portfolio turnover | | | 109 | % | | | 141 | % | | | 138 | % | | | 137 | % | | | 160 | % | |
Notes to Financial Highlights
(a) Rounds to zero.
(b) In addition to the fees and expenses which the Fund bears directly, the Fund indirectly bears a pro rata share of the fees and expenses of the acquired funds in which it invests. Such indirect expenses are not included in the reported expense ratios.
(c) Certain line items from prior years have been reclassified to conform to the current presentation.
(d) Ratios include line of credit interest expense which rounds to less than 0.01%.
(e) Total net expenses include the impact of certain waivers/reimbursements made by the Investment Manager and certain of its affiliates, if applicable.
(f) The benefits derived from expense reductions had an impact of less than 0.01%.
The accompanying Notes to Financial Statements are an integral part of this statement.
Annual Report 2013
20
Columbia Mid Cap Growth Fund
Financial Highlights (continued)
| | | Year Ended August 31, | |
Class B | | 2013 | | 2012 | | 2011 | | 2010 | | 2009 | |
Per share data | |
Net asset value, beginning of period | | $ | 24.29 | | | $ | 23.92 | | | $ | 18.93 | | | $ | 16.59 | | | $ | 22.35 | | |
Income from investment operations: | |
Net investment income (loss) | | | (0.31 | ) | | | (0.23 | ) | | | (0.34 | ) | | | (0.23 | ) | | | (0.14 | ) | |
Net realized and unrealized gain (loss) | | | 3.99 | | | | 1.43 | | | | 5.33 | | | | 2.57 | | | | (5.13 | ) | |
Total from investment operations | | | 3.68 | | | | 1.20 | | | | 4.99 | | | | 2.34 | | | | (5.27 | ) | |
Less distributions to shareholders: | |
Net realized gains | | | (0.77 | ) | | | (0.83 | ) | | | — | | | | — | | | | (0.49 | ) | |
Total distributions to shareholders | | | (0.77 | ) | | | (0.83 | ) | | | — | | | | — | | | | (0.49 | ) | |
Proceeds from regulatory settlements | | | — | | | | 0.00 | (a) | | | 0.00 | (a) | | | — | | | | 0.00 | (a) | |
Net asset value, end of period | | $ | 27.20 | | | $ | 24.29 | | | $ | 23.92 | | | $ | 18.93 | | | $ | 16.59 | | |
Total return | | | 15.68 | % | | | 5.19 | % | | | 26.36 | % | | | 14.10 | % | | | (22.93 | %) | |
Ratios to average net assets(b)(c) | |
Total gross expenses | | | 1.95 | % | | | 1.99 | % | | | 1.95 | %(d) | | | 1.98 | %(d) | | | 2.01 | % | |
Total net expenses(e) | | | 1.95 | %(f) | | | 1.99 | %(f) | | | 1.95 | %(d)(f) | | | 1.98 | %(d)(f) | | | 2.01 | %(f) | |
Net investment loss | | | (1.20 | %) | | | (0.99 | %) | | | (1.39 | %) | | | (1.24 | %) | | | (0.95 | %) | |
Supplemental data | |
Net assets, end of period (in thousands) | | $ | 17,994 | | | $ | 5,140 | | | $ | 7,604 | | | $ | 5,582 | | | $ | 8,322 | | |
Portfolio turnover | | | 109 | % | | | 141 | % | | | 138 | % | | | 137 | % | | | 160 | % | |
Notes to Financial Highlights
(a) Rounds to zero.
(b) In addition to the fees and expenses which the Fund bears directly, the Fund indirectly bears a pro rata share of the fees and expenses of the acquired funds in which it invests. Such indirect expenses are not included in the reported expense ratios.
(c) Certain line items from prior years have been reclassified to conform to the current presentation.
(d) Ratios include line of credit interest expense which rounds to less than 0.01%.
(e) Total net expenses include the impact of certain waivers/reimbursements made by the Investment Manager and certain of its affiliates, if applicable.
(f) The benefits derived from expense reductions had an impact of less than 0.01%.
The accompanying Notes to Financial Statements are an integral part of this statement.
Annual Report 2013
21
Columbia Mid Cap Growth Fund
Financial Highlights (continued)
| | | Year Ended August 31, | |
Class C | | 2013 | | 2012 | | 2011 | | 2010 | | 2009 | |
Per share data | |
Net asset value, beginning of period | | $ | 24.37 | | | $ | 23.99 | | | $ | 18.98 | | | $ | 16.63 | | | $ | 22.41 | | |
Income from investment operations: | |
Net investment loss | | | (0.26 | ) | | | (0.23 | ) | | | (0.35 | ) | | | (0.24 | ) | | | (0.14 | ) | |
Net realized and unrealized gain (loss) | | | 3.96 | | | | 1.44 | | | | 5.36 | | | | 2.59 | | | | (5.15 | ) | |
Total from investment operations | | | 3.70 | | | | 1.21 | | | | 5.01 | | | | 2.35 | | | | (5.29 | ) | |
Less distributions to shareholders: | |
Net realized gains | | | (0.77 | ) | | | (0.83 | ) | | | — | | | | — | | | | (0.49 | ) | |
Total distributions to shareholders | | | (0.77 | ) | | | (0.83 | ) | | | — | | | | — | | | | (0.49 | ) | |
Proceeds from regulatory settlements | | | — | | | | 0.00 | (a) | | | 0.00 | (a) | | | — | | | | 0.00 | (a) | |
Net asset value, end of period | | $ | 27.30 | | | $ | 24.37 | | | $ | 23.99 | | | $ | 18.98 | | | $ | 16.63 | | |
Total return | | | 15.71 | % | | | 5.22 | % | | | 26.40 | % | | | 14.13 | % | | | (22.96 | %) | |
Ratios to average net assets(b)(c) | |
Total gross expenses | | | 1.96 | % | | | 1.98 | % | | | 1.94 | %(d) | | | 1.98 | %(d) | | | 2.01 | % | |
Total net expenses(e) | | | 1.96 | %(f) | | | 1.98 | %(f) | | | 1.94 | %(d)(f) | | | 1.98 | %(d)(f) | | | 2.01 | %(f) | |
Net investment loss | | | (1.04 | %) | | | (0.98 | %) | | | (1.39 | %) | | | (1.24 | %) | | | (0.95 | %) | |
Supplemental data | |
Net assets, end of period (in thousands) | | $ | 52,284 | | | $ | 45,236 | | | $ | 54,224 | | | $ | 9,858 | | | $ | 9,106 | | |
Portfolio turnover | | | 109 | % | | | 141 | % | | | 138 | % | | | 137 | % | | | 160 | % | |
Notes to Financial Highlights
(a) Rounds to zero.
(b) In addition to the fees and expenses which the Fund bears directly, the Fund indirectly bears a pro rata share of the fees and expenses of the acquired funds in which it invests. Such indirect expenses are not included in the reported expense ratios.
(c) Certain line items from prior years have been reclassified to conform to the current presentation.
(d) Ratios include line of credit interest expense which rounds to less than 0.01%.
(e) Total net expenses include the impact of certain waivers/reimbursements made by the Investment Manager and certain of its affiliates, if applicable.
(f) The benefits derived from expense reductions had an impact of less than 0.01%.
The accompanying Notes to Financial Statements are an integral part of this statement.
Annual Report 2013
22
Columbia Mid Cap Growth Fund
Financial Highlights (continued)
| | | Year Ended August 31, | |
Class I | | 2013 | | 2012 | | 2011(a) | |
Per share data | |
Net asset value, beginning of period | | $ | 27.33 | | | $ | 26.49 | | | $ | 23.23 | | |
Income from investment operations: | |
Net investment income (loss) | | | 0.05 | | | | 0.06 | | | | (0.06 | ) | |
Net realized and unrealized gain | | | 4.48 | | | | 1.61 | | | | 3.32 | | |
Total from investment operations | | | 4.53 | | | | 1.67 | | | | 3.26 | | |
Less distributions to shareholders: | |
Net realized gains | | | (0.77 | ) | | | (0.83 | ) | | | — | | |
Total distributions to shareholders | | | (0.77 | ) | | | (0.83 | ) | | | — | | |
Proceeds from regulatory settlements | | | — | | | | 0.00 | (b) | | | 0.00 | (b) | |
Net asset value, end of period | | $ | 31.09 | | | $ | 27.33 | | | $ | 26.49 | | |
Total return | | | 17.08 | % | | | 6.49 | % | | | 14.03 | % | |
Ratios to average net assets(c)(d) | |
Total gross expenses | | | 0.77 | % | | | 0.78 | % | | | 0.80 | %(e)(f) | |
Total net expenses(g) | | | 0.77 | % | | | 0.78 | % | | | 0.80 | %(e)(f)(h) | |
Net investment income (loss) | | | 0.17 | % | | | 0.23 | % | | | (0.22 | %)(e) | |
Supplemental data | |
Net assets, end of period (in thousands) | | $ | 240,974 | | | $ | 268,601 | | | $ | 180,383 | | |
Portfolio turnover | | | 109 | % | | | 141 | % | | | 138 | % | |
Notes to Financial Highlights
(a) For the period from September 7, 2010 (commencement of operations) to August 31, 2011.
(b) Rounds to zero.
(c) In addition to the fees and expenses which the Fund bears directly, the Fund indirectly bears a pro rata share of the fees and expenses of the acquired funds in which it invests. Such indirect expenses are not included in the reported expense ratios.
(d) Certain line items from prior years have been reclassified to conform to the current presentation.
(e) Annualized.
(f) Ratios include line of credit interest expense which rounds to less than 0.01%.
(g) Total net expenses include the impact of certain waivers/reimbursements made by the Investment Manager and certain of its affiliates, if applicable.
(h) The benefits derived from expense reductions had an impact of less than 0.01%.
The accompanying Notes to Financial Statements are an integral part of this statement.
Annual Report 2013
23
Columbia Mid Cap Growth Fund
Financial Highlights (continued)
Class K | | Year Ended
August 31,
2013(a) | |
Per share data | |
Net asset value, beginning of period | | $ | 28.08 | | |
Income from investment operations: | |
Net investment loss | | | (0.06 | ) | |
Net realized and unrealized gain | | | 2.87 | | |
Total from investment operations | | | 2.81 | | |
Net asset value, end of period | | $ | 30.89 | | |
Total return | | | 10.01 | % | |
Ratios to average net assets(b) | |
Total gross expenses | | | 1.05 | %(c) | |
Total net expenses(d) | | | 1.05 | %(c) | |
Net investment loss | | | (0.42 | %)(c) | |
Supplemental data | |
Net assets, end of period (in thousands) | | $ | 396 | | |
Portfolio turnover | | | 109 | % | |
Notes to Financial Highlights
(a) For the period from February 28, 2013 (commencement of operations) to August 31, 2013.
(b) In addition to the fees and expenses which the Fund bears directly, the Fund indirectly bears a pro rata share of the fees and expenses of the acquired funds in which it invests. Such indirect expenses are not included in the reported expense ratios.
(c) Annualized.
(d) Total net expenses include the impact of certain waivers/reimbursements made by the Investment Manager and certain of its affiliates, if applicable.
The accompanying Notes to Financial Statements are an integral part of this statement.
Annual Report 2013
24
Columbia Mid Cap Growth Fund
Financial Highlights (continued)
| | | Year Ended August 31, | |
Class R | | 2013 | | 2012 | | 2011 | | 2010 | | 2009 | |
Per share data | |
Net asset value, beginning of period | | $ | 25.96 | | | $ | 25.38 | | | $ | 19.98 | | | $ | 17.42 | | | $ | 23.32 | | |
Income from investment operations: | |
Net investment loss | | | (0.14 | ) | | | (0.12 | ) | | | (0.23 | ) | | | (0.15 | ) | | | (0.07 | ) | |
Net realized and unrealized gain (loss) | | | 4.23 | | | | 1.53 | | | | 5.63 | | | | 2.71 | | | | (5.34 | ) | |
Total from investment operations | | | 4.09 | | | | 1.41 | | | | 5.40 | | | | 2.56 | | | | (5.41 | ) | |
Less distributions to shareholders: | |
Net realized gains | | | (0.77 | ) | | | (0.83 | ) | | | — | | | | — | | | | (0.49 | ) | |
Total distributions to shareholders | | | (0.77 | ) | | | (0.83 | ) | | | — | | | | — | | | | (0.49 | ) | |
Proceeds from regulatory settlements | | | — | | | | 0.00 | (a) | | | 0.00 | (a) | | | — | | | | 0.00 | (a) | |
Net asset value, end of period | | $ | 29.28 | | | $ | 25.96 | | | $ | 25.38 | | | $ | 19.98 | | | $ | 17.42 | | |
Total return | | | 16.27 | % | | | 5.73 | % | | | 27.03 | % | | | 14.70 | % | | | (22.57 | %) | |
Ratios to average net assets(b)(c) | |
Total gross expenses | | | 1.46 | % | | | 1.48 | % | | | 1.44 | %(d) | | | 1.48 | %(d) | | | 1.51 | % | |
Total net expenses(e) | | | 1.46 | %(f) | | | 1.48 | %(f) | | | 1.44 | %(d)(f) | | | 1.48 | %(d)(f) | | | 1.51 | %(f) | |
Net investment loss | | | (0.53 | %) | | | (0.48 | %) | | | (0.88 | %) | | | (0.73 | %) | | | (0.45 | %) | |
Supplemental data | |
Net assets, end of period (in thousands) | | $ | 27,574 | | | $ | 25,613 | | | $ | 26,196 | | | $ | 5,112 | | | $ | 3,876 | | |
Portfolio turnover | | | 109 | % | | | 141 | % | | | 138 | % | | | 137 | % | | | 160 | % | |
Notes to Financial Highlights
(a) Rounds to zero.
(b) In addition to the fees and expenses which the Fund bears directly, the Fund indirectly bears a pro rata share of the fees and expenses of the acquired funds in which it invests. Such indirect expenses are not included in the reported expense ratios.
(c) Certain line items from prior years have been reclassified to conform to the current presentation.
(d) Ratios include line of credit interest expense which rounds to less than 0.01%.
(e) Total net expenses include the impact of certain waivers/reimbursements made by the Investment Manager and certain of its affiliates, if applicable.
(f) The benefits derived from expense reductions had an impact of less than 0.01%.
The accompanying Notes to Financial Statements are an integral part of this statement.
Annual Report 2013
25
Columbia Mid Cap Growth Fund
Financial Highlights (continued)
Class R4 | | Year Ended
August 31,
2013(a) | |
Per share data | |
Net asset value, beginning of period | | $ | 26.58 | | |
Income from investment operations: | |
Net investment loss | | | (0.09 | ) | |
Net realized and unrealized gain | | | 5.70 | | |
Total from investment operations | | | 5.61 | | |
Less distributions to shareholders: | |
Net realized gains | | | (0.77 | ) | |
Total distributions to shareholders | | | (0.77 | ) | |
Net asset value, end of period | | $ | 31.42 | | |
Total return | | | 21.61 | % | |
Ratios to average net assets(b) | |
Total gross expenses | | | 0.96 | %(c) | |
Total net expenses(d) | | | 0.96 | %(c)(e) | |
Net investment loss | | | (0.41 | %) | |
Supplemental data | |
Net assets, end of period (in thousands) | | $ | 30 | | |
Portfolio turnover | | | 109 | % | |
Notes to Financial Highlights
(a) For the period from November 8, 2012 (commencement of operations) to August 31, 2013.
(b) In addition to the fees and expenses which the Fund bears directly, the Fund indirectly bears a pro rata share of the fees and expenses of the acquired funds in which it invests. Such indirect expenses are not included in the reported expense ratios.
(c) Annualized.
(d) Total net expenses include the impact of certain waivers/reimbursements made by the Investment Manager and certain of its affiliates, if applicable.
(e) The benefits derived from expense reductions had an impact of less than 0.01%.
The accompanying Notes to Financial Statements are an integral part of this statement.
Annual Report 2013
26
Columbia Mid Cap Growth Fund
Financial Highlights (continued)
| | | Year Ended August 31, | |
Class R5 | | 2013 | | 2012 | | 2011(a) | |
Per share data | |
Net asset value, beginning of period | | $ | 27.31 | | | $ | 26.47 | | | $ | 28.05 | | |
Income from investment operations: | |
Net investment income (loss) | | | (0.04 | ) | | | 0.06 | | | | (0.03 | ) | |
Net realized and unrealized gain (loss) | | | 4.53 | | | | 1.61 | | | | (1.55 | )(b) | |
Total from investment operations | | | 4.49 | | | | 1.67 | | | | (1.58 | ) | |
Less distributions to shareholders: | |
Net realized gains | | | (0.77 | ) | | | (0.83 | ) | | | — | | |
Total distributions to shareholders | | | (0.77 | ) | | | (0.83 | ) | | | — | | |
Proceeds from regulatory settlements | | | — | | | | 0.00 | (c) | | | — | | |
Net asset value, end of period | | $ | 31.03 | | | $ | 27.31 | | | $ | 26.47 | | |
Total return | | | 16.94 | % | | | 6.50 | % | | | (5.63 | %) | |
Ratios to average net assets(d)(e) | |
Total gross expenses | | | 0.81 | % | | | 0.78 | % | | | 0.78 | %(f)(g) | |
Total net expenses(h) | | | 0.81 | % | | | 0.78 | % | | | 0.78 | %(f)(g)(i) | |
Net investment income (loss) | | | (0.14 | %) | | | 0.22 | % | | | (0.24 | %)(f) | |
Supplemental data | |
Net assets, end of period (in thousands) | | $ | 3,847 | | | $ | 2,336 | | | $ | 2,198 | | |
Portfolio turnover | | | 109 | % | | | 141 | % | | | 138 | % | |
Notes to Financial Highlights
(a) For the period from March 7, 2011 (commencement of operations) to August 31, 2011.
(b) Calculation of the net gain (loss) per share (both realized and unrealized) does not correlate to the aggregate realized and unrealized gain (loss) presented in the Statement of Operations due to the timing of sales and repurchases of Fund shares in relation to fluctuations in the market value of the portfolio.
(c) Rounds to zero.
(d) In addition to the fees and expenses which the Fund bears directly, the Fund indirectly bears a pro rata share of the fees and expenses of the acquired funds in which it invests. Such indirect expenses are not included in the reported expense ratios.
(e) Certain line items from prior years have been reclassified to conform to the current presentation.
(f) Annualized.
(g) Ratios include line of credit interest expense which rounds to less than 0.01%.
(h) Total net expenses include the impact of certain waivers/reimbursements made by the Investment Manager and certain of its affiliates, if applicable.
(i) The benefits derived from expense reductions had an impact of less than 0.01%.
The accompanying Notes to Financial Statements are an integral part of this statement.
Annual Report 2013
27
Columbia Mid Cap Growth Fund
Financial Highlights (continued)
| | | Year Ended August 31, | |
Class T | | 2013 | | 2012 | | 2011 | | 2010 | | 2009 | |
Per share data | |
Net asset value, beginning of period | | $ | 26.37 | | | $ | 25.72 | | | $ | 20.21 | | | $ | 17.58 | | | $ | 23.48 | | |
Income from investment operations: | |
Net investment loss | | | (0.09 | ) | | | (0.07 | ) | | | (0.18 | ) | | | (0.11 | ) | | | (0.04 | ) | |
Net realized and unrealized gain (loss) | | | 4.31 | | | | 1.55 | | | | 5.69 | | | | 2.74 | | | | (5.37 | ) | |
Total from investment operations | | | 4.22 | | | | 1.48 | | | | 5.51 | | | | 2.63 | | | | (5.41 | ) | |
Less distributions to shareholders: | |
Net realized gains | | | (0.77 | ) | | | (0.83 | ) | | | — | | | | — | | | | (0.49 | ) | |
Total distributions to shareholders | | | (0.77 | ) | | | (0.83 | ) | | | — | | | | — | | | | (0.49 | ) | |
Proceeds from regulatory settlements | | | — | | | | 0.00 | (a) | | | 0.00 | (a) | | | — | | | | 0.00 | (a) | |
Net asset value, end of period | | $ | 29.82 | | | $ | 26.37 | | | $ | 25.72 | | | $ | 20.21 | | | $ | 17.58 | | |
Total return | | | 16.51 | % | | | 5.94 | % | | | 27.26 | % | | | 14.96 | % | | | (22.41 | %) | |
Ratios to average net assets(b)(c) | |
Total gross expenses | | | 1.26 | % | | | 1.28 | % | | | 1.26 | %(d) | | | 1.28 | %(d) | | | 1.31 | % | |
Total net expenses(e) | | | 1.26 | %(f) | | | 1.28 | %(f) | | | 1.26 | %(d)(f) | | | 1.28 | %(d)(f) | | | 1.31 | %(f) | |
Net investment income | | | (0.32 | %) | | | (0.28 | %) | | | (0.69 | %) | | | (0.54 | %) | | | (0.25 | %) | |
Supplemental data | |
Net assets, end of period (in thousands) | | $ | 22,027 | | | $ | 20,965 | | | $ | 22,127 | | | $ | 19,582 | | | $ | 18,847 | | |
Portfolio turnover | | | 109 | % | | | 141 | % | | | 138 | % | | | 137 | % | | | 160 | % | |
Notes to Financial Highlights
(a) Rounds to zero.
(b) In addition to the fees and expenses which the Fund bears directly, the Fund indirectly bears a pro rata share of the fees and expenses of the acquired funds in which it invests. Such indirect expenses are not included in the reported expense ratios.
(c) Certain line items from prior years have been reclassified to conform to the current presentation.
(d) Ratios include line of credit interest expense which rounds to less than 0.01%.
(e) Total net expenses include the impact of certain waivers/reimbursements made by the Investment Manager and certain of its affiliates, if applicable.
(f) The benefits derived from expense reductions had an impact of less than 0.01%.
The accompanying Notes to Financial Statements are an integral part of this statement.
Annual Report 2013
28
Columbia Mid Cap Growth Fund
Financial Highlights (continued)
| | | Year Ended August 31, | |
Class W | | 2013 | | 2012 | | 2011(a) | |
Per share data | |
Net asset value, beginning of period | | $ | 26.43 | | | $ | 25.76 | | | $ | 22.67 | | |
Income from investment operations: | |
Net investment loss | | | (0.08 | ) | | | (0.05 | ) | | | (0.16 | ) | |
Net realized and unrealized gain | | | 4.33 | | | | 1.55 | | | | 3.25 | | |
Total from investment operations | | | 4.25 | | | | 1.50 | | | | 3.09 | | |
Less distributions to shareholders: | |
Net realized gains | | | (0.77 | ) | | | (0.83 | ) | | | — | | |
Total distributions to shareholders | | | (0.77 | ) | | | (0.83 | ) | | | — | | |
Proceeds from regulatory settlements | | | — | | | | 0.00 | (b) | | | 0.00 | (b) | |
Net asset value, end of period | | $ | 29.91 | | | $ | 26.43 | | | $ | 25.76 | | |
Total return | | | 16.59 | % | | | 6.01 | % | | | 13.63 | % | |
Ratios to average net assets(c)(d) | |
Total gross expenses | | | 1.21 | % | | | 1.22 | % | | | 1.19 | %(e)(f) | |
Total net expenses(g) | | | 1.21 | %(h) | | | 1.22 | %(h) | | | 1.19 | %(e)(f)(h) | |
Net investment loss | | | (0.28 | %) | | | (0.21 | %) | | | (0.63 | %)(e) | |
Supplemental data | |
Net assets, end of period (in thousands) | | $ | 104,752 | | | $ | 66,704 | | | $ | 45,119 | | |
Portfolio turnover | | | 109 | % | | | 141 | % | | | 138 | % | |
Notes to Financial Highlights
(a) For the period from September 27, 2010 (commencement of operations) to August 31, 2011.
(b) Rounds to zero.
(c) In addition to the fees and expenses which the Fund bears directly, the Fund indirectly bears a pro rata share of the fees and expenses of the acquired funds in which it invests. Such indirect expenses are not included in the reported expense ratios.
(d) Certain line items from prior years have been reclassified to conform to the current presentation.
(e) Annualized.
(f) Ratios include line of credit interest expense which rounds to less than 0.01%.
(g) Total net expenses include the impact of certain waivers/reimbursements made by the Investment Manager and certain of its affiliates, if applicable.
(h) The benefits derived from expense reductions had an impact of less than 0.01%.
The accompanying Notes to Financial Statements are an integral part of this statement.
Annual Report 2013
29
Columbia Mid Cap Growth Fund
Financial Highlights (continued)
| | | Year Ended August 31, | |
Class Y | | 2013 | | 2012 | | 2011 | | 2010 | | 2009(a) | |
Per share data | |
Net asset value, beginning of period | | $ | 27.26 | | | $ | 26.46 | | | $ | 20.72 | | | $ | 17.98 | | | $ | 16.18 | | |
Income from investment operations: | |
Net investment income | | | 0.07 | | | | 0.03 | | | | (0.04 | ) | | | (0.03 | ) | | | 0.01 | | |
Net realized and unrealized gain | | | 4.45 | | | | 1.60 | | | | 5.78 | | | | 2.80 | | | | 1.79 | | |
Total from investment operations | | | 4.52 | | | | 1.63 | | | | 5.74 | | | | 2.77 | | | | 1.80 | | |
Less distributions to shareholders: | |
Net investment income | | | — | | | | — | | | | — | | | | (0.03 | ) | | | — | | |
Net realized gains | | | (0.77 | ) | | | (0.83 | ) | | | — | | | | — | | | | — | | |
Total distributions to shareholders | | | (0.77 | ) | | | (0.83 | ) | | | — | | | | (0.03 | ) | | | — | | |
Proceeds from regulatory settlements | | | — | | | | 0.00 | (b) | | | 0.00 | (b) | | | — | | | | — | | |
Net asset value, end of period | | $ | 31.01 | | | $ | 27.26 | | | $ | 26.46 | | | $ | 20.72 | | | $ | 17.98 | | |
Total return | | | 17.09 | % | | | 6.35 | % | | | 27.70 | % | | | 15.43 | % | | | 11.12 | % | |
Ratios to average net assets(c)(d) | |
Total gross expenses | | | 0.83 | % | | | 0.88 | % | | | 0.86 | %(f) | | | 0.84 | %(f) | | | 0.86 | %(e) | |
Total net expenses(g) | | | 0.83 | % | | | 0.88 | % | | | 0.86 | %(f)(h) | | | 0.84 | %(f)(h) | | | 0.86 | %(e)(h) | |
Net investment income | | | 0.26 | % | | | 0.10 | % | | | (0.15 | %) | | | (0.13 | %) | | | 0.31 | %(e) | |
Supplemental data | |
Net assets, end of period (in thousands) | | $ | 229 | | | $ | 16 | | | $ | 32 | | | $ | 1,013 | | | $ | 3,067 | | |
Portfolio turnover | | | 109 | % | | | 141 | % | | | 138 | % | | | 137 | % | | | 160 | % | |
Notes to Financial Highlights
(a) For the period from July 15, 2009 (commencement of operations) to August 31, 2009.
(b) Rounds to zero.
(c) In addition to the fees and expenses which the Fund bears directly, the Fund indirectly bears a pro rata share of the fees and expenses of the acquired funds in which it invests. Such indirect expenses are not included in the reported expense ratios.
(d) Certain line items from prior years have been reclassified to conform to the current presentation.
(e) Annualized.
(f) Ratios include line of credit interest expense which rounds to less than 0.01%.
(g) Total net expenses include the impact of certain waivers/reimbursements made by the Investment Manager and certain of its affiliates, if applicable.
(h) The benefits derived from expense reductions had an impact of less than 0.01%.
The accompanying Notes to Financial Statements are an integral part of this statement.
Annual Report 2013
30
Columbia Mid Cap Growth Fund
Financial Highlights (continued)
| | | Year Ended August 31, | |
Class Z | | 2013 | | 2012 | | 2011 | | 2010 | | 2009 | |
Per share data | |
Net asset value, beginning of period | | $ | 27.23 | | | $ | 26.45 | | | $ | 20.72 | | | $ | 17.98 | | | $ | 23.92 | | |
Income from investment operations: | |
Net investment income (loss) | | | (0.00 | )(a) | | | 0.01 | | | | (0.10 | ) | | | (0.05 | ) | | | 0.01 | | |
Net realized and unrealized gain (loss) | | | 4.45 | | | | 1.60 | | | | 5.83 | | | | 2.80 | | | | (5.46 | ) | |
Total from investment operations | | | 4.45 | | | | 1.61 | | | | 5.73 | | | | 2.75 | | | | (5.45 | ) | |
Less distributions to shareholders: | |
Net investment income | | | — | | | | — | | | | — | | | | (0.01 | ) | | | — | | |
Net realized gains | | | (0.77 | ) | | | (0.83 | ) | | | — | | | | — | | | | (0.49 | ) | |
Total distributions to shareholders | | | (0.77 | ) | | | (0.83 | ) | | | — | | | | (0.01 | ) | | | (0.49 | ) | |
Proceeds from regulatory settlements | | | — | | | | 0.00 | (a) | | | 0.00 | (a) | | | — | | | | 0.00 | (a) | |
Net asset value, end of period | | $ | 30.91 | | | $ | 27.23 | | | $ | 26.45 | | | $ | 20.72 | | | $ | 17.98 | | |
Total return | | | 16.84 | % | | | 6.27 | % | | | 27.65 | % | | | 15.29 | % | | | (22.16 | %) | |
Ratios to average net assets(b)(c) | |
Total gross expenses | | | 0.96 | % | | | 0.97 | % | | | 0.95 | %(d) | | | 0.98 | %(d) | | | 1.01 | % | |
Total net expenses(e) | | | 0.96 | %(f) | | | 0.97 | %(f) | | | 0.95 | %(d)(f) | | | 0.98 | %(d)(f) | | | 1.01 | %(f) | |
Net investment income (loss) | | | (0.01 | %) | | | 0.03 | % | | | (0.39 | %) | | | (0.24 | %) | | | 0.05 | % | |
Supplemental data | |
Net assets, end of period (in thousands) | | $ | 1,196,953 | | | $ | 1,274,026 | | | $ | 1,198,927 | | | $ | 986,590 | | | $ | 954,718 | | |
Portfolio turnover | | | 109 | % | | | 141 | % | | | 138 | % | | | 137 | % | | | 160 | % | |
Notes to Financial Highlights
(a) Rounds to zero.
(b) In addition to the fees and expenses which the Fund bears directly, the Fund indirectly bears a pro rata share of the fees and expenses of the acquired funds in which it invests. Such indirect expenses are not included in the reported expense ratios.
(c) Certain line items from prior years have been reclassified to conform to the current presentation.
(d) Ratios include line of credit interest expense which rounds to less than 0.01%.
(e) Total net expenses include the impact of certain waivers/reimbursements made by the Investment Manager and certain of its affiliates, if applicable.
(f) The benefits derived from expense reductions had an impact of less than 0.01%.
The accompanying Notes to Financial Statements are an integral part of this statement.
Annual Report 2013
31
Columbia Mid Cap Growth Fund
Notes to Financial Statements
August 31, 2013
Note 1. Organization
Columbia Mid Cap Growth Fund (the Fund), a series of Columbia Funds Series Trust I (the Trust), is a diversified fund. The Trust is registered under the Investment Company Act of 1940, as amended (the 1940 Act), as an open-end management investment company organized as a Massachusetts business trust.
Fund Shares
The Trust may issue an unlimited number of shares (without par value). The Fund offers Class A, Class B, Class C, Class I, Class K, Class R, Class R4, Class R5, Class T, Class W, Class Y and Class Z shares. Although all share classes generally have identical voting, dividend and liquidation rights, each share class votes separately when required by law. Different share classes pay different distribution amounts to the extent the expenses of such share classes differ, and distributions in liquidation will be proportional to the net asset value of each share class. Each share class has its own expense structure and sales charges, as applicable.
Class A shares are subject to a maximum front-end sales charge of 5.75% based on the initial investment amount. Class A shares purchased without an initial sales charge in accounts aggregating $1 million to $50 million at the time of purchase are subject to a contingent deferred sales charge (CDSC) if the shares are sold within 18 months of purchase, charged as follows: 1.00% CDSC if redeemed within 12 months of purchase, and 0.50% CDSC if redeemed more than 12, but less than 18, months after purchase.
Class B shares may be subject to a maximum CDSC of 5.00% based upon the holding period after purchase. Class B shares will generally convert to Class A shares eight years after purchase. The Fund no longer accepts investments by new or existing investors in the Fund's Class B shares, except in connection with the reinvestment of any dividend and/or capital gain distributions in Class B shares of the Fund and exchanges by existing Class B shareholders of certain other funds within the Columbia Family of Funds.
Class C shares are subject to a 1.00% CDSC on shares redeemed within one year of purchase.
Class I shares are not subject to sales charges and are available only to the Columbia Family of Funds.
Class K shares are not subject to sales charges and are closed to new investors. Class K shares commenced operations on February 28, 2013.
Class R shares are not subject to sales charges and are generally available only to certain retirement plans and other eligible investors.
Class R4 shares are not subject to sales charges and are generally available only to omnibus retirement plans and certain other eligible investors. Class R4 shares commenced operations on November 8, 2012.
Class R5 shares are not subject to sales charges. Effective November 8, 2012, Class R5 shares are generally available only to investors purchasing through authorized investment professionals and omnibus retirement plans. Prior to November 8, 2012, Class R5 shares were closed to new investors.
Class T shares are subject to a maximum front-end sales charge of 5.75% based on the investment amount. Class T shares purchased without an initial sales charge in accounts aggregating $1 million to $50 million at the time of purchase are subject to a CDSC if the shares are sold within 18 months of purchase, charged as follows: 1.00% CDSC if redeemed within 12 months of purchase, and 0.50% CDSC if redeemed more than 12, but less than 18, months after purchase. Class T shares are available only to investors who received (and who have continuously held) Class T shares in connection with the merger of certain Galaxy Funds into various Columbia Funds (formerly named Liberty Funds).
Class W shares are not subject to sales charges and are available only to investors purchasing through authorized investment programs managed by investment professionals, including discretionary managed account programs.
Class Y shares are not subject to sales charges and are generally available only to certain retirement plans.
Class Z shares are not subject to sales charges and are available only to certain eligible investors, which are subject to different investment minimums.
Note 2. Summary of Significant Accounting Policies
Use of Estimates
The preparation of financial statements in accordance with U.S. generally accepted accounting principles (GAAP) requires management to make certain estimates and assumptions that affect the reported amounts of assets and liabilities, the disclosure of contingent assets and liabilities at the date of the financial statements and the reported amounts of revenue and expenses during the reporting period. Actual results could differ from those estimates.
Annual Report 2013
32
Columbia Mid Cap Growth Fund
Notes to Financial Statements (continued)
August 31, 2013
The following is a summary of significant accounting policies consistently followed by the Fund in the preparation of its financial statements.
Security Valuation
All equity securities are valued at the close of business of the New York Stock Exchange (NYSE). Equity securities are valued at the last quoted sales price on the principal exchange or market on which they trade, except for securities traded on the NASDAQ Stock Market, which are valued at the NASDAQ official close price. Unlisted securities or listed securities for which there were no sales during the day are valued at the mean of the latest quoted bid and ask prices on such exchanges or markets.
Foreign equity securities are valued based on quotations from the principal market in which such securities are normally traded. If any foreign share prices are not readily available as a result of limited share activity the securities are valued at the mean of the latest quoted bid and ask prices on such exchanges or markets. Foreign currency exchange rates are generally determined at 4:00 p.m. Eastern (U.S.) time. However, many securities markets and exchanges outside the U.S. close prior to the close of the NYSE; therefore, the closing prices for securities in such markets or on such exchanges may not fully reflect events that occur after such close but before the close of the NYSE. In those situations, foreign securities will be fair valued pursuant to the policy adopted by the Board of Trustees (the Board), including utilizing a third party pricing service to determine these fair values. The third party pricing service takes into account multiple factors, including, but not limited to, movements in the U.S. securities markets, certain depositary receipts, futures contracts and foreign exchange rates that have occurred subsequent to the close of the foreign exchange or market, to determine a good faith estimate that reasonably reflects the current market conditions as of the close of the NYSE. The fair value of a security is likely to be different from the quoted or published price, if available.
Investments in open-end investment companies, including money market funds, are valued at net asset value.
Investments for which market quotations are not readily available, or that have quotations which management believes are not reliable, are valued at fair value as determined in good faith under consistently applied procedures established by and under the general supervision of the Board. If a security or class of securities (such as foreign securities) is valued at fair value, such value is likely to be different from the last quoted market price for the security.
The determination of fair value often requires significant judgment. To determine fair value, management may use
assumptions including but not limited to future cash flows and estimated risk premiums. Multiple inputs from various sources may be used to determine fair value.
Foreign Currency Transactions and Translations
The values of all assets and liabilities denominated in foreign currencies are translated into U.S. dollars at that day's exchange rates. Net realized and unrealized gains (losses) on foreign currency transactions and translations include gains (losses) arising from the fluctuation in exchange rates between trade and settlement dates on securities transactions, gains (losses) arising from the disposition of foreign currency and currency gains (losses) between the accrual and payment dates on dividends, interest income and foreign withholding taxes.
For financial statement purposes, the Fund does not distinguish that portion of gains (losses) on investments which is due to changes in foreign exchange rates from that which is due to changes in market prices of the investments. Such fluctuations are included with the net realized and unrealized gains (losses) on investments in the Statement of Operations.
Security Transactions
Security transactions are accounted for on the trade date. Cost is determined and gains (losses) are based upon the specific identification method for both financial statement and federal income tax purposes.
Income Recognition
Corporate actions and dividend income are generally recorded net of any non-reclaimable tax withholdings, on the ex-dividend date or upon receipt of ex-dividend notification in the case of certain foreign securities.
The Fund may receive distributions from holdings in business development companies (BDCs), exchange traded funds (ETFs) and real estate investment trusts (REITs), which report information on the character of their distributions annually. These distributions are allocated to dividend income, capital gain and return of capital based on estimates made by the Fund's management if actual information has not yet been reported. Return of capital is recorded as a reduction of the cost basis of securities held. If the Fund no longer owns the applicable securities, return of capital is recorded as a realized gain. Management's estimates are subsequently adjusted when the actual character of the distributions is disclosed by the BDCs, ETFs and REITs, which could result in a proportionate change in return of capital to shareholders.
Awards from class action litigation are recorded as a reduction of cost basis if the Fund still owns the applicable securities on the payment date. If the Fund no longer owns the applicable securities, the proceeds are recorded as realized gains.
Annual Report 2013
33
Columbia Mid Cap Growth Fund
Notes to Financial Statements (continued)
August 31, 2013
Expenses
General expenses of the Trust are allocated to the Fund and other funds of the Trust based upon relative net assets or other expense allocation methodologies determined by the nature of the expense. Expenses directly attributable to the Fund are charged to the Fund. Expenses directly attributable to a specific class of shares are charged to that share class.
Determination of Class Net Asset Value
All income, expenses (other than class-specific expenses, which are charged to that share class, as shown in the Statement of Operations) and realized and unrealized gains (losses) are allocated to each class of the Fund on a daily basis, based on the relative net assets of each class, for purposes of determining the net asset value of each class.
Federal Income Tax Status
The Fund intends to qualify each year as a regulated investment company under Subchapter M of the Internal Revenue Code, as amended, and will distribute substantially all of its taxable income (including net short-term capital gains), if any, for its tax year, and as such will not be subject to federal income taxes. In addition, the Fund intends to distribute in each calendar year substantially all of its net investment income, capital gains and certain other amounts, if any, such that the Fund should not be subject to federal excise tax. Therefore, no federal income or excise tax provision is recorded.
Distributions to Shareholders
Distributions from net investment income, if any, are declared and paid annually. Net realized capital gains, if any, are distributed along with the income distribution. Income distributions and capital gain distributions are determined in accordance with federal income tax regulations, which may differ from GAAP.
Guarantees and Indemnifications
Under the Trust's organizational documents and, in some cases, by contract, its officers and trustees are indemnified against certain liabilities arising out of the performance of their duties to the Trust or its funds. In addition, certain of the Fund's contracts with its service providers contain general indemnification clauses. The Fund's maximum exposure under these arrangements is unknown since the amount of any future claims that may be made against the Fund cannot be determined, and the Fund has no historical basis for predicting the likelihood of any such claims.
Recent Accounting Pronouncement
Disclosures about Offsetting Assets and Liabilities
In December 2011, the Financial Accounting Standards Board (FASB) issued Accounting Standards Update
(ASU) No. 2011-11, Disclosures about Offsetting Assets and Liabilities and in January 2013, ASU No. 2013-1, Clarifying the Scope of Disclosures about Offsetting Assets and Liabilities (collectively, the ASUs). Specifically, the ASUs require an entity to disclose both gross and net information for derivatives and other financial instruments that are subject to a master netting arrangement or similar agreement. The ASUs require disclosure of collateral received in connection with the master netting agreements or similar agreements. The disclosure requirements are effective for interim and annual periods beginning on or after January 1, 2013. At this time, management is evaluating the implications of this guidance and the impact it will have on the financial statement amounts and footnote disclosures, if any.
Note 3. Fees and Compensation Paid to Affiliates
Investment Management Fees
Under an Investment Management Services Agreement, Columbia Management Investment Advisers, LLC (the Investment Manager), a wholly-owned subsidiary of Ameriprise Financial, Inc. (Ameriprise Financial), determines which securities will be purchased, held or sold. The investment management fee is an annual fee that is equal to a percentage of the Fund's average daily net assets that declines from 0.76% to 0.62% as the Fund's net assets increase. The effective investment management fee rate for the year ended August 31, 2013 was 0.68% of the Fund's average daily net assets.
Administration Fees
Under an Administrative Services Agreement, the Investment Manager also serves as the Fund Administrator. The Fund pays the Fund Administrator an annual fee for administration and accounting services equal to a percentage of the Fund's average daily net assets that declines from 0.06% to 0.03% as the Fund's net assets increase. The effective administration fee rate for the year ended August 31, 2013 was 0.05% of the Fund's average daily net assets.
Compensation of Board Members
Board members are compensated for their services to the Fund as disclosed in the Statement of Operations. The Trust's eligible Trustees may participate in a Deferred Compensation Plan (the Plan) which may be terminated at any time. Obligations of the Plan will be paid solely out of the Fund's assets.
Compensation of Chief Compliance Officer
The Board has appointed a Chief Compliance Officer to the Fund in accordance with federal securities regulations. The Fund pays its pro-rata share of the expenses associated with the Chief Compliance Officer. The Fund's expenses for the Chief Compliance Officer will not exceed $15,000 per year.
Annual Report 2013
34
Columbia Mid Cap Growth Fund
Notes to Financial Statements (continued)
August 31, 2013
Transfer Agent Fees
Under a Transfer and Dividend Disbursing Agent Agreement, Columbia Management Investment Services Corp. (the Transfer Agent), an affiliate of the Investment Manager and a wholly-owned subsidiary of Ameriprise Financial, is responsible for providing transfer agency services to the Fund. The Transfer Agent has contracted with Boston Financial Data Services (BFDS) to serve as sub-transfer agent.
The Transfer Agent receives monthly account-based service fees based on the number of open accounts and also receives sub-transfer agency fees based on a percentage of the average aggregate value of the Fund's shares maintained in omnibus accounts (other than omnibus accounts for which American Enterprise Investment Services Inc. is the broker of record or accounts where the beneficial shareholder is a customer of Ameriprise Financial Services, Inc., which are paid a per account fee). The Transfer Agent pays the fees of BFDS for services as sub-transfer agent and is not entitled to reimbursement for such fees from the Fund (with the exception of out-of-pocket fees).
The Transfer Agent also receives compensation from fees for various shareholder services and reimbursements for certain out-of-pocket fees. Effective March 16, 2013, Class A, Class B, Class C, Class R, Class R4, Class T, Class W and Class Z shares are subject to an annual transfer agent fee limitation of not more than 0.19% of the average daily net assets attributable to each share class. This limitation will expire December 31, 2014. Class I shares do not pay transfer agent fees. Total transfer agent fees for Class K and Class R5 shares are subject to an annual limitation of not more than 0.05% of the average daily net assets attributable to each share class. Beginning November 1, 2012, Class Y shares are not subject to transfer agent fees for at least twelve months.
For the year ended August 31, 2013, the Fund's effective transfer agent fee rates as a percentage of average daily net assets of each class were as follows:
Class A | | | 0.19 | % | |
Class B | | | 0.19 | | |
Class C | | | 0.19 | | |
Class K | | | 0.05 | * | |
Class R | | | 0.19 | | |
Class R4 | | | 0.19 | * | |
Class R5 | | | 0.05 | | |
Class T | | | 0.19 | | |
Class W | | | 0.19 | | |
Class Y | | | 0.02 | | |
Class Z | | | 0.19 | | |
*Annualized
The Fund and certain other associated investment companies, have severally, but not jointly, guaranteed the performance and observance of all the terms and conditions of a lease entered into by Seligman Data Corp. (SDC), the former transfer agent, including the payment of rent by SDC (the Guaranty). The lease and the Guaranty expire in January 2019. At August 31, 2013, the Fund's total potential future obligation over the life of the Guaranty is $204,501. The liability remaining at August 31, 2013 for non-recurring charges associated with the lease amounted to $102,332 and is recorded as a part of the payable for other expenses in the Statement of Assets and Liabilities. SDC is owned by six associated investment companies, including the Fund. The Fund's ownership interest in SDC at August 31, 2013 is recorded as a part of other assets in the Statement of Assets and Liabilities at a cost of $2,199.
An annual minimum account balance fee of $20 may apply to certain accounts with a value below the applicable share class' initial minimum investment requirements to reduce the impact of small accounts on transfer agent fees. These minimum account balance fees are recorded as part of expense reductions in the Statement of Operations. For the year ended August 31, 2013, these minimum account balance fees reduced total expenses by $13,714.
Plan Administration Fees
Under a Plan Administration Services Agreement with the Transfer Agent, the Fund pays an annual fee at a rate of 0.25% of the Fund's average daily net assets attributable to Class K shares for the provision of various administrative, recordkeeping, communication and educational services.
Distribution and Service Fees
The Fund has an agreement with Columbia Management Investment Distributors, Inc. (the Distributor), an affiliate of the Investment Manager and a wholly-owned subsidiary of Ameriprise Financial, for distribution and shareholder services. Pursuant to Rule 12b-1 under the 1940 Act, the Board has approved, and the Fund has adopted, distribution and shareholder service plans (the Plans) which set the distribution and service fees for the Fund. These fees are calculated daily and are intended to compensate the Distributor and/or eligible selling and/or servicing agents for selling shares of the Fund and providing services to investors.
Under the Plans, the Fund pays a monthly service fee to the Distributor at the maximum annual rate of 0.25% of the average daily net assets attributable to Class A, Class B, Class C and Class W shares of the Fund. Also under the Plans, the Fund pays a monthly distribution fee to the Distributor at the maximum annual rates of 0.10%, 0.75%, 0.75%, 0.50% and 0.25% of the average daily net assets attributable to
Annual Report 2013
35
Columbia Mid Cap Growth Fund
Notes to Financial Statements (continued)
August 31, 2013
Class A, Class B, Class C, Class R and Class W shares, respectively.
The Fund may pay distribution and service fees up to a maximum annual rate of 0.35% of the Fund's average daily net assets attributable to Class A shares (comprised of up to 0.10% for distribution services and up to 0.25% for shareholder liaison services), but currently limit such fees to an aggregate fee of not more than 0.25% of the Fund's average daily net assets attributable to Class A shares.
The Fund may pay a distribution fee up to 0.25% of the Fund's average daily net assets attributable to Class W shares and a service fee of up to 0.25% of the Fund's average daily net assets attributable to Class W shares, provided, however, that the aggregate fee shall not exceed 0.25% of the Fund's average daily net assets attributable to Class W shares.
Shareholder Services Fees
The Fund has adopted a shareholder services plan that permits it to pay for certain services provided to Class T shareholders by their selling and/or servicing agents. The Fund may pay shareholder servicing fees up to an aggregate annual rate of 0.50% of the Fund's average daily net assets attributable to Class T shares (comprised of up to 0.25% for shareholder liaison services and up to 0.25% for administrative support services). These fees are currently limited to an aggregate annual rate of not more than 0.30% of the Fund's average daily net assets attributable to Class T shares. The effective shareholder services fee rate for the year ended August 31, 2013 was 0.30% of the Fund's average daily net assets attributable to Class T shares.
Sales Charges
Sales charges, including front-end charges and CDSCs, received by the Distributor for distributing Fund shares were $164,613 for Class A, $4,930 for Class B, $748 for Class C and $69 for Class T shares for the year ended August 31, 2013.
Expenses Waived/Reimbursed by the Investment Manager and its Affiliates
The Investment Manager and certain of its affiliates have contractually agreed to waive fees and/or reimburse expenses (excluding certain fees and expenses described below as well as any reorganization costs allocated to the Fund) for the periods disclosed below, unless sooner terminated at the sole discretion of the Board, so that the Fund's net operating expenses, after giving effect to fees waived/expenses reimbursed and any balance credits and/or overdraft charges
from the Fund's custodian, do not exceed the following annual rates as a percentage of the class' average daily net assets:
| | | January 1, 2013
through
December 31, 2013 | | Prior to
January 1, 2013 | |
Class A | | | 1.35 | % | | | 1.35 | % | |
Class B | | | 2.10 | | | | 2.10 | | |
Class C | | | 2.10 | | | | 2.10 | | |
Class I | | | 0.94 | | | | 0.99 | | |
Class K | | | 1.24 | * | | | — | | |
Class R | | | 1.60 | | | | 1.60 | | |
Class R4 | | | 1.10 | | | | 1.10 | | |
Class R5 | | | 0.99 | | | | 1.04 | | |
Class T | | | 1.40 | | | | 1.40 | | |
Class W | | | 1.35 | | | | 1.35 | | |
Class Y | | | 0.94 | | | | 1.10 | | |
Class Z | | | 1.10 | | | | 1.10 | | |
*Annual rate is contractual from February 28, 2013 (the commencement of operations of Class K shares) through December 31, 2013.
Under the agreement governing these fee waivers and/or expense reimbursement arrangements, the following fees and expenses are excluded from the waiver/reimbursement commitment, and therefore will be paid by the Fund, if applicable: taxes (including foreign transaction taxes), expenses associated with investments in affiliated and non-affiliated pooled investment vehicles (including mutual funds and exchange traded funds), transaction costs and brokerage commissions, costs related to any securities lending program, dividend expenses associated with securities sold short, inverse floater program fees and expenses, transaction charges and interest on borrowed money, interest, extraordinary expenses and any other expenses the exclusion of which is specifically approved by the Board. This agreement may be modified or amended only with approval from all parties. Reorganization (see Note 11) costs were allocated to the Fund only to the extent they are expected to be offset by the anticipated reduction in expenses borne by the Fund's shareholders during the first year following the reorganization.
Note 4. Federal Tax Information
The timing and character of income and capital gain distributions are determined in accordance with income tax regulations, which may differ from GAAP because of temporary or permanent book to tax differences.
Annual Report 2013
36
Columbia Mid Cap Growth Fund
Notes to Financial Statements (continued)
August 31, 2013
At August 31, 2013, these differences are primarily due to differing treatment for capital loss carryforwards, deferral/reversal of wash sale losses, Trustees' deferred compensation, foreign currency transactions, net operating loss reclassification, and late-year ordinary losses. To the extent these differences are permanent, reclassifications are made among the components of the Fund's net assets in the Statement of Assets and Liabilities. Temporary differences do not require reclassifications. In the Statement of Assets and Liabilities the following reclassifications were made:
Excess of distributions over net investment income | | $ | 6,668,622 | | |
Accumulated net realized gain | | | 17,143,337 | | |
Paid-in capital | | | (23,811,959 | ) | |
Net investment income (loss) and net realized gains (losses), as disclosed in the Statement of Operations, and net assets were not affected by this reclassification.
The tax character of distributions paid during the years indicated was as follows:
Year Ended August 31, | | 2013 | | 2012 | |
Long-term capital gains | | $ | 55,901,965 | | | $ | 62,495,112 | | |
Short-term capital gain distributions, if any, are considered ordinary income distributions for tax purposes.
At August 31, 2013, the components of distributable earnings on a tax basis were as follows:
Undistributed ordinary income | | $ | 14,538,254 | | |
Undistributed accumulated long-term capital gains | | | 191,155,363 | | |
Unrealized appreciation | | | 541,494,470 | | |
At August 31, 2013, the cost of investments for federal income tax purposes was $2,110,856,870 and the aggregate gross unrealized appreciation and depreciation based on that cost was:
Unrealized appreciation | | $ | 567,268,033 | | |
Unrealized depreciation | | | (25,773,563 | ) | |
Net unrealized appreciation | | | 541,494,470 | | |
The following capital loss carryforward, determined at August 31, 2013, may be available to reduce taxable income arising from future net realized gains on investments, if any, to the extent permitted by the Internal Revenue Code:
Year of Expiration | | Amount ($) | |
2015 | | | 28,080,558 | | |
2016 | | | 59,497,626 | | |
Total | | | 87,578,184 | | |
For the year ended August 31, 2013, $30,546,478 of capital loss carryforward was utilized, $16,144,944 was permanently lost as a result of the current year merger with Columbia Mid Cap Growth Opportunity Fund, and $5,550,567 was permanently lost as a result of the Fund's 2011 merger with Seligman Capital Fund.
The Fund acquired $74,884,647 of capital loss carryforward in connection with the Columbia Mid Cap Growth Opportunity Fund merger (Note 11). As noted above, $16,144,944 of the total capital loss carryforward acquired from the merger was permanently lost. In addition to the acquired capital loss carryforward, the Fund also acquired unrealized capital gains as a result of the merger. The yearly utilization of the acquired capital loss carryforward may be limited by the Internal Revenue Code.
Any capital loss carryforwards acquired as part of a merger that are permanently lost due to provisions under the Internal Revenue Code are recorded as a reduction of paid in capital.
Management of the Fund has concluded that there are no significant uncertain tax positions that would require recognition in the financial statements. However, management's conclusion may be subject to review and adjustment at a later date based on factors including, but not limited to, new tax laws, regulations, and administrative interpretations (including relevant court decisions). Generally, the Fund's federal tax returns for the prior three fiscal years remain subject to examination by the Internal Revenue Service.
Note 5. Portfolio Information
The cost of purchases and proceeds from sales of securities, excluding short-term obligations, aggregated to $2,462,584,819 and $2,821,087,564, respectively, for the year ended August 31, 2013.
Transactions to realign the Fund's portfolio following the merger as described in Note 11 are excluded for purposes of calculating the Fund's portfolio turnover rate. These realignment transactions amounted to proceeds from sales of $3,489,093.
Note 6. Regulatory Settlements
During the year ended August 31, 2012, the Fund received $26,617 as a result of a settlement of an administrative proceeding brought by the Securities and Exchange Commission against an unaffiliated third party relating to market timing and/or late trading of mutual funds. This amount represented the Fund's portion of the proceeds from the settlement (the Fund was not a party to the proceeding). The
Annual Report 2013
37
Columbia Mid Cap Growth Fund
Notes to Financial Statements (continued)
August 31, 2013
payments have been included in "Proceeds from regulatory settlements" in the Statement of Changes in Net Assets.
Note 7. Lending of Portfolio Securities
Effective December 19, 2012, the Fund no longer participates in securities lending activity. Prior to that date, the Fund participated, or was eligible to participate, in securities lending activity pursuant to a Master Securities Lending Agreement (the Agreement) with JPMorgan Chase Bank, N.A. (JPMorgan). The Agreement authorized JPMorgan as lending agent to lend securities to authorized borrowers in order to generate additional income on behalf of the Fund. Pursuant to the Agreement, the securities loaned were secured by cash or securities that either were issued or guaranteed as to principal and interest by the U.S. government, its agencies, authorities or instrumentalities with value equal to at least 100% of the market value of the loaned securities. Any additional collateral required to maintain those levels due to market fluctuations of the loaned securities was requested to be delivered the following business day. Cash collateral received was invested by the lending agent on behalf of the Fund into authorized investments pursuant to the Agreement.
Pursuant to the Agreement, the Fund received income for lending its securities either in the form of fees or by earning interest on invested cash collateral, net of negotiated rebates paid to borrowers and fees paid to the lending agent for services provided and any other securities lending expenses. Net income earned from securities lending for the year ended August 31, 2013 is disclosed in the Statement of Operations. The Fund continued to earn and accrue interest and dividends on the securities loaned.
Note 8. Affiliated Money Market Fund
The Fund invests its daily cash balances in Columbia Short-Term Cash Fund, an affiliated money market fund established for the exclusive use by the Fund and other affiliated funds. The income earned by the Fund from such investments is included as "Dividends — affiliated issuers" in the Statement of Operations. As an investing fund, the Fund indirectly bears its proportionate share of the expenses of Columbia Short-Term Cash Fund.
Note 9. Shareholder Concentration
At August 31, 2013, one unaffiliated shareholder account owned 14.1% of the outstanding shares of the Fund. The Fund has no knowledge about whether any portion of those shares was owned beneficially by such account. Affiliated shareholder accounts owned 17.4% of the outstanding shares of the Fund. Subscription and redemption activity by concentrated accounts may have a significant effect on the operations of the Fund.
Note 10. Line of Credit
The Fund has entered into a revolving credit facility with a syndicate of banks led by JPMorgan whereby the Fund may borrow for the temporary funding of shareholder redemptions or for other temporary or emergency purposes. The credit facility agreement, as amended, which is a collective agreement between the Fund and certain other funds managed by the Investment Manager, severally and not jointly, permits collective borrowings up to $500 million. Interest is charged to each participating fund based on its borrowings at a rate equal to the higher of (i) the overnight federal funds rate plus 1.00% or (ii) the one-month LIBOR rate plus 1.00%. Each borrowing under the credit facility matures no later than 60 days after the date of borrowing. The Fund also pays a commitment fee equal to its pro rata share of the amount of the credit facility at a rate of 0.08% per annum. The commitment fee is included in other expenses in the Statement of Operations.
The Fund had no borrowings during the year ended August 31, 2013.
Note 11. Fund Merger
At the close of business on March 15, 2013, the Fund acquired the assets and assumed the identified liabilities of Columbia Mid Cap Growth Opportunity Fund, a series Columbia Funds Series Trust I (the acquired fund). The reorganization was completed after shareholders of the acquired fund approved a plan of reorganization on February 27, 2013. The purpose of the transaction was to combine two funds managed by the Investment Manager with comparable investment objectives and strategies.
The aggregate net assets of the Fund immediately before the acquisition was $2,034,157,302 and the combined net assets immediately after the acquisition was $2,696,402,529.
The merger was accomplished by a tax-free exchange of 60,985,326 shares of the acquired fund valued at $662,245,227 (including $126,187,391 of unrealized appreciation).
Annual Report 2013
38
Columbia Mid Cap Growth Fund
Notes to Financial Statements (continued)
August 31, 2013
In exchange for the acquired fund's shares, the Fund issued the following number of shares:
| | | Shares | |
Class A | | | 22,792,214 | | |
Class B | | | 692,621 | | |
Class C | | | 327,825 | | |
Class I | | | 417 | | |
Class K | | | 17,936 | | |
Class R | | | 1,849 | | |
Class R4 | | | 282 | | |
Class Z | | | 51,867 | | |
For financial reporting purposes, net assets received and shares issued by the Fund were recorded at fair value; however, the acquired fund's cost of investments was carried forward.
The financial statements reflect the operations of the Fund for the period prior to the merger and the combined fund for the period subsequent to the merger. Because the combined investment portfolios have been managed as a single integrated portfolio since the merger was completed, it is not practicable to separate the amounts of revenue and earnings of the acquired fund that have been included in the combined Fund's Statement of Operations since the merger was completed.
Assuming the merger had been completed on September 1, 2012 the Fund's pro-forma net investment loss, net gain on investments, net change in unrealized appreciation and net increase in net assets from operations for the year ended August 31, 2013 would have been approximately $(3.2) million, $261.3 million, $152.9 million and $411.0 million, respectively.
Note 12. Significant Risks
Consumer Discretionary Risk
The Fund's portfolio managers may invest significantly in issuers operating in the consumer discretionary sector. The Fund may be more susceptible to the particular risks of this sector than if the Fund were invested in a wider variety of issuers operating in unrelated sectors.
Note 13. Subsequent Events
Management has evaluated the events and transactions that have occurred through the date the financial statements were issued and noted no items requiring adjustment of the financial statements or additional disclosure.
Note 14. Information Regarding Pending and Settled Legal Proceedings
In December 2005, without admitting or denying the allegations, American Express Financial Corporation (AEFC, which is now known as Ameriprise Financial, Inc. (Ameriprise Financial)) entered into settlement agreements with the Securities and Exchange Commission (SEC) and Minnesota Department of Commerce (MDOC) related to market timing activities. As a result, AEFC was censured and ordered to cease and desist from committing or causing any violations of certain provisions of the Investment Advisers Act of 1940, the Investment Company Act of 1940, and various Minnesota laws. AEFC agreed to pay disgorgement of $10 million and civil money penalties of $7 million. AEFC also agreed to retain an independent distribution consultant to assist in developing a plan for distribution of all disgorgement and civil penalties ordered by the SEC in accordance with various undertakings detailed at www.sec.gov/litigation/admin/ia-2451.pdf. Ameriprise Financial and its affiliates have cooperated with the SEC and the MDOC in these legal proceedings, and have made regular reports to the funds' Boards of Trustees.
Ameriprise Financial and certain of its affiliates have historically been involved in a number of legal, arbitration and regulatory proceedings, including routine litigation, class actions, and governmental actions, concerning matters arising in connection with the conduct of their business activities. Ameriprise Financial believes that the Funds are not currently the subject of, and that neither Ameriprise Financial nor any of its affiliates are the subject of, any pending legal, arbitration or regulatory proceedings that are likely to have a material adverse effect on the Funds or the ability of Ameriprise Financial or its affiliates to perform under their contracts with the Funds. Ameriprise Financial is required to make 10-Q, 10-K and, as necessary, 8-K filings with the Securities and Exchange Commission on legal and regulatory matters that relate to Ameriprise Financial and its affiliates. Copies of these filings may be obtained by accessing the SEC website at www.sec.gov.
There can be no assurance that these matters, or the adverse publicity associated with them, will not result in increased fund redemptions, reduced sale of fund shares or other adverse consequences to the Funds. Further, although we believe proceedings are not likely to have a material adverse effect on the Funds or the ability of Ameriprise Financial or its affiliates to perform under their contracts with the Funds, these proceedings are subject to uncertainties and, as such, we are unable to estimate the possible loss or range of loss that may result. An adverse outcome in one or more of these proceedings could result in adverse judgments, settlements,
Annual Report 2013
39
Columbia Mid Cap Growth Fund
Notes to Financial Statements (continued)
August 31, 2013
fines, penalties or other relief that could have a material adverse effect on the consolidated financial condition or results of operations of Ameriprise Financial.
Annual Report 2013
40
Columbia Mid Cap Growth Fund
Report of Independent Registered Public Accounting Firm
To the Trustees of Columbia Funds Series Trust I and the Shareholders of
Columbia Mid Cap Growth Fund
In our opinion, the accompanying statement of assets and liabilities, including the portfolio of investments, and the related statements of operations and of changes in net assets and the financial highlights present fairly, in all material respects, the financial position of Columbia Mid Cap Growth Fund (the "Fund") (a series of Columbia Funds Series Trust I) at August 31, 2013, the results of its operations, the changes in its net assets and the financial highlights for the periods indicated, in conformity with accounting principles generally accepted in the United States of America. These financial statements and financial highlights (hereafter referred to as "financial statements") are the responsibility of the Fund's management. Our responsibility is to express an opinion on these financial statements based on our audits. We conducted our audits of these financial statements in accordance with the standards of the Public Company Accounting Oversight Board (United States). Those standards require that we plan and perform the audit to obtain reasonable assurance about whether the financial statements are free of material misstatement. An audit includes examining, on a test basis, evidence supporting the amounts and disclosures in the financial statements, assessing the accounting principles used and significant estimates made by management, and evaluating the overall financial statement presentation. We believe that our audits, which included confirmation of securities at August 31, 2013 by correspondence with the custodian, brokers and transfer agent, provide a reasonable basis for our opinion.
PricewaterhouseCoopers LLP
Minneapolis, Minnesota
October 22, 2013
Annual Report 2013
41
Columbia Mid Cap Growth Fund
Federal Income Tax Information
(Unaudited)
The Fund hereby designates the following tax attributes for the fiscal year ended August 31, 2013. Shareholders will be notified in early 2014 of the amounts for use in preparing 2013 income tax returns.
Tax Designations:
Capital Gain Dividend | | $ | 204,503,981 | | |
Capital Gain Dividend. The Fund designates as a capital gain dividend the amount reflected above, or if subsequently determined to be different, the net capital gain of such fiscal period. The Fund also designates as capital gain dividends, to the extent necessary to fully distribute such capital gains, earnings and profits distributed to shareholders on the redemption of shares.
Annual Report 2013
42
Columbia Mid Cap Growth Fund
The Trustees serve terms of indefinite duration. The names, addresses and birth years of the Trustees and Officers of the Funds in Columbia Funds Series Trust I, the year each was first elected or appointed to office, their principal business occupations during at least the last five years, the number of Funds overseen by each Trustee and other directorships they hold are shown below. Each officer listed below serves as an officer of each Fund in Columbia Funds Series Trust I.
Independent Trustees
Name, Address and Year of Birth,
Position with Funds, Year First
Elected or Appointed to Office | | Principal Occupation(s) During Past Five Years, Number of Funds in Columbia
Funds Complex Overseen by Trustee, Other Directorships Held | |
Rodman L. Drake (Born 1943)
c/o Columbia Management
Investment Advisers, LLC
225 Franklin Street
Boston, MA 02110
Trustee (since 1994) and
Chairman of the Board (since 2009) | | Independent consultant since 2010; Co-Founder of Baringo Capital LLC (private equity) from 1997 to 2008; Chairman (from 2003 to 2010) and CEO (from 2008 to 2010) of Crystal River Capital, Inc. (real estate investment trust); Oversees 52; Jackson Hewitt Tax Service Inc. (tax preparation services) from 2004 to 2011; Student Loan Corporation (student loan provider) from 2005 to 2010; Celgene Corporation (global biotechnology company); The Helios Funds and Brookfield Funds (closed-end funds); Chimerix, Inc. (biopharmaceutical company) since August 1, 2013; Crystal River Capital, Inc. from 2005 to 2010; Parsons Brinckerhoff from 1995 to 2008; and Apex Silver Mines Ltd. from 2007 to 2009 | |
Douglas A. Hacker (Born 1955)
c/o Columbia Management
Investment Advisers, LLC
225 Franklin Street
Boston, MA 02110
Trustee (since 1996) | | Independent business executive since May 2006; Executive Vice President — Strategy of United Airlines from December 2002 to May 2006; President of UAL Loyalty Services (airline marketing company) from September 2001 to December 2002; Executive Vice President and Chief Financial Officer of United Airlines from July 1999 to September 2001. Oversees 52; Nash Finch Company (food distributor); Aircastle Limited (aircraft leasing); and SeaCube Container Leasing Ltd. (container leasing) | |
Janet Langford Kelly (Born 1957)
c/o Columbia Management
Investment Advisers, LLC
225 Franklin Street
Boston, MA 02110
Trustee (since 1996) | | Senior Vice President, General Counsel and Corporate Secretary, ConocoPhillips (integrated energy company) since September 2007; Deputy General Counsel — Corporate Legal Services, ConocoPhillips from August 2006 to August 2007; Partner, Zelle, Hofmann, Voelbel, Mason & Gette LLP (law firm) from March 2005 to July 2006; Adjunct Professor of Law, Northwestern University from September 2004 to June 2006; Director, UAL Corporation (airline) from February 2006 to July 2006; Chief Administrative Officer and Senior Vice President, Kmart Holding Corporation (consumer goods) from September 2003 to March 2004. Oversees 52; None | |
Nancy T. Lukitsh (Born 1956)
c/o Columbia Management
Investment Advisers, LLC
225 Franklin Street
Boston, MA 02110
Trustee (since 2011) | | Senior Vice President, Partner and Director of Marketing, Wellington Management Company, LLP (investment adviser) from 1997 to 2010; Chair, Wellington Management Investment Portfolios (commingled non-U.S. investment pools) from 2007 to 2010; Director, Wellington Trust Company, NA and other Wellington affiliates from 1997 to 2010. Oversees 52; None | |
William E. Mayer (Born 1940)
c/o Columbia Management
Investment Advisers, LLC
225 Franklin Street
Boston, MA 02110
Trustee (since 1994) | | Partner, Park Avenue Equity Partners (private equity) since February 1999; Dean and Professor, College of Business and Management, University of Maryland from 1992 to 1996. Oversees 52; DynaVox Inc. (speech creation); Lee Enterprises (print media); WR Hambrecht + Co. (financial service provider) from 2000 to 2012; BlackRock Kelso Capital Corporation (investment company) | |
David M. Moffett (Born 1952)
c/o Columbia Management
Investment Advisers, LLC
225 Franklin Street
Boston, MA 02110
Trustee (since 2011) | | Retired. Chief Executive Officer, Federal Home Loan Mortgage Corporation, from 2008 to 2009; Senior Adviser, Global Financial Services Group, Carlyle Group, Inc., from 2007 to 2008; Vice Chairman and Chief Financial Officer, U.S. Bancorp, from 1993 to 2007. Oversees 52; CIT Group Inc. (commercial and consumer finance); eBay Inc. (online trading community); MBIA Inc. (financial service provider); E.W. Scripps Co. (print and television media), Building Materials Holding Corp. (building materials and construction services); Genworth Financial, Inc. (financial and insurance products and services); and University of Oklahoma Foundation | |
Charles R. Nelson (Born 1942)
c/o Columbia Management
Investment Advisers, LLC
225 Franklin Street
Boston, MA 02110
Trustee (since 1981) | | Retired. Professor Emeritus, University of Washington, since 2011; Professor of Economics, University of Washington from 1976 to 2011; Ford and Louisa Van Voorhis Professor of Political Economy, University of Washington from 1993 to 2011; Adjunct Professor of Statistics, University of Washington from 1980 to 2011; Associate Editor, Journal of Money, Credit and Banking from September 1993 to 2008; consultant on econometric and statistical matters. Oversees 52; None | |
John J. Neuhauser (Born 1943)
c/o Columbia Management
Investment Advisers, LLC
225 Franklin Street
Boston, MA 02110
Trustee (since 1984) | | President, Saint Michael's College, since August 2007; Director or Trustee of several non-profit organizations, including Fletcher Allen Health Care, Inc.; University Professor, Boston College from November 2005 to August 2007; Academic Vice President and Dean of Faculties, Boston College from August 1999 to October 2005. Oversees 52; Liberty All-Star Equity Fund and Liberty All-Star Growth Fund (closed-end funds) | |
Annual Report 2013
43
Columbia Mid Cap Growth Fund
Trustees and Officers (continued)
Independent Trustees (continued)
Name, Address and Year of Birth,
Position with Funds, Year First
Elected or Appointed to Office | | Principal Occupation(s) During Past Five Years, Number of Funds in Columbia
Funds Complex Overseen by Trustee, Other Directorships Held | |
Patrick J. Simpson (Born 1944)
c/o Columbia Management
Investment Advisers, LLC
225 Franklin Street
Boston, MA 02110
Trustee (since 2000) | | Partner, Perkins Coie LLP (law firm). Oversees 52; None | |
Anne-Lee Verville (Born 1945)
c/o Columbia Management
Investment Advisers, LLC
225 Franklin Street
Boston, MA 02110
Trustee (since 1998) | | Retired. General Manager — Global Education Industry from 1994 to 1997, President — Application Systems Division from 1991 to 1994, Chief Financial Officer — US Marketing & Services from 1988 to 1991, and Chief Information Officer from 1987 to 1988, IBM Corporation (computer and technology). Oversees 52; Enesco Group, Inc. (producer of giftware and home and garden decor products) from 2001 to 2006 | |
Interested Trustee
Name, Address and Year of Birth,
Position with Funds, Year First
Elected or Appointed to Office | | Principal Occupation(s) During Past Five Years, Number of Funds in Columbia
Funds Complex Overseen by Trustee, Other Directorships Held | |
William F. Truscott (born 1960)
53600 Ameriprise Financial Center
Minneapolis, MN 55474
Senior Vice President (since 2012) | | Chairman of the Board and President, Columbia Management Investment Advisers, LLC since May 2010 and February 2012 (previously President and Chief Investment Officer, from 2001 to April 2010); Chief Executive Officer, Global Asset Management, Ameriprise Financial, Inc. since September 2012 (previously, Chief Executive Officer, U.S. Asset Management & President, Annuities, from May 2010 to September 2012 and President — U.S. Asset Management and Chief Investment Officer from 2005 to April 2010); Director and Chief Executive Officer, Columbia Management Investment Distributors, Inc. since May 2010 and February 2012, respectively (previously Chairman of the Board and Chief Executive Officer from 2006 to April 2010); Chairman of the Board and Chief Executive Officer, RiverSource Distributors, Inc. since 2006; President and Chief Executive Officer, Ameriprise Certificate Company, 2006 to August 2012; Oversees 184; Director, Ameriprise Certificate Company, 2006-January 2013 | |
The Statement of Additional Information includes additional information about the Trustees of the Funds and is available, without charge, upon request by calling 800.345.6611.
The Board has appointed officers who are responsible for day-to-day business decisions based on policies it has established. The officers serve at the pleasure of the Board. In addition to Mr. Truscott, who is Senior Vice President, the Funds' other officers are:
Officers
Name, Year of Birth and Address | | Principal Occupation(s) During the Past Five Years | |
J. Kevin Connaughton (Born 1964)
225 Franklin Street
Boston, MA 02110
President (since 2009) | | Senior Vice President and General Manager — Mutual Fund Products, Columbia Management Investment Advisers, LLC since May 2010; President, Columbia Funds since 2009 and RiverSource Funds since May 2010; Managing Director, Columbia Management Advisors, LLC, December 2004-April 2010; Senior Vice President and Chief Financial Officer, Columbia Funds, June 2008-January 2009; Treasurer, Columbia Funds, October 2003-May 2008; and senior officer of various other affiliated funds since 2000 | |
Amy Johnson (Born 1965)
5228 Ameriprise Financial Center
Minneapolis, MN 55474
Vice President (since 2010) | | Senior Vice President and Chief Operating Officer, Columbia Management Investment Advisers, LLC since May 2010 (previously Chief Administrative Officer, from 2009-April 2010, Vice President — Asset Management and Trust Company Services, from 2006-2009) | |
Michael G. Clarke (Born 1969)
225 Franklin Street
Boston, MA 02110
Treasurer (since 2011) and Chief
Financial Officer (since 2009) | | Vice President, Columbia Management Investment Advisers, LLC since May 2010; Managing Director of Fund Administration, Columbia Management Advisors, LLC, September 2004-April 2010; senior officer of Columbia Funds and affiliated funds since 2002 | |
Annual Report 2013
44
Columbia Mid Cap Growth Fund
Trustees and Officers (continued)
Officers (continued)
Name, Year of Birth and Address | | Principal Occupation(s) During the Past Five Years | |
Scott R. Plummer (Born 1959)
5228 Ameriprise Financial Center
Minneapolis, MN 55474
Senior Vice President, Assistant
Secretary and Chief Legal Officer
(since 2010) | | Senior Vice President, Chief Legal Officer and Assistant Secretary, Columbia Management Investment Advisers, LLC since June 2005; Senior Vice President and Lead Chief Counsel — Asset Management, Ameriprise Financial, Inc. since May 2010 (previously Vice President and Chief Counsel — Asset Management, 2005-April 2010); Vice President, Chief Counsel and Assistant Secretary, Columbia Management Investment Distributors, Inc. since 2008; Vice President, General Counsel and Secretary, Ameriprise Certificate Company since 2005; Chief Counsel, RiverSource Distributors, Inc. since 2006; senior officer of Columbia Funds and affiliated funds since 2010 | |
Colin Moore (Born 1958)
225 Franklin Street
Boston, MA 02110
Senior Vice President (since 2010) | | Executive Vice President and Global Chief Investment Officer, Ameriprise Financial, Inc. since July 2013; Director and Global Chief Investment Officer, Columbia Management Investment Advisers, LLC since May 2010; Manager, Managing Director and Chief Investment Officer of Columbia Management Advisors, LLC, 2007-April 2010 | |
Thomas P. McGuire (Born 1972)
225 Franklin Street
Boston, MA 02110
Chief Compliance Officer
(since 2012) | | Vice President — Asset Management Compliance, Columbia Management Investment Advisers, LLC since 2010; Chief Compliance Officer, Ameriprise Certificate Company, since September 2010; Compliance Executive, Bank of America, N.A. 2005-2010 | |
Stephen T. Welsh (born 1957)
225 Franklin Street
Boston, MA 02110
Vice President (since 2006) | | President and Director, Columbia Management Investment Services Corp. since May 2010; President and Director, Columbia Management Services, Inc., July 2004-April 2010; Managing Director, Columbia Management Distributors, Inc., August 2007-April 2010 | |
Christopher O. Petersen (born 1970)
5228 Ameriprise Financial Center
Minneapolis, MN 55474
Vice President (since 2010) and
Secretary (since 2011) | | Vice President and Chief Counsel, Ameriprise Financial, Inc. since January 2010 (formerly Vice President and Group Counsel or Counsel, April 2004-January 2010); Assistant Secretary of Columbia Funds, January 2007-April 2011 | |
Paul D. Pearson (born 1956)
10468 Ameriprise Financial Center
Minneapolis, MN 55474
Vice President and Assistant
Treasurer (since 2011) | | Vice President, Investment Accounting, Columbia Management Investment Advisers, LLC, since May 2010; Vice President — Managed Assets, Investment Accounting, Ameriprise Financial, Inc., February 1998-May 2010 | |
Joseph F. DiMaria (Born 1968)
225 Franklin Street
Boston, MA 02110
Vice President (since 2011) and
Chief Accounting Officer (since 2008) | | Vice President, Mutual Fund Administration, Columbia Management Investment Advisers, LLC, since May 2010; Director of Fund Administration, Columbia Management Advisors, LLC, January 2006-April 2010 | |
Paul B. Goucher (born 1968)
100 Park Avenue
New York, NY 10017
Vice President and Assistant
Secretary (since 2010) | | Vice President and Lead Chief Counsel, Ameriprise Financial, Inc. since November 2008 and January 2013, respectively (formerly, Chief Counsel from January 2010-January 2013 and Group Counsel from November 2008-January 2010); Director, Managing Director and General Counsel, J. & W. Seligman & Co. Incorporated, July 2008-November 2008 (previously, Managing Director and Associate General Counsel, January 2005-July 2008) | |
Michael E. DeFao (born 1968)
225 Franklin Street
Boston, MA 02110
Vice President and Assistant
Secretary (since 2011) | | Vice President and Chief Counsel, Ameriprise Financial, Inc. since May 2010; Associate General Counsel, Bank of America, N.A. June 2005-April 2010 | |
Annual Report 2013
45
Columbia Mid Cap Growth Fund
Board Consideration and Approval of Advisory Agreement
On June 14, 2013, the Board of Trustees (the "Board") and the Trustees who are not interested persons (as defined in the Investment Company Act of 1940) of the Trust (the "Independent Trustees") unanimously approved the continuation of the Investment Management Services Agreement (the "Advisory Agreement") with Columbia Management Investment Advisers, LLC (the "Investment Manager") with respect to Columbia Mid Cap Growth Fund (the "Fund"), a series of the Trust. As detailed below, the Advisory Fees and Expenses Committee (the "Committee") and the Board met on multiple occasions to review and discuss, both among themselves and with the management team of the Investment Manager, materials provided by the Investment Manager before determining to approve the continuation of the Advisory Agreement.
In connection with their deliberations regarding the continuation of the Advisory Agreement, the Committee and the Board evaluated materials requested from the Investment Manager regarding the Fund and the Advisory Agreement, and discussed these materials with representatives of the Investment Manager at Committee meetings held on March 5, 2013, April 24, 2013 and June 13, 2013, and at the Board meeting held on June 14, 2013. In addition, the Board considers matters bearing on the Advisory Agreement at most of its other meetings throughout the year and meets regularly with senior management of the Funds and the Investment Manager. Through the Board's Investment Oversight Committees, Trustees also meet with selected Fund portfolio managers and other investment personnel at various times throughout the year. The Committee and the Board also consulted with Fund counsel and with the Independent Trustees' independent legal counsel, who advised on various matters with respect to the Committee's and the Board's considerations and otherwise assisted the Committee and the Board in their deliberations. On June 13, 2013, the Committee recommended that the Board approve the continuation of the Advisory Agreement. On June 14, 2013, the Board, including the Independent Trustees, voting separately, unanimously approved the continuation of the Advisory Agreement for the Fund.
The Committee and the Board considered all information that they, their legal counsel, or the Investment Manager believed reasonably necessary to evaluate and to determine whether to approve the continuation of the Advisory Agreement. The information and factors considered by the Committee and the Board in recommending for approval or approving the continuation of the Advisory Agreement for the Fund included the following:
• Information on the investment performance of the Fund relative to the performance of a group of mutual funds determined to be comparable to the Fund by an independent third-party data provider, as well as performance relative to benchmarks;
• Information on the Fund's advisory fees and total expenses, including information comparing the Fund's expenses to those of a group of comparable mutual funds, as determined by the independent third-party data provider;
• The Investment Manager's agreement to contractually limit or cap total operating expenses for the Fund so that total operating expenses (excluding certain fees and expenses, such as transaction costs and certain other investment related expenses, interest, taxes, acquired fund fees and expenses, and extraordinary expenses) would not exceed the median expenses of a group of comparable funds (as determined from time to time, generally annually, by the independent third-party data provider);
• The terms and conditions of the Advisory Agreement;
• The terms and conditions of other agreements and arrangements with affiliates of the Investment Manager relating to the operations of the Fund, including the Administrative Services Agreement, the Distribution Agreement and the Transfer and Dividend Disbursing Agent Agreement;
• Descriptions of various functions performed by the Investment Manager under the Advisory Agreement, including portfolio management and portfolio trading practices;
• Information regarding the management fees and investment performance of comparable portfolios of other clients of the Investment Manager, including institutional separate accounts;
• Information regarding the reputation, regulatory history and resources of the Investment Manager, including information regarding senior management, portfolio managers and other personnel;
• Information regarding the capabilities of the Investment Manager with respect to compliance monitoring services, including an assessment of the Investment Manager's compliance system by the Fund's Chief Compliance Officer; and
• The profitability to the Investment Manager and its affiliates from their relationships with the Fund.
Annual Report 2013
46
Columbia Mid Cap Growth Fund
Board Consideration and Approval of Advisory Agreement (continued)
Nature, Extent and Quality of Services Provided under the Advisory Agreement
The Committee and the Board considered the nature, extent and quality of services provided to the Fund by the Investment Manager and its affiliates under the Advisory Agreement and under separate agreements for the provision of transfer agency and administrative services, and the resources dedicated to the Fund and the other Columbia Funds by the Investment Manager and its affiliates. The Committee and the Board considered, among other things, the Investment Manager's ability to attract, motivate and retain highly qualified research, advisory and supervisory investment professionals (including personnel and other resources, compensation programs for personnel involved in fund management, reputation and other attributes), the portfolio management services provided by those investment professionals, and the quality of the Investment Manager's investment research capabilities and trade execution services. The Committee and the Board also considered the potential benefits to shareholders of investing in a mutual fund that is part of a fund complex offering exposure to a variety of asset classes and investment disciplines and providing a variety of fund and shareholder services.
The Committee and the Board also considered the professional experience and qualifications of the senior personnel of the Investment Manager, which included consideration of the Investment Manager's experience with similarly-structured funds. The Committee and the Board noted the compliance programs of and the compliance-related resources provided to the Fund by the Investment Manager and its affiliates, and considered the Investment Manager's ability to provide administrative services to the Fund pursuant to a separate Administrative Services Agreement, including the Investment Manager's ability to coordinate the activities of the Fund's other service providers. After reviewing these and related factors, the Committee and the Board concluded, within the context of their overall conclusions, that the nature, extent and quality of the services provided to the Fund under the Advisory Agreement supported the continuation of the Advisory Agreement.
Investment Performance
The Committee and the Board reviewed information about the performance of the Fund over various time periods, including performance information relative to benchmarks and information based on reports of the independent third-party data provider that compared the performance of the Fund to the performance of a group of comparable mutual funds. The Committee and the Board also reviewed a description of the third party's methodology for identifying the Fund's peer groups for purposes of performance and expense comparisons. Although the Fund's performance lagged that of a relevant peer group for certain (although not necessarily all) periods, the Committee and the Board concluded that other factors relevant to performance were sufficient, in light of other considerations, to warrant continuation of the Fund's Advisory Agreement. Those factors included one or more of the following: (i) that the Fund's performance, although lagging in certain recent periods, was stronger over the longer term; (ii) that the underperformance was attributable, to a significant extent, to investment decisions that were reasonable and consistent with the Fund's investment strategy and policies and that the Fund was performing within a reasonable range of expectations, given those investment decisions, market conditions and the Fund's investment strategy; (iii) that the Fund's performance was competitive when compared to other relevant performance benchmarks or peer groups; and (iv) that the Investment Manager had taken or was taking steps designed to help improve the Fund's investment performance, including, but not limited to, replacing portfolio managers, enhancing the resources supporting the portfolio managers, or modifying investment strategies.
The Committee and the Board noted that, through December 31, 2012, the Fund's performance was in the eighty-second, fifty-ninth and fiftieth percentile (where the best performance would be in the first percentile) of its category selected by the independent third-party data provider for the purposes of performance comparisons for the one-, three- and five- year periods, respectively.
The Committee and the Board also considered the Investment Manager's performance and reputation generally, the Investment Manager's historical responsiveness to Board concerns about performance, and the Investment Manager's willingness to take steps intended to improve performance. After reviewing these and related factors, the Committee and the Board concluded, within the context of their overall conclusions, that the performance of the Fund and the Investment Manager was sufficient, in light of other considerations, to warrant the continuation of the Advisory Agreement.
Investment Advisory Fee Rates and Other Expenses
The Committee and the Board considered the advisory fees charged to the Fund under the Advisory Agreement as well as the total expenses incurred by the Fund. In assessing the reasonableness of the fees under the Advisory Agreement, the
Annual Report 2013
47
Columbia Mid Cap Growth Fund
Board Consideration and Approval of Advisory Agreement (continued)
Committee and the Board considered, among other information, the Fund's advisory fee and its total expense ratio as a percentage of average daily net assets. The Committee and the Board noted that the Fund's actual management fee and net expense ratio are both ranked in the second quintile (where the lowest fees and expenses would be in the first quintile) against the Fund's expense universe as determined by the independent third-party data provider for purposes of expense comparison. The Committee and the Board also took into account the fee waiver and expense limitation arrangements agreed to by the Investment Manager, as noted above.
The Committee and the Board also received and considered information about the advisory fees charged by the Investment Manager to institutional separate accounts. In considering the fees charged to those accounts, the Committee and the Board took into account, among other things, the Investment Manager's representations about the differences between managing mutual funds as compared to other types of accounts, including differences in the services provided, differences in the risk profile of such business for the Investment Manager and the additional resources required to manage mutual funds effectively. In evaluating the Fund's advisory fees, the Committee and the Board also took into account the demands, complexity and quality of the investment management of the Fund.
After reviewing these and related factors, the Committee and the Board concluded, within the context of their overall conclusions, that the advisory fee rates and expenses of the Fund supported the continuation of the Advisory Agreement.
Costs of Services Provided and Profitability
The Committee and the Board also took note of the costs of the services provided (both on an absolute and relative basis) and the profitability to the Investment Manager and its affiliates in connection with their relationships with the Fund. In evaluating these considerations, the Committee and the Board took note of the advisory fees charged by the Investment Manager to other clients, including fees charged by the Investment Manager to institutional separate account clients with similar investment strategies to those of the Fund.
The Committee and the Board also considered the compensation directly or indirectly received by the Investment Manager's affiliates in connection with their relationships with the Fund. The Committee and the Board reviewed information provided by management as to the profitability of the Investment Manager and its affiliates of their relationships with the Fund, information about the allocation of expenses used to calculate profitability, and comparisons of profitability levels realized in 2012 to profitability levels realized in 2011. When reviewing profitability, the Committee and the Board also considered court cases in which adviser profitability was an issue in whole or in part, the performance of the Fund, the expense ratio of the Fund, and the implementation of expense limitations with respect to the Fund. The Committee and the Board also considered information provided by the Investment Manager regarding its financial condition and comparing its profitability to that of other asset management firms that are, or are subsidiaries of, publicly traded companies.
After reviewing these and related factors, the Committee and the Board concluded, within the context of their overall conclusions, that the costs of services provided and the profitability to the Investment Manager and its affiliates from their relationships with the Fund supported the continuation of the Advisory Agreement.
Economies of Scale
The Committee and the Board considered the potential existence of economies of scale in the provision by the Investment Manager of services to the Fund, to groups of related funds, and to the Investment Manager's investment advisory clients as a whole, and whether those economies of scale were shared with the Fund through breakpoints in investment advisory fees or other means, such as expense limitation arrangements and additional investments by the Investment Manager in investment, trading and compliance resources. The Committee and the Board noted that the investment advisory fee schedules for the Fund contained breakpoints that would reduce the fee rate on assets above specified threshold levels.
In considering these matters, the Committee and the Board also considered the costs of the services provided and the profitability to the Investment Manager and its affiliates from their relationships with the Fund, as discussed above. After reviewing these and related factors, the Committee and the Board concluded, within the context of their overall conclusions, that the extent to which any economies of scale were expected to be shared with the Fund supported the continuation of the Advisory Agreement.
Annual Report 2013
48
Columbia Mid Cap Growth Fund
Board Consideration and Approval of Advisory Agreement (continued)
Other Benefits to the Investment Manager
The Committee and the Board received and considered information regarding "fall-out" or ancillary benefits received by the Investment Manager and its affiliates as a result of their relationships with the Fund, such as the engagement of the Investment Manager to provide administrative services to the Fund and the engagement of the Investment Manager's affiliates to provide distribution and transfer agency services to the Fund. The Committee and the Board considered that the Fund's distributor retains a portion of the distribution fees from the Fund. The Committee and the Board also considered the benefits of research made available to the Investment Manager by reason of brokerage commissions generated by the Fund's securities transactions, and reviewed information about the Investment Manager's practices with respect to allocating portfolio transactions for brokerage and research services. The Committee and the Board considered the possible conflicts of interest associated with certain fall-out or other ancillary benefits and the reporting, disclosure and other processes that are in place to address such possible conflicts of interest. The Committee and the Board recognized that the Investment Manager's profitability would be somewhat lower without these benefits.
Conclusion
The Committee and the Board reviewed all of the above considerations in reaching their decisions to recommend or approve the continuation of the Advisory Agreement. In their deliberations, the Trustees did not identify any particular information that was all-important or controlling, and individual Trustees may have attributed different weights to the various factors. Based on their evaluation of all factors that they deemed to be material, including those factors described above, and assisted by the advice of independent legal counsel, the Board, including the Independent Trustees, voting separately, unanimously approved the continuation of the Advisory Agreement.
Annual Report 2013
49
This page intentionally left blank.
Annual Report 2013
50
This page intentionally left blank.
Annual Report 2013
51
This page intentionally left blank.
Annual Report 2013
52
Columbia Mid Cap Growth Fund
Important Information About This Report
Each fund mails one shareholder report to each shareholder address. If you would like more than one report, please call shareholder services at 800.345.6611 and additional reports will be sent to you.
The policy of the Board is to vote the proxies of the companies in which each fund holds investments consistent with the procedures as stated in the Statement of Additional Information (SAI). You may obtain a copy of the SAI without charge by calling 800.345.6611; contacting your financial intermediary; visiting columbiamanagement.com; or searching the website of the Securities and Exchange Commission (SEC) at sec.gov. Information regarding how each fund voted proxies relating to portfolio securities is filed with the SEC by August 31 for the most recent 12-month period ending June 30 of that year, and is available without charge by visiting columbiamanagement.com; or searching the website of the SEC at sec.gov.
Each fund files a complete schedule of portfolio holdings with the SEC for the first and third quarters of each fiscal year on Form N-Q. Each fund's Form N-Q is available on the SEC's website at sec.gov and may be reviewed and copied at the SEC's Public Reference Room in Washington, D.C. Information on the operation of the Public Reference Room may be obtained by calling 800.SEC.0330. Each fund's complete schedule of portfolio holdings, as filed on Form N-Q, can also be obtained without charge, upon request, by calling 800.345.6611.
Annual Report 2013
53

Columbia Mid Cap Growth Fund
P.O. Box 8081
Boston, MA 02266-8081
columbiamanagement.com
This information is for use with concurrent or prior delivery of a fund prospectus. Please read and consider the investment objectives, risks, charges and expenses for any fund carefully before investing. For a prospectus which contains this and other important information about the Fund go to columbiamanagement.com. The Fund is distributed by Columbia Management Investment Distributors, Inc., member FINRA, and managed by Columbia Management Investment Advisers, LLC.
© 2013 Columbia Management Investment Advisers, LLC. All rights reserved.
ANN194_08_C01_(10/13)
Annual Report
August 31, 2013

Not FDIC insured • No bank guarantee • May lose value
 Dear Shareholders,
A return to volatility
Volatility returned to the financial markets in the second quarter of 2013, as uncertainty about the global economy, monetary policy and the impact of the sequester's spending cuts weighed on investors. Households advanced their spending but also allocated less to savings. Labor markets continued to crank out jobs at a steady pace, slowly reducing unemployment. Housing activity remained strong and retail sales were higher despite no real increase in income. The single weak spot was in the manufacturing sector, where activity slowed. While the consumer has weathered the domestic drag well, business has been closer to the global slowdown and effects of sequestration. Businesses remain very cautious, keeping inventories and staffs lean, and are planning for but not yet confident enough to make capital expenditures.
Against this backdrop, equities outperformed fixed income during the second quarter of 2013. Small-cap stocks outperformed large- and mid-cap stocks, and growth outperformed value except for in the large-cap sector. Outside the United States, foreign stock markets generally lost ground, with the most significant losses sustained by emerging markets.
Columbia Management to begin delivering summary prospectuses
Each Columbia fund is required to update its prospectus on an annual basis. Beginning with June 2013 prospectus updates, shareholders of Columbia retail mutual funds will start to receive a summary prospectus, rather than the full length (statutory) mutual fund prospectus they have received in the past.
Each fund's summary prospectus will include the following key information:
> Investment objective
> Fee and expense table
> Portfolio turnover rate information
> Principal investment strategies, principal risks and performance information
> Management information
> Purchase and sale information
> Tax information
> Financial intermediary compensation information
Each fund's statutory prospectus will contain additional information about the fund and its risks. Both the statutory and summary prospectus will be updated each year, and will be available at columbiamanagement.com. Shareholders may request a printed version of a statutory prospectus at no cost by calling 800.345.6611 or sending an email to serviceinquiries@columbiamanagement.com.
Stay on track with Columbia Management
Backed by more than 100 years of experience, Columbia Management is one of the nation's largest asset managers. At the heart of our success — and, most importantly, that of our investors — are highly talented industry professionals, brought together by a unique way of working. We are dedicated to helping you take advantage of today's opportunities and anticipate tomorrow's. We stay abreast of the latest investment trends and ideas, using our collective insight to evaluate events and transform them into solutions you can use.
Visit columbiamanagement.com for:
> The Columbia Management Perspectives blog, featuring timely posts by our investment teams
> Detailed up-to-date fund performance and portfolio information
> Economic analysis and market commentary
> Quarterly fund commentaries
> Columbia Management Investor, our award-winning quarterly newsletter for shareholders
Thank you for your continued support of the Columbia Funds. We look forward to serving your investment needs for many years to come.
Best Regards,

J. Kevin Connaughton
President, Columbia Funds
Investors should consider the investment objectives, risks, charges and expenses of a mutual fund carefully before investing. For a free prospectus, which contains this and other important information about a fund, visit columbiamanagement.com. The prospectus should be read carefully before investing.
Columbia Funds are distributed by Columbia Management Investment Distributors, Inc., member FINRA, and managed by Columbia Management Investment Advisers, LLC.
© 2013 Columbia Management Investment Advisers, LLC. All rights reserved.
Performance Overview | | | 2 | | |
Manager Discussion of Fund Performance | | | 4 | | |
Understanding Your Fund's Expenses | | | 6 | | |
Portfolio of Investments | | | 7 | | |
Statement of Assets and Liabilities | | | 11 | | |
Statement of Operations | | | 13 | | |
Statement of Changes in Net Assets | | | 14 | | |
Financial Highlights | | | 16 | | |
Notes to Financial Statements | | | 22 | | |
Report of Independent Registered
Public Accounting Firm | | | 28 | | |
Trustees and Officers | | | 29 | | |
Board Consideration and Approval of Advisory Agreement | | | 32 | | |
Important Information About This Report | | | 37 | | |
Fund Investment Manager
Columbia Management Investment
Advisers, LLC
225 Franklin Street
Boston, MA 02110
Fund Distributor
Columbia Management Investment
Distributors, Inc.
225 Franklin Street
Boston, MA 02110
Fund Transfer Agent
Columbia Management Investment
Services Corp.
P.O. Box 8081
Boston, MA 02266-8081
For more information about any of the funds, please visit columbiamanagement.com or call 800.345.6611. Customer Service Representatives are available to answer your questions Monday through Friday from 8 a.m. to 8 p.m. Eastern time.
The views expressed in this report reflect the current views of the respective parties. These views are not guarantees of future performance and involve certain risks, uncertainties and assumptions that are difficult to predict, so actual outcomes and results may differ significantly from the views expressed. These views are subject to change at any time based upon economic, market or other conditions and the respective parties disclaim any responsibility to update such views. These views may not be relied on as investment advice and, because investment decisions for a Columbia Fund are based on numerous factors, may not be relied on as an indication of trading intent on behalf of any particular Columbia Fund. References to specific securities should not be construed as a recommendation or investment advice.
Annual Report 2013
Performance Summary
> Columbia Technology Fund (the Fund) Class A shares returned 23.92% excluding sales charges for the 12-month period that ended August 31, 2013.
> The Fund slightly outperformed its benchmark, the Bank of America Merrill Lynch (BofAML) 100 Technology Index, which returned 23.48% during the same period.
Average Annual Total Returns (%) (for period ended August 31, 2013)
| | | Inception | | 1 Year | | 5 Years | | 10 Years | |
Class A | | 11/01/02 | | | | | | | | | | | | | |
Excluding sales charges | | | | | | | 23.92 | | | | 6.74 | | | | 9.76 | | |
Including sales charges | | | | | | | 16.83 | | | | 5.49 | | | | 9.11 | | |
Class B | | 11/01/02 | | | | | | | | | | | | | |
Excluding sales charges | | | | | | | 22.96 | | | | 5.94 | | | | 8.95 | | |
Including sales charges | | | | | | | 17.96 | | | | 5.62 | | | | 8.95 | | |
Class C * | | 10/13/03 | | | | | | | | | | | | | |
Excluding sales charges | | | | | | | 22.92 | | | | 5.93 | | | | 8.97 | | |
Including sales charges | | | | | | | 21.92 | | | | 5.93 | | | | 8.97 | | |
Class R4 * | | 11/08/12 | | | 24.29 | | | | 7.01 | | | | 10.05 | | |
Class R5 * | | 11/08/12 | | | 24.38 | | | | 7.02 | | | | 10.06 | | |
Class Z | | 11/09/00 | | | 24.17 | | | | 6.99 | | | | 10.04 | | |
BofAML 100 Technology Index | | | | | | | 23.48 | | | | 6.84 | | | | 6.30 | | |
Returns for Class A are shown with and without the maximum initial sales charge of 5.75%. Returns for Class B are shown with and without the applicable contingent deferred sales charge (CDSC) of 5.00% in the first year, declining to 1.00% in the sixth year and eliminated thereafter. Returns for Class C are shown with and without the 1.00% CDSC for the first year only. The Fund's other classes are not subject to sales charges and have limited eligibility. Please see the Fund's prospectus for details. Performance for different share classes will vary based on differences in sales charges and fees associated with each class. All results shown assume reinvestment of distributions during the period. Returns do not reflect the deduction of taxes that a shareholder may pay on Fund distributions or on the redemption of Fund shares. Performance results reflect the effect of any fee waivers or reimbursements of Fund expenses by Columbia Management Investment Advisers, LLC and/or any of its affiliates. Absent these fee waivers or expense reimbursement arrangements, performance results would have been lower.
The performance information shown represents past performance and is not a guarantee of future results. The investment return and principal value of your investment will fluctuate so that your shares, when redeemed, may be worth more or less than their original cost. Current performance may be lower or higher than the performance information shown. You may obtain performance information current to the most recent month-end by contacting your financial intermediary, visiting columbiamanagement.com or calling 800.345.6611.
* The returns shown for periods prior to the share class inception date (including returns for the Life of the Fund, if shown, which are since Fund inception) include the returns of the Fund's oldest share class. These returns are adjusted to reflect any higher class-related operating expenses of the newer share classes, as applicable. Please visit columbiamanagement.com/mutual-funds/appended-performance for more information.
The BofAML 100 Technology Index is an unmanaged equally weighted index of 100 leading technology stocks.
Indices are not available for investment, are not professionally managed and do not reflect sales charges, fees, brokerage commissions, taxes or other expenses of investing. Securities in the Fund may not match those in an index.
Annual Report 2013
2
Performance Overview (continued)
Performance of a Hypothetical $10,000 Investment (September 1, 2003 – August 31, 2013)
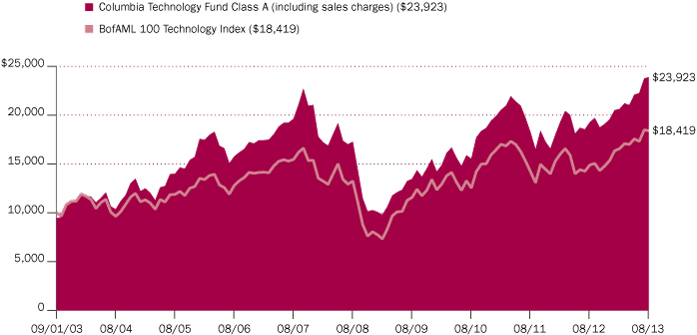
The chart above shows the change in value of a hypothetical $10,000 investment in Class A shares of Columbia Technology Fund during the stated time period, and does not reflect the deduction of taxes that a shareholder may pay on Fund distributions or on the redemption of Fund shares.
Annual Report 2013
3
Manager Discussion of Fund Performance
For the 12-month period that ended August 31, 2013, the Fund's Class A shares returned 23.92% excluding sales charges. The Fund's benchmark, the Bank of America Merrill Lynch (BofAML) 100 Technology Index, returned 23.48% for the same 12-month period. Because our bottom-up fundamental research process favors high quality growth companies, the Fund was underexposed to the more defensive names favored by the market earlier in the period. This trend reversed during the second half of the year, improving returns among high quality growth names favored by the Fund and boosting returns. Security selection among internet catalog and retail names and internet software and services providers generally accounted for the Fund's modest advantage over the benchmark during the period. Certain holdings in the computers and peripherals industry hampered results.
Internet-Related Stocks Produced Solid Results
The Fund benefited from internet retail holdings priceline.com and TripAdvisor, which were rewarded by investors who favored cyclical names with strong internet franchises and that continued to grow revenues. Stock selection in the internet software and services sector also aided the Fund's returns, as investors were drawn to emerging internet companies growing their mobile footprints in large, scalable markets. In that regard, Yelp, Shutterstock, ChannelAdvisor, and Facebook also made a contribution to performance for the period. Within the IT services industry, a position in payment processor Visa also aided returns as the company continued to benefit from the secular shift away from cash and toward electronic transactions.
Computers and Peripherals, Semiconductor Positioning Disappointed
Stock selection in computers and peripherals detracted from performance during the year. Apple was the largest detractor, as excitement about the much-anticipated iPhone 5 release faded. Despite better-than-expected quarterly earnings, an increased dividend and expanded share repurchase program, investors sold the stock due to concerns about eroding margins as new products failed to live up to expectations. We reduced the portfolio's position in Apple during the period.
Portfolio positioning and stock selection in the semiconductor industry also detracted from relative returns during the period. Despite a decline in PC demand, the semiconductor industry rebounded strongly during the period, driven by compelling valuations and investor belief that the cycle may be starting to turn. Against that backdrop, the portfolio's underweight in semiconductors detracted from performance, as benchmark constituents such as ARM Holdings, which has a growing market share in mobile technologies like smartphones and tablets, posted solid gains during the period.
Looking Ahead
Concerns about the impact of tax increases and enforced federal spending cuts, another showdown over the debt ceiling and the possibility of an attack on Syria weighed on investors during the 12-month period ended August 31, 2013. However, steady job growth and a solid rebound in the housing market helped keep economic growth afloat. After a brief pullback in the manufacturing sector, manufacturing activity picked up late in the period — a sign that the economy
Portfolio Management
Wayne Collette, CFA
Rahul Narang
Top Ten Holdings (%)
(at August 31, 2013) | |
Google, Inc., Class A | | | 3.5 | | |
Apple, Inc. | | | 2.9 | | |
Alliance Data Systems Corp. | | | 2.1 | | |
Amazon.com, Inc. | | | 2.0 | | |
Cisco Systems, Inc. | | | 1.8 | | |
Facebook, Inc., Class A | | | 1.7 | | |
Salesforce.com, Inc. | | | 1.6 | | |
Micron Technology, Inc. | | | 1.5 | | |
Automatic Data
Processing, Inc. | | | 1.5 | | |
Check Point Software
Technologies Ltd. | | | 1.5 | | |
Percentages indicated are based upon total investments (excluding Money Market Funds).
For further detail about these holdings, please refer to the section entitled "Portfolio of Investments."
Fund holdings are as of the date given, are subject to change at any time, and are not recommendations to buy or sell any security.
Portfolio Breakdown (%)
(at August 31, 2013) | |
Common Stocks | | | 98.1 | | |
Consumer Discretionary | | | 10.0 | | |
Industrials | | | 1.0 | | |
Information Technology | | | 85.1 | | |
Telecommunication Services | | | 2.0 | | |
Exchange-Traded Funds | | | 0.5 | | |
Money Market Funds | | | 1.4 | | |
Total | | | 100.0 | | |
Percentages indicated are based upon total investments. The Fund's portfolio composition is subject to change.
Annual Report 2013
4
Manager Discussion of Fund Performance (continued)
has the potential to break out of the doldrums if confidence rises among consumers and business alike. At the same time, earnings growth estimates for technology stocks have returned to more reasonable levels and the consensus expectation is for growth that is more in line with historical averages. In this environment, we continue to adhere to our bottom-up, fundamental research process, which favors high quality companies with sustainable, long-term growth prospects, high or improving margins and return on invested capital, internally financed growth and strong management teams.
Investment Risks
The share price of a fund that invests primarily in one sector will likely be subject to more volatility than a fund that invests across many sectors. Technology stocks may be more volatile than stocks in other sectors. The Fund should be considered part of an overall investment program, and not a complete investment program. See the Fund's prospectus for information on these and other risks.
Annual Report 2013
5
Understanding Your Fund's Expenses
(Unaudited)
As an investor, you incur two types of costs. There are transaction costs, which generally include sales charges on purchases and may include redemption fees. There are also ongoing costs, which generally include management fees, distribution and service (Rule 12b-1) fees, and other fund expenses. The following information is intended to help you understand your ongoing costs (in dollars) of investing in the Fund and to help you compare these costs with the ongoing costs of investing in other mutual funds.
Analyzing Your Fund's Expenses
To illustrate these ongoing costs, we have provided examples and calculated the expenses paid by investors in each share class of the Fund during the period. The actual and hypothetical information in the table is based on an initial investment of $1,000 at the beginning of the period indicated and held for the entire period. Expense information is calculated two ways and each method provides you with different information. The amount listed in the "Actual" column is calculated using the Fund's actual operating expenses and total return for the period. You may use the Actual information, together with the amount invested, to estimate the expenses that you paid over the period. Simply divide your account value by $1,000 (for example, an $8,600 account value divided by $1,000 = 8.6), then multiply the results by the expenses paid during the period under the Actual column. The amount listed in the "Hypothetical" column assumes a 5% annual rate of return before expenses (which is not the Fund's actual return) and then applies the Fund's actual expense ratio for the period to the hypothetical return. You should not use the hypothetical account values and expenses to estimate either your actual account balance at the end of the period or the expenses you paid during the period. See "Compare With Other Funds" below for details on how to use the hypothetical data.
Compare With Other Funds
Since all mutual funds are required to include the same hypothetical calculations about expenses in shareholder reports, you can use this information to compare the ongoing cost of investing in the Fund with other funds. To do so, compare the hypothetical example with the 5% hypothetical examples that appear in the shareholder reports of other funds. As you compare hypothetical examples of other funds, it is important to note that hypothetical examples are meant to highlight the ongoing costs of investing in a fund only and do not reflect any transaction costs, such as sales charges, or redemption or exchange fees. Therefore, the hypothetical calculations are useful in comparing ongoing costs only, and will not help you determine the relative total costs of owning different funds. If transaction costs were included in these calculations, your costs would be higher.
March 1, 2013 – August 31, 2013
| | | Account Value at the Beginning
of the Period ($) | | Account Value at the End of the
Period ($) | | Expenses Paid During the
Period ($) | | Fund's Annualized
Expense Ratio (%) | |
| | | Actual | | Hypothetical | | Actual | | Hypothetical | | Actual | | Hypothetical | | Actual | |
Class A | | | 1,000.00 | | | | 1,000.00 | | | | 1,159.20 | | | | 1,017.75 | | | | 7.90 | | | | 7.38 | | | | 1.46 | | |
Class B | | | 1,000.00 | | | | 1,000.00 | | | | 1,153.80 | | | | 1,013.99 | | | | 11.93 | | | | 11.16 | | | | 2.21 | | |
Class C | | | 1,000.00 | | | | 1,000.00 | | | | 1,153.50 | | | | 1,013.99 | | | | 11.93 | | | | 11.16 | | | | 2.21 | | |
Class R4 | | | 1,000.00 | | | | 1,000.00 | | | | 1,160.00 | | | | 1,018.95 | | | | 6.61 | | | | 6.17 | | | | 1.22 | | |
Class R5 | | | 1,000.00 | | | | 1,000.00 | | | | 1,160.90 | | | | 1,019.70 | | | | 5.80 | | | | 5.42 | | | | 1.07 | | |
Class Z | | | 1,000.00 | | | | 1,000.00 | | | | 1,159.40 | | | | 1,019.00 | | | | 6.55 | | | | 6.12 | | | | 1.21 | | |
Expenses paid during the period are equal to the annualized expense ratio for each class as indicated above multiplied by the average account value over the period and then multiplied by the number of days in the Fund's most recent fiscal half year and divided by 365.
Expenses do not include fees and expenses incurred indirectly by the Fund from the underlying funds in the Fund may invest (also referred to as "acquired funds"), including affiliated and non-affiliated investment vehicles (including mutual funds and exchange-traded funds).
Annual Report 2013
6
Portfolio of Investments
August 31, 2013
(Percentages represent value of investments compared to net assets)
Common Stocks 98.3%
Issuer | | Shares | | Value ($) | |
Consumer Discretionary 10.0% | |
Diversified Consumer Services 1.2% | |
LifeLock, Inc.(a) | | | 144,879 | | | | 1,826,925 | | |
Internet & Catalog Retail 5.8% | |
Amazon.com, Inc.(a) | | | 10,586 | | | | 2,974,454 | | |
Expedia, Inc. | | | 18,866 | | | | 882,174 | | |
LightInTheBox Holding Co., Ltd., ADR(a) | | | 49,062 | | | | 474,430 | | |
priceline.com, Inc.(a) | | | 2,034 | | | | 1,908,970 | | |
RetailMeNot, Inc.(a) | | | 23,582 | | | | 753,681 | | |
TripAdvisor, Inc.(a) | | | 24,455 | | | | 1,808,936 | | |
Total | | | | | 8,802,645 | | |
Media 3.0% | |
AMC Networks, Inc., Class A(a) | | | 13,733 | | | | 851,171 | | |
Charter Communications Operating LLC, Class A(a)
| | | 7,363 | | | | 894,016 | | |
Comcast Corp., Class A | | | 30,679 | | | | 1,291,279 | | |
Walt Disney Co. (The) | | | 25,075 | | | | 1,525,312 | | |
Total | | | | | 4,561,778 | | |
Total Consumer Discretionary | | | | | 15,191,348 | | |
Industrials 1.0% | |
Commercial Services & Supplies 0.5% | |
MiX Telematics Ltd., ADR(a) | | | 47,695 | | | | 738,795 | | |
Professional Services 0.5% | |
Verisk Analytics, Inc., Class A(a) | | | 12,210 | | | | 759,218 | | |
Total Industrials | | | | | 1,498,013 | | |
Information Technology 85.3% | |
Communications Equipment 4.1% | |
Cisco Systems, Inc. | | | 115,587 | | | | 2,694,333 | | |
Oplink Communications, Inc.(a) | | | 21,576 | | | | 401,098 | | |
QUALCOMM, Inc. | | | 26,901 | | | | 1,782,998 | | |
Telefonaktiebolaget LM Ericsson, ADR | | | 113,132 | | | | 1,332,695 | | |
Total | | | | | 6,211,124 | | |
Computers & Peripherals 6.8% | |
Apple, Inc. | | | 8,956 | | | | 4,362,020 | | |
EMC Corp. | | | 73,971 | | | | 1,906,972 | | |
NetApp, Inc. | | | 20,522 | | | | 852,484 | | |
SanDisk Corp. | | | 17,372 | | | | 958,587 | | |
Seagate Technology PLC | | | 31,556 | | | | 1,209,226 | | |
Western Digital Corp. | | | 16,204 | | | | 1,004,648 | | |
Total | | | | | 10,293,937 | | |
Common Stocks (continued)
Issuer | | Shares | | Value ($) | |
Electronic Equipment, Instruments & Components 2.1% | |
Amphenol Corp., Class A | | | 20,325 | | | | 1,540,025 | | |
InvenSense, Inc.(a) | | | 35,557 | | | | 635,404 | | |
TE Connectivity Ltd. | | | 20,552 | | | | 1,007,048 | | |
Total | | | | | 3,182,477 | | |
Internet Software & Services 17.4% | |
Akamai Technologies, Inc.(a) | | | 37,827 | | | | 1,739,285 | | |
Baidu, Inc., ADR(a) | | | 11,358 | | | | 1,539,350 | | |
ChannelAdvisor Corp.(a) | | | 55,264 | | | | 1,692,184 | | |
Cvent, Inc.(a) | | | 32,081 | | | | 1,142,404 | | |
eBay, Inc.(a) | | | 32,202 | | | | 1,609,778 | | |
Equinix, Inc.(a) | | | 3,888 | | | | 675,501 | | |
Facebook, Inc., Class A(a) | | | 61,231 | | | | 2,527,616 | | |
Gogo, Inc.(a) | | | 59,053 | | | | 667,299 | | |
Google, Inc., Class A(a) | | | 6,178 | | | | 5,232,148 | | |
LinkedIn Corp., Class A(a) | | | 9,058 | | | | 2,174,282 | | |
OpenTable, Inc.(a) | | | 16,482 | | | | 1,228,568 | | |
Pandora Media, Inc.(a) | | | 40,840 | | | | 752,273 | | |
Shutterstock, Inc.(a) | | | 18,969 | | | | 941,621 | | |
Trulia, Inc.(a) | | | 21,248 | | | | 882,217 | | |
VeriSign, Inc.(a) | | | 37,843 | | | | 1,816,086 | | |
Yelp, Inc.(a) | | | 31,828 | | | | 1,654,419 | | |
Total | | | | | 26,275,031 | | |
IT Services 17.3% | |
Accenture PLC, Class A | | | 15,962 | | | | 1,153,254 | | |
Acxiom Corp.(a) | | | 40,347 | | | | 1,003,833 | | |
Alliance Data Systems Corp.(a) | | | 15,902 | | | | 3,112,021 | | |
Automatic Data Processing, Inc. | | | 31,626 | | | | 2,250,506 | | |
Blackhawk Network Holdings, Inc.(a) | | | 4,194 | | | | 102,795 | | |
Cognizant Technology Solutions Corp., Class A(a)
19,331 | | | | | | | 1,416,962 | | |
Computer Sciences Corp. | | | 16,310 | | | | 817,947 | | |
Fiserv, Inc.(a) | | | 15,569 | | | | 1,498,828 | | |
FleetCor Technologies, Inc.(a) | | | 15,851 | | | | 1,634,397 | | |
International Business Machines Corp. | | | 7,056 | | | | 1,286,097 | | |
Mastercard, Inc., Class A | | | 2,552 | | | | 1,546,716 | | |
Paychex, Inc. | | | 19,659 | | | | 760,410 | | |
ServiceSource International, Inc.(a) | | | 142,298 | | | | 1,723,229 | | |
Teradata Corp.(a) | | | 20,370 | | | | 1,192,867 | | |
Total System Services, Inc. | | | 64,070 | | | | 1,772,817 | | |
The accompanying Notes to Financial Statements are an integral part of this statement.
Annual Report 2013
7
Portfolio of Investments (continued)
August 31, 2013
Common Stocks (continued)
Issuer | | Shares | | Value ($) | |
Vantiv, Inc., Class A(a) | | | 57,655 | | | | 1,522,669 | | |
Visa, Inc., Class A | | | 8,619 | | | | 1,503,326 | | |
Western Union Co. (The) | | | 109,975 | | | | 1,927,862 | | |
Total | | | | | 26,226,536 | | |
Semiconductors & Semiconductor Equipment 19.5% | |
Altera Corp. | | | 21,172 | | | | 744,619 | | |
Applied Materials, Inc. | | | 140,073 | | | | 2,102,496 | | |
ARM Holdings PLC, ADR | | | 36,778 | | | | 1,490,612 | | |
| ASML Holding NV | | | 17,884 | | | | 1,556,981 | | |
Avago Technologies Ltd. | | | 42,984 | | | | 1,655,314 | | |
Broadcom Corp., Class A | | | 42,838 | | | | 1,082,088 | | |
Cree, Inc.(a) | | | 20,316 | | | | 1,127,335 | | |
EZchip Semiconductor Ltd.(a) | | | 40,691 | | | | 1,159,693 | | |
Fairchild Semiconductor International, Inc.(a) | | | 52,118 | | | | 636,361 | | |
Formfactor, Inc.(a) | | | 208,880 | | | | 1,267,902 | | |
Inphi Corp.(a) | | | 52,402 | | | | 666,553 | | |
KLA-Tencor Corp. | | | 33,705 | | | | 1,858,831 | | |
Lam Research Corp.(a) | | | 40,074 | | | | 1,870,254 | | |
Linear Technology Corp. | | | 38,819 | | | | 1,487,932 | | |
Microchip Technology, Inc. | | | 45,228 | | | | 1,755,299 | | |
Micron Technology, Inc.(a) | | | 167,484 | | | | 2,272,758 | | |
NXP Semiconductor NV(a) | | | 49,104 | | | | 1,825,196 | | |
Power Integrations, Inc. | | | 16,194 | | | | 844,031 | | |
Rambus, Inc.(a) | | | 62,963 | | | | 513,778 | | |
Skyworks Solutions, Inc.(a) | | | 61,947 | | | | 1,570,976 | | |
Taiwan Semiconductor
Manufacturing Co., Ltd., ADR | | | 47,513 | | | | 786,815 | | |
Xilinx, Inc. | | | 28,122 | | | | 1,221,057 | | |
Total | | | | | 29,496,881 | | |
Software 18.1% | |
Activision Blizzard, Inc. | | | 99,228 | | | | 1,619,401 | | |
Adobe Systems, Inc.(a) | | | 41,715 | | | | 1,908,461 | | |
Aspen Technology, Inc.(a) | | | 28,944 | | | | 967,598 | | |
Autodesk, Inc.(a) | | | 39,136 | | | | 1,438,248 | | |
Check Point Software Technologies Ltd.(a) | | | 39,857 | | | | 2,234,782 | | |
Citrix Systems, Inc.(a) | | | 24,914 | | | | 1,763,164 | | |
Electronic Arts, Inc.(a) | | | 59,511 | | | | 1,585,373 | | |
Fortinet, Inc.(a) | | | 52,084 | | | | 1,031,263 | | |
Guidewire Software, Inc.(a) | | | 24,538 | | | | 1,127,766 | | |
Intuit, Inc. | | | 26,548 | | | | 1,686,594 | | |
Common Stocks (continued)
Issuer | | Shares | | Value ($) | |
Microsoft Corp. | | | 54,602 | | | | 1,823,707 | | |
Nuance Communications, Inc.(a) | | | 32,590 | | | | 622,143 | | |
Oracle Corp. | | | 34,017 | | | | 1,083,782 | | |
Proofpoint, Inc.(a) | | | 55,735 | | | | 1,605,725 | | |
PTC, Inc.(a) | | | 38,274 | | | | 997,803 | | |
Red Hat, Inc.(a) | | | 20,555 | | | | 1,038,439 | | |
Salesforce.com, Inc.(a) | | | 49,238 | | | | 2,419,063 | | |
Symantec Corp. | | | 62,497 | | | | 1,600,548 | | |
Tableau Software, Inc.(a) | | | 6,215 | | | | 449,407 | | |
Workday, Inc., Class A(a) | | | 4,669 | | | | 338,643 | | |
Total | | | | | 27,341,910 | | |
Total Information Technology | | | | | 129,027,896 | | |
Telecommunication Services 2.0% | |
Diversified Telecommunication Services 1.1% | |
Cogent Communications Group, Inc. | | | 24,677 | | | | 765,727 | | |
Verizon Communications, Inc. | | | 19,881 | | | | 941,962 | | |
Total | | | | | 1,707,689 | | |
Wireless Telecommunication Services 0.9% | |
SBA Communications Corp., Class A(a) | | | 18,620 | | | | 1,396,500 | | |
Total Telecommunication Services | | | | | 3,104,189 | | |
Total Common Stocks
(Cost: $127,804,375) | | | | | 148,821,446 | | |
Exchange-Traded Funds 0.5%
| | Shares | | Value ($) | |
Market Vectors Semiconductor ETF | | | 19,395 | | | | 720,331 | | |
Total Exchange-Traded Funds
(Cost: $610,141) | | | | | 720,331 | | |
Money Market Funds 1.4%
Columbia Short-Term Cash
Fund, 0.097%(b)(c) | | | 2,105,604 | | | | 2,105,604 | | |
Total Money Market Funds
(Cost: $2,105,604) | | | | | 2,105,604 | | |
Total Investments
(Cost: $130,520,120) | | | | | 151,647,381 | | |
Other Assets & Liabilities, Net | | | | | (338,900 | ) | |
Net Assets | | | | | 151,308,481 | | |
The accompanying Notes to Financial Statements are an integral part of this statement.
Annual Report 2013
8
Portfolio of Investments (continued)
August 31, 2013
Notes to Portfolio of Investments
(a) Non-income producing.
(b) The rate shown is the seven-day current annualized yield at August 31, 2013.
(c) As defined in the Investment Company Act of 1940, an affiliated company is one in which the Fund owns 5% or more of its outstanding voting securities, or a company which is under common ownership or control with the Fund. Holdings and transactions in these affiliated companies during the year ended August 31, 2013, are as follows:
Issuer | | Beginning
Cost ($) | | Purchase
Cost ($) | | Proceeds
from Sales ($) | | Ending
Cost ($) | | Dividends or
Interest
Income ($) | | Value ($) | |
Columbia Short-Term Cash Fund | | | 2,315,813 | | | | 49,309,158 | | | | (49,519,367 | ) | | | 2,105,604 | | | | 2,299 | | | | 2,105,604 | | |
Abbreviation Legend
ADR American Depositary Receipt
Fair Value Measurements
Generally accepted accounting principles (GAAP) require disclosure regarding the inputs and valuation techniques used to measure fair value and any changes in valuation inputs or techniques. In addition, investments shall be disclosed by major category.
The Fund categorizes its fair value measurements according to a three-level hierarchy that maximizes the use of observable inputs and minimizes the use of unobservable inputs by prioritizing that the most observable input be used when available. Observable inputs are those that market participants would use in pricing an investment based on market data obtained from sources independent of the reporting entity. Unobservable inputs are those that reflect the Fund's assumptions about the information market participants would use in pricing an investment. An investment's level within the fair value hierarchy is based on the lowest level of any input that is deemed significant to the asset or liability's fair value measurement. The input levels are not necessarily an indication of the risk or liquidity associated with investments at that level. For example, certain U.S. government securities are generally high quality and liquid, however, they are reflected as Level 2 because the inputs used to determine fair value may not always be quoted prices in an active market.
Fair value inputs are summarized in the three broad levels listed below:
> Level 1 — Valuations based on quoted prices for investments in active markets that the Fund has the ability to access at the measurement date (including NAV for open-end mutual funds). Valuation adjustments are not applied to Level 1 investments.
> Level 2 — Valuations based on other significant observable inputs (including quoted prices for similar securities, interest rates, prepayment speeds, credit risks, etc.).
> Level 3 — Valuations based on significant unobservable inputs (including the Fund's own assumptions and judgment in determining the fair value of investments).
Inputs that are used in determining fair value of an investment may include price information, credit data, volatility statistics, and other factors. These inputs can be either observable or unobservable. The availability of observable inputs can vary between investments, and is affected by various factors such as the type of investment, and the volume and level of activity for that investment or similar investments in the marketplace. The inputs will be considered by the Investment Manager, along with any other relevant factors in the calculation of an investment's fair value. The Fund uses prices and inputs that are current as of the measurement date, which may include periods of market dislocations. During these periods, the availability of prices and inputs may be reduced for many investments. This condition could cause an investment to be reclassified between the various levels within the hierarchy.
Investments falling into the Level 3 category are primarily supported by quoted prices from brokers and dealers participating in the market for those investments. However, these may be classified as Level 3 investments due to lack of market transparency and corroboration to support these quoted prices. Additionally, valuation models may be used as the pricing source for any remaining investments classified as Level 3. These models may rely on one or more significant unobservable inputs and/or significant assumptions by the Investment Manager. Inputs used in valuations may include, but are not limited to, financial statement analysis, capital account balances, discount rates and estimated cash flows, and comparable company data.
Under the direction of the Fund's Board of Trustees (the Board), the Investment Manager's Valuation Committee (the Committee) is responsible for carrying out the valuation procedures approved by the Board. The Committee consists of voting and non-voting members from various groups within the Investment Manager's organization, including operations and accounting, trading and investments, compliance, risk management and legal.
The Committee meets at least monthly to review and approve valuation matters, which may include a description of specific valuation determinations, data regarding pricing information received from approved pricing vendors and brokers and the results of Board-approved valuation control policies and procedures (the Policies). The Policies address, among other things, instances when market quotations are or
The accompanying Notes to Financial Statements are an integral part of this statement.
Annual Report 2013
9
Portfolio of Investments (continued)
August 31, 2013
Fair Value Measurements (continued)
are not readily available, including recommendations of third party pricing vendors and a determination of appropriate pricing methodologies; events that require specific valuation determinations and assessment of fair value techniques; securities with a potential for stale pricing, including those that are illiquid, restricted, or in default; and the effectiveness of third-party pricing vendors, including periodic reviews of vendors. The Committee meets more frequently, as needed, to discuss additional valuation matters, which may include the need to review back-testing results, review time-sensitive information or approve related valuation actions. The Committee reports to the Board, with members of the Committee meeting with the Board at each of its regularly scheduled meetings to discuss valuation matters and actions during the period, similar to those described earlier.
For investments categorized as Level 3, the Committee monitors information similar to that described above, which may include: (i) data specific to the issuer or comparable issuers, (ii) general market or specific sector news and (iii) quoted prices and specific or similar security transactions. The Committee considers this data and any changes from prior periods in order to assess the reasonableness of observable and unobservable inputs, any assumptions or internal models used to value those securities and changes in fair value. This data is also used to corroborate, when available, information received from approved pricing vendors and brokers. Various factors impact the frequency of monitoring this information (which may occur as often as daily). However, the Committee may determine that changes to inputs, assumptions and models are not required as a result of the monitoring procedures performed.
The following table is a summary of the inputs used to value the Fund's investments at August 31, 2013:
Description | | Level 1
Quoted Prices in Active
Markets for Identical
Assets ($) | |
Level 2
Other Significant
Observable Inputs ($) | |
Level 3
Significant
Unobservable Inputs ($) | |
Total ($) | |
Equity Securities | |
Common Stocks | |
Consumer Discretionary | | | 15,191,348 | | | | — | | | | — | | | | 15,191,348 | | |
Industrials | | | 1,498,013 | | | | — | | | | — | | | | 1,498,013 | | |
Information Technology | | | 129,027,896 | | | | — | | | | — | | | | 129,027,896 | | |
Telecommunication Services | | | 3,104,189 | | | | — | | | | — | | | | 3,104,189 | | |
Exchange-Traded Funds | | | 720,331 | | | | — | | | | — | | | | 720,331 | | |
Total Equity Securities | | | 149,541,777 | | | | — | | | | — | | | | 149,541,777 | | |
Mutual Funds | |
Money Market Funds | | | 2,105,604 | | | | — | | | | — | | | | 2,105,604 | | |
Total Mutual Funds | | | 2,105,604 | | | | — | | | | — | | | | 2,105,604 | | |
Total | | | 151,647,381 | | | | — | | | | — | | | | 151,647,381 | | |
See the Portfolio of Investments for all investment classifications not indicated in the table.
There were no transfers of financial assets between Levels 1 and 2 during the period.
The accompanying Notes to Financial Statements are an integral part of this statement.
Annual Report 2013
10
Statement of Assets and Liabilities
August 31, 2013
Assets | |
Investments, at value | |
Unaffiliated issuers (identified cost $128,414,516) | | $ | 149,541,777 | | |
Affiliated issuers (identified cost $2,105,604) | | | 2,105,604 | | |
Total investments (identified cost $130,520,120) | | | 151,647,381 | | |
Receivable for: | |
Investments sold | | | 246,420 | | |
Capital shares sold | | | 300,847 | | |
Dividends | | | 104,507 | | |
Prepaid expenses | | | 1,652 | | |
Trustees' deferred compensation plan | | | 26,938 | | |
Total assets | | | 152,327,745 | | |
Liabilities | |
Payable for: | |
Investments purchased | | | 317,946 | | |
Capital shares purchased | | | 609,151 | | |
Investment management fees | | | 3,637 | | |
Distribution and/or service fees | | | 922 | | |
Transfer agent fees | | | 30,158 | | |
Chief compliance officer expenses | | | 14 | | |
Other expenses | | | 30,498 | | |
Trustees' deferred compensation plan | | | 26,938 | | |
Total liabilities | | | 1,019,264 | | |
Net assets applicable to outstanding capital stock | | $ | 151,308,481 | | |
Represented by | |
Paid-in capital | | $ | 141,346,036 | | |
Excess of distributions over net investment income | | | (609,306 | ) | |
Accumulated net realized loss | | | (10,555,510 | ) | |
Unrealized appreciation (depreciation) on: | |
Investments | | | 21,127,261 | | |
Total — representing net assets applicable to outstanding capital stock | | $ | 151,308,481 | | |
The accompanying Notes to Financial Statements are an integral part of this statement.
Annual Report 2013
11
Statement of Assets and Liabilities (continued)
August 31, 2013
Class A | |
Net assets | | $ | 53,711,207 | | |
Shares outstanding | | | 3,988,882 | | |
Net asset value per share | | $ | 13.47 | | |
Maximum offering price per share(a) | | $ | 14.29 | | |
Class B | |
Net assets | | $ | 3,147,344 | | |
Shares outstanding | | | 251,210 | | |
Net asset value per share | | $ | 12.53 | | |
Class C | |
Net assets | | $ | 16,791,105 | | |
Shares outstanding | | | 1,337,844 | | |
Net asset value per share | | $ | 12.55 | | |
Class R4(b) | |
Net assets | | $ | 177,202 | | |
Shares outstanding | | | 12,669 | | |
Net asset value per share | | $ | 13.99 | | |
Class R5(b) | |
Net assets | | $ | 202,953 | | |
Shares outstanding | | | 14,497 | | |
Net asset value per share | | $ | 14.00 | | |
Class Z | |
Net assets | | $ | 77,278,670 | | |
Shares outstanding | | | 5,591,754 | | |
Net asset value per share | | $ | 13.82 | | |
(a) The maximum offering price per share is calculated by dividing the net asset value per share by 1.0 minus the maximum sales charge of 5.75%.
(b) For the period from November 8, 2012 (commencement of operations) to August 31, 2013.
The accompanying Notes to Financial Statements are an integral part of this statement.
Annual Report 2013
12
Statement of Operations
Year ended August 31, 2013
Net investment income | |
Income: | |
Dividends — unaffiliated issuers | | $ | 1,504,569 | | |
Dividends — affiliated issuers | | | 2,299 | | |
Income from securities lending — net | | | 32,805 | | |
Foreign taxes withheld | | | (20,023 | ) | |
Total income | | | 1,519,650 | | |
Expenses: | |
Investment management fees | | | 1,206,218 | | |
Distribution and/or service fees | |
Class A | | | 120,827 | | |
Class B | | | 33,226 | | |
Class C | | | 154,804 | | |
Transfer agent fees | |
Class A | | | 98,535 | | |
Class B | | | 6,793 | | |
Class C | | | 31,531 | | |
Class R4(a) | | | 112 | | |
Class R5(a) | | | 4 | | |
Class Z | | | 145,382 | | |
Compensation of board members | | | 19,929 | | |
Custodian fees | | | 8,670 | | |
Printing and postage fees | | | 107,321 | | |
Registration fees | | | 50,541 | | |
Professional fees | | | 22,642 | | |
Chief compliance officer expenses | | | 85 | | |
Other | | | 16,602 | | |
Total expenses | | | 2,023,222 | | |
Fees waived or expenses reimbursed by Investment Manager and its affiliates | | | (31,538 | ) | |
Expense reductions | | | (1,060 | ) | |
Total net expenses | | | 1,990,624 | | |
Net investment loss | | | (470,974 | ) | |
Realized and unrealized gain (loss) — net | |
Net realized gain (loss) on: | |
Investments | | | 13,091,563 | | |
Foreign currency translations | | | (822 | ) | |
Net realized gain | | | 13,090,741 | | |
Net change in unrealized appreciation (depreciation) on: | |
Investments | | | 17,195,533 | | |
Net change in unrealized appreciation (depreciation) | | | 17,195,533 | | |
Net realized and unrealized gain | | | 30,286,274 | | |
Net increase in net assets resulting from operations | | $ | 29,815,300 | | |
(a) For the period from November 8, 2012 (commencement of operations) to August 31, 2013.
The accompanying Notes to Financial Statements are an integral part of this statement.
Annual Report 2013
13
Statement of Changes in Net Assets
| | | Year Ended
August 31,
2013 | | Year Ended
August 31,
2012 | |
Operations | |
Net investment loss | | $ | (470,974 | ) | | $ | (1,471,599 | ) | |
Net realized gain | | | 13,090,741 | | | | 14,898,642 | | |
Net change in unrealized appreciation (depreciation) | | | 17,195,533 | | | | (5,811,501 | ) | |
Net increase in net assets resulting from operations | | | 29,815,300 | | | | 7,615,542 | | |
Increase (decrease) in net assets from capital stock activity | | | (20,145,992 | ) | | | (89,992,780 | ) | |
Total increase (decrease) in net assets | | | 9,669,308 | | | | (82,377,238 | ) | |
Net assets at beginning of year | | | 141,639,173 | | | | 224,016,411 | | |
Net assets at end of year | | $ | 151,308,481 | | | $ | 141,639,173 | | |
Excess of distributions over net investment income | | $ | (609,306 | ) | | $ | (823,391 | ) | |
The accompanying Notes to Financial Statements are an integral part of this statement.
Annual Report 2013
14
Statement of Changes in Net Assets (continued)
| | | Year ended August 31, 2013(a) | | Year ended August 31, 2012 | |
| | | Shares | | Dollars($) | | Shares | | Dollars($) | |
Capital stock activity | |
Class A shares | |
Subscriptions(b) | | | 840,006 | | | | 10,217,809 | | | | 1,041,246 | | | | 10,906,732 | | |
Redemptions | | | (1,504,170 | ) | | | (17,329,339 | ) | | | (2,734,416 | ) | | | (27,798,153 | ) | |
Net decrease | | | (664,164 | ) | | | (7,111,530 | ) | | | (1,693,170 | ) | | | (16,891,421 | ) | |
Class B shares | |
Subscriptions | | | 1 | | | | 10 | | | | 4,175 | | | | 40,516 | | |
Redemptions(b) | | | (120,630 | ) | | | (1,305,949 | ) | | | (207,822 | ) | | | (2,014,957 | ) | |
Net decrease | | | (120,629 | ) | | | (1,305,939 | ) | | | (203,647 | ) | | | (1,974,441 | ) | |
Class C shares | |
Subscriptions | | | 131,128 | | | | 1,472,768 | | | | 130,085 | | | | 1,270,966 | | |
Redemptions | | | (343,518 | ) | | | (3,725,447 | ) | | | (678,344 | ) | | | (6,529,928 | ) | |
Net decrease | | | (212,390 | ) | | | (2,252,679 | ) | | | (548,259 | ) | | | (5,258,962 | ) | |
Class R4 shares | |
Subscriptions | | | 12,885 | | | | 160,185 | | | | — | | | | — | | |
Redemptions | | | (216 | ) | | | (2,830 | ) | | | — | | | | — | | |
Net increase | | | 12,669 | | | | 157,355 | | | | — | | | | — | | |
Class R5 shares | |
Subscriptions | | | 14,497 | | | | 202,525 | | | | — | | | | — | | |
Net increase | | | 14,497 | | | | 202,525 | | | | — | | | | — | | |
Class Z shares | |
Subscriptions | | | 1,045,012 | | | | 12,490,257 | | | | 1,623,372 | | | | 17,195,488 | | |
Redemptions | | | (1,875,074 | ) | | | (22,325,981 | ) | | | (7,901,761 | ) | | | (83,063,444 | ) | |
Net decrease | | | (830,062 | ) | | | (9,835,724 | ) | | | (6,278,389 | ) | | | (65,867,956 | ) | |
Total net decrease | | | (1,800,079 | ) | | | (20,145,992 | ) | | | (8,723,465 | ) | | | (89,992,780 | ) | |
(a) Class R4 and R5 shares are for the period from November 8, 2012 (commencement of operations) to August 31, 2013.
(b) Includes conversions of Class B shares to Class A shares, if any.
The accompanying Notes to Financial Statements are an integral part of this statement.
Annual Report 2013
15
The following tables are intended to help you understand the Fund's financial performance. Certain information reflects financial results for a single share of a class held for the periods shown. Per share net investment income (loss) amounts are calculated based on average shares outstanding during the period. Total return assumes reinvestment of all dividends and distributions, if any. Total return does not reflect payment of sales charges, if any, and is not annualized for periods of less than one year.
| | | Year ended August 31, | |
Class A | | 2013 | | 2012 | | 2011 | | 2010 | | 2009 | |
Per share data | |
Net asset value, beginning of period | | $ | 10.87 | | | $ | 10.25 | | | $ | 8.75 | | | $ | 7.58 | | | $ | 9.72 | | |
Income from investment operations: | |
Net investment loss | | | (0.04 | ) | | | (0.08 | ) | | | (0.11 | ) | | | (0.09 | ) | | | (0.05 | ) | |
Net realized and unrealized gain (loss) | | | 2.64 | | | | 0.70 | | | | 1.61 | | | | 1.26 | | | | (2.09 | ) | |
Total from investment operations | | | 2.60 | | | | 0.62 | | | | 1.50 | | | | 1.17 | | | | (2.14 | ) | |
Net asset value, end of period | | $ | 13.47 | | | $ | 10.87 | | | $ | 10.25 | | | $ | 8.75 | | | $ | 7.58 | | |
Total return | | | 23.92 | % | | | 6.05 | % | | | 17.14 | % | | | 15.44 | % | | | (22.02 | %) | |
Ratios to average net assets(a)(b) | |
Total gross expenses | | | 1.49 | % | | | 1.39 | % | | | 1.46 | %(c) | | | 1.47 | %(c) | | | 1.53 | % | |
Total net expenses(d) | | | 1.46 | %(e) | | | 1.39 | %(e) | | | 1.43 | %(c) | | | 1.45 | %(c)(e) | | | 1.46 | %(e) | |
Net investment loss | | | (0.36 | %) | | | (0.80 | %) | | | (1.01 | %) | | | (1.10 | %) | | | (0.80 | %) | |
Supplemental data | |
Net assets, end of period (in thousands) | | $ | 53,711 | | | $ | 50,574 | | | $ | 65,071 | | | $ | 71,989 | | | $ | 81,321 | | |
Portfolio turnover | | | 135 | % | | | 220 | % | | | 263 | % | | | 189 | % | | | 284 | % | |
Notes to Financial Highlights
(a) In addition to the fees and expenses which the Fund bears directly, the Fund indirectly bears a pro rata share of the fees and expenses of the acquired funds in which it invests. Such indirect expenses are not included in the reported expense ratios.
(b) Certain line items from prior years have been reclassified to conform to the current presentation.
(c) Ratios include line of credit interest expense which rounds to less than 0.01%.
(d) Total net expenses include the impact of certain waivers/reimbursements made by the Investment Manager and certain of its affiliates, if applicable.
(e) The benefits derived from expense reductions had an impact of less than 0.01%.
The accompanying Notes to Financial Statements are an integral part of this statement.
Annual Report 2013
16
Financial Highlights (continued)
| | | Year ended August 31, | |
Class B | | 2013 | | 2012 | | 2011 | | 2010 | | 2009 | |
Per share data | |
Net asset value, beginning of period | | $ | 10.19 | | | $ | 9.68 | | | $ | 8.33 | | | $ | 7.26 | | | $ | 9.39 | | |
Income from investment operations: | |
Net investment loss | | | (0.12 | ) | | | (0.15 | ) | | | (0.19 | ) | | | (0.15 | ) | | | (0.10 | ) | |
Net realized and unrealized gain (loss) | | | 2.46 | | | | 0.66 | | | | 1.54 | | | | 1.22 | | | | (2.03 | ) | |
Total from investment operations | | | 2.34 | | | | 0.51 | | | | 1.35 | | | | 1.07 | | | | (2.13 | ) | |
Net asset value, end of period | | $ | 12.53 | | | $ | 10.19 | | | $ | 9.68 | | | $ | 8.33 | | | $ | 7.26 | | |
Total return | | | 22.96 | % | | | 5.27 | % | | | 16.21 | % | | | 14.74 | % | | | (22.68 | %) | |
Ratios to average net assets(a)(b) | |
Total gross expenses | | | 2.24 | % | | | 2.15 | % | | | 2.21 | %(c) | | | 2.22 | %(c) | | | 2.28 | % | |
Total net expenses(d) | | | 2.21 | %(e) | | | 2.15 | %(e) | | | 2.19 | %(c) | | | 2.20 | %(c)(e) | | | 2.21 | %(e) | |
Net investment loss | | | (1.10 | %) | | | (1.56 | %) | | | (1.77 | %) | | | (1.85 | %) | | | (1.55 | %) | |
Supplemental data | |
Net assets, end of period (in thousands) | | $ | 3,147 | | | $ | 3,788 | | | $ | 5,573 | | | $ | 6,478 | | | $ | 6,562 | | |
Portfolio turnover | | | 135 | % | | | 220 | % | | | 263 | % | | | 189 | % | | | 284 | % | |
Notes to Financial Highlights
(a) In addition to the fees and expenses which the Fund bears directly, the Fund indirectly bears a pro rata share of the fees and expenses of the acquired funds in which it invests. Such indirect expenses are not included in the reported expense ratios.
(b) Certain line items from prior years have been reclassified to conform to the current presentation.
(c) Ratios include line of credit interest expense which rounds to less than 0.01%.
(d) Total net expenses include the impact of certain waivers/reimbursements made by the Investment Manager and certain of its affiliates, if applicable.
(e) The benefits derived from expense reductions had an impact of less than 0.01%.
The accompanying Notes to Financial Statements are an integral part of this statement.
Annual Report 2013
17
Financial Highlights (continued)
| | | Year ended August 31, | |
Class C | | 2013 | | 2012 | | 2011 | | 2010 | | 2009 | |
Per share data | |
Net asset value, beginning of period | | $ | 10.21 | | | $ | 9.70 | | | $ | 8.35 | | | $ | 7.27 | | | $ | 9.41 | | |
Income from investment operations: | |
Net investment loss | | | (0.12 | ) | | | (0.15 | ) | | | (0.19 | ) | | | (0.15 | ) | | | (0.10 | ) | |
Net realized and unrealized gain (loss) | | | 2.46 | | | | 0.66 | | | | 1.54 | | | | 1.23 | | | | (2.04 | ) | |
Total from investment operations | | | 2.34 | | | | 0.51 | | | | 1.35 | | | | 1.08 | | | | (2.14 | ) | |
Net asset value, end of period | | $ | 12.55 | | | $ | 10.21 | | | $ | 9.70 | | | $ | 8.35 | | | $ | 7.27 | | |
Total return | | | 22.92 | % | | | 5.26 | % | | | 16.17 | % | | | 14.86 | % | | | (22.74 | %) | |
Ratios to average net assets(a)(b) | |
Total gross expenses | | | 2.23 | % | | | 2.17 | % | | | 2.22 | %(c) | | | 2.22 | %(c) | | | 2.28 | % | |
Total net expenses(d) | | | 2.21 | %(e) | | | 2.17 | %(e) | | | 2.20 | %(c) | | | 2.20 | %(c)(e) | | | 2.21 | %(e) | |
Net investment loss | | | (1.11 | %) | | | (1.57 | %) | | | (1.79 | %) | | | (1.85 | %) | | | (1.55 | %) | |
Supplemental data | |
Net assets, end of period (in thousands) | | $ | 16,791 | | | $ | 15,821 | | | $ | 20,360 | | | $ | 20,941 | | | $ | 24,410 | | |
Portfolio turnover | | | 135 | % | | | 220 | % | | | 263 | % | | | 189 | % | | | 284 | % | |
Notes to Financial Highlights | |
(a) In addition to the fees and expenses which the Fund bears directly, the Fund indirectly bears a pro rata share of the fees and expenses of the acquired funds in which it invests. Such indirect expenses are not included in the reported expense ratios.
(b) Certain line items from prior years have been reclassified to conform to the current presentation.
(c) Ratios include line of credit interest expense which rounds to less than 0.01%.
(d) Total net expenses include the impact of certain waivers/reimbursements made by the Investment Manager and certain of its affiliates, if applicable.
(e) The benefits derived from expense reductions had an impact of less than 0.01%.
The accompanying Notes to Financial Statements are an integral part of this statement.
Annual Report 2013
18
Financial Highlights (continued)
Class R4 | | Year ended
August 31,
2013(a) | |
Per share data | |
Net asset value, beginning of period | | $ | 10.73 | | |
Income from investment operations: | |
Net investment loss | | | (0.03 | ) | |
Net realized and unrealized gain | | | 3.29 | | |
Total from investment operations | | | 3.26 | | |
Net asset value, end of period | | $ | 13.99 | | |
Total return | | | 30.38 | % | |
Ratios to average net assets(b) | |
Total gross expenses | | | 1.22 | %(c) | |
Total net expenses(d) | | | 1.22 | %(c)(e) | |
Net investment loss | | | (0.28 | %)(c) | |
Supplemental data | |
Net assets, end of period (in thousands) | | $ | 177 | | |
Portfolio turnover | | | 135 | % | |
Notes to Financial Highlights | |
(a) For the period from November 8, 2012 (commencement of operations) to August 31, 2013.
(b) In addition to the fees and expenses which the Fund bears directly, the Fund indirectly bears a pro rata share of the fees and expenses of the acquired funds in which it invests. Such indirect expenses are not included in the reported expense ratios.
(c) Annualized.
(d) Total net expenses include the impact of certain waivers/reimbursements made by the Investment Manager and certain of its affiliates, if applicable.
(e) The benefits derived from expense reductions had an impact of less than 0.01%.
The accompanying Notes to Financial Statements are an integral part of this statement.
Annual Report 2013
19
Financial Highlights (continued)
Class R5 | | Year ended
August 31,
2013(a) | |
Per share data | |
Net asset value, beginning of period | | $ | 10.73 | | |
Income from investment operations: | |
Net investment income | | | (0.00 | )(b) | |
Net realized and unrealized gain | | | 3.27 | | |
Total from investment operations | | | 3.27 | | |
Net asset value, end of period | | $ | 14.00 | | |
Total return | | | 30.48 | % | |
Ratios to average net assets(c) | |
Total gross expenses | | | 1.08 | %(d) | |
Total net expenses(e) | | | 1.08 | %(d) | |
Net investment loss | | | (0.08 | %)(d) | |
Supplemental data | |
Net assets, end of period (in thousands) | | $ | 203 | | |
Portfolio turnover | | | 135 | % | |
Notes to Financial Highlights
(a) For the period from November 8, 2012 (commencement of operations) to August 31, 2013.
(b) Rounds to zero.
(c) In addition to the fees and expenses which the Fund bears directly, the Fund indirectly bears a pro rata share of the fees and expenses of the acquired funds in which it invests. Such indirect expenses are not included in the reported expense ratios.
(d) Annualized.
(e) Total net expenses include the impact of certain waivers/reimbursements made by the Investment Manager and certain of its affiliates, if applicable.
The accompanying Notes to Financial Statements are an integral part of this statement.
Annual Report 2013
20
Financial Highlights (continued)
| | | Year ended August 31, | |
Class Z | | 2013 | | 2012 | | 2011 | | 2010 | | 2009 | |
Per share data | |
Net asset value, beginning of period | | $ | 11.13 | | | $ | 10.47 | | | $ | 8.92 | | | $ | 7.70 | | | $ | 9.86 | | |
Income from investment operations: | |
Net investment loss | | | (0.01 | ) | | | (0.07 | ) | | | (0.09 | ) | | | (0.07 | ) | | | (0.04 | ) | |
Net realized and unrealized gain (loss) | | | 2.70 | | | | 0.73 | | | | 1.64 | | | | 1.29 | | | | (2.12 | ) | |
Total from investment operations | | | 2.69 | | | | 0.66 | | | | 1.55 | | | | 1.22 | | | | (2.16 | ) | |
Net asset value, end of period | | $ | 13.82 | | | $ | 11.13 | | | $ | 10.47 | | | $ | 8.92 | | | $ | 7.70 | | |
Total return | | | 24.17 | % | | | 6.30 | % | | | 17.38 | % | | | 15.84 | % | | | (21.91 | %) | |
Ratios to average net assets(a)(b) | |
Total gross expenses | | | 1.24 | % | | | 1.19 | % | | | 1.22 | %(c) | | | 1.22 | %(c) | | | 1.28 | % | |
Total net expenses(d) | | | 1.21 | %(e) | | | 1.19 | %(e) | | | 1.20 | %(c) | | | 1.20 | %(c)(e) | | | 1.21 | %(e) | |
Net investment loss | | | (0.12 | %) | | | (0.62 | %) | | | (0.79 | %) | | | (0.85 | %) | | | (0.54 | %) | |
Supplemental data | |
Net assets, end of period (in thousands) | | $ | 77,279 | | | $ | 71,456 | | | $ | 133,011 | | | $ | 151,924 | | | $ | 155,332 | | |
Portfolio turnover | | | 135 | % | | | 220 | % | | | 263 | % | | | 189 | % | | | 284 | % | |
Notes to Financial Highlights
(a) In addition to the fees and expenses which the Fund bears directly, the Fund indirectly bears a pro rata share of the fees and expenses of the acquired funds in which it invests. Such indirect expenses are not included in the reported expense ratios.
(b) Certain line items from prior years have been reclassified to conform to the current presentation.
(c) Ratios include line of credit interest expense which rounds to less than 0.01%.
(d) Total net expenses include the impact of certain waivers/reimbursements made by the Investment Manager and certain of its affiliates, if applicable.
(e) The benefits derived from expense reductions had an impact of less than 0.01%.
The accompanying Notes to Financial Statements are an integral part of this statement.
Annual Report 2013
21
Notes to Financial Statements
August 31, 2013
Note 1. Organization
Columbia Technology Fund (the Fund), a series of Columbia Funds Series Trust I (the Trust), is a non-diversified fund. The Trust is registered under the Investment Company Act of 1940, as amended (the 1940 Act), as an open-end management investment company organized as a Massachusetts business trust.
At an adjourned Joint Special Meeting of Shareholders held on April 10, 2013, shareholders of the Fund approved a proposal to change the Fund's classification from a diversified fund to a non-diversified fund.
Fund Shares
The Trust may issue an unlimited number of shares (without par value). The Fund offers Class A, Class B, Class C, Class R4, Class R5 and Class Z shares. Although all share classes generally have identical voting, dividend and liquidation rights, each share class votes separately when required by law. Different share classes pay different distribution amounts to the extent the expenses of such share classes differ, and distributions in liquidation will be proportional to the net asset value of each share class. Each share class has its own expense structure and sales charges, as applicable.
Class A shares are subject to a maximum front-end sales charge of 5.75% based on the initial investment amount. Class A shares purchased without an initial sales charge in accounts aggregating $1 million to $50 million at the time of purchase are subject to a contingent deferred sales charge (CDSC) if the shares are sold within 18 months of purchase, charged as follows: 1.00% CDSC if redeemed within 12 months of purchase, and 0.50% CDSC if redeemed more than 12, but less than 18, months after purchase.
Class B shares may be subject to a maximum CDSC of 5.00% based upon the holding period after purchase. Class B shares will generally convert to Class A shares eight years after purchase. The Fund no longer accepts investments by new or existing investors in the Fund's Class B shares, except in connection with the reinvestment of any dividend and/or capital gain distributions in Class B shares of the Fund and exchanges by existing Class B shareholders of certain other funds within the Columbia Family of Funds.
Class C shares are subject to a 1.00% CDSC on shares redeemed within one year of purchase.
Class R4 shares are not subject to sales charges and are generally available only to omnibus retirement plans and certain other eligible investors. Class R4 shares commenced operations on November 8, 2012.
Class R5 shares are not subject to sales charges and are generally available only to investors purchasing through authorized investment professionals and omnibus retirement plans. Class R5 shares commenced operations on November 8, 2012.
Class Z shares are not subject to sales charges and are available only to certain eligible investors, which are subject to different investment minimums.
Note 2. Summary of Significant Accounting Policies
Use of Estimates
The preparation of financial statements in accordance with U.S. generally accepted accounting principles (GAAP) requires management to make certain estimates and assumptions that affect the reported amounts of assets and liabilities, the disclosure of contingent assets and liabilities at the date of the financial statements and the reported amounts of revenue and expenses during the reporting period. Actual results could differ from those estimates.
The following is a summary of significant accounting policies consistently followed by the Fund in the preparation of its financial statements.
Security Valuation
All equity securities and exchange traded funds (ETFs) are valued at the close of business of the New York Stock Exchange (NYSE). Equity securities and ETFs are valued at the last quoted sales price on the principal exchange or market on which they trade, except for securities traded on the NASDAQ Stock Market, which are valued at the NASDAQ official close price. Unlisted securities or listed securities for which there were no sales during the day are valued at the mean of the latest quoted bid and ask prices on such exchanges or markets.
Foreign equity securities are valued based on quotations from the principal market in which such securities are normally traded. If any foreign share prices are not readily available as a result of limited share activity the securities are valued at the mean of the latest quoted bid and ask prices on such exchanges or markets. Foreign currency exchange rates are generally determined at 4:00 p.m. Eastern (U.S.) time. However, many securities markets and exchanges outside the U.S. close prior to the close of the NYSE; therefore, the closing prices for securities in such markets or on such exchanges may not fully reflect events that occur after such close but before the close of the NYSE. In those situations, foreign securities will be fair valued pursuant to the policy adopted by the Board of Trustees (the Board), including utilizing a third party pricing service to determine these fair
Annual Report 2013
22
Notes to Financial Statements (continued)
August 31, 2013
values. The third party pricing service takes into account multiple factors, including, but not limited to, movements in the U.S. securities markets, certain depositary receipts, futures contracts and foreign exchange rates that have occurred subsequent to the close of the foreign exchange or market, to determine a good faith estimate that reasonably reflects the current market conditions as of the close of the NYSE. The fair value of a security is likely to be different from the quoted or published price, if available.
Investments in open-end investment companies, including money market funds, are valued at net asset value.
Investments for which market quotations are not readily available, or that have quotations which management believes are not reliable, are valued at fair value as determined in good faith under consistently applied procedures established by and under the general supervision of the Board. If a security or class of securities (such as foreign securities) is valued at fair value, such value is likely to be different from the last quoted market price for the security.
The determination of fair value often requires significant judgment. To determine fair value, management may use assumptions including but not limited to future cash flows and estimated risk premiums. Multiple inputs from various sources may be used to determine fair value.
Foreign Currency Transactions and Translations
The values of all assets and liabilities denominated in foreign currencies are translated into U.S. dollars at that day's exchange rates. Net realized and unrealized gains (losses) on foreign currency transactions and translations include gains (losses) arising from the fluctuation in exchange rates between trade and settlement dates on securities transactions, gains (losses) arising from the disposition of foreign currency and currency gains (losses) between the accrual and payment dates on dividends, interest income and foreign withholding taxes.
For financial statement purposes, the Fund does not distinguish that portion of gains (losses) on investments which is due to changes in foreign exchange rates from that which is due to changes in market prices of the investments. Such fluctuations are included with the net realized and unrealized gains (losses) on investments in the Statement of Operations.
Security Transactions
Security transactions are accounted for on the trade date. Cost is determined and gains (losses) are based upon the specific identification method for both financial statement and federal income tax purposes.
Income Recognition
Corporate actions and dividend income are generally recorded net of any non-reclaimable tax withholdings, on the ex-dividend date or upon receipt of ex-dividend notification in the case of certain foreign securities.
Awards from class action litigation are recorded as a reduction of cost basis if the Fund still owns the applicable securities on the payment date. If the Fund no longer owns the applicable securities, the proceeds are recorded as realized gains.
Expenses
General expenses of the Trust are allocated to the Fund and other funds of the Trust based upon relative net assets or other expense allocation methodologies determined by the nature of the expense. Expenses directly attributable to the Fund are charged to the Fund. Expenses directly attributable to a specific class of shares are charged to that share class.
Determination of Class Net Asset Value
All income, expenses (other than class-specific expenses, which are charged to that share class, as shown in the Statement of Operations) and realized and unrealized gains (losses) are allocated to each class of the Fund on a daily basis, based on the relative net assets of each class, for purposes of determining the net asset value of each class.
Federal Income Tax Status
The Fund intends to qualify each year as a regulated investment company under Subchapter M of the Internal Revenue Code, as amended, and will distribute substantially all of its taxable income (including net short-term capital gains), if any, for its tax year, and as such will not be subject to federal income taxes. In addition, the Fund intends to distribute in each calendar year substantially all of its net investment income, capital gains and certain other amounts, if any, such that the Fund should not be subject to federal excise tax. Therefore, no federal income or excise tax provision is recorded.
Foreign Taxes
The Fund may be subject to foreign taxes on income, gains on investments or currency repatriation, a portion of which may be recoverable. The Fund will accrue such taxes and recoveries, as applicable, based upon its current interpretation of tax rules and regulations that exist in the markets in which it invests.
Realized gains in certain countries may be subject to foreign taxes at the Fund level, based on statutory rates. The Fund accrues for such foreign taxes on realized and unrealized gains at the appropriate rate for each jurisdiction, as applicable. The
Annual Report 2013
23
Notes to Financial Statements (continued)
August 31, 2013
amount, if any, is disclosed as a liability on the Statement of Assets and Liabilities.
Distributions to Shareholders
Distributions from net investment income, if any, are declared and paid annually. Net realized capital gains, if any, are distributed along with the income distribution. Income distributions and capital gain distributions are determined in accordance with federal income tax regulations, which may differ from GAAP.
Guarantees and Indemnifications
Under the Trust's organizational documents and, in some cases, by contract, its officers and trustees are indemnified against certain liabilities arising out of the performance of their duties to the Trust or its funds. In addition, certain of the Fund's contracts with its service providers contain general indemnification clauses. The Fund's maximum exposure under these arrangements is unknown since the amount of any future claims that may be made against the Fund cannot be determined, and the Fund has no historical basis for predicting the likelihood of any such claims.
Recent Accounting Pronouncement
Disclosures about Offsetting Assets and Liabilities
In December 2011, the Financial Accounting Standards Board (FASB) issued Accounting Standards Update (ASU) No. 2011-11, Disclosures about Offsetting Assets and Liabilities and in January 2013, ASU No. 2013-1, Clarifying the Scope of Disclosures about Offsetting Assets and Liabilities (collectively, the ASUs). Specifically, the ASUs require an entity to disclose both gross and net information for derivatives and other financial instruments that are subject to a master netting arrangement or similar agreement. The ASUs require disclosure of collateral received in connection with the master netting agreements or similar agreements. The disclosure requirements are effective for interim and annual periods beginning on or after January 1, 2013. At this time, management is evaluating the implications of this guidance and the impact it will have on the financial statement amounts and footnote disclosures, if any.
Note 3. Fees and Compensation Paid to Affiliates
Investment Management Fees
Under an Investment Management Services Agreement, Columbia Management Investment Advisers, LLC (the Investment Manager), a wholly-owned subsidiary of Ameriprise Financial, Inc. (Ameriprise Financial), determines which securities will be purchased, held or sold. The investment management fee is an annual fee that is equal to a percentage of the Fund's average daily net assets that declines
from 0.87% to 0.77% as the Fund's net assets increase. The effective investment management fee rate for the year ended August 31, 2013 was 0.87 % of the Fund's average daily net assets.
Administration Fees
Under an Administrative Services Agreement, the Investment Manager also serves as the Fund Administrator. The Investment Manager does not receive a fee for its services under the Administrative Services Agreement.
Compensation of Board Members
Board members are compensated for their services to the Fund as disclosed in the Statement of Operations. The Trust's eligible Trustees may participate in a Deferred Compensation Plan (the Plan) which may be terminated at any time. Obligations of the Plan will be paid solely out of the Fund's assets.
Compensation of Chief Compliance Officer
The Board has appointed a Chief Compliance Officer to the Fund in accordance with federal securities regulations. The Fund pays its pro-rata share of the expenses associated with the Chief Compliance Officer. The Fund's expenses for the Chief Compliance Officer will not exceed $15,000 per year.
Transfer Agent Fees
Under a Transfer and Dividend Disbursing Agent Agreement, Columbia Management Investment Services Corp. (the Transfer Agent), an affiliate of the Investment Manager and a wholly-owned subsidiary of Ameriprise Financial, is responsible for providing transfer agency services to the Fund. The Transfer Agent has contracted with Boston Financial Data Services (BFDS) to serve as sub-transfer agent.
The Transfer Agent receives monthly account-based service fees based on the number of open accounts and also receives sub-transfer agency fees based on a percentage of the average aggregate value of the Fund's shares maintained in omnibus accounts (other than omnibus accounts for which American Enterprise Investment Services Inc. is the broker of record or accounts where the beneficial shareholder is a customer of Ameriprise Financial Services, Inc., which are paid a per account fee). The Transfer Agent pays the fees of BFDS for services as sub-transfer agent and is not entitled to reimbursement for such fees from the Fund (with the exception of out-of-pocket fees).
The Transfer Agent also receives compensation from fees for various shareholder services and reimbursements for certain out-of-pocket fees. Total transfer agent fees for Class R5 shares are subject to an annual limitation of not more than 0.05% of the average daily net assets attributable to Class R5 shares.
Annual Report 2013
24
Notes to Financial Statements (continued)
August 31, 2013
For the year ended August 31, 2013, the Fund's effective transfer agent fee rates as a percentage of average daily net assets of each class were as follows:
Class A | | | .20 | % | |
Class B | | | .20 | | |
Class C | | | .20 | | |
Class R4 | | | .20 | * | |
Class R5 | | | .05 | * | |
Class Z | | | .20 | | |
*Annualized
An annual minimum account balance fee of $20 may apply to certain accounts with a value below the applicable share class' initial minimum investment requirements to reduce the impact of small accounts on transfer agent fees. These minimum account balance fees are recorded as part of expense reductions in the Statement of Operations. For the year ended August 31, 2013, these minimum account balance fees reduced total expenses by $1,060.
Distribution and Service Fees
The Fund has an agreement with Columbia Management Investment Distributors, Inc. (the Distributor), an affiliate of the Investment Manager and a wholly-owned subsidiary of Ameriprise Financial, for distribution and shareholder services. Pursuant to Rule 12b-1 under the 1940 Act, the Board has approved, and the Fund has adopted, distribution and shareholder service plans (the Plans) which set the distribution and service fees for the Fund. These fees are calculated daily and are intended to compensate the Distributor and/or eligible selling and/or servicing agents for selling shares of the Fund and providing services to investors.
Under the Plans, the Fund pays a monthly service fee to the Distributor at the maximum annual rate of 0.25% of the average daily net assets attributable to Class A, Class B and Class C shares of the Fund. Also under the Plans, the Fund pays a monthly distribution fee to the Distributor at the maximum annual rates of 0.10%, 0.75% and 0.75% of the average daily net assets attributable to Class A, Class B and Class C shares, respectively.
The Fund may pay distribution and service fees up to a maximum annual rate of 0.35% of the Fund's average daily net assets attributable to Class A shares (comprised of up to 0.10% for distribution services and up to 0.25% for shareholder liaison services), but currently limit such fees to an aggregate fee of not more than 0.25% of the Fund's average daily net assets attributable to Class A shares.
Sales Charges
Sales charges, including front-end charges and CDSCs, received by the Distributor for distributing Fund shares were
$50,200 for Class A, $4,192 for Class B and $386 for Class C for the year ended August 31, 2013.
Expenses Waived/Reimbursed by the Investment Manager and its Affiliates
The Investment Manager and certain of its affiliates have contractually agreed to waive fees and/or reimburse expenses (excluding certain fees and expenses described below) for the periods disclosed below, unless sooner terminated at the sole discretion of the Board, so that the Fund's net operating expenses, after giving effect to fees waived/expenses reimbursed and any balance credits and/or overdraft charges from the Fund's custodian, do not exceed the following annual rates as a percentage of the class' average daily net assets:
| | | January 1, 2013
through
December 31, 2013 | | Prior to
January 1, 2013 | |
Class A | | | 1.51 | % | | | 1.45 | % | |
Class B | | | 2.26 | | | | 2.20 | | |
Class C | | | 2.26 | | | | 2.20 | | |
Class R4 | | | 1.26 | | | | 1.20 | | |
Class R5 | | | 1.18 | | | | 1.12 | | |
Class Z | | | 1.26 | | | | 1.20 | | |
Under the agreement governing these fee waivers and/or expense reimbursement arrangements, the following fees and expenses are excluded from the waiver/reimbursement commitment, and therefore will be paid by the Fund, if applicable: taxes (including foreign transaction taxes), expenses associated with investments in affiliated and non-affiliated pooled investment vehicles (including mutual funds and exchange traded funds), transaction costs and brokerage commissions, costs related to any securities lending program, dividend expenses associated with securities sold short, inverse floater program fees and expenses, transaction charges and interest on borrowed money, interest, extraordinary expenses and any other expenses the exclusion of which is specifically approved by the Board. This agreement may be modified or amended only with approval from all parties.
Note 4. Federal Tax Information
The timing and character of income and capital gain distributions are determined in accordance with income tax regulations, which may differ from GAAP because of temporary or permanent book to tax differences.
At August 31, 2013, these differences are primarily due to differing treatment for capital loss carryforwards, deferral/reversal of wash sales losses, Trustees' deferred compensation, foreign currency transactions, net operating loss reclassification and post-October capital losses. To the extent these differences are permanent, reclassifications are
Annual Report 2013
25
Notes to Financial Statements (continued)
August 31, 2013
made among the components of the Fund's net assets in the Statement of Assets and Liabilities. Temporary differences do not require reclassifications. In the Statement of Assets and Liabilities the following reclassifications were made:
Excess of distributions over net investment income | | $ | 685,059 | | |
Accumulated net realized loss | | | 822 | | |
Paid-in capital | | | (685,881 | ) | |
Net investment income and net realized gains (losses), as disclosed in the Statement of Operations, and net assets were not affected by this reclassification.
For the years ended August 31, 2013 and 2012, there were no distributions.
At August 31, 2013, the components of distributable earnings on a tax basis were as follows:
Undistributed ordinary income | | $ | — | | |
Undistributed accumulated long-term gain | | | — | | |
Unrealized appreciation | | | 20,738,850 | | |
At August 31, 2013, the cost of investments for federal income tax purposes was $130,908,531 and the aggregate gross unrealized appreciation and depreciation based on that cost was:
Unrealized appreciation | | $ | 23,956,975 | | |
Unrealized depreciation | | | (3,218,125 | ) | |
Net unrealized appreciation | | $ | 20,738,850 | | |
The following capital loss carryforward, determined at August 31, 2013, may be available to reduce taxable income arising from future net realized gains on investments, if any, to the extent permitted by the Internal Revenue Code:
Year of Expiration | | Amount ($) | |
2018 | | | 10,167,099 | | |
For the year ended August 31, 2013, $12,902,655 of capital loss carryforward was utilized.
Management of the Fund has concluded that there are no significant uncertain tax positions that would require recognition in the financial statements. However, management's conclusion may be subject to review and adjustment at a later date based on factors including, but not limited to, new tax laws, regulations, and administrative interpretations (including relevant court decisions). Generally, the Fund's federal tax returns for the prior three fiscal years remain subject to examination by the Internal Revenue Service.
Note 5. Portfolio Information
The cost of purchases and proceeds from sales of securities, excluding short-term obligations, aggregated to $186,051,728 and $206,254,775, respectively, for the year ended August 31, 2013.
Note 6. Lending of Portfolio Securities
Effective December 19, 2012, the Fund no longer participates in securities lending activity. Prior to that date, the Fund participated, or was eligible to participate, in securities lending activity pursuant to a Master Securities Lending Agreement (the Agreement) with JPMorgan Chase Bank, N.A. (JPMorgan). The Agreement authorized JPMorgan as lending agent to lend securities to authorized borrowers in order to generate additional income on behalf of the Fund. Pursuant to the Agreement, the securities loaned were secured by cash or securities that either were issued or guaranteed as to principal and interest by the U.S. government, its agencies, authorities or instrumentalities with value equal to at least 100% of the market value of the loaned securities. Any additional collateral required to maintain those levels due to market fluctuations of the loaned securities was requested to be delivered the following business day. Cash collateral received was invested by the lending agent on behalf of the Fund into authorized investments pursuant to the Agreement.
Pursuant to the Agreement, the Fund received income for lending its securities either in the form of fees or by earning interest on invested cash collateral, net of negotiated rebates paid to borrowers and fees paid to the lending agent for services provided and any other securities lending expenses. Net income earned from securities lending for the year ended August 31, 2013 is disclosed in the Statement of Operations. The Fund continued to earn and accrue interest and dividends on the securities loaned.
Note 7. Affiliated Money Market Fund
The Fund invests its daily cash balances in Columbia Short-Term Cash Fund, an affiliated money market fund established for the exclusive use by the Fund and other affiliated funds. The income earned by the Fund from such investments is included as "Dividends — affiliated issuers" in the Statement of Operations. As an investing fund, the Fund indirectly bears its proportionate share of the expenses of Columbia Short-Term Cash Fund.
Note 8. Shareholder Concentration
At August 31, 2013, two unaffiliated shareholder accounts owned an aggregate of 31.46% of the outstanding shares of the Fund. The Fund has no knowledge about whether any portion of those shares was owned beneficially by such accounts. Subscription and redemption activity by concentrated accounts may have a significant effect on the operations of the Fund.
Note 9. Line of Credit
The Fund has entered into a revolving credit facility with a syndicate of banks led by JPMorgan whereby the Fund may borrow for the temporary funding of shareholder redemptions
Annual Report 2013
26
Notes to Financial Statements (continued)
August 31, 2013
or for other temporary or emergency purposes. The credit facility agreement, as amended, which is a collective agreement between the Fund and certain other funds managed by the Investment Manager, severally and not jointly, permits collective borrowings up to $500 million. Interest is charged to each participating fund based on its borrowings at a rate equal to the higher of (i) the overnight federal funds rate plus 1.00% or (ii) the one-month LIBOR rate plus 1.00%. Each borrowing under the credit facility matures no later than 60 days after the date of borrowing. The Fund also pays a commitment fee equal to its pro rata share of the amount of the credit facility at a rate of 0.08% per annum. The commitment fee is included in other expenses in the Statement of Operations.
The Fund had no borrowings during the year ended August 31, 2013.
Note 10. Significant Risks
Technology and Technology-related Investment Risk
The Fund invested a substantial portion of its assets in technology and technology-related companies. The market prices of technology and technology-related stocks tend to exhibit a greater degree of market risk and price volatility than other types of investments.
Foreign Securities Risk
Investing in foreign securities may include certain risks and considerations not typically associated with investing in U.S. securities, such as fluctuating currency values and changing local and regional economic, political and social conditions, which may result in greater market volatility. In addition, certain foreign securities may not be as liquid as U.S. securities.
Non-Diversification Risk
A non-diversified fund is permitted to invest a greater percentage of its total assets in fewer issuers than a diversified fund. The Fund may, therefore, have a greater risk of loss from a few issuers than a similar fund that invests more broadly.
Note 11. Subsequent Events
Management has evaluated the events and transactions that have occurred through the date the financial statements were issued and noted no items requiring adjustment of the financial statements or additional disclosure.
Note 12. Information Regarding Pending and Settled Legal Proceedings
In December 2005, without admitting or denying the allegations, American Express Financial Corporation (AEFC, which is now known as Ameriprise Financial, Inc. (Ameriprise Financial)) entered into settlement agreements with the
Securities and Exchange Commission (SEC) and Minnesota Department of Commerce (MDOC) related to market timing activities. As a result, AEFC was censured and ordered to cease and desist from committing or causing any violations of certain provisions of the Investment Advisers Act of 1940, the Investment Company Act of 1940, and various Minnesota laws. AEFC agreed to pay disgorgement of $10 million and civil money penalties of $7 million. AEFC also agreed to retain an independent distribution consultant to assist in developing a plan for distribution of all disgorgement and civil penalties ordered by the SEC in accordance with various undertakings detailed at www.sec.gov/litigation/admin/ia-2451.pdf. Ameriprise Financial and its affiliates have cooperated with the SEC and the MDOC in these legal proceedings, and have made regular reports to the funds' Boards of Trustees.
Ameriprise Financial and certain of its affiliates have historically been involved in a number of legal, arbitration and regulatory proceedings, including routine litigation, class actions, and governmental actions, concerning matters arising in connection with the conduct of their business activities. Ameriprise Financial believes that the Funds are not currently the subject of, and that neither Ameriprise Financial nor any of its affiliates are the subject of, any pending legal, arbitration or regulatory proceedings that are likely to have a material adverse effect on the Funds or the ability of Ameriprise Financial or its affiliates to perform under their contracts with the Funds. Ameriprise Financial is required to make 10-Q, 10-K and, as necessary, 8-K filings with the Securities and Exchange Commission on legal and regulatory matters that relate to Ameriprise Financial and its affiliates. Copies of these filings may be obtained by accessing the SEC website at www.sec.gov.
There can be no assurance that these matters, or the adverse publicity associated with them, will not result in increased fund redemptions, reduced sale of fund shares or other adverse consequences to the Funds. Further, although we believe proceedings are not likely to have a material adverse effect on the Funds or the ability of Ameriprise Financial or its affiliates to perform under their contracts with the Funds, these proceedings are subject to uncertainties and, as such, we are unable to estimate the possible loss or range of loss that may result. An adverse outcome in one or more of these proceedings could result in adverse judgments, settlements, fines, penalties or other relief that could have a material adverse effect on the consolidated financial condition or results of operations of Ameriprise Financial.
Annual Report 2013
27
Report of Independent Registered Public Accounting Firm
To the Trustees of Columbia Funds Series Trust I and the Shareholders of
Columbia Technology Fund
In our opinion, the accompanying statement of assets and liabilities, including the portfolio of investments, and the related statements of operations and of changes in net assets and the financial highlights present fairly, in all material respects, the financial position of Columbia Technology Fund (the "Fund") (a series of Columbia Funds Series Trust I) at August 31, 2013, the results of its operations, the changes in its net assets and the financial highlights for the periods indicated, in conformity with accounting principles generally accepted in the United States of America. These financial statements and financial highlights (hereafter referred to as "financial statements") are the responsibility of the Fund's management. Our responsibility is to express an opinion on these financial statements based on our audits. We conducted our audits of these financial statements in accordance with the standards of the Public Company Accounting Oversight Board (United States). Those standards require that we plan and perform the audit to obtain reasonable assurance about whether the financial statements are free of material misstatement. An audit includes examining, on a test basis, evidence supporting the amounts and disclosures in the financial statements, assessing the accounting principles used and significant estimates made by management, and evaluating the overall financial statement presentation. We believe that our audits, which included confirmation of securities at August 31, 2013 by correspondence with the custodian, brokers and transfer agent, provide a reasonable basis for our opinion.
PricewaterhouseCoopers LLP
Minneapolis, Minnesota
October 22, 2013
Annual Report 2013
28
The Trustees serve terms of indefinite duration. The names, addresses and birth years of the Trustees and Officers of the Funds in Columbia Funds Series Trust I, the year each was first elected or appointed to office, their principal business occupations during at least the last five years, the number of Funds overseen by each Trustee and other directorships they hold are shown below. Each officer listed below serves as an officer of each Fund in Columbia Funds Series Trust I.
Independent Trustees
Name, Address and Year of Birth,
Position with Funds, Year First
Elected or Appointed to Office | | Principal Occupation(s) During Past Five Years, Number of Funds in Columbia
Funds Complex Overseen by Trustee, Other Directorships Held | |
Rodman L. Drake (Born 1943)
c/o Columbia Management
Investment Advisers, LLC
225 Franklin Street
Boston, MA 02110
Trustee (since 1994) and
Chairman of the Board (since 2009) | | Independent consultant since 2010; Co-Founder of Baringo Capital LLC (private equity) from 1997 to 2008; Chairman (from 2003 to 2010) and CEO (from 2008 to 2010) of Crystal River Capital, Inc. (real estate investment trust); Oversees 52; Jackson Hewitt Tax Service Inc. (tax preparation services) from 2004 to 2011; Student Loan Corporation (student loan provider) from 2005 to 2010; Celgene Corporation (global biotechnology company); The Helios Funds and Brookfield Funds (closed-end funds); Chimerix, Inc. (biopharmaceutical company) since August 1, 2013; Crystal River Capital, Inc. from 2005 to 2010; Parsons Brinckerhoff from 1995 to 2008; and Apex Silver Mines Ltd. from 2007 to 2009 | |
Douglas A. Hacker (Born 1955)
c/o Columbia Management
Investment Advisers, LLC
225 Franklin Street
Boston, MA 02110
Trustee (since 1996) | | Independent business executive since May 2006; Executive Vice President — Strategy of United Airlines from December 2002 to May 2006; President of UAL Loyalty Services (airline marketing company) from September 2001 to December 2002; Executive Vice President and Chief Financial Officer of United Airlines from July 1999 to September 2001. Oversees 52; Nash Finch Company (food distributor); Aircastle Limited (aircraft leasing); and SeaCube Container Leasing Ltd. (container leasing) | |
Janet Langford Kelly (Born 1957)
c/o Columbia Management
Investment Advisers, LLC
225 Franklin Street
Boston, MA 02110
Trustee (since 1996) | | Senior Vice President, General Counsel and Corporate Secretary, ConocoPhillips (integrated energy company) since September 2007; Deputy General Counsel — Corporate Legal Services, ConocoPhillips from August 2006 to August 2007; Partner, Zelle, Hofmann, Voelbel, Mason & Gette LLP (law firm) from March 2005 to July 2006; Adjunct Professor of Law, Northwestern University from September 2004 to June 2006; Director, UAL Corporation (airline) from February 2006 to July 2006; Chief Administrative Officer and Senior Vice President, Kmart Holding Corporation (consumer goods) from September 2003 to March 2004. Oversees 52; None | |
Nancy T. Lukitsh (Born 1956)
c/o Columbia Management
Investment Advisers, LLC
225 Franklin Street
Boston, MA 02110
Trustee (since 2011) | | Senior Vice President, Partner and Director of Marketing, Wellington Management Company, LLP (investment adviser) from 1997 to 2010; Chair, Wellington Management Investment Portfolios (commingled non-U.S. investment pools) from 2007 to 2010; Director, Wellington Trust Company, NA and other Wellington affiliates from 1997 to 2010. Oversees 52; None | |
William E. Mayer (Born 1940)
c/o Columbia Management
Investment Advisers, LLC
225 Franklin Street
Boston, MA 02110
Trustee (since 1994) | | Partner, Park Avenue Equity Partners (private equity) since February 1999; Dean and Professor, College of Business and Management, University of Maryland from 1992 to 1996. Oversees 52; DynaVox Inc. (speech creation); Lee Enterprises (print media); WR Hambrecht + Co. (financial service provider) from 2000 to 2012; BlackRock Kelso Capital Corporation (investment company) | |
David M. Moffett (Born 1952)
c/o Columbia Management
Investment Advisers, LLC
225 Franklin Street
Boston, MA 02110
Trustee (since 2011) | | Retired. Chief Executive Officer, Federal Home Loan Mortgage Corporation, from 2008 to 2009; Senior Adviser, Global Financial Services Group, Carlyle Group, Inc., from 2007 to 2008; Vice Chairman and Chief Financial Officer, U.S. Bancorp, from 1993 to 2007. Oversees 52; CIT Group Inc. (commercial and consumer finance); eBay Inc. (online trading community); MBIA Inc. (financial service provider); E.W. Scripps Co. (print and television media), Building Materials Holding Corp. (building materials and construction services); Genworth Financial, Inc. (financial and insurance products and services); and University of Oklahoma Foundation | |
Charles R. Nelson (Born 1942)
c/o Columbia Management
Investment Advisers, LLC
225 Franklin Street
Boston, MA 02110
Trustee (since 1981) | | Retired. Professor Emeritus, University of Washington, since 2011; Professor of Economics, University of Washington from 1976 to 2011; Ford and Louisa Van Voorhis Professor of Political Economy, University of Washington from 1993 to 2011; Adjunct Professor of Statistics, University of Washington from 1980 to 2011; Associate Editor, Journal of Money, Credit and Banking from September 1993 to 2008; consultant on econometric and statistical matters. Oversees 52; None | |
John J. Neuhauser (Born 1943)
c/o Columbia Management
Investment Advisers, LLC
225 Franklin Street
Boston, MA 02110
Trustee (since 1984) | | President, Saint Michael's College, since August 2007; Director or Trustee of several non-profit organizations, including Fletcher Allen Health Care, Inc.; University Professor, Boston College from November 2005 to August 2007; Academic Vice President and Dean of Faculties, Boston College from August 1999 to October 2005. Oversees 52; Liberty All-Star Equity Fund and Liberty All-Star Growth Fund (closed-end funds) | |
Annual Report 2013
29
Trustees and Officers (continued)
Independent Trustees (continued)
Name, Address and Year of Birth,
Position with Funds, Year First
Elected or Appointed to Office | | Principal Occupation(s) During Past Five Years, Number of Funds in Columbia
Funds Complex Overseen by Trustee, Other Directorships Held | |
Patrick J. Simpson (Born 1944)
c/o Columbia Management
Investment Advisers, LLC
225 Franklin Street
Boston, MA 02110
Trustee (since 2000) | | Partner, Perkins Coie LLP (law firm). Oversees 52; None | |
Anne-Lee Verville (Born 1945)
c/o Columbia Management
Investment Advisers, LLC
225 Franklin Street
Boston, MA 02110
Trustee (since 1998) | | Retired. General Manager — Global Education Industry from 1994 to 1997, President — Application Systems Division from 1991 to 1994, Chief Financial Officer — US Marketing & Services from 1988 to 1991, and Chief Information Officer from 1987 to 1988, IBM Corporation (computer and technology). Oversees 52; Enesco Group, Inc. (producer of giftware and home and garden decor products) from 2001 to 2006 | |
Interested Trustee
Name, Address and Year of Birth,
Position with Funds, Year First
Elected or Appointed to Office | | Principal Occupation(s) During Past Five Years, Number of Funds in Columbia
Funds Complex Overseen by Trustee, Other Directorships Held | |
William F. Truscott (born 1960)
53600 Ameriprise Financial Center
Minneapolis, MN 55474
Senior Vice President (since 2012) | | Chairman of the Board and President, Columbia Management Investment Advisers, LLC since May 2010 and February 2012 (previously President and Chief Investment Officer, from 2001 to April 2010); Chief Executive Officer, Global Asset Management, Ameriprise Financial, Inc. since September 2012 (previously, Chief Executive Officer, U.S. Asset Management & President, Annuities, from May 2010 to September 2012 and President — U.S. Asset Management and Chief Investment Officer from 2005 to April 2010); Director and Chief Executive Officer, Columbia Management Investment Distributors, Inc. since May 2010 and February 2012, respectively (previously Chairman of the Board and Chief Executive Officer from 2006 to April 2010); Chairman of the Board and Chief Executive Officer, RiverSource Distributors, Inc. since 2006; President and Chief Executive Officer, Ameriprise Certificate Company, 2006 to August 2012; Oversees 184; Director, Ameriprise Certificate Company, 2006-January 2013 | |
The Statement of Additional Information includes additional information about the Trustees of the Funds and is available, without charge, upon request by calling 800.345.6611.
The Board has appointed officers who are responsible for day-to-day business decisions based on policies it has established. The officers serve at the pleasure of the Board. In addition to Mr. Truscott, who is Senior Vice President, the Funds' other officers are:
Officers
Name, Year of Birth and Address | | Principal Occupation(s) During the Past Five Years | |
J. Kevin Connaughton (Born 1964)
225 Franklin Street
Boston, MA 02110
President (since 2009) | | Senior Vice President and General Manager — Mutual Fund Products, Columbia Management Investment Advisers, LLC since May 2010; President, Columbia Funds since 2009 and RiverSource Funds since May 2010; Managing Director, Columbia Management Advisors, LLC, December 2004-April 2010; Senior Vice President and Chief Financial Officer, Columbia Funds, June 2008-January 2009; Treasurer, Columbia Funds, October 2003-May 2008; and senior officer of various other affiliated funds since 2000 | |
Amy Johnson (Born 1965)
5228 Ameriprise Financial Center
Minneapolis, MN 55474
Vice President (since 2010) | | Senior Vice President and Chief Operating Officer, Columbia Management Investment Advisers, LLC since May 2010 (previously Chief Administrative Officer, from 2009-April 2010, Vice President — Asset Management and Trust Company Services, from 2006-2009) | |
Michael G. Clarke (Born 1969)
225 Franklin Street
Boston, MA 02110
Treasurer (since 2011) and Chief
Financial Officer (since 2009) | | Vice President, Columbia Management Investment Advisers, LLC since May 2010; Managing Director of Fund Administration, Columbia Management Advisors, LLC, September 2004-April 2010; senior officer of Columbia Funds and affiliated funds since 2002 | |
Annual Report 2013
30
Trustees and Officers (continued)
Officers (continued)
Name, Year of Birth and Address | | Principal Occupation(s) During the Past Five Years | |
Scott R. Plummer (Born 1959)
5228 Ameriprise Financial Center
Minneapolis, MN 55474
Senior Vice President, Assistant
Secretary and Chief Legal Officer
(since 2010) | | Senior Vice President, Chief Legal Officer and Assistant Secretary, Columbia Management Investment Advisers, LLC since June 2005; Senior Vice President and Lead Chief Counsel — Asset Management, Ameriprise Financial, Inc. since May 2010 (previously Vice President and Chief Counsel — Asset Management, 2005-April 2010); Vice President, Chief Counsel and Assistant Secretary, Columbia Management Investment Distributors, Inc. since 2008; Vice President, General Counsel and Secretary, Ameriprise Certificate Company since 2005; Chief Counsel, RiverSource Distributors, Inc. since 2006; senior officer of Columbia Funds and affiliated funds since 2010 | |
Colin Moore (Born 1958)
225 Franklin Street
Boston, MA 02110
Senior Vice President (since 2010) | | Executive Vice President and Global Chief Investment Officer, Ameriprise Financial, Inc. since July 2013; Director and Global Chief Investment Officer, Columbia Management Investment Advisers, LLC since May 2010; Manager, Managing Director and Chief Investment Officer of Columbia Management Advisors, LLC, 2007-April 2010 | |
Thomas P. McGuire (Born 1972)
225 Franklin Street
Boston, MA 02110
Chief Compliance Officer
(since 2012) | | Vice President — Asset Management Compliance, Columbia Management Investment Advisers, LLC since 2010; Chief Compliance Officer, Ameriprise Certificate Company, since September 2010; Compliance Executive, Bank of America, N.A. 2005-2010 | |
Stephen T. Welsh (born 1957)
225 Franklin Street
Boston, MA 02110
Vice President (since 2006) | | President and Director, Columbia Management Investment Services Corp. since May 2010; President and Director, Columbia Management Services, Inc., July 2004-April 2010; Managing Director, Columbia Management Distributors, Inc., August 2007-April 2010 | |
Christopher O. Petersen (born 1970)
5228 Ameriprise Financial Center
Minneapolis, MN 55474
Vice President (since 2010) and
Secretary (since 2011) | | Vice President and Chief Counsel, Ameriprise Financial, Inc. since January 2010 (formerly Vice President and Group Counsel or Counsel, April 2004-January 2010); Assistant Secretary of Columbia Funds, January 2007-April 2011 | |
Paul D. Pearson (born 1956)
10468 Ameriprise Financial Center
Minneapolis, MN 55474
Vice President and Assistant
Treasurer (since 2011) | | Vice President, Investment Accounting, Columbia Management Investment Advisers, LLC, since May 2010; Vice President — Managed Assets, Investment Accounting, Ameriprise Financial, Inc., February 1998-May 2010 | |
Joseph F. DiMaria (Born 1968)
225 Franklin Street
Boston, MA 02110
Vice President (since 2011) and
Chief Accounting Officer (since 2008) | | Vice President, Mutual Fund Administration, Columbia Management Investment Advisers, LLC, since May 2010; Director of Fund Administration, Columbia Management Advisors, LLC, January 2006-April 2010 | |
Paul B. Goucher (born 1968)
100 Park Avenue
New York, NY 10017
Vice President and Assistant
Secretary (since 2010) | | Vice President and Lead Chief Counsel, Ameriprise Financial, Inc. since November 2008 and January 2013, respectively (formerly, Chief Counsel from January 2010-January 2013 and Group Counsel from November 2008-January 2010); Director, Managing Director and General Counsel, J. & W. Seligman & Co. Incorporated, July 2008-November 2008 (previously, Managing Director and Associate General Counsel, January 2005-July 2008) | |
Michael E. DeFao (born 1968)
225 Franklin Street
Boston, MA 02110
Vice President and Assistant
Secretary (since 2011) | | Vice President and Chief Counsel, Ameriprise Financial, Inc. since May 2010; Associate General Counsel, Bank of America, N.A. June 2005-April 2010 | |
Annual Report 2013
31
Board Consideration and Approval of
Advisory Agreement
On June 14, 2013, the Board of Trustees (the "Board") and the Trustees who are not interested persons (as defined in the Investment Company Act of 1940) of the Trust (the "Independent Trustees") unanimously approved the continuation of the Investment Management Services Agreement (the "Advisory Agreement") with Columbia Management Investment Advisers, LLC (the "Investment Manager") with respect to Columbia Technology Fund (the "Fund"), a series of the Trust. As detailed below, the Advisory Fees and Expenses Committee (the "Committee") and the Board met on multiple occasions to review and discuss, both among themselves and with the management team of the Investment Manager, materials provided by the Investment Manager before determining to approve the continuation of the Advisory Agreement.
In connection with their deliberations regarding the continuation of the Advisory Agreement, the Committee and the Board evaluated materials requested from the Investment Manager regarding the Fund and the Advisory Agreement, and discussed these materials with representatives of the Investment Manager at Committee meetings held on March 5, 2013, April 24, 2013 and June 13, 2013, and at the Board meeting held on June 14, 2013. In addition, the Board considers matters bearing on the Advisory Agreement at most of its other meetings throughout the year and meets regularly with senior management of the Funds and the Investment Manager. Through the Board's Investment Oversight Committees, Trustees also meet with selected Fund portfolio managers and other investment personnel at various times throughout the year. The Committee and the Board also consulted with Fund counsel and with the Independent Trustees' independent legal counsel, who advised on various matters with respect to the Committee's and the Board's considerations and otherwise assisted the Committee and the Board in their deliberations. On June 13, 2013, the Committee recommended that the Board approve the continuation of the Advisory Agreement. On June 14, 2013, the Board, including the Independent Trustees, voting separately, unanimously approved the continuation of the Advisory Agreement for the Fund.
The Committee and the Board considered all information that they, their legal counsel, or the Investment Manager believed reasonably necessary to evaluate and to determine whether to approve the continuation of the Advisory Agreement. The information and factors considered by the Committee and the Board in recommending for approval or approving the continuation of the Advisory Agreement for the Fund included the following:
• Information on the investment performance of the Fund relative to the performance of a group of mutual funds determined to be comparable to the Fund by an independent third-party data provider, as well as performance relative to benchmarks;
• Information on the Fund's advisory fees and total expenses, including information comparing the Fund's expenses to those of a group of comparable mutual funds, as determined by the independent third-party data provider;
• The Investment Manager's agreement to contractually limit or cap total operating expenses for the Fund so that total operating expenses (excluding certain fees and expenses, such as transaction costs and certain other investment related expenses, interest, taxes, acquired fund fees and expenses, and extraordinary expenses) would not exceed the median expenses of a group of comparable funds (as determined from time to time, generally annually, by the independent third-party data provider);
• The terms and conditions of the Advisory Agreement;
• The terms and conditions of other agreements and arrangements with affiliates of the Investment Manager relating to the operations of the Fund, including the Administrative Services Agreement, the Distribution Agreement and the Transfer and Dividend Disbursing Agent Agreement;
• Descriptions of various functions performed by the Investment Manager under the Advisory Agreement, including portfolio management and portfolio trading practices;
• Information regarding the management fees and investment performance of comparable portfolios of other clients of the Investment Manager, including institutional separate accounts;
• Information regarding the reputation, regulatory history and resources of the Investment Manager, including information regarding senior management, portfolio managers and other personnel;
• Information regarding the capabilities of the Investment Manager with respect to compliance monitoring services, including an assessment of the Investment Manager's compliance system by the Fund's Chief Compliance Officer; and
• The profitability to the Investment Manager and its affiliates from their relationships with the Fund.
Annual Report 2013
32
Board Consideration and Approval of
Advisory Agreement (continued)
Nature, Extent and Quality of Services Provided under the Advisory Agreement
The Committee and the Board considered the nature, extent and quality of services provided to the Fund by the Investment Manager and its affiliates under the Advisory Agreement and under separate agreements for the provision of transfer agency and administrative services, and the resources dedicated to the Fund and the other Columbia Funds by the Investment Manager and its affiliates. The Committee and the Board considered, among other things, the Investment Manager's ability to attract, motivate and retain highly qualified research, advisory and supervisory investment professionals (including personnel and other resources, compensation programs for personnel involved in fund management, reputation and other attributes), the portfolio management services provided by those investment professionals, and the quality of the Investment Manager's investment research capabilities and trade execution services. The Committee and the Board also considered the potential benefits to shareholders of investing in a mutual fund that is part of a fund complex offering exposure to a variety of asset classes and investment disciplines and providing a variety of fund and shareholder services.
The Committee and the Board also considered the professional experience and qualifications of the senior personnel of the Investment Manager, which included consideration of the Investment Manager's experience with similarly-structured funds. The Committee and the Board noted the compliance programs of and the compliance-related resources provided to the Fund by the Investment Manager and its affiliates, and considered the Investment Manager's ability to provide administrative services to the Fund pursuant to a separate Administrative Services Agreement, including the Investment Manager's ability to coordinate the activities of the Fund's other service providers. After reviewing these and related factors, the Committee and the Board concluded, within the context of their overall conclusions, that the nature, extent and quality of the services provided to the Fund under the Advisory Agreement supported the continuation of the Advisory Agreement.
Investment Performance
The Committee and the Board reviewed information about the performance of the Fund over various time periods, including performance information relative to benchmarks and information based on reports of the independent third-party data provider that compared the performance of the Fund to the performance of a group of comparable mutual funds. The Committee and the Board also reviewed a description of the third party's methodology for identifying the Fund's peer groups for purposes of performance and expense comparisons. Although the Fund's performance lagged that of a relevant peer group for certain (although not necessarily all) periods, the Committee and the Board concluded that other factors relevant to performance were sufficient, in light of other considerations, to warrant continuation of the Fund's Advisory Agreement. Those factors included one or more of the following: (i) that the Fund's performance, although lagging in certain recent periods, was stronger over the longer term; (ii) that the underperformance was attributable, to a significant extent, to investment decisions that were reasonable and consistent with the Fund's investment strategy and policies and that the Fund was performing within a reasonable range of expectations, given those investment decisions, market conditions and the Fund's investment strategy; (iii) that the Fund's performance was competitive when compared to other relevant performance benchmarks or peer groups; and (iv) that the Investment Manager had taken or was taking steps designed to help improve the Fund's investment performance, including, but not limited to, replacing portfolio managers, enhancing the resources supporting the portfolio managers, or modifying investment strategies.
The Committee and the Board noted that, through December 31, 2012, the Fund's performance was in the 19th, 63rd and 92nd percentile (where the best performance would be in the first percentile) of its category selected by the independent third-party data provider for the purposes of performance comparisons for the one-, three- and five-year periods, respectively.
The Committee and the Board also considered the Investment Manager's performance and reputation generally, the Investment Manager's historical responsiveness to Board concerns about performance, and the Investment Manager's willingness to take steps intended to improve performance. After reviewing these and related factors, the Committee and the Board concluded, within the context of their overall conclusions, that the performance of the Fund and the Investment Manager was sufficient, in light of other considerations, to warrant the continuation of the Advisory Agreement.
Investment Advisory Fee Rates and Other Expenses
The Committee and the Board considered the advisory fees charged to the Fund under the Advisory Agreement as well as the total expenses incurred by the Fund. In assessing the reasonableness of the fees under the Advisory Agreement, the Committee and the Board considered, among other information, the Fund's advisory fee and its total expense ratio as a
Annual Report 2013
33
Board Consideration and Approval of
Advisory Agreement (continued)
percentage of average daily net assets. The Committee and the Board noted that the Fund's actual management fee and net expense ratio are ranked in the 4th and 3rd quintiles, respectively, (where the lowest fees and expenses would be in the first quintile) against the Fund's expense universe as determined by the independent third-party data provider for purposes of expense comparison. The Committee and the Board also took into account the fee waiver and expense limitation arrangements agreed to by the Investment Manager, as noted above.
The Committee and the Board also received and considered information about the advisory fees charged by the Investment Manager to institutional separate accounts. In considering the fees charged to those accounts, the Committee and the Board took into account, among other things, the Investment Manager's representations about the differences between managing mutual funds as compared to other types of accounts, including differences in the services provided, differences in the risk profile of such business for the Investment Manager and the additional resources required to manage mutual funds effectively. In evaluating the Fund's advisory fees, the Committee and the Board also took into account the demands, complexity and quality of the investment management of the Fund.
After reviewing these and related factors, the Committee and the Board concluded, within the context of their overall conclusions, that the advisory fee rates and expenses of the Fund supported the continuation of the Advisory Agreement.
Costs of Services Provided and Profitability
The Committee and the Board also took note of the costs of the services provided (both on an absolute and relative basis) and the profitability to the Investment Manager and its affiliates in connection with their relationships with the Fund. In evaluating these considerations, the Committee and the Board took note of the advisory fees charged by the Investment Manager to other clients, including fees charged by the Investment Manager to institutional separate account clients with similar investment strategies to those of the Fund.
The Committee and the Board also considered the compensation directly or indirectly received by the Investment Manager's affiliates in connection with their relationships with the Fund. The Committee and the Board reviewed information provided by management as to the profitability of the Investment Manager and its affiliates of their relationships with the Fund, information about the allocation of expenses used to calculate profitability, and comparisons of profitability levels realized in 2012 to profitability levels realized in 2011. When reviewing profitability, the Committee and the Board also considered court cases in which adviser profitability was an issue in whole or in part, the performance of the Fund, the expense ratio of the Fund, and the implementation of expense limitations with respect to the Fund. The Committee and the Board also considered information provided by the Investment Manager regarding its financial condition and comparing its profitability to that of other asset management firms that are, or are subsidiaries of, publicly traded companies.
After reviewing these and related factors, the Committee and the Board concluded, within the context of their overall conclusions, that the costs of services provided and the profitability to the Investment Manager and its affiliates from their relationships with the Fund supported the continuation of the Advisory Agreement.
Economies of Scale
The Committee and the Board considered the potential existence of economies of scale in the provision by the Investment Manager of services to the Fund, to groups of related funds, and to the Investment Manager's investment advisory clients as a whole, and whether those economies of scale were shared with the Fund through breakpoints in investment advisory fees or other means, such as expense limitation arrangements and additional investments by the Investment Manager in investment, trading and compliance resources. The Committee and the Board noted that the investment advisory fee schedules for the Fund contained breakpoints that would reduce the fee rate on assets above specified threshold levels.
In considering these matters, the Committee and the Board also considered the costs of the services provided and the profitability to the Investment Manager and its affiliates from their relationships with the Fund, as discussed above. After reviewing these and related factors, the Committee and the Board concluded, within the context of their overall conclusions, that the extent to which any economies of scale were expected to be shared with the Fund supported the continuation of the Advisory Agreement.
Annual Report 2013
34
Board Consideration and Approval of
Advisory Agreement (continued)
Other Benefits to the Investment Manager
The Committee and the Board received and considered information regarding "fall-out" or ancillary benefits received by the Investment Manager and its affiliates as a result of their relationships with the Fund, such as the engagement of the Investment Manager to provide administrative services to the Fund and the engagement of the Investment Manager's affiliates to provide distribution and transfer agency services to the Fund. The Committee and the Board considered that the Fund's distributor retains a portion of the distribution fees from the Fund. The Committee and the Board also considered the benefits of research made available to the Investment Manager by reason of brokerage commissions generated by the Fund's securities transactions, and reviewed information about the Investment Manager's practices with respect to allocating portfolio transactions for brokerage and research services. The Committee and the Board considered the possible conflicts of interest associated with certain fall-out or other ancillary benefits and the reporting, disclosure and other processes that are in place to address such possible conflicts of interest. The Committee and the Board recognized that the Investment Manager's profitability would be somewhat lower without these benefits.
Conclusion
The Committee and the Board reviewed all of the above considerations in reaching their decisions to recommend or approve the continuation of the Advisory Agreement. In their deliberations, the Trustees did not identify any particular information that was all-important or controlling, and individual Trustees may have attributed different weights to the various factors. Based on their evaluation of all factors that they deemed to be material, including those factors described above, and assisted by the advice of independent legal counsel, the Board, including the Independent Trustees, voting separately, unanimously approved the continuation of the Advisory Agreement.
Annual Report 2013
35
This page intentionally left blank.
Annual Report 2013
36
Important Information About This Report
Each fund mails one shareholder report to each shareholder address. If you would like more than one report, please call shareholder services at 800.345.6611 and additional reports will be sent to you.
The policy of the Board is to vote the proxies of the companies in which each fund holds investments consistent with the procedures as stated in the Statement of Additional Information (SAI). You may obtain a copy of the SAI without charge by calling 800.345.6611; contacting your financial intermediary; visiting columbiamanagement.com; or searching the website of the Securities and Exchange Commission (SEC) at sec.gov. Information regarding how each fund voted proxies relating to portfolio securities is filed with the SEC by August 31 for the most recent 12-month period ending June 30 of that year, and is available without charge by visiting columbiamanagement.com; or searching the website of the SEC at sec.gov.
Each fund files a complete schedule of portfolio holdings with the SEC for the first and third quarters of each fiscal year on Form N-Q. Each fund's Form N-Q is available on the SEC's website at sec.gov and may be reviewed and copied at the SEC's Public Reference Room in Washington, D.C. Information on the operation of the Public Reference Room may be obtained by calling 800.SEC.0330. Each fund's complete schedule of portfolio holdings, as filed on Form N-Q, can also be obtained without charge, upon request, by calling 800.345.6611.
Annual Report 2013
37

Columbia Technology Fund
P.O. Box 8081
Boston, MA 02266-8081
columbiamanagement.com
This information is for use with concurrent or prior delivery of a fund prospectus. Please read and consider the investment objectives, risks, charges and expenses for any fund carefully before investing. For a prospectus which contains this and other important information about the Fund go to columbiamanagement.com. The Fund is distributed by Columbia Management Investment Distributors, Inc., member FINRA, and managed by Columbia Management Investment Advisers, LLC.
© 2013 Columbia Management Investment Advisers, LLC. All rights reserved.
ANN234_08_C01_(10/13)
Annual Report
August 31, 2013

Not FDIC insured • No bank guarantee • May lose value
 Dear Shareholders,
A return to volatility
Volatility returned to the financial markets in the second quarter of 2013, as uncertainty about the global economy, monetary policy and the impact of the sequester's spending cuts weighed on investors. Households advanced their spending but also allocated less to savings. Labor markets continued to crank out jobs at a steady pace, slowly reducing unemployment. Housing activity remained strong and retail sales were higher despite no real increase in income. The single weak spot was in the manufacturing sector, where activity slowed. While the consumer has weathered the domestic drag well, business has been closer to the global slowdown and effects of sequestration. Businesses remain very cautious, keeping inventories and staffs lean, and are planning for but not yet confident enough to make capital expenditures.
Against this backdrop, equities outperformed fixed income during the second quarter of 2013. Small-cap stocks outperformed large- and mid-cap stocks, and growth outperformed value except for in the large-cap sector. Outside the United States, foreign stock markets generally lost ground, with the most significant losses sustained by emerging markets.
Columbia Management to begin delivering summary prospectuses
Each Columbia fund is required to update its prospectus on an annual basis. Beginning with June 2013 prospectus updates, shareholders of Columbia retail mutual funds will start to receive a summary prospectus, rather than the full length (statutory) mutual fund prospectus they have received in the past.
Each fund's summary prospectus will include the following key information:
> Investment objective
> Fee and expense table
> Portfolio turnover rate information
> Principal investment strategies, principal risks and performance information
> Management information
> Purchase and sale information
> Tax information
> Financial intermediary compensation information
Each fund's statutory prospectus will contain additional information about the fund and its risks. Both the statutory and summary prospectus will be updated each year, and will be available at columbiamanagement.com. Shareholders may request a printed version of a statutory prospectus at no cost by calling 800.345.6611 or sending an email to serviceinquiries@columbiamanagement.com.
Stay on track with Columbia Management
Backed by more than 100 years of experience, Columbia Management is one of the nation's largest asset managers. At the heart of our success — and, most importantly, that of our investors — are highly talented industry professionals, brought together by a unique way of working. We are dedicated to helping you take advantage of today's opportunities and anticipate tomorrow's. We stay abreast of the latest investment trends and ideas, using our collective insight to evaluate events and transform them into solutions you can use.
Visit columbiamanagement.com for:
> The Columbia Management Perspectives blog, featuring timely posts by our investment teams
> Detailed up-to-date fund performance and portfolio information
> Economic analysis and market commentary
> Quarterly fund commentaries
> Columbia Management Investor, our award-winning quarterly newsletter for shareholders
Thank you for your continued support of the Columbia Funds. We look forward to serving your investment needs for many years to come.
Best Regards,

J. Kevin Connaughton
President, Columbia Funds
Investors should consider the investment objectives, risks, charges and expenses of a mutual fund carefully before investing. For a free prospectus, which contains this and other important information about a fund, visit columbiamanagement.com. The prospectus should be read carefully before investing.
Columbia Funds are distributed by Columbia Management Investment Distributors, Inc., member FINRA, and managed by Columbia Management Investment Advisers, LLC.
© 2013 Columbia Management Investment Advisers, LLC. All rights reserved.
Performance Overview | | | 2 | | |
Manager Discussion of Fund Performance | | | 4 | | |
Understanding Your Fund's Expenses | | | 6 | | |
Portfolio of Investments | | | 7 | | |
Statement of Assets and Liabilities | | | 31 | | |
Statement of Operations | | | 33 | | |
Statement of Changes in Net Assets | | | 34 | | |
Financial Highlights | | | 37 | | |
Notes to Financial Statements | | | 46 | | |
Report of Independent Registered
Public Accounting Firm | | | 56 | | |
Federal Income Tax Information | | | 57 | | |
Trustees and Officers | | | 58 | | |
Board Consideration and Approval of Advisory Agreement | | | 61 | | |
Important Information About This Report | | | 65 | | |
Fund Investment Manager
Columbia Management Investment
Advisers, LLC
225 Franklin Street
Boston, MA 02110
Fund Distributor
Columbia Management Investment
Distributors, Inc.
225 Franklin Street
Boston, MA 02110
Fund Transfer Agent
Columbia Management Investment
Services Corp.
P.O. Box 8081
Boston, MA 02266-8081
For more information about any of the funds, please visit columbiamanagement.com or call 800.345.6611. Customer Service Representatives are available to answer your questions Monday through Friday from 8 a.m. to 8 p.m. Eastern time.
The views expressed in this report reflect the current views of the respective parties. These views are not guarantees of future performance and involve certain risks, uncertainties and assumptions that are difficult to predict, so actual outcomes and results may differ significantly from the views expressed. These views are subject to change at any time based upon economic, market or other conditions and the respective parties disclaim any responsibility to update such views. These views may not be relied on as investment advice and, because investment decisions for a Columbia Fund are based on numerous factors, may not be relied on as an indication of trading intent on behalf of any particular Columbia Fund. References to specific securities should not be construed as a recommendation or investment advice.
Performance Summary
> Columbia Balanced Fund (the Fund) Class A shares returned 13.97% excluding sales charges for the 12-month period that ended August 31, 2013.
> During the 12-month period, the broad U.S. equity market, represented by the S&P 500 Index, returned 18.70% and the broad U.S. fixed-income market, represented by the Barclays U.S. Aggregate Bond Index, returned -2.47%.
> The Fund's results were aided by the strong performance of its equity holdings, which were overweight relative to their neutral target throughout the period.
Average Annual Total Returns (%) (for period ended August 31, 2013)
| | Inception | | 1 Year | | 5 Years | | 10 Years | |
Class A | | 11/01/02 | | | | | | | | | | | | | |
Excluding sales charges | | | | | | | 13.97 | | | | 8.16 | | | | 7.44 | | |
Including sales charges | | | | | | | 7.42 | | | | 6.88 | | | | 6.81 | | |
Class B | | 11/01/02 | | | | | | | | | | | | | |
Excluding sales charges | | | | | | | 13.12 | | | | 7.34 | | | | 6.63 | | |
Including sales charges | | | | | | | 8.12 | | | | 7.04 | | | | 6.63 | | |
Class C* | | 10/13/03 | | | | | | | | | | | | | |
Excluding sales charges | | | | | | | 13.12 | | | | 7.34 | | | | 6.63 | | |
Including sales charges | | | | | | | 12.12 | | | | 7.34 | | | | 6.63 | | |
Class K* | | 03/07/11 | | | 14.11 | | | | 8.20 | | | | 7.47 | | |
Class R* | | 09/27/10 | | | 13.73 | | | | 7.88 | | | | 7.17 | | |
Class R4* | | 11/08/12 | | | 14.28 | | | | 8.41 | | | | 7.71 | | |
Class R5* | | 03/07/11 | | | 14.42 | | | | 8.46 | | | | 7.73 | | |
Class Y* | | 11/08/12 | | | 14.42 | | | | 8.44 | | | | 7.72 | | |
Class Z | | 10/01/91 | | | 14.24 | | | | 8.41 | | | | 7.71 | | |
S&P 500 Index | | | | | | | 18.70 | | | | 7.32 | | | | 7.12 | | |
Barclays U.S. Aggregate Bond Index | | | | | | | -2.47 | | | | 4.93 | | | | 4.77 | | |
Returns for Class A are shown with and without the maximum initial sales charge of 5.75%. Returns for Class B are shown with and without the applicable contingent deferred sales charge (CDSC) of 5.00% in the first year, declining to 1.00% in the sixth year and eliminated thereafter. Returns for Class C are shown with and without the 1.00% CDSC for the first year only. The Fund's other classes are not subject to sales charges and have limited eligibility. Please see the Fund's prospectus for details. Performance for different share classes will vary based on differences in sales charges and fees associated with each class. All results shown assume reinvestment of distributions during the period. Returns do not reflect the deduction of taxes that a shareholder may pay on Fund distributions or on the redemption of Fund shares. Performance results reflect the effect of any fee waivers or reimbursements of Fund expenses by Columbia Management Investment Advisers, LLC and/or any of its affiliates. Absent these fee waivers or expense reimbursement arrangements, performance results would have been lower.
The performance information shown represents past performance and is not a guarantee of future results. The investment return and principal value of your investment will fluctuate so that your shares, when redeemed, may be worth more or less than their original cost. Current performance may be lower or higher than the performance information shown. You may obtain performance information current to the most recent month-end by contacting your financial intermediary, visiting columbiamanagement.com or calling 800.345.6611.
*The returns shown for periods prior to the share class inception date (including returns for the Life of the Fund, if shown, which are since Fund inception) include the returns of the Fund's oldest share class. These returns are adjusted to reflect any higher class-related operating expenses of the newer share classes, as applicable. Please visit columbiamanagement.com/mutual-funds/appended-performance for more information.
The S&P 500 Index, an unmanaged index, measures the performance of 500 widely held, large-capitalization U.S. stocks and is frequently used as a general measure of market performance.
The Barclays U.S. Aggregate Bond Index is a broad-based benchmark that measures the investment grade, U.S. dollar-denominated, fixed-rate taxable bond market, including Treasuries, government-related and corporate securities, mortgage-backed securities (agency fixed-rate and hybrid adjustable-rate mortgage passthroughs), asset-backed securities, and commercial mortgage-backed securities.
Indices are not available for investment, are not professionally managed and do not reflect sales charges, fees, brokerage commissions, taxes or other expenses of investing. Securities in the Fund may not match those in an index.
Annual Report 2013
2
Performance Overview (continued)
Performance of a Hypothetical $10,000 Investment (September 1, 2003 – August 31, 2013)
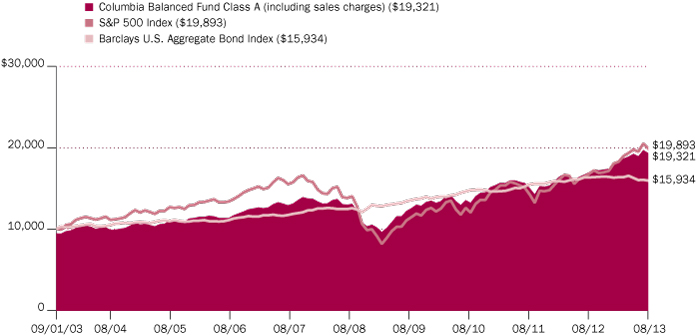
The chart above shows the change in value of a hypothetical $10,000 investment in Class A shares of Columbia Balanced Fund during the stated time period, and does not reflect the deduction of taxes that a shareholder may pay on Fund distributions or on the redemption of Fund shares.
Annual Report 2013
3
Manager Discussion of Fund Performance
For the 12-month period that ended August 31, 2013, the Fund's Class A shares returned 13.97% excluding sales charges. During the 12-month period, the broad U.S. equity market, represented by the S&P 500 Index, returned 18.70% and the broad U.S. fixed-income market, represented by the Barclays U.S. Aggregate Bond Index, returned -2.47%. The Fund's results were aided by the strong performance of its equity holdings, which were overweight relative to their neutral target throughout the period.
U.S. Economy Makes Steady Progress
During the 12-month period ended August 31, 2013, investors faced concerns about the impact of tax increases and enforced federal spending cuts, as well as another showdown over the debt ceiling and the possibility of an attack on Syria. However, economic growth was kept afloat by steady job growth and a solid rebound in the housing market. Pent-up demand, low mortgage rates and an improving labor market all contributed to higher home sales. Manufacturing activity picked up late in the period, and business surveys and recent demand measures suggest that business could be ready to pick up the pace of spending later this year. Against this backdrop, investors bid prices higher on stocks and other riskier assets, as central banks continued to pour liquidity into key markets. However, these sectors pulled back in July and August as the civil war in Syria intensified and the Federal Reserve (the Fed) began to talk about removing some of its support.
Strong Showing by Equities
The equity portion of the Fund's portfolio outperformed the S&P 500 Index during the period. The Fund outpaced the S&P 500 Index within the financials sectors on the strength of its overweights in certain asset managers, including Morgan Stanley, State Street and BlackRock, which benefited from higher asset prices and an upswing in global trading volumes, as well as turnaround stories such as Citigroup. Health care was another profitable area for the Fund. A position in Celgene, which is not included in the S&P 500 Index, aided relative results as the stock nearly doubled during the period, the result of a strong new-product pipeline and a consequently improved outlook for long-term earnings power. An overweight in CIGNA also benefited relative results. CIGNA shares moved sharply higher as investors became more comfortable with the prospects for health maintenance organizations (HMOs) under the Affordable Care Act.
Inevitably, some stocks where the Fund had outsized positions relative to the equity benchmark produced disappointing results. Although Apple has been a successful long-term holding for the Fund, it declined sharply over the past 12 months amid increased competition. International Business Machines also was down, in response to a slowdown in global IT spending. Finally, Philip Morris International not only experienced lower volumes worldwide, it also had to fight the headwind of a stronger U.S. dollar, and its stock posted a slight loss for the period.
Fixed-income Component Outperforms in a Weak Bond Market
The fixed-income portion of the Fund's portfolio outperformed the Barclays U.S. Aggregate Bond Index, which dipped into negative territory for the 12 months. Interest rates moved somewhat higher during the period, but yields remained low
Portfolio Management
Leonard Aplet, CFA
Brian Lavin, CFA
Gregory Liechty
Guy Pope, CFA
Ronald Stahl
Top Ten Holdings (%)
(at August 31, 2013) | |
Apple, Inc. | | | 2.3 | | |
Philip Morris International, Inc. | | | 2.0 | | |
Federal Home Loan
Mortgage Corp.
3.500% 09/01/2043 | | | 1.8
| | |
Google, Inc., Class A | | | 1.8 | | |
Citigroup, Inc. | | | 1.6 | | |
JPMorgan Chase & Co. | | | 1.6 | | |
U.S. Treasury
3.875% 08/15/2040 | | | 1.6
| | |
Johnson & Johnson | | | 1.6 | | |
Berkshire Hathaway, Inc.,
Class B | | | 1.5
| | |
Bank of America Corp. | | | 1.4 | | |
Percentages indicated are based upon total investments (excluding Money Market Funds).
For further detail about these holdings, please refer to the section entitled "Portfolio of Investments."
Fund holdings are as of the date given, are subject to change at any time, and are not recommendations to buy or sell any security.
Annual Report 2013
4
Manager Discussion of Fund Performance (continued)
in absolute terms, and investors were rewarded for seeking extra yields from riskier sectors of the market. The Fund's investments in corporate bonds and commercial mortgage-backed securities aided overall performance. A small position in high-yield bonds also paid off. High-yield issuers have made tremendous progress in reducing their interest burden and increasing liquidity, and default rates have come in below historical norms. In addition, because interest rates rose during the period, the Fund's decision to keep the duration of the portfolio shorter than that of the Barclays U.S. Aggregate Bond Index created a slight performance advantage. Duration is a measure of interest rate sensitivity.
Looking Ahead
We expect some interest rate volatility as the markets continue to assess the strength of the economic recovery while reacting to ongoing geopolitical events and uncertainty about the path of monetary policy. We are mindful that the Fed has signaled its intention to wind down the zero interest rate policy that has been in place since the financial crisis erupted several years ago. The broader equity markets have not historically prospered within such a setting. We believe the Fed is well aware of this sensitivity and would likely move in a very deliberate manner. Within the fixed-income portion of the portfolio, we currently intend to maintain a slightly shorter duration than the Barclays U.S. Aggregate Bond Index while underweighting Treasury securities and emphasizing higher-yielding sectors of the market.
Portfolio Breakdown (%)
(at August 31, 2013) | |
Asset-Backed Securities —
Non-Agency | | | 0.9 | | |
Commercial Mortgage-Backed
Securities — Agency | | | 3.5 | | |
Commercial Mortgage-Backed
Securities — Non-Agency | | | 1.6 | | |
Common Stocks | | | 58.8 | | |
Consumer Discretionary | | | 8.1 | | |
Consumer Staples | | | 6.4 | | |
Energy | | | 5.9 | | |
Financials | | | 10.1 | | |
Health Care | | | 8.1 | | |
Industrials | | | 5.8 | | |
Information Technology | | | 11.7 | | |
Materials | | | 1.0 | | |
Telecommunication Services | | | 1.7 | | |
Corporate Bonds & Notes | | | 10.3 | | |
Foreign Government
Obligations | | | 0.5 | | |
Inflation-Indexed Bonds | | | 0.7 | | |
Money Market Funds | | | 9.8 | | |
Municipal Bonds | | | 0.1 | | |
Residential Mortgage-Backed
Securities — Agency | | | 10.3 | | |
Residential Mortgage-Backed
Securities — Non-Agency | | | 0.4 | | |
Senior Loans | | | 0.1 | | |
U.S. Treasury Obligations | | | 3.0 | | |
Warrants | | | 0.0 | (a) | |
Total | | | 100.0 | | |
Percentages indicated are based upon total investments. The Fund's portfolio composition is subject to change.
(a) Rounds to zero.
Investment Risks
Risks include stock and bond market fluctuations, the credit quality of individual issuers, prepayments and changes in interest rates. When interest rates go up, bond prices typically drop and vice versa. Derivative instruments are financial instruments that have a value dependent on the value of something else, such as one or more underlying securities. Gains or losses may be substantial, because a relatively small price movement in an underlying security may result in a substantial gain or loss. See the Fund's prospectus for information on these and other risks.
Annual Report 2013
5
Understanding Your Fund's Expenses
(Unaudited)
As an investor, you incur two types of costs. There are transaction costs, which generally include sales charges on purchases and may include redemption fees. There are also ongoing costs, which generally include management fees, distribution and service (Rule 12b-1) fees, and other fund expenses. The following information is intended to help you understand your ongoing costs (in dollars) of investing in the Fund and to help you compare these costs with the ongoing costs of investing in other mutual funds.
Analyzing Your Fund's Expenses
To illustrate these ongoing costs, we have provided examples and calculated the expenses paid by investors in each share class of the Fund during the period. The actual and hypothetical information in the table is based on an initial investment of $1,000 at the beginning of the period indicated and held for the entire period. Expense information is calculated two ways and each method provides you with different information. The amount listed in the "Actual" column is calculated using the Fund's actual operating expenses and total return for the period. You may use the Actual information, together with the amount invested, to estimate the expenses that you paid over the period. Simply divide your account value by $1,000 (for example, an $8,600 account value divided by $1,000 = 8.6), then multiply the results by the expenses paid during the period under the Actual column. The amount listed in the "Hypothetical" column assumes a 5% annual rate of return before expenses (which is not the Fund's actual return) and then applies the Fund's actual expense ratio for the period to the hypothetical return. You should not use the hypothetical account values and expenses to estimate either your actual account balance at the end of the period or the expenses you paid during the period. See "Compare With Other Funds" below for details on how to use the hypothetical data.
Compare With Other Funds
Since all mutual funds are required to include the same hypothetical calculations about expenses in shareholder reports, you can use this information to compare the ongoing cost of investing in the Fund with other funds. To do so, compare the hypothetical example with the 5% hypothetical examples that appear in the shareholder reports of other funds. As you compare hypothetical examples of other funds, it is important to note that hypothetical examples are meant to highlight the ongoing costs of investing in a fund only and do not reflect any transaction costs, such as sales charges, or redemption or exchange fees. Therefore, the hypothetical calculations are useful in comparing ongoing costs only, and will not help you determine the relative total costs of owning different funds. If transaction costs were included in these calculations, your costs would be higher.
March 1, 2013 – August 31, 2013
| | Account Value at the Beginning
of the Period ($) | | Account Value at the End of the
Period ($) | | Expenses Paid During the
Period ($) | | Fund's Annualized
Expense Ratio (%) | |
| | Actual | | Hypothetical | | Actual | | Hypothetical | | Actual | | Hypothetical | | Actual | |
Class A | | | 1,000.00 | | | | 1,000.00 | | | | 1,059.00 | | | | 1,019.40 | | | | 5.83 | | | | 5.72 | | | | 1.13 | | |
Class B | | | 1,000.00 | | | | 1,000.00 | | | | 1,055.20 | | | | 1,015.64 | | | | 9.69 | | | | 9.50 | | | | 1.88 | | |
Class C | | | 1,000.00 | | | | 1,000.00 | | | | 1,055.20 | | | | 1,015.64 | | | | 9.69 | | | | 9.50 | | | | 1.88 | | |
Class K | | | 1,000.00 | | | | 1,000.00 | | | | 1,059.70 | | | | 1,019.95 | | | | 5.27 | | | | 5.16 | | | | 1.02 | | |
Class R | | | 1,000.00 | | | | 1,000.00 | | | | 1,057.70 | | | | 1,018.15 | | | | 7.12 | | | | 6.98 | | | | 1.38 | | |
Class R4 | | | 1,000.00 | | | | 1,000.00 | | | | 1,060.30 | | | | 1,020.66 | | | | 4.55 | | | | 4.46 | | | | 0.88 | | |
Class R5 | | | 1,000.00 | | | | 1,000.00 | | | | 1,060.90 | | | | 1,021.26 | | | | 3.93 | | | | 3.85 | | | | 0.76 | | |
Class Y | | | 1,000.00 | | | | 1,000.00 | | | | 1,061.30 | | | | 1,021.56 | | | | 3.62 | | | | 3.55 | | | | 0.70 | | |
Class Z | | | 1,000.00 | | | | 1,000.00 | | | | 1,060.10 | | | | 1,020.66 | | | | 4.54 | | | | 4.46 | | | | 0.88 | | |
Expenses paid during the period are equal to the annualized expense ratio for each class as indicated above, multiplied by the average account value over the period and then multiplied by the number of days in the Fund's most recent fiscal half year and divided by 365.
Expenses do not include fees and expenses incurred indirectly by the Fund from the underlying funds in which the Fund may invest (also referred to as "acquired funds"), including affiliated and non-affiliated pooled investment vehicles (including mutual funds and exchange-traded funds).
Annual Report 2013
6
Portfolio of Investments
August 31, 2013
(Percentages represent value of investments compared to net assets)
Common Stocks 62.3%
Issuer | | Shares | | Value ($) | |
Consumer Discretionary 8.6% | |
Auto Components 0.4% | |
Delphi Automotive PLC | | | 113,465 | | | | 6,242,844 | | |
Automobiles 1.0% | |
General Motors Co.(a) | | | 464,029 | | | | 15,814,108 | | |
Hotels, Restaurants & Leisure 0.5% | |
Wynn Resorts Ltd. | | | 54,551 | | | | 7,693,873 | | |
Household Durables 0.4% | |
Lennar Corp., Class A | | | 186,270 | | | | 5,925,249 | | |
Media 3.6% | |
Comcast Corp., Class A | | | 423,831 | | | | 17,839,047 | | |
DIRECTV(a) | | | 188,157 | | | | 10,946,974 | | |
Discovery Communications, Inc., Class A(a) | | | 121,545 | | | | 9,420,953 | | |
Viacom, Inc., Class B | | | 246,338 | | | | 19,598,651 | | |
Total | | | | | 57,805,625 | | |
Specialty Retail 2.4% | |
Dick's Sporting Goods, Inc. | | | 149,910 | | | | 6,957,323 | | |
Lowe's Companies, Inc. | | | 363,332 | | | | 16,647,872 | | |
Tiffany & Co. | | | 94,440 | | | | 7,282,269 | | |
Ulta Salon Cosmetics & Fragrance, Inc.(a) | | | 69,745 | | | | 6,921,494 | | |
Total | | | | | 37,808,958 | | |
Textiles, Apparel & Luxury Goods 0.3% | |
Nike, Inc., Class B | | | 90,890 | | | | 5,709,710 | | |
Total Consumer Discretionary | | | | | 137,000,367 | | |
Consumer Staples 6.8% | |
Beverages 2.1% | |
Diageo PLC, ADR | | | 109,484 | | | | 13,431,497 | | |
PepsiCo, Inc. | | | 255,823 | | | | 20,396,768 | | |
Total | | | | | 33,828,265 | | |
Food & Staples Retailing 1.6% | |
CVS Caremark Corp. | | | 289,060 | | | | 16,779,933 | | |
Walgreen Co. | | | 169,854 | | | | 8,164,882 | | |
Total | | | | | 24,944,815 | | |
Household Products 1.2% | |
Procter & Gamble Co. (The) | | | 243,939 | | | | 19,000,409 | | |
Tobacco 1.9% | |
Philip Morris International, Inc. | | | 363,169 | | | | 30,302,821 | | |
Total Consumer Staples | | | | | 108,076,310 | | |
Common Stocks (continued)
Issuer | | Shares | | Value ($) | |
Energy 6.2% | |
Energy Equipment & Services 1.4% | |
Halliburton Co. | | | 385,025 | | | | 18,481,200 | | |
Tidewater, Inc. | | | 73,310 | | | | 3,955,807 | | |
Total | | | | | 22,437,007 | | |
Oil, Gas & Consumable Fuels 4.8% | |
Anadarko Petroleum Corp. | | | 117,695 | | | | 10,759,677 | | |
Canadian Natural Resources Ltd. | | | 309,645 | | | | 9,481,330 | | |
Chevron Corp. | | | 175,101 | | | | 21,087,414 | | |
ConocoPhillips | | | 149,994 | | | | 9,944,602 | | |
Exxon Mobil Corp. | | | 163,227 | | | | 14,226,865 | | |
Newfield Exploration Co.(a) | | | 130,435 | | | | 3,106,962 | | |
Noble Energy, Inc. | | | 133,338 | | | | 8,190,953 | | |
Total | | | | | 76,797,803 | | |
Total Energy | | | | | 99,234,810 | | |
Financials 10.7% | |
Capital Markets 2.8% | |
BlackRock, Inc. | | | 56,656 | | | | 14,748,690 | | |
Invesco Ltd. | | | 322,975 | | | | 9,805,521 | | |
Morgan Stanley | | | 305,924 | | | | 7,880,602 | | |
State Street Corp. | | | 171,490 | | | | 11,441,813 | | |
Total | | | | | 43,876,626 | | |
Commercial Banks 1.0% | |
Wells Fargo & Co. | | | 373,706 | | | | 15,351,843 | | |
Diversified Financial Services 4.4% | |
Bank of America Corp. | | | 1,508,375 | | | | 21,298,255 | | |
Citigroup, Inc. | | | 514,337 | | | | 24,857,907 | | |
JPMorgan Chase & Co. | | | 485,973 | | | | 24,556,216 | | |
Total | | | | | 70,712,378 | | |
Insurance 2.5% | |
Aon PLC | | | 254,667 | | | | 16,904,795 | | |
Berkshire Hathaway, Inc., Class B(a) | | | 208,600 | | | | 23,200,492 | | |
Total | | | | | 40,105,287 | | |
Total Financials | | | | | 170,046,134 | | |
Health Care 8.6% | |
Biotechnology 0.7% | |
Ariad Pharmaceuticals, Inc.(a) | | | 221,790 | | | | 4,125,294 | | |
Celgene Corp.(a) | | | 55,176 | | | | 7,723,536 | | |
Total | | | | | 11,848,830 | | |
The accompanying Notes to Financial Statements are an integral part of this statement.
Annual Report 2013
7
Portfolio of Investments (continued)
August 31, 2013
Common Stocks (continued)
Issuer | | Shares | | Value ($) | |
Health Care Equipment & Supplies 2.6% | |
Abbott Laboratories | | | 313,865 | | | | 10,461,121 | | |
Baxter International, Inc. | | | 233,343 | | | | 16,231,339 | | |
Covidien PLC | | | 249,373 | | | | 14,812,756 | | |
Total | | | | | 41,505,216 | | |
Health Care Providers & Services 2.8% | |
Cardinal Health, Inc. | | | 367,426 | | | | 18,474,179 | | |
CIGNA Corp. | | | 164,054 | | | | 12,909,409 | | |
Express Scripts Holding Co.(a) | | | 200,214 | | | | 12,789,671 | | |
Total | | | | | 44,173,259 | | |
Pharmaceuticals 2.5% | |
Johnson & Johnson | | | 278,400 | | | | 24,056,544 | | |
Pfizer, Inc. | | | 290,400 | | | | 8,192,184 | | |
Salix Pharmaceuticals Ltd.(a) | | | 107,675 | | | | 7,207,765 | | |
Total | | | | | 39,456,493 | | |
Total Health Care | | | | | 136,983,798 | | |
Industrials 6.2% | |
Aerospace & Defense 1.9% | |
Honeywell International, Inc. | | | 179,313 | | | | 14,267,935 | | |
United Technologies Corp. | | | 158,839 | | | | 15,899,784 | | |
Total | | | | | 30,167,719 | | |
Air Freight & Logistics 0.7% | |
FedEx Corp. | | | 109,657 | | | | 11,772,776 | | |
Commercial Services & Supplies 0.7% | |
Tyco International Ltd. | | | 318,431 | | | | 10,520,960 | | |
Electrical Equipment 0.9% | |
Eaton Corp. PLC | | | 227,206 | | | | 14,386,684 | | |
Industrial Conglomerates 0.7% | |
General Electric Co. | | | 506,730 | | | | 11,725,732 | | |
Professional Services 0.8% | |
Nielsen Holdings NV | | | 354,702 | | | | 12,237,219 | | |
Road & Rail 0.5% | |
Union Pacific Corp. | | | 49,820 | | | | 7,649,363 | | |
Total Industrials | | | | | 98,460,453 | | |
Information Technology 12.4% | |
Communications Equipment 1.0% | |
QUALCOMM, Inc. | | | 249,514 | | | | 16,537,788 | | |
Common Stocks (continued)
Issuer | | Shares | | Value ($) | |
Computers & Peripherals 3.4% | |
Apple, Inc. | | | 73,020 | | | | 35,564,391 | | |
EMC Corp. | | | 492,525 | | | | 12,697,295 | | |
Hewlett-Packard Co. | | | 226,851 | | | | 5,067,851 | | |
Total | | | | | 53,329,537 | | |
Internet Software & Services 3.3% | |
Baidu, Inc., ADR(a) | | | 33,420 | | | | 4,529,413 | | |
eBay, Inc.(a) | | | 287,801 | | | | 14,387,172 | | |
Facebook, Inc., Class A(a) | | | 170,108 | | | | 7,022,058 | | |
Google, Inc., Class A(a) | | | 31,784 | | | | 26,917,870 | | |
Total | | | | | 52,856,513 | | |
IT Services 1.1% | |
International Business Machines Corp. | | | 16,915 | | | | 3,083,097 | | |
Mastercard, Inc., Class A | | | 24,587 | | | | 14,901,689 | | |
Total | | | | | 17,984,786 | | |
Semiconductors & Semiconductor Equipment 0.4% | |
Skyworks Solutions, Inc.(a) | | | 225,123 | | | | 5,709,119 | | |
Software 3.2% | |
Activision Blizzard, Inc. | | | 509,265 | | | | 8,311,205 | | |
Citrix Systems, Inc.(a) | | | 88,418 | | | | 6,257,342 | | |
Electronic Arts, Inc.(a) | | | 596,987 | | | | 15,903,734 | | |
Intuit, Inc. | | | 239,625 | | | | 15,223,376 | | |
Microsoft Corp. | | | 159,889 | | | | 5,340,292 | | |
Total | | | | | 51,035,949 | | |
Total Information Technology | | | | | 197,453,692 | | |
Materials 1.0% | |
Chemicals 1.0% | |
Celanese Corp., Class A | | | 54,405 | | | | 2,678,902 | | |
Dow Chemical Co. (The) | | | 375,462 | | | | 14,042,279 | | |
Total | | | | | 16,721,181 | | |
Total Materials | | | | | 16,721,181 | | |
Telecommunication Services 1.8% | |
Diversified Telecommunication Services 1.2% | |
AT&T, Inc. | | | 563,445 | | | | 19,061,344 | | |
Wireless Telecommunication Services 0.6% | |
Vodafone Group PLC, ADR | | | 276,546 | | | | 8,946,263 | | |
Total Telecommunication Services | | | | | 28,007,607 | | |
Total Common Stocks
(Cost: $743,852,217) | | | | | 991,984,352 | | |
The accompanying Notes to Financial Statements are an integral part of this statement.
Annual Report 2013
8
Portfolio of Investments (continued)
August 31, 2013
Corporate Bonds & Notes 10.9%
Issuer | | Coupon
Rate | | Principal
Amount ($) | | Value ($) | |
Aerospace & Defense 0.1% | |
ADS Tactical, Inc.
Senior Secured(b)
04/01/18 | | | 11.000 | % | | | 102,000 | | | | 95,880 | | |
Bombardier, Inc.
Senior Notes(b)
01/15/23 | | | 6.125 | % | | | 60,000 | | | | 58,650 | | |
Huntington Ingalls Industries, Inc.
03/15/18 | | | 6.875 | % | | | 52,000 | | | | 56,030 | | |
Kratos Defense & Security Solutions, Inc.
Senior Secured
06/01/17 | | | 10.000 | % | | | 187,000 | | | | 201,960 | | |
L-3 Communications Corp.
02/15/21 | | | 4.950 | % | | | 1,250,000 | | | | 1,313,524 | | |
TransDigm, Inc.
10/15/20 | | | 5.500 | % | | | 30,000 | | | | 29,250 | | |
TransDigm, Inc.(b)
07/15/21 | | | 7.500 | % | | | 54,000 | | | | 57,105 | | |
Total | | | | | | | 1,812,399 | | |
Automotive 0.1% | |
Allison Transmission, Inc.(b)
05/15/19 | | | 7.125 | % | | | 76,000 | | | | 80,560 | | |
American Axle & Manufacturing, Inc.
03/15/21 | | | 6.250 | % | | | 43,000 | | | | 43,752 | | |
Chrysler Group LLC/Co-Issuer, Inc.
Secured
06/15/19 | | | 8.000 | % | | | 64,000 | | | | 69,520 | | |
Delphi Corp.
05/15/19 | | | 5.875 | % | | | 35,000 | | | | 37,100 | | |
02/15/23 | | | 5.000 | % | | | 18,000 | | | | 18,293 | | |
Ford Motor Credit Co. LLC
Senior Unsecured
01/16/18 | | | 2.375 | % | | | 1,475,000 | | | | 1,435,317 | | |
General Motors Financial Co., Inc.(b)
Senior Unsecured
05/15/18 | | | 3.250 | % | | | 13,000 | | | | 12,480 | | |
05/15/23 | | | 4.250 | % | | | 19,000 | | | | 17,100 | | |
Jaguar Land Rover Automotive PLC(b)
02/01/23 | | | 5.625 | % | | | 59,000 | | | | 56,787 | | |
Schaeffler Finance BV
Senior Secured(b)
02/15/19 | | | 8.500 | % | | | 45,000 | | | | 50,569 | | |
Visteon Corp.
04/15/19 | | | 6.750 | % | | | 108,000 | | | | 114,480 | | |
Total | | | | | | | 1,935,958 | | |
Corporate Bonds & Notes (continued)
Issuer | | Coupon
Rate | | Principal
Amount ($) | | Value ($) | |
Banking 2.0% | |
Ally Financial, Inc.
02/15/17 | | | 5.500 | % | | | 54,000 | | | | 56,923 | | |
03/15/20 | | | 8.000 | % | | | 250,000 | | | | 287,813 | | |
BB&T Corp.
Senior Unsecured(c)
04/28/14 | | | 0.964 | % | | | 1,500,000 | | | | 1,502,943 | | |
BNP Paribas SA
Senior Unsecured
08/20/18 | | | 2.700 | % | | | 1,750,000 | | | | 1,742,940 | | |
Bank of America Corp.
Senior Unsecured
01/05/21 | | | 5.875 | % | | | 1,100,000 | | | | 1,226,267 | | |
Bear Stearns Companies LLC (The)
Senior Unsecured
02/01/18 | | | 7.250 | % | | | 2,620,000 | | | | 3,114,632 | | |
Capital One Financial Corp.
Senior Unsecured
07/15/21 | | | 4.750 | % | | | 1,395,000 | | | | 1,467,882 | | |
Citigroup, Inc.
Senior Unsecured
05/15/18 | | | 6.125 | % | | | 2,285,000 | | | | 2,621,537 | | |
Goldman Sachs Group, Inc. (The)
Senior Unsecured
01/18/18 | | | 5.950 | % | | | 2,075,000 | | | | 2,321,363 | | |
HSBC Holdings PLC
Senior Unsecured
04/05/21 | | | 5.100 | % | | | 1,500,000 | | | | 1,639,877 | | |
ING Bank NV
Senior Unsecured(b)(c)
09/25/15 | | | 1.913 | % | | | 1,575,000 | | | | 1,605,561 | | |
KeyCorp
Senior Unsecured
03/24/21 | | | 5.100 | % | | | 1,075,000 | | | | 1,178,617 | | |
Lloyds TSB Bank PLC
Bank Guaranteed
01/21/21 | | | 6.375 | % | | | 1,475,000 | | | | 1,702,651 | | |
Merrill Lynch & Co., Inc.
Senior Unsecured
04/25/18 | | | 6.875 | % | | | 2,100,000 | | | | 2,442,191 | | |
Morgan Stanley
04/01/18 | | | 6.625 | % | | | 1,625,000 | | | | 1,862,356 | | |
PNC Financial Services Group, Inc. (The)
Senior Unsecured(c)
11/09/22 | | | 2.854 | % | | | 2,135,000 | | | | 1,948,190 | | |
Synovus Financial Corp.
Senior Unsecured
02/15/19 | | | 7.875 | % | | | 113,000 | | | | 129,668 | | |
The accompanying Notes to Financial Statements are an integral part of this statement.
Annual Report 2013
9
Portfolio of Investments (continued)
August 31, 2013
Corporate Bonds & Notes (continued)
Issuer | | Coupon
Rate | | Principal
Amount ($) | | Value ($) | |
U.S. Bank
Subordinated Notes(c)
04/29/20 | | | 3.778 | % | | | 2,200,000 | | | | 2,296,494 | | |
Wells Fargo & Co.
Subordinated Notes
02/13/23 | | | 3.450 | % | | | 2,715,000 | | | | 2,531,610 | | |
Total | | | | | | | 31,679,515 | | |
Brokerage —% | |
E*TRADE Financial Corp.
Senior Unsecured
11/15/19 | | | 6.375 | % | | | 64,000 | | | | 67,200 | | |
Nuveen Investments, Inc.(b)
Senior Unsecured
10/15/17 | | | 9.125 | % | | | 16,000 | | | | 15,760 | | |
10/15/20 | | | 9.500 | % | | | 91,000 | | | | 89,408 | | |
Total | | | | | | | 172,368 | | |
Building Materials —% | |
American Builders & Contractors Supply Co., Inc.
Senior Unsecured(b)
04/15/21 | | | 5.625 | % | | | 57,000 | | | | 55,290 | | |
Gibraltar Industries, Inc.(b)
02/01/21 | | | 6.500 | % | | | 19,000 | | | | 19,285 | | |
HD Supply, Inc.
Secured
04/15/20 | | | 11.000 | % | | | 33,000 | | | | 39,435 | | |
HD Supply, Inc.(b)
Senior Unsecured
07/15/20 | | | 7.500 | % | | | 77,000 | | | | 80,465 | | |
Nortek, Inc.
12/01/18 | | | 10.000 | % | | | 10,000 | | | | 10,950 | | |
04/15/21 | | | 8.500 | % | | | 69,000 | | | | 74,692 | | |
Total | | | | | | | 280,117 | | |
Chemicals 0.2% | |
Celanese U.S. Holdings LLC
06/15/21 | | | 5.875 | % | | | 79,000 | | | | 80,975 | | |
Dow Chemical Co. (The)
Senior Unsecured
11/01/29 | | | 7.375 | % | | | 778,000 | | | | 995,705 | | |
Eastman Chemical Co.
Senior Unsecured
06/01/17 | | | 2.400 | % | | | 1,650,000 | | | | 1,658,357 | | |
Huntsman International LLC
11/15/20 | | | 4.875 | % | | | 29,000 | | | | 27,623 | | |
03/15/21 | | | 8.625 | % | | | 8,000 | | | | 8,920 | | |
JM Huber Corp.
Senior Notes(b)
11/01/19 | | | 9.875 | % | | | 90,000 | | | | 100,687 | | |
Corporate Bonds & Notes (continued)
Issuer | | Coupon
Rate | | Principal
Amount ($) | | Value ($) | |
Koppers, Inc.
12/01/19 | | | 7.875 | % | | | 14,000 | | | | 15,050 | | |
Momentive Performance Materials, Inc.
Senior Secured
10/15/20 | | | 8.875 | % | | | 89,000 | | | | 92,560 | | |
10/15/20 | | | 10.000 | % | | | 13,000 | | | | 13,423 | | |
NOVA Chemicals Corp.
Senior Unsecured(b)
08/01/23 | | | 5.250 | % | | | 38,000 | | | | 37,905 | | |
Nova Chemicals Corp.
Senior Unsecured
11/01/19 | | | 8.625 | % | | | 57,000 | | | | 63,127 | | |
PQ Corp.
Secured(b)
05/01/18 | | | 8.750 | % | | | 239,000 | | | | 250,950 | | |
U.S. Coatings Acquisition, Inc./Axalta Coating
Systems Dutch Holding B BV(b)
05/01/21 | | | 7.375 | % | | | 59,000 | | | | 60,623 | | |
Total | | | | | | | 3,405,905 | | |
Construction Machinery 0.1% | |
Case New Holland, Inc.
12/01/17 | | | 7.875 | % | | | 173,000 | | | | 198,950 | | |
Caterpillar Financial Services Corp.
Senior Unsecured
06/01/22 | | | 2.850 | % | | | 1,205,000 | | | | 1,137,791 | | |
Columbus McKinnon Corp.
02/01/19 | | | 7.875 | % | | | 87,000 | | | | 91,350 | | |
H&E Equipment Services, Inc.
09/01/22 | | | 7.000 | % | | | 9,000 | | | | 9,563 | | |
Neff Rental LLC/Finance Corp.
Secured(b)
05/15/16 | | | 9.625 | % | | | 102,000 | | | | 108,120 | | |
United Rentals North America, Inc.
05/15/20 | | | 7.375 | % | | | 45,000 | | | | 48,488 | | |
04/15/22 | | | 7.625 | % | | | 114,000 | | | | 122,550 | | |
Secured
07/15/18 | | | 5.750 | % | | | 55,000 | | | | 58,712 | | |
Total | | | | | | | 1,775,524 | | |
Consumer Cyclical Services —% | |
Corrections Corp. of America
05/01/23 | | | 4.625 | % | | | 39,000 | | | | 36,270 | | |
GNET Escrow Corp.
Senior Secured(b)
07/01/18 | | | 12.125 | % | | | 37,000 | | | | 39,405 | | |
Goodman Networks, Inc.
Senior Secured(b)
07/01/18 | | | 13.125 | % | | | 75,000 | | | | 79,500 | | |
The accompanying Notes to Financial Statements are an integral part of this statement.
Annual Report 2013
10
Portfolio of Investments (continued)
August 31, 2013
Corporate Bonds & Notes (continued)
Issuer | | Coupon
Rate | | Principal
Amount ($) | | Value ($) | |
Monitronics International, Inc.
04/01/20 | | | 9.125 | % | | | 37,000 | | | | 38,203 | | |
Monitronics International, Inc.(b)
Senior Unsecured
04/01/20 | | | 9.125 | % | | | 25,000 | | | | 25,875 | | |
Vivint, Inc.(b)
Senior Secured
12/01/19 | | | 6.375 | % | | | 123,000 | | | | 115,927 | | |
Senior Unsecured
12/01/20 | | | 8.750 | % | | | 118,000 | | | | 116,230 | | |
Total | | | | | | | 451,410 | | |
Consumer Products 0.1% | |
Clorox Co. (The)
Senior Unsecured
09/15/22 | | | 3.050 | % | | | 775,000 | | | | 729,839 | | |
Libbey Glass, Inc.
Senior Secured
05/15/20 | | | 6.875 | % | | | 27,000 | | | | 28,856 | | |
Serta Simmons Holdings LLC
Senior Unsecured(b)
10/01/20 | | | 8.125 | % | | | 106,000 | | | | 111,300 | | |
Spectrum Brands Escrow Corp.(b)
11/15/20 | | | 6.375 | % | | | 56,000 | | | | 57,960 | | |
Spectrum Brands, Inc.
03/15/20 | | | 6.750 | % | | | 114,000 | | | | 120,270 | | |
Springs Window Fashions LLC
Senior Secured(b)
06/01/21 | | | 6.250 | % | | | 74,000 | | | | 73,075 | | |
Total | | | | | | | 1,121,300 | | |
Diversified Manufacturing 0.1% | |
Amsted Industries, Inc.
Senior Notes(b)
03/15/18 | | | 8.125 | % | | | 109,000 | | | | 114,995 | | |
Gardner Denver, Inc.
Senior Unsecured(b)
08/15/21 | | | 6.875 | % | | | 96,000 | | | | 93,840 | | |
Hamilton Sundstrand Corp(b)
12/15/20 | | | 7.750 | % | | | 66,000 | | | | 68,310 | | |
United Technologies Corp.
Senior Unsecured
06/01/22 | | | 3.100 | % | | | 1,550,000 | | | | 1,510,563 | | |
Total | | | | | | | 1,787,708 | | |
Electric 0.9% | |
Arizona Public Service Co.
Senior Unsecured
04/01/42 | | | 4.500 | % | | | 925,000 | | | | 888,321 | | |
Corporate Bonds & Notes (continued)
Issuer | | Coupon
Rate | | Principal
Amount ($) | | Value ($) | |
CMS Energy Corp.
Senior Unsecured
02/01/20 | | | 6.250 | % | | | 1,200,000 | | | | 1,378,272 | | |
Calpine Corp.
Senior Secured(b)
02/15/21 | | | 7.500 | % | | | 87,000 | | | | 92,002 | | |
Commonwealth Edison Co.
1st Mortgage
09/15/17 | | | 6.150 | % | | | 775,000 | | | | 901,884 | | |
DTE Energy Co.
Senior Unsecured
04/15/33 | | | 6.375 | % | | | 340,000 | | | | 390,786 | | |
Dominion Resources, Inc.
Senior Unsecured
08/15/19 | | | 5.200 | % | | | 1,263,000 | | | | 1,426,618 | | |
FirstEnergy Corp.
Senior Unsecured
03/15/23 | | | 4.250 | % | | | 1,350,000 | | | | 1,226,208 | | |
GenOn Energy, Inc.
Senior Unsecured
10/15/18 | | | 9.500 | % | | | 119,000 | | | | 134,470 | | |
Indiana Michigan Power Co.
Senior Unsecured
03/15/37 | | | 6.050 | % | | | 700,000 | | | | 770,612 | | |
Nevada Power Co.
08/01/18 | | | 6.500 | % | | | 900,000 | | | | 1,073,727 | | |
PPL Capital Funding, Inc.
06/01/23 | | | 3.400 | % | | | 1,925,000 | | | | 1,804,443 | | |
Pacific Gas & Electric Co.
Senior Unsecured
03/01/37 | | | 5.800 | % | | | 900,000 | | | | 994,214 | | |
Progress Energy, Inc.
Senior Unsecured
03/01/31 | | | 7.750 | % | | | 955,000 | | | | 1,233,135 | | |
TransAlta Corp.
Senior Unsecured
01/15/15 | | | 4.750 | % | | | 1,360,000 | | | | 1,423,769 | | |
Total | | | | | | | 13,738,461 | | |
Entertainment —% | |
AMC Entertainment, Inc.
06/01/19 | | | 8.750 | % | | | 87,000 | | | | 93,525 | | |
12/01/20 | | | 9.750 | % | | | 6,000 | | | | 6,855 | | |
Cedar Fair LP/Canada's Wonderland Co./Magnum
Management Corp.(b)
03/15/21 | | | 5.250 | % | | | 48,000 | | | | 45,840 | | |
Total | | | | | | | 146,220 | | |
The accompanying Notes to Financial Statements are an integral part of this statement.
Annual Report 2013
11
Portfolio of Investments (continued)
August 31, 2013
Corporate Bonds & Notes (continued)
Issuer | | Coupon
Rate | | Principal
Amount ($) | | Value ($) | |
Environmental 0.1% | |
Waste Management, Inc.
03/11/19 | | | 7.375 | % | | | 1,365,000 | | | | 1,639,061 | | |
Food and Beverage 0.6% | |
ARAMARK Corp.(b)
03/15/20 | | | 5.750 | % | | | 22,000 | | | | 22,440 | | |
Anheuser-Busch InBev Worldwide, Inc.(c)
07/14/14 | | | 0.628 | % | | | 1,450,000 | | | | 1,454,096 | | |
B&G Foods, Inc.
06/01/21 | | | 4.625 | % | | | 94,000 | | | | 87,303 | | |
Bacardi Ltd.(b)
04/01/14 | | | 7.450 | % | | | 95,000 | | | | 98,554 | | |
ConAgra Foods, Inc.
Senior Unsecured
09/15/22 | | | 3.250 | % | | | 1,200,000 | | | | 1,141,189 | | |
Constellation Brands Inc.
Senior Unsecured
05/01/21 | | | 3.750 | % | | | 27,000 | | | | 24,975 | | |
05/01/23 | | | 4.250 | % | | | 38,000 | | | | 34,865 | | |
Cott Beverages, Inc.
09/01/18 | | | 8.125 | % | | | 9,000 | | | | 9,664 | | |
Diageo Capital PLC
04/29/23 | | | 2.625 | % | | | 1,345,000 | | | | 1,229,643 | | |
Kraft Foods Group, Inc.
Senior Unsecured
06/06/22 | | | 3.500 | % | | | 1,400,000 | | | | 1,369,007 | | |
Mondelez International, Inc.
Senior Unsecured
02/10/20 | | | 5.375 | % | | | 1,000,000 | | | | 1,117,531 | | |
PepsiCo, Inc.
Senior Unsecured
03/05/22 | | | 2.750 | % | | | 1,540,000 | | | | 1,450,380 | | |
SABMiller Holdings, Inc.(b)
01/15/22 | | | 3.750 | % | | | 1,465,000 | | | | 1,470,268 | | |
Shearer's Foods, Inc. LLC
Senior Secured(b)
11/01/19 | | | 9.000 | % | | | 18,000 | | | | 18,945 | | |
Total | | | | | | | 9,528,860 | | |
Gaming 0.1% | |
Boyd Gaming Corp.
07/01/20 | | | 9.000 | % | | | 12,000 | | | | 12,870 | | |
Caesars Entertainment Operating Co., Inc.
Senior Secured
02/15/20 | | | 8.500 | % | | | 50,000 | | | | 47,750 | | |
02/15/20 | | | 9.000 | % | | | 51,000 | | | | 48,960 | | |
Corporate Bonds & Notes (continued)
Issuer | | Coupon
Rate | | Principal
Amount ($) | | Value ($) | |
MGM Resorts International
03/01/18 | | | 11.375 | % | | | 71,000 | | | | 88,750 | | |
10/01/20 | | | 6.750 | % | | | 8,000 | | | | 8,160 | | |
12/15/21 | | | 6.625 | % | | | 37,000 | | | | 37,555 | | |
PNK Finance Corp.(b)
08/01/21 | | | 6.375 | % | | | 105,000 | | | | 104,737 | | |
Pinnacle Entertainment, Inc.
04/01/22 | | | 7.750 | % | | | 3,000 | | | | 3,113 | | |
ROC Finance LLC/Corp.
Secured(b)
09/01/18 | | | 12.125 | % | | | 132,000 | | | | 146,850 | | |
Seminole Indian Tribe of Florida
Senior Secured(b)
10/01/20 | | | 6.535 | % | | | 51,000 | | | | 54,060 | | |
Seneca Gaming Corp.(b)
12/01/18 | | | 8.250 | % | | | 90,000 | | | | 96,300 | | |
SugarHouse HSP Gaming LP/Finance Corp.
Senior Secured(b)
06/01/21 | | | 6.375 | % | | | 60,000 | | | | 57,000 | | |
Tunica-Biloxi Gaming Authority
Senior Unsecured(b)
11/15/15 | | | 9.000 | % | | | 25,000 | | | | 22,625 | | |
Total | | | | | | | 728,730 | | |
Gas Distributors —% | |
Sempra Energy
Senior Unsecured
10/01/22 | | | 2.875 | % | | | 785,000 | | | | 725,187 | | |
Gas Pipelines 0.5% | |
Access Midstream Partners LP/Finance Corp.
04/15/21 | | | 5.875 | % | | | 46,000 | | | | 47,265 | | |
05/15/23 | | | 4.875 | % | | | 106,000 | | | | 98,580 | | |
El Paso LLC
Senior Secured
09/15/20 | | | 6.500 | % | | | 194,000 | | | | 204,842 | | |
El Paso Pipeline Partners Operating Co. LLC
11/15/40 | | | 7.500 | % | | | 760,000 | | | | 935,007 | | |
Enterprise Products Operating LLC
02/01/41 | | | 5.950 | % | | | 1,025,000 | | | | 1,127,788 | | |
Hiland Partners LP/Finance Corp.(b)
10/01/20 | | | 7.250 | % | | | 155,000 | | | | 160,812 | | |
MarkWest Energy Partners LP/Finance Corp.
06/15/22 | | | 6.250 | % | | | 74,000 | | | | 77,330 | | |
02/15/23 | | | 5.500 | % | | | 99,000 | | | | 97,267 | | |
NiSource Finance Corp.
02/15/44 | | | 4.800 | % | | | 1,045,000 | | | | 946,737 | | |
Regency Energy Partners LP/Finance Corp.
07/15/21 | | | 6.500 | % | | | 105,000 | | | | 111,300 | | |
04/15/23 | | | 5.500 | % | | | 115,000 | | | | 110,975 | | |
The accompanying Notes to Financial Statements are an integral part of this statement.
Annual Report 2013
12
Portfolio of Investments (continued)
August 31, 2013
Corporate Bonds & Notes (continued)
Issuer | | Coupon
Rate | | Principal
Amount ($) | | Value ($) | |
Regency Energy Partners LP/Finance Corp.(b)
11/01/23 | | | 4.500 | % | | | 40,000 | | | | 35,700 | | |
Sabine Pass Liquefaction LLC
Senior Secured(b)
02/01/21 | | | 5.625 | % | | | 69,000 | | | | 65,895 | | |
Southern Natural Gas Co. LLC
Senior Unsecured(b)
04/01/17 | | | 5.900 | % | | | 916,000 | | | | 1,034,245 | | |
TransCanada PipeLines Ltd.(c)
05/15/67 | | | 6.350 | % | | | 245,000 | | | | 254,800 | | |
Senior Unsecured
06/30/16 | | | 0.953 | % | | | 1,800,000 | | | | 1,811,065 | | |
Williams Partners LP/Finance Corp.
Senior Unsecured
02/01/17 | | | 7.250 | % | | | 1,090,000 | | | | 1,265,050 | | |
Total | | | | | | | 8,384,658 | | |
Health Care 0.3% | |
Amsurg Corp.
11/30/20 | | | 5.625 | % | | | 29,000 | | | | 29,290 | | |
Biomet, Inc.
08/01/20 | | | 6.500 | % | | | 123,000 | | | | 126,075 | | |
CHS/Community Health Systems, Inc.
11/15/19 | | | 8.000 | % | | | 65,000 | | | | 68,250 | | |
Senior Secured
08/15/18 | | | 5.125 | % | | | 112,000 | | | | 114,520 | | |
Cardinal Health, Inc.
Senior Unsecured
12/15/20 | | | 4.625 | % | | | 1,075,000 | | | | 1,149,979 | | |
ConvaTec Finance International SA
Senior Unsecured(b)
01/15/19 | | | 8.250 | % | | | 70,000 | | | | 68,950 | | |
ConvaTec Healthcare E SA
Senior Unsecured(b)
12/15/18 | | | 10.500 | % | | | 123,000 | | | | 137,760 | | |
DaVita HealthCare Partners, Inc.
08/15/22 | | | 5.750 | % | | | 84,000 | | | | 83,160 | | |
Emdeon, Inc.
12/31/19 | | | 11.000 | % | | | 84,000 | | | | 95,340 | | |
Express Scripts Holding Co.
11/15/21 | | | 4.750 | % | | | 1,000,000 | | | | 1,061,303 | | |
Fresenius Medical Care U.S. Finance II, Inc.(b)
07/31/19 | | | 5.625 | % | | | 27,000 | | | | 27,810 | | |
01/31/22 | | | 5.875 | % | | | 34,000 | | | | 34,595 | | |
Fresenius Medical Care U.S. Finance, Inc.(b)
09/15/18 | | | 6.500 | % | | | 55,000 | | | | 59,950 | | |
02/15/21 | | | 5.750 | % | | | 62,000 | | | | 63,395 | | |
Corporate Bonds & Notes (continued)
Issuer | | Coupon
Rate | | Principal
Amount ($) | | Value ($) | |
HCA Holdings, Inc.
Senior Unsecured
02/15/21 | | | 6.250 | % | | | 114,000 | | | | 114,285 | | |
HCA, Inc.
02/15/22 | | | 7.500 | % | | | 104,000 | | | | 113,100 | | |
Senior Secured
02/15/20 | | | 6.500 | % | | | 110,000 | | | | 118,112 | | |
05/01/23 | | | 4.750 | % | | | 11,000 | | | | 10,271 | | |
Healthcare Technology Intermediate, Inc.
Senior Unsecured(b)
09/01/18 | | | 7.375 | % | | | 43,000 | | | | 43,591 | | |
Hologic, Inc.
08/01/20 | | | 6.250 | % | | | 16,000 | | | | 16,680 | | |
IASIS Healthcare LLC/Capital Corp.
05/15/19 | | | 8.375 | % | | | 53,000 | | | | 55,518 | | |
IMS Health, Inc.
Senior Unsecured(b)
11/01/20 | | | 6.000 | % | | | 47,000 | | | | 48,234 | | |
Kinetic Concepts, Inc./KCI U.S.A., Inc.
Secured
11/01/18 | | | 10.500 | % | | | 40,000 | | | | 43,950 | | |
MPH Intermediate Holding Co. 2
Senior Unsecured PIK(b)
08/01/18 | | | 8.375 | % | | | 49,000 | | | | 49,980 | | |
McKesson Corp.
Senior Unsecured
03/01/21 | | | 4.750 | % | | | 965,000 | | | | 1,043,918 | | |
Physio-Control International, Inc.
Senior Secured(b)
01/15/19 | | | 9.875 | % | | | 43,000 | | | | 47,515 | | |
Radnet Management, Inc.
04/01/18 | | | 10.375 | % | | | 32,000 | | | | 33,920 | | |
STHI Holding Corp.
Secured(b)
03/15/18 | | | 8.000 | % | | | 54,000 | | | | 58,320 | | |
Tenet Healthcare Corp.
Senior Secured
06/01/20 | | | 4.750 | % | | | 84,000 | | | | 79,485 | | |
Tenet Healthcare Corp.(b)
Senior Secured
04/01/21 | | | 4.500 | % | | | 24,000 | | | | 22,080 | | |
Truven Health Analytics, Inc.
06/01/20 | | | 10.625 | % | | | 40,000 | | | | 42,500 | | |
United Surgical Partners International, Inc.
04/01/20 | | | 9.000 | % | | | 54,000 | | | | 59,535 | | |
Universal Hospital Services, Inc.
Secured
08/15/20 | | | 7.625 | % | | | 3,000 | | | | 3,120 | | |
Total | | | | | | | 5,124,491 | | |
The accompanying Notes to Financial Statements are an integral part of this statement.
Annual Report 2013
13
Portfolio of Investments (continued)
August 31, 2013
Corporate Bonds & Notes (continued)
Issuer | | Coupon
Rate | | Principal
Amount ($) | | Value ($) | |
Healthcare Insurance 0.1% | |
Cigna Corp.
Senior Unsecured
06/15/20 | | | 5.125 | % | | | 1,025,000 | | | | 1,119,558 | | |
Home Construction —% | |
Ashton Woods U.S.A. LLC/Finance Co.(b)
02/15/21 | | | 6.875 | % | | | 8,000 | | | | 7,920 | | |
Beazer Homes USA, Inc.
05/15/19 | | | 9.125 | % | | | 29,000 | | | | 30,668 | | |
02/01/23 | | | 7.250 | % | | | 25,000 | | | | 25,250 | | |
Brookfield Residential Properties, Inc./U.S. Corp.(b)
07/01/22 | | | 6.125 | % | | | 26,000 | | | | 25,675 | | |
KB Home
03/15/20 | | | 8.000 | % | | | 35,000 | | | | 37,888 | | |
09/15/22 | | | 7.500 | % | | | 10,000 | | | | 10,425 | | |
Meritage Homes Corp.
03/01/18 | | | 4.500 | % | | | 49,000 | | | | 48,387 | | |
04/01/22 | | | 7.000 | % | | | 30,000 | | | | 32,100 | | |
Shea Homes LP/Funding Corp.
Senior Secured
05/15/19 | | | 8.625 | % | | | 83,000 | | | | 91,092 | | |
Standard Pacific Corp.
12/15/21 | | | 6.250 | % | | | 79,000 | | | | 79,197 | | |
Taylor Morrison Communities, Inc./Monarch, Inc.(b)
04/15/21 | | | 5.250 | % | | | 37,000 | | | | 34,965 | | |
Woodside Homes Co., LLC/Finance, Inc.
Senior Unsecured(b)
12/15/21 | | | 6.750 | % | | | 30,000 | | | | 29,850 | | |
Total | | | | | | | 453,417 | | |
Independent Energy 0.7% | |
Anadarko Petroleum Corp.
Senior Unsecured
09/15/16 | | | 5.950 | % | | | 1,265,000 | | | | 1,418,756 | | |
Antero Resources Finance Corp.
08/01/19 | | | 7.250 | % | | | 17,000 | | | | 17,850 | | |
Athlon Holdings LP/Finance Corp.(b)
04/15/21 | | | 7.375 | % | | | 92,000 | | | | 92,920 | | |
Aurora U.S.A. Oil & Gas, Inc.(b)
04/01/20 | | | 7.500 | % | | | 138,000 | | | | 136,620 | | |
Carrizo Oil & Gas, Inc.
10/15/18 | | | 8.625 | % | | | 116,000 | | | | 126,150 | | |
Chesapeake Energy Corp.
08/15/20 | | | 6.625 | % | | | 195,000 | | | | 209,137 | | |
02/15/21 | | | 6.125 | % | | | 95,000 | | | | 98,800 | | |
03/15/23 | | | 5.750 | % | | | 56,000 | | | | 55,720 | | |
Comstock Resources, Inc.
06/15/20 | | | 9.500 | % | | | 92,000 | | | | 99,820 | | |
Corporate Bonds & Notes (continued)
Issuer | | Coupon
Rate | | Principal
Amount ($) | | Value ($) | |
Concho Resources, Inc.
01/15/21 | | | 7.000 | % | | | 151,000 | | | | 165,722 | | |
01/15/22 | | | 6.500 | % | | | 19,000 | | | | 20,140 | | |
04/01/23 | | | 5.500 | % | | | 52,000 | | | | 50,440 | | |
Continental Resources, Inc.
10/01/19 | | | 8.250 | % | | | 1,000 | | | | 1,100 | | |
04/01/21 | | | 7.125 | % | | | 53,000 | | | | 58,300 | | |
09/15/22 | | | 5.000 | % | | | 296,000 | | | | 298,960 | | |
04/15/23 | | | 4.500 | % | | | 115,000 | | | | 112,987 | | |
Devon Energy Corp.
Senior Unsecured
05/15/17 | | | 1.875 | % | | | 1,200,000 | | | | 1,183,802 | | |
EP Energy LLC/Everest Acquisition Finance, Inc.
09/01/22 | | | 7.750 | % | | | 13,000 | | | | 13,910 | | |
EP Energy LLC/Finance, Inc.
Senior Unsecured
05/01/20 | | | 9.375 | % | | | 51,000 | | | | 56,164 | | |
EnCana Corp.
Senior Unsecured
11/15/21 | | | 3.900 | % | | | 1,375,000 | | | | 1,362,650 | | |
Halcon Resources Corp.
05/15/21 | | | 8.875 | % | | | 76,000 | | | | 76,190 | | |
Kodiak Oil & Gas Corp.
12/01/19 | | | 8.125 | % | | | 222,000 | | | | 243,090 | | |
Kodiak Oil & Gas Corp.(b)
01/15/21 | | | 5.500 | % | | | 86,000 | | | | 85,140 | | |
02/01/22 | | | 5.500 | % | | | 36,000 | | | | 34,740 | | |
Laredo Petroleum, Inc.
02/15/19 | | | 9.500 | % | | | 110,000 | | | | 122,375 | | |
05/01/22 | | | 7.375 | % | | | 23,000 | | | | 24,265 | | |
Linn Energy LLC/Finance Corp.(b)
11/01/19 | | | 6.250 | % | | | 20,000 | | | | 18,400 | | |
Nexen, Inc.
Senior Unsecured
03/10/35 | | | 5.875 | % | | | 865,000 | | | | 890,688 | | |
Oasis Petroleum, Inc.
02/01/19 | | | 7.250 | % | | | 141,000 | | | | 149,460 | | |
11/01/21 | | | 6.500 | % | | | 106,000 | | | | 111,300 | | |
01/15/23 | | | 6.875 | % | | | 61,000 | | | | 64,203 | | |
Pioneer Natural Resources Co.
Senior Unsecured
07/15/22 | | | 3.950 | % | | | 1,350,000 | | | | 1,333,138 | | |
QEP Resources, Inc.
Senior Unsecured
10/01/22 | | | 5.375 | % | | | 58,000 | | | | 55,680 | | |
05/01/23 | | | 5.250 | % | | | 61,000 | | | | 57,188 | | |
Range Resources Corp.
06/01/21 | | | 5.750 | % | | | 53,000 | | | | 55,518 | | |
08/15/22 | | | 5.000 | % | | | 14,000 | | | | 13,685 | | |
The accompanying Notes to Financial Statements are an integral part of this statement.
Annual Report 2013
14
Portfolio of Investments (continued)
August 31, 2013
Corporate Bonds & Notes (continued)
Issuer | | Coupon
Rate | | Principal
Amount ($) | | Value ($) | |
SM Energy Co.
Senior Unsecured
11/15/21 | | | 6.500 | % | | | 43,000 | | | | 45,150 | | |
SM Energy Co.(b)
Senior Unsecured
01/15/24 | | | 5.000 | % | | | 55,000 | | | | 51,013 | | |
Southwestern Energy Co.
02/01/18 | | | 7.500 | % | | | 770,000 | | | | 912,754 | | |
Whiting Petroleum Corp.
10/01/18 | | | 6.500 | % | | | 5,000 | | | | 5,263 | | |
Woodside Finance Ltd.(b)
05/10/21 | | | 4.600 | % | | | 1,600,000 | | | | 1,668,334 | | |
Total | | | | | | | 11,597,522 | | |
Integrated Energy 0.2% | |
Cenovus Energy, Inc.
Senior Unsecured
09/15/23 | | | 3.800 | % | | | 1,510,000 | | | | 1,493,888 | | |
Petro-Canada
Senior Unsecured
05/15/18 | | | 6.050 | % | | | 1,175,000 | | | | 1,362,160 | | |
Total | | | | | | | 2,856,048 | | |
Life Insurance 0.4% | |
Hartford Financial Services Group, Inc.
Senior Unsecured
03/30/20 | | | 5.500 | % | | | 1,325,000 | | | | 1,480,187 | | |
Lincoln National Corp.
Senior Unsecured
07/01/19 | | | 8.750 | % | | | 950,000 | | | | 1,221,128 | | |
Metropolitan Life Global Funding I
Senior Secured(b)
04/11/22 | | | 3.875 | % | | | 1,250,000 | | | | 1,270,646 | | |
Prudential Financial, Inc.
Senior Unsecured
06/15/17 | | | 6.100 | % | | | 1,480,000 | | | | 1,688,224 | | |
Total | | | | | | | 5,660,185 | | |
Lodging —% | |
Choice Hotels International, Inc.
07/01/22 | | | 5.750 | % | | | 32,000 | | | | 32,960 | | |
Playa Resorts Holding BV
Senior Unsecured(b)
08/15/20 | | | 8.000 | % | | | 70,000 | | | | 71,515 | | |
Total | | | | | | | 104,475 | | |
Media Cable 0.2% | |
CCO Holdings LLC/Capital Corp.
01/31/22 | | | 6.625 | % | | | 50,000 | | | | 50,750 | | |
09/30/22 | | | 5.250 | % | | | 101,000 | | | | 92,162 | | |
Corporate Bonds & Notes (continued)
Issuer | | Coupon
Rate | | Principal
Amount ($) | | Value ($) | |
CSC Holdings LLC
Senior Unsecured
02/15/18 | | | 7.875 | % | | | 22,000 | | | | 24,970 | | |
02/15/19 | | | 8.625 | % | | | 32,000 | | | | 36,800 | | |
CSC Holdings, Inc.
Senior Unsecured
11/15/21 | | | 6.750 | % | | | 40,000 | | | | 42,100 | | |
Cablevision Systems Corp.
Senior Unsecured
04/15/20 | | | 8.000 | % | | | 66,000 | | | | 73,095 | | |
09/15/22 | | | 5.875 | % | | | 20,000 | | | | 19,100 | | |
Cequel Communications Holdings I LLC/Capital Corp.
Senior Unsecured(b)
09/15/20 | | | 6.375 | % | | | 62,000 | | | | 61,845 | | |
DIRECTV Holdings LLC/Financing Co., Inc.
03/01/21 | | | 5.000 | % | | | 1,740,000 | | | | 1,778,230 | | |
DISH DBS Corp.
09/01/19 | | | 7.875 | % | | | 102,000 | | | | 115,005 | | |
06/01/21 | | | 6.750 | % | | | 18,000 | | | | 18,765 | | |
07/15/22 | | | 5.875 | % | | | 117,000 | | | | 114,660 | | |
03/15/23 | | | 5.000 | % | | | 76,000 | | | | 70,110 | | |
Midcontinent Communications & Finance Corp.(b)
08/01/21 | | | 6.250 | % | | | 14,000 | | | | 14,070 | | |
Quebecor Media, Inc.
Senior Unsecured
01/15/23 | | | 5.750 | % | | | 58,000 | | | | 54,085 | | |
Unitymedia Hessen GmbH & Co. KG NRW
Senior Secured(b)
01/15/23 | | | 5.500 | % | | | 38,000 | | | | 35,340 | | |
Videotron Ltd.
07/15/22 | | | 5.000 | % | | | 38,000 | | | | 35,340 | | |
WaveDivision Escrow LLC/Corp.
Senior Unsecured(b)
09/01/20 | | | 8.125 | % | | | 2,000 | | | | 2,070 | | |
WideOpenWest Finance LLC/Capital Corp.
07/15/19 | | | 10.250 | % | | | 25,000 | | | | 26,813 | | |
Total | | | | | | | 2,665,310 | | |
Media Non-Cable 0.5% | |
AMC Networks, Inc.
07/15/21 | | | 7.750 | % | | | 102,000 | | | | 112,710 | | |
12/15/22 | | | 4.750 | % | | | 25,000 | | | | 23,438 | | |
Clear Channel Communications, Inc.
Senior Secured
03/01/21 | | | 9.000 | % | | | 78,000 | | | | 74,100 | | |
Clear Channel Worldwide Holdings, Inc.
03/15/20 | | | 7.625 | % | | | 99,000 | | | | 99,248 | | |
11/15/22 | | | 6.500 | % | | | 50,000 | | | | 49,625 | | |
11/15/22 | | | 6.500 | % | | | 92,000 | | | | 92,000 | | |
The accompanying Notes to Financial Statements are an integral part of this statement.
Annual Report 2013
15
Portfolio of Investments (continued)
August 31, 2013
Corporate Bonds & Notes (continued)
Issuer | | Coupon
Rate | | Principal
Amount ($) | | Value ($) | |
Hughes Satellite Systems Corp.
06/15/21 | | | 7.625 | % | | | 88,000 | | | | 94,380 | | |
Intelsat Jackson Holdings SA
10/15/20 | | | 7.250 | % | | | 185,000 | | | | 197,487 | | |
Intelsat Luxembourg SA(b)
06/01/21 | | | 7.750 | % | | | 31,000 | | | | 31,930 | | |
06/01/23 | | | 8.125 | % | | | 88,000 | | | | 91,960 | | |
MDC Partners, Inc.(b)
04/01/20 | | | 6.750 | % | | | 78,000 | | | | 78,975 | | |
NBCUniversal Media LLC
04/01/41 | | | 5.950 | % | | | 1,100,000 | | | | 1,247,324 | | |
National CineMedia LLC
Senior Secured
04/15/22 | | | 6.000 | % | | | 74,000 | | | | 75,480 | | |
News America, Inc.
03/15/33 | | | 6.550 | % | | | 1,000,000 | | | | 1,124,071 | | |
Nielsen Finance LLC/Co.
10/01/20 | | | 4.500 | % | | | 184,000 | | | | 174,800 | | |
Reed Elsevier Capital, Inc.
10/15/22 | | | 3.125 | % | | | 1,497,000 | | | | 1,376,259 | | |
TCM Sub LLC(b)
01/15/15 | | | 3.550 | % | | | 955,000 | | | | 986,206 | | |
Thomson Reuters Corp.
Senior Unsecured
05/23/43 | | | 4.500 | % | | | 1,225,000 | | | | 1,071,643 | | |
Univision Communications, Inc.(b)
05/15/21 | | | 8.500 | % | | | 45,000 | | | | 48,713 | | |
Senior Secured
11/01/20 | | | 7.875 | % | | | 34,000 | | | | 36,890 | | |
09/15/22 | | | 6.750 | % | | | 94,000 | | | | 97,525 | | |
05/15/23 | | | 5.125 | % | | | 26,000 | | | | 24,538 | | |
Total | | | | | | | 7,209,302 | | |
Metals 0.2% | |
Alpha Natural Resources, Inc.
04/15/18 | | | 9.750 | % | | | 39,000 | | | | 39,195 | | |
ArcelorMittal
Senior Unsecured
03/01/21 | | | 6.000 | % | | | 104,000 | | | | 102,180 | | |
Arch Coal, Inc.
06/15/21 | | | 7.250 | % | | | 4,000 | | | | 3,090 | | |
Arch Coal, Inc.(b)
06/15/19 | | | 9.875 | % | | | 77,000 | | | | 66,990 | | |
CONSOL Energy, Inc.
03/01/21 | | | 6.375 | % | | | 4,000 | | | | 4,040 | | |
Calcipar SA
Senior Secured(b)
05/01/18 | | | 6.875 | % | | | 85,000 | | | | 87,656 | | |
Corporate Bonds & Notes (continued)
Issuer | | Coupon
Rate | | Principal
Amount ($) | | Value ($) | |
FMG Resources August 2006 Proprietary Ltd.(b)
11/01/19 | | | 8.250 | % | | | 136,000 | | | | 144,160 | | |
FQM Akubra, Inc.(b)
06/01/20 | | | 8.750 | % | | | 128,000 | | | | 133,760 | | |
06/01/21 | | | 7.500 | % | | | 39,000 | | | | 39,195 | | |
Freeport-McMoRan Copper & Gold, Inc.
Senior Unsecured(b)
03/15/20 | | | 3.100 | % | | | 1,340,000 | | | | 1,214,335 | | |
JMC Steel Group, Inc.
Senior Notes(b)
03/15/18 | | | 8.250 | % | | | 75,000 | | | | 73,125 | | |
Peabody Energy Corp.
11/15/18 | | | 6.000 | % | | | 67,000 | | | | 66,665 | | |
11/15/21 | | | 6.250 | % | | | 29,000 | | | | 27,985 | | |
Vale Overseas Ltd.
01/23/17 | | | 6.250 | % | | | 1,115,000 | | | | 1,231,569 | | |
Total | | | | | | | 3,233,945 | | |
Non-Captive Consumer —% | |
Provident Funding Associates LP/PFG Finance Corp.(b)
06/15/21 | | | 6.750 | % | | | 47,000 | | | | 47,470 | | |
Springleaf Finance Corp.
Senior Unsecured
12/15/17 | | | 6.900 | % | | | 62,000 | | | | 63,085 | | |
Total | | | | | | | 110,555 | | |
Non-Captive Diversified 0.3% | |
Air Lease Corp.
03/01/20 | | | 4.750 | % | | | 129,000 | | | | 128,677 | | |
CIT Group, Inc.
Senior Unsecured
08/15/17 | | | 4.250 | % | | | 48,000 | | | | 48,600 | | |
03/15/18 | | | 5.250 | % | | | 50,000 | | | | 51,625 | | |
08/01/23 | | | 5.000 | % | | | 27,000 | | | | 25,286 | | |
CIT Group, Inc.(b)
Senior Secured
04/01/18 | | | 6.625 | % | | | 69,000 | | | | 74,348 | | |
Senior Unsecured
02/15/19 | | | 5.500 | % | | | 156,000 | | | | 159,900 | | |
General Electric Capital Corp.
Senior Unsecured
10/17/21 | | | 4.650 | % | | | 3,890,000 | | | | 4,099,714 | | |
International Lease Finance Corp.
Senior Unsecured
09/01/17 | | | 8.875 | % | | | 80,000 | | | | 91,300 | | |
04/15/18 | | | 3.875 | % | | | 3,000 | | | | 2,865 | | |
05/15/19 | | | 6.250 | % | | | 29,000 | | | | 29,870 | | |
12/15/20 | | | 8.250 | % | | | 149,000 | | | | 165,762 | | |
04/15/21 | | | 4.625 | % | | | 5,000 | | | | 4,550 | | |
Total | | | | | | | 4,882,497 | | |
The accompanying Notes to Financial Statements are an integral part of this statement.
Annual Report 2013
16
Portfolio of Investments (continued)
August 31, 2013
Corporate Bonds & Notes (continued)
Issuer | | Coupon
Rate | | Principal
Amount ($) | | Value ($) | |
Oil Field Services 0.2% | |
Atwood Oceanics, Inc.
Senior Unsecured
02/01/20 | | | 6.500 | % | | | 231,000 | | | | 247,170 | | |
Green Field Energy Services, Inc.(b)
Secured
11/15/16 | | | 13.250 | % | | | 4,000 | | | | 3,920 | | |
11/15/16 | | | 13.250 | % | | | 127,000 | | | | 124,460 | | |
Halliburton Co.
Senior Unsecured
08/01/23 | | | 3.500 | % | | | 1,800,000 | | | | 1,776,346 | | |
Oil States International, Inc.(b)
01/15/23 | | | 5.125 | % | | | 37,000 | | | | 40,423 | | |
Pacific Drilling SA
Senior Secured(b)
06/01/20 | | | 5.375 | % | | | 93,000 | | | | 89,745 | | |
Weatherford International, Inc.
06/15/37 | | | 6.800 | % | | | 1,235,000 | | | | 1,278,620 | | |
Total | | | | | | | 3,560,684 | | |
Other Industry —% | |
Interline Brands, Inc.
11/15/18 | | | 7.500 | % | | | 122,000 | | | | 128,100 | | |
Unifrax I LLC/Holding Co.(b)
02/15/19 | | | 7.500 | % | | | 39,000 | | | | 39,049 | | |
Total | | | | | | | 167,149 | | |
Packaging —% | |
Ardagh Packaging Finance PLC/MP Holdings
U.S.A., Inc.(b)
Senior Secured
11/15/22 | | | 4.875 | % | | | 28,000 | | | | 26,880 | | |
Senior Unsecured
11/15/20 | | | 7.000 | % | | | 18,000 | | | | 17,460 | | |
BOE Intermediate Holding Corp.
Senior Unsecured PIK(b)
11/01/17 | | | 9.000 | % | | | 18,000 | | | | 18,360 | | |
Reynolds Group Issuer, Inc. LLC
Senior Secured
10/15/20 | | | 5.750 | % | | | 43,000 | | | | 42,624 | | |
Reynolds Group Issuer, Inc./LLC
08/15/19 | | | 9.875 | % | | | 92,000 | | | | 97,750 | | |
02/15/21 | | | 8.250 | % | | | 23,000 | | | | 22,712 | | |
Senior Secured
08/15/19 | | | 7.875 | % | | | 74,000 | | | | 81,400 | | |
02/15/21 | | | 6.875 | % | | | 94,000 | | | | 99,170 | | |
Total | | | | | | | 406,356 | | |
Paper —% | |
Graphic Packaging International, Inc.
04/15/21 | | | 4.750 | % | | | 66,000 | | | | 63,360 | | |
Corporate Bonds & Notes (continued)
Issuer | | Coupon
Rate | | Principal
Amount ($) | | Value ($) | |
Pharmaceuticals 0.2% | |
Amgen, Inc.
Senior Unsecured
11/15/21 | | | 3.875 | % | | | 760,000 | | | | 762,880 | | |
GlaxoSmithKline Capital, Inc.
03/18/23 | | | 2.800 | % | | | 1,115,000 | | | | 1,044,466 | | |
Jaguar Holding Co. II/Merger Sub, Inc.
Senior Unsecured(b)
12/01/19 | | | 9.500 | % | | | 38,000 | | | | 42,940 | | |
Merck & Co, Inc.
Senior Unsecured
05/18/23 | | | 2.800 | % | | | 1,625,000 | | | | 1,516,854 | | |
VPII Escrow Corp.(b)
Senior Unsecured
08/15/18 | | | 6.750 | % | | | 56,000 | | | | 59,290 | | |
07/15/21 | | | 7.500 | % | | | 79,000 | | | | 84,530 | | |
Valeant Pharmaceuticals International(b)
10/15/20 | | | 6.375 | % | | | 145,000 | | | | 147,175 | | |
Total | | | | | | | 3,658,135 | | |
Property & Casualty 0.4% | |
ACE INA Holdings, Inc.
03/15/18 | | | 5.800 | % | | | 1,000,000 | | | | 1,153,048 | | |
Alliant Holdings, Inc.
Senior Unsecured(b)
12/15/20 | | | 7.875 | % | | | 50,000 | | | | 51,125 | | |
Berkshire Hathaway, Inc.
Senior Unsecured(c)
08/15/14 | | | 0.964 | % | | | 1,475,000 | | | | 1,484,105 | | |
CNA Financial Corp.
Senior Unsecured
11/15/19 | | | 7.350 | % | | | 1,058,000 | | | | 1,277,926 | | |
Liberty Mutual Group, Inc.(b)
06/01/21 | | | 5.000 | % | | | 1,200,000 | | | | 1,262,864 | | |
Transatlantic Holdings, Inc.
Senior Unsecured
11/30/39 | | | 8.000 | % | | | 625,000 | | | | 783,696 | | |
Total | | | | | | | 6,012,764 | | |
Railroads 0.2% | |
CSX Corp.
Senior Unsecured
10/30/20 | | | 3.700 | % | | | 1,450,000 | | | | 1,497,937 | | |
Canadian Pacific Railway Co.
Senior Unsecured
03/15/23 | | | 4.450 | % | | | 1,325,000 | | | | 1,375,126 | | |
Total | | | | | | | 2,873,063 | | |
The accompanying Notes to Financial Statements are an integral part of this statement.
Annual Report 2013
17
Portfolio of Investments (continued)
August 31, 2013
Corporate Bonds & Notes (continued)
Issuer | | Coupon
Rate | | Principal
Amount ($) | | Value ($) | |
Refining 0.1% | |
Marathon Petroleum Corp.
Senior Unsecured
03/01/41 | | | 6.500 | % | | | 800,000 | | | | 881,160 | | |
REITs 0.3% | |
Boston Properties LP
Senior Unsecured
05/15/21 | | | 4.125 | % | | | 1,200,000 | | | | 1,225,020 | | |
CyrusOne LP/Finance Corp.
11/15/22 | | | 6.375 | % | | | 66,000 | | | | 66,330 | | |
Duke Realty LP
08/15/19 | | | 8.250 | % | | | 1,040,000 | | | | 1,279,328 | | |
Kimco Realty Corp.
Senior Unsecured
02/01/18 | | | 4.300 | % | | | 1,235,000 | | | | 1,323,564 | | |
Simon Property Group LP
Senior Unsecured
02/01/40 | | | 6.750 | % | | | 880,000 | | | | 1,078,278 | | |
Total | | | | | | | 4,972,520 | | |
Restaurants 0.1% | |
Yum! Brands, Inc.
Senior Unsecured
11/01/20 | | | 3.875 | % | | | 1,280,000 | | | | 1,292,386 | | |
Retailers 0.1% | |
AutoNation, Inc.
02/01/20 | | | 5.500 | % | | | 35,000 | | | | 36,663 | | |
Burlington Coat Factory Warehouse Corp.
02/15/19 | | | 10.000 | % | | | 84,000 | | | | 93,660 | | |
Burlington Holdings LLC/Finance, Inc.
Senior Unsecured PIK(b)
02/15/18 | | | 9.000 | % | | | 71,000 | | | | 72,597 | | |
CVS Pass-Through Trust
Pass-Through Certificates(b)
01/10/32 | | | 7.507 | % | | | 324,288 | | | | 387,436 | | |
Jo-Ann Stores, Inc.
Senior Unsecured(b)
03/15/19 | | | 8.125 | % | | | 62,000 | | | | 63,085 | | |
Macy's Retail Holdings, Inc.
07/15/34 | | | 6.700 | % | | | 750,000 | | | | 850,207 | | |
Michaels FinCo Holdings LLC/Inc.
Senior Unsecured PIK(b)
08/01/18 | | | 7.500 | % | | | 71,000 | | | | 71,177 | | |
Rite Aid Corp.
03/15/20 | | | 9.250 | % | | | 24,000 | | | | 27,150 | | |
Senior Unsecured
02/15/27 | | | 7.700 | % | | | 25,000 | | | | 25,438 | | |
Corporate Bonds & Notes (continued)
Issuer | | Coupon
Rate | | Principal
Amount ($) | | Value ($) | |
Rite Aid Corp.(b)
06/15/21 | | | 6.750 | % | | | 4,000 | | | | 4,050 | | |
Sally Holdings LLC/Capital, Inc.
06/01/22 | | | 5.750 | % | | | 50,000 | | | | 50,062 | | |
Total | | | | | | | 1,681,525 | | |
Supermarkets 0.1% | |
Safeway, Inc.
Senior Unsecured
02/01/31 | | | 7.250 | % | | | 1,080,000 | | | | 1,157,151 | | |
Technology 0.3% | |
Alliance Data Systems Corp.(b)
12/01/17 | | | 5.250 | % | | | 59,000 | | | | 60,917 | | |
04/01/20 | | | 6.375 | % | | | 45,000 | | | | 46,350 | | |
Amkor Technology, Inc.
Senior Unsecured
06/01/21 | | | 6.625 | % | | | 1,000 | | | | 983 | | |
Apple, Inc.
Senior Unsecured
05/03/23 | | | 2.400 | % | | | 1,570,000 | | | | 1,418,680 | | |
CDW LLC/Finance Corp.
04/01/19 | | | 8.500 | % | | | 35,000 | | | | 38,413 | | |
Senior Secured
12/15/18 | | | 8.000 | % | | | 37,000 | | | | 40,608 | | |
Cardtronics, Inc.
09/01/18 | | | 8.250 | % | | | 56,000 | | | | 60,060 | | |
Equinix, Inc.
Senior Unsecured
04/01/20 | | | 4.875 | % | | | 28,000 | | | | 26,950 | | |
04/01/23 | | | 5.375 | % | | | 27,000 | | | | 25,718 | | |
First Data Corp.
01/15/21 | | | 12.625 | % | | | 109,000 | | | | 117,856 | | |
First Data Corp.(b)
01/15/21 | | | 11.250 | % | | | 26,000 | | | | 26,650 | | |
08/15/21 | | | 11.750 | % | | | 27,000 | | | | 25,245 | | |
Secured
01/15/21 | | | 8.250 | % | | | 107,000 | | | | 109,407 | | |
Senior Secured
08/15/20 | | | 8.875 | % | | | 100,000 | | | | 108,000 | | |
11/01/20 | | | 6.750 | % | | | 44,000 | | | | 44,770 | | |
Hewlett-Packard Co.
Senior Unsecured
06/01/21 | | | 4.300 | % | | | 2,000,000 | | | | 1,929,704 | | |
NXP BV/Funding LLC(b)
02/15/21 | | | 5.750 | % | | | 66,000 | | | | 66,000 | | |
Nuance Communications, Inc.(b)
08/15/20 | | | 5.375 | % | | | 99,000 | | | | 94,297 | | |
Oracle Corp.
Senior Unsecured
04/15/38 | | | 6.500 | % | | | 920,000 | | | | 1,148,252 | | |
The accompanying Notes to Financial Statements are an integral part of this statement.
Annual Report 2013
18
Portfolio of Investments (continued)
August 31, 2013
Corporate Bonds & Notes (continued)
Issuer | | Coupon
Rate | | Principal
Amount ($) | | Value ($) | |
VeriSign, Inc.(b)
05/01/23 | | | 4.625 | % | | | 48,000 | | | | 44,880 | | |
Total | | | | | | | 5,433,740 | | |
Transportation Services 0.1% | |
Avis Budget Car Rental LLC/Finance, Inc.
03/15/20 | | | 9.750 | % | | | 38,000 | | | | 43,605 | | |
ERAC U.S.A. Finance LLC(b)
10/15/37 | | | 7.000 | % | | | 1,095,000 | | | | 1,300,465 | | |
Hertz Corp. (The)
10/15/18 | | | 7.500 | % | | | 78,000 | | | | 84,240 | | |
01/15/21 | | | 7.375 | % | | | 36,000 | | | | 38,880 | | |
LBC Tank Terminals Holding Netherlands BV(b)
05/15/23 | | | 6.875 | % | | | 66,000 | | | | 66,330 | | |
Total | | | | | | | 1,533,520 | | |
Wireless 0.3% | |
America Movil SAB de CV
11/15/17 | | | 5.625 | % | | | 570,000 | | | | 644,676 | | |
Crown Castle International Corp.
Senior Unsecured
01/15/23 | | | 5.250 | % | | | 75,000 | | | | 70,875 | | |
MetroPCS Wireless, Inc.(b)
04/01/23 | | | 6.625 | % | | | 49,000 | | | | 48,632 | | |
NII International Telecom SCA(b)
08/15/19 | | | 7.875 | % | | | 56,000 | | | | 52,780 | | |
08/15/19 | | | 11.375 | % | | | 166,000 | | | | 178,450 | | |
Rogers Communications, Inc.
08/15/18 | | | 6.800 | % | | | 1,100,000 | | | | 1,301,595 | | |
SBA Telecommunications, Inc.
08/15/19 | | | 8.250 | % | | | 55,000 | | | | 59,675 | | |
07/15/20 | | | 5.750 | % | | | 72,000 | | | | 72,360 | | |
Softbank Corp.(b)
04/15/20 | | | 4.500 | % | | | 95,000 | | | | 89,817 | | |
Sprint Capital Corp.
11/15/28 | | | 6.875 | % | | | 25,000 | | | | 22,563 | | |
Sprint Communications, Inc.
Senior Unsecured
08/15/17 | | | 8.375 | % | | | 6,000 | | | | 6,735 | | |
11/15/21 | | | 11.500 | % | | | 83,000 | | | | 108,315 | | |
11/15/22 | | | 6.000 | % | | | 74,000 | | | | 69,190 | | |
Sprint Communications, Inc.(b)
11/15/18 | | | 9.000 | % | | | 258,000 | | | | 301,860 | | |
03/01/20 | | | 7.000 | % | | | 70,000 | | | | 75,250 | | |
United States Cellular Corp.
Senior Unsecured
12/15/33 | | | 6.700 | % | | | 915,000 | | | | 889,711 | | |
Corporate Bonds & Notes (continued)
Issuer | | Coupon
Rate | | Principal
Amount ($) | | Value ($) | |
Wind Acquisition Finance SA
Senior Secured(b)
04/30/20 | | | 6.500 | % | | | 92,000 | | | | 92,000 | | |
Total | | | | | | | 4,084,484 | | |
Wirelines 0.7% | |
AT&T, Inc.
Senior Unsecured
02/15/39 | | | 6.550 | % | | | 1,680,000 | | | | 1,928,877 | | |
CenturyLink, Inc.
Senior Unsecured
04/01/20 | | | 5.625 | % | | | 140,000 | | | | 137,200 | | |
Deutsche Telekom International Finance BV
03/23/16 | | | 5.750 | % | | | 985,000 | | | | 1,087,343 | | |
Embarq Corp.
Senior Unsecured
06/01/36 | | | 7.995 | % | | | 965,000 | | | | 990,435 | | |
Frontier Communications Corp.
Senior Unsecured
03/15/19 | | | 7.125 | % | | | 48,000 | | | | 50,400 | | |
07/01/21 | | | 9.250 | % | | | 28,000 | | | | 31,780 | | |
01/15/23 | | | 7.125 | % | | | 59,000 | | | | 57,377 | | |
04/15/24 | | | 7.625 | % | | | 23,000 | | | | 22,483 | | |
Level 3 Communications, Inc.
Senior Unsecured
02/01/19 | | | 11.875 | % | | | 65,000 | | | | 74,587 | | |
Level 3 Financing, Inc.
04/01/19 | | | 9.375 | % | | | 117,000 | | | | 128,407 | | |
07/01/19 | | | 8.125 | % | | | 25,000 | | | | 26,438 | | |
07/15/20 | | | 8.625 | % | | | 24,000 | | | | 25,680 | | |
Orange SA
Senior Unsecured
09/14/16 | | | 2.750 | % | | | 1,260,000 | | | | 1,294,839 | | |
PAETEC Holding Corp.
12/01/18 | | | 9.875 | % | | | 78,000 | | | | 86,775 | | |
Telecom Italia Capital SA
07/18/36 | | | 7.200 | % | | | 1,500,000 | | | | 1,458,126 | | |
Telefonica Emisiones SAU
06/20/36 | | | 7.045 | % | | | 1,320,000 | | | | 1,403,927 | | |
Verizon New York, Inc.
04/01/32 | | | 7.375 | % | | | 1,520,000 | | | | 1,741,826 | | |
Windstream Holdings, Inc.
08/01/23 | | | 6.375 | % | | | 55,000 | | | | 49,706 | | |
Zayo Group LLC/Capital, Inc.
07/01/20 | | | 10.125 | % | | | 19,000 | | | | 21,565 | | |
Senior Secured
01/01/20 | | | 8.125 | % | | | 97,000 | | | | 105,245 | | |
Total | | | | | | | 10,723,016 | | |
Total Corporate Bonds & Notes
(Cost: $172,196,368) | | | | | | | 172,831,699 | | |
The accompanying Notes to Financial Statements are an integral part of this statement.
Annual Report 2013
19
Portfolio of Investments (continued)
August 31, 2013
Residential Mortgage-Backed Securities —
Agency 10.9%
Issuer | | Coupon
Rate | | Principal
Amount ($) | | Value ($) | |
Federal Home Loan Mortgage Corp.(c)(d)
12/01/36 | | | 6.104 | % | | | 33,442 | | | | 35,830 | | |
08/01/36 | | | 2.588 | % | | | 54,320 | | | | 57,539 | | |
Federal Home Loan Mortgage Corp.(d)
06/01/32-
07/01/32 | | | 7.000 | % | | | 680,554 | | | | 782,521 | | |
12/01/17-
05/01/40 | | | 5.500 | % | | | 3,640,718 | | | | 3,912,752 | | |
08/01/18-
05/01/41 | | | 5.000 | % | | | 8,762,663 | | | | 9,380,476 | | |
05/01/39-
06/01/41 | | | 4.500 | % | | | 13,813,082 | | | | 14,548,408 | | |
03/01/17-
10/01/39 | | | 6.000 | % | | | 3,590,010 | | | | 3,910,935 | | |
10/01/26 | | | 3.500 | % | | | 3,593,616 | | | | 3,754,484 | | |
08/01/32-
03/01/38 | | | 6.500 | % | | | 98,545 | | | | 110,707 | | |
07/01/42-
08/01/43 | | | 3.000 | % | | | 25,369,999 | | | | 24,302,632 | | |
CMO Series 1614 Class MZ
11/15/23 | | | 6.500 | % | | | 31,240 | | | | 34,694 | | |
CMO Series 2735 Class OG
08/15/32 | | | 5.000 | % | | | 39,724 | | | | 40,104 | | |
Federal Home Loan Mortgage Corp.(d)(e)
09/01/43 | | | 3.500 | % | | | 28,155,000 | | | | 28,061,517 | | |
09/01/43 | | | 4.000 | % | | | 14,800,000 | | | | 15,257,875 | | |
Federal National Mortgage Association(c)(d)
04/01/36 | | | 2.046 | % | | | 51,449 | | | | 54,017 | | |
08/01/34 | | | 5.576 | % | | | 93,647 | | | | 100,791 | | |
08/01/36 | | | 2.970 | % | | | 38,997 | | | | 41,471 | | |
Federal National Mortgage Association(d)
03/01/17-
08/01/37 | | | 6.500 | % | | | 1,350,329 | | | | 1,503,621 | | |
08/01/18-
02/01/38 | | | 5.500 | % | | | 2,758,484 | | | | 3,000,097 | | |
06/01/31-
08/01/32 | | | 7.000 | % | | | 459,346 | | | | 510,561 | | |
12/01/20-
07/01/23 | | | 5.000 | % | | | 436,684 | | | | 469,552 | | |
09/01/17-
11/01/32 | | | 6.000 | % | | | 875,308 | | | | 955,152 | | |
05/01/40 | | | 4.500 | % | | | 521,142 | | | | 550,539 | | |
09/01/40 | | | 4.000 | % | | | 4,773,917 | | | | 4,929,273 | | |
08/01/43 | | | 3.000 | % | | | 440,000 | | | | 422,508 | | |
Federal National Mortgage Association(d)(e)
09/01/28-
09/01/43 | | | 3.500 | % | | | 18,000,000 | | | | 18,232,666 | | |
07/01/27-
09/01/28 | | | 3.000 | % | | | 15,701,061 | | | | 16,071,052 | | |
09/01/28-
09/01/43 | | | 4.000 | % | | | 18,705,000 | | | | 19,375,037 | | |
Federal National Mortgage Association(d)(f)
10/01/40 | | | 4.500 | % | | | 1,035,484 | | | | 1,095,233 | | |
Residential Mortgage-Backed Securities —
Agency (continued)
Issuer | | Coupon
Rate | | Principal
Amount ($) | | Value ($) | |
Federal National Mortgage Association(d)(g)
CMO IO Series 2003-71 Class IM
12/25/31 | | | 5.500 | % | | | 85,660 | | | | 5,025 | | |
Government National Mortgage Association(d)
10/15/33 | | | 5.500 | % | | | 425,307 | | | | 477,455 | | |
10/15/31-
05/15/32 | | | 7.000 | % | | | 117,924 | | | | 136,584 | | |
02/15/34 | | | 5.000 | % | | | 353,687 | | | | 383,962 | | |
12/15/37 | | | 6.000 | % | | | 115,432 | | | | 126,962 | | |
02/15/39 | | | 4.500 | % | | | 28,834 | | | | 30,787 | | |
Government National Mortgage Association(d)(g)
CMO IO Series 2002-70 Class IC
08/20/32 | | | 6.000 | % | | | 129,435 | | | | 11,473 | | |
Total Residential Mortgage-Backed
Securities — Agency
(Cost: $172,154,758) | | | | | | | 172,674,292 | | |
Residential Mortgage-Backed Securities —
Non-Agency 0.4% | |
SACO I, Inc.
CMO Series 1995-1 Class A(b)(c)(d)(h)(i)
09/25/24 | | | 0.000 | % | | | 4,940 | | | | 1,630 | | |
Springleaf Mortgage Loan Trust(b)(c)(d)
CMO Series 2012-1A Class A
09/25/57 | | | 2.667 | % | | | 752,516 | | | | 766,488 | | |
CMO Series 2012-2A Class A
10/25/57 | | | 2.220 | % | | | 472,933 | | | | 470,182 | | |
CMO Series 2012-3A Class A
12/25/59 | | | 1.570 | % | | | 1,959,834 | | | | 1,927,183 | | |
CMO Series 2013-1A Class A
06/25/58 | | | 1.270 | % | | | 1,612,586 | | | | 1,570,237 | | |
CMO Series 2013-2A Class A
12/25/65 | | | 1.780 | % | | | 1,356,711 | | | | 1,343,305 | | |
Total Residential Mortgage-Backed
Securities — Non-Agency
(Cost: $6,145,071) | | | | | | | 6,079,025 | | |
Commercial Mortgage-Backed Securities —
Agency 3.7% | |
Federal National Mortgage Association
Series 2006-M2 Class A2A(c)(d)
10/25/32 | | | 5.271 | % | | | 2,579,380 | | | | 2,930,826 | | |
Government National Mortgage Association(c)(d)
Series 2010-52 Class AE
06/16/36 | | | 4.115 | % | | | 308,743 | | | | 316,065 | | |
Series 2013-50 Class AH
06/16/39 | | | 2.100 | % | | | 2,006,720 | | | | 2,018,515 | | |
The accompanying Notes to Financial Statements are an integral part of this statement.
Annual Report 2013
20
Portfolio of Investments (continued)
August 31, 2013
Commercial Mortgage-Backed Securities —
Agency (continued)
Issuer | | Coupon
Rate | | Principal
Amount ($) | | Value ($) | |
Government National Mortgage Association(d)
Series 2009-71 Class A
04/16/38 | | | 3.304 | % | | | 222,176 | | | | 225,239 | | |
Series 2010-159 Class A
01/16/33 | | | 2.159 | % | | | 353,748 | | | | 355,954 | | |
Series 2011-149 Class A
10/16/46 | | | 3.000 | % | | | 1,691,833 | | | | 1,737,181 | | |
Series 2011-16 Class A
11/16/34 | | | 2.210 | % | | | 526,455 | | | | 529,230 | | |
Series 2011-161 Class A
01/16/34 | | | 1.738 | % | | | 2,799,936 | | | | 2,806,888 | | |
Series 2011-31 Class A
12/16/35 | | | 2.210 | % | | | 480,408 | | | | 484,110 | | |
Series 2011-64 Class A
08/16/34 | | | 2.380 | % | | | 330,820 | | | | 331,188 | | |
Series 2011-64 Class AD
11/16/38 | | | 2.700 | % | | | 256,320 | | | | 259,132 | | |
Series 2011-78 Class A
08/16/34 | | | 2.250 | % | | | 2,338,247 | | | | 2,354,366 | | |
Series 2012-111 Class AC
04/16/47 | | | 2.211 | % | | �� | 1,330,778 | | | | 1,341,583 | | |
Series 2012-25 Class A
11/16/42 | | | 2.575 | % | | | 3,414,142 | | | | 3,466,207 | | |
Series 2012-45 Class A
03/16/40 | | | 2.830 | % | | | 969,415 | | | | 990,848 | | |
Series 2012-55 Class A
08/16/33 | | | 1.704 | % | | | 1,404,372 | | | | 1,404,256 | | |
Series 2012-58 Class A
01/16/40 | | | 2.500 | % | | | 1,053,131 | | | | 1,069,148 | | |
Series 2012-79 Class A
04/16/39 | | | 1.800 | % | | | 1,092,342 | | | | 1,082,735 | | |
Series 2012-9 Class A
05/16/39 | | | 3.220 | % | | | 955,110 | | | | 984,433 | | |
Series 2013-105 Class A
02/16/37 | | | 1.705 | % | | | 4,962,477 | | | | 4,933,615 | | |
Series 2013-12 Class A
10/16/42 | | | 1.410 | % | | | 2,227,505 | | | | 2,197,485 | | |
Series 2013-126 Class AB
09/16/38 | | | 1.540 | % | | | 3,030,000 | | | | 3,007,275 | | |
Series 2013-17 Class AH
10/16/43 | | | 1.558 | % | | | 1,697,139 | | | | 1,680,795 | | |
Series 2013-2 Class AB
12/16/42 | | | 1.600 | % | | | 1,659,717 | | | | 1,647,827 | | |
Series 2013-30 Class A
05/16/42 | | | 1.500 | % | | | 2,988,021 | | | | 2,948,286 | | |
Series 2013-32 Class AB
01/16/42 | | | 1.900 | % | | | 3,317,976 | | | | 3,308,328 | | |
Series 2013-33 Class A
07/16/38 | | | 1.061 | % | | | 4,354,286 | | | | 4,261,923 | | |
Series 2013-40 Class A
10/16/41 | | | 1.511 | % | | | 1,925,338 | | | | 1,904,943 | | |
Series 2013-57 Class A
06/16/37 | | | 1.350 | % | | | 4,240,613 | | | | 4,180,676 | | |
Series 2013-61 Class A
01/16/43 | | | 1.450 | % | | | 2,243,675 | | | | 2,209,255 | | |
Commercial Mortgage-Backed Securities —
Agency (continued)
Issuer | | Coupon
Rate | | Principal
Amount ($) | | Value ($) | |
Series 2013-78 Class AB
07/16/39 | | | 1.624 | % | | | 2,284,965 | | | | 2,256,538 | | |
Total Commercial Mortgage-Backed
Securities — Agency
(Cost: $59,919,297) | | | | | | | 59,224,850 | | |
Commercial Mortgage-Backed Securities —
Non-Agency 1.7% | |
Americold 2010 LLC Trust
Series 2010-ARTA Class A1(b)(d)
01/14/29 | | | 3.847 | % | | | 354,156 | | | | 378,913 | | |
Banc of America Commercial Mortgage Trust
Series 2006-4 Class A4(d)
07/10/46 | | | 5.634 | % | | | 3,465,000 | | | | 3,779,778 | | |
Banc of America Merrill Lynch Commercial
Mortgage, Inc.
Series 2005-3 Class A4(d)
07/10/43 | | | 4.668 | % | | | 375,000 | | | | 395,335 | | |
Bear Stearns Commercial Mortgage Securities(c)(d)
Series 2005-T20 Class AAB
10/12/42 | | | 5.277 | % | | | 308,474 | | | | 315,143 | | |
Series 2007-T28 Class A4
09/11/42 | | | 5.742 | % | | | 750,000 | | | | 844,000 | | |
Citigroup Commercial Mortgage Trust
Series 2006-C5 Class A4(d)
10/15/49 | | | 5.431 | % | | | 1,400,000 | | | | 1,537,718 | | |
Citigroup/Deutsche Bank Commercial Mortgage Trust
Series 2005-CD1 Class A4(c)(d)
07/15/44 | | | 5.393 | % | | | 880,000 | | | | 942,889 | | |
Credit Suisse Commercial Mortgage Trust
Series 2006-C2 Class A2(c)(d)
03/15/39 | | | 5.858 | % | | | 215,676 | | | | 217,577 | | |
Credit Suisse First Boston Mortgage
Securities Corp.(c)(d)
Series 2004-C1 Class A4
01/15/37 | | | 4.750 | % | | | 284,708 | | | | 285,691 | | |
Credit Suisse First Boston Mortgage
Securities Corp.(d)
Series 2004-C2 Class A1
05/15/36 | | | 3.819 | % | | | 16,518 | | | | 16,581 | | |
DBRR Trust(b)(d)
Series 2012-EZ1 Class A
09/25/45 | | | 1.393 | % | | | 495,000 | | | | 492,901 | | |
09/25/45 | | | 2.062 | % | | | 2,195,000 | | | | 2,179,757 | | |
DBUBS Mortgage Trust
Series 2011-LC1A Class A3(b)(d)
11/10/46 | | | 5.002 | % | | | 150,000 | | | | 164,212 | | |
The accompanying Notes to Financial Statements are an integral part of this statement.
Annual Report 2013
21
Portfolio of Investments (continued)
August 31, 2013
Commercial Mortgage-Backed Securities —
Non-Agency (continued)
Issuer | | Coupon
Rate | | Principal
Amount ($) | | Value ($) | |
GS Mortgage Securities Corp. II
Series 2011-GC3 Class A1(b)(d)
03/10/44 | | | 2.331 | % | | | 324,196 | | | | 328,286 | | |
General Electric Capital Assurance Co.(b)(c)(d)
Series 2003-1 Class A4
05/12/35 | | | 5.254 | % | | | 163,225 | | | | 170,331 | | |
Series 2003-1 Class A5
05/12/35 | | | 5.743 | % | | | 250,000 | | | | 284,914 | | |
Greenwich Capital Commercial Funding Corp.
Series 2005-GG5 Class AAB(c)(d)
04/10/37 | | | 5.190 | % | | | 276,595 | | | | 282,555 | | |
JPMorgan Chase Commercial Mortgage
Securities Corp.(b)(d)
Series 2009-IWST Class A2
12/05/27 | | | 5.633 | % | | | 300,000 | | | | 336,901 | | |
Series 2010-C1 Class A1
06/15/43 | | | 3.853 | % | | | 279,563 | | | | 290,838 | | |
Series 2010-CNTR Class A2
08/05/32 | | | 4.311 | % | | | 450,000 | | | | 472,509 | | |
Series 2011-C3 Class A4
02/15/46 | | | 4.717 | % | | | 450,000 | | | | 481,167 | | |
JPMorgan Chase Commercial Mortgage
Securities Corp.(c)(d)
Series 2006-LDP6 Class ASB
04/15/43 | | | 5.490 | % | | | 65,914 | | | | 68,167 | | |
JPMorgan Chase Commercial Mortgage
Securities Corp.(d)
Series 2007-CB18 Class A4
06/12/47 | | | 5.440 | % | | | 820,000 | | | | 899,168 | | |
JPMorgan Chase Commercial Mortgage
Securities Trust(c)(d)
Series 2005-CB11 Class ASB
08/12/37 | | | 5.201 | % | | | 253,989 | | | | 258,193 | | |
Series 2005-LDP3 Class ASB
08/15/42 | | | 4.893 | % | | | 189,566 | | | | 195,536 | | |
Series 2005-LDP4 Class ASB
10/15/42 | | | 4.824 | % | | | 117,828 | | | | 120,383 | | |
Series 2005-LDP5 Class A4
12/15/44 | | | 5.367 | % | | | 4,132,061 | | | | 4,443,330 | | |
JPMorgan Chase Commercial Mortgage
Securities Trust(d)
Series 2005-LDP2 Class A3
07/15/42 | | | 4.697 | % | | | 62,740 | | | | 62,722 | | |
Series 2005-LDP2 Class ASB
07/15/42 | | | 4.659 | % | | | 127,358 | | | | 130,116 | | |
LB-UBS Commercial Mortgage Trust(c)(d)
Series 2007-C7 Class A3
09/15/45 | | | 5.866 | % | | | 527,387 | | | | 583,261 | | |
LB-UBS Commercial Mortgage Trust(d)
Series 2007-C1 Class AAB
02/15/40 | | | 5.403 | % | | | 254,967 | | | | 258,728 | | |
Commercial Mortgage-Backed Securities —
Non-Agency (continued)
Issuer | | Coupon
Rate | | Principal
Amount ($) | | Value ($) | |
Morgan Stanley Capital I, Inc.
Series 2011-C1 Class A4(b)(c)(d)
09/15/47 | | | 5.033 | % | | | 300,000 | | | | 329,473 | | |
Morgan Stanley Re-Remic Trust
Series 2009-GG10 Class A4A(b)(c)(d)
08/12/45 | | | 5.995 | % | | | 825,000 | | | | 911,835 | | |
Motel 6 Trust
Series 2012-MTL6 Class A1(b)(d)
10/05/25 | | | 1.500 | % | | | 432,863 | | | | 426,306 | | |
Nationslink Funding Corp.
Series 1999-LTL1 Class A3(d)
01/22/26 | | | 7.104 | % | | | 89,480 | | | | 92,983 | | |
ORES NPL LLC
Series 2012-LV1 Class A(b)(d)
09/25/44 | | | 4.000 | % | | | 64,697 | | | | 64,672 | | |
S2 Hospitality LLC
Series 2012-LV1 Class A(b)(d)
04/15/25 | | | 4.500 | % | | | 61,825 | | | | 61,734 | | |
Wachovia Bank Commercial Mortgage Trust(c)(d)
Series 2005- C22 Class AM
12/15/44 | | | 5.515 | % | | | 200,000 | | | | 212,455 | | |
Series 2005-C21 Class A4
10/15/44 | | | 5.414 | % | | | 1,439,935 | | | | 1,535,270 | | |
Wachovia Bank Commercial Mortgage Trust(d)
Series 2005-C18 Class A4
04/15/42 | | | 4.935 | % | | | 1,670,136 | | | | 1,753,479 | | |
Total Commercial Mortgage-Backed
Securities — Non-Agency
(Cost: $26,089,800) | | | | | | | 26,605,807 | | |
Asset-Backed Securities — Non-Agency 1.0% | |
Ally Master Owner Trust
CMO Series 2011-3 Class A1(c)
05/15/16 | | | 0.814 | % | | | 1,275,000 | | | | 1,276,157 | | |
American Credit Acceptance Receivables Trust(b)
Series 2012-3 Class A
11/15/16 | | | 1.640 | % | | | 337,148 | | | | 336,960 | | |
Series 2013-1 Class A
04/16/18 | | | 1.450 | % | | | 832,991 | | | | 831,761 | | |
CNH Wholesale Master Note Trust
Series 2013-2A Class A(b)(c)
08/15/19 | | | 0.790 | % | | | 1,650,000 | | | | 1,649,982 | | |
Chesapeake Funding LLC
Series 2012-1A Class A(b)(c)
11/07/23 | | | 0.936 | % | | | 1,815,128 | | | | 1,823,137 | | |
Cityscape Home Equity Loan Trust
Series 1997-B Class A7(h)(i)(j)(k)
05/25/28 | | | 7.410 | % | | | 26,984 | | | | — | | |
The accompanying Notes to Financial Statements are an integral part of this statement.
Annual Report 2013
22
Portfolio of Investments (continued)
August 31, 2013
Asset-Backed Securities — Non-Agency (continued)
Issuer | | Coupon
Rate | | Principal
Amount ($) | | Value ($) | |
Deutsche Mortgage Securities, Inc.
CMO Series 2009-RS2 Class 4A1(b)(c)
04/26/37 | | | 0.320 | % | | | 88,692 | | | | 88,104 | | |
Equifirst Mortgage Loan Trust
Series 2003-1 Class IF1(c)
12/25/32 | | | 4.010 | % | | | 102,400 | | | | 103,309 | | |
GTP Towers Issuer LLC(b)
02/15/15 | | | 4.436 | % | | | 200,000 | | | | 207,002 | | |
Hertz Vehicle Financing LLC(b)
Series 2009-2A Class A2
03/25/16 | | | 5.290 | % | | | 500,000 | | | | 529,124 | | |
Series 2010-1A Class A1
02/25/15 | | | 2.600 | % | | | 300,000 | | | | 301,480 | | |
Hilton Grand Vacations Trust
Series 2013-A Class A(b)
01/25/26 | | | 2.280 | % | | | 2,242,336 | | | | 2,242,496 | | |
KeyCorp Student Loan Trust
Series 1999-A Class A2(c)
12/27/29 | | | 0.606 | % | | | 321,321 | | | | 316,359 | | |
Nations Equipment Finance Funding I LLC
Series 2013-1A Class A(b)
11/20/16 | | | 1.697 | % | | | 1,990,280 | | | | 1,990,280 | | |
SBA Tower Trust(b)
04/15/40 | | | 4.254 | % | | | 500,000 | | | | 508,891 | | |
SLM Student Loan Trust(b)
Series 2012-A Class A2
01/17/45 | | | 3.830 | % | | | 500,000 | | | | 528,846 | | |
SLM Student Loan Trust(b)(c)
Series 2011-C Class A1
12/15/23 | | | 1.584 | % | | | 354,197 | | | | 355,871 | | |
SLM Student Loan Trust(c)
Series 2004-B Class A2
06/15/21 | | | 0.473 | % | | | 1,165,926 | | | | 1,147,025 | | |
Santander Drive Auto Receivables Trust
Series 2012-1 Class B
05/16/16 | | | 2.720 | % | | | 400,000 | | | | 404,023 | | |
Sierra Receivables Funding Co. LLC(b)
Series 2010-1A Class A1
07/20/26 | | | 4.480 | % | | | 31,377 | | | | 31,845 | | |
Series 2010-2A Class A
11/20/25 | | | 3.840 | % | | | 63,113 | | | | 64,159 | | |
Series 2010-3A Class A
11/20/25 | | | 3.510 | % | | | 58,762 | | | | 59,763 | | |
Sierra Receivables Funding Co. LLC(b)(c)
Series 2007-2A Class A2 (NPFGC)
09/20/19 | | | 1.184 | % | | | 116,969 | | | | 116,944 | | |
Wheels SPV LLC
Series 2012-1 Class A2(b)
03/20/21 | | | 1.190 | % | | | 386,022 | | | | 387,361 | | |
Total Asset-Backed Securities — Non-Agency
(Cost: $15,225,929) | | | | | | | 15,300,879 | | |
Inflation-Indexed Bonds 0.7%
Issuer | | Coupon
Rate | | Principal
Amount ($) | | Value ($) | |
United States 0.7% | |
U.S. Treasury Inflation-Indexed Bond
07/15/15 | | | 1.875 | % | | | 924,293 | | | | 978,451 | | |
07/15/17 | | | 2.625 | % | | | 450,624 | | | | 508,747 | | |
04/15/16 | | | 0.125 | % | | | 9,985,538 | | | | 10,232,839 | | |
Total | | | | | | | 11,720,037 | | |
Total Inflation-Indexed Bonds
(Cost: $11,702,137) | | | | | | | 11,720,037 | | |
U.S. Treasury Obligations 3.2% | |
U.S. Treasury
08/15/40 | | | 3.875 | % | | | 23,521,000 | | | | 24,550,044 | | |
01/15/16 | | | 0.375 | % | | | 9,700,000 | | | | 9,665,895 | | |
03/31/15 | | | 2.500 | % | | | 16,500,000 | | | | 17,069,761 | | |
Total U.S. Treasury Obligations
(Cost: $52,211,880) | | | | | | | 51,285,700 | | |
Foreign Government Obligations 0.5% | |
Canada 0.4% | |
Province of Nova Scotia
Senior Unsecured
01/26/17 | | | 5.125 | % | | | 2,100,000 | | | | 2,359,673 | | |
Province of Ontario
Senior Unsecured
02/14/18 | | | 1.200 | % | | | 2,100,000 | | | | 2,044,900 | | |
Province of Quebec
Senior Unsecured
05/14/18 | | | 4.625 | % | | | 2,115,000 | | | | 2,365,628 | | |
Total | | | | | | | 6,770,201 | | |
Mexico 0.1% | |
Pemex Project Funding Master Trust
01/21/21 | | | 5.500 | % | | | 1,600,000 | | | | 1,694,400 | | |
Total Foreign Government Obligations
(Cost: $8,377,459) | | | | | | | 8,464,601 | | |
Municipal Bonds 0.2% | |
Issue
Description | | Coupon
Rate | | Principal
Amount ($) | | Value ($) | |
State of Illinois
Unlimited General Obligation Taxable Notes
Series 2011
03/01/17 | | | 5.365 | % | | | 2,065,000 | | | | 2,183,490 | | |
Total Municipal Bonds
(Cost: $2,270,772) | | | | | | | 2,183,490 | | |
The accompanying Notes to Financial Statements are an integral part of this statement.
Annual Report 2013
23
Portfolio of Investments (continued)
August 31, 2013
Senior Loans 0.1%
Borrower | | Weighted
Average
Coupon | | Principal
Amount ($) | | Value ($) | |
Automotive —% | |
Affinia Group, Inc.
Tranche B2 Term Loan(c)(l)
04/25/20 | | | 4.750 | % | | | 26,000 | | | | 26,000 | | |
Brokerage —% | |
Nuveen Investments, Inc.
Tranche B 2nd Lien Term Loan(c)(l)
02/28/19 | | | 6.500 | % | | | 48,000 | | | | 47,720 | | |
Chemicals —% | |
Axalta Coating Systems Dutch Holding BBV/U.S.
Holdings, Inc.
Tranche B Term Loan(c)(l)
02/01/20 | | | 4.750 | % | | | 31,920 | | | | 32,127 | | |
MacDermid, Inc.
Tranche B 2nd Lien Term Loan(c)(l)
12/07/20 | | | 7.750 | % | | | 52,000 | | | | 52,520 | | |
Total | | | | | | | 84,647 | | |
Consumer Cyclical Services —% | |
New Breed, Inc.
Term Loan(c)(l)
10/01/19 | | | 6.000 | % | | | 102,485 | | | | 102,400 | | |
Food and Beverage —% | |
New HB Acquisition LLC
Tranche B Term Loan(c)(l)
04/09/20 | | | 6.750 | % | | | 37,000 | | | | 37,879 | | |
Gaming —% | |
ROC Finance LLC
Tranche B Term Loan(c)(l)
06/20/19 | | | 5.000 | % | | | 38,000 | | | | 38,048 | | |
Health Care —% | |
American Renal Holdings, Inc.
2nd Lien Term Loan(c)(l)
03/20/20 | | | 8.500 | % | | | 93,000 | | | | 91,838 | | |
ConvaTec, Inc.
Term Loan(c)(l)
12/22/16 | | | 5.000 | % | | | 12,605 | | | | 12,655 | | |
U.S. Renal Care, Inc.(c)(e)(l)
Tranche B1 1st Lien Term Loan
07/03/19 | | | 5.250 | % | | | 19,000 | | | | 18,992 | | |
2nd Lien Term Loan
01/03/20 | | | 8.500 | % | | | 24,000 | | | | 24,000 | | |
U.S. Renal Care, Inc.(c)(l)
2nd Lien Term Loan
01/03/20 | | | 10.250 | % | | | 71,000 | | | | 71,000 | | |
Senior Loans (continued)
Borrower | | Weighted
Average
Coupon | | Principal
Amount ($) | | Value ($) | |
Tranche B1 1st Lien Term Loan
07/03/19 | | | 5.250 | % | | | 70,290 | | | | 70,260 | | |
United Surgical Partners International, Inc.
Tranche B Term Loan(c)(l)
04/03/19 | | | 4.750 | % | | | 19,862 | | | | 20,003 | | |
Total | | | | | | | 308,748 | | |
Life Insurance —% | |
Alliant Holdings I, Inc.
Term Loan(c)(l)
12/20/19 | | | 5.000 | % | | | 33,830 | | | | 33,936 | | |
Lodging —% | |
Four Seasons Holdings, Inc.
2nd Lien Term Loan(c)(l)
12/27/20 | | | 6.250 | % | | | 19,000 | | | | 19,285 | | |
Playa Resorts Holding BV
Tranche B Term Loan(c)(e)(l)
12/27/20 | | | 6.250 | % | | | 27,000 | | | | 27,079 | | |
Total | | | | | | | 46,364 | | |
Media Cable —% | |
TWCC Holding Corp.
2nd Lien Term Loan(c)(e)(l)
06/26/20 | | | 7.000 | % | | | 9,000 | | | | 9,225 | | |
WideOpenWest Finance LLC
Tranche B Term Loan(c)(l)
04/01/19 | | | 4.750 | % | | | 62,371 | | | | 62,740 | | |
Total | | | | | | | 71,965 | | |
Media Non-Cable —% | |
Cumulus Media Holdings, Inc.
2nd Lien Term Loan(c)(l)
09/16/19 | | | 7.500 | % | | | 54,550 | | | | 54,959 | | |
Property & Casualty —% | |
Asurion LLC
Tranche B1 Term Loan(c)(l)
05/24/19 | | | 4.500 | % | | | 67,660 | | | | 66,786 | | |
Lonestar Intermediate Super Holdings LLC
Term Loan(c)(l)
09/02/19 | | | 11.000 | % | | | 176,000 | | | | 183,480 | | |
Total | | | | | | | 250,266 | | |
Retailers —% | |
Rite Aid Corp.
Tranche 1 2nd Lien Term Loan(c)(l)
08/21/20 | | | 5.750 | % | | | 50,000 | | | | 51,235 | | |
The accompanying Notes to Financial Statements are an integral part of this statement.
Annual Report 2013
24
Portfolio of Investments (continued)
August 31, 2013
Senior Loans (continued)
Borrower | | Weighted
Average
Coupon | | Principal
Amount ($) | | Value ($) | |
Technology 0.1% | |
Ancestry.com, Inc.
Tranche B1 Term Loan(c)(l)
12/28/18 | | | 5.250 | % | | | 83,817 | | | | 84,305 | | |
Blue Coat Systems, Inc.
2nd Lien Term Loan(c)(l)
06/28/20 | | | 9.500 | % | | | 101,428 | | | | 101,555 | | |
Ion Trading Technologies SARL
2nd Lien Term Loan(c)(l)
05/22/21 | | | 8.250 | % | | | 98,424 | | | | 98,363 | | |
Triple Point Group Holdings, Inc.(c)(l)
1st Lien Term Loan
07/10/20 | | | 5.250 | % | | | 59,000 | | | | 57,869 | | |
2nd Lien Term Loan
07/10/21 | | | 9.250 | % | | | 56,000 | | | | 53,760 | | |
Total | | | | | | | 395,852 | | |
Wirelines —% | |
Integra Telecom Holdings, Inc.(c)(l)
2nd Lien Term Loan
02/21/20 | | | 9.750 | % | | | 8,000 | | | | 8,210 | | |
Tranche B Term Loan
02/22/19 | | | 5.250 | % | | | 23,940 | | | | 24,149 | | |
Total | | | | | | | 32,359 | | |
Total Senior Loans
(Cost: $1,553,828) | | | | | | | 1,582,378 | | |
Warrants —%
Issuer | | Shares | | Value ($) | |
Energy —% | |
Energy Equipment & Services —% | |
Green Field Energy Services, Inc.(a) | | | 127 | | | | 5,080 | | |
Total Energy | | | | | 5,080 | | |
Total Warrants
(Cost: $5,142) | | | | | 5,080 | | |
Money Market Funds 10.3%
Columbia Short-Term Cash Fund,
0.097%(m)(n) | | | 164,611,110 | | | | 164,611,110 | | |
Total Money Market Funds
(Cost: $164,611,110) | | | | | 164,611,110 | | |
Total Investments
(Cost: $1,436,315,768) | | | | | 1,684,553,300 | | |
Other Assets & Liabilities, Net | | | | | (93,199,342 | ) | |
Net Assets | | | | | 1,591,353,958 | | |
Investments in Derivatives
Futures Contracts Outstanding at August 31, 2013
Contract Description | | Number of
Contracts
Long (Short) | | Notional
Market
Value ($) | | Expiration
Date | | Unrealized
Appreciation ($) | | Unrealized
Depreciation ($) | |
U.S. Treasury Note, 2-year | | | (70 | ) | | | (15,382,500 | ) | | December 2013 | | | — | | | | (4,497 | ) | |
U.S. Treasury Note, 5-year | | | (92 | ) | | | (11,010,531 | ) | | December 2013 | | | 525 | | | | — | | |
U.S. Treasury Note, 10-year | | | (116 | ) | | | (14,416,625 | ) | | December 2013 | | | 7,913 | | | | — | | |
Total | | | | | | | | | 8,438 | | | | (4,497 | ) | |
The accompanying Notes to Financial Statements are an integral part of this statement.
Annual Report 2013
25
Portfolio of Investments (continued)
August 31, 2013
Notes to Portfolio of Investments
(a) Non-income producing.
(b) Security exempt from registration pursuant to Rule 144A under the Securities Act of 1933. This security may be resold in transactions exempt from registration, normally to qualified institutional buyers. At August 31, 2013, the value of these securities amounted to $45,963,240 or 2.89% of net assets.
(c) Variable rate security.
(d) The maturity dates shown represent the original maturity of the underlying obligation. Actual maturity may vary based upon prepayment activity on these obligations. Unless otherwise noted, the coupon rates presented are fixed rates.
(e) Represents a security purchased on a when-issued or delayed delivery basis.
(f) At August 31, 2013, investments in securities included securities valued at $466,980 that were partially pledged as collateral to cover initial margin deposits on open interest rate futures contracts.
(g) Interest Only (IO) security. The actual effective yield of this security is different than the stated coupon rate.
(h) Identifies issues considered to be illiquid as to their marketability. The aggregate value of such securities at August 31, 2013 was $1,630, representing less than 0.01% of net assets. Information concerning such security holdings at August 31, 2013 is as follows:
Security Description | | Acquisition Dates | | Cost ($) | |
Cityscape Home Equity Loan Trust
Series 1997-B Class A7
7.410% 05/25/28 | | 06/23/09 - 5/13/11 | | | 26,705 | | |
SACO I, Inc.
CMO Series 1995-1 Class A
0.000% 09/25/24 | | 04/30/99 - 12/20/02 | | | 4,703 | | |
(i) Represents fair value as determined in good faith under procedures approved by the Board of Trustees. At August 31, 2013, the value of these securities amounted to $1,630, which represents less than 0.01% of net assets.
(j) Negligible market value.
(k) Represents securities that have defaulted on payment of interest. The Fund has stopped accruing interest on these securities. At August 31, 2013, the value of these securities amounted to $0, which represents less than 0.01% of net assets.
(l) Senior loans have rates of interest that float periodically based primarily on the London Interbank Offered Rate ("LIBOR") and other short-term rates. The interest rate shown reflects the weighted average coupon as of August 31, 2013. The interest rate shown for senior loans purchased on a when-issued or delayed delivery basis, if any, reflects an estimated average coupon. Remaining maturities of senior loans may be less than the stated maturities shown as a result of contractual or optional prepayments by the borrower. Such prepayments cannot be predicted with certainty.
(m) The rate shown is the seven-day current annualized yield at August 31, 2013.
(n) As defined in the Investment Company Act of 1940, an affiliated company is one in which the Fund owns 5% or more of its outstanding voting securities, or a company which is under common ownership or control with the Fund. Holdings and transactions in these affiliated companies during the year ended August 31, 2013, are as follows:
Issuer | | Beginning
Cost ($) | | Purchase
Cost ($) | | Proceeds
From Sales ($) | | Ending
Cost ($) | | Dividends —
Affiliated
Issuers ($) | | Value ($) | |
Columbia Short-Term Cash Fund | | | 98,875,366 | | | | 590,075,432 | | | | (524,339,688 | ) | | | 164,611,110 | | | | 167,337 | | | | 164,611,110 | | |
Abbreviation Legend
ADR American Depositary Receipt
CMO Collateralized Mortgage Obligation
NPFGC National Public Finance Guarantee Corporation
PIK Payment-in-Kind
The accompanying Notes to Financial Statements are an integral part of this statement.
Annual Report 2013
26
Portfolio of Investments (continued)
August 31, 2013
Fair Value Measurements
Generally accepted accounting principles (GAAP) require disclosure regarding the inputs and valuation techniques used to measure fair value and any changes in valuation inputs or techniques. In addition, investments shall be disclosed by major category.
The Fund categorizes its fair value measurements according to a three-level hierarchy that maximizes the use of observable inputs and minimizes the use of unobservable inputs by prioritizing that the most observable input be used when available. Observable inputs are those that market participants would use in pricing an investment based on market data obtained from sources independent of the reporting entity. Unobservable inputs are those that reflect the Fund's assumptions about the information market participants would use in pricing an investment. An investment's level within the fair value hierarchy is based on the lowest level of any input that is deemed significant to the asset or liability's fair value measurement. The input levels are not necessarily an indication of the risk or liquidity associated with investments at that level. For example, certain U.S. government securities are generally high quality and liquid, however, they are reflected as Level 2 because the inputs used to determine fair value may not always be quoted prices in an active market.
Fair value inputs are summarized in the three broad levels listed below:
> Level 1 — Valuations based on quoted prices for investments in active markets that the Fund has the ability to access at the measurement date (including NAV for open-end mutual funds). Valuation adjustments are not applied to Level 1 investments.
> Level 2 — Valuations based on other significant observable inputs (including quoted prices for similar securities, interest rates, prepayment speeds, credit risks, etc.).
> Level 3 — Valuations based on significant unobservable inputs (including the Fund's own assumptions and judgment in determining the fair value of investments).
Inputs that are used in determining fair value of an investment may include price information, credit data, volatility statistics, and other factors. These inputs can be either observable or unobservable. The availability of observable inputs can vary between investments, and is affected by various factors such as the type of investment, and the volume and level of activity for that investment or similar investments in the marketplace. The inputs will be considered by the Investment Manager, along with any other relevant factors in the calculation of an investment's fair value. The Fund uses prices and inputs that are current as of the measurement date, which may include periods of market dislocations. During these periods, the availability of prices and inputs may be reduced for many investments. This condition could cause an investment to be reclassified between the various levels within the hierarchy.
Investments falling into the Level 3 category are primarily supported by quoted prices from brokers and dealers participating in the market for those investments. However, these may be classified as Level 3 investments due to lack of market transparency and corroboration to support these quoted prices. Additionally, valuation models may be used as the pricing source for any remaining investments classified as Level 3. These models may rely on one or more significant unobservable inputs and/or significant assumptions by the Investment Manager. Inputs used in valuations may include, but are not limited to, financial statement analysis, capital account balances, discount rates and estimated cash flows, and comparable company data.
Under the direction of the Fund's Board of Trustees (the Board), the Investment Manager's Valuation Committee (the Committee) is responsible for carrying out the valuation procedures approved by the Board. The Committee consists of voting and non-voting members from various groups within the Investment Manager's organization, including operations and accounting, trading and investments, compliance, risk management and legal.
The Committee meets at least monthly to review and approve valuation matters, which may include a description of specific valuation determinations, data regarding pricing information received from approved pricing vendors and brokers and the results of Board-approved valuation control policies and procedures (the Policies). The Policies address, among other things, instances when market quotations are or are not readily available, including recommendations of third party pricing vendors and a determination of appropriate pricing methodologies; events that require specific valuation determinations and assessment of fair value techniques; securities with a potential for stale pricing, including those that are illiquid, restricted, or in default; and the effectiveness of third-party pricing vendors, including periodic reviews of vendors. The Committee meets more frequently, as needed, to discuss additional valuation matters, which may include the need to review back-testing results, review time-sensitive information or approve related valuation actions. The Committee reports to the Board, with members of the Committee meeting with the Board at each of its regularly scheduled meetings to discuss valuation matters and actions during the period, similar to those described earlier.
For investments categorized as Level 3, the Committee monitors information similar to that described above, which may include: (i) data specific to the issuer or comparable issuers, (ii) general market or specific sector news and (iii) quoted prices and specific or similar security transactions. The Committee considers this data and any changes from prior periods in order to assess the reasonableness of observable and unobservable inputs, any assumptions or internal models used to value those securities and changes in fair value. This data is also used to corroborate, when available, information received from approved pricing vendors and brokers. Various factors impact the frequency of monitoring this information (which may occur as often as daily). However, the Committee may determine that changes to inputs, assumptions and models are not required as a result of the monitoring procedures performed.
The accompanying Notes to Financial Statements are an integral part of this statement.
Annual Report 2013
27
Portfolio of Investments (continued)
August 31, 2013
Fair Value Measurements (continued)
The following table is a summary of the inputs used to value the Fund's investments at August 31, 2013:
Description | | Level 1
Quoted Prices in Active
Markets for Identical
Assets ($) | | Level 2
Other Significant
Observable Inputs ($) | | Level 3
Significant
Unobservable Inputs ($) | | Total ($) | |
Equity Securities | |
Common Stocks | |
Consumer Discretionary | | | 137,000,367 | | | | — | | | | — | | | | 137,000,367 | | |
Consumer Staples | | | 108,076,310 | | | | — | | | | — | | | | 108,076,310 | | |
Energy | | | 99,234,810 | | | | — | | | | — | | | | 99,234,810 | | |
Financials | | | 170,046,134 | | | | — | | | | — | | | | 170,046,134 | | |
Health Care | | | 136,983,798 | | | | — | | | | — | | | | 136,983,798 | | |
Industrials | | | 98,460,453 | | | | — | | | | — | | | | 98,460,453 | | |
Information Technology | | | 197,453,692 | | | | — | | | | — | | | | 197,453,692 | | |
Materials | | | 16,721,181 | | | | — | | | | — | | | | 16,721,181 | | |
Telecommunication Services | | | 28,007,607 | | | | — | | | | — | | | | 28,007,607 | | |
Warrants | |
Energy | | | — | | | | 5,080 | | | | — | | | | 5,080 | | |
Total Equity Securities | | | 991,984,352 | | | | 5,080 | | | | — | | | | 991,989,432 | | |
Bonds | |
Corporate Bonds & Notes | | | — | | | | 172,831,699 | | | | — | | | | 172,831,699 | | |
Residential Mortgage-Backed
Securities — Agency | | | — | | | | 172,674,292 | | | | — | | | | 172,674,292 | | |
Residential Mortgage-Backed
Securities — Non-Agency | | | — | | | | 6,077,395 | | | | 1,630 | | | | 6,079,025 | | |
Commercial Mortgage-Backed
Securities — Agency | | | — | | | | 56,217,575 | | | | 3,007,275 | | | | 59,224,850 | | |
Commercial Mortgage-Backed
Securities — Non-Agency | | | — | | | | 23,933,149 | | | | 2,672,658 | | | | 26,605,807 | | |
Asset-Backed Securities — Non-Agency | | | — | | | | 13,310,599 | | | | 1,990,280 | | | | 15,300,879 | | |
Inflation-Indexed Bonds | | | — | | | | 11,720,037 | | | | — | | | | 11,720,037 | | |
U.S. Treasury Obligations | | | 51,285,700 | | | | — | | | | — | | | | 51,285,700 | | |
Foreign Government Obligations | | | — | | | | 8,464,601 | | | | — | | | | 8,464,601 | | |
Municipal Bonds | | | — | | | | 2,183,490 | | | | — | | | | 2,183,490 | | |
Total Bonds | | | 51,285,700 | | | | 467,412,837 | | | | 7,671,843 | | | | 526,370,380 | | |
Other | |
Senior Loans | | | — | | | | 1,582,378 | | | | — | | | | 1,582,378 | | |
Total Other | | | — | | | | 1,582,378 | | | | — | | | | 1,582,378 | | |
Mutual Funds | |
Money Market Funds | | | 164,611,110 | | | | — | | | | — | | | | 164,611,110 | | |
Total Mutual Funds | | | 164,611,110 | | | | — | | | | — | | | | 164,611,110 | | |
The accompanying Notes to Financial Statements are an integral part of this statement.
Annual Report 2013
28
Portfolio of Investments (continued)
August 31, 2013
Fair Value Measurements (continued)
Description | | Level 1
Quoted Prices in Active
Markets for Identical
Assets ($) | | Level 2
Other Significant
Observable Inputs ($) | | Level 3
Significant
Unobservable Inputs ($) | | Total ($) | |
Investments in Securities | | | 1,207,881,162 | | | | 469,000,295 | | | | 7,671,843 | | | | 1,684,553,300 | | |
Derivatives | |
Assets | |
Futures Contracts | | | 8,438 | | | | — | | | | — | | | | 8,438 | | |
Liabilities | |
Futures Contracts | | | (4,497 | ) | | | — | | | | — | | | | (4,497 | ) | |
Total | | | 1,207,885,103 | | | | 469,000,295 | | | | 7,671,843 | | | | 1,684,557,241 | | |
See the Portfolio of Investments for all investment classifications not indicated in the table.
The Fund's assets assigned to the Level 2 input category are generally valued using the market approach, in which a security's value is determined through reference to prices and information from market transactions for similar or identical assets.
There were no transfers of financial assets between Levels 1 and 2 during the period.
Derivative instruments are valued at unrealized appreciation (depreciation).
| | | Residential
Mortgage-Backed
Securities —
Non-Agency ($) | | Commercial
Mortgage-Backed
Securities —
Agency ($) | | Commercial
Mortgage-Backed
Securities —
Non-Agency ($) | | Asset-Backed
Securities —
Non-Agency ($) | | Total ($) | |
Balance as of August 31, 2012 | | | 1,680 | | | | — | | | | — | | | | — | | | | 1,680 | | |
Accrued discounts/premiums | | | 13 | | | | — | | | | — | | | | (294 | ) | | | (281 | ) | |
Realized gain (loss) | | | 6 | | | | — | | | | — | | | | — | | | | 6 | | |
Change in unrealized appreciation
(depreciation)(a) | | | 83 | | | | (3,788 | ) | | | (16,570 | ) | | | 31,730 | | | | 11,455 | | |
Sales | | | (152 | ) | | | — | | | | — | | | | (291,156 | ) | | | (291,308 | ) | |
Purchases | | | — | | | | 3,011,063 | | | | 2,689,228 | | | | 2,250,000 | | | | 7,950,291 | | |
Transfers into Level 3 | | | — | | | | — | | | | — | | | | — | | | | — | | |
Transfers out of Level 3 | | | — | | | | — | | | | — | | | | — | | | | — | | |
Balance as of August 31, 2013 | | | 1,630 | | | | 3,007,275 | | | | 2,672,658 | | | | 1,990,280 | | | | 7,671,843 | | |
(a) Change in unrealized appreciation (depreciation) relating to securities held at August 31, 2013 was $11,455, which is comprised of Residential Mortgage-Backed Securities — Non-Agency of $83, Commercial Mortgage-Backed Securities — Agency of $(3,788), Commercial Mortgage-Backed Securities — Non-Agency of $(16,570) and Asset-Backed Securities — Non-Agency of $31,730.
The Fund's assets assigned to the Level 3 category are valued utilizing the valuation technique deemed the most appropriate in the circumstances.
Certain residential mortgage-backed securities classified as Level 3 securities are valued using the market approach. To determine fair value for these securities, management considered various factors which may have included, but were not limited to, estimated cash flows of the securities, discount rates observed in the market for similar assets as well as observed yields on securities management deemed comparable. Significant increases (decreases) to any of these inputs would result in a significantly lower (higher) fair value measurement. Generally, a change in observable yields on comparable securities would result in a directionally similar change to discount rates.
The accompanying Notes to Financial Statements are an integral part of this statement.
Annual Report 2013
29
Portfolio of Investments (continued)
August 31, 2013
Fair Value Measurements (continued)
Certain commercial and asset backed securities as well as senior loans classified as Level 3 are valued using the market approach and utilize single market quotations from broker dealers which may have included, but not limited to, the distressed nature of the security and observable transactions for similar assets in the market. Significant increases (decreases) to any of these inputs would result in a significantly lower (higher) fair value measurement.
Financial Assets were transferred from Level 2 to Level 3 due to utilizing a single market quotation from a broker dealer. As a result, as of period end, management determined to value the security(s) under consistently applied procedures established by and under the general supervision of the Board of Trustee.
Transfers in and/or out of Level 3 are determined based on the fair value at the beginning of the period for security positions held throughout the period.
The accompanying Notes to Financial Statements are an integral part of this statement.
Annual Report 2013
30
Statement of Assets and Liabilities
August 31, 2013
Assets | |
Investments, at value | |
Unaffiliated issuers (identified cost $1,271,704,658) | | $ | 1,519,942,190 | | |
Affiliated issuers (identified cost $164,611,110) | | | 164,611,110 | | |
Total investments (identified cost $1,436,315,768) | | | 1,684,553,300 | | |
Receivable for: | |
Investments sold | | | 2,293,515 | | |
Capital shares sold | | | 8,375,460 | | |
Dividends | | | 1,699,304 | | |
Interest | | | 3,129,837 | | |
Reclaims | | | 6,690 | | |
Variation margin | | | 11,594 | | |
Equity-linked notes (Note 9) | | | 45,055 | | |
Prepaid expenses | | | 17,968 | | |
Trustees' deferred compensation plan | | | 34,781 | | |
Other assets | | | 3,553 | | |
Total assets | | | 1,700,171,057 | | |
Liabilities | |
Payable for: | |
Investments purchased | | | 8,636,291 | | |
Investments purchased on a delayed delivery basis | | | 97,695,262 | | |
Capital shares purchased | | | 2,042,468 | | |
Variation margin | | | 5,468 | | |
Investment management fees | | | 26,562 | | |
Distribution and/or service fees | | | 11,394 | | |
Transfer agent fees | | | 211,837 | | |
Administration fees | | | 2,384 | | |
Plan administration fees | | | 15,082 | | |
Compensation of board members | | | 8,035 | | |
Chief compliance officer expenses | | | 141 | | |
Other expenses | | | 127,394 | | |
Trustees' deferred compensation plan | | | 34,781 | | |
Total liabilities | | | 108,817,099 | | |
Net assets applicable to outstanding capital stock | | $ | 1,591,353,958 | | |
Represented by | |
Paid-in capital | | $ | 1,401,980,185 | | |
Undistributed net investment income | | | 2,171,264 | | |
Accumulated net realized loss | | | (61,038,995 | ) | |
Unrealized appreciation (depreciation) on: | |
Investments | | | 248,237,532 | | |
Foreign currency translations | | | 31 | | |
Futures contracts | | | 3,941 | | |
Total — representing net assets applicable to outstanding capital stock | | $ | 1,591,353,958 | | |
The accompanying Notes to Financial Statements are an integral part of this statement.
Annual Report 2013
31
Statement of Assets and Liabilities (continued)
August 31, 2013
Class A | |
Net assets | | $ | 994,162,776 | | |
Shares outstanding | | | 31,235,881 | | |
Net asset value per share | | $ | 31.83 | | |
Maximum offering price per share(a) | | $ | 33.77 | | |
Class B | |
Net assets | | $ | 12,225,023 | | |
Shares outstanding | | | 385,072 | | |
Net asset value per share | | $ | 31.75 | | |
Class C | |
Net assets | | $ | 149,580,846 | | |
Shares outstanding | | | 4,711,262 | | |
Net asset value per share | | $ | 31.75 | | |
Class K(b) | |
Net assets | | $ | 70,410,835 | | |
Shares outstanding | | | 2,214,484 | | |
Net asset value per share | | $ | 31.80 | | |
Class R | |
Net assets | | $ | 13,112,940 | | |
Shares outstanding | | | 412,152 | | |
Net asset value per share | | $ | 31.82 | | |
Class R4 | |
Net assets | | $ | 3,514,922 | | |
Shares outstanding | | | 109,745 | | |
Net asset value per share | | $ | 32.03 | | |
Class R5 | |
Net assets | | $ | 29,617,417 | | |
Shares outstanding | | | 931,453 | | |
Net asset value per share | | $ | 31.80 | | |
Class Y | |
Net assets | | $ | 9,784,319 | | |
Shares outstanding | | | 305,350 | | |
Net asset value per share | | $ | 32.04 | | |
Class Z | |
Net assets | | $ | 308,944,880 | | |
Shares outstanding | | | 9,719,888 | | |
Net asset value per share | | $ | 31.78 | | |
(a) The maximum offering price per share is calculated by dividing the net asset value per share by 1.0 minus the maximum sales charge of 5.75%.
(b) Effective October 25, 2012, Class R4 shares were renamed Class K shares.
The accompanying Notes to Financial Statements are an integral part of this statement.
Annual Report 2013
32
Statement of Operations
Year Ended August 31, 2013
Net investment income | |
Income: | |
Dividends — unaffiliated issuers | | $ | 16,723,658 | | |
Dividends — affiliated issuers | | | 167,337 | | |
Interest | | | 11,210,834 | | |
Income from securities lending — net | | | 6,829 | | |
Foreign taxes withheld | | | (34,482 | ) | |
Total income | | | 28,074,176 | | |
Expenses: | |
Investment management fees | | | 8,516,272 | | |
Distribution and/or service fees | | | | | |
Class A | | | 2,158,130 | | |
Class B | | | 124,275 | | |
Class C | | | 1,053,511 | | |
Class R | | | 47,390 | | |
Transfer agent fees | | | | | |
Class A | | | 1,528,545 | | |
Class B | | | 22,021 | | |
Class C | | | 186,231 | | |
Class K(a) | | | 33,279 | | |
Class R | | | 16,694 | | |
Class R4(b) | | | 1,085 | | |
Class R5 | | | 2,972 | | |
Class Z | | | 550,761 | | |
Administration fees | | | 763,256 | | |
Plan administration fees | | | | | |
Class K(a) | | | 166,252 | | |
Compensation of board members | | | 48,593 | | |
Custodian fees | | | 41,077 | | |
Printing and postage fees | | | 212,531 | | |
Registration fees | | | 135,503 | | |
Professional fees | | | 72,348 | | |
Chief compliance officer expenses | | | 909 | | |
Other | | | 48,117 | | |
Total expenses | | | 15,729,752 | | |
Fees waived or expenses reimbursed by Investment Manager and its affiliates | | | (174,344 | ) | |
Expense reductions | | | (5,347 | ) | |
Total net expenses | | | 15,550,061 | | |
Net investment income | | | 12,524,115 | | |
Realized and unrealized gain (loss) — net | |
Net realized gain (loss) on: | | | | | |
Investments | | | 81,465,945 | | |
Futures contracts | | | 1,051,783 | | |
Net realized gain | | | 82,517,728 | | |
Net change in unrealized appreciation (depreciation) on: | | | | | |
Investments | | | 80,316,539 | | |
Foreign currency translations | | | 55 | | |
Futures contracts | | | 132,750 | | |
Receivables for equity-linked notes (Note 9) | | | (114,468 | ) | |
Net change in unrealized appreciation (depreciation) | | | 80,334,876 | | |
Net realized and unrealized gain | | | 162,852,604 | | |
Net increase in net assets resulting from operations | | $ | 175,376,719 | | |
(a) Effective October 25, 2012, Class R4 shares were renamed Class K shares.
(b) Class R4 shares are for the period from November 8, 2012 (commencement of operations) to August 31, 2013.
The accompanying Notes to Financial Statements are an integral part of this statement.
Annual Report 2013
33
Statement of Changes in Net Assets
| | | Year Ended
August 31,
2013(a) | | Year Ended
August 31,
2012 | |
Operations | |
Net investment income | | $ | 12,524,115 | | | $ | 13,904,385 | | |
Net realized gain | | | 82,517,728 | | | | 18,479,474 | | |
Net change in unrealized appreciation (depreciation) | | | 80,334,876 | | | | 103,514,576 | | |
Net increase in net assets resulting from operations | | | 175,376,719 | | | | 135,898,435 | | |
Distributions to shareholders | |
Net investment income | |
Class A | | | (8,351,330 | ) | | | (8,851,932 | ) | |
Class B | | | (35,460 | ) | | | (70,723 | ) | |
Class C | | | (242,901 | ) | | | (273,715 | ) | |
Class K(b) | | | (723,281 | ) | | | (702,944 | ) | |
Class R | | | (52,906 | ) | | | (10,213 | ) | |
Class R4 | | | (393 | ) | | | — | | |
Class R5 | | | (12,563 | ) | | | (215 | ) | |
Class Y | | | (24,253 | ) | | | — | | |
Class Z | | | (3,857,154 | ) | | | (3,896,376 | ) | |
Net realized gains | |
Class A | | | — | | | | (20,711,136 | ) | |
Class B | | | — | | | | (429,546 | ) | |
Class C | | | — | | | | (1,560,825 | ) | |
Class K(b) | | | — | | | | (1,557,751 | ) | |
Class R | | | — | | | | (20,767 | ) | |
Class R5 | | | — | | | | (410 | ) | |
Class Z | | | — | | | | (7,758,803 | ) | |
Total distributions to shareholders | | | (13,300,241 | ) | | | (45,845,356 | ) | |
Increase (decrease) in net assets from capital stock activity | | | 219,958,671 | | | | 120,185,018 | | |
Total increase in net assets | | | 382,035,149 | | | | 210,238,097 | | |
Net assets at beginning of year | | | 1,209,318,809 | | | | 999,080,712 | | |
Net assets at end of year | | $ | 1,591,353,958 | | | $ | 1,209,318,809 | | |
Undistributed net investment income | | $ | 2,171,264 | | | $ | 2,407,534 | | |
(a) Class R4 and Class Y shares are for the period from November 8, 2012 (commencement of operations) to August 31, 2013.
(b) Effective October 25, 2012, Class R4 shares were renamed Class K shares.
The accompanying Notes to Financial Statements are an integral part of this statement.
Annual Report 2013
34
Statement of Changes in Net Assets (continued)
| | | Year Ended August 31, 2013(a) | | Year Ended August 31, 2012 | |
| | | Shares | | Dollars ($) | | Shares | | Dollars ($) | |
Capital stock activity | |
Class A shares | |
Subscriptions(b) | | | 8,031,666 | | | | 246,384,655 | | | | 5,888,205 | | | | 157,375,381 | | |
Distributions reinvested | | | 251,262 | | | | 7,392,506 | | | | 1,016,506 | | | | 26,143,345 | | |
Redemptions | | | (4,492,901 | ) | | | (135,640,379 | ) | | | (4,697,297 | ) | | | (124,960,018 | ) | |
Net increase | | | 3,790,027 | | | | 118,136,782 | | | | 2,207,414 | | | | 58,558,708 | | |
Class B shares | |
Subscriptions | | | 114,543 | | | | 3,467,901 | | | | 104,594 | | | | 2,795,311 | | |
Distributions reinvested | | | 1,091 | | | | 31,219 | | | | 17,317 | | | | 443,012 | | |
Redemptions(b) | | | (153,689 | ) | | | (4,694,705 | ) | | | (246,060 | ) | | | (6,581,269 | ) | |
Net decrease | | | (38,055 | ) | | | (1,195,585 | ) | | | (124,149 | ) | | | (3,342,946 | ) | |
Class C shares | |
Subscriptions | | | 2,479,652 | | | | 75,955,846 | | | | 1,063,387 | | | | 28,710,940 | | |
Distributions reinvested | | | 7,404 | | | | 211,918 | | | | 60,505 | | | | 1,549,110 | | |
Redemptions | | | (432,191 | ) | | | (13,108,219 | ) | | | (323,177 | ) | | | (8,622,713 | ) | |
Net increase | | | 2,054,865 | | | | 63,059,545 | | | | 800,715 | | | | 21,637,337 | | |
Class K shares(c) | |
Subscriptions | | | 596,232 | | | | 18,179,438 | | | | 573,065 | | | | 15,367,302 | | |
Distributions reinvested | | | 24,585 | | | | 723,231 | | | | 87,919 | | | | 2,260,519 | | |
Redemptions | | | (561,650 | ) | | | (17,176,288 | ) | | | (380,929 | ) | | | (10,287,631 | ) | |
Net increase | | | 59,167 | | | | 1,726,381 | | | | 280,055 | | | | 7,340,190 | | |
Class R shares | |
Subscriptions | | | 402,466 | | | | 11,958,332 | | | | 92,324 | | | | 2,547,632 | | |
Distributions reinvested | | | 1,666 | | | | 49,376 | | | | 1,183 | | | | 30,587 | | |
Redemptions | | | (89,181 | ) | | | (2,725,958 | ) | | | (13,869 | ) | | | (384,023 | ) | |
Net increase | | | 314,951 | | | | 9,281,750 | | | | 79,638 | | | | 2,194,196 | | |
Class R4 shares | |
Subscriptions | | | 148,818 | | | | 4,719,998 | | | | — | | | | — | | |
Distributions reinvested | | | 12 | | | | 369 | | | | — | | | | — | | |
Redemptions | | | (39,085 | ) | | | (1,272,625 | ) | | | — | | | | — | | |
Net increase | | | 109,745 | | | | 3,447,742 | | | | — | | | | — | | |
Class R5 shares | |
Subscriptions | | | 944,567 | | | | 29,428,724 | | | | — | | | | — | | |
Distributions reinvested | | | 404 | | | | 12,481 | | | | 14 | | | | 371 | | |
Redemptions | | | (14,035 | ) | | | (452,178 | ) | | | — | | | | — | | |
Net increase | | | 930,936 | | | | 28,989,027 | | | | 14 | | | | 371 | | |
Class Y shares | |
Subscriptions | | | 316,772 | | | | 10,174,990 | | | | — | | | | — | | |
Distributions reinvested | | | 192 | | | | 5,976 | | | | — | | | | — | | |
Redemptions | | | (11,614 | ) | | | (374,587 | ) | | | — | | | | — | | |
Net increase | | | 305,350 | | | | 9,806,379 | | | | — | | | | — | | |
The accompanying Notes to Financial Statements are an integral part of this statement.
Annual Report 2013
35
Statement of Changes in Net Assets (continued)
| | | Year Ended August 31, 2013(a) | | Year Ended August 31, 2012 | |
| | | Shares | | Dollars ($) | | Shares | | Dollars ($) | |
Capital stock activity (continued) | |
Class Z shares | |
Subscriptions | | | 3,273,648 | | | | 98,595,867 | | | | 3,718,947 | | | | 99,363,526 | | |
Distributions reinvested | | | 109,662 | | | | 3,225,831 | | | | 360,588 | | | | 9,272,757 | | |
Redemptions | | | (3,777,637 | ) | | | (115,115,048 | ) | | | (2,795,157 | ) | | | (74,839,121 | ) | |
Net increase (decrease) | | | (394,327 | ) | | | (13,293,350 | ) | | | 1,284,378 | | | | 33,797,162 | | |
Total net increase | | | 7,132,659 | | | | 219,958,671 | | | | 4,528,065 | | | | 120,185,018 | | |
(a) Class R4 and Class Y shares are for the period from November 8, 2012 (commencement of operations) to August 31, 2013.
(b) Includes conversions of Class B shares to Class A shares, if any.
(c) Effective October 25, 2012, Class R4 shares were renamed Class K shares.
The accompanying Notes to Financial Statements are an integral part of this statement.
Annual Report 2013
36
The following tables are intended to help you understand the Fund's financial performance. Certain information reflects financial results for a single share of a class held for the periods shown. Per share net investment income (loss) amounts are calculated based on average shares outstanding during the period. Total return assumes reinvestment of all dividends and distributions, if any. Total return does not reflect payment of sales charges, if any, and is not annualized for periods of less than one year.
| | | Year Ended August 31, | |
Class A | | 2013 | | 2012 | | 2011 | | 2010 | | 2009 | |
Per share data | |
Net asset value, beginning of period | | $ | 28.21 | | | $ | 26.06 | | | $ | 23.29 | | | $ | 22.46 | | | $ | 24.03 | | |
Income from investment operations: | |
Net investment income | | | 0.28 | | | | 0.33 | | | | 0.37 | | | | 0.35 | | | | 0.47 | | |
Net realized and unrealized gain (loss) | | | 3.64 | | | | 2.97 | | | | 2.79 | | | | 0.85 | | | | (1.52 | ) | |
Total from investment operations | | | 3.92 | | | | 3.30 | | | | 3.16 | | | | 1.20 | | | | (1.05 | ) | |
Less distributions to shareholders: | |
Net investment income | | | (0.30 | ) | | | (0.34 | ) | | | (0.39 | ) | | | (0.37 | ) | | | (0.52 | ) | |
Net realized gains | | | — | | | | (0.81 | ) | | | — | | | | — | | | | — | | |
Total distributions to shareholders | | | (0.30 | ) | | | (1.15 | ) | | | (0.39 | ) | | | (0.37 | ) | | | (0.52 | ) | |
Proceeds from regulatory settlements | | | — | | | | — | | | | — | | | | 0.00 | (a) | | | — | | |
Net asset value, end of period | | $ | 31.83 | | | $ | 28.21 | | | $ | 26.06 | | | $ | 23.29 | | | $ | 22.46 | | |
Total return | | | 13.97 | % | | | 13.14 | % | | | 13.57 | % | | | 5.33 | % | | | (4.03 | %) | |
Ratios to average net assets(b) | |
Total gross expenses | | | 1.14 | % | | | 1.16 | % | | | 1.10 | % | | | 1.02 | % | | | 1.04 | % | |
Total net expenses(c) | | | 1.13 | %(d) | | | 1.11 | %(d) | | | 1.03 | %(d) | | | 1.02 | %(d) | | | 1.04 | %(d) | |
Net investment income | | | 0.91 | % | | | 1.24 | % | | | 1.38 | % | | | 1.47 | % | | | 2.33 | % | |
Supplemental data | |
Net assets, end of period (in thousands) | | $ | 994,163 | | | $ | 774,214 | | | $ | 657,604 | | | $ | 65,112 | | | $ | 19,152 | | |
Portfolio turnover | | | 141 | %(e) | | | 130 | %(e) | | | 99 | % | | | 89 | % | | | 102 | % | |
Notes to Financial Highlights
(a) Rounds to zero.
(b) In addition to the fees and expenses which the Fund bears directly, the Fund indirectly bears a pro rata share of the fees and expenses of the acquired funds in which it invests. Such indirect expenses are not included in the reported expense ratios.
(c) Total net expenses include the impact of certain waivers/reimbursements made by the Investment Manager and certain of its affiliates, if applicable.
(d) The benefits derived from expense reductions had an impact of less than 0.01%.
(e) Includes mortgage dollar rolls. If mortgage dollar roll transactions were excluded, the portfolio turnover would have been 65% and 66% for the years ended August 31, 2013 and 2012, respectively.
The accompanying Notes to Financial Statements are an integral part of this statement.
Annual Report 2013
37
Financial Highlights (continued)
| | | Year Ended August 31, | |
Class B | | 2013 | | 2012 | | 2011 | | 2010 | | 2009 | |
Per share data | |
Net asset value, beginning of period | | $ | 28.15 | | | $ | 26.00 | | | $ | 23.24 | | | $ | 22.41 | | | $ | 23.99 | | |
Income from investment operations: | |
Net investment income | | | 0.05 | | | | 0.13 | | | | 0.17 | | | | 0.17 | | | | 0.32 | | |
Net realized and unrealized gain (loss) | | | 3.63 | | | | 2.97 | | | | 2.78 | | | | 0.85 | | | | (1.53 | ) | |
Total from investment operations | | | 3.68 | | | | 3.10 | | | | 2.95 | | | | 1.02 | | | | (1.21 | ) | |
Less distributions to shareholders: | |
Net investment income | | | (0.08 | ) | | | (0.14 | ) | | | (0.19 | ) | | | (0.19 | ) | | | (0.37 | ) | |
Net realized gains | | | — | | | | (0.81 | ) | | | — | | | | — | | | | — | | |
Total distributions to shareholders | | | (0.08 | ) | | | (0.95 | ) | | | (0.19 | ) | | | (0.19 | ) | | | (0.37 | ) | |
Proceeds from regulatory settlements | | | — | | | | — | | | | — | | | | 0.00 | (a) | | | — | | |
Net asset value, end of period | | $ | 31.75 | | | $ | 28.15 | | | $ | 26.00 | | | $ | 23.24 | | | $ | 22.41 | | |
Total return | | | 13.12 | % | | | 12.30 | % | | | 12.71 | % | | | 4.56 | % | | | (4.82 | %) | |
Ratios to average net assets(b) | |
Total gross expenses | | | 1.89 | % | | | 1.91 | % | | | 1.84 | % | | | 1.77 | % | | | 1.79 | % | |
Total net expenses(c) | | | 1.88 | %(d) | | | 1.86 | %(d) | | | 1.78 | %(d) | | | 1.77 | %(d) | | | 1.79 | %(d) | |
Net investment income | | | 0.16 | % | | | 0.49 | % | | | 0.64 | % | | | 0.73 | % | | | 1.63 | % | |
Supplemental data | |
Net assets, end of period (in thousands) | | $ | 12,225 | | | $ | 11,910 | | | $ | 14,227 | | | $ | 6,683 | | | $ | 6,934 | | |
Portfolio turnover | | | 141 | %(e) | | | 130 | %(e) | | | 99 | % | | | 89 | % | | | 102 | % | |
Notes to Financial Highlights
(a) Rounds to zero.
(b) In addition to the fees and expenses which the Fund bears directly, the Fund indirectly bears a pro rata share of the fees and expenses of the acquired funds in which it invests. Such indirect expenses are not included in the reported expense ratios.
(c) Total net expenses include the impact of certain waivers/reimbursements made by the Investment Manager and certain of its affiliates, if applicable.
(d) The benefits derived from expense reductions had an impact of less than 0.01%.
(e) Includes mortgage dollar rolls. If mortgage dollar roll transactions were excluded, the portfolio turnover would have been 65% and 66% for the years ended August 31, 2013 and 2012, respectively.
The accompanying Notes to Financial Statements are an integral part of this statement.
Annual Report 2013
38
Financial Highlights (continued)
| | | Year Ended August 31, | |
Class C | | 2013 | | 2012 | | 2011 | | 2010 | | 2009 | |
Per share data | |
Net asset value, beginning of period | | $ | 28.15 | | | $ | 25.99 | | | $ | 23.24 | | | $ | 22.42 | | | $ | 23.99 | | |
Income from investment operations: | |
Net investment income | | | 0.05 | | | | 0.13 | | | | 0.17 | | | | 0.17 | | | | 0.31 | | |
Net realized and unrealized gain (loss) | | | 3.63 | | | | 2.98 | | | | 2.77 | | | | 0.84 | | | | (1.51 | ) | |
Total from investment operations | | | 3.68 | | | | 3.11 | | | | 2.94 | | | | 1.01 | | | | (1.20 | ) | |
Less distributions to shareholders: | |
Net investment income | | | (0.08 | ) | | | (0.14 | ) | | | (0.19 | ) | | | (0.19 | ) | | | (0.37 | ) | |
Net realized gains | | | — | | | | (0.81 | ) | | | — | | | | — | | | | — | | |
Total distributions to shareholders | | | (0.08 | ) | | | (0.95 | ) | | | (0.19 | ) | | | (0.19 | ) | | | (0.37 | ) | |
Proceeds from regulatory settlements | | | — | | | | — | | | | — | | | | 0.00 | (a) | | | — | | |
Net asset value, end of period | | $ | 31.75 | | | $ | 28.15 | | | $ | 25.99 | | | $ | 23.24 | | | $ | 22.42 | | |
Total return | | | 13.12 | % | | | 12.34 | % | | | 12.67 | % | | | 4.51 | % | | | (4.77 | %) | |
Ratios to average net assets(b) | |
Total gross expenses | | | 1.89 | % | | | 1.91 | % | | | 1.84 | % | | | 1.77 | % | | | 1.79 | % | |
Total net expenses(c) | | | 1.88 | %(d) | | | 1.86 | %(d) | | | 1.79 | %(d) | | | 1.77 | %(d) | | | 1.79 | %(d) | |
Net investment income | | | 0.16 | % | | | 0.50 | % | | | 0.62 | % | | | 0.71 | % | | | 1.57 | % | |
Supplemental data | |
Net assets, end of period (in thousands) | | $ | 149,581 | | | $ | 74,771 | | | $ | 48,236 | | | $ | 25,462 | | | $ | 11,014 | | |
Portfolio turnover | | | 141 | %(e) | | | 130 | %(e) | | | 99 | % | | | 89 | % | | | 102 | % | |
Notes to Financial Highlights
(a) Rounds to zero.
(b) In addition to the fees and expenses which the Fund bears directly, the Fund indirectly bears a pro rata share of the fees and expenses of the acquired funds in which it invests. Such indirect expenses are not included in the reported expense ratios.
(c) Total net expenses include the impact of certain waivers/reimbursements made by the Investment Manager and certain of its affiliates, if applicable.
(d) The benefits derived from expense reductions had an impact of less than 0.01%.
(e) Includes mortgage dollar rolls. If mortgage dollar roll transactions were excluded, the portfolio turnover would have been 65% and 66% for the years ended August 31, 2013 and 2012, respectively.
The accompanying Notes to Financial Statements are an integral part of this statement.
Annual Report 2013
39
Financial Highlights (continued)
| | | Year Ended August 31, | |
Class K(a) | | 2013 | | 2012 | | 2011(b) | |
Per share data | |
Net asset value, beginning of period | | $ | 28.18 | | | $ | 26.02 | | | $ | 27.16 | | |
Income from investment operations: | |
Net investment income | | | 0.31 | | | | 0.35 | | | | 0.18 | | |
Net realized and unrealized gain (loss) | | | 3.64 | | | | 2.98 | | | | (1.15 | )(c) | |
Total from investment operations | | | 3.95 | | | | 3.33 | | | | (0.97 | ) | |
Less distributions to shareholders: | |
Net investment income | | | (0.33 | ) | | | (0.36 | ) | | | (0.17 | ) | |
Net realized gains | | | — | | | | (0.81 | ) | | | — | | |
Total distributions to shareholders | | | (0.33 | ) | | | (1.17 | ) | | | (0.17 | ) | |
Net asset value, end of period | | $ | 31.80 | | | $ | 28.18 | | | $ | 26.02 | | |
Total return | | | 14.11 | % | | | 13.26 | % | | | (3.59 | %) | |
Ratios to average net assets(d) | |
Total gross expenses | | | 1.01 | % | | | 1.03 | % | | | 1.02 | %(e) | |
Total net expenses(f) | | | 1.01 | % | | | 1.03 | % | | | 1.02 | %(e)(g) | |
Net investment income | | | 1.02 | % | | | 1.32 | % | | | 1.40 | %(e) | |
Supplemental data | |
Net assets, end of period (in thousands) | | $ | 70,411 | | | $ | 60,735 | | | $ | 48,799 | | |
Portfolio turnover | | | 141 | %(h) | | | 130 | %(h) | | | 99 | % | |
Notes to Financial Highlights
(a) Effective October 25, 2012, Class R4 shares were renamed Class K shares.
(b) For the period from March 7, 2011 (commencement of operations) to August 31, 2011.
(c) Calculation of the net gain (loss) per share (both realized and unrealized) does not correlate to the aggregate realized and unrealized gain (loss) presented in the Statement of Operations due to the timing of sales and repurchases of Fund shares in relation to fluctuations in the market value of the portfolio.
(d) In addition to the fees and expenses which the Fund bears directly, the Fund indirectly bears a pro rata share of the fees and expenses of the acquired funds in which it invests. Such indirect expenses are not included in the reported expense ratios.
(e) Annualized.
(f) Total net expenses include the impact of certain waivers/reimbursements made by the Investment Manager and certain of its affiliates, if applicable.
(g) The benefits derived from expense reductions had an impact of less than 0.01%.
(h) Includes mortgage dollar rolls. If mortgage dollar roll transactions were excluded, the portfolio turnover would have been 65% and 66% for the years ended August 31, 2013 and 2012, respectively.
The accompanying Notes to Financial Statements are an integral part of this statement.
Annual Report 2013
40
Financial Highlights (continued)
| | | Year Ended August 31, | |
Class R | | 2013 | | 2012 | | 2011(a) | |
Per share data | |
Net asset value, beginning of period | | $ | 28.19 | | | $ | 26.04 | | | $ | 24.62 | | |
Income from investment operations: | |
Net investment income | | | 0.20 | | | | 0.27 | | | | 0.30 | | |
Net realized and unrealized gain | | | 3.65 | | | | 2.97 | | | | 1.35 | | |
Total from investment operations | | | 3.85 | | | | 3.24 | | | | 1.65 | | |
Less distributions to shareholders: | |
Net investment income | | | (0.22 | ) | | | (0.28 | ) | | | (0.23 | ) | |
Net realized gains | | | — | | | | (0.81 | ) | | | — | | |
Total distributions to shareholders | | | (0.22 | ) | | | (1.09 | ) | | | (0.23 | ) | |
Net asset value, end of period | | $ | 31.82 | | | $ | 28.19 | | | $ | 26.04 | | |
Total return | | | 13.73 | % | | | 12.87 | % | | | 6.70 | % | |
Ratios to average net assets(b) | |
Total gross expenses | | | 1.39 | % | | | 1.42 | % | | | 1.37 | %(c) | |
Total net expenses(d) | | | 1.38 | %(e) | | | 1.36 | %(e) | | | 1.28 | %(c)(e) | |
Net investment income | | | 0.64 | % | | | 1.01 | % | | | 1.20 | %(c) | |
Supplemental data | |
Net assets, end of period (in thousands) | | $ | 13,113 | | | $ | 2,740 | | | $ | 457 | | |
Portfolio turnover | | | 141 | %(f) | | | 130 | %(f) | | | 99 | % | |
Notes to Financial Highlights
(a) For the period from September 27, 2010 (commencement of operations) to August 31, 2011.
(b) In addition to the fees and expenses which the Fund bears directly, the Fund indirectly bears a pro rata share of the fees and expenses of the acquired funds in which it invests. Such indirect expenses are not included in the reported expense ratios.
(c) Annualized.
(d) Total net expenses include the impact of certain waivers/reimbursements made by the Investment Manager and certain of its affiliates, if applicable.
(e) The benefits derived from expense reductions had an impact of less than 0.01%.
(f) Includes mortgage dollar rolls. If mortgage dollar roll transactions were excluded, the portfolio turnover would have been 65% and 66% for the years ended August 31, 2013 and 2012, respectively.
The accompanying Notes to Financial Statements are an integral part of this statement.
Annual Report 2013
41
Financial Highlights (continued)
Class R4 | | Year Ended
August 31,
2013(a) | |
Per share data | |
Net asset value, beginning of period | | $ | 28.25 | | |
Income from investment operations: | |
Net investment income | | | 0.29 | | |
Net realized and unrealized gain | | | 3.76 | | |
Total from investment operations | | | 4.05 | | |
Less distributions to shareholders: | |
Net investment income | | | (0.27 | ) | |
Total distributions to shareholders | | | (0.27 | ) | |
Net asset value, end of period | | $ | 32.03 | | |
Total return | | | 14.40 | % | |
Ratios to average net assets(b) | |
Total gross expenses | | | 0.88 | %(c) | |
Total net expenses(d) | | | 0.88 | %(c)(e) | |
Net investment income | | | 1.14 | %(c) | |
Supplemental data | |
Net assets, end of period (in thousands) | | $ | 3,515 | | |
Portfolio turnover | | | 141 | %(f) | |
Notes to Financial Highlights
(a) For the period from November 8, 2012 (commencement of operations) to August 31, 2013.
(b) In addition to the fees and expenses which the Fund bears directly, the Fund indirectly bears a pro rata share of the fees and expenses of the acquired funds in which it invests. Such indirect expenses are not included in the reported expense ratios.
(c) Annualized.
(d) Total net expenses include the impact of certain waivers/reimbursements made by the Investment Manager and certain of its affiliates, if applicable.
(e) The benefits derived from expense reductions had an impact of less than 0.01%.
(f) Includes mortgage dollar rolls. If mortgage dollar roll transactions were excluded, the portfolio turnover would have been 65% for the year ended August 31, 2013.
The accompanying Notes to Financial Statements are an integral part of this statement.
Annual Report 2013
42
Financial Highlights (continued)
| | | Year Ended August 31, | |
Class R5 | | 2013 | | 2012 | | 2011(a) | |
Per share data | |
Net asset value, beginning of period | | $ | 28.17 | | | $ | 26.02 | | | $ | 27.16 | | |
Income from investment operations: | |
Net investment income | | | 0.39 | | | | 0.42 | | | | 0.24 | | |
Net realized and unrealized gain (loss) | | | 3.64 | | | | 2.97 | | | | (1.18 | )(b) | |
Total from investment operations | | | 4.03 | | | | 3.39 | | | | (0.94 | ) | |
Less distributions to shareholders: | |
Net investment income | | | (0.40 | ) | | | (0.43 | ) | | | (0.20 | ) | |
Net realized gains | | | — | | | | (0.81 | ) | | | — | | |
Total distributions to shareholders | | | (0.40 | ) | | | (1.24 | ) | | | (0.20 | ) | |
Net asset value, end of period | | $ | 31.80 | | | $ | 28.17 | | | $ | 26.02 | | |
Total return | | | 14.42 | % | | | 13.52 | % | | | (3.46 | %) | |
Ratios to average net assets(c) | |
Total gross expenses | | | 0.76 | % | | | 0.78 | % | | | 0.75 | %(d) | |
Total net expenses(e) | | | 0.76 | % | | | 0.78 | % | | | 0.73 | %(d)(f) | |
Net investment income | | | 1.26 | % | | | 1.57 | % | | | 1.79 | %(d) | |
Supplemental data | |
Net assets, end of period (in thousands) | | $ | 29,617 | | | $ | 15 | | | $ | 13 | | |
Portfolio turnover | | | 141 | %(g) | | | 130 | %(g) | | | 99 | % | |
Notes to Financial Highlights
(a) For the period from March 7, 2011 (commencement of operations) to August 31, 2011.
(b) Calculation of the net gain (loss) per share (both realized and unrealized) does not correlate to the aggregate realized and unrealized gain (loss) presented in the Statement of Operations due to the timing of sales and repurchases of Fund shares in relation to fluctuations in the market value of the portfolio.
(c) In addition to the fees and expenses which the Fund bears directly, the Fund indirectly bears a pro rata share of the fees and expenses of the acquired funds in which it invests. Such indirect expenses are not included in the reported expense ratios.
(d) Annualized.
(e) Total net expenses include the impact of certain waivers/reimbursements made by the Investment Manager and certain of its affiliates, if applicable.
(f) The benefits derived from expense reductions had an impact of less than 0.01%.
(g) Includes mortgage dollar rolls. If mortgage dollar roll transactions were excluded, the portfolio turnover would have been 65% and 66% for the years ended August 31, 2013 and 2012, respectively.
The accompanying Notes to Financial Statements are an integral part of this statement.
Annual Report 2013
43
Financial Highlights (continued)
Class Y | | Year Ended
August 31,
2013(a) | |
Per share data | |
Net asset value, beginning of period | | $ | 28.25 | | |
Income from investment operations: | |
Net investment income | | | 0.34 | | |
Net realized and unrealized gain | | | 3.75 | | |
Total from investment operations | | | 4.09 | | |
Less distributions to shareholders: | |
Net investment income | | | (0.30 | ) | |
Total distributions to shareholders | | | (0.30 | ) | |
Net asset value, end of period | | $ | 32.04 | | |
Total return | | | 14.54 | % | |
Ratios to average net assets(b) | |
Total gross expenses | | | 0.70 | %(c) | |
Total net expenses(d) | | | 0.70 | %(c) | |
Net investment income | | | 1.34 | %(c) | |
Supplemental data | |
Net assets, end of period (in thousands) | | $ | 9,784 | | |
Portfolio turnover | | | 141 | %(e) | |
Notes to Financial Highlights
(a) For the period from November 8, 2012 (commencement of operations) to August 31, 2013.
(b) In addition to the fees and expenses which the Fund bears directly, the Fund indirectly bears a pro rata share of the fees and expenses of the acquired funds in which it invests. Such indirect expenses are not included in the reported expense ratios.
(c) Annualized.
(d) Total net expenses include the impact of certain waivers/reimbursements made by the Investment Manager and certain of its affiliates, if applicable.
(e) Includes mortgage dollar rolls. If mortgage dollar roll transactions were excluded, the portfolio turnover would have been 65% for the year ended August 31, 2013.
The accompanying Notes to Financial Statements are an integral part of this statement.
Annual Report 2013
44
Financial Highlights (continued)
| | | Year Ended August 31, | |
Class Z | | 2013 | | 2012 | | 2011 | | 2010 | | 2009 | |
Per share data | |
Net asset value, beginning of period | | $ | 28.17 | | | $ | 26.02 | | | $ | 23.27 | | | $ | 22.43 | | | $ | 24.02 | | |
Income from investment operations: | |
Net investment income | | | 0.35 | | | | 0.40 | | | | 0.43 | | | | 0.41 | | | | 0.52 | | |
Net realized and unrealized gain (loss) | | | 3.63 | | | | 2.96 | | | | 2.77 | | | | 0.86 | | | | (1.54 | ) | |
Total from investment operations | | | 3.98 | | | | 3.36 | | | | 3.20 | | | | 1.27 | | | | (1.02 | ) | |
Less distributions to shareholders: | |
Net investment income | | | (0.37 | ) | | | (0.40 | ) | | | (0.45 | ) | | | (0.43 | ) | | | (0.57 | ) | |
Net realized gains | | | — | | | | (0.81 | ) | | | — | | | | — | | | | — | | |
Total distributions to shareholders | | | (0.37 | ) | | | (1.21 | ) | | | (0.45 | ) | | | (0.43 | ) | | | (0.57 | ) | |
Proceeds from regulatory settlements | | | — | | | | — | | | | — | | | | 0.00 | (a) | | | — | | |
Net asset value, end of period | | $ | 31.78 | | | $ | 28.17 | | | $ | 26.02 | | | $ | 23.27 | | | $ | 22.43 | | |
Total return | | | 14.24 | % | | | 13.42 | % | | | 13.78 | % | | | 5.64 | % | | | (3.87 | %) | |
Ratios to average net assets(b) | |
Total gross expenses | | | 0.89 | % | | | 0.91 | % | | | 0.83 | % | | | 0.77 | % | | | 0.79 | % | |
Total net expenses(c) | | | 0.88 | %(d) | | | 0.86 | %(d) | | | 0.78 | %(d) | | | 0.77 | %(d) | | | 0.79 | %(d) | |
Net investment income | | | 1.16 | % | | | 1.49 | % | | | 1.62 | % | | | 1.73 | % | | | 2.62 | % | |
Supplemental data | |
Net assets, end of period (in thousands) | | $ | 308,945 | | | $ | 284,934 | | | $ | 229,744 | | | $ | 207,526 | | | $ | 192,819 | | |
Portfolio turnover | | | 141 | %(e) | | | 130 | %(e) | | | 99 | % | | | 89 | % | | | 102 | % | |
Notes to Financial Highlights
(a) Rounds to zero.
(b) In addition to the fees and expenses which the Fund bears directly, the Fund indirectly bears a pro rata share of the fees and expenses of the acquired funds in which it invests. Such indirect expenses are not included in the reported expense ratios.
(c) Total net expenses include the impact of certain waivers/reimbursements made by the Investment Manager and certain of its affiliates, if applicable.
(d) The benefits derived from expense reductions had an impact of less than 0.01%.
(e) Includes mortgage dollar rolls. If mortgage dollar roll transactions were excluded, the portfolio turnover would have been 65% and 66% for the years ended August 31, 2013 and 2012, respectively.
The accompanying Notes to Financial Statements are an integral part of this statement.
Annual Report 2013
45
Notes to Financial Statements
August 31, 2013
Note 1. Organization
Columbia Balanced Fund (the Fund), a series of Columbia Funds Series Trust I (the Trust), is a diversified fund. The Trust is registered under the Investment Company Act of 1940, as amended (the 1940 Act), as an open-end management investment company organized as a Massachusetts business trust.
Fund Shares
The Trust may issue an unlimited number of shares (without par value). The Fund offers Class A, Class B, Class C, Class K, Class R, Class R4, Class R5, Class Y and Class Z shares. Although all share classes generally have identical voting, dividend and liquidation rights, each share class votes separately when required by law. Different share classes pay different distribution amounts to the extent the expenses of such share classes differ, and distributions in liquidation will be proportional to the net asset value of each share class. Each share class has its own expense structure and sales charges, as applicable.
Class A shares are subject to a maximum front-end sales charge of 5.75% based on the initial investment amount. Class A shares purchased without an initial sales charge in accounts aggregating $1 million to $50 million at the time of purchase are subject to a contingent deferred sales charge (CDSC) if the shares are sold within 18 months of purchase, charged as follows: 1.00% CDSC if redeemed within 12 months of purchase, and 0.50% CDSC if redeemed more than 12, but less than 18, months after purchase.
Class B shares may be subject to a maximum CDSC of 5.00% based upon the holding period after purchase. Class B shares will generally convert to Class A shares eight years after purchase. The Fund no longer accepts investments by new or existing investors in the Fund's Class B shares, except in connection with the reinvestment of any dividend and/or capital gain distributions in Class B shares of the Fund and exchanges by existing Class B shareholders of certain other funds within the Columbia Family of Funds.
Class C shares are subject to a 1.00% CDSC on shares redeemed within one year of purchase.
Class K shares (formerly Class R4 shares) are not subject to sales charges; however, this share class is closed to new investors. Effective October 25, 2012, Class R4 shares were renamed Class K shares.
Class R shares are not subject to sales charges and are generally available only to certain retirement plans and other eligible investors.
Class R4 shares are not subject to sales charges and are generally available only to omnibus retirement plans and
certain other eligible investors. Class R4 shares commenced operations on November 8, 2012.
Class R5 shares are not subject to sales charges. Effective November 8, 2012, Class R5 shares are generally available only to investors purchasing through authorized investment professionals and omnibus retirement plans. Prior to November 8, 2012, Class R5 shares were closed to new investors.
Class Y shares are not subject to sales charges and are generally available only to certain retirement plans. Class Y shares commenced operations on November 8, 2012.
Class Z shares are not subject to sales charges and are available only to certain eligible investors, which are subject to different investment minimums.
Note 2. Summary of Significant Accounting Policies
Use of Estimates
The preparation of financial statements in accordance with U.S. generally accepted accounting principles (GAAP) requires management to make certain estimates and assumptions that affect the reported amounts of assets and liabilities, the disclosure of contingent assets and liabilities at the date of the financial statements and the reported amounts of revenue and expenses during the reporting period. Actual results could differ from those estimates.
The following is a summary of significant accounting policies consistently followed by the Fund in the preparation of its financial statements.
Security Valuation
All equity securities are valued at the close of business of the New York Stock Exchange (NYSE). Equity securities are valued at the last quoted sales price on the principal exchange or market on which they trade, except for securities traded on the NASDAQ Stock Market, which are valued at the NASDAQ official close price. Unlisted securities or listed securities for which there were no sales during the day are valued at the mean of the latest quoted bid and ask prices on such exchanges or markets.
Debt securities generally are valued by pricing services approved by the Board of Trustees (the Board) based upon market transactions for normal, institutional-size trading units of similar securities. The services may use various pricing techniques which take into account appropriate factors such as yield, quality, coupon rate, maturity, type of issue, trading characteristics and other data, as well as broker quotes. Debt securities for which quotations are readily available may also be valued based upon an over-the-counter or exchange bid quotation.
Annual Report 2013
46
Notes to Financial Statements (continued)
August 31, 2013
Asset and mortgage-backed securities are generally valued by pricing services, which utilize pricing models that incorporate the securities' cash flow and loan performance data. These models also take into account available market data, including trades, market quotations, and benchmark yield curves for identical or similar securities. Factors used to identify similar securities may include, but are not limited to, issuer, collateral type, vintage, prepayment speeds, collateral performance, credit ratings, credit enhancement and expected life. Asset-backed securities for which quotations are readily available may also be valued based upon an over-the-counter or exchange bid quotation.
Foreign equity securities are valued based on quotations from the principal market in which such securities are normally traded. If any foreign share prices are not readily available as a result of limited share activity the securities are valued at the mean of the latest quoted bid and ask prices on such exchanges or markets. Foreign currency exchange rates are generally determined at 4:00 p.m. Eastern (U.S.) time. However, many securities markets and exchanges outside the U.S. close prior to the close of the NYSE; therefore, the closing prices for securities in such markets or on such exchanges may not fully reflect events that occur after such close but before the close of the NYSE. In those situations, foreign securities will be fair valued pursuant to the policy adopted by the Board, including utilizing a third party pricing service to determine these fair values. The third party pricing service takes into account multiple factors, including, but not limited to, movements in the U.S. securities markets, certain depositary receipts, futures contracts and foreign exchange rates that have occurred subsequent to the close of the foreign exchange or market, to determine a good faith estimate that reasonably reflects the current market conditions as of the close of the NYSE. The fair value of a security is likely to be different from the quoted or published price, if available.
Investments in open-end investment companies, including money market funds, are valued at net asset value.
Futures and options on futures contracts are valued based upon the settlement price established each day by the board of trade or exchange on which they are traded.
Investments for which market quotations are not readily available, or that have quotations which management believes are not reliable, are valued at fair value as determined in good faith under consistently applied procedures established by and under the general supervision of the Board. If a security or class of securities (such as foreign securities) is valued at fair value, such value is likely to be different from the last quoted market price for the security.
The determination of fair value often requires significant judgment. To determine fair value, management may use
assumptions including but not limited to future cash flows and estimated risk premiums. Multiple inputs from various sources may be used to determine fair value.
Foreign Currency Transactions and Translations
The values of all assets and liabilities denominated in foreign currencies are translated into U.S. dollars at that day's exchange rates. Net realized and unrealized gains (losses) on foreign currency transactions and translations include gains (losses) arising from the fluctuation in exchange rates between trade and settlement dates on securities transactions, gains (losses) arising from the disposition of foreign currency and currency gains (losses) between the accrual and payment dates on dividends, interest income and foreign withholding taxes.
For financial statement purposes, the Fund does not distinguish that portion of gains (losses) on investments which is due to changes in foreign exchange rates from that which is due to changes in market prices of the investments. Such fluctuations are included with the net realized and unrealized gains (losses) on investments in the Statement of Operations.
Derivative Instruments
The Fund invests in certain derivative instruments, as detailed below, to meet its investment objectives. Derivatives are instruments whose values depend on, or are derived from, in whole or in part, the value of one or more other assets, such as securities, currencies, commodities or indices. Derivative instruments may be used to maintain cash reserves while maintaining exposure to certain other assets, to offset anticipated declines in values of investments, to facilitate trading, to reduce transaction costs and to pursue higher investment returns. The Fund may also use derivative instruments to mitigate certain investment risks, such as foreign currency exchange rate risk, interest rate risk and credit risk. Derivatives may involve various risks, including the potential inability of the counterparty to fulfill its obligation under the terms of the contract, the potential for an illiquid secondary market (making it difficult for the Fund to sell, including at favorable prices) and the potential for market movements which may expose the Fund to gains or losses in excess of the amount shown in the Statement of Assets and Liabilities. The notional amounts of derivative instruments, if applicable, are not recorded in the financial statements.
A derivative instrument may suffer a mark to market loss if the value of the contract decreases due to an unfavorable change in the market rates or values of the underlying instrument. Losses can also occur if the counterparty does not perform under the contract. A Fund's risk of loss from counterparty credit risk on OTC derivatives is generally limited to the aggregate unrealized gain netted against any collateral held by the Fund and the amount of any initial margin held by the
Annual Report 2013
47
Notes to Financial Statements (continued)
August 31, 2013
counterparty. With exchange traded or centrally cleared derivatives, there is minimal counterparty credit risk to the Fund since the exchange's clearinghouse, as counterparty to such instruments, guarantees against a possible default. The clearinghouse stands between the buyer and the seller of the contract; therefore, the counterparty credit risk is limited to failure of the clearinghouse. However, credit risk still exists in exchange traded or centrally cleared derivatives with respect to initial and variation margin that is held in a broker's customer accounts. While brokers are required to segregate customer margin from their own assets, in the event that a broker becomes insolvent or goes into bankruptcy and at that time there is a shortfall in the aggregate amount of margin held by the broker for all its clients, U.S. bankruptcy laws will typically allocate that shortfall on a pro-rata basis across all the broker's customers, potentially resulting in losses to the Fund.
In order to better define its contractual rights and to secure rights that will help the Fund mitigate its counterparty risk, the Fund may enter into an International Swaps and Derivatives Association, Inc. Master Agreement (ISDA Master Agreement) or similar agreement with its derivative contract counterparties. An ISDA Master Agreement is a bilateral agreement between a Fund and a counterparty that governs OTC derivatives and foreign exchange contracts and typically contains, among other things, collateral posting terms and netting provisions in the event of a default and/or termination event. Under an ISDA Master Agreement, the Fund may, under certain circumstances, offset with the counterparty certain derivative instrument's payables and/or receivables with collateral held and/or posted and create one single net payment. The provisions of the ISDA Master Agreement typically permit a single net payment in the event of default (close-out netting) including the bankruptcy or insolvency of the counterparty. Note, however, that bankruptcy or insolvency laws of a particular jurisdiction may impose restrictions on or prohibitions against the right of offset in bankruptcy, insolvency or other events.
Collateral (margin) requirements differ by type of derivative. Margin requirements are established by the exchange or clearinghouse for exchange traded and centrally cleared derivatives. Brokers can ask for margin in excess of the minimum in certain circumstances. Collateral terms are contract specific for OTC derivatives. For OTC derivatives traded under an ISDA Master Agreement, the collateral requirements are typically calculated by netting the mark to market amount for each transaction under such agreement and comparing that amount to the value of any variation margin currently pledged by the Fund and/or the counterparty. Generally, the amount of collateral due from or to a party has to exceed a minimum transfer amount threshold (e.g. $500,000)
before a transfer has to be made. To the extent amounts due to the Fund from its counterparties are not fully collateralized, contractually or otherwise, the Fund bears the risk of loss from counterparty nonperformance. The Fund attempts to mitigate counterparty risk by only entering into agreements with counterparties that it believes have the financial resources to honor their obligations and by monitoring the financial stability of those counterparties.
Certain ISDA Master Agreements allow counterparties to OTC derivatives to terminate derivative contracts prior to maturity in the event the Fund's net assets decline by a stated percentage over a specified time period or the Fund fails to meet the terms of the ISDA Master Agreement, which would cause the Fund to accelerate payment of any net liability owed to the counterparty. The Fund also has termination rights if the counterparty fails to meet the terms of the ISDA Master Agreement. In addition to considering counterparty credit risk, the Fund would consider terminating the derivative contracts based on whether termination would result in a net liability owed from the counterparty.
For financial reporting purposes, the Fund does not offset derivative assets and derivative liabilities that are subject to netting arrangements in the Statement of Assets and Liabilities.
Futures Contracts
Futures contracts are exchange traded and represent commitments for the future purchase or sale of an asset at a specified price on a specified date. The Fund bought and sold futures contracts to manage the duration and yield curve exposure of the Fund versus the benchmark and to manage exposure to movements in interest rates. These instruments may be used for other purposes in future periods. Upon entering into futures contracts, the Fund bears risks that it may not achieve the anticipated benefits of the futures contracts and may realize a loss. Additional risks include counterparty credit risk, the possibility of an illiquid market, and that a change in the value of the contract or option may not correlate with changes in the value of the underlying asset.
Upon entering into a futures contract, the Fund pledges cash or securities with the broker in an amount sufficient to meet the initial margin requirement. The initial margin deposit must be maintained at an established level over the life of the contract. Cash deposited as initial margin is recorded in the Statement of Assets and Liabilities as margin deposits. Securities deposited as initial margin are designated in the Portfolio of Investments. Subsequent payments (variation margin) are made or received by the Fund each day. The variation margin payments are equal to the daily change in the contract value and are recorded as variation margin receivable or payable and are offset in unrealized gains or losses. The
Annual Report 2013
48
Notes to Financial Statements (continued)
August 31, 2013
Fund recognizes a realized gain or loss when the contract is closed or expires. Futures contracts involve, to varying degrees, risk of loss in excess of the variation margin disclosed in the Statement of Assets and Liabilities.
Effects of Derivative Transactions in the Financial Statements
The following tables are intended to provide additional information about the effect of derivatives on the financial statements of the Fund, including: the fair value of derivatives by risk category and the location of those fair values in the Statement of Assets and Liabilities; the impact of derivative transactions over the period in the Statement of Operations including realized gains or losses and unrealized gains or losses. The derivative schedules following the Portfolio of Investments present additional information regarding derivative instruments outstanding at the end of the period, if any.
The following table is a summary of the fair value of derivative instruments at August 31, 2013:
Asset Derivatives | |
Risk Exposure
Category | | Statement of Assets and
Liabilities Location | | Fair Value ($) | |
Interest rate risk | | Net assets — unrealized
appreciation on futures
contracts | | | 8,438
| * | |
Liability Derivatives | |
Risk Exposure
Category | | Statement of Assets and
Liabilities Location | | Fair Value ($) | |
Interest rate risk | | Net assets — unrealized
depreciation on futures
contracts | | | 4,497
| * | |
*Includes cumulative appreciation (depreciation) of futures contracts as reported in the Futures Contracts Outstanding table following the Portfolio of Investments. Only the current day's variation margin is reported in receivables or payables in the Statement of Assets and Liabilities.
The following table indicates the effect of derivative instruments in the Statement of Operations for the year ended August 31, 2013:
Amount of Realized Gain (Loss) on Derivatives Recognized in Income | |
Risk Exposure Category | | Futures Contracts ($) | |
Interest rate risk | | | 1,051,783 | | |
Change in Unrealized Appreciation (Depreciation) on
Derivatives Recognized in Income | |
Risk Exposure Category | | Futures Contracts ($) | |
Interest rate risk | | | 132,750 | | |
The following table is a summary of the volume of derivative instruments for the year ended August 31, 2013:
Derivative Instrument | | Contracts Opened | |
Futures contracts | | | 1,521 | | |
Investments in Loans
The Fund may invest in loan participations and assignments of all or a portion of a loan. When the Fund purchases a loan participation, the Fund typically enters into a contractual relationship with the lender or third party selling such participations (Selling Participant), but not the borrower, and assumes the credit risk of the borrower, Selling Participant and any other persons interpositioned between the Fund and the borrower. In addition, the Fund may not directly benefit from the collateral supporting the loan that it has purchased from the Selling Participant. In contrast, when the Fund purchases an assignment of a loan, the Fund typically has direct rights against the borrower; provided, however, that the Fund's rights may be more limited than the lender from which it acquired the assignment and the Fund may be able to enforce their rights only through an administrative agent. Although certain loan participations or assignments are secured by collateral, the Fund could experience delays or limitations in realizing such collateral or have their interest subordinated to other indebtedness of the obligor. In the event that the administrator or collateral agent of a loan becomes insolvent, enters into receivership or bankruptcy, the Fund may incur costs and delays in realizing payment or may suffer a loss of principal and/or interest. The risk of loss is greater for unsecured or subordinated loans. In addition, loan participations and assignments are vulnerable to market conditions such that economic conditions or other events may reduce the demand for loan participations and assignments and certain loan participations and assignments which were liquid, when purchased, may become illiquid.
Delayed Delivery Securities
The Fund may trade securities on other than normal settlement terms, including securities purchased or sold on a "when-issued" basis. This may increase the risk if the other party to the transaction fails to deliver and causes the Fund to subsequently invest at less advantageous prices. The Fund designates cash or liquid securities in an amount equal to the delayed delivery commitment.
Mortgage Dollar Roll Transactions
The Fund may enter into mortgage "dollar rolls" in which the Fund sells securities for delivery in the current month and simultaneously contracts with the same counterparty to repurchase similar but not identical securities (same type, coupon and maturity) on a specified future date. During the roll period, the Fund loses the right to receive principal and interest paid on the securities sold. However, the Fund will benefit because it receives negotiated amounts in the form of reductions of the purchase price for the future purchase plus the interest earned on the cash proceeds of the securities sold until the settlement date of the forward purchase. The Fund records the
Annual Report 2013
49
Notes to Financial Statements (continued)
August 31, 2013
incremental difference between the forward purchase and sale of each forward roll as a realized gain or loss. Unless any realized gains exceed the income, capital appreciation, and gain or loss due to mortgage prepayments that would have been realized on the securities sold as part of the mortgage dollar roll, the use of this technique will diminish the investment performance of the Fund compared to what the performance would have been without the use of mortgage dollar rolls. All cash proceeds will be invested in instruments that are permissible investments for the Fund. The Fund identifies cash or liquid securities in an amount equal to the forward purchase price.
For financial reporting and tax purposes, the Fund treats "to be announced" mortgage dollar rolls as two separate transactions, one involving the purchase of a security and a separate transaction involving a sale. These transactions may increase the Fund's portfolio turnover rate. The Fund does not currently enter into mortgage dollar rolls that are accounted for as financing transactions.
Mortgage dollar rolls involve the risk that the market value of the securities the Fund is obligated to repurchase may decline below the repurchase price, or that the counterparty may default on its obligations.
Treasury Inflation Protected Securities
The Fund may invest in treasury inflation protected securities (TIPS). The principal amount of TIPS is adjusted periodically and is increased for inflation or decreased for deflation based on a monthly published index. Interest payments are based on the adjusted principal at the time the interest is paid. These adjustments are recorded as interest income in the Statement of Operations.
Interest Only Securities
The Fund may invest in Interest Only Securities (IOs). IOs are stripped securities entitled to receive all of the security's interest, but none of its principal. The Fund may also invest in stripped mortgage-backed securities. If the underlying obligations experience greater than anticipated prepayments of principal, the Fund may fail to fully recoup its initial investment in an IO. As a result of the prepayments the daily interest accrual factor is adjusted periodically (typically, each month) to reflect the paydown of principal. IOs are particularly sensitive to changes in interest rates and therefore subject to greater fluctuations in price than typical interest bearing debt securities. IOs are also subject to credit risk because the Fund may not receive all or part of the interest payments if the issuer or credit enhanced defaults on its obligation.
Security Transactions
Security transactions are accounted for on the trade date. Cost is determined and gains (losses) are based upon the specific
identification method for both financial statement and federal income tax purposes.
Income Recognition
Corporate actions and dividend income are generally recorded net of any non-reclaimable tax withholdings, on the ex-dividend date or upon receipt of ex-dividend notification in the case of certain foreign securities.
Interest income is recorded on an accrual basis. Market premiums and discounts, including original issue discounts, are amortized and accreted, respectively, over the expected life of the security on all debt securities, unless otherwise noted.
The Fund may receive distributions from holdings in business development companies (BDCs), exchange traded funds (ETFs) and real estate investment trusts (REITs), which report information on the character of their distributions annually. These distributions are allocated to dividend income, capital gain and return of capital based on estimates made by the Fund's management if actual information has not yet been reported. Return of capital is recorded as a reduction of the cost basis of securities held. If the Fund no longer owns the applicable securities, return of capital is recorded as a realized gain. Management's estimates are subsequently adjusted when the actual character of the distributions is disclosed by the BDCs, ETFs and REITs, which could result in a proportionate change in return of capital to shareholders.
Awards from class action litigation are recorded as a reduction of cost basis if the Fund still owns the applicable securities on the payment date. If the Fund no longer owns the applicable securities, the proceeds are recorded as realized gains.
The value of additional securities received as an income payment is recorded as income and increases the cost basis of such securities.
Expenses
General expenses of the Trust are allocated to the Fund and other funds of the Trust based upon relative net assets or other expense allocation methodologies determined by the nature of the expense. Expenses directly attributable to the Fund are charged to the Fund. Expenses directly attributable to a specific class of shares are charged to that share class.
Determination of Class Net Asset Value
All income, expenses (other than class-specific expenses, which are charged to that share class, as shown in the Statement of Operations) and realized and unrealized gains (losses) are allocated to each class of the Fund on a daily basis, based on the relative net assets of each class, for purposes of determining the net asset value of each class.
Annual Report 2013
50
Notes to Financial Statements (continued)
August 31, 2013
Federal Income Tax Status
The Fund intends to qualify each year as a regulated investment company under Subchapter M of the Internal Revenue Code, as amended, and will distribute substantially all of its taxable income (including net short-term capital gains), if any, for its tax year, and as such will not be subject to federal income taxes. In addition, the Fund intends to distribute in each calendar year substantially all of its net investment income, capital gains and certain other amounts, if any, such that the Fund should not be subject to federal excise tax. Therefore, no federal income or excise tax provision is recorded.
Foreign Taxes
The Fund may be subject to foreign taxes on income, gains on investments or currency repatriation, a portion of which may be recoverable. The Fund will accrue such taxes and recoveries, as applicable, based upon its current interpretation of tax rules and regulations that exist in the markets in which it invests.
Realized gains in certain countries may be subject to foreign taxes at the Fund level, based on statutory rates. The Fund accrues for such foreign taxes on realized and unrealized gains at the appropriate rate for each jurisdiction, as applicable. The amount, if any, is disclosed as a liability on the Statement of Assets and Liabilities.
Distributions to Shareholders
Distributions from net investment income, if any, are declared and paid each calendar quarter. Net realized capital gains, if any, are distributed at least annually. Income distributions and capital gain distributions are determined in accordance with federal income tax regulations, which may differ from GAAP.
Guarantees and Indemnifications
Under the Trust's organizational documents and, in some cases, by contract, its officers and trustees are indemnified against certain liabilities arising out of the performance of their duties to the Trust or its funds. In addition, certain of the Fund's contracts with its service providers contain general indemnification clauses. The Fund's maximum exposure under these arrangements is unknown since the amount of any future claims that may be made against the Fund cannot be determined, and the Fund has no historical basis for predicting the likelihood of any such claims.
Recent Accounting Pronouncement
Disclosures about Offsetting Assets and Liabilities
In December 2011, the Financial Accounting Standards Board (FASB) issued Accounting Standards Update (ASU) No. 2011-11, Disclosures about Offsetting Assets and Liabilities and in January 2013, ASU No. 2013-1, Clarifying
the Scope of Disclosures about Offsetting Assets and Liabilities (collectively, the ASUs). Specifically, the ASUs require an entity to disclose both gross and net information for derivatives and other financial instruments that are subject to a master netting arrangement or similar agreement. The ASUs require disclosure of collateral received in connection with the master netting agreements or similar agreements. The disclosure requirements are effective for interim and annual periods beginning on or after January 1, 2013. At this time, management is evaluating the implications of this guidance and the impact it will have on the financial statement amounts and footnote disclosures, if any.
Note 3. Fees and Compensation Paid to Affiliates
Investment Management Fees
Under an Investment Management Services Agreement, Columbia Management Investment Advisers, LLC (the Investment Manager), a wholly-owned subsidiary of Ameriprise Financial, Inc. (Ameriprise Financial), determines which securities will be purchased, held or sold. The investment management fee is an annual fee that is equal to a percentage of the Fund's average daily net assets that declines from 0.66% to 0.49% as the Fund's net assets increase. The effective investment management fee rate for the year ended August 31, 2013 was 0.62% of the Fund's average daily net assets.
Administration Fees
Under an Administrative Services Agreement, the Investment Manager also serves as the Fund Administrator. The Fund pays the Fund Administrator an annual fee for administration and accounting services equal to a percentage of the Fund's average daily net assets that declines from 0.06% to 0.03% as the Fund's net assets increase. The effective administration fee rate for the year ended August 31, 2013 was 0.06% of the Fund's average daily net assets.
Compensation of Board Members
Board members are compensated for their services to the Fund as disclosed in the Statement of Operations. The Trust's eligible Trustees may participate in a Deferred Compensation Plan (the Plan) which may be terminated at any time. Obligations of the Plan will be paid solely out of the Fund's assets.
Compensation of Chief Compliance Officer
The Board has appointed a Chief Compliance Officer to the Fund in accordance with federal securities regulations. The Fund pays its pro-rata share of the expenses associated with the Chief Compliance Officer. The Fund's expenses for the Chief Compliance Officer will not exceed $15,000 per year.
Annual Report 2013
51
Notes to Financial Statements (continued)
August 31, 2013
Transfer Agent Fees
Under a Transfer and Dividend Disbursing Agent Agreement, Columbia Management Investment Services Corp. (the Transfer Agent), an affiliate of the Investment Manager and a wholly-owned subsidiary of Ameriprise Financial, is responsible for providing transfer agency services to the Fund. The Transfer Agent has contracted with Boston Financial Data Services (BFDS) to serve as sub-transfer agent.
The Transfer Agent receives monthly account-based service fees based on the number of open accounts and also receives sub-transfer agency fees based on a percentage of the average aggregate value of the Fund's shares maintained in omnibus accounts (other than omnibus accounts for which American Enterprise Investment Services Inc. is the broker of record or accounts where the beneficial shareholder is a customer of Ameriprise Financial Services, Inc., which are paid a per account fee). The Transfer Agent pays the fees of BFDS for services as sub-transfer agent and is not entitled to reimbursement for such fees from the Fund (with the exception of out-of-pocket fees).
The Transfer Agent also receives compensation from fees for various shareholder services and reimbursements for certain out-of-pocket fees. Total transfer agent fees for Class K and Class R5 shares are subject to an annual limitation of not more than 0.05% of the average daily net assets attributable to each share class. Beginning November 8, 2012, Class Y shares are not subject to transfer agent fees for at least twelve months.
For the year ended August 31, 2013, the Fund's effective transfer agent fee rates as a percentage of average daily net assets of each class were as follows:
Class A | | | 0.18 | % | |
Class B | | | 0.18 | | |
Class C | | | 0.18 | | |
Class K | | | 0.05 | | |
Class R | | | 0.18 | | |
Class R4 | | | 0.17 | * | |
Class R5 | | | 0.05 | | |
Class Z | | | 0.18 | | |
*Annualized
The Fund and certain other associated investment companies, have severally, but not jointly, guaranteed the performance and observance of all the terms and conditions of a lease entered into by Seligman Data Corp. (SDC), the former transfer agent, including the payment of rent by SDC (the Guaranty). The lease and the Guaranty expire in January 2019. At August 31, 2013, the Fund's total potential future obligation over the life of the Guaranty is $35,021. The liability remaining at August 31, 2013 for non-recurring charges associated with the
lease amounted to $18,635 and is recorded as a part of the payable for other expenses in the Statement of Assets and Liabilities. SDC is owned by six associated investment companies, including the Fund. The Fund's ownership interest in SDC at August 31, 2013 is recorded as a part of other assets in the Statement of Assets and Liabilities at a cost of $3,553.
An annual minimum account balance fee of $20 may apply to certain accounts with a value below the applicable share class' initial minimum investment requirements to reduce the impact of small accounts on transfer agent fees. These minimum account balance fees are recorded as part of expense reductions in the Statement of Operations. For the year ended August 31, 2013, these minimum account balance fees reduced total expenses by $5,347.
Plan Administration Fees
Under a Plan Administration Services Agreement with the Transfer Agent, the Fund pays an annual fee at a rate of 0.25% of the Fund's average daily net assets attributable to Class K shares for the provision of various administrative, recordkeeping, communication and educational services.
Distribution and Service Fees
The Fund has an agreement with Columbia Management Investment Distributors, Inc. (the Distributor), an affiliate of the Investment Manager and a wholly-owned subsidiary of Ameriprise Financial, for distribution and shareholder services. Pursuant to Rule 12b-1 under the 1940 Act, the Board has approved, and the Fund has adopted, distribution and shareholder service plans (the Plans) which set the distribution and service fees for the Fund. These fees are calculated daily and are intended to compensate the Distributor and/or eligible selling and/or servicing agents for selling shares of the Fund and providing services to investors.
Under the Plans, the Fund pays a monthly service fee to the Distributor at the maximum annual rate of 0.25% of the average daily net assets attributable to Class A, Class B and Class C shares of the Fund. Also under the Plans, the Fund pays a monthly distribution fee to the Distributor at the maximum annual rates of 0.10%, 0.75%, 0.75% and 0.50% of the average daily net assets attributable to Class A, Class B, Class C and Class R shares, respectively.
The Fund may pay distribution and service fees up to a maximum annual rate of 0.35% of the Fund's average daily net assets attributable to Class A shares (comprised of up to 0.10% for distribution services and up to 0.25% for shareholder liaison services), but currently limit such fees to an aggregate fee of not more than 0.25% of the Fund's average daily net assets attributable to Class A shares.
Annual Report 2013
52
Notes to Financial Statements (continued)
August 31, 2013
Sales Charges
Sales charges, including front-end charges and CDSCs, received by the Distributor for distributing Fund shares were $1,837,867 for Class A, $4,620 for Class B and $10,863 for Class C shares for the year ended August 31, 2013.
Expenses Waived/Reimbursed by the Investment Manager and its Affiliates
The Investment Manager and certain of its affiliates have contractually agreed to waive fees and/or reimburse expenses (excluding certain fees and expenses described below) for the periods disclosed below, unless sooner terminated at the sole discretion of the Board, so that the Fund's net operating expenses, after giving effect to fees waived/expenses reimbursed and any balance credits and/or overdraft charges from the Fund's custodian, do not exceed the following annual rates as a percentage of the class' average daily net assets:
| | | January 1, 2013
through
December 31, 2013 | | Prior to
January 1, 2013 | |
Class A | | | 1.19 | % | | | 1.11 | % | |
Class B | | | 1.94 | | | | 1.86 | | |
Class C | | | 1.94 | | | | 1.86 | | |
Class K | | | 1.11 | | | | 1.05 | | |
Class R | | | 1.44 | | | | 1.36 | | |
Class R4 | | | 0.94 | | | | 0.86 | | |
Class R5 | | | 0.86 | | | | 0.80 | | |
Class Y | | | 0.81 | | | | 0.75 | | |
Class Z | | | 0.94 | | | | 0.86 | | |
Under the agreement governing these fee waivers and/or expense reimbursement arrangements, the following fees and expenses are excluded from the waiver/reimbursement commitment, and therefore will be paid by the Fund, if applicable: taxes (including foreign transaction taxes), expenses associated with investments in affiliated and non-affiliated pooled investment vehicles (including mutual funds and exchange traded funds), transaction costs and brokerage commissions, costs related to any securities lending program, dividend expenses associated with securities sold short, inverse floater program fees and expenses, transaction charges and interest on borrowed money, interest, extraordinary expenses and any other expenses the exclusion of which is specifically approved by the Board. This agreement may be modified or amended only with approval from all parties.
Note 4. Federal Tax Information
The timing and character of income and capital gain distributions are determined in accordance with income tax regulations, which may differ from GAAP because of temporary or permanent book to tax differences.
At August 31, 2013, these differences are primarily due to differing treatment for capital loss carryforwards, principal and/or interest of fixed income securities, deferral/reversal of wash sale losses, Trustees' deferred compensation, foreign currency transactions, and derivative investments. To the extent these differences are permanent, reclassifications are made among the components of the Fund's net assets in the Statement of Assets and Liabilities. Temporary differences do not require reclassifications. In the Statement of Assets and Liabilities the following reclassifications were made:
Undistributed net investment income | | $ | 539,856 | | |
Accumulated net realized loss | | | (3,977,409 | ) | |
Paid-in capital | | | 3,437,553 | | |
Net investment income and net realized gains (losses), as disclosed in the Statement of Operations, and net assets were not affected by this reclassification.
The tax character of distributions paid during the years indicated was as follows:
Year Ended August 31, | | 2013 | | 2012 | |
Ordinary income | | $ | 13,300,241 | | | $ | 13,933,096 | | |
Long-term capital gains | | | — | | | | 31,912,260 | | |
Total | | $ | 13,300,241 | | | $ | 45,845,356 | | |
Short-term capital gain distributions, if any, are considered ordinary income distributions for tax purposes.
At August 31, 2013, the components of distributable earnings on a tax basis were as follows:
Undistributed ordinary income | | $ | 2,300,387 | | |
Unrealized appreciation | | | 244,961,999 | | |
At August 31, 2013, the cost of investments for federal income tax purposes was $1,439,591,301 and the aggregate gross unrealized appreciation and depreciation based on that cost was:
Unrealized appreciation | | $ | 253,927,788 | | |
Unrealized depreciation | | | (8,965,789 | ) | |
Net unrealized appreciation | | $ | 244,961,999 | | |
The following capital loss carryforward, determined at August 31, 2013, may be available to reduce taxable income arising from future net realized gains on investments, if any, to the extent permitted by the Internal Revenue Code:
Year of Expiration | | Amount | |
2017 | | $ | 57,737,726 | | |
For the year ended August 31, 2013, $80,940,912 of capital loss carryforward was utilized.
Management of the Fund has concluded that there are no significant uncertain tax positions that would require
Annual Report 2013
53
Notes to Financial Statements (continued)
August 31, 2013
recognition in the financial statements. However, management's conclusion may be subject to review and adjustment at a later date based on factors including, but not limited to, new tax laws, regulations, and administrative interpretations (including relevant court decisions). Generally, the Fund's federal tax returns for the prior three fiscal years remain subject to examination by the Internal Revenue Service.
Note 5. Portfolio Information
The cost of purchases and proceeds from sales of securities, excluding short-term obligations but including mortgage dollar rolls, aggregated to $2,070,925,980 and $1,890,956,367, respectively, for the year ended August 31, 2013, of which $1,241,563,897 and $1,176,778,952 respectively, were U.S. government securities.
Note 6. Lending of Portfolio Securities
Effective December 19, 2012, the Fund no longer participates in securities lending activity. Prior to that date, the Fund participated, or was eligible to participate, in securities lending activity pursuant to a Master Securities Lending Agreement (the Agreement) with JPMorgan Chase Bank, N.A. (JPMorgan). The Agreement authorized JPMorgan as lending agent to lend securities to authorized borrowers in order to generate additional income on behalf of the Fund. Pursuant to the Agreement, the securities loaned were secured by cash or securities that either were issued or guaranteed as to principal and interest by the U.S. government, its agencies, authorities or instrumentalities with value equal to at least 100% of the market value of the loaned securities. Any additional collateral required to maintain those levels due to market fluctuations of the loaned securities was requested to be delivered the following business day. Cash collateral received was invested by the lending agent on behalf of the Fund into authorized investments pursuant to the Agreement.
Pursuant to the Agreement, the Fund received income for lending its securities either in the form of fees or by earning interest on invested cash collateral, net of negotiated rebates paid to borrowers and fees paid to the lending agent for services provided and any other securities lending expenses. Net income earned from securities lending for the year ended August 31, 2013 is disclosed in the Statement of Operations. The Fund continued to earn and accrue interest and dividends on the securities loaned.
Note 7. Affiliated Money Market Fund
The Fund invests its daily cash balances in Columbia Short-Term Cash Fund, an affiliated money market fund established for the exclusive use by the Fund and other affiliated funds. The income earned by the Fund from such
investments is included as "Dividends — affiliated issuers" in the Statement of Operations. As an investing fund, the Fund indirectly bears its proportionate share of the expenses of Columbia Short-Term Cash Fund.
Note 8. Shareholder Concentration
At August 31, 2013, affiliated shareholder accounts owned 12.5% of the outstanding shares of the Fund. Subscription and redemption activity by concentrated accounts may have a significant effect on the operations of the Fund.
Note 9. Lehman Brothers Holdings Inc. Equity-Linked Notes
The Fund holds investments in two equity-linked notes (notes) for which Lehman Brothers Holdings Inc. (Lehman Brothers) is the counterparty. The notes (with an aggregate principal amount of $696,000) defaulted as of their respective maturity dates, September 14, 2008 and October 2, 2008. Lehman Brothers filed a Chapter 11 bankruptcy petition on September 15, 2008, and as such, it is likely that the Fund will receive less than the maturity value of the notes, pending the outcome of the bankruptcy proceedings. Based on the bankruptcy proceedings, the Fund recorded receivables aggregating $67,340 based on the estimated amounts recoverable for the notes and recognized realized losses of $628,660. The estimates of the amounts recoverable for the notes are based on the current information regarding the claim provided by the bankruptcy court and any amounts received as payments for the claim, which provide an indication of amounts recoverable through the bankruptcy proceedings. To date, the Fund has received $151,177 on this claim. Any changes to the receivable balances resulting from such adjustments are recorded as a change in unrealized appreciation or depreciation in the Statement of Operations. At August 31, 2013, the value of the receivable balances was approximately $45,055, which represented less than 0.01% of the Fund's net assets.
Note 10. Line of Credit
The Fund has entered into a revolving credit facility with a syndicate of banks led by JPMorgan whereby the Fund may borrow for the temporary funding of shareholder redemptions or for other temporary or emergency purposes. The credit facility agreement, as amended, which is a collective agreement between the Fund and certain other funds managed by the Investment Manager, severally and not jointly, permits collective borrowings up to $500 million. Interest is charged to each participating fund based on its borrowings at a rate equal to the higher of (i) the overnight federal funds rate plus 1.00% or (ii) the one-month LIBOR rate plus 1.00%. Each borrowing under the credit facility matures no later than 60 days after the
Annual Report 2013
54
Notes to Financial Statements (continued)
August 31, 2013
date of borrowing. The Fund also pays a commitment fee equal to its pro rata share of the amount of the credit facility at a rate of 0.08% per annum. The commitment fee is included in other expenses in the Statement of Operations.
The Fund had no borrowings during the year ended August 31, 2013.
Note 11. Subsequent Events
Management has evaluated the events and transactions that have occurred through the date the financial statements were issued and noted no items requiring adjustment of the financial statements or additional disclosure.
Note 12. Information Regarding Pending and Settled Legal Proceedings
In December 2005, without admitting or denying the allegations, American Express Financial Corporation (AEFC, which is now known as Ameriprise Financial, Inc. (Ameriprise Financial)) entered into settlement agreements with the Securities and Exchange Commission (SEC) and Minnesota Department of Commerce (MDOC) related to market timing activities. As a result, AEFC was censured and ordered to cease and desist from committing or causing any violations of certain provisions of the Investment Advisers Act of 1940, the Investment Company Act of 1940, and various Minnesota laws. AEFC agreed to pay disgorgement of $10 million and civil money penalties of $7 million. AEFC also agreed to retain an independent distribution consultant to assist in developing a plan for distribution of all disgorgement and civil penalties ordered by the SEC in accordance with various undertakings detailed at www.sec.gov/litigation/admin/ia-2451.pdf. Ameriprise Financial and its affiliates have cooperated with the SEC and the MDOC in these legal proceedings, and have made regular reports to the funds' Boards of Trustees.
Ameriprise Financial and certain of its affiliates have historically been involved in a number of legal, arbitration and regulatory proceedings, including routine litigation, class actions, and governmental actions, concerning matters arising in connection with the conduct of their business activities. Ameriprise Financial believes that the Funds are not currently the subject of, and that neither Ameriprise Financial nor any of its affiliates are the subject of, any pending legal, arbitration or regulatory proceedings that are likely to have a material adverse effect on the Funds or the ability of Ameriprise Financial or its affiliates to perform under their contracts with the Funds. Ameriprise Financial is required to make 10-Q, 10-K and, as necessary, 8-K filings with the Securities and Exchange Commission on legal and regulatory matters that relate to Ameriprise Financial and its affiliates. Copies of
these filings may be obtained by accessing the SEC website at www.sec.gov.
There can be no assurance that these matters, or the adverse publicity associated with them, will not result in increased fund redemptions, reduced sale of fund shares or other adverse consequences to the Funds. Further, although we believe proceedings are not likely to have a material adverse effect on the Funds or the ability of Ameriprise Financial or its affiliates to perform under their contracts with the Funds, these proceedings are subject to uncertainties and, as such, we are unable to estimate the possible loss or range of loss that may result. An adverse outcome in one or more of these proceedings could result in adverse judgments, settlements, fines, penalties or other relief that could have a material adverse effect on the consolidated financial condition or results of operations of Ameriprise Financial.
Annual Report 2013
55
Report of Independent Registered Public Accounting Firm
To the Trustees of Columbia Funds Series Trust I and the Shareholders of Columbia Balanced Fund
In our opinion, the accompanying statement of assets and liabilities, including the portfolio of investments, and the related statements of operations and of changes in net assets and the financial highlights present fairly, in all material respects, the financial position of Columbia Balanced Fund (the "Fund") (a series of Columbia Funds Series Trust I) at August 31, 2013, the results of its operations, the changes in its net assets and the financial highlights for the periods indicated, in conformity with accounting principles generally accepted in the United States of America. These financial statements and financial highlights (hereafter referred to as "financial statements") are the responsibility of the Fund's management. Our responsibility is to express an opinion on these financial statements based on our audits. We conducted our audits of these financial statements in accordance with the standards of the Public Company Accounting Oversight Board (United States). Those standards require that we plan and perform the audit to obtain reasonable assurance about whether the financial statements are free of material misstatement. An audit includes examining, on a test basis, evidence supporting the amounts and disclosures in the financial statements, assessing the accounting principles used and significant estimates made by management, and evaluating the overall financial statement presentation. We believe that our audits, which included confirmation of securities at August 31, 2013 by correspondence with the custodian, brokers and transfer agent, provide a reasonable basis for our opinion.
PricewaterhouseCoopers LLP
Minneapolis, Minnesota
October 22, 2013
Annual Report 2013
56
Federal Income Tax Information
(Unaudited)
The Fund hereby designates the following tax attributes for the fiscal year ended August 31, 2013. Shareholders will be notified in early 2014 of the amounts for use in preparing 2013 income tax returns.
Tax Designations:
| Qualified Dividend Income | | | 97.18 | % | |
| Dividends Received Deduction | | | 95.51 | % | |
Qualified Dividend Income. For taxable, non-corporate shareholders, the percentage of ordinary income dividends paid during the fiscal year that represents qualified dividend income subject to reduced tax rates.
Dividends Received Deduction. The percentage of ordinary income dividends paid during the fiscal year that qualifies for the corporate dividends received deduction.
Annual Report 2013
57
The Trustees serve terms of indefinite duration. The names, addresses and birth years of the Trustees and Officers of the Funds in Columbia Funds Series Trust I, the year each was first elected or appointed to office, their principal business occupations during at least the last five years, the number of Funds overseen by each Trustee and other directorships they hold are shown below. Each officer listed below serves as an officer of each Fund in Columbia Funds Series Trust I.
Independent Trustees
Name, Address and Year of Birth,
Position with Funds, Year First
Elected or Appointed to Office | | Principal Occupation(s) During Past Five Years, Number of Funds in Columbia
Funds Complex Overseen by Trustee, Other Directorships Held | |
Rodman L. Drake (Born 1943)
c/o Columbia Management
Investment Advisers, LLC
225 Franklin Street
Boston, MA 02110
Trustee (since 1994) and
Chairman of the Board (since 2009) | | Independent consultant since 2010; Co-Founder of Baringo Capital LLC (private equity) from 1997 to 2008; Chairman (from 2003 to 2010) and CEO (from 2008 to 2010) of Crystal River Capital, Inc. (real estate investment trust); Oversees 52; Jackson Hewitt Tax Service Inc. (tax preparation services) from 2004 to 2011; Student Loan Corporation (student loan provider) from 2005 to 2010; Celgene Corporation (global biotechnology company); The Helios Funds and Brookfield Funds (closed-end funds); Chimerix, Inc. (biopharmaceutical company) since August 1, 2013; Crystal River Capital, Inc. from 2005 to 2010; Parsons Brinckerhoff from 1995 to 2008; and Apex Silver Mines Ltd. from 2007 to 2009 | |
Douglas A. Hacker (Born 1955)
c/o Columbia Management
Investment Advisers, LLC
225 Franklin Street
Boston, MA 02110
Trustee (since 1996) | | Independent business executive since May 2006; Executive Vice President — Strategy of United Airlines from December 2002 to May 2006; President of UAL Loyalty Services (airline marketing company) from September 2001 to December 2002; Executive Vice President and Chief Financial Officer of United Airlines from July 1999 to September 2001. Oversees 52; Nash Finch Company (food distributor); Aircastle Limited (aircraft leasing); and SeaCube Container Leasing Ltd. (container leasing) | |
Janet Langford Kelly (Born 1957)
c/o Columbia Management
Investment Advisers, LLC
225 Franklin Street
Boston, MA 02110
Trustee (since 1996) | | Senior Vice President, General Counsel and Corporate Secretary, ConocoPhillips (integrated energy company) since September 2007; Deputy General Counsel — Corporate Legal Services, ConocoPhillips from August 2006 to August 2007; Partner, Zelle, Hofmann, Voelbel, Mason & Gette LLP (law firm) from March 2005 to July 2006; Adjunct Professor of Law, Northwestern University from September 2004 to June 2006; Director, UAL Corporation (airline) from February 2006 to July 2006; Chief Administrative Officer and Senior Vice President, Kmart Holding Corporation (consumer goods) from September 2003 to March 2004. Oversees 52; None | |
Nancy T. Lukitsh (Born 1956)
c/o Columbia Management
Investment Advisers, LLC
225 Franklin Street
Boston, MA 02110
Trustee (since 2011) | | Senior Vice President, Partner and Director of Marketing, Wellington Management Company, LLP (investment adviser) from 1997 to 2010; Chair, Wellington Management Investment Portfolios (commingled non-U.S. investment pools) from 2007 to 2010; Director, Wellington Trust Company, NA and other Wellington affiliates from 1997 to 2010. Oversees 52; None | |
William E. Mayer (Born 1940)
c/o Columbia Management
Investment Advisers, LLC
225 Franklin Street
Boston, MA 02110
Trustee (since 1994) | | Partner, Park Avenue Equity Partners (private equity) since February 1999; Dean and Professor, College of Business and Management, University of Maryland from 1992 to 1996. Oversees 52; DynaVox Inc. (speech creation); Lee Enterprises (print media); WR Hambrecht + Co. (financial service provider) from 2000 to 2012; BlackRock Kelso Capital Corporation (investment company) | |
David M. Moffett (Born 1952)
c/o Columbia Management
Investment Advisers, LLC
225 Franklin Street
Boston, MA 02110
Trustee (since 2011) | | Retired. Chief Executive Officer, Federal Home Loan Mortgage Corporation, from 2008 to 2009; Senior Adviser, Global Financial Services Group, Carlyle Group, Inc., from 2007 to 2008; Vice Chairman and Chief Financial Officer, U.S. Bancorp, from 1993 to 2007. Oversees 52; CIT Group Inc. (commercial and consumer finance); eBay Inc. (online trading community); MBIA Inc. (financial service provider); E.W. Scripps Co. (print and television media), Building Materials Holding Corp. (building materials and construction services); Genworth Financial, Inc. (financial and insurance products and services); and University of Oklahoma Foundation | |
Charles R. Nelson (Born 1942)
c/o Columbia Management
Investment Advisers, LLC
225 Franklin Street
Boston, MA 02110
Trustee (since 1981) | | Retired. Professor Emeritus, University of Washington, since 2011; Professor of Economics, University of Washington from 1976 to 2011; Ford and Louisa Van Voorhis Professor of Political Economy, University of Washington from 1993 to 2011; Adjunct Professor of Statistics, University of Washington from 1980 to 2011; Associate Editor, Journal of Money, Credit and Banking from September 1993 to 2008; consultant on econometric and statistical matters. Oversees 52; None | |
John J. Neuhauser (Born 1943)
c/o Columbia Management
Investment Advisers, LLC
225 Franklin Street
Boston, MA 02110
Trustee (since 1984) | | President, Saint Michael's College, since August 2007; Director or Trustee of several non-profit organizations, including Fletcher Allen Health Care, Inc.; University Professor, Boston College from November 2005 to August 2007; Academic Vice President and Dean of Faculties, Boston College from August 1999 to October 2005. Oversees 52; Liberty All-Star Equity Fund and Liberty All-Star Growth Fund (closed-end funds) | |
Annual Report 2013
58
Trustees and Officers (continued)
Independent Trustees (continued)
Name, Address and Year of Birth,
Position with Funds, Year First
Elected or Appointed to Office | | Principal Occupation(s) During Past Five Years, Number of Funds in Columbia
Funds Complex Overseen by Trustee, Other Directorships Held | |
Patrick J. Simpson (Born 1944)
c/o Columbia Management
Investment Advisers, LLC
225 Franklin Street
Boston, MA 02110
Trustee (since 2000) | | Partner, Perkins Coie LLP (law firm). Oversees 52; None | |
Anne-Lee Verville (Born 1945)
c/o Columbia Management
Investment Advisers, LLC
225 Franklin Street
Boston, MA 02110
Trustee (since 1998) | | Retired. General Manager — Global Education Industry from 1994 to 1997, President — Application Systems Division from 1991 to 1994, Chief Financial Officer — US Marketing & Services from 1988 to 1991, and Chief Information Officer from 1987 to 1988, IBM Corporation (computer and technology). Oversees 52; Enesco Group, Inc. (producer of giftware and home and garden decor products) from 2001 to 2006 | |
Interested Trustee
Name, Address and Year of Birth,
Position with Funds, Year First
Elected or Appointed to Office | | Principal Occupation(s) During Past Five Years, Number of Funds in Columbia
Funds Complex Overseen by Trustee, Other Directorships Held | |
William F. Truscott (born 1960)
53600 Ameriprise Financial Center
Minneapolis, MN 55474
Senior Vice President (since 2012) | | Chairman of the Board and President, Columbia Management Investment Advisers, LLC since May 2010 and February 2012 (previously President and Chief Investment Officer, from 2001 to April 2010); Chief Executive Officer, Global Asset Management, Ameriprise Financial, Inc. since September 2012 (previously, Chief Executive Officer, U.S. Asset Management & President, Annuities, from May 2010 to September 2012 and President — U.S. Asset Management and Chief Investment Officer from 2005 to April 2010); Director and Chief Executive Officer, Columbia Management Investment Distributors, Inc. since May 2010 and February 2012, respectively (previously Chairman of the Board and Chief Executive Officer from 2006 to April 2010); Chairman of the Board and Chief Executive Officer, RiverSource Distributors, Inc. since 2006; President and Chief Executive Officer, Ameriprise Certificate Company, 2006 to August 2012; Oversees 184; Director, Ameriprise Certificate Company, 2006-January 2013 | |
The Statement of Additional Information includes additional information about the Trustees of the Funds and is available, without charge, upon request by calling 800.345.6611.
The Board has appointed officers who are responsible for day-to-day business decisions based on policies it has established. The officers serve at the pleasure of the Board. In addition to Mr. Truscott, who is Senior Vice President, the Funds' other officers are:
Officers
Name, Year of Birth and Address | | Principal Occupation(s) During the Past Five Years | |
J. Kevin Connaughton (Born 1964)
225 Franklin Street
Boston, MA 02110
President (since 2009) | | Senior Vice President and General Manager — Mutual Fund Products, Columbia Management Investment Advisers, LLC since May 2010; President, Columbia Funds since 2009 and RiverSource Funds since May 2010; Managing Director, Columbia Management Advisors, LLC, December 2004-April 2010; Senior Vice President and Chief Financial Officer, Columbia Funds, June 2008-January 2009; Treasurer, Columbia Funds, October 2003-May 2008; and senior officer of various other affiliated funds since 2000 | |
Amy Johnson (Born 1965)
5228 Ameriprise Financial Center
Minneapolis, MN 55474
Vice President (since 2010) | | Senior Vice President and Chief Operating Officer, Columbia Management Investment Advisers, LLC since May 2010 (previously Chief Administrative Officer, from 2009-April 2010, Vice President — Asset Management and Trust Company Services, from 2006-2009) | |
Michael G. Clarke (Born 1969)
225 Franklin Street
Boston, MA 02110
Treasurer (since 2011) and Chief
Financial Officer (since 2009) | | Vice President, Columbia Management Investment Advisers, LLC since May 2010; Managing Director of Fund Administration, Columbia Management Advisors, LLC, September 2004-April 2010; senior officer of Columbia Funds and affiliated funds since 2002 | |
Annual Report 2013
59
Trustees and Officers (continued)
Officers (continued)
Name, Year of Birth and Address | | Principal Occupation(s) During the Past Five Years | |
Scott R. Plummer (Born 1959)
5228 Ameriprise Financial Center
Minneapolis, MN 55474
Senior Vice President, Assistant
Secretary and Chief Legal Officer
(since 2010) | | Senior Vice President, Chief Legal Officer and Assistant Secretary, Columbia Management Investment Advisers, LLC since June 2005; Senior Vice President and Lead Chief Counsel — Asset Management, Ameriprise Financial, Inc. since May 2010 (previously Vice President and Chief Counsel — Asset Management, 2005-April 2010); Vice President, Chief Counsel and Assistant Secretary, Columbia Management Investment Distributors, Inc. since 2008; Vice President, General Counsel and Secretary, Ameriprise Certificate Company since 2005; Chief Counsel, RiverSource Distributors, Inc. since 2006; senior officer of Columbia Funds and affiliated funds since 2010 | |
Colin Moore (Born 1958)
225 Franklin Street
Boston, MA 02110
Senior Vice President (since 2010) | | Executive Vice President and Global Chief Investment Officer, Ameriprise Financial, Inc. since July 2013; Director and Global Chief Investment Officer, Columbia Management Investment Advisers, LLC since May 2010; Manager, Managing Director and Chief Investment Officer of Columbia Management Advisors, LLC, 2007-April 2010 | |
Thomas P. McGuire (Born 1972)
225 Franklin Street
Boston, MA 02110
Chief Compliance Officer
(since 2012) | | Vice President — Asset Management Compliance, Columbia Management Investment Advisers, LLC since 2010; Chief Compliance Officer, Ameriprise Certificate Company, since September 2010; Compliance Executive, Bank of America, N.A. 2005-2010 | |
Stephen T. Welsh (born 1957)
225 Franklin Street
Boston, MA 02110
Vice President (since 2006) | | President and Director, Columbia Management Investment Services Corp. since May 2010; President and Director, Columbia Management Services, Inc., July 2004-April 2010; Managing Director, Columbia Management Distributors, Inc., August 2007-April 2010 | |
Christopher O. Petersen (born 1970)
5228 Ameriprise Financial Center
Minneapolis, MN 55474
Vice President (since 2010) and
Secretary (since 2011) | | Vice President and Chief Counsel, Ameriprise Financial, Inc. since January 2010 (formerly Vice President and Group Counsel or Counsel, April 2004-January 2010); Assistant Secretary of Columbia Funds, January 2007-April 2011 | |
Paul D. Pearson (born 1956)
10468 Ameriprise Financial Center
Minneapolis, MN 55474
Vice President and Assistant
Treasurer (since 2011) | | Vice President, Investment Accounting, Columbia Management Investment Advisers, LLC, since May 2010; Vice President — Managed Assets, Investment Accounting, Ameriprise Financial, Inc., February 1998-May 2010 | |
Joseph F. DiMaria (Born 1968)
225 Franklin Street
Boston, MA 02110
Vice President (since 2011) and
Chief Accounting Officer (since 2008) | | Vice President, Mutual Fund Administration, Columbia Management Investment Advisers, LLC, since May 2010; Director of Fund Administration, Columbia Management Advisors, LLC, January 2006-April 2010 | |
Paul B. Goucher (born 1968)
100 Park Avenue
New York, NY 10017
Vice President and Assistant
Secretary (since 2010) | | Vice President and Lead Chief Counsel, Ameriprise Financial, Inc. since November 2008 and January 2013, respectively (formerly, Chief Counsel from January 2010-January 2013 and Group Counsel from November 2008-January 2010); Director, Managing Director and General Counsel, J. & W. Seligman & Co. Incorporated, July 2008-November 2008 (previously, Managing Director and Associate General Counsel, January 2005-July 2008) | |
Michael E. DeFao (born 1968)
225 Franklin Street
Boston, MA 02110
Vice President and Assistant
Secretary (since 2011) | | Vice President and Chief Counsel, Ameriprise Financial, Inc. since May 2010; Associate General Counsel, Bank of America, N.A. June 2005-April 2010 | |
Annual Report 2013
60
Board Consideration and Approval of
Advisory Agreement
On June 14, 2013, the Board of Trustees (the "Board") and the Trustees who are not interested persons (as defined in the Investment Company Act of 1940) of the Trust (the "Independent Trustees") unanimously approved the continuation of the Investment Management Services Agreement (the "Advisory Agreement") with Columbia Management Investment Advisers, LLC (the "Investment Manager") with respect to Columbia Balanced Fund (the "Fund"), a series of the Trust. As detailed below, the Advisory Fees and Expenses Committee (the "Committee") and the Board met on multiple occasions to review and discuss, both among themselves and with the management team of the Investment Manager, materials provided by the Investment Manager before determining to approve the continuation of the Advisory Agreement.
In connection with their deliberations regarding the continuation of the Advisory Agreement, the Committee and the Board evaluated materials requested from the Investment Manager regarding the Fund and the Advisory Agreement, and discussed these materials with representatives of the Investment Manager at Committee meetings held on March 5, 2013, April 24, 2013 and June 13, 2013, and at the Board meeting held on June 14, 2013. In addition, the Board considers matters bearing on the Advisory Agreement at most of its other meetings throughout the year and meets regularly with senior management of the Funds and the Investment Manager. Through the Board's Investment Oversight Committees, Trustees also meet with selected Fund portfolio managers and other investment personnel at various times throughout the year. The Committee and the Board also consulted with Fund counsel and with the Independent Trustees' independent legal counsel, who advised on various matters with respect to the Committee's and the Board's considerations and otherwise assisted the Committee and the Board in their deliberations. On June 13, 2013, the Committee recommended that the Board approve the continuation of the Advisory Agreement. On June 14, 2013, the Board, including the Independent Trustees, voting separately, unanimously approved the continuation of the Advisory Agreement for the Fund.
The Committee and the Board considered all information that they, their legal counsel, or the Investment Manager believed reasonably necessary to evaluate and to determine whether to approve the continuation of the Advisory Agreement. The information and factors considered by the Committee and the Board in recommending for approval or approving the continuation of the Advisory Agreement for the Fund included the following:
• Information on the investment performance of the Fund relative to the performance of a group of mutual funds determined to be comparable to the Fund by an independent third-party data provider, as well as performance relative to benchmarks;
• Information on the Fund's advisory fees and total expenses, including information comparing the Fund's expenses to those of a group of comparable mutual funds, as determined by the independent third-party data provider;
• The Investment Manager's agreement to contractually limit or cap total operating expenses for the Fund so that total operating expenses (excluding certain fees and expenses, such as transaction costs and certain other investment related expenses, interest, taxes, acquired fund fees and expenses, and extraordinary expenses) would not exceed the median expenses of a group of comparable funds (as determined from time to time, generally annually, by the independent third-party data provider);
• The terms and conditions of the Advisory Agreement;
• The terms and conditions of other agreements and arrangements with affiliates of the Investment Manager relating to the operations of the Fund, including the Administrative Services Agreement, the Distribution Agreement and the Transfer and Dividend Disbursing Agent Agreement;
• Descriptions of various functions performed by the Investment Manager under the Advisory Agreement, including portfolio management and portfolio trading practices;
• Information regarding the management fees and investment performance of comparable portfolios of other clients of the Investment Manager, including institutional separate accounts;
• Information regarding the reputation, regulatory history and resources of the Investment Manager, including information regarding senior management, portfolio managers and other personnel;
• Information regarding the capabilities of the Investment Manager with respect to compliance monitoring services, including an assessment of the Investment Manager's compliance system by the Fund's Chief Compliance Officer; and
• The profitability to the Investment Manager and its affiliates from their relationships with the Fund.
Annual Report 2013
61
Board Consideration and Approval of
Advisory Agreement (continued)
Nature, Extent and Quality of Services Provided under the Advisory Agreement
The Committee and the Board considered the nature, extent and quality of services provided to the Fund by the Investment Manager and its affiliates under the Advisory Agreement and under separate agreements for the provision of transfer agency and administrative services, and the resources dedicated to the Fund and the other Columbia Funds by the Investment Manager and its affiliates. The Committee and the Board considered, among other things, the Investment Manager's ability to attract, motivate and retain highly qualified research, advisory and supervisory investment professionals (including personnel and other resources, compensation programs for personnel involved in fund management, reputation and other attributes), the portfolio management services provided by those investment professionals, and the quality of the Investment Manager's investment research capabilities and trade execution services. The Committee and the Board also considered the potential benefits to shareholders of investing in a mutual fund that is part of a fund complex offering exposure to a variety of asset classes and investment disciplines and providing a variety of fund and shareholder services.
The Committee and the Board also considered the professional experience and qualifications of the senior personnel of the Investment Manager, which included consideration of the Investment Manager's experience with similarly-structured funds. The Committee and the Board noted the compliance programs of and the compliance-related resources provided to the Fund by the Investment Manager and its affiliates, and considered the Investment Manager's ability to provide administrative services to the Fund pursuant to a separate Administrative Services Agreement, including the Investment Manager's ability to coordinate the activities of the Fund's other service providers. After reviewing these and related factors, the Committee and the Board concluded, within the context of their overall conclusions, that the nature, extent and quality of the services provided to the Fund under the Advisory Agreement supported the continuation of the Advisory Agreement.
Investment Performance
The Committee and the Board reviewed information about the performance of the Fund over various time periods, including performance information relative to benchmarks and information based on reports of the independent third-party data provider that compared the performance of the Fund to the performance of a group of comparable mutual funds. The Committee and the Board also reviewed a description of the third party's methodology for identifying the Fund's peer groups for purposes of performance and expense comparisons.
The Committee and the Board noted that, through December 31, 2012, the Fund's performance was in the thirty-first, twenty-second and fourth percentile (where the best performance would be in the first percentile) of its category selected by the independent third-party data provider for the purposes of performance comparisons for the one-, three- and five- year periods, respectively.
The Committee and the Board also considered the Investment Manager's performance and reputation generally, the Investment Manager's historical responsiveness to Board concerns about performance, and the Investment Manager's willingness to take steps intended to improve performance. After reviewing these and related factors, the Committee and the Board concluded, within the context of their overall conclusions, that the performance of the Fund supported the continuation of the Advisory Agreement.
Investment Advisory Fee Rates and Other Expenses
The Committee and the Board considered the advisory fees charged to the Fund under the Advisory Agreement as well as the total expenses incurred by the Fund. In assessing the reasonableness of the fees under the Advisory Agreement, the Committee and the Board considered, among other information, the Fund's advisory fee and its total expense ratio as a percentage of average daily net assets. The Committee and the Board noted that the Fund's actual management fee and net expense ratio are ranked in the fourth and third quintiles, respectively, (where the lowest fees and expenses would be in the first quintile) against the Fund's expense universe as determined by the independent third-party data provider for purposes of expense comparison. The Committee and the Board also took into account the fee waiver and expense limitation arrangements agreed to by the Investment Manager, as noted above.
The Committee and the Board also received and considered information about the advisory fees charged by the Investment Manager to institutional separate accounts. In considering the fees charged to those accounts, the Committee and the Board took into account, among other things, the Investment Manager's representations about the differences between managing mutual funds as compared to other types of accounts, including differences in the services provided, differences in the risk
Annual Report 2013
62
Board Consideration and Approval of
Advisory Agreement (continued)
profile of such business for the Investment Manager and the additional resources required to manage mutual funds effectively. In evaluating the Fund's advisory fees, the Committee and the Board also took into account the demands, complexity and quality of the investment management of the Fund.
After reviewing these and related factors, the Committee and the Board concluded, within the context of their overall conclusions, that the advisory fee rates and expenses of the Fund supported the continuation of the Advisory Agreement.
Costs of Services Provided and Profitability
The Committee and the Board also took note of the costs of the services provided (both on an absolute and relative basis) and the profitability to the Investment Manager and its affiliates in connection with their relationships with the Fund. In evaluating these considerations, the Committee and the Board took note of the advisory fees charged by the Investment Manager to other clients, including fees charged by the Investment Manager to institutional separate account clients with similar investment strategies to those of the Fund.
The Committee and the Board also considered the compensation directly or indirectly received by the Investment Manager's affiliates in connection with their relationships with the Fund. The Committee and the Board reviewed information provided by management as to the profitability of the Investment Manager and its affiliates of their relationships with the Fund, information about the allocation of expenses used to calculate profitability, and comparisons of profitability levels realized in 2012 to profitability levels realized in 2011. When reviewing profitability, the Committee and the Board also considered court cases in which adviser profitability was an issue in whole or in part, the performance of the Fund, and the expense ratio of the Fund, and the implementation of expense limitations with respect to the Fund. The Committee and the Board also considered information provided by the Investment Manager regarding its financial condition and comparing its profitability to that of other asset management firms that are, or are subsidiaries of, publicly traded companies.
After reviewing these and related factors, the Committee and the Board concluded, within the context of their overall conclusions, that the costs of services provided and the profitability to the Investment Manager and its affiliates from their relationships with the Fund supported the continuation of the Advisory Agreement.
Economies of Scale
The Committee and the Board considered the potential existence of economies of scale in the provision by the Investment Manager of services to the Fund, to groups of related funds, and to the Investment Manager's investment advisory clients as a whole, and whether those economies of scale were shared with the Fund through breakpoints in investment advisory fees or other means, such as expense limitation arrangements and additional investments by the Investment Manager in investment, trading and compliance resources. The Committee and the Board noted that the investment advisory fee schedules for the Fund contained breakpoints that would reduce the fee rate on assets above specified threshold levels.
In considering these matters, the Committee and the Board also considered the costs of the services provided and the profitability to the Investment Manager and its affiliates from their relationships with the Fund, as discussed above. After reviewing these and related factors, the Committee and the Board concluded, within the context of their overall conclusions, that the extent to which any economies of scale were expected to be shared with the Fund supported the continuation of the Advisory Agreement.
Other Benefits to the Investment Manager
The Committee and the Board received and considered information regarding "fall-out" or ancillary benefits received by the Investment Manager and its affiliates as a result of their relationships with the Fund, such as the engagement of the Investment Manager to provide administrative services to the Fund and the engagement of the Investment Manager's affiliates to provide distribution and transfer agency services to the Fund. The Committee and the Board considered that the Fund's distributor retains a portion of the distribution fees from the Fund. The Committee and the Board also considered the benefits of research made available to the Investment Manager by reason of brokerage commissions generated by the Fund's securities transactions, and reviewed information about the Investment Manager's practices with respect to allocating portfolio transactions for brokerage and research services. The Committee and the Board considered the possible conflicts of interest associated with certain fall-out or other ancillary benefits and the reporting, disclosure and other processes that are in place to address such possible conflicts of interest. The Committee and the Board recognized that the Investment Manager's profitability would be somewhat lower without these benefits.
Annual Report 2013
63
Board Consideration and Approval of
Advisory Agreement (continued)
Conclusion
The Committee and the Board reviewed all of the above considerations in reaching their decisions to recommend or approve the continuation of the Advisory Agreement. In their deliberations, the Trustees did not identify any particular information that was all-important or controlling, and individual Trustees may have attributed different weights to the various factors. Based on their evaluation of all factors that they deemed to be material, including those factors described above, and assisted by the advice of independent legal counsel, the Board, including the Independent Trustees, voting separately, unanimously approved the continuation of the Advisory Agreement.
Annual Report 2013
64
Important Information About This Report
Each fund mails one shareholder report to each shareholder address. If you would like more than one report, please call shareholder services at 800.345.6611 and additional reports will be sent to you.
The policy of the Board is to vote the proxies of the companies in which each fund holds investments consistent with the procedures as stated in the Statement of Additional Information (SAI). You may obtain a copy of the SAI without charge by calling 800.345.6611; contacting your financial intermediary; visiting columbiamanagement.com; or searching the website of the Securities and Exchange Commission (SEC) at sec.gov. Information regarding how each fund voted proxies relating to portfolio securities is filed with the SEC by August 31 for the most recent 12-month period ending June 30 of that year, and is available without charge by visiting columbiamanagement.com; or searching the website of the SEC at sec.gov.
Each fund files a complete schedule of portfolio holdings with the SEC for the first and third quarters of each fiscal year on Form N-Q. Each fund's Form N-Q is available on the SEC's website at sec.gov and may be reviewed and copied at the SEC's Public Reference Room in Washington, D.C. Information on the operation of the Public Reference Room may be obtained by calling 800.SEC.0330. Each fund's complete schedule of portfolio holdings, as filed on Form N-Q, can also be obtained without charge, upon request, by calling 800.345.6611.
Annual Report 2013
65

Columbia Balanced Fund
P.O. Box 8081
Boston, MA 02266-8081
columbiamanagement.com
This information is for use with concurrent or prior delivery of a fund prospectus. Please read and consider the investment objectives, risks, charges and expenses for any fund carefully before investing. For a prospectus which contains this and other important information about the Fund go to columbiamanagement.com. The Fund is distributed by Columbia Management Investment Distributors, Inc., member FINRA, and managed by Columbia Management Investment Advisers, LLC.
© 2013 Columbia Management Investment Advisers, LLC. All rights reserved.
ANN120_08_C01_(10/13)
Annual Report
August 31, 2013

Columbia Small Cap Core Fund
Not FDIC insured • No bank guarantee • May lose value
 Dear Shareholders,
A return to volatility
Volatility returned to the financial markets in the second quarter of 2013, as uncertainty about the global economy, monetary policy and the impact of the sequester's spending cuts weighed on investors. Households advanced their spending but also allocated less to savings. Labor markets continued to crank out jobs at a steady pace, slowly reducing unemployment. Housing activity remained strong and retail sales were higher despite no real increase in income. The single weak spot was in the manufacturing sector, where activity slowed. While the consumer has weathered the domestic drag well, business has been closer to the global slowdown and effects of sequestration. Businesses remain very cautious, keeping inventories and staffs lean, and are planning for but not yet confident enough to make capital expenditures.
Against this backdrop, equities outperformed fixed income during the second quarter of 2013. Small-cap stocks outperformed large- and mid-cap stocks, and growth outperformed value except for in the large-cap sector. Outside the United States, foreign stock markets generally lost ground, with the most significant losses sustained by emerging markets.
Columbia Management to begin delivering summary prospectuses
Each Columbia fund is required to update its prospectus on an annual basis. Beginning with June 2013 prospectus updates, shareholders of Columbia retail mutual funds will start to receive a summary prospectus, rather than the full length (statutory) mutual fund prospectus they have received in the past.
Each fund's summary prospectus will include the following key information:
> Investment objective
> Fee and expense table
> Portfolio turnover rate information
> Principal investment strategies, principal risks and performance information
> Management information
> Purchase and sale information
> Tax information
> Financial intermediary compensation information
Each fund's statutory prospectus will contain additional information about the fund and its risks. Both the statutory and summary prospectus will be updated each year, and will be available at columbiamanagement.com. Shareholders may request a printed version of a statutory prospectus at no cost by calling 800.345.6611 or sending an email to serviceinquiries@columbiamanagement.com.
Stay on track with Columbia Management
Backed by more than 100 years of experience, Columbia Management is one of the nation's largest asset managers. At the heart of our success — and, most importantly, that of our investors — are highly talented industry professionals, brought together by a unique way of working. We are dedicated to helping you take advantage of today's opportunities and anticipate tomorrow's. We stay abreast of the latest investment trends and ideas, using our collective insight to evaluate events and transform them into solutions you can use.
Visit columbiamanagement.com for:
> The Columbia Management Perspectives blog, featuring timely posts by our investment teams
> Detailed up-to-date fund performance and portfolio information
> Economic analysis and market commentary
> Quarterly fund commentaries
> Columbia Management Investor, our award-winning quarterly newsletter for shareholders
Thank you for your continued support of the Columbia Funds. We look forward to serving your investment needs for many years to come.
Best Regards,

J. Kevin Connaughton
President, Columbia Funds
Investors should consider the investment objectives, risks, charges and expenses of a mutual fund carefully before investing. For a free prospectus, which contains this and other important information about a fund, visit columbiamanagement.com. The prospectus should be read carefully before investing.
Columbia Funds are distributed by Columbia Management Investment Distributors, Inc., member FINRA, and managed by Columbia Management Investment Advisers, LLC.
© 2013 Columbia Management Investment Advisers, LLC. All rights reserved.
Columbia Small Cap Core Fund
Performance Overview | | | 2 | | |
Manager Discussion of Fund Performance | | | 4 | | |
Understanding Your Fund's Expenses | | | 6 | | |
Portfolio of Investments | | | 7 | | |
Statement of Assets and Liabilities | | | 13 | | |
Statement of Operations | | | 15 | | |
Statement of Changes in Net Assets | | | 16 | | |
Financial Highlights | | | 19 | | |
Notes to Financial Statements | | | 29 | | |
Report of Independent Registered
Public Accounting Firm | | | 36 | | |
Federal Income Tax Information | | | 37 | | |
Trustees and Officers | | | 38 | | |
Board Consideration and Approval of Advisory Agreement | | | 41 | | |
Important Information About This Report | | | 45 | | |
Fund Investment Manager
Columbia Management Investment
Advisers, LLC
225 Franklin Street
Boston, MA 02110
Fund Distributor
Columbia Management Investment
Distributors, Inc.
225 Franklin Street
Boston, MA 02110
Fund Transfer Agent
Columbia Management Investment
Services Corp.
P.O. Box 8081
Boston, MA 02266-8081
For more information about any of the funds, please visit columbiamanagement.com or call 800.345.6611. Customer Service Representatives are available to answer your questions Monday through Friday from 8 a.m. to 8 p.m. Eastern time.
The views expressed in this report reflect the current views of the respective parties. These views are not guarantees of future performance and involve certain risks, uncertainties and assumptions that are difficult to predict, so actual outcomes and results may differ significantly from the views expressed. These views are subject to change at any time based upon economic, market or other conditions and the respective parties disclaim any responsibility to update such views. These views may not be relied on as investment advice and, because investment decisions for a Columbia Fund are based on numerous factors, may not be relied on as an indication of trading intent on behalf of any particular Columbia Fund. References to specific securities should not be construed as a recommendation or investment advice.
Columbia Small Cap Core Fund
Performance Summary
> Columbia Small Cap Core Fund (the Fund) Class A shares returned 27.93% excluding sales charges for the 12-month period that ended August 31, 2013.
> The Fund outperformed both of its benchmarks, the Russell 2000 Index and the S&P SmallCap 600 Index, which returned 26.27% and 26.69%, respectively, for the same 12-month period.
> Security selection within the health care, financials and energy sectors helped push the Fund ahead of the Russell 2000 Index during the period.
Average Annual Total Returns (%) (for period ended August 31, 2013)
| | Inception | | 1 Year | | 5 Years | | 10 Years | |
Class A | | 11/01/98 | | | | | | | | | | | | | |
Excluding sales charges | | | | | | | 27.93 | | | | 8.09 | | | | 8.93 | | |
Including sales charges | | | | | | | 20.56 | | | | 6.81 | | | | 8.29 | | |
Class B | | 11/01/98 | | | | | | | | | | | | | |
Excluding sales charges | | | | | | | 26.90 | | | | 7.27 | | | | 8.12 | | |
Including sales charges | | | | | | | 21.90 | | | | 6.97 | | | | 8.12 | | |
Class C | | 11/18/02 | | | | | | | | | | | | | |
Excluding sales charges | | | | | | | 26.95 | | | | 7.27 | | | | 8.11 | | |
Including sales charges | | | | | | | 25.95 | | | | 7.27 | | | | 8.11 | | |
Class I* | | 09/27/10 | | | 28.49 | | | | 8.47 | | | | 9.27 | | |
Class R4* | | 11/08/12 | | | 28.18 | | | | 8.35 | | | | 9.21 | | |
Class R5* | | 11/08/12 | | | 28.36 | | | | 8.38 | | | | 9.22 | | |
Class T | | 02/12/93 | | | | | | | | | | | | | |
Excluding sales charges | | | | | | | 27.86 | | | | 8.02 | | | | 8.87 | | |
Including sales charges | | | | | | | 20.51 | | | | 6.75 | | | | 8.23 | | |
Class W* | | 09/27/10 | | | 27.93 | | | | 8.09 | | | | 8.95 | | |
Class Y* | | 11/08/12 | | | 28.37 | | | | 8.38 | | | | 9.22 | | |
Class Z | | 12/14/92 | | | 28.17 | | | | 8.35 | | | | 9.21 | | |
Russell 2000 Index | | | | | | | 26.27 | | | | 7.98 | | | | 8.76 | | |
S&P SmallCap 600 Index | | | | | | | 26.69 | | | | 9.51 | | | | 10.14 | | |
Returns for Class A and Class T are shown with and without the maximum initial sales charge of 5.75%. Returns for Class B are shown with and without the applicable contingent deferred sales charge (CDSC) of 5.00% in the first year, declining to 1.00% in the sixth year and eliminated thereafter. Returns for Class C are shown with and without the 1.00% CDSC for the first year only. The Fund's other classes are not subject to sales charges and have limited eligibility. Please see the Fund's prospectus for details. Performance for different share classes will vary based on differences in sales charges and fees associated with each class. All results shown assume reinvestment of distributions during the period. Returns do not reflect the deduction of taxes that a shareholder may pay on Fund distributions or on the redemption of Fund shares. Performance results reflect the effect of any fee waivers or reimbursements of Fund expenses by Columbia Management Investment Advisers, LLC and/or any of its affiliates. Absent these fee waivers or expense reimbursement arrangements, performance results would have been lower.
The performance information shown represents past performance and is not a guarantee of future results. The investment return and principal value of your investment will fluctuate so that your shares, when redeemed, may be worth more or less than their original cost. Current performance may be lower or higher than the performance information shown. You may obtain performance information current to the most recent month-end by contacting your financial intermediary, visiting columbiamanagement.com or calling 800.345.6611.
*The returns shown for periods prior to the share class inception date (including returns for the Life of the Fund, if shown, which are since Fund inception) include the returns of the Fund's oldest share class. These returns are adjusted to reflect any higher class-related operating expenses of the newer share classes, as applicable. Please visit columbiamanagement.com/mutual-funds/appended-performance for more information.
The Russell 2000 Index measures the performance of the small-cap segment of the U.S. equity universe. The Russell 2000 is a subset of the Russell 3000 Index representing approximately 10% of the total market capitalization of that index. It includes approximately 2,000 of the smallest securities based on a combination of their market capitalization and current index membership.
The S&P SmallCap 600 Index tracks the performance of 600 domestic companies traded on major stock exchanges. The S&P SmallCap 600 is heavily weighted with the stocks of companies with small market capitalizations.
Indices are not available for investment, are not professionally managed and do not reflect sales charges, fees, brokerage commissions, taxes or other expenses of investing. Securities in the Fund may not match those in an index.
Annual Report 2013
2
Columbia Small Cap Core Fund
Performance Overview (continued)
Performance of a Hypothetical $10,000 Investment (September 1, 2003 – August 31, 2013)

The chart above shows the change in value of a hypothetical $10,000 investment in Class A shares of Columbia Small Cap Core Fund during the stated time period, and does not reflect the deduction of taxes that a shareholder may pay on Fund distributions or on the redemption of Fund shares.
Annual Report 2013
3
Columbia Small Cap Core Fund
Manager Discussion of Fund Performance
For the 12-month period that ended August 31, 2013, the Fund's Class A shares returned 27.93% excluding sales charges. Over the same time period, the Fund's benchmarks, the Russell 2000 Index and the S&P SmallCap 600 Index, gained 26.27% and 26.69%, respectively. Security selection drove most of the Fund's outperformance relative to the Russell 2000 Index, but sector allocations also contributed to results. We maintained our disciplined focus on seeking to invest in companies with strong management teams, solid balance sheets and good long-term earnings growth prospects when their stocks were under pressure because of short-term issues. We also owned micro-cap companies we believed had not yet been discovered by Wall Street. Our long-term perspective and low portfolio turnover was rewarded, as many of the stocks that were last year's underperformers became this year's top contributors.
Encouraging Economic News Aided Market Returns
Concerns about the impact of tax increases and enforced federal spending cuts, another showdown over the debt ceiling and the possibility of an attack on Syria weighed on investors during the past 12 months. Worries that the Federal Reserve would taper the monthly bond-buying program it began last fall further pressured returns in May and June. However, steady job growth, a solid rebound in the housing market and a late-period pickup in manufacturing activity helped keep economic growth afloat. As central banks continued to pour liquidity into key markets, investors bid prices higher on stocks and other riskier assets, with U.S. equities outpacing most international markets. In this environment, small-cap stocks, which tend to be more domestically focused than larger, more global companies, did particularly well.
Boost from Health Care and Financials
Stock picks in health care helped drive the Fund's results ahead of those of the Russell 2000 Index. We favored health care services and medical products companies because we believed their shares tended to be more attractively valued than biotechnology or pharmaceutical stocks. Standout performers included privatized social services company Providence Service, whose share price posted sharp gains after a large shareholder pushed for management changes, resulting in a new CEO and CFO who quickly began turning around the business. An investment in Staar Surgical, which makes intraocular lenses for cataract surgery and implantable contact lenses for myopia, soared, as improved execution by management and growth in the company's Asian end markets drove earnings ahead of expectations. Security selection in financials also gave a sizable boost to relative performance. Winners included Puerto Rico-based bank OFG Bancorp (formerly Oriental Financial), whose steep share price appreciation was fueled by an acquisition that boosted the company's loan business and earnings prospects. Finally, stock picks in energy contributed, led by energy service company Tetra Technologies, whose share price benefited from the company's improved cash flow outlook, reduced expense structure and a new CFO who was focused on capital return.
Disappointing Stock Picks in Industrials
A sizable overweight in industrials helped relative performance but wasn't enough to offset the underperformance generated by a handful of stocks. Individual detractors included air freight company Atlas Air Worldwide Holdings, whose share price declined as lackluster economies reduced demand
Portfolio Management
Richard D'Auteuil
Jeffrey Hershey, CFA
Paul Szczygiel, CFA
Morningstar Style BoxTM
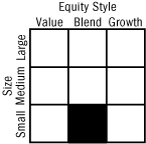
The Morningstar Style BoxTM is based on a fund's portfolio holdings. For equity funds, the vertical axis shows the market capitalization of the stocks owned, and the horizontal axis shows investment style (value, blend, or growth). Information shown is based on the most recent data provided by Morningstar.
©2013 Morningstar, Inc. All rights reserved. The Morningstar information contained herein: (1) is proprietary to Morningstar and/or its content providers; (2) may not be copied or distributed; and (3) is not warranted to be accurate, complete or timely. Neither Morningstar nor its content providers are responsible for any damages or losses arising from any use of this information.
Top Ten Holdings (%)
(at August 31, 2013) | |
Staar Surgical Co. | | | 1.6 | | |
OFG Bancorp | | | 1.6 | | |
Providence Service Corp. (The) | | | 1.5 | | |
Tetra Technologies, Inc. | | | 1.4 | | |
Air Methods Corp. | | | 1.3 | | |
John Wiley & Sons, Inc., Class A | | | 1.2 | | |
Progress Software Corp. | | | 1.2 | | |
Belden, Inc. | | | 1.1 | | |
Plexus Corp. | | | 1.1 | | |
Wabash National Corp. | | | 1.1 | | |
Percentages indicated are based upon total investments (excluding Money Market Funds).
For further detail about these holdings, please refer to the section entitled "Portfolio of Investments."
Fund holdings are as of the date given, are subject to change at any time, and are not recommendations to buy or sell any security.
Annual Report 2013
4
Columbia Small Cap Core Fund
Manager Discussion of Fund Performance (continued)
worldwide, especially for higher cost air shipments and as excess industry capacity pressured rates. To a lesser extent, stock picks in the information technology and consumer discretionary sectors also hurt relative performance. In technology, PRGX Global, which does recovery audit services for the retail and health care markets, saw its share price fall due to weak first-quarter results and delays in the bidding process for a new government contract. In consumer discretionary, an out-of-index stake in publisher John Wiley & Sons further hampered performance, as weak demand and elevated expenses associated with transitioning from print to digital hurt the company's bottom line.
Positioned for Economic Expansion
After the strong rally that took place during the 12 months ended August 31, 2013, many stocks look expensive, making it more difficult to find new ideas that meet our valuation criteria. However, we believe we can still find attractively valued small-cap stocks with strong earnings growth potential that we can own for the next three to five years. We're also cautiously optimistic that stocks will benefit if the economy continues to get better and if, as expected, investors rotate out of bonds and into stocks in anticipation of rising interest rates. We believe the Fund ended the period well positioned for improved economic growth and higher interest rates, with a continued sizable overweight in industrials and increased exposure to the consumer discretionary sector.
Portfolio Breakdown (%)
(at August 31, 2013) | |
Common Stocks | | | 97.0 | | |
Consumer Discretionary | | | 11.5 | | |
Consumer Staples | | | 1.1 | | |
Energy | | | 6.3 | | |
Financials | | | 18.8 | | |
Health Care | | | 11.8 | | |
Industrials | | | 21.1 | | |
Information Technology | | | 19.0 | | |
Materials | | | 4.8 | | |
Telecommunication Services | | | 0.7 | | |
Utilities | | | 1.9 | | |
Money Market Funds | | | 3.0 | | |
Total | | | 100.0 | | |
Percentages indicated are based upon total investments. The Fund's portfolio composition is subject to change.
Investment Risks
Risks include stock market fluctuations due to business and economic developments. Investments in small-cap companies may be subject to greater volatility and price fluctuations because they may be thinly traded and less liquid. Value stocks may also be subject to specific business risks that have caused the stocks to be out of favor. See the Fund's prospectus for information on these and other risks.
Annual Report 2013
5
Columbia Small Cap Core Fund
Understanding Your Fund's Expenses
(Unaudited)
As an investor, you incur two types of costs. There are transaction costs, which generally include sales charges on purchases and may include redemption fees. There are also ongoing costs, which generally include management fees, distribution and service (Rule 12b-1) fees, and other fund expenses. The following information is intended to help you understand your ongoing costs (in dollars) of investing in the Fund and to help you compare these costs with the ongoing costs of investing in other mutual funds.
Analyzing Your Fund's Expenses
To illustrate these ongoing costs, we have provided examples and calculated the expenses paid by investors in each share class of the Fund during the period. The actual and hypothetical information in the table is based on an initial investment of $1,000 at the beginning of the period indicated and held for the entire period. Expense information is calculated two ways and each method provides you with different information. The amount listed in the "Actual" column is calculated using the Fund's actual operating expenses and total return for the period. You may use the Actual information, together with the amount invested, to estimate the expenses that you paid over the period. Simply divide your account value by $1,000 (for example, an $8,600 account value divided by $1,000 = 8.6), then multiply the results by the expenses paid during the period under the Actual column. The amount listed in the "Hypothetical" column assumes a 5% annual rate of return before expenses (which is not the Fund's actual return) and then applies the Fund's actual expense ratio for the period to the hypothetical return. You should not use the hypothetical account values and expenses to estimate either your actual account balance at the end of the period or the expenses you paid during the period. See "Compare With Other Funds" below for details on how to use the hypothetical data.
Compare With Other Funds
Since all mutual funds are required to include the same hypothetical calculations about expenses in shareholder reports, you can use this information to compare the ongoing cost of investing in the Fund with other funds. To do so, compare the hypothetical example with the 5% hypothetical examples that appear in the shareholder reports of other funds. As you compare hypothetical examples of other funds, it is important to note that hypothetical examples are meant to highlight the ongoing costs of investing in a fund only and do not reflect any transaction costs, such as sales charges, or redemption or exchange fees. Therefore, the hypothetical calculations are useful in comparing ongoing costs only, and will not help you determine the relative total costs of owning different funds. If transaction costs were included in these calculations, your costs would be higher.
March 1, 2013 – August 31, 2013
| | Account Value at the Beginning
of the Period ($) | | Account Value at the End of the
Period ($) | | Expenses Paid During the
Period ($) | | Fund's Annualized
Expense Ratio (%) | |
| | Actual | | Hypothetical | | Actual | | Hypothetical | | Actual | | Hypothetical | | Actual | |
Class A | | | 1,000.00 | | | | 1,000.00 | | | | 1,108.70 | | | | 1,018.20 | | | | 7.24 | | | | 6.93 | | | | 1.37 | | |
Class B | | | 1,000.00 | | | | 1,000.00 | | | | 1,104.00 | | | | 1,014.49 | | | | 11.13 | | | | 10.66 | | | | 2.11 | | |
Class C | | | 1,000.00 | | | | 1,000.00 | | | | 1,103.90 | | | | 1,014.44 | | | | 11.18 | | | | 10.71 | | | | 2.12 | | |
Class I | | | 1,000.00 | | | | 1,000.00 | | | | 1,110.60 | | | | 1,020.66 | | | | 4.66 | | | | 4.46 | | | | 0.88 | | |
Class R4 | | | 1,000.00 | | | | 1,000.00 | | | | 1,110.00 | | | | 1,019.45 | | | | 5.92 | | | | 5.67 | | | | 1.12 | | |
Class R5 | | | 1,000.00 | | | | 1,000.00 | | | | 1,110.60 | | | | 1,020.36 | | | | 4.97 | | | | 4.76 | | | | 0.94 | | |
Class T | | | 1,000.00 | | | | 1,000.00 | | | | 1,108.30 | | | | 1,017.95 | | | | 7.50 | | | | 7.18 | | | | 1.42 | | |
Class W | | | 1,000.00 | | | | 1,000.00 | | | | 1,108.00 | | | | 1,018.25 | | | | 7.19 | | | | 6.88 | | | | 1.36 | | |
Class Y | | | 1,000.00 | | | | 1,000.00 | | | | 1,110.80 | | | | 1,020.66 | | | | 4.66 | | | | 4.46 | | | | 0.88 | | |
Class Z | | | 1,000.00 | | | | 1,000.00 | | | | 1,109.80 | | | | 1,019.50 | | | | 5.87 | | | | 5.62 | | | | 1.11 | | |
Expenses paid during the period are equal to the annualized expense ratio for each class as indicated above, multiplied by the average account value over the period and then multiplied by the number of days in the Fund's most recent fiscal half year and divided by 365.
Expenses do not include fees and expenses incurred indirectly by the Fund from the underlying funds in which the Fund may invest (also referred to as "acquired funds"), including affiliated and non-affiliated pooled investment vehicles (including mutual funds and exchange-traded funds).
Had Columbia Management Investment Advisers, LLC and/or certain of its affiliates not waived/reimbursed certain fees and expenses, account value at the end of the period would have been reduced.
Annual Report 2013
6
Columbia Small Cap Core Fund
Portfolio of Investments
August 31, 2013
(Percentages represent value of investments compared to net assets)
Common Stocks 97.3%
Issuer | | Shares | | Value ($) | |
Consumer Discretionary 11.5% | |
Auto Components 1.5% | |
Dorman Products, Inc. | | | 150,781 | | | | 7,575,237 | | |
Fox Factory Holding Corp.(a) | | | 136,203 | | | | 2,473,447 | | |
Modine Manufacturing Co.(a) | | | 551,081 | | | | 7,180,585 | | |
Total | | | | | 17,229,269 | | |
Diversified Consumer Services 0.7% | |
Steiner Leisure Ltd.(a) | | | 136,938 | | | | 7,630,185 | | |
Hotels, Restaurants & Leisure 1.9% | |
Bob Evans Farms, Inc. | | | 98,047 | | | | 4,807,244 | | |
CEC Entertainment, Inc. | | | 215,639 | | | | 8,726,910 | | |
Diversified Restaurant Holdings, Inc.(a) | | | 479,602 | | | | 3,026,289 | | |
Morgans Hotel Group Co.(a) | | | 743,111 | | | | 5,105,173 | | |
Total | | | | | 21,665,616 | | |
Household Durables 1.6% | |
Helen of Troy Ltd.(a) | | | 175,198 | | | | 7,039,456 | | |
Jarden Corp.(a) | | | 156,959 | | | | 6,741,389 | | |
TRI Pointe Homes, Inc.(a) | | | 285,534 | | | | 4,006,042 | | |
Total | | | | | 17,786,887 | | |
Leisure Equipment & Products 0.4% | |
Callaway Golf Co. | | | 741,567 | | | | 5,131,644 | | |
Media 1.7% | |
John Wiley & Sons, Inc., Class A | | | 305,626 | | | | 13,386,419 | | |
Valassis Communications, Inc. | | | 207,992 | | | | 5,730,179 | | |
Total | | | | | 19,116,598 | | |
Multiline Retail 0.4% | |
Tuesday Morning Corp.(a) | | | 376,253 | | | | 4,631,675 | | |
Specialty Retail 3.3% | |
Bebe Stores, Inc. | | | 545,122 | | | | 3,150,805 | | |
Buckle, Inc. (The) | | | 133,397 | | | | 6,907,297 | | |
CST Brands, Inc.(a) | | | 146,653 | | | | 4,326,264 | | |
Express, Inc.(a) | | | 154,041 | | | | 3,233,321 | | |
Penske Automotive Group, Inc. | | | 248,316 | | | | 9,691,773 | | |
Rent-A-Center, Inc. | | | 181,220 | | | | 6,797,562 | | |
Wet Seal, Inc. (The), Class A(a) | | | 997,679 | | | | 3,641,528 | | |
Total | | | | | 37,748,550 | | |
Total Consumer Discretionary | | | | | 130,940,424 | | |
Common Stocks (continued)
Issuer | | Shares | | Value ($) | |
Consumer Staples 1.2% | |
Food & Staples Retailing 0.2% | |
Casey's General Stores, Inc. | | | 37,473 | | | | 2,470,970 | | |
Food Products 0.5% | |
Ingredion, Inc. | | | 87,010 | | | | 5,476,409 | | |
Personal Products 0.5% | |
Elizabeth Arden, Inc.(a) | | | 150,206 | | | | 5,216,654 | | |
Total Consumer Staples | | | | | 13,164,033 | | |
Energy 6.3% | |
Energy Equipment & Services 4.1% | |
Gulfmark Offshore, Inc., Class A | | | 118,976 | | | | 5,470,516 | | |
Helix Energy Solutions Group, Inc.(a) | | | 281,742 | | | | 7,052,002 | | |
ION Geophysical Corp.(a) | | | 937,669 | | | | 4,491,435 | | |
Newpark Resources, Inc.(a) | | | 459,553 | | | | 5,114,825 | | |
Oceaneering International, Inc. | | | 60,608 | | | | 4,701,969 | | |
Tetra Technologies, Inc.(a) | | | 1,300,128 | | | | 15,276,504 | | |
Unit Corp.(a) | | | 107,177 | | | | 4,935,501 | | |
Total | | | | | 47,042,752 | | |
Oil, Gas & Consumable Fuels 2.2% | |
BPZ Resources, Inc.(a) | | | 733,503 | | | | 1,672,387 | | |
Carrizo Oil & Gas, Inc.(a) | | | 132,418 | | | | 4,536,641 | | |
Diamondback Energy, Inc.(a) | | | 128,284 | | | | 5,162,148 | | |
EXCO Resources, Inc. | | | 372,188 | | | | 2,709,529 | | |
Matador Resources Co.(a) | | | 360,658 | | | | 6,109,546 | | |
Resolute Energy Corp.(a) | | | 546,355 | | | | 4,283,423 | | |
Total | | | | | 24,473,674 | | |
Total Energy | | | | | 71,516,426 | | |
Financials 18.9% | |
Capital Markets 2.4% | |
FXCM, Inc., Class A | | | 325,152 | | | | 6,174,637 | | |
INTL FCStone, Inc.(a) | | | 259,624 | | | | 4,989,973 | | |
Investment Technology Group, Inc.(a) | | | 619,245 | | | | 10,527,165 | | |
Waddell & Reed Financial, Inc., Class A | | | 105,454 | | | | 5,021,719 | | |
Total | | | | | 26,713,494 | | |
Commercial Banks 6.3% | |
BBCN Bancorp, Inc. | | | 222,991 | | | | 2,979,160 | | |
Bryn Mawr Bank Corp. | | | 315,696 | | | | 7,958,696 | | |
Financial Institutions, Inc. | | | 267,058 | | | | 4,951,255 | | |
The accompanying Notes to Financial Statements are an integral part of this statement.
Annual Report 2013
7
Columbia Small Cap Core Fund
Portfolio of Investments (continued)
August 31, 2013
Common Stocks (continued)
Issuer | | Shares | | Value ($) | |
First Financial Holdings, Inc. | | | 147,199 | | | | 7,923,722 | | |
Independent Bank Corp.(a) | | | 414,663 | | | | 3,939,299 | | |
National Bank Holdings Corp., Class A | | | 246,031 | | | | 4,809,906 | | |
OFG Bancorp | | | 1,038,998 | | | | 17,849,986 | | |
Simmons First National Corp., Class A | | | 140,533 | | | | 3,402,304 | | |
Southwest Bancorp, Inc.(a) | | | 614,739 | | | | 8,876,831 | | |
Susquehanna Bancshares, Inc. | | | 242,703 | | | | 3,060,485 | | |
Union First Market Bankshares Corp. | | | 290,726 | | | | 6,218,629 | | |
Total | | | | | 71,970,273 | | |
Consumer Finance 1.0% | |
Cash America International, Inc. | | | 255,799 | | | | 10,943,081 | | |
Insurance 3.4% | |
AMERISAFE, Inc. | | | 122,280 | | | | 3,985,105 | | |
Arthur J Gallagher & Co. | | | 104,557 | | | | 4,322,386 | | |
CNO Financial Group, Inc. | | | 538,128 | | | | 7,313,159 | | |
Enstar Group Ltd.(a) | | | 54,991 | | | | 7,411,137 | | |
Horace Mann Educators Corp. | | | 208,452 | | | | 5,494,795 | | |
National Interstate Corp. | | | 79,493 | | | | 1,999,249 | | |
State Auto Financial Corp. | | | 165,216 | | | | 3,084,583 | | |
Third Point Reinsurance Ltd.(a) | | | 378,756 | | | | 4,995,792 | | |
Total | | | | | 38,606,206 | | |
Real Estate Investment Trusts (REITs) 5.0% | |
Acadia Realty Trust | | | 166,575 | | | | 3,886,195 | | |
American Campus Communities, Inc. | | | 155,200 | | | | 5,169,712 | | |
AmREIT, Inc. | | | 263,927 | | | | 4,452,449 | | |
Chesapeake Lodging Trust | | | 255,903 | | | | 5,632,425 | | |
Cousins Properties, Inc. | | | 414,639 | | | | 4,117,365 | | |
DuPont Fabros Technology, Inc. | | | 175,687 | | | | 4,003,907 | | |
First Potomac Realty Trust | | | 470,185 | | | | 5,849,101 | | |
Mack-Cali Realty Corp. | | | 136,367 | | | | 2,945,527 | | |
Physicians Realty Trust(a) | | | 444,223 | | | | 5,001,951 | | |
STAG Industrial, Inc. | | | 478,359 | | | | 9,567,180 | | |
Summit Hotel Properties, Inc. | | | 696,404 | | | | 6,643,694 | | |
Total | | | | | 57,269,506 | | |
Thrifts & Mortgage Finance 0.8% | |
Berkshire Hills Bancorp, Inc. | | | 176,665 | | | | 4,390,125 | | |
Dime Community Bancshares, Inc. | | | 295,604 | | | | 4,706,016 | | |
Total | | | | | 9,096,141 | | |
Total Financials | | | | | 214,598,701 | | |
Common Stocks (continued)
Issuer | | Shares | | Value ($) | |
Health Care 11.8% | |
Biotechnology 1.3% | |
Myriad Genetics, Inc.(a) | | | 363,333 | | | | 9,508,424 | | |
Repligen Corp.(a) | | | 475,776 | | | | 4,643,574 | | |
Total | | | | | 14,151,998 | | |
Health Care Equipment & Supplies 6.4% | |
Analogic Corp. | | | 154,886 | | | | 11,560,691 | | |
Atrion Corp. | | | 34,282 | | | | 8,193,398 | | |
Greatbatch, Inc.(a) | | | 157,209 | | | | 5,340,390 | | |
Haemonetics Corp.(a) | | | 104,285 | | | | 4,155,757 | | |
Hill-Rom Holdings, Inc. | | | 142,843 | | | | 4,876,660 | | |
Invacare Corp. | | | 465,976 | | | | 6,994,300 | | |
Staar Surgical Co.(a) | | | 1,408,787 | | | | 17,877,507 | | |
Teleflex, Inc. | | | 60,099 | | | | 4,632,431 | | |
Thoratec Corp.(a) | | | 159,608 | | | | 5,702,794 | | |
West Pharmaceutical Services, Inc. | | | 47,593 | | | | 3,519,502 | | |
Total | | | | | 72,853,430 | | |
Health Care Providers & Services 3.5% | |
Air Methods Corp. | | | 361,462 | | | | 14,791,025 | | |
LifePoint Hospitals, Inc.(a) | | | 46,061 | | | | 2,083,339 | | |
Magellan Health Services, Inc.(a) | | | 78,101 | | | | 4,390,057 | | |
Owens & Minor, Inc. | | | 50,916 | | | | 1,736,745 | | |
Providence Service Corp. (The)(a)(b) | | | 637,604 | | | | 17,113,291 | | |
Total | | | | | 40,114,457 | | |
Life Sciences Tools & Services 0.6% | |
Bruker Corp.(a) | | | 242,556 | | | | 4,860,823 | | |
Techne Corp. | | | 31,873 | | | | 2,470,476 | | |
Total | | | | | 7,331,299 | | |
Total Health Care | | | | | 134,451,184 | | |
Industrials 21.1% | |
Aerospace & Defense 2.4% | |
AAR Corp. | | | 302,538 | | | | 7,590,678 | | |
American Science & Engineering, Inc. | | | 136,048 | | | | 7,670,386 | | |
LMI Aerospace, Inc.(a) | | | 254,819 | | | | 3,080,762 | | |
Moog, Inc., Class A(a) | | | 89,092 | | | | 4,525,874 | | |
Teledyne Technologies, Inc.(a) | | | 49,852 | | | | 3,847,079 | | |
Total | | | | | 26,714,779 | | |
Air Freight & Logistics 0.8% | |
Atlas Air Worldwide Holdings, Inc.(a) | | | 200,575 | | | | 9,266,565 | | |
The accompanying Notes to Financial Statements are an integral part of this statement.
Annual Report 2013
8
Columbia Small Cap Core Fund
Portfolio of Investments (continued)
August 31, 2013
Common Stocks (continued)
Issuer | | Shares | | Value ($) | |
Commercial Services & Supplies 3.0% | |
ABM Industries, Inc. | | | 167,246 | | | | 4,038,991 | | |
ACCO Brands Corp.(a) | | | 867,886 | | | | 5,719,369 | | |
McGrath Rentcorp | | | 285,516 | | | | 9,444,869 | | |
Standard Parking Corp.(a) | | | 217,647 | | | | 4,842,646 | | |
Unifirst Corp. | | | 108,993 | | | | 10,450,249 | | |
Total | | | | | 34,496,124 | | |
Construction & Engineering 3.5% | |
Argan, Inc. | | | 296,530 | | | | 5,263,408 | | |
EMCOR Group, Inc. | | | 184,784 | | | | 6,946,031 | | |
Great Lakes Dredge & Dock Corp. | | | 709,767 | | | | 4,776,732 | | |
MasTec, Inc.(a) | | | 323,053 | | | | 10,273,085 | | |
Primoris Services Corp. | | | 392,357 | | | | 8,820,185 | | |
Sterling Construction Co., Inc.(a) | | | 328,093 | | | | 3,179,221 | | |
Total | | | | | 39,258,662 | | |
Electrical Equipment 1.6% | |
Global Power Equipment Group, Inc. | | | 270,241 | | | | 5,021,078 | | |
LSI Industries, Inc. | | | 1,162,384 | | | | 7,834,468 | | |
Regal-Beloit Corp. | | | 89,000 | | | | 5,669,300 | | |
Total | | | | | 18,524,846 | | |
Machinery 5.0% | |
Actuant Corp., Class A | | | 221,801 | | | | 7,922,732 | | |
Albany International Corp., Class A | | | 310,600 | | | | 10,023,062 | | |
Douglas Dynamics, Inc. | | | 138,637 | | | | 1,949,236 | | |
ESCO Technologies, Inc. | | | 99,679 | | | | 3,055,161 | | |
Key Technology, Inc.(a)(b) | | | 307,456 | | | | 4,092,239 | | |
Miller Industries, Inc. | | | 276,126 | | | | 4,423,539 | | |
PMFG, Inc.(a) | | | 585,960 | | | | 4,054,843 | | |
Tennant Co. | | | 77,047 | | | | 3,957,905 | | |
Terex Corp.(a) | | | 202,068 | | | | 5,859,972 | | |
Wabash National Corp.(a) | | | 1,125,014 | | | | 11,722,646 | | |
Total | | | | | 57,061,335 | | |
Marine 0.4% | |
Rand Logistics, Inc.(a) | | | 823,502 | | | | 4,323,386 | | |
Professional Services 1.7% | |
FTI Consulting, Inc.(a) | | | 168,477 | | | | 5,633,871 | | |
Hudson Global, Inc.(a) | | | 297,360 | | | | 814,766 | | |
Kforce, Inc. | | | 604,342 | | | | 9,832,644 | | |
Navigant Consulting, Inc.(a) | | | 201,695 | | | | 2,753,137 | | |
Total | | | | | 19,034,418 | | |
Common Stocks (continued)
Issuer | | Shares | | Value ($) | |
Road & Rail 0.5% | |
Marten Transport Ltd. | | | 340,944 | | | | 6,031,299 | | |
Trading Companies & Distributors 2.2% | |
Kaman Corp. | | | 231,005 | | | | 8,131,376 | | |
MRC Global, Inc.(a) | | | 192,295 | | | | 5,047,744 | | |
Rush Enterprises, Inc., Class A(a) | | | 229,960 | | | | 5,755,899 | | |
Rush Enterprises, Inc., Class B(a) | | | 133,385 | | | | 2,886,451 | | |
Titan Machinery, Inc.(a) | | | 204,649 | | | | 3,593,636 | | |
Total | | | | | 25,415,106 | | |
Total Industrials | | | | | 240,126,520 | | |
Information Technology 19.1% | |
Communications Equipment 1.8% | |
ADTRAN, Inc. | | | 188,606 | | | | 4,549,177 | | |
InterDigital, Inc. | | | 159,136 | | | | 5,655,693 | | |
Performance Technologies, Inc.(a)(b) | | | 643,041 | | | | 1,768,363 | | |
Plantronics, Inc. | | | 206,229 | | | | 8,909,093 | | |
Total | | | | | 20,882,326 | | |
Computers & Peripherals 0.3% | |
Intevac, Inc.(a) | | | 499,280 | | | | 2,990,687 | | |
Electronic Equipment, Instruments & Components 7.4% | |
Anixter International, Inc.(a) | | | 107,951 | | | | 9,020,386 | | |
Belden, Inc. | | | 223,361 | | | | 12,669,036 | | |
Benchmark Electronics, Inc.(a) | | | 445,856 | | | | 9,795,456 | | |
Cognex Corp. | | | 107,632 | | | | 6,132,871 | | |
CTS Corp. | | | 417,420 | | | | 5,810,486 | | |
FARO Technologies, Inc.(a) | | | 195,721 | | | | 7,267,121 | | |
GSI Group, Inc.(a) | | | 490,642 | | | | 4,136,112 | | |
Littelfuse, Inc. | | | 30,636 | | | | 2,260,018 | | |
Newport Corp.(a) | | | 397,330 | | | | 6,095,042 | | |
Plexus Corp.(a) | | | 383,658 | | | | 12,560,963 | | |
Rogers Corp.(a) | | | 144,314 | | | | 8,005,098 | | |
Total | | | | | 83,752,589 | | |
Internet Software & Services 1.8% | |
Digital River, Inc.(a) | | | 452,559 | | | | 7,820,220 | | |
Liquidity Services, Inc.(a) | | | 96,453 | | | | 2,858,867 | | |
Saba Software, Inc.(a) | | | 397,028 | | | | 3,940,503 | | |
Stamps.com, Inc.(a) | | | 86,413 | | | | 3,618,976 | | |
TechTarget, Inc.(a) | | | 615,800 | | | | 2,746,468 | | |
Total | | | | | 20,985,034 | | |
The accompanying Notes to Financial Statements are an integral part of this statement.
Annual Report 2013
9
Columbia Small Cap Core Fund
Portfolio of Investments (continued)
August 31, 2013
Common Stocks (continued)
Issuer | | Shares | | Value ($) | |
IT Services 3.6% | |
Acxiom Corp.(a) | | | 254,727 | | | | 6,337,608 | | |
Computer Task Group, Inc. | | | 281,092 | | | | 5,025,925 | | |
CoreLogic, Inc.(a) | | | 262,344 | | | | 6,742,241 | | |
DST Systems, Inc. | | | 120,903 | | | | 8,628,847 | | |
Global Cash Access Holdings, Inc.(a) | | | 699,863 | | | | 5,388,945 | | |
PRGX Global, Inc.(a)(b) | | | 1,426,501 | | | | 8,658,861 | | |
Total | | | | | 40,782,427 | | |
Semiconductors & Semiconductor Equipment 1.8% | |
ATMI, Inc.(a) | | | 450,307 | | | | 11,055,037 | | |
BTU International, Inc.(a) | | | 292,872 | | | | 887,402 | | |
Fairchild Semiconductor
International, Inc.(a) | | | 448,071 | | | | 5,470,947 | | |
Pericom Semiconductor Corp.(a) | | | 395,914 | | | | 2,783,275 | | |
Total | | | | | 20,196,661 | | |
Software 2.4% | |
Accelrys, Inc.(a) | | | 824,767 | | | | 7,455,894 | | |
American Software, Inc., Class A | | | 444,679 | | | | 3,566,325 | | |
Mentor Graphics Corp. | | | 129,525 | | | | 2,870,274 | | |
Progress Software Corp.(a) | | | 545,796 | | | | 13,350,170 | | |
Total | | | | | 27,242,663 | | |
Total Information Technology | | | | | 216,832,387 | | |
Materials 4.8% | |
Chemicals 3.2% | |
H.B. Fuller Co. | | | 254,350 | | | | 9,484,712 | | |
Innophos Holdings, Inc. | | | 102,150 | | | | 5,002,286 | | |
Omnova Solutions, Inc.(a) | | | 901,784 | | | | 6,961,772 | | |
Sensient Technologies Corp. | | | 263,727 | | | | 10,934,121 | | |
Stepan Co. | | | 62,109 | | | | 3,505,432 | | |
Total | | | | | 35,888,323 | | |
Containers & Packaging 0.8% | |
Greif, Inc., Class A | | | 168,631 | | | | 9,084,152 | | |
Metals & Mining 0.4% | |
Universal Stainless & Alloy
Products, Inc.(a) | | | 174,656 | | | | 4,810,026 | | |
Paper & Forest Products 0.4% | |
PH Glatfelter Co. | | | 202,366 | | | | 5,184,617 | | |
Total Materials | | | | | 54,967,118 | | |
Common Stocks (continued)
Issuer | | Shares | | Value ($) | |
Telecommunication Services 0.7% | |
Diversified Telecommunication Services 0.7% | |
General Communication, Inc.,
Class A(a) | | | 856,534 | | | | 7,665,979 | | |
Total Telecommunication Services | | | | | 7,665,979 | | |
Utilities 1.9% | |
Electric Utilities 0.4% | |
Allete, Inc. | | | 102,009 | | | | 4,814,825 | | |
Gas Utilities 1.5% | |
Laclede Group, Inc. (The) | | | 103,866 | | | | 4,625,153 | | |
New Jersey Resources Corp. | | | 112,369 | | | | 4,840,856 | | |
South Jersey Industries, Inc. | | | 119,792 | | | | 6,919,186 | | |
Total | | | | | 16,385,195 | | |
Total Utilities | | | | | 21,200,020 | | |
Total Common Stocks
(Cost: $838,806,054) | | | | | 1,105,462,792 | | |
Money Market Funds 3.0%
| | Shares | | Value ($) | |
Columbia Short-Term Cash Fund,
0.097%(b)(c) | | | 33,773,250 | | | | 33,773,250 | | |
Total Money Market Funds
(Cost: $33,773,250) | | | | | 33,773,250 | | |
Total Investments
(Cost: $872,579,304) | | | | | 1,139,236,042 | | |
Other Assets & Liabilities, Net | | | | | (3,927,293 | ) | |
Net Assets | | | | | 1,135,308,749 | | |
The accompanying Notes to Financial Statements are an integral part of this statement.
Annual Report 2013
10
Columbia Small Cap Core Fund
Portfolio of Investments (continued)
August 31, 2013
Notes to Portfolio of Investments
(a) Non-income producing.
(b) As defined in the Investment Company Act of 1940, an affiliated company is one in which the Fund owns 5% or more of its outstanding voting securities, or a company which is under common ownership or control with the Fund. Holdings and transactions in these affiliated companies during the year ended August 31, 2013, are as follows:
Issuer | | Beginning
Cost ($) | | Purchase
Cost ($) | | Proceeds
From Sales ($) | | Realized
Gain (Loss) ($) | | Ending
Cost ($) | | Dividends —
Affiliated
Issuers ($) | | Value ($) | |
Columbia Short-Term Cash Fund | | | 25,948,350 | | | | 308,323,661 | | | | (300,498,761 | ) | | | — | | | | 33,773,250 | | | | 31,735 | | | | 33,773,250 | | |
Key Technology, Inc.* | | | 3,422,025 | | | | 495,706 | | | | — | | | | — | | | | 3,917,731 | | | | — | | | | 4,092,239 | | |
Performance Technologies, Inc. | | | 5,454,067 | | | | | | | | | | | | — | | | | 5,454,067 | | | | — | | | | 1,768,363 | | |
PRGX Global, Inc.* | | | 6,001,865 | | | | 2,811,215 | | | | (113,157 | ) | | | (28,576 | ) | | | 8,671,347 | | | | — | | | | 8,658,861 | | |
Providence Service Corp. (The)* | | | 13,857,360 | | | | 2,487,722 | | | | (9,790,458 | ) | | | 2,410,941 | | | | 8,965,565 | | | | — | | | | 17,113,291 | | |
Total | | | 54,683,667 | | | | 314,118,304 | | | | (310,402,376 | ) | | | 2,382,365 | | | | 60,781,960 | | | | 31,735 | | | | 65,406,004 | | |
*Issuer was not an affiliate for the entire period ended August 31, 2013.
(c) The rate shown is the seven-day current annualized yield at August 31, 2013.
Fair Value Measurements
Generally accepted accounting principles (GAAP) require disclosure regarding the inputs and valuation techniques used to measure fair value and any changes in valuation inputs or techniques. In addition, investments shall be disclosed by major category.
The Fund categorizes its fair value measurements according to a three-level hierarchy that maximizes the use of observable inputs and minimizes the use of unobservable inputs by prioritizing that the most observable input be used when available. Observable inputs are those that market participants would use in pricing an investment based on market data obtained from sources independent of the reporting entity. Unobservable inputs are those that reflect the Fund's assumptions about the information market participants would use in pricing an investment. An investment's level within the fair value hierarchy is based on the lowest level of any input that is deemed significant to the asset or liability's fair value measurement. The input levels are not necessarily an indication of the risk or liquidity associated with investments at that level. For example, certain U.S. government securities are generally high quality and liquid, however, they are reflected as Level 2 because the inputs used to determine fair value may not always be quoted prices in an active market.
Fair value inputs are summarized in the three broad levels listed below:
> Level 1 — Valuations based on quoted prices for investments in active markets that the Fund has the ability to access at the measurement date (including NAV for open-end mutual funds). Valuation adjustments are not applied to Level 1 investments.
> Level 2 — Valuations based on other significant observable inputs (including quoted prices for similar securities, interest rates, prepayment speeds, credit risks, etc.).
> Level 3 — Valuations based on significant unobservable inputs (including the Fund's own assumptions and judgment in determining the fair value of investments).
Inputs that are used in determining fair value of an investment may include price information, credit data, volatility statistics, and other factors. These inputs can be either observable or unobservable. The availability of observable inputs can vary between investments, and is affected by various factors such as the type of investment, and the volume and level of activity for that investment or similar investments in the marketplace. The inputs will be considered by the Investment Manager, along with any other relevant factors in the calculation of an investment's fair value. The Fund uses prices and inputs that are current as of the measurement date, which may include periods of market dislocations. During these periods, the availability of prices and inputs may be reduced for many investments. This condition could cause an investment to be reclassified between the various levels within the hierarchy.
Investments falling into the Level 3 category are primarily supported by quoted prices from brokers and dealers participating in the market for those investments. However, these may be classified as Level 3 investments due to lack of market transparency and corroboration to support these quoted prices. Additionally, valuation models may be used as the pricing source for any remaining investments classified as Level 3. These models may rely on one or more significant unobservable inputs and/or significant assumptions by the Investment Manager. Inputs used in valuations may include, but are not limited to, financial statement analysis, capital account balances, discount rates and estimated cash flows, and comparable company data.
The accompanying Notes to Financial Statements are an integral part of this statement.
Annual Report 2013
11
Columbia Small Cap Core Fund
Portfolio of Investments (continued)
August 31, 2013
Fair Value Measurements (continued)
Under the direction of the Fund's Board of Trustees (the Board), the Investment Manager's Valuation Committee (the Committee) is responsible for carrying out the valuation procedures approved by the Board. The Committee consists of voting and non-voting members from various groups within the Investment Manager's organization, including operations and accounting, trading and investments, compliance, risk management and legal.
The Committee meets at least monthly to review and approve valuation matters, which may include a description of specific valuation determinations, data regarding pricing information received from approved pricing vendors and brokers and the results of Board-approved valuation control policies and procedures (the Policies). The Policies address, among other things, instances when market quotations are or are not readily available, including recommendations of third party pricing vendors and a determination of appropriate pricing methodologies; events that require specific valuation determinations and assessment of fair value techniques; securities with a potential for stale pricing, including those that are illiquid, restricted, or in default; and the effectiveness of third-party pricing vendors, including periodic reviews of vendors. The Committee meets more frequently, as needed, to discuss additional valuation matters, which may include the need to review back-testing results, review time-sensitive information or approve related valuation actions. The Committee reports to the Board, with members of the Committee meeting with the Board at each of its regularly scheduled meetings to discuss valuation matters and actions during the period, similar to those described earlier.
For investments categorized as Level 3, the Committee monitors information similar to that described above, which may include: (i) data specific to the issuer or comparable issuers, (ii) general market or specific sector news and (iii) quoted prices and specific or similar security transactions. The Committee considers this data and any changes from prior periods in order to assess the reasonableness of observable and unobservable inputs, any assumptions or internal models used to value those securities and changes in fair value. This data is also used to corroborate, when available, information received from approved pricing vendors and brokers. Various factors impact the frequency of monitoring this information (which may occur as often as daily). However, the Committee may determine that changes to inputs, assumptions and models are not required as a result of the monitoring procedures performed.
The following table is a summary of the inputs used to value the Fund's investments at August 31, 2013:
Description | | Level 1
Quoted Prices in Active
Markets for Identical
Assets ($) | | Level 2
Other Significant
Observable Inputs ($) | | Level 3
Significant
Unobservable Inputs ($) | | Total ($) | |
Equity Securities | |
Common Stocks | |
Consumer Discretionary | | | 130,940,424 | | | | — | | | | — | | | | 130,940,424 | | |
Consumer Staples | | | 13,164,033 | | | | — | | | | — | | | | 13,164,033 | | |
Energy | | | 71,516,426 | | | | — | | | | — | | | | 71,516,426 | | |
Financials | | | 214,598,701 | | | | — | | | | — | | | | 214,598,701 | | |
Health Care | | | 134,451,184 | | | | — | | | | — | | | | 134,451,184 | | |
Industrials | | | 240,126,520 | | | | — | | | | — | | | | 240,126,520 | | |
Information Technology | | | 216,832,387 | | | | — | | | | — | | | | 216,832,387 | | |
Materials | | | 54,967,118 | | | | — | | | | — | | | | 54,967,118 | | |
Telecommunication Services | | | 7,665,979 | | | | — | | | | — | | | | 7,665,979 | | |
Utilities | | | 21,200,020 | | | | — | | | | — | | | | 21,200,020 | | |
Total Equity Securities | | | 1,105,462,792 | | | | — | | | | — | | | | 1,105,462,792 | | |
Mutual Funds | |
Money Market Funds | | | 33,773,250 | | | | — | | | | — | | | | 33,773,250 | | |
Total Mutual Funds | | | 33,773,250 | | | | — | | | | — | | | | 33,773,250 | | |
Total | | | 1,139,236,042 | | | | — | | | | — | | | | 1,139,236,042 | | |
See the Portfolio of Investments for all investment classifications not indicated in the table.
There were no transfers of financial assets between Levels 1 and 2 during the period.
The accompanying Notes to Financial Statements are an integral part of this statement.
Annual Report 2013
12
Columbia Small Cap Core Fund
Statement of Assets and Liabilities
August 31, 2013
Assets | |
Investments, at value | |
Unaffiliated issuers (identified cost $811,797,344) | | $ | 1,073,830,038 | | |
Affiliated issuers (identified cost $60,781,960) | | | 65,406,004 | | |
Total investments (identified cost $872,579,304) | | | 1,139,236,042 | | |
Receivable for: | |
Investments sold | | | 81,434 | | |
Capital shares sold | | | 813,818 | | |
Dividends | | | 656,462 | | |
Expense reimbursement due from Investment Manager | | | 106 | | |
Prepaid expenses | | | 14,023 | | |
Trustees' deferred compensation plan | | | 72,719 | | |
Total assets | | | 1,140,874,604 | | |
Liabilities | |
Payable for: | |
Investments purchased | | | 483,037 | | |
Capital shares purchased | | | 4,602,704 | | |
Investment management fees | | | 24,043 | | |
Distribution and/or service fees | | | 4,689 | | |
Transfer agent fees | | | 300,323 | | |
Administration fees | | | 2,425 | | |
Compensation of board members | | | 1,184 | | |
Chief compliance officer expenses | | | 223 | | |
Other expenses | | | 74,508 | | |
Trustees' deferred compensation plan | | | 72,719 | | |
Total liabilities | | | 5,565,855 | | |
Net assets applicable to outstanding capital stock | | $ | 1,135,308,749 | | |
Represented by | |
Paid-in capital | | $ | 800,033,125 | | |
Excess of distributions over net investment income | | | (3,300,511 | ) | |
Accumulated net realized gain | | | 71,919,397 | | |
Unrealized appreciation (depreciation) on: | |
Investments — unaffiliated issuers | | | 262,032,694 | | |
Investments — affiliated issuers | | | 4,624,044 | | |
Total — representing net assets applicable to outstanding capital stock | | $ | 1,135,308,749 | | |
The accompanying Notes to Financial Statements are an integral part of this statement.
Annual Report 2013
13
Columbia Small Cap Core Fund
Statement of Assets and Liabilities (continued)
August 31, 2013
Class A | |
Net assets | | $ | 399,231,536 | | |
Shares outstanding | | | 21,499,144 | | |
Net asset value per share | | $ | 18.57 | | |
Maximum offering price per share(a) | | $ | 19.70 | | |
Class B | |
Net assets | | $ | 878,494 | | |
Shares outstanding | | | 54,448 | | |
Net asset value per share | | $ | 16.13 | | |
Class C | |
Net assets | | $ | 29,768,837 | | |
Shares outstanding | | | 1,842,783 | | |
Net asset value per share | | $ | 16.15 | | |
Class I | |
Net assets | | $ | 59,097,577 | | |
Shares outstanding | | | 3,064,582 | | |
Net asset value per share | | $ | 19.28 | | |
Class R4 | |
Net assets | | $ | 902,601 | | |
Shares outstanding | | | 46,592 | | |
Net asset value per share | | $ | 19.37 | | |
Class R5 | |
Net assets | | $ | 16,704,332 | | |
Shares outstanding | | | 861,820 | | |
Net asset value per share | | $ | 19.38 | | |
Class T | |
Net assets | | $ | 76,010,815 | | |
Shares outstanding | | | 4,173,984 | | |
Net asset value per share | | $ | 18.21 | | |
Maximum offering price per share(a) | | $ | 19.32 | | |
Class W | |
Net assets | | $ | 60,353,060 | | |
Shares outstanding | | | 3,250,052 | | |
Net asset value per share | | $ | 18.57 | | |
Class Y | |
Net assets | | $ | 11,300,551 | | |
Shares outstanding | | | 580,920 | | |
Net asset value per share | | $ | 19.45 | | |
Class Z | |
Net assets | | $ | 481,060,946 | | |
Shares outstanding | | | 25,035,878 | | |
Net asset value per share | | $ | 19.21 | | |
(a) The maximum offering price per share is calculated by dividing the net asset value per share by 1.0 minus the maximum sales charge of 5.75%.
The accompanying Notes to Financial Statements are an integral part of this statement.
Annual Report 2013
14
Columbia Small Cap Core Fund
Statement of Operations
Year Ended August 31, 2013
Net investment income | |
Income: | |
Dividends — unaffiliated issuers | | $ | 14,134,943 | | |
Dividends — affiliated issuers | | | 31,735 | | |
Income from securities lending — net | | | 115,397 | | |
Foreign taxes withheld | | | (24,007 | ) | |
Total income | | | 14,258,068 | | |
Expenses: | |
Investment management fees | | | 7,942,625 | | |
Distribution and/or service fees | |
Class A | | | 810,693 | | |
Class B | | | 11,622 | | |
Class C | | | 276,636 | | |
Class T | | | 216,169 | | |
Class W | | | 169,177 | | |
Transfer agent fees | |
Class A | | | 749,636 | | |
Class B | | | 2,662 | | |
Class C | | | 63,631 | | |
Class R4(a) | | | 472 | | |
Class R5(a) | | | 1,378 | | |
Class T | | | 165,703 | | |
Class W | | | 155,785 | | |
Class Z | | | 1,113,657 | | |
Administration fees | | | 801,561 | | |
Compensation of board members | | | 40,779 | | |
Custodian fees | | | 15,532 | | |
Printing and postage fees | | | 165,622 | | |
Registration fees | | | 163,806 | | |
Professional fees | | | 51,269 | | |
Line of credit interest expense | | | 591 | | |
Chief compliance officer expenses | | | 797 | | |
Other | | | 32,201 | | |
Total expenses | | | 12,952,004 | | |
Fees waived or expenses reimbursed by Investment Manager and its affiliates | | | (23,843 | ) | |
Expense reductions | | | (3,120 | ) | |
Total net expenses | | | 12,925,041 | | |
Net investment income | | | 1,333,027 | | |
Realized and unrealized gain (loss) — net | |
Net realized gain (loss) on: | |
Investments — unaffiliated issuers | | | 70,986,642 | | |
Investments — affiliated issuers | | | 2,382,365 | | |
Net realized gain | | | 73,369,007 | | |
Net change in unrealized appreciation (depreciation) on: | |
Investments — unaffiliated issuers | | | 164,588,396 | | |
Investments — affiliated issuers | | | 12,956,809 | | |
Net change in unrealized appreciation (depreciation) | | | 177,545,205 | | |
Net realized and unrealized gain | | | 250,914,212 | | |
Net increase in net assets resulting from operations | | $ | 252,247,239 | | |
(a) Class R4 and Class R5 shares are for the period from November 8, 2012 (commencement of operations) to August 31, 2013.
The accompanying Notes to Financial Statements are an integral part of this statement.
Annual Report 2013
15
Columbia Small Cap Core Fund
Statement of Changes in Net Assets
| | | Year Ended
August 31,
2013(a) | | Year Ended
August 31,
2012(b) | | Year Ended
September 30,
2011 | |
Operations | |
Net investment income (loss) | | $ | 1,333,027 | | | $ | (1,208,357 | ) | | $ | (3,209,941 | ) | |
Net realized gain | | | 73,369,007 | | | | 28,924,636 | | | | 46,014,237 | | |
Net change in unrealized appreciation (depreciation) | | | 177,545,205 | | | | 105,521,122 | | | | (59,114,142 | ) | |
Net increase (decrease) in net assets resulting from operations | | | 252,247,239 | | | | 133,237,401 | | | | (16,309,846 | ) | |
Distributions to shareholders | |
Net investment income | |
Class A | | | (922,111 | ) | | | — | | | | — | | |
Class I | | | (480,100 | ) | | | — | | | | — | | |
Class R4 | | | (17 | ) | | | — | | | | — | | |
Class R5 | | | (19 | ) | | | — | | | | — | | |
Class T | | | (240,199 | ) | | | — | | | | — | | |
Class W | | | (260,307 | ) | | | — | | | | — | | |
Class Y | | | (21 | ) | | | — | | | | — | | |
Class Z | | | (2,852,618 | ) | | | — | | | | — | | |
Net realized gains | |
Class A | | | (7,269,649 | ) | | | (7,224,924 | ) | | | — | | |
Class B | | | (46,627 | ) | | | (369,209 | ) | | | — | | |
Class C | | | (927,388 | ) | | | (1,099,438 | ) | | | — | | |
Class I | | | (1,752,182 | ) | | | (149,258 | ) | | | — | | |
Class R4 | | | (79 | ) | | | — | | | | — | | |
Class R5 | | | (79 | ) | | | — | | | | — | | |
Class T | | | (2,180,079 | ) | | | (2,773,408 | ) | | | — | | |
Class W | | | (2,039,997 | ) | | | (1,481,992 | ) | | | — | | |
Class Y | | | (79 | ) | | | — | | | | — | | |
Class Z | | | (14,017,377 | ) | | | (15,795,495 | ) | | | — | | |
Total distributions to shareholders | | | (32,988,928 | ) | | | (28,893,724 | ) | | | — | | |
Increase (decrease) in net assets from capital stock activity | | | 34,712,305 | | | | 103,817,259 | | | | 47,256,524 | | |
Proceeds from regulatory settlements (Note 6) | | | — | | | | — | | | | 12,545 | | |
Total increase in net assets | | | 253,970,616 | | | | 208,160,936 | | | | 30,959,223 | | |
Net assets at beginning of year | | | 881,338,133 | | | | 673,177,197 | | | | 642,217,974 | | |
Net assets at end of year | | $ | 1,135,308,749 | | | $ | 881,338,133 | | | $ | 673,177,197 | | |
Excess of distributions over net investment income | | $ | (3,300,511 | ) | | $ | (92,757 | ) | | $ | (528,456 | ) | |
(a) Class R4, Class R5 and Class Y shares are for the period from November 8, 2012 (commencement of operations) to August 31, 2013.
(b) For the period from October 1, 2011 to August 31, 2012. During the period, the Fund's fiscal year end was changed from September 30 to August 31.
The accompanying Notes to Financial Statements are an integral part of this statement.
Annual Report 2013
16
Columbia Small Cap Core Fund
Statement of Changes in Net Assets (continued)
| | | Year Ended August 31,
2013(a) | | Year Ended August 31,
2012(b) | | Year Ended September 30,
2011 | |
| | | Shares | | Dollars ($) | | Shares | | Dollars ($) | | Shares | | Dollars ($) | |
Capital stock activity | |
Class A shares | |
Subscriptions(c) | | | 11,885,894 | | | | 199,398,657 | | | | 5,937,667 | | | | 88,929,326 | | | | 7,054,588 | | | | 109,013,946 | | |
Distributions reinvested | | | 439,975 | | | | 6,634,538 | | | | 405,420 | | | | 5,890,749 | | | | — | | | | — | | |
Redemptions | | | (5,994,433 | ) | | | (102,003,743 | ) | | | (3,698,982 | ) | | | (55,244,044 | ) | | | (3,643,742 | ) | | | (56,019,850 | ) | |
Net increase | | | 6,331,436 | | | | 104,029,452 | | | | 2,644,105 | | | | 39,576,031 | | | | 3,410,846 | | | | 52,994,096 | | |
Class B shares | |
Subscriptions | | | 5,599 | | | | 79,298 | | | | 13,417 | | | | 179,314 | | | | 32,709 | | | | 438,251 | | |
Distributions reinvested | | | 2,655 | | | | 34,724 | | | | 22,978 | | | | 294,119 | | | | — | | | | — | | |
Redemptions(c) | | | (67,319 | ) | | | (973,498 | ) | | | (726,478 | ) | | | (9,513,750 | ) | | | (529,687 | ) | | | (7,192,883 | ) | |
Net decrease | | | (59,065 | ) | | | (859,476 | ) | | | (690,083 | ) | | | (9,040,317 | ) | | | (496,978 | ) | | | (6,754,632 | ) | |
Class C shares | |
Subscriptions | | | 290,435 | | | | 4,280,448 | | | | 422,146 | | | | 5,570,305 | | | | 730,825 | | | | 10,197,519 | | |
Distributions reinvested | | | 56,364 | | | | 738,372 | | | | 67,210 | | | | 860,955 | | | | — | | | | — | | |
Redemptions | | | (479,308 | ) | | | (6,916,490 | ) | | | (470,688 | ) | | | (6,243,056 | ) | | | (421,882 | ) | | | (5,744,942 | ) | |
Net increase (decrease) | | | (132,509 | ) | | | (1,897,670 | ) | | | 18,668 | | | | 188,204 | | | | 308,943 | | | | 4,452,577 | | |
Class I shares | |
Subscriptions | | | 164,137 | | | | 2,772,710 | | | | 3,857,856 | | | | 63,803,555 | | | | 310,294 | | | | 4,818,092 | | |
Distributions reinvested | | | 143,132 | | | | 2,232,165 | | | | 9,930 | | | | 149,152 | | | | — | | | | — | | |
Redemptions | | | (784,042 | ) | | | (14,596,151 | ) | | | (607,712 | ) | | | (9,376,977 | ) | | | (29,200 | ) | | | (462,831 | ) | |
Net increase (decrease) | | | (476,773 | ) | | | (9,591,276 | ) | | | 3,260,074 | | | | 54,575,730 | | | | 281,094 | | | | 4,355,261 | | |
Class R4 shares | |
Subscriptions | | | 47,937 | | | | 902,511 | | | | — | | | | — | | | | — | | | | — | | |
Redemptions | | | (1,345 | ) | | | (26,115 | ) | | | — | | | | — | | | | — | | | | — | | |
Net increase | | | 46,592 | | | | 876,396 | | | | — | | | | — | | | | — | | | | — | | |
Class R5 shares | |
Subscriptions | | | 892,298 | | | | 16,955,352 | | | | — | | | | — | | | | — | | | | — | | |
Redemptions | | | (30,478 | ) | | | (603,405 | ) | | | — | | | | — | | | | — | | | | — | | |
Net increase | | | 861,820 | | | | 16,351,947 | | | | — | | | | — | | | | — | | | | — | | |
Class T shares | |
Subscriptions | | | 57,012 | | | | 871,376 | | | | 72,075 | | | | 1,040,646 | | | | 42,096 | | | | 642,556 | | |
Distributions reinvested | | | 113,746 | | | | 1,681,987 | | | | 131,931 | | | | 1,881,336 | | | | — | | | | — | | |
Redemptions | | | (605,515 | ) | | | (9,833,690 | ) | | | (583,657 | ) | | | (8,570,096 | ) | | | (698,375 | ) | | | (10,535,505 | ) | |
Net decrease | | | (434,757 | ) | | | (7,280,327 | ) | | | (379,651 | ) | | | (5,648,114 | ) | | | (656,279 | ) | | | (9,892,949 | ) | |
Class W shares | |
Subscriptions | | | 1,145,055 | | | | 19,079,818 | | | | 2,043,493 | | | | 31,632,033 | | | | 5,725,192 | | | | 83,442,893 | | |
Distributions reinvested | | | 152,536 | | | | 2,300,198 | | | | 101,988 | | | | 1,481,883 | | | | — | | | | — | | |
Redemptions | | | (2,041,103 | ) | | | (36,129,782 | ) | | | (1,360,326 | ) | | | (20,473,264 | ) | | | (2,516,975 | ) | | | (39,253,421 | ) | |
Net increase (decrease) | | | (743,512 | ) | | | (14,749,766 | ) | | | 785,155 | | | | 12,640,652 | | | | 3,208,217 | | | | 44,189,472 | | |
The accompanying Notes to Financial Statements are an integral part of this statement.
Annual Report 2013
17
Columbia Small Cap Core Fund
Statement of Changes in Net Assets (continued)
| | | Year Ended August 31,
2013(a) | | Year Ended August 31,
2012(b) | | Year Ended September 30,
2011 | |
| | | Shares | | Dollars ($) | | Shares | | Dollars ($) | | Shares | | Dollars ($) | |
Capital stock activity (continued) | |
Class Y shares | |
Subscriptions | | | 582,612 | | | | 11,485,836 | | | | — | | | | — | | | | — | | | | — | | |
Redemptions | | | (1,692 | ) | | | (30,369 | ) | | | — | | | | — | | | | — | | | | — | | |
Net increase | | | 580,920 | | | | 11,455,467 | | | | — | | | | — | | | | — | | | | — | | |
Class Z shares | |
Subscriptions | | | 6,257,873 | | | | 105,704,041 | | | | 7,537,453 | | | | 117,291,610 | | | | 9,636,904 | | | | 152,660,806 | | |
Distributions reinvested | | | 566,101 | | | | 8,813,173 | | | | 467,470 | | | | 7,007,375 | | | | — | | | | — | | |
Redemptions | | | (10,202,375 | ) | | | (178,139,656 | ) | | | (7,269,428 | ) | | | (112,773,912 | ) | | | (12,021,499 | ) | | | (194,748,107 | ) | |
Net increase (decrease) | | | (3,378,401 | ) | | | (63,622,442 | ) | | | 735,495 | | | | 11,525,073 | | | | (2,384,595 | ) | | | (42,087,301 | ) | |
Total net increase | | | 2,595,751 | | | | 34,712,305 | | | | 6,373,763 | | | | 103,817,259 | | | | 3,671,248 | | | | 47,256,524 | | |
(a) Class R4, Class R5 and Class Y shares are for the period from November 8, 2012 (commencement of operations) to August 31, 2013.
(b) For the period from October 1, 2011 to August 31, 2012. During the period, the Fund's fiscal year end was changed from September 30 to August 31.
(c) Includes conversions of Class B shares to Class A shares, if any.
The accompanying Notes to Financial Statements are an integral part of this statement.
Annual Report 2013
18
Columbia Small Cap Core Fund
The following tables are intended to help you understand the Fund's financial performance. Certain information reflects financial results for a single share of a class held for the periods shown. Per share net investment income (loss) amounts are calculated based on average shares outstanding during the period. Total return assumes reinvestment of all dividends and distributions, if any. Total return does not reflect payment of sales charges, if any, and is not annualized for periods of less than one year.
| | | Year Ended August 31, | | Year Ended September 30, | |
Class A | | 2013 | | 2012(a) | | 2011 | | 2010 | | 2009 | | 2008 | |
Per share data | |
Net asset value, beginning of period | | $ | 15.05 | | | $ | 12.98 | | | $ | 13.33 | | | $ | 11.58 | | | $ | 14.14 | | | $ | 20.01 | | |
Income from investment operations: | |
Net investment income (loss) | | | (0.01 | ) | | | (0.04 | ) | | | (0.07 | ) | | | (0.05 | ) | | | (0.02 | ) | | | (0.09 | ) | |
Net realized and unrealized gain (loss) | | | 4.08 | | | | 2.68 | | | | (0.28 | ) | | | 1.80 | | | | (1.39 | ) | | | (2.11 | ) | |
Total from investment operations | | | 4.07 | | | | 2.64 | | | | (0.35 | ) | | | 1.75 | | | | (1.41 | ) | | | (2.20 | ) | |
Less distributions to shareholders: | |
Net investment income | | | (0.06 | ) | | | — | | | | — | | | | — | | | | — | | | | (0.03 | ) | |
Net realized gains | | | (0.49 | ) | | | (0.57 | ) | | | — | | | | — | | | | (1.15 | ) | | | (3.64 | ) | |
Total distributions to shareholders | | | (0.55 | ) | | | (0.57 | ) | | | — | | | | — | | | | (1.15 | ) | | | (3.67 | ) | |
Proceeds from regulatory settlements | | | — | | | | — | | | | 0.00 | (b) | | | — | | | | 0.00 | (b) | | | — | | |
Net asset value, end of period | | $ | 18.57 | | | $ | 15.05 | | | $ | 12.98 | | | $ | 13.33 | | | $ | 11.58 | | | $ | 14.14 | | |
Total return | | | 27.93 | % | | | 20.46 | % | | | (2.63 | %) | | | 15.11 | % | | | (7.41 | %) | | | (12.86 | %) | |
Ratios to average net assets(c) | |
Total gross expenses | | | 1.37 | %(d) | | | 1.37 | %(e) | | | 1.32 | % | | | 1.30 | % | | | 1.33 | % | | | 1.25 | % | |
Total net expenses(f) | | | 1.36 | %(d)(g) | | | 1.36 | %(e)(g) | | | 1.29 | %(g) | | | 1.30 | %(g) | | | 1.33 | %(g) | | | 1.25 | %(g) | |
Net investment income (loss) | | | (0.07 | %) | | | (0.28 | %)(e) | | | (0.48 | %) | | | (0.38 | %) | | | (0.28 | %) | | | (0.56 | %) | |
Supplemental data | |
Net assets, end of period (in thousands) | | $ | 399,232 | | | $ | 228,303 | | | $ | 162,502 | | | $ | 121,456 | | | $ | 81,474 | | | $ | 115,246 | | |
Portfolio turnover | | | 34 | % | | | 26 | % | | | 33 | % | | | 26 | % | | | 11 | % | | | 25 | % | |
Notes to Financial Highlights
(a) For the period from October 1, 2011 to August 31, 2012. During the period, the Fund's fiscal year end was changed from September 30 to August 31.
(b) Rounds to zero.
(c) In addition to the fees and expenses which the Fund bears directly, the Fund indirectly bears a pro rata share of the fees and expenses of the acquired funds in which it invests. Such indirect expenses are not included in the reported expense ratios.
(d) Ratios include line of credit interest expense which rounds to less than 0.01%.
(e) Annualized.
(f) Total net expenses include the impact of certain waivers/reimbursements made by the Investment Manager and certain of its affiliates, if applicable.
(g) The benefits derived from expense reductions had an impact of less than 0.01%.
The accompanying Notes to Financial Statements are an integral part of this statement.
Annual Report 2013
19
Columbia Small Cap Core Fund
Financial Highlights (continued)
| | | Year Ended August 31, | | Year Ended September 30, | |
Class B | | 2013 | | 2012(a) | | 2011 | | 2010 | | 2009 | | 2008 | |
Per share data | |
Net asset value, beginning of period | | $ | 13.19 | | | $ | 11.50 | | | $ | 11.90 | | | $ | 10.42 | | | $ | 12.97 | | | $ | 18.75 | | |
Income from investment operations: | |
Net investment loss | | | (0.09 | ) | | | (0.12 | ) | | | (0.17 | ) | | | (0.12 | ) | | | (0.09 | ) | | | (0.19 | ) | |
Net realized and unrealized gain (loss) | | | 3.52 | | | | 2.38 | | | | (0.23 | ) | | | 1.60 | | | | (1.31 | ) | | | (1.95 | ) | |
Total from investment operations | | | 3.43 | | | | 2.26 | | | | (0.40 | ) | | | 1.48 | | | | (1.40 | ) | | | (2.14 | ) | |
Less distributions to shareholders: | |
Net realized gains | | | (0.49 | ) | | | (0.57 | ) | | | — | | | | — | | | | (1.15 | ) | | | (3.64 | ) | |
Total distributions to shareholders | | | (0.49 | ) | | | (0.57 | ) | | | — | | | | — | | | | (1.15 | ) | | | (3.64 | ) | |
Proceeds from regulatory settlements | | | — | | | | — | | | | 0.00 | (b) | | | — | | | | 0.00 | (b) | | | — | | |
Net asset value, end of period | | $ | 16.13 | | | $ | 13.19 | | | $ | 11.50 | | | $ | 11.90 | | | $ | 10.42 | | | $ | 12.97 | | |
Total return | | | 26.90 | % | | | 19.77 | % | | | (3.36 | %) | | | 14.20 | % | | | (8.08 | %) | | | (13.53 | %) | |
Ratios to average net assets(c) | |
Total gross expenses | | | 2.11 | %(d) | | | 2.20 | %(e) | | | 2.08 | % | | | 2.05 | % | | | 2.08 | % | | | 2.00 | % | |
Total net expenses(f) | | | 2.11 | %(d)(g) | | | 2.11 | %(e)(g) | | | 2.04 | %(g) | | | 2.05 | %(g) | | | 2.08 | %(g) | | | 2.00 | %(g) | |
Net investment loss | | | (0.61 | %) | | | (1.00 | %)(e) | | | (1.26 | %) | | | (1.11 | %) | | | (1.03 | %) | | | (1.31 | %) | |
Supplemental data | |
Net assets, end of period (in thousands) | | $ | 878 | | | $ | 1,497 | | | $ | 9,244 | | | $ | 15,478 | | | $ | 17,317 | | | $ | 23,085 | | |
Portfolio turnover | | | 34 | % | | | 26 | % | | | 33 | % | | | 26 | % | | | 11 | % | | | 25 | % | |
Notes to Financial Highlights
(a) For the period from October 1, 2011 to August 31, 2012. During the period, the Fund's fiscal year end was changed from September 30 to August 31.
(b) Rounds to zero.
(c) In addition to the fees and expenses which the Fund bears directly, the Fund indirectly bears a pro rata share of the fees and expenses of the acquired funds in which it invests. Such indirect expenses are not included in the reported expense ratios.
(d) Ratios include line of credit interest expense which rounds to less than 0.01%.
(e) Annualized.
(f) Total net expenses include the impact of certain waivers/reimbursements made by the Investment Manager and certain of its affiliates, if applicable.
(g) The benefits derived from expense reductions had an impact of less than 0.01%.
The accompanying Notes to Financial Statements are an integral part of this statement.
Annual Report 2013
20
Columbia Small Cap Core Fund
Financial Highlights (continued)
| | | Year Ended August 31, | | Year Ended September 30, | |
Class C | | 2013 | | 2012(a) | | 2011 | | 2010 | | 2009 | | 2008 | |
Per share data | |
Net asset value, beginning of period | | $ | 13.20 | | | $ | 11.52 | | | $ | 11.92 | | | $ | 10.43 | | | $ | 12.99 | | | $ | 18.76 | | |
Income from investment operations: | |
Net investment loss | | | (0.10 | ) | | | (0.12 | ) | | | (0.17 | ) | | | (0.12 | ) | | | (0.09 | ) | | | (0.19 | ) | |
Net realized and unrealized gain (loss) | | | 3.54 | | | | 2.37 | | | | (0.23 | ) | | | 1.61 | | | | (1.32 | ) | | | (1.94 | ) | |
Total from investment operations | | | 3.44 | | | | 2.25 | | | | (0.40 | ) | | | 1.49 | | | | (1.41 | ) | | | (2.13 | ) | |
Less distributions to shareholders: | |
Net realized gains | | | (0.49 | ) | | | (0.57 | ) | | | — | | | | — | | | | (1.15 | ) | | | (3.64 | ) | |
Total distributions to shareholders | | | (0.49 | ) | | | (0.57 | ) | | | — | | | | — | | | | (1.15 | ) | | | (3.64 | ) | |
Proceeds from regulatory settlements | | | — | | | | — | | | | 0.00 | (b) | | | — | | | | 0.00 | (b) | | | — | | |
Net asset value, end of period | | $ | 16.15 | | | $ | 13.20 | | | $ | 11.52 | | | $ | 11.92 | | | $ | 10.43 | | | $ | 12.99 | | |
Total return | | | 26.95 | % | | | 19.65 | % | | | (3.36 | %) | | | 14.29 | % | | | (8.15 | %) | | | (13.46 | %) | |
Ratios to average net assets(c) | |
Total gross expenses | | | 2.11 | %(d) | | | 2.12 | %(e) | | | 2.07 | % | | | 2.05 | % | | | 2.08 | % | | | 2.00 | % | |
Total net expenses(f) | | | 2.11 | %(d)(g) | | | 2.11 | %(e)(g) | | | 2.04 | %(g) | | | 2.05 | %(g) | | | 2.08 | %(g) | | | 2.00 | %(g) | |
Net investment loss | | | (0.71 | %) | | | (1.03 | %)(e) | | | (1.23 | %) | | | (1.12 | %) | | | (1.03 | %) | | | (1.29 | %) | |
Supplemental data | |
Net assets, end of period (in thousands) | | $ | 29,769 | | | $ | 26,077 | | | $ | 22,535 | | | $ | 19,635 | | | $ | 18,461 | | | $ | 24,756 | | |
Portfolio turnover | | | 34 | % | | | 26 | % | | | 33 | % | | | 26 | % | | | 11 | % | | | 25 | % | |
Notes to Financial Highlights
(a) For the period from October 1, 2011 to August 31, 2012. During the period, the Fund's fiscal year end was changed from September 30 to August 31.
(b) Rounds to zero.
(c) In addition to the fees and expenses which the Fund bears directly, the Fund indirectly bears a pro rata share of the fees and expenses of the acquired funds in which it invests. Such indirect expenses are not included in the reported expense ratios.
(d) Ratios include line of credit interest expense which rounds to less than 0.01%.
(e) Annualized.
(f) Total net expenses include the impact of certain waivers/reimbursements made by the Investment Manager and certain of its affiliates, if applicable.
(g) The benefits derived from expense reductions had an impact of less than 0.01%.
The accompanying Notes to Financial Statements are an integral part of this statement.
Annual Report 2013
21
Columbia Small Cap Core Fund
Financial Highlights (continued)
| | | Year Ended August 31, | | Year Ended September 30, | |
Class I | | 2013 | | 2012(a) | | 2011 | | 2010(b) | |
Per share data | |
Net asset value, beginning of period | | $ | 15.61 | | | $ | 13.38 | | | $ | 13.69 | | | $ | 13.37 | | |
Income from investment operations: | |
Net investment income (loss) | | | 0.09 | | | | 0.03 | | | | (0.01 | ) | | | 0.00 | (c) | |
Net realized and unrealized gain (loss) | | | 4.21 | | | | 2.77 | | | | (0.30 | ) | | | 0.32 | | |
Total from investment operations | | | 4.30 | | | | 2.80 | | | | (0.31 | ) | | | 0.32 | | |
Less distributions to shareholders: | |
Net investment income | | | (0.14 | ) | | | — | | | | — | | | | — | | |
Net realized gains | | | (0.49 | ) | | | (0.57 | ) | | | — | | | | — | | |
Total distributions to shareholders | | | (0.63 | ) | | | (0.57 | ) | | | — | | | | — | | |
Proceeds from regulatory settlements | | | — | | | | — | | | | 0.00 | (c) | | | — | | |
Net asset value, end of period | | $ | 19.28 | | | $ | 15.61 | | | $ | 13.38 | | | $ | 13.69 | | |
Total return | | | 28.49 | % | | | 21.06 | % | | | (2.26 | %) | | | 2.39 | % | |
Ratios to average net assets(d) | |
Total gross expenses | | | 0.88 | %(e) | | | 0.91 | %(f) | | | 0.88 | % | | | 0.90 | %(f) | |
Total net expenses(g) | | | 0.88 | %(e) | | | 0.91 | %(f) | | | 0.88 | %(h) | | | 0.90 | %(f)(h) | |
Net investment income (loss) | | | 0.52 | % | | | 0.19 | %(f) | | | (0.04 | %) | | | 2.13 | %(f) | |
Supplemental data | |
Net assets, end of period (in thousands) | | $ | 59,098 | | | $ | 55,276 | | | $ | 3,765 | | | $ | 3 | | |
Portfolio turnover | | | 34 | % | | | 26 | % | | | 33 | % | | | 26 | % | |
Notes to Financial Highlights
(a) For the period from October 1, 2011 to August 31, 2012. During the period, the Fund's fiscal year end was changed from September 30 to August 31.
(b) For the period from September 27, 2010 (commencement of operations) to September 30, 2010.
(c) Rounds to zero.
(d) In addition to the fees and expenses which the Fund bears directly, the Fund indirectly bears a pro rata share of the fees and expenses of the acquired funds in which it invests. Such indirect expenses are not included in the reported expense ratios.
(e) Ratios include line of credit interest expense which rounds to less than 0.01%.
(f) Annualized.
(g) Total net expenses include the impact of certain waivers/reimbursements made by the Investment Manager and certain of its affiliates, if applicable.
(h) The benefits derived from expense reductions had an impact of less than 0.01%.
The accompanying Notes to Financial Statements are an integral part of this statement.
Annual Report 2013
22
Columbia Small Cap Core Fund
Financial Highlights (continued)
Class R4 | | Year Ended
August 31,
2013(a) | |
Per share data | |
Net asset value, beginning of period | | $ | 15.57 | | |
Income from investment operations: | |
Net investment loss | | | (0.05 | ) | |
Net realized and unrealized gain | | | 4.45 | | |
Total from investment operations | | | 4.40 | | |
Less distributions to shareholders: | |
Net investment income | | | (0.11 | ) | |
Net realized gains | | | (0.49 | ) | |
Total distributions to shareholders | | | (0.60 | ) | |
Net asset value, end of period | | $ | 19.37 | | |
Total return | | | 29.18 | % | |
Ratios to average net assets(b) | |
Total gross expenses | | | 1.12 | %(c)(d) | |
Total net expenses(e) | | | 1.12 | %(c)(d)(f) | |
Net investment loss | | | (0.31 | %)(d) | |
Supplemental data | |
Net assets, end of period (in thousands) | | $ | 903 | | |
Portfolio turnover | | | 34 | % | |
Notes to Financial Highlights
(a) For the period from November 8, 2012 (commencement of operations) to August 31, 2013.
(b) In addition to the fees and expenses which the Fund bears directly, the Fund indirectly bears a pro rata share of the fees and expenses of the acquired funds in which it invests. Such indirect expenses are not included in the reported expense ratios.
(c) Ratios include line of credit interest expense which rounds to less than 0.01%.
(d) Annualized.
(e) Total net expenses include the impact of certain waivers/reimbursements made by the Investment Manager and certain of its affiliates, if applicable.
(f) The benefits derived from expense reductions had an impact of less than 0.01%.
The accompanying Notes to Financial Statements are an integral part of this statement.
Annual Report 2013
23
Columbia Small Cap Core Fund
Financial Highlights (continued)
Class R5 | | Year Ended
August 31,
2013(a) | |
Per share data | |
Net asset value, beginning of period | | $ | 15.57 | | |
Income from investment operations: | |
Net investment loss | | | (0.05 | ) | |
Net realized and unrealized gain | | | 4.47 | | |
Total from investment operations | | | 4.42 | | |
Less distributions to shareholders: | |
Net investment income | | | (0.12 | ) | |
Net realized gains | | | (0.49 | ) | |
Total distributions to shareholders | | | (0.61 | ) | |
Net asset value, end of period | | $ | 19.38 | | |
Total return | | | 29.36 | % | |
Ratios to average net assets(b) | |
Total gross expenses | | | 0.94 | %(c)(d) | |
Total net expenses(e) | | | 0.94 | %(c)(d) | |
Net investment loss | | | (0.32 | %)(d) | |
Supplemental data | |
Net assets, end of period (in thousands) | | $ | 16,704 | | |
Portfolio turnover | | | 34 | % | |
Notes to Financial Highlights
(a) For the period from November 8, 2012 (commencement of operations) to August 31, 2013.
(b) In addition to the fees and expenses which the Fund bears directly, the Fund indirectly bears a pro rata share of the fees and expenses of the acquired funds in which it invests. Such indirect expenses are not included in the reported expense ratios.
(c) Ratios include line of credit interest expense which rounds to less than 0.01%.
(d) Annualized.
(e) Total net expenses include the impact of certain waivers/reimbursements made by the Investment Manager and certain of its affiliates, if applicable.
The accompanying Notes to Financial Statements are an integral part of this statement.
Annual Report 2013
24
Columbia Small Cap Core Fund
Financial Highlights (continued)
| | | Year Ended August 31, | | Year Ended September 30, | |
Class T | | 2013 | | 2012(a) | | 2011 | | 2010 | | 2009 | | 2008 | |
Per share data | |
Net asset value, beginning of period | | $ | 14.77 | | | $ | 12.75 | | | $ | 13.10 | | | $ | 11.39 | | | $ | 13.94 | | | $ | 19.78 | | |
Income from investment operations: | |
Net investment income (loss) | | | (0.00 | )(b) | | | (0.04 | ) | | | (0.08 | ) | | | (0.05 | ) | | | (0.03 | ) | | | (0.10 | ) | |
Net realized and unrealized gain (loss) | | | 3.99 | | | | 2.63 | | | | (0.27 | ) | | | 1.76 | | | | (1.37 | ) | | | (2.08 | ) | |
Total from investment operations | | | 3.99 | | | | 2.59 | | | | (0.35 | ) | | | 1.71 | | | | (1.40 | ) | | | (2.18 | ) | |
Less distributions to shareholders: | |
Net investment income | | | (0.06 | ) | | | — | | | | — | | | | — | | | | — | | | | (0.02 | ) | |
Net realized gains | | | (0.49 | ) | | | (0.57 | ) | | | — | | | | — | | | | (1.15 | ) | | | (3.64 | ) | |
Total distributions to shareholders | | | (0.55 | ) | | | (0.57 | ) | | | — | | | | — | | | | (1.15 | ) | | | (3.66 | ) | |
Proceeds from regulatory settlements | | | — | | | | — | | | | 0.00 | (b) | | | — | | | | 0.00 | (b) | | | — | | |
Net asset value, end of period | | $ | 18.21 | | | $ | 14.77 | | | $ | 12.75 | | | $ | 13.10 | | | $ | 11.39 | | | $ | 13.94 | | |
Total return | | | 27.86 | % | | | 20.44 | % | | | (2.67 | %) | | | 15.01 | % | | | (7.45 | %) | | | (12.90 | %) | |
Ratios to average net assets(c) | |
Total gross expenses | | | 1.41 | %(d) | | | 1.42 | %(e) | | | 1.38 | % | | | 1.35 | % | | | 1.38 | % | | | 1.30 | % | |
Total net expenses(f) | | | 1.41 | %(d)(g) | | | 1.41 | %(e)(g) | | | 1.35 | %(g) | | | 1.35 | %(g) | | | 1.38 | %(g) | | | 1.30 | %(g) | |
Net investment income | | | (0.01 | %) | | | (0.33 | %)(e) | | | (0.56 | %) | | | (0.42 | %) | | | (0.34 | %) | | | (0.63 | %) | |
Supplemental data | |
Net assets, end of period (in thousands) | | $ | 76,011 | | | $ | 68,074 | | | $ | 63,595 | | | $ | 73,960 | | | $ | 74,722 | | | $ | 98,299 | | |
Portfolio turnover | | | 34 | % | | | 26 | % | | | 33 | % | | | 26 | % | | | 11 | % | | | 25 | % | |
Notes to Financial Highlights
(a) For the period from October 1, 2011 to August 31, 2012. During the period, the Fund's fiscal year end was changed from September 30 to August 31.
(b) Rounds to zero.
(c) In addition to the fees and expenses which the Fund bears directly, the Fund indirectly bears a pro rata share of the fees and expenses of the acquired funds in which it invests. Such indirect expenses are not included in the reported expense ratios.
(d) Ratios include line of credit interest expense which rounds to less than 0.01%.
(e) Annualized.
(f) Total net expenses include the impact of certain waivers/reimbursements made by the Investment Manager and certain of its affiliates, if applicable.
(g) The benefits derived from expense reductions had an impact of less than 0.01%.
The accompanying Notes to Financial Statements are an integral part of this statement.
Annual Report 2013
25
Columbia Small Cap Core Fund
Financial Highlights (continued)
| | | Year Ended August 31, | | Year Ended September 30, | |
Class W | | 2013 | | 2012(a) | | 2011 | | 2010(b) | |
Per share data | |
Net asset value, beginning of period | | $ | 15.05 | | | $ | 12.98 | | | $ | 13.32 | | | $ | 13.01 | | |
Income from investment operations: | |
Net investment income (loss) | | | 0.01 | | | | (0.04 | ) | | | (0.07 | ) | | | 0.00 | (c) | |
Net realized and unrealized gain (loss) | | | 4.06 | | | | 2.68 | | | | (0.27 | ) | | | 0.31 | | |
Total from investment operations | | | 4.07 | | | | 2.64 | | | | (0.34 | ) | | | 0.31 | | |
Less distributions to shareholders: | |
Net investment income | | | (0.06 | ) | | | — | | | | — | | | | — | | |
Net realized gains | | | (0.49 | ) | | | (0.57 | ) | | | — | | | | — | | |
Total distributions to shareholders | | | (0.55 | ) | | | (0.57 | ) | | | — | | | | — | | |
Proceeds from regulatory settlements | | | — | | | | — | | | | 0.00 | (c) | | | — | | |
Net asset value, end of period | | $ | 18.57 | | | $ | 15.05 | | | $ | 12.98 | | | $ | 13.32 | | |
Total return | | | 27.93 | % | | | 20.46 | % | | | (2.55 | %) | | | 2.38 | % | |
Ratios to average net assets(d) | |
Total gross expenses | | | 1.36 | %(e) | | | 1.38 | %(f) | | | 1.32 | % | | | 1.34 | %(f) | |
Total net expenses(g) | | | 1.36 | %(e)(h) | | | 1.36 | %(f)(h) | | | 1.29 | %(h) | | | 1.34 | %(f)(h) | |
Net investment income (loss) | | | 0.05 | % | | | (0.27 | %)(f) | | | (0.47 | %) | | | 1.69 | %(f) | |
Supplemental data | |
Net assets, end of period (in thousands) | | $ | 60,353 | | | $ | 60,112 | | | $ | 41,634 | | | $ | 3 | | |
Portfolio turnover | | | 34 | % | | | 26 | % | | | 33 | % | | | 26 | % | |
Notes to Financial Highlights
(a) For the period from October 1, 2011 to August 31, 2012. During the period, the Fund's fiscal year end was changed from September 30 to August 31.
(b) For the period from September 27, 2010 (commencement of operations) to September 30, 2010.
(c) Rounds to zero.
(d) In addition to the fees and expenses which the Fund bears directly, the Fund indirectly bears a pro rata share of the fees and expenses of the acquired funds in which it invests. Such indirect expenses are not included in the reported expense ratios.
(e) Ratios include line of credit interest expense which rounds to less than 0.01%.
(f) Annualized.
(g) Total net expenses include the impact of certain waivers/reimbursements made by the Investment Manager and certain of its affiliates, if applicable.
(h) The benefits derived from expense reductions had an impact of less than 0.01%.
The accompanying Notes to Financial Statements are an integral part of this statement.
Annual Report 2013
26
Columbia Small Cap Core Fund
Financial Highlights (continued)
Class Y | | Year Ended
August 31,
2013(a) | |
Per share data | |
Net asset value, beginning of period | | $ | 15.63 | | |
Income from investment operations: | |
Net investment income | | | 0.02 | | |
Net realized and unrealized gain | | | 4.42 | | |
Total from investment operations | | | 4.44 | | |
Less distributions to shareholders: | |
Net investment income | | | (0.13 | ) | |
Net realized gains | | | (0.49 | ) | |
Total distributions to shareholders | | | (0.62 | ) | |
Net asset value, end of period | | $ | 19.45 | | |
Total return | | | 29.37 | % | |
Ratios to average net assets(b) | |
Total gross expenses | | | 0.88 | %(c)(d) | |
Total net expenses(e) | | | 0.88 | %(c)(d) | |
Net investment income | | | 0.07 | %(d) | |
Supplemental data | |
Net assets, end of period (in thousands) | | $ | 11,301 | | |
Portfolio turnover | | | 34 | % | |
Notes to Financial Highlights
(a) For the period from November 8, 2012 (commencement of operations) to August 31, 2013.
(b) In addition to the fees and expenses which the Fund bears directly, the Fund indirectly bears a pro rata share of the fees and expenses of the acquired funds in which it invests. Such indirect expenses are not included in the reported expense ratios.
(c) Ratios include line of credit interest expense which rounds to less than 0.01%.
(d) Annualized.
(e) Total net expenses include the impact of certain waivers/reimbursements made by the Investment Manager and certain of its affiliates, if applicable.
The accompanying Notes to Financial Statements are an integral part of this statement.
Annual Report 2013
27
Columbia Small Cap Core Fund
Financial Highlights (continued)
| | | Year Ended August 31, | | Year Ended September 30, | |
Class Z | | 2013 | | 2012(a) | | 2011 | | 2010 | | 2009 | | 2008 | |
Per share data | |
Net asset value, beginning of period | | $ | 15.56 | | | $ | 13.36 | | | $ | 13.69 | | | $ | 11.87 | | | $ | 14.42 | | | $ | 20.33 | | |
Income from investment operations: | |
Net investment income (loss) | | | 0.05 | | | | (0.00 | )(b) | | | (0.04 | ) | | | (0.02 | ) | | | (0.00 | )(b) | | | (0.04 | ) | |
Net realized and unrealized gain (loss) | | | 4.19 | | | | 2.77 | | | | (0.29 | ) | | | 1.84 | | | | (1.40 | ) | | | (2.15 | ) | |
Total from investment operations | | | 4.24 | | | | 2.77 | | | | (0.33 | ) | | | 1.82 | | | | (1.40 | ) | | | (2.19 | ) | |
Less distributions to shareholders: | |
Net investment income | | | (0.10 | ) | | | — | | | | — | | | | — | | | | — | | | | (0.08 | ) | |
Net realized gains | | | (0.49 | ) | | | (0.57 | ) | | | — | | | | — | | | | (1.15 | ) | | | (3.64 | ) | |
Total distributions to shareholders | | | (0.59 | ) | | | (0.57 | ) | | | — | | | | — | | | | (1.15 | ) | | | (3.72 | ) | |
Proceeds from regulatory settlements | | | — | | | | — | | | | 0.00 | (b) | | | — | | | | 0.00 | (b) | | | — | | |
Net asset value, end of period | | $ | 19.21 | | | $ | 15.56 | | | $ | 13.36 | | | $ | 13.69 | | | $ | 11.87 | | | $ | 14.42 | | |
Total return | | | 28.17 | % | | | 20.86 | % | | | (2.41 | %) | | | 15.33 | % | | | (7.18 | %) | | | (12.60 | %) | |
Ratios to average net assets(c) | |
Total gross expenses | | | 1.11 | %(d) | | | 1.12 | %(e) | | | 1.07 | % | | | 1.05 | % | | | 1.08 | % | | | 1.00 | % | |
Total net expenses(f) | | | 1.11 | %(d)(g) | | | 1.11 | %(e)(g) | | | 1.05 | %(g) | | | 1.05 | %(g) | | | 1.08 | %(g) | | | 1.00 | %(g) | |
Net investment income (loss) | | | 0.30 | % | | | (0.03 | %)(e) | | | (0.26 | %) | | | (0.12 | %) | | | (0.04 | %) | | | (0.27 | %) | |
Supplemental data | |
Net assets, end of period (in thousands) | | $ | 481,061 | | | $ | 442,000 | | | $ | 369,903 | | | $ | 411,684 | | | $ | 353,117 | | | $ | 413,763 | | |
Portfolio turnover | | | 34 | % | | | 26 | % | | | 33 | % | | | 26 | % | | | 11 | % | | | 25 | % | |
Notes to Financial Highlights
(a) For the period from October 1, 2011 to August 31, 2012. During the period, the Fund's fiscal year end was changed from September 30 to August 31.
(b) Rounds to zero.
(c) In addition to the fees and expenses which the Fund bears directly, the Fund indirectly bears a pro rata share of the fees and expenses of the acquired funds in which it invests. Such indirect expenses are not included in the reported expense ratios.
(d) Ratios include line of credit interest expense which rounds to less than 0.01%.
(e) Annualized.
(f) Total net expenses include the impact of certain waivers/reimbursements made by the Investment Manager and certain of its affiliates, if applicable.
(g) The benefits derived from expense reductions had an impact of less than 0.01%.
The accompanying Notes to Financial Statements are an integral part of this statement.
Annual Report 2013
28
Columbia Small Cap Core Fund
Notes to Financial Statements
August 31, 2013
Note 1. Organization
Columbia Small Cap Core Fund (the Fund), a series of Columbia Funds Series Trust I (the Trust), is a diversified fund. The Trust is registered under the Investment Company Act of 1940, as amended (the 1940 Act), as an open-end management investment company organized as a Massachusetts business trust.
Fund Shares
The Trust may issue an unlimited number of shares (without par value). The Fund offers Class A, Class B, Class C, Class I, Class R4, Class R5, Class T, Class W, Class Y and Class Z shares. Although all share classes generally have identical voting, dividend and liquidation rights, each share class votes separately when required by law. Different share classes pay different distribution amounts to the extent the expenses of such share classes differ, and distributions in liquidation will be proportional to the net asset value of each share class. Each share class has its own expense structure and sales charges, as applicable.
Class A shares are subject to a maximum front-end sales charge of 5.75% based on the initial investment amount. Class A shares purchased without an initial sales charge in accounts aggregating $1 million to $50 million at the time of purchase are subject to a contingent deferred sales charge (CDSC) if the shares are sold within 18 months of purchase, charged as follows: 1.00% CDSC if redeemed within 12 months of purchase, and 0.50% CDSC if redeemed more than 12, but less than 18, months after purchase.
Class B shares may be subject to a maximum CDSC of 5.00% based upon the holding period after purchase. Class B shares will generally convert to Class A shares eight years after purchase. The Fund no longer accepts investments by new or existing investors in the Fund's Class B shares, except in connection with the reinvestment of any dividend and/or capital gain distributions in Class B shares of the Fund and exchanges by existing Class B shareholders of certain other funds within the Columbia Family of Funds.
Class C shares are subject to a 1.00% CDSC on shares redeemed within one year of purchase.
Class I shares are not subject to sales charges and are available only to the Columbia Family of Funds.
Class R4 shares are not subject to sales charges and are generally available only to omnibus retirement plans and certain other eligible investors. Class R4 shares commenced operations on November 8, 2012.
Class R5 shares are not subject to sales charges and are generally available only to investors purchasing through
authorized investment professionals and omnibus retirement plans. Class R5 shares commenced operations on November 8, 2012.
Class T shares are subject to a maximum front-end sales charge of 5.75% based on the investment amount. Class T shares purchased without an initial sales charge in accounts aggregating $1 million to $50 million at the time of purchase are subject to a CDSC if the shares are sold within 18 months of purchase, charged as follows: 1.00% CDSC if redeemed within 12 months of purchase, and 0.50% CDSC if redeemed more than 12, but less than 18, months after purchase. Class T shares are available only to investors who received (and who have continuously held) Class T shares in connection with the merger of certain Galaxy Funds into various Columbia Funds (formerly named Liberty Funds).
Class W shares are not subject to sales charges and are available only to investors purchasing through authorized investment programs managed by investment professionals, including discretionary managed account programs.
Class Y shares are not subject to sales charges and are generally available only to certain retirement plans. Class Y shares commenced operations on November 8, 2012.
Class Z shares are not subject to sales charges and are available only to certain eligible investors, which are subject to different investment minimums.
Note 2. Summary of Significant Accounting Policies
Use of Estimates
The preparation of financial statements in accordance with U.S. generally accepted accounting principles (GAAP) requires management to make certain estimates and assumptions that affect the reported amounts of assets and liabilities, the disclosure of contingent assets and liabilities at the date of the financial statements and the reported amounts of revenue and expenses during the reporting period. Actual results could differ from those estimates.
The following is a summary of significant accounting policies consistently followed by the Fund in the preparation of its financial statements.
Security Valuation
All equity securities are valued at the close of business of the New York Stock Exchange (NYSE). Equity securities are valued at the last quoted sales price on the principal exchange or market on which they trade, except for securities traded on the NASDAQ Stock Market, which are valued at the NASDAQ official close price. Unlisted securities or listed
Annual Report 2013
29
Columbia Small Cap Core Fund
Notes to Financial Statements (continued)
August 31, 2013
securities for which there were no sales during the day are valued at the mean of the latest quoted bid and ask prices on such exchanges or markets.
Foreign equity securities are valued based on quotations from the principal market in which such securities are normally traded. If any foreign share prices are not readily available as a result of limited share activity the securities are valued at the mean of the latest quoted bid and ask prices on such exchanges or markets. Foreign currency exchange rates are generally determined at 4:00 p.m. Eastern (U.S.) time. However, many securities markets and exchanges outside the U.S. close prior to the close of the NYSE; therefore, the closing prices for securities in such markets or on such exchanges may not fully reflect events that occur after such close but before the close of the NYSE. In those situations, foreign securities will be fair valued pursuant to the policy adopted by the Board of Trustees (the Board), including utilizing a third party pricing service to determine these fair values. The third party pricing service takes into account multiple factors, including, but not limited to, movements in the U.S. securities markets, certain depositary receipts, futures contracts and foreign exchange rates that have occurred subsequent to the close of the foreign exchange or market, to determine a good faith estimate that reasonably reflects the current market conditions as of the close of the NYSE. The fair value of a security is likely to be different from the quoted or published price, if available.
Investments in open-end investment companies, including money market funds, are valued at net asset value.
Investments for which market quotations are not readily available, or that have quotations which management believes are not reliable, are valued at fair value as determined in good faith under consistently applied procedures established by and under the general supervision of the Board. If a security or class of securities (such as foreign securities) is valued at fair value, such value is likely to be different from the last quoted market price for the security.
The determination of fair value often requires significant judgment. To determine fair value, management may use assumptions including but not limited to future cash flows and estimated risk premiums. Multiple inputs from various sources may be used to determine fair value.
Security Transactions
Security transactions are accounted for on the trade date. Cost is determined and gains (losses) are based upon the specific identification method for both financial statement and federal income tax purposes.
Income Recognition
Corporate actions and dividend income are generally recorded net of any non-reclaimable tax withholdings, on the ex-dividend date or upon receipt of ex-dividend notification in the case of certain foreign securities.
The Fund may receive distributions from holdings in business development companies (BDCs), exchange traded funds (ETFs) and real estate investment trusts (REITs), which report information on the character of their distributions annually. These distributions are allocated to dividend income, capital gain and return of capital based on estimates made by the Fund's management if actual information has not yet been reported. Return of capital is recorded as a reduction of the cost basis of securities held. If the Fund no longer owns the applicable securities, return of capital is recorded as a realized gain. Management's estimates are subsequently adjusted when the actual character of the distributions is disclosed by the BDCs, ETFs and REITs, which could result in a proportionate change in return of capital to shareholders.
Awards from class action litigation are recorded as a reduction of cost basis if the Fund still owns the applicable securities on the payment date. If the Fund no longer owns the applicable securities, the proceeds are recorded as realized gains.
Expenses
General expenses of the Trust are allocated to the Fund and other funds of the Trust based upon relative net assets or other expense allocation methodologies determined by the nature of the expense. Expenses directly attributable to the Fund are charged to the Fund. Expenses directly attributable to a specific class of shares are charged to that share class.
Determination of Class Net Asset Value
All income, expenses (other than class-specific expenses, which are charged to that share class, as shown in the Statement of Operations) and realized and unrealized gains (losses) are allocated to each class of the Fund on a daily basis, based on the relative net assets of each class, for purposes of determining the net asset value of each class.
Federal Income Tax Status
The Fund intends to qualify each year as a regulated investment company under Subchapter M of the Internal Revenue Code, as amended, and will distribute substantially all of its taxable income (including net short-term capital gains), if any, for its tax year, and as such will not be subject to federal income taxes. In addition, the Fund intends to distribute in each calendar year substantially all of its net investment income, capital gains and certain other amounts, if any, such that the Fund should not be subject to federal excise
Annual Report 2013
30
Columbia Small Cap Core Fund
Notes to Financial Statements (continued)
August 31, 2013
tax. Therefore, no federal income or excise tax provision is recorded.
Foreign Taxes
The Fund may be subject to foreign taxes on income, gains on investments or currency repatriation, a portion of which may be recoverable. The Fund will accrue such taxes and recoveries, as applicable, based upon its current interpretation of tax rules and regulations that exist in the markets in which it invests.
Realized gains in certain countries may be subject to foreign taxes at the Fund level, based on statutory rates. The Fund accrues for such foreign taxes on realized and unrealized gains at the appropriate rate for each jurisdiction, as applicable. The amount, if any, is disclosed as a liability on the Statement of Assets and Liabilities.
Distributions to Shareholders
Distributions from net investment income, if any, are declared and paid annually. Net realized capital gains, if any, are distributed along with the income distribution. Income distributions and capital gain distributions are determined in accordance with federal income tax regulations, which may differ from GAAP.
Guarantees and Indemnifications
Under the Trust's organizational documents and, in some cases, by contract, its officers and trustees are indemnified against certain liabilities arising out of the performance of their duties to the Trust or its funds. In addition, certain of the Fund's contracts with its service providers contain general indemnification clauses. The Fund's maximum exposure under these arrangements is unknown since the amount of any future claims that may be made against the Fund cannot be determined, and the Fund has no historical basis for predicting the likelihood of any such claims.
Recent Accounting Pronouncement
Disclosures about Offsetting Assets and Liabilities
In December 2011, the Financial Accounting Standards Board (FASB) issued Accounting Standards Update (ASU) No. 2011-11, Disclosures about Offsetting Assets and Liabilities and in January 2013, ASU No. 2013-1, Clarifying the Scope of Disclosures about Offsetting Assets and Liabilities (collectively, the ASUs). Specifically, the ASUs require an entity to disclose both gross and net information for derivatives and other financial instruments that are subject to a master netting arrangement or similar agreement. The ASUs require disclosure of collateral received in connection with the master netting agreements or similar agreements. The disclosure requirements are effective for interim and annual
periods beginning on or after January 1, 2013. At this time, management is evaluating the implications of this guidance and the impact it will have on the financial statement amounts and footnote disclosures, if any.
Note 3. Fees and Compensation Paid to Affiliates
Investment Management Fees
Under an Investment Management Services Agreement, Columbia Management Investment Advisers, LLC (the Investment Manager), a wholly-owned subsidiary of Ameriprise Financial, Inc. (Ameriprise Financial), determines which securities will be purchased, held or sold. The investment management fee is an annual fee that is equal to a percentage of the Fund's average daily net assets that declines from 0.79% to 0.70% as the Fund's net assets increase. The effective investment management fee rate for the year ended August 31, 2013 was 0.76% of the Fund's average daily net assets.
Administration Fees
Under an Administrative Services Agreement, the Investment Manager also serves as the Fund Administrator. The Fund pays the Fund Administrator an annual fee for administration and accounting services equal to a percentage of the Fund's average daily net assets that declines from 0.08% to 0.05% as the Fund's net assets increase. The effective administration fee rate for the year ended August 31, 2013 was 0.08% of the Fund's average daily net assets.
Compensation of Board Members
Board members are compensated for their services to the Fund as disclosed in the Statement of Operations. The Trust's eligible Trustees may participate in a Deferred Compensation Plan (the Plan) which may be terminated at any time. Obligations of the Plan will be paid solely out of the Fund's assets.
Compensation of Chief Compliance Officer
The Board has appointed a Chief Compliance Officer to the Fund in accordance with federal securities regulations. The Fund pays its pro-rata share of the expenses associated with the Chief Compliance Officer. The Fund's expenses for the Chief Compliance Officer will not exceed $15,000 per year.
Transfer Agent Fees
Under a Transfer and Dividend Disbursing Agent Agreement, Columbia Management Investment Services Corp. (the Transfer Agent), an affiliate of the Investment Manager and a wholly-owned subsidiary of Ameriprise Financial, is responsible for providing transfer agency services to the Fund.
Annual Report 2013
31
Columbia Small Cap Core Fund
Notes to Financial Statements (continued)
August 31, 2013
The Transfer Agent has contracted with Boston Financial Data Services (BFDS) to serve as sub-transfer agent.
The Transfer Agent receives monthly account-based service fees based on the number of open accounts and also receives sub-transfer agency fees based on a percentage of the average aggregate value of the Fund's shares maintained in omnibus accounts (other than omnibus accounts for which American Enterprise Investment Services Inc. is the broker of record or accounts where the beneficial shareholder is a customer of Ameriprise Financial Services, Inc., which are paid a per account fee). The Transfer Agent pays the fees of BFDS for services as sub-transfer agent and is not entitled to reimbursement for such fees from the Fund (with the exception of out-of-pocket fees).
The Transfer Agent also receives compensation from fees for various shareholder services and reimbursements for certain out-of-pocket fees. Class I shares do not pay transfer agent fees. Total transfer agent fees for Class R5 shares are subject to an annual limitation of not more than 0.05% of the average daily net assets attributable to Class R5 shares. Beginning November 8, 2012, Class Y shares are not subject to transfer agent fees for at least twelve months.
For the year ended August 31, 2013, the Fund's effective transfer agent fee rates as a percentage of average daily net assets of each class were as follows:
Class A | | | 0.23 | % | |
Class B | | | 0.23 | | |
Class C | | | 0.23 | | |
Class R4 | | | 0.23 | * | |
Class R5 | | | 0.05 | * | |
Class T | | | 0.23 | | |
Class W | | | 0.23 | | |
Class Z | | | 0.23 | | |
*Annualized.
An annual minimum account balance fee of $20 may apply to certain accounts with a value below the applicable share class' initial minimum investment requirements to reduce the impact of small accounts on transfer agent fees. These minimum account balance fees are recorded as part of expense reductions in the Statement of Operations. For the year ended August 31, 2013, these minimum account balance fees reduced total expenses by $3,120.
Distribution and Service Fees
The Fund has an agreement with Columbia Management Investment Distributors, Inc. (the Distributor), an affiliate of the Investment Manager and a wholly-owned subsidiary of Ameriprise Financial, for distribution and shareholder
services. Pursuant to Rule 12b-1 under the 1940 Act, the Board has approved, and the Fund has adopted, distribution and shareholder service plans (the Plans) which set the distribution and service fees for the Fund. These fees are calculated daily and are intended to compensate the Distributor and/or eligible selling and/or servicing agents for selling shares of the Fund and providing services to investors.
Under the Plans, the Fund pays a monthly service fee to the Distributor at the maximum annual rate of 0.25% of the average daily net assets attributable to Class A, Class B, Class C and Class W shares of the Fund. Also under the Plans, the Fund pays a monthly distribution fee to the Distributor at the maximum annual rates of 0.10%, 0.75%, 0.75% and 0.25% of the average daily net assets attributable to Class A, Class B, Class C and Class W shares, respectively.
The Fund may pay distribution and service fees up to a maximum annual rate of 0.35% of the Fund's average daily net assets attributable to Class A shares (comprised of up to 0.10% for distribution services and up to 0.25% for shareholder liaison services), but currently limit such fees to an aggregate fee of not more than 0.25% of the Fund's average daily net assets attributable to Class A shares.
The Fund may pay a distribution fee up to 0.25% of the Fund's average daily net assets attributable to Class W shares and a service fee of up to 0.25% of the Fund's average daily net assets attributable to Class W shares, provided, however, that the aggregate fee shall not exceed 0.25% of the Fund's average daily net assets attributable to Class W shares.
Shareholder Services Fees
The Fund has adopted a shareholder services plan that permits it to pay for certain services provided to Class T shareholders by their selling and/or servicing agents. The Fund may pay shareholder servicing fees up to an aggregate annual rate of 0.50% of the Fund's average daily net assets attributable to Class T shares (comprised of up to 0.25% for shareholder liaison services and up to 0.25% for administrative support services). These fees are currently limited to an aggregate annual rate of not more than 0.30% of the Fund's average daily net assets attributable to Class T shares. The effective shareholder services fee rate for the year ended August 31, 2013 was 0.30% of the Fund's average daily net assets attributable to Class T shares.
Sales Charges
Sales charges, including front-end charges and CDSCs, received by the Distributor for distributing Fund shares were $74,070 for Class A, $472 for Class B, $658 for Class C and $5,722 for Class T shares for the year ended August 31, 2013.
Annual Report 2013
32
Columbia Small Cap Core Fund
Notes to Financial Statements (continued)
August 31, 2013
Expenses Waived/Reimbursed by the Investment Manager and its Affiliates
The Investment Manager and certain of its affiliates have contractually agreed to waive fees and/or reimburse expenses (excluding certain fees and expenses described below) for the periods disclosed below, unless sooner terminated at the sole discretion of the Board, so that the Fund's net operating expenses, after giving effect to fees waived/expenses reimbursed and any balance credits and/or overdraft charges from the Fund's custodian, do not exceed the following annual rates as a percentage of the class' average daily net assets:
| | | February 1, 2013
through
December 31, 2013 | | Prior to
February 1, 2013 | |
Class A | | | 1.41 | % | | | 1.36 | % | |
Class B | | | 2.16 | | | | 2.11 | | |
Class C | | | 2.16 | | | | 2.11 | | |
Class I | | | 1.01 | | | | 0.98 | | |
Class R4 | | | 1.16 | | | | 1.11 | | |
Class R5 | | | 1.06 | | | | 1.03 | | |
Class T | | | 1.46 | | | | 1.41 | | |
Class W | | | 1.41 | | | | 1.36 | | |
Class Y | | | 1.01 | | | | 0.98 | | |
Class Z | | | 1.16 | | | | 1.11 | | |
Under the agreement governing these fee waivers and/or expense reimbursement arrangements, the following fees and expenses are excluded from the waiver/reimbursement commitment, and therefore will be paid by the Fund, if applicable: taxes (including foreign transaction taxes), expenses associated with investments in affiliated and non-affiliated pooled investment vehicles (including mutual funds and exchange traded funds), transaction costs and brokerage commissions, costs related to any securities lending program, dividend expenses associated with securities sold short, inverse floater program fees and expenses, transaction charges and interest on borrowed money, interest, extraordinary expenses and any other expenses the exclusion of which is specifically approved by the Board. This agreement may be modified or amended only with approval from all parties.
Note 4. Federal Tax Information
The timing and character of income and capital gain distributions are determined in accordance with income tax regulations, which may differ from GAAP because of temporary or permanent book to tax differences.
At August 31, 2013, these differences are primarily due to differing treatment for deferral/reversal of wash sales losses, Trustees' deferred compensation, passive foreign investment
company (PFIC) holdings and re-characterization of distributions for investments. To the extent these differences are permanent, reclassifications are made among the components of the Fund's net assets in the Statement of Assets and Liabilities. Temporary differences do not require reclassifications. In the Statement of Assets and Liabilities the following reclassifications were made:
Excess of distributions over net investment income | | $ | 214,611 | | |
Accumulated net realized gain | | | (161,377 | ) | |
Paid-in capital | | | (53,234 | ) | |
Net investment income and net realized gains (losses), as disclosed in the Statement of Operations, and net assets were not affected by this reclassification.
The tax character of distributions paid during the periods indicated was as follows:
| | | Year Ended
August 31,
2013 | | Period Ended
August 31,
2012 | | Year Ended
September 30,
2011 | |
Ordinary income | | $ | 10,192,346 | | | $ | — | | | $ | — | | |
Long-term capital gains | | | 22,796,582 | | | | 28,893,724 | | | | — | | |
Total | | $ | 32,988,928 | | | $ | 28,893,724 | | | $ | — | | |
Short-term capital gain distributions, if any, are considered ordinary income distributions for tax purposes.
At August 31, 2013, the components of distributable earnings on a tax basis were as follows:
Undistributed ordinary income | | $ | 20,935,416 | | |
Undistributed accumulated long-term gain | | | 53,944,635 | | |
Unrealized appreciation | | | 260,468,293 | | |
At August 31, 2013, the cost of investments for federal income tax purposes was $878,767,749 and the aggregate gross unrealized appreciation and depreciation based on that cost was:
Unrealized appreciation | | $ | 303,162,383 | | |
Unrealized depreciation | | | (42,694,090 | ) | |
Net unrealized appreciation | | $ | 260,468,293 | | |
Management of the Fund has concluded that there are no significant uncertain tax positions that would require recognition in the financial statements. However, management's conclusion may be subject to review and adjustment at a later date based on factors including, but not limited to, new tax laws, regulations, and administrative interpretations (including relevant court decisions). Generally, the Fund's federal tax returns for the prior three fiscal years remain subject to examination by the Internal Revenue Service.
Annual Report 2013
33
Columbia Small Cap Core Fund
Notes to Financial Statements (continued)
August 31, 2013
Note 5. Portfolio Information
The cost of purchases and proceeds from sales of securities, excluding short-term obligations, aggregated to $349,231,328 and $344,730,194, respectively, for the year ended August 31, 2013.
Note 6. Regulatory Settlements
During the year ended September 30, 2011, the Fund received $12,545 resulting from certain regulatory settlements with third parties in which the Fund had participated. The payments have been included in "Proceeds from regulatory settlements" in the Statement of Changes in Net Assets.
Note 7. Lending of Portfolio Securities
Effective December 19, 2012, the Fund no longer participates in securities lending activity. Prior to that date, the Fund participated, or was eligible to participate, in securities lending activity pursuant to a Master Securities Lending Agreement (the Agreement) with JPMorgan Chase Bank, N.A. (JPMorgan). The Agreement authorized JPMorgan as lending agent to lend securities to authorized borrowers in order to generate additional income on behalf of the Fund. Pursuant to the Agreement, the securities loaned were secured by cash or securities that either were issued or guaranteed as to principal and interest by the U.S. government, its agencies, authorities or instrumentalities with value equal to at least 100% of the market value of the loaned securities. Any additional collateral required to maintain those levels due to market fluctuations of the loaned securities was requested to be delivered the following business day. Cash collateral received was invested by the lending agent on behalf of the Fund into authorized investments pursuant to the Agreement.
Pursuant to the Agreement, the Fund received income for lending its securities either in the form of fees or by earning interest on invested cash collateral, net of negotiated rebates paid to borrowers and fees paid to the lending agent for services provided and any other securities lending expenses. Net income earned from securities lending for the year ended August 31, 2013 is disclosed in the Statement of Operations. The Fund continued to earn and accrue interest and dividends on the securities loaned.
Note 8. Affiliated Money Market Fund
The Fund invests its daily cash balances in Columbia Short-Term Cash Fund, an affiliated money market fund established for the exclusive use by the Fund and other affiliated funds. The income earned by the Fund from such investments is included as "Dividends — affiliated issuers" in the Statement of Operations. As an investing fund, the Fund indirectly bears its proportionate share of the expenses of Columbia Short-Term Cash Fund.
Note 9. Shareholder Concentration
At August 31, 2013, one unaffiliated shareholder account owned 27.4% of the outstanding shares of the Fund. The Fund has no knowledge about whether any portion of those shares was owned beneficially by such account. Affiliated shareholder accounts owned 27.9% of the outstanding shares of the Fund. Subscription and redemption activity by concentrated accounts may have a significant effect on the operations of the Fund.
Note 10. Line of Credit
The Fund has entered into a revolving credit facility with a syndicate of banks led by JPMorgan whereby the Fund may borrow for the temporary funding of shareholder redemptions or for other temporary or emergency purposes. The credit facility agreement, as amended, which is a collective agreement between the Fund and certain other funds managed by the Investment Manager, severally and not jointly, permits collective borrowings up to $500 million. Interest is charged to each participating fund based on its borrowings at a rate equal to the higher of (i) the overnight federal funds rate plus 1.00% or (ii) the one-month LIBOR rate plus 1.00%. Each borrowing under the credit facility matures no later than 60 days after the date of borrowing. The Fund also pays a commitment fee equal to its pro rata share of the amount of the credit facility at a rate of 0.08% per annum. The commitment fee is included in other expenses in the Statement of Operations.
For the year ended August 31, 2013, the average daily loan balance outstanding on days when borrowing existed was $8,900,000 at a weighted average interest rate of 1.20%. Interest expense incurred by the Fund is recorded as interest expense in the Statement of Operations.
Note 11. Significant Risks
Industrial Sector Risk
The Fund's portfolio managers may invest significantly in issuers operating in the industrials sector. The Fund may be more susceptible to the particular risks of this sector than if the Fund were invested in a wider variety of issuers operating in unrelated sectors.
Note 12. Subsequent Events
Management has evaluated the events and transactions that have occurred through the date the financial statements were issued and noted no items requiring adjustment of the financial statements or additional disclosure.
Annual Report 2013
34
Columbia Small Cap Core Fund
Notes to Financial Statements (continued)
August 31, 2013
Note 13. Information Regarding Pending and Settled Legal Proceedings
In December 2005, without admitting or denying the allegations, American Express Financial Corporation (AEFC, which is now known as Ameriprise Financial, Inc. (Ameriprise Financial)) entered into settlement agreements with the Securities and Exchange Commission (SEC) and Minnesota Department of Commerce (MDOC) related to market timing activities. As a result, AEFC was censured and ordered to cease and desist from committing or causing any violations of certain provisions of the Investment Advisers Act of 1940, the Investment Company Act of 1940, and various Minnesota laws. AEFC agreed to pay disgorgement of $10 million and civil money penalties of $7 million. AEFC also agreed to retain an independent distribution consultant to assist in developing a plan for distribution of all disgorgement and civil penalties ordered by the SEC in accordance with various undertakings detailed at www.sec.gov/litigation/admin/ia-2451.pdf. Ameriprise Financial and its affiliates have cooperated with the SEC and the MDOC in these legal proceedings, and have made regular reports to the funds' Boards of Trustees.
Ameriprise Financial and certain of its affiliates have historically been involved in a number of legal, arbitration and regulatory proceedings, including routine litigation, class actions, and governmental actions, concerning matters arising in connection with the conduct of their business activities. Ameriprise Financial believes that the Funds are not currently the subject of, and that neither Ameriprise Financial nor any of its affiliates are the subject of, any pending legal, arbitration or regulatory proceedings that are likely to have a material adverse effect on the Funds or the ability of Ameriprise Financial or its affiliates to perform under their contracts with the Funds. Ameriprise Financial is required to make 10-Q, 10-K and, as necessary, 8-K filings with the Securities and Exchange Commission on legal and regulatory matters that relate to Ameriprise Financial and its affiliates. Copies of these filings may be obtained by accessing the SEC website at www.sec.gov.
There can be no assurance that these matters, or the adverse publicity associated with them, will not result in increased fund redemptions, reduced sale of fund shares or other adverse consequences to the Funds. Further, although we believe proceedings are not likely to have a material adverse effect on the Funds or the ability of Ameriprise Financial or its affiliates to perform under their contracts with the Funds, these proceedings are subject to uncertainties and, as such, we are unable to estimate the possible loss or range of loss that may result. An adverse outcome in one or more of these proceedings could result in adverse judgments, settlements, fines, penalties or other relief that could have a material adverse effect on the consolidated financial condition or results of operations of Ameriprise Financial.
Annual Report 2013
35
Columbia Small Cap Core Fund
Report of Independent Registered Public Accounting Firm
To the Trustees of Columbia Funds Series Trust I and the Shareholders of
Columbia Small Cap Core Fund
In our opinion, the accompanying statement of assets and liabilities, including the portfolio of investments, and the related statements of operations and of changes in net assets and the financial highlights present fairly, in all material respects, the financial position of Columbia Small Cap Core Fund (the "Fund") (a series of Columbia Funds Series Trust I) at August 31, 2013, the results of its operations, the changes in its net assets and the financial highlights for the periods indicated, in conformity with accounting principles generally accepted in the United States of America. These financial statements and financial highlights (hereafter referred to as "financial statements") are the responsibility of the Fund's management. Our responsibility is to express an opinion on these financial statements based on our audits. We conducted our audits of these financial statements in accordance with the standards of the Public Company Accounting Oversight Board (United States). Those standards require that we plan and perform the audit to obtain reasonable assurance about whether the financial statements are free of material misstatement. An audit includes examining, on a test basis, evidence supporting the amounts and disclosures in the financial statements, assessing the accounting principles used and significant estimates made by management, and evaluating the overall financial statement presentation. We believe that our audits, which included confirmation of securities at August 31, 2013 by correspondence with the custodian, brokers and transfer agent, provide a reasonable basis for our opinion.
PricewaterhouseCoopers LLP
Minneapolis, Minnesota
October 22, 2013
Annual Report 2013
36
Columbia Small Cap Core Fund
Federal Income Tax Information
(Unaudited)
The Fund hereby designates the following tax attributes for the fiscal year ended August 31, 2013. Shareholders will be notified in early 2014 of the amounts for use in preparing 2013 income tax returns.
Tax Designations:
| Qualified Dividend Income | | | 73.08 | % | |
| Dividends Received Deduction | | | 73.10 | % | |
Capital Gain Dividend | | $ | 56,846,766 | | |
Qualified Dividend Income. For taxable, non-corporate shareholders, the percentage of ordinary income dividends paid during the fiscal year that represents qualified dividend income subject to reduced tax rates.
Dividends Received Deduction. The percentage of ordinary income dividends paid during the fiscal year that qualifies for the corporate dividends received deduction.
Capital Gain Dividend. The Fund designates as a capital gain dividend the amount reflected above, or if subsequently determined to be different, the net capital gain of such fiscal period. The Fund also designates as capital gain dividends, to the extent necessary to fully distribute such capital gains, earnings and profits distributed to shareholders on the redemption of shares.
Annual Report 2013
37
Columbia Small Cap Core Fund
The Trustees serve terms of indefinite duration. The names, addresses and birth years of the Trustees and Officers of the Funds in Columbia Funds Series Trust I, the year each was first elected or appointed to office, their principal business occupations during at least the last five years, the number of Funds overseen by each Trustee and other directorships they hold are shown below. Each officer listed below serves as an officer of each Fund in Columbia Funds Series Trust I.
Independent Trustees
Name, Address and Year of Birth,
Position with Funds, Year First
Elected or Appointed to Office | | Principal Occupation(s) During Past Five Years, Number of Funds in Columbia
Funds Complex Overseen by Trustee, Other Directorships Held | |
Rodman L. Drake (Born 1943)
c/o Columbia Management
Investment Advisers, LLC
225 Franklin Street
Boston, MA 02110
Trustee (since 1994) and
Chairman of the Board (since 2009) | | Independent consultant since 2010; Co-Founder of Baringo Capital LLC (private equity) from 1997 to 2008; Chairman (from 2003 to 2010) and CEO (from 2008 to 2010) of Crystal River Capital, Inc. (real estate investment trust); Oversees 52; Jackson Hewitt Tax Service Inc. (tax preparation services) from 2004 to 2011; Student Loan Corporation (student loan provider) from 2005 to 2010; Celgene Corporation (global biotechnology company); The Helios Funds and Brookfield Funds (closed-end funds); Chimerix, Inc. (biopharmaceutical company) since August 1, 2013; Crystal River Capital, Inc. from 2005 to 2010; Parsons Brinckerhoff from 1995 to 2008; and Apex Silver Mines Ltd. from 2007 to 2009 | |
Douglas A. Hacker (Born 1955)
c/o Columbia Management
Investment Advisers, LLC
225 Franklin Street
Boston, MA 02110
Trustee (since 1996) | | Independent business executive since May 2006; Executive Vice President — Strategy of United Airlines from December 2002 to May 2006; President of UAL Loyalty Services (airline marketing company) from September 2001 to December 2002; Executive Vice President and Chief Financial Officer of United Airlines from July 1999 to September 2001. Oversees 52; Nash Finch Company (food distributor); Aircastle Limited (aircraft leasing); and SeaCube Container Leasing Ltd. (container leasing) | |
Janet Langford Kelly (Born 1957)
c/o Columbia Management
Investment Advisers, LLC
225 Franklin Street
Boston, MA 02110
Trustee (since 1996) | | Senior Vice President, General Counsel and Corporate Secretary, ConocoPhillips (integrated energy company) since September 2007; Deputy General Counsel — Corporate Legal Services, ConocoPhillips from August 2006 to August 2007; Partner, Zelle, Hofmann, Voelbel, Mason & Gette LLP (law firm) from March 2005 to July 2006; Adjunct Professor of Law, Northwestern University from September 2004 to June 2006; Director, UAL Corporation (airline) from February 2006 to July 2006; Chief Administrative Officer and Senior Vice President, Kmart Holding Corporation (consumer goods) from September 2003 to March 2004. Oversees 52; None | |
Nancy T. Lukitsh (Born 1956)
c/o Columbia Management
Investment Advisers, LLC
225 Franklin Street
Boston, MA 02110
Trustee (since 2011) | | Senior Vice President, Partner and Director of Marketing, Wellington Management Company, LLP (investment adviser) from 1997 to 2010; Chair, Wellington Management Investment Portfolios (commingled non-U.S. investment pools) from 2007 to 2010; Director, Wellington Trust Company, NA and other Wellington affiliates from 1997 to 2010. Oversees 52; None | |
William E. Mayer (Born 1940)
c/o Columbia Management
Investment Advisers, LLC
225 Franklin Street
Boston, MA 02110
Trustee (since 1994) | | Partner, Park Avenue Equity Partners (private equity) since February 1999; Dean and Professor, College of Business and Management, University of Maryland from 1992 to 1996. Oversees 52; DynaVox Inc. (speech creation); Lee Enterprises (print media); WR Hambrecht + Co. (financial service provider) from 2000 to 2012; BlackRock Kelso Capital Corporation (investment company) | |
David M. Moffett (Born 1952)
c/o Columbia Management
Investment Advisers, LLC
225 Franklin Street
Boston, MA 02110
Trustee (since 2011) | | Retired. Chief Executive Officer, Federal Home Loan Mortgage Corporation, from 2008 to 2009; Senior Adviser, Global Financial Services Group, Carlyle Group, Inc., from 2007 to 2008; Vice Chairman and Chief Financial Officer, U.S. Bancorp, from 1993 to 2007. Oversees 52; CIT Group Inc. (commercial and consumer finance); eBay Inc. (online trading community); MBIA Inc. (financial service provider); E.W. Scripps Co. (print and television media), Building Materials Holding Corp. (building materials and construction services); Genworth Financial, Inc. (financial and insurance products and services); and University of Oklahoma Foundation | |
Charles R. Nelson (Born 1942)
c/o Columbia Management
Investment Advisers, LLC
225 Franklin Street
Boston, MA 02110
Trustee (since 1981) | | Retired. Professor Emeritus, University of Washington, since 2011; Professor of Economics, University of Washington from 1976 to 2011; Ford and Louisa Van Voorhis Professor of Political Economy, University of Washington from 1993 to 2011; Adjunct Professor of Statistics, University of Washington from 1980 to 2011; Associate Editor, Journal of Money, Credit and Banking from September 1993 to 2008; consultant on econometric and statistical matters. Oversees 52; None | |
John J. Neuhauser (Born 1943)
c/o Columbia Management
Investment Advisers, LLC
225 Franklin Street
Boston, MA 02110
Trustee (since 1984) | | President, Saint Michael's College, since August 2007; Director or Trustee of several non-profit organizations, including Fletcher Allen Health Care, Inc.; University Professor, Boston College from November 2005 to August 2007; Academic Vice President and Dean of Faculties, Boston College from August 1999 to October 2005. Oversees 52; Liberty All-Star Equity Fund and Liberty All-Star Growth Fund (closed-end funds) | |
Annual Report 2013
38
Columbia Small Cap Core Fund
Trustees and Officers (continued)
Independent Trustees (continued)
Name, Address and Year of Birth,
Position with Funds, Year First
Elected or Appointed to Office | | Principal Occupation(s) During Past Five Years, Number of Funds in Columbia
Funds Complex Overseen by Trustee, Other Directorships Held | |
Patrick J. Simpson (Born 1944)
c/o Columbia Management
Investment Advisers, LLC
225 Franklin Street
Boston, MA 02110
Trustee (since 2000) | | Partner, Perkins Coie LLP (law firm). Oversees 52; None | |
Anne-Lee Verville (Born 1945)
c/o Columbia Management
Investment Advisers, LLC
225 Franklin Street
Boston, MA 02110
Trustee (since 1998) | | Retired. General Manager — Global Education Industry from 1994 to 1997, President — Application Systems Division from 1991 to 1994, Chief Financial Officer — US Marketing & Services from 1988 to 1991, and Chief Information Officer from 1987 to 1988, IBM Corporation (computer and technology). Oversees 52; Enesco Group, Inc. (producer of giftware and home and garden decor products) from 2001 to 2006 | |
Interested Trustee
Name, Address and Year of Birth,
Position with Funds, Year First
Elected or Appointed to Office | | Principal Occupation(s) During Past Five Years, Number of Funds in Columbia
Funds Complex Overseen by Trustee, Other Directorships Held | |
William F. Truscott (born 1960)
53600 Ameriprise Financial Center
Minneapolis, MN 55474
Senior Vice President (since 2012) | | Chairman of the Board and President, Columbia Management Investment Advisers, LLC since May 2010 and February 2012 (previously President and Chief Investment Officer, from 2001 to April 2010); Chief Executive Officer, Global Asset Management, Ameriprise Financial, Inc. since September 2012 (previously, Chief Executive Officer, U.S. Asset Management & President, Annuities, from May 2010 to September 2012 and President — U.S. Asset Management and Chief Investment Officer from 2005 to April 2010); Director and Chief Executive Officer, Columbia Management Investment Distributors, Inc. since May 2010 and February 2012, respectively (previously Chairman of the Board and Chief Executive Officer from 2006 to April 2010); Chairman of the Board and Chief Executive Officer, RiverSource Distributors, Inc. since 2006; President and Chief Executive Officer, Ameriprise Certificate Company, 2006 to August 2012; Oversees 184; Director, Ameriprise Certificate Company, 2006-January 2013 | |
The Statement of Additional Information includes additional information about the Trustees of the Funds and is available, without charge, upon request by calling 800.345.6611.
The Board has appointed officers who are responsible for day-to-day business decisions based on policies it has established. The officers serve at the pleasure of the Board. In addition to Mr. Truscott, who is Senior Vice President, the Funds' other officers are:
Officers
Name, Year of Birth and Address | | Principal Occupation(s) During the Past Five Years | |
J. Kevin Connaughton (Born 1964)
225 Franklin Street
Boston, MA 02110
President (since 2009) | | Senior Vice President and General Manager — Mutual Fund Products, Columbia Management Investment Advisers, LLC since May 2010; President, Columbia Funds since 2009 and RiverSource Funds since May 2010; Managing Director, Columbia Management Advisors, LLC, December 2004-April 2010; Senior Vice President and Chief Financial Officer, Columbia Funds, June 2008-January 2009; Treasurer, Columbia Funds, October 2003-May 2008; and senior officer of various other affiliated funds since 2000 | |
Amy Johnson (Born 1965)
5228 Ameriprise Financial Center
Minneapolis, MN 55474
Vice President (since 2010) | | Senior Vice President and Chief Operating Officer, Columbia Management Investment Advisers, LLC since May 2010 (previously Chief Administrative Officer, from 2009-April 2010, Vice President — Asset Management and Trust Company Services, from 2006-2009) | |
Michael G. Clarke (Born 1969)
225 Franklin Street
Boston, MA 02110
Treasurer (since 2011) and Chief
Financial Officer (since 2009) | | Vice President, Columbia Management Investment Advisers, LLC since May 2010; Managing Director of Fund Administration, Columbia Management Advisors, LLC, September 2004-April 2010; senior officer of Columbia Funds and affiliated funds since 2002 | |
Annual Report 2013
39
Columbia Small Cap Core Fund
Trustees and Officers (continued)
Officers (continued)
Name, Year of Birth and Address | | Principal Occupation(s) During the Past Five Years | |
Scott R. Plummer (Born 1959)
5228 Ameriprise Financial Center
Minneapolis, MN 55474
Senior Vice President, Assistant
Secretary and Chief Legal Officer
(since 2010) | | Senior Vice President, Chief Legal Officer and Assistant Secretary, Columbia Management Investment Advisers, LLC since June 2005; Senior Vice President and Lead Chief Counsel — Asset Management, Ameriprise Financial, Inc. since May 2010 (previously Vice President and Chief Counsel — Asset Management, 2005-April 2010); Vice President, Chief Counsel and Assistant Secretary, Columbia Management Investment Distributors, Inc. since 2008; Vice President, General Counsel and Secretary, Ameriprise Certificate Company since 2005; Chief Counsel, RiverSource Distributors, Inc. since 2006; senior officer of Columbia Funds and affiliated funds since 2010 | |
Colin Moore (Born 1958)
225 Franklin Street
Boston, MA 02110
Senior Vice President (since 2010) | | Executive Vice President and Global Chief Investment Officer, Ameriprise Financial, Inc. since July 2013; Director and Global Chief Investment Officer, Columbia Management Investment Advisers, LLC since May 2010; Manager, Managing Director and Chief Investment Officer of Columbia Management Advisors, LLC, 2007-April 2010 | |
Thomas P. McGuire (Born 1972)
225 Franklin Street
Boston, MA 02110
Chief Compliance Officer
(since 2012) | | Vice President — Asset Management Compliance, Columbia Management Investment Advisers, LLC since 2010; Chief Compliance Officer, Ameriprise Certificate Company, since September 2010; Compliance Executive, Bank of America, N.A. 2005-2010 | |
Stephen T. Welsh (born 1957)
225 Franklin Street
Boston, MA 02110
Vice President (since 2006) | | President and Director, Columbia Management Investment Services Corp. since May 2010; President and Director, Columbia Management Services, Inc., July 2004-April 2010; Managing Director, Columbia Management Distributors, Inc., August 2007-April 2010 | |
Christopher O. Petersen (born 1970)
5228 Ameriprise Financial Center
Minneapolis, MN 55474
Vice President (since 2010) and
Secretary (since 2011) | | Vice President and Chief Counsel, Ameriprise Financial, Inc. since January 2010 (formerly Vice President and Group Counsel or Counsel, April 2004-January 2010); Assistant Secretary of Columbia Funds, January 2007-April 2011 | |
Paul D. Pearson (born 1956)
10468 Ameriprise Financial Center
Minneapolis, MN 55474
Vice President and Assistant
Treasurer (since 2011) | | Vice President, Investment Accounting, Columbia Management Investment Advisers, LLC, since May 2010; Vice President — Managed Assets, Investment Accounting, Ameriprise Financial, Inc., February 1998-May 2010 | |
Joseph F. DiMaria (Born 1968)
225 Franklin Street
Boston, MA 02110
Vice President (since 2011) and
Chief Accounting Officer (since 2008) | | Vice President, Mutual Fund Administration, Columbia Management Investment Advisers, LLC, since May 2010; Director of Fund Administration, Columbia Management Advisors, LLC, January 2006-April 2010 | |
Paul B. Goucher (born 1968)
100 Park Avenue
New York, NY 10017
Vice President and Assistant
Secretary (since 2010) | | Vice President and Lead Chief Counsel, Ameriprise Financial, Inc. since November 2008 and January 2013, respectively (formerly, Chief Counsel from January 2010-January 2013 and Group Counsel from November 2008-January 2010); Director, Managing Director and General Counsel, J. & W. Seligman & Co. Incorporated, July 2008-November 2008 (previously, Managing Director and Associate General Counsel, January 2005-July 2008) | |
Michael E. DeFao (born 1968)
225 Franklin Street
Boston, MA 02110
Vice President and Assistant
Secretary (since 2011) | | Vice President and Chief Counsel, Ameriprise Financial, Inc. since May 2010; Associate General Counsel, Bank of America, N.A. June 2005-April 2010 | |
Annual Report 2013
40
Columbia Small Cap Core Fund
Board Consideration and Approval of
Advisory Agreement
On June 14, 2013, the Board of Trustees (the "Board") and the Trustees who are not interested persons (as defined in the Investment Company Act of 1940) of the Trust (the "Independent Trustees") unanimously approved the continuation of the Investment Management Services Agreement (the "Advisory Agreement") with Columbia Management Investment Advisers, LLC (the "Investment Manager") with respect to Columbia Small Cap Core Fund (the "Fund"), a series of the Trust. As detailed below, the Advisory Fees and Expenses Committee (the "Committee") and the Board met on multiple occasions to review and discuss, both among themselves and with the management team of the Investment Manager, materials provided by the Investment Manager before determining to approve the continuation of the Advisory Agreement.
In connection with their deliberations regarding the continuation of the Advisory Agreement, the Committee and the Board evaluated materials requested from the Investment Manager regarding the Fund and the Advisory Agreement, and discussed these materials with representatives of the Investment Manager at Committee meetings held on March 5, 2013, April 24, 2013 and June 13, 2013, and at the Board meeting held on June 14, 2013. In addition, the Board considers matters bearing on the Advisory Agreement at most of its other meetings throughout the year and meets regularly with senior management of the Funds and the Investment Manager. Through the Board's Investment Oversight Committees, Trustees also meet with selected Fund portfolio managers and other investment personnel at various times throughout the year. The Committee and the Board also consulted with Fund counsel and with the Independent Trustees' independent legal counsel, who advised on various matters with respect to the Committee's and the Board's considerations and otherwise assisted the Committee and the Board in their deliberations. On June 13, 2013, the Committee recommended that the Board approve the continuation of the Advisory Agreement. On June 14, 2013, the Board, including the Independent Trustees, voting separately, unanimously approved the continuation of the Advisory Agreement for the Fund.
The Committee and the Board considered all information that they, their legal counsel, or the Investment Manager believed reasonably necessary to evaluate and to determine whether to approve the continuation of the Advisory Agreement. The information and factors considered by the Committee and the Board in recommending for approval or approving the continuation of the Advisory Agreement for the Fund included the following:
• Information on the investment performance of the Fund relative to the performance of a group of mutual funds determined to be comparable to the Fund by an independent third-party data provider, as well as performance relative to benchmarks;
• Information on the Fund's advisory fees and total expenses, including information comparing the Fund's expenses to those of a group of comparable mutual funds, as determined by the independent third-party data provider;
• The Investment Manager's agreement to contractually limit or cap total operating expenses for the Fund so that total operating expenses (excluding certain fees and expenses, such as transaction costs and certain other investment related expenses, interest, taxes, acquired fund fees and expenses, and extraordinary expenses) would not exceed the median expenses of a group of comparable funds (as determined from time to time, generally annually, by the independent third-party data provider);
• The terms and conditions of the Advisory Agreement;
• The terms and conditions of other agreements and arrangements with affiliates of the Investment Manager relating to the operations of the Fund, including the Administrative Services Agreement, the Distribution Agreement and the Transfer and Dividend Disbursing Agent Agreement;
• Descriptions of various functions performed by the Investment Manager under the Advisory Agreement, including portfolio management and portfolio trading practices;
• Information regarding the management fees and investment performance of comparable portfolios of other clients of the Investment Manager, including institutional separate accounts;
• Information regarding the reputation, regulatory history and resources of the Investment Manager, including information regarding senior management, portfolio managers and other personnel;
• Information regarding the capabilities of the Investment Manager with respect to compliance monitoring services, including an assessment of the Investment Manager's compliance system by the Fund's Chief Compliance Officer; and
• The profitability to the Investment Manager and its affiliates from their relationships with the Fund.
Annual Report 2013
41
Columbia Small Cap Core Fund
Board Consideration and Approval of
Advisory Agreement (continued)
Nature, Extent and Quality of Services Provided under the Advisory Agreement
The Committee and the Board considered the nature, extent and quality of services provided to the Fund by the Investment Manager and its affiliates under the Advisory Agreement and under separate agreements for the provision of transfer agency and administrative services, and the resources dedicated to the Fund and the other Columbia Funds by the Investment Manager and its affiliates. The Committee and the Board considered, among other things, the Investment Manager's ability to attract, motivate and retain highly qualified research, advisory and supervisory investment professionals (including personnel and other resources, compensation programs for personnel involved in fund management, reputation and other attributes), the portfolio management services provided by those investment professionals, and the quality of the Investment Manager's investment research capabilities and trade execution services. The Committee and the Board also considered the potential benefits to shareholders of investing in a mutual fund that is part of a fund complex offering exposure to a variety of asset classes and investment disciplines and providing a variety of fund and shareholder services.
The Committee and the Board also considered the professional experience and qualifications of the senior personnel of the Investment Manager, which included consideration of the Investment Manager's experience with similarly-structured funds. The Committee and the Board noted the compliance programs of and the compliance-related resources provided to the Fund by the Investment Manager and its affiliates, and considered the Investment Manager's ability to provide administrative services to the Fund pursuant to a separate Administrative Services Agreement, including the Investment Manager's ability to coordinate the activities of the Fund's other service providers. After reviewing these and related factors, the Committee and the Board concluded, within the context of their overall conclusions, that the nature, extent and quality of the services provided to the Fund under the Advisory Agreement supported the continuation of the Advisory Agreement.
Investment Performance
The Committee and the Board reviewed information about the performance of the Fund over various time periods, including performance information relative to benchmarks and information based on reports of the independent third-party data provider that compared the performance of the Fund to the performance of a group of comparable mutual funds. The Committee and the Board also reviewed a description of the third party's methodology for identifying the Fund's peer groups for purposes of performance and expense comparisons. Although the Fund's performance lagged that of a relevant peer group for certain (although not necessarily all) periods, the Committee and the Board concluded that other factors relevant to performance were sufficient, in light of other considerations, to warrant continuation of the Fund's Advisory Agreement. Those factors included one or more of the following: (i) that the Fund's performance, although lagging in certain recent periods, was stronger over the longer term; (ii) that the underperformance was attributable, to a significant extent, to investment decisions that were reasonable and consistent with the Fund's investment strategy and policies and that the Fund was performing within a reasonable range of expectations, given those investment decisions, market conditions and the Fund's investment strategy; (iii) that the Fund's performance was competitive when compared to other relevant performance benchmarks or peer groups; and (iv) that the Investment Manager had taken or was taking steps designed to help improve the Fund's investment performance, including, but not limited to, replacing portfolio managers, enhancing the resources supporting the portfolio managers, or modifying investment strategies.
The Committee and the Board noted that, through December 31, 2012, the Fund's performance was in the sixty-eighth, forty-seventh and twenty-eighth percentile (where the best performance would be in the first percentile) of its category selected by the independent third-party data provider for the purposes of performance comparisons for the one-, three- and five- year periods, respectively.
The Committee and the Board also considered the Investment Manager's performance and reputation generally, the Investment Manager's historical responsiveness to Board concerns about performance, and the Investment Manager's willingness to take steps intended to improve performance. After reviewing these and related factors, the Committee and the Board concluded, within the context of their overall conclusions, that the performance of the Fund and the Investment Manager was sufficient, in light of other considerations, to warrant the continuation of the Advisory Agreement.
Investment Advisory Fee Rates and Other Expenses
The Committee and the Board considered the advisory fees charged to the Fund under the Advisory Agreement as well as the total expenses incurred by the Fund. In assessing the reasonableness of the fees under the Advisory Agreement, the
Annual Report 2013
42
Columbia Small Cap Core Fund
Board Consideration and Approval of
Advisory Agreement (continued)
Committee and the Board considered, among other information, the Fund's advisory fee and its total expense ratio as a percentage of average daily net assets. The Committee and the Board noted that the Fund's actual management fee and net expense ratio are ranked in the fourth and third quintiles, respectively, (where the lowest fees and expenses would be in the first quintile) against the Fund's expense universe as determined by the independent third-party data provider for purposes of expense comparison. The Committee and the Board also took into account the fee waiver and expense limitation arrangements agreed to by the Investment Manager, as noted above.
The Committee and the Board also received and considered information about the advisory fees charged by the Investment Manager to institutional separate accounts. In considering the fees charged to those accounts, the Committee and the Board took into account, among other things, the Investment Manager's representations about the differences between managing mutual funds as compared to other types of accounts, including differences in the services provided, differences in the risk profile of such business for the Investment Manager and the additional resources required to manage mutual funds effectively. In evaluating the Fund's advisory fees, the Committee and the Board also took into account the demands, complexity and quality of the investment management of the Fund.
After reviewing these and related factors, the Committee and the Board concluded, within the context of their overall conclusions, that the advisory fee rates and expenses of the Fund supported the continuation of the Advisory Agreement.
Costs of Services Provided and Profitability
The Committee and the Board also took note of the costs of the services provided (both on an absolute and relative basis) and the profitability to the Investment Manager and its affiliates in connection with their relationships with the Fund. In evaluating these considerations, the Committee and the Board took note of the advisory fees charged by the Investment Manager to other clients, including fees charged by the Investment Manager to institutional separate account clients with similar investment strategies to those of the Fund.
The Committee and the Board also considered the compensation directly or indirectly received by the Investment Manager's affiliates in connection with their relationships with the Fund. The Committee and the Board reviewed information provided by management as to the profitability of the Investment Manager and its affiliates of their relationships with the Fund, information about the allocation of expenses used to calculate profitability, and comparisons of profitability levels realized in 2012 to profitability levels realized in 2011. When reviewing profitability, the Committee and the Board also considered court cases in which adviser profitability was an issue in whole or in part, the performance of the Fund, the expense ratio of the Fund, and the implementation of expense limitations with respect to the Fund. The Committee and the Board also considered information provided by the Investment Manager regarding its financial condition and comparing its profitability to that of other asset management firms that are, or are subsidiaries of, publicly traded companies.
After reviewing these and related factors, the Committee and the Board concluded, within the context of their overall conclusions, that the costs of services provided and the profitability to the Investment Manager and its affiliates from their relationships with the Fund supported the continuation of the Advisory Agreement.
Economies of Scale
The Committee and the Board considered the potential existence of economies of scale in the provision by the Investment Manager of services to the Fund, to groups of related funds, and to the Investment Manager's investment advisory clients as a whole, and whether those economies of scale were shared with the Fund through breakpoints in investment advisory fees or other means, such as expense limitation arrangements and additional investments by the Investment Manager in investment, trading and compliance resources. The Committee and the Board noted that the investment advisory fee schedules for the Fund contained breakpoints that would reduce the fee rate on assets above specified threshold levels.
In considering these matters, the Committee and the Board also considered the costs of the services provided and the profitability to the Investment Manager and its affiliates from their relationships with the Fund, as discussed above. After reviewing these and related factors, the Committee and the Board concluded, within the context of their overall conclusions, that the extent to which any economies of scale were expected to be shared with the Fund supported the continuation of the Advisory Agreement.
Annual Report 2013
43
Columbia Small Cap Core Fund
Board Consideration and Approval of
Advisory Agreement (continued)
Other Benefits to the Investment Manager
The Committee and the Board received and considered information regarding "fall-out" or ancillary benefits received by the Investment Manager and its affiliates as a result of their relationships with the Fund, such as the engagement of the Investment Manager to provide administrative services to the Fund and the engagement of the Investment Manager's affiliates to provide distribution and transfer agency services to the Fund. The Committee and the Board considered that the Fund's distributor retains a portion of the distribution fees from the Fund. The Committee and the Board also considered the benefits of research made available to the Investment Manager by reason of brokerage commissions generated by the Fund's securities transactions, and reviewed information about the Investment Manager's practices with respect to allocating portfolio transactions for brokerage and research services. The Committee and the Board considered the possible conflicts of interest associated with certain fall-out or other ancillary benefits and the reporting, disclosure and other processes that are in place to address such possible conflicts of interest. The Committee and the Board recognized that the Investment Manager's profitability would be somewhat lower without these benefits.
Conclusion
The Committee and the Board reviewed all of the above considerations in reaching their decisions to recommend or approve the continuation of the Advisory Agreement. In their deliberations, the Trustees did not identify any particular information that was all-important or controlling, and individual Trustees may have attributed different weights to the various factors. Based on their evaluation of all factors that they deemed to be material, including those factors described above, and assisted by the advice of independent legal counsel, the Board, including the Independent Trustees, voting separately, unanimously approved the continuation of the Advisory Agreement.
Annual Report 2013
44
Columbia Small Cap Core Fund
Important Information About This Report
Each fund mails one shareholder report to each shareholder address. If you would like more than one report, please call shareholder services at 800.345.6611 and additional reports will be sent to you.
The policy of the Board is to vote the proxies of the companies in which each fund holds investments consistent with the procedures as stated in the Statement of Additional Information (SAI). You may obtain a copy of the SAI without charge by calling 800.345.6611; contacting your financial intermediary; visiting columbiamanagement.com; or searching the website of the Securities and Exchange Commission (SEC) at sec.gov. Information regarding how each fund voted proxies relating to portfolio securities is filed with the SEC by August 31 for the most recent 12-month period ending June 30 of that year, and is available without charge by visiting columbiamanagement.com; or searching the website of the SEC at sec.gov.
Each fund files a complete schedule of portfolio holdings with the SEC for the first and third quarters of each fiscal year on Form N-Q. Each fund's Form N-Q is available on the SEC's website at sec.gov and may be reviewed and copied at the SEC's Public Reference Room in Washington, D.C. Information on the operation of the Public Reference Room may be obtained by calling 800.SEC.0330. Each fund's complete schedule of portfolio holdings, as filed on Form N-Q, can also be obtained without charge, upon request, by calling 800.345.6611.
Annual Report 2013
45

Columbia Small Cap Core Fund
P.O. Box 8081
Boston, MA 02266-8081
columbiamanagement.com
This information is for use with concurrent or prior delivery of a fund prospectus. Please read and consider the investment objectives, risks, charges and expenses for any fund carefully before investing. For a prospectus which contains this and other important information about the Fund go to columbiamanagement.com. The Fund is distributed by Columbia Management Investment Distributors, Inc., member FINRA, and managed by Columbia Management Investment Advisers, LLC.
© 2013 Columbia Management Investment Advisers, LLC. All rights reserved.
ANN225_08_C01_(10/13)
Annual Report
August 31, 2013

Columbia Small Cap Growth Fund I
Not FDIC insured • No bank guarantee • May lose value
 Dear Shareholders,
A return to volatility
Volatility returned to the financial markets in the second quarter of 2013, as uncertainty about the global economy, monetary policy and the impact of the sequester's spending cuts weighed on investors. Households advanced their spending but also allocated less to savings. Labor markets continued to crank out jobs at a steady pace, slowly reducing unemployment. Housing activity remained strong and retail sales were higher despite no real increase in income. The single weak spot was in the manufacturing sector, where activity slowed. While the consumer has weathered the domestic drag well, business has been closer to the global slowdown and effects of sequestration. Businesses remain very cautious, keeping inventories and staffs lean, and are planning for but not yet confident enough to make capital expenditures.
Against this backdrop, equities outperformed fixed income during the second quarter of 2013. Small-cap stocks outperformed large- and mid-cap stocks, and growth outperformed value except for in the large-cap sector. Outside the United States, foreign stock markets generally lost ground, with the most significant losses sustained by emerging markets.
Columbia Management to begin delivering summary prospectuses
Each Columbia fund is required to update its prospectus on an annual basis. Beginning with June 2013 prospectus updates, shareholders of Columbia retail mutual funds will start to receive a summary prospectus, rather than the full length (statutory) mutual fund prospectus they have received in the past.
Each fund's summary prospectus will include the following key information:
> Investment objective
> Fee and expense table
> Portfolio turnover rate information
> Principal investment strategies, principal risks and performance information
> Management information
> Purchase and sale information
> Tax information
> Financial intermediary compensation information
Each fund's statutory prospectus will contain additional information about the fund and its risks. Both the statutory and summary prospectus will be updated each year, and will be available at columbiamanagement.com. Shareholders may request a printed version of a statutory prospectus at no cost by calling 800.345.6611 or sending an email to serviceinquiries@columbiamanagement.com.
Stay on track with Columbia Management
Backed by more than 100 years of experience, Columbia Management is one of the nation's largest asset managers. At the heart of our success — and, most importantly, that of our investors — are highly talented industry professionals, brought together by a unique way of working. We are dedicated to helping you take advantage of today's opportunities and anticipate tomorrow's. We stay abreast of the latest investment trends and ideas, using our collective insight to evaluate events and transform them into solutions you can use.
Visit columbiamanagement.com for:
> The Columbia Management Perspectives blog, featuring timely posts by our investment teams
> Detailed up-to-date fund performance and portfolio information
> Economic analysis and market commentary
> Quarterly fund commentaries
> Columbia Management Investor, our award-winning quarterly newsletter for shareholders
Thank you for your continued support of the Columbia Funds. We look forward to serving your investment needs for many years to come.
Best Regards,

J. Kevin Connaughton
President, Columbia Funds
Investors should consider the investment objectives, risks, charges and expenses of a mutual fund carefully before investing. For a free prospectus, which contains this and other important information about a fund, visit columbiamanagement.com. The prospectus should be read carefully before investing.
Columbia Funds are distributed by Columbia Management Investment Distributors, Inc., member FINRA, and managed by Columbia Management Investment Advisers, LLC.
© 2013 Columbia Management Investment Advisers, LLC. All rights reserved.
Columbia Small Cap Growth Fund I
Performance Overview | | | 2 | | |
Manager Discussion of Fund Performance | | | 4 | | |
Understanding Your Fund's Expenses | | | 6 | | |
Portfolio of Investments | | | 7 | | |
Statement of Assets and Liabilities | | | 12 | | |
Statement of Operations | | | 14 | | |
Statement of Changes in Net Assets | | | 15 | | |
Financial Highlights | | | 18 | | |
Notes to Financial Statements | | | 28 | | |
Report of Independent Registered
Public Accounting Firm | | | 36 | | |
Federal Income Tax Information | | | 37 | | |
Trustees and Officers | | | 38 | | |
Board Consideration and Approval of Advisory Agreement | | | 41 | | |
Important Information About This Report | | | 45 | | |
Fund Investment Manager
Columbia Management Investment
Advisers, LLC
225 Franklin Street
Boston, MA 02110
Fund Distributor
Columbia Management Investment
Distributors, Inc.
225 Franklin Street
Boston, MA 02110
Fund Transfer Agent
Columbia Management Investment
Services Corp.
P.O. Box 8081
Boston, MA 02266-8081
For more information about any of the funds, please visit columbiamanagement.com or call 800.345.6611. Customer Service Representatives are available to answer your questions Monday through Friday from 8 a.m. to 8 p.m. Eastern time.
The views expressed in this report reflect the current views of the respective parties. These views are not guarantees of future performance and involve certain risks, uncertainties and assumptions that are difficult to predict, so actual outcomes and results may differ significantly from the views expressed. These views are subject to change at any time based upon economic, market or other conditions and the respective parties disclaim any responsibility to update such views. These views may not be relied on as investment advice and, because investment decisions for a Columbia Fund are based on numerous factors, may not be relied on as an indication of trading intent on behalf of any particular Columbia Fund. References to specific securities should not be construed as a recommendation or investment advice.
Columbia Small Cap Growth Fund I
Performance Summary
> Columbia Small Cap Growth Fund I (the Fund) Class A shares returned 25.12% excluding sales charges for the 12 months that ended August 31, 2013.
> In a period that was generally strong for small-cap stocks, the Fund lagged its benchmarks, the Russell 2000 Growth Index and the Russell 2000 Index, which returned 28.14% and 26.27%, respectively.
> The Fund's focus on companies with high earnings growth and strong balance sheets hampered relative performance. Low interest rates and other factors attracted investors to companies that paid dividends or funded growth through low-cost debt as well as companies with faster growth profiles but without the cash flow to support their high valuations.
Average Annual Total Returns (%) (for period ended August 31, 2013)
| | Inception | | 1 Year | | 5 Years | | 10 Years | |
Class A* | | 11/01/05 | | | | | | | | | | | | | |
Excluding sales charges | | | | | | | 25.12 | | | | 7.94 | | | | 9.75 | | |
Including sales charges | | | | | | | 17.94 | | | | 6.67 | | | | 9.10 | | |
Class B* | | 11/01/05 | | | | | | | | | | | | | |
Excluding sales charges | | | | | | | 24.20 | | | | 7.13 | | | | 8.94 | | |
Including sales charges | | | | | | | 19.20 | | | | 6.83 | | | | 8.94 | | |
Class C* | | 11/01/05 | | | | | | | | | | | | | |
Excluding sales charges | | | | | | | 24.20 | | | | 7.15 | | | | 8.94 | | |
Including sales charges | | | | | | | 23.20 | | | | 7.15 | | | | 8.94 | | |
Class I* | | 09/27/10 | | | 25.69 | | | | 8.33 | | | | 10.08 | | |
Class K* | | 02/28/13 | | | 25.30 | | | | 8.08 | | | | 9.89 | | |
Class R* | | 09/27/10 | | | 24.85 | | | | 7.68 | | | | 9.48 | | |
Class R4* | | 11/08/12 | | | 25.51 | | | | 8.22 | | | | 10.03 | | |
Class R5* | | 02/28/13 | | | 25.56 | | | | 8.23 | | | | 10.03 | | |
Class Y* | | 07/15/09 | | | 25.70 | | | | 8.36 | | | | 10.10 | | |
Class Z | | 10/01/96 | | | 25.42 | | | | 8.20 | | | | 10.02 | | |
Russell 2000 Growth Index | | | | | | | 28.14 | | | | 9.01 | | | | 8.84 | | |
Russell 2000 Index | | | | | | | 26.27 | | | | 7.98 | | | | 8.76 | | |
Returns for Class A are shown with and without the maximum initial sales charge of 5.75%. Returns for Class B are shown with and without the applicable contingent deferred sales charge (CDSC) of 5.00% in the first year, declining to 1.00% in the sixth year and eliminated thereafter. Returns for Class C are shown with and without the 1.00% CDSC for the first year only. The Fund's other classes are not subject to sales charges and have limited eligibility. Please see the Fund's prospectus for details. Performance for different share classes will vary based on differences in sales charges and fees associated with each class. All results shown assume reinvestment of distributions during the period. Returns do not reflect the deduction of taxes that a shareholder may pay on Fund distributions or on the redemption of Fund shares. Performance results reflect the effect of any fee waivers or reimbursements of Fund expenses by Columbia Management Investment Advisers, LLC and/or any of its affiliates. Absent these fee waivers or expense reimbursement arrangements, performance results would have been lower.
The performance information shown represents past performance and is not a guarantee of future results. The investment return and principal value of your investment will fluctuate so that your shares, when redeemed, may be worth more or less than their original cost. Current performance may be lower or higher than the performance information shown. You may obtain performance information current to the most recent month-end by contacting your financial intermediary, visiting columbiamanagement.com or calling 800.345.6611.
*The returns shown for periods prior to the share class inception date (including returns for the Life of the Fund, if shown, which are since Fund inception) include the returns of the Fund's oldest share class. These returns are adjusted to reflect any higher class-related operating expenses of the newer share classes, as applicable. Please visit columbiamanagement.com/mutual-funds/appended-performance for more information.
The Russell 2000 Growth Index, an unmanaged index, measures the performance of those Russell 2000 Index companies with higher price-to-book ratios and higher forecasted growth values.
The Russell 2000 Index measures the performance of the small-cap segment of the U.S. equity universe. The Russell 2000 is a subset of the Russell 3000 Index representing approximately 10% of the total market capitalization of that index. It includes approximately 2,000 of the smallest securities based on a combination of their market cap and current index membership.
Indices are not available for investment, are not professionally managed and do not reflect sales charges, fees, brokerage commissions, taxes or other expenses of investing. Securities in the Fund may not match those in an index.
Annual Report 2013
2
Columbia Small Cap Growth Fund I
Performance Overview (continued)
Performance of a Hypothetical $10,000 Investment (September 1, 2003 – August 31, 2013)
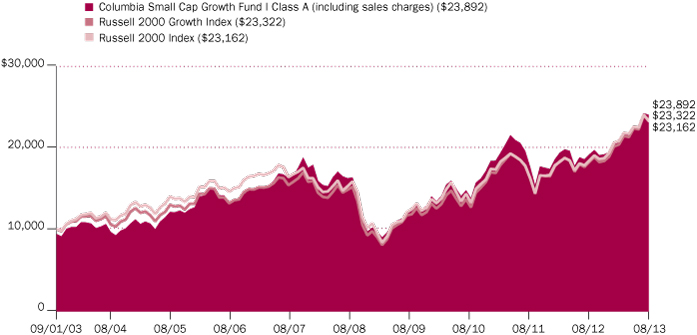
The chart above shows the change in value of a hypothetical $10,000 investment in Class A shares of Columbia Small Cap Growth Fund I during the stated time period, and does not reflect the deduction of taxes that a shareholder may pay on Fund distributions or on the redemption of Fund shares.
Annual Report 2013
3
Columbia Small Cap Growth Fund I
Manager Discussion of Fund Performance
For the 12-month period that ended August 31, 2013, the Fund's Class A shares returned 25.12% excluding sales charges. The Fund's benchmarks, the Russell 2000 Growth Index and the Russell 2000 Index returned 28.14% and 26.27%, respectively, for the same 12-month period. During a period in which small-cap growth companies did extremely well for investors, we remained focused on attractively valued small-cap companies with high earnings growth, strong balance sheets and good cash flow. However, investors favored companies with slower earnings growth, high levels of debt and high dividend payments, as well as rapidly growing companies that did not necessarily have the cash flow to support their high valuations. In this environment, stock selection generally accounted for the modest shortfall relative to the benchmarks.
Progress in U.S. Economy
Concerns about the impact of tax increases and enforced federal spending cuts, another showdown over the debt ceiling and the possibility of an attack on Syria weighed on investors during the past 12 months. However, steady job growth and a solid rebound in the housing market helped keep U.S economic growth afloat. Manufacturing activity also picked up late in the period — an encouraging sign. In May, the Federal Reserve began talking about pulling back on its huge monthly government bond purchase program, triggering a market pullback. However, stocks recovered before retreating again in August as investors locked in profits and the civil war in Syria intensified. Nevertheless, U.S. stocks ended the year with gains that were well ahead of most international markets. Small-cap stocks benefited from their domestic focus, beating larger cap stocks. Within small-cap stocks, growth beat value.
Boost from Consumer Discretionary and Information Technology
Stock picks in the consumer discretionary and technology sectors aided relative performance. Standouts within consumer discretionary included floor tile retailer Tile Shop Holdings. Its stock benefited as the U.S. housing recovery spurred increased demand for its products and as consumers favored hard-surface flooring over carpeting. In information technology, Yelp was a top contributor. Yelp hosts an online database of user-generated reviews for local businesses. The stock benefited from recent company initiatives, which included launching display ads on mobile phones, improving the effectiveness of its application on Apple's iOS platform and expanding reviews to include a wider array of service providers. Elsewhere, top contributors included WageWorks, an industrials company that helps businesses administer flexible tax-advantaged health care and dependent care spending accounts. Its stock climbed as rising health care costs drove increased demand for these accounts, helping to push earnings and revenue ahead of expectations.
Disappointments from Consumer Staples and Health Care
The Fund lost ground versus the Russell 2000 Growth Index from stock picks in the consumer staples and health care sectors. In consumer staples, makeup and skin care company Elizabeth Arden detracted the most. The company, which has focused on expanding international distribution, fell short of its earnings growth targets, causing the stock to decline. In health care, an out-of-index stake in
Portfolio Management
Wayne Collette, CFA
Lawrence Lin, CFA
Rahul Narang*
*Effective September 12, 2013, Rahul Narang was added as a Portfolio Manager of the Fund. George Myers and Brian Neigut no longer serve as Portfolio Managers of the Fund.
Morningstar Style BoxTM
The Morningstar Style BoxTM is based on a fund's portfolio holdings. For equity funds, the vertical axis shows the market capitalization of the stocks owned, and the horizontal axis shows investment style (value, blend, or growth). Information shown is based on the most recent data provided by Morningstar.
©2013 Morningstar, Inc. All rights reserved. The Morningstar information contained herein: (1) is proprietary to Morningstar and/or its content providers; (2) may not be copied or distributed; and (3) is not warranted to be accurate, complete or timely. Neither Morningstar nor its content providers are responsible for any damages or losses arising from any use of this information.
Top Ten Holdings (%)
(at August 31, 2013) | |
Yelp, Inc. | | | 2.7 | | |
Select Comfort Corp. | | | 2.6 | | |
Lumber Liquidators Holdings, Inc. | | | 2.0 | | |
Domino's Pizza, Inc. | | | 1.9 | | |
Conn's, Inc. | | | 1.9 | | |
LifeLock, Inc. | | | 1.9 | | |
U.S. Airways Group, Inc. | | | 1.9 | | |
Acuity Brands, Inc. | | | 1.8 | | |
HMS Holdings Corp. | | | 1.8 | | |
GameStop Corp., Class A | | | 1.7 | | |
Percentages indicated are based upon total investments (excluding Money Market Funds).
For further detail about these holdings, please refer to the section entitled "Portfolio of Investments."
Fund holdings are as of the date given, are subject to change at any time, and are not recommendations to buy or sell any security.
Annual Report 2013
4
Columbia Small Cap Growth Fund I
Manager Discussion of Fund Performance (continued)
biopharmaceutical company Amarin hurt results, as uncertainty about how a newly approved drug would be marketed pressured the share price. Elsewhere, untimely ownership of online real estate listing company Zillow detracted, as the stock fell sharply in the wake of a muted earnings forecast for the seasonally slower fourth quarter. We sold the position.
Looking Ahead
While stocks held up well during the summer earnings reporting season, we think conditions could become less favorable. Typically, in the absence of a market rally that benefits stocks across the board, investors have been satisfied with companies meeting subdued earnings growth expectations and rewarded firms that could boost market share, capitalize on pockets of sales growth or overcome skepticism about their prospects. If, as we expect, earnings growth becomes harder to find, bottom-up stock pickers such as ourselves, who are focused on company-specific factors, should have an advantage over investors who rely heavily on macroeconomic trends for their predictions. While we plan to keep sector weights close to those in the Russell 2000 Growth Index, security selection may drive modest deviations. At period end, the Fund had a small underweight in consumer staples and slight overweight in health care.
Portfolio Breakdown (%)
(at August 31, 2013) | |
Common Stocks | | | 97.7 | | |
Consumer Discretionary | | | 21.0 | | |
Consumer Staples | | | 1.7 | | |
Energy | | | 3.8 | | |
Financials | | | 5.2 | | |
Health Care | | | 23.8 | | |
Industrials | | | 13.8 | | |
Information Technology | | | 24.9 | | |
Materials | | | 1.6 | | |
Telecommunication Services | | | 1.9 | | |
Money Market Funds | | | 2.3 | | |
Warrants | | | 0.0 | (a) | |
Total | | | 100.0 | | |
Percentages indicated are based upon total investments. The Fund's portfolio composition is subject to change.
(a) Rounds to zero.
Investment Risks
Risks include stock market fluctuations due to business and economic developments. Investments in small-cap companies may be subject to greater volatility and price fluctuations because they may be thinly traded and less liquid. See the Fund's prospectus for information on these and other risks.
Annual Report 2013
5
Columbia Small Cap Growth Fund I
Understanding Your Fund's Expenses
(Unaudited)
As an investor, you incur two types of costs. There are transaction costs, which generally include sales charges on purchases and may include redemption fees. There are also ongoing costs, which generally include management fees, distribution and service (Rule 12b-1) fees, and other fund expenses. The following information is intended to help you understand your ongoing costs (in dollars) of investing in the Fund and to help you compare these costs with the ongoing costs of investing in other mutual funds.
Analyzing Your Fund's Expenses
To illustrate these ongoing costs, we have provided examples and calculated the expenses paid by investors in each share class of the Fund during the period. The actual and hypothetical information in the table is based on an initial investment of $1,000 at the beginning of the period indicated and held for the entire period. Expense information is calculated two ways and each method provides you with different information. The amount listed in the "Actual" column is calculated using the Fund's actual operating expenses and total return for the period. You may use the Actual information, together with the amount invested, to estimate the expenses that you paid over the period. Simply divide your account value by $1,000 (for example, an $8,600 account value divided by $1,000 = 8.6), then multiply the results by the expenses paid during the period under the Actual column. The amount listed in the "Hypothetical" column assumes a 5% annual rate of return before expenses (which is not the Fund's actual return) and then applies the Fund's actual expense ratio for the period to the hypothetical return. You should not use the hypothetical account values and expenses to estimate either your actual account balance at the end of the period or the expenses you paid during the period. See "Compare With Other Funds" below for details on how to use the hypothetical data.
Compare With Other Funds
Since all mutual funds are required to include the same hypothetical calculations about expenses in shareholder reports, you can use this information to compare the ongoing cost of investing in the Fund with other funds. To do so, compare the hypothetical example with the 5% hypothetical examples that appear in the shareholder reports of other funds. As you compare hypothetical examples of other funds, it is important to note that hypothetical examples are meant to highlight the ongoing costs of investing in a fund only and do not reflect any transaction costs, such as sales charges, or redemption or exchange fees. Therefore, the hypothetical calculations are useful in comparing ongoing costs only, and will not help you determine the relative total costs of owning different funds. If transaction costs were included in these calculations, your costs would be higher.
March 1, 2013 – August 31, 2013
| | Account Value at the Beginning
of the Period ($) | | Account Value at the End of the
Period ($) | | Expenses Paid During the
Period ($) | | Fund's Annualized
Expense Ratio (%) | |
| | Actual | | Hypothetical | | Actual | | Hypothetical | | Actual | | Hypothetical | | Actual | |
Class A | | | 1,000.00 | | | | 1,000.00 | | | | 1,155.30 | | | | 1,018.50 | | | | 7.08 | | | | 6.63 | | | | 1.31 | | |
Class B | | | 1,000.00 | | | | 1,000.00 | | | | 1,151.20 | | | | 1,014.74 | | | | 11.11 | | | | 10.40 | | | | 2.06 | | |
Class C | | | 1,000.00 | | | | 1,000.00 | | | | 1,151.20 | | | | 1,014.74 | | | | 11.11 | | | | 10.40 | | | | 2.06 | | |
Class I | | | 1,000.00 | | | | 1,000.00 | | | | 1,157.90 | | | | 1,020.76 | | | | 4.65 | | | | 4.36 | | | | 0.86 | | |
Class K | | | 1,000.00 | | | | 1,000.00 | | | | 1,156.10 | | | | 1,019.25 | | | | 6.24 | | | | 5.87 | | | | 1.16 | | |
Class R | | | 1,000.00 | | | | 1,000.00 | | | | 1,154.10 | | | | 1,017.25 | | | | 8.42 | | | | 7.89 | | | | 1.56 | | |
Class R4 | | | 1,000.00 | | | | 1,000.00 | | | | 1,156.80 | | | | 1,019.60 | | | | 5.89 | | | | 5.52 | | | | 1.09 | | |
Class R5 | | | 1,000.00 | | | | 1,000.00 | | | | 1,157.80 | | | | 1,020.41 | | | | 5.00 | | | | 4.71 | | | | 0.93 | | |
Class Y | | | 1,000.00 | | | | 1,000.00 | | | | 1,157.90 | | | | 1,020.76 | | | | 4.65 | | | | 4.36 | | | | 0.86 | | |
Class Z | | | 1,000.00 | | | | 1,000.00 | | | | 1,156.50 | | | | 1,019.75 | | | | 5.73 | | | | 5.37 | | | | 1.06 | | |
Expenses paid during the period are equal to the annualized expense ratio for each class as indicated above, multiplied by the average account value over the period and then multiplied by the number of days in the Fund's most recent fiscal half year and divided by 365.
Expenses do not include fees and expenses incurred indirectly by the Fund from the underlying funds in which the Fund may invest (also referred to as "acquired funds"), including affiliated and non-affiliated pooled investment vehicles (including mutual funds and exchange-traded funds).
Annual Report 2013
6
Columbia Small Cap Growth Fund I
Portfolio of Investments
August 31, 2013
(Percentages represent value of investments compared to net assets)
Common Stocks 97.7%
Issuer | | Shares | | Value ($) | |
Consumer Discretionary 21.0% | |
Diversified Consumer Services 2.5% | |
LifeLock, Inc.(a) | | | 1,985,000 | | | | 25,030,850 | | |
Outerwall, Inc.(a) | | | 153,400 | | | | 9,536,878 | | |
Total | | | | | 34,567,728 | | |
Hotels, Restaurants & Leisure 4.5% | |
Bloomin' Brands, Inc.(a) | | | 289,927 | | | | 6,523,357 | | |
Diamond Resorts International, Inc.(a) | | | 927,182 | | | | 15,057,436 | | |
Domino's Pizza, Inc. | | | 417,317 | | | | 25,639,956 | | |
Six Flags Entertainment Corp. | | | 442,680 | | | | 14,612,867 | | |
Total | | | | | 61,833,616 | | |
Leisure Equipment & Products 0.8% | |
Brunswick Corp. | | | 289,309 | | | | 10,519,275 | | |
Media 1.6% | |
IMAX Corp.(a) | | | 390,700 | | | | 10,720,808 | | |
Nexstar Broadcasting Group, Inc., Class A | | | 326,552 | | | | 10,962,351 | | |
Total | | | | | 21,683,159 | | |
Specialty Retail 9.4% | |
Cabela's, Inc.(a) | | | 110,313 | | | | 7,228,811 | | |
Conn's, Inc.(a) | | | 378,003 | | | | 25,178,780 | | |
GameStop Corp., Class A | | | 460,000 | | | | 23,096,600 | | |
Lumber Liquidators Holdings, Inc.(a) | | | 271,562 | | | | 26,998,694 | | |
Select Comfort Corp.(a) | | | 1,414,600 | | | | 34,940,620 | | |
Tile Shop Holdings, Inc.(a) | | | 462,392 | | | | 12,285,755 | | |
Total | | | | | 129,729,260 | | |
Textiles, Apparel & Luxury Goods 2.2% | |
Fifth & Pacific Companies, Inc.(a) | | | 915,100 | | | | 21,815,984 | | |
Tumi Holdings, Inc.(a) | | | 457,810 | | | | 9,412,574 | | |
Total | | | | | 31,228,558 | | |
Total Consumer Discretionary | | | | | 289,561,596 | | |
Consumer Staples 1.8% | |
Food & Staples Retailing 0.8% | |
Natural Grocers by Vitamin Cottage, Inc.(a) | | | 126,142 | | | | 4,862,774 | | |
Susser Holdings Corp.(a) | | | 112,524 | | | | 5,368,520 | | |
Total | | | | | 10,231,294 | | |
Food Products 0.6% | |
TreeHouse Foods, Inc.(a) | | | 134,200 | | | | 8,727,026 | | |
Common Stocks (continued)
Issuer | | Shares | | Value ($) | |
Personal Products 0.4% | |
Elizabeth Arden, Inc.(a) | | | 149,375 | | | | 5,187,794 | | |
Total Consumer Staples | | | | | 24,146,114 | | |
Energy 3.8% | |
Energy Equipment & Services 0.4% | |
Forum Energy Technologies, Inc.(a) | | | 231,297 | | | | 6,053,043 | | |
Oil, Gas & Consumable Fuels 3.4% | |
Carrizo Oil & Gas, Inc.(a) | | | 322,314 | | | | 11,042,478 | | |
Energy XXI Bermuda Ltd. | | | 262,636 | | | | 6,978,238 | | |
Oasis Petroleum, Inc.(a) | | | 241,328 | | | | 9,460,058 | | |
PDC Energy, Inc.(a) | | | 134,167 | | | | 7,698,502 | | |
Western Refining, Inc. | | | 384,055 | | | | 11,264,333 | | |
Total | | | | | 46,443,609 | | |
Total Energy | | | | | 52,496,652 | | |
Financials 5.1% | |
Capital Markets 0.2% | |
WisdomTree Investments, Inc.(a) | | | 302,000 | | | | 3,382,400 | | |
Commercial Banks 1.5% | |
BankUnited, Inc. | | | 283,000 | | | | 8,362,650 | | |
Signature Bank(a) | | | 140,488 | | | | 12,323,607 | | |
Total | | | | | 20,686,257 | | |
Consumer Finance 1.6% | |
Portfolio Recovery Associates, Inc.(a) | | | 411,678 | | | | 21,835,401 | | |
Real Estate Investment Trusts (REITs) 1.8% | |
DiamondRock Hospitality Co. | | | 1,665,853 | | | | 16,142,116 | | |
Summit Hotel Properties, Inc. | | | 930,315 | | | | 8,875,205 | | |
Total | | | | | 25,017,321 | | |
Total Financials | | | | | 70,921,379 | | |
Health Care 23.8% | |
Biotechnology 7.7% | |
Alnylam Pharmaceuticals, Inc.(a) | | | 372,560 | | | | 19,298,608 | | |
Ariad Pharmaceuticals, Inc.(a) | | | 676,553 | | | | 12,583,886 | | |
Astex Pharmaceuticals(a) | | | 983,900 | | | | 6,444,545 | | |
Bluebird Bio, Inc.(a) | | | 268,273 | | | | 6,679,998 | | |
Infinity Pharmaceuticals, Inc.(a) | | | 662,120 | | | | 12,255,841 | | |
Insmed, Inc.(a) | | | 391,400 | | | | 5,953,194 | | |
Keryx Biopharmaceuticals, Inc.(a) | | | 1,473,219 | | | | 12,566,558 | | |
The accompanying Notes to Financial Statements are an integral part of this statement.
Annual Report 2013
7
Columbia Small Cap Growth Fund I
Portfolio of Investments (continued)
August 31, 2013
Common Stocks (continued)
Issuer | | Shares | | Value ($) | |
Pharmacyclics, Inc.(a) | | | 66,700 | | | | 7,437,050 | | |
Prosensa Holding NV(a) | | | 309,963 | | | | 7,057,857 | | |
Sarepta Therapeutics, Inc.(a) | | | 146,986 | | | | 5,016,632 | | |
TESARO, Inc.(a) | | | 334,096 | | | | 11,553,040 | | |
Total | | | | | 106,847,209 | | |
Health Care Equipment & Supplies 5.8% | |
Align Technology, Inc.(a) | | | 501,746 | | | | 21,851,038 | | |
Cerus Corp.(a) | | | 1,241,067 | | | | 6,490,781 | | |
Endologix, Inc.(a) | | | 355,679 | | | | 5,626,842 | | |
HeartWare International, Inc.(a) | | | 130,992 | | | | 10,295,971 | | |
Insulet Corp.(a) | | | 419,096 | | | | 13,972,661 | | |
NxStage Medical, Inc.(a) | | | 867,118 | | | | 10,708,907 | | |
TearLab Corp.(a) | | | 845,066 | | | | 11,104,167 | | |
Total | | | | | 80,050,367 | | |
Health Care Providers & Services 4.0% | |
Air Methods Corp. | | | 409,600 | | | | 16,760,832 | | |
Brookdale Senior Living, Inc.(a) | | | 892,088 | | | | 22,320,042 | | |
ExamWorks Group, Inc.(a) | | | 268,400 | | | | 6,307,400 | | |
IPC The Hospitalist Co., Inc.(a) | | | 193,969 | | | | 9,977,765 | | |
Total | | | | | 55,366,039 | | |
Health Care Technology 3.2% | |
athenahealth, Inc.(a) | | | 106,193 | | | | 11,202,300 | | |
HMS Holdings Corp.(a) | | | 947,775 | | | | 23,684,897 | | |
Vocera Communications, Inc. (a) | | | 563,701 | | | | 9,137,593 | | |
Total | | | | | 44,024,790 | | |
Life Sciences Tools & Services 1.2% | |
ICON PLC(a) | | | 464,274 | | | | 16,964,572 | | |
Pharmaceuticals 1.9% | |
Impax Laboratories, Inc.(a) | | | 533,570 | | | | 10,874,157 | | |
Jazz Pharmaceuticals PLC(a) | | | 98,551 | | | | 8,641,937 | | |
Pacira Pharmaceuticals, Inc.(a) | | | 171,600 | | | | 6,215,352 | | |
Total | | | | | 25,731,446 | | |
Total Health Care | | | | | 328,984,423 | | |
Industrials 13.8% | |
Airlines 2.7% | |
Alaska Air Group, Inc. | | | 208,288 | | | | 11,793,267 | | |
U.S. Airways Group, Inc.(a) | | | 1,547,157 | | | | 25,002,057 | | |
Total | | | | | 36,795,324 | | |
Common Stocks (continued)
Issuer | | Shares | | Value ($) | |
Electrical Equipment 1.8% | |
Acuity Brands, Inc. | | | 290,274 | | | | 24,818,427 | | |
Machinery 2.5% | |
Chart Industries, Inc.(a) | | | 60,145 | | | | 6,867,356 | | |
Manitowoc Co., Inc. (The) | | | 501,200 | | | | 10,013,976 | | |
Middleby Corp. (The)(a) | | | 94,500 | | | | 17,571,330 | | |
Total | | | | | 34,452,662 | | |
Marine 0.4% | |
Costamare, Inc. | | | 305,061 | | | | 5,210,442 | | |
Professional Services 2.0% | |
Advisory Board Co. (The)(a) | | | 128,016 | | | | 7,011,436 | | |
TrueBlue, Inc.(a) | | | 366,600 | | | | 8,915,712 | | |
Wageworks, Inc.(a) | | | 279,811 | | | | 11,679,311 | | |
Total | | | | | 27,606,459 | | |
Road & Rail 2.9% | |
Avis Budget Group, Inc.(a) | | | 290,329 | | | | 7,772,107 | | |
Landstar System, Inc. | | | 186,800 | | | | 10,208,620 | | |
Roadrunner Transportation Systems, Inc.(a) | | | 516,872 | | | | 14,017,569 | | |
Swift Transportation Co.(a) | | | 451,700 | | | | 8,112,532 | | |
Total | | | | | 40,110,828 | | |
Trading Companies & Distributors 1.5% | |
United Rentals, Inc.(a) | | | 384,169 | | | | 21,040,936 | | |
Total Industrials | | | | | 190,035,078 | | |
Information Technology 24.9% | |
Electronic Equipment, Instruments & Components 1.3% | |
Cognex Corp. | | | 182,415 | | | | 10,394,007 | | |
FEI Co. | | | 96,300 | | | | 7,538,364 | | |
Total | | | | | 17,932,371 | | |
Internet Software & Services 9.5% | |
ChannelAdvisor Corp.(a) | | | 85,520 | | | | 2,618,622 | | |
Cornerstone OnDemand, Inc.(a) | | | 248,739 | | | | 12,812,546 | | |
CoStar Group, Inc.(a) | | | 152,976 | | | | 22,718,466 | | |
Gogo, Inc.(a) | | | 69,760 | | | | 788,288 | | |
OpenTable, Inc.(a) | | | 150,800 | | | | 11,240,632 | | |
Pandora Media, Inc.(a) | | | 1,076,700 | | | | 19,832,814 | | |
Shutterstock, Inc.(a) | | | 151,042 | | | | 7,497,725 | | |
Trulia, Inc.(a) | | | 410,469 | | | | 17,042,673 | | |
Yelp, Inc.(a) | | | 709,698 | | | | 36,890,102 | | |
Total | | | | | 131,441,868 | | |
The accompanying Notes to Financial Statements are an integral part of this statement.
Annual Report 2013
8
Columbia Small Cap Growth Fund I
Portfolio of Investments (continued)
August 31, 2013
Common Stocks (continued)
Issuer | | Shares | | Value ($) | |
IT Services 2.8% | |
Acxiom Corp.(a) | | | 334,500 | | | | 8,322,360 | | |
Cardtronics, Inc.(a) | | | 176,763 | | | | 6,131,908 | | |
MAXIMUS, Inc. | | | 378,300 | | | | 14,190,033 | | |
WEX, Inc.(a) | | | 135,954 | | | | 10,880,399 | | |
Total | | | | | 39,524,700 | | |
Semiconductors & Semiconductor Equipment 0.8% | |
EZchip Semiconductor Ltd.(a) | | | 95,373 | | | | 2,718,130 | | |
Formfactor, Inc.(a) | | | 356,100 | | | | 2,161,527 | | |
GT Advanced Technologies, Inc.(a) | | | 625,900 | | | | 4,043,314 | | |
Rambus, Inc.(a) | | | 217,600 | | | | 1,775,616 | | |
Total | | | | | 10,698,587 | | |
Software 10.5% | |
Aspen Technology, Inc.(a) | | | 628,339 | | | | 21,005,373 | | |
CommVault Systems, Inc.(a) | | | 190,846 | | | | 15,998,620 | | |
Guidewire Software, Inc.(a) | | | 236,030 | | | | 10,847,939 | | |
Imperva, Inc.(a) | | | 150,659 | | | | 7,111,105 | | |
Infoblox, Inc.(a) | | | 432,577 | | | | 15,096,937 | | |
Proofpoint, Inc.(a) | | | 300,184 | | | | 8,648,301 | | |
PTC, Inc.(a) | | | 182,900 | | | | 4,768,203 | | |
QLIK Technologies, Inc.(a) | | | 220,075 | | | | 7,216,259 | | |
Splunk, Inc.(a) | | | 234,404 | | | | 12,941,445 | | |
TiVo, Inc.(a) | | | 1,071,022 | | | | 12,498,827 | | |
Tyler Technologies, Inc.(a) | | | 152,841 | | | | 11,293,421 | | |
Ultimate Software Group, Inc.(a) | | | 124,150 | | | | 17,407,072 | | |
Total | | | | | 144,833,502 | | |
Total Information Technology | | | | | 344,431,028 | | |
Materials 1.6% | |
Construction Materials 1.6% | |
Eagle Materials, Inc. | | | 349,705 | | | | 22,437,073 | | |
Total Materials | | | | | 22,437,073 | | |
Common Stocks (continued)
Issuer | | Shares | | Value ($) | |
Telecommunication Services 1.9% | |
Diversified Telecommunication Services 1.9% | |
Cogent Communications Group, Inc. | | | 633,172 | | | | 19,647,327 | | |
inContact, Inc.(a) | | | 826,400 | | | | 6,718,632 | | |
Total | | | | | 26,365,959 | | |
Total Telecommunication Services | | | | | 26,365,959 | | |
Total Common Stocks
(Cost: $1,020,847,087) | | | | | 1,349,379,302 | | |
Warrants —%
Energy —% | |
Oil, Gas & Consumable Fuels —% | |
Magnum Hunter Resources Corp.(a) | | | 111,329 | | | | 13,081 | | |
Total Energy | | | | | 13,081 | | |
Total Warrants
(Cost: $93,775) | | | | | 13,081 | | |
Money Market Funds 2.3%
| | Shares | | Value ($) | |
Columbia Short-Term Cash Fund,
0.097%(b)(c) | | | 32,016,170 | | | | 32,016,170 | | |
Total Money Market Funds
(Cost: $32,016,170) | | | | | 32,016,170 | | |
Total Investments
(Cost: $1,052,957,032) | | | | | 1,381,408,553 | | |
Other Assets & Liabilities, Net | | | | | 355,484 | | |
Net Assets | | | | | 1,381,764,037 | | |
The accompanying Notes to Financial Statements are an integral part of this statement.
Annual Report 2013
9
Columbia Small Cap Growth Fund I
Portfolio of Investments (continued)
August 31, 2013
Notes to Portfolio of Investments
(a) Non-income producing.
(b) The rate shown is the seven-day current annualized yield at August 31, 2013.
(c) As defined in the Investment Company Act of 1940, an affiliated company is one in which the Fund owns 5% or more of its outstanding voting securities, or a company which is under common ownership or control with the Fund. Holdings and transactions in these affiliated companies during the year ended August 31, 2013, are as follows:
Issuer | | Beginning
Cost ($) | | Purchase
Cost ($) | | Proceeds
From Sales ($) | | Ending
Cost ($) | | Dividends —
Affiliated
Issuers ($) | | Value ($) | |
Columbia Short-Term Cash Fund | | | 9,046,846 | | | | 527,363,151 | | | | (504,393,827 | ) | | | 32,016,170 | | | | 34,499 | | | | 32,016,170 | | |
Fair Value Measurements
Generally accepted accounting principles (GAAP) require disclosure regarding the inputs and valuation techniques used to measure fair value and any changes in valuation inputs or techniques. In addition, investments shall be disclosed by major category.
The Fund categorizes its fair value measurements according to a three-level hierarchy that maximizes the use of observable inputs and minimizes the use of unobservable inputs by prioritizing that the most observable input be used when available. Observable inputs are those that market participants would use in pricing an investment based on market data obtained from sources independent of the reporting entity. Unobservable inputs are those that reflect the Fund's assumptions about the information market participants would use in pricing an investment. An investment's level within the fair value hierarchy is based on the lowest level of any input that is deemed significant to the asset or liability's fair value measurement. The input levels are not necessarily an indication of the risk or liquidity associated with investments at that level. For example, certain U.S. government securities are generally high quality and liquid, however, they are reflected as Level 2 because the inputs used to determine fair value may not always be quoted prices in an active market. Fair value inputs are summarized in the three broad levels listed below:
> Level 1 — Valuations based on quoted prices for investments in active markets that the Fund has the ability to access at the measurement date (including NAV for open-end mutual funds). Valuation adjustments are not applied to Level 1 investments.
> Level 2 — Valuations based on other significant observable inputs (including quoted prices for similar securities, interest rates, prepayment speeds, credit risks, etc.).
> Level 3 — Valuations based on significant unobservable inputs (including the Fund's own assumptions and judgment in determining the fair value of investments).
Inputs that are used in determining fair value of an investment may include price information, credit data, volatility statistics, and other factors. These inputs can be either observable or unobservable. The availability of observable inputs can vary between investments, and is affected by various factors such as the type of investment, and the volume and level of activity for that investment or similar investments in the marketplace. The inputs will be considered by the Investment Manager, along with any other relevant factors in the calculation of an investment's fair value. The Fund uses prices and inputs that are current as of the measurement date, which may include periods of market dislocations. During these periods, the availability of prices and inputs may be reduced for many investments. This condition could cause an investment to be reclassified between the various levels within the hierarchy.
Investments falling into the Level 3 category are primarily supported by quoted prices from brokers and dealers participating in the market for those investments. However, these may be classified as Level 3 investments due to lack of market transparency and corroboration to support these quoted prices. Additionally, valuation models may be used as the pricing source for any remaining investments classified as Level 3. These models may rely on one or more significant unobservable inputs and/or significant assumptions by the Investment Manager. Inputs used in valuations may include, but are not limited to, financial statement analysis, capital account balances, discount rates and estimated cash flows, and comparable company data.
Under the direction of the Fund's Board of Trustees (the Board), the Investment Manager's Valuation Committee (the Committee) is responsible for carrying out the valuation procedures approved by the Board. The Committee consists of voting and non-voting members from various groups within the Investment Manager's organization, including operations and accounting, trading and investments, compliance, risk management and legal.
The Committee meets at least monthly to review and approve valuation matters, which may include a description of specific valuation determinations, data regarding pricing information received from approved pricing vendors and brokers and the results of Board-approved valuation control policies and procedures (the Policies). The Policies address, among other things, instances when market quotations are or are not readily available, including recommendations of third party pricing vendors and a determination of appropriate pricing methodologies; events that require specific valuation determinations and assessment of fair value techniques; securities with a potential for stale pricing, including those that are illiquid, restricted, or in default; and the effectiveness of third-party pricing vendors, including periodic reviews of vendors. The Committee meets more frequently, as needed, to discuss additional valuation matters, which may include the need to review back-testing results, review time-sensitive information or approve related valuation actions. The Committee reports to the Board, with members of the Committee meeting with the Board at each of its regularly scheduled meetings to discuss valuation matters and actions during the period, similar to those described earlier.
The accompanying Notes to Financial Statements are an integral part of this statement.
Annual Report 2013
10
Columbia Small Cap Growth Fund I
Portfolio of Investments (continued)
August 31, 2013
Fair Value Measurements (continued)
For investments categorized as Level 3, the Committee monitors information similar to that described above, which may include: (i) data specific to the issuer or comparable issuers, (ii) general market or specific sector news and (iii) quoted prices and specific or similar security transactions. The Committee considers this data and any changes from prior periods in order to assess the reasonableness of observable and unobservable inputs, any assumptions or internal models used to value those securities and changes in fair value. This data is also used to corroborate, when available, information received from approved pricing vendors and brokers. Various factors impact the frequency of monitoring this information (which may occur as often as daily). However, the Committee may determine that changes to inputs, assumptions and models are not required as a result of the monitoring procedures performed.
The following table is a summary of the inputs used to value the Fund's investments at August 31, 2013:
Description | | Level 1
Quoted Prices in Active
Markets for Identical
Assets ($) | |
Level 2
Other Significant
Observable Inputs ($) | |
Level 3
Significant
Unobservable Inputs ($) | |
Total ($) | |
Equity Securities | |
Common Stocks | |
Consumer Discretionary | | | 289,561,596 | | | | — | | | | — | | | | 289,561,596 | | |
Consumer Staples | | | 24,146,114 | | | | — | | | | — | | | | 24,146,114 | | |
Energy | | | 52,496,652 | | | | — | | | | — | | | | 52,496,652 | | |
Financials | | | 70,921,379 | | | | — | | | | — | | | | 70,921,379 | | |
Health Care | | | 328,984,423 | | | | — | | | | — | | | | 328,984,423 | | |
Industrials | | | 190,035,078 | | | | — | | | | — | | | | 190,035,078 | | |
Information Technology | | | 344,431,028 | | | | — | | | | — | | | | 344,431,028 | | |
Materials | | | 22,437,073 | | | | — | | | | — | | | | 22,437,073 | | |
Telecommunication Services | | | 26,365,959 | | | | — | | | | — | | | | 26,365,959 | | |
Warrants | |
Energy | | | 13,081 | | | | — | | | | — | | | | 13,081 | | |
Total Equity Securities | | | 1,349,392,383 | | | | — | | | | — | | | | 1,349,392,383 | | |
Mutual Funds | |
Money Market Funds | | | 32,016,170 | | | | — | | | | — | | | | 32,016,170 | | |
Total Mutual Funds | | | 32,016,170 | | | | — | | | | — | | | | 32,016,170 | | |
Total | | | 1,381,408,553 | | | | — | | | | — | | | | 1,381,408,553 | | |
See the Portfolio of Investments for all investment classifications not indicated in the table.
Financial assets were transferred from Level 2 to Level 1 as the market for these assets was deemed to be active during the period and fair values were consequently obtained using quoted prices for identical assets rather than being based upon other observable market inputs as of period end.
The following table shows transfers between Level 1 and Level 2 of the fair value hierarchy:
Transfers In | | Transfers Out | |
| Level 1 ($) | | Level 2 ($) | | Level 1 ($) | | Level 2 ($) | |
| | 13,081 | | | | — | | | | — | | | | (13,081 | ) | |
Transfers between Level 1 and Level 2 are determined based on the fair value at the beginning of the period for security positions held throughout the period.
The accompanying Notes to Financial Statements are an integral part of this statement.
Annual Report 2013
11
Columbia Small Cap Growth Fund I
Statement of Assets and Liabilities
August 31, 2013
Assets | |
Investments, at value | |
Unaffiliated issuers (identified cost $1,020,940,862) | | $ | 1,349,392,383 | | |
Affiliated issuers (identified cost $32,016,170) | | | 32,016,170 | | |
Total investments (identified cost $1,052,957,032) | | | 1,381,408,553 | | |
Receivable for: | |
Investments sold | | | 13,928,531 | | |
Capital shares sold | | | 349,666 | | |
Dividends | | | 466,761 | | |
Prepaid expenses | | | 15,883 | | |
Trustees' deferred compensation plan | | | 74,485 | | |
Total assets | | | 1,396,243,879 | | |
Liabilities | |
Payable for: | |
Investments purchased | | | 12,532,169 | | |
Capital shares purchased | | | 1,398,577 | | |
Investment management fees | | | 28,681 | | |
Distribution and/or service fees | | | 2,547 | | |
Transfer agent fees | | | 260,179 | | |
Administration fees | | | 2,889 | | |
Plan administration fees | | | 10 | | |
Compensation of board members | | | 64,103 | | |
Chief compliance officer expenses | | | 133 | | |
Other expenses | | | 116,069 | | |
Trustees' deferred compensation plan | | | 74,485 | | |
Total liabilities | | | 14,479,842 | | |
Net assets applicable to outstanding capital stock | | $ | 1,381,764,037 | | |
Represented by | |
Paid-in capital | | $ | 933,631,186 | | |
Excess of distributions over net investment income | | | (139,347 | ) | |
Accumulated net realized gain | | | 119,820,677 | | |
Unrealized appreciation (depreciation) on: | |
Investments | | | 328,451,521 | | |
Total — representing net assets applicable to outstanding capital stock | | $ | 1,381,764,037 | | |
The accompanying Notes to Financial Statements are an integral part of this statement.
Annual Report 2013
12
Columbia Small Cap Growth Fund I
Statement of Assets and Liabilities (continued)
August 31, 2013
Class A | |
Net assets | | $ | 254,054,862 | | |
Shares outstanding | | | 7,625,359 | | |
Net asset value per share | | $ | 33.32 | | |
Maximum offering price per share(a) | | $ | 35.35 | | |
Class B | |
Net assets | | $ | 3,874,402 | | |
Shares outstanding | | | 123,240 | | |
Net asset value per share | | $ | 31.44 | | |
Class C | |
Net assets | | $ | 22,685,107 | | |
Shares outstanding | | | 721,588 | | |
Net asset value per share | | $ | 31.44 | | |
Class I | |
Net assets | | $ | 77,982,749 | | |
Shares outstanding | | | 2,287,047 | | |
Net asset value per share | | $ | 34.10 | | |
Class K | |
Net assets | | $ | 48,121 | | |
Shares outstanding | | | 1,422 | | |
Net asset value per share(b) | | $ | 33.85 | | |
Class R | |
Net assets | | $ | 3,649,761 | | |
Shares outstanding | | | 110,011 | | |
Net asset value per share | | $ | 33.18 | | |
Class R4 | |
Net assets | | $ | 818,300 | | |
Shares outstanding | | | 23,706 | | |
Net asset value per share | | $ | 34.52 | | |
Class R5 | |
Net assets | | $ | 1,145,129 | | |
Shares outstanding | | | 33,782 | | |
Net asset value per share | | $ | 33.90 | | |
Class Y | |
Net assets | | $ | 14,816,936 | | |
Shares outstanding | | | 434,695 | | |
Net asset value per share | | $ | 34.09 | | |
Class Z | |
Net assets | | $ | 1,002,688,670 | | |
Shares outstanding | | | 29,565,647 | | |
Net asset value per share | | $ | 33.91 | | |
(a) The maximum offering price per share is calculated by dividing the net asset value per share by 1.0 minus the maximum sales charge of 5.75%.
(b) Net asset value per share rounds to this amount due to fractional shares outstanding.
The accompanying Notes to Financial Statements are an integral part of this statement.
Annual Report 2013
13
Columbia Small Cap Growth Fund I
Statement of Operations
Year Ended August 31, 2013
Net investment income | |
Income: | |
Dividends — unaffiliated issuers | | $ | 7,895,885 | | |
Dividends — affiliated issuers | | | 34,499 | | |
Income from securities lending — net | | | 289,473 | | |
Total income | | | 8,219,857 | | |
Expenses: | |
Investment management fees | | | 8,867,134 | | |
Distribution and/or service fees | |
Class A | | | 365,352 | | |
Class B | | | 26,104 | | |
Class C | | | 161,757 | | |
Class R | | | 8,540 | | |
Transfer agent fees | |
Class A | | | 288,882 | | |
Class B | | | 5,158 | | |
Class C | | | 31,909 | | |
Class K(a) | | | 11 | | |
Class R | | | 3,387 | | |
Class R4(b) | | | 317 | | |
Class R5(a) | | | 146 | | |
Class Y | | | 4 | | |
Class Z | | | 1,770,276 | | |
Administration fees | | | 894,140 | | |
Plan administration fees | |
Class K(a) | | | 53 | | |
Compensation of board members | | | 46,993 | | |
Custodian fees | | | 27,483 | | |
Printing and postage fees | | | 192,402 | | |
Registration fees | | | 27,854 | | |
Professional fees | | | 82,702 | | |
Chief compliance officer expenses | | | 749 | | |
Other | | | 56,319 | | |
Total expenses | | | 12,857,672 | | |
Fees waived or expenses reimbursed by Investment Manager and its affiliates | | | (53,467 | ) | |
Expense reductions | | | (17,963 | ) | |
Total net expenses | | | 12,786,242 | | |
Net investment loss | | | (4,566,385 | ) | |
Realized and unrealized gain (loss) — net | |
Net realized gain (loss) on: | |
Investments | | | 156,044,989 | | |
Foreign currency translations | | | (2,856 | ) | |
Net realized gain | | | 156,042,133 | | |
Net change in unrealized appreciation (depreciation) on: | |
Investments | | | 108,861,988 | | |
Foreign currency translations | | | 394 | | |
Net change in unrealized appreciation (depreciation) | | | 108,862,382 | | |
Net realized and unrealized gain | | | 264,904,515 | | |
Net increase in net assets resulting from operations | | $ | 260,338,130 | | |
(a) Class K and R5 shares are for the period from February 28, 2013 (commencement of operations) to August 31, 2013.
(b) Class R4 shares are for the period from November 8, 2012 (commencement of operations) to August 31, 2013.
The accompanying Notes to Financial Statements are an integral part of this statement.
Annual Report 2013
14
Columbia Small Cap Growth Fund I
Statement of Changes in Net Assets
| | | Year Ended
August 31,
2013(a) | | Year Ended
August 31,
2012 | |
Operations | |
Net investment loss | | $ | (4,566,385 | ) | | $ | (2,900,575 | ) | |
Net realized gain | | | 156,042,133 | | | | 88,810,985 | | |
Net change in unrealized appreciation (depreciation) | | | 108,862,382 | | | | 1,928,299 | | |
Net increase in net assets resulting from operations | | | 260,338,130 | | | | 87,838,709 | | |
Distributions to shareholders | |
Net realized gains | |
Class A | | | (5,725,926 | ) | | | (8,033,542 | ) | |
Class B | | | (137,440 | ) | | | (165,165 | ) | |
Class C | | | (1,044,679 | ) | | | (1,317,176 | ) | |
Class I | | | (8,663,850 | ) | | | (6,933,914 | ) | |
Class R | | | (5,009 | ) | | | (5,346 | ) | |
Class R4 | | | (249 | ) | | | — | | |
Class Y | | | (1,221,162 | ) | | | (1,103,193 | ) | |
Class Z | | | (78,109,613 | ) | | | (85,995,735 | ) | |
Total distributions to shareholders | | | (94,907,928 | ) | | | (103,554,071 | ) | |
Increase (decrease) in net assets from capital stock activity | | | 199,118,514 | | | | (129,402,633 | ) | |
Total increase (decrease) in net assets | | | 364,548,716 | | | | (145,117,995 | ) | |
Net assets at beginning of year | | | 1,017,215,321 | | | | 1,162,333,316 | | |
Net assets at end of year | | $ | 1,381,764,037 | | | $ | 1,017,215,321 | | |
Excess of distributions over net investment income | | $ | (139,347 | ) | | $ | (2,815,813 | ) | |
(a) Class R4 shares are for the period from November 8, 2012 (commencement of operations) to August 31, 2013.
The accompanying Notes to Financial Statements are an integral part of this statement.
Annual Report 2013
15
Columbia Small Cap Growth Fund I
Statement of Changes in Net Assets (continued)
| | | Year Ended August 31, 2013(a)(b) | | Year Ended August 31, 2012 | |
| | | Shares | | Dollars ($) | | Shares | | Dollars ($) | |
Capital stock activity | |
Class A shares | |
Subscriptions(c) | | | 336,379 | | | | 10,080,801 | | | | 434,890 | | | | 12,391,899 | | |
Fund merger | | | 6,175,881 | | | | 187,024,390 | | | | — | | | | — | | |
Distributions reinvested | | | 209,240 | | | | 5,526,032 | | | | 276,795 | | | | 7,559,280 | | |
Redemptions | | | (1,161,867 | ) | | | (35,077,020 | ) | | | (1,692,890 | ) | | | (48,465,439 | ) | |
Net increase (decrease) | | | 5,559,633 | | | | 167,554,203 | | | | (981,205 | ) | | | (28,514,260 | ) | |
Class B shares | |
Subscriptions | | | 836 | | | | 23,244 | | | | 689 | | | | 18,573 | | |
Fund merger | | | 101,039 | | | | 2,896,869 | | | | — | | | | — | | |
Distributions reinvested | | | 4,944 | | | | 123,890 | | | | 5,639 | | | | 147,736 | | |
Redemptions(c) | | | (34,246 | ) | | | (1,010,071 | ) | | | (24,152 | ) | | | (664,783 | ) | |
Net increase (decrease) | | | 72,573 | | | | 2,033,932 | | | | (17,824 | ) | | | (498,474 | ) | |
Class C shares | |
Subscriptions | | | 20,015 | | | | 550,379 | | | | 22,638 | | | | 619,559 | | |
Fund merger | | | 455,413 | | | | 13,065,291 | | | | — | | | | — | | |
Distributions reinvested | | | 34,201 | | | | 857,082 | | | | 36,659 | | | | 960,467 | | |
Redemptions | | | (188,498 | ) | | | (5,395,282 | ) | | | (209,277 | ) | | | (5,682,212 | ) | |
Net increase (decrease) | | | 321,131 | | | | 9,077,470 | | | | (149,980 | ) | | | (4,102,186 | ) | |
Class I shares | |
Subscriptions | | | 23,673 | | | | 694,023 | | | | 1,398,138 | | | | 42,179,840 | | |
Fund merger | | | 671 | | | | 20,760 | | | | — | | | | — | | |
Distributions reinvested | | | 321,588 | | | | 8,663,577 | | | | 250,131 | | | | 6,933,641 | | |
Redemptions | | | (1,081,237 | ) | | | (35,604,149 | ) | | | (1,585,755 | ) | | | (47,522,973 | ) | |
Net increase (decrease) | | | (735,305 | ) | | | (26,225,789 | ) | | | 62,514 | | | | 1,590,508 | | |
Class K shares | |
Subscriptions | | | 91 | | | | 2,652 | | | | — | | | | — | | |
Fund merger | | | 1,381 | | | | 42,487 | | | | — | | | | — | | |
Redemptions | | | (50 | ) | | | (1,535 | ) | | | — | | | | — | | |
Net increase | | | 1,422 | | | | 43,604 | | | | — | | | | — | | |
Class R shares | |
Subscriptions | | | 11,812 | | | | 379,646 | | | | 471 | | | | 13,483 | | |
Fund merger | | | 126,746 | | | | 3,827,956 | | | | — | | | | — | | |
Distributions reinvested | | | 180 | | | | 4,739 | | | | 186 | | | | 5,089 | | |
Redemptions | | | (30,560 | ) | | | (950,685 | ) | | | (677 | ) | | | (19,707 | ) | |
Net increase (decrease) | | | 108,178 | | | | 3,261,656 | | | | (20 | ) | | | (1,135 | ) | |
Class R4 shares | |
Subscriptions | | | 27,171 | | | | 875,760 | | | | — | | | | — | | |
Redemptions | | | (3,465 | ) | | | (110,695 | ) | | | — | | | | — | | |
Net increase | | | 23,706 | | | | 765,065 | | | | — | | | | — | | |
The accompanying Notes to Financial Statements are an integral part of this statement.
Annual Report 2013
16
Columbia Small Cap Growth Fund I
Statement of Changes in Net Assets (continued)
| | | Year Ended August 31, 2013(a)(b) | | Year Ended August 31, 2012 | |
| | | Shares | | Dollars ($) | | Shares | | Dollars ($) | |
Capital stock activity (continued) | |
Class R5 shares | |
Subscriptions | | | 33,493 | | | | 1,073,014 | | | | — | | | | — | | |
Fund merger | | | 1,039 | | | | 31,968 | | | | — | | | | — | | |
Redemptions | | | (750 | ) | | | (25,942 | ) | | | — | | | | — | | |
Net increase | | | 33,782 | | | | 1,079,040 | | | | — | | | | — | | |
Class Y shares | |
Subscriptions | | | 86 | | | | 2,501 | | | | — | | | | — | | |
Distributions reinvested | | | 45,336 | | | | 1,220,909 | | | | 39,812 | | | | 1,103,193 | | |
Redemptions | | | (26,169 | ) | | | (800,000 | ) | | | (576 | ) | | | (17,161 | ) | |
Net increase | | | 19,253 | | | | 423,410 | | | | 39,236 | | | | 1,086,032 | | |
Class Z shares | |
Subscriptions | | | 3,747,790 | | | | 112,452,889 | | | | 3,767,042 | | | | 108,971,471 | | |
Fund merger | | | 6,383,431 | | | | 196,603,079 | | | | — | | | | — | | |
Distributions reinvested | | | 1,720,127 | | | | 46,151,011 | | | | 1,592,084 | | | | 44,037,051 | | |
Redemptions | | | (10,307,179 | ) | | | (314,101,056 | ) | | | (8,695,502 | ) | | | (251,971,640 | ) | |
Net increase (decrease) | | | 1,544,169 | | | | 41,105,923 | | | | (3,336,376 | ) | | | (98,963,118 | ) | |
Total net increase (decrease) | | | 6,948,542 | | | | 199,118,514 | | | | (4,383,655 | ) | | | (129,402,633 | ) | |
(a) Class K and R5 shares are for the period from February 28, 2013 (commencement of operations) to August 31, 2013.
(b) Class R4 shares are for the period from November 8, 2012 (commencement of operations) to August 31, 2013.
(c) Includes conversions of Class B shares to Class A shares, if any.
The accompanying Notes to Financial Statements are an integral part of this statement.
Annual Report 2013
17
Columbia Small Cap Growth Fund I
The following tables are intended to help you understand the Fund's financial performance. Certain information reflects financial results for a single share of a class held for the periods shown. Per share net investment income (loss) amounts are calculated based on average shares outstanding during the period. Total return assumes reinvestment of all dividends and distributions, if any. Total return does not reflect payment of sales charges, if any, and is not annualized for periods of less than one year.
| | | Year Ended August 31, | |
Class A | | 2013 | | 2012 | | 2011 | | 2010 | | 2009 | |
Per share data | |
Net asset value, beginning of period | | $ | 29.55 | | | $ | 29.94 | | | $ | 23.55 | | | $ | 20.82 | | | $ | 27.82 | | |
Income from investment operations: | |
Net investment loss | | | (0.23 | ) | | | (0.15 | ) | | | (0.31 | ) | | | (0.26 | ) | | | (0.19 | ) | |
Net realized and unrealized gain (loss) | | | 6.90 | | | | 2.56 | | | | 6.70 | | | | 2.99 | | | | (6.81 | ) | |
Total from investment operations | | | 6.67 | | | | 2.41 | | | | 6.39 | | | | 2.73 | | | | (7.00 | ) | |
Less distributions to shareholders: | |
Net realized gains | | | (2.90 | ) | | | (2.80 | ) | | | — | | | | — | | | | — | | |
Total distributions to shareholders | | | (2.90 | ) | | | (2.80 | ) | | | — | | | | — | | | | — | | |
Net asset value, end of period | | $ | 33.32 | | | $ | 29.55 | | | $ | 29.94 | | | $ | 23.55 | | | $ | 20.82 | | |
Total return | | | 25.12 | % | | | 8.81 | % | | | 27.13 | % | | | 13.11 | % | | | (25.16 | %) | |
Ratios to average net assets(a)(b) | |
Total gross expenses | | | 1.31 | % | | | 1.33 | % | | | 1.30 | % | | | 1.32 | %(c) | | | 1.40 | % | |
Total net expenses(d) | | | 1.31 | %(e) | | | 1.31 | %(e) | | | 1.30 | %(e) | | | 1.32 | %(c)(e) | | | 1.37 | %(e) | |
Net investment loss | | | (0.74 | %) | | | (0.53 | %) | | | (1.00 | %) | | | (1.10 | %) | | | (1.01 | %) | |
Supplemental data | |
Net assets, end of period (in thousands) | | $ | 254,055 | | | $ | 61,032 | | | $ | 91,234 | | | $ | 62,261 | | | $ | 54,384 | | |
Portfolio turnover | | | 104 | % | | | 113 | % | | | 113 | % | | | 144 | % | | | 149 | % | |
Notes to Financial Highlights
(a) In addition to the fees and expenses which the Fund bears directly, the Fund indirectly bears a pro rata share of the fees and expenses of the acquired funds in which it invests. Such indirect expenses are not included in the reported expense ratios.
(b) Certain line items from prior years have been reclassified to conform to the current presentation.
(c) Ratios include line of credit interest expense which rounds to less than 0.01%.
(d) Total net expenses include the impact of certain waivers/reimbursements made by the Investment Manager and certain of its affiliates, if applicable.
(e) The benefits derived from expense reductions had an impact of less than 0.01%.
The accompanying Notes to Financial Statements are an integral part of this statement.
Annual Report 2013
18
Columbia Small Cap Growth Fund I
Financial Highlights (continued)
| | | Year Ended August 31, | |
Class B | | 2013 | | 2012 | | 2011 | | 2010 | | 2009 | |
Per share data | |
Net asset value, beginning of period | | $ | 28.19 | | | $ | 28.82 | | | $ | 22.84 | | | $ | 20.35 | | | $ | 27.39 | | |
Income from investment operations: | |
Net investment loss | | | (0.42 | ) | | | (0.35 | ) | | | (0.53 | ) | | | (0.43 | ) | | | (0.32 | ) | |
Net realized and unrealized gain (loss) | | | 6.52 | | | | 2.45 | | | | 6.51 | | | | 2.92 | | | | (6.72 | ) | |
Total from investment operations | | | 6.10 | | | | 2.10 | | | | 5.98 | | | | 2.49 | | | | (7.04 | ) | |
Less distributions to shareholders: | |
Net realized gains | | | (2.85 | ) | | | (2.73 | ) | | | — | | | | — | | | | — | | |
Total distributions to shareholders | | | (2.85 | ) | | | (2.73 | ) | | | — | | | | — | | | | — | | |
Net asset value, end of period | | $ | 31.44 | | | $ | 28.19 | | | $ | 28.82 | | | $ | 22.84 | | | $ | 20.35 | | |
Total return | | | 24.20 | % | | | 7.99 | % | | | 26.18 | % | | | 12.24 | % | | | (25.70 | %) | |
Ratios to average net assets(a)(b) | |
Total gross expenses | | | 2.06 | % | | | 2.08 | % | | | 2.05 | % | | | 2.07 | %(c) | | | 2.15 | % | |
Total net expenses(d) | | | 2.06 | %(e) | | | 2.06 | %(e) | | | 2.05 | %(e) | | | 2.07 | %(c)(e) | | | 2.12 | %(e) | |
Net investment loss | | | (1.46 | %) | | | (1.27 | %) | | | (1.76 | %) | | | (1.84 | %) | | | (1.75 | %) | |
Supplemental data | |
Net assets, end of period (in thousands) | | $ | 3,874 | | | $ | 1,428 | | | $ | 1,974 | | | $ | 2,155 | | | $ | 2,620 | | |
Portfolio turnover | | | 104 | % | | | 113 | % | | | 113 | % | | | 144 | % | | | 149 | % | |
Notes to Financial Highlights
(a) In addition to the fees and expenses which the Fund bears directly, the Fund indirectly bears a pro rata share of the fees and expenses of the acquired funds in which it invests. Such indirect expenses are not included in the reported expense ratios.
(b) Certain line items from prior years have been reclassified to conform to the current presentation.
(c) Ratios include line of credit interest expense which rounds to less than 0.01%.
(d) Total net expenses include the impact of certain waivers/reimbursements made by the Investment Manager and certain of its affiliates, if applicable.
(e) The benefits derived from expense reductions had an impact of less than 0.01%.
The accompanying Notes to Financial Statements are an integral part of this statement.
Annual Report 2013
19
Columbia Small Cap Growth Fund I
Financial Highlights (continued)
| | | Year Ended August 31, | |
Class C | | 2013 | | 2012 | | 2011 | | 2010 | | 2009 | |
Per share data | |
Net asset value, beginning of period | | $ | 28.19 | | | $ | 28.82 | | | $ | 22.84 | | | $ | 20.35 | | | $ | 27.37 | | |
Income from investment operations: | |
Net investment loss | | | (0.41 | ) | | | (0.35 | ) | | | (0.53 | ) | | | (0.44 | ) | | | (0.32 | ) | |
Net realized and unrealized gain (loss) | | | 6.51 | | | | 2.45 | | | | 6.51 | | | | 2.93 | | | | (6.70 | ) | |
Total from investment operations | | | 6.10 | | | | 2.10 | | | | 5.98 | | | | 2.49 | | | | (7.02 | ) | |
Less distributions to shareholders: | |
Net realized gains | | | (2.85 | ) | | | (2.73 | ) | | | — | | | | — | | | | — | | |
Total distributions to shareholders | | | (2.85 | ) | | | (2.73 | ) | | | — | | | | — | | | | — | | |
Net asset value, end of period | | $ | 31.44 | | | $ | 28.19 | | | $ | 28.82 | | | $ | 22.84 | | | $ | 20.35 | | |
Total return | | | 24.20 | % | | | 7.99 | % | | | 26.18 | % | | | 12.24 | % | | | (25.65 | %) | |
Ratios to average net assets(a)(b) | |
Total gross expenses | | | 2.06 | % | | | 2.07 | % | | | 2.05 | % | | | 2.07 | %(c) | | | 2.15 | % | |
Total net expenses(d) | | | 2.06 | %(e) | | | 2.06 | %(e) | | | 2.05 | %(e) | | | 2.07 | %(c)(e) | | | 2.12 | %(e) | |
Net investment loss | | | (1.42 | %) | | | (1.27 | %) | | | (1.75 | %) | | | (1.85 | %) | | | (1.75 | %) | |
Supplemental data | |
Net assets, end of period (in thousands) | | $ | 22,685 | | | $ | 11,287 | | | $ | 15,864 | | | $ | 13,897 | | | $ | 10,093 | | |
Portfolio turnover | | | 104 | % | | | 113 | % | | | 113 | % | | | 144 | % | | | 149 | % | |
Notes to Financial Highlights
(a) In addition to the fees and expenses which the Fund bears directly, the Fund indirectly bears a pro rata share of the fees and expenses of the acquired funds in which it invests. Such indirect expenses are not included in the reported expense ratios.
(b) Certain line items from prior years have been reclassified to conform to the current presentation.
(c) Ratios include line of credit interest expense which rounds to less than 0.01%.
(d) Total net expenses include the impact of certain waivers/reimbursements made by the Investment Manager and certain of its affiliates, if applicable.
(e) The benefits derived from expense reductions had an impact of less than 0.01%.
The accompanying Notes to Financial Statements are an integral part of this statement.
Annual Report 2013
20
Columbia Small Cap Growth Fund I
Financial Highlights (continued)
| | | Year Ended August 31, | |
Class I | | 2013 | | 2012 | | 2011(a) | |
Per share data | |
Net asset value, beginning of period | | $ | 30.09 | | | $ | 30.45 | | | $ | 26.86 | | |
Income from investment operations: | |
Net investment loss | | | (0.04 | ) | | | (0.02 | ) | | | (0.17 | ) | |
Net realized and unrealized gain | | | 6.99 | | | | 2.59 | | | | 3.76 | | |
Total from investment operations | | | 6.95 | | | | 2.57 | | | | 3.59 | | |
Less distributions to shareholders: | |
Net realized gains | | | (2.94 | ) | | | (2.93 | ) | | | — | | |
Total distributions to shareholders | | | (2.94 | ) | | | (2.93 | ) | | | — | | |
Net asset value, end of period | | $ | 34.10 | | | $ | 30.09 | | | $ | 30.45 | | |
Total return | | | 25.69 | % | | | 9.27 | % | | | 13.37 | % | |
Ratios to average net assets(b)(c) | |
Total gross expenses | | | 0.87 | % | | | 0.88 | % | | | 0.88 | %(d) | |
Total net expenses(e) | | | 0.87 | % | | | 0.88 | % | | | 0.88 | %(d)(f) | |
Net investment loss | | | (0.12 | %) | | | (0.06 | %) | | | (0.57 | %)(d) | |
Supplemental data | |
Net assets, end of period (in thousands) | | $ | 77,983 | | | $ | 90,936 | | | $ | 90,132 | | |
Portfolio turnover | | | 104 | % | | | 113 | % | | | 113 | % | |
Notes to Financial Highlights
(a) For the period from September 27, 2010 (commencement of operations) to August 31, 2011.
(b) In addition to the fees and expenses which the Fund bears directly, the Fund indirectly bears a pro rata share of the fees and expenses of the acquired funds in which it invests. Such indirect expenses are not included in the reported expense ratios.
(c) Certain line items from prior years have been reclassified to conform to the current presentation.
(d) Annualized.
(e) Total net expenses include the impact of certain waivers/reimbursements made by the Investment Manager and certain of its affiliates, if applicable.
(f) The benefits derived from expense reductions had an impact of less than 0.01%.
The accompanying Notes to Financial Statements are an integral part of this statement.
Annual Report 2013
21
Columbia Small Cap Growth Fund I
Financial Highlights (continued)
Class K | | Year Ended
August 31,
2013(a) | |
Per share data | |
Net asset value, beginning of period | | $ | 29.28 | | |
Income from investment operations: | |
Net investment loss | | | (0.11 | ) | |
Net realized and unrealized gain | | | 4.68 | | |
Total from investment operations | | | 4.57 | | |
Net asset value, end of period | | $ | 33.85 | | |
Total return | | | 15.61 | % | |
Ratios to average net assets(b) | |
Total gross expenses | | | 1.16 | %(c) | |
Total net expenses(d) | | | 1.16 | %(c) | |
Net investment loss | | | (0.68 | %)(c) | |
Supplemental data | |
Net assets, end of period (in thousands) | | $ | 48 | | |
Portfolio turnover | | | 104 | % | |
Notes to Financial Highlights
(a) For the period from February 28, 2013 (commencement of operations) to August 31, 2013.
(b) In addition to the fees and expenses which the Fund bears directly, the Fund indirectly bears a pro rata share of the fees and expenses of the acquired funds in which it invests. Such indirect expenses are not included in the reported expense ratios.
(c) Annualized.
(d) Total net expenses include the impact of certain waivers/reimbursements made by the Investment Manager and certain of its affiliates, if applicable.
The accompanying Notes to Financial Statements are an integral part of this statement.
Annual Report 2013
22
Columbia Small Cap Growth Fund I
Financial Highlights (continued)
| | | Year Ended August 31, | |
Class R | | 2013 | | 2012 | | 2011(a) | |
Per share data | |
Net asset value, beginning of period | | $ | 29.47 | | | $ | 29.88 | | | $ | 26.52 | | |
Income from investment operations: | |
Net investment loss | | | (0.35 | ) | | | (0.21 | ) | | | (0.35 | ) | |
Net realized and unrealized gain | | | 6.93 | | | | 2.53 | | | | 3.71 | | |
Total from investment operations | | | 6.58 | | | | 2.32 | | | | 3.36 | | |
Less distributions to shareholders: | |
Net realized gains | | | (2.87 | ) | | | (2.73 | ) | | | — | | |
Total distributions to shareholders | | | (2.87 | ) | | | (2.73 | ) | | | — | | |
Net asset value, end of period | | $ | 33.18 | | | $ | 29.47 | | | $ | 29.88 | | |
Total return | | | 24.85 | % | | | 8.48 | % | | | 12.67 | % | |
Ratios to average net assets(b)(c) | |
Total gross expenses | | | 1.56 | % | | | 1.57 | % | | | 1.55 | %(d) | |
Total net expenses(e) | | | 1.56 | %(f) | | | 1.56 | %(f) | | | 1.54 | %(d)(f) | |
Net investment loss | | | (1.11 | %) | | | (0.74 | %) | | | (1.16 | %)(d) | |
Supplemental data | |
Net assets, end of period (in thousands) | | $ | 3,650 | | | $ | 54 | | | $ | 55 | | |
Portfolio turnover | | | 104 | % | | | 113 | % | | | 113 | % | |
Notes to Financial Highlights
(a) For the period from September 27, 2010 (commencement of operations) to August 31, 2011.
(b) In addition to the fees and expenses which the Fund bears directly, the Fund indirectly bears a pro rata share of the fees and expenses of the acquired funds in which it invests. Such indirect expenses are not included in the reported expense ratios.
(c) Certain line items from prior years have been reclassified to conform to the current presentation.
(d) Annualized.
(e) Total net expenses include the impact of certain waivers/reimbursements made by the Investment Manager and certain of its affiliates, if applicable.
(f) The benefits derived from expense reductions had an impact of less than 0.01%.
The accompanying Notes to Financial Statements are an integral part of this statement.
Annual Report 2013
23
Columbia Small Cap Growth Fund I
Financial Highlights (continued)
Class R4 | | Year Ended
August 31,
2013(a) | |
Per share data | |
Net asset value, beginning of period | | $ | 29.37 | | |
Income from investment operations: | |
Net investment loss | | | (0.18 | ) | |
Net realized and unrealized gain | | | 8.25 | | |
Total from investment operations | | | 8.07 | | |
Less distributions to shareholders: | |
Net realized gains | | | (2.92 | ) | |
Total distributions to shareholders | | | (2.92 | ) | |
Net asset value, end of period | | $ | 34.52 | | |
Total return | | | 30.11 | % | |
Ratios to average net assets(b) | |
Total gross expenses | | | 1.09 | %(c) | |
Total net expenses(d) | | | 1.09 | %(c)(e) | |
Net investment loss | | | (0.67 | %)(c) | |
Supplemental data | |
Net assets, end of period (in thousands) | | $ | 818 | | |
Portfolio turnover | | | 104 | % | |
Notes to Financial Highlights
(a) For the period from November 8, 2012 (commencement of operations) to August 31, 2013.
(b) In addition to the fees and expenses which the Fund bears directly, the Fund indirectly bears a pro rata share of the fees and expenses of the acquired funds in which it invests. Such indirect expenses are not included in the reported expense ratios.
(c) Annualized.
(d) Total net expenses include the impact of certain waivers/reimbursements made by the Investment Manager and certain of its affiliates, if applicable.
(e) The benefits derived from expense reductions had an impact of less than 0.01%.
The accompanying Notes to Financial Statements are an integral part of this statement.
Annual Report 2013
24
Columbia Small Cap Growth Fund I
Financial Highlights (continued)
Class R5 | | Year Ended
August 31,
2013(a) | |
Per share data | |
Net asset value, beginning of period | | $ | 29.28 | | |
Income from investment operations: | |
Net investment loss | | | (0.07 | ) | |
Net realized and unrealized gain | | | 4.69 | | |
Total from investment operations | | | 4.62 | | |
Net asset value, end of period | | $ | 33.90 | | |
Total return | | | 15.78 | % | |
Ratios to average net assets(b) | |
Total gross expenses | | | 0.93 | %(c) | |
Total net expenses(d) | | | 0.93 | %(c) | |
Net investment loss | | | (0.41 | %)(c) | |
Supplemental data | |
Net assets, end of period (in thousands) | | $ | 1,145 | | |
Portfolio turnover | | | 104 | % | |
Notes to Financial Highlights
(a) For the period from February 28, 2013 (commencement of operations) to August 31, 2013.
(b) In addition to the fees and expenses which the Fund bears directly, the Fund indirectly bears a pro rata share of the fees and expenses of the acquired funds in which it invests. Such indirect expenses are not included in the reported expense ratios.
(c) Annualized.
(d) Total net expenses include the impact of certain waivers/reimbursements made by the Investment Manager and certain of its affiliates, if applicable.
The accompanying Notes to Financial Statements are an integral part of this statement.
Annual Report 2013
25
Columbia Small Cap Growth Fund I
Financial Highlights (continued)
| | | Year Ended August 31, | |
Class Y | | 2013 | | 2012 | | 2011 | | 2010 | | 2009(a) | |
Per share data | |
Net asset value, beginning of period | | $ | 30.08 | | | $ | 30.44 | | | $ | 23.85 | | | $ | 21.00 | | | $ | 19.21 | | |
Income from investment operations: | |
Net investment loss | | | (0.04 | ) | | | (0.02 | ) | | | (0.18 | ) | | | (0.17 | ) | | | (0.03 | ) | |
Net realized and unrealized gain | | | 6.99 | | | | 2.59 | | | | 6.77 | | | | 3.02 | | | | 1.82 | | |
Total from investment operations | | | 6.95 | | | | 2.57 | | | | 6.59 | | | | 2.85 | | | | 1.79 | | |
Less distributions to shareholders: | |
Net realized gains | | | (2.94 | ) | | | (2.93 | ) | | | — | | | | — | | | | — | | |
Total distributions to shareholders | | | (2.94 | ) | | | (2.93 | ) | | | — | | | | — | | | | — | | |
Net asset value, end of period | | $ | 34.09 | | | $ | 30.08 | | | $ | 30.44 | | | $ | 23.85 | | | $ | 21.00 | | |
Total return | | | 25.70 | % | | | 9.27 | % | | | 27.63 | % | | | 13.57 | % | | | 9.32 | % | |
Ratios to average net assets(b)(c) | |
Total gross expenses | | | 0.87 | % | | | 0.88 | % | | | 0.88 | % | | | 0.93 | %(d) | | | 1.03 | %(e) | |
Total net expenses(f) | | | 0.87 | % | | | 0.88 | % | | | 0.88 | %(g) | | | 0.93 | %(d)(g) | | | 1.03 | %(e)(g) | |
Net investment income | | | (0.14 | %) | | | (0.07 | %) | | | (0.58 | %) | | | (0.70 | %) | | | (0.96 | %)(e) | |
Supplemental data | |
Net assets, end of period (in thousands) | | $ | 14,817 | | | $ | 12,496 | | | $ | 11,453 | | | $ | 13,708 | | | $ | 14,222 | | |
Portfolio turnover | | | 104 | % | | | 113 | % | | | 113 | % | | | 144 | % | | | 149 | % | |
Notes to Financial Highlights
(a) For the period from July 15, 2009 (commencement of operations) to August 31, 2009.
(b) In addition to the fees and expenses which the Fund bears directly, the Fund indirectly bears a pro rata share of the fees and expenses of the acquired funds in which it invests. Such indirect expenses are not included in the reported expense ratios.
(c) Certain line items from prior years have been reclassified to conform to the current presentation.
(d) Ratios includes line of credit interest expense which rounds to less than 0.01%.
(e) Annualized.
(f) Total net expenses include the impact of certain waivers/reimbursements made by the Investment Manager and certain of its affiliates, if applicable.
(g) The benefits derived from expense reductions had an impact of less than 0.01%.
The accompanying Notes to Financial Statements are an integral part of this statement.
Annual Report 2013
26
Columbia Small Cap Growth Fund I
Financial Highlights (continued)
| | | Year Ended August 31, | |
Class Z | | 2013 | | 2012 | | 2011 | | 2010 | | 2009 | |
Per share data | |
Net asset value, beginning of period | | $ | 29.98 | | | $ | 30.35 | | | $ | 23.81 | | | $ | 21.00 | | | $ | 27.99 | | |
Income from investment operations: | |
Net investment loss | | | (0.10 | ) | | | (0.08 | ) | | | (0.23 | ) | | | (0.21 | ) | | | (0.14 | ) | |
Net realized and unrealized gain (loss) | | | 6.95 | | | | 2.59 | | | | 6.77 | | | | 3.02 | | | | (6.85 | ) | |
Total from investment operations | | | 6.85 | | | | 2.51 | | | | 6.54 | | | | 2.81 | | | | (6.99 | ) | |
Less distributions to shareholders: | |
Net realized gains | | | (2.92 | ) | | | (2.88 | ) | | | — | | | | — | | | | — | | |
Total distributions to shareholders | | | (2.92 | ) | | | (2.88 | ) | | | — | | | | — | | | | — | | |
Net asset value, end of period | | $ | 33.91 | | | $ | 29.98 | | | $ | 30.35 | | | $ | 23.81 | | | $ | 21.00 | | |
Total return | | | 25.42 | % | | | 9.06 | % | | | 27.47 | % | | | 13.38 | % | | | (24.97 | %) | |
Ratios to average net assets(a)(b) | |
Total gross expenses | | | 1.07 | % | | | 1.07 | % | | | 1.05 | % | | | 1.07 | %(c) | | | 1.15 | % | |
Total net expenses(d) | | | 1.06 | %(e) | | | 1.06 | %(e) | | | 1.05 | %(e) | | | 1.07 | %(c)(e) | | | 1.12 | %(e) | |
Net investment loss | | | (0.34 | %) | | | (0.26 | %) | | | (0.73 | %) | | | (0.85 | %) | | | (0.76 | %) | |
Supplemental data | |
Net assets, end of period (in thousands) | | $ | 1,002,689 | | | $ | 839,982 | | | $ | 951,620 | | | $ | 698,422 | | | $ | 509,514 | | |
Portfolio turnover | | | 104 | % | | | 113 | % | | | 113 | % | | | 144 | % | | | 149 | % | |
Notes to Financial Highlights
(a) In addition to the fees and expenses which the Fund bears directly, the Fund indirectly bears a pro rata share of the fees and expenses of the acquired funds in which it invests. Such indirect expenses are not included in the reported expense ratios.
(b) Certain line items from prior years have been reclassified to conform to the current presentation.
(c) Ratios include line of credit interest expense which rounds to less than 0.01%.
(d) Total net expenses include the impact of certain waivers/reimbursements made by the Investment Manager and certain of its affiliates, if applicable.
(e) The benefits derived from expense reductions had an impact of less than 0.01%.
The accompanying Notes to Financial Statements are an integral part of this statement.
Annual Report 2013
27
Columbia Small Cap Growth Fund I
Notes to Financial Statements
August 31, 2013
Note 1. Organization
Columbia Small Cap Growth Fund I (the Fund), a series of Columbia Funds Series Trust I (the Trust), is a diversified fund. The Trust is registered under the Investment Company Act of 1940, as amended (the 1940 Act), as an open-end management investment company organized as a Massachusetts business trust.
Fund Shares
The Trust may issue an unlimited number of shares (without par value). The Fund offers Class A, Class B, Class C, Class I, Class K, Class R, Class R4, Class R5, Class Y and Class Z shares. Although all share classes generally have identical voting, dividend and liquidation rights, each share class votes separately when required by law. Different share classes pay different distribution amounts to the extent the expenses of such share classes differ, and distributions in liquidation will be proportional to the net asset value of each share class. Each share class has its own expense structure and sales charges, as applicable.
The Fund is closed to new investors and new accounts, subject to certain limited exceptions.
Class A shares are subject to a maximum front-end sales charge of 5.75% based on the initial investment amount. Class A shares purchased without an initial sales charge in accounts aggregating $1 million to $50 million at the time of purchase are subject to a contingent deferred sales charge (CDSC) if the shares are sold within 18 months of purchase, charged as follows: 1.00% CDSC if redeemed within 12 months of purchase, and 0.50% CDSC if redeemed more than 12, but less than 18, months after purchase.
Class B shares may be subject to a maximum CDSC of 5.00% based upon the holding period after purchase. Class B shares will generally convert to Class A shares eight years after purchase.
Class C shares are subject to a 1.00% CDSC on shares redeemed within one year of purchase.
Class I shares are not subject to sales charges and are available only to the Columbia Family of Funds.
Class K shares are not subject to sales charges and are closed to new investors. Class K shares commenced operations on February 28, 2013.
Class R shares are not subject to sales charges and are generally available only to certain retirement plans and other eligible investors.
Class R4 shares are not subject to sales charges and are generally available only to omnibus retirement plans and
certain other eligible investors. Class R4 shares commenced operations on November 8, 2012.
Class R5 shares are not subject to sales charges and are generally available only to investors purchasing through authorized investment professionals and omnibus retirement plans. Class R5 shares commenced operations on February 28, 2013.
Class Y shares are not subject to sales charges and are generally available only to certain retirement plans.
Class Z shares are not subject to sales charges and are available only to certain eligible investors, which are subject to different investment minimums.
Note 2. Summary of Significant Accounting Policies
Use of Estimates
The preparation of financial statements in accordance with U.S. generally accepted accounting principles (GAAP) requires management to make certain estimates and assumptions that affect the reported amounts of assets and liabilities, the disclosure of contingent assets and liabilities at the date of the financial statements and the reported amounts of revenue and expenses during the reporting period. Actual results could differ from those estimates.
The following is a summary of significant accounting policies consistently followed by the Fund in the preparation of its financial statements.
Security Valuation
All equity securities are valued at the close of business of the New York Stock Exchange (NYSE). Equity securities are valued at the last quoted sales price on the principal exchange or market on which they trade, except for securities traded on the NASDAQ Stock Market, which are valued at the NASDAQ official close price. Unlisted securities or listed securities for which there were no sales during the day are valued at the mean of the latest quoted bid and ask prices on such exchanges or markets.
Foreign equity securities are valued based on quotations from the principal market in which such securities are normally traded. If any foreign share prices are not readily available as a result of limited share activity the securities are valued at the mean of the latest quoted bid and ask prices on such exchanges or markets. Foreign currency exchange rates are generally determined at 4:00 p.m. Eastern (U.S.) time. However, many securities markets and exchanges outside the U.S. close prior to the close of the NYSE; therefore, the closing prices for securities in such markets or on such
Annual Report 2013
28
Columbia Small Cap Growth Fund I
Notes to Financial Statements (continued)
August 31, 2013
exchanges may not fully reflect events that occur after such close but before the close of the NYSE. In those situations, foreign securities will be fair valued pursuant to the policy adopted by the Board of Trustees (the Board), including utilizing a third party pricing service to determine these fair values. The third party pricing service takes into account multiple factors, including, but not limited to, movements in the U.S. securities markets, certain depositary receipts, futures contracts and foreign exchange rates that have occurred subsequent to the close of the foreign exchange or market, to determine a good faith estimate that reasonably reflects the current market conditions as of the close of the NYSE. The fair value of a security is likely to be different from the quoted or published price, if available.
Investments in open-end investment companies, including money market funds, are valued at net asset value.
Investments for which market quotations are not readily available, or that have quotations which management believes are not reliable, are valued at fair value as determined in good faith under consistently applied procedures established by and under the general supervision of the Board. If a security or class of securities (such as foreign securities) is valued at fair value, such value is likely to be different from the last quoted market price for the security.
The determination of fair value often requires significant judgment. To determine fair value, management may use assumptions including but not limited to future cash flows and estimated risk premiums. Multiple inputs from various sources may be used to determine fair value.
Foreign Currency Transactions and Translations
The values of all assets and liabilities denominated in foreign currencies are translated into U.S. dollars at that day's exchange rates. Net realized and unrealized gains (losses) on foreign currency transactions and translations include gains (losses) arising from the fluctuation in exchange rates between trade and settlement dates on securities transactions, gains (losses) arising from the disposition of foreign currency and currency gains (losses) between the accrual and payment dates on dividends, interest income and foreign withholding taxes.
For financial statement purposes, the Fund does not distinguish that portion of gains (losses) on investments which is due to changes in foreign exchange rates from that which is due to changes in market prices of the investments. Such fluctuations are included with the net realized and unrealized gains (losses) on investments in the Statement of Operations.
Security Transactions
Security transactions are accounted for on the trade date. Cost is determined and gains (losses) are based upon the specific
identification method for both financial statement and federal income tax purposes.
Income Recognition
Corporate actions and dividend income are generally recorded net of any non-reclaimable tax withholdings, on the ex-dividend date or upon receipt of ex-dividend notification in the case of certain foreign securities.
The Fund may receive distributions from holdings in business development companies (BDCs), exchange traded funds (ETFs) and real estate investment trusts (REITs), which report information on the character of their distributions annually. These distributions are allocated to dividend income, capital gain and return of capital based on estimates made by the Fund's management if actual information has not yet been reported. Return of capital is recorded as a reduction of the cost basis of securities held. If the Fund no longer owns the applicable securities, return of capital is recorded as a realized gain. Management's estimates are subsequently adjusted when the actual character of the distributions is disclosed by the BDCs, ETFs and REITs, which could result in a proportionate change in return of capital to shareholders.
Awards from class action litigation are recorded as a reduction of cost basis if the Fund still owns the applicable securities on the payment date. If the Fund no longer owns the applicable securities, the proceeds are recorded as realized gains.
Expenses
General expenses of the Trust are allocated to the Fund and other funds of the Trust based upon relative net assets or other expense allocation methodologies determined by the nature of the expense. Expenses directly attributable to the Fund are charged to the Fund. Expenses directly attributable to a specific class of shares are charged to that share class.
Determination of Class Net Asset Value
All income, expenses (other than class-specific expenses, which are charged to that share class, as shown in the Statement of Operations) and realized and unrealized gains (losses) are allocated to each class of the Fund on a daily basis, based on the relative net assets of each class, for purposes of determining the net asset value of each class.
Federal Income Tax Status
The Fund intends to qualify each year as a regulated investment company under Subchapter M of the Internal Revenue Code, as amended, and will distribute substantially all of its taxable income (including net short-term capital gains), if any, for its tax year, and as such will not be subject to federal income taxes. In addition, the Fund intends to distribute in each calendar year substantially all of its net
Annual Report 2013
29
Columbia Small Cap Growth Fund I
Notes to Financial Statements (continued)
August 31, 2013
investment income, capital gains and certain other amounts, if any, such that the Fund should not be subject to federal excise tax. Therefore, no federal income or excise tax provision is recorded.
Distributions to Shareholders
Distributions from net investment income, if any, are declared and paid annually. Net realized capital gains, if any, are distributed along with the income distribution. Income distributions and capital gain distributions are determined in accordance with federal income tax regulations, which may differ from GAAP.
Guarantees and Indemnifications
Under the Trust's organizational documents and, in some cases, by contract, its officers and trustees are indemnified against certain liabilities arising out of the performance of their duties to the Trust or its funds. In addition, certain of the Fund's contracts with its service providers contain general indemnification clauses. The Fund's maximum exposure under these arrangements is unknown since the amount of any future claims that may be made against the Fund cannot be determined, and the Fund has no historical basis for predicting the likelihood of any such claims.
Recent Accounting Pronouncement
Disclosures about Offsetting Assets and Liabilities
In December 2011, the Financial Accounting Standards Board (FASB) issued Accounting Standards Update (ASU) No. 2011-11, Disclosures about Offsetting Assets and Liabilities and in January 2013, ASU No. 2013-1, Clarifying the Scope of Disclosures about Offsetting Assets and Liabilities (collectively, the ASUs). Specifically, the ASUs require an entity to disclose both gross and net information for derivatives and other financial instruments that are subject to a master netting arrangement or similar agreement. The ASUs require disclosure of collateral received in connection with the master netting agreements or similar agreements. The disclosure requirements are effective for interim and annual periods beginning on or after January 1, 2013. At this time, management is evaluating the implications of this guidance and the impact it will have on the financial statement amounts and footnote disclosures, if any.
Note 3. Fees and Compensation Paid to Affiliates
Investment Management Fees
Under an Investment Management Services Agreement, Columbia Management Investment Advisers, LLC (the Investment Manager), a wholly-owned subsidiary of Ameriprise Financial, Inc. (Ameriprise Financial), determines
which securities will be purchased, held or sold. The investment management fee is an annual fee that is equal to a percentage of the Fund's average daily net assets that declines from 0.79% to 0.70% as the Fund's net assets increase. The effective investment management fee rate for the year ended August 31, 2013 was 0.76% of the Fund's average daily net assets.
Administration Fees
Under an Administrative Services Agreement, the Investment Manager also serves as the Fund Administrator. The Fund pays the Fund Administrator an annual fee for administration and accounting services equal to a percentage of the Fund's average daily net assets that declines from 0.08% to 0.05% as the Fund's net assets increase. The effective administration fee rate for the year ended August 31, 2013 was 0.08% of the Fund's average daily net assets.
Compensation of Board Members
Board members are compensated for their services to the Fund as disclosed in the Statement of Operations. The Trust's eligible Trustees may participate in a Deferred Compensation Plan (the Plan) which may be terminated at any time. Obligations of the Plan will be paid solely out of the Fund's assets.
Compensation of Chief Compliance Officer
The Board has appointed a Chief Compliance Officer to the Fund in accordance with federal securities regulations. The Fund pays its pro-rata share of the expenses associated with the Chief Compliance Officer. The Fund's expenses for the Chief Compliance Officer will not exceed $15,000 per year.
Transfer Agent Fees
Under a Transfer and Dividend Disbursing Agent Agreement, Columbia Management Investment Services Corp. (the Transfer Agent), an affiliate of the Investment Manager and a wholly-owned subsidiary of Ameriprise Financial, is responsible for providing transfer agency services to the Fund. The Transfer Agent has contracted with Boston Financial Data Services (BFDS) to serve as sub-transfer agent.
The Transfer Agent receives monthly account-based service fees based on the number of open accounts and also receives sub-transfer agency fees based on a percentage of the average aggregate value of the Fund's shares maintained in omnibus accounts (other than omnibus accounts for which American Enterprise Investment Services Inc. is the broker of record or accounts where the beneficial shareholder is a customer of Ameriprise Financial Services, Inc., which are paid a per account fee). The Transfer Agent pays the fees of BFDS for services as sub-transfer agent and is not entitled to
Annual Report 2013
30
Columbia Small Cap Growth Fund I
Notes to Financial Statements (continued)
August 31, 2013
reimbursement for such fees from the Fund (with the exception of out-of-pocket fees).
The Transfer Agent also receives compensation from fees for various shareholder services and reimbursements for certain out-of-pocket fees. Class I shares do not pay transfer agent fees. Total transfer agent fees for Class K and Class R5 shares are subject to an annual limitation of not more than 0.05% of the average daily net assets attributable to each share class. Beginning November 1, 2012, Class Y shares are not subject to transfer agent fees for at least twelve months.
For the year ended August 31, 2013, the Fund's effective transfer agent fee rates as a percentage of average daily net assets of each class were as follows:
Class A | | | 0.20 | % | |
Class B | | | 0.20 | | |
Class C | | | 0.20 | | |
Class K | | | 0.05 | * | |
Class R | | | 0.20 | | |
Class R4 | | | 0.20 | * | |
Class R5 | | | 0.05 | * | |
Class Y | | | 0.00 | ** | |
Class Z | | | 0.20 | | |
*Annualized
**Rounds to zero.
The Fund and certain other associated investment companies, have severally, but not jointly, guaranteed the performance and observance of all the terms and conditions of a lease entered into by Seligman Data Corp. (SDC), the former transfer agent, including the payment of rent by SDC (the Guaranty). The lease and the Guaranty expire in January 2019. At August 31, 2013, the Fund's total potential future obligation over the life of the Guaranty is $33,644. The liability remaining at August 31, 2013 for non-recurring charges associated with the lease amounted to $18,413 and is recorded as a part of the payable for other expenses in the Statement of Assets and Liabilities.
An annual minimum account balance fee of $20 may apply to certain accounts with a value below the applicable share class' initial minimum investment requirements to reduce the impact of small accounts on transfer agent fees. These minimum account balance fees are recorded as part of expense reductions in the Statement of Operations. For the year ended August 31, 2013, these minimum account balance fees reduced total expenses by $17,963.
Plan Administration Fees
Under a Plan Administration Services Agreement with the Transfer Agent, the Fund pays an annual fee at a rate of 0.25% of the Fund's average daily net assets attributable to Class K shares for the provision of various administrative, recordkeeping, communication and educational services.
Distribution and Service Fees
The Fund has an agreement with Columbia Management Investment Distributors, Inc. (the Distributor), an affiliate of the Investment Manager and a wholly-owned subsidiary of Ameriprise Financial, for distribution and shareholder services. Pursuant to Rule 12b-1 under the 1940 Act, the Board has approved, and the Fund has adopted, distribution and shareholder service plans (the Plans) which set the distribution and service fees for the Fund. These fees are calculated daily and are intended to compensate the Distributor and/or eligible selling and/or servicing agents for selling shares of the Fund and providing services to investors.
Under the Plans, the Fund pays a monthly service fee to the Distributor at the maximum annual rate of 0.25% of the average daily net assets attributable to Class A, Class B and Class C shares of the Fund. Also under the Plans, the Fund pays a monthly distribution fee to the Distributor at the maximum annual rates of 0.10%, 0.75%, 0.75% and 0.50% of the average daily net assets attributable to Class A, Class B, Class C and Class R shares, respectively.
The Fund may pay distribution and service fees up to a maximum annual rate of 0.35% of the Fund's average daily net assets attributable to Class A shares (comprised of up to 0.10% for distribution services and up to 0.25% for shareholder liaison services), but currently limit such fees to an aggregate fee of not more than 0.25% of the Fund's average daily net assets attributable to Class A shares.
Sales Charges
Sales charges, including front-end charges and CDSCs, received by the Distributor for distributing Fund shares were $18,372 for Class A, $800 for Class B and $420 for Class C shares for the year ended August 31, 2013.
Expenses Waived/Reimbursed by the Investment Manager and its Affiliates
The Investment Manager and certain of its affiliates have contractually agreed to waive fees and/or reimburse expenses (excluding certain fees and expenses described below as well as any reorganization costs allocated to the Fund) for the periods disclosed below, unless sooner terminated at the sole discretion of the Board, so that the Fund's net operating expenses, after giving effect to fees waived/expenses
Annual Report 2013
31
Columbia Small Cap Growth Fund I
Notes to Financial Statements (continued)
August 31, 2013
reimbursed and any balance credits and/or overdraft charges from the Fund's custodian, do not exceed the following annual rates as a percentage of the class' average daily net assets:
| | | January 1, 2013
through
December 31, 2013 | | Prior to
January 1, 2013 | |
Class A | | | 1.41 | % | | | 1.31 | % | |
Class B | | | 2.16 | | | | 2.06 | | |
Class C | | | 2.16 | | | | 2.06 | | |
Class I | | | 1.03 | | | | 0.93 | | |
Class K | | | 1.33 | * | | | — | | |
Class R | | | 1.66 | | | | 1.56 | | |
Class R4 | | | 1.16 | | | | 1.06 | | |
Class R5 | | | 1.08 | * | | | — | | |
Class Y | | | 1.03 | | | | 1.06 | | |
Class Z | | | 1.16 | | | | 1.06 | | |
*Annual rate is contractual from February 28, 2013 (the commencement of operations of Class K and Class R5 shares) through December 31, 2013.
Under the agreement governing these fee waivers and/or expense reimbursement arrangements, the following fees and expenses are excluded from the waiver/reimbursement commitment, and therefore will be paid by the Fund, if applicable: taxes (including foreign transaction taxes), expenses associated with investments in affiliated and non-affiliated pooled investment vehicles (including mutual funds and exchange traded funds), transaction costs and brokerage commissions, costs related to any securities lending program, dividend expenses associated with securities sold short, inverse floater program fees and expenses, transaction charges and interest on borrowed money, interest, extraordinary expenses and any other expenses the exclusion of which is specifically approved by the Board. This agreement may be modified or amended only with approval from all parties. Reorganization (see Note 10) costs were allocated to the Fund only to the extent they are expected to be offset by the anticipated reduction in expenses borne by the Fund's shareholders during the first year following the reorganization.
Note 4. Federal Tax Information
The timing and character of income and capital gain distributions are determined in accordance with income tax regulations, which may differ from GAAP because of temporary or permanent book to tax differences.
At August 31, 2013, these differences are primarily due to differing treatment for capital loss carryforwards, deferral/reversal of wash sales losses, Trustees' deferred compensation, foreign currency transactions, net operating loss reclassification, passive foreign investment company
(PFIC) holdings, post-October ordinary and capital loss and re-characterization of distributions for investments. To the extent these differences are permanent, reclassifications are made among the components of the Fund's net assets in the Statement of Assets and Liabilities. Temporary differences do not require reclassifications. In the Statement of Assets and Liabilities the following reclassifications were made:
Excess of distributions over net investment income | | $ | 8,458,402 | | |
Accumulated net realized gain | | | 8,145,830 | | |
Paid-in capital | | | (16,604,232 | ) | |
Net investment income and net realized gains (losses), as disclosed in the Statement of Operations, and net assets were not affected by this reclassification.
The tax character of distributions paid during the years indicated was as follows:
Year Ended August 31, | | 2013 | | 2012 | |
Ordinary income | | $ | 2,365,931 | | | $ | 5,289,051 | | |
Long-term capital gains | | | 92,541,997 | | | | 98,265,020 | | |
Total | | $ | 94,907,928 | | | $ | 103,554,071 | | |
Short-term capital gain distributions, if any, are considered ordinary income distributions for tax purposes.
At August 31, 2013, the components of distributable earnings on a tax basis were as follows:
Undistributed ordinary income | | $ | 19,482,592 | | |
Undistributed accumulated long-term gain | | | 108,754,816 | | |
Unrealized appreciation | | | 326,140,988 | | |
At August 31, 2013, the cost of investments for federal income tax purposes was $1,055,267,565 and the aggregate gross unrealized appreciation and depreciation based on that cost was:
Unrealized appreciation | | $ | 343,097,797 | | |
Unrealized depreciation | | | (16,956,809 | ) | |
Net unrealized appreciation | | $ | 326,140,988 | | |
The following capital loss carryforward, determined at August 31, 2013, may be available to reduce taxable income arising from future net realized gains on investments, if any, to the extent permitted by the Internal Revenue Code:
Year of Expiration | | Amount | |
2016 | | $ | 6,101,280 | | |
For the year ended August 31, 2013, $8,600,060 of capital loss carryforward was utilized.
The Fund acquired $24,605,501 of capital loss carryforward in connection with the Columbia Frontier Fund and Columbia Small Cap Growth Fund merger (Note 10). From the total capital loss carryforward acquired from the merger,
Annual Report 2013
32
Columbia Small Cap Growth Fund I
Notes to Financial Statements (continued)
August 31, 2013
$9,904,161 was permanently lost. In addition to the acquired capital loss carryforward, the Fund also acquired unrealized capital gains as a result of the merger. The yearly utilization of the acquired capital loss carryforward may be limited by the Internal Revenue Code. Any capital loss carryforwards acquired as part of a merger that are permanently lost due to provisions under the Internal Revenue Code are recorded as a reduction of paid in capital.
Management of the Fund has concluded that there are no significant uncertain tax positions that would require recognition in the financial statements. However, management's conclusion may be subject to review and adjustment at a later date based on factors including, but not limited to, new tax laws, regulations, and administrative interpretations (including relevant court decisions). Generally, the Fund's federal tax returns for the prior three fiscal years remain subject to examination by the Internal Revenue Service.
Note 5. Portfolio Information
The cost of purchases and proceeds from sales of securities, excluding short-term obligations, aggregated to $1,194,976,140 and $1,525,340,279, respectively, for the year ended August 31, 2013.
Transactions to realign the Fund's portfolio following the merger as described in Note 10 are excluded for purposes of calculating the Fund's portfolio turnover rate. These realignment transactions amounted to cost of proceeds from sales of $1,281,084.
Note 6. Lending of Portfolio Securities
Effective December 19, 2012, the Fund no longer participates in securities lending activity. Prior to that date, the Fund participated, or was eligible to participate, in securities lending activity pursuant to a Master Securities Lending Agreement (the Agreement) with JPMorgan Chase Bank, N.A. (JPMorgan). The Agreement authorized JPMorgan as lending agent to lend securities to authorized borrowers in order to generate additional income on behalf of the Fund. Pursuant to the Agreement, the securities loaned were secured by cash or securities that either were issued or guaranteed as to principal and interest by the U.S. government, its agencies, authorities or instrumentalities with value equal to at least 100% of the market value of the loaned securities. Any additional collateral required to maintain those levels due to market fluctuations of the loaned securities was requested to be delivered the following business day. Cash collateral received was invested by the lending agent on behalf of the Fund into authorized investments pursuant to the Agreement.
Pursuant to the Agreement, the Fund received income for lending its securities either in the form of fees or by earning interest on invested cash collateral, net of negotiated rebates paid to borrowers and fees paid to the lending agent for services provided and any other securities lending expenses. Net income earned from securities lending for the year ended August 31, 2013 is disclosed in the Statement of Operations. The Fund continued to earn and accrue interest and dividends on the securities loaned.
Note 7. Affiliated Money Market Fund
The Fund invests its daily cash balances in Columbia Short-Term Cash Fund, an affiliated money market fund established for the exclusive use by the Fund and other affiliated funds. The income earned by the Fund from such investments is included as "Dividends — affiliated issuers" in the Statement of Operations. As an investing fund, the Fund indirectly bears its proportionate share of the expenses of Columbia Short-Term Cash Fund.
Note 8. Shareholder Concentration
At August 31, 2013, two unaffiliated shareholder accounts owned an aggregate of 42.2% of the outstanding shares of the Fund. The Fund has no knowledge about whether any portion of those shares was owned beneficially by such accounts. Subscription and redemption activity by concentrated accounts may have a significant effect on the operations of the Fund.
Note 9. Line of Credit
The Fund has entered into a revolving credit facility with a syndicate of banks led by JPMorgan whereby the Fund may borrow for the temporary funding of shareholder redemptions or for other temporary or emergency purposes. The credit facility agreement, as amended, which is a collective agreement between the Fund and certain other funds managed by the Investment Manager, severally and not jointly, permits collective borrowings up to $500 million. Interest is charged to each participating fund based on its borrowings at a rate equal to the higher of (i) the overnight federal funds rate plus 1.00% or (ii) the one-month LIBOR rate plus 1.00%. Each borrowing under the credit facility matures no later than 60 days after the date of borrowing. The Fund also pays a commitment fee equal to its pro rata share of the amount of the credit facility at a rate of 0.08% per annum. The commitment fee is included in other expenses in the Statement of Operations.
The Fund had no borrowings during the year ended August 31, 2013.
Annual Report 2013
33
Columbia Small Cap Growth Fund I
Notes to Financial Statements (continued)
August 31, 2013
Note 10. Fund Merger
At the close of business on March 15, 2013, the Fund acquired the assets and assumed the identified liabilities of Columbia Frontier Fund, a series of Columbia Funds Series Trust II, Columbia Select Small Cap Fund, a series of Columbia Funds Series Trust I, and Columbia Small Cap Growth Fund II, a series of Columbia Funds Series Trust (the acquired funds). The reorganization was completed after shareholders of the acquired funds approved a plan of reorganization on February 27, 2013. The purpose of the transaction was to combine four funds managed by the Investment Manager with comparable investment objectives and strategies.
The aggregate net assets of the Fund immediately before the acquisition were $1,023,569,342 and the combined net assets immediately after the acquisition were $1,427,082,142.
The merger was accomplished by a tax-free exchange of 6,308,081 shares of Columbia Frontier Fund valued at $73,420,942 (including $11,033,473 of unrealized appreciation), 8,967,661 shares of Columbia Select Small Cap Fund valued at $102,020,803 (including $20,056,742 of unrealized appreciation) and 16,311,272 shares of Columbia Small Cap Growth Fund II valued at $228,071,055 (including $41,963,159 of unrealized appreciation).
In exchange for the acquired fund's shares, the Fund issued the following number of shares:
| | | Shares | |
Class A | | | 6,175,881 | | |
Class B | | | 101,039 | | |
Class C | | | 455,413 | | |
Class I | | | 671 | | |
Class K | | | 1,381 | | |
Class R | | | 126,746 | | |
Class R5 | | | 1,039 | | |
Class Z | | | 6,383,431 | | |
For financial reporting purposes, net assets received and shares issued by the Fund were recorded at fair value; however, the acquired fund's cost of investments was carried forward.
The financial statements reflect the operations of the Fund for the period prior to the merger and the combined fund for the period subsequent to the merger. Because the combined investment portfolios have been managed as a single integrated portfolio since the merger was completed, it is not practicable to separate the amounts of revenue and earnings of the acquired fund that have been included in the combined Fund's Statement of Operations since the merger was completed.
Assuming the merger had been completed on September 1, 2012 the Fund's pro-forma net investment loss, net gain on investments, net change in unrealized appreciation and net increase in net assets from operations for the year ended August 31, 2013 would have been approximately $(5.2) million, $178.7 million, $139.5 million and $313.0 million, respectively.
Note 11. Significant Risks
Health Care Sector Risk
The Fund's portfolio managers may invest significantly in issuers operating in the health care sector. The Fund may be more susceptible to the particular risks of this sector than if the Fund were invested in a wider variety of issuers operating in unrelated sectors.
Technology and Technology-related Investment Risk
The Fund invested a substantial portion of its assets in technology and technology-related companies. The market prices of technology and technology-related stocks tend to exhibit a greater degree of market risk and price volatility than other types of investments.
Consumer Discretionary Risk
The Fund's portfolio managers may invest significantly in issuers operating in the consumer discretionary sector. The Fund may be more susceptible to the particular risks of this sector than if the Fund were invested in a wider variety of issuers operating in unrelated sectors.
Note 12. Subsequent Events
Management has evaluated the events and transactions that have occurred through the date the financial statements were issued and noted no items requiring adjustment of the financial statements or additional disclosure.
Note 13. Information Regarding Pending and Settled Legal Proceedings
In December 2005, without admitting or denying the allegations, American Express Financial Corporation (AEFC, which is now known as Ameriprise Financial, Inc. (Ameriprise Financial)) entered into settlement agreements with the Securities and Exchange Commission (SEC) and Minnesota Department of Commerce (MDOC) related to market timing activities. As a result, AEFC was censured and ordered to cease and desist from committing or causing any violations of certain provisions of the Investment Advisers Act of 1940, the Investment Company Act of 1940, and various Minnesota laws. AEFC agreed to pay disgorgement of $10 million and civil money penalties of $7 million. AEFC also agreed to retain an
Annual Report 2013
34
Columbia Small Cap Growth Fund I
Notes to Financial Statements (continued)
August 31, 2013
independent distribution consultant to assist in developing a plan for distribution of all disgorgement and civil penalties ordered by the SEC in accordance with various undertakings detailed at www.sec.gov/litigation/admin/ia-2451.pdf. Ameriprise Financial and its affiliates have cooperated with the SEC and the MDOC in these legal proceedings, and have made regular reports to the funds' Boards of Trustees.
Ameriprise Financial and certain of its affiliates have historically been involved in a number of legal, arbitration and regulatory proceedings, including routine litigation, class actions, and governmental actions, concerning matters arising in connection with the conduct of their business activities. Ameriprise Financial believes that the Funds are not currently the subject of, and that neither Ameriprise Financial nor any of its affiliates are the subject of, any pending legal, arbitration or regulatory proceedings that are likely to have a material adverse effect on the Funds or the ability of Ameriprise Financial or its affiliates to perform under their contracts with the Funds. Ameriprise Financial is required to make 10-Q, 10-K and, as necessary, 8-K filings with the Securities and Exchange Commission on legal and regulatory matters that relate to Ameriprise Financial and its affiliates. Copies of these filings may be obtained by accessing the SEC website at www.sec.gov.
There can be no assurance that these matters, or the adverse publicity associated with them, will not result in increased fund redemptions, reduced sale of fund shares or other adverse consequences to the Funds. Further, although we believe proceedings are not likely to have a material adverse effect on the Funds or the ability of Ameriprise Financial or its affiliates to perform under their contracts with the Funds, these proceedings are subject to uncertainties and, as such, we are unable to estimate the possible loss or range of loss that may result. An adverse outcome in one or more of these proceedings could result in adverse judgments, settlements, fines, penalties or other relief that could have a material adverse effect on the consolidated financial condition or results of operations of Ameriprise Financial.
Annual Report 2013
35
Columbia Small Cap Growth Fund I
Report of Independent Registered Public Accounting Firm
To the Trustees of Columbia Funds Series Trust I and the Shareholders of Columbia Small Cap Growth Fund I
In our opinion, the accompanying statement of assets and liabilities, including the portfolio of investments, and the related statements of operations and of changes in net assets and the financial highlights present fairly, in all material respects, the financial position of Columbia Small Cap Growth Fund I (the "Fund") (a series of Columbia Funds Series Trust I) at August 31, 2013, the results of its operations, the changes in its net assets and the financial highlights for the periods indicated, in conformity with accounting principles generally accepted in the United States of America. These financial statements and financial highlights (hereafter referred to as "financial statements") are the responsibility of the Fund's management. Our responsibility is to express an opinion on these financial statements based on our audits. We conducted our audits of these financial statements in accordance with the standards of the Public Company Accounting Oversight Board (United States). Those standards require that we plan and perform the audit to obtain reasonable assurance about whether the financial statements are free of material misstatement. An audit includes examining, on a test basis, evidence supporting the amounts and disclosures in the financial statements, assessing the accounting principles used and significant estimates made by management, and evaluating the overall financial statement presentation. We believe that our audits, which included confirmation of securities at August 31, 2013 by correspondence with the custodian, brokers and transfer agent, provide a reasonable basis for our opinion.
PricewaterhouseCoopers LLP
Minneapolis, Minnesota
October 22, 2013
Annual Report 2013
36
Columbia Small Cap Growth Fund I
Federal Income Tax Information
(Unaudited)
The Fund hereby designates the following tax attributes for the fiscal year ended August 31, 2013. Shareholders will be notified in early 2014 of the amounts for use in preparing 2013 income tax returns.
Tax Designations:
Qualified Dividend Income | | 22.46% | |
Dividends Received Deduction | | 22.51% | |
Capital Gain Dividend | | $119,912,547 | |
Qualified Dividend Income. For taxable, non-corporate shareholders, the percentage of ordinary income dividends paid during the fiscal year that represents qualified dividend income subject to reduced tax rates.
Dividends Received Deduction. The percentage of ordinary income dividends paid during the fiscal year that qualifies for the corporate dividends received deduction.
Capital Gain Dividend. The Fund designates as a capital gain dividend the amount reflected above, or if subsequently determined to be different, the net capital gain of such fiscal period. The Fund also designates as capital gain dividends, to the extent necessary to fully distribute such capital gains, earnings and profits distributed to shareholders on the redemption of shares.
Annual Report 2013
37
Columbia Small Cap Growth Fund I
The Trustees serve terms of indefinite duration. The names, addresses and birth years of the Trustees and Officers of the Funds in Columbia Funds Series Trust I, the year each was first elected or appointed to office, their principal business occupations during at least the last five years, the number of Funds overseen by each Trustee and other directorships they hold are shown below. Each officer listed below serves as an officer of each Fund in Columbia Funds Series Trust I.
Independent Trustees
Name, Address and Year of Birth,
Position with Funds, Year First
Elected or Appointed to Office | | Principal Occupation(s) During Past Five Years, Number of Funds in Columbia
Funds Complex Overseen by Trustee, Other Directorships Held | |
Rodman L. Drake (Born 1943)
c/o Columbia Management
Investment Advisers, LLC
225 Franklin Street
Boston, MA 02110
Trustee (since 1994) and
Chairman of the Board (since 2009) | | Independent consultant since 2010; Co-Founder of Baringo Capital LLC (private equity) from 1997 to 2008; Chairman (from 2003 to 2010) and CEO (from 2008 to 2010) of Crystal River Capital, Inc. (real estate investment trust); Oversees 52; Jackson Hewitt Tax Service Inc. (tax preparation services) from 2004 to 2011; Student Loan Corporation (student loan provider) from 2005 to 2010; Celgene Corporation (global biotechnology company); The Helios Funds and Brookfield Funds (closed-end funds); Chimerix, Inc. (biopharmaceutical company) since August 1, 2013; Crystal River Capital, Inc. from 2005 to 2010; Parsons Brinckerhoff from 1995 to 2008; and Apex Silver Mines Ltd. from 2007 to 2009 | |
Douglas A. Hacker (Born 1955)
c/o Columbia Management
Investment Advisers, LLC
225 Franklin Street
Boston, MA 02110
Trustee (since 1996) | | Independent business executive since May 2006; Executive Vice President — Strategy of United Airlines from December 2002 to May 2006; President of UAL Loyalty Services (airline marketing company) from September 2001 to December 2002; Executive Vice President and Chief Financial Officer of United Airlines from July 1999 to September 2001. Oversees 52; Nash Finch Company (food distributor); Aircastle Limited (aircraft leasing); and SeaCube Container Leasing Ltd. (container leasing) | |
Janet Langford Kelly (Born 1957)
c/o Columbia Management
Investment Advisers, LLC
225 Franklin Street
Boston, MA 02110
Trustee (since 1996) | | Senior Vice President, General Counsel and Corporate Secretary, ConocoPhillips (integrated energy company) since September 2007; Deputy General Counsel — Corporate Legal Services, ConocoPhillips from August 2006 to August 2007; Partner, Zelle, Hofmann, Voelbel, Mason & Gette LLP (law firm) from March 2005 to July 2006; Adjunct Professor of Law, Northwestern University from September 2004 to June 2006; Director, UAL Corporation (airline) from February 2006 to July 2006; Chief Administrative Officer and Senior Vice President, Kmart Holding Corporation (consumer goods) from September 2003 to March 2004. Oversees 52; None | |
Nancy T. Lukitsh (Born 1956)
c/o Columbia Management
Investment Advisers, LLC
225 Franklin Street
Boston, MA 02110
Trustee (since 2011) | | Senior Vice President, Partner and Director of Marketing, Wellington Management Company, LLP (investment adviser) from 1997 to 2010; Chair, Wellington Management Investment Portfolios (commingled non-U.S. investment pools) from 2007 to 2010; Director, Wellington Trust Company, NA and other Wellington affiliates from 1997 to 2010. Oversees 52; None | |
William E. Mayer (Born 1940)
c/o Columbia Management
Investment Advisers, LLC
225 Franklin Street
Boston, MA 02110
Trustee (since 1994) | | Partner, Park Avenue Equity Partners (private equity) since February 1999; Dean and Professor, College of Business and Management, University of Maryland from 1992 to 1996. Oversees 52; DynaVox Inc. (speech creation); Lee Enterprises (print media); WR Hambrecht + Co. (financial service provider) from 2000 to 2012; BlackRock Kelso Capital Corporation (investment company) | |
David M. Moffett (Born 1952)
c/o Columbia Management
Investment Advisers, LLC
225 Franklin Street
Boston, MA 02110
Trustee (since 2011) | | Retired. Chief Executive Officer, Federal Home Loan Mortgage Corporation, from 2008 to 2009; Senior Adviser, Global Financial Services Group, Carlyle Group, Inc., from 2007 to 2008; Vice Chairman and Chief Financial Officer, U.S. Bancorp, from 1993 to 2007. Oversees 52; CIT Group Inc. (commercial and consumer finance); eBay Inc. (online trading community); MBIA Inc. (financial service provider); E.W. Scripps Co. (print and television media), Building Materials Holding Corp. (building materials and construction services); Genworth Financial, Inc. (financial and insurance products and services); and University of Oklahoma Foundation | |
Charles R. Nelson (Born 1942)
c/o Columbia Management
Investment Advisers, LLC
225 Franklin Street
Boston, MA 02110
Trustee (since 1981) | | Retired. Professor Emeritus, University of Washington, since 2011; Professor of Economics, University of Washington from 1976 to 2011; Ford and Louisa Van Voorhis Professor of Political Economy, University of Washington from 1993 to 2011; Adjunct Professor of Statistics, University of Washington from 1980 to 2011; Associate Editor, Journal of Money, Credit and Banking from September 1993 to 2008; consultant on econometric and statistical matters. Oversees 52; None | |
John J. Neuhauser (Born 1943)
c/o Columbia Management
Investment Advisers, LLC
225 Franklin Street
Boston, MA 02110
Trustee (since 1984) | | President, Saint Michael's College, since August 2007; Director or Trustee of several non-profit organizations, including Fletcher Allen Health Care, Inc.; University Professor, Boston College from November 2005 to August 2007; Academic Vice President and Dean of Faculties, Boston College from August 1999 to October 2005. Oversees 52; Liberty All-Star Equity Fund and Liberty All-Star Growth Fund (closed-end funds) | |
Annual Report 2013
38
Columbia Small Cap Growth Fund I
Trustees and Officers (continued)
Independent Trustees (continued)
Name, Address and Year of Birth,
Position with Funds, Year First
Elected or Appointed to Office | | Principal Occupation(s) During Past Five Years, Number of Funds in Columbia
Funds Complex Overseen by Trustee, Other Directorships Held | |
Patrick J. Simpson (Born 1944)
c/o Columbia Management
Investment Advisers, LLC
225 Franklin Street
Boston, MA 02110
Trustee (since 2000) | | Partner, Perkins Coie LLP (law firm). Oversees 52; None | |
Anne-Lee Verville (Born 1945)
c/o Columbia Management
Investment Advisers, LLC
225 Franklin Street
Boston, MA 02110
Trustee (since 1998) | | Retired. General Manager — Global Education Industry from 1994 to 1997, President — Application Systems Division from 1991 to 1994, Chief Financial Officer — US Marketing & Services from 1988 to 1991, and Chief Information Officer from 1987 to 1988, IBM Corporation (computer and technology). Oversees 52; Enesco Group, Inc. (producer of giftware and home and garden decor products) from 2001 to 2006 | |
Interested Trustee
Name, Address and Year of Birth,
Position with Funds, Year First
Elected or Appointed to Office | | Principal Occupation(s) During Past Five Years, Number of Funds in Columbia
Funds Complex Overseen by Trustee, Other Directorships Held | |
William F. Truscott (born 1960)
53600 Ameriprise Financial Center
Minneapolis, MN 55474
Senior Vice President (since 2012) | | Chairman of the Board and President, Columbia Management Investment Advisers, LLC since May 2010 and February 2012 (previously President and Chief Investment Officer, from 2001 to April 2010); Chief Executive Officer, Global Asset Management, Ameriprise Financial, Inc. since September 2012 (previously, Chief Executive Officer, U.S. Asset Management & President, Annuities, from May 2010 to September 2012 and President — U.S. Asset Management and Chief Investment Officer from 2005 to April 2010); Director and Chief Executive Officer, Columbia Management Investment Distributors, Inc. since May 2010 and February 2012, respectively (previously Chairman of the Board and Chief Executive Officer from 2006 to April 2010); Chairman of the Board and Chief Executive Officer, RiverSource Distributors, Inc. since 2006; President and Chief Executive Officer, Ameriprise Certificate Company, 2006 to August 2012; Oversees 184; Director, Ameriprise Certificate Company, 2006-January 2013 | |
The Statement of Additional Information includes additional information about the Trustees of the Funds and is available, without charge, upon request by calling 800.345.6611.
The Board has appointed officers who are responsible for day-to-day business decisions based on policies it has established. The officers serve at the pleasure of the Board. In addition to Mr. Truscott, who is Senior Vice President, the Funds' other officers are:
Officers
Name, Year of Birth and Address | | Principal Occupation(s) During the Past Five Years | |
J. Kevin Connaughton (Born 1964)
225 Franklin Street
Boston, MA 02110
President (since 2009) | | Senior Vice President and General Manager — Mutual Fund Products, Columbia Management Investment Advisers, LLC since May 2010; President, Columbia Funds since 2009 and RiverSource Funds since May 2010; Managing Director, Columbia Management Advisors, LLC, December 2004-April 2010; Senior Vice President and Chief Financial Officer, Columbia Funds, June 2008-January 2009; Treasurer, Columbia Funds, October 2003-May 2008; and senior officer of various other affiliated funds since 2000 | |
Amy Johnson (Born 1965)
5228 Ameriprise Financial Center
Minneapolis, MN 55474
Vice President (since 2010) | | Senior Vice President and Chief Operating Officer, Columbia Management Investment Advisers, LLC since May 2010 (previously Chief Administrative Officer, from 2009-April 2010, Vice President — Asset Management and Trust Company Services, from 2006-2009) | |
Michael G. Clarke (Born 1969)
225 Franklin Street
Boston, MA 02110
Treasurer (since 2011) and Chief
Financial Officer (since 2009) | | Vice President, Columbia Management Investment Advisers, LLC since May 2010; Managing Director of Fund Administration, Columbia Management Advisors, LLC, September 2004-April 2010; senior officer of Columbia Funds and affiliated funds since 2002 | |
Annual Report 2013
39
Columbia Small Cap Growth Fund I
Trustees and Officers (continued)
Officers (continued)
Name, Year of Birth and Address | | Principal Occupation(s) During the Past Five Years | |
Scott R. Plummer (Born 1959)
5228 Ameriprise Financial Center
Minneapolis, MN 55474
Senior Vice President, Assistant
Secretary and Chief Legal Officer
(since 2010) | | Senior Vice President, Chief Legal Officer and Assistant Secretary, Columbia Management Investment Advisers, LLC since June 2005; Senior Vice President and Lead Chief Counsel — Asset Management, Ameriprise Financial, Inc. since May 2010 (previously Vice President and Chief Counsel — Asset Management, 2005-April 2010); Vice President, Chief Counsel and Assistant Secretary, Columbia Management Investment Distributors, Inc. since 2008; Vice President, General Counsel and Secretary, Ameriprise Certificate Company since 2005; Chief Counsel, RiverSource Distributors, Inc. since 2006; senior officer of Columbia Funds and affiliated funds since 2010 | |
Colin Moore (Born 1958)
225 Franklin Street
Boston, MA 02110
Senior Vice President (since 2010) | | Executive Vice President and Global Chief Investment Officer, Ameriprise Financial, Inc. since July 2013; Director and Global Chief Investment Officer, Columbia Management Investment Advisers, LLC since May 2010; Manager, Managing Director and Chief Investment Officer of Columbia Management Advisors, LLC, 2007-April 2010 | |
Thomas P. McGuire (Born 1972)
225 Franklin Street
Boston, MA 02110
Chief Compliance Officer
(since 2012) | | Vice President — Asset Management Compliance, Columbia Management Investment Advisers, LLC since 2010; Chief Compliance Officer, Ameriprise Certificate Company, since September 2010; Compliance Executive, Bank of America, N.A. 2005-2010 | |
Stephen T. Welsh (born 1957)
225 Franklin Street
Boston, MA 02110
Vice President (since 2006) | | President and Director, Columbia Management Investment Services Corp. since May 2010; President and Director, Columbia Management Services, Inc., July 2004-April 2010; Managing Director, Columbia Management Distributors, Inc., August 2007-April 2010 | |
Christopher O. Petersen (born 1970)
5228 Ameriprise Financial Center
Minneapolis, MN 55474
Vice President (since 2010) and
Secretary (since 2011) | | Vice President and Chief Counsel, Ameriprise Financial, Inc. since January 2010 (formerly Vice President and Group Counsel or Counsel, April 2004-January 2010); Assistant Secretary of Columbia Funds, January 2007-April 2011 | |
Paul D. Pearson (born 1956)
10468 Ameriprise Financial Center
Minneapolis, MN 55474
Vice President and Assistant
Treasurer (since 2011) | | Vice President, Investment Accounting, Columbia Management Investment Advisers, LLC, since May 2010; Vice President — Managed Assets, Investment Accounting, Ameriprise Financial, Inc., February 1998-May 2010 | |
Joseph F. DiMaria (Born 1968)
225 Franklin Street
Boston, MA 02110
Vice President (since 2011) and
Chief Accounting Officer (since 2008) | | Vice President, Mutual Fund Administration, Columbia Management Investment Advisers, LLC, since May 2010; Director of Fund Administration, Columbia Management Advisors, LLC, January 2006-April 2010 | |
Paul B. Goucher (born 1968)
100 Park Avenue
New York, NY 10017
Vice President and Assistant
Secretary (since 2010) | | Vice President and Lead Chief Counsel, Ameriprise Financial, Inc. since November 2008 and January 2013, respectively (formerly, Chief Counsel from January 2010-January 2013 and Group Counsel from November 2008-January 2010); Director, Managing Director and General Counsel, J. & W. Seligman & Co. Incorporated, July 2008-November 2008 (previously, Managing Director and Associate General Counsel, January 2005-July 2008) | |
Michael E. DeFao (born 1968)
225 Franklin Street
Boston, MA 02110
Vice President and Assistant
Secretary (since 2011) | | Vice President and Chief Counsel, Ameriprise Financial, Inc. since May 2010; Associate General Counsel, Bank of America, N.A. June 2005-April 2010 | |
Annual Report 2013
40
Columbia Small Cap Growth Fund I
Board Consideration and Approval of
Advisory Agreement
On June 14, 2013, the Board of Trustees (the "Board") and the Trustees who are not interested persons (as defined in the Investment Company Act of 1940) of the Trust (the "Independent Trustees") unanimously approved the continuation of the Investment Management Services Agreement (the "Advisory Agreement") with Columbia Management Investment Advisers, LLC (the "Investment Manager") with respect to Columbia Small Cap Growth Fund I (the "Fund"), a series of the Trust. As detailed below, the Advisory Fees and Expenses Committee (the "Committee") and the Board met on multiple occasions to review and discuss, both among themselves and with the management team of the Investment Manager, materials provided by the Investment Manager before determining to approve the continuation of the Advisory Agreement.
In connection with their deliberations regarding the continuation of the Advisory Agreement, the Committee and the Board evaluated materials requested from the Investment Manager regarding the Fund and the Advisory Agreement, and discussed these materials with representatives of the Investment Manager at Committee meetings held on March 5, 2013, April 24, 2013 and June 13, 2013, and at the Board meeting held on June 14, 2013. In addition, the Board considers matters bearing on the Advisory Agreement at most of its other meetings throughout the year and meets regularly with senior management of the Funds and the Investment Manager. Through the Board's Investment Oversight Committees, Trustees also meet with selected Fund portfolio managers and other investment personnel at various times throughout the year. The Committee and the Board also consulted with Fund counsel and with the Independent Trustees' independent legal counsel, who advised on various matters with respect to the Committee's and the Board's considerations and otherwise assisted the Committee and the Board in their deliberations. On June 13, 2013, the Committee recommended that the Board approve the continuation of the Advisory Agreement. On June 14, 2013, the Board, including the Independent Trustees, voting separately, unanimously approved the continuation of the Advisory Agreement for the Fund.
The Committee and the Board considered all information that they, their legal counsel, or the Investment Manager believed reasonably necessary to evaluate and to determine whether to approve the continuation of the Advisory Agreement. The information and factors considered by the Committee and the Board in recommending for approval or approving the continuation of the Advisory Agreement for the Fund included the following:
• Information on the investment performance of the Fund relative to the performance of a group of mutual funds determined to be comparable to the Fund by an independent third-party data provider, as well as performance relative to benchmarks;
• Information on the Fund's advisory fees and total expenses, including information comparing the Fund's expenses to those of a group of comparable mutual funds, as determined by the independent third-party data provider;
• The Investment Manager's agreement to contractually limit or cap total operating expenses for the Fund so that total operating expenses (excluding certain fees and expenses, such as transaction costs and certain other investment related expenses, interest, taxes, acquired fund fees and expenses, and extraordinary expenses) would not exceed the median expenses of a group of comparable funds (as determined from time to time, generally annually, by the independent third-party data provider);
• The terms and conditions of the Advisory Agreement;
• The terms and conditions of other agreements and arrangements with affiliates of the Investment Manager relating to the operations of the Fund, including the Administrative Services Agreement, the Distribution Agreement and the Transfer and Dividend Disbursing Agent Agreement;
• Descriptions of various functions performed by the Investment Manager under the Advisory Agreement, including portfolio management and portfolio trading practices;
• Information regarding the management fees and investment performance of comparable portfolios of other clients of the Investment Manager, including institutional separate accounts;
• Information regarding the reputation, regulatory history and resources of the Investment Manager, including information regarding senior management, portfolio managers and other personnel;
• Information regarding the capabilities of the Investment Manager with respect to compliance monitoring services, including an assessment of the Investment Manager's compliance system by the Fund's Chief Compliance Officer; and
• The profitability to the Investment Manager and its affiliates from their relationships with the Fund.
Annual Report 2013
41
Columbia Small Cap Growth Fund I
Board Consideration and Approval of
Advisory Agreement (continued)
Nature, Extent and Quality of Services Provided under the Advisory Agreement
The Committee and the Board considered the nature, extent and quality of services provided to the Fund by the Investment Manager and its affiliates under the Advisory Agreement and under separate agreements for the provision of transfer agency and administrative services, and the resources dedicated to the Fund and the other Columbia Funds by the Investment Manager and its affiliates. The Committee and the Board considered, among other things, the Investment Manager's ability to attract, motivate and retain highly qualified research, advisory and supervisory investment professionals (including personnel and other resources, compensation programs for personnel involved in fund management, reputation and other attributes), the portfolio management services provided by those investment professionals, and the quality of the Investment Manager's investment research capabilities and trade execution services. The Committee and the Board also considered the potential benefits to shareholders of investing in a mutual fund that is part of a fund complex offering exposure to a variety of asset classes and investment disciplines and providing a variety of fund and shareholder services.
The Committee and the Board also considered the professional experience and qualifications of the senior personnel of the Investment Manager, which included consideration of the Investment Manager's experience with similarly-structured funds. The Committee and the Board noted the compliance programs of and the compliance-related resources provided to the Fund by the Investment Manager and its affiliates, and considered the Investment Manager's ability to provide administrative services to the Fund pursuant to a separate Administrative Services Agreement, including the Investment Manager's ability to coordinate the activities of the Fund's other service providers. After reviewing these and related factors, the Committee and the Board concluded, within the context of their overall conclusions, that the nature, extent and quality of the services provided to the Fund under the Advisory Agreement supported the continuation of the Advisory Agreement.
Investment Performance
The Committee and the Board reviewed information about the performance of the Fund over various time periods, including performance information relative to benchmarks and information based on reports of the independent third-party data provider that compared the performance of the Fund to the performance of a group of comparable mutual funds. The Committee and the Board also reviewed a description of the third party's methodology for identifying the Fund's peer groups for purposes of performance and expense comparisons. Although the Fund's performance lagged that of a relevant peer group for certain (although not necessarily all) periods, the Committee and the Board concluded that other factors relevant to performance were sufficient, in light of other considerations, to warrant continuation of the Fund's Advisory Agreement. Those factors included one or more of the following: (i) that the Fund's performance, although lagging in certain recent periods, was stronger over the longer term; (ii) that the underperformance was attributable, to a significant extent, to investment decisions that were reasonable and consistent with the Fund's investment strategy and policies and that the Fund was performing within a reasonable range of expectations, given those investment decisions, market conditions and the Fund's investment strategy; (iii) that the Fund's performance was competitive when compared to other relevant performance benchmarks or peer groups; and (iv) that the Investment Manager had taken or was taking steps designed to help improve the Fund's investment performance, including, but not limited to, replacing portfolio managers, enhancing the resources supporting the portfolio managers, or modifying investment strategies.
The Committee and the Board noted that, through December 31, 2012, the Fund's performance was in the sixty-fourth, sixty-third and sixty-first percentile (where the best performance would be in the first percentile) of its category selected by the independent third-party data provider for the purposes of performance comparisons for the one-, three- and five- year periods, respectively.
The Committee and the Board also considered the Investment Manager's performance and reputation generally, the Investment Manager's historical responsiveness to Board concerns about performance, and the Investment Manager's willingness to take steps intended to improve performance. After reviewing these and related factors, the Committee and the Board concluded, within the context of their overall conclusions, that the performance of the Fund and the Investment Manager was sufficient, in light of other considerations, to warrant the continuation of the Advisory Agreement.
Investment Advisory Fee Rates and Other Expenses
The Committee and the Board considered the advisory fees charged to the Fund under the Advisory Agreement as well as the total expenses incurred by the Fund. In assessing the reasonableness of the fees under the Advisory Agreement, the
Annual Report 2013
42
Columbia Small Cap Growth Fund I
Board Consideration and Approval of
Advisory Agreement (continued)
Committee and the Board considered, among other information, the Fund's advisory fee and its total expense ratio as a percentage of average daily net assets. The Committee and the Board noted that the Fund's actual management fee and net expense ratio are ranked in the third and second quintiles, respectively, (where the lowest fees and expenses would be in the first quintile) against the Fund's expense universe as determined by the independent third-party data provider for purposes of expense comparison. The Committee and the Board also took into account the fee waiver and expense limitation arrangements agreed to by the Investment Manager, as noted above.
The Committee and the Board also received and considered information about the advisory fees charged by the Investment Manager to institutional separate accounts. In considering the fees charged to those accounts, the Committee and the Board took into account, among other things, the Investment Manager's representations about the differences between managing mutual funds as compared to other types of accounts, including differences in the services provided, differences in the risk profile of such business for the Investment Manager and the additional resources required to manage mutual funds effectively. In evaluating the Fund's advisory fees, the Committee and the Board also took into account the demands, complexity and quality of the investment management of the Fund.
After reviewing these and related factors, the Committee and the Board concluded, within the context of their overall conclusions, that the advisory fee rates and expenses of the Fund supported the continuation of the Advisory Agreement.
Costs of Services Provided and Profitability
The Committee and the Board also took note of the costs of the services provided (both on an absolute and relative basis) and the profitability to the Investment Manager and its affiliates in connection with their relationships with the Fund. In evaluating these considerations, the Committee and the Board took note of the advisory fees charged by the Investment Manager to other clients, including fees charged by the Investment Manager to institutional separate account clients with similar investment strategies to those of the Fund.
The Committee and the Board also considered the compensation directly or indirectly received by the Investment Manager's affiliates in connection with their relationships with the Fund. The Committee and the Board reviewed information provided by management as to the profitability of the Investment Manager and its affiliates of their relationships with the Fund, information about the allocation of expenses used to calculate profitability, and comparisons of profitability levels realized in 2012 to profitability levels realized in 2011. When reviewing profitability, the Committee and the Board also considered court cases in which adviser profitability was an issue in whole or in part, the performance of the Fund, the expense ratio of the Fund, and the implementation of expense limitations with respect to the Fund. The Committee and the Board also considered information provided by the Investment Manager regarding its financial condition and comparing its profitability to that of other asset management firms that are, or are subsidiaries of, publicly traded companies.
After reviewing these and related factors, the Committee and the Board concluded, within the context of their overall conclusions, that the costs of services provided and the profitability to the Investment Manager and its affiliates from their relationships with the Fund supported the continuation of the Advisory Agreement.
Economies of Scale
The Committee and the Board considered the potential existence of economies of scale in the provision by the Investment Manager of services to the Fund, to groups of related funds, and to the Investment Manager's investment advisory clients as a whole, and whether those economies of scale were shared with the Fund through breakpoints in investment advisory fees or other means, such as expense limitation arrangements and additional investments by the Investment Manager in investment, trading and compliance resources. The Committee and the Board noted that the investment advisory fee schedules for the Fund contained breakpoints that would reduce the fee rate on assets above specified threshold levels.
In considering these matters, the Committee and the Board also considered the costs of the services provided and the profitability to the Investment Manager and its affiliates from their relationships with the Fund, as discussed above. After reviewing these and related factors, the Committee and the Board concluded, within the context of their overall conclusions, that the extent to which any economies of scale were expected to be shared with the Fund supported the continuation of the Advisory Agreement.
Annual Report 2013
43
Columbia Small Cap Growth Fund I
Board Consideration and Approval of
Advisory Agreement (continued)
Other Benefits to the Investment Manager
The Committee and the Board received and considered information regarding "fall-out" or ancillary benefits received by the Investment Manager and its affiliates as a result of their relationships with the Fund, such as the engagement of the Investment Manager to provide administrative services to the Fund and the engagement of the Investment Manager's affiliates to provide distribution and transfer agency services to the Fund. The Committee and the Board considered that the Fund's distributor retains a portion of the distribution fees from the Fund. The Committee and the Board also considered the benefits of research made available to the Investment Manager by reason of brokerage commissions generated by the Fund's securities transactions, and reviewed information about the Investment Manager's practices with respect to allocating portfolio transactions for brokerage and research services. The Committee and the Board considered the possible conflicts of interest associated with certain fall-out or other ancillary benefits and the reporting, disclosure and other processes that are in place to address such possible conflicts of interest. The Committee and the Board recognized that the Investment Manager's profitability would be somewhat lower without these benefits.
Conclusion
The Committee and the Board reviewed all of the above considerations in reaching their decisions to recommend or approve the continuation of the Advisory Agreement. In their deliberations, the Trustees did not identify any particular information that was all-important or controlling, and individual Trustees may have attributed different weights to the various factors. Based on their evaluation of all factors that they deemed to be material, including those factors described above, and assisted by the advice of independent legal counsel, the Board, including the Independent Trustees, voting separately, unanimously approved the continuation of the Advisory Agreement.
Annual Report 2013
44
Columbia Small Cap Growth Fund I
Important Information About This Report
Each fund mails one shareholder report to each shareholder address. If you would like more than one report, please call shareholder services at 800.345.6611 and additional reports will be sent to you.
The policy of the Board is to vote the proxies of the companies in which each fund holds investments consistent with the procedures as stated in the Statement of Additional Information (SAI). You may obtain a copy of the SAI without charge by calling 800.345.6611; contacting your financial intermediary; visiting columbiamanagement.com; or searching the website of the Securities and Exchange Commission (SEC) at sec.gov. Information regarding how each fund voted proxies relating to portfolio securities is filed with the SEC by August 31 for the most recent 12-month period ending June 30 of that year, and is available without charge by visiting columbiamanagement.com; or searching the website of the SEC at sec.gov.
Each fund files a complete schedule of portfolio holdings with the SEC for the first and third quarters of each fiscal year on Form N-Q. Each fund's Form N-Q is available on the SEC's website at sec.gov and may be reviewed and copied at the SEC's Public Reference Room in Washington, D.C. Information on the operation of the Public Reference Room may be obtained by calling 800.SEC.0330. Each fund's complete schedule of portfolio holdings, as filed on Form N-Q, can also be obtained without charge, upon request, by calling 800.345.6611.
Annual Report 2013
45

Columbia Small Cap Growth Fund I
P.O. Box 8081
Boston, MA 02266-8081
columbiamanagement.com
This information is for use with concurrent or prior delivery of a fund prospectus. Please read and consider the investment objectives, risks, charges and expenses for any fund carefully before investing. For a prospectus which contains this and other important information about the Fund go to columbiamanagement.com. The Fund is distributed by Columbia Management Investment Distributors, Inc., member FINRA, and managed by Columbia Management Investment Advisers, LLC.
© 2013 Columbia Management Investment Advisers, LLC. All rights reserved.
ANN226_08_C01_(10/13)
Annual Report
August 31, 2013

Columbia Value and Restructuring Fund
Not FDIC insured • No bank guarantee • May lose value
 Dear Shareholders,
A return to volatility
Volatility returned to the financial markets in the second quarter of 2013, as uncertainty about the global economy, monetary policy and the impact of the sequester's spending cuts weighed on investors. Households advanced their spending but also allocated less to savings. Labor markets continued to crank out jobs at a steady pace, slowly reducing unemployment. Housing activity remained strong and retail sales were higher despite no real increase in income. The single weak spot was in the manufacturing sector, where activity slowed. While the consumer has weathered the domestic drag well, business has been closer to the global slowdown and effects of sequestration. Businesses remain very cautious, keeping inventories and staffs lean, and are planning for but not yet confident enough to make capital expenditures.
Against this backdrop, equities outperformed fixed income during the second quarter of 2013. Small-cap stocks outperformed large- and mid-cap stocks, and growth outperformed value except for in the large-cap sector. Outside the United States, foreign stock markets generally lost ground, with the most significant losses sustained by emerging markets.
Columbia Management to begin delivering summary prospectuses
Each Columbia fund is required to update its prospectus on an annual basis. Beginning with June 2013 prospectus updates, shareholders of Columbia retail mutual funds will start to receive a summary prospectus, rather than the full length (statutory) mutual fund prospectus they have received in the past.
Each fund's summary prospectus will include the following key information:
> Investment objective
> Fee and expense table
> Portfolio turnover rate information
> Principal investment strategies, principal risks and performance information
> Management information
> Purchase and sale information
> Tax information
> Financial intermediary compensation information
Each fund's statutory prospectus will contain additional information about the fund and its risks. Both the statutory and summary prospectus will be updated each year, and will be available at columbiamanagement.com. Shareholders may request a printed version of a statutory prospectus at no cost by calling 800.345.6611 or sending an email to serviceinquiries@columbiamanagement.com.
Stay on track with Columbia Management
Backed by more than 100 years of experience, Columbia Management is one of the nation's largest asset managers. At the heart of our success — and, most importantly, that of our investors — are highly talented industry professionals, brought together by a unique way of working. We are dedicated to helping you take advantage of today's opportunities and anticipate tomorrow's. We stay abreast of the latest investment trends and ideas, using our collective insight to evaluate events and transform them into solutions you can use.
Visit columbiamanagement.com for:
> The Columbia Management Perspectives blog, featuring timely posts by our investment teams
> Detailed up-to-date fund performance and portfolio information
> Economic analysis and market commentary
> Quarterly fund commentaries
> Columbia Management Investor, our award-winning quarterly newsletter for shareholders
Thank you for your continued support of the Columbia Funds. We look forward to serving your investment needs for many years to come.
Best Regards,

J. Kevin Connaughton
President, Columbia Funds
Investors should consider the investment objectives, risks, charges and expenses of a mutual fund carefully before investing. For a free prospectus, which contains this and other important information about a fund, visit columbiamanagement.com. The prospectus should be read carefully before investing.
Columbia Funds are distributed by Columbia Management Investment Distributors, Inc., member FINRA, and managed by Columbia Management Investment Advisers, LLC.
© 2013 Columbia Management Investment Advisers, LLC. All rights reserved.
Columbia Value and Restructuring Fund
Performance Overview | | | 2 | | |
Manager Discussion of Fund Performance | | | 4 | | |
Understanding Your Fund's Expenses | | | 6 | | |
Portfolio of Investments | | | 7 | | |
Statement of Assets and Liabilities | | | 11 | | |
Statement of Operations | | | 13 | | |
Statement of Changes in Net Assets | | | 14 | | |
Financial Highlights | | | 16 | | |
Notes to Financial Statements | | | 25 | | |
Report of Independent Registered
Public Accounting Firm | | | 31 | | |
Federal Income Tax Information | | | 32 | | |
Trustees and Officers | | | 33 | | |
Board Consideration and Approval of Advisory Agreement | | | 36 | | |
Important Information About This Report | | | 41 | | |
Fund Investment Manager
Columbia Management Investment
Advisers, LLC
225 Franklin Street
Boston, MA 02110
Fund Distributor
Columbia Management Investment
Distributors, Inc.
225 Franklin Street
Boston, MA 02110
Fund Transfer Agent
Columbia Management Investment
Services Corp.
P.O. Box 8081
Boston, MA 02266-8081
For more information about any of the funds, please visit columbiamanagement.com or call 800.345.6611. Customer Service Representatives are available to answer your questions Monday through Friday from 8 a.m. to 8 p.m. Eastern time.
The views expressed in this report reflect the current views of the respective parties. These views are not guarantees of future performance and involve certain risks, uncertainties and assumptions that are difficult to predict, so actual outcomes and results may differ significantly from the views expressed. These views are subject to change at any time based upon economic, market or other conditions and the respective parties disclaim any responsibility to update such views. These views may not be relied on as investment advice and, because investment decisions for a Columbia Fund are based on numerous factors, may not be relied on as an indication of trading intent on behalf of any particular Columbia Fund. References to specific securities should not be construed as a recommendation or investment advice.
Columbia Value and Restructuring Fund
Performance Summary
> Columbia Value and Restructuring Fund (the Fund) Class A shares returned 23.42% excluding sales charges for the 12-month period that ended August 31, 2013.
> The Fund outperformed its benchmarks, the Russell 1000 Value Index and the S&P 500 Index, which returned 23.10% and 18.70%, respectively, for the same 12-month period.
> Stock selection within several key sectors propelled the Fund to its strong performance for the period.
Average Annual Total Returns (%) (for period ended August 31, 2013)
| | | Inception | | 1 Year | | 5 Years | | 10 Years | |
Class A* | | 09/28/07 | | | | | | | |
Excluding sales charges | | | | | 23.42 | | | | 3.80 | | | | 8.14 | | |
Including sales charges | | | | | 16.34 | | | | 2.58 | | | | 7.50 | | |
Class C* | | 09/28/07 | | | | | | | |
Excluding sales charges | | | | | 22.52 | | | | 3.03 | | | | 7.34 | | |
Including sales charges | | | | | 21.52 | | | | 3.03 | | | | 7.34 | | |
Class I* | | 09/27/10 | | | 23.98 | | | | 4.13 | | | | 8.43 | | |
Class R* | | 12/31/04 | | | 23.12 | | | | 3.54 | | | | 7.87 | | |
Class R4* | | 11/08/12 | | | 23.77 | | | | 4.06 | | | | 8.39 | | |
Class R5* | | 11/08/12 | | | 23.87 | | | | 4.08 | | | | 8.40 | | |
Class W* | | 09/27/10 | | | 23.49 | | | | 3.82 | | | | 8.13 | | |
Class Y* | | 11/08/12 | | | 23.95 | | | | 4.09 | | | | 8.41 | | |
Class Z | | 12/31/92 | | | 23.74 | | | | 4.06 | | | | 8.39 | | |
Russell 1000 Value Index | | | | | 23.10 | | | | 6.69 | | | | 7.61 | | |
S&P 500 Index | | | | | 18.70 | | | | 7.32 | | | | 7.12 | | |
Returns for Class A are shown with and without the maximum initial sales charge of 5.75%. Returns for Class C are shown with and without the 1.00% contingent deferred sales charge for the first year only. The Fund's other classes are not subject to sales charges and have limited eligibility. Please see the Fund's prospectus for details. Performance for different share classes will vary based on differences in sales charges and fees associated with each class. All results shown assume reinvestment of distributions during the period. Returns do not reflect the deduction of taxes that a shareholder may pay on Fund distributions or on the redemption of Fund shares. Performance results reflect the effect of any fee waivers or reimbursements of Fund expenses by Columbia Management Investment Advisers, LLC and/or any of its affiliates. Absent these fee waivers or expense reimbursement arrangements, performance results would have been lower.
The performance information shown represents past performance and is not a guarantee of future results. The investment return and principal value of your investment will fluctuate so that your shares, when redeemed, may be worth more or less than their original cost. Current performance may be lower or higher than the performance information shown. You may obtain performance information current to the most recent month-end by contacting your financial intermediary, visiting columbiamanagement.com or calling 800.345.6611.
* The returns shown for periods prior to the share class inception date (including returns for the Life of the Fund, if shown, which are since Fund inception) include the returns of the Fund's oldest share class. These returns are adjusted to reflect any higher class-related operating expenses of the newer share classes, as applicable. Please visit columbiamanagement.com/mutual-funds/appended-performance for more information.
The Russell 1000 Value Index, an unmanaged index, measures the performance of those stocks in the Russell 1000 Index with lower price-to-book ratios and lower forecasted growth values.
The S&P 500 Index, an unmanaged index, measures the performance of 500 widely held, large-capitalization U.S. stocks and is frequently used as a general measure of market performance.
Indices are not available for investment, are not professionally managed and do not reflect sales charges, fees, brokerage commissions, taxes or other expenses of investing. Securities in the Fund may not match those in an index.
Annual Report 2013
2
Columbia Value and Restructuring Fund
Performance Overview (continued)
Performance of a Hypothetical $10,000 Investment (September 1, 2003 – August 31, 2013)
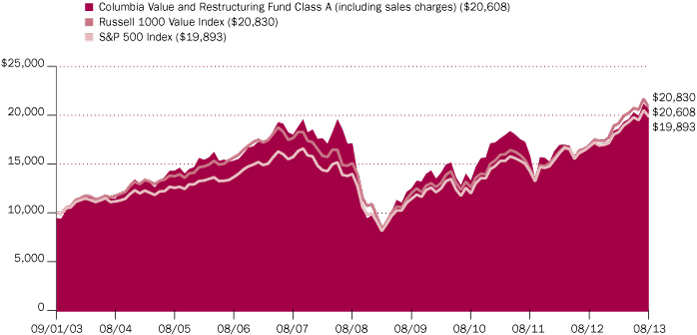
The chart above shows the change in value of a hypothetical $10,000 investment in Class A shares of Columbia Value and Restructuring Fund during the stated time period, and does not reflect the deduction of taxes that a shareholder may pay on Fund distributions or on the redemption of Fund shares.
Annual Report 2013
3
Columbia Value and Restructuring Fund
Manager Discussion of Fund Performance
For the 12-month period that ended August 31, 2013, the Fund's Class A shares returned 23.42% excluding sales charges. The Fund's benchmarks, the Russell 1000 Value Index and the S&P 500 Index, returned 23.10% and 18.70% respectively, for the same period. Stock selection among financials, health care and energy stocks were largely responsible for the performance advantage relative to its benchmarks.
U.S. Economy Makes Steady Progress
During the 12-month period ended August 31, 2013, investors faced concerns about the impact of tax increases and enforced federal spending cuts, as well as another showdown over the debt ceiling and the possibility of an attack on Syria. However, economic growth was kept afloat by steady job growth and a solid rebound in the housing market. Pent-up demand, low mortgage rates and an improving labor market all contributed to higher home sales. Manufacturing activity picked up late in the period, and business surveys and recent demand measures suggest that businesses may be ready to increase the pace of spending later this year. Against this backdrop, investors bid prices higher on stocks as central banks continued to pour liquidity into key markets. A modest pull back occurred in July and August as the civil war in Syria intensified and the Federal Reserve (the Fed) began to talk about removing some of its support.
Stock Selection Aided Results
The Fund outpaced the Russell 1000 Value Index within the financials sector on the strength of its overweight positions in certain names, including Morgan Stanley, State Street and BlackRock, which benefited from higher asset prices and an upswing in global trading volumes. Even the prospect of higher interest rates, which normally hurts financial stocks, was seen as potentially favorable as higher rates lead to increased net interest margins. An overweight in Citigroup also benefited the Fund's results, as investors responded well to the efforts of the company's new management team.
Health care was another profitable area for the Fund. A position in Celgene, which is not included in the Russell 1000 Value Index, aided relative results as the stock nearly doubled during the period, the result of a strong new-product pipeline and a consequently improved outlook for long-term earnings power. An overweight in leading health insurer CIGNA was a plus, as the company completed several restructurings including its pharmacy benefit manager and discontinued operations, combined with investors becoming more comfortable with growth prospects under the Affordable Care Act. Elsewhere in the portfolio, significant winners included Halliburton, which initiated a share-buyback program as the company's margins improved, a position in Delphi Automotive, a General Motors spinoff that has enjoyed higher sales volumes as the domestic economy has recovered and Hewlett-Packard, which was purchased at an advantageous price in 2012 amid the fallout from its ill-fated acquisition of Autonomy. Hewlett-Packard was overweight relative to the Russell 1000 Value Index, which further bolstered relative results.
Disappointments among Multinationals
Although the Fund enjoyed positive returns from each of the major sectors in which it invests, it lost a slight amount of ground versus the Russell 1000 Value Index in a handful of sectors, notably information technology and consumer
Portfolio Management
Guy Pope, CFA
J. Nicholas Smith, CFA
Morningstar Style BoxTM
The Morningstar Style BoxTM is based on a fund's portfolio holdings. For equity funds, the vertical axis shows the market capitalization of the stocks owned, and the horizontal axis shows investment style (value, blend, or growth). Information shown is based on the most recent data provided by Morningstar.
© 2013 Morningstar, Inc. All rights reserved. The Morningstar information contained herein: (1) is proprietary to Morningstar and/or its content providers; (2) may not be copied or distributed; and (3) is not warranted to be accurate, complete or timely. Neither Morningstar nor its content providers are responsible for any damages or losses arising from any use of this information.
Top Ten Holdings (%)
(at August 31, 2013) | |
Apple, Inc. | | | 3.7 | | |
Chevron Corp. | | | 2.7 | | |
Philip Morris International, Inc. | | | 2.7 | | |
JPMorgan Chase & Co. | | | 2.7 | | |
Google, Inc., Class A | | | 2.6 | | |
Citigroup, Inc. | | | 2.6 | | |
Johnson & Johnson | | | 2.3 | | |
Berkshire Hathaway, Inc.,
Class B | | | 2.3 | | |
PepsiCo, Inc. | | | 2.1 | | |
Bank of America Corp. | | | 2.1 | | |
Percentages indicated are based upon total investments (excluding Money Market Funds).
For further detail about these holdings, please refer to the section entitled "Portfolio of Investments."
Fund holdings are as of the date given, are subject to change at any time, and are not recommendations to buy or sell any security.
Annual Report 2013
4
Columbia Value and Restructuring Fund
Manager Discussion of Fund Performance (continued)
staples. In terms of individual stocks, several prominent multinational companies produced disappointing results. A substantial position in Apple, a successful long-term holding for the Fund, was a drag on relative performance as it declined sharply over the past 12 months amid increased competition. IBM International also was down, in response to a slowdown in global information technology spending. The Fund also lost ground relative to the Russell 1000 Value Index with an overweight in Philip Morris International, and a position in Lorillard. Philip Morris experienced lower cigarette sales volumes worldwide, higher local taxes in certain countries, and fought the headwind of a stronger U.S. dollar. Lorillard faced the dual concerns of a domestic business in secular decline and the possibility of government regulation in the menthol market. We sold the stock in Lorillard before the close of the reporting period.
Looking Ahead
We are cautiously optimistic about the trajectory of the economy, and mindful that the Fed has signaled its intention to conclude the zero interest rate policy that has been in place since the financial crisis erupted several years ago. While we noted in this report that some of the Fund's individual holdings in the financials sector may adapt well to a higher interest rate environment, the broader equity markets have not historically prospered within such a setting. We believe the Fed is well aware of this sensitivity and will likely move in a very deliberate manner.
Portfolio Breakdown (%)
(at August 31, 2013) | |
Common Stocks | | | 99.3 | | |
Consumer Discretionary | | | 13.6 | | |
Consumer Staples | | | 10.4 | | |
Energy | | | 10.1 | | |
Financials | | | 17.6 | | |
Health Care | | | 13.3 | | |
Industrials | | | 10.2 | | |
Information Technology | | | 19.6 | | |
Materials | | | 1.6 | | |
Telecommunication Services | | | 2.9 | | |
Money Market Funds | | | 0.7 | | |
Total | | | 100.0 | | |
Percentages indicated are based upon total investments. The Fund's portfolio composition is subject to change.
Investment Risks
Risks include stock market fluctuations and changes in the values of specific fund holdings due to economic and business developments. Value stocks may also be subject to specific business risks that have caused the stocks to be out of favor. See the Fund's prospectus for information on these and other risks.
Annual Report 2013
5
Columbia Value and Restructuring Fund
Understanding Your Fund's Expenses
(Unaudited)
As an investor, you incur two types of costs. There are transaction costs, which generally include sales charges on purchases and may include redemption fees. There are also ongoing costs, which generally include management fees, distribution and service (Rule 12b-1) fees, and other fund expenses. The following information is intended to help you understand your ongoing costs (in dollars) of investing in the Fund and to help you compare these costs with the ongoing costs of investing in other mutual funds.
Analyzing Your Fund's Expenses
To illustrate these ongoing costs, we have provided examples and calculated the expenses paid by investors in each share class of the Fund during the period. The actual and hypothetical information in the table is based on an initial investment of $1,000 at the beginning of the period indicated and held for the entire period. Expense information is calculated two ways and each method provides you with different information. The amount listed in the "Actual" column is calculated using the Fund's actual operating expenses and total return for the period. You may use the Actual information, together with the amount invested, to estimate the expenses that you paid over the period. Simply divide your account value by $1,000 (for example, an $8,600 account value divided by $1,000 = 8.6), then multiply the results by the expenses paid during the period under the Actual column. The amount listed in the "Hypothetical" column assumes a 5% annual rate of return before expenses (which is not the Fund's actual return) and then applies the Fund's actual expense ratio for the period to the hypothetical return. You should not use the hypothetical account values and expenses to estimate either your actual account balance at the end of the period or the expenses you paid during the period. See "Compare With Other Funds" below for details on how to use the hypothetical data.
Compare With Other Funds
Since all mutual funds are required to include the same hypothetical calculations about expenses in shareholder reports, you can use this information to compare the ongoing cost of investing in the Fund with other funds. To do so, compare the hypothetical example with the 5% hypothetical examples that appear in the shareholder reports of other funds. As you compare hypothetical examples of other funds, it is important to note that hypothetical examples are meant to highlight the ongoing costs of investing in a fund only and do not reflect any transaction costs, such as sales charges, or redemption or exchange fees. Therefore, the hypothetical calculations are useful in comparing ongoing costs only, and will not help you determine the relative total costs of owning different funds. If transaction costs were included in these calculations, your costs would be higher.
March 1, 2013 – August 31, 2013
| | | Account Value at the Beginning
of the Period ($) | | Account Value at the End of the
Period ($) | | Expenses Paid During the
Period ($) | | Fund's Annualized
Expense Ratio (%) | |
| | | Actual | | Hypothetical | | Actual | | Hypothetical | | Actual | | Hypothetical | | Actual | |
Class A | | | 1,000.00 | | | | 1,000.00 | | | | 1,107.70 | | | | 1,019.10 | | | | 6.29 | | | | 6.02 | | | | 1.19 | | |
Class C | | | 1,000.00 | | | | 1,000.00 | | | | 1,103.50 | | | | 1,015.34 | | | | 10.23 | | | | 9.80 | | | | 1.94 | | |
Class I | | | 1,000.00 | | | | 1,000.00 | | | | 1,109.70 | | | | 1,021.31 | | | | 3.97 | | | | 3.80 | | | | 0.75 | | |
Class R | | | 1,000.00 | | | | 1,000.00 | | | | 1,106.00 | | | | 1,017.90 | | | | 7.55 | | | | 7.23 | | | | 1.43 | | |
Class R4 | | | 1,000.00 | | | | 1,000.00 | | | | 1,108.90 | | | | 1,020.36 | | | | 4.97 | | | | 4.76 | | | | 0.94 | | |
Class R5 | | | 1,000.00 | | | | 1,000.00 | | | | 1,109.70 | | | | 1,021.01 | | | | 4.28 | | | | 4.10 | | | | 0.81 | | |
Class W | | | 1,000.00 | | | | 1,000.00 | | | | 1,107.60 | | | | 1,019.45 | | | | 5.92 | | | | 5.67 | | | | 1.12 | | |
Class Y | | | 1,000.00 | | | | 1,000.00 | | | | 1,110.10 | | | | 1,021.31 | | | | 3.97 | | | | 3.80 | | | | 0.75 | | |
Class Z | | | 1,000.00 | | | | 1,000.00 | | | | 1,108.80 | | | | 1,020.36 | | | | 4.97 | | | | 4.76 | | | | 0.94 | | |
Expenses paid during the period are equal to the annualized expense ratio for each class as indicated above, multiplied by the average account value over the period and then multiplied by the number of days in the Fund's most recent fiscal half year and divided by 365.
Expenses do not include fees and expenses incurred indirectly by the Fund from the underlying funds in which the Fund may invest (also referred to as "acquired funds"), including affiliated and non-affiliated pooled investment vehicles (including mutual funds and exchange-traded funds).
Annual Report 2013
6
Columbia Value and Restructuring Fund
Portfolio of Investments
August 31, 2013
(Percentages represent value of investments compared to net assets)
Common Stocks 98.6%
Issuer | | Shares | | Value ($) | |
Consumer Discretionary 13.5% | |
Auto Components 0.6% | |
Delphi Automotive PLC | | | 246,180 | | | | 13,544,824 | | |
Automobiles 1.5% | |
General Motors Co.(a) | | | 931,990 | | | | 31,762,219 | | |
Hotels, Restaurants & Leisure 0.8% | |
Wynn Resorts Ltd. | | | 114,685 | | | | 16,175,173 | | |
Household Durables 0.5% | |
Lennar Corp., Class A | | | 345,515 | | | | 10,990,832 | | |
Media 5.8% | |
Comcast Corp., Class A | | | 869,225 | | | | 36,585,680 | | |
DIRECTV(a) | | | 422,820 | | | | 24,599,668 | | |
Discovery Communications, Inc.,
Class A(a) | | | 259,200 | | | | 20,090,592 | | |
Viacom, Inc., Class B | | | 517,240 | | | | 41,151,614 | | |
Total | | | | | 122,427,554 | | |
Specialty Retail 3.8% | |
Dick's Sporting Goods, Inc. | | | 304,220 | | | | 14,118,850 | | |
Lowe's Companies, Inc. | | | 712,910 | | | | 32,665,536 | | |
Tiffany & Co. | | | 221,820 | | | | 17,104,540 | | |
Ulta Salon Cosmetics &
Fragrance, Inc.(a) | | | 165,315 | | | | 16,405,861 | | |
Total | | | | | 80,294,787 | | |
Textiles, Apparel & Luxury Goods 0.5% | |
Nike, Inc., Class B | | | 184,445 | | | | 11,586,835 | | |
Total Consumer Discretionary | | | | | 286,782,224 | | |
Consumer Staples 10.3% | |
Beverages 3.3% | |
Diageo PLC, ADR | | | 217,120 | | | | 26,636,282 | | |
PepsiCo, Inc. | | | 549,000 | | | | 43,771,770 | | |
Total | | | | | 70,408,052 | | |
Food & Staples Retailing 2.4% | |
CVS Caremark Corp. | | | 564,840 | | | | 32,788,962 | | |
Walgreen Co. | | | 389,520 | | | | 18,724,226 | | |
Total | | | | | 51,513,188 | | |
Household Products 1.9% | |
Procter & Gamble Co. (The) | | | 513,800 | | | | 40,019,882 | | |
Tobacco 2.7% | |
Philip Morris International, Inc. | | | 680,400 | | | | 56,772,576 | | |
Total Consumer Staples | | | | | 218,713,698 | | |
Common Stocks (continued)
Issuer | | Shares | | Value ($) | |
Energy 10.0% | |
Energy Equipment & Services 2.2% | |
Halliburton Co. | | | 768,200 | | | | 36,873,600 | | |
Tidewater, Inc. | | | 180,855 | | | | 9,758,936 | | |
Total | | | | | 46,632,536 | | |
Oil, Gas & Consumable Fuels 7.8% | |
Anadarko Petroleum Corp. | | | 239,675 | | | | 21,911,089 | | |
Canadian Natural Resources Ltd. | | | 610,010 | | | | 18,678,506 | | |
Chevron Corp. | | | 474,600 | | | | 57,156,078 | | |
ConocoPhillips | | | 353,900 | | | | 23,463,570 | | |
Exxon Mobil Corp. | | | 230,140 | | | | 20,059,002 | | |
Newfield Exploration Co.(a) | | | 244,190 | | | | 5,816,606 | | |
Noble Energy, Inc. | | | 305,400 | | | | 18,760,722 | | |
Total | | | | | 165,845,573 | | |
Total Energy | | | | | 212,478,109 | | |
Financials 17.5% | |
Capital Markets 4.6% | |
BlackRock, Inc. | | | 120,200 | | | | 31,290,464 | | |
Invesco Ltd. | | | 762,100 | | | | 23,137,356 | | |
Morgan Stanley | | | 632,425 | | | | 16,291,268 | | |
State Street Corp. | | | 401,700 | | | | 26,801,424 | | |
Total | | | | | 97,520,512 | | |
Commercial Banks 1.6% | |
Wells Fargo & Co. | | | 819,090 | | | | 33,648,217 | | |
Diversified Financial Services 7.3% | |
Bank of America Corp. | | | 3,042,890 | | | | 42,965,607 | | |
Citigroup, Inc. | | | 1,123,150 | | | | 54,281,840 | | |
JPMorgan Chase & Co. | | | 1,123,310 | | | | 56,760,854 | | |
Total | | | | | 154,008,301 | | |
Insurance 4.0% | |
Aon PLC | | | 555,100 | | | | 36,847,538 | | |
Berkshire Hathaway, Inc., Class B(a) | | | 429,095 | | | | 47,723,946 | | |
Total | | | | | 84,571,484 | | |
Total Financials | | | | | 369,748,514 | | |
Health Care 13.3% | |
Biotechnology 1.2% | |
Ariad Pharmaceuticals, Inc.(a) | | | 483,220 | | | | 8,987,892 | | |
Celgene Corp.(a) | | | 111,969 | | | | 15,673,421 | | |
Total | | | | | 24,661,313 | | |
The accompanying Notes to Financial Statements are an integral part of this statement.
Annual Report 2013
7
Columbia Value and Restructuring Fund
Portfolio of Investments (continued)
August 31, 2013
Common Stocks (continued)
Issuer | | Shares | | Value ($) | |
Health Care Equipment & Supplies 4.0% | |
Abbott Laboratories | | | 715,510 | | | | 23,847,948 | | |
Baxter International, Inc. | | | 465,820 | | | | 32,402,439 | | |
Covidien PLC | | | 472,600 | | | | 28,072,440 | | |
Total | | | | | 84,322,827 | | |
Health Care Providers & Services 4.3% | |
Cardinal Health, Inc. | | | 705,000 | | | | 35,447,400 | | |
CIGNA Corp. | | | 379,100 | | | | 29,831,379 | | |
Express Scripts Holding Co.(a) | | | 406,360 | | | | 25,958,277 | | |
Total | | | | | 91,237,056 | | |
Pharmaceuticals 3.8% | |
Johnson & Johnson | | | 567,905 | | | | 49,072,671 | | |
Pfizer, Inc. | | | 610,950 | | | | 17,234,900 | | |
Salix Pharmaceuticals Ltd.(a) | | | 211,080 | | | | 14,129,695 | | |
Total | | | | | 80,437,266 | | |
Total Health Care | | | | | 280,658,462 | | |
Industrials 10.1% | |
Aerospace & Defense 3.2% | |
Honeywell International, Inc. | | | 421,045 | | | | 33,502,551 | | |
United Technologies Corp. | | | 347,050 | | | | 34,739,705 | | |
Total | | | | | 68,242,256 | | |
Air Freight & Logistics 1.2% | |
FedEx Corp. | | | 239,315 | | | | 25,692,858 | | |
Commercial Services & Supplies 1.2% | |
Tyco International Ltd. | | | 770,000 | | | | 25,440,800 | | |
Electrical Equipment 1.3% | |
Eaton Corp. PLC | | | 438,890 | | | | 27,790,515 | | |
Industrial Conglomerates 1.1% | |
General Electric Co. | | | 966,010 | | | | 22,353,471 | | |
Professional Services 1.2% | |
Nielsen Holdings NV | | | 720,125 | | | | 24,844,312 | | |
Road & Rail 0.9% | |
Union Pacific Corp. | | | 127,370 | | | | 19,556,390 | | |
Total Industrials | | | | | 213,920,602 | | |
Information Technology 19.5% | |
Communications Equipment 1.6% | |
QUALCOMM, Inc. | | | 495,860 | | | | 32,865,601 | | |
Common Stocks (continued)
Issuer | | Shares | | Value ($) | |
Computers & Peripherals 5.5% | |
Apple, Inc. | | | 156,830 | | | | 76,384,052 | | |
EMC Corp. | | | 1,141,135 | | | | 29,418,460 | | |
Hewlett-Packard Co. | | | 464,242 | | | | 10,371,166 | | |
Total | | | | | 116,173,678 | | |
Internet Software & Services 5.0% | |
Baidu, Inc., ADR(a) | | | 73,650 | | | | 9,981,785 | | |
eBay, Inc.(a) | | | 579,800 | | | | 28,984,202 | | |
Facebook, Inc., Class A(a) | | | 309,015 | | | | 12,756,139 | | |
Google, Inc., Class A(a) | | | 64,740 | | | | 54,828,306 | | |
Total | | | | | 106,550,432 | | |
IT Services 1.8% | |
International Business Machines Corp. | | | 35,470 | | | | 6,465,117 | | |
Mastercard, Inc., Class A | | | 51,250 | | | | 31,061,600 | | |
Total | | | | | 37,526,717 | | |
Semiconductors & Semiconductor Equipment 0.6% | |
Skyworks Solutions, Inc.(a) | | | 519,675 | | | | 13,178,958 | | |
Software 5.0% | |
Activision Blizzard, Inc. | | | 1,069,920 | | | | 17,461,094 | | |
Citrix Systems, Inc.(a) | | | 179,430 | | | | 12,698,261 | | |
Electronic Arts, Inc.(a) | | | 1,297,490 | | | | 34,565,134 | | |
Intuit, Inc. | | | 466,580 | | | | 29,641,827 | | |
Microsoft Corp. | | | 352,210 | | | | 11,763,814 | | |
Total | | | | | 106,130,130 | | |
Total Information Technology | | | | | 412,425,516 | | |
Materials 1.5% | |
Chemicals 1.5% | |
Celanese Corp., Class A | | | 114,175 | | | | 5,621,977 | | |
Dow Chemical Co. (The) | | | 727,150 | | | | 27,195,410 | | |
Total | | | | | 32,817,387 | | |
Total Materials | | | | | 32,817,387 | | |
Telecommunication Services 2.9% | |
Diversified Telecommunication Services 2.0% | |
AT&T, Inc. | | | 1,215,105 | | | | 41,107,002 | | |
Wireless Telecommunication Services 0.9% | |
Vodafone Group PLC, ADR | | | 615,010 | | | | 19,895,573 | | |
Total Telecommunication Services | | | | | 61,002,575 | | |
Total Common Stocks
(Cost: $1,647,921,721) | | | | | 2,088,547,087 | | |
The accompanying Notes to Financial Statements are an integral part of this statement.
Annual Report 2013
8
Columbia Value and Restructuring Fund
Portfolio of Investments (continued)
August 31, 2013
Money Market Funds 0.7%
Issuer | | Shares | | Value ($) | |
Columbia Short-Term Cash Fund,
0.097%(b)(c) | | | 13,924,661 | | | | 13,924,661 | | |
Total Money Market Funds
(Cost: $13,924,661) | | | | | 13,924,661 | | |
Total Investments
(Cost: $1,661,846,382) | | | | | 2,102,471,748 | | |
Other Assets & Liabilities, Net | | | | | 14,879,197 | | |
Net Assets | | | | | 2,117,350,945 | | |
Notes to Portfolio of Investments
(a) Non-income producing.
(b) The rate shown is the seven-day current annualized yield at August 31, 2013.
(c) As defined in the Investment Company Act of 1940, an affiliated company is one in which the Fund owns 5% or more of its outstanding voting securities, or a company which is under common ownership or control with the Fund. Holdings and transactions in these affiliated companies during the year ended August 31, 2013, are as follows:
Issuer | | Beginning
Cost ($) | | Purchase
Cost ($) | | Proceeds
from Sales ($) | | Ending
Cost ($) | | Dividends —
Affiliated
Issuers ($) | | Value ($) | |
Columbia Short-Term Cash Fund | | | 28,067,156 | | | | 808,122,684 | | | | (822,265,179 | ) | | | 13,924,661 | | | | 22,654 | | | | 13,924,661 | | |
Abbreviation Legend
ADR American Depositary Receipt
Fair Value Measurements
Generally accepted accounting principles (GAAP) require disclosure regarding the inputs and valuation techniques used to measure fair value and any changes in valuation inputs or techniques. In addition, investments shall be disclosed by major category.
The Fund categorizes its fair value measurements according to a three-level hierarchy that maximizes the use of observable inputs and minimizes the use of unobservable inputs by prioritizing that the most observable input be used when available. Observable inputs are those that market participants would use in pricing an investment based on market data obtained from sources independent of the reporting entity. Unobservable inputs are those that reflect the Fund's assumptions about the information market participants would use in pricing an investment. An investment's level within the fair value hierarchy is based on the lowest level of any input that is deemed significant to the asset or liability's fair value measurement. The input levels are not necessarily an indication of the risk or liquidity associated with investments at that level. For example, certain U.S. government securities are generally high quality and liquid, however, they are reflected as Level 2 because the inputs used to determine fair value may not always be quoted prices in an active market.
Fair value inputs are summarized in the three broad levels listed below:
> Level 1 — Valuations based on quoted prices for investments in active markets that the Fund has the ability to access at the measurement date (including NAV for open-end mutual funds). Valuation adjustments are not applied to Level 1 investments.
> Level 2 — Valuations based on other significant observable inputs (including quoted prices for similar securities, interest rates, prepayment speeds, credit risks, etc.).
> Level 3 — Valuations based on significant unobservable inputs (including the Fund's own assumptions and judgment in determining the fair value of investments).
Inputs that are used in determining fair value of an investment may include price information, credit data, volatility statistics, and other factors. These inputs can be either observable or unobservable. The availability of observable inputs can vary between investments, and is affected by various factors such as the type of investment, and the volume and level of activity for that investment or similar investments in the marketplace. The inputs will be considered by the Investment Manager, along with any other relevant factors in the calculation of an investment's fair value. The Fund uses prices and inputs that are current as of the measurement date, which may include periods of market dislocations. During these periods, the availability of prices and inputs may be reduced for many investments. This condition could cause an investment to be reclassified between the various levels within the hierarchy.
The accompanying Notes to Financial Statements are an integral part of this statement.
Annual Report 2013
9
Columbia Value and Restructuring Fund
Portfolio of Investments (continued)
August 31, 2013
Fair Value Measurements (continued)
Investments falling into the Level 3 category are primarily supported by quoted prices from brokers and dealers participating in the market for those investments. However, these may be classified as Level 3 investments due to lack of market transparency and corroboration to support these quoted prices. Additionally, valuation models may be used as the pricing source for any remaining investments classified as Level 3. These models may rely on one or more significant unobservable inputs and/or significant assumptions by the Investment Manager. Inputs used in valuations may include, but are not limited to, financial statement analysis, capital account balances, discount rates and estimated cash flows, and comparable company data.
Under the direction of the Fund's Board of Trustees (the Board), the Investment Manager's Valuation Committee (the Committee) is responsible for carrying out the valuation procedures approved by the Board. The Committee consists of voting and non-voting members from various groups within the Investment Manager's organization, including operations and accounting, trading and investments, compliance, risk management and legal.
The Committee meets at least monthly to review and approve valuation matters, which may include a description of specific valuation determinations, data regarding pricing information received from approved pricing vendors and brokers and the results of Board-approved valuation control policies and procedures (the Policies). The Policies address, among other things, instances when market quotations are or are not readily available, including recommendations of third party pricing vendors and a determination of appropriate pricing methodologies; events that require specific valuation determinations and assessment of fair value techniques; securities with a potential for stale pricing, including those that are illiquid, restricted, or in default; and the effectiveness of third-party pricing vendors, including periodic reviews of vendors. The Committee meets more frequently, as needed, to discuss additional valuation matters, which may include the need to review back-testing results, review time-sensitive information or approve related valuation actions. The Committee reports to the Board, with members of the Committee meeting with the Board at each of its regularly scheduled meetings to discuss valuation matters and actions during the period, similar to those described earlier.
For investments categorized as Level 3, the Committee monitors information similar to that described above, which may include: (i) data specific to the issuer or comparable issuers, (ii) general market or specific sector news and (iii) quoted prices and specific or similar security transactions. The Committee considers this data and any changes from prior periods in order to assess the reasonableness of observable and unobservable inputs, any assumptions or internal models used to value those securities and changes in fair value. This data is also used to corroborate, when available, information received from approved pricing vendors and brokers. Various factors impact the frequency of monitoring this information (which may occur as often as daily). However, the Committee may determine that changes to inputs, assumptions and models are not required as a result of the monitoring procedures performed.
The following table is a summary of the inputs used to value the Fund's investments at August 31, 2013:
Description | | Level 1
Quoted Prices in Active
Markets for Identical
Assets ($) | | Level 2
Other Significant
Observable Inputs ($) | | Level 3
Significant
Unobservable Inputs ($) | | Total ($) | |
Equity Securities | |
Common Stocks | |
Consumer Discretionary | | | 286,782,224 | | | | — | | | | — | | | | 286,782,224 | | |
Consumer Staples | | | 218,713,698 | | | | — | | | | — | | | | 218,713,698 | | |
Energy | | | 212,478,109 | | | | — | | | | — | | | | 212,478,109 | | |
Financials | | | 369,748,514 | | | | — | | | | — | | | | 369,748,514 | | |
Health Care | | | 280,658,462 | | | | — | | | | — | | | | 280,658,462 | | |
Industrials | | | 213,920,602 | | | | — | | | | — | | | | 213,920,602 | | |
Information Technology | | | 412,425,516 | | | | — | | | | — | | | | 412,425,516 | | |
Materials | | | 32,817,387 | | | | — | | | | — | | | | 32,817,387 | | |
Telecommunication Services | | | 61,002,575 | | | | — | | | | — | | | | 61,002,575 | | |
Total Equity Securities | | | 2,088,547,087 | | | | — | | | | — | | | | 2,088,547,087 | | |
Mutual Funds | |
Money Market Funds | | | 13,924,661 | | | | — | | | | — | | | | 13,924,661 | | |
Total Mutual Funds | | | 13,924,661 | | | | — | | | | — | | | | 13,924,661 | | |
Total | | | 2,102,471,748 | | | | — | | | | — | | | | 2,102,471,748 | | |
See the Portfolio of Investments for all investment classifications not indicated in the table.
There were no transfers of financial assets between Levels 1 and 2 during the period.
The accompanying Notes to Financial Statements are an integral part of this statement.
Annual Report 2013
10
Columbia Value and Restructuring Fund
Statement of Assets and Liabilities
August 31, 2013
Assets | |
Investments, at value | |
Unaffiliated issuers (identified cost $1,647,921,721) | | $ | 2,088,547,087 | | |
Affiliated issuers (identified cost $13,924,661) | | | 13,924,661 | | |
Total investments (identified cost $1,661,846,382) | | | 2,102,471,748 | | |
Receivable for: | |
Investments sold | | | 19,614,343 | | |
Capital shares sold | | | 259,633 | | |
Dividends | | | 3,693,777 | | |
Reclaims | | | 158,598 | | |
Prepaid expenses | | | 25,436 | | |
Trustees' deferred compensation plan | | | 220,639 | | |
Other assets | | | 1,502 | | |
Total assets | | | 2,126,445,676 | | |
Liabilities | |
Payable for: | |
Investments purchased | | | 6,841,887 | | |
Capital shares purchased | | | 1,470,607 | | |
Investment management fees | | | 40,290 | | |
Distribution and/or service fees | | | 1,748 | | |
Transfer agent fees | | | 409,340 | | |
Administration fees | | | 3,504 | | |
Compensation of board members | | | 396 | | |
Chief compliance officer expenses | | | 316 | | |
Other expenses | | | 106,004 | | |
Trustees' deferred compensation plan | | | 220,639 | | |
Total liabilities | | | 9,094,731 | | |
Net assets applicable to outstanding capital stock | | $ | 2,117,350,945 | | |
Represented by | |
Paid-in capital | | $ | 1,353,773,994 | | |
Undistributed net investment income | | | 1,506,443 | | |
Accumulated net realized gain | | | 321,462,530 | | |
Unrealized appreciation (depreciation) on: | |
Investments | | | 440,625,366 | | |
Foreign currency translations | | | (17,388 | ) | |
Total — representing net assets applicable to outstanding capital stock | | $ | 2,117,350,945 | | |
The accompanying Notes to Financial Statements are an integral part of this statement.
Annual Report 2013
11
Columbia Value and Restructuring Fund
Statement of Assets and Liabilities (continued)
August 31, 2013
Class A | |
Net assets | | $ | 102,893,184 | | |
Shares outstanding | | | 1,966,353 | | |
Net asset value per share | | $ | 52.33 | | |
Maximum offering price per share(a) | | $ | 55.52 | | |
Class C | |
Net assets | | $ | 28,633,996 | | |
Shares outstanding | | | 550,471 | | |
Net asset value per share | | $ | 52.02 | | |
Class I | |
Net assets | | $ | 3,003 | | |
Shares outstanding | | | 58 | | |
Net asset value per share(b) | | $ | 52.22 | | |
Class R | |
Net assets | | $ | 18,096,456 | | |
Shares outstanding | | | 346,259 | | |
Net asset value per share | | $ | 52.26 | | |
Class R4 | |
Net assets | | $ | 3,299,063 | | |
Shares outstanding | | | 62,248 | | |
Net asset value per share | | $ | 53.00 | | |
Class R5 | |
Net assets | | $ | 9,095,362 | | |
Shares outstanding | | | 171,598 | | |
Net asset value per share | | $ | 53.00 | | |
Class W | |
Net assets | | $ | 3,007 | | |
Shares outstanding | | | 58 | | |
Net asset value per share(b) | | $ | 52.30 | | |
Class Y | |
Net assets | | $ | 795,049 | | |
Shares outstanding | | | 15,018 | | |
Net asset value per share | | $ | 52.94 | | |
Class Z | |
Net assets | | $ | 1,954,531,825 | | |
Shares outstanding | | | 37,363,670 | | |
Net asset value per share | | $ | 52.31 | | |
(a) The maximum offering price per share is calculated by dividing the net asset value per share by 1.0 minus the maximum sales charge of 5.75%.
(b) Net asset value per share rounds to this amount due to fractional shares outstanding.
The accompanying Notes to Financial Statements are an integral part of this statement.
Annual Report 2013
12
Columbia Value and Restructuring Fund
Statement of Operations
Year ended August 31, 2013
Net investment income | |
Income: | |
Dividends — unaffiliated issuers | | $ | 44,425,490 | | |
Dividends — affiliated issuers | | | 22,654 | | |
Interest | | | 40,450 | | |
Income from securities lending — net | | | 38,113 | | |
Foreign taxes withheld | | | (59,959 | ) | |
Total income | | | 44,466,748 | | |
Expenses: | |
Investment management fees | | | 16,455,919 | | |
Distribution and/or service fees | |
Class A | | | 282,810 | | |
Class C | | | 310,256 | | |
Class R | | | 123,794 | | |
Class W | | | 7 | | |
Transfer agent fees | |
Class A | | | 213,921 | | |
Class C | | | 58,633 | | |
Class R | | | 46,946 | | |
Class R4(a) | | | 2,038 | | |
Class R5(a) | | | 1,357 | | |
Class W | | | 4 | | |
Class Z | | | 4,183,328 | | |
Administration fees | | | 1,430,949 | | |
Compensation of board members | | | 75,555 | | |
Custodian fees | | | 22,981 | | |
Printing and postage fees | | | 132,378 | | |
Registration fees | | | 106,656 | | |
Professional fees | | | 63,276 | | |
Line of credit interest expense | | | 1,142 | | |
Chief compliance officer expenses | | | 1,662 | | |
Other | | | 104,948 | | |
Total expenses | | | 23,618,560 | | |
Expense reductions | | | (25,552 | ) | |
Total net expenses | | | 23,593,008 | | |
Net investment income | | | 20,873,740 | | |
Realized and unrealized gain (loss) — net | |
Net realized gain (loss) on: | |
Investments | | | 454,761,593 | | |
Foreign currency translations | | | (611 | ) | |
Net realized gain | | | 454,760,982 | | |
Net change in unrealized appreciation (depreciation) on: | |
Investments | | | 29,824,802 | | |
Foreign currency translations | | | 7,662 | | |
Net change in unrealized appreciation (depreciation) | | | 29,832,464 | | |
Net realized and unrealized gain | | | 484,593,446 | | |
Net increase in net assets resulting from operations | | $ | 505,467,186 | | |
(a) For the period from November 8, 2012 (commencement of operations) to August 31, 2013.
The accompanying Notes to Financial Statements are an integral part of this statement.
Annual Report 2013
13
Columbia Value and Restructuring Fund
Statement of Changes in Net Assets
| | | Year Ended
August 31,
2013(a) | | Year Ended
August 31,
2012(b) | | Year Ended
March 31,
2012 | |
Operations | |
Net investment income | | $ | 20,873,740 | | | $ | 17,675,819 | | | $ | 68,549,440 | | |
Net realized gain | | | 454,760,982 | | | | 721,830,776 | | | | 817,261,192 | | |
Net change in unrealized appreciation (depreciation) | | | 29,832,464 | | | | (828,760,147 | ) | | | (1,410,227,538 | ) | |
Net increase (decrease) in net assets resulting from operations | | | 505,467,186 | | | | (89,253,552 | ) | | | (524,416,906 | ) | |
Distributions to shareholders | |
Net investment income | |
Class A | | | (927,799 | ) | | | (491,104 | ) | | | (2,022,036 | ) | |
Class C | | | (56,034 | ) | | | (57,756 | ) | | | (178,216 | ) | |
Class I | | | (35 | ) | | | (12 | ) | | | (39 | ) | |
Class R | | | (151,790 | ) | | | (98,412 | ) | | | (351,895 | ) | |
Class R4 | | | (13,344 | ) | | | — | | | | — | | |
Class R5 | | | (22,565 | ) | | | — | | | | — | | |
Class W | | | (24 | ) | | | (10 | ) | | | (29 | ) | |
Class Y | | | (1,893 | ) | | | — | | | | — | | |
Class Z | | | (23,705,389 | ) | | | (11,516,046 | ) | | | (64,346,698 | ) | |
Net realized gains | |
Class A | | | (14,028,118 | ) | | | — | | | | — | | |
Class C | | | (3,752,998 | ) | | | — | | | | — | | |
Class I | | | (345 | ) | | | — | | | | — | | |
Class R | | | (3,218,304 | ) | | | — | | | | — | | |
Class R4 | | | (309 | ) | | | — | | | | — | | |
Class R5 | | | (309 | ) | | | — | | | | — | | |
Class W | | | (345 | ) | | | — | | | | — | | |
Class Y | | | (310 | ) | | | — | | | | — | | |
Class Z | | | (272,216,030 | ) | | | — | | | | — | | |
Total distributions to shareholders | | | (318,095,941 | ) | | | (12,163,340 | ) | | | (66,898,913 | ) | |
Increase (decrease) in net assets from capital stock activity | | | (873,345,572 | ) | | | (1,229,819,245 | ) | | | (2,288,996,250 | ) | |
Total decrease in net assets | | | (685,974,327 | ) | | | (1,331,236,137 | ) | | | (2,880,312,069 | ) | |
Net assets at beginning of year | | | 2,803,325,272 | | | | 4,134,561,409 | | | | 7,014,873,478 | | |
Net assets at end of year | | $ | 2,117,350,945 | | | $ | 2,803,325,272 | | | $ | 4,134,561,409 | | |
Undistributed net investment income | | $ | 1,506,443 | | | $ | 5,806,656 | | | $ | 1,639,387 | | |
(a) Class R4, Class R5 and Class Y shares are for the period from November 8, 2012 (commencement of operations) to August 31, 2013.
(b) For the period from April 1, 2012 to August 31, 2012. During the period, the Fund's fiscal year end was changed from March 31 to August 31.
The accompanying Notes to Financial Statements are an integral part of this statement.
Annual Report 2013
14
Columbia Value and Restructuring Fund
Statement of Changes in Net Assets (continued)
| | | Year Ended August 31, 2013(a) | | Year Ended August 31, 2012(b) | | Year ended March 31, 2012 | |
| | | Shares | | Dollars($) | | Shares | | Dollars($) | | Shares | | Dollars($) | |
Capital stock activity | |
Class A shares | |
Subscriptions | | | 234,722 | | | | 11,579,064 | | | | 77,220 | | | | 3,628,854 | | | | 429,799 | | | | 20,748,380 | | |
Distributions reinvested | | | 318,824 | | | | 14,021,246 | | | | 10,153 | | | | 463,975 | | | | 37,595 | | | | 1,698,011 | | |
Redemptions | | | (1,349,900 | ) | | | (65,754,655 | ) | | | (678,621 | ) | | | (31,999,955 | ) | | | (2,169,299 | ) | | | (103,288,238 | ) | |
Net decrease | | | (796,354 | ) | | | (40,154,345 | ) | | | (591,248 | ) | | | (27,907,126 | ) | | | (1,701,905 | ) | | | (80,841,847 | ) | |
Class C shares | |
Subscriptions | | | 33,542 | | | | 1,581,039 | | | | 9,787 | | | | 461,915 | | | | 87,938 | | | | 4,296,824 | | |
Distributions reinvested | | | 74,752 | | | | 3,264,131 | | | | 1,069 | | | | 48,734 | | | | 2,972 | | | | 133,769 | | |
Redemptions | | | (287,203 | ) | | | (13,979,207 | ) | | | (129,941 | ) | | | (6,114,048 | ) | | | (586,390 | ) | | | (27,697,861 | ) | |
Net decrease | | | (178,909 | ) | | | (9,134,037 | ) | | | (119,085 | ) | | | (5,603,399 | ) | | | (495,480 | ) | | | (23,267,268 | ) | |
Class I shares | |
Subscriptions | | | — | | | | — | | | | — | | | | — | | | | 58,248 | | | | 3,123,981 | | |
Redemptions | | | — | | | | — | | | | — | | | | — | | | | (560,760 | ) | | | (28,966,012 | ) | |
Net increase (decrease) | | | — | | | | — | | | | — | | | | — | | | | (502,512 | ) | | | (25,842,031 | ) | |
Class R shares | |
Subscriptions | | | 77,979 | | | | 3,833,132 | | | | 47,006 | | | | 2,222,975 | | | | 145,708 | | | | 6,982,623 | | |
Distributions reinvested | | | 76,797 | | | | 3,370,094 | | | | 2,155 | | | | 98,412 | | | | 7,762 | | | | 351,895 | | |
Redemptions | | | (469,811 | ) | | | (23,116,940 | ) | | | (170,884 | ) | | | (7,994,806 | ) | | | (603,378 | ) | | | (30,008,857 | ) | |
Net decrease | | | (315,035 | ) | | | (15,913,714 | ) | | | (121,723 | ) | | | (5,673,419 | ) | | | (449,908 | ) | | | (22,674,339 | ) | |
Class R4 shares | |
Subscriptions | | | 191,818 | | | | 10,039,112 | | | | — | | | | — | | | | — | | | | — | | |
Distributions reinvested | | | 262 | | | | 13,325 | | | | — | | | | — | | | | — | | | | — | | |
Redemptions | | | (129,832 | ) | | | (6,948,009 | ) | | | — | | | | — | | | | — | | | | — | | |
Net increase | | | 62,248 | | | | 3,104,428 | | | | — | | | | — | | | | — | | | | — | | |
Class R5 shares | |
Subscriptions | | | 186,694 | | | | 9,571,054 | | | | — | | | | — | | | | — | | | | — | | |
Distributions reinvested | | | 446 | | | | 22,544 | | | | — | | | | — | | | | — | | | | — | | |
Redemptions | | | (15,542 | ) | | | (827,446 | ) | | | — | | | | — | | | | — | | | | — | | |
Net increase | | | 171,598 | | | | 8,766,152 | | | | — | | | | — | | | | — | | | | — | | |
Class Y shares | |
Subscriptions | | | 16,454 | | | | 867,642 | | | | — | | | | — | | | | — | | | | — | | |
Distributions reinvested | | | 37 | | | | 1,871 | | | | — | | | | — | | | | — | | | | — | | |
Redemptions | | | (1,473 | ) | | | (77,206 | ) | | | — | | | | — | | | | — | | | | — | | |
Net increase | | | 15,018 | | | | 792,307 | | | | — | | | | — | | | | — | | | | — | | |
Class Z shares | |
Subscriptions | | | 2,276,997 | | | | 110,297,129 | | | | 954,372 | | | | 45,117,296 | | | | 10,657,053 | | | | 515,042,888 | | |
Distributions reinvested | | | 5,631,101 | | | | 247,812,847 | | | | 202,426 | | | | 9,244,800 | | | | 922,759 | | | | 41,664,646 | | |
Redemptions | | | (24,105,526 | ) | | | (1,178,916,339 | ) | | | (26,047,705 | ) | | | (1,244,997,397 | ) | | | (57,331,033 | ) | | | (2,693,078,299 | ) | |
Net decrease | | | (16,197,428 | ) | | | (820,806,363 | ) | | | (24,890,907 | ) | | | (1,190,635,301 | ) | | | (45,751,221 | ) | | | (2,136,370,765 | ) | |
Total net decrease | | | (17,238,862 | ) | | | (873,345,572 | ) | | | (25,722,963 | ) | | | (1,229,819,245 | ) | | | (48,901,026 | ) | | | (2,288,996,250 | ) | |
(a) Class R4, Class R5 and Class Y shares are for the period from November 8, 2012 (commencement of operations) to August 31, 2013.
(b) For the period from April 1, 2012 to August 31, 2012. During the period, the Fund's fiscal year end was changed from March 31 to August 31.
The accompanying Notes to Financial Statements are an integral part of this statement.
Annual Report 2013
15
Columbia Value and Restructuring Fund
The following tables are intended to help you understand the Fund's financial performance. Certain information reflects financial results for a single share of a class held for the periods shown. Per share net investment income (loss) amounts are calculated based on average shares outstanding during the period. Total return assumes reinvestment of all dividends and distributions, if any. Total return does not reflect payment of sales charges, if any, and is not annualized for periods of less than one year.
| | | Year ended August 31, | | Year ended March 31, | |
Class A | | 2013 | | 2012(a) | | 2012 | | 2011 | | 2010 | | 2009 | |
Per share data | |
Net asset value, beginning of period | | $ | 48.59 | | | $ | 49.58 | | | $ | 53.03 | | | $ | 44.68 | | | $ | 26.51 | | | $ | 52.25 | | |
Income from investment operations: | |
Net investment income | | | 0.32 | | | | 0.23 | | | | 0.49 | | | | 0.53 | (b) | | | 0.39 | (b) | | | 0.51 | | |
Net realized and unrealized gain (loss) | | | 9.81 | | | | (1.06 | ) | | | (3.45 | ) | | | 8.37 | | | | 18.16 | | | | (25.72 | ) | |
Total from investment operations | | | 10.13 | | | | (0.83 | ) | | | (2.96 | ) | | | 8.90 | | | | 18.55 | | | | (25.21 | ) | |
Less distributions to shareholders: | |
Net investment income | | | (0.39 | ) | | | (0.16 | ) | | | (0.49 | ) | | | (0.55 | ) | | | (0.38 | ) | | | (0.51 | ) | |
Net realized gains | | | (6.00 | ) | | | — | | | | — | | | | — | | | | — | | | | (0.02 | ) | |
Total distributions to shareholders | | | (6.39 | ) | | | (0.16 | ) | | | (0.49 | ) | | | (0.55 | ) | | | (0.38 | ) | | | (0.53 | ) | |
Proceeds from regulatory settlements | | | — | | | | — | | | | — | | | | — | | | | 0.00 | (c) | | | 0.00 | (c) | |
Net asset value, end of period | | $ | 52.33 | | | $ | 48.59 | | | $ | 49.58 | | | $ | 53.03 | | | $ | 44.68 | | | $ | 26.51 | | |
Total return | | | 23.42 | % | | | (1.65 | %) | | | (5.49 | %) | | | 20.17 | % | | | 70.25 | % | | | (48.51 | %) | |
Ratios to average net assets(d)(e) | |
Total gross expenses | | | 1.21 | %(f) | | | 1.26 | %(g) | | | 1.26 | %(f) | | | 1.20 | %(f) | | | 1.14 | %(f) | | | 1.18 | %(f) | |
Total net expenses(h) | | | 1.21 | %(f)(i) | | | 1.19 | %(g)(i) | | | 1.19 | %(f)(i) | | | 1.20 | %(f)(i) | | | 1.14 | %(f)(i) | | | 1.14 | %(f)(i) | |
Net investment income | | | 0.66 | % | | | 1.15 | %(g) | | | 1.03 | % | | | 1.16 | % | | | 1.01 | % | | | 1.35 | % | |
Supplemental data | |
Net assets, end of period (in thousands) | | $ | 102,893 | | | $ | 134,228 | | | $ | 166,301 | | | $ | 268,124 | | | $ | 291,655 | | | $ | 163,338 | | |
Portfolio turnover | | | 55 | % | | | 64 | % | | | 9 | % | | | 12 | % | | | 6 | % | | | 12 | % | |
Notes to Financial Highlights
(a) For the period from April 1, 2012 to August 31, 2012. During the period, the Fund's fiscal year end was changed from March 31 to August 31.
(b) Net investment income per share reflects special dividends. The effect of these dividends amounted to $0.18 and $0.04 per share, respectively.
(c) Rounds to zero.
(d) In addition to the fees and expenses which the Fund bears directly, the Fund indirectly bears a pro rata share of the fees and expenses of the acquired funds in which it invests. Such indirect expenses are not included in the reported expense ratios.
(e) Certain line items from prior years have been reclassified to conform to the current presentation.
(f) Ratios include line of credit interest expense which rounds to less than 0.01%.
(g) Annualized.
(h) Total net expenses include the impact of certain waivers/reimbursements made by the Investment Manager and certain of its affiliates, if applicable.
(i) The benefits derived from expense reductions had an impact of less than 0.01%.
The accompanying Notes to Financial Statements are an integral part of this statement.
Annual Report 2013
16
Columbia Value and Restructuring Fund
Financial Highlights (continued)
| | | Year ended August 31, | | Year ended March 31, | |
Class C | | 2013 | | 2012(a) | | 2012 | | 2011 | | 2010 | | 2009 | |
Per share data | |
Net asset value, beginning of period | | $ | 48.38 | | | $ | 49.44 | | | $ | 52.89 | | | $ | 44.60 | | | $ | 26.51 | | | $ | 52.23 | | |
Income from investment operations: | |
Net investment income (loss) | | | (0.04 | ) | | | 0.08 | | | | 0.13 | | | | 0.18 | (b) | | | 0.10 | (b) | | | 0.23 | | |
Net realized and unrealized gain (loss) | | | 9.76 | | | | (1.07 | ) | | | (3.41 | ) | | | 8.36 | | | | 18.16 | | | | (25.73 | ) | |
Total from investment operations | | | 9.72 | | | | (0.99 | ) | | | (3.28 | ) | | | 8.54 | | | | 18.26 | | | | (25.50 | ) | |
Less distributions to shareholders: | |
Net investment income | | | (0.08 | ) | | | (0.07 | ) | | | (0.17 | ) | | | (0.25 | ) | | | (0.17 | ) | | | (0.20 | ) | |
Net realized gains | | | (6.00 | ) | | | — | | | | — | | | | — | | | | — | | | | (0.02 | ) | |
Total distributions to shareholders | | | (6.08 | ) | | | (0.07 | ) | | | (0.17 | ) | | | (0.25 | ) | | | (0.17 | ) | | | (0.22 | ) | |
Proceeds from regulatory settlements | | | — | | | | — | | | | — | | | | — | | | | 0.00 | (c) | | | 0.00 | (c) | |
Net asset value, end of period | | $ | 52.02 | | | $ | 48.38 | | | $ | 49.44 | | | $ | 52.89 | | | $ | 44.60 | | | $ | 26.51 | | |
Total return | | | 22.52 | % | | | (1.98 | %) | | | (6.18 | %) | | | 19.27 | % | | | 69.00 | % | | | (48.89 | %) | |
Ratios to average net assets(d)(e) | |
Total gross expenses | | | 1.96 | %(f) | | | 2.01 | %(g) | | | 1.99 | %(f) | | | 1.95 | %(f) | | | 1.89 | %(f) | | | 1.93 | %(f) | |
Total net expenses(h) | | | 1.96 | %(f)(i) | | | 1.94 | %(g)(i) | | | 1.95 | %(f)(i) | | | 1.95 | %(f)(i) | | | 1.89 | %(f)(i) | | | 1.89 | %(f)(i) | |
Net investment income (loss) | | | (0.09 | %) | | | 0.41 | %(g) | | | 0.28 | % | | | 0.40 | % | | | 0.26 | % | | | 0.63 | % | |
Supplemental data | |
Net assets, end of period (in thousands) | | $ | 28,634 | | | $ | 35,288 | | | $ | 41,945 | | | $ | 71,083 | | | $ | 74,880 | | | $ | 40,380 | | |
Portfolio turnover | | | 55 | % | | | 64 | % | | | 9 | % | | | 12 | % | | | 6 | % | | | 12 | % | |
Notes to Financial Highlights
(a) For the period from April 1, 2012 to August 31, 2012. During the period, the Fund's fiscal year end was changed from March 31 to August 31.
(b) Net investment income per share reflects special dividends. The effect of these dividends amounted to $0.18 and $0.04 per share, respectively.
(c) Rounds to zero.
(d) In addition to the fees and expenses which the Fund bears directly, the Fund indirectly bears a pro rata share of the fees and expenses of the acquired funds in which it invests. Such indirect expenses are not included in the reported expense ratios.
(e) Certain line items from prior years have been reclassified to conform to the current presentation.
(f) Ratios include line of credit interest expense which rounds to less than 0.01%.
(g) Annualized.
(h) Total net expenses include the impact of certain waivers/reimbursements made by the Investment Manager and certain of its affiliates, if applicable.
(i) The benefits derived from expense reductions had an impact of less than 0.01%.
The accompanying Notes to Financial Statements are an integral part of this statement.
Annual Report 2013
17
Columbia Value and Restructuring Fund
Financial Highlights (continued)
| | | Year ended August 31, | | Year ended March 31, | |
Class I | | 2013 | | 2012(a) | | 2012 | | 2011(b) | |
Per share data | |
Net asset value, beginning of period | | $ | 48.50 | | | $ | 49.48 | | | $ | 53.03 | | | $ | 43.47 | | |
Income from investment operations: | |
Net investment income | | | 0.55 | | | | 0.31 | | | | 0.09 | | | | 0.27 | | |
Net realized and unrealized gain (loss) | | | 9.77 | | | | (1.08 | ) | | | (2.95 | ) | | | 9.57 | | |
Total from investment operations | | | 10.32 | | | | (0.77 | ) | | | (2.86 | ) | | | 9.84 | | |
Less distributions to shareholders: | |
Net investment income | | | (0.60 | ) | | | (0.21 | ) | | | (0.69 | ) | | | (0.28 | ) | |
Net realized gains | | | (6.00 | ) | | | — | | | | — | | | | — | | |
Total distributions to shareholders | | | (6.60 | ) | | | (0.21 | ) | | | (0.69 | ) | | | (0.28 | ) | |
Net asset value, end of period | | $ | 52.22 | | | $ | 48.50 | | | $ | 49.48 | | | $ | 53.03 | | |
Total return | | | 23.98 | % | | | (1.52 | %) | | | (5.26 | %) | | | 22.67 | % | |
Ratios to average net assets(c)(d) | |
Total gross expenses | | | 0.76 | %(e) | | | 0.81 | %(f) | | | 0.78 | %(e) | | | 0.79 | %(e)(f) | |
Total net expenses(g) | | | 0.76 | %(e) | | | 0.81 | %(f) | | | 0.78 | %(e)(h) | | | 0.79 | %(e)(f)(h) | |
Net investment income | | | 1.11 | % | | | 1.55 | %(f) | | | 0.17 | % | | | 1.05 | %(f) | |
Supplemental data | |
Net assets, end of period (in thousands) | | $ | 3 | | | $ | 3 | | | $ | 3 | | | $ | 26,652 | | |
Portfolio turnover | | | 55 | % | | | 64 | % | | | 9 | % | | | 12 | % | |
Notes to Financial Highlights
(a) For the period from April 1, 2012 to August 31, 2012. During the period, the Fund's fiscal year end was changed from March 31 to August 31.
(b) For the period from September 27, 2010 (commencement of operations) to March 31, 2011.
(c) In addition to the fees and expenses which the Fund bears directly, the Fund indirectly bears a pro rata share of the fees and expenses of the acquired funds in which it invests. Such indirect expenses are not included in the reported expense ratios.
(d) Certain line items from prior years have been reclassified to conform to the current presentation.
(e) Ratios include line of credit interest expense which rounds to less than 0.01%.
(f) Annualized.
(g) Total net expenses include the impact of certain waivers/reimbursements made by the Investment Manager and certain of its affiliates, if applicable.
(h) The benefits derived from expense reductions had an impact of less than 0.01%.
The accompanying Notes to Financial Statements are an integral part of this statement.
Annual Report 2013
18
Columbia Value and Restructuring Fund
Financial Highlights (continued)
| | | Year ended August 31, | | Year ended March 31, | |
Class R | | 2013 | | 2012(a) | | 2012 | | 2011 | | 2010 | | 2009 | |
Per share data | |
Net asset value, beginning of period | | $ | 48.53 | | | $ | 49.55 | | | $ | 52.98 | | | $ | 44.64 | | | $ | 26.50 | | | $ | 52.23 | | |
Income from investment operations: | |
Net investment income | | | 0.20 | | | | 0.18 | | | | 0.37 | | | | 0.41 | (b) | | | 0.30 | (b) | | | 0.41 | | |
Net realized and unrealized gain (loss) | | | 9.80 | | | | (1.07 | ) | | | (3.43 | ) | | | 8.37 | | | | 18.14 | | | | (25.72 | ) | |
Total from investment operations | | | 10.00 | | | | (0.89 | ) | | | (3.06 | ) | | | 8.78 | | | | 18.44 | | | | (25.31 | ) | |
Less distributions to shareholders: | |
Net investment income | | | (0.27 | ) | | | (0.13 | ) | | | (0.37 | ) | | | (0.44 | ) | | | (0.30 | ) | | | (0.40 | ) | |
Net realized gains | | | (6.00 | ) | | | — | | | | — | | | | — | | | | — | | | | (0.02 | ) | |
Total distributions to shareholders | | | (6.27 | ) | | | (0.13 | ) | | | (0.37 | ) | | | (0.44 | ) | | | (0.30 | ) | | | (0.42 | ) | |
Proceeds from regulatory settlements | | | — | | | | — | | | | — | | | | — | | | | 0.00 | (c) | | | 0.00 | (c) | |
Net asset value, end of period | | $ | 52.26 | | | $ | 48.53 | | | $ | 49.55 | | | $ | 52.98 | | | $ | 44.64 | | | $ | 26.50 | | |
Total return | | | 23.12 | % | | | (1.77 | %) | | | (5.70 | %) | | | 19.86 | % | | | 69.84 | % | | | (48.65 | %) | |
Ratios to average net assets(d)(e) | |
Total gross expenses | | | 1.46 | %(f) | | | 1.51 | %(g) | | | 1.50 | %(f) | | | 1.45 | %(f) | | | 1.39 | %(f) | | | 1.43 | %(f) | |
Total net expenses(h) | | | 1.46 | %(f)(i) | | | 1.44 | %(g)(i) | | | 1.44 | %(f)(i) | | | 1.45 | %(f)(i) | | | 1.39 | %(f)(i) | | | 1.39 | %(f)(i) | |
Net investment income | | | 0.40 | % | | | 0.91 | %(g) | | | 0.76 | % | | | 0.91 | % | | | 0.78 | % | | | 1.05 | % | |
Supplemental data | |
Net assets, end of period (in thousands) | | $ | 18,096 | | | $ | 32,095 | | | $ | 38,799 | | | $ | 65,321 | | | $ | 58,120 | | | $ | 37,637 | | |
Portfolio turnover | | | 55 | % | | | 64 | % | | | 9 | % | | | 12 | % | | | 6 | % | | | 12 | % | |
Notes to Financial Highlights
(a) For the period from April 1, 2012 to August 31, 2012. During the period, the Fund's fiscal year end was changed from March 31 to August 31.
(b) Net investment income per share reflects special dividends. The effect of these dividends amounted to $0.18 and $0.04 per share, respectively.
(c) Rounds to zero.
(d) In addition to the fees and expenses which the Fund bears directly, the Fund indirectly bears a pro rata share of the fees and expenses of the acquired funds in which it invests. Such indirect expenses are not included in the reported expense ratios.
(e) Certain line items from prior years have been reclassified to conform to the current presentation.
(f) Ratios include line of credit interest expense which rounds to less than 0.01%.
(g) Annualized.
(h) Total net expenses include the impact of certain waivers/reimbursements made by the Investment Manager and certain of its affiliates, if applicable.
(i) The benefits derived from expense reductions had an impact of less than 0.01%.
The accompanying Notes to Financial Statements are an integral part of this statement.
Annual Report 2013
19
Columbia Value and Restructuring Fund
Financial Highlights (continued)
Class R4 | | Year ended
August 31,
2013(a) | |
Per share data | |
Net asset value, beginning of period | | $ | 48.51 | | |
Income from investment operations: | |
Net investment income | | | 0.43 | | |
Net realized and unrealized gain | | | 10.42 | | |
Total from investment operations | | | 10.85 | | |
Less distributions to shareholders: | |
Net investment income | | | (0.36 | ) | |
Net realized gains | | | (6.00 | ) | |
Total distributions to shareholders | | | (6.36 | ) | |
Net asset value, end of period | | $ | 53.00 | | |
Total return | | | 24.95 | % | |
Ratios to average net assets(b) | |
Total gross expenses | | | 0.94 | %(c)(d) | |
Total net expenses(e) | | | 0.94 | %(c)(d)(f) | |
Net investment income | | | 1.04 | %(c) | |
Supplemental data | |
Net assets, end of period (in thousands) | | $ | 3,299 | | |
Portfolio turnover | | | 55 | % | |
Notes to Financial Highlights
(a) For the period from November 8, 2012 (commencement of operations) to August 31, 2013.
(b) In addition to the fees and expenses which the Fund bears directly, the Fund indirectly bears a pro rata share of the fees and expenses of the acquired funds in which it invests. Such indirect expenses are not included in the reported expense ratios.
(c) Annualized.
(d) Ratios include line of credit interest expense which rounds to less than 0.01%.
(e) Total net expenses include the impact of certain waivers/reimbursements made by the Investment Manager and certain of its affiliates, if applicable.
(f) The benefits derived from expense reductions had an impact of less than 0.01%.
The accompanying Notes to Financial Statements are an integral part of this statement.
Annual Report 2013
20
Columbia Value and Restructuring Fund
Financial Highlights (continued)
Class R5 | | Year ended
August 31,
2013(a) | |
Per share data | |
Net asset value, beginning of period | | $ | 48.51 | | |
Income from investment operations: | |
Net investment income | | | 0.46 | | |
Net realized and unrealized gain | | | 10.43 | | |
Total from investment operations | | | 10.89 | | |
Less distributions to shareholders: | |
Net investment income | | | (0.40 | ) | |
Net realized gains | | | (6.00 | ) | |
Total distributions to shareholders | | | (6.40 | ) | |
Net asset value, end of period | | $ | 53.00 | | |
Total return | | | 25.05 | % | |
Ratios to average net assets(b) | |
Total gross expenses | | | 0.81 | %(c)(d) | |
Total net expenses(e) | | | 0.81 | %(c)(d) | |
Net investment income | | | 1.11 | %(c) | |
Supplemental data | |
Net assets, end of period (in thousands) | | $ | 9,095 | | |
Portfolio turnover | | | 55 | % | |
Notes to Financial Highlights
(a) For the period from November 8, 2012 (commencement of operations) to August 31, 2013.
(b) In addition to the fees and expenses which the Fund bears directly, the Fund indirectly bears a pro rata share of the fees and expenses of the acquired funds in which it invests. Such indirect expenses are not included in the reported expense ratios.
(c) Annualized.
(d) Ratios include line of credit interest expense which rounds to less than 0.01%.
(e) Total net expenses include the impact of certain waivers/reimbursements made by the Investment Manager and certain of its affiliates, if applicable.
The accompanying Notes to Financial Statements are an integral part of this statement.
Annual Report 2013
21
Columbia Value and Restructuring Fund
Financial Highlights (continued)
| | | Year ended August 31, | | Year ended March 31, | |
Class W | | 2013 | | 2012(a) | | 2012 | | 2011(b) | |
Per share data | |
Net asset value, beginning of period | | $ | 48.56 | | | $ | 49.56 | | | $ | 53.04 | | | $ | 43.49 | | |
Income from investment operations: | |
Net investment income | | | 0.36 | | | | 0.23 | | | | 0.50 | | | | 0.20 | | |
Net realized and unrealized gain (loss) | | | 9.79 | | | | (1.07 | ) | | | (3.47 | ) | | | 9.53 | | |
Total from investment operations | | | 10.15 | | | | (0.84 | ) | | | (2.97 | ) | | | 9.73 | | |
Less distributions to shareholders: | |
Net investment income | | | (0.41 | ) | | | (0.16 | ) | | | (0.51 | ) | | | (0.18 | ) | |
Net realized gains | | | (6.00 | ) | | | — | | | | — | | | | — | | |
Total distributions to shareholders | | | (6.41 | ) | | | (0.16 | ) | | | (0.51 | ) | | | (0.18 | ) | |
Net asset value, end of period | | $ | 52.30 | | | $ | 48.56 | | | $ | 49.56 | | | $ | 53.04 | | |
Total return | | | 23.49 | % | | | (1.66 | %) | | | (5.50 | %) | | | 22.41 | % | |
Ratios to average net assets(c)(d) | |
Total gross expenses | | | 1.14 | %(e) | | | 1.24 | %(f) | | | 1.22 | %(e) | | | 1.19 | %(e)(f) | |
Total net expenses(g) | | | 1.14 | %(e)(h) | | �� | 1.18 | %(f)(h) | | | 1.17 | %(e)(h) | | | 1.19 | %(e)(f)(h) | |
Net investment income | | | 0.73 | % | | | 1.18 | %(f) | | | 1.04 | % | | | 0.81 | %(f) | |
Supplemental data | |
Net assets, end of period (in thousands) | | $ | 3 | | | $ | 3 | | | $ | 3 | | | $ | 3 | | |
Portfolio turnover | | | 55 | % | | | 64 | % | | | 9 | % | | | 12 | % | |
Notes to Financial Highlights
(a) For the period from April 1, 2012 to August 31, 2012. During the period, the Fund's fiscal year end was changed from March 31 to August 31.
(b) For the period from September 27, 2010 (commencement of operations) to March 31, 2011.
(c) In addition to the fees and expenses which the Fund bears directly, the Fund indirectly bears a pro rata share of the fees and expenses of the acquired funds in which it invests. Such indirect expenses are not included in the reported expense ratios.
(d) Certain line items from prior years have been reclassified to conform to the current presentation.
(e) Ratios include line of credit interest expense which rounds to less than 0.01%.
(f) Annualized.
(g) Total net expenses include the impact of certain waivers/reimbursements made by the Investment Manager and certain of its affiliates, if applicable.
(h) The benefits derived from expense reductions had an impact of less than 0.01%.
The accompanying Notes to Financial Statements are an integral part of this statement.
Annual Report 2013
22
Columbia Value and Restructuring Fund
Financial Highlights (continued)
Class Y | | Year ended
August 31,
2013(a) | |
Per share data | |
Net asset value, beginning of period | | $ | 48.45 | | |
Income from investment operations: | |
Net investment income | | | 0.48 | | |
Net realized and unrealized gain | | | 10.43 | | |
Total from investment operations | | | 10.91 | | |
Less distributions to shareholders: | |
Net investment income | | | (0.42 | ) | |
Net realized gains | | | (6.00 | ) | |
Total distributions to shareholders | | | (6.42 | ) | |
Net asset value, end of period | | $ | 52.94 | | |
Total return | | | 25.12 | % | |
Ratios to average net assets(b) | |
Total gross expenses | | | 0.75 | %(c)(d) | |
Total net expenses(e) | | | 0.75 | %(c)(d) | |
Net investment income | | | 1.12 | %(c) | |
Supplemental data | |
Net assets, end of period (in thousands) | | $ | 795 | | |
Portfolio turnover | | | 55 | % | |
Notes to Financial Highlights
(a) For the period from November 8, 2012 (commencement of operations) to August 31, 2013.
(b) In addition to the fees and expenses which the Fund bears directly, the Fund indirectly bears a pro rata share of the fees and expenses of the acquired funds in which it invests. Such indirect expenses are not included in the reported expense ratios.
(c) Annualized.
(d) Ratios include line of credit interest expense which rounds to less than 0.01%.
(e) Total net expenses include the impact of certain waivers/reimbursements made by the Investment Manager and certain of its affiliates, if applicable.
The accompanying Notes to Financial Statements are an integral part of this statement.
Annual Report 2013
23
Columbia Value and Restructuring Fund
Financial Highlights (continued)
| | | Year ended August 31, | | Year ended March 31, | |
Class Z | | 2013 | | 2012(a) | | 2012 | | 2011 | | 2010 | | 2009 | |
Per share data | |
Net asset value, beginning of period | | $ | 48.57 | | | $ | 49.55 | | | $ | 53.01 | | | $ | 44.66 | | | $ | 26.49 | | | $ | 52.22 | | |
Income from investment operations: | |
Net investment income | | | 0.45 | | | | 0.27 | | | | 0.61 | | | | 0.64 | (b) | | | 0.49 | (b) | | | 0.61 | | |
Net realized and unrealized gain (loss) | | | 9.80 | | | | (1.06 | ) | | | (3.46 | ) | | | 8.37 | | | | 18.15 | | | | (25.71 | ) | |
Total from investment operations | | | 10.25 | | | | (0.79 | ) | | | (2.85 | ) | | | 9.01 | | | | 18.64 | | | | (25.10 | ) | |
Less distributions to shareholders: | |
Net investment income | | | (0.51 | ) | | | (0.19 | ) | | | (0.61 | ) | | | (0.66 | ) | | | (0.47 | ) | | | (0.61 | ) | |
Net realized gains | | | (6.00 | ) | | | — | | | | — | | | | — | | | | — | | | | (0.02 | ) | |
Total distributions to shareholders | | | (6.51 | ) | | | (0.19 | ) | | | (0.61 | ) | | | (0.66 | ) | | | (0.47 | ) | | | (0.63 | ) | |
Proceeds from regulatory settlements | | | — | | | | — | | | | — | | | | — | | | | 0.00 | (c) | | | 0.00 | (c) | |
Net asset value, end of period | | $ | 52.31 | | | $ | 48.57 | | | $ | 49.55 | | | $ | 53.01 | | | $ | 44.66 | | | $ | 26.49 | | |
Total return | | | 23.74 | % | | | (1.57 | %) | | | (5.26 | %) | | | 20.46 | % | | | 70.71 | % | | | (48.39 | %) | |
Ratios to average net assets(d)(e) | |
Total gross expenses | | | 0.96 | %(f) | | | 1.01 | %(g) | | | 0.99 | %(f) | | | 0.95 | %(f) | | | 0.89 | %(f) | | | 0.93 | %(f) | |
Total net expenses(h) | | | 0.96 | %(f)(i) | | | 0.94 | %(g)(i) | | | 0.94 | %(f)(i) | | | 0.95 | %(f)(i) | | | 0.89 | %(f)(i) | | | 0.89 | %(f)(i) | |
Net investment income | | | 0.90 | % | | | 1.36 | %(g) | | | 1.28 | % | | | 1.40 | % | | | 1.28 | % | | | 1.47 | % | |
Supplemental data | |
Net assets, end of period (in thousands) | | $ | 1,954,532 | | | $ | 2,601,708 | | | $ | 3,887,512 | | | $ | 6,583,690 | | | $ | 6,765,345 | | | $ | 4,352,176 | | |
Portfolio turnover | | | 55 | % | | | 64 | % | | | 9 | % | | | 12 | % | | | 6 | % | | | 12 | % | |
Notes to Financial Highlights
(a) For the period from April 1, 2012 to August 31, 2012. During the period, the Fund's fiscal year end was changed from March 31 to August 31.
(b) Net investment income per share reflects special dividends. The effect of these dividends amounted to $$0.18 and $0.04 per share, respectively.
(c) Rounds to zero.
(d) In addition to the fees and expenses which the Fund bears directly, the Fund indirectly bears a pro rata share of the fees and expenses of the acquired funds in which it invests. Such indirect expenses are not included in the reported expense ratios.
(e) Certain line items from prior years have been reclassified to conform to the current presentation.
(f) Ratios include line of credit interest expense which rounds to less than 0.01%.
(g) Annualized.
(h) Total net expenses include the impact of certain waivers/reimbursements made by the Investment Manager and certain of its affiliates, if applicable.
(i) The benefits derived from expense reductions had an impact of less than 0.01%.
The accompanying Notes to Financial Statements are an integral part of this statement.
Annual Report 2013
24
Columbia Value and Restructuring Fund
Notes to Financial Statements
August 31, 2013
Note 1. Organization
Columbia Value and Restructuring Fund (the Fund), a series of Columbia Funds Series Trust I (the Trust), is a diversified fund. The Trust is registered under the Investment Company Act of 1940, as amended (the 1940 Act), as an open-end management investment company organized as a Massachusetts business trust.
Fund Shares
The Trust may issue an unlimited number of shares (without par value). The Fund offers Class A, Class C, Class I, Class R, Class R4, Class R5, Class W, Class Y and Class Z shares. Although all share classes generally have identical voting, dividend and liquidation rights, each share class votes separately when required by law. Different share classes pay different distribution amounts to the extent the expenses of such share classes differ, and distributions in liquidation will be proportional to the net asset value of each share class. Each share class has its own expense structure and sales charges, as applicable.
Class A shares are subject to a maximum front-end sales charge of 5.75% based on the initial investment amount. Class A shares purchased without an initial sales charge in accounts aggregating $1 million to $50 million at the time of purchase are subject to a contingent deferred sales charge (CDSC) if the shares are sold within 18 months of purchase, charged as follows: 1.00% CDSC if redeemed within 12 months of purchase, and 0.50% CDSC if redeemed more than 12, but less than 18, months after purchase.
Class C shares are subject to a 1.00% CDSC on shares redeemed within one year of purchase.
Class I shares are not subject to sales charges and are available only to the Columbia Family of Funds.
Class R shares are not subject to sales charges and are generally available only to certain retirement plans and other eligible investors.
Class R4 shares are not subject to sales charges and are generally available only to omnibus retirement plans and certain other eligible investors. Class R4 shares commenced operations on November 8, 2012.
Class R5 shares are not subject to sales charges and are generally available only to investors purchasing through authorized investment professionals and omnibus retirement plans. Class R5 shares commenced operations on November 8, 2012.
Class W shares are not subject to sales charges and are available only to investors purchasing through authorized investment programs managed by investment professionals, including discretionary managed account programs.
Class Y shares are not subject to sales charges and are generally available only to certain retirement plans. Class Y shares commenced operations on November 8, 2012.
Class Z shares are not subject to sales charges and are available only to certain eligible investors, which are subject to different investment minimums.
Note 2. Summary of Significant Accounting Policies
Use of Estimates
The preparation of financial statements in accordance with U.S. generally accepted accounting principles (GAAP) requires management to make certain estimates and assumptions that affect the reported amounts of assets and liabilities, the disclosure of contingent assets and liabilities at the date of the financial statements and the reported amounts of revenue and expenses during the reporting period. Actual results could differ from those estimates.
The following is a summary of significant accounting policies consistently followed by the Fund in the preparation of its financial statements.
Security Valuation
All equity securities are valued at the close of business of the New York Stock Exchange (NYSE). Equity securities are valued at the last quoted sales price on the principal exchange or market on which they trade, except for securities traded on the NASDAQ Stock Market, which are valued at the NASDAQ official close price. Unlisted securities or listed securities for which there were no sales during the day are valued at the mean of the latest quoted bid and ask prices on such exchanges or markets.
Foreign equity securities are valued based on quotations from the principal market in which such securities are normally traded. If any foreign share prices are not readily available as a result of limited share activity the securities are valued at the mean of the latest quoted bid and ask prices on such exchanges or markets. Foreign currency exchange rates are generally determined at 4:00 p.m. Eastern (U.S.) time. However, many securities markets and exchanges outside the U.S. close prior to the close of the NYSE; therefore, the closing prices for securities in such markets or on such exchanges may not fully reflect events that occur after such close but before the close of the NYSE. In those situations, foreign securities will be fair valued pursuant to the policy adopted by the Board of Trustees (the Board), including utilizing a third party pricing service to determine these fair values. The third party pricing service takes into account multiple factors, including, but not limited to, movements in
Annual Report 2013
25
Columbia Value and Restructuring Fund
Notes to Financial Statements (continued)
August 31, 2013
the U.S. securities markets, certain depositary receipts, futures contracts and foreign exchange rates that have occurred subsequent to the close of the foreign exchange or market, to determine a good faith estimate that reasonably reflects the current market conditions as of the close of the NYSE. The fair value of a security is likely to be different from the quoted or published price, if available.
Investments in open-end investment companies, including money market funds, are valued at net asset value.
Investments for which market quotations are not readily available, or that have quotations which management believes are not reliable, are valued at fair value as determined in good faith under consistently applied procedures established by and under the general supervision of the Board. If a security or class of securities (such as foreign securities) is valued at fair value, such value is likely to be different from the last quoted market price for the security.
The determination of fair value often requires significant judgment. To determine fair value, management may use assumptions including but not limited to future cash flows and estimated risk premiums. Multiple inputs from various sources may be used to determine fair value.
Foreign Currency Transactions and Translations
The values of all assets and liabilities denominated in foreign currencies are translated into U.S. dollars at that day's exchange rates. Net realized and unrealized gains (losses) on foreign currency transactions and translations include gains (losses) arising from the fluctuation in exchange rates between trade and settlement dates on securities transactions, gains (losses) arising from the disposition of foreign currency and currency gains (losses) between the accrual and payment dates on dividends, interest income and foreign withholding taxes.
For financial statement purposes, the Fund does not distinguish that portion of gains (losses) on investments which is due to changes in foreign exchange rates from that which is due to changes in market prices of the investments. Such fluctuations are included with the net realized and unrealized gains (losses) on investments in the Statement of Operations.
Security Transactions
Security transactions are accounted for on the trade date. Cost is determined and gains (losses) are based upon the specific identification method for both financial statement and federal income tax purposes.
Income Recognition
Corporate actions and dividend income are generally recorded net of any non-reclaimable tax withholdings, on the ex-dividend date or upon receipt of ex-dividend notification in the case of certain foreign securities.
Awards from class action litigation are recorded as a reduction of cost basis if the Fund still owns the applicable securities on the payment date. If the Fund no longer owns the applicable securities, the proceeds are recorded as realized gains.
Expenses
General expenses of the Trust are allocated to the Fund and other funds of the Trust based upon relative net assets or other expense allocation methodologies determined by the nature of the expense. Expenses directly attributable to the Fund are charged to the Fund. Expenses directly attributable to a specific class of shares are charged to that share class.
Determination of Class Net Asset Value
All income, expenses (other than class-specific expenses, which are charged to that share class, as shown in the Statement of Operations) and realized and unrealized gains (losses) are allocated to each class of the Fund on a daily basis, based on the relative net assets of each class, for purposes of determining the net asset value of each class.
Federal Income Tax Status
The Fund intends to qualify each year as a regulated investment company under Subchapter M of the Internal Revenue Code, as amended, and will distribute substantially all of its taxable income (including net short-term capital gains), if any, for its tax year, and as such will not be subject to federal income taxes. In addition, the Fund intends to distribute in each calendar year substantially all of its net investment income, capital gains and certain other amounts, if any, such that the Fund should not be subject to federal excise tax. Therefore, no federal income or excise tax provision is recorded.
Foreign Taxes
The Fund may be subject to foreign taxes on income, gains on investments or currency repatriation, a portion of which may be recoverable. The Fund will accrue such taxes and recoveries, as applicable, based upon its current interpretation of tax rules and regulations that exist in the markets in which it invests.
Realized gains in certain countries may be subject to foreign taxes at the Fund level, based on statutory rates. The Fund accrues for such foreign taxes on realized and unrealized gains at the appropriate rate for each jurisdiction, as applicable. The amount, if any, is disclosed as a liability on the Statement of Assets and Liabilities.
Distributions to Shareholders
Distributions from net investment income, if any, are declared and paid each calendar quarter. Net realized capital gains, if any, are distributed at least annually. Income distributions and capital gain distributions are determined in accordance with federal income tax regulations, which may differ from GAAP.
Annual Report 2013
26
Columbia Value and Restructuring Fund
Notes to Financial Statements (continued)
August 31, 2013
Guarantees and Indemnifications
Under the Trust's organizational documents and, in some cases, by contract, its officers and trustees are indemnified against certain liabilities arising out of the performance of their duties to the Trust or its funds. In addition, certain of the Fund's contracts with its service providers contain general indemnification clauses. The Fund's maximum exposure under these arrangements is unknown since the amount of any future claims that may be made against the Fund cannot be determined, and the Fund has no historical basis for predicting the likelihood of any such claims.
Recent Accounting Pronouncement
Disclosures about Offsetting Assets and Liabilities
In December 2011, the Financial Accounting Standards Board (FASB) issued Accounting Standards Update (ASU) No. 2011-11, Disclosures about Offsetting Assets and Liabilities and in January 2013, ASU No. 2013-1, Clarifying the Scope of Disclosures about Offsetting Assets and Liabilities (collectively, the ASUs). Specifically, the ASUs require an entity to disclose both gross and net information for derivatives and other financial instruments that are subject to a master netting arrangement or similar agreement. The ASUs require disclosure of collateral received in connection with the master netting agreements or similar agreements. The disclosure requirements are effective for interim and annual periods beginning on or after January 1, 2013. At this time, management is evaluating the implications of this guidance and the impact it will have on the financial statement amounts and footnote disclosures, if any.
Note 3. Fees and Compensation Paid to Affiliates
Investment Management Fees
Under an Investment Management Services Agreement, Columbia Management Investment Advisers, LLC (the Investment Manager), a wholly-owned subsidiary of Ameriprise Financial, Inc. (Ameriprise Financial), determines which securities will be purchased, held or sold. The investment management fee is an annual fee that is equal to a percentage of the Fund's average daily net assets that declines from 0.69% to 0.54% as the Fund's net assets increase. The effective investment management fee rate for the year ended August 31, 2013 was 0.69% of the Fund's average daily net assets.
Administration Fees
Under an Administrative Services Agreement, the Investment Manager also serves as the Fund Administrator. The Fund pays the Fund Administrator an annual fee for administration and
accounting services equal to a percentage of the Fund's average daily net assets that declines from 0.06% to 0.03% as the Fund's net assets increase. The effective administration fee rate for the year ended August 31, 2013 was 0.06% of the Fund's average daily net assets.
Compensation of Board Members
Board members are compensated for their services to the Fund as disclosed in the Statement of Operations. The Trust's eligible Trustees may participate in a Deferred Compensation Plan (the Plan) which may be terminated at any time. Obligations of the Plan will be paid solely out of the Fund's assets.
Compensation of Chief Compliance Officer
The Board has appointed a Chief Compliance Officer to the Fund in accordance with federal securities regulations. The Fund pays its pro-rata share of the expenses associated with the Chief Compliance Officer. The Fund's expenses for the Chief Compliance Officer will not exceed $15,000 per year.
Transfer Agent Fees
Under a Transfer and Dividend Disbursing Agent Agreement, Columbia Management Investment Services Corp. (the Transfer Agent), an affiliate of the Investment Manager and a wholly-owned subsidiary of Ameriprise Financial, is responsible for providing transfer agency services to the Fund. The Transfer Agent has contracted with Boston Financial Data Services (BFDS) to serve as sub-transfer agent.
The Transfer Agent receives monthly account-based service fees based on the number of open accounts and also receives sub-transfer agency fees based on a percentage of the average aggregate value of the Fund's shares maintained in omnibus accounts (other than omnibus accounts for which American Enterprise Investment Services Inc. is the broker of record or accounts where the beneficial shareholder is a customer of Ameriprise Financial Services, Inc., which are paid a per account fee). The Transfer Agent pays the fees of BFDS for services as sub-transfer agent and is not entitled to reimbursement for such fees from the Fund (with the exception of out-of-pocket fees).
The Transfer Agent also receives compensation from fees for various shareholder services and reimbursements for certain out-of-pocket fees. Class I shares do not pay transfer agent fees. Total transfer agent fees for Class R5 shares are subject to an annual limitation of not more than 0.05% of the average daily net assets attributable to Class R5 shares. Beginning November 8, 2012, Class Y shares are not subject to transfer agent fees for at least twelve months.
Annual Report 2013
27
Columbia Value and Restructuring Fund
Notes to Financial Statements (continued)
August 31, 2013
For the year ended August 31, 2013, the Fund's effective transfer agent fee rates as a percentage of average daily net assets of each class were as follows:
Class A | | | 0.19 | % | |
Class C | | | 0.19 | | |
Class R | | | 0.19 | | |
Class R4 | | | 0.18 | * | |
Class R5 | | | 0.05 | * | |
Class W | | | 0.14 | | |
Class Z | | | 0.19 | | |
*Annualized
An annual minimum account balance fee of $20 may apply to certain accounts with a value below the applicable share class' initial minimum investment requirements to reduce the impact of small accounts on transfer agent fees. These minimum account balance fees are recorded as part of expense reductions in the Statement of Operations. For the year ended August 31, 2013, these minimum account balance fees reduced total expenses by $25,552.
Distribution and Service Fees
The Fund has an agreement with Columbia Management Investment Distributors, Inc. (the Distributor), an affiliate of the Investment Manager and a wholly-owned subsidiary of Ameriprise Financial, for distribution and shareholder services. Pursuant to Rule 12b-1 under the 1940 Act, the Board has approved, and the Fund has adopted, distribution and shareholder service plans (the Plans) which set the distribution and service fees for the Fund. These fees are calculated daily and are intended to compensate the Distributor and/or eligible selling and/or servicing agents for selling shares of the Fund and providing services to investors.
Under the Plans, the Fund pays a monthly service fee to the Distributor at the maximum annual rate of 0.25% of the average daily net assets attributable to Class A, Class C and Class W shares of the Fund. Also under the Plans, the Fund pays a monthly distribution fee to the Distributor at the maximum annual rates of 0.75%, 0.50% and 0.25% of the average daily net assets attributable to Class C, Class R and Class W shares, respectively.
The Fund may pay a distribution fee up to 0.25% of the Fund's average daily net assets attributable to Class W shares and a service fee of up to 0.25% of the Fund's average daily net assets attributable to Class W shares, provided, however, that the aggregate fee shall not exceed 0.25% of the Fund's average daily net assets attributable to Class W shares.
Sales Charges
Sales charges, including front-end charges and CDSCs, received by the Distributor for distributing Fund shares were $32,705 for Class A and $1,757 for Class C shares for the year ended August 31, 2013.
Expenses Waived/Reimbursed by the Investment Manager and its Affiliates
The Investment Manager and certain of its affiliates have contractually agreed to waive fees and/or reimburse expenses (excluding certain fees and expenses described below) for the period disclosed below, unless sooner terminated at the sole discretion of the Board, so that the Fund's net operating expenses, after giving effect to fees waived/expenses reimbursed and any balance credits and/or overdraft charges from the Fund's custodian, do not exceed the following annual rates as a percentage of the class' average daily net assets:
| | | Fee Rates Contractual
through
December 31, 2013 | |
Class A | | | 1.26 | % | |
Class C | | | 2.01 | | |
Class I | | | 0.85 | | |
Class R | | | 1.51 | | |
Class R4 | | | 1.01 | | |
Class R5 | | | 0.90 | | |
Class W | | | 1.26 | | |
Class Y | | | 0.85 | | |
Class Z | | | 1.01 | | |
Under the agreement governing these fee waivers and/or expense reimbursement arrangements, the following fees and expenses are excluded from the waiver/reimbursement commitment, and therefore will be paid by the Fund, if applicable: taxes (including foreign transaction taxes), expenses associated with investments in affiliated and non-affiliated pooled investment vehicles (including mutual funds and exchange traded funds), transaction costs and brokerage commissions, costs related to any securities lending program, dividend expenses associated with securities sold short, inverse floater program fees and expenses, transaction charges and interest on borrowed money, interest, extraordinary expenses and any other expenses the exclusion of which is specifically approved by the Board. This agreement may be modified or amended only with approval from all parties.
Note 4. Federal Tax Information
The timing and character of income and capital gain distributions are determined in accordance with income tax
Annual Report 2013
28
Columbia Value and Restructuring Fund
Notes to Financial Statements (continued)
August 31, 2013
regulations, which may differ from GAAP because of temporary or permanent book to tax differences.
At August 31, 2013, these differences are primarily due to differing treatment for deferral/reversal of wash sales losses, outstanding loss deferrals on identified straddles, partnership adjustments and Trustees' deferred compensation. To the extent these differences are permanent, reclassifications are made among the components of the Fund's net assets in the Statement of Assets and Liabilities. Temporary differences do not require reclassifications. In the Statement of Assets and Liabilities the following reclassifications were made:
Undistributed net investment income | | $ | (295,080 | ) | |
Accumulated net realized gain | | | 1,482,844 | | |
Paid-in capital | | | (1,187,764 | ) | |
Net investment income and net realized gains (losses), as disclosed in the Statement of Operations, and net assets were not affected by this reclassification.
The tax character of distributions paid during the years indicated was as follows:
| | | Year Ended
August 31,
2013 | | Period End
August 31,
2012 | | Year Ended
March 31,
2012 | |
Ordinary income | | $ | 47,692,261 | | | $ | 12,163,340 | | | $ | 66,898,913 | | |
Long-term capital gains | | | 270,403,680 | | | | — | | | | — | | |
Total | | $ | 318,095,941 | | | $ | 12,163,340 | | | $ | 66,898,913 | | |
Short-term capital gain distributions, if any, are considered ordinary income distributions for tax purposes.
At August 31, 2013, the components of distributable earnings on a tax basis were as follows:
Undistributed ordinary income | | $ | 128,870,607 | | |
Undistributed accumulated long-term gain | | | 203,284,933 | | |
Unrealized appreciation | | | 431,659,437 | | |
At August 31, 2013, the cost of investments for federal income tax purposes was $1,670,812,311 and the aggregate gross unrealized appreciation and depreciation based on that cost was:
Unrealized appreciation | | $ | 451,610,317 | | |
Unrealized depreciation | | | (19,950,880 | ) | |
Net unrealized appreciation | | | 431,659,437 | | |
Management of the Fund has concluded that there are no significant uncertain tax positions that would require recognition in the financial statements. However, management's conclusion may be subject to review and adjustment at a later date based on factors including, but not limited to, new tax laws, regulations, and administrative interpretations (including relevant court decisions). Generally,
the Fund's federal tax returns for the prior three fiscal years remain subject to examination by the Internal Revenue Service.
Note 5. Portfolio Information
The cost of purchases and proceeds from sales of securities, excluding short-term obligations, aggregated to $1,295,894,480 and $2,466,596,438, respectively, for the year ended August 31, 2013.
Note 6. Lending of Portfolio Securities
Effective December 19, 2012, the Fund no longer participates in securities lending activity. Prior to that date, the Fund participated, or was eligible to participate, in securities lending activity pursuant to a Master Securities Lending Agreement (the Agreement) with JPMorgan Chase Bank, N.A. (JPMorgan). The Agreement authorized JPMorgan as lending agent to lend securities to authorized borrowers in order to generate additional income on behalf of the Fund. Pursuant to the Agreement, the securities loaned were secured by cash or securities that either were issued or guaranteed as to principal and interest by the U.S. government, its agencies, authorities or instrumentalities with value equal to at least 100% of the market value of the loaned securities. Any additional collateral required to maintain those levels due to market fluctuations of the loaned securities was requested to be delivered the following business day. Cash collateral received was invested by the lending agent on behalf of the Fund into authorized investments pursuant to the Agreement.
Pursuant to the Agreement, the Fund received income for lending its securities either in the form of fees or by earning interest on invested cash collateral, net of negotiated rebates paid to borrowers and fees paid to the lending agent for services provided and any other securities lending expenses. Net income earned from securities lending for the year ended August 31, 2013 is disclosed in the Statement of Operations. The Fund continued to earn and accrue interest and dividends on the securities loaned.
Note 7. Affiliated Money Market Fund
The Fund invests its daily cash balances in Columbia Short-Term Cash Fund, an affiliated money market fund established for the exclusive use by the Fund and other affiliated funds. The income earned by the Fund from such investments is included as "Dividends — affiliated issuers" in the Statement of Operations. As an investing fund, the Fund indirectly bears its proportionate share of the expenses of Columbia Short-Term Cash Fund.
Note 8. Shareholder Concentration
At August 31, 2013, three unaffiliated shareholder accounts owned an aggregate of 62.0% of the outstanding shares of the
Annual Report 2013
29
Columbia Value and Restructuring Fund
Notes to Financial Statements (continued)
August 31, 2013
Fund. The Fund has no knowledge about whether any portion of those shares was owned beneficially by such accounts. Subscription and redemption activity by concentrated accounts may have a significant effect on the operations of the Fund.
Note 9. Line of Credit
The Fund has entered into a revolving credit facility with a syndicate of banks led by JPMorgan whereby the Fund may borrow for the temporary funding of shareholder redemptions or for other temporary or emergency purposes. The credit facility agreement, as amended, which is a collective agreement between the Fund and certain other funds managed by the Investment Manager, severally and not jointly, permits collective borrowings up to $500 million. Interest is charged to each participating fund based on its borrowings at a rate equal to the higher of (i) the overnight federal funds rate plus 1.00% or (ii) the one-month LIBOR rate plus 1.00%. Each borrowing under the credit facility matures no later than 60 days after the date of borrowing. The Fund also pays a commitment fee equal to its pro rata share of the amount of the credit facility at a rate of 0.08% per annum. The commitment fee is included in other expenses in the Statement of Operations.
For the year ended August 31, 2013, the average daily loan balance outstanding on days when borrowing existed was $16,900,000 at a weighted average interest rate of 1.22%. Interest expense incurred by the Fund is recorded as interest expense in the Statement of Operations.
Note 10. Subsequent Events
Management has evaluated the events and transactions that have occurred through the date the financial statements were issued and noted no items requiring adjustment of the financial statements or additional disclosure.
Note 11. Information Regarding Pending and Settled Legal Proceedings
In December 2005, without admitting or denying the allegations, American Express Financial Corporation (AEFC, which is now known as Ameriprise Financial, Inc. (Ameriprise Financial)) entered into settlement agreements with the Securities and Exchange Commission (SEC) and Minnesota Department of Commerce (MDOC) related to market timing activities. As a result, AEFC was censured and ordered to cease and desist from committing or causing any violations of certain provisions of the Investment Advisers Act of 1940, the Investment Company Act of 1940, and various Minnesota laws. AEFC agreed to pay disgorgement of $10 million and civil money penalties of $7 million. AEFC also agreed to retain an independent distribution consultant to assist in developing a plan for distribution of all disgorgement and civil penalties ordered by the SEC in accordance with various undertakings
detailed at www.sec.gov/litigation/admin/ia-2451.pdf. Ameriprise Financial and its affiliates have cooperated with the SEC and the MDOC in these legal proceedings, and have made regular reports to the funds' Boards of Trustees.
Ameriprise Financial and certain of its affiliates have historically been involved in a number of legal, arbitration and regulatory proceedings, including routine litigation, class actions, and governmental actions, concerning matters arising in connection with the conduct of their business activities. Ameriprise Financial believes that the Funds are not currently the subject of, and that neither Ameriprise Financial nor any of its affiliates are the subject of, any pending legal, arbitration or regulatory proceedings that are likely to have a material adverse effect on the Funds or the ability of Ameriprise Financial or its affiliates to perform under their contracts with the Funds. Ameriprise Financial is required to make 10-Q, 10-K and, as necessary, 8-K filings with the Securities and Exchange Commission on legal and regulatory matters that relate to Ameriprise Financial and its affiliates. Copies of these filings may be obtained by accessing the SEC website at www.sec.gov.
There can be no assurance that these matters, or the adverse publicity associated with them, will not result in increased fund redemptions, reduced sale of fund shares or other adverse consequences to the Funds. Further, although we believe proceedings are not likely to have a material adverse effect on the Funds or the ability of Ameriprise Financial or its affiliates to perform under their contracts with the Funds, these proceedings are subject to uncertainties and, as such, we are unable to estimate the possible loss or range of loss that may result. An adverse outcome in one or more of these proceedings could result in adverse judgments, settlements, fines, penalties or other relief that could have a material adverse effect on the consolidated financial condition or results of operations of Ameriprise Financial.
Annual Report 2013
30
Columbia Value and Restructuring Fund
Report of Independent Registered Public Accounting Firm
To the Trustees of Columbia Funds Series Trust I and the Shareholders of
Columbia Value and Restructuring Fund
In our opinion, the accompanying statement of assets and liabilities, including the portfolio of investments, and the related statements of operations and of changes in net assets and the financial highlights present fairly, in all material respects, the financial position of Columbia Value and Restructuring Fund (the "Fund") (a series of Columbia Funds Series Trust I) at August 31, 2013, the results of its operations, the changes in its net assets and the financial highlights for the periods indicated, in conformity with accounting principles generally accepted in the United States of America. These financial statements and financial highlights (hereafter referred to as "financial statements") are the responsibility of the Fund's management. Our responsibility is to express an opinion on these financial statements based on our audits. We conducted our audits of these financial statements in accordance with the standards of the Public Company Accounting Oversight Board (United States). Those standards require that we plan and perform the audit to obtain reasonable assurance about whether the financial statements are free of material misstatement. An audit includes examining, on a test basis, evidence supporting the amounts and disclosures in the financial statements, assessing the accounting principles used and significant estimates made by management, and evaluating the overall financial statement presentation. We believe that our audits, which included confirmation of securities at August 31, 2013 by correspondence with the custodian, brokers and transfer agent, provide a reasonable basis for our opinion.
PricewaterhouseCoopers LLP
Minneapolis, Minnesota
October 22, 2013
Annual Report 2013
31
Columbia Value and Restructuring Fund
Federal Income Tax Information
(Unaudited)
The Fund hereby designates the following tax attributes for the fiscal year ended August 31, 2013. Shareholders will be notified in early 2014 of the amounts for use in preparing 2013 income tax returns.
Tax Designations
| Qualified Dividend Income | | | 32.20 | % | |
| Dividends Received Deduction | | | 29.93 | % | |
| Capital Gain Dividend | | $ | 316,706,597 | | |
Qualified Dividend Income. For taxable, non-corporate shareholders, the percentage of ordinary income dividends paid during the fiscal year that represents qualified dividend income subject to reduced tax rates.
Dividends Received Deduction. The percentage of ordinary income dividends paid during the fiscal year that qualifies for the corporate dividends received deduction.
Capital Gain Dividend. The Fund designates as a capital gain dividend the amount reflected above, or if subsequently determined to be different, the net capital gain of such fiscal period. The Fund also designates as capital gain dividends, to the extent necessary to fully distribute such capital gains, earnings and profits distributed to shareholders on the redemption of shares.
Annual Report 2013
32
Columbia Value and Restructuring Fund
The Trustees serve terms of indefinite duration. The names, addresses and birth years of the Trustees and Officers of the Funds in Columbia Funds Series Trust I, the year each was first elected or appointed to office, their principal business occupations during at least the last five years, the number of Funds overseen by each Trustee and other directorships they hold are shown below. Each officer listed below serves as an officer of each Fund in Columbia Funds Series Trust I.
Independent Trustees
Name, Address and Year of Birth,
Position with Funds, Year First
Elected or Appointed to Office | | Principal Occupation(s) During Past Five Years, Number of Funds in Columbia
Funds Complex Overseen by Trustee, Other Directorships Held | |
Rodman L. Drake (Born 1943)
c/o Columbia Management
Investment Advisers, LLC
225 Franklin Street
Boston, MA 02110
Trustee (since 1994) and
Chairman of the Board (since 2009) | | Independent consultant since 2010; Co-Founder of Baringo Capital LLC (private equity) from 1997 to 2008; Chairman (from 2003 to 2010) and CEO (from 2008 to 2010) of Crystal River Capital, Inc. (real estate investment trust); Oversees 52; Jackson Hewitt Tax Service Inc. (tax preparation services) from 2004 to 2011; Student Loan Corporation (student loan provider) from 2005 to 2010; Celgene Corporation (global biotechnology company); The Helios Funds and Brookfield Funds (closed-end funds); Chimerix, Inc. (biopharmaceutical company) since August 1, 2013; Crystal River Capital, Inc. from 2005 to 2010; Parsons Brinckerhoff from 1995 to 2008; and Apex Silver Mines Ltd. from 2007 to 2009 | |
Douglas A. Hacker (Born 1955)
c/o Columbia Management
Investment Advisers, LLC
225 Franklin Street
Boston, MA 02110
Trustee (since 1996) | | Independent business executive since May 2006; Executive Vice President — Strategy of United Airlines from December 2002 to May 2006; President of UAL Loyalty Services (airline marketing company) from September 2001 to December 2002; Executive Vice President and Chief Financial Officer of United Airlines from July 1999 to September 2001. Oversees 52; Nash Finch Company (food distributor); Aircastle Limited (aircraft leasing); and SeaCube Container Leasing Ltd. (container leasing) | |
Janet Langford Kelly (Born 1957)
c/o Columbia Management
Investment Advisers, LLC
225 Franklin Street
Boston, MA 02110
Trustee (since 1996) | | Senior Vice President, General Counsel and Corporate Secretary, ConocoPhillips (integrated energy company) since September 2007; Deputy General Counsel — Corporate Legal Services, ConocoPhillips from August 2006 to August 2007; Partner, Zelle, Hofmann, Voelbel, Mason & Gette LLP (law firm) from March 2005 to July 2006; Adjunct Professor of Law, Northwestern University from September 2004 to June 2006; Director, UAL Corporation (airline) from February 2006 to July 2006; Chief Administrative Officer and Senior Vice President, Kmart Holding Corporation (consumer goods) from September 2003 to March 2004. Oversees 52; None | |
Nancy T. Lukitsh (Born 1956)
c/o Columbia Management
Investment Advisers, LLC
225 Franklin Street
Boston, MA 02110
Trustee (since 2011) | | Senior Vice President, Partner and Director of Marketing, Wellington Management Company, LLP (investment adviser) from 1997 to 2010; Chair, Wellington Management Investment Portfolios (commingled non-U.S. investment pools) from 2007 to 2010; Director, Wellington Trust Company, NA and other Wellington affiliates from 1997 to 2010. Oversees 52; None | |
William E. Mayer (Born 1940)
c/o Columbia Management
Investment Advisers, LLC
225 Franklin Street
Boston, MA 02110
Trustee (since 1994) | | Partner, Park Avenue Equity Partners (private equity) since February 1999; Dean and Professor, College of Business and Management, University of Maryland from 1992 to 1996. Oversees 52; DynaVox Inc. (speech creation); Lee Enterprises (print media); WR Hambrecht + Co. (financial service provider) from 2000 to 2012; BlackRock Kelso Capital Corporation (investment company) | |
David M. Moffett (Born 1952)
c/o Columbia Management
Investment Advisers, LLC
225 Franklin Street
Boston, MA 02110
Trustee (since 2011) | | Retired. Chief Executive Officer, Federal Home Loan Mortgage Corporation, from 2008 to 2009; Senior Adviser, Global Financial Services Group, Carlyle Group, Inc., from 2007 to 2008; Vice Chairman and Chief Financial Officer, U.S. Bancorp, from 1993 to 2007. Oversees 52; CIT Group Inc. (commercial and consumer finance); eBay Inc. (online trading community); MBIA Inc. (financial service provider); E.W. Scripps Co. (print and television media), Building Materials Holding Corp. (building materials and construction services); Genworth Financial, Inc. (financial and insurance products and services); and University of Oklahoma Foundation | |
Charles R. Nelson (Born 1942)
c/o Columbia Management
Investment Advisers, LLC
225 Franklin Street
Boston, MA 02110
Trustee (since 1981) | | Retired. Professor Emeritus, University of Washington, since 2011; Professor of Economics, University of Washington from 1976 to 2011; Ford and Louisa Van Voorhis Professor of Political Economy, University of Washington from 1993 to 2011; Adjunct Professor of Statistics, University of Washington from 1980 to 2011; Associate Editor, Journal of Money, Credit and Banking from September 1993 to 2008; consultant on econometric and statistical matters. Oversees 52; None | |
John J. Neuhauser (Born 1943)
c/o Columbia Management
Investment Advisers, LLC
225 Franklin Street
Boston, MA 02110
Trustee (since 1984) | | President, Saint Michael's College, since August 2007; Director or Trustee of several non-profit organizations, including Fletcher Allen Health Care, Inc.; University Professor, Boston College from November 2005 to August 2007; Academic Vice President and Dean of Faculties, Boston College from August 1999 to October 2005. Oversees 52; Liberty All-Star Equity Fund and Liberty All-Star Growth Fund (closed-end funds) | |
Annual Report 2013
33
Columbia Value and Restructuring Fund
Trustees and Officers (continued)
Independent Trustees (continued)
Name, Address and Year of Birth,
Position with Funds, Year First
Elected or Appointed to Office | | Principal Occupation(s) During Past Five Years, Number of Funds in Columbia
Funds Complex Overseen by Trustee, Other Directorships Held | |
Patrick J. Simpson (Born 1944)
c/o Columbia Management
Investment Advisers, LLC
225 Franklin Street
Boston, MA 02110
Trustee (since 2000) | | Partner, Perkins Coie LLP (law firm). Oversees 52; None | |
Anne-Lee Verville (Born 1945)
c/o Columbia Management
Investment Advisers, LLC
225 Franklin Street
Boston, MA 02110
Trustee (since 1998) | | Retired. General Manager — Global Education Industry from 1994 to 1997, President — Application Systems Division from 1991 to 1994, Chief Financial Officer — US Marketing & Services from 1988 to 1991, and Chief Information Officer from 1987 to 1988, IBM Corporation (computer and technology). Oversees 52; Enesco Group, Inc. (producer of giftware and home and garden decor products) from 2001 to 2006 | |
Interested Trustee
Name, Address and Year of Birth,
Position with Funds, Year First
Elected or Appointed to Office | | Principal Occupation(s) During Past Five Years, Number of Funds in Columbia
Funds Complex Overseen by Trustee, Other Directorships Held | |
William F. Truscott (born 1960)
53600 Ameriprise Financial Center
Minneapolis, MN 55474
Senior Vice President (since 2012) | | Chairman of the Board and President, Columbia Management Investment Advisers, LLC since May 2010 and February 2012 (previously President and Chief Investment Officer, from 2001 to April 2010); Chief Executive Officer, Global Asset Management, Ameriprise Financial, Inc. since September 2012 (previously, Chief Executive Officer, U.S. Asset Management & President, Annuities, from May 2010 to September 2012 and President — U.S. Asset Management and Chief Investment Officer from 2005 to April 2010); Director and Chief Executive Officer, Columbia Management Investment Distributors, Inc. since May 2010 and February 2012, respectively (previously Chairman of the Board and Chief Executive Officer from 2006 to April 2010); Chairman of the Board and Chief Executive Officer, RiverSource Distributors, Inc. since 2006; President and Chief Executive Officer, Ameriprise Certificate Company, 2006 to August 2012; Oversees 184; Director, Ameriprise Certificate Company, 2006-January 2013 | |
The Statement of Additional Information includes additional information about the Trustees of the Funds and is available, without charge, upon request by calling 800.345.6611.
The Board has appointed officers who are responsible for day-to-day business decisions based on policies it has established. The officers serve at the pleasure of the Board. In addition to Mr. Truscott, who is Senior Vice President, the Funds' other officers are:
Officers
Name, Year of Birth and Address | | Principal Occupation(s) During the Past Five Years | |
J. Kevin Connaughton (Born 1964)
225 Franklin Street
Boston, MA 02110
President (since 2009) | | Senior Vice President and General Manager — Mutual Fund Products, Columbia Management Investment Advisers, LLC since May 2010; President, Columbia Funds since 2009 and RiverSource Funds since May 2010; Managing Director, Columbia Management Advisors, LLC, December 2004-April 2010; Senior Vice President and Chief Financial Officer, Columbia Funds, June 2008-January 2009; Treasurer, Columbia Funds, October 2003-May 2008; and senior officer of various other affiliated funds since 2000 | |
Amy Johnson (Born 1965)
5228 Ameriprise Financial Center
Minneapolis, MN 55474
Vice President (since 2010) | | Senior Vice President and Chief Operating Officer, Columbia Management Investment Advisers, LLC since May 2010 (previously Chief Administrative Officer, from 2009-April 2010, Vice President — Asset Management and Trust Company Services, from 2006-2009) | |
Michael G. Clarke (Born 1969)
225 Franklin Street
Boston, MA 02110
Treasurer (since 2011) and Chief
Financial Officer (since 2009) | | Vice President, Columbia Management Investment Advisers, LLC since May 2010; Managing Director of Fund Administration, Columbia Management Advisors, LLC, September 2004-April 2010; senior officer of Columbia Funds and affiliated funds since 2002 | |
Annual Report 2013
34
Columbia Value and Restructuring Fund
Trustees and Officers (continued)
Officers (continued)
Name, Year of Birth and Address | | Principal Occupation(s) During the Past Five Years | |
Scott R. Plummer (Born 1959)
5228 Ameriprise Financial Center
Minneapolis, MN 55474
Senior Vice President, Assistant
Secretary and Chief Legal Officer
(since 2010) | | Senior Vice President, Chief Legal Officer and Assistant Secretary, Columbia Management Investment Advisers, LLC since June 2005; Senior Vice President and Lead Chief Counsel — Asset Management, Ameriprise Financial, Inc. since May 2010 (previously Vice President and Chief Counsel — Asset Management, 2005-April 2010); Vice President, Chief Counsel and Assistant Secretary, Columbia Management Investment Distributors, Inc. since 2008; Vice President, General Counsel and Secretary, Ameriprise Certificate Company since 2005; Chief Counsel, RiverSource Distributors, Inc. since 2006; senior officer of Columbia Funds and affiliated funds since 2010 | |
Colin Moore (Born 1958)
225 Franklin Street
Boston, MA 02110
Senior Vice President (since 2010) | | Executive Vice President and Global Chief Investment Officer, Ameriprise Financial, Inc. since July 2013; Director and Global Chief Investment Officer, Columbia Management Investment Advisers, LLC since May 2010; Manager, Managing Director and Chief Investment Officer of Columbia Management Advisors, LLC, 2007-April 2010 | |
Thomas P. McGuire (Born 1972)
225 Franklin Street
Boston, MA 02110
Chief Compliance Officer
(since 2012) | | Vice President — Asset Management Compliance, Columbia Management Investment Advisers, LLC since 2010; Chief Compliance Officer, Ameriprise Certificate Company, since September 2010; Compliance Executive, Bank of America, N.A. 2005-2010 | |
Stephen T. Welsh (born 1957)
225 Franklin Street
Boston, MA 02110
Vice President (since 2006) | | President and Director, Columbia Management Investment Services Corp. since May 2010; President and Director, Columbia Management Services, Inc., July 2004-April 2010; Managing Director, Columbia Management Distributors, Inc., August 2007-April 2010 | |
Christopher O. Petersen (born 1970)
5228 Ameriprise Financial Center
Minneapolis, MN 55474
Vice President (since 2010) and
Secretary (since 2011) | | Vice President and Chief Counsel, Ameriprise Financial, Inc. since January 2010 (formerly Vice President and Group Counsel or Counsel, April 2004-January 2010); Assistant Secretary of Columbia Funds, January 2007-April 2011 | |
Paul D. Pearson (born 1956)
10468 Ameriprise Financial Center
Minneapolis, MN 55474
Vice President and Assistant
Treasurer (since 2011) | | Vice President, Investment Accounting, Columbia Management Investment Advisers, LLC, since May 2010; Vice President — Managed Assets, Investment Accounting, Ameriprise Financial, Inc., February 1998-May 2010 | |
Joseph F. DiMaria (Born 1968)
225 Franklin Street
Boston, MA 02110
Vice President (since 2011) and
Chief Accounting Officer (since 2008) | | Vice President, Mutual Fund Administration, Columbia Management Investment Advisers, LLC, since May 2010; Director of Fund Administration, Columbia Management Advisors, LLC, January 2006-April 2010 | |
Paul B. Goucher (born 1968)
100 Park Avenue
New York, NY 10017
Vice President and Assistant
Secretary (since 2010) | | Vice President and Lead Chief Counsel, Ameriprise Financial, Inc. since November 2008 and January 2013, respectively (formerly, Chief Counsel from January 2010-January 2013 and Group Counsel from November 2008-January 2010); Director, Managing Director and General Counsel, J. & W. Seligman & Co. Incorporated, July 2008-November 2008 (previously, Managing Director and Associate General Counsel, January 2005-July 2008) | |
Michael E. DeFao (born 1968)
225 Franklin Street
Boston, MA 02110
Vice President and Assistant
Secretary (since 2011) | | Vice President and Chief Counsel, Ameriprise Financial, Inc. since May 2010; Associate General Counsel, Bank of America, N.A. June 2005-April 2010 | |
Annual Report 2013
35
Columbia Value and Restructuring Fund
Board Consideration and Approval of
Advisory Agreement
On June 14, 2013, the Board of Trustees (the "Board") and the Trustees who are not interested persons (as defined in the Investment Company Act of 1940) of the Trust (the "Independent Trustees") unanimously approved the continuation of the Investment Management Services Agreement (the "Advisory Agreement") with Columbia Management Investment Advisers, LLC (the "Investment Manager") with respect to Columbia Value and Restructuring Fund (the "Fund"), a series of the Trust. As detailed below, the Advisory Fees and Expenses Committee (the "Committee") and the Board met on multiple occasions to review and discuss, both among themselves and with the management team of the Investment Manager, materials provided by the Investment Manager before determining to approve the continuation of the Advisory Agreement.
In connection with their deliberations regarding the continuation of the Advisory Agreement, the Committee and the Board evaluated materials requested from the Investment Manager regarding the Fund and the Advisory Agreement, and discussed these materials with representatives of the Investment Manager at Committee meetings held on March 5, 2013, April 24, 2013 and June 13, 2013, and at the Board meeting held on June 14, 2013. In addition, the Board considers matters bearing on the Advisory Agreement at most of its other meetings throughout the year and meets regularly with senior management of the Funds and the Investment Manager. Through the Board's Investment Oversight Committees, Trustees also meet with selected Fund portfolio managers and other investment personnel at various times throughout the year. The Committee and the Board also consulted with Fund counsel and with the Independent Trustees' independent legal counsel, who advised on various matters with respect to the Committee's and the Board's considerations and otherwise assisted the Committee and the Board in their deliberations. On June 13, 2013, the Committee recommended that the Board approve the continuation of the Advisory Agreement. On June 14, 2013, the Board, including the Independent Trustees, voting separately, unanimously approved the continuation of the Advisory Agreement for the Fund.
The Committee and the Board considered all information that they, their legal counsel, or the Investment Manager believed reasonably necessary to evaluate and to determine whether to approve the continuation of the Advisory Agreement. The information and factors considered by the Committee and the Board in recommending for approval or approving the continuation of the Advisory Agreement for the Fund included the following:
• Information on the investment performance of the Fund relative to the performance of a group of mutual funds determined to be comparable to the Fund by an independent third-party data provider, as well as performance relative to benchmarks;
• Information on the Fund's advisory fees and total expenses, including information comparing the Fund's expenses to those of a group of comparable mutual funds, as determined by the independent third-party data provider;
• The Investment Manager's agreement to contractually limit or cap total operating expenses for the Fund so that total operating expenses (excluding certain fees and expenses, such as transaction costs and certain other investment related expenses, interest, taxes, acquired fund fees and expenses, and extraordinary expenses) would not exceed the median expenses of a group of comparable funds (as determined from time to time, generally annually, by the independent third-party data provider);
• The terms and conditions of the Advisory Agreement;
• The terms and conditions of other agreements and arrangements with affiliates of the Investment Manager relating to the operations of the Fund, including the Administrative Services Agreement, the Distribution Agreement and the Transfer and Dividend Disbursing Agent Agreement;
• Descriptions of various functions performed by the Investment Manager under the Advisory Agreement, including portfolio management and portfolio trading practices;
• Information regarding the management fees and investment performance of comparable portfolios of other clients of the Investment Manager, including institutional separate accounts;
• Information regarding the reputation, regulatory history and resources of the Investment Manager, including information regarding senior management, portfolio managers and other personnel;
• Information regarding the capabilities of the Investment Manager with respect to compliance monitoring services, including an assessment of the Investment Manager's compliance system by the Fund's Chief Compliance Officer; and
• The profitability to the Investment Manager and its affiliates from their relationships with the Fund.
Annual Report 2013
36
Columbia Value and Restructuring Fund
Board Consideration and Approval of
Advisory Agreement (continued)
Nature, Extent and Quality of Services Provided under the Advisory Agreement
The Committee and the Board considered the nature, extent and quality of services provided to the Fund by the Investment Manager and its affiliates under the Advisory Agreement and under separate agreements for the provision of transfer agency and administrative services, and the resources dedicated to the Fund and the other Columbia Funds by the Investment Manager and its affiliates. The Committee and the Board considered, among other things, the Investment Manager's ability to attract, motivate and retain highly qualified research, advisory and supervisory investment professionals (including personnel and other resources, compensation programs for personnel involved in fund management, reputation and other attributes), the portfolio management services provided by those investment professionals, and the quality of the Investment Manager's investment research capabilities and trade execution services. The Committee and the Board also considered the potential benefits to shareholders of investing in a mutual fund that is part of a fund complex offering exposure to a variety of asset classes and investment disciplines and providing a variety of fund and shareholder services.
The Committee and the Board also considered the professional experience and qualifications of the senior personnel of the Investment Manager, which included consideration of the Investment Manager's experience with similarly-structured funds. The Committee and the Board noted the compliance programs of and the compliance-related resources provided to the Fund by the Investment Manager and its affiliates, and considered the Investment Manager's ability to provide administrative services to the Fund pursuant to a separate Administrative Services Agreement, including the Investment Manager's ability to coordinate the activities of the Fund's other service providers. After reviewing these and related factors, the Committee and the Board concluded, within the context of their overall conclusions, that the nature, extent and quality of the services provided to the Fund under the Advisory Agreement supported the continuation of the Advisory Agreement.
Investment Performance
The Committee and the Board reviewed information about the performance of the Fund over various time periods, including performance information relative to benchmarks and information based on reports of the independent third-party data provider that compared the performance of the Fund to the performance of a group of comparable mutual funds. The Committee and the Board also reviewed a description of the third party's methodology for identifying the Fund's peer groups for purposes of performance and expense comparisons. Although the Fund's performance lagged that of a relevant peer group for certain (although not necessarily all) periods, the Committee and the Board concluded that other factors relevant to performance were sufficient, in light of other considerations, to warrant continuation of the Fund's Advisory Agreement. Those factors included one or more of the following: (i) that the Fund's performance, although lagging in certain recent periods, was stronger over the longer term; (ii) that the underperformance was attributable, to a significant extent, to investment decisions that were reasonable and consistent with the Fund's investment strategy and policies and that the Fund was performing within a reasonable range of expectations, given those investment decisions, market conditions and the Fund's investment strategy; (iii) that the Fund's performance was competitive when compared to other relevant performance benchmarks or peer groups; and (iv) that the Investment Manager had taken or was taking steps designed to help improve the Fund's investment performance, including, but not limited to, replacing portfolio managers, enhancing the resources supporting the portfolio managers, or modifying investment strategies.
The Committee and the Board noted that, through December 31, 2012, the Fund's performance was in the 65th, 89th and 83rd percentile (where the best performance would be in the first percentile) of its category selected by the independent third-party data provider for the purposes of performance comparisons for the one-, three- and five- year periods, respectively.
The Committee and the Board also considered the Investment Manager's performance and reputation generally, the Investment Manager's historical responsiveness to Board concerns about performance, and the Investment Manager's willingness to take steps intended to improve performance. After reviewing these and related factors, the Committee and the Board concluded, within the context of their overall conclusions, that the performance of the Fund and the Investment Manager was sufficient, in light of other considerations, to warrant the continuation of the Advisory Agreement.
Investment Advisory Fee Rates and Other Expenses
The Committee and the Board considered the advisory fees charged to the Fund under the Advisory Agreement as well as the total expenses incurred by the Fund. In assessing the reasonableness of the fees under the Advisory Agreement, the Committee and the Board considered, among other information, the Fund's advisory fee and its total expense ratio as a
Annual Report 2013
37
Columbia Value and Restructuring Fund
Board Consideration and Approval of
Advisory Agreement (continued)
percentage of average daily net assets. The Committee and the Board noted that the Fund's actual management fee and net expense ratio are ranked in the 3rd and 2nd quintiles, respectively, (where the lowest fees and expenses would be in the first quintile) against the Fund's expense universe as determined by the independent third-party data provider for purposes of expense comparison. The Committee and the Board also took into account the fee waiver and expense limitation arrangements agreed to by the Investment Manager, as noted above.
The Committee and the Board also received and considered information about the advisory fees charged by the Investment Manager to institutional separate accounts. In considering the fees charged to those accounts, the Committee and the Board took into account, among other things, the Investment Manager's representations about the differences between managing mutual funds as compared to other types of accounts, including differences in the services provided, differences in the risk profile of such business for the Investment Manager and the additional resources required to manage mutual funds effectively. In evaluating the Fund's advisory fees, the Committee and the Board also took into account the demands, complexity and quality of the investment management of the Fund.
After reviewing these and related factors, the Committee and the Board concluded, within the context of their overall conclusions, that the advisory fee rates and expenses of the Fund supported the continuation of the Advisory Agreement.
Costs of Services Provided and Profitability
The Committee and the Board also took note of the costs of the services provided (both on an absolute and relative basis) and the profitability to the Investment Manager and its affiliates in connection with their relationships with the Fund. In evaluating these considerations, the Committee and the Board took note of the advisory fees charged by the Investment Manager to other clients, including fees charged by the Investment Manager to institutional separate account clients with similar investment strategies to those of the Fund.
The Committee and the Board also considered the compensation directly or indirectly received by the Investment Manager's affiliates in connection with their relationships with the Fund. The Committee and the Board reviewed information provided by management as to the profitability of the Investment Manager and its affiliates of their relationships with the Fund, information about the allocation of expenses used to calculate profitability, and comparisons of profitability levels realized in 2012 to profitability levels realized in 2011. When reviewing profitability, the Committee and the Board also considered court cases in which adviser profitability was an issue in whole or in part, the performance of the Fund, the expense ratio of the Fund, and the implementation of expense limitations with respect to the Fund. The Committee and the Board also considered information provided by the Investment Manager regarding its financial condition and comparing its profitability to that of other asset management firms that are, or are subsidiaries of, publicly traded companies.
After reviewing these and related factors, the Committee and the Board concluded, within the context of their overall conclusions, that the costs of services provided and the profitability to the Investment Manager and its affiliates from their relationships with the Fund supported the continuation of the Advisory Agreement.
Economies of Scale
The Committee and the Board considered the potential existence of economies of scale in the provision by the Investment Manager of services to the Fund, to groups of related funds, and to the Investment Manager's investment advisory clients as a whole, and whether those economies of scale were shared with the Fund through breakpoints in investment advisory fees or other means, such as expense limitation arrangements and additional investments by the Investment Manager in investment, trading and compliance resources. The Committee and the Board noted that the investment advisory fee schedules for the Fund contained breakpoints that would reduce the fee rate on assets above specified threshold levels.
In considering these matters, the Committee and the Board also considered the costs of the services provided and the profitability to the Investment Manager and its affiliates from their relationships with the Fund, as discussed above. After reviewing these and related factors, the Committee and the Board concluded, within the context of their overall conclusions, that the extent to which any economies of scale were expected to be shared with the Fund supported the continuation of the Advisory Agreement.
Annual Report 2013
38
Columbia Value and Restructuring Fund
Board Consideration and Approval of
Advisory Agreement (continued)
Other Benefits to the Investment Manager
The Committee and the Board received and considered information regarding "fall-out" or ancillary benefits received by the Investment Manager and its affiliates as a result of their relationships with the Fund, such as the engagement of the Investment Manager to provide administrative services to the Fund and the engagement of the Investment Manager's affiliates to provide distribution and transfer agency services to the Fund. The Committee and the Board considered that the Fund's distributor retains a portion of the distribution fees from the Fund. The Committee and the Board also considered the benefits of research made available to the Investment Manager by reason of brokerage commissions generated by the Fund's securities transactions, and reviewed information about the Investment Manager's practices with respect to allocating portfolio transactions for brokerage and research services. The Committee and the Board considered the possible conflicts of interest associated with certain fall-out or other ancillary benefits and the reporting, disclosure and other processes that are in place to address such possible conflicts of interest. The Committee and the Board recognized that the Investment Manager's profitability would be somewhat lower without these benefits.
Conclusion
The Committee and the Board reviewed all of the above considerations in reaching their decisions to recommend or approve the continuation of the Advisory Agreement. In their deliberations, the Trustees did not identify any particular information that was all-important or controlling, and individual Trustees may have attributed different weights to the various factors. Based on their evaluation of all factors that they deemed to be material, including those factors described above, and assisted by the advice of independent legal counsel, the Board, including the Independent Trustees, voting separately, unanimously approved the continuation of the Advisory Agreement.
Annual Report 2013
39
This page intentionally left blank.
Annual Report 2013
40
Columbia Value and Restructuring Fund
Important Information About This Report
Each fund mails one shareholder report to each shareholder address. If you would like more than one report, please call shareholder services at 800.345.6611 and additional reports will be sent to you.
The policy of the Board is to vote the proxies of the companies in which each fund holds investments consistent with the procedures as stated in the Statement of Additional Information (SAI). You may obtain a copy of the SAI without charge by calling 800.345.6611; contacting your financial intermediary; visiting columbiamanagement.com; or searching the website of the Securities and Exchange Commission (SEC) at sec.gov. Information regarding how each fund voted proxies relating to portfolio securities is filed with the SEC by August 31 for the most recent 12-month period ending June 30 of that year, and is available without charge by visiting columbiamanagement.com; or searching the website of the SEC at sec.gov.
Each fund files a complete schedule of portfolio holdings with the SEC for the first and third quarters of each fiscal year on Form N-Q. Each fund's Form N-Q is available on the SEC's website at sec.gov and may be reviewed and copied at the SEC's Public Reference Room in Washington, D.C. Information on the operation of the Public Reference Room may be obtained by calling 800.SEC.0330. Each fund's complete schedule of portfolio holdings, as filed on Form N-Q, can also be obtained without charge, upon request, by calling 800.345.6611.
Annual Report 2013
41

Columbia Value and Restructuring Fund
P.O. Box 8081
Boston, MA 02266-8081
columbiamanagement.com
This information is for use with concurrent or prior delivery of a fund prospectus. Please read and consider the investment objectives, risks, charges and expenses for any fund carefully before investing. For a prospectus which contains this and other important information about the Fund go to columbiamanagement.com. The Fund is distributed by Columbia Management Investment Distributors, Inc., member FINRA, and managed by Columbia Management Investment Advisers, LLC.
© 2013 Columbia Management Investment Advisers, LLC. All rights reserved.
ANN238_08_C01_(10/13)
Annual Report
August 31, 2013

Columbia Global Energy and Natural Resources Fund
Not FDIC insured • No bank guarantee • May lose value
 Dear Shareholders,
A return to volatility
Volatility returned to the financial markets in the second quarter of 2013, as uncertainty about the global economy, monetary policy and the impact of the sequester's spending cuts weighed on investors. Households advanced their spending but also allocated less to savings. Labor markets continued to crank out jobs at a steady pace, slowly reducing unemployment. Housing activity remained strong and retail sales were higher despite no real increase in income. The single weak spot was in the manufacturing sector, where activity slowed. While the consumer has weathered the domestic drag well, business has been closer to the global slowdown and effects of sequestration. Businesses remain very cautious, keeping inventories and staffs lean, and are planning for but not yet confident enough to make capital expenditures.
Against this backdrop, equities outperformed fixed income during the second quarter of 2013. Small-cap stocks outperformed large- and mid-cap stocks, and growth outperformed value except for in the large-cap sector. Outside the United States, foreign stock markets generally lost ground, with the most significant losses sustained by emerging markets.
Columbia Management to begin delivering summary prospectuses
Each Columbia fund is required to update its prospectus on an annual basis. Beginning with June 2013 prospectus updates, shareholders of Columbia retail mutual funds will start to receive a summary prospectus, rather than the full length (statutory) mutual fund prospectus they have received in the past.
Each fund's summary prospectus will include the following key information:
> Investment objective
> Fee and expense table
> Portfolio turnover rate information
> Principal investment strategies, principal risks and performance information
> Management information
> Purchase and sale information
> Tax information
> Financial intermediary compensation information
Each fund's statutory prospectus will contain additional information about the fund and its risks. Both the statutory and summary prospectus will be updated each year, and will be available at columbiamanagement.com. Shareholders may request a printed version of a statutory prospectus at no cost by calling 800.345.6611 or sending an email to serviceinquiries@columbiamanagement.com.
Stay on track with Columbia Management
Backed by more than 100 years of experience, Columbia Management is one of the nation's largest asset managers. At the heart of our success — and, most importantly, that of our investors — are highly talented industry professionals, brought together by a unique way of working. We are dedicated to helping you take advantage of today's opportunities and anticipate tomorrow's. We stay abreast of the latest investment trends and ideas, using our collective insight to evaluate events and transform them into solutions you can use.
Visit columbiamanagement.com for:
> The Columbia Management Perspectives blog, featuring timely posts by our investment teams
> Detailed up-to-date fund performance and portfolio information
> Economic analysis and market commentary
> Quarterly fund commentaries
> Columbia Management Investor, our award-winning quarterly newsletter for shareholders
Thank you for your continued support of the Columbia Funds. We look forward to serving your investment needs for many years to come.
Best Regards,

J. Kevin Connaughton
President, Columbia Funds
Investors should consider the investment objectives, risks, charges and expenses of a mutual fund carefully before investing. For a free prospectus, which contains this and other important information about a fund, visit columbiamanagement.com. The prospectus should be read carefully before investing.
Columbia Funds are distributed by Columbia Management Investment Distributors, Inc., member FINRA, and managed by Columbia Management Investment Advisers, LLC.
© 2013 Columbia Management Investment Advisers, LLC. All rights reserved.
Columbia Global Energy and Natural Resources Fund
Performance Overview | | | 2 | | |
Manager Discussion of Fund Performance | | | 4 | | |
Understanding Your Fund's Expenses | | | 6 | | |
Portfolio of Investments | | | 7 | | |
Statement of Assets and Liabilities | | | 12 | | |
Statement of Operations | | | 14 | | |
Statement of Changes in Net Assets | | | 15 | | |
Financial Highlights | | | 18 | | |
Notes to Financial Statements | | | 27 | | |
Report of Independent Registered
Public Accounting Firm | | | 38 | | |
Federal Income Tax Information | | | 39 | | |
Trustees and Officers | | | 40 | | |
Board Consideration and Approval of Advisory Agreement | | | 43 | | |
Important Information About This Report | | | 49 | | |
Fund Investment Manager
Columbia Management Investment
Advisers, LLC
225 Franklin Street
Boston, MA 02110
Fund Distributor
Columbia Management Investment
Distributors, Inc.
225 Franklin Street
Boston, MA 02110
Fund Transfer Agent
Columbia Management Investment
Services Corp.
P.O. Box 8081
Boston, MA 02266-8081
For more information about any of the funds, please visit columbiamanagement.com or call 800.345.6611. Customer Service Representatives are available to answer your questions Monday through Friday from 8 a.m. to 8 p.m. Eastern time.
The views expressed in this report reflect the current views of the respective parties. These views are not guarantees of future performance and involve certain risks, uncertainties and assumptions that are difficult to predict, so actual outcomes and results may differ significantly from the views expressed. These views are subject to change at any time based upon economic, market or other conditions and the respective parties disclaim any responsibility to update such views. These views may not be relied on as investment advice and, because investment decisions for a Columbia Fund are based on numerous factors, may not be relied on as an indication of trading intent on behalf of any particular Columbia Fund. References to specific securities should not be construed as a recommendation or investment advice.
Columbia Global Energy and Natural Resources Fund
Performance Summary
> Columbia Global Energy and Natural Resources Fund (the Fund) Class A shares returned 5.54% excluding sales charges for the 12-month period ended August 31, 2013.
> The Fund lagged the Blended Benchmark and the S&P North American Natural Resources Sector Index, which returned 6.34% and 9.13%, respectively, during the 12-month period.
> Positioning in the metals and mining group hurt performance relative to the Blended Benchmark as did the Fund's currency hedging strategy. The Fund's global exposure detracted from results versus the S&P North American Natural Resources Sector Index, as U.S. stocks outperformed most international securities during the 12-month period.
Average Annual Total Returns (%) (for period ended August 31, 2013)
| | Inception | | 1 Year | | 5 Years | | 10 Years | |
Class A* | | 09/28/07 | | | | | | | | | | | | | |
Excluding sales charges | | | | | | | 5.54 | | | | -3.05 | | | | 11.29 | | |
Including sales charges | | | | | | | -0.51 | | | | -4.19 | | | | 10.63 | | |
Class B* | | 03/07/11 | | | | | | | | | | | | | |
Excluding sales charges | | | | | | | 4.70 | | | | -3.87 | | | | 10.29 | | |
Including sales charges | | | | | | | -0.30 | | | | -4.26 | | | | 10.29 | | |
Class C* | | 09/28/07 | | | | | | | | | | | | | |
Excluding sales charges | | | | | | | 4.75 | | | | -3.76 | | | | 10.48 | | |
Including sales charges | | | | | | | 3.75 | | | | -3.76 | | | | 10.48 | | |
Class I* | | 09/27/10 | | | 6.06 | | | | -2.66 | | | | 11.63 | | |
Class K* (formerly Class R4) | | 03/07/11 | | | 5.71 | | | | -2.96 | | | | 11.32 | | |
Class R* | | 09/27/10 | | | 5.27 | | | | -3.32 | | | | 10.93 | | |
Class R4* | | 11/08/12 | | | 5.79 | | | | -2.80 | | | | 11.55 | | |
Class R5* | | 11/08/12 | | | 5.92 | | | | -2.78 | | | | 11.56 | | |
Class Z | | 12/31/92 | | | 5.80 | | | | -2.80 | | | | 11.55 | | |
Blended Benchmark | | | | | | | 6.34 | | | | -0.22 | | | | 10.41 | | |
S&P North American Natural Resources Sector Index | | | | | | | 9.13 | | | | 0.77 | | | | 12.10 | | |
Returns for Class A shown with and without the maximum initial sales charge of 5.75%. Returns for Class B are shown with and without the applicable contingent deferred sales charge (CDSC) of 5.00% in the first year, declining to 1.00% in the sixth year and eliminated thereafter. Returns for Class C are shown with and without the 1.00% CDSC for the first year only. The Fund's other classes are not subject to sales charges and have limited eligibility. Please see the Fund's prospectus for details. Performance for different share classes will vary based on differences in sales charges and fees associated with each class. All results shown assume reinvestment of distributions during the period. Returns do not reflect the deduction of taxes that a shareholder may pay on Fund distributions or on the redemption of Fund shares. Performance results reflect the effect of any fee waivers or reimbursements of Fund expenses by Columbia Management Investment Advisers, LLC and/or any of its affiliates. Absent these fee waivers or expense reimbursement arrangements, performance results would have been lower.
The performance information shown represents past performance and is not a guarantee of future results. The investment return and principal value of your investment will fluctuate so that your shares, when redeemed, may be worth more or less than their original cost. Current performance may be lower or higher than the performance information shown. You may obtain performance information current to the most recent month-end by contacting your financial intermediary, visiting columbiamanagement.com or calling 800.345.6611.
*The returns shown for periods prior to the share class inception date (including returns for the Life of the Fund, if shown, which are since Fund inception) include the returns of the Fund's oldest share class. These returns are adjusted to reflect any higher class-related operating expenses of the newer share classes, as applicable. Please visit columbiamanagement.com/mutual-funds/appended-performance for more information.
The Blended Benchmark, a weighted custom composite, established by the Investment Manager, consists of a 60% weighting in the MSCI World Energy Sector Index (Net) and a 40% weighting in the MSCI World Materials Sector Index (Net). The MSCI World Energy Sector Index (Net) is a free float-adjusted market capitalization weighted index that represents the energy segment in global developed market equity performance. The MSCI World Materials Sector Index (Net) is a free float-adjusted market capitalization weighted index that represents the materials segment in global developed-market equity performance.
The S&P North American Natural Resources Sector Index is a modified market capitalization-weighted equity index designed as a benchmark for U.S. traded securities in the natural resources sector. The index includes companies involved in the following categories: extractive industries, energy companies, owners and operators of timber tracts, forestry services, producers of pulp and paper and owners of plantations.
Indices are not available for investment, are not professionally managed and do not reflect sales charges, fees, brokerage commissions, taxes or other expenses of investing. Securities in the Fund may not match those in an index.
Annual Report 2013
2
Columbia Global Energy and Natural Resources Fund
Performance Overview (continued)
Performance of a Hypothetical $10,000 Investment (September 1, 2003 – August 31, 2013)

The chart above shows the change in value of a hypothetical $10,000 investment in Class A shares of Columbia Global Energy and Natural Resources Fund during the stated time period, and does not reflect the deduction of taxes that a shareholder may pay on Fund distributions or on the redemption of Fund shares.
Annual Report 2013
3
Columbia Global Energy and Natural Resources Fund
Manager Discussion of Fund Performance
On August 5, 2013, Columbia Energy and Natural Resources Fund was renamed Columbia Global Energy and Natural Resources Fund to reflect its global investment mandate.
For the 12-month period that ended August 31, 2013, the Fund's Class A shares returned 5.54% excluding sales charges. The Fund underperformed its Blended Benchmark, a 60/40 mix of the MSCI World Energy Index (net) and the MSCI World Materials Index (Net), which returned 6.34% during the same 12-month period. The Fund also lagged the S&P North American Natural Resources Sector Index, which returned 9.13% for the same time period. We believe the Blended Benchmark is a better comparative measure for the Fund, as it more closely reflects the Fund's global investment mandate. During this 12-month period, the Fund's positioning in the metals and mining group generally accounted for the modest shortfall relative to the Blended Benchmark. The Fund's global exposure hampered performance compared to the S&P Natural Resources and Energy Sector Index, as U.S. stocks outperformed most international markets during the 12-month period. Currency hedging detracted from results versus both benchmarks.
Energy and Materials Stocks Lagged
The MSCI World Energy Index (Net) climbed 7.58% over the one-year period, compared to the 17.63% gain of the MSCI World Index, which measures the broad global equity market. A supply glut in U.S. mid continent kept a lid on U.S. oil prices until late June, when new pipeline capacity opened up. Overseas oil prices were volatile but remained higher than in the United States, especially given late-period geopolitical tensions in the Middle East. Natural gas prices climbed modestly during last year's cold winter, but stayed relatively low as U.S. supply exceeded demand. The MSCI World Materials Index (Net) advanced 4.21% over the one-year period. Chemicals stocks rallied, fueled by a cost advantage from low domestic natural gas input prices. However, metals and mining stocks declined, pressured by slowing economic growth in China and emerging markets, a stronger U.S. dollar and low inflation.
Gain from Positioning in Energy
An overweight and favorable security selection in energy aided performance versus the Blended Benchmark. Stock picks among exploration and production companies helped the most. Standouts included Anadarko Petroleum, which benefited from the company's recent successful exploration activity and monetization of previously discovered resources. Shares of EOG Resources also rose sharply, buoyed by the company's early adoption of new production techniques. Above-average exposure and positive security selection in the refining segment further aided results. Winners included U.S.-based Phillips 66 and Marathon Petroleum, both of which profited from low U.S. oil prices and higher global product prices.
Disappointments from Materials and Currency Hedges
The Fund lost ground in metals and mining, mostly in the diversified metals and mining and gold segments. Individual detractors included British-Australian multinational mining giant Rio Tinto, whose stock fell due to a first-half profit shortfall and concern over the potential for slowing demand. In the gold group, positions in Canada-based gold miners Barrick Gold and Agnico Eagle Mines
Portfolio Management
Colin Moore, AIIMR
Josh Kapp, CFA
Jonathan Mogil, CFA
Morningstar Style BoxTM
The Morningstar Style BoxTM is based on a fund's portfolio holdings. For equity funds, the vertical axis shows the market capitalization of the stocks owned, and the horizontal axis shows investment style (value, blend, or growth). Information shown is based on the most recent data provided by Morningstar.
©2013 Morningstar, Inc. All rights reserved. The Morningstar information contained herein: (1) is proprietary to Morningstar and/or its content providers; (2) may not be copied or distributed; and (3) is not warranted to be accurate, complete or timely. Neither Morningstar nor its content providers are responsible for any damages or losses arising from any use of this information.
Top Ten Holdings (%)
(at August 31, 2013) | |
Exxon Mobil Corp.
(United States) | | | 6.5 | | |
Chevron Corp. (United States) | | | 6.5 | | |
Dow Chemical Co. (The)
(United States) | | | 5.2 | | |
Rio Tinto PLC (United Kingdom) | | | 3.0 | | |
BP PLC (United Kingdom) | | | 3.0 | | |
Anadarko Petroleum Corp.
(United States) | | | 3.0 | | |
LyondellBasell Industries NV,
Class A (United States) | | | 2.7 | | |
Monsanto Co. (United States) | | | 2.5 | | |
Schlumberger Ltd.
(United States) | | | 2.5 | | |
Celanese Corp.,
Class A (United States) | | | 2.5 | | |
Percentages indicated are based upon total investments (excluding Money Market Funds).
For further detail about these holdings, please refer to the section entitled "Portfolio of Investments."
Fund holdings are as of the date given, are subject to change at any time, and are not recommendations to buy or sell any security.
Annual Report 2013
4
Columbia Global Energy and Natural Resources Fund
Manager Discussion of Fund Performance (continued)
detracted from results, as gold prices slid and production fell short of expectations. Results in the chemicals group also hindered performance. An investment in fertilizer and agricultural chemicals company Mosaic detracted, as the stock plunged when a leading industry competitor in Russia decided it would set its own potash prices to gain market share. Top contributors came from a mix of materials segments. Shares of industrial gas company Air Products & Chemicals rallied, as the company's attractive valuation, expansion in emerging markets, cost cutting and stock buybacks drew investor interest. Diversified U.S-based chemicals giant Dow Chemical posted a strong gain, fueled by low domestic natural gas prices that gave it a cost advantage over European competitors. Elsewhere, the Fund's use of long and short forward foreign currency contracts to neutralize the long-term impact of currency movements on returns hampered near-term performance, as the U.S. dollar strengthened against major currencies.
Looking Ahead
The Fund ended the year with an overweight in energy and an underweight in materials, but close to the 60/40 mix in the Blended Benchmark. Within energy, we've favored oil-related companies over gas because we currently expect global oil supply/demand to remain tight and gas prices to stay relatively low. Energy positioning was less defensive at period end, with an underweight in integrated oil and overweights in the exploration and production and refining and marketing groups. On the materials side, the Fund had an overweight in commodity chemicals at the close of the reporting period, particularly in U.S. companies, which we believe will likely continue to benefit from low input costs domestically. We've kept a neutral weight in metals and mining due to concern about sluggish global growth and surplus production.
Country Breakdown (%)
(at August 31, 2013) | |
Australia | | | 2.5 | | |
Bermuda | | | 0.5 | | |
Canada | | | 10.1 | | |
France | | | 2.9 | | |
Germany | | | 1.0 | | |
Italy | | | 2.1 | | |
Japan | | | 0.0 | (a) | |
Netherlands | | | 2.6 | | |
Norway | | | 0.4 | | |
United Kingdom | | | 11.6 | | |
United States(b) | | | 66.3 | | |
Total | | | 100.0 | | |
Percentages indicated are based upon total investments. The Fund's portfolio composition is subject to change.
(a) Rounds to zero.
(b) Includes investments in Money Market Funds.
Summary of Investments in Securities
by Industry (%) (at August 31, 2013) | |
Chemicals | | | 19.4 | | |
Construction & Engineering | | | 1.1 | | |
Energy Equipment & Services | | | 9.4 | | |
Metals & Mining | | | 16.0 | | |
Oil, Gas & Consumable Fuels | | | 52.3 | | |
Paper & Forest Products | | | 1.6 | | |
Money Market Funds | | | 0.3 | | |
Total | | | 100.1 | | |
Percentages indicated are based upon net assets. The Fund's portfolio composition is subject to change.
Investment Risks
The share price of a fund that invests primarily in one sector will likely be subject to more volatility than a fund that invests across many sectors. The Fund also has potentially greater price volatility due to the Fund's concentration in a limited number of stocks. Securities of issuers in the energy and natural resources industry may underperform other market sectors or the market as a whole and may have greater volatility than other types of investments. Investments in precious metals are considered speculative and are affected by worldwide economic, financial and political factors. International investments involve greater potential risks, including less regulation, currency fluctuations, economic instability and political developments. The Fund should be considered part of an overall investment program, and not a complete investment program. See the Fund's prospectus for information on these and other risks.
Annual Report 2013
5
Columbia Global Energy and Natural Resources Fund
Understanding Your Fund's Expenses
(Unaudited)
As an investor, you incur two types of costs. There are transaction costs, which generally include sales charges on purchases and may include redemption fees. There are also ongoing costs, which generally include management fees, distribution and service (Rule 12b-1) fees, and other fund expenses. The following information is intended to help you understand your ongoing costs (in dollars) of investing in the Fund and to help you compare these costs with the ongoing costs of investing in other mutual funds.
Analyzing Your Fund's Expenses
To illustrate these ongoing costs, we have provided examples and calculated the expenses paid by investors in each share class of the Fund during the period. The actual and hypothetical information in the table is based on an initial investment of $1,000 at the beginning of the period indicated and held for the entire period. Expense information is calculated two ways and each method provides you with different information. The amount listed in the "Actual" column is calculated using the Fund's actual operating expenses and total return for the period. You may use the Actual information, together with the amount invested, to estimate the expenses that you paid over the period. Simply divide your account value by $1,000 (for example, an $8,600 account value divided by $1,000 = 8.6), then multiply the results by the expenses paid during the period under the Actual column. The amount listed in the "Hypothetical" column assumes a 5% annual rate of return before expenses (which is not the Fund's actual return) and then applies the Fund's actual expense ratio for the period to the hypothetical return. You should not use the hypothetical account values and expenses to estimate either your actual account balance at the end of the period or the expenses you paid during the period. See "Compare With Other Funds" below for details on how to use the hypothetical data.
Compare With Other Funds
Since all mutual funds are required to include the same hypothetical calculations about expenses in shareholder reports, you can use this information to compare the ongoing cost of investing in the Fund with other funds. To do so, compare the hypothetical example with the 5% hypothetical examples that appear in the shareholder reports of other funds. As you compare hypothetical examples of other funds, it is important to note that hypothetical examples are meant to highlight the ongoing costs of investing in a fund only and do not reflect any transaction costs, such as sales charges, or redemption or exchange fees. Therefore, the hypothetical calculations are useful in comparing ongoing costs only, and will not help you determine the relative total costs of owning different funds. If transaction costs were included in these calculations, your costs would be higher.
March 1, 2013 – August 31, 2013
| | Account Value at the Beginning
of the Period ($) | | Account Value at the End of the
Period ($) | | Expenses Paid During the
Period ($) | | Fund's Annualized
Expense Ratio (%) | |
| | Actual | | Hypothetical | | Actual | | Hypothetical | | Actual | | Hypothetical | | Actual | |
Class A | | | 1,000.00 | | | | 1,000.00 | | | | 1,009.60 | | | | 1,018.50 | | | | 6.60 | | | | 6.63 | | | | 1.31 | | |
Class B | | | 1,000.00 | | | | 1,000.00 | | | | 1,005.40 | | | | 1,014.74 | | | | 10.36 | | | | 10.40 | | | | 2.06 | | |
Class C | | | 1,000.00 | | | | 1,000.00 | | | | 1,005.90 | | | | 1,014.74 | | | | 10.36 | | | | 10.40 | | | | 2.06 | | |
Class I | | | 1,000.00 | | | | 1,000.00 | | | | 1,011.90 | | | | 1,020.96 | | | | 4.14 | | | | 4.15 | | | | 0.82 | | |
Class K | | | 1,000.00 | | | | 1,000.00 | | | | 1,010.50 | | | | 1,019.45 | | | | 5.64 | | | | 5.67 | | | | 1.12 | | |
Class R | | | 1,000.00 | | | | 1,000.00 | | | | 1,008.10 | | | | 1,017.25 | | | | 7.85 | | | | 7.89 | | | | 1.56 | | |
Class R4 | | | 1,000.00 | | | | 1,000.00 | | | | 1,010.80 | | | | 1,019.75 | | | | 5.34 | | | | 5.37 | | | | 1.06 | | |
Class R5 | | | 1,000.00 | | | | 1,000.00 | | | | 1,011.70 | | | | 1,020.71 | | | | 4.39 | | | | 4.41 | | | | 0.87 | | |
Class Z | | | 1,000.00 | | | | 1,000.00 | | | | 1,011.00 | | | | 1,019.75 | | | | 5.34 | | | | 5.37 | | | | 1.06 | | |
Expenses paid during the period are equal to the annualized expense ratio for each class as indicated above, multiplied by the average account value over the period and then multiplied by the number of days in the Fund's most recent fiscal half year and divided by 365.
Expenses do not include fees and expenses incurred indirectly by the Fund from the underlying funds in which the Fund may invest (also referred to as "acquired funds"), including affiliated and non-affiliated pooled investment vehicles (including mutual funds and exchange-traded funds).
Annual Report 2013
6
Columbia Global Energy and Natural Resources Fund
Portfolio of Investments
August 31, 2013
(Percentages represent value of investments compared to net assets)
Common Stocks 99.8%
Issuer | | Shares | | Value ($) | |
Australia 2.5% | |
BHP Billiton Ltd., ADR | | | 106,494 | | | | 6,738,940 | | |
Origin Energy Ltd. | | | 98,780 | | | | 1,158,057 | | |
Woodside Petroleum Ltd. | | | 33,096 | | | | 1,120,072 | | |
Total | | | | | 9,017,069 | | |
Bermuda 0.5% | |
Kosmos Energy Ltd.(a) | | | 183,361 | | | | 1,864,781 | | |
Canada 10.1% | |
Agnico Eagle Mines Ltd. | | | 78,350 | | | | 2,354,418 | | |
Barrick Gold Corp. | | | 124,276 | | | | 2,379,885 | | |
Canadian Natural Resources Ltd. | | | 142,510 | | | | 4,363,656 | | |
Cenovus Energy, Inc. | | | 132,990 | | | | 3,810,537 | | |
Enbridge, Inc. | | | 78,592 | | | | 3,222,623 | | |
First Quantum Minerals Ltd. | | | 169,766 | | | | 2,818,957 | | |
Imperial Oil Ltd. | | | 26,360 | | | | 1,100,648 | | |
Silver Wheaton Corp. | | | 101,351 | | | | 2,670,599 | | |
Suncor Energy, Inc. | | | 120,595 | | | | 4,064,485 | | |
Suncor Energy, Inc. | | | 96,533 | | | | 3,269,573 | | |
Talisman Energy, Inc. | | | 91,220 | | | | 977,878 | | |
Tourmaline Oil Corp.(a) | | | 50,360 | | | | 1,945,934 | | |
TransCanada Corp. | | | 26,610 | | | | 1,159,845 | | |
Yamana Gold, Inc. | | | 245,017 | | | | 2,788,294 | | |
Total | | | | | 36,927,332 | | |
France 2.9% | |
Lafarge SA | | | 32,454 | | | | 1,981,649 | | |
Technip SA | | | 17,320 | | | | 2,014,406 | | |
Total SA | | | 117,898 | | | | 6,531,190 | | |
Total | | | | | 10,527,245 | | |
Germany 1.0% | |
BASF SE | | | 41,320 | | | | 3,611,397 | | |
Italy 2.1% | |
ENI SpA | | | 327,610 | | | | 7,481,994 | | |
Japan —% | |
Inpex Corp. | | | 2 | | | | 9,018 | | |
Common Stocks (continued)
Issuer | | Shares | | Value ($) | |
Netherlands 2.6% | |
Frank's International NV(a) | | | 30,607 | | | | 848,120 | | |
Royal Dutch Shell PLC, Class A | | | 263,860 | | | | 8,535,870 | | |
Total | | | | | 9,383,990 | | |
Norway 0.4% | |
Subsea 7 SA | | | 77,520 | | | | 1,589,706 | | |
United Kingdom 11.6% | |
Anglo American PLC | | | 155,520 | | | | 3,563,324 | | |
BG Group PLC | | | 269,328 | | | | 5,121,225 | | |
| BP PLC | | | 1,589,052 | | | | 10,987,918 | | |
Ensco PLC, Class A | | | 48,782 | | | | 2,710,328 | | |
Premier Oil PLC | | | 235,093 | | | | 1,310,837 | | |
Rio Tinto PLC | | | 244,700 | | | | 11,046,437 | | |
Rio Tinto PLC, ADR | | | 140,440 | | | | 6,335,248 | | |
Rockhopper Exploration PLC(a) | | | 425,341 | | | | 746,489 | | |
Tullow Oil PLC | | | 27,962 | | | | 436,794 | | |
Total | | | | | 42,258,600 | | |
United States 66.1% | |
Air Products & Chemicals, Inc. | | | 40,760 | | | | 4,163,226 | | |
Albemarle Corp. | | | 69,620 | | | | 4,342,199 | | |
Anadarko Petroleum Corp. | | | 117,483 | | | | 10,740,296 | | |
Apache Corp. | | | 55,010 | | | | 4,713,257 | | |
Atwood Oceanics, Inc.(a) | | | 39,080 | | | | 2,175,974 | | |
Cabot Oil & Gas Corp. | | | 69,152 | | | | 2,705,918 | | |
Cameron International Corp.(a) | | | 53,428 | | | | 3,034,176 | | |
Celanese Corp., Class A | | | 181,368 | | | | 8,930,560 | | |
Chevron Corp. | | | 195,933 | | | | 23,596,211 | | |
Cobalt International Energy, Inc.(a) | | | 95,049 | | | | 2,319,196 | | |
Coeur Mining, Inc.(a) | | | 67,910 | | | | 980,620 | | |
ConocoPhillips | | | 131,182 | | | | 8,697,367 | | |
Continental Resources, Inc.(a) | | | 23,380 | | | | 2,157,039 | | |
Dow Chemical Co. (The) | | | 502,569 | | | | 18,796,081 | | |
Dril-Quip, Inc.(a) | | | 20,034 | | | | 2,043,668 | | |
Eastman Chemical Co. | | | 60,140 | | | | 4,570,640 | | |
EOG Resources, Inc. | | | 47,775 | | | | 7,503,064 | | |
The accompanying Notes to Financial Statements are an integral part of this statement.
Annual Report 2013
7
Columbia Global Energy and Natural Resources Fund
Portfolio of Investments (continued)
August 31, 2013
Common Stocks (continued)
Issuer | | Shares | | Value ($) | |
Exxon Mobil Corp. | | | 272,468 | | | | 23,748,311 | | |
FMC Technologies, Inc.(a) | | | 50,753 | | | | 2,721,883 | | |
Freeport-McMoRan Copper & Gold, Inc. | | | 245,520 | | | | 7,419,614 | | |
Halliburton Co. | | | 130,906 | | | | 6,283,488 | | |
HollyFrontier Corp. | | | 74,868 | | | | 3,330,129 | | |
International Paper Co. | | | 121,400 | | | | 5,731,294 | | |
Kinder Morgan, Inc. | | | 48,413 | | | | 1,836,305 | | |
LyondellBasell Industries NV, Class A | | | 137,992 | | | | 9,680,139 | | |
Marathon Oil Corp. | | | 51,913 | | | | 1,787,365 | | |
Marathon Petroleum Corp. | | | 83,917 | | | | 6,084,822 | | |
Martin Marietta Materials, Inc. | | | 20,618 | | | | 1,980,359 | | |
Monsanto Co. | | | 93,033 | | | | 9,107,000 | | |
Mosaic Co. (The) | | | 93,338 | | | | 3,887,528 | | |
Newmont Mining Corp. | | | 94,196 | | | | 2,992,607 | | |
Noble Energy, Inc. | | | 91,004 | | | | 5,590,376 | | |
Nucor Corp. | | | 135,240 | | | | 6,152,068 | | |
Occidental Petroleum Corp. | | | 38,848 | | | | 3,426,782 | | |
PBF Energy, Inc. | | | 56,605 | | | | 1,243,612 | | |
Phillips 66 | | | 49,536 | | | | 2,828,506 | | |
Pioneer Natural Resources Co. | | | 9,303 | | | | 1,627,746 | | |
Common Stocks (continued)
Issuer | | Shares | | Value ($) | |
Praxair, Inc. | | | 31,519 | | | | 3,700,331 | | |
Range Resources Corp. | | | 13,380 | | | | 1,003,232 | | |
Schlumberger Ltd. | | | 110,565 | | | | 8,949,131 | | |
SemGroup Corp., Class A | | | 24,692 | | | | 1,307,194 | | |
Spectra Energy Corp. | | | 46,895 | | | | 1,552,693 | | |
Superior Energy Services, Inc.(a) | | | 79,343 | | | | 1,948,664 | | |
Valero Energy Corp. | | | 79,882 | | | | 2,838,207 | | |
Williams Companies, Inc. (The) | | | 22,492 | | | | 815,110 | | |
Total | | | | | 241,043,988 | | |
Total Common Stocks
(Cost: $324,495,731) | | | | | 363,715,120 | | |
Money Market Funds 0.3%
Columbia Short-Term Cash Fund,
0.097%(b)(c) | | | 1,195,833 | | | | 1,195,833 | | |
Total Money Market Funds
(Cost: $1,195,833) | | | | | 1,195,833 | | |
Total Investments
(Cost: $325,691,564) | | | 364,910,953 | | |
Other Assets & Liabilities, Net | | | (398,420 | ) | |
Net Assets | | | 364,512,533 | | |
Investments in Derivatives
Forward Foreign Currency Exchange Contracts Open at August 31, 2013
Counterparty | | Exchange Date | | Currency to
be Delivered | | Currency to
be Received | | Unrealized
Appreciation ($) | | Unrealized
Depreciation ($) | |
Goldman, Sachs & Co.
| | September 17, 2013
| | | 11,522,354
(USD) | | | | 12,613,000
(AUD) | | | | —
| | | | (305,717
| ) | |
Goldman, Sachs & Co.
| | September 17, 2013
| | | 1,962,173
(USD) | | | | 2,023,000
(CAD) | | | | —
| | | | (42,158
| ) | |
Goldman, Sachs & Co.
| | September 17, 2013
| | | 6,919,326
(USD) | | | | 6,464,000
(CHF) | | | | 28,530
| | | | —
| | |
Goldman, Sachs & Co.
| | September 17, 2013
| | | 24,605,159
(USD) | | | | 18,605,000
(EUR) | | | | —
| | | | (14,820
| ) | |
Goldman, Sachs & Co.
| | September 17, 2013
| | | 6,159,397
(USD) | | | | 4,025,000
(GBP) | | | | 77,519
| | | | —
| | |
Goldman, Sachs & Co.
| | September 17, 2013
| | | 765,404
(USD) | | | | 2,752,000
(ILS) | | | | —
| | | | (7,976
| ) | |
Goldman, Sachs & Co.
| | September 17, 2013
| | | 15,435,465
(USD) | | | | 1,539,132,000
(JPY) | | | | 241,271
| | | | —
| | |
Goldman, Sachs & Co.
| | September 17, 2013
| | | 3,827,103
(USD) | | | | 22,782,000
(NOK) | | | | —
| | | | (106,254
| ) | |
The accompanying Notes to Financial Statements are an integral part of this statement.
Annual Report 2013
8
Columbia Global Energy and Natural Resources Fund
Portfolio of Investments (continued)
August 31, 2013
Forward Foreign Currency Exchange Contracts Open at August 31, 2013 (continued)
Counterparty | | Exchange Date | | Currency to
be Delivered | | Currency to
be Received | | Unrealized
Appreciation ($) | | Unrealized
Depreciation ($) | |
Goldman, Sachs & Co.
| | September 17, 2013
| | | 778,873
(USD) | | | | 972,000
(NZD) | | | | —
| | | | (28,373
| ) | |
Goldman, Sachs & Co.
| | September 17, 2013
| | | 766,087
(USD) | | | | 5,001,000
(SEK) | | | | —
| | | | (11,708
| ) | |
Credit Suisse
| | September 27, 2013
| | | 8,451,000
(CHF) | | | | 9,050,312
(USD) | | | | —
| | | | (33,962
| ) | |
HSBC Securities (USA), Inc.
| | September 27, 2013
| | | 17,193,000
(EUR) | | | | 22,862,135
(USD) | | | | 137,303
| | | | —
| | |
UBS Securities
| | September 27, 2013
| | | 8,854,000
(GBP) | | | | 13,837,779
(USD) | | | | 119,176
| | | | —
| | |
Deutsche Bank
| | September 27, 2013
| | | 14,135,357
(USD) | | | | 83,295,000
(NOK) | | | | —
| | | | (536,311
| ) | |
Goldman, Sachs & Co.
| | September 27, 2013
| | | 23,050,823
(USD) | | | | 29,524,000
(NZD) | | | | —
| | | | (270,212
| ) | |
J.P. Morgan Securities, Inc.
| | September 27, 2013
| | | 9,144,856
(USD) | | | | 59,768,000
(SEK) | | | | —
| | | | (131,130
| ) | |
Total | | | | | | | | | | | | | | | 603,799 | | | | (1,488,621 | ) | |
Notes to Portfolio of Investments
(a) Non-income producing.
(b) The rate shown is the seven-day current annualized yield at August 31, 2013.
(c) As defined in the Investment Company Act of 1940, an affiliated company is one in which the Fund owns 5% or more of its outstanding voting securities, or a company which is under common ownership or control with the Fund. Holdings and transactions in these affiliated companies during the year ended August 31, 2013, are as follows:
Issuer | | Beginning
Cost ($) | | Purchase
Cost ($) | | Proceeds
From Sales ($) | | Ending
Cost ($) | | Dividends —
Affiliated
Issuers ($) | | Value ($) | |
Columbia Short-Term Cash Fund | | | 9,186,538 | | | | 120,829,657 | | | | (128,820,362 | ) | | | 1,195,833 | | | | 3,084 | | | | 1,195,833 | | |
Abbreviation Legend
ADR American Depositary Receipt
Currency Legend
AUD Australian Dollar
CAD Canadian Dollar
CHF Swiss Franc
EUR Euro
GBP British Pound
ILS Israeli Shekel
JPY Japanese Yen
NOK Norwegian Krone
NZD New Zealand Dollar
SEK Swedish Krona
USD US Dollar
The accompanying Notes to Financial Statements are an integral part of this statement.
Annual Report 2013
9
Columbia Global Energy and Natural Resources Fund
Portfolio of Investments (continued)
August 31, 2013
Fair Value Measurements
Generally accepted accounting principles (GAAP) require disclosure regarding the inputs and valuation techniques used to measure fair value and any changes in valuation inputs or techniques. In addition, investments shall be disclosed by major category.
The Fund categorizes its fair value measurements according to a three-level hierarchy that maximizes the use of observable inputs and minimizes the use of unobservable inputs by prioritizing that the most observable input be used when available. Observable inputs are those that market participants would use in pricing an investment based on market data obtained from sources independent of the reporting entity. Unobservable inputs are those that reflect the Fund's assumptions about the information market participants would use in pricing an investment. An investment's level within the fair value hierarchy is based on the lowest level of any input that is deemed significant to the asset or liability's fair value measurement. The input levels are not necessarily an indication of the risk or liquidity associated with investments at that level. For example, certain U.S. government securities are generally high quality and liquid, however, they are reflected as Level 2 because the inputs used to determine fair value may not always be quoted prices in an active market.
Fair value inputs are summarized in the three broad levels listed below:
> Level 1 — Valuations based on quoted prices for investments in active markets that the Fund has the ability to access at the measurement date (including NAV for open-end mutual funds). Valuation adjustments are not applied to Level 1 investments.
> Level 2 — Valuations based on other significant observable inputs (including quoted prices for similar securities, interest rates, prepayment speeds, credit risks, etc.).
> Level 3 — Valuations based on significant unobservable inputs (including the Fund's own assumptions and judgment in determining the fair value of investments).
Inputs that are used in determining fair value of an investment may include price information, credit data, volatility statistics, and other factors. These inputs can be either observable or unobservable. The availability of observable inputs can vary between investments, and is affected by various factors such as the type of investment, and the volume and level of activity for that investment or similar investments in the marketplace. The inputs will be considered by the Investment Manager, along with any other relevant factors in the calculation of an investment's fair value. The Fund uses prices and inputs that are current as of the measurement date, which may include periods of market dislocations. During these periods, the availability of prices and inputs may be reduced for many investments. This condition could cause an investment to be reclassified between the various levels within the hierarchy.
Foreign equity securities actively traded in markets where there is a significant delay in the local close relative to the New York Stock Exchange (NYSE) are classified as Level 2. The values of these securities may include an adjustment to reflect the impact of significant market movements following the close of local trading, as described in Note 2 to the financial statements — Security Valuation.
Investments falling into the Level 3 category are primarily supported by quoted prices from brokers and dealers participating in the market for those investments. However, these may be classified as Level 3 investments due to lack of market transparency and corroboration to support these quoted prices. Additionally, valuation models may be used as the pricing source for any remaining investments classified as Level 3. These models may rely on one or more significant unobservable inputs and/or significant assumptions by the Investment Manager. Inputs used in valuations may include, but are not limited to, financial statement analysis, capital account balances, discount rates and estimated cash flows, and comparable company data.
Under the direction of the Fund's Board of Trustees (the Board), the Investment Manager's Valuation Committee (the Committee) is responsible for carrying out the valuation procedures approved by the Board. The Committee consists of voting and non-voting members from various groups within the Investment Manager's organization, including operations and accounting, trading and investments, compliance, risk management and legal.
The Committee meets at least monthly to review and approve valuation matters, which may include a description of specific valuation determinations, data regarding pricing information received from approved pricing vendors and brokers and the results of Board-approved valuation control policies and procedures (the Policies). The Policies address, among other things, instances when market quotations are or are not readily available, including recommendations of third party pricing vendors and a determination of appropriate pricing methodologies; events that require specific valuation determinations and assessment of fair value techniques; securities with a potential for stale pricing, including those that are illiquid, restricted, or in default; and the effectiveness of third-party pricing vendors, including periodic reviews of vendors. The Committee meets more frequently, as needed, to discuss additional valuation matters, which may include the need to review back-testing results, review time-sensitive information or approve related valuation actions. The Committee reports to the Board, with members of the Committee meeting with the Board at each of its regularly scheduled meetings to discuss valuation matters and actions during the period, similar to those described earlier.
For investments categorized as Level 3, the Committee monitors information similar to that described above, which may include: (i) data specific to the issuer or comparable issuers, (ii) general market or specific sector news and (iii) quoted prices and specific or similar security transactions. The Committee considers this data and any changes from prior periods in order to assess the reasonableness of observable and unobservable inputs, any assumptions or internal models used to value those securities and changes in fair value. This data is also used to corroborate, when available, information received from approved pricing vendors and brokers. Various factors impact the frequency of monitoring this information (which may occur as often as daily). However, the Committee may determine that changes to inputs, assumptions and models are not required as a result of the monitoring procedures performed.
The accompanying Notes to Financial Statements are an integral part of this statement.
Annual Report 2013
10
Columbia Global Energy and Natural Resources Fund
Portfolio of Investments (continued)
August 31, 2013
Fair Value Measurements (continued)
The following table is a summary of the inputs used to value the Fund's investments at August 31, 2013:
Description | | Level 1
Quoted Prices in Active
Markets for Identical
Assets ($) | |
Level 2
Other Significant
Observable Inputs ($) | |
Level 3
Significant
Unobservable Inputs ($) | |
Total ($) | |
Equity Securities | |
Common Stocks | |
Energy | | | 177,948,130 | | | | 47,043,576 | | | | — | | | | 224,991,706 | | |
Materials | | | 118,520,607 | | | | 20,202,807 | | | | — | | | | 138,723,414 | | |
Total Equity Securities | | | 296,468,737 | | | | 67,246,383 | | | | — | | | | 363,715,120 | | |
Mutual Funds | |
Money Market Funds | | | 1,195,833 | | | | — | | | | — | | | | 1,195,833 | | |
Total Mutual Funds | | | 1,195,833 | | | | — | | | | — | | | | 1,195,833 | | |
Investments in Securities | | | 297,664,570 | | | | 67,246,383 | | | | — | | | | 364,910,953 | | |
Derivatives | |
Assets | |
Forward Foreign Currency
Exchange Contracts | | | — | | | | 603,799 | | | | — | | | | 603,799 | | |
Liabilities | |
Forward Foreign Currency
Exchange Contracts | | | — | | | | (1,488,621 | ) | | | — | | | | (1,488,621 | ) | |
Total | | | 297,664,570 | | | | 66,361,561 | | | | — | | | | 364,026,131 | | |
See the Portfolio of Investments for all investment classifications not indicated in the table.
The Fund's assets assigned to the Level 2 input category are generally valued using the market approach, in which a security's value is determined through reference to prices and information from market transactions for similar or identical assets. These assets include certain foreign securities for which a third party statistical pricing service may be employed for purposes of fair market valuation. The models utilized by the third party statistical pricing service take into account a security's correlation to available market data including, but not limited to, intraday index, ADR, and ETF movements.
There were no transfers of financial assets between Levels 1 and 2 during the period.
Derivative instruments are valued at unrealized appreciation (depreciation).
The accompanying Notes to Financial Statements are an integral part of this statement.
Annual Report 2013
11
Columbia Global Energy and Natural Resources Fund
Statement of Assets and Liabilities
August 31, 2013
Assets | |
Investments, at value | |
Unaffiliated issuers (identified cost $324,495,731) | | $ | 363,715,120 | | |
Affiliated issuers (identified cost $1,195,833) | | | 1,195,833 | | |
Total investments (identified cost $325,691,564) | | | 364,910,953 | | |
Unrealized appreciation on forward foreign currency exchange contracts | | | 603,799 | | |
Receivable for: | |
Investments sold | | | 27,178 | | |
Capital shares sold | | | 67,131 | | |
Dividends | | | 1,480,192 | | |
Reclaims | | | 31,567 | | |
Prepaid expenses | | | 4,392 | | |
Trustees' deferred compensation plan | | | 30,656 | | |
Total assets | | | 367,155,868 | | |
Liabilities | |
Unrealized depreciation on forward foreign currency exchange contracts | | | 1,488,621 | | |
Payable for: | |
Investments purchased | | | 586,585 | | |
Capital shares purchased | | | 419,065 | | |
Investment management fees | | | 6,937 | | |
Distribution and/or service fees | | | 1,292 | | |
Transfer agent fees | | | 50,247 | | |
Administration fees | | | 603 | | |
Plan administration fees | | | 15 | | |
Compensation of board members | | | 2,331 | | |
Chief compliance officer expenses | | | 38 | | |
Other expenses | | | 56,945 | | |
Trustees' deferred compensation plan | | | 30,656 | | |
Total liabilities | | | 2,643,335 | | |
Net assets applicable to outstanding capital stock | | $ | 364,512,533 | | |
Represented by | |
Paid-in capital | | $ | 328,478,495 | | |
Excess of distributions over net investment income | | | (460,740 | ) | |
Accumulated net realized loss | | | (1,838,506 | ) | |
Unrealized appreciation (depreciation) on: | |
Investments | | | 39,219,389 | | |
Foreign currency translations | | | (1,283 | ) | |
Forward foreign currency exchange contracts | | | (884,822 | ) | |
Total — representing net assets applicable to outstanding capital stock | | $ | 364,512,533 | | |
The accompanying Notes to Financial Statements are an integral part of this statement.
Annual Report 2013
12
Columbia Global Energy and Natural Resources Fund
Statement of Assets and Liabilities (continued)
August 31, 2013
Class A | |
Net assets | | $ | 110,896,004 | | |
Shares outstanding | | | 5,263,859 | | |
Net asset value per share | | $ | 21.07 | | |
Maximum offering price per share(a) | | $ | 22.36 | | |
Class B | |
Net assets | | $ | 3,012,742 | | |
Shares outstanding | | | 148,021 | | |
Net asset value per share | | $ | 20.35 | | |
Class C | |
Net assets | | $ | 15,340,106 | | |
Shares outstanding | | | 753,556 | | |
Net asset value per share | | $ | 20.36 | | |
Class I | |
Net assets | | $ | 44,595,077 | | |
Shares outstanding | | | 2,099,671 | | |
Net asset value per share | | $ | 21.24 | | |
Class K(b) | |
Net assets | | $ | 68,763 | | |
Shares outstanding | | | 3,246 | | |
Net asset value per share | | $ | 21.18 | | |
Class R | |
Net assets | | $ | 1,663,843 | | |
Shares outstanding | | | 79,102 | | |
Net asset value per share | | $ | 21.03 | | |
Class R4 | |
Net assets | | $ | 1,574,746 | | |
Shares outstanding | | | 73,208 | | |
Net asset value per share | | $ | 21.51 | | |
Class R5 | |
Net assets | | $ | 1,057,772 | | |
Shares outstanding | | | 49,125 | | |
Net asset value per share | | $ | 21.53 | | |
Class Z | |
Net assets | | $ | 186,303,480 | | |
Shares outstanding | | | 8,791,904 | | |
Net asset value per share | | $ | 21.19 | | |
(a) The maximum offering price per share is calculated by dividing the net asset value per share by 1.0 minus the maximum sales charge of 5.75%.
(b) Effective October 25, 2012, Class R4 shares were renamed Class K shares.
The accompanying Notes to Financial Statements are an integral part of this statement.
Annual Report 2013
13
Columbia Global Energy and Natural Resources Fund
Statement of Operations
Year Ended August 31, 2013
Net investment income | |
Income: | |
Dividends — unaffiliated issuers | | $ | 10,941,920 | | |
Dividends — affiliated issuers | | | 3,084 | | |
Interest | | | 5,812 | | |
Income from securities lending — net | | | 22,496 | | |
Foreign taxes withheld | | | (457,043 | ) | |
Total income | | | 10,516,269 | | |
Expenses: | |
Investment management fees | | | 2,956,409 | | |
Distribution and/or service fees | |
Class A | | | 288,000 | | |
Class B | | | 35,944 | | |
Class C | | | 168,609 | | |
Class R | | | 7,490 | | |
Transfer agent fees | |
Class A | | | 272,332 | | |
Class B | | | 8,497 | | |
Class C | | | 39,855 | | |
Class K(a) | | | 37 | | |
Class R | | | 3,547 | | |
Class R4(b) | | | 1,497 | | |
Class R5(b) | | | 261 | | |
Class Z | | | 589,052 | | |
Administration fees | | | 257,079 | | |
Plan administration fees | |
Class K(a) | | | 185 | | |
Compensation of board members | | | 27,644 | | |
Custodian fees | | | 23,494 | | |
Printing and postage fees | | | 139,411 | | |
Registration fees | | | 104,446 | | |
Professional fees | | | 29,835 | | |
Line of credit interest expense | | | 940 | | |
Chief compliance officer expenses | | | 288 | | |
Other | | | 22,994 | | |
Total expenses | | | 4,977,846 | | |
Expense reductions | | | (3,780 | ) | |
Total net expenses | | | 4,974,066 | | |
Net investment income | | | 5,542,203 | | |
Realized and unrealized gain (loss) — net | |
Net realized gain (loss) on: | |
Investments | | | 34,637,281 | | |
Foreign currency translations | | | (55,282 | ) | |
Forward foreign currency exchange contracts | | | (4,730,438 | ) | |
Futures contracts | | | 229,502 | | |
Options contracts written | | | 464,501 | | |
Net realized gain | | | 30,545,564 | | |
Net change in unrealized appreciation (depreciation) on: | |
Investments | | | (10,593,932 | ) | |
Foreign currency translations | | | (1,628 | ) | |
Forward foreign currency exchange contracts | | | (884,822 | ) | |
Options contracts written | | | (24,431 | ) | |
Net change in unrealized appreciation (depreciation) | | | (11,504,813 | ) | |
Net realized and unrealized gain | | | 19,040,751 | | |
Net increase in net assets resulting from operations | | $ | 24,582,954 | | |
(a) Effective October 25, 2012, Class R4 shares were renamed Class K shares.
(b) For the period from November 8, 2012 (commencement of operations) to August 31, 2013.
The accompanying Notes to Financial Statements are an integral part of this statement.
Annual Report 2013
14
Columbia Global Energy and Natural Resources Fund
Statement of Changes in Net Assets
| | | Year Ended
August 31,
2013(a) | | Year Ended
August 31,
2012(b) | | Year Ended
March 31,
2012 | |
Operations | |
Net investment income | | $ | 5,542,203 | | | $ | 1,975,377 | | | $ | 2,661,409 | | |
Net realized gain (loss) | | | 30,545,564 | | | | (12,557,718 | ) | | | 15,696,214 | | |
Net change in unrealized appreciation (depreciation) | | | (11,504,813 | ) | | | (17,023,495 | ) | | | (182,172,715 | ) | |
Net increase (decrease) in net assets resulting from operations | | | 24,582,954 | | | | (27,605,836 | ) | | | (163,815,092 | ) | |
Distributions to shareholders | |
Net investment income | |
Class A | | | (463,199 | ) | | | (198,138 | ) | | | (456,402 | ) | |
Class B | | | (554 | ) | | | — | | | | — | | |
Class C | | | (2,626 | ) | | | — | | | | — | | |
Class I | | | (227,483 | ) | | | (111,539 | ) | | | (473,597 | ) | |
Class K(c) | | | (367 | ) | | | (179 | ) | | | (534 | ) | |
Class R | | | (3,246 | ) | | | (227 | ) | | | (319 | ) | |
Class R4 | | | (7 | ) | | | — | | | | — | | |
Class R5 | | | (7 | ) | | | — | | | �� | — | | |
Class Z | | | (1,467,544 | ) | | | (916,731 | ) | | | (2,288,248 | ) | |
Net realized gains | |
Class A | | | — | | | | — | | | | (2,618,102 | ) | |
Class B | | | — | | | | — | | | | (108,924 | ) | |
Class C | | | — | | | | — | | | | (417,651 | ) | |
Class I | | | — | | | | — | | | | (711,708 | ) | |
Class K(c) | | | — | | | | — | | | | (2,209 | ) | |
Class R | | | — | | | | — | | | | (8,977 | ) | |
Class Z | | | — | | | | — | | | | (7,662,137 | ) | |
Total distributions to shareholders | | | (2,165,033 | ) | | | (1,226,814 | ) | | | (14,748,808 | ) | |
Increase (decrease) in net assets from capital stock activity | | | (144,474,491 | ) | | | (79,296,304 | ) | | | (142,926,768 | ) | |
Proceeds from regulatory settlements (Note 0) | | | — | | | | — | | | | 4,585 | | |
Total decrease in net assets | | | (122,056,570 | ) | | | (108,128,954 | ) | | | (321,486,083 | ) | |
Net assets at beginning of year | | | 486,569,103 | | | | 594,698,057 | | | | 916,184,140 | | |
Net assets at end of year | | $ | 364,512,533 | | | $ | 486,569,103 | | | $ | 594,698,057 | | |
Undistributed (excess of distributions over) net investment income | | ($ | 460,740 | ) | | $ | 901,000 | | | $ | 92,600 | | |
(a) Class R4 and Class R5 shares are for the period from November 8, 2012 (commencement of operations) to August 31, 2013.
(b) For the period from April 1, 2012 to August 31, 2012. During the period, the Fund's fiscal year end was changed from March 31 to August 31.
(c) Effective October 25, 2012, Class R4 shares were renamed Class K shares.
The accompanying Notes to Financial Statements are an integral part of this statement.
Annual Report 2013
15
Columbia Global Energy and Natural Resources Fund
Statement of Changes in Net Assets (continued)
| | | Year Ended August 31,
2013(a) | | Year Ended August 31,
2012(b) | | Year Ended March 31,
2012 | |
| | | Shares | | Dollars ($) | | Shares | | Dollars ($) | | Shares | | Dollars ($) | |
Capital stock activity | |
Class A shares | |
Subscriptions(c) | | | 808,718 | | | | 16,675,726 | | | | 229,199 | | | | 4,366,384 | | | | 1,264,704 | | | | 28,122,049 | | |
Fund merger | | | — | | | | — | | | | — | | | | — | | | | 6,701,075 | | | | 157,664,942 | | |
Distributions reinvested | | | 21,779 | | | | 444,056 | | | | 10,624 | | | | 189,736 | | | | 140,024 | | | | 2,843,648 | | |
Redemptions | | | (1,717,441 | ) | | | (35,486,049 | ) | | | (1,043,241 | ) | | | (20,050,109 | ) | | | (3,886,721 | ) | | | (83,455,870 | ) | |
Net increase (decrease) | | | (886,944 | ) | | | (18,366,267 | ) | | | (803,418 | ) | | | (15,493,989 | ) | | | 4,219,082 | | | | 105,174,769 | | |
Class B shares | |
Subscriptions | | | 10,103 | | | | 204,372 | | | | 4,096 | | | | 77,365 | | | | 32,089 | | | | 690,955 | | |
Fund merger | | | — | | | | — | | | | — | | | | — | | | | 511,902 | | | | 11,739,090 | | |
Distributions reinvested | | | 27 | | | | 536 | | | | — | | | | — | | | | 5,243 | | | | 103,345 | | |
Redemptions(c) | | | (63,414 | ) | | | (1,268,232 | ) | | | (90,425 | ) | | | (1,652,735 | ) | | | (263,906 | ) | | | (5,901,478 | ) | |
Net increase (decrease) | | | (53,284 | ) | | | (1,063,324 | ) | | | (86,329 | ) | | | (1,575,370 | ) | | | 285,328 | | | | 6,631,912 | | |
Class C shares | |
Subscriptions | | | 76,239 | | | | 1,542,276 | | | | 31,337 | | | | 586,301 | | | | 228,983 | | | | 4,923,413 | | |
Fund merger | | | — | | | | — | | | | — | | | | — | | | | 280,755 | | | | 6,438,045 | | |
Distributions reinvested | | | 116 | | | | 2,266 | | | | — | | | | — | | | | 17,645 | | | | 347,774 | | |
Redemptions | | | (282,669 | ) | | | (5,661,719 | ) | | | (194,055 | ) | | | (3,597,384 | ) | | | (426,171 | ) | | | (8,915,368 | ) | |
Net increase (decrease) | | | (206,314 | ) | | | (4,117,177 | ) | | | (162,718 | ) | | | (3,011,083 | ) | | | 101,212 | | | | 2,793,864 | | |
Class I shares | |
Subscriptions | | | 717,724 | | | | 14,269,988 | | | | 7,350 | | | | 143,540 | | | | 2,218,577 | | | | 51,799,261 | | |
Fund merger | | | — | | | | — | | | | — | | | | — | | | | 604 | | | | 14,295 | | |
Distributions reinvested | | | 11,140 | | | | 227,389 | | | | 6,211 | | | | 111,482 | | | | 57,100 | | | | 1,184,943 | | |
Redemptions | | | (58,269 | ) | | | (1,233,639 | ) | | | — | | | | — | | | | (5,373,416 | ) | | | (123,041,510 | ) | |
Net increase (decrease) | | | 670,595 | | | | 13,263,738 | | | | 13,561 | | | | 255,022 | | | | (3,097,135 | ) | | | (70,043,011 | ) | |
Class K shares(d) | |
Subscriptions | | | — | | | | — | | | | — | | | | — | | | | 775 | | | | 16,515 | | |
Fund merger | | | — | | | | — | | | | — | | | | — | | | | 5,846 | | | | 138,127 | | |
Distributions reinvested | | | 17 | | | | 349 | | | | 10 | | | | 170 | | | | 131 | | | | 2,662 | | |
Redemptions | | | (589 | ) | | | (12,449 | ) | | | (1,391 | ) | | | (27,803 | ) | | | (1,651 | ) | | | (33,617 | ) | |
Net increase (decrease) | | | (572 | ) | | | (12,100 | ) | | | (1,381 | ) | | | (27,633 | ) | | | 5,101 | | | | 123,687 | | |
Class R shares | |
Subscriptions | | | 45,336 | | | | 947,297 | | | | 29,907 | | | | 574,369 | | | | 49,382 | | | | 1,066,845 | | |
Distributions reinvested | | | 159 | | | | 3,239 | | | | 13 | | | | 227 | | | | 457 | | | | 9,247 | | |
Redemptions | | | (27,580 | ) | | | (571,512 | ) | | | (10,891 | ) | | | (201,737 | ) | | | (9,816 | ) | | | (210,083 | ) | |
Net increase | | | 17,915 | | | | 379,024 | | | | 19,029 | | | | 372,859 | | | | 40,023 | | | | 866,009 | | |
The accompanying Notes to Financial Statements are an integral part of this statement.
Annual Report 2013
16
Columbia Global Energy and Natural Resources Fund
Statement of Changes in Net Assets (continued)
| | | Year Ended August 31,
2013(a) | | Year Ended August 31,
2012(b) | | Year Ended March 31,
2012 | |
| | | Shares | | Dollars ($) | | Shares | | Dollars ($) | | Shares | | Dollars ($) | |
Capital stock activity (continued) | |
Class R4 shares | |
Subscriptions | | | 85,962 | | | | 1,821,595 | | | | — | | | | — | | | | — | | | | — | | |
Redemptions | | | (12,754 | ) | | | (268,078 | ) | | | — | | | | — | | | | — | | | | — | | |
Net increase | | | 73,208 | | | | 1,553,517 | | | | — | | | | — | | | | — | | | | — | | |
Class R5 shares | |
Subscriptions | | | 54,663 | | | | 1,180,775 | | | | — | | | | — | | | | — | | | | — | | |
Redemptions | | | (5,538 | ) | | | (117,800 | ) | | | — | | | | — | | | | — | | | | — | | |
Net increase | | | 49,125 | | | | 1,062,975 | | | | — | | | | — | | | | — | | | | — | | |
Class Z shares | |
Subscriptions | | | 780,758 | | | | 16,237,189 | | | | 1,258,729 | | | | 24,554,058 | | | | 4,359,217 | | | | 98,498,028 | | |
Distributions reinvested | | | 58,857 | | | | 1,205,839 | | | | 40,140 | | | | 720,103 | | | | 352,520 | | | | 7,189,747 | | |
Redemptions | | | (7,476,400 | ) | | | (154,617,905 | ) | | | (4,446,210 | ) | | | (85,090,271 | ) | | | (13,589,844 | ) | | | (294,161,773 | ) | |
Net decrease | | | (6,636,785 | ) | | | (137,174,877 | ) | | | (3,147,341 | ) | | | (59,816,110 | ) | | | (8,878,107 | ) | | | (188,473,998 | ) | |
Total net decrease | | | (6,973,056 | ) | | | (144,474,491 | ) | | | (4,168,597 | ) | | | (79,296,304 | ) | | | (7,324,496 | ) | | | (142,926,768 | ) | |
(a) Class R4 and Class R5 are for the period from November 8, 2012 (commencement of operations) to August 31, 2013.
(b) For the period from April 1, 2012 to August 31, 2012. During the period, the Fund's fiscal year end was changed from March 31 to August 31.
(c) Includes conversions of Class B shares to Class A shares, if any.
(d) Effective October 25, 2012, Class R4 shares were renamed Class K shares.
The accompanying Notes to Financial Statements are an integral part of this statement.
Annual Report 2013
17
Columbia Global Energy and Natural Resources Fund
The following tables are intended to help you understand the Fund's financial performance. Certain information reflects financial results for a single share of a class held for the periods shown. Per share net investment income (loss) amounts are calculated based on average shares outstanding during the period. Total return assumes reinvestment of all dividends and distributions, if any. Total return does not reflect payment of sales charges, if any, and is not annualized for periods of less than one year.
| | | Year Ended August 31, | | Year Ended March 31, | |
Class A | | 2013 | | 2012(a) | | 2012 | | 2011 | | 2010 | | 2009 | |
Per share data | |
Net asset value, beginning of period | | $ | 20.04 | | | $ | 20.89 | | | $ | 25.57 | | | $ | 20.11 | | | $ | 13.62 | | | $ | 25.49 | | |
Income from investment operations: | |
Net investment income (loss) | | | 0.24 | | | | 0.06 | | | | 0.05 | | | | (0.02 | ) | | | (0.02 | ) | | | (0.01 | ) | |
Net realized and unrealized gain (loss) | | | 0.87 | | | | (0.88 | ) | | | (4.32 | ) | | | 5.49 | | | | 6.52 | | | | (11.46 | ) | |
Total from investment operations | | | 1.11 | | | | (0.82 | ) | | | (4.27 | ) | | | 5.47 | | | | 6.50 | | | | (11.47 | ) | |
Less distributions to shareholders: | |
Net investment income | | | (0.08 | ) | | | (0.03 | ) | | | (0.05 | ) | | | (0.01 | ) | | | (0.01 | ) | | | — | | |
Net realized gains | | | — | | | | — | | | | (0.36 | ) | | | — | | | | — | | | | (0.40 | ) | |
Total distributions to shareholders | | | (0.08 | ) | | | (0.03 | ) | | | (0.41 | ) | | | (0.01 | ) | | | (0.01 | ) | | | (0.40 | ) | |
Proceeds from regulatory settlements | | | — | | | | — | | | | 0.00 | (b) | | | — | | | | 0.00 | (b) | | | — | | |
Net asset value, end of period | | $ | 21.07 | | | $ | 20.04 | | | $ | 20.89 | | | $ | 25.57 | | | $ | 20.11 | | | $ | 13.62 | | |
Total return | | | 5.54 | % | | | (3.90 | %) | | | (16.64 | %) | | | 27.20 | % | | | 47.76 | % | | | (45.88 | %) | |
Ratios to average net assets(c)(d) | |
Total gross expenses | | | 1.32 | %(e) | | | 1.34 | %(f) | | | 1.28 | %(e) | | | 1.26 | %(e) | | | 1.21 | %(e) | | | 1.28 | % | |
Total net expenses(g) | | | 1.32 | %(e)(h) | | | 1.34 | %(f)(h) | | | 1.28 | %(e)(h) | | | 1.26 | %(e)(h) | | | 1.21 | %(e)(h) | | | 1.24 | %(h) | |
Net investment income (loss) | | | 1.17 | % | | | 0.79 | %(f) | | | 0.21 | % | | | (0.08 | %) | | | (0.10 | %) | | | (0.03 | %) | |
Supplemental data | |
Net assets, end of period (in thousands) | | $ | 110,896 | | | $ | 123,271 | | | $ | 145,298 | | | $ | 69,938 | | | $ | 50,812 | | | $ | 16,842 | | |
Portfolio turnover | | | 73 | % | | | 14 | % | | | 167 | % | | | 551 | % | | | 523 | % | | | 484 | % | |
Notes to Financial Highlights
(a) For the period from April 1, 2012 to August 31, 2012. During the period, the Fund's fiscal year end was changed from March 31 to August 31.
(b) Rounds to zero.
(c) In addition to the fees and expenses which the Fund bears directly, the Fund indirectly bears a pro rata share of the fees and expenses of the acquired funds in which it invests. Such indirect expenses are not included in the reported expense ratios.
(d) Certain line items from prior years have been reclassified to conform to the current presentation.
(e) Ratios include line of credit interest expense which rounds to less than 0.01%.
(f) Annualized.
(g) Total net expenses include the impact of certain waivers/reimbursements made by the Investment Manager and certain of its affiliates, if applicable.
(h) The benefits derived from expense reductions had an impact of less than 0.01%.
The accompanying Notes to Financial Statements are an integral part of this statement.
Annual Report 2013
18
Columbia Global Energy and Natural Resources Fund
Financial Highlights (continued)
| | | Year Ended August 31, | | Year Ended March 31, | |
Class B | | 2013 | | 2012(a) | | 2012 | | 2011(b) | |
Per share data | |
Net asset value, beginning of period | | $ | 19.44 | | | $ | 20.29 | | | $ | 24.96 | | | $ | 24.77 | | |
Income from investment operations: | |
Net investment income (loss) | | | 0.08 | | | | (0.00 | )(c) | | | (0.11 | ) | | | (0.03 | ) | |
Net realized and unrealized gain (loss) | | | 0.83 | | | | (0.85 | ) | | | (4.20 | ) | | | 0.22 | | |
Total from investment operations | | | 0.91 | | | | (0.85 | ) | | | (4.31 | ) | | | 0.19 | | |
Less distributions to shareholders: | |
Net investment income | | | (0.00 | )(c) | | | — | | | | — | | | | — | | |
Net realized gains | | | — | | | | — | | | | (0.36 | ) | | | — | | |
Total distributions to shareholders | | | (0.00 | )(c) | | | — | | | | (0.36 | ) | | | — | | |
Proceeds from regulatory settlements | | | — | | | | — | | | | 0.00 | (c) | | | — | | |
Net asset value, end of period | | $ | 20.35 | | | $ | 19.44 | | | $ | 20.29 | | | $ | 24.96 | | |
Total return | | | 4.70 | % | | | (4.19 | %) | | | (17.24 | %) | | | 0.77 | % | |
Ratios to average net assets(d)(e) | |
Total gross expenses | | | 2.06 | %(f) | | | 2.09 | %(g) | | | 2.01 | %(f) | | | 2.20 | %(f)(g) | |
Total net expenses(h) | | | 2.06 | %(f)(i) | | | 2.09 | %(g)(i) | | | 2.01 | %(f)(i) | | | 2.20 | %(f)(g)(i) | |
Net investment income (loss) | | | 0.40 | % | | | (0.00 | )(c)(g) | | | (0.54 | %) | | | (2.14 | %)(g) | |
Supplemental data | |
Net assets, end of period (in thousands) | | $ | 3,013 | | | $ | 3,913 | | | $ | 5,837 | | | $ | 58 | | |
Portfolio turnover | | | 73 | % | | | 14 | % | | | 167 | % | | | 551 | % | |
Notes to Financial Highlights
(a) For the period from April 1, 2012 to August 31, 2012. During the period, the Fund's fiscal year end was changed from March 31 to August 31.
(b) For the period from March 7, 2011 (commencement of operations) to March 31, 2011.
(c) Rounds to zero.
(d) In addition to the fees and expenses which the Fund bears directly, the Fund indirectly bears a pro rata share of the fees and expenses of the acquired funds in which it invests. Such indirect expenses are not included in the reported expense ratios.
(e) Certain line items from prior years have been reclassified to conform to the current presentation.
(f) Ratios include line of credit interest expense which rounds to less than 0.01%.
(g) Annualized.
(h) Total net expenses include the impact of certain waivers/reimbursements made by the Investment Manager and certain of its affiliates, if applicable.
(i) The benefits derived from expense reductions had an impact of less than 0.01%.
The accompanying Notes to Financial Statements are an integral part of this statement.
Annual Report 2013
19
Columbia Global Energy and Natural Resources Fund
Financial Highlights (continued)
| | | Year Ended August 31, | | Year Ended March 31, | |
Class C | | 2013 | | 2012(a) | | 2012 | | 2011 | | 2010 | | 2009 | |
Per share data | |
Net asset value, beginning of period | | $ | 19.44 | | | $ | 20.30 | | | $ | 24.96 | | | $ | 19.78 | | | $ | 13.47 | | | $ | 25.40 | | |
Income from investment operations: | |
Net investment income (loss) | | | 0.08 | | | | 0.00 | (b) | | | (0.12 | ) | | | (0.17 | ) | | | (0.15 | ) | | | (0.13 | ) | |
Net realized and unrealized gain (loss) | | | 0.84 | | | | (0.86 | ) | | | (4.18 | ) | | | 5.35 | | | | 6.46 | | | | (11.40 | ) | |
Total from investment operations | | | 0.92 | | | | (0.86 | ) | | | (4.30 | ) | | | 5.18 | | | | 6.31 | | | | (11.53 | ) | |
Less distributions to shareholders: | |
Net investment income | | | (0.00 | )(b) | | | — | | | | — | | | | — | | | | — | | | | — | | |
Net realized gains | | | — | | | | — | | | | (0.36 | ) | | | — | | | | — | | | | (0.40 | ) | |
Total distributions to shareholders | | | (0.00 | )(b) | | | — | | | | (0.36 | ) | | | — | | | | — | | | | (0.40 | ) | |
Proceeds from regulatory settlements | | | — | | | | — | | | | 0.00 | (b) | | | — | | | | 0.00 | (b) | | | — | | |
Net asset value, end of period | | $ | 20.36 | | | $ | 19.44 | | | $ | 20.30 | | | $ | 24.96 | | | $ | 19.78 | | | $ | 13.47 | | |
Total return | | | 4.75 | % | | | (4.24 | %) | | | (17.20 | %) | | | 26.19 | % | | | 46.84 | % | | | (46.29 | %) | |
Ratios to average net assets(c)(d) | |
Total gross expenses | | | 2.06 | %(e) | | | 2.09 | %(f) | | | 2.02 | %(e) | | | 2.01 | %(e) | | | 1.96 | %(e) | | | 2.03 | % | |
Total net expenses(g) | | | 2.06 | %(e)(h) | | | 2.09 | %(f)(h) | | | 2.02 | %(e)(h) | | | 2.01 | %(e)(h) | | | 1.96 | %(e)(h) | | | 1.99 | %(h) | |
Net investment income (loss) | | | 0.41 | % | | | 0.04 | %(f) | | | (0.55 | %) | | | (0.83 | %) | | | (0.84 | %) | | | (0.73 | %) | |
Supplemental data | |
Net assets, end of period (in thousands) | | $ | 15,340 | | | $ | 18,661 | | | $ | 22,785 | | | $ | 25,494 | | | $ | 16,420 | | | $ | 5,843 | | |
Portfolio turnover | | | 73 | % | | | 14 | % | | | 167 | % | | | 551 | % | | | 523 | % | | | 484 | % | |
Notes to Financial Highlights
(a) For the period from April 1, 2012 to August 31, 2012. During the period, the Fund's fiscal year end was changed from March 31 to August 31.
(b) Rounds to zero.
(c) In addition to the fees and expenses which the Fund bears directly, the Fund indirectly bears a pro rata share of the fees and expenses of the acquired funds in which it invests. Such indirect expenses are not included in the reported expense ratios.
(d) Certain line items from prior years have been reclassified to conform to the current presentation.
(e) Ratios include line of credit interest expense which rounds to less than 0.01%.
(f) Annualized.
(g) Total net expenses include the impact of certain waivers/reimbursements made by the Investment Manager and certain of its affiliates, if applicable.
(h) The benefits derived from expense reductions had an impact of less than 0.01%.
The accompanying Notes to Financial Statements are an integral part of this statement.
Annual Report 2013
20
Columbia Global Energy and Natural Resources Fund
Financial Highlights (continued)
| | | Year Ended August 31, | | Year Ended March 31, | |
Class I | | 2013 | | 2012(a) | | 2012 | | 2011(b) | |
Per share data | |
Net asset value, beginning of period | | $ | 20.15 | | | $ | 21.02 | | | $ | 25.70 | | | $ | 18.82 | | |
Income from investment operations: | |
Net investment income | | | 0.35 | | | | 0.10 | | | | 0.11 | | | | 0.05 | | |
Net realized and unrealized gain (loss) | | | 0.87 | | | | (0.89 | ) | | | (4.30 | ) | | | 6.86 | | |
Total from investment operations | | | 1.22 | | | | (0.79 | ) | | | (4.19 | ) | | | 6.91 | | |
Less distributions to shareholders: | |
Net investment income | | | (0.13 | ) | | | (0.08 | ) | | | (0.13 | ) | | | (0.03 | ) | |
Net realized gains | | | — | | | | — | | | | (0.36 | ) | | | — | | |
Total distributions to shareholders | | | (0.13 | ) | | | (0.08 | ) | | | (0.49 | ) | | | (0.03 | ) | |
Proceeds from regulatory settlements | | | — | | | | — | | | | 0.00 | (c) | | | — | | |
Net asset value, end of period | | $ | 21.24 | | | $ | 20.15 | | | $ | 21.02 | | | $ | 25.70 | | |
Total return | | | 6.06 | % | | | (3.72 | %) | | | (16.23 | %) | | | 36.74 | % | |
Ratios to average net assets(d)(e) | |
Total gross expenses | | | 0.83 | %(f) | | | 0.86 | %(g) | | | 0.80 | %(f) | | | 0.85 | %(f)(g) | |
Total net expenses(h) | | | 0.83 | %(f) | | | 0.86 | %(g) | | | 0.80 | %(f)(i) | | | 0.85 | %(f)(g)(i) | |
Net investment income | | | 1.70 | % | | | 1.29 | %(g) | | | 0.49 | % | | | 0.38 | %(g) | |
Supplemental data | |
Net assets, end of period (in thousands) | | $ | 44,595 | | | $ | 28,803 | | | $ | 29,761 | | | $ | 115,953 | | |
Portfolio turnover | | | 73 | % | | | 14 | % | | | 167 | % | | | 551 | % | |
Notes to Financial Highlights
(a) For the period from April 1, 2012 to August 31, 2012. During the period, the Fund's fiscal year end was changed from March 31 to August 31.
(b) For the period from September 27, 2010 (commencement of operations) to March 31, 2011.
(c) Rounds to zero.
(d) In addition to the fees and expenses which the Fund bears directly, the Fund indirectly bears a pro rata share of the fees and expenses of the acquired funds in which it invests. Such indirect expenses are not included in the reported expense ratios.
(e) Certain line items from prior years have been reclassified to conform to the current presentation.
(f) Ratios include line of credit interest expense which rounds to less than 0.01%.
(g) Annualized.
(h) Total net expenses include the impact of certain waivers/reimbursements made by the Investment Manager and certain of its affiliates, if applicable.
(i) The benefits derived from expense reductions had an impact of less than 0.01%.
The accompanying Notes to Financial Statements are an integral part of this statement.
Annual Report 2013
21
Columbia Global Energy and Natural Resources Fund
Financial Highlights (continued)
| | | Year Ended August 31, | | Year Ended March 31, | |
Class K(a) | | 2013 | | 2012(b) | | 2012 | | 2011(c) | |
Per share data | |
Net asset value, beginning of period | | $ | 20.13 | | | $ | 20.99 | | | $ | 25.67 | | | $ | 25.48 | | |
Income from investment operations: | |
Net investment income (loss) | | | 0.28 | | | | 0.07 | | | | 0.09 | | | | (0.01 | ) | |
Net realized and unrealized gain (loss) | | | 0.87 | | | | (0.88 | ) | | | (4.33 | ) | | | 0.22 | | |
Total from investment operations | | | 1.15 | | | | (0.81 | ) | | | (4.24 | ) | | | 0.21 | | |
Less distributions to shareholders: | |
Net investment income | | | (0.10 | ) | | | (0.05 | ) | | | (0.08 | ) | | | (0.02 | ) | |
Net realized gains | | | — | | | | — | | | | (0.36 | ) | | | — | | |
Total distributions to shareholders | | | (0.10 | ) | | | (0.05 | ) | | | (0.44 | ) | | | (0.02 | ) | |
Proceeds from regulatory settlements | | | — | | | | — | | | | 0.00 | (d) | | | — | | |
Net asset value, end of period | | $ | 21.18 | | | $ | 20.13 | | | $ | 20.99 | | | $ | 25.67 | | |
Total return | | | 5.71 | % | | | (3.85 | %) | | | (16.45 | %) | | | 0.82 | % | |
Ratios to average net assets(e)(f) | |
Total gross expenses | | | 1.13 | %(g) | | | 1.16 | %(h) | | | 1.11 | %(g) | | | 1.26 | %(g)(h) | |
Total net expenses(i) | | | 1.13 | %(g) | | | 1.16 | %(h) | | | 1.11 | %(g)(j) | | | 1.26 | %(g)(h)(j) | |
Net investment income (loss) | | | 1.35 | % | | | 0.90 | %(h) | | | 0.43 | % | | | (0.57 | %)(h) | |
Supplemental data | |
Net assets, end of period (in thousands) | | $ | 69 | | | $ | 77 | | | $ | 109 | | | $ | 3 | | |
Portfolio turnover | | | 73 | % | | | 14 | % | | | 167 | % | | | 551 | % | |
Notes to Financial Highlights
(a) Effective October 25, 2012, Class R4 shares were renamed Class K shares.
(b) For the period from April 1, 2012 to August 31, 2012. During the period, the Fund's fiscal year end was changed from March 31 to August 31.
(c) For the period from March 7, 2011 (commencement of operations) to March 31, 2011.
(d) Rounds to zero.
(e) In addition to the fees and expenses which the Fund bears directly, the Fund indirectly bears a pro rata share of the fees and expenses of the acquired funds in which it invests. Such indirect expenses are not included in the reported expense ratios.
(f) Certain line items from prior years have been reclassified to conform to the current presentation.
(g) Ratios include line of credit interest expense which rounds to less than 0.01%.
(h) Annualized.
(i) Total net expenses include the impact of certain waivers/reimbursements made by the Investment Manager and certain of its affiliates, if applicable.
(j) The benefits derived from expense reductions had an impact of less than 0.01%.
The accompanying Notes to Financial Statements are an integral part of this statement.
Annual Report 2013
22
Columbia Global Energy and Natural Resources Fund
Financial Highlights (continued)
| | | Year Ended August 31, | | Year Ended March 31, | |
Class R | | 2013 | | 2012(a) | | 2012 | | 2011(b) | |
Per share data | |
Net asset value, beginning of period | | $ | 20.03 | | | $ | 20.88 | | | $ | 25.56 | | | $ | 18.76 | | |
Income from investment operations: | |
Net investment income (loss) | | | 0.21 | | | | 0.05 | | | | 0.02 | | | | (0.02 | ) | |
Net realized and unrealized gain (loss) | | | 0.84 | | | | (0.89 | ) | | | (4.33 | ) | | | 6.82 | | |
Total from investment operations | | | 1.05 | | | | (0.84 | ) | | | (4.31 | ) | | | 6.80 | | |
Less distributions to shareholders: | |
Net investment income | | | (0.05 | ) | | | (0.01 | ) | | | (0.01 | ) | | | — | | |
Net realized gains | | | — | | | | — | | | | (0.36 | ) | | | — | | |
Total distributions to shareholders | | | (0.05 | ) | | | (0.01 | ) | | | (0.37 | ) | | | — | | |
Proceeds from regulatory settlements | | | — | | | | — | | | | 0.00 | (c) | | | — | | |
Net asset value, end of period | | $ | 21.03 | | | $ | 20.03 | | | $ | 20.88 | | | $ | 25.56 | | |
Total return | | | 5.27 | % | | | (4.04 | %) | | | (16.80 | %) | | | 36.25 | % | |
Ratios to average net assets(d)(e) | |
Total gross expenses | | | 1.57 | %(g) | | | 1.59 | %(f) | | | 1.55 | %(g) | | | 1.60 | %(f)(g) | |
Total net expenses(h) | | | 1.57 | %(g)(i) | | | 1.59 | %(f)(i) | | | 1.55 | %(g)(i) | | | 1.60 | %(f)(g)(i) | |
Net investment income (loss) | | | 1.01 | % | | | 0.61 | %(f) | | | 0.11 | % | | | (0.13 | %)(f) | |
Supplemental data | |
Net assets, end of period (in thousands) | | $ | 1,664 | | | $ | 1,226 | | | $ | 880 | | | $ | 55 | | |
Portfolio turnover | | | 73 | % | | | 14 | % | | | 167 | % | | | 551 | % | |
Notes to Financial Highlights
(a) For the period from April 1, 2012 to August 31, 2012. During the period, the Fund's fiscal year end was changed from March 31 to August 31.
(b) For the period from September 27, 2010 (commencement of operations) to March 31, 2011.
(c) Rounds to zero.
(d) In addition to the fees and expenses which the Fund bears directly, the Fund indirectly bears a pro rata share of the fees and expenses of the acquired funds in which it invests. Such indirect expenses are not included in the reported expense ratios.
(e) Certain line items from prior years have been reclassified to conform to the current presentation.
(f) Annualized.
(g) Ratios include line of credit interest expense which rounds to less than 0.01%.
(h) Total net expenses include the impact of certain waivers/reimbursements made by the Investment Manager and certain of its affiliates, if applicable.
(i) The benefits derived from expense reductions had an impact of less than 0.01%.
The accompanying Notes to Financial Statements are an integral part of this statement.
Annual Report 2013
23
Columbia Global Energy and Natural Resources Fund
Financial Highlights (continued)
Class R4 | | Year Ended
August 31,
2013(a) | |
Per share data | |
Net asset value, beginning of period | | $ | 20.25 | | |
Income from investment operations: | |
Net investment income | | | 0.35 | | |
Net realized and unrealized gain | | | 0.96 | | |
Total from investment operations | | | 1.31 | | |
Less distributions to shareholders: | |
Net investment income | | | (0.05 | ) | |
Total distributions to shareholders | | | (0.05 | ) | |
Net asset value, end of period | | $ | 21.51 | | |
Total return | | | 6.50 | % | |
Ratios to average net assets(b) | |
Total gross expenses | | | 1.06 | %(c) | |
Total net expenses(d) | | | 1.06 | %(c)(e) | |
Net investment income | | | 2.05 | %(c) | |
Supplemental data | |
Net assets, end of period (in thousands) | | $ | 1,575 | | |
Portfolio turnover | | | 73 | % | |
Notes to Financial Highlights
(a) For the period from November 8, 2012 (commencement of operations) to August 31, 2013.
(b) In addition to the fees and expenses which the Fund bears directly, the Fund indirectly bears a pro rata share of the fees and expenses of the acquired funds in which it invests. Such indirect expenses are not included in the reported expense ratios.
(c) Annualized.
(d) Total net expenses include the impact of certain waivers/reimbursements made by the Investment Manager and certain of its affiliates, if applicable.
(e) The benefits derived from expense reductions had an impact of less than 0.01%.
The accompanying Notes to Financial Statements are an integral part of this statement.
Annual Report 2013
24
Columbia Global Energy and Natural Resources Fund
Financial Highlights (continued)
Class R5 | | Year Ended
August 31,
2013(a) | |
Per share data | |
Net asset value, beginning of period | | $ | 20.25 | | |
Income from investment operations: | |
Net investment income | | | 0.34 | | |
Net realized and unrealized gain | | | 1.00 | | |
Total from investment operations | | | 1.34 | | |
Less distributions to shareholders: | |
Net investment income | | | (0.06 | ) | |
Total distributions to shareholders | | | (0.06 | ) | |
Net asset value, end of period | | $ | 21.53 | | |
Total return | | | 6.63 | % | |
Ratios to average net assets(b) | |
Total gross expenses | | | 0.88 | %(c) | |
Total net expenses(d) | | | 0.88 | %(c) | |
Net investment income | | | 2.02 | %(c) | |
Supplemental data | |
Net assets, end of period (in thousands) | | $ | 1,058 | | |
Portfolio turnover | | | 73 | % | |
Notes to Financial Highlights
(a) For the period from November 8, 2012 (commencement of operations) to August 31, 2013.
(b) In addition to the fees and expenses which the Fund bears directly, the Fund indirectly bears a pro rata share of the fees and expenses of the acquired funds in which it invests. Such indirect expenses are not included in the reported expense ratios.
(c) Annualized.
(d) Total net expenses include the impact of certain waivers/reimbursements made by the Investment Manager and certain of its affiliates, if applicable.
The accompanying Notes to Financial Statements are an integral part of this statement.
Annual Report 2013
25
Columbia Global Energy and Natural Resources Fund
Financial Highlights (continued)
| | | Year Ended August 31, | | Year Ended March 31, | |
Class Z | | 2013 | | 2012(a) | | 2012 | | 2011 | | 2010 | | 2009 | |
Per share data | |
Net asset value, beginning of period | | $ | 20.13 | | | $ | 21.00 | | | $ | 25.67 | | | $ | 20.17 | | | $ | 13.66 | | | $ | 25.49 | | |
Income from investment operations: | |
Net investment income | | | 0.28 | | | | 0.08 | | | | 0.09 | | | | 0.03 | | | | 0.04 | | | | 0.02 | | |
Net realized and unrealized gain (loss) | | | 0.88 | | | | (0.89 | ) | | | (4.31 | ) | | | 5.51 | | | | 6.52 | | | | (11.45 | ) | |
Total from investment operations | | | 1.16 | | | | (0.81 | ) | | | (4.22 | ) | | | 5.54 | | | | 6.56 | | | | (11.43 | ) | |
Less distributions to shareholders: | |
Net investment income | | | (0.10 | ) | | | (0.06 | ) | | | (0.09 | ) | | | (0.04 | ) | | | (0.05 | ) | | | — | | |
Net realized gains | | | — | | | | — | | | | (0.36 | ) | | | — | | | | — | | | | (0.40 | ) | |
Total distributions to shareholders | | | (0.10 | ) | | | (0.06 | ) | | | (0.45 | ) | | | (0.04 | ) | | | (0.05 | ) | | | (0.40 | ) | |
Proceeds from regulatory settlements | | | — | | | | — | | | | 0.00 | (b) | | | — | | | | 0.00 | (b) | | | — | | |
Net asset value, end of period | | $ | 21.19 | | | $ | 20.13 | | | $ | 21.00 | | | $ | 25.67 | | | $ | 20.17 | | | $ | 13.66 | | |
Total return | | | 5.80 | % | | | (3.84 | %) | | | (16.37 | %) | | | 27.47 | % | | | 48.12 | % | | | (45.72 | %) | |
Ratios to average net assets(c)(d) | |
Total gross expenses | | | 1.07 | %(e) | | | 1.09 | %(f) | | | 1.01 | %(e) | | | 1.01 | %(e) | | | 0.96 | %(e) | | | 1.03 | % | |
Total net expenses(g) | | | 1.07 | %(e)(h) | | | 1.09 | %(f)(h) | | | 1.01 | %(e)(h) | | | 1.01 | %(e)(h) | | | 0.96 | %(e)(h) | | | 0.99 | %(h) | |
Net investment income | | | 1.35 | % | | | 1.03 | %(f) | | | 0.42 | % | | | 0.17 | % | | | 0.21 | % | | | 0.11 | % | |
Supplemental data | |
Net assets, end of period (in thousands) | | $ | 186,303 | | | $ | 310,620 | | | $ | 390,028 | | | $ | 704,685 | | | $ | 622,471 | | | $ | 338,292 | | |
Portfolio turnover | | | 73 | % | | | 14 | % | | | 167 | % | | | 551 | % | | | 523 | % | | | 484 | % | |
Notes to Financial Highlights
(a) For the period from April 1, 2012 to August 31, 2012. During the period, the Fund's fiscal year end was changed from March 31 to August 31.
(b) Rounds to zero.
(c) In addition to the fees and expenses which the Fund bears directly, the Fund indirectly bears a pro rata share of the fees and expenses of the acquired funds in which it invests. Such indirect expenses are not included in the reported expense ratios.
(d) Certain line items from prior years have been reclassified to conform to the current presentation.
(e) Ratios include line of credit interest expense which rounds to less than 0.01%.
(f) Annualized.
(g) Total net expenses include the impact of certain waivers/reimbursements made by the Investment Manager and certain of its affiliates, if applicable.
(h) The benefits derived from expense reductions had an impact of less than 0.01%.
The accompanying Notes to Financial Statements are an integral part of this statement.
Annual Report 2013
26
Columbia Global Energy and Natural Resources Fund
Notes to Financial Statements
August 31, 2013
Note 1. Organization
Columbia Global Energy and Natural Resources Fund (formerly known as Columbia Energy and Natural Resources Fund) (the Fund), a series of Columbia Funds Series Trust I (the Trust), is a non-diversified fund. The Trust is registered under the Investment Company Act of 1940, as amended (the 1940 Act), as an open-end management investment company organized as a Massachusetts business trust. Effective August 5, 2013, Columbia Energy and Natural Resources Fund was renamed Columbia Global Energy and Natural Resources Fund.
Fund Shares
The Trust may issue an unlimited number of shares (without par value). The Fund offers Class A, Class B, Class C, Class I, Class K, Class R, Class R4, Class R5 and Class Z shares. Although all share classes generally have identical voting, dividend and liquidation rights, each share class votes separately when required by law. Different share classes pay different distribution amounts to the extent the expenses of such share classes differ, and distributions in liquidation will be proportional to the net asset value of each share class. Each share class has its own expense structure and sales charges, as applicable.
Class A shares are subject to a maximum front-end sales charge of 5.75% based on the initial investment amount. Class A shares purchased without an initial sales charge in accounts aggregating $1 million to $50 million at the time of purchase are subject to a contingent deferred sales charge (CDSC) if the shares are sold within 18 months of purchase, charged as follows: 1.00% CDSC if redeemed within 12 months of purchase, and 0.50% CDSC if redeemed more than 12, but less than 18, months after purchase.
Class B shares may be subject to a maximum CDSC of 5.00% based upon the holding period after purchase. Class B shares will generally convert to Class A shares eight years after purchase. The Fund no longer accepts investments by new or existing investors in the Fund's Class B shares, except in connection with the reinvestment of any dividend and/or capital gain distributions in Class B shares of the Fund and exchanges by existing Class B shareholders of certain other funds within the Columbia Family of Funds.
Class C shares are subject to a 1.00% CDSC on shares redeemed within one year of purchase.
Class I shares are not subject to sales charges and are available only to the Columbia Family of Funds.
Class K shares (formerly Class R4 shares) are not subject to sales charges; however, this share class is closed to new investors. Effective October 25, 2012, Class R4 shares were renamed Class K shares.
Class R shares are not subject to sales charges and are generally available only to certain retirement plans and other eligible investors.
Class R4 shares are not subject to sales charges and are generally available only to omnibus retirement plans and certain other eligible investors. Class R4 shares commenced operations on November 8, 2012.
Class R5 shares are not subject to sales charges and are generally available only to investors purchasing through authorized investment professionals and omnibus retirement plans. Class R5 shares commenced operations on November 8, 2012.
Class Z shares are not subject to sales charges and are available only to certain eligible investors, which are subject to different investment minimums.
Note 2. Summary of Significant Accounting Policies
Use of Estimates
The preparation of financial statements in accordance with U.S. generally accepted accounting principles (GAAP) requires management to make certain estimates and assumptions that affect the reported amounts of assets and liabilities, the disclosure of contingent assets and liabilities at the date of the financial statements and the reported amounts of revenue and expenses during the reporting period. Actual results could differ from those estimates.
The following is a summary of significant accounting policies consistently followed by the Fund in the preparation of its financial statements.
Security Valuation
All equity securities are valued at the close of business of the New York Stock Exchange (NYSE). Equity securities are valued at the last quoted sales price on the principal exchange or market on which they trade, except for securities traded on the NASDAQ Stock Market, which are valued at the NASDAQ official close price. Unlisted securities or listed securities for which there were no sales during the day are valued at the mean of the latest quoted bid and ask prices on such exchanges or markets.
Foreign equity securities are valued based on quotations from the principal market in which such securities are normally traded. If any foreign share prices are not readily available as a result of limited share activity the securities are valued at the mean of the latest quoted bid and ask prices on such exchanges or markets. Foreign currency exchange rates are generally determined at 4:00 p.m. Eastern (U.S.) time. However, many securities markets and exchanges outside the U.S. close prior to the close of the NYSE; therefore, the
Annual Report 2013
27
Columbia Global Energy and Natural Resources Fund
Notes to Financial Statements (continued)
August 31, 2013
closing prices for securities in such markets or on such exchanges may not fully reflect events that occur after such close but before the close of the NYSE. In those situations, foreign securities will be fair valued pursuant to the policy adopted by the Board of Trustees (the Board), including utilizing a third party pricing service to determine these fair values. The third party pricing service takes into account multiple factors, including, but not limited to, movements in the U.S. securities markets, certain depositary receipts, futures contracts and foreign exchange rates that have occurred subsequent to the close of the foreign exchange or market, to determine a good faith estimate that reasonably reflects the current market conditions as of the close of the NYSE. The fair value of a security is likely to be different from the quoted or published price, if available.
Investments in open-end investment companies, including money market funds, are valued at net asset value.
Forward foreign currency exchange contracts are marked-to-market based upon foreign currency exchange rates provided by a pricing service.
Futures and options on futures contracts are valued based upon the settlement price established each day by the board of trade or exchange on which they are traded.
Option contracts are valued at the mean of the latest quoted bid and asked prices on their primary exchanges. Option contracts, including over-the-counter (OTC) option contracts, with no readily available market value are valued using quotations obtained from independent brokers as of the close of the NYSE.
Investments for which market quotations are not readily available, or that have quotations which management believes are not reliable, are valued at fair value as determined in good faith under consistently applied procedures established by and under the general supervision of the Board. If a security or class of securities (such as foreign securities) is valued at fair value, such value is likely to be different from the last quoted market price for the security.
The determination of fair value often requires significant judgment. To determine fair value, management may use assumptions including but not limited to future cash flows and estimated risk premiums. Multiple inputs from various sources may be used to determine fair value.
Foreign Currency Transactions and Translations
The values of all assets and liabilities denominated in foreign currencies are translated into U.S. dollars at that day's exchange rates. Net realized and unrealized gains (losses) on foreign currency transactions and translations include gains (losses) arising from the fluctuation in exchange rates between
trade and settlement dates on securities transactions, gains (losses) arising from the disposition of foreign currency and currency gains (losses) between the accrual and payment dates on dividends, interest income and foreign withholding taxes.
For financial statement purposes, the Fund does not distinguish that portion of gains (losses) on investments which is due to changes in foreign exchange rates from that which is due to changes in market prices of the investments. Such fluctuations are included with the net realized and unrealized gains (losses) on investments in the Statement of Operations.
Derivative Instruments
The Fund invests in certain derivative instruments, as detailed below, to meet its investment objectives. Derivatives are instruments whose values depend on, or are derived from, in whole or in part, the value of one or more other assets, such as securities, currencies, commodities or indices. Derivative instruments may be used to maintain cash reserves while maintaining exposure to certain other assets, to offset anticipated declines in values of investments, to facilitate trading, to reduce transaction costs and to pursue higher investment returns. The Fund may also use derivative instruments to mitigate certain investment risks, such as foreign currency exchange rate risk, interest rate risk and credit risk. Derivatives may involve various risks, including the potential inability of the counterparty to fulfill its obligation under the terms of the contract, the potential for an illiquid secondary market (making it difficult for the Fund to sell, including at favorable prices) and the potential for market movements which may expose the Fund to gains or losses in excess of the amount shown in the Statement of Assets and Liabilities. The notional amounts of derivative instruments, if applicable, are not recorded in the financial statements.
A derivative instrument may suffer a mark to market loss if the value of the contract decreases due to an unfavorable change in the market rates or values of the underlying instrument. Losses can also occur if the counterparty does not perform under the contract. A Fund's risk of loss from counterparty credit risk on OTC derivatives is generally limited to the aggregate unrealized gain netted against any collateral held by the Fund and the amount of any initial margin held by the counterparty. With exchange traded or centrally cleared derivatives, there is minimal counterparty credit risk to the Fund since the exchange's clearinghouse, as counterparty to such instruments, guarantees against a possible default. The clearinghouse stands between the buyer and the seller of the contract; therefore, the counterparty credit risk is limited to failure of the clearinghouse. However, credit risk still exists in exchange traded or centrally cleared derivatives with respect to initial and variation margin that is held in a broker's customer
Annual Report 2013
28
Columbia Global Energy and Natural Resources Fund
Notes to Financial Statements (continued)
August 31, 2013
accounts. While brokers are required to segregate customer margin from their own assets, in the event that a broker becomes insolvent or goes into bankruptcy and at that time there is a shortfall in the aggregate amount of margin held by the broker for all its clients, U.S. bankruptcy laws will typically allocate that shortfall on a pro-rata basis across all the broker's customers, potentially resulting in losses to the Fund.
In order to better define its contractual rights and to secure rights that will help the Fund mitigate its counterparty risk, the Fund may enter into an International Swaps and Derivatives Association, Inc. Master Agreement (ISDA Master Agreement) or similar agreement with its derivative contract counterparties. An ISDA Master Agreement is an agreement between a Fund and a counterparty that governs OTC derivatives and forward foreign exchange contracts and typically contains, among other things, collateral posting terms and netting provisions in the event of a default and/or termination event. Under an ISDA Master Agreement, the Fund may, under certain circumstances, offset with the counterparty certain derivative instrument's payables and/or receivables with collateral held and/or posted and create one single net payment. The provisions of the ISDA Master Agreement typically permit a single net payment in the event of default (close-out netting) including the bankruptcy or insolvency of the counterparty. Note, however, that bankruptcy or insolvency laws of a particular jurisdiction may impose restrictions on or prohibitions against the right of offset in bankruptcy, insolvency or other events.
Collateral (margin) requirements differ by type of derivative. Margin requirements are established by the exchange or clearinghouse for exchange traded and centrally cleared derivatives. Brokers can ask for margin in excess of the minimum in certain circumstances. Collateral terms are contract specific for OTC derivatives. For OTC derivatives traded under an ISDA Master Agreement, the collateral requirements are typically calculated by netting the mark to market amount for each transaction under such agreement and comparing that amount to the value of any variation margin currently pledged by the Fund and/or the counterparty. Generally, the amount of collateral due from or to a party has to exceed a minimum transfer amount threshold (e.g. $500,000) before a transfer has to be made. To the extent amounts due to the Fund from its counterparties are not fully collateralized, contractually or otherwise, the Fund bears the risk of loss from counterparty nonperformance. The Fund attempts to mitigate counterparty risk by only entering into agreements with counterparties that it believes have the financial resources to honor their obligations and by monitoring the financial stability of those counterparties.
Certain ISDA Master Agreements allow counterparties to OTC derivatives to terminate derivative contracts prior to maturity in the event the Fund's net assets decline by a stated percentage over a specified time period or the Fund fails to meet the terms of the ISDA Master Agreement, which would cause the Fund to accelerate payment of any net liability owed to the counterparty. The Fund also has termination rights if the counterparty fails to meet the terms of the ISDA Master Agreement. In addition to considering counterparty credit risk, the Fund would consider terminating the derivative contracts based on whether termination would result in a net liability owed from the counterparty.
For financial reporting purposes, the Fund does not offset derivative assets and derivative liabilities that are subject to netting arrangements in the Statement of Assets and Liabilities.
The Fund and any counterparty are required to maintain an agreement that requires the Fund and that counterparty to monitor (on a daily basis) the net fair value of all derivatives entered into pursuant to the agreement between the Fund and such counterparty. If the net fair value of such derivatives between the Fund and that counterparty exceeds a certain threshold (as defined in the agreement), the Fund or the counterparty (as the case may be) is required to post cash and/or securities as collateral. Fair values of derivatives presented in the financial statements are not netted with the fair value of other derivatives or with any collateral amounts posted by the Fund or any counterparty.
Forward Foreign Currency Exchange Contracts
Forward foreign currency exchange contracts are OTC agreements between two parties to buy and sell a currency at a set price on a future date. These contracts are typically intended to be used to minimize the exposure to foreign exchange rate fluctuations during the period between the trade and settlement dates of the contract. The Fund utilized forward foreign currency exchange contracts to hedge the currency exposure associated with some or all of the Fund's securities, to shift foreign currency exposure back to U.S. dollars, to shift investment exposure from one currency to another, and to shift U.S. dollar exposure to achieve a representative weighted mix of major currencies in its benchmark, and/or to recover an underweight country exposure in its portfolio. These instruments may be used for other purposes in future periods.
The values of forward foreign currency exchange contracts fluctuate with changes in foreign currency exchange rates. The Fund will record a realized gain or loss when the forward foreign currency exchange contract expires or is closed.
The use of forward foreign currency exchange contracts does not eliminate fluctuations in the prices of the Fund's portfolio
Annual Report 2013
29
Columbia Global Energy and Natural Resources Fund
Notes to Financial Statements (continued)
August 31, 2013
securities. The risks of forward foreign currency exchange contracts include movement in the values of the foreign currencies relative to the U.S. dollar (or other foreign currencies) and the possibility that counterparties will not complete their contractual obligations, which may be in excess of the amount reflected, if any, in the Statement of Assets and Liabilities.
Futures Contracts
Futures contracts are exchange traded and represent commitments for the future purchase or sale of an asset at a specified price on a specified date. The Fund bought and sold futures contracts to manage exposure to the securities market. These instruments may be used for other purposes in future periods. Upon entering into futures contracts, the Fund bears risks that it may not achieve the anticipated benefits of the futures contracts and may realize a loss. Additional risks include counterparty credit risk, the possibility of an illiquid market, and that a change in the value of the contract or option may not correlate with changes in the value of the underlying asset.
Upon entering into a futures contract, the Fund pledges cash or securities with the broker in an amount sufficient to meet the initial margin requirement. The initial margin deposit must be maintained at an established level over the life of the contract. Cash deposited as initial margin is recorded in the Statement of Assets and Liabilities as margin deposits. Securities deposited as initial margin are designated in the Portfolio of Investments. Subsequent payments (variation margin) are made or received by the Fund each day. In the event of a bankruptcy or insolvency of a futures commission merchant that holds the margin on behalf of the Fund, the Fund may not be entitled to the return of the entire margin owed to the Fund, resulting in a loss. The variation margin payments are equal to the daily change in the contract value and are recorded as variation margin receivable or payable and are offset in unrealized gains or losses. The Fund recognizes a realized gain or loss when the contract is closed or expires. Futures contracts involve, to varying degrees, risk of loss in excess of the variation margin disclosed in the Statement of Assets and Liabilities.
Options Contracts
Options are contracts which entitle the holder to purchase or sell securities or other identified assets at a specified price, or in the case of index option contracts, to receive or pay the difference between the index value and the strike price of the index option contract. Option contracts can be either exchange traded or OTC. The Fund purchased and wrote option
contracts to decrease the Fund's exposure to equity market risk, to protect gains, and facilitate buying and selling of securities for investments. These instruments may be used for other purposes in future periods. Completion of transactions for option contracts traded in the OTC market depends upon the performance of the other party. Cash collateral may be collected or posted by the Fund to secure certain OTC option contract trades. Cash collateral held or posted by the Fund for such option contract trades must be returned to the counterparty or the Fund upon closure, exercise or expiration of the contract.
Options contracts purchased are recorded as investments. When the Fund writes an options contract, the premium received is recorded as an asset and an amount equivalent to the premium is recorded as a liability in the Statement of Assets and Liabilities and is subsequently adjusted to reflect the current fair value of the option written. The Fund will realize a gain or loss when the option contract is closed or expires. When option contracts are exercised, the proceeds on sales for a written call or purchased put option contract, or the purchase cost for a written put or purchased call option contract, is adjusted by the amount of premium received or paid.
For OTC options purchased, the Fund bears the risk of loss of the amount of the premiums paid plus the positive change in market values net of any collateral held by the Fund should the counterparty fail to perform under the contracts. The Fund also has the additional risk of being unable to enter into a closing transaction if a liquid secondary market does not exist. The risk in writing a call option contract is that the Fund gives up the opportunity for profit if the market price of the security increases above the strike price. The risk in writing a put option contract is that the Fund may incur a loss if the market price of the security decreases below the strike price and the option contract is exercised. The Fund's maximum payout in the case of written put option contracts represents the maximum potential amount of future payments (undiscounted) that the Fund could be required to make under the contract. For OTC options contracts, the transaction is also subject to counterparty credit risk. Option contracts written by the Fund do not typically give rise to counterparty credit risk, as options written generally obligate the Fund and not the counterparty to perform. The maximum payout amount may be offset by the subsequent sale, if any, of assets obtained upon the exercise of the put option contracts by holders of the option contracts or proceeds received upon entering into the contracts.
Annual Report 2013
30
Columbia Global Energy and Natural Resources Fund
Notes to Financial Statements (continued)
August 31, 2013
Contracts and premiums associated with options contracts written for the year ended August 31, 2013 are as follows:
| | | Calls | | Puts | |
| | | Contracts | | Premiums ($) | | Contracts | | Premiums ($) | |
Balance at August 31, 2012 | | | 1,733 | | | | 77,099 | | | | — | | | | — | | |
Opened | | | 9,747 | | | | 328,196 | | | | 1,460 | | | | 96,370 | | |
Closed | | | (300 | ) | | | (11,691 | ) | | | (700 | ) | | | (64,753 | ) | |
Expired | | | (10,515 | ) | | | (365,272 | ) | | | (760 | ) | | | (31,617 | ) | |
Exercised | | | (665 | ) | | | (28,332 | ) | | | — | | | | — | | |
Balance at August 31, 2013 | | | — | | | | — | | | | — | | | | — | | |
Effects of Derivative Transactions in the Financial Statements
The following tables are intended to provide additional information about the effect of derivatives on the financial statements of the Fund, including: the fair value of derivatives by risk category and the location of those fair values in the Statement of Assets and Liabilities; the impact of derivative transactions over the period in the Statement of Operations including realized gains or losses and unrealized gains or losses. The derivative schedules following the Portfolio of Investments present additional information regarding derivative instruments outstanding at the end of the period, if any.
The following table is a summary of the fair value of derivative instruments at August 31, 2013:
Asset Derivatives | |
Risk Exposure
Category | | Statement of Assets and
Liabilities Location | | Fair Value ($) | |
Foreign exchange
risk | | Unrealized appreciation on
forward foreign currency
exchange contracts | | | 603,799
| | |
Liability Derivatives | |
Risk Exposure
Category | | Statement of Assets and
Liabilities Location | | Fair Value ($) | |
Foreign exchange
risk | | Unrealized depreciation on
forward foreign currency
exchange contracts | | | 1,488,621
| | |
The following table indicates the effect of derivative instruments in the Statement of Operations for the year ended August 31, 2013:
Amount of Realized Gain (Loss) on Derivatives Recognized in Income | |
| Risk Exposure Category | | Forward Foreign
Currency Exchange
Contracts ($) | | Futures Contracts ($) | | Options Contracts
Written and
Purchased ($) | | Total ($) | |
Equity risk | | | — | | | | 229,502 | | | | 301,851 | | | | 531,353 | | |
Foreign exchange risk | | | (4,730,438 | ) | | | — | | | | — | | | | (4,730,438 | ) | |
Total | | | (4,730,438 | ) | | | 229,502 | | | | 301,851 | | | | (4,199,085 | ) | |
Change in Unrealized Appreciation (Depreciation) on Derivatives Recognized in Income | |
| Risk Exposure Category | | Forward Foreign
Currency Exchange
Contracts ($) | | Futures Contracts ($) | | Options Contracts
Written and
Purchased ($) | | Total ($) | |
Equity risk | | | — | | | | — | | | | (24,431 | ) | | | (24,431 | ) | |
Foreign exchange risk | | | (884,822 | ) | | | — | | | | — | | | | (884,822 | ) | |
Total | | | (884,822 | ) | | | — | | | | (24,431 | ) | | | (909,253 | ) | |
Annual Report 2013
31
Columbia Global Energy and Natural Resources Fund
Notes to Financial Statements (continued)
August 31, 2013
The following table is a summary of the volume of derivative instruments for the year ended August 31, 2013:
Derivative Instrument | | Contracts Opened | |
Forward foreign currency exchange contracts | | | 155 | | |
Futures contracts | | | 349 | | |
Options contracts | | | 16,826 | | |
Security Transactions
Security transactions are accounted for on the trade date. Cost is determined and gains (losses) are based upon the specific identification method for both financial statement and federal income tax purposes.
Income Recognition
Corporate actions and dividend income are generally recorded net of any non-reclaimable tax withholdings, on the ex-dividend date or upon receipt of ex-dividend notification in the case of certain foreign securities.
Awards from class action litigation are recorded as a reduction of cost basis if the Fund still owns the applicable securities on the payment date. If the Fund no longer owns the applicable securities, the proceeds are recorded as realized gains.
Expenses
General expenses of the Trust are allocated to the Fund and other funds of the Trust based upon relative net assets or other expense allocation methodologies determined by the nature of the expense. Expenses directly attributable to the Fund are charged to the Fund. Expenses directly attributable to a specific class of shares are charged to that share class.
Determination of Class Net Asset Value
All income, expenses (other than class-specific expenses, which are charged to that share class, as shown in the Statement of Operations) and realized and unrealized gains (losses) are allocated to each class of the Fund on a daily basis, based on the relative net assets of each class, for purposes of determining the net asset value of each class.
Federal Income Tax Status
The Fund intends to qualify each year as a regulated investment company under Subchapter M of the Internal Revenue Code, as amended, and will distribute substantially all of its taxable income (including net short-term capital gains), if any, for its tax year, and as such will not be subject to federal income taxes. In addition, the Fund intends to distribute in each calendar year substantially all of its net investment income, capital gains and certain other amounts, if any, such that the Fund should not be subject to federal excise tax. Therefore, no federal income or excise tax provision is recorded.
Foreign Taxes
The Fund may be subject to foreign taxes on income, gains on investments or currency repatriation, a portion of which may be recoverable. The Fund will accrue such taxes and recoveries, as applicable, based upon its current interpretation of tax rules and regulations that exist in the markets in which it invests.
Realized gains in certain countries may be subject to foreign taxes at the Fund level, based on statutory rates. The Fund accrues for such foreign taxes on realized and unrealized gains at the appropriate rate for each jurisdiction, as applicable. The amount, if any, is disclosed as a liability on the Statement of Assets and Liabilities.
Distributions to Shareholders
Distributions from net investment income, if any, are declared and paid each calendar quarter. Net realized capital gains, if any, are distributed at least annually. Income distributions and capital gain distributions are determined in accordance with federal income tax regulations, which may differ from GAAP.
Guarantees and Indemnifications
Under the Trust's organizational documents and, in some cases, by contract, its officers and trustees are indemnified against certain liabilities arising out of the performance of their duties to the Trust or its funds. In addition, certain of the Fund's contracts with its service providers contain general indemnification clauses. The Fund's maximum exposure under these arrangements is unknown since the amount of any future claims that may be made against the Fund cannot be determined, and the Fund has no historical basis for predicting the likelihood of any such claims.
Recent Accounting Pronouncement
Disclosures about Offsetting Assets and Liabilities
In December 2011, the Financial Accounting Standards Board (FASB) issued Accounting Standards Update (ASU) No. 2011-11, Disclosures about Offsetting Assets and Liabilities and in January 2013, ASU No. 2013-1, Clarifying the Scope of Disclosures about Offsetting Assets and Liabilities (collectively, the ASUs). Specifically, the ASUs require an entity to disclose both gross and net information for derivatives and other financial instruments that are subject to a master netting arrangement or similar agreement. The ASUs require disclosure of collateral received in connection with the master netting agreements or similar agreements. The disclosure requirements are effective for interim and annual periods beginning on or after January 1, 2013. At this time, management is evaluating the implications of this guidance and the impact it will have on the financial statement amounts and footnote disclosures, if any.
Annual Report 2013
32
Columbia Global Energy and Natural Resources Fund
Notes to Financial Statements (continued)
August 31, 2013
Note 3. Fees and Compensation Paid to Affiliates
Investment Management Fees
Under an Investment Management Services Agreement, Columbia Management Investment Advisers, LLC (the Investment Manager), a wholly-owned subsidiary of Ameriprise Financial, Inc. (Ameriprise Financial), determines which securities will be purchased, held or sold. The investment management fee is an annual fee that is equal to a percentage of the Fund's average daily net assets that declines from 0.69% to 0.54% as the Fund's net assets increase. The effective investment management fee rate for the year ended August 31, 2013 was 0.69% of the Fund's average daily net assets.
Administration Fees
Under an Administrative Services Agreement, the Investment Manager also serves as the Fund Administrator. The Fund pays the Fund Administrator an annual fee for administration and accounting services equal to a percentage of the Fund's average daily net assets that declines from 0.06% to 0.04% as the Fund's net assets increase. The effective administration fee rate for the year ended August 31, 2013 was 0.06% of the Fund's average daily net assets.
Compensation of Board Members
Board members are compensated for their services to the Fund as disclosed in the Statement of Operations. The Trust's eligible Trustees may participate in a Deferred Compensation Plan (the Plan) which may be terminated at any time. Obligations of the Plan will be paid solely out of the Fund's assets.
Compensation of Chief Compliance Officer
The Board has appointed a Chief Compliance Officer to the Fund in accordance with federal securities regulations. The Fund pays its pro-rata share of the expenses associated with the Chief Compliance Officer. The Fund's expenses for the Chief Compliance Officer will not exceed $15,000 per year.
Transfer Agent Fees
Under a Transfer and Dividend Disbursing Agent Agreement, Columbia Management Investment Services Corp. (the Transfer Agent), an affiliate of the Investment Manager and a wholly-owned subsidiary of Ameriprise Financial, is responsible for providing transfer agency services to the Fund. The Transfer Agent has contracted with Boston Financial Data Services (BFDS) to serve as sub-transfer agent.
The Transfer Agent receives monthly account-based service fees based on the number of open accounts and also receives sub-transfer agency fees based on a percentage of the average aggregate value of the Fund's shares maintained in omnibus
accounts (other than omnibus accounts for which American Enterprise Investment Services Inc. is the broker of record or accounts where the beneficial shareholder is a customer of Ameriprise Financial Services, Inc., which are paid a per account fee). The Transfer Agent pays the fees of BFDS for services as sub-transfer agent and is not entitled to reimbursement for such fees from the Fund (with the exception of out-of-pocket fees).
The Transfer Agent also receives compensation from fees for various shareholder services and reimbursements for certain out-of-pocket fees. Class I shares do not pay transfer agent fees. Total transfer agent fees for Class K and Class R5 shares are subject to an annual limitation of not more than 0.05% of the average daily net assets attributable to each share class.
For the year ended August 31, 2013, the Fund's effective transfer agent fee rates as a percentage of average daily net assets of each class were as follows:
Class A | | | 0.24 | % | |
Class B | | | 0.24 | | |
Class C | | | 0.24 | | |
Class K | | | 0.05 | | |
Class R | | | 0.24 | | |
Class R4 | | | 0.24 | * | |
Class R5 | | | 0.05 | * | |
Class Z | | | 0.24 | | |
*Annualized
An annual minimum account balance fee of $20 may apply to certain accounts with a value below the applicable share class' initial minimum investment requirements to reduce the impact of small accounts on transfer agent fees. These minimum account balance fees are recorded as part of expense reductions in the Statement of Operations For the year ended August 31, 2013, these minimum account balance fees reduced total expenses by $3,780.
Plan Administration Fees
Under a Plan Administration Services Agreement with the Transfer Agent, the Fund pays an annual fee at a rate of 0.25% of the Fund's average daily net assets attributable to Class K shares for the provision of various administrative, recordkeeping, communication and educational services.
Distribution and Service Fees
The Fund has an agreement with Columbia Management Investment Distributors, Inc. (the Distributor), an affiliate of the Investment Manager and a wholly-owned subsidiary of Ameriprise Financial, for distribution and shareholder services. Pursuant to Rule 12b-1 under the 1940 Act, the
Annual Report 2013
33
Columbia Global Energy and Natural Resources Fund
Notes to Financial Statements (continued)
August 31, 2013
Board has approved, and the Fund has adopted, distribution and shareholder service plans (the Plans) which set the distribution and service fees for the Fund. These fees are calculated daily and are intended to compensate the Distributor and/or eligible selling and/or servicing agents for selling shares of the Fund and providing services to investors.
Under the Plans, the Fund pays a monthly service fee to the Distributor at the maximum annual rate of 0.25% of the average daily net assets attributable to Class A, Class B and Class C shares of the Fund. Also under the Plans, the Fund pays a monthly distribution fee to the Distributor at the maximum annual rates of 0.75%, 0.75% and 0.50% of the average daily net assets attributable to Class B, Class C and Class R shares, respectively.
Sales Charges
Sales charges, including front-end charges and CDSCs, received by the Distributor for distributing Fund shares were $105,247 for Class A, $674 for Class B and $1,001 for Class C shares for the year ended August 31, 2013.
Expenses Waived/Reimbursed by the Investment Manager and its Affiliates
The Investment Manager and certain of its affiliates have contractually agreed to waive fees and/or reimburse expenses (excluding certain fees and expenses described below) for the periods disclosed below, unless sooner terminated at the sole discretion of the Board, so that the Fund's net operating expenses, after giving effect to fees waived/expenses reimbursed and any balance credits and/or overdraft charges from the Fund's custodian, do not exceed the following annual rates as a percentage of the class' average daily net assets:
| | | August 1, 2012
through
December 31, 2013 | |
Class A | | | 1.50 | % | |
Class B | | | 2.25 | | |
Class C | | | 2.25 | | |
Class I | | | 1.08 | | |
Class K | | | 1.38 | | |
Class R | | | 1.75 | | |
Class R4 | | | 1.25 | * | |
Class R5 | | | 1.13 | * | |
Class Z | | | 1.25 | | |
*Annual rate is contractual from November 8, 2012 (the commencement of operations of Class R4 and Class R5 shares) through December 31, 2013.
Under the agreement governing these fee waivers and/or expense reimbursement arrangements, the following fees and expenses are excluded from the waiver/reimbursement
commitment, and therefore will be paid by the Fund, if applicable: taxes (including foreign transaction taxes), expenses associated with investments in affiliated and non-affiliated pooled investment vehicles (including mutual funds and exchange traded funds), transaction costs and brokerage commissions, costs related to any securities lending program, dividend expenses associated with securities sold short, inverse floater program fees and expenses, transaction charges and interest on borrowed money, interest, extraordinary expenses and any other expenses the exclusion of which is specifically approved by the Board. This agreement may be modified or amended only with approval from all parties.
Note 4. Federal Tax Information
The timing and character of income and capital gain distributions are determined in accordance with income tax regulations, which may differ from GAAP because of temporary or permanent book to tax differences.
At August 31, 2013, these differences are primarily due to differing treatment for deferral/reversal of wash sales losses, Trustees' deferred compensation, distribution reclassifications, foreign currency transactions, late-year ordinary losses and derivative investments. To the extent these differences are permanent, reclassifications are made among the components of the Fund's net assets in the Statement of Assets and Liabilities. Temporary differences do not require reclassifications. In the Statement of Assets and Liabilities the following reclassifications were made:
Undistributed net investment income | | ($ | 4,738,910 | ) | |
Accumulated net realized loss | | | 4,738,910 | | |
Net investment income and net realized gains (losses), as disclosed in the Statement of Operations, and net assets were not affected by this reclassification.
The tax character of distributions paid during the years indicated was as follows:
Year Ended August 31, | | 2013 | | 2012 | |
Ordinary income | | $ | 2,165,033 | | | $ | 1,226,814 | | |
Long-term capital gains | | | — | | | | — | | |
Tax return of capital | | | — | | | | — | | |
Total | | $ | 2,165,033 | | | $ | 1,226,814 | | |
Short-term capital gain distributions, if any, are considered ordinary income distributions for tax purposes.
At August 31, 2013, the components of distributable earnings on a tax basis were as follows:
Undistributed accumulated long-term gain | | $ | 1,327,620 | | |
Unrealized appreciation | | | 36,053,262 | | |
Annual Report 2013
34
Columbia Global Energy and Natural Resources Fund
Notes to Financial Statements (continued)
August 31, 2013
At August 31, 2013, the cost of investments for federal income tax purposes was $328,857,691 and the aggregate gross unrealized appreciation and depreciation based on that cost was:
Unrealized appreciation | | $ | 59,450,500 | | |
Unrealized depreciation | | | (23,397,238 | ) | |
Net unrealized appreciation | | $ | 36,053,262 | | |
For the year ended August 31, 2013, $31,287,226 of capital loss carryforward was utilized.
Under current tax rules, regulated investment companies can elect to treat certain late-year ordinary losses incurred and post-October capital losses (capital losses realized after October 31) as arising on the first day of the following taxable year. As of August 31, 2013, the Fund will elect to treat late year ordinary losses of $1,312,638 as arising on September 1, 2013.
Management of the Fund has concluded that there are no significant uncertain tax positions that would require recognition in the financial statements. However, management's conclusion may be subject to review and adjustment at a later date based on factors including, but not limited to, new tax laws, regulations, and administrative interpretations (including relevant court decisions). Generally, the Fund's federal tax returns for the prior three fiscal years remain subject to examination by the Internal Revenue Service.
Note 5. Portfolio Information
The cost of purchases and proceeds from sales of securities, excluding short-term obligations, aggregated to $308,976,510 and $446,208,943, respectively, for the year ended August 31, 2013.
Note 6. Regulatory Settlements
During the year ended March 31, 2012, the Fund received $4,585 as a result of a regulatory settlement proceeding brought by the Securities and Exchange Commission against an unaffiliated third party relating to market timing and/or late trading of mutual funds. This amount represented the Fund's portion of the proceeds from the settlement (the Fund was not a party to the proceeding). The payments have been included in "Proceeds from regulatory settlements" in the Statement of Changes in Net Assets.
Note 7. Lending of Portfolio Securities
Effective December 19, 2012, the Fund no longer participates in securities lending activity. Prior to that date, the Fund participated, or was eligible to participate, in securities lending activity pursuant to a Master Securities Lending Agreement (the Agreement) with JPMorgan Chase Bank, N.A.
(JPMorgan). The Agreement authorized JPMorgan as lending agent to lend securities to authorized borrowers in order to generate additional income on behalf of the Fund. Pursuant to the Agreement, the securities loaned were secured by cash or securities that either were issued or guaranteed as to principal and interest by the U.S. government, its agencies, authorities or instrumentalities with value equal to at least 100% of the market value of the loaned securities. Any additional collateral required to maintain those levels due to market fluctuations of the loaned securities was requested to be delivered the following business day. Cash collateral received was invested by the lending agent on behalf of the Fund into authorized investments pursuant to the Agreement.
Pursuant to the Agreement, the Fund received income for lending its securities either in the form of fees or by earning interest on invested cash collateral, net of negotiated rebates paid to borrowers and fees paid to the lending agent for services provided and any other securities lending expenses. Net income earned from securities lending for the year ended August 31, 2013 is disclosed in the Statement of Operations. The Fund continued to earn and accrue interest and dividends on the securities loaned.
Note 8. Affiliated Money Market Fund
The Fund invests its daily cash balances in Columbia Short-Term Cash Fund, an affiliated money market fund established for the exclusive use by the Fund and other affiliated funds. The income earned by the Fund from such investments is included as "Dividends — affiliated issuers" in the Statement of Operations. As an investing fund, the Fund indirectly bears its proportionate share of the expenses of Columbia Short-Term Cash Fund.
Note 9. Shareholder Concentration
At August 31, 2013, one unaffiliated shareholder account owned 17.6% of the outstanding shares of the Fund. The Fund has no knowledge about whether any portion of those shares was owned beneficially by such account. Affiliated shareholder accounts owned 20.8% of the outstanding shares of the Fund. Subscription and redemption activity by concentrated accounts may have a significant effect on the operations of the Fund.
Note 10. Line of Credit
The Fund has entered into a revolving credit facility with a syndicate of banks led by JPMorgan whereby the Fund may borrow for the temporary funding of shareholder redemptions or for other temporary or emergency purposes. The credit facility agreement, as amended, which is a collective agreement between the Fund and certain other funds managed by the Investment Manager, severally and not jointly, permits collective borrowings up to $500 million. Interest is charged to
Annual Report 2013
35
Columbia Global Energy and Natural Resources Fund
Notes to Financial Statements (continued)
August 31, 2013
each participating fund based on its borrowings at a rate equal to the higher of (i) the overnight federal funds rate plus 1.00% or (ii) the one-month LIBOR rate plus 1.00%. Each borrowing under the credit facility matures no later than 60 days after the date of borrowing. The Fund also pays a commitment fee equal to its pro rata share of the amount of the credit facility at a rate of 0.08% per annum. The commitment fee is included in other expenses in the Statement of Operations.
For the year ended August 31, 2013, the average daily loan balance outstanding on days when borrowing existed was $2,325,000 at a weighted average interest rate of 1.21%. Interest expense incurred by the Fund is recorded as interest expense in the Statement of Operations.
Note 11. Fund Merger
At the close of business on June 3, 2011, the Fund acquired the assets and assumed the identified liabilities of RiverSource Precious Metals and Mining Fund, a series of RiverSource Selected Series, Inc. (the acquired fund). The reorganization was completed after shareholders of the acquired fund approved the plan on February 15, 2011. The purpose of the transaction was to combine two funds managed by the Investment Manager with comparable investment objectives and strategies.
The aggregate net assets of the Fund immediately before the acquisition were $859,188,131and the combined net assets immediately after the acquisition were $1,035,182,630.
The merger was accomplished by a tax-free exchange of 12,525,870 shares of the acquired fund valued at $175,994,499 (including $56,637,074 of unrealized appreciation).
In exchange for the acquired fund's shares, the Fund issued the following number of shares:
| | | Shares | |
Class A | | | 6,701,075 | | |
Class B | | | 511,902 | | |
Class C | | | 280,755 | | |
Class I | | | 604 | | |
Class R4 | | | 5,846 | | |
For financial reporting purposes, net assets received and shares issued by the Fund were recorded at fair value; however, the acquired fund's cost of investments was carried forward.
The financial statements reflect the operations of the Fund for the period prior to the merger and the combined fund for the period subsequent to the merger. Because the combined investment portfolios have been managed as a single integrated portfolio since the merger was completed, it is not practicable
to separate the amounts of revenue and earnings of the acquired fund that have been included in the combined Fund's Statement of Operations since the merger was completed.
Assuming the merger had been completed on April 1, 2011, the Fund's pro-forma net investment income, net gain on investments, net change in unrealized depreciation and net decrease in net assets from operations for the year ended March 31, 2012 would have been approximately $2.7 million, $25.3 million, $(204.0) million and $(176.0) million, respectively.
Note 12. Significant Risks
Non-Diversification Risk
A non-diversified fund is permitted to invest a greater percentage of its total assets in fewer issuers than a diversified fund. The Fund may, therefore, have a greater risk of loss from a few issuers than a similar fund that invests more broadly.
Note 13. Subsequent Events
Management has evaluated the events and transactions that have occurred through the date the financial statements were issued and noted no items requiring adjustment of the financial statements or additional disclosure.
Note 14. Information Regarding Pending and Settled Legal Proceedings
In December 2005, without admitting or denying the allegations, American Express Financial Corporation (AEFC, which is now known as Ameriprise Financial, Inc. (Ameriprise Financial)) entered into settlement agreements with the Securities and Exchange Commission (SEC) and Minnesota Department of Commerce (MDOC) related to market timing activities. As a result, AEFC was censured and ordered to cease and desist from committing or causing any violations of certain provisions of the Investment Advisers Act of 1940, the Investment Company Act of 1940, and various Minnesota laws. AEFC agreed to pay disgorgement of $10 million and civil money penalties of $7 million. AEFC also agreed to retain an independent distribution consultant to assist in developing a plan for distribution of all disgorgement and civil penalties ordered by the SEC in accordance with various undertakings detailed at www.sec.gov/litigation/admin/ia-2451.pdf. Ameriprise Financial and its affiliates have cooperated with the SEC and the MDOC in these legal proceedings, and have made regular reports to the funds' Boards of Trustees.
Ameriprise Financial and certain of its affiliates have historically been involved in a number of legal, arbitration and regulatory proceedings, including routine litigation, class actions, and governmental actions, concerning matters arising
Annual Report 2013
36
Columbia Global Energy and Natural Resources Fund
Notes to Financial Statements (continued)
August 31, 2013
in connection with the conduct of their business activities. Ameriprise Financial believes that the Funds are not currently the subject of, and that neither Ameriprise Financial nor any of its affiliates are the subject of, any pending legal, arbitration or regulatory proceedings that are likely to have a material adverse effect on the Funds or the ability of Ameriprise Financial or its affiliates to perform under their contracts with the Funds. Ameriprise Financial is required to make 10-Q, 10-K and, as necessary, 8-K filings with the Securities and Exchange Commission on legal and regulatory matters that relate to Ameriprise Financial and its affiliates. Copies of these filings may be obtained by accessing the SEC website at www.sec.gov.
There can be no assurance that these matters, or the adverse publicity associated with them, will not result in increased fund redemptions, reduced sale of fund shares or other adverse consequences to the Funds. Further, although we believe proceedings are not likely to have a material adverse effect on the Funds or the ability of Ameriprise Financial or its affiliates to perform under their contracts with the Funds, these proceedings are subject to uncertainties and, as such, we are unable to estimate the possible loss or range of loss that may result. An adverse outcome in one or more of these proceedings could result in adverse judgments, settlements, fines, penalties or other relief that could have a material adverse effect on the consolidated financial condition or results of operations of Ameriprise Financial.
Annual Report 2013
37
Columbia Global Energy and Natural Resources Fund
Report of Independent Registered Public Accounting Firm
To the Trustees of Columbia Funds Series Trust I and the Shareholders of
Columbia Global Energy and Natural Resources Fund
In our opinion, the accompanying statement of assets and liabilities, including the portfolio of investments, and the related statements of operations and of changes in net assets and the financial highlights present fairly, in all material respects, the financial position of Columbia Global Energy and Natural Resources Fund (the "Fund") (formerly known as Columbia Energy and Natural Resources Fund) (a series of Columbia Funds Series Trust I) at August 31, 2013, the results of its operations, the changes in its net assets and the financial highlights for the periods indicated, in conformity with accounting principles generally accepted in the United States of America. These financial statements and financial highlights (hereafter referred to as "financial statements") are the responsibility of the Fund's management. Our responsibility is to express an opinion on these financial statements based on our audits. We conducted our audits of these financial statements in accordance with the standards of the Public Company Accounting Oversight Board (United States). Those standards require that we plan and perform the audit to obtain reasonable assurance about whether the financial statements are free of material misstatement. An audit includes examining, on a test basis, evidence supporting the amounts and disclosures in the financial statements, assessing the accounting principles used and significant estimates made by management, and evaluating the overall financial statement presentation. We believe that our audits, which included confirmation of securities at August 31, 2013 by correspondence with the custodian, brokers and transfer agent, provide a reasonable basis for our opinion.
PricewaterhouseCoopers LLP
Minneapolis, Minnesota
October 22, 2013
Annual Report 2013
38
Columbia Global Energy and Natural Resources Fund
Federal Income Tax Information
(Unaudited)
The Fund hereby designates the following tax attributes for the fiscal year ended August 31, 2013. Shareholders will be notified in early 2014 of the amounts for use in preparing 2013 income tax returns.
Tax Designations:
| Qualified Dividend Income | | 100.00% | |
| Dividends Received Deduction | | 100.00% | |
Capital Gain Dividend | | $1,443,152 | |
Qualified Dividend Income. For taxable, non-corporate shareholders, the percentage of ordinary income dividends paid during the fiscal year that represents qualified dividend income subject to reduced tax rates.
Dividends Received Deduction. The percentage of ordinary income dividends paid during the fiscal year that qualifies for the corporate dividends received deduction.
Capital Gain Dividend. The Fund designates as a capital gain dividend the amount reflected above, or if subsequently determined to be different, the net capital gain of such fiscal period. The Fund also designates as capital gain dividends, to the extent necessary to fully distribute such capital gains, earnings and profits distributed to shareholders on the redemption of shares.
Annual Report 2013
39
Columbia Global Energy and Natural Resources Fund
The Trustees serve terms of indefinite duration. The names, addresses and birth years of the Trustees and Officers of the Funds in Columbia Funds Series Trust I, the year each was first elected or appointed to office, their principal business occupations during at least the last five years, the number of Funds overseen by each Trustee and other directorships they hold are shown below. Each officer listed below serves as an officer of each Fund in Columbia Funds Series Trust I.
Independent Trustees
Name, Address and Year of Birth,
Position with Funds, Year First
Elected or Appointed to Office | | Principal Occupation(s) During Past Five Years, Number of Funds in Columbia
Funds Complex Overseen by Trustee, Other Directorships Held | |
Rodman L. Drake (Born 1943)
c/o Columbia Management
Investment Advisers, LLC
225 Franklin Street
Boston, MA 02110
Trustee (since 1994) and
Chairman of the Board (since 2009) | | Independent consultant since 2010; Co-Founder of Baringo Capital LLC (private equity) from 1997 to 2008; Chairman (from 2003 to 2010) and CEO (from 2008 to 2010) of Crystal River Capital, Inc. (real estate investment trust); Oversees 52; Jackson Hewitt Tax Service Inc. (tax preparation services) from 2004 to 2011; Student Loan Corporation (student loan provider) from 2005 to 2010; Celgene Corporation (global biotechnology company); The Helios Funds and Brookfield Funds (closed-end funds); Chimerix, Inc. (biopharmaceutical company) since August 1, 2013; Crystal River Capital, Inc. from 2005 to 2010; Parsons Brinckerhoff from 1995 to 2008; and Apex Silver Mines Ltd. from 2007 to 2009 | |
Douglas A. Hacker (Born 1955)
c/o Columbia Management
Investment Advisers, LLC
225 Franklin Street
Boston, MA 02110
Trustee (since 1996) | | Independent business executive since May 2006; Executive Vice President — Strategy of United Airlines from December 2002 to May 2006; President of UAL Loyalty Services (airline marketing company) from September 2001 to December 2002; Executive Vice President and Chief Financial Officer of United Airlines from July 1999 to September 2001. Oversees 52; Nash Finch Company (food distributor); Aircastle Limited (aircraft leasing); and SeaCube Container Leasing Ltd. (container leasing) | |
Janet Langford Kelly (Born 1957)
c/o Columbia Management
Investment Advisers, LLC
225 Franklin Street
Boston, MA 02110
Trustee (since 1996) | | Senior Vice President, General Counsel and Corporate Secretary, ConocoPhillips (integrated energy company) since September 2007; Deputy General Counsel — Corporate Legal Services, ConocoPhillips from August 2006 to August 2007; Partner, Zelle, Hofmann, Voelbel, Mason & Gette LLP (law firm) from March 2005 to July 2006; Adjunct Professor of Law, Northwestern University from September 2004 to June 2006; Director, UAL Corporation (airline) from February 2006 to July 2006; Chief Administrative Officer and Senior Vice President, Kmart Holding Corporation (consumer goods) from September 2003 to March 2004. Oversees 52; None | |
Nancy T. Lukitsh (Born 1956)
c/o Columbia Management
Investment Advisers, LLC
225 Franklin Street
Boston, MA 02110
Trustee (since 2011) | | Senior Vice President, Partner and Director of Marketing, Wellington Management Company, LLP (investment adviser) from 1997 to 2010; Chair, Wellington Management Investment Portfolios (commingled non-U.S. investment pools) from 2007 to 2010; Director, Wellington Trust Company, NA and other Wellington affiliates from 1997 to 2010. Oversees 52; None | |
William E. Mayer (Born 1940)
c/o Columbia Management
Investment Advisers, LLC
225 Franklin Street
Boston, MA 02110
Trustee (since 1994) | | Partner, Park Avenue Equity Partners (private equity) since February 1999; Dean and Professor, College of Business and Management, University of Maryland from 1992 to 1996. Oversees 52; DynaVox Inc. (speech creation); Lee Enterprises (print media); WR Hambrecht + Co. (financial service provider) from 2000 to 2012; BlackRock Kelso Capital Corporation (investment company) | |
David M. Moffett (Born 1952)
c/o Columbia Management
Investment Advisers, LLC
225 Franklin Street
Boston, MA 02110
Trustee (since 2011) | | Retired. Chief Executive Officer, Federal Home Loan Mortgage Corporation, from 2008 to 2009; Senior Adviser, Global Financial Services Group, Carlyle Group, Inc., from 2007 to 2008; Vice Chairman and Chief Financial Officer, U.S. Bancorp, from 1993 to 2007. Oversees 52; CIT Group Inc. (commercial and consumer finance); eBay Inc. (online trading community); MBIA Inc. (financial service provider); E.W. Scripps Co. (print and television media), Building Materials Holding Corp. (building materials and construction services); Genworth Financial, Inc. (financial and insurance products and services); and University of Oklahoma Foundation | |
Charles R. Nelson (Born 1942)
c/o Columbia Management
Investment Advisers, LLC
225 Franklin Street
Boston, MA 02110
Trustee (since 1981) | | Retired. Professor Emeritus, University of Washington, since 2011; Professor of Economics, University of Washington from 1976 to 2011; Ford and Louisa Van Voorhis Professor of Political Economy, University of Washington from 1993 to 2011; Adjunct Professor of Statistics, University of Washington from 1980 to 2011; Associate Editor, Journal of Money, Credit and Banking from September 1993 to 2008; consultant on econometric and statistical matters. Oversees 52; None | |
John J. Neuhauser (Born 1943)
c/o Columbia Management
Investment Advisers, LLC
225 Franklin Street
Boston, MA 02110
Trustee (since 1984) | | President, Saint Michael's College, since August 2007; Director or Trustee of several non-profit organizations, including Fletcher Allen Health Care, Inc.; University Professor, Boston College from November 2005 to August 2007; Academic Vice President and Dean of Faculties, Boston College from August 1999 to October 2005. Oversees 52; Liberty All-Star Equity Fund and Liberty All-Star Growth Fund (closed-end funds) | |
Annual Report 2013
40
Columbia Global Energy and Natural Resources Fund
Trustees and Officers (continued)
Independent Trustees (continued)
Name, Address and Year of Birth,
Position with Funds, Year First
Elected or Appointed to Office | | Principal Occupation(s) During Past Five Years, Number of Funds in Columbia
Funds Complex Overseen by Trustee, Other Directorships Held | |
Patrick J. Simpson (Born 1944)
c/o Columbia Management
Investment Advisers, LLC
225 Franklin Street
Boston, MA 02110
Trustee (since 2000) | | Partner, Perkins Coie LLP (law firm). Oversees 52; None | |
Anne-Lee Verville (Born 1945)
c/o Columbia Management
Investment Advisers, LLC
225 Franklin Street
Boston, MA 02110
Trustee (since 1998) | | Retired. General Manager — Global Education Industry from 1994 to 1997, President — Application Systems Division from 1991 to 1994, Chief Financial Officer — US Marketing & Services from 1988 to 1991, and Chief Information Officer from 1987 to 1988, IBM Corporation (computer and technology). Oversees 52; Enesco Group, Inc. (producer of giftware and home and garden decor products) from 2001 to 2006 | |
Interested Trustee
Name, Address and Year of Birth,
Position with Funds, Year First
Elected or Appointed to Office | | Principal Occupation(s) During Past Five Years, Number of Funds in Columbia
Funds Complex Overseen by Trustee, Other Directorships Held | |
William F. Truscott (born 1960)
53600 Ameriprise Financial Center
Minneapolis, MN 55474
Senior Vice President (since 2012) | | Chairman of the Board and President, Columbia Management Investment Advisers, LLC since May 2010 and February 2012 (previously President and Chief Investment Officer, from 2001 to April 2010); Chief Executive Officer, Global Asset Management, Ameriprise Financial, Inc. since September 2012 (previously, Chief Executive Officer, U.S. Asset Management & President, Annuities, from May 2010 to September 2012 and President — U.S. Asset Management and Chief Investment Officer from 2005 to April 2010); Director and Chief Executive Officer, Columbia Management Investment Distributors, Inc. since May 2010 and February 2012, respectively (previously Chairman of the Board and Chief Executive Officer from 2006 to April 2010); Chairman of the Board and Chief Executive Officer, RiverSource Distributors, Inc. since 2006; President and Chief Executive Officer, Ameriprise Certificate Company, 2006 to August 2012; Oversees 184; Director, Ameriprise Certificate Company, 2006-January 2013 | |
The Statement of Additional Information includes additional information about the Trustees of the Funds and is available, without charge, upon request by calling 800.345.6611.
The Board has appointed officers who are responsible for day-to-day business decisions based on policies it has established. The officers serve at the pleasure of the Board. In addition to Mr. Truscott, who is Senior Vice President, the Funds' other officers are:
Officers
Name, Year of Birth and Address | | Principal Occupation(s) During the Past Five Years | |
J. Kevin Connaughton (Born 1964)
225 Franklin Street
Boston, MA 02110
President (since 2009) | | Senior Vice President and General Manager — Mutual Fund Products, Columbia Management Investment Advisers, LLC since May 2010; President, Columbia Funds since 2009 and RiverSource Funds since May 2010; Managing Director, Columbia Management Advisors, LLC, December 2004-April 2010; Senior Vice President and Chief Financial Officer, Columbia Funds, June 2008-January 2009; Treasurer, Columbia Funds, October 2003-May 2008; and senior officer of various other affiliated funds since 2000 | |
Amy Johnson (Born 1965)
5228 Ameriprise Financial Center
Minneapolis, MN 55474
Vice President (since 2010) | | Senior Vice President and Chief Operating Officer, Columbia Management Investment Advisers, LLC since May 2010 (previously Chief Administrative Officer, from 2009-April 2010, Vice President — Asset Management and Trust Company Services, from 2006-2009) | |
Michael G. Clarke (Born 1969)
225 Franklin Street
Boston, MA 02110
Treasurer (since 2011) and Chief
Financial Officer (since 2009) | | Vice President, Columbia Management Investment Advisers, LLC since May 2010; Managing Director of Fund Administration, Columbia Management Advisors, LLC, September 2004-April 2010; senior officer of Columbia Funds and affiliated funds since 2002 | |
Annual Report 2013
41
Columbia Global Energy and Natural Resources Fund
Trustees and Officers (continued)
Officers (continued)
Name, Year of Birth and Address | | Principal Occupation(s) During the Past Five Years | |
Scott R. Plummer (Born 1959)
5228 Ameriprise Financial Center
Minneapolis, MN 55474
Senior Vice President, Assistant
Secretary and Chief Legal Officer
(since 2010) | | Senior Vice President, Chief Legal Officer and Assistant Secretary, Columbia Management Investment Advisers, LLC since June 2005; Senior Vice President and Lead Chief Counsel — Asset Management, Ameriprise Financial, Inc. since May 2010 (previously Vice President and Chief Counsel — Asset Management, 2005-April 2010); Vice President, Chief Counsel and Assistant Secretary, Columbia Management Investment Distributors, Inc. since 2008; Vice President, General Counsel and Secretary, Ameriprise Certificate Company since 2005; Chief Counsel, RiverSource Distributors, Inc. since 2006; senior officer of Columbia Funds and affiliated funds since 2010 | |
Colin Moore (Born 1958)
225 Franklin Street
Boston, MA 02110
Senior Vice President (since 2010) | | Executive Vice President and Global Chief Investment Officer, Ameriprise Financial, Inc. since July 2013; Director and Global Chief Investment Officer, Columbia Management Investment Advisers, LLC since May 2010; Manager, Managing Director and Chief Investment Officer of Columbia Management Advisors, LLC, 2007-April 2010 | |
Thomas P. McGuire (Born 1972)
225 Franklin Street
Boston, MA 02110
Chief Compliance Officer
(since 2012) | | Vice President — Asset Management Compliance, Columbia Management Investment Advisers, LLC since 2010; Chief Compliance Officer, Ameriprise Certificate Company, since September 2010; Compliance Executive, Bank of America, N.A. 2005-2010 | |
Stephen T. Welsh (born 1957)
225 Franklin Street
Boston, MA 02110
Vice President (since 2006) | | President and Director, Columbia Management Investment Services Corp. since May 2010; President and Director, Columbia Management Services, Inc., July 2004-April 2010; Managing Director, Columbia Management Distributors, Inc., August 2007-April 2010 | |
Christopher O. Petersen (born 1970)
5228 Ameriprise Financial Center
Minneapolis, MN 55474
Vice President (since 2010) and
Secretary (since 2011) | | Vice President and Chief Counsel, Ameriprise Financial, Inc. since January 2010 (formerly Vice President and Group Counsel or Counsel, April 2004-January 2010); Assistant Secretary of Columbia Funds, January 2007-April 2011 | |
Paul D. Pearson (born 1956)
10468 Ameriprise Financial Center
Minneapolis, MN 55474
Vice President and Assistant
Treasurer (since 2011) | | Vice President, Investment Accounting, Columbia Management Investment Advisers, LLC, since May 2010; Vice President — Managed Assets, Investment Accounting, Ameriprise Financial, Inc., February 1998-May 2010 | |
Joseph F. DiMaria (Born 1968)
225 Franklin Street
Boston, MA 02110
Vice President (since 2011) and
Chief Accounting Officer (since 2008) | | Vice President, Mutual Fund Administration, Columbia Management Investment Advisers, LLC, since May 2010; Director of Fund Administration, Columbia Management Advisors, LLC, January 2006-April 2010 | |
Paul B. Goucher (born 1968)
100 Park Avenue
New York, NY 10017
Vice President and Assistant
Secretary (since 2010) | | Vice President and Lead Chief Counsel, Ameriprise Financial, Inc. since November 2008 and January 2013, respectively (formerly, Chief Counsel from January 2010-January 2013 and Group Counsel from November 2008-January 2010); Director, Managing Director and General Counsel, J. & W. Seligman & Co. Incorporated, July 2008-November 2008 (previously, Managing Director and Associate General Counsel, January 2005-July 2008) | |
Michael E. DeFao (born 1968)
225 Franklin Street
Boston, MA 02110
Vice President and Assistant
Secretary (since 2011) | | Vice President and Chief Counsel, Ameriprise Financial, Inc. since May 2010; Associate General Counsel, Bank of America, N.A. June 2005-April 2010 | |
Annual Report 2013
42
Columbia Global Energy and Natural Resources Fund
Board Consideration and Approval of Advisory Agreement
On June 14, 2013, the Board of Trustees (the "Board") and the Trustees who are not interested persons (as defined in the Investment Company Act of 1940) of the Trust (the "Independent Trustees") unanimously approved the continuation of the Investment Management Services Agreement (the "Advisory Agreement") with Columbia Management Investment Advisers, LLC (the "Investment Manager") with respect to Columbia Global Energy and Natural Resources Fund (the "Fund"), a series of the Trust. As detailed below, the Advisory Fees and Expenses Committee (the "Committee") and the Board met on multiple occasions to review and discuss, both among themselves and with the management team of the Investment Manager, materials provided by the Investment Manager before determining to approve the continuation of the Advisory Agreement.
In connection with their deliberations regarding the continuation of the Advisory Agreement, the Committee and the Board evaluated materials requested from the Investment Manager regarding the Fund and the Advisory Agreement, and discussed these materials with representatives of the Investment Manager at Committee meetings held on March 5, 2013, April 24, 2013 and June 13, 2013, and at the Board meeting held on June 14, 2013. In addition, the Board considers matters bearing on the Advisory Agreement at most of its other meetings throughout the year and meets regularly with senior management of the Funds and the Investment Manager. Through the Board's Investment Oversight Committees, Trustees also meet with selected Fund portfolio managers and other investment personnel at various times throughout the year. The Committee and the Board also consulted with Fund counsel and with the Independent Trustees' independent legal counsel, who advised on various matters with respect to the Committee's and the Board's considerations and otherwise assisted the Committee and the Board in their deliberations. On June 13, 2013, the Committee recommended that the Board approve the continuation of the Advisory Agreement. On June 14, 2013, the Board, including the Independent Trustees, voting separately, unanimously approved the continuation of the Advisory Agreement for the Fund.
The Committee and the Board considered all information that they, their legal counsel, or the Investment Manager believed reasonably necessary to evaluate and to determine whether to approve the continuation of the Advisory Agreement. The information and factors considered by the Committee and the Board in recommending for approval or approving the continuation of the Advisory Agreement for the Fund included the following:
• Information on the investment performance of the Fund relative to the performance of a group of mutual funds determined to be comparable to the Fund by an independent third-party data provider, as well as performance relative to benchmarks;
• Information on the Fund's advisory fees and total expenses, including information comparing the Fund's expenses to those of a group of comparable mutual funds, as determined by the independent third-party data provider;
• The Investment Manager's agreement to contractually limit or cap total operating expenses for the Fund so that total operating expenses (excluding certain fees and expenses, such as transaction costs and certain other investment related expenses, interest, taxes, acquired fund fees and expenses, and extraordinary expenses) would not exceed the median expenses of a group of comparable funds (as determined from time to time, generally annually, by the independent third-party data provider);
• The terms and conditions of the Advisory Agreement;
• The terms and conditions of other agreements and arrangements with affiliates of the Investment Manager relating to the operations of the Fund, including the Administrative Services Agreement, the Distribution Agreement and the Transfer and Dividend Disbursing Agent Agreement;
• Descriptions of various functions performed by the Investment Manager under the Advisory Agreement, including portfolio management and portfolio trading practices;
• Information regarding the management fees and investment performance of comparable portfolios of other clients of the Investment Manager, including institutional separate accounts;
• Information regarding the reputation, regulatory history and resources of the Investment Manager, including information regarding senior management, portfolio managers and other personnel;
• Information regarding the capabilities of the Investment Manager with respect to compliance monitoring services, including an assessment of the Investment Manager's compliance system by the Fund's Chief Compliance Officer; and
• The profitability to the Investment Manager and its affiliates from their relationships with the Fund.
Annual Report 2013
43
Columbia Global Energy and Natural Resources Fund
Board Consideration and Approval of Advisory Agreement (continued)
Nature, Extent and Quality of Services Provided under the Advisory Agreement
The Committee and the Board considered the nature, extent and quality of services provided to the Fund by the Investment Manager and its affiliates under the Advisory Agreement and under separate agreements for the provision of transfer agency and administrative services, and the resources dedicated to the Fund and the other Columbia Funds by the Investment Manager and its affiliates. The Committee and the Board considered, among other things, the Investment Manager's ability to attract, motivate and retain highly qualified research, advisory and supervisory investment professionals (including personnel and other resources, compensation programs for personnel involved in fund management, reputation and other attributes), the portfolio management services provided by those investment professionals, and the quality of the Investment Manager's investment research capabilities and trade execution services. The Committee and the Board also considered the potential benefits to shareholders of investing in a mutual fund that is part of a fund complex offering exposure to a variety of asset classes and investment disciplines and providing a variety of fund and shareholder services.
The Committee and the Board also considered the professional experience and qualifications of the senior personnel of the Investment Manager, which included consideration of the Investment Manager's experience with similarly-structured funds. The Committee and the Board noted the compliance programs of and the compliance-related resources provided to the Fund by the Investment Manager and its affiliates, and considered the Investment Manager's ability to provide administrative services to the Fund pursuant to a separate Administrative Services Agreement, including the Investment Manager's ability to coordinate the activities of the Fund's other service providers. After reviewing these and related factors, the Committee and the Board concluded, within the context of their overall conclusions, that the nature, extent and quality of the services provided to the Fund under the Advisory Agreement supported the continuation of the Advisory Agreement.
Investment Performance
The Committee and the Board reviewed information about the performance of the Fund over various time periods, including performance information relative to benchmarks and information based on reports of the independent third-party data provider that compared the performance of the Fund to the performance of a group of comparable mutual funds. The Committee and the Board also reviewed a description of the third party's methodology for identifying the Fund's peer groups for purposes of performance and expense comparisons. Although the Fund's performance lagged that of a relevant peer group for certain (although not necessarily all) periods, the Committee and the Board concluded that other factors relevant to performance were sufficient, in light of other considerations, to warrant continuation of the Fund's Advisory Agreement. Those factors included one or more of the following: (i) that the Fund's performance, although lagging in certain recent periods, was stronger over the longer term; (ii) that the underperformance was attributable, to a significant extent, to investment decisions that were reasonable and consistent with the Fund's investment strategy and policies and that the Fund was performing within a reasonable range of expectations, given those investment decisions, market conditions and the Fund's investment strategy; (iii) that the Fund's performance was competitive when compared to other relevant performance benchmarks or peer groups; and (iv) that the Investment Manager had taken or was taking steps designed to help improve the Fund's investment performance, including, but not limited to, replacing portfolio managers, enhancing the resources supporting the portfolio managers, or modifying investment strategies.
The Committee and the Board noted that, through December 31, 2012, the Fund's performance was in the 56th, 88th and 44th percentile (where the best performance would be in the first percentile) of its category selected by the independent third-party data provider for the purposes of performance comparisons for the one-, three- and five- year periods, respectively.
The Committee and the Board also considered the Investment Manager's performance and reputation generally, the Investment Manager's historical responsiveness to Board concerns about performance, and the Investment Manager's willingness to take steps intended to improve performance. After reviewing these and related factors, the Committee and the Board concluded, within the context of their overall conclusions, that the performance of the Fund and the Investment Manager was sufficient, in light of other considerations, to warrant the continuation of the Advisory Agreement.
Investment Advisory Fee Rates and Other Expenses
The Committee and the Board considered the advisory fees charged to the Fund under the Advisory Agreement as well as the total expenses incurred by the Fund. In assessing the reasonableness of the fees under the Advisory Agreement, the
Annual Report 2013
44
Columbia Global Energy and Natural Resources Fund
Board Consideration and Approval of Advisory Agreement (continued)
Committee and the Board considered, among other information, the Fund's advisory fee and its total expense ratio as a percentage of average daily net assets. The Committee and the Board noted that the Fund's actual management fee and net expense ratio are ranked in the 3rd and 1st quintiles, respectively, (where the lowest fees and expenses would be in the first quintile) against the Fund's expense universe as determined by the independent third-party data provider for purposes of expense comparison. The Committee and the Board also took into account the fee waiver and expense limitation arrangements agreed to by the Investment Manager, as noted above.
The Committee and the Board also received and considered information about the advisory fees charged by the Investment Manager to institutional separate accounts. In considering the fees charged to those accounts, the Committee and the Board took into account, among other things, the Investment Manager's representations about the differences between managing mutual funds as compared to other types of accounts, including differences in the services provided, differences in the risk profile of such business for the Investment Manager and the additional resources required to manage mutual funds effectively. In evaluating the Fund's advisory fees, the Committee and the Board also took into account the demands, complexity and quality of the investment management of the Fund.
After reviewing these and related factors, the Committee and the Board concluded, within the context of their overall conclusions, that the advisory fee rates and expenses of the Fund supported the continuation of the Advisory Agreement.
Costs of Services Provided and Profitability
The Committee and the Board also took note of the costs of the services provided (both on an absolute and relative basis) and the profitability to the Investment Manager and its affiliates in connection with their relationships with the Fund. In evaluating these considerations, the Committee and the Board took note of the advisory fees charged by the Investment Manager to other clients, including fees charged by the Investment Manager to institutional separate account clients with similar investment strategies to those of the Fund.
The Committee and the Board also considered the compensation directly or indirectly received by the Investment Manager's affiliates in connection with their relationships with the Fund. The Committee and the Board reviewed information provided by management as to the profitability of the Investment Manager and its affiliates of their relationships with the Fund, information about the allocation of expenses used to calculate profitability, and comparisons of profitability levels realized in 2012 to profitability levels realized in 2011. When reviewing profitability, the Committee and the Board also considered court cases in which adviser profitability was an issue in whole or in part, the performance of the Fund, the expense ratio of the Fund, and the implementation of expense limitations with respect to the Fund. The Committee and the Board also considered information provided by the Investment Manager regarding its financial condition and comparing its profitability to that of other asset management firms that are, or are subsidiaries of, publicly traded companies.
After reviewing these and related factors, the Committee and the Board concluded, within the context of their overall conclusions, that the costs of services provided and the profitability to the Investment Manager and its affiliates from their relationships with the Fund supported the continuation of the Advisory Agreement.
Economies of Scale
The Committee and the Board considered the potential existence of economies of scale in the provision by the Investment Manager of services to the Fund, to groups of related funds, and to the Investment Manager's investment advisory clients as a whole, and whether those economies of scale were shared with the Fund through breakpoints in investment advisory fees or other means, such as expense limitation arrangements and additional investments by the Investment Manager in investment, trading and compliance resources. The Committee and the Board noted that the investment advisory fee schedules for the Fund contained breakpoints that would reduce the fee rate on assets above specified threshold levels.
In considering these matters, the Committee and the Board also considered the costs of the services provided and the profitability to the Investment Manager and its affiliates from their relationships with the Fund, as discussed above. After reviewing these and related factors, the Committee and the Board concluded, within the context of their overall conclusions, that the extent to which any economies of scale were expected to be shared with the Fund supported the continuation of the Advisory Agreement.
Annual Report 2013
45
Columbia Global Energy and Natural Resources Fund
Board Consideration and Approval of Advisory Agreement (continued)
Other Benefits to the Investment Manager
The Committee and the Board received and considered information regarding "fall-out" or ancillary benefits received by the Investment Manager and its affiliates as a result of their relationships with the Fund, such as the engagement of the Investment Manager to provide administrative services to the Fund and the engagement of the Investment Manager's affiliates to provide distribution and transfer agency services to the Fund. The Committee and the Board considered that the Fund's distributor retains a portion of the distribution fees from the Fund. The Committee and the Board also considered the benefits of research made available to the Investment Manager by reason of brokerage commissions generated by the Fund's securities transactions, and reviewed information about the Investment Manager's practices with respect to allocating portfolio transactions for brokerage and research services. The Committee and the Board considered the possible conflicts of interest associated with certain fall-out or other ancillary benefits and the reporting, disclosure and other processes that are in place to address such possible conflicts of interest. The Committee and the Board recognized that the Investment Manager's profitability would be somewhat lower without these benefits.
Conclusion
The Committee and the Board reviewed all of the above considerations in reaching their decisions to recommend or approve the continuation of the Advisory Agreement. In their deliberations, the Trustees did not identify any particular information that was all-important or controlling, and individual Trustees may have attributed different weights to the various factors. Based on their evaluation of all factors that they deemed to be material, including those factors described above, and assisted by the advice of independent legal counsel, the Board, including the Independent Trustees, voting separately, unanimously approved the continuation of the Advisory Agreement.
Annual Report 2013
46
This page intentionally left blank.
Annual Report 2013
47
This page intentionally left blank.
Annual Report 2013
48
Columbia Global Energy and Natural Resources Fund
Important Information About This Report
Each fund mails one shareholder report to each shareholder address. If you would like more than one report, please call shareholder services at 800.345.6611 and additional reports will be sent to you.
The policy of the Board is to vote the proxies of the companies in which each fund holds investments consistent with the procedures as stated in the Statement of Additional Information (SAI). You may obtain a copy of the SAI without charge by calling 800.345.6611; contacting your financial intermediary; visiting columbiamanagement.com; or searching the website of the Securities and Exchange Commission (SEC) at sec.gov. Information regarding how each fund voted proxies relating to portfolio securities is filed with the SEC by August 31 for the most recent 12-month period ending June 30 of that year, and is available without charge by visiting columbiamanagement.com; or searching the website of the SEC at sec.gov.
Each fund files a complete schedule of portfolio holdings with the SEC for the first and third quarters of each fiscal year on Form N-Q. Each fund's Form N-Q is available on the SEC's website at sec.gov and may be reviewed and copied at the SEC's Public Reference Room in Washington, D.C. Information on the operation of the Public Reference Room may be obtained by calling 800.SEC.0330. Each fund's complete schedule of portfolio holdings, as filed on Form N-Q, can also be obtained without charge, upon request, by calling 800.345.6611.
Annual Report 2013
49

Columbia Global Energy and Natural Resources Fund
P.O. Box 8081
Boston, MA 02266-8081
columbiamanagement.com
This information is for use with concurrent or prior delivery of a fund prospectus. Please read and consider the investment objectives, risks, charges and expenses for any fund carefully before investing. For a prospectus which contains this and other important information about the Fund go to columbiamanagement.com. The Fund is distributed by Columbia Management Investment Distributors, Inc., member FINRA, and managed by Columbia Management Investment Advisers, LLC.
© 2013 Columbia Management Investment Advisers, LLC. All rights reserved.
ANN144_08_C01_(10/13)
Annual Report
August 31, 2013

Columbia Contrarian Core Fund
Not FDIC insured • No bank guarantee • May lose value
 Dear Shareholders,
A return to volatility
Volatility returned to the financial markets in the second quarter of 2013, as uncertainty about the global economy, monetary policy and the impact of the sequester's spending cuts weighed on investors. Households advanced their spending but also allocated less to savings. Labor markets continued to crank out jobs at a steady pace, slowly reducing unemployment. Housing activity remained strong and retail sales were higher despite no real increase in income. The single weak spot was in the manufacturing sector, where activity slowed. While the consumer has weathered the domestic drag well, business has been closer to the global slowdown and effects of sequestration. Businesses remain very cautious, keeping inventories and staffs lean, and are planning for but not yet confident enough to make capital expenditures.
Against this backdrop, equities outperformed fixed income during the second quarter of 2013. Small-cap stocks outperformed large- and mid-cap stocks, and growth outperformed value except for in the large-cap sector. Outside the United States, foreign stock markets generally lost ground, with the most significant losses sustained by emerging markets.
Columbia Management to begin delivering summary prospectuses
Each Columbia fund is required to update its prospectus on an annual basis. Beginning with June 2013 prospectus updates, shareholders of Columbia retail mutual funds will start to receive a summary prospectus, rather than the full length (statutory) mutual fund prospectus they have received in the past.
Each fund's summary prospectus will include the following key information:
> Investment objective
> Fee and expense table
> Portfolio turnover rate information
> Principal investment strategies, principal risks and performance information
> Management information
> Purchase and sale information
> Tax information
> Financial intermediary compensation information
Each fund's statutory prospectus will contain additional information about the fund and its risks. Both the statutory and summary prospectus will be updated each year, and will be available at columbiamanagement.com. Shareholders may request a printed version of a statutory prospectus at no cost by calling 800.345.6611 or sending an email to serviceinquiries@columbiamanagement.com.
Stay on track with Columbia Management
Backed by more than 100 years of experience, Columbia Management is one of the nation's largest asset managers. At the heart of our success — and, most importantly, that of our investors — are highly talented industry professionals, brought together by a unique way of working. We are dedicated to helping you take advantage of today's opportunities and anticipate tomorrow's. We stay abreast of the latest investment trends and ideas, using our collective insight to evaluate events and transform them into solutions you can use.
Visit columbiamanagement.com for:
> The Columbia Management Perspectives blog, featuring timely posts by our investment teams
> Detailed up-to-date fund performance and portfolio information
> Economic analysis and market commentary
> Quarterly fund commentaries
> Columbia Management Investor, our award-winning quarterly newsletter for shareholders
Thank you for your continued support of the Columbia Funds. We look forward to serving your investment needs for many years to come.
Best Regards,

J. Kevin Connaughton
President, Columbia Funds
Investors should consider the investment objectives, risks, charges and expenses of a mutual fund carefully before investing. For a free prospectus, which contains this and other important information about a fund, visit columbiamanagement.com. The prospectus should be read carefully before investing.
Columbia Funds are distributed by Columbia Management Investment Distributors, Inc., member FINRA, and managed by Columbia Management Investment Advisers, LLC.
© 2013 Columbia Management Investment Advisers, LLC. All rights reserved.
Columbia Contrarian Core Fund
Performance Overview | | | 2 | | |
Manager Discussion of Fund Performance | | | 4 | | |
Understanding Your Fund's Expenses | | | 6 | | |
Portfolio of Investments | | | 7 | | |
Statement of Assets and Liabilities | | | 12 | | |
Statement of Operations | | | 15 | | |
Statement of Changes in Net Assets | | | 16 | | |
Financial Highlights | | | 19 | | |
Notes to Financial Statements | | | 31 | | |
Report of Independent Registered
Public Accounting Firm | | | 39 | | |
Federal Income Tax Information | | | 40 | | |
Trustees and Officers | | | 41 | | |
Board Consideration and Approval of Advisory Agreement | | | 44 | | |
Important Information About This Report | | | 49 | | |
Fund Investment Manager
Columbia Management Investment
Advisers, LLC
225 Franklin Street
Boston, MA 02110
Fund Distributor
Columbia Management Investment
Distributors, Inc.
225 Franklin Street
Boston, MA 02110
Fund Transfer Agent
Columbia Management Investment
Services Corp.
P.O. Box 8081
Boston, MA 02266-8081
For more information about any of the funds, please visit columbiamanagement.com or call 800.345.6611. Customer Service Representatives are available to answer your questions Monday through Friday from 8 a.m. to 8 p.m. Eastern time.
The views expressed in this report reflect the current views of the respective parties. These views are not guarantees of future performance and involve certain risks, uncertainties and assumptions that are difficult to predict, so actual outcomes and results may differ significantly from the views expressed. These views are subject to change at any time based upon economic, market or other conditions and the respective parties disclaim any responsibility to update such views. These views may not be relied on as investment advice and, because investment decisions for a Columbia Fund are based on numerous factors, may not be relied on as an indication of trading intent on behalf of any particular Columbia Fund. References to specific securities should not be construed as a recommendation or investment advice.
Columbia Contrarian Core Fund
Performance Summary
> Columbia Contrarian Core Fund (the Fund) Class A shares returned 23.23% excluding sales charges for the 12-month period that ended August 31, 2013.
> The Fund outperformed its benchmark, the Russell 1000 Index, which returned 19.84% for the same 12-month period.
> Stock selection within the financials sector accounted for most of the Fund's performance advantage during the period.
Average Annual Total Returns (%) (for period ended August 31, 2013)
| | Inception | | 1 Year | | 5 Years | | 10 Years | |
Class A | | 11/01/98 | | | | | | | | | | | | | |
Excluding sales charges | | | | | | | 23.23 | | | | 9.03 | | | | 8.71 | | |
Including sales charges | | | | | | | 16.12 | | | | 7.74 | | | | 8.07 | | |
Class B | | 11/01/98 | | | | | | | | | | | | | |
Excluding sales charges | | | | | | | 22.32 | | | | 8.20 | | | | 7.88 | | |
Including sales charges | | | | | | | 17.32 | | | | 7.91 | | | | 7.88 | | |
Class C | | 12/09/02 | | | | | | | | | | | | | |
Excluding sales charges | | | | | | | 22.36 | | | | 8.22 | | | | 7.90 | | |
Including sales charges | | | | | | | 21.36 | | | | 8.22 | | | | 7.90 | | |
Class I* | | 09/27/10 | | | 23.73 | | | | 9.40 | | | | 9.04 | | |
Class K* (formerly Class R4) | | 03/07/11 | | | 23.40 | | | | 9.15 | | | | 8.84 | | |
Class R* | | 09/27/10 | | | 22.93 | | | | 8.77 | | | | 8.47 | | |
Class R4* | | 11/08/12 | | | 23.59 | | | | 9.31 | | | | 8.99 | | |
Class R5* | | 11/08/12 | | | 23.73 | | | | 9.33 | | | | 9.01 | | |
Class T | | 02/12/93 | | | | | | | | | | | | | |
Excluding sales charges | | | | | | | 23.22 | | | | 8.97 | | | | 8.65 | | |
Including sales charges | | | | | | | 16.13 | | | | 7.69 | | | | 8.00 | | |
Class W* | | 09/27/10 | | | 23.21 | | | | 9.03 | | | | 8.72 | | |
Class Y* | | 11/08/12 | | | 23.76 | | | | 9.34 | | | | 9.01 | | |
Class Z | | 12/14/92 | | | 23.50 | | | | 9.29 | | | | 8.99 | | |
Russell 1000 Index | | | | | | | 19.84 | | | | 7.59 | | | | 7.50 | | |
Returns for Class A and T are shown with and without the maximum initial sales charge of 5.75%. Returns for Class B are shown with and without the applicable contingent deferred sales charge (CDSC) of 5.00% in the first year, declining to 1.00% in the sixth year and eliminated thereafter. Returns for Class C are shown with and without the 1.00% CDSC for the first year only. The Fund's other classes are not subject to sales charges and have limited eligibility. Please see the Fund's prospectus for details. Performance for different share classes will vary based on differences in sales charges and fees associated with each class. All results shown assume reinvestment of distributions during the period. Returns do not reflect the deduction of taxes that a shareholder may pay on Fund distributions or on the redemption of Fund shares. Performance results reflect the effect of any fee waivers or reimbursements of Fund expenses by Columbia Management Investment Advisers, LLC and/or any of its affiliates. Absent these fee waivers or expense reimbursement arrangements, performance results would have been lower.
The performance information shown represents past performance and is not a guarantee of future results. The investment return and principal value of your investment will fluctuate so that your shares, when redeemed, may be worth more or less than their original cost. Current performance may be lower or higher than the performance information shown. You may obtain performance information current to the most recent month-end by contacting your financial intermediary, visiting columbiamanagement.com or calling 800.345.6611.
*The returns shown for periods prior to the share class inception date (including returns for the Life of the Fund, if shown, which are since Fund inception) include the returns of the Fund's oldest share class. These returns are adjusted to reflect any higher class-related operating expenses of the newer share classes, as applicable. Please visit columbiamanagement.com/mutual-funds/appended-performance for more information.
The Russell 1000 Index tracks the performance of 1,000 of the largest U.S. companies, based on market capitalization.
Indices are not available for investment, are not professionally managed and do not reflect sales charges, fees, brokerage commissions, taxes or other expenses of investing. Securities in the Fund may not match those in an index.
Annual Report 2013
2
Columbia Contrarian Core Fund
Performance Overview (continued)
Performance of a Hypothetical $10,000 Investment (September 1, 2003 – August 31, 2013)

The chart above shows the change in value of a hypothetical $10,000 investment in Class A shares of Columbia Contrarian Core Fund during the stated time period, and does not reflect the deduction of taxes that a shareholder may pay on Fund distributions or on the redemption of Fund shares.
Annual Report 2013
3
Columbia Contrarian Core Fund
Manager Discussion of Fund Performance
For the 12-month period that ended August 31, 2013, the Fund's Class A shares returned 23.23% excluding sales charge. The Fund's benchmark, the Russell 1000 Index, returned 19.84% for the same 12-month period. Stock selection among financial stocks — and, to a lesser extent, within the health care and consumer discretionary sectors — were largely responsible for the performance advantage relative to the benchmark.
U.S. Economy Makes Steady Progress
During the 12-month period ended August 31, 2013, investors faced concerns about the impact of tax increases and enforced federal spending cuts, as well as another showdown over the debt ceiling and the possibility of an attack on Syria. However, economic growth was kept afloat by steady job growth and a solid rebound in the housing market. Pent-up demand, low mortgage rates and an improving labor market all contributed to higher home sales. Manufacturing activity picked up late in the period, and business surveys and recent demand measures suggest that business could be ready to pick up the pace of spending later this year. Against this backdrop, investors bid prices higher on stocks and other riskier assets, as central banks continued to pour liquidity into key markets. However, these sectors pulled back in July and August as the civil war in Syria intensified and the Federal Reserve (the Fed) began to talk about removing some of its support.
Financials Sector Aids Results
The Fund outpaced its benchmark within the financials sectors on the strength of its overweights in certain asset managers, including Morgan Stanley, State Street and Black Rock, which benefited from higher asset prices and an upswing in global trading volumes. Even the prospect of higher interest rates, which normally hurts financial stocks, was seen as potentially favorable for asset managers because the prevailing low rates, especially for short-term securities, had squeezed their net interest margins. An overweight in Citigroup also benefited the Fund's results, as investors responded well to the efforts of the company's new management team.
Health care was another profitable area for the Fund. An overweight in Celgene bolstered relative results. The stock nearly doubled during the period, propelled by a new-product pipeline that bolsters its long-term earnings prospects. Leading insurer CIGNA was a plus, as investors became more comfortable with the prospects for health maintenance organizations (HMOs) under the Affordable Care Act and the stock was a strong performer. Elsewhere in the portfolio, significant winners included an out-of-index position in Delphi Automotive, a General Motors spinoff that has enjoyed higher sales volumes as the domestic economy has recovered, and Hewlett-Packard, which was purchased at an advantageous price in 2012 amid the fallout from its ill-fated acquisition of Autonomy. Hewlett-Packard was overweight relative to the benchmark, which further bolstered relative results.
Disappointments among Multinationals
Although the Fund enjoyed positive returns from each of the major sectors in which it invests, it lost a slight amount of ground versus its benchmark in the consumer staples, materials and industrials sectors. In terms of individual stocks, several prominent multinational companies produced disappointing results. An
Portfolio Management
Guy Pope, CFA
Morningstar Style BoxTM
The Morningstar Style BoxTM is based on a fund's portfolio holdings. For equity funds, the vertical axis shows the market capitalization of the stocks owned, and the horizontal axis shows investment style (value, blend, or growth). Information shown is based on the most recent data provided by Morningstar.
©2013 Morningstar, Inc. All rights reserved. The Morningstar information contained herein: (1) is proprietary to Morningstar and/or its content providers; (2) may not be copied or distributed; and (3) is not warranted to be accurate, complete or timely. Neither Morningstar nor its content providers are responsible for any damages or losses arising from any use of this information.
Top Ten Holdings (%)
(at August 31, 2013) | |
Apple, Inc. | | | 3.6 | | |
Philip Morris International, Inc. | | | 3.0 | | |
Google, Inc., Class A | | | 2.7 | | |
Citigroup, Inc. | | | 2.5 | | |
JPMorgan Chase & Co. | | | 2.5 | | |
Johnson & Johnson | | | 2.4 | | |
Berkshire Hathaway, Inc., Class B | | | 2.4 | | |
Bank of America Corp. | | | 2.2 | | |
Chevron Corp. | | | 2.2 | | |
PepsiCo, Inc. | | | 2.1 | | |
Percentages indicated are based upon total investments (excluding Money Market Funds).
For further detail about these holdings, please refer to the section entitled "Portfolio of Investments."
Fund holdings are as of the date given, are subject to change at any time, and are not recommendations to buy or sell any security.
Annual Report 2013
4
Columbia Contrarian Core Fund
Manager Discussion of Fund Performance (continued)
overweight position in Apple, a successful long-term holding for the Fund, was a drag on relative performance as it declined sharply over the past 12 months amid increased competition. An overweight in IBM International also hurt relative results. The stock was down, in response to a slowdown in global IT spending. Finally, the Fund lost ground relative to the benchmark with an overweight in Philip Morris International. Philip Morris not only experienced lower volumes worldwide, but also had to fight the headwind of a stronger U.S. dollar, and its stock posted a slight loss for the period.
Looking Ahead
We are cautiously optimistic about the trajectory of the economy. We are mindful that the Fed has signaled its intention to wind down the zero interest rate policy that has been in place since the financial crisis erupted several years ago. While we have noted in this report that some of the Fund's individual holdings in the financials sector may adapt well to a higher interest rate environment, the broader equity markets have not historically prospered within such a setting. We believe the Fed is well aware of this sensitivity and would likely move in a very deliberate manner.
Portfolio Breakdown (%)
(at August 31, 2013) | |
Common Stocks | | | 96.6 | | |
Consumer Discretionary | | | 13.4 | | |
Consumer Staples | | | 10.5 | | |
Energy | | | 9.6 | | |
Financials | | | 16.7 | | |
Health Care | | | 13.2 | | |
Industrials | | | 9.6 | | |
Information Technology | | | 19.2 | | |
Materials | | | 1.6 | | |
Telecommunication Services | | | 2.8 | | |
Money Market Funds | | | 3.4 | | |
Total | | | 100.0 | | |
Percentages indicated are based upon total investments. The Fund's portfolio composition is subject to change.
Investment Risks
Risks include stock market fluctuations due to business and economic developments, as well as changes in the values of specific fund holdings. See the Fund's prospectus for information on these and other risks.
Annual Report 2013
5
Columbia Contrarian Core Fund
Understanding Your Fund's Expenses
(Unaudited)
As an investor, you incur two types of costs. There are transaction costs, which generally include sales charges on purchases and may include redemption fees. There are also ongoing costs, which generally include management fees, distribution and service (Rule 12b-1) fees, and other fund expenses. The following information is intended to help you understand your ongoing costs (in dollars) of investing in the Fund and to help you compare these costs with the ongoing costs of investing in other mutual funds.
Analyzing Your Fund's Expenses
To illustrate these ongoing costs, we have provided examples and calculated the expenses paid by investors in each share class of the Fund during the period. The actual and hypothetical information in the table is based on an initial investment of $1,000 at the beginning of the period indicated and held for the entire period. Expense information is calculated two ways and each method provides you with different information. The amount listed in the "Actual" column is calculated using the Fund's actual operating expenses and total return for the period. You may use the Actual information, together with the amount invested, to estimate the expenses that you paid over the period. Simply divide your account value by $1,000 (for example, an $8,600 account value divided by $1,000 = 8.6), then multiply the results by the expenses paid during the period under the Actual column. The amount listed in the "Hypothetical" column assumes a 5% annual rate of return before expenses (which is not the Fund's actual return) and then applies the Fund's actual expense ratio for the period to the hypothetical return. You should not use the hypothetical account values and expenses to estimate either your actual account balance at the end of the period or the expenses you paid during the period. See "Compare With Other Funds" below for details on how to use the hypothetical data.
Compare With Other Funds
Since all mutual funds are required to include the same hypothetical calculations about expenses in shareholder reports, you can use this information to compare the ongoing cost of investing in the Fund with other funds. To do so, compare the hypothetical example with the 5% hypothetical examples that appear in the shareholder reports of other funds. As you compare hypothetical examples of other funds, it is important to note that hypothetical examples are meant to highlight the ongoing costs of investing in a fund only and do not reflect any transaction costs, such as sales charges, or redemption or exchange fees. Therefore, the hypothetical calculations are useful in comparing ongoing costs only, and will not help you determine the relative total costs of owning different funds. If transaction costs were included in these calculations, your costs would be higher.
March 1, 2013 — August 31, 2013
| | Account Value at the Beginning
of the Period ($) | | Account Value at the End of the
Period ($) | | Expenses Paid During the
Period ($) | | Fund's Annualized
Expense Ratio (%) | |
| | Actual | | Hypothetical | | Actual | | Hypothetical | | Actual | | Hypothetical | | Actual | |
Class A | | | 1,000.00 | | | | 1,000.00 | | | | 1,106.30 | | | | 1,019.40 | | | | 5.97 | | | | 5.72 | | | | 1.13 | | |
Class B | | | 1,000.00 | | | | 1,000.00 | | | | 1,102.50 | | | | 1,015.64 | | | | 9.91 | | | | 9.50 | | | | 1.88 | | |
Class C | | | 1,000.00 | | | | 1,000.00 | | | | 1,102.40 | | | | 1,015.64 | | | | 9.91 | | | | 9.50 | | | | 1.88 | | |
Class I | | | 1,000.00 | | | | 1,000.00 | | | | 1,108.70 | | | | 1,021.61 | | | | 3.65 | | | | 3.50 | | | | 0.69 | | |
Class K | | | 1,000.00 | | | | 1,000.00 | | | | 1,107.50 | | | | 1,020.10 | | | | 5.23 | | | | 5.01 | | | | 0.99 | | |
Class R | | | 1,000.00 | | | | 1,000.00 | | | | 1,105.00 | | | | 1,018.15 | | | | 7.28 | | | | 6.98 | | | | 1.38 | | |
Class R4 | | | 1,000.00 | | | | 1,000.00 | | | | 1,107.80 | | | | 1,020.61 | | | | 4.70 | | | | 4.51 | | | | 0.89 | | |
Class R5 | | | 1,000.00 | | | | 1,000.00 | | | | 1,109.10 | | | | 1,021.31 | | | | 3.97 | | | | 3.80 | | | | 0.75 | | |
Class T | | | 1,000.00 | | | | 1,000.00 | | | | 1,106.50 | | | | 1,019.15 | | | | 6.23 | | | | 5.97 | | | | 1.18 | | |
Class W | | | 1,000.00 | | | | 1,000.00 | | | | 1,106.20 | | | | 1,019.40 | | | | 5.97 | | | | 5.72 | | | | 1.13 | | |
Class Y | | | 1,000.00 | | | | 1,000.00 | | | | 1,109.10 | | | | 1,021.46 | | | | 3.81 | | | | 3.65 | | | | 0.72 | | |
Class Z | | | 1,000.00 | | | | 1,000.00 | | | | 1,107.50 | | | | 1,020.66 | | | | 4.65 | | | | 4.46 | | | | 0.88 | | |
Expenses paid during the period are equal to the annualized expense ratio for each class as indicated above, multiplied by the average account value over the period and then multiplied by the number of days in the Fund's most recent fiscal half year and divided by 365.
Expenses do not include fees and expenses incurred indirectly by the Fund from the underlying funds in which the Fund may invest (also referred to as "acquired funds"), including affiliated and non-affiliated pooled investment vehicles (including mutual funds and exchange-traded funds).
Had Columbia Management Investment Advisers, LLC and/or certain of its affiliates not waived/reimbursed certain fees and expenses, account value at the end of the period would have been reduced.
Annual Report 2013
6
Columbia Contrarian Core Fund
Portfolio of Investments
August 31, 2013
(Percentages represent value of investments compared to net assets)
Common Stocks 96.8%
Issuer | | Shares | | Value ($) | |
Consumer Discretionary 13.4% | |
Auto Components 0.6% | |
Delphi Automotive PLC | | | 369,371 | | | | 20,322,793 | | |
Automobiles 1.5% | |
General Motors Co.(a) | | | 1,465,953 | | | | 49,959,678 | | |
Hotels, Restaurants & Leisure 0.8% | |
Wynn Resorts Ltd. | | | 177,925 | | | | 25,094,542 | | |
Household Durables 0.6% | |
Lennar Corp., Class A | | | 587,720 | | | | 18,695,373 | | |
Media 5.7% | |
Comcast Corp., Class A | | | 1,381,858 | | | | 58,162,403 | | |
DIRECTV(a) | | | 613,476 | | | | 35,692,034 | | |
Discovery Communications, Inc.,
Class A(a) | | | 397,202 | | | | 30,787,127 | | |
Viacom, Inc., Class B | | | 802,786 | | | | 63,869,654 | | |
Total | | | | | 188,511,218 | | |
Specialty Retail 3.7% | |
Dick's Sporting Goods, Inc. | | | 473,600 | | | | 21,979,776 | | |
Lowe's Companies, Inc. | | | 1,183,276 | | | | 54,217,706 | | |
Tiffany & Co. | | | 307,591 | | | | 23,718,342 | | |
Ulta Salon Cosmetics &
Fragrance, Inc.(a) | | | 225,970 | | | | 22,425,263 | | |
Total | | | | | 122,341,087 | | |
Textiles, Apparel & Luxury Goods 0.5% | |
Nike, Inc., Class B | | | 287,145 | | | | 18,038,449 | | |
Total Consumer Discretionary | | | | | 442,963,140 | | |
Consumer Staples 10.5% | |
Beverages 3.3% | |
Diageo PLC, ADR | | | 356,478 | | | | 43,732,721 | | |
PepsiCo, Inc. | | | 833,044 | | | | 66,418,598 | | |
Total | | | | | 110,151,319 | | |
Food & Staples Retailing 2.4% | |
CVS Caremark Corp. | | | 913,186 | | | | 53,010,447 | | |
Walgreen Co. | | | 552,538 | | | | 26,560,502 | | |
Total | | | | | 79,570,949 | | |
Household Products 1.9% | |
Procter & Gamble Co. (The) | | | 794,438 | | | | 61,878,776 | | |
Common Stocks (continued)
Issuer | | Shares | | Value ($) | |
Tobacco 2.9% | |
Philip Morris International, Inc. | | | 1,146,043 | | | | 95,625,828 | | |
Total Consumer Staples | | | | | 347,226,872 | | |
Energy 9.6% | |
Energy Equipment & Services 2.1% | |
Halliburton Co. | | | 1,215,533 | | | | 58,345,584 | | |
Tidewater, Inc. | | | 239,300 | | | | 12,912,628 | | |
Total | | | | | 71,258,212 | | |
Oil, Gas & Consumable Fuels 7.5% | |
Anadarko Petroleum Corp. | | | 371,618 | | | | 33,973,318 | | |
Canadian Natural Resources Ltd. | | | 977,690 | | | | 29,936,868 | | |
Chevron Corp. | | | 571,050 | | | | 68,771,551 | | |
ConocoPhillips | | | 488,731 | | | | 32,402,865 | | |
Exxon Mobil Corp. | | | 515,202 | | | | 44,905,006 | | |
Newfield Exploration Co.(a) | | | 425,010 | | | | 10,123,738 | | |
Noble Energy, Inc. | | | 434,444 | | | | 26,687,895 | | |
Total | | | | | 246,801,241 | | |
Total Energy | | | | | 318,059,453 | | |
Financials 16.8% | |
Capital Markets 4.3% | |
BlackRock, Inc. | | | 184,543 | | | | 48,040,234 | | |
Invesco Ltd. | | | 1,052,224 | | | | 31,945,520 | | |
Morgan Stanley | | | 994,984 | | | | 25,630,788 | | |
State Street Corp. | | | 558,457 | | | | 37,260,251 | | |
Total | | | | | 142,876,793 | | |
Commercial Banks 1.5% | |
Wells Fargo & Co. | | | 1,215,153 | | | | 49,918,485 | | |
Diversified Financial Services 7.0% | |
Bank of America Corp. | | | 4,906,153 | | | | 69,274,880 | | |
Citigroup, Inc. | | | 1,674,436 | | | | 80,925,492 | | |
JPMorgan Chase & Co. | | | 1,583,218 | | | | 80,000,006 | | |
Total | | | | | 230,200,378 | | |
Insurance 4.0% | |
Aon PLC | | | 830,655 | | | | 55,138,879 | | |
Berkshire Hathaway, Inc., Class B(a) | | | 679,084 | | | | 75,527,723 | | |
Total | | | | | 130,666,602 | | |
Total Financials | | | | | 553,662,258 | | |
The accompanying Notes to Financial Statements are an integral part of this statement.
Annual Report 2013
7
Columbia Contrarian Core Fund
Portfolio of Investments (continued)
August 31, 2013
Common Stocks (continued)
Issuer | | Shares | | Value ($) | |
Health Care 13.2% | |
Biotechnology 1.1% | |
Ariad Pharmaceuticals, Inc.(a) | | | 721,560 | | | | 13,421,016 | | |
Celgene Corp.(a) | | | 174,311 | | | | 24,400,054 | | |
Total | | | | | 37,821,070 | | |
Health Care Equipment & Supplies 4.0% | |
Abbott Laboratories | | | 1,022,199 | | | | 34,069,893 | | |
Baxter International, Inc. | | | 736,800 | | | | 51,251,808 | | |
Covidien PLC | | | 787,421 | | | | 46,772,807 | | |
Total | | | | | 132,094,508 | | |
Health Care Providers & Services 4.3% | |
Cardinal Health, Inc. | | | 1,196,782 | | | | 60,174,199 | | |
CIGNA Corp. | | | 534,017 | | | | 42,021,798 | | |
Express Scripts Holding Co.(a) | | | 632,069 | | | | 40,376,568 | | |
Total | | | | | 142,572,565 | | |
Pharmaceuticals 3.8% | |
Johnson & Johnson | | | 877,609 | | | | 75,834,194 | | |
Pfizer, Inc. | | | 916,582 | | | | 25,856,778 | | |
Salix Pharmaceuticals Ltd.(a) | | | 340,175 | | | | 22,771,314 | | |
Total | | | | | 124,462,286 | | |
Total Health Care | | | | | 436,950,429 | | |
Industrials 9.6% | |
Aerospace & Defense 3.0% | |
Honeywell International, Inc. | | | 584,336 | | | | 46,495,615 | | |
United Technologies Corp. | | | 516,970 | | | | 51,748,697 | | |
Total | | | | | 98,244,312 | | |
Air Freight & Logistics 1.2% | |
FedEx Corp. | | | 356,694 | | | | 38,294,668 | | |
Commercial Services & Supplies 1.0% | |
Tyco International Ltd. | | | 1,036,188 | | | | 34,235,652 | | |
Electrical Equipment 1.4% | |
Eaton Corp. PLC | | | 717,322 | | | | 45,420,829 | | |
Industrial Conglomerates 1.1% | |
General Electric Co. | | | 1,598,336 | | | | 36,985,495 | | |
Professional Services 1.2% | |
Nielsen Holdings NV | | | 1,118,752 | | | | 38,596,944 | | |
Road & Rail 0.7% | |
Union Pacific Corp. | | | 162,166 | | | | 24,898,968 | | |
Total Industrials | | | | | 316,676,868 | | |
Common Stocks (continued)
Issuer | | Shares | | Value ($) | |
Information Technology 19.3% | |
Communications Equipment 1.6% | |
QUALCOMM, Inc. | | | 816,467 | | | | 54,115,433 | | |
Computers & Peripherals 5.3% | |
Apple, Inc. | | | 237,984 | | | | 115,910,107 | | |
EMC Corp. | | | 1,604,633 | | | | 41,367,439 | | |
Hewlett-Packard Co. | | | 710,672 | | | | 15,876,412 | | |
Total | | | | | 173,153,958 | | |
Internet Software & Services 5.1% | |
Baidu, Inc., ADR(a) | | | 108,830 | | | | 14,749,730 | | |
eBay, Inc.(a) | | | 907,765 | | | | 45,379,172 | | |
Facebook, Inc., Class A(a) | | | 552,352 | | | | 22,801,091 | | |
Google, Inc., Class A(a) | | | 100,249 | | | | 84,900,878 | | |
Total | | | | | 167,830,871 | | |
IT Services 1.8% | |
International Business Machines Corp. | | | 53,416 | | | | 9,736,134 | | |
Mastercard, Inc., Class A | | | 80,075 | | | | 48,531,856 | | |
Total | | | | | 58,267,990 | | |
Semiconductors & Semiconductor Equipment 0.6% | |
Skyworks Solutions, Inc.(a) | | | 733,120 | | | | 18,591,923 | | |
Software 4.9% | |
Activision Blizzard, Inc. | | | 1,607,738 | | | | 26,238,284 | | |
Citrix Systems, Inc.(a) | | | 279,334 | | | | 19,768,467 | | |
Electronic Arts, Inc.(a) | | | 1,946,565 | | | | 51,856,492 | | |
Intuit, Inc. | | | 755,780 | | | | 48,014,703 | | |
Microsoft Corp. | | | 519,434 | | | | 17,349,096 | | |
Total | | | | | 163,227,042 | | |
Total Information Technology | | | | | 635,187,217 | | |
Materials 1.6% | |
Chemicals 1.6% | |
Celanese Corp., Class A | | | 171,779 | | | | 8,458,398 | | |
Dow Chemical Co. (The) | | | 1,186,142 | | | | 44,361,711 | | |
Total | | | | | 52,820,109 | | |
Total Materials | | | | | 52,820,109 | | |
Telecommunication Services 2.8% | |
Diversified Telecommunication Services 1.9% | |
AT&T, Inc. | | | 1,836,440 | | | | 62,126,765 | | |
The accompanying Notes to Financial Statements are an integral part of this statement.
Annual Report 2013
8
Columbia Contrarian Core Fund
Portfolio of Investments (continued)
August 31, 2013
Common Stocks (continued)
Issuer | | Shares | | Value ($) | |
Wireless Telecommunication Services 0.9% | |
Vodafone Group PLC, ADR | | | 900,490 | | | | 29,130,852 | | |
Total Telecommunication Services | | | | | 91,257,617 | | |
Total Common Stocks
(Cost: $2,463,206,087) | | | | | 3,194,803,963 | | |
Money Market Funds 3.4% | |
| | | Shares | | Value ($) | |
Columbia Short-Term Cash Fund,
0.097%(b)(c) | | | 112,456,359 | | | | 112,456,359 | | |
Total Money Market Funds
(Cost: $112,456,359) | | | | | 112,456,359 | | |
Total Investments
(Cost: $2,575,662,446) | | | | | 3,307,260,322 | | |
Other Assets & Liabilities, Net | | | | | (7,108,172 | ) | |
Net Assets | | | | | 3,300,152,150 | | |
Notes to Portfolio of Investments
(a) Non-income producing.
(b) The rate shown is the seven-day current annualized yield at August 31, 2013.
(c) As defined in the Investment Company Act of 1940, an affiliated company is one in which the Fund owns 5% or more of its outstanding voting securities, or a company which is under common ownership or control with the Fund. Holdings and transactions in these affiliated companies during the year ended August 31, 2013, are as follows:
Issuer | | Beginning
Cost ($) | | Purchase
Cost ($) | | Proceeds
From Sales ($) | | Ending
Cost ($) | | Dividends —
Affiliated
Issuers ($) | | Value ($) | |
Columbia Short-Term Cash Fund | | | 12,403,481 | | | | 854,320,513 | | | | (754,267,635 | ) | | | 112,456,359 | | | | 58,323 | | | | 112,456,359 | | |
Abbreviation Legend
ADR American Depositary Receipt
Fair Value Measurements
Generally accepted accounting principles (GAAP) require disclosure regarding the inputs and valuation techniques used to measure fair value and any changes in valuation inputs or techniques. In addition, investments shall be disclosed by major category.
The Fund categorizes its fair value measurements according to a three-level hierarchy that maximizes the use of observable inputs and minimizes the use of unobservable inputs by prioritizing that the most observable input be used when available. Observable inputs are those that market participants would use in pricing an investment based on market data obtained from sources independent of the reporting entity. Unobservable inputs are those that reflect the Fund's assumptions about the information market participants would use in pricing an investment. An investment's level within the fair value hierarchy is based on the lowest level of any input that is deemed significant to the asset or liability's fair value measurement. The input levels are not necessarily an indication of the risk or liquidity associated with investments at that level. For example, certain U.S. government securities are generally high quality and liquid, however, they are reflected as Level 2 because the inputs used to determine fair value may not always be quoted prices in an active market.
Fair value inputs are summarized in the three broad levels listed below:
> Level 1 — Valuations based on quoted prices for investments in active markets that the Fund has the ability to access at the measurement date (including NAV for open-end mutual funds). Valuation adjustments are not applied to Level 1 investments.
> Level 2 — Valuations based on other significant observable inputs (including quoted prices for similar securities, interest rates, prepayment speeds, credit risks, etc.).
> Level 3 — Valuations based on significant unobservable inputs (including the Fund's own assumptions and judgment in determining the fair value of investments).
The accompanying Notes to Financial Statements are an integral part of this statement.
Annual Report 2013
9
Columbia Contrarian Core Fund
Portfolio of Investments (continued)
August 31, 2013
Fair Value Measurements (continued)
Inputs that are used in determining fair value of an investment may include price information, credit data, volatility statistics, and other factors. These inputs can be either observable or unobservable. The availability of observable inputs can vary between investments, and is affected by various factors such as the type of investment, and the volume and level of activity for that investment or similar investments in the marketplace. The inputs will be considered by the Investment Manager, along with any other relevant factors in the calculation of an investment's fair value. The Fund uses prices and inputs that are current as of the measurement date, which may include periods of market dislocations. During these periods, the availability of prices and inputs may be reduced for many investments. This condition could cause an investment to be reclassified between the various levels within the hierarchy.
Investments falling into the Level 3 category are primarily supported by quoted prices from brokers and dealers participating in the market for those investments. However, these may be classified as Level 3 investments due to lack of market transparency and corroboration to support these quoted prices. Additionally, valuation models may be used as the pricing source for any remaining investments classified as Level 3. These models may rely on one or more significant unobservable inputs and/or significant assumptions by the Investment Manager. Inputs used in valuations may include, but are not limited to, financial statement analysis, capital account balances, discount rates and estimated cash flows, and comparable company data.
Under the direction of the Fund's Board of Trustees (the Board), the Investment Manager's Valuation Committee (the Committee) is responsible for carrying out the valuation procedures approved by the Board. The Committee consists of voting and non-voting members from various groups within the Investment Manager's organization, including operations and accounting, trading and investments, compliance, risk management and legal.
The Committee meets at least monthly to review and approve valuation matters, which may include a description of specific valuation determinations, data regarding pricing information received from approved pricing vendors and brokers and the results of Board-approved valuation control policies and procedures (the Policies). The Policies address, among other things, instances when market quotations are or are not readily available, including recommendations of third party pricing vendors and a determination of appropriate pricing methodologies; events that require specific valuation determinations and assessment of fair value techniques; securities with a potential for stale pricing, including those that are illiquid, restricted, or in default; and the effectiveness of third-party pricing vendors, including periodic reviews of vendors. The Committee meets more frequently, as needed, to discuss additional valuation matters, which may include the need to review back-testing results, review time-sensitive information or approve related valuation actions. The Committee reports to the Board, with members of the Committee meeting with the Board at each of its regularly scheduled meetings to discuss valuation matters and actions during the period, similar to those described earlier.
For investments categorized as Level 3, the Committee monitors information similar to that described above, which may include: (i) data specific to the issuer or comparable issuers, (ii) general market or specific sector news and (iii) quoted prices and specific or similar security transactions. The Committee considers this data and any changes from prior periods in order to assess the reasonableness of observable and unobservable inputs, any assumptions or internal models used to value those securities and changes in fair value. This data is also used to corroborate, when available, information received from approved pricing vendors and brokers. Various factors impact the frequency of monitoring this information (which may occur as often as daily). However, the Committee may determine that changes to inputs, assumptions and models are not required as a result of the monitoring procedures performed.
The accompanying Notes to Financial Statements are an integral part of this statement.
Annual Report 2013
10
Columbia Contrarian Core Fund
Portfolio of Investments (continued)
August 31, 2013
Fair Value Measurements (continued)
The following table is a summary of the inputs used to value the Fund's investments at August 31, 2013:
Description | | Level 1
Quoted Prices in Active
Markets for Identical
Assets ($) | |
Level 2
Other Significant
Observable Inputs ($) | |
Level 3
Significant
Unobservable Inputs ($) | |
Total ($) | |
Equity Securities | |
Common Stocks | |
Consumer Discretionary | | | 442,963,140 | | | | — | | | | — | | | | 442,963,140 | | |
Consumer Staples | | | 347,226,872 | | | | — | | | | — | | | | 347,226,872 | | |
Energy | | | 318,059,453 | | | | — | | | | — | | | | 318,059,453 | | |
Financials | | | 553,662,258 | | | | — | | | | — | | | | 553,662,258 | | |
Health Care | | | 436,950,429 | | | | — | | | | — | | | | 436,950,429 | | |
Industrials | | | 316,676,868 | | | | — | | | | — | | | | 316,676,868 | | |
Information Technology | | | 635,187,217 | | | | — | | | | — | | | | 635,187,217 | | |
Materials | | | 52,820,109 | | | | — | | | | — | | | | 52,820,109 | | |
Telecommunication Services | | | 91,257,617 | | | | — | | | | — | | | | 91,257,617 | | |
Total Equity Securities | | | 3,194,803,963 | | | | — | | | | — | | | | 3,194,803,963 | | |
Mutual Funds | |
Money Market Funds | | | 112,456,359 | | | | — | | | | — | | | | 112,456,359 | | |
Total Mutual Funds | | | 112,456,359 | | | | — | | | | — | | | | 112,456,359 | | |
Total | | | 3,307,260,322 | | | | — | | | | — | | | | 3,307,260,322 | | |
See the Portfolio of Investments for all investment classifications not indicated in the table.
There were no transfers of financial assets between Levels 1 and 2 during the period.
The accompanying Notes to Financial Statements are an integral part of this statement.
Annual Report 2013
11
Columbia Contrarian Core Fund
Statement of Assets and Liabilities
August 31, 2013
Assets | |
Investments, at value | |
Unaffiliated issuers (identified cost $2,463,206,087) | | $ | 3,194,803,963 | | |
Affiliated issuers (identified cost $112,456,359) | | | 112,456,359 | | |
Total investments (identified cost $2,575,662,446) | | | 3,307,260,322 | | |
Receivable for: | |
Investments sold | | | 7,847,342 | | |
Capital shares sold | | | 6,012,996 | | |
Dividends | | | 5,444,514 | | |
Reclaims | | | 45,476 | | |
Prepaid expenses | | | 37,354 | | |
Trustees' deferred compensation plan | | | 57,723 | | |
Total assets | | | 3,326,705,727 | | |
Liabilities | |
Payable for: | |
Investments purchased | | | 22,029,995 | | |
Capital shares purchased | | | 3,784,281 | | |
Investment management fees | | | 55,555 | | |
Distribution and/or service fees | | | 12,935 | | |
Transfer agent fees | | | 501,580 | | |
Administration fees | | | 4,658 | | |
Plan administration fees | | | 31 | | |
Compensation of board members | | | 6,053 | | |
Chief compliance officer expenses | | | 389 | | |
Other expenses | | | 100,377 | | |
Trustees' deferred compensation plan | | | 57,723 | | |
Total liabilities | | | 26,553,577 | | |
Net assets applicable to outstanding capital stock | | $ | 3,300,152,150 | | |
Represented by | |
Paid-in capital | | $ | 2,409,258,727 | | |
Undistributed net investment income | | | 14,004,651 | | |
Accumulated net realized gain | | | 145,283,904 | | |
Unrealized appreciation (depreciation) on: | |
Investments | | | 731,597,876 | | |
Foreign currency translations | | | 6,992 | | |
Total — representing net assets applicable to outstanding capital stock | | $ | 3,300,152,150 | | |
The accompanying Notes to Financial Statements are an integral part of this statement.
Annual Report 2013
12
Columbia Contrarian Core Fund
Statement of Assets and Liabilities (continued)
August 31, 2013
Class A | |
Net assets | | $ | 913,211,645 | | |
Shares outstanding | | | 47,677,036 | | |
Net asset value per share | | $ | 19.15 | | |
Maximum offering price per share(a) | | $ | 20.32 | | |
Class B | |
Net assets | | $ | 16,396,443 | | |
Shares outstanding | | | 924,258 | | |
Net asset value per share | | $ | 17.74 | | |
Class C | |
Net assets | | $ | 115,939,710 | | |
Shares outstanding | | | 6,525,129 | | |
Net asset value per share | | $ | 17.77 | | |
Class I | |
Net assets | | $ | 424,375,688 | | |
Shares outstanding | | | 22,019,311 | | |
Net asset value per share | | $ | 19.27 | | |
Class K(b) | |
Net assets | | $ | 144,010 | | |
Shares outstanding | | | 7,478 | | |
Net asset value per share | | $ | 19.26 | | |
Class R | |
Net assets | | $ | 13,102,015 | | |
Shares outstanding | | | 684,028 | | |
Net asset value per share | | $ | 19.15 | | |
Class R4 | |
Net assets | | $ | 46,212,147 | | |
Shares outstanding | | | 2,367,410 | | |
Net asset value per share | | $ | 19.52 | | |
Class R5 | |
Net assets | | $ | 68,708,794 | | |
Shares outstanding | | | 3,520,683 | | |
Net asset value per share | | $ | 19.52 | | |
Class T | |
Net assets | | $ | 131,731,965 | | |
Shares outstanding | | | 6,931,118 | | |
Net asset value per share | | $ | 19.01 | | |
Maximum offering price per share(a) | | $ | 20.17 | | |
Class W | |
Net assets | | $ | 254,377,085 | | |
Shares outstanding | | | 13,275,420 | | |
Net asset value per share | | $ | 19.16 | | |
The accompanying Notes to Financial Statements are an integral part of this statement.
Annual Report 2013
13
Columbia Contrarian Core Fund
Statement of Assets and Liabilities (continued)
August 31, 2013
Class Y | |
Net assets | | $ | 78,773 | | |
Shares outstanding | | | 4,035 | | |
Net asset value per share | | $ | 19.52 | | |
Class Z | |
Net assets | | $ | 1,315,873,875 | | |
Shares outstanding | | | 68,278,092 | | |
Net asset value per share | | $ | 19.27 | | |
(a) The maximum offering price per share is calculated by dividing the net asset value per share by 1.0 minus the maximum sales charge of 5.75%.
(b) Effective October 25, 2012, Class R4 shares were renamed Class K shares.
The accompanying Notes to Financial Statements are an integral part of this statement.
Annual Report 2013
14
Columbia Contrarian Core Fund
Statement of Operations
Year Ended August 31, 2013
Net investment income | |
Income: | |
Dividends — unaffiliated issuers | | $ | 49,447,298 | | |
Dividends — affiliated issuers | | | 58,323 | | |
Interest | | | 148 | | |
Income from securities lending — net | | | 115,720 | | |
Foreign taxes withheld | | | (93,458 | ) | |
Total income | | | 49,528,031 | | |
Expenses: | |
Investment management fees | | | 16,485,570 | | |
Distribution and/or service fees | |
Class A | | | 1,791,352 | | |
Class B | | | 180,025 | | |
Class C | | | 812,946 | | |
Class R | | | 44,098 | | |
Class T | | | 375,898 | | |
Class W | | | 466,164 | | |
Transfer agent fees | |
Class A | | | 1,389,762 | | |
Class B | | | 35,095 | | |
Class C | | | 157,181 | | |
Class K(a) | | | 65 | | |
Class R | | | 16,995 | | |
Class R4(b) | | | 15,831 | | |
Class R5(b) | | | 12,682 | | |
Class T | | | 243,894 | | |
Class W | | | 358,656 | | |
Class Z | | | 2,052,729 | | |
Administration fees | | | 1,391,706 | | |
Plan administration fees | |
Class K(a) | | | 327 | | |
Compensation of board members | | | 72,117 | | |
Custodian fees | | | 23,721 | | |
Printing and postage fees | | | 226,529 | | |
Registration fees | | | 223,549 | | |
Professional fees | | | 90,624 | | |
Chief compliance officer expenses | | | 1,823 | | |
Other | | | 88,458 | | |
Total expenses | | | 26,557,797 | | |
Fees waived or expenses reimbursed by Investment Manager and its affiliates | | | (57,718 | ) | |
Expense reductions | | | (10,417 | ) | |
Total net expenses | | | 26,489,662 | | |
Net investment income | | | 23,038,369 | | |
Realized and unrealized gain (loss) — net | |
Net realized gain (loss) on: | |
Investments | | | 163,695,578 | | |
Foreign currency translations | | | 4,158 | | |
Net realized gain | | | 163,699,736 | | |
Net change in unrealized appreciation (depreciation) on: | |
Investments | | | 360,841,950 | | |
Foreign currency translations | | | (3,468 | ) | |
Net change in unrealized appreciation (depreciation) | | | 360,838,482 | | |
Net realized and unrealized gain | | | 524,538,218 | | |
Net increase in net assets resulting from operations | | $ | 547,576,587 | | |
(a) Effective October 25, 2012, Class R4 shares were renamed Class K shares.
(b) For the period from November 8, 2012 (commencement of operations) to August 31, 2013.
The accompanying Notes to Financial Statements are an integral part of this statement.
Annual Report 2013
15
Columbia Contrarian Core Fund
Statement of Changes in Net Assets
| | | Year Ended
August 31,
2013(a) | | Year Ended
August 31,
2012(b) | | Year Ended
September 30,
2011(c) | |
Operations | |
Net investment income | | $ | 23,038,369 | | | $ | 16,146,219 | | | $ | 7,299,606 | | |
Net realized gain | | | 163,699,736 | | | | 28,611,650 | | | | 84,355,766 | | |
Net change in unrealized appreciation (depreciation) | | | 360,838,482 | | | | 367,240,798 | | | | (227,233,561 | ) | |
Net increase (decrease) in net assets resulting from operations | | | 547,576,587 | | | | 411,998,667 | | | | (135,578,189 | ) | |
Distributions to shareholders | |
Net investment income | |
Class A | | | (4,697,565 | ) | | | (2,560,605 | ) | | | (298,249 | ) | |
Class B | | | (10,684 | ) | | | — | | | | — | | |
Class C | | | (38,746 | ) | | | — | | | | — | | |
Class I | | | (4,850,120 | ) | | | (2,810,753 | ) | | | (147,174 | ) | |
Class K(d) | | | (1,091 | ) | | | (719 | ) | | | — | | |
Class R | | | (32,011 | ) | | | (704 | ) | | | — | | |
Class R4 | | | (26 | ) | | | — | | | | — | | |
Class R5 | | | (29 | ) | | | — | | | | — | | |
Class T | | | (858,582 | ) | | | (537,364 | ) | | | (228,384 | ) | |
Class W | | | (848,002 | ) | | | (470,835 | ) | | | (161,179 | ) | |
Class Y | | | (30 | ) | | | — | | | | — | | |
Class Z | | | (9,108,943 | ) | | | (4,432,162 | ) | | | (1,778,271 | ) | |
Net realized gains | |
Class A | | | (701,559 | ) | | | (10,430,378 | ) | | | — | | |
Class B | | | (21,731 | ) | | | (539,119 | ) | | | — | | |
Class C | | | (78,810 | ) | | | (989,703 | ) | | | — | | |
Class I | | | (469,252 | ) | | | (6,421,134 | ) | | | — | | |
Class K(d) | | | (137 | ) | | | (2,421 | ) | | | — | | |
Class R | | | (6,918 | ) | | | (4,502 | ) | | | — | | |
Class R4 | | | (3 | ) | | | — | | | | — | | |
Class R5 | | | (3 | ) | | | — | | | | — | | |
Class T | | | (136,675 | ) | | | (2,422,017 | ) | | | — | | |
Class W | | | (126,644 | ) | | | (1,918,363 | ) | | | — | | |
Class Y | | | (3 | ) | | | — | | | | — | | |
Class Z | | | (1,039,374 | ) | | | (12,224,234 | ) | | | — | | |
Total distributions to shareholders | | | (23,026,938 | ) | | | (45,765,013 | ) | | | (2,613,257 | ) | |
Increase (decrease) in net assets from capital stock activity | | | 678,302,103 | | | | 296,283,645 | | | | 982,482,973 | | |
Total increase in net assets | | | 1,202,851,752 | | | | 662,517,299 | | | | 844,291,527 | | |
Net assets at beginning of year | | | 2,097,300,398 | | | | 1,434,783,099 | | | | 590,491,572 | | |
Net assets at end of year | | $ | 3,300,152,150 | | | $ | 2,097,300,398 | | | $ | 1,434,783,099 | | |
Undistributed net investment income | | $ | 14,004,651 | | | $ | 11,407,953 | | | $ | 6,072,649 | | |
(a) Class R4, Class R5 and Class Y are for the period from November 8, 2012 (commencement of operations) to August 31, 2013.
(b) For the period from October 1, 2011 to August 31, 2012. During the period, the Fund's fiscal year end was changed from September 30 to August 31.
(c) Class K shares are for the period from March 7, 2011 (commencement of operations) to September 30, 2011.
(d) Effective October 25, 2012, Class R4 shares were renamed Class K shares.
The accompanying Notes to Financial Statements are an integral part of this statement.
Annual Report 2013
16
Columbia Contrarian Core Fund
Statement of Changes in Net Assets (continued)
| | | Year Ended August 31,
2013(a) | | Year Ended August 31,
2012(b) | | Year Ended September 30,
2011(c) | |
| | | Shares | | Dollars ($) | | Shares | | Dollars ($) | | Shares | | Dollars ($) | |
Capital stock activity | |
Class A shares | |
Subscriptions(d) | | | 18,225,919 | | | | 325,959,827 | | | | 9,750,851 | | | | 143,837,218 | | | | 10,020,992 | | | | 144,873,952 | | |
Fund merger | | | — | | | | — | | | | — | | | | — | | | | 20,212,114 | | | | 303,837,273 | | |
Distributions reinvested | | | 324,479 | | | | 5,162,466 | | | | 882,717 | | | | 12,128,536 | | | | 18,354 | | | | 255,641 | | |
Redemptions | | | (8,380,115 | ) | | | (145,663,821 | ) | | | (6,936,222 | ) | | | (101,491,144 | ) | | | (5,258,930 | ) | | | (75,612,603 | ) | |
Net increase | | | 10,170,283 | | | | 185,458,472 | | | | 3,697,346 | | | | 54,474,610 | | | | 24,992,530 | | | | 373,354,263 | | |
Class B shares | |
Subscriptions | | | 145,178 | | | | 2,359,331 | | | | 83,727 | | | | 1,137,696 | | | | 122,651 | | | | 1,620,731 | | |
Fund merger | | | — | | | | — | | | | — | | | | — | | | | 2,516,488 | | | | 35,329,181 | | |
Distributions reinvested | | | 2,140 | | | | 31,718 | | | | 40,648 | | | | 520,704 | | | | — | | | | — | | |
Redemptions(d) | | | (413,094 | ) | | | (6,987,155 | ) | | | (770,519 | ) | | | (10,565,494 | ) | | | (1,141,664 | ) | | | (15,777,916 | ) | |
Net increase (decrease) | | | (265,776 | ) | | | (4,596,106 | ) | | | (646,144 | ) | | | (8,907,094 | ) | | | 1,497,475 | | | | 21,171,996 | | |
Class C shares | |
Subscriptions | | | 3,326,904 | | | | 55,393,030 | | | | 1,449,195 | | | | 19,627,067 | | | | 1,437,827 | | | | 19,390,341 | | |
Fund merger | | | — | | | | — | | | | — | | | | — | | | | 617,699 | | | | 8,678,618 | | |
Distributions reinvested | | | 5,851 | | | | 86,822 | | | | 55,020 | | | | 705,354 | | | | — | | | | — | | |
Redemptions | | | (810,624 | ) | | | (13,256,327 | ) | | | (610,574 | ) | | | (8,319,064 | ) | | | (503,246 | ) | | | (6,666,669 | ) | |
Net increase | | | 2,522,131 | | | | 42,223,525 | | | | 893,641 | | | | 12,013,357 | | | | 1,552,280 | | | | 21,402,290 | | |
Class I shares | |
Subscriptions | | | 5,432,112 | | | | 95,439,363 | | | | 9,275,311 | | | | 137,098,256 | | | | 10,718,323 | | | | 153,579,476 | | |
Fund merger | | | — | | | | — | | | | — | | | | — | | | | 13,605,994 | | | | 205,416,554 | | |
Distributions reinvested | | | 333,287 | | | | 5,319,260 | | | | 669,931 | | | | 9,231,653 | | | | 10,521 | | | | 147,157 | | |
Redemptions | | | (8,200,682 | ) | | | (149,431,991 | ) | | | (7,544,691 | ) | | | (110,727,675 | ) | | | (2,280,992 | ) | | | (32,975,816 | ) | |
Net increase (decrease) | | | (2,435,283 | ) | | | (48,673,368 | ) | | | 2,400,551 | | | | 35,602,234 | | | | 22,053,846 | | | | 326,167,371 | | |
Class K shares(e) | |
Subscriptions | | | — | | | | — | | | | — | | | | — | | | | 167 | | | | 2,583 | | |
Fund merger | | | — | | | | — | | | | — | | | | — | | | | 7,740 | | | | 116,844 | | |
Distributions reinvested | | | 68 | | | | 1,084 | | | | 202 | | | | 2,795 | | | | — | | | | — | | |
Redemptions | | | — | | | | — | | | | (699 | ) | | | (10,529 | ) | | | — | | | | — | | |
Net increase (decrease) | | | 68 | | | | 1,084 | | | | (497 | ) | | | (7,734 | ) | | | 7,907 | | | | 119,427 | | |
Class R shares | |
Subscriptions | | | 592,089 | | | | 10,331,746 | | | | 336,597 | | | | 4,914,156 | | | | 318 | | | | 4,652 | | |
Distributions reinvested | | | 1,626 | | | | 25,917 | | | | 373 | | | | 5,135 | | | | — | | | | — | | |
Redemptions | | | (195,885 | ) | | | (3,446,570 | ) | | | (51,284 | ) | | | (761,250 | ) | | | (4 | ) | | | (61 | ) | |
Net increase | | | 397,830 | | | | 6,911,093 | | | | 285,686 | | | | 4,158,041 | | | | 314 | | | | 4,591 | | |
The accompanying Notes to Financial Statements are an integral part of this statement.
Annual Report 2013
17
Columbia Contrarian Core Fund
Statement of Changes in Net Assets (continued)
| | | Year Ended August 31,
2013(a) | | Year Ended August 31,
2012(b) | | Year Ended September 30,
2011(c) | |
| | | Shares | | Dollars ($) | | Shares | | Dollars ($) | | Shares | | Dollars ($) | |
Capital stock activity (continued) | |
Class R4 shares | |
Subscriptions | | | 2,426,298 | | | | 47,419,859 | | | | — | | | | — | | | | — | | | | — | | |
Redemptions | | | (58,888 | ) | | | (1,158,932 | ) | | | — | | | | — | | | | — | | | | — | | |
Net increase | | | 2,367,410 | | | | 46,260,927 | | | | — | | | | — | | | | — | | | | — | | |
Class R5 shares | |
Subscriptions | | | 3,760,744 | | | | 69,564,350 | | | | — | | | | — | | | | — | | | | — | | |
Redemptions | | | (240,061 | ) | | | (4,579,396 | ) | | | — | | | | — | | | | — | | | | — | | |
Net increase | | | 3,520,683 | | | | 64,984,954 | | | | — | | | | — | | | | — | | | | — | | |
Class T shares | |
Subscriptions | | | 54,026 | | | | 894,428 | | | | 85,562 | | | | 1,189,156 | | | | 55,930 | | | | 788,208 | | |
Distributions reinvested | | | 43,186 | | | | 681,908 | | | | 146,871 | | | | 2,003,321 | | | | 10,960 | | | | 151,720 | | |
Redemptions | | | (713,528 | ) | | | (12,336,857 | ) | | | (726,028 | ) | | | (10,516,756 | ) | | | (1,045,497 | ) | | | (14,810,309 | ) | |
Net decrease | | | (616,316 | ) | | | (10,760,521 | ) | | | (493,595 | ) | | | (7,324,279 | ) | | | (978,607 | ) | | | (13,870,381 | ) | |
Class W shares | |
Subscriptions | | | 9,467,580 | | | | 165,936,155 | | | | 2,622,116 | | | | 38,500,041 | | | | 7,743,688 | | | | 106,692,654 | | |
Distributions reinvested | | | 61,220 | | | | 974,618 | | | | 173,754 | | | | 2,389,123 | | | | 11,569 | | | | 161,173 | | |
Redemptions | | | (3,015,039 | ) | | | (55,117,699 | ) | | | (1,914,803 | ) | | | (28,426,789 | ) | | | (1,874,863 | ) | | | (27,146,720 | ) | |
Net increase | | | 6,513,761 | | | | 111,793,074 | | | | 881,067 | | | | 12,462,375 | | | | 5,880,394 | | | | 79,707,107 | | |
Class Y shares | |
Subscriptions | | | 4,041 | | | | 80,603 | | | | — | | | | — | | | | — | | | | — | | |
Distributions reinvested | | | — | | | | — | | | | — | | | | — | | | | — | | | | — | | |
Redemptions | | | (6 | ) | | | (100 | ) | | | — | | | | — | | | | — | | | | — | | |
Net increase | | | 4,035 | | | | 80,503 | | | | — | | | | — | | | | — | | | | — | | |
Class Z shares | |
Subscriptions | | | 31,221,824 | | | | 547,326,731 | | | | 21,510,360 | | | | 318,447,204 | | | | 21,989,221 | | | | 320,135,583 | | |
Distributions reinvested | | | 421,303 | | | | 6,732,416 | | | | 698,972 | | | | 9,645,813 | | | | 63,653 | | | | 886,445 | | |
Redemptions | | | (15,316,122 | ) | | | (269,440,681 | ) | | | (9,138,525 | ) | | | (134,280,882 | ) | | | (10,301,231 | ) | | | (146,595,719 | ) | |
Net increase | | | 16,327,005 | | | | 284,618,466 | | | | 13,070,807 | | | | 193,812,135 | | | | 11,751,643 | | | | 174,426,309 | | |
Total net increase | | | 38,505,831 | | | | 678,302,103 | | | | 20,088,862 | | | | 296,283,645 | | | | 66,757,782 | | | | 982,482,973 | | |
(a) Class R4, Class R5 and Class Y shares are for the period from November 8, 2012 (commencement of operations) to August 31, 2013.
(b) For the period from October 1, 2011 to August 31, 2012. During the period, the Fund's fiscal year end was changed from September 30 to August 31.
(c) Class K shares are for the period from March 7, 2011 (commencement of operations) to September 30, 2011.
(d) Includes conversions of Class B shares to Class A shares, if any.
(e) Effective October 25, 2012, Class R4 shares were renamed Class K shares.
The accompanying Notes to Financial Statements are an integral part of this statement.
Annual Report 2013
18
Columbia Contrarian Core Fund
The following tables are intended to help you understand the Fund's financial performance. Certain information reflects financial results for a single share of a class held for the periods shown. Per share net investment income (loss) amounts are calculated based on average shares outstanding during the period. Total return assumes reinvestment of all dividends and distributions, if any. Total return does not reflect payment of sales charges, if any, and is not annualized for periods of less than one year.
| | | Year Ended August 31, | | Year Ended September 30, | |
Class A | | 2013 | | 2012(a) | | 2011 | | 2010 | | 2009 | | 2008 | |
Per share data | |
Net asset value, beginning of period | | $ | 15.68 | | | $ | 12.63 | | | $ | 12.61 | | | $ | 11.76 | | | $ | 11.89 | | | $ | 15.51 | | |
Income from investment operations: | |
Net investment income | | | 0.13 | | | | 0.11 | | | | 0.08 | | | | 0.04 | | | | 0.08 | | | | 0.07 | | |
Net realized and unrealized gain (loss) | | | 3.48 | | | | 3.32 | | | | (0.03 | ) | | | 0.87 | | | | (0.14 | ) | | | (2.17 | ) | |
Total from investment operations | | | 3.61 | | | | 3.43 | | | | 0.05 | | | | 0.91 | | | | (0.06 | ) | | | (2.10 | ) | |
Less distributions to shareholders: | |
Net investment income | | | (0.12 | ) | | | (0.07 | ) | | | (0.03 | ) | | | (0.06 | ) | | | (0.07 | ) | | | (0.05 | ) | |
Net realized gains | | | (0.02 | ) | | | (0.31 | ) | | | — | | | | — | | | | — | | | | (1.47 | ) | |
Total distributions to shareholders | | | (0.14 | ) | | | (0.38 | ) | | | (0.03 | ) | | | (0.06 | ) | | | (0.07 | ) | | | (1.52 | ) | |
Proceeds from regulatory settlements | | | — | | | | — | | | | — | | | | — | | | | 0.00 | (b) | | | — | | |
Net asset value, end of period | | $ | 19.15 | | | $ | 15.68 | | | $ | 12.63 | | | $ | 12.61 | | | $ | 11.76 | | | $ | 11.89 | | |
Total return | | | 23.23 | % | | | 27.59 | % | | | 0.39 | % | | | 7.75 | % | | | (0.28 | %) | | | (15.35 | %) | |
Ratios to average net assets(c)(d) | |
Total gross expenses | | | 1.15 | % | | | 1.19 | %(e) | | | 1.19 | %(f) | | | 1.25 | % | | | 1.28 | %(f) | | | 1.24 | %(f) | |
Total net expenses(g) | | | 1.14 | %(h) | | | 1.16 | %(e)(h) | | | 1.16 | %(f)(h) | | | 1.19 | %(h) | | | 1.17 | %(f)(h) | | | 1.14 | %(f)(i) | |
Net investment income | | | 0.73 | % | | | 0.82 | %(e) | | | 0.56 | % | | | 0.32 | % | | | 0.77 | % | | | 0.53 | % | |
Supplemental data | |
Net assets, end of period (in thousands) | | $ | 913,212 | | | $ | 588,182 | | | $ | 427,039 | | | $ | 111,182 | | | $ | 27,742 | | | $ | 11,187 | | |
Portfolio turnover | | | 47 | % | | | 62 | % | | | 78 | % | | | 94 | % | | | 131 | % | | | 106 | % | |
Notes to Financial Highlights
(a) For the period from October 1, 2011 to August 31, 2012. During the period, the Fund's fiscal year end was changed from September 30 to August 31.
(b) Rounds to zero.
(c) In addition to the fees and expenses which the Fund bears directly, the Fund indirectly bears a pro rata share of the fees and expenses of the acquired funds in which it invests. Such indirect expenses are not included in the reported expense ratios.
(d) Certain line items from prior years have been reclassified to conform to the current presentation.
(e) Annualized.
(f) Includes interest expense which rounds to less than 0.01%.
(g) Total net expenses include the impact of certain waivers/reimbursements made by the Investment Manager and certain of its affiliates, if applicable.
(h) The benefits derived from expense reductions had an impact of less than 0.01%.
(i) The benefits derived from expense reductions had an impact of 0.01%.
The accompanying Notes to Financial Statements are an integral part of this statement.
Annual Report 2013
19
Columbia Contrarian Core Fund
Financial Highlights (continued)
| | | Year Ended August 31, | | Year Ended September 30, | |
Class B | | 2013 | | 2012(a) | | 2011 | | 2010 | | 2009 | | 2008 | |
Per share data | |
Net asset value, beginning of period | | $ | 14.53 | | | $ | 11.74 | | | $ | 11.78 | | | $ | 11.02 | | | $ | 11.14 | | | $ | 14.67 | | |
Income from investment operations: | |
Net investment income (loss) | | | (0.00 | )(b) | | | 0.01 | | | | (0.03 | ) | | | (0.05 | ) | | | 0.01 | | | | (0.03 | ) | |
Net realized and unrealized gain (loss) | | | 3.24 | | | | 3.09 | | | | (0.01 | ) | | | 0.81 | | | | (0.13 | ) | | | (2.03 | ) | |
Total from investment operations | | | 3.24 | | | | 3.10 | | | | (0.04 | ) | | | 0.76 | | | | (0.12 | ) | | | (2.06 | ) | |
Less distributions to shareholders: | |
Net investment income | | | (0.01 | ) | | | — | | | | — | | | | — | | | | — | | | | — | | |
Net realized gains | | | (0.02 | ) | | | (0.31 | ) | | | — | | | | — | | | | — | | | | (1.47 | ) | |
Total distributions to shareholders | | | (0.03 | ) | | | (0.31 | ) | | | — | | | | — | | | | — | | | | (1.47 | ) | |
Proceeds from regulatory settlements | | | — | | | | — | | | | — | | | | — | | | | 0.00 | (b) | | | — | | |
Net asset value, end of period | | $ | 17.74 | | | $ | 14.53 | | | $ | 11.74 | | | $ | 11.78 | | | $ | 11.02 | | | $ | 11.14 | | |
Total return | | | 22.32 | % | | | 26.72 | % | | | (0.34 | %) | | | 6.90 | % | | | (1.08 | %) | | | (15.96 | %) | |
Ratios to average net assets(c)(d) | |
Total gross expenses | | | 1.90 | % | | | 1.94 | %(e) | | | 1.92 | %(f) | | | 2.00 | % | | | 2.03 | %(f) | | | 1.99 | %(f) | |
Total net expenses(g) | | | 1.89 | %(h) | | | 1.91 | %(e)(h) | | | 1.90 | %(f)(h) | | | 1.94 | %(h) | | | 1.92 | %(f)(h) | | | 1.89 | %(f)(i) | |
Net investment income (loss) | | | (0.02 | %) | | | 0.05 | %(e) | | | (0.19 | %) | | | (0.46 | %) | | | 0.12 | % | | | (0.22 | %) | |
Supplemental data | |
Net assets, end of period (in thousands) | | $ | 16,396 | | | $ | 17,292 | | | $ | 21,560 | | | $ | 3,991 | | | $ | 3,428 | | | $ | 3,629 | | |
Portfolio turnover | | | 47 | % | | | 62 | % | | | 78 | % | | | 94 | % | | | 131 | % | | | 106 | % | |
Notes to Financial Highlights
(a) For the period from October 1, 2011 to August 31, 2012. During the period, the Fund's fiscal year end was changed from September 30 to August 31.
(b) Rounds to zero.
(c) In addition to the fees and expenses which the Fund bears directly, the Fund indirectly bears a pro rata share of the fees and expenses of the acquired funds in which it invests. Such indirect expenses are not included in the reported expense ratios.
(d) Certain line items from prior years have been reclassified to conform to the current presentation.
(e) Annualized.
(f) Includes interest expense which rounds to less than 0.01%.
(g) Total net expenses include the impact of certain waivers/reimbursements made by the Investment Manager and certain of its affiliates, if applicable.
(h) The benefits derived from expense reductions had an impact of less than 0.01%.
(i) The benefits derived from expense reductions had an impact of 0.01%.
The accompanying Notes to Financial Statements are an integral part of this statement.
Annual Report 2013
20
Columbia Contrarian Core Fund
Financial Highlights (continued)
| | | Year Ended August 31, | | Year Ended September 30, | |
Class C | | 2013 | | 2012(a) | | 2011 | | 2010 | | 2009 | | 2008 | |
Per share data | |
Net asset value, beginning of period | | $ | 14.55 | | | $ | 11.76 | | | $ | 11.80 | | | $ | 11.03 | | | $ | 11.15 | | | $ | 14.68 | | |
Income from investment operations: | |
Net investment income (loss) | | | (0.00 | )(b) | | | 0.01 | | | | (0.03 | ) | | | (0.05 | ) | | | 0.01 | | | | (0.03 | ) | |
Net realized and unrealized gain (loss) | | | 3.25 | | | | 3.09 | | | | (0.01 | ) | | | 0.82 | | | | (0.13 | ) | | | (2.03 | ) | |
Total from investment operations | | | 3.25 | | | | 3.10 | | | | (0.04 | ) | | | 0.77 | | | | (0.12 | ) | | | (2.06 | ) | |
Less distributions to shareholders: | |
Net investment income | | | (0.01 | ) | | | — | | | | — | | | | — | | | | — | | | | — | | |
Net realized gains | | | (0.02 | ) | | | (0.31 | ) | | | — | | | | — | | | | — | | | | (1.47 | ) | |
Total distributions to shareholders | | | (0.03 | ) | | | (0.31 | ) | | | — | | | | — | | | | — | | | | (1.47 | ) | |
Proceeds from regulatory settlements | | | — | | | | — | | | | — | | | | — | | | | 0.00 | (b) | | | — | | |
Net asset value, end of period | | $ | 17.77 | | | $ | 14.55 | | | $ | 11.76 | | | $ | 11.80 | | | $ | 11.03 | | | $ | 11.15 | | |
Total return | | | 22.36 | % | | | 26.68 | % | | | (0.34 | %) | | | 6.98 | % | | | (1.08 | %) | | | (15.95 | %) | |
Ratios to average net assets(c)(d) | |
Total gross expenses | | | 1.90 | % | | | 1.94 | %(e) | | | 1.95 | %(f) | | | 2.00 | % | | | 2.03 | %(f) | | | 1.99 | %(f) | |
Total net expenses(g) | | | 1.89 | %(h) | | | 1.91 | %(e)(h) | | | 1.92 | %(f)(h) | | | 1.94 | %(h) | | | 1.92 | %(f)(h) | | | 1.89 | %(f)(i) | |
Net investment income (loss) | | | (0.02 | %) | | | 0.07 | %(e) | | | (0.22 | %) | | | (0.44 | %) | | | 0.03 | % | | | (0.21 | %) | |
Supplemental data | |
Net assets, end of period (in thousands) | | $ | 115,940 | | | $ | 58,257 | | | $ | 36,559 | | | $ | 18,368 | | | $ | 7,094 | | | $ | 1,718 | | |
Portfolio turnover | | | 47 | % | | | 62 | % | | | 78 | % | | | 94 | % | | | 131 | % | | | 106 | % | |
Notes to Financial Highlights
(a) For the period from October 1, 2011 to August 31, 2012. During the period, the Fund's fiscal year end was changed from September 30 to August 31.
(b) Rounds to zero.
(c) In addition to the fees and expenses which the Fund bears directly, the Fund indirectly bears a pro rata share of the fees and expenses of the acquired funds in which it invests. Such indirect expenses are not included in the reported expense ratios.
(d) Certain line items from prior years have been reclassified to conform to the current presentation.
(e) Annualized.
(f) Includes interest expense which rounds to less than 0.01%.
(g) Total net expenses include the impact of certain waivers/reimbursements made by the Investment Manager and certain of its affiliates, if applicable.
(h) The benefits derived from expense reductions had an impact of less than 0.01%.
(i) The benefits derived from expense reductions had an impact of 0.01%.
The accompanying Notes to Financial Statements are an integral part of this statement.
Annual Report 2013
21
Columbia Contrarian Core Fund
Financial Highlights (continued)
| | | Year Ended August 31, | | Year Ended September 30, | |
Class I | | 2013 | | 2012(a) | | 2011 | | 2010(b) | |
Per share data | |
Net asset value, beginning of period | | $ | 15.78 | | | $ | 12.71 | | | $ | 12.69 | | | $ | 12.70 | | |
Income from investment operations: | |
Net investment income | | | 0.21 | | | | 0.17 | | | | 0.14 | | | | 0.01 | | |
Net realized and unrealized gain (loss) | | | 3.49 | | | | 3.34 | | | | (0.03 | ) | | | (0.02 | ) | |
Total from investment operations | | | 3.70 | | | | 3.51 | | | | 0.11 | | | | (0.01 | ) | |
Less distributions to shareholders: | |
Net investment income | | | (0.19 | ) | | | (0.13 | ) | | | (0.09 | ) | | | — | | |
Net realized gains | | | (0.02 | ) | | | (0.31 | ) | | | — | | | | — | | |
Total distributions to shareholders | | | (0.21 | ) | | | (0.44 | ) | | | (0.09 | ) | | | — | | |
Net asset value, end of period | | $ | 19.27 | | | $ | 15.78 | | | $ | 12.71 | | | $ | 12.69 | | |
Total return | | | 23.73 | % | | | 28.12 | % | | | 0.81 | % | | | (0.08 | %) | |
Ratios to average net assets(c)(d) | |
Total gross expenses | | | 0.70 | % | | | 0.75 | %(e) | | | 0.76 | %(f) | | | 0.85 | %(e) | |
Total net expenses(g) | | | 0.70 | % | | | 0.75 | %(e) | | | 0.76 | %(f)(h) | | | 0.85 | %(e)(h) | |
Net investment income | | | 1.17 | % | | | 1.24 | %(e) | | | 0.99 | % | | | 4.99 | %(e) | |
Supplemental data | |
Net assets, end of period (in thousands) | | $ | 424,376 | | | $ | 385,802 | | | $ | 280,304 | | | $ | 2 | | |
Portfolio turnover | | | 47 | % | | | 62 | % | | | 78 | % | | | 94 | % | |
Notes to Financial Highlights
(a) For the period from October 1, 2011 to August 31, 2012. During the period, the Fund's fiscal year end was changed from September 30 to August 31.
(b) For the period from September 27, 2010 (commencement of operations) to Septermber 30, 2010.
(c) In addition to the fees and expenses which the Fund bears directly, the Fund indirectly bears a pro rata share of the fees and expenses of the acquired funds in which it invests. Such indirect expenses are not included in the reported expense ratios.
(d) Certain line items from prior years have been reclassified to conform to the current presentation.
(e) Annualized.
(f) Includes interest expense which rounds to less than 0.01%.
(g) Total net expenses include the impact of certain waivers/reimbursements made by the Investment Manager and certain of its affiliates, if applicable.
(h) The benefits derived from expense reductions had an impact of less than 0.01%.
The accompanying Notes to Financial Statements are an integral part of this statement.
Annual Report 2013
22
Columbia Contrarian Core Fund
Financial Highlights (continued)
| | | Year Ended August 31, | | Year Ended
September 30, | |
Class K(a) | | 2013 | | 2012(b) | | 2011(c) | |
Per share data | |
Net asset value, beginning of period | | $ | 15.77 | | | $ | 12.70 | | | $ | 14.93 | | |
Income from investment operations: | |
Net investment income | | | 0.15 | | | | 0.13 | | | | 0.06 | | |
Net realized and unrealized gain (loss) | | | 3.51 | | | | 3.34 | | | | (2.29 | ) | |
Total from investment operations | | | 3.66 | | | | 3.47 | | | | (2.23 | ) | |
Less distributions to shareholders: | |
Net investment income | | | (0.15 | ) | | | (0.09 | ) | | | — | | |
Net realized gains | | | (0.02 | ) | | | (0.31 | ) | | | — | | |
Total distributions to shareholders | | | (0.17 | ) | | | (0.40 | ) | | | — | | |
Net asset value, end of period | | $ | 19.26 | | | $ | 15.77 | | | $ | 12.70 | | |
Total return | | | 23.40 | % | | | 27.74 | % | | | (14.94 | %) | |
Ratios to average net assets(d)(e) | |
Total gross expenses | | | 1.00 | % | | | 1.05 | %(f) | | | 1.05 | %(f)(g) | |
Total net expenses(h) | | | 1.00 | % | | | 1.05 | %(f) | | | 1.05 | %(f)(g)(i) | |
Net investment income | | | 0.87 | % | | | 0.93 | %(f) | | | 0.72 | %(f) | |
Supplemental data | |
Net assets, end of period (in thousands) | | $ | 144 | | | $ | 117 | | | $ | 100 | | |
Portfolio turnover | | | 47 | % | | | 62 | % | | | 78 | % | |
Notes to Financial Highlights
(a) Effective October 25, 2012, Class R4 shares were renamed Class K shares.
(b) For the period from October 1, 2011 to August 31, 2012. During the period, the Fund's fiscal year end was changed from September 30 to August 31.
(c) For the period from March 7, 2011 (commencement of operations) to September 30,2011.
(d) In addition to the fees and expenses which the Fund bears directly, the Fund indirectly bears a pro rata share of the fees and expenses of the acquired funds in which it invests. Such indirect expenses are not included in the reported expense ratios.
(e) Certain line items from prior years have been reclassified to conform to the current presentation.
(f) Annualized.
(g) Includes interest expense which rounds to less than 0.01%.
(h) Total net expenses include the impact of certain waivers/reimbursements made by the Investment Manager and certain of its affiliates, if applicable.
(i) The benefits derived from expense reductions had an impact of less than 0.01%.
The accompanying Notes to Financial Statements are an integral part of this statement.
Annual Report 2013
23
Columbia Contrarian Core Fund
Financial Highlights (continued)
| | | Year Ended August 31, | | Year Ended September 30, | |
Class R | | 2013 | | 2012(a) | | 2011 | | 2010(b) | |
Per share data | |
Net asset value, beginning of period | | $ | 15.68 | | | $ | 12.63 | | | $ | 12.61 | | | $ | 12.62 | | |
Income from investment operations: | |
Net investment income | | | 0.08 | | | | 0.08 | | | | 0.05 | | | | 0.00 | (c) | |
Net realized and unrealized gain (loss) | | | 3.49 | | | | 3.32 | | | | (0.03 | ) | | | (0.01 | ) | |
Total from investment operations | | | 3.57 | | | | 3.40 | | | | 0.02 | | | | (0.01 | ) | |
Less distributions to shareholders: | |
Net investment income | | | (0.08 | ) | | | (0.04 | ) | | | — | | | | — | | |
Net realized gains | | | (0.02 | ) | | | (0.31 | ) | | | — | | | | — | | |
Total distributions to shareholders | | | (0.10 | ) | | | (0.35 | ) | | | — | | | | — | | |
Net asset value, end of period | | $ | 19.15 | | | $ | 15.68 | | | $ | 12.63 | | | $ | 12.61 | | |
Total return | | | 22.93 | % | | | 27.34 | % | | | 0.16 | % | | | (0.08 | %) | |
Ratios to average net assets(d)(e) | |
Total gross expenses | | | 1.39 | % | | | 1.42 | %(f) | | | 1.44 | %(g) | | | 1.44 | %(f) | |
Total net expenses(h) | | | 1.39 | %(i) | | | 1.41 | %(f)(i) | | | 1.39 | %(g)(i) | | | 1.44 | %(f)(i) | |
Net investment income | | | 0.46 | % | | | 0.59 | %(f) | | | 0.32 | % | | | 4.34 | %(f) | |
Supplemental data | |
Net assets, end of period (in thousands) | | $ | 13,102 | | | $ | 4,489 | | | $ | 6 | | | $ | 2 | | |
Portfolio turnover | | | 47 | % | | | 62 | % | | | 78 | % | | | 94 | % | |
Notes to Financial Highlights
(a) For the period from October 1, 2011 to August 31, 2012. During the period, the Fund's fiscal year end was changed from September 30 to August 31.
(b) For the period from September 27, 2010 (commencement of operations) to September 30,2010.
(c) Rounds to zero.
(d) In addition to the fees and expenses which the Fund bears directly, the Fund indirectly bears a pro rata share of the fees and expenses of the acquired funds in which it invests. Such indirect expenses are not included in the reported expense ratios.
(e) Certain line items from prior years have been reclassified to conform to the current presentation.
(f) Annualized.
(g) Includes interest expense which rounds to less than 0.01%.
(h) Total net expenses include the impact of certain waivers/reimbursements made by the Investment Manager and certain of its affiliates, if applicable.
(i) The benefits derived from expense reductions had an impact of less than 0.01%.
The accompanying Notes to Financial Statements are an integral part of this statement.
Annual Report 2013
24
Columbia Contrarian Core Fund
Financial Highlights (continued)
Class R4 | | Year Ended
August 31,
2013(a) | |
Per share data | |
Net asset value, beginning of period | | $ | 15.84 | | |
Income from investment operations: | |
Net investment income | | | 0.16 | | |
Net realized and unrealized gain | | | 3.70 | | |
Total from investment operations | | | 3.86 | | |
Less distributions to shareholders: | |
Net investment income | | | (0.16 | ) | |
Net realized gains | | | (0.02 | ) | |
Total distributions to shareholders | | | (0.18 | ) | |
Net asset value, end of period | | $ | 19.52 | | |
Total return | | | 24.61 | % | |
Ratios to average net assets(b) | |
Total gross expenses | | | 0.89 | %(c) | |
Total net expenses(d) | | | 0.89 | %(c)(e) | |
Net investment income | | | 1.04 | %(c) | |
Supplemental data | |
Net assets, end of period (in thousands) | | $ | 46,212 | | |
Portfolio turnover | | | 47 | % | |
Notes to Financial Highlights
(a) For the period from November 8, 2012 (commencement of operations) to August 31, 2013.
(b) In addition to the fees and expenses which the Fund bears directly, the Fund indirectly bears a pro rata share of the fees and expenses of the acquired funds in which it invests. Such indirect expenses are not included in the reported expense ratios.
(c) Annualized.
(d) Total net expenses include the impact of certain waivers/reimbursements made by the Investment Manager and certain of its affiliates, if applicable.
(e) The benefits derived from expense reductions had an impact of less than 0.01%.
The accompanying Notes to Financial Statements are an integral part of this statement.
Annual Report 2013
25
Columbia Contrarian Core Fund
Financial Highlights (continued)
Class R5 | | Year Ended
August 31,
2013(a) | |
Per share data | |
Net asset value, beginning of period | | $ | 15.84 | | |
Income from investment operations: | |
Net investment income | | | 0.15 | | |
Net realized and unrealized gain | | | 3.73 | | |
Total from investment operations | | | 3.88 | | |
Less distributions to shareholders: | |
Net investment income | | | (0.18 | ) | |
Net realized gains | | | (0.02 | ) | |
Total distributions to shareholders | | | (0.20 | ) | |
Net asset value, end of period | | $ | 19.52 | | |
Total return | | | 24.75 | % | |
Ratios to average net assets(b) | |
Total gross expenses | | | 0.75 | %(c) | |
Total net expenses(d) | | | 0.75 | %(c) | |
Net investment income | | | 1.01 | %(c) | |
Supplemental data | |
Net assets, end of period (in thousands) | | $ | 68,709 | | |
Portfolio turnover | | | 47 | % | |
Notes to Financial Highlights
(a) For the period from November 8, 2012 (commencement of operations) to August 31, 2013.
(b) In addition to the fees and expenses which the Fund bears directly, the Fund indirectly bears a pro rata share of the fees and expenses of the acquired funds in which it invests. Such indirect expenses are not included in the reported expense ratios.
(c) Annualized.
(d) Total net expenses include the impact of certain waivers/reimbursements made by the Investment Manager and certain of its affiliates, if applicable.
The accompanying Notes to Financial Statements are an integral part of this statement.
Annual Report 2013
26
Columbia Contrarian Core Fund
Financial Highlights (continued)
| | | Year Ended August 31, | | Year Ended September 30, | |
Class T | | 2013 | | 2012(a) | | 2011 | | 2010 | | 2009 | | 2008 | |
Per share data | |
Net asset value, beginning of period | | $ | 15.56 | | | $ | 12.54 | | | $ | 12.51 | | | $ | 11.67 | | | $ | 11.80 | | | $ | 15.40 | | |
Income from investment operations: | |
Net investment income | | | 0.12 | | | | 0.10 | | | | 0.06 | | | | 0.03 | | | | 0.08 | | | | 0.06 | | |
Net realized and unrealized gain (loss) | | | 3.47 | | | | 3.29 | | | | — | | | | 0.86 | | | | (0.14 | ) | | | (2.15 | ) | |
Total from investment operations | | | 3.59 | | | | 3.39 | | | | 0.06 | | | | 0.89 | | | | (0.06 | ) | | | (2.09 | ) | |
Less distributions to shareholders: | |
Net investment income | | | (0.12 | ) | | | (0.06 | ) | | | (0.03 | ) | | | (0.05 | ) | | | (0.07 | ) | | | (0.04 | ) | |
Net realized gains | | | (0.02 | ) | | | (0.31 | ) | | | — | | | | — | | | | — | | | | (1.47 | ) | |
Total distributions to shareholders | | | (0.14 | ) | | | (0.37 | ) | | | (0.03 | ) | | | (0.05 | ) | | | (0.07 | ) | | | (1.51 | ) | |
Proceeds from regulatory settlements | | | — | | | | — | | | | — | | | | — | | | | 0.00 | (b) | | | — | | |
Net asset value, end of period | | $ | 19.01 | | | $ | 15.56 | | | $ | 12.54 | | | $ | 12.51 | | | $ | 11.67 | | | $ | 11.80 | | |
Total return | | | 23.22 | % | | | 27.49 | % | | | 0.43 | % | | | 7.68 | % | | | (0.35 | %) | | | (15.37 | %) | |
Ratios to average net assets(c)(d) | |
Total gross expenses | | | 1.20 | % | | | 1.24 | %(e) | | | 1.26 | %(f) | | | 1.30 | % | | | 1.33 | %(f) | | | 1.29 | %(f) | |
Total net expenses(g) | | | 1.19 | %(h) | | | 1.21 | %(e)(h) | | | 1.21 | %(f)(h) | | | 1.24 | %(h) | | | 1.22 | %(f)(h) | | | 1.19 | %(f)(i) | |
Net investment income | | | 0.68 | % | | | 0.77 | %(e) | | | 0.44 | % | | | 0.24 | % | | | 0.81 | % | | | 0.48 | % | |
Supplemental data | |
Net assets, end of period (in thousands) | | $ | 131,732 | | | $ | 117,457 | | | $ | 100,805 | | | $ | 112,862 | | | $ | 117,161 | | | $ | 132,272 | | |
Portfolio turnover | | | 47 | % | | | 62 | % | | | 78 | % | | | 94 | % | | | 131 | % | | | 106 | % | |
Notes to Financial Highlights
(a) For the period from October 1, 2011 to August 31, 2012. During the period, the Fund's fiscal year end was changed from September 30 to August 31.
(b) Rounds to zero.
(c) In addition to the fees and expenses which the Fund bears directly, the Fund indirectly bears a pro rata share of the fees and expenses of the acquired funds in which it invests. Such indirect expenses are not included in the reported expense ratios.
(d) Certain line items from prior years have been reclassified to conform to the current presentation.
(e) Annualized.
(f) Includes interest expense which rounds to less than 0.01%.
(g) Total net expenses include the impact of certain waivers/reimbursements made by the Investment Manager and certain of its affiliates, if applicable.
(h) The benefits derived from expense reductions had an impact of less than 0.01%.
(i) The benefits derived from expense reductions had an impact of 0.01%.
The accompanying Notes to Financial Statements are an integral part of this statement.
Annual Report 2013
27
Columbia Contrarian Core Fund
Financial Highlights (continued)
| | | Year Ended August 31, | | Year Ended September 30, | |
Class W | | 2013 | | 2012(a) | | 2011 | | 2010(b) | |
Per share data | |
Net asset value, beginning of period | | $ | 15.69 | | | $ | 12.64 | | | $ | 12.61 | | | $ | 12.62 | | |
Income from investment operations: | |
Net investment income | | | 0.13 | | | | 0.11 | | | | 0.08 | | | | 0.00 | (c) | |
Net realized and unrealized gain (loss) | | | 3.48 | | | | 3.32 | | | | (0.02 | ) | | | (0.01 | ) | |
Total from investment operations | | | 3.61 | | | | 3.43 | | | | 0.06 | | | | (0.01 | ) | |
Less distributions to shareholders: | |
Net investment income | | | (0.12 | ) | | | (0.07 | ) | | | (0.03 | ) | | | — | | |
Net realized gains | | | (0.02 | ) | | | (0.31 | ) | | | — | | | | — | | |
Total distributions to shareholders | | | (0.14 | ) | | | (0.38 | ) | | | (0.03 | ) | | | — | | |
Net asset value, end of period | | $ | 19.16 | | | $ | 15.69 | | | $ | 12.64 | | | $ | 12.61 | | |
Total return | | | 23.21 | % | | | 27.57 | % | | | 0.47 | % | | | (0.08 | %) | |
Ratios to average net assets(d)(e) | |
Total gross expenses | | | 1.14 | % | | | 1.19 | %(f) | | | 1.20 | %(g) | | | 1.19 | %(f) | |
Total net expenses(h) | | | 1.14 | %(i) | | | 1.16 | %(f)(i) | | | 1.16 | %(g)(i) | | | 1.19 | %(f)(i) | |
Net investment income | | | 0.73 | % | | | 0.83 | %(f) | | | 0.54 | % | | | 4.64 | %(f) | |
Supplemental data | |
Net assets, end of period (in thousands) | | $ | 254,377 | | | $ | 106,075 | | | $ | 74,302 | | | $ | 2 | | |
Portfolio turnover | | | 47 | % | | | 62 | % | | | 78 | % | | | 94 | % | |
Notes to Financial Highlights
(a) For the period from October 1, 2011 to August 31, 2012. During the period, the Fund's fiscal year end was changed from September 30 to August 31.
(b) For the period from September 27, 2010 (commencement of operations) to September 30, 2010.
(c) Rounds to zero.
(d) In addition to the fees and expenses which the Fund bears directly, the Fund indirectly bears a pro rata share of the fees and expenses of the acquired funds in which it invests. Such indirect expenses are not included in the reported expense ratios.
(e) Certain line items from prior years have been reclassified to conform to the current presentation.
(f) Annualized.
(g) Includes interest expense which rounds to less than 0.01%.
(h) Total net expenses include the impact of certain waivers/reimbursements made by the Investment Manager and certain of its affiliates, if applicable.
(i) The benefits derived from expense reductions had an impact of less than 0.01%.
The accompanying Notes to Financial Statements are an integral part of this statement.
Annual Report 2013
28
Columbia Contrarian Core Fund
Financial Highlights (continued)
Class Y | | Year Ended
August 31,
2013(a) | |
Per share data | |
Net asset value, beginning of period | | $ | 15.84 | | |
Income from investment operations: | |
Net investment income | | | 0.24 | | |
Net realized and unrealized gain | | | 3.64 | | |
Total from investment operations | | | 3.88 | | |
Less distributions to shareholders: | |
Net investment income | | | (0.18 | ) | |
Net realized gains | | | (0.02 | ) | |
Total distributions to shareholders | | | (0.20 | ) | |
Net asset value, end of period | | $ | 19.52 | | |
Total return | | | 24.79 | % | |
Ratios to average net assets(b) | |
Total gross expenses | | | 0.72 | %(c) | |
Total net expenses(d) | | | 0.72 | %(c) | |
Net investment income | | | 1.60 | %(c) | |
Supplemental data | |
Net assets, end of period (in thousands) | | $ | 79 | | |
Portfolio turnover | | | 47 | % | |
Notes to Financial Highlights
(a) For the period from November 8, 2012 (commencement of operations) to August 31,2013.
(b) In addition to the fees and expenses which the Fund bears directly, the Fund indirectly bears a pro rata share of the fees and expenses of the acquired funds in which it invests. Such indirect expenses are not included in the reported expense ratios.
(c) Annualized.
(d) Total net expenses include the impact of certain waivers/reimbursements made by the Investment Manager and certain of its affiliates, if applicable.
The accompanying Notes to Financial Statements are an integral part of this statement.
Annual Report 2013
29
Columbia Contrarian Core Fund
Financial Highlights (continued)
| | | Year Ended August 31, | | Year Ended September 30, | |
Class Z | | 2013 | | 2012(a) | | 2011 | | 2010 | | 2009 | | 2008 | |
Per share data | |
Net asset value, beginning of period | | $ | 15.78 | | | $ | 12.71 | | | $ | 12.68 | | | $ | 11.83 | | | $ | 11.97 | | | $ | 15.60 | | |
Income from investment operations: | |
Net investment income | | | 0.17 | | | | 0.15 | | | | 0.11 | | | | 0.07 | | | | 0.11 | | | | 0.11 | | |
Net realized and unrealized gain (loss) | | | 3.50 | | | | 3.34 | | | | (0.01 | ) | | | 0.86 | | | | (0.15 | ) | | | (2.18 | ) | |
Total from investment operations | | | 3.67 | | | | 3.49 | | | | 0.10 | | | | 0.93 | | | | (0.04 | ) | | | (2.07 | ) | |
Less distributions to shareholders: | |
Net investment income | | | (0.16 | ) | | | (0.11 | ) | | | (0.07 | ) | | | (0.08 | ) | | | (0.10 | ) | | | (0.09 | ) | |
Net realized gains | | | (0.02 | ) | | | (0.31 | ) | | | — | | | | — | | | | — | | | | (1.47 | ) | |
Total distributions to shareholders | | | (0.18 | ) | | | (0.42 | ) | | | (0.07 | ) | | | (0.08 | ) | | | (0.10 | ) | | | (1.56 | ) | |
Proceeds from regulatory settlements | | | — | | | | — | | | | — | | | | — | | | | 0.00 | (b) | | | — | | |
Net asset value, end of period | | $ | 19.27 | | | $ | 15.78 | | | $ | 12.71 | | | $ | 12.68 | | | $ | 11.83 | | | $ | 11.97 | | |
Total return | | | 23.50 | % | | | 27.91 | % | | | 0.72 | % | | | 7.93 | % | | | (0.01 | %) | | | (15.11 | %) | |
Ratios to average net assets(c)(d) | |
Total gross expenses | | | 0.90 | % | | | 0.94 | %(e) | | | 0.96 | %(f) | | | 1.00 | % | | | 1.03 | %(f) | | | 0.99 | %(f) | |
Total net expenses(g) | | | 0.89 | %(h) | | | 0.91 | %(e)(h) | | | 0.91 | %(f)(h) | | | 0.94 | %(h) | | | 0.92 | %(f)(h) | | | 0.89 | %(f)(i) | |
Net investment income | | | 0.98 | % | | | 1.08 | %(e) | | | 0.76 | % | | | 0.54 | % | | | 1.09 | % | | | 0.77 | % | |
Supplemental data | |
Net assets, end of period (in thousands) | | $ | 1,315,874 | | | $ | 819,630 | | | $ | 494,107 | | | $ | 344,081 | | | $ | 247,974 | | | $ | 173,479 | | |
Portfolio turnover | | | 47 | % | | | 62 | % | | | 78 | % | | | 94 | % | | | 131 | % | | | 106 | % | |
Notes to Financial Highlights
(a) For the period from October 1, 2011 to August 31, 2012. During the period, the Fund's fiscal year end was changed from September 30 to August 31.
(b) Rounds to zero.
(c) In addition to the fees and expenses which the Fund bears directly, the Fund indirectly bears a pro rata share of the fees and expenses of the acquired funds in which it invests. Such indirect expenses are not included in the reported expense ratios.
(d) Certain line items from prior years have been reclassified to conform to the current presentation.
(e) Annualized.
(f) Includes interest expense which rounds to less than 0.01%.
(g) Total net expenses include the impact of certain waivers/reimbursements made by the Investment Manager and certain of its affiliates, if applicable.
(h) The benefits derived from expense reductions had an impact of less than 0.01%.
(i) The benefits derived from expense reductions had an impact of 0.01%.
The accompanying Notes to Financial Statements are an integral part of this statement.
Annual Report 2013
30
Columbia Contrarian Core Fund
Notes to Financial Statements
August 31, 2013
Note 1. Organization
Columbia Contrarian Core Fund (the Fund), a series of Columbia Funds Series Trust I (the Trust), is a diversified fund. The Trust is registered under the Investment Company Act of 1940, as amended (the 1940 Act), as an open-end management investment company organized as a Massachusetts business trust.
Fund Shares
The Trust may issue an unlimited number of shares (without par value). The Fund offers Class A, Class B, Class C, Class I, Class K, Class R, Class R4, Class R5, Class T, Class W, Class Y and Class Z shares. Although all share classes generally have identical voting, dividend and liquidation rights, each share class votes separately when required by law. Different share classes pay different distribution amounts to the extent the expenses of such share classes differ, and distributions in liquidation will be proportional to the net asset value of each share class. Each share class has its own expense structure and sales charges, as applicable.
Class A shares are subject to a maximum front-end sales charge of 5.75% based on the initial investment amount. Class A shares purchased without an initial sales charge in accounts aggregating $1 million to $50 million at the time of purchase are subject to a contingent deferred sales charge (CDSC) if the shares are sold within 18 months of purchase, charged as follows: 1.00% CDSC if redeemed within 12 months of purchase, and 0.50% CDSC if redeemed more than 12, but less than 18, months after purchase.
Class B shares may be subject to a maximum CDSC of 5.00% based upon the holding period after purchase. Class B shares will generally convert to Class A shares eight years after purchase. The Fund no longer accepts investments by new or existing investors in the Fund's Class B shares, except in connection with the reinvestment of any dividend and/or capital gain distributions in Class B shares of the Fund and exchanges by existing Class B shareholders of certain other funds within the Columbia Family of Funds.
Class C shares are subject to a 1.00% CDSC on shares redeemed within one year of purchase.
Class I shares are not subject to sales charges and are available only to the Columbia Family of Funds.
Class K shares (formerly Class R4 shares) are not subject to sales charges; however, this share class is closed to new investors. Effective October 25, 2012, Class R4 shares were renamed Class K shares.
Class R shares are not subject to sales charges and are generally available only to certain retirement plans and other eligible investors.
Class R4 shares are not subject to sales charges and are generally available only to omnibus retirement plans and certain other eligible investors. Class R4 shares commenced operations on November 8, 2012.
Class R5 shares are not subject to sales charges and are generally available only to investors purchasing through authorized investment professionals and omnibus retirement plans. Class R5 shares commenced operations on November 8, 2012.
Class T shares are subject to a maximum front-end sales charge of 5.75% based on the investment amount. Class T shares purchased without an initial sales charge in accounts aggregating $1 million to $50 million at the time of purchase are subject to a CDSC if the shares are sold within 18 months of purchase, charged as follows: 1.00% CDSC if redeemed within 12 months of purchase, and 0.50% CDSC if redeemed more than 12, but less than 18, months after purchase. Class T shares are available only to investors who received (and who have continuously held) Class T shares in connection with the merger of certain Galaxy Funds into various Columbia Funds (formerly named Liberty Funds).
Class W shares are not subject to sales charges and are available only to investors purchasing through authorized investment programs managed by investment professionals, including discretionary managed account programs.
Class Y shares commenced operations on November 8, 2012. Class Y shares are not subject to sales charges and are generally available only to certain retirement plans.
Class Z shares are not subject to sales charges and are available only to certain eligible investors, which are subject to different investment minimums.
Note 2. Summary of Significant Accounting Policies
Use of Estimates
The preparation of financial statements in accordance with U.S. generally accepted accounting principles (GAAP) requires management to make certain estimates and assumptions that affect the reported amounts of assets and liabilities, the disclosure of contingent assets and liabilities at the date of the financial statements and the reported amounts of revenue and expenses during the reporting period. Actual results could differ from those estimates.
Annual Report 2013
31
Columbia Contrarian Core Fund
Notes to Financial Statements (continued)
August 31, 2013
The following is a summary of significant accounting policies consistently followed by the Fund in the preparation of its financial statements.
Security Valuation
All equity securities are valued at the close of business of the New York Stock Exchange (NYSE). Equity securities are valued at the last quoted sales price on the principal exchange or market on which they trade, except for securities traded on the NASDAQ Stock Market, which are valued at the NASDAQ official close price. Unlisted securities or listed securities for which there were no sales during the day are valued at the mean of the latest quoted bid and ask prices on such exchanges or markets.
Foreign equity securities are valued based on quotations from the principal market in which such securities are normally traded. If any foreign share prices are not readily available as a result of limited share activity the securities are valued at the mean of the latest quoted bid and ask prices on such exchanges or markets. Foreign currency exchange rates are generally determined at 4:00 p.m. Eastern (U.S.) time. However, many securities markets and exchanges outside the U.S. close prior to the close of the NYSE; therefore, the closing prices for securities in such markets or on such exchanges may not fully reflect events that occur after such close but before the close of the NYSE. In those situations, foreign securities will be fair valued pursuant to the policy adopted by the Board of Trustees (the Board), including utilizing a third party pricing service to determine these fair values. The third party pricing service takes into account multiple factors, including, but not limited to, movements in the U.S. securities markets, certain depositary receipts, futures contracts and foreign exchange rates that have occurred subsequent to the close of the foreign exchange or market, to determine a good faith estimate that reasonably reflects the current market conditions as of the close of the NYSE. The fair value of a security is likely to be different from the quoted or published price, if available.
Investments in open-end investment companies, including money market funds, are valued at net asset value.
Investments for which market quotations are not readily available, or that have quotations which management believes are not reliable, are valued at fair value as determined in good faith under consistently applied procedures established by and under the general supervision of the Board. If a security or class of securities (such as foreign securities) is valued at fair value, such value is likely to be different from the last quoted market price for the security.
The determination of fair value often requires significant judgment. To determine fair value, management may use
assumptions including but not limited to future cash flows and estimated risk premiums. Multiple inputs from various sources may be used to determine fair value.
Foreign Currency Transactions and Translations
The values of all assets and liabilities denominated in foreign currencies are translated into U.S. dollars at that day's exchange rates. Net realized and unrealized gains (losses) on foreign currency transactions and translations include gains (losses) arising from the fluctuation in exchange rates between trade and settlement dates on securities transactions, gains (losses) arising from the disposition of foreign currency and currency gains (losses) between the accrual and payment dates on dividends, interest income and foreign withholding taxes.
For financial statement purposes, the Fund does not distinguish that portion of gains (losses) on investments which is due to changes in foreign exchange rates from that which is due to changes in market prices of the investments. Such fluctuations are included with the net realized and unrealized gains (losses) on investments in the Statement of Operations.
Security Transactions
Security transactions are accounted for on the trade date. Cost is determined and gains (losses) are based upon the specific identification method for both financial statement and federal income tax purposes.
Income Recognition
Corporate actions and dividend income are generally recorded net of any non-reclaimable tax withholdings, on the ex-dividend date or upon receipt of ex-dividend notification in the case of certain foreign securities.
Awards from class action litigation are recorded as a reduction of cost basis if the Fund still owns the applicable securities on the payment date. If the Fund no longer owns the applicable securities, the proceeds are recorded as realized gains.
Expenses
General expenses of the Trust are allocated to the Fund and other funds of the Trust based upon relative net assets or other expense allocation methodologies determined by the nature of the expense. Expenses directly attributable to the Fund are charged to the Fund. Expenses directly attributable to a specific class of shares are charged to that share class.
Determination of Class Net Asset Value
All income, expenses (other than class-specific expenses, which are charged to that share class, as shown in the Statement of Operations) and realized and unrealized gains (losses) are allocated to each class of the Fund on a daily basis, based on the relative net assets of each class, for purposes of determining the net asset value of each class.
Annual Report 2013
32
Columbia Contrarian Core Fund
Notes to Financial Statements (continued)
August 31, 2013
Federal Income Tax Status
The Fund intends to qualify each year as a regulated investment company under Subchapter M of the Internal Revenue Code, as amended, and will distribute substantially all of its taxable income (including net short-term capital gains), if any, for its tax year, and as such will not be subject to federal income taxes. In addition, the Fund intends to distribute in each calendar year substantially all of its net investment income, capital gains and certain other amounts, if any, such that the Fund should not be subject to federal excise tax. Therefore, no federal income or excise tax provision is recorded.
Foreign Taxes
The Fund may be subject to foreign taxes on income, gains on investments or currency repatriation, a portion of which may be recoverable. The Fund will accrue such taxes and recoveries, as applicable, based upon its current interpretation of tax rules and regulations that exist in the markets in which it invests.
Realized gains in certain countries may be subject to foreign taxes at the Fund level, based on statutory rates. The Fund accrues for such foreign taxes on realized and unrealized gains at the appropriate rate for each jurisdiction, as applicable. The amount, if any, is disclosed as a liability on the Statement of Assets and Liabilities.
Distributions to Shareholders
Distributions from net investment income, if any, are declared and paid annually. Net realized capital gains, if any, are distributed along with the income distribution. Income distributions and capital gain distributions are determined in accordance with federal income tax regulations, which may differ from GAAP.
Guarantees and Indemnifications
Under the Trust's organizational documents and, in some cases, by contract, its officers and trustees are indemnified against certain liabilities arising out of the performance of their duties to the Trust or its funds. In addition, certain of the Fund's contracts with its service providers contain general indemnification clauses. The Fund's maximum exposure under these arrangements is unknown since the amount of any future claims that may be made against the Fund cannot be determined, and the Fund has no historical basis for predicting the likelihood of any such claims.
Recent Accounting Pronouncement
Disclosures about Offsetting Assets and Liabilities
In December 2011, the Financial Accounting Standards Board (FASB) issued Accounting Standards Update (ASU) No. 2011-11, Disclosures about Offsetting Assets and
Liabilities and in January 2013, ASU No. 2013-1, Clarifying the Scope of Disclosures about Offsetting Assets and Liabilities (collectively, the ASUs). Specifically, the ASUs require an entity to disclose both gross and net information for derivatives and other financial instruments that are subject to a master netting arrangement or similar agreement. The ASUs require disclosure of collateral received in connection with the master netting agreements or similar agreements. The disclosure requirements are effective for interim and annual periods beginning on or after January 1, 2013. At this time, management is evaluating the implications of this guidance and the impact it will have on the financial statement amounts and footnote disclosures, if any.
Note 3. Fees and Compensation Paid to Affiliates
Investment Management Fees
Under an Investment Management Services Agreement, Columbia Management Investment Advisers, LLC (the Investment Manager), a wholly-owned subsidiary of Ameriprise Financial, Inc. (Ameriprise Financial), determines which securities will be purchased, held or sold. The investment management fee is an annual fee that is equal to a percentage of the Fund's average daily net assets that declines from 0.71% to 0.54% as the Fund's net assets increase. The effective investment management fee rate for the year ended August 31, 2013 was 0.62% of the Fund's average daily net assets.
Administration Fees
Under an Administrative Services Agreement, the Investment Manager also serves as the Fund Administrator. The Fund pays the Fund Administrator an annual fee for administration and accounting services equal to a percentage of the Fund's average daily net assets that declines from 0.06% to 0.03% as the Fund's net assets increase. The effective administration fee rate for the year ended August 31, 2013 was 0.05% of the Fund's average daily net assets.
Compensation of Board Members
Board members are compensated for their services to the Fund as disclosed in the Statement of Operations. The Trust's eligible Trustees may participate in a Deferred Compensation Plan (the Plan) which may be terminated at any time. Obligations of the Plan will be paid solely out of the Fund's assets.
Compensation of Chief Compliance Officer
The Board has appointed a Chief Compliance Officer to the Fund in accordance with federal securities regulations. The Fund pays its pro-rata share of the expenses associated with the Chief Compliance Officer. The Fund's expenses for the Chief Compliance Officer will not exceed $15,000 per year.
Annual Report 2013
33
Columbia Contrarian Core Fund
Notes to Financial Statements (continued)
August 31, 2013
Transfer Agent Fees
Under a Transfer and Dividend Disbursing Agent Agreement, Columbia Management Investment Services Corp. (the Transfer Agent), an affiliate of the Investment Manager and a wholly-owned subsidiary of Ameriprise Financial, is responsible for providing transfer agency services to the Fund. The Transfer Agent has contracted with Boston Financial Data Services (BFDS) to serve as sub-transfer agent.
The Transfer Agent receives monthly account-based service fees based on the number of open accounts and also receives sub-transfer agency fees based on a percentage of the average aggregate value of the Fund's shares maintained in omnibus accounts (other than omnibus accounts for which American Enterprise Investment Services Inc. is the broker of record or accounts where the beneficial shareholder is a customer of Ameriprise Financial Services, Inc., which are paid a per account fee). The Transfer Agent pays the fees of BFDS for services as sub-transfer agent and is not entitled to reimbursement for such fees from the Fund (with the exception of out-of-pocket fees).
The Transfer Agent also receives compensation from fees for various shareholder services and reimbursements for certain out-of-pocket fees. Class I shares do not pay transfer agent fees. Total transfer agent fees for Class K and Class R5 shares are subject to an annual limitation of not more than 0.05% of the average daily net assets attributable to each share class. Beginning November 8, 2012, Class Y shares are not subject to transfer agent fees for at least twelve months.
For the year ended August 31, 2013, the Fund's effective transfer agent fee rates as a percentage of average daily net assets of each class were as follows:
Class A | | | 0.19 | % | |
Class B | | | 0.19 | | |
Class C | | | 0.19 | | |
Class K | | | 0.05 | | |
Class R | | | 0.19 | | |
Class R4 | | | 0.19 | * | |
Class R5 | | | 0.05 | * | |
Class T | | | 0.19 | | |
Class W | | | 0.19 | | |
Class Z | | | 0.19 | | |
*Annualized
An annual minimum account balance fee of $20 may apply to certain accounts with a value below the applicable share class' initial minimum investment requirements to reduce the impact of small accounts on transfer agent fees. These minimum account balance fees are recorded as part of expense
reductions in the Statement of Operations. For the Year Ended August 31, 2013, these minimum account balance fees reduced total expenses by $10,417.
Distribution and Service Fees
The Fund has an agreement with Columbia Management Investment Distributors, Inc. (the Distributor), an affiliate of the Investment Manager and a wholly-owned subsidiary of Ameriprise Financial, for distribution and shareholder services. Pursuant to Rule 12b-1 under the 1940 Act, the Board has approved, and the Fund has adopted, distribution and shareholder service plans (the Plans) which set the distribution and service fees for the Fund. These fees are calculated daily and are intended to compensate the Distributor and/or eligible selling and/or servicing agents for selling shares of the Fund and providing services to investors.
Under the Plans, the Fund pays a monthly service fee to the Distributor at the maximum annual rate of 0.25% of the average daily net assets attributable to Class A, Class B, Class C and Class W shares of the Fund. Also under the Plans, the Fund pays a monthly distribution fee to the Distributor at the maximum annual rates of 0.10%, 0.75%, 0.75%, 0.50% and 0.25% of the average daily net assets attributable to Class A, Class B, Class C, Class R and Class W shares, respectively.
The Fund may pay distribution and service fees up to a maximum annual rate of 0.35% of the Fund's average daily net assets attributable to Class A shares (comprised of up to 0.10% for distribution services and up to 0.25% for shareholder liaison services), but currently limit such fees to an aggregate fee of not more than 0.25% of the Fund's average daily net assets attributable to Class A shares.
The Fund may pay a distribution fee up to 0.25% of the Fund's average daily net assets attributable to Class W shares and a service fee of up to 0.25% of the Fund's average daily net assets attributable to Class W shares, provided, however, that the aggregate fee shall not exceed 0.25% of the Fund's average daily net assets attributable to Class W shares.
Shareholder Services Fees
The Fund has adopted a shareholder services plan that permits it to pay for certain services provided to Class T shareholders by their selling and/or servicing agents. The Fund may pay shareholder servicing fees up to an aggregate annual rate of 0.50% of the Fund's average daily net assets attributable to Class T shares (comprised of up to 0.25% for shareholder liaison services and up to 0.25% for administrative support services). These fees are currently limited to an aggregate annual rate of not more than 0.30% of the Fund's average daily net assets attributable to Class T shares. The annualized
Annual Report 2013
34
Columbia Contrarian Core Fund
Notes to Financial Statements (continued)
August 31, 2013
effective shareholder services fee rate for the year ended August 31, 2013 was 0.30% of the Fund's average daily net assets attributable to Class T shares.
Sales Charges
Sales charges, including front-end charges and CDSCs, received by the Distributor for distributing Fund shares were $1,263,126 for Class A, $6,679 for Class B, $7,372 for Class C and $10,288 for Class T shares for the year ended August 31, 2013.
Expenses Waived/Reimbursed by the Investment Manager and its Affiliates
The Investment Manager and certain of its affiliates have contractually agreed to waive fees and/or reimburse expenses (excluding certain fees and expenses described below) for the periods disclosed below, unless sooner terminated at the sole discretion of the Board, so that the Fund's net operating expenses, after giving effect to fees waived/expenses reimbursed and any balance credits and/or overdraft charges from the Fund's custodian, do not exceed the following annual rates as a percentage of the class' average daily net assets:
| | | February 1, 2013
through
December 31, 2013 | | Prior to
February 1, 2013 | |
Class A | | | 1.20 | % | | | 1.16 | % | |
Class B | | | 1.95 | | | | 1.91 | | |
Class C | | | 1.95 | | | | 1.91 | | |
Class I | | | 0.81 | | | | 0.78 | | |
Class K | | | 1.11 | | | | 1.08 | | |
Class R | | | 1.45 | | | | 1.41 | | |
Class R4 | | | 0.95 | | | | 0.91 | * | |
Class R5 | | | 0.86 | | | | 0.83 | * | |
Class T | | | 1.25 | | | | 1.21 | | |
Class W | | | 1.20 | | | | 1.16 | | |
Class Y | | | 0.81 | | | | 0.78 | * | |
Class Z | | | 0.95 | | | | 0.91 | | |
*Annual rate is contractual from November 8, 2012 (the commencement of operations of Class R4, Class R5 and Class Y shares) through January 31, 2013.
Under the agreement governing these fee waivers and/or expense reimbursement arrangements, the following fees and expenses are excluded from the waiver/reimbursement commitment, and therefore will be paid by the Fund, if applicable: taxes (including foreign transaction taxes), expenses associated with investments in affiliated and non-affiliated pooled investment vehicles (including mutual funds and exchange traded funds), transaction costs and brokerage commissions, costs related to any securities lending
program, dividend expenses associated with securities sold short, inverse floater program fees and expenses, transaction charges and interest on borrowed money, interest, extraordinary expenses and any other expenses the exclusion of which is specifically approved by the Board. This agreement may be modified or amended only with approval from all parties.
Note 4. Federal Tax Information
The timing and character of income and capital gain distributions are determined in accordance with income tax regulations, which may differ from GAAP because of temporary or permanent book to tax differences.
At August 31, 2013, these differences are primarily due to differing treatment for deferral/reversal of wash sales losses, Trustees' deferred compensation, re-characterization of distributions for investments, and foreign currency transactions. To the extent these differences are permanent, reclassifications are made among the components of the Fund's net assets in the Statement of Assets and Liabilities. Temporary differences do not require reclassifications. In the Statement of Assets and Liabilities the following reclassifications were made:
Undistributed net investment income | | $ | 4,158 | | |
Accumulated net realized loss | | | (4,158 | ) | |
Paid-in capital | | | — | | |
Net investment income and net realized gains (losses), as disclosed in the Statement of Operations, and net assets were not affected by this reclassification.
The tax character of distributions paid during the years indicated was as follows:
Year Ended August 31, | | 2013 | | 2012 | |
Ordinary income | | $ | 21,254,253 | | | $ | 10,813,142 | | |
Long-term capital gains | | | 1,772,686 | | | | 34,951,871 | | |
Total | | $ | 23,026,939 | | | $ | 45,765,013 | | |
Short-term capital gain distributions, if any, are considered ordinary income distributions for tax purposes.
At August 31, 2013, the components of distributable earnings on a tax basis were as follows:
Undistributed ordinary income | | $ | 63,872,947 | | |
Undistributed accumulated long-term gain | | | 104,029,435 | | |
Unrealized appreciation | | | 723,049,644 | | |
At August 31, 2013, the cost of investments for federal income tax purposes was $2,584,210,678 and the aggregate gross
Annual Report 2013
35
Columbia Contrarian Core Fund
Notes to Financial Statements (continued)
August 31, 2013
unrealized appreciation and depreciation based on that cost was:
Unrealized appreciation | | $ | 731,377,007 | | |
Unrealized depreciation | | | (8,327,363 | ) | |
Net unrealized appreciation/depreciation | | $ | 723,049,644 | | |
Management of the Fund has concluded that there are no significant uncertain tax positions that would require recognition in the financial statements. However, management's conclusion may be subject to review and adjustment at a later date based on factors including, but not limited to, new tax laws, regulations, and administrative interpretations (including relevant court decisions). Generally, the Fund's federal tax returns for the prior three fiscal years remain subject to examination by the Internal Revenue Service.
Note 5. Portfolio Information
The cost of purchases and proceeds from sales of securities, excluding short-term obligations, aggregated to $1,835,280,261 and $1,230,590,881, respectively, for the year ended August 31, 2013.
Note 6. Lending of Portfolio Securities
Effective December 19, 2012, the Fund no longer participates in securities lending activity. Prior to that date, the Fund participated, or was eligible to participate, in securities lending activity pursuant to a Master Securities Lending Agreement (the Agreement) with JPMorgan Chase Bank, N.A. (JPMorgan). The Agreement authorized JPMorgan as lending agent to lend securities to authorized borrowers in order to generate additional income on behalf of the Fund. Pursuant to the Agreement, the securities loaned were secured by cash or securities that either were issued or guaranteed as to principal and interest by the U.S. government, its agencies, authorities or instrumentalities with value equal to at least 100% of the market value of the loaned securities. Any additional collateral required to maintain those levels due to market fluctuations of the loaned securities was requested to be delivered the following business day. Cash collateral received was invested by the lending agent on behalf of the Fund into authorized investments pursuant to the Agreement.
Pursuant to the Agreement, the Fund received income for lending its securities either in the form of fees or by earning interest on invested cash collateral, net of negotiated rebates paid to borrowers and fees paid to the lending agent for services provided and any other securities lending expenses. Net income earned from securities lending for the year ended August 31, 2013 is disclosed in the Statement of Operations.
The Fund continued to earn and accrue interest and dividends on the securities loaned.
Note 7. Affiliated Money Market Fund
The Fund invests its daily cash balances in Columbia Short-Term Cash Fund, an affiliated money market fund established for the exclusive use by the Fund and other affiliated funds. The income earned by the Fund from such investments is included as "Dividends — affiliated issuers" in the Statement of Operations. As an investing fund, the Fund indirectly bears its proportionate share of the expenses of Columbia Short-Term Cash Fund.
Note 8. Shareholder Concentration
At August 31, 2013, one unaffiliated shareholder account owned an aggregate of 15.5% of the outstanding shares of the Fund. The Fund has no knowledge about whether any portion of those shares was owned beneficially by such accounts. Affiliated shareholder accounts owned 31% of the outstanding shares of the Fund. Subscription and redemption activity by concentrated accounts may have a significant effect on the operations of the Fund.
Note 9. Line of Credit
The Fund has entered into a revolving credit facility with a syndicate of banks led by JPMorgan whereby the Fund may borrow for the temporary funding of shareholder redemptions or for other temporary or emergency purposes. The credit facility agreement, as amended, which is a collective agreement between the Fund and certain other funds managed by the Investment Manager, severally and not jointly, permits collective borrowings up to $500 million. Interest is charged to each participating fund based on its borrowings at a rate equal to the higher of (i) the overnight federal funds rate plus 1.00% or (ii) the one-month LIBOR rate plus 1.00%. Each borrowing under the credit facility matures no later than 60 days after the date of borrowing. The Fund also pays a commitment fee equal to its pro rata share of the amount of the credit facility at a rate of 0.08% per annum. The commitment fee is included in other expenses in the Statement of Operations.
The Fund had no borrowings during the year ended August 31, 2013.
Note 10. Fund Merger
At the close of business on April 8, 2011, the Fund acquired the assets and assumed the identified liabilities of RiverSource Partners Fundamental Value Fund, a series of RiverSource Managers Series, Inc (the acquired fund). The reorganization was completed after shareholders of the acquired fund approved the plan on February 15, 2011. The purpose of the
Annual Report 2013
36
Columbia Contrarian Core Fund
Notes to Financial Statements (continued)
August 31, 2013
transaction was to combine two funds managed by the Investment Manager with comparable investment objectives and strategies.
The aggregate net assets of the Fund immediately before the acquisition were $900,258,998 and the combined net assets immediately after the acquisition were $1,453,637,468.
The merger was accomplished by a tax-free exchange of 105,198,809 shares of the acquired fund valued at $553,378,470 (including $147,202,771 of unrealized appreciation).
In exchange for the acquired fund's shares, the Fund issued the following number of shares:
| | | Shares | |
Class A | | | 20,212,114 | | |
Class B | | | 2,516,488 | | |
Class C | | | 617,699 | | |
Class I | | | 13,605,994 | | |
Class R4 | | | 7,740 | | |
For financial reporting purposes, net assets received and shares issued by the Fund were recorded at fair value; however, the acquired fund's cost of investments was carried forward.
The financial statements reflect the operations of the Fund for the period prior to the merger and the combined fund for the period subsequent to the merger. Because the combined investment portfolios have been managed as a single integrated portfolio since the merger was completed, it is not practicable to separate the amounts of revenue and earnings of the acquired fund that have been included in the combined Fund's Statement of Operations since the merger was completed.
Assuming the merger had been completed on October 1, 2010 the Fund's pro-forma net investment income, net gain on investments, net change in unrealized depreciation and net decrease in net assets from operations for the year ended September 30, 2011 would have been approximately $9.4 million, $110 million, $(170.1) million and $(50.7) million, respectively.
Note 11. Subsequent Events
Management has evaluated the events and transactions that have occurred through the date the financial statements were issued and noted no items requiring adjustment of the financial statements or additional disclosure.
Note 12. Information Regarding Pending and Settled Legal Proceedings
In December 2005, without admitting or denying the allegations, American Express Financial Corporation (AEFC, which is now known as Ameriprise Financial, Inc. (Ameriprise Financial)) entered into settlement agreements with the Securities and Exchange Commission (SEC) and Minnesota Department of Commerce (MDOC) related to market timing activities. As a result, AEFC was censured and ordered to cease and desist from committing or causing any violations of certain provisions of the Investment Advisers Act of 1940, the Investment Company Act of 1940, and various Minnesota laws. AEFC agreed to pay disgorgement of $10 million and civil money penalties of $7 million. AEFC also agreed to retain an independent distribution consultant to assist in developing a plan for distribution of all disgorgement and civil penalties ordered by the SEC in accordance with various undertakings detailed at www.sec.gov/litigation/admin/ia-2451.pdf. Ameriprise Financial and its affiliates have cooperated with the SEC and the MDOC in these legal proceedings, and have made regular reports to the funds' Boards of Trustees.
Ameriprise Financial and certain of its affiliates have historically been involved in a number of legal, arbitration and regulatory proceedings, including routine litigation, class actions, and governmental actions, concerning matters arising in connection with the conduct of their business activities. Ameriprise Financial believes that the Funds are not currently the subject of, and that neither Ameriprise Financial nor any of its affiliates are the subject of, any pending legal, arbitration or regulatory proceedings that are likely to have a material adverse effect on the Funds or the ability of Ameriprise Financial or its affiliates to perform under their contracts with the Funds. Ameriprise Financial is required to make 10-Q, 10-K and, as necessary, 8-K filings with the Securities and Exchange Commission on legal and regulatory matters that relate to Ameriprise Financial and its affiliates. Copies of these filings may be obtained by accessing the SEC website at www.sec.gov.
There can be no assurance that these matters, or the adverse publicity associated with them, will not result in increased fund redemptions, reduced sale of fund shares or other adverse consequences to the Funds. Further, although we believe proceedings are not likely to have a material adverse effect on the Funds or the ability of Ameriprise Financial or its affiliates to perform under their contracts with the Funds, these proceedings are subject to uncertainties and, as such, we are unable to estimate the possible loss or range of loss that may result. An adverse outcome in one or more of these proceedings could result in adverse judgments, settlements,
Annual Report 2013
37
Columbia Contrarian Core Fund
Notes to Financial Statements (continued)
August 31, 2013
fines, penalties or other relief that could have a material adverse effect on the consolidated financial condition or results of operations of Ameriprise Financial.
Annual Report 2013
38
Columbia Contrarian Core Fund
Report of Independent Registered Public Accounting Firm
To the Trustees of Columbia Funds Series Trust I and the Shareholders of
Columbia Contrarian Core Fund
In our opinion, the accompanying statement of assets and liabilities, including the portfolio of investments, and the related statements of operations and of changes in net assets and the financial highlights present fairly, in all material respects, the financial position of Columbia Contrarian Core Fund (the "Fund") (a series of Columbia Funds Series Trust I) at August 31, 2013, the results of its operations, the changes in its net assets and the financial highlights for the periods indicated, in conformity with accounting principles generally accepted in the United States of America. These financial statements and financial highlights (hereafter referred to as "financial statements") are the responsibility of the Fund's management. Our responsibility is to express an opinion on these financial statements based on our audits. We conducted our audits of these financial statements in accordance with the standards of the Public Company Accounting Oversight Board (United States). Those standards require that we plan and perform the audit to obtain reasonable assurance about whether the financial statements are free of material misstatement. An audit includes examining, on a test basis, evidence supporting the amounts and disclosures in the financial statements, assessing the accounting principles used and significant estimates made by management, and evaluating the overall financial statement presentation. We believe that our audits, which included confirmation of securities at August 31, 2013 by correspondence with the custodian, brokers and transfer agent, provide a reasonable basis for our opinion.
PricewaterhouseCoopers LLP
Minneapolis, Minnesota
October 22, 2013
Annual Report 2013
39
Columbia Contrarian Core Fund
Federal Income Tax Information
(Unaudited)
The Fund hereby designates the following tax attributes for the fiscal year ended August 31, 2013. Shareholders will be notified in early 2014 of the amounts for use in preparing 2013 income tax returns.
Tax Designations:
| Qualified Dividend Income | | | 83.48 | % | |
| Dividends Received Deduction | | | 80.28 | % | |
Capital Gain Dividend | | $ | 111,092,227 | | |
Qualified Dividend Income. For taxable, non-corporate shareholders, the percentage of ordinary income dividends paid during the fiscal year that represents qualified dividend income subject to reduced tax rates.
Dividends Received Deduction. The percentage of ordinary income dividends paid during the fiscal year that qualifies for the corporate dividends received deduction.
Capital Gain Dividend. The Fund designates as a capital gain dividend the amount reflected above, or if subsequently determined to be different, the net capital gain of such fiscal period. The Fund also designates as capital gain dividends, to the extent necessary to fully distribute such capital gains, earnings and profits distributed to shareholders on the redemption of shares.
Annual Report 2013
40
Columbia Contrarian Core Fund
The Trustees serve terms of indefinite duration. The names, addresses and birth years of the Trustees and Officers of the Funds in Columbia Funds Series Trust I, the year each was first elected or appointed to office, their principal business occupations during at least the last five years, the number of Funds overseen by each Trustee and other directorships they hold are shown below. Each officer listed below serves as an officer of each Fund in Columbia Funds Series Trust I.
Independent Trustees
Name, Address and Year of Birth,
Position with Funds, Year First
Elected or Appointed to Office | | Principal Occupation(s) During Past Five Years, Number of Funds in Columbia
Funds Complex Overseen by Trustee, Other Directorships Held | |
Rodman L. Drake (Born 1943)
c/o Columbia Management
Investment Advisers, LLC
225 Franklin Street
Boston, MA 02110
Trustee (since 1994) and
Chairman of the Board (since 2009) | | Independent consultant since 2010; Co-Founder of Baringo Capital LLC (private equity) from 1997 to 2008; Chairman (from 2003 to 2010) and CEO (from 2008 to 2010) of Crystal River Capital, Inc. (real estate investment trust); Oversees 52; Jackson Hewitt Tax Service Inc. (tax preparation services) from 2004 to 2011; Student Loan Corporation (student loan provider) from 2005 to 2010; Celgene Corporation (global biotechnology company); The Helios Funds and Brookfield Funds (closed-end funds); Chimerix, Inc. (biopharmaceutical company) since August 1, 2013; Crystal River Capital, Inc. from 2005 to 2010; Parsons Brinckerhoff from 1995 to 2008; and Apex Silver Mines Ltd. from 2007 to 2009 | |
Douglas A. Hacker (Born 1955)
c/o Columbia Management
Investment Advisers, LLC
225 Franklin Street
Boston, MA 02110
Trustee (since 1996) | | Independent business executive since May 2006; Executive Vice President — Strategy of United Airlines from December 2002 to May 2006; President of UAL Loyalty Services (airline marketing company) from September 2001 to December 2002; Executive Vice President and Chief Financial Officer of United Airlines from July 1999 to September 2001. Oversees 52; Nash Finch Company (food distributor); Aircastle Limited (aircraft leasing); and SeaCube Container Leasing Ltd. (container leasing) | |
Janet Langford Kelly (Born 1957)
c/o Columbia Management
Investment Advisers, LLC
225 Franklin Street
Boston, MA 02110
Trustee (since 1996) | | Senior Vice President, General Counsel and Corporate Secretary, ConocoPhillips (integrated energy company) since September 2007; Deputy General Counsel — Corporate Legal Services, ConocoPhillips from August 2006 to August 2007; Partner, Zelle, Hofmann, Voelbel, Mason & Gette LLP (law firm) from March 2005 to July 2006; Adjunct Professor of Law, Northwestern University from September 2004 to June 2006; Director, UAL Corporation (airline) from February 2006 to July 2006; Chief Administrative Officer and Senior Vice President, Kmart Holding Corporation (consumer goods) from September 2003 to March 2004. Oversees 52; None | |
Nancy T. Lukitsh (Born 1956)
c/o Columbia Management
Investment Advisers, LLC
225 Franklin Street
Boston, MA 02110
Trustee (since 2011) | | Senior Vice President, Partner and Director of Marketing, Wellington Management Company, LLP (investment adviser) from 1997 to 2010; Chair, Wellington Management Investment Portfolios (commingled non-U.S. investment pools) from 2007 to 2010; Director, Wellington Trust Company, NA and other Wellington affiliates from 1997 to 2010. Oversees 52; None | |
William E. Mayer (Born 1940)
c/o Columbia Management
Investment Advisers, LLC
225 Franklin Street
Boston, MA 02110
Trustee (since 1994) | | Partner, Park Avenue Equity Partners (private equity) since February 1999; Dean and Professor, College of Business and Management, University of Maryland from 1992 to 1996. Oversees 52; DynaVox Inc. (speech creation); Lee Enterprises (print media); WR Hambrecht + Co. (financial service provider) from 2000 to 2012; BlackRock Kelso Capital Corporation (investment company) | |
David M. Moffett (Born 1952)
c/o Columbia Management
Investment Advisers, LLC
225 Franklin Street
Boston, MA 02110
Trustee (since 2011) | | Retired. Chief Executive Officer, Federal Home Loan Mortgage Corporation, from 2008 to 2009; Senior Adviser, Global Financial Services Group, Carlyle Group, Inc., from 2007 to 2008; Vice Chairman and Chief Financial Officer, U.S. Bancorp, from 1993 to 2007. Oversees 52; CIT Group Inc. (commercial and consumer finance); eBay Inc. (online trading community); MBIA Inc. (financial service provider); E.W. Scripps Co. (print and television media), Building Materials Holding Corp. (building materials and construction services); Genworth Financial, Inc. (financial and insurance products and services); and University of Oklahoma Foundation | |
Charles R. Nelson (Born 1942)
c/o Columbia Management
Investment Advisers, LLC
225 Franklin Street
Boston, MA 02110
Trustee (since 1981) | | Retired. Professor Emeritus, University of Washington, since 2011; Professor of Economics, University of Washington from 1976 to 2011; Ford and Louisa Van Voorhis Professor of Political Economy, University of Washington from 1993 to 2011; Adjunct Professor of Statistics, University of Washington from 1980 to 2011; Associate Editor, Journal of Money, Credit and Banking from September 1993 to 2008; consultant on econometric and statistical matters. Oversees 52; None | |
John J. Neuhauser (Born 1943)
c/o Columbia Management
Investment Advisers, LLC
225 Franklin Street
Boston, MA 02110
Trustee (since 1984) | | President, Saint Michael's College, since August 2007; Director or Trustee of several non-profit organizations, including Fletcher Allen Health Care, Inc.; University Professor, Boston College from November 2005 to August 2007; Academic Vice President and Dean of Faculties, Boston College from August 1999 to October 2005. Oversees 52; Liberty All-Star Equity Fund and Liberty All-Star Growth Fund (closed-end funds) | |
Annual Report 2013
41
Columbia Contrarian Core Fund
Trustees and Officers (continued)
Independent Trustees (continued)
Name, Address and Year of Birth,
Position with Funds, Year First
Elected or Appointed to Office | | Principal Occupation(s) During Past Five Years, Number of Funds in Columbia
Funds Complex Overseen by Trustee, Other Directorships Held | |
Patrick J. Simpson (Born 1944)
c/o Columbia Management
Investment Advisers, LLC
225 Franklin Street
Boston, MA 02110
Trustee (since 2000) | | Partner, Perkins Coie LLP (law firm). Oversees 52; None | |
Anne-Lee Verville (Born 1945)
c/o Columbia Management
Investment Advisers, LLC
225 Franklin Street
Boston, MA 02110
Trustee (since 1998) | | Retired. General Manager — Global Education Industry from 1994 to 1997, President — Application Systems Division from 1991 to 1994, Chief Financial Officer — US Marketing & Services from 1988 to 1991, and Chief Information Officer from 1987 to 1988, IBM Corporation (computer and technology). Oversees 52; Enesco Group, Inc. (producer of giftware and home and garden decor products) from 2001 to 2006 | |
Interested Trustee
Name, Address and Year of Birth,
Position with Funds, Year First
Elected or Appointed to Office | | Principal Occupation(s) During Past Five Years, Number of Funds in Columbia
Funds Complex Overseen by Trustee, Other Directorships Held | |
William F. Truscott (born 1960)
53600 Ameriprise Financial Center
Minneapolis, MN 55474
Senior Vice President (since 2012) | | Chairman of the Board and President, Columbia Management Investment Advisers, LLC since May 2010 and February 2012 (previously President and Chief Investment Officer, from 2001 to April 2010); Chief Executive Officer, Global Asset Management, Ameriprise Financial, Inc. since September 2012 (previously, Chief Executive Officer, U.S. Asset Management & President, Annuities, from May 2010 to September 2012 and President — U.S. Asset Management and Chief Investment Officer from 2005 to April 2010); Director and Chief Executive Officer, Columbia Management Investment Distributors, Inc. since May 2010 and February 2012, respectively (previously Chairman of the Board and Chief Executive Officer from 2006 to April 2010); Chairman of the Board and Chief Executive Officer, RiverSource Distributors, Inc. since 2006; President and Chief Executive Officer, Ameriprise Certificate Company, 2006 to August 2012; Oversees 184; Director, Ameriprise Certificate Company, 2006-January 2013 | |
The Statement of Additional Information includes additional information about the Trustees of the Funds and is available, without charge, upon request by calling 800.345.6611.
The Board has appointed officers who are responsible for day-to-day business decisions based on policies it has established. The officers serve at the pleasure of the Board. In addition to Mr. Truscott, who is Senior Vice President, the Funds' other officers are:
Officers
Name, Year of Birth and Address | | Principal Occupation(s) During the Past Five Years | |
J. Kevin Connaughton (Born 1964)
225 Franklin Street
Boston, MA 02110
President (since 2009) | | Senior Vice President and General Manager — Mutual Fund Products, Columbia Management Investment Advisers, LLC since May 2010; President, Columbia Funds since 2009 and RiverSource Funds since May 2010; Managing Director, Columbia Management Advisors, LLC, December 2004-April 2010; Senior Vice President and Chief Financial Officer, Columbia Funds, June 2008-January 2009; Treasurer, Columbia Funds, October 2003-May 2008; and senior officer of various other affiliated funds since 2000 | |
Amy Johnson (Born 1965)
5228 Ameriprise Financial Center
Minneapolis, MN 55474
Vice President (since 2010) | | Senior Vice President and Chief Operating Officer, Columbia Management Investment Advisers, LLC since May 2010 (previously Chief Administrative Officer, from 2009-April 2010, Vice President — Asset Management and Trust Company Services, from 2006-2009) | |
Michael G. Clarke (Born 1969)
225 Franklin Street
Boston, MA 02110
Treasurer (since 2011) and Chief
Financial Officer (since 2009) | | Vice President, Columbia Management Investment Advisers, LLC since May 2010; Managing Director of Fund Administration, Columbia Management Advisors, LLC, September 2004-April 2010; senior officer of Columbia Funds and affiliated funds since 2002 | |
Annual Report 2013
42
Columbia Contrarian Core Fund
Trustees and Officers (continued)
Officers (continued)
Name, Year of Birth and Address | | Principal Occupation(s) During the Past Five Years | |
Scott R. Plummer (Born 1959)
5228 Ameriprise Financial Center
Minneapolis, MN 55474
Senior Vice President, Assistant
Secretary and Chief Legal Officer
(since 2010) | | Senior Vice President, Chief Legal Officer and Assistant Secretary, Columbia Management Investment Advisers, LLC since June 2005; Senior Vice President and Lead Chief Counsel — Asset Management, Ameriprise Financial, Inc. since May 2010 (previously Vice President and Chief Counsel — Asset Management, 2005-April 2010); Vice President, Chief Counsel and Assistant Secretary, Columbia Management Investment Distributors, Inc. since 2008; Vice President, General Counsel and Secretary, Ameriprise Certificate Company since 2005; Chief Counsel, RiverSource Distributors, Inc. since 2006; senior officer of Columbia Funds and affiliated funds since 2010 | |
Colin Moore (Born 1958)
225 Franklin Street
Boston, MA 02110
Senior Vice President (since 2010) | | Executive Vice President and Global Chief Investment Officer, Ameriprise Financial, Inc. since July 2013; Director and Global Chief Investment Officer, Columbia Management Investment Advisers, LLC since May 2010; Manager, Managing Director and Chief Investment Officer of Columbia Management Advisors, LLC, 2007-April 2010 | |
Thomas P. McGuire (Born 1972)
225 Franklin Street
Boston, MA 02110
Chief Compliance Officer
(since 2012) | | Vice President — Asset Management Compliance, Columbia Management Investment Advisers, LLC since 2010; Chief Compliance Officer, Ameriprise Certificate Company, since September 2010; Compliance Executive, Bank of America, N.A. 2005-2010 | |
Stephen T. Welsh (born 1957)
225 Franklin Street
Boston, MA 02110
Vice President (since 2006) | | President and Director, Columbia Management Investment Services Corp. since May 2010; President and Director, Columbia Management Services, Inc., July 2004-April 2010; Managing Director, Columbia Management Distributors, Inc., August 2007-April 2010 | |
Christopher O. Petersen (born 1970)
5228 Ameriprise Financial Center
Minneapolis, MN 55474
Vice President (since 2010) and
Secretary (since 2011) | | Vice President and Chief Counsel, Ameriprise Financial, Inc. since January 2010 (formerly Vice President and Group Counsel or Counsel, April 2004-January 2010); Assistant Secretary of Columbia Funds, January 2007-April 2011 | |
Paul D. Pearson (born 1956)
10468 Ameriprise Financial Center
Minneapolis, MN 55474
Vice President and Assistant
Treasurer (since 2011) | | Vice President, Investment Accounting, Columbia Management Investment Advisers, LLC, since May 2010; Vice President — Managed Assets, Investment Accounting, Ameriprise Financial, Inc., February 1998-May 2010 | |
Joseph F. DiMaria (Born 1968)
225 Franklin Street
Boston, MA 02110
Vice President (since 2011) and
Chief Accounting Officer (since 2008) | | Vice President, Mutual Fund Administration, Columbia Management Investment Advisers, LLC, since May 2010; Director of Fund Administration, Columbia Management Advisors, LLC, January 2006-April 2010 | |
Paul B. Goucher (born 1968)
100 Park Avenue
New York, NY 10017
Vice President and Assistant
Secretary (since 2010) | | Vice President and Lead Chief Counsel, Ameriprise Financial, Inc. since November 2008 and January 2013, respectively (formerly, Chief Counsel from January 2010-January 2013 and Group Counsel from November 2008-January 2010); Director, Managing Director and General Counsel, J. & W. Seligman & Co. Incorporated, July 2008-November 2008 (previously, Managing Director and Associate General Counsel, January 2005-July 2008) | |
Michael E. DeFao (born 1968)
225 Franklin Street
Boston, MA 02110
Vice President and Assistant
Secretary (since 2011) | | Vice President and Chief Counsel, Ameriprise Financial, Inc. since May 2010; Associate General Counsel, Bank of America, N.A. June 2005-April 2010 | |
Annual Report 2013
43
Columbia Contrarian Core Fund
Board Consideration and Approval of Advisory Agreement
On June 14, 2013, the Board of Trustees (the "Board") and the Trustees who are not interested persons (as defined in the Investment Company Act of 1940) of the Trust (the "Independent Trustees") unanimously approved the continuation of the Investment Management Services Agreement (the "Advisory Agreement") with Columbia Management Investment Advisers, LLC (the "Investment Manager") with respect to Columbia Contrarian Core Fund (the "Fund"), a series of the Trust. As detailed below, the Advisory Fees and Expenses Committee (the "Committee") and the Board met on multiple occasions to review and discuss, both among themselves and with the management team of the Investment Manager, materials provided by the Investment Manager before determining to approve the continuation of the Advisory Agreement.
In connection with their deliberations regarding the continuation of the Advisory Agreement, the Committee and the Board evaluated materials requested from the Investment Manager regarding the Fund and the Advisory Agreement, and discussed these materials with representatives of the Investment Manager at Committee meetings held on March 5, 2013, April 24, 2013 and June 13, 2013, and at the Board meeting held on June 14, 2013. In addition, the Board considers matters bearing on the Advisory Agreement at most of its other meetings throughout the year and meets regularly with senior management of the Funds and the Investment Manager. Through the Board's Investment Oversight Committees, Trustees also meet with selected Fund portfolio managers and other investment personnel at various times throughout the year. The Committee and the Board also consulted with Fund counsel and with the Independent Trustees' independent legal counsel, who advised on various matters with respect to the Committee's and the Board's considerations and otherwise assisted the Committee and the Board in their deliberations. On June 13, 2013, the Committee recommended that the Board approve the continuation of the Advisory Agreement. On June 14, 2013, the Board, including the Independent Trustees, voting separately, unanimously approved the continuation of the Advisory Agreement for the Fund.
The Committee and the Board considered all information that they, their legal counsel, or the Investment Manager believed reasonably necessary to evaluate and to determine whether to approve the continuation of the Advisory Agreement. The information and factors considered by the Committee and the Board in recommending for approval or approving the continuation of the Advisory Agreement for the Fund included the following:
• Information on the investment performance of the Fund relative to the performance of a group of mutual funds determined to be comparable to the Fund by an independent third-party data provider, as well as performance relative to benchmarks;
• Information on the Fund's advisory fees and total expenses, including information comparing the Fund's expenses to those of a group of comparable mutual funds, as determined by the independent third-party data provider;
• The Investment Manager's agreement to contractually limit or cap total operating expenses for the Fund so that total operating expenses (excluding certain fees and expenses, such as transaction costs and certain other investment related expenses, interest, taxes, acquired fund fees and expenses, and extraordinary expenses) would not exceed the median expenses of a group of comparable funds (as determined from time to time, generally annually, by the independent third-party data provider);
• The terms and conditions of the Advisory Agreement;
• The terms and conditions of other agreements and arrangements with affiliates of the Investment Manager relating to the operations of the Fund, including the Administrative Services Agreement, the Distribution Agreement and the Transfer and Dividend Disbursing Agent Agreement;
• Descriptions of various functions performed by the Investment Manager under the Advisory Agreement, including portfolio management and portfolio trading practices;
• Information regarding the management fees and investment performance of comparable portfolios of other clients of the Investment Manager, including institutional separate accounts;
• Information regarding the reputation, regulatory history and resources of the Investment Manager, including information regarding senior management, portfolio managers and other personnel;
• Information regarding the capabilities of the Investment Manager with respect to compliance monitoring services, including an assessment of the Investment Manager's compliance system by the Fund's Chief Compliance Officer; and
• The profitability to the Investment Manager and its affiliates from their relationships with the Fund.
Annual Report 2013
44
Columbia Contrarian Core Fund
Board Consideration and Approval of Advisory Agreement (continued)
Nature, Extent and Quality of Services Provided under the Advisory Agreement
The Committee and the Board considered the nature, extent and quality of services provided to the Fund by the Investment Manager and its affiliates under the Advisory Agreement and under separate agreements for the provision of transfer agency and administrative services, and the resources dedicated to the Fund and the other Columbia Funds by the Investment Manager and its affiliates. The Committee and the Board considered, among other things, the Investment Manager's ability to attract, motivate and retain highly qualified research, advisory and supervisory investment professionals (including personnel and other resources, compensation programs for personnel involved in fund management, reputation and other attributes), the portfolio management services provided by those investment professionals, and the quality of the Investment Manager's investment research capabilities and trade execution services. The Committee and the Board also considered the potential benefits to shareholders of investing in a mutual fund that is part of a fund complex offering exposure to a variety of asset classes and investment disciplines and providing a variety of fund and shareholder services.
The Committee and the Board also considered the professional experience and qualifications of the senior personnel of the Investment Manager, which included consideration of the Investment Manager's experience with similarly-structured funds. The Committee and the Board noted the compliance programs of and the compliance-related resources provided to the Fund by the Investment Manager and its affiliates, and considered the Investment Manager's ability to provide administrative services to the Fund pursuant to a separate Administrative Services Agreement, including the Investment Manager's ability to coordinate the activities of the Fund's other service providers. After reviewing these and related factors, the Committee and the Board concluded, within the context of their overall conclusions, that the nature, extent and quality of the services provided to the Fund under the Advisory Agreement supported the continuation of the Advisory Agreement.
Investment Performance
The Committee and the Board reviewed information about the performance of the Fund over various time periods, including performance information relative to benchmarks and information based on reports of the independent third-party data provider that compared the performance of the Fund to the performance of a group of comparable mutual funds. The Committee and the Board also reviewed a description of the third party's methodology for identifying the Fund's peer groups for purposes of performance and expense comparisons.
The Committee and the Board noted that, through December 31, 2012, the Fund's performance was in the 12th, 18th and 6th percentile (where the best performance would be in the first percentile) of its category selected by the independent third-party data provider for the purposes of performance comparisons for the one-, three- and five- year periods, respectively.
The Committee and the Board also considered the Investment Manager's performance and reputation generally, the Investment Manager's historical responsiveness to Board concerns about performance, and the Investment Manager's willingness to take steps intended to improve performance. After reviewing these and related factors, the Committee and the Board concluded, within the context of their overall conclusions, that the performance of the Fund supported the continuation of the Advisory Agreement.
Investment Advisory Fee Rates and Other Expenses
The Committee and the Board considered the advisory fees charged to the Fund under the Advisory Agreement as well as the total expenses incurred by the Fund. In assessing the reasonableness of the fees under the Advisory Agreement, the Committee and the Board considered, among other information, the Fund's advisory fee and its total expense ratio as a percentage of average daily net assets. The Committee and the Board noted that the Fund's actual management fee and net expense ratio are ranked in the 4th and 3rd quintiles, respectively, (where the lowest fees and expenses would be in the first quintile) against the Fund's expense universe as determined by the independent third-party data provider for purposes of expense comparison. The Committee and the Board also took into account the fee waiver and expense limitation arrangements agreed to by the Investment Manager, as noted above.
The Committee and the Board also received and considered information about the advisory fees charged by the Investment Manager to institutional separate accounts. In considering the fees charged to those accounts, the Committee and the Board took into account, among other things, the Investment Manager's representations about the differences between managing mutual funds as compared to other types of accounts, including differences in the services provided, differences in the risk profile of such business for the Investment Manager and the additional resources required to manage mutual funds
Annual Report 2013
45
Columbia Contrarian Core Fund
Board Consideration and Approval of Advisory Agreement (continued)
effectively. In evaluating the Fund's advisory fees, the Committee and the Board also took into account the demands, complexity and quality of the investment management of the Fund.
After reviewing these and related factors, the Committee and the Board concluded, within the context of their overall conclusions, that the advisory fee rates and expenses of the Fund supported the continuation of the Advisory Agreement.
Costs of Services Provided and Profitability
The Committee and the Board also took note of the costs of the services provided (both on an absolute and relative basis) and the profitability to the Investment Manager and its affiliates in connection with their relationships with the Fund. In evaluating these considerations, the Committee and the Board took note of the advisory fees charged by the Investment Manager to other clients, including fees charged by the Investment Manager to institutional separate account clients with similar investment strategies to those of the Fund.
The Committee and the Board also considered the compensation directly or indirectly received by the Investment Manager's affiliates in connection with their relationships with the Fund. The Committee and the Board reviewed information provided by management as to the profitability of the Investment Manager and its affiliates of their relationships with the Fund, information about the allocation of expenses used to calculate profitability, and comparisons of profitability levels realized in 2012 to profitability levels realized in 2011. When reviewing profitability, the Committee and the Board also considered court cases in which adviser profitability was an issue in whole or in part, the performance of the Fund, the expense ratio of the Fund, and the implementation of expense limitations with respect to the Fund. The Committee and the Board also considered information provided by the Investment Manager regarding its financial condition and comparing its profitability to that of other asset management firms that are, or are subsidiaries of, publicly traded companies.
After reviewing these and related factors, the Committee and the Board concluded, within the context of their overall conclusions, that the costs of services provided and the profitability to the Investment Manager and its affiliates from their relationships with the Fund supported the continuation of the Advisory Agreement.
Economies of Scale
The Committee and the Board considered the potential existence of economies of scale in the provision by the Investment Manager of services to the Fund, to groups of related funds, and to the Investment Manager's investment advisory clients as a whole, and whether those economies of scale were shared with the Fund through breakpoints in investment advisory fees or other means, such as expense limitation arrangements and additional investments by the Investment Manager in investment, trading and compliance resources. The Committee and the Board noted that the investment advisory fee schedules for the Fund contained breakpoints that would reduce the fee rate on assets above specified threshold levels.
In considering these matters, the Committee and the Board also considered the costs of the services provided and the profitability to the Investment Manager and its affiliates from their relationships with the Fund, as discussed above. After reviewing these and related factors, the Committee and the Board concluded, within the context of their overall conclusions, that the extent to which any economies of scale were expected to be shared with the Fund supported the continuation of the Advisory Agreement.
Other Benefits to the Investment Manager
The Committee and the Board received and considered information regarding "fall-out" or ancillary benefits received by the Investment Manager and its affiliates as a result of their relationships with the Fund, such as the engagement of the Investment Manager to provide administrative services to the Fund and the engagement of the Investment Manager's affiliates to provide distribution and transfer agency services to the Fund. The Committee and the Board considered that the Fund's distributor retains a portion of the distribution fees from the Fund. The Committee and the Board also considered the benefits of research made available to the Investment Manager by reason of brokerage commissions generated by the Fund's securities transactions, and reviewed information about the Investment Manager's practices with respect to allocating portfolio transactions for brokerage and research services. The Committee and the Board considered the possible conflicts of interest associated with certain fall-out or other ancillary benefits and the reporting, disclosure and other processes that are in place to address such possible conflicts of interest. The Committee and the Board recognized that the Investment Manager's profitability would be somewhat lower without these benefits.
Annual Report 2013
46
Columbia Contrarian Core Fund
Board Consideration and Approval of Advisory Agreement (continued)
Conclusion
The Committee and the Board reviewed all of the above considerations in reaching their decisions to recommend or approve the continuation of the Advisory Agreement. In their deliberations, the Trustees did not identify any particular information that was all-important or controlling, and individual Trustees may have attributed different weights to the various factors. Based on their evaluation of all factors that they deemed to be material, including those factors described above, and assisted by the advice of independent legal counsel, the Board, including the Independent Trustees, voting separately, unanimously approved the continuation of the Advisory Agreement.
Annual Report 2013
47
This page intentionally left blank.
Annual Report 2013
48
Columbia Contrarian Core Fund
Important Information About This Report
Each fund mails one shareholder report to each shareholder address. If you would like more than one report, please call shareholder services at 800.345.6611 and additional reports will be sent to you.
The policy of the Board is to vote the proxies of the companies in which each fund holds investments consistent with the procedures as stated in the Statement of Additional Information (SAI). You may obtain a copy of the SAI without charge by calling 800.345.6611; contacting your financial intermediary; visiting columbiamanagement.com; or searching the website of the Securities and Exchange Commission (SEC) at sec.gov. Information regarding how each fund voted proxies relating to portfolio securities is filed with the SEC by August 31 for the most recent 12-month period ending June 30 of that year, and is available without charge by visiting columbiamanagement.com; or searching the website of the SEC at sec.gov.
Each fund files a complete schedule of portfolio holdings with the SEC for the first and third quarters of each fiscal year on Form N-Q. Each fund's Form N-Q is available on the SEC's website at sec.gov and may be reviewed and copied at the SEC's Public Reference Room in Washington, D.C. Information on the operation of the Public Reference Room may be obtained by calling 800.SEC.0330. Each fund's complete schedule of portfolio holdings, as filed on Form N-Q, can also be obtained without charge, upon request, by calling 800.345.6611.
Annual Report 2013
49

Columbia Contrarian Core Fund
P.O. Box 8081
Boston, MA 02266-8081
columbiamanagement.com
This information is for use with concurrent or prior delivery of a fund prospectus. Please read and consider the investment objectives, risks, charges and expenses for any fund carefully before investing. For a prospectus which contains this and other important information about the Fund go to columbiamanagement.com. The Fund is distributed by Columbia Management Investment Distributors, Inc., member FINRA, and managed by Columbia Management Investment Advisers, LLC.
© 2013 Columbia Management Investment Advisers, LLC. All rights reserved.
ANN133_08_C01_(10/13)
| | |
Annual Report August 31, 2013 | |  |
| | |
Active Portfolios® Multi-Manager Alternative Strategies Fund | | |

President’s Message

Dear Shareholders,
A return to volatility
Volatility returned to the financial markets in the second quarter of 2013, as uncertainty about the global economy, monetary policy and the impact of the sequester’s spending cuts weighed on investors. Households advanced their spending but also allocated less to savings. Labor markets continued to crank out jobs at a steady pace, slowly reducing unemployment. Housing activity remained strong and retail sales were higher despite no real increase in income. The single weak spot was in the manufacturing sector, where activity slowed. While the consumer has weathered the domestic drag well, business has been closer to the global slowdown and effects of sequestration. Businesses remain very cautious, keeping inventories and staffs lean, and are planning for but not yet confident enough to make capital expenditures.
Against this backdrop, equities outperformed fixed income during the second quarter of 2013. Small-cap stocks outperformed large- and mid-cap stocks, and growth outperformed value except for in the large-cap sector. Outside the United States, foreign stock markets generally lost ground, with the most significant losses sustained by emerging markets.
Columbia Management to begin delivering summary prospectuses
Each Columbia fund is required to update its prospectus on an annual basis. Beginning with June 2013 prospectus updates, shareholders of Columbia retail mutual funds will start to receive a summary prospectus, rather than the full length (statutory) mutual fund prospectus they have received in the past.
Each fund’s summary prospectus will include the following key information:
| > | | Portfolio turnover rate information |
| > | | Principal investment strategies, principal risks and performance information |
| > | | Purchase and sale information |
| > | | Financial intermediary compensation information |
Each fund’s statutory prospectus will contain additional information about the fund and its risks. Both the statutory and summary prospectus will be updated each year, and will be available at columbiamanagement.com. Shareholders may request a printed version of a statutory prospectus at no cost by calling 800.345.6611 or sending an email to serviceinquiries@columbiamanagement.com.
Stay on track with Columbia Management
Backed by more than 100 years of experience, Columbia Management is one of the nation’s largest asset managers. At the heart of our success — and, most importantly, that of our investors — are highly talented industry professionals, brought together by a unique way of working. We are dedicated to helping you take advantage of today’s opportunities and anticipate tomorrow’s. We stay abreast of the latest investment trends and ideas, using our collective insight to evaluate events and transform them into solutions you can use.
Visit columbiamanagement.com for:
| > | | The Columbia Management Perspectives blog, featuring timely posts by our investment teams |
| > | | Detailed up-to-date fund performance and portfolio information |
| > | | Economic analysis and market commentary |
| > | | Quarterly fund commentaries |
| > | | Columbia Management Investor, our award-winning quarterly newsletter for shareholders |
Thank you for your continued support of the Columbia Funds. We look forward to serving your investment needs for many years to come.
Best Regards,

J. Kevin Connaughton
President, Columbia Funds
Investors should consider the investment objectives, risks, charges and expenses of a mutual fund carefully before investing. For a free prospectus, which contains this and other important information about a fund, visit columbiamanagement.com. The prospectus should be read carefully before investing.
Columbia Funds are distributed by Columbia Management Investment Distributors, Inc., member FINRA, and managed by Columbia Management Investment Advisers, LLC.
© 2013 Columbia Management Investment Advisers, LLC. All rights reserved.
Annual Report 2013
| | |
| |
| Active Portfolios® Multi-Manager Alternative Strategies Fund | | |
Table of Contents
Fund Investment Manager
Columbia Management Investment
Advisers, LLC
225 Franklin Street
Boston, MA 02110
Fund Distributor
Columbia Management Investment
Distributors, Inc.
225 Franklin Street
Boston, MA 02110
Fund Transfer Agent
Columbia Management Investment
Services Corp.
P.O. Box 8081
Boston, MA 02266-8081
For more information about any of the funds, please visit columbiamanagement.com or call 800.345.6611. Customer Service Representatives are available to answer your questions Monday through Friday from 8 a.m. to 8 p.m. Eastern time.
The views expressed in this report reflect the current views of the respective parties. These views are not guarantees of future performance and involve certain risks, uncertainties and assumptions that are difficult to predict, so actual outcomes and results may differ significantly from the views expressed. These views are subject to change at any time based upon economic, market or other conditions and the respective parties disclaim any responsibility to update such views. These views may not be relied on as investment advice and, because investment decisions for a Columbia Fund are based on numerous factors, may not be relied on as an indication of trading intent on behalf of any particular Columbia Fund. References to specific securities should not be construed as a recommendation or investment advice.
Annual Report 2013
| | |
| |
| | Active Portfolios® Multi-Manager Alternative Strategies Fund |
Performance Overview
Performance Summary
| > | | Active Portfolios® Multi-Manager Alternative Strategies Fund (the Fund) Class A shares returned 5.53% for the 12-month period that ended August 31, 2013. |
| > | | The Fund outperformed its benchmark, the Citigroup 3-Month U.S. Treasury Bill Index, which returned 0.07% over the same period. |
| > | | The Fund’s outperformance can be attributed primarily to effective implementation of various alternative strategies. |
| | | | | | | | | | |
Average Annual Total Returns (%) (for period ended August 31, 2013) | |
| | | Inception | | 1 Year | | | Life | |
Class A | | 04/23/12 | | | 5.53 | | | | 4.28 | |
Citigroup 3-Month U.S. Treasury Bill Index | | | | | 0.07 | | | | 0.07 | |
All results shown assume reinvestment of distributions during the period. Returns do not reflect the deduction of taxes that a shareholder may pay on Fund distributions or on the redemption of Fund shares. Performance results reflect the effect of any fee waivers or reimbursements of Fund expenses by Columbia Management Investment Advisers, LLC and/or any of its affiliates. Absent these fee waivers or expense reimbursement arrangements, performance results would have been lower.
The performance information shown represents past performance and is not a guarantee of future results. The investment return and principal value of your investment will fluctuate so that your shares, when redeemed, may be worth more or less than their original cost. Current performance may be lower or higher than the performance information shown. You may obtain performance information current to the most recent month-end by contacting your financial intermediary, visiting columbiamanagement.com or calling 800.345.6611.
The Citigroup 3-Month U.S. Treasury Bill Index, an unmanaged index, is representative of the performance of three-month Treasury bills.
Indices are not available for investment, are not professionally managed and do not reflect sales charges, fees, brokerage commissions, taxes or other expenses of investing. Securities in the Fund may not match those in an index.
| | |
| |
| Active Portfolios® Multi-Manager Alternative Strategies Fund | | |
Performance Overview (continued)
|
Performance of a Hypothetical $10,000 Investment (April 23, 2012 — August 31, 2013) |
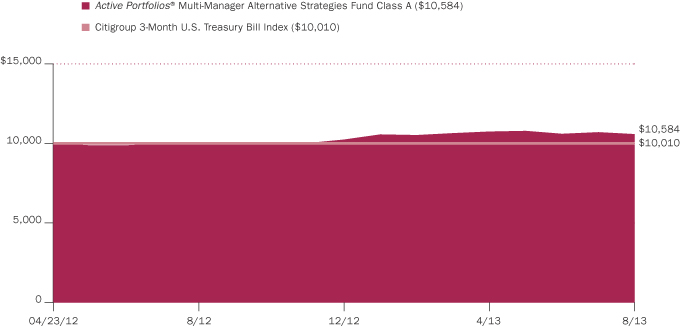
The chart above shows the change in value of a hypothetical $10,000 investment in Class A shares of Active Portfolios® Multi-Manager Alternative Strategies Fund during the stated time period, and does not reflect the deduction of taxes that a shareholder may pay on Fund distributions or on the redemption of Fund shares.
| | |
| |
| | Active Portfolios® Multi-Manager Alternative Strategies Fund |
Manager Discussion of Fund Performance
Portfolio Management
AQR Capital Management, LLC
Clifford Asness, Ph.D.
John Liew, Ph.D.
Brian Hurst
Yao Hua Ooi
Eaton Vance Management
John Baur
Michael Cirami, CFA
Eric Stein, CFA
Wasatch Advisors, Inc.
Michael Shinnick
Ralph Shive, CFA
Water Island Capital, LLC
John Orrico, CFA
Todd Munn
Roger Foltynowicz, CAIA
Gregg Loprete
Morningstar Style Box™
The Morningstar Style Box™ is based on a fund’s portfolio holdings. For equity funds, the vertical axis shows the market capitalization of the stocks owned, and the horizontal axis shows investment style (value, blend, or growth). Information shown is based on the most recent data provided by Morningstar.
©2013 Morningstar, Inc. All rights reserved. The Morningstar information contained herein: (1) is proprietary to Morningstar and/or its content providers; (2) may not be copied or distributed; and (3) is not warranted to be accurate, complete or timely. Neither Morningstar nor its content providers are responsible for any damages or losses arising from any use of this information.
Active Portfolios® Multi-Manager Alternative Strategies Fund is managed by four independent money management firms and each invests a portion of the portfolio’s assets. As of August 31, 2013, AQR Capital Management, LLC (AQR), Eaton Vance Management (Eaton Vance), Wasatch Advisors, Inc. (Wasatch) and Water Island Capital, LLC (Water Island) managed approximately 25%, 23%, 32% and 20% of the portfolio, respectively.
While the Fund’s benchmark is the Citigroup 3-Month U.S. Treasury Bill Index, Wasatch also compares the performance of its portion of the Fund to the S&P 500 Index.
For the 12-month period that ended August 31, 2013, the Fund’s Class A shares returned 5.53%. The Fund outperformed its benchmark, the Citigroup 3-Month U.S. Treasury Bill Index, which returned 0.07% over the same period. The Fund’s outperformance can be attributed primarily to effective implementation of various alternative strategies.
Developed Market Central Bank Actions Drove Global Asset Prices
The actions of the world’s major central banks were the key driver of asset prices during the 12 months ended August 31, 2013. The annual period began with investors still cheering a pledge made by the European Central Bank (ECB) in late 2012 to do whatever it takes to keep the eurozone intact. The ECB followed up in September with a plan to support the bond markets of eurozone governments approved for aid from the region’s rescue fund and submit to austerity measures. One week later, the U.S. Federal Reserve (the Fed) embarked on what was dubbed QE3, its third round of quantitative easing since the 2008 financial crisis. Then, in January 2013, the Fed increased the size of the bond purchases it was making under QE3 after a bond-swapping program known as Operation Twist expired. In Japan, new political leadership pushed for more aggressive monetary easing, and the Bank of Japan responded with a bond-buying program much larger than the Fed’s as a percentage of Gross Domestic Product.
While central bank policies were generally supportive of asset prices during the first eight months of the annual period, comments made by Fed Chair Bernanke later in the annual period were not. In May 2013, Bernanke stated the Fed could start tapering its bond purchases within the next few months. He reiterated those remarks in June and went on to say the central bank could end its purchases entirely by mid-2014, provided the economy met its forecasts. Fears of waning Fed support triggered a broad sell-off in the global financial markets, higher interest rates across most major markets and the unwinding of carry trades (long positions in high-yielding currencies funded with short positions in low-yielding currencies). The unwinding of carry trades caused most emerging market currencies to weaken versus the U.S. dollar. In addition, the general decline in risk appetites prompted investors to pull capital out of many emerging countries, which pushed bond yields higher in the majority of those markets. In the U.S., the Treasury yield curve steepened, meaning the differential in yields between shorter-term and longer-term maturities widened, as longer-term maturities sold off on tapering expectations (the Fed buys bonds further out on the yield curve), while expectations of the Fed’s policy rate, a proxy for the short-term end of the yield curve, staying anchored near zero for an extended period of time remained largely unchanged.
| | |
| |
| Active Portfolios® Multi-Manager Alternative Strategies Fund | | |
Manager Discussion of Fund Performance (continued)
Money management firms delivered results based on a variety of alternative strategies
AQR: Our portion of the Fund, which pursues an active managed futures strategy, outperformed the benchmark during the reporting period. We invest in futures and forward contracts, both long and short, across the global equity, fixed income, commodity and currency markets. In implementing our strategy, we utilize both short-term and long-term trend-following signals to attempt to profit from different types of trends that occur in each of these markets. Trend following can be simply described as taking long positions in markets that are rising in price and taking short positions in markets that are falling in price. In addition to trend-following signals, we also incorporate signals that seek to identify overextended trends and seek to reduce risk when the chance of a reversal is perceived as higher than normal, since market reversals generally cause losses for trend-following strategies.
Following concerns about European stability, the third quarter of 2012 saw positive economic surprises and accommodative monetary policy actions by the ECB and the U.S. Fed, which supported risk markets. This led to relatively bullish positioning within our portion of the Fund at the start of September 2012, with an expected portfolio beta to the S&P 500 Index of +0.6. (Beta is a measure of systematic risk of a security or portfolio in relation to the market as a whole.) Aside from brief early November and late December dips due to deteriorating negotiations to fix the fiscal cliff, we maintained such bullish positioning into 2013. Market trends remained bullish through March 2013, but turned bearish later in the period over concerns of tightening by the Fed and a credit squeeze in China. Such conditions led our portion of the Fund to end August 2013 with a beta of +0.2.
By asset class, equities and currencies contributed positively to our portion of the Fund’s performance during the period, while fixed income and commodities detracted. By signal, short-term trend-following detracted, while long-term trend-following and overextended trend signals contributed positively. Long-term trend-following signals performed well, particularly in equities and currencies. Shorter-term signals were weaker, as there were a number of reversals, especially in May and June 2013, that hurt these types of signals. Overextended signals, which attempt to identify trends that have gone too far and are due for reversals, contributed strongly to performance, as reversals were identified in various asset classes. Such differing results indicate, in our view, that our strategy of diversifying our strategy across many horizons of trend following is prudent given the difficulty in predicting which market environment will prevail.
Eaton Vance: Our portion of the Fund, which employs a global macro long/short fixed income strategy, underperformed the benchmark during the period, as its diversified mix of long and short investments primarily focused on currencies and sovereign credit around the world produced modestly negative returns. More specifically, a long position in the Indian rupee was the biggest detractor from returns. A long position in the Philippine peso was also a negative contributor, similarly impacted by U.S. Fed tapering expectations and outflows from its equity market. A long position in New Zealand interest rates — employed as a hedge for other long risk positions — detracted as rates across much of the globe rose, again on U.S. Fed tapering expectations. Also detracting from our portion of the Fund’s results was duration positioning. During the period, our portion of the Fund maintained its duration slightly longer than that of the benchmark. As interest rates globally increased, this modestly long duration negatively impacted performance.
| | | | | | | | | | | | |
Portfolio Breakdown (%) (at August 31, 2013) | |
| | | | Long | | | | Short | | | | Net | |
Common Stocks | | | 42.6 | | | | (5.6 | ) | | | 37.0 | |
Consumer Discretionary | | | 6.1 | | | | (1.9 | ) | | | 4.2 | |
Consumer Staples | | | 3.1 | | | | (0.1 | ) | | | 3.0 | |
Energy | | | 8.2 | | | | (0.3 | ) | | | 7.9 | |
Financials | | | 7.2 | | | | (1.7 | ) | | | 5.5 | |
Health Care | | | 4.9 | | | | (0.2 | ) | | | 4.7 | |
Industrials | | | 2.5 | | | | (0.0 | )(a) | | | 2.5 | |
Information Technology | | | 7.9 | | | | (0.7 | ) | | | 7.2 | |
Materials | | | 2.0 | | | | (0.0 | )(a) | | | 2.0 | |
Telecommunication Services | | | 0.7 | | | | (0.4 | ) | | | 0.3 | |
Utilities | | | 0.0 | (a) | | | (0.3 | ) | | | (0.3 | ) |
Preferred Stocks | | | 0.2 | | | | — | | | | 0.2 | |
Financials | | | 0.2 | | | | — | | | | 0.2 | |
Bonds | | | 16.4 | | | | (0.3 | ) | | | 16.1 | |
Corporate Bonds & Notes | | | 7.1 | | | | (0.3 | ) | | | 6.8 | |
Convertible Bonds | | | 1.1 | | | | — | | | | 1.1 | |
Foreign Government Obligations | | | 6.8 | | | | — | | | | 6.8 | |
Inflation Indexed Bonds | | | 1.4 | | | | — | | | | 1.4 | |
Exchange-Traded Funds | | | 0.0 | (a) | | | (1.0 | ) | | | (1.0 | ) |
Exchange-Traded Notes | | | 0.0 | | | | (0.0 | )(a) | | | (0.0 | )(a) |
Options Purchased Calls | | | 0.1 | | | | — | | | | 0.1 | |
Options Purchased Puts | | | 0.1 | | | | — | | | | 0.1 | |
Treasury Bills | | | 19.0 | | | | — | | | | 19.0 | |
Short-Term Investments Segregated in Connection with Open Derivatives Contracts(b) | | | 28.5 | | | | — | | | | 28.5 | |
Total | | | 106.9 | | | | (6.9 | ) | | | 100.0 | |
Percentages indicated are based upon total investments. The Fund’s portfolio composition is subject to change.
| (b) | Includes investments in Money Market Funds (amounting to $169.0 million) which have been segregated to cover obligations related to the Fund’s investment in derivatives which provides exposure to multiple markets. For a description of the Fund’s investments in derivatives, see Investments in Derivatives following the Consolidated Portfolio of Investments, and Note 2 to the financial statements. |
| | |
| |
| | Active Portfolios® Multi-Manager Alternative Strategies Fund |
Manager Discussion of Fund Performance (continued)
| | | | |
Market Exposure Through Derivatives Investments (% of notional exposure)
(at August 31, 2013)(a) | |
Fixed Income Derivative Contracts | | | (157.7 | ) |
Commodities Derivative Contracts | | | (0.7 | ) |
Equity Derivative Contracts | | | 9.7 | |
Forward Foreign Currency Exchange Contracts | | | 48.7 | |
Total Notional Market Value of Derivative Contracts | | | (100.0 | ) |
| (a) | The Fund has market exposure to fixed income, equity and commodities asset classes through its investments in futures and swap contracts, and market exposure to foreign currencies through its investments in forward foreign currency exchange contracts. Futures and swap contracts and forward foreign currency exchange contracts are derivative instruments. The Fund may have long or short market exposures. Reflects notional market value of futures and swap contracts and forward foreign currency exchange contracts. The notional exposure of a financial instrument is the nominal or face amount that is used to calculate payments made on that instrument and/or changes in value for the instrument. The notional exposure is a hypothetical underlying quantity upon which payment obligations are computed. Notional exposures provide a gauge for how the Fund may behave given changes in individual markets. Notional amounts for each derivative contract are shown in the Consolidated Portfolio of Investments. At period end, the notional amount of all outstanding derivative contracts is ($363,073,001). For a description of the Fund’s investments in derivatives, see Investments in Derivatives following the Consolidated Portfolio of Investments, and Note 2 to the consolidated financial statements. At period end, the Fund held investments in an affiliated money market fund (amounting to $167.8 million), which have been segregated to cover obligations relating to the Fund’s investment in derivatives. For further information on these holdings, see the Portfolio Holdings table below and the Consolidated Portfolio of Investments. |
Factors positively impacting returns included a long position in the Serbian dinar versus the euro, which was the top contributor to returns during the period. Serbia moved closer to European Union membership, which was perceived as positively impacting its trade status. A short position in the Japanese yen was also beneficial to returns as new Prime Minister Shinzo Abe pushed for higher inflation and a weaker currency as keys to stimulate decades of sluggish economic growth. A long position in the Nigerian naira added value as the country’s local debt was added to a major index, oil prices moved higher and its short-term currency instruments offered relatively attractive yields.
Wasatch: Our portion of the Fund, which implements a long/short equity strategy, outperformed the benchmark with double-digit gains during the period.
The strongest contributing sectors on a relative basis were information technology, energy and telecommunication services, where stock selection in long positions proved particularly effective. Amongst our portion of the Fund’s short positions, utilities and energy were the strongest contributors. Conversely, security selection in materials and underweight allocations to the comparatively strong performing health care and consumer staples sectors detracted most significantly. Amongst our portion of the Fund’s short positions, consumer discretionary, telecommunication services and health care detracted most.
The biggest individual contributors to our portion of the Fund’s results were energy drilling company Patterson-UTI Energy, computer hardware manufacturer Silicon Graphics International and auto manufacturer General Motors. Positions in fertilizer manufacturer Mosaic, tire manufacturer Goodyear Tire & Rubber and gold mining company Yamana Gold detracted most from our portion of the Fund’s relative results.
Water Island: Our portion of the Fund’s portfolio, which employs a variety of alternative strategies, outperformed the benchmark during the period. While all four of the sub-strategies we use contributed positively to performance on an absolute basis, the credit special situations sleeve, led by an investment in Globalstar, was the top contributor to our portion of the Fund’s portfolio. Within the credit special situations sleeve, our team’s focus on short-duration, more catalyst-driven idiosyncratic corporate events helped insulate the Fund’s position from interest rate risk and overall volatility, especially in the last several months of the period when fears concerning rising interest rates and a pullback by the Fed caused significant disruption in the markets.
A handful of terminated merger deals caused a drag on performance in the merger arbitrage sub-strategy. Nonetheless, a number of successfully completed and still pending merger deals brought the merger arbitrage sub-strategy to be the second best contributor for the period. Among the top contributors within the merger arbitrage sleeve were the acquisitions of Clearwire by SprintNextel and of Copeinca by Pacific Andes Resources. On a relative basis, the merger-related credit and equity special situations sleeve also contributed, but more modestly.
Our event-driven strategy does not target specific sectors with its investments, but rather idiosyncratic corporate events such as mergers and acquisitions. That said, telecommunication services, energy and consumer discretionary were the top contributors during the period, led by the aforementioned Globalstar and Clearwire events as well as by the acquisition of MetroPCS by T-Mobile and the acquisition of Plains Exploration and Production by Freeport-McMoRan Copper & Gold. The only significant detractor from performance was materials, primarily a result of terminated merger deals involved Finders Mines, Sundance Resources and Whitehaven Coal.
| | |
| |
| Active Portfolios® Multi-Manager Alternative Strategies Fund | | |
Manager Discussion of Fund Performance (continued)
Changes to the Fund’s Portfolio Based on Strategy Implementation
AQR: In equities, our portion of the Fund began the period with long positions across virtually all developed and emerging equity markets within our investment universe. Global markets rose through the end of September 2012 and continued their rally into the end of 2012 on positive news when the Fed announced its third round of quantitative easing and the Bank of Japan expanded its asset purchasing program. As a result, our portion of the Fund benefited from its consistent and significant long view across equity markets. Our portion of the Fund ended August 2013 mostly long across most developed markets, with short positions in some emerging equity markets, specifically South Korea, China and Taiwan.
In fixed income, our portion of the Fund began the period with mostly long positions, with the largest positions in Japanese, U.K. and U.S. bonds, but also with modest short positions in Australian short-duration bonds, U.S. short-duration bonds and Canadian and Swiss short-term interest rate futures. Global bond markets rallied on weak macroeconomic data, renewed European sovereign debt concerns and the ECB’s interest rate cut in the second half of 2012. Reduced risk aversion early in 2013 led to global declines in assets traditionally considered safe havens, which resulted in losses early in the first quarter of 2013. Global fixed income markets dropped sharply in May 2013 on fears of tightening by the Fed. In June 2013, we switched to short positioning in the asset class, which helped our portion of the Fund’s performance. We ended August 2013 with short positions in virtually all bond futures and nearly all short-term interest rate futures, as long-term and short-term signals were bearish in July and August following the sharp reversal in the second quarter of 2013.
In commodities, our portion of the Fund began the period with its largest long positions in gasoline, soybeans and gas oil and its largest short positions in aluminum, lean hogs and zinc. Following a rally earlier in 2012, most commodities’ prices declined in late 2012 on news of slowing economic growth in China and a warm winter in the U.S. After an initial rally in early 2013, commodities declined broadly again, this time on declining emerging markets growth and a credit squeeze in China — with the exception of energy commodities. Our portion of the Fund benefited from these declines, as we had positioned the asset class with short positions across most commodities. However, our portion of the Fund was hurt in August as commodities bounced back on drought in the U.S. Midwest and geopolitical risk due to the civil war in Syria. Our portion of the Fund finished August 2013 with a mix of long and short positions in commodities.
In the currency markets, our portion of the Fund entered September 2012 with strong short positions in the euro, the Japanese yen and the U.S. dollar, with long positions in the Australian dollar, Canadian dollar, British pound and Norwegian krone, and with a mix of long and short positions in emerging market currencies. As the European crisis persisted, the ECB’s steps to maintain the European Monetary Union caused a reversal that hurt our portion of the Fund’s performance. In late 2012 and early 2013, our portion of the Fund’s short position in the Japanese yen against other currencies led to significant gains, as the yen fell significantly due to large-scale efforts by the Bank of Japan to weaken the yen and raise inflation targets and expectations. Choppiness in the euro in January 2013 persisted through early 2013. Short positions in the euro and long positions in riskier currencies detracted from our portion of the Fund’s results during the second quarter of 2013, as risk assets declined broadly while the euro rallied on
Investment Risks
The value of commodities investments will generally be affected by overall market movements and factors specific to a particular industry or commodity, which may include weather, embargoes, tariffs, and economic health, political, international, regulatory and other developments. Economic and other events (whether real or perceived) can reduce the demand for commodities, which may reduce market prices and cause the value of Fund shares to fall. Exposure to commodities and commodities markets may subject the Fund to greater volatility than investments in traditional securities. No active trading market may exist for certain commodities investments, which may impair the ability of the Fund to sell or to realize the full value of such investments in the event of the need to liquidate such investments. In addition, certain types of commodities instruments are subject to the risk that the counterparty to the instrument will not perform or will be unable to perform in accordance with the terms of the instrument. Derivative instruments are financial instruments that have a value dependent on the value of something else, such as one or more underlying securities. The use of derivatives involves risks different from, and possibly greater than, the risks associated with investing directly in the investments underlying the derivatives. Derivatives may be volatile and involve significant risk, such as, among other things, correlation risk, counterparty credit risk, hedging risk, leverage risk and liquidity risk. Certain derivatives have the potential for unlimited losses, regardless of the size of the initial investment. Investments in asset-backed and mortgage-backed securities are subject to prepayment risk which can limit the potential for gain during a declining interest rate environment and increases the potential for loss in a rising interest rate environment. Counterparty risk is the risk that a counterparty to a financial instrument held by the Fund or by a special purpose or structured vehicle invested in by the Fund may become insolvent or otherwise fail to perform its obligations, and the Fund may obtain no or limited recovery of its investment, and any recovery may be significantly delayed. See the Fund’s prospectus for information on these and other risks.
| | |
| |
| | Active Portfolios® Multi-Manager Alternative Strategies Fund |
Manager Discussion of Fund Performance (continued)
increased agreement on moving from austerity to stimulus and support. Our portion of the Fund ended August 2013 strongly short the Norwegian krone, New Zealand dollar, Canadian dollar and Australian dollar, long the euro and with a mix of long and short positions in various emerging market currencies.
Eaton Vance: The most notable changes within our portion of the Fund took place within the Asia region amidst increased volatility — particularly in the currency markets — toward the latter part of the period. As mentioned earlier, many emerging market currencies experienced heightened volatility as expectations for the U.S. Fed tapering its asset purchase program increased. We removed a long position in the Chinese yuan, booking a solid gain. We also eliminated a long position in the South Korean won, as a weaker Japanese yen could have implications for exports. A long position in the Malaysian ringgit was transitioned to a short position, as the country’s foreign currency reserves and current account surplus both eroded. We increased our portion of the Fund’s short position in the Japanese yen, as new Prime Minister Shinzo Abe’s sweeping victory in the December 2012 elections made it clear aggressive monetary policy would likely ensue. Outside of Asia, we established a short position in the British pound, as a new central bank governor with dovish undertones took control of the Bank of England. We opportunistically exited a long position in the Polish zloty in favor of a long position in interest rates, as the Polish central bank transitioned to a rate-cutting cycle to support economic growth. A long position in Venezuelan credit was transitioned to a short position in credit as the political and economic environment there deteriorated in the wake of former President Hugo Chavez’s passing. Our portion of the Fund’s duration position remained unchanged at the end of the period.
Wasatch: During the period, we initiated a new short position in perennially struggling retailer J.C. Penney. We took the position after the announcement of a share sale by significant owner Vornado Realty Trust. There was also a large debt issuance in which the majority of the firm’s real estate assets were pledged. J.C. Penney is representative of the type of short position we look for — a company with a highly leveraged balance sheet, negative cash flow and facing significant operating challenges to return to profitability let alone sustain its current valuation.
Overall, as of August 31, 2013, our portion of the Fund was most significantly overweight relative to the S&P 500 Index in energy. The overweight position includes companies in energy services, like Halliburton, that have performed well. We reduced our portion of the Fund’s weighting in land drillers on the price spike in early 2013. The Fund’s holdings in offshore drillers, such as Ensco, lagged, and we added to certain positions on weakness. Our portion of the Fund was also modestly overweight relative to the S&P 500 Index in materials at the end of the annual period. Our portion of the Fund was most significantly underweight relative to the S&P 500 Index in consumer staples at the end of the annual period given our belief that the sector is expensive. In August 2013, we initiated a position in Wal-Mart Stores, considered a consumer staple as it is the largest grocer in the U.S. We expect to see that position grow, as the company has significant cash flows and shows a willingness to buy back stock. On August 31, 2013, our portion of the Fund was also underweight relative to the S&P 500 Index in the health care, financials, industrials, utilities, telecommunication services and information technology sectors and was rather neutrally weighted to the S&P 500 Index in consumer discretionary.
Water Island: The aforementioned Clearwire (acquirer SprintNextel) and Plains Exploration (acquirer Freeport-McMoRan Copper & Gold) as well as Exxon
| | |
| |
| Active Portfolios® Multi-Manager Alternative Strategies Fund | | |
Manager Discussion of Fund Performance (continued)
Mobil’s purchase of Celtic Exploration were three new deals added to our portion of the Fund’s portfolio during the period. All three of these deals were completed successfully during the period and were amongst our portion of the Fund’s top contributors. Typically, when a merger transaction completes, we do not have to make a sale in the market to unwind a position; the shares are taken up in the corporate action.
Also, in addition to our portion of the Fund’s investment in Globalstar, mentioned earlier, we initiated a position in Yellow Media, a holding corporation of companies specializing in digital advertising and marketing solutions. Yellow Media undertook a voluntary balance sheet restructuring under the Canada Business Corporation Act, which provides a procedure allowing corporations to rearrange their debt obligations. We established a position in Yellow Media cross the capital structure, based on rigorous fundamental credit and scenario analysis.
While our strategy does not allocate to a particular sector but rather to specific corporate events, noticeable shifts in sector exposure during the period included an increase in consumer staples and telecommunication services and a decrease in industrials.
Looking ahead
AQR: Overall, gains in equities and currencies counterbalanced losses in fixed income in our portion of the Fund’s portfolio during the period, and long-term momentum and overextended signal gains exceeded losses from our shorter-term signals. We believe the period ended August 31, 2013 continued to illustrate the importance of our portion of the Fund’s construction, which emphasizes diversification across asset classes as well as diversification across signals.
Eaton Vance: Clearly, the actions of developed market central banks drove returns in the global financial markets during the period, and we currently expect this to continue for some time going forward. Generally, unconventional monetary policy remains the most effective tool to combat deflationary pressures and the inability of governments to address fiscal imbalances and implement prudent economic reforms. With this in mind, we currently believe the Fed is likely to ultimately continue its bond buying program, as U.S. economic data falls short of projections. We also believe the Bank of Japan is likely to press forward with its aggressive policies and the Bank of England, under the leadership of a new governor, is likely to become more accommodative.
Among developing economies, we believe the responses to the ultra-loose monetary policies of the developed world will likely vary from country to country. Such variances could provide investment opportunities, as asset prices may well remain disconnected from fundamentals. Furthermore, as monetary policies continue to shift over the coming months, we currently expect volatility to continue to remain dominant within the currency, credit and interest rate markets. In turn, there are still numerous opportunities, in our view, to search for investments where we believe asset prices are dislocated from, but should ultimately move toward, a country’s fundamentals over time.
Wasatch: For most of the period, our portion of the Fund was positioned approximately 80% long and 10% short, with the remainder in cash and cash equivalents, reflecting a constructive outlook for equities based in part on investors seeking returns in a market increasingly concerned about the risk of holding fixed income instruments. At the end of the period, our portion of the Fund remained at a 70% net long position, as we continued to believe we are able to find stocks with
| | |
| |
| | Active Portfolios® Multi-Manager Alternative Strategies Fund |
Manager Discussion of Fund Performance (continued)
meaningful upside potential. While the manner in which the Fed’s quantitative easing is tapered may well draw significant scrutiny, we continue to believe the U.S. economy is still recovering and accommodation from the central bank is likely to persist.
Water Island: At present, we believe global equity and credit markets will likely remain volatile as the U.S. Fed transitions its policies to accommodate any changes in economic growth. We also believe any stability in the U.S. Treasury market would be influential in, and a sign of, lessening fear among global investors. More volatile markets typically provide our strategy with attractive entry points in many of the deals and events we track around the globe. We believe rising interest rates, when they do materialize, may serve to buttress merger arbitrage returns, and if accompanied by strengthening macroeconomic conditions, will likely mean a more robust deal environment as well. Market action toward the end of the period gave us the opportunity to demonstrate how the drivers of returns in merger arbitrage are distinct and counter to the behavior of other asset classes. For our credit strategies, we currently intend to remain focused on positions we believe are likely to hold up well in a volatile market, such as names in the merger-related space and post-reorganization refinancing space, with the most definitive timelines. At the end of the period, we found situations in which the expected time to the completion of the event is three to six months in duration to be the most attractive. Given current market conditions, our equity special situations team sees corporations under pressure to maximize shareholder value, leading to activist scenarios, split offs, and tax-efficient restructurings like real estate investment trust (REIT) conversions. In the near term, we expect such events to be primary areas of opportunity. Our equity special situations team expects to focus on maintaining hedging strategies to mitigate market beta, or volatility, exposure. While these hedges may reduce potential gains in bull markets, they may also serve to reduce volatility in down markets, and they adhere to the strategy’s fundamental market neutral core. We seek to continue to avoid those transactions for which our risk-taking is not well compensated and remain focused on what we consider to be solid, strategic transactions underpinned by strong strategic rationales.
| | |
| |
| Active Portfolios® Multi-Manager Alternative Strategies Fund | | |
Understanding Your Fund’s Expenses
(Unaudited)
As an investor, you incur two types of costs. There are transaction costs, which generally include sales charges on purchases and may include redemption fees. There are also ongoing costs, which generally include management fees, distribution and service (Rule 12b-1) fees, and other fund expenses. The following information is intended to help you understand your ongoing costs (in dollars) of investing in the Fund and to help you compare these costs with the ongoing costs of investing in other mutual funds.
Analyzing Your Fund’s Expenses
To illustrate these ongoing costs, we have provided examples and calculated the expenses paid by investors of the Fund during the period. The actual and hypothetical information in the table is based on an initial investment of $1,000 at the beginning of the period indicated and held for the entire period. Expense information is calculated two ways and each method provides you with different information. The amount listed in the “Actual” column is calculated using the Fund’s actual operating expenses and total return for the period. You may use the Actual information, together with the amount invested, to estimate the expenses that you paid over the period. Simply divide your account value by $1,000 (for example, an $8,600 account value divided by $1,000 = 8.6), then multiply the results by the expenses paid during the period under the Actual column. The amount listed in the “Hypothetical” column assumes a 5% annual rate of return before expenses (which is not the Fund’s actual return) and then applies the Fund’s actual expense ratio for the period to the hypothetical return. You should not use the hypothetical account values and expenses to estimate either your actual account balance at the end of the period or the expenses you paid during the period. See “Compare With Other Funds” below for details on how to use the hypothetical data.
Compare With Other Funds
Since all mutual funds are required to include the same hypothetical calculations about expenses in shareholder reports, you can use this information to compare the ongoing cost of investing in the Fund with other funds. To do so, compare the hypothetical example with the 5% hypothetical examples that appear in the shareholder reports of other funds. As you compare hypothetical examples of other funds, it is important to note that hypothetical examples are meant to highlight the ongoing costs of investing in a fund only and do not reflect any transaction costs, such as sales charges, or redemption or exchange fees. Therefore, the hypothetical calculations are useful in comparing ongoing costs only, and will not help you determine the relative total costs of owning different funds. If transaction costs were included in these calculations, your costs would be higher.
March 1, 2013 – August 31, 2013
| | | | | | | | | | | | | | | | | | | | | | | | | | | | |
| | | Account Value at the
Beginning of the
Period ($) | | | Account Value at the
End of the
Period ($) | | | Expenses Paid During
the Period ($) | | | Fund’s Annualized
Expense Ratio (%) | |
| | | | Actual | | | | Hypothetical | | | | Actual | | | | Hypothetical | | | | Actual | | | | Hypothetical | | | | Actual | |
Class A | | | 1,000.00 | | | | 1,000.00 | | | | 1,004.80 | | | | 1,016.75 | | | | 8.34 | | | | 8.39 | | | | 1.66 | |
Expenses paid during the period are equal to the annualized expense ratio for each class as indicated above, multiplied by the average account value over the period and then multiplied by the number of days in the Fund’s most recent fiscal half year and divided by 365.
Expenses do not include fees and expenses incurred indirectly by the Fund from the underlying funds in which the Fund may invest (also referred to as “acquired funds”), including affiliated and non-affiliated pooled investment vehicles (including mutual funds and exchange-traded funds).
Had Columbia Management Investment Advisers, LLC and/or certain of its affiliates not waived/reimbursed certain fees and expenses, account value at the end of the period would have been reduced.
Class A shares of the Fund are available only to certain eligible investors through certain wrap fee programs sponsored and/or managed by Ameriprise Financial, Inc. or its affiliates. Fund shares are sold in accordance with the terms of the account through which you invest in the Fund. Participants in wrap fee programs pay an asset-based fee that is not included in the above table. Please read the wrap program documents for information regarding fees charged.
| | |
| |
| | Active Portfolios® Multi-Manager Alternative Strategies Fund |
Consolidated Portfolio of Investments
August 31, 2013
(Percentages represent value of investments compared to net assets)
| | | | | | | | |
| Common Stocks 38.0% | |
| Issuer | | Shares | | | Value ($) | |
Consumer Discretionary 5.4% | |
Auto Components 0.3% | |
| | |
Cooper Tire & Rubber Co. | | | 64,213 | | | | 2,050,321 | |
|
Automobiles 0.8% | |
| | |
General Motors Co.(a)(b)(i) | | | 160,170 | | | | 5,458,593 | |
|
Diversified Consumer Services 0.4% | |
| | |
Outerwall, Inc.(a)(i) | | | 45,546 | | | | 2,831,595 | |
|
Household Durables 0.2% | |
| | |
iRobot Corp.(a) | | | 32,367 | | | | 1,057,430 | |
|
Leisure Equipment & Products 0.1% | |
| | |
Steinway Musical Instruments, Inc.(a) | | | 23,915 | | | | 962,818 | |
|
Media 1.5% | |
| | |
Belo Corp., Class A | | | 118,695 | | | | 1,678,348 | |
| | |
Interpublic Group of Companies, Inc. (The) | | | 301,846 | | | | 4,745,019 | |
| | |
Kabel Deutschland Holding AG | | | 30,514 | | | | 3,464,246 | |
| | | | | | | | | |
Total | | | | | | | 9,887,613 | |
|
Multiline Retail 1.0% | |
| | |
Saks, Inc.(a)(i) | | | 79,629 | | | | 1,268,490 | |
| | |
Target Corp. | | | 79,418 | | | | 5,027,953 | |
| | | | | | | | | |
Total | | | | | | | 6,296,443 | |
|
Specialty Retail 1.1% | |
| | |
American Eagle Outfitters, Inc. | | | 97,300 | | | | 1,407,931 | |
| | |
ANN, Inc.(a) | | | 59,967 | | | | 2,080,855 | |
| | |
OfficeMax, Inc.(b)(i) | | | 93,038 | | | | 1,011,323 | |
| | |
PEP Boys-Manny, Moe & Jack
(The)(a)(b) | | | 109,655 | | | | 1,231,426 | |
| | |
Rue21, Inc.(a) | | | 42,759 | | | | 1,746,705 | |
| | | | | | | | | |
Total | | | | | | | 7,478,240 | |
| | | | | | | | | |
Total Consumer Discretionary | | | | | | | 36,023,053 | |
| | |
| | | | | | | | |
Consumer Staples 2.8% | |
Food & Staples Retailing 1.1% | |
| | |
Harris Teeter Supermarkets, Inc. | | | 47,988 | | | | 2,358,610 | |
| | |
Shoppers Drug Mart Corp. | | | 10,676 | | | | 597,402 | |
| | |
Wal-Mart Stores, Inc. | | | 57,028 | | | | 4,161,904 | |
| | | | | | | | | |
Total | | | | | | | 7,117,916 | |
|
Food Products 1.7% | |
| | |
DE Master Blenders 1753 NV(a) | | | 337,315 | | | | 5,510,241 | |
| | |
Dole Food Co., Inc.(a) | | | 96,900 | | | | 1,329,468 | |
| | |
GrainCorp Ltd., Class A | | | 198,994 | | | | 2,196,025 | |
| | |
Smithfield Foods, Inc.(a)(b) | | | 68,099 | | | | 2,283,359 | |
| | | | | | | | | |
Total | | | | | | | 11,319,093 | |
| | | | | | | | | |
Total Consumer Staples | | | | | | | 18,437,009 | |
| | | | | | | | |
| Common Stocks (continued) | |
| Issuer | | Shares | | | Value ($) | |
Energy 7.3% | |
Energy Equipment & Services 3.6% | |
| | |
Ensco PLC, Class A | | | 74,614 | | | | 4,145,554 | |
| | |
Fred Olsen Production ASA | | | 407,620 | | | | 614,442 | |
| | |
Gulf Coast Ultra Deep Royalty Trust, ADR(a) | | | 82,002 | | | | 173,024 | |
| | |
Halliburton Co. | | | 107,695 | | | | 5,169,360 | |
| | |
Helmerich & Payne, Inc. | | | 29,495 | | | | 1,859,365 | |
| | |
National Oilwell Varco, Inc. | | | 43,705 | | | | 3,247,282 | |
| | |
Noble Corp. | | | 84,702 | | | | 3,150,914 | |
| | |
Patterson-UTI Energy, Inc. | | | 203,883 | | | | 3,994,068 | |
| | |
Unit Corp.(a)(b) | | | 38,064 | | | | 1,752,847 | |
| | | | | | | | | |
Total | | | | | | | 24,106,856 | |
|
Oil, Gas & Consumable Fuels 3.7% | |
| | |
Berry Petroleum Co., Class A | | | 603 | | | | 24,813 | |
| | |
Bill Barrett Corp.(a)(b)(i) | | | 198,622 | | | | 4,276,332 | |
| | |
ConocoPhillips | | | 30,582 | | | | 2,027,587 | |
| | |
Denbury Resources, Inc.(a) | | | 575,214 | | | | 9,945,450 | |
| | |
Energen Corp. | | | 33,120 | | | | 2,196,187 | |
| | |
Ithaca Energy, Inc. | | | 5,320 | | | | 9,914 | |
| | |
Swift Energy Co.(a) | | | 124,394 | | | | 1,403,164 | |
| | |
Talisman Energy, Inc. | | | 339,686 | | | | 3,641,434 | |
| | |
Torc Oil & Gas Ltd.(a) | | | 376,370 | | | | 575,293 | |
| | |
Total SA | | | 3,527 | | | | 195,385 | |
| | |
Whitehaven Coal Ltd. | | | 21,974 | | | | 38,611 | |
| | | | | | | | | |
Total | | | | | | | 24,334,170 | |
| | | | | | | | | |
Total Energy | | | | | | | 48,441,026 | |
| | |
| | | | | | | | |
Financials 6.4% | |
Capital Markets 0.1% | |
| | |
Jovian Capital Corp. | | | 74,481 | | | | 723,384 | |
|
Commercial Banks 0.4% | |
| | |
Bank of Ayudhya PCL | | | 908,939 | | | | 1,069,306 | |
| | |
Bank of Ayudhya PCL, NVDR | | | 1,124,213 | | | | 1,322,561 | |
| | | | | | | | | |
Total | | | | | | | 2,391,867 | |
|
Diversified Financial Services 1.2% | |
| | |
Citigroup, Inc. | | | 34,730 | | | | 1,678,501 | |
| | |
NYSE Euronext(b) | | | 142,936 | | | | 5,974,725 | |
| | | | | | | | | |
Total | | | | | | | 7,653,226 | |
|
Insurance 3.5% | |
| | |
American Safety Insurance Holdings Ltd.(a) | | | 34,576 | | | | 1,041,775 | |
| | |
Aon PLC | | | 36,797 | | | | 2,442,585 | |
| | |
CNA Financial Corp. | | | 114,997 | | | | 4,057,094 | |
| | |
Genworth Financial, Inc., Class A(a)(i) | | | 90,539 | | | | 1,068,360 | |
The accompanying Notes to Consolidated Financial Statements are an integral part of this statement.
| | |
| |
| Active Portfolios® Multi-Manager Alternative Strategies Fund | | |
Consolidated Portfolio of Investments (continued)
August 31, 2013
| | | | | | | | |
| Common Stocks (continued) | |
| Issuer | | Shares | | | Value ($) | |
Loews Corp. | | | 187,466 | | | | 8,334,738 | |
| | |
MetLife, Inc. | | | 65,658 | | | | 3,032,743 | |
| | |
Unum Group | | | 121,868 | | | | 3,598,762 | |
| | | | | | | | | |
Total | | | | | | | 23,576,057 | |
|
Real Estate Investment Trusts (REITs) 0.4% | |
| | |
CapLease, Inc. | | | 300,344 | | | | 2,555,927 | |
|
Real Estate Management & Development 0.3% | |
| | |
Deutsche Euroshop AG | | | 13,193 | | | | 538,963 | |
| | |
Deutsche Wohnen AG | | | 30,838 | | | | 540,846 | |
| | |
GAGFAH SA(a) | | | 43,830 | | | | 535,718 | |
| | |
GSW Immobilien AG | | | 12,820 | | | | 558,544 | |
| | | | | | | | | |
Total | | | | | | | 2,174,071 | |
|
Thrifts & Mortgage Finance 0.5% | |
| | |
Hudson City Bancorp, Inc.(b) | | | 382,962 | | | | 3,519,421 | |
| | | | | | | | | |
Total Financials | | | | | | | 42,593,953 | |
| | |
| | | | | | | | |
Health Care 4.4% | |
Biotechnology 1.2% | |
| | |
Elan Corp. PLC, ADR(a) | | | 201,940 | | | | 3,077,565 | |
| | |
Onyx Pharmaceuticals, Inc.(a) | | | 19,267 | | | | 2,381,016 | |
| | |
Trius Therapeutics, Inc.(a) | | | 186,725 | | | | 2,552,531 | |
| | | | | | | | | |
Total | | | | | | | 8,011,112 | |
|
Health Care Equipment & Supplies 0.7% | |
| | |
Edwards Lifesciences Corp.(a)(b) | | | 17,016 | | | | 1,197,586 | |
| | |
Medtronic, Inc. | | | 33,800 | | | | 1,749,150 | |
| | |
Stryker Corp. | | | 20,300 | | | | 1,357,867 | |
| | | | | | | | | |
Total | | | | | | | 4,304,603 | |
|
Health Care Providers & Services 1.0% | |
| | |
CML HealthCare, Inc. | | | 255,379 | | | | 2,596,705 | |
| | |
Express Scripts Holding Co.(a) | | | 60,282 | | | | 3,850,814 | |
| | | | | | | | | |
Total | | | | | | | 6,447,519 | |
|
Life Sciences Tools & Services 0.3% | |
| | |
Life Technologies Corp.(a)(b) | | | 30,165 | | | | 2,244,578 | |
|
Pharmaceuticals 1.2% | |
| | |
Actavis, Inc.(a) | | | 11,455 | | | | 1,548,487 | |
| | |
Novartis AG, ADR | | | 32,100 | | | | 2,342,658 | |
| | |
Optimer Pharmaceuticals, Inc.(a)(i) | | | 153,730 | | | | 1,923,162 | |
| | |
Questcor Pharmaceuticals, Inc.(i) | | | 31,984 | | | | 2,132,693 | |
| | |
Sanofi | | | 1,757 | | | | 168,796 | |
| | |
Zoetis, Inc. | | | 4,569 | | | | 133,187 | |
| | | | | | | | | |
Total | | | | | | | 8,248,983 | |
| | | | | | | | | |
Total Health Care | | | | | | | 29,256,795 | |
| | |
| | | | | | | | |
| | | | | | | | |
| Common Stocks (continued) | |
| Issuer | | Shares | | | Value ($) | |
Industrials 2.2% | |
Airlines 0.4% | | | | | | | | |
| | |
Southwest Airlines Co. | | | 204,565 | | | | 2,620,478 | |
|
Commercial Services & Supplies 1.0% | |
| | |
Iron Mountain, Inc. | | | 141,366 | | | | 3,647,243 | |
| | |
Republic Services, Inc. | | | 70,505 | | | | 2,292,117 | |
| | |
TMS International Corp., Class A | | | 47,902 | | | | 833,974 | |
| | | | | | | | | |
Total | | | | | | | 6,773,334 | |
|
Construction & Engineering 0.5% | |
| | |
Aegion Corp.(a) | | | 98,921 | | | | 2,116,909 | |
| | |
Michael Baker Corp. | | | 31,445 | | | | 1,271,636 | |
| | | | | | | | | |
Total | | | | | | | 3,388,545 | |
|
Machinery 0.1% | |
| | |
Edwards Group Ltd., ADR(a) | | | 7,849 | | | | 76,842 | |
| | |
Invensys PLC | | | 41,630 | | | | 315,409 | |
| | |
MAN SE | | | 1,138 | | | | 130,189 | |
| | | | | | | | | |
Total | | | | | | | 522,440 | |
|
Road & Rail 0.2% | |
| | |
Knight Transportation, Inc. | | | 92,200 | | | | 1,501,016 | |
| | | | | | | | | |
Total Industrials | | | | | | | 14,805,813 | |
| | |
| | | | | | | | |
Information Technology 7.0% | |
Communications Equipment 0.8% | |
| | |
Cisco Systems, Inc. | | | 102,631 | | | | 2,392,328 | |
| | |
QUALCOMM, Inc. | | | 40,789 | | | | 2,703,495 | |
| | | | | | | | | |
Total | | | | | | | 5,095,823 | |
|
Computers & Peripherals 2.6% | |
| | |
Apple, Inc.(b)(i) | | | 24,125 | | | | 11,750,081 | |
| | |
Dell, Inc. | | | 116,626 | | | | 1,605,940 | |
| | |
Silicon Graphics International Corp.(a)(i) | | | 282,009 | | | | 4,156,813 | |
| | | | | | | | | |
Total | | | | | | | 17,512,834 | |
|
IT Services 1.0% | |
| | |
Acxiom Corp.(a) | | | 34,217 | | | | 851,319 | |
| | |
Convergys Corp. | | | 90,593 | | | | 1,597,155 | |
| | |
Global Payments, Inc. | | | 46,093 | | | | 2,196,331 | |
| | |
Lender Processing Services, Inc. | | | 60,041 | | | | 1,915,308 | |
| | | | | | | | | |
Total | | | | | | | 6,560,113 | |
|
Semiconductors & Semiconductor Equipment 0.4% | |
| | |
Intel Corp. | | | 121,292 | | | | 2,665,998 | |
|
Software 2.2% | |
| | |
Activision Blizzard, Inc. | | | 38,971 | | | | 636,007 | |
| | |
BMC Software, Inc.(a)(b) | | | 87,797 | | | | 4,038,662 | |
| | |
Microsoft Corp. | | | 177,729 | | | | 5,936,149 | |
| | |
Oracle Corp. | | | 57,499 | | | | 1,831,918 | |
The accompanying Notes to Consolidated Financial Statements are an integral part of this statement.
| | |
| |
| | Active Portfolios® Multi-Manager Alternative Strategies Fund |
Consolidated Portfolio of Investments (continued)
August 31, 2013
| | | | | | | | |
| Common Stocks (continued) | |
| Issuer | | Shares | | | Value ($) | |
Sourcefire, Inc.(a) | | | 33,877 | | | | 2,556,358 | |
| | | | | | | | | |
Total | | | | | | | 14,999,094 | |
| | | | | | | | | |
Total Information Technology | | | | | | | 46,833,862 | |
| | |
| | | | | | | | |
Materials 1.8% | |
Chemicals 1.2% | |
| | |
CF Industries Holdings, Inc.(b) | | | 10,000 | | | | 1,903,400 | |
| | |
Mosaic Co. (The)(b)(i) | | | 50,736 | | | | 2,113,154 | |
| | |
Potash Corp. of Saskatchewan, Inc.(b) | | | 120,095 | | | | 3,559,616 | |
| | | | | | | | | |
Total | | | | | | | 7,576,170 | |
|
Metals & Mining 0.4% | |
| | |
Flinders Mines Ltd.(a) | | | 506,159 | | | | 19,285 | |
| | |
Sundance Resources Ltd.(a) | | | 2,068,468 | | | | 143,601 | |
| | |
Yamana Gold, Inc. | | | 206,081 | | | | 2,345,202 | |
| | |
Yancoal Australia Ltd.(a) | | | 138,996 | | | | 345,160 | |
| | |
Yancoal Australia Ltd.(a) | | | 64,710 | | | | 41,290 | |
| | | | | | | | | |
Total | | | | | | | 2,894,538 | |
|
Paper & Forest Products 0.2% | |
| | |
Domtar Corp. | | | 22,800 | | | | 1,504,800 | |
| | | | | | | | | |
Total Materials | | | | | | | 11,975,508 | |
| | |
| | | | | | | | |
Telecommunication Services 0.7% | |
Diversified Telecommunication Services 0.2% | |
| | |
Globalstar, Inc.(a) | | | 214,614 | | | | 138,694 | |
| | |
Koninklijke KPN NV(a) | | | 128,935 | | | | 376,599 | |
| | |
Verizon Communications, Inc. | | | 11,320 | | | | 536,342 | |
| | | | | | | | | |
Total | | | | | | | 1,051,635 | |
|
Wireless Telecommunication Services 0.5% | |
| | |
Leap Wireless International, Inc.(a)(i) | | | 36,900 | | | | 560,142 | |
| | |
Sprint Corp.(a)(i) | | | 38,360 | | | | 257,396 | |
| | |
Vodafone Group PLC, ADR(b) | | | 78,500 | | | | 2,539,475 | |
| | | | | | | | | |
Total | | | | | | | 3,357,013 | |
| | | | | | | | | |
Total Telecommunication Services | | | | | | | 4,408,648 | |
| | |
| | | | | | | | |
Utilities —% | |
Gas Utilities —% | | | | | | | | |
| | |
Envestra Ltd. | | | 201,987 | | | | 204,049 | |
| | | | | | | | | |
Total Utilities | | | | | | | 204,049 | |
| | | | | | | | | |
Total Common Stocks
(Cost: $232,677,480) | | | | | | | 252,979,716 | |
| | |
| | | | | | | | |
| | | | | | | | |
| Preferred Stocks 0.2% | | | | | | | | |
| Issuer | | Shares | | | Value ($) | |
Financials 0.2% | | | | | | | | |
Commercial Banks 0.1% | | | | | | | | |
| | |
Citizens Funding Trust I, 7.500% | | | 2,872 | | | | 72,561 | |
| | |
GMAC Capital Trust I, 8.125%(c) | | | 29,476 | | | | 781,409 | |
| | | | | | | | | |
Total | | | | | | | 853,970 | |
| | |
Diversified Financial Services 0.1% | | | | | | | | |
| | |
Citigroup Capital IX, 6.000% | | | 21,000 | | | | 526,680 | |
| | | | | | | | | |
Total Financials | | | | | | | 1,380,650 | |
| | | | | | | | | |
Total Preferred Stocks (Cost: $1,315,420) | | | | | | | 1,380,650 | |
| | | | | | | | | | | | |
| Corporate Bonds & Notes(d) 6.4% | |
| Issuer | | Coupon
Rate | | | Principal
Amount ($) | | | Value ($) | |
Aerospace & Defense 0.3% | |
DynCorp International, Inc. | | | | | |
07/01/17 | | | 10.375% | | | | 1,705,000 | | | | 1,747,625 | |
| | | |
| | | | | | | | | | | | |
Banking 0.2% | |
Fifth Third Capital Trust IV(c) | |
04/15/67 | | | 6.500% | | | | 1,530,000 | | | | 1,518,525 | |
| | | |
| | | | | | | | | | | | |
Chemicals 0.2% | |
Nova Chemicals Corp.
Senior Unsecured | |
11/01/19 | | | 8.625% | | | | 896,000 | | | | 992,320 | |
| | | |
| | | | | | | | | | | | |
Construction Machinery 0.2% | |
Case New Holland, Inc. | | | | | |
09/01/13 | | | 7.750% | | | | 425,000 | | | | 425,139 | |
|
United Rentals North America, Inc. | |
09/15/20 | | | 8.375% | | | | 906,000 | | | | 992,070 | |
| | | | | | | | | | | | | |
Total | | | | | | | | | | | 1,417,209 | |
|
| |
Consumer Products 0.1% | |
Spectrum Brands, Inc.
Senior Secured | |
06/15/18 | | | 9.500% | | | | 473,000 | | | | 520,300 | |
| | | |
| | | | | | | | | | | | |
Diversified Manufacturing 0.2% | |
Coleman Cable, Inc. | | | | | | | | | | | | |
02/15/18 | | | 9.000% | | | | 980,000 | | | | 1,041,250 | |
| | | |
| | | | | | | | | | | | |
Electric —% | |
NRG Energy, Inc. | | | | | | | | | | | | |
06/15/19 | | | 8.500% | | | | 215,000 | | | | 231,663 | |
| | | |
| | | | | | | | | | | | |
The accompanying Notes to Consolidated Financial Statements are an integral part of this statement.
| | |
| |
| Active Portfolios® Multi-Manager Alternative Strategies Fund | | |
Consolidated Portfolio of Investments (continued)
August 31, 2013
| | | | | | | | | | | | |
| Corporate Bonds & Notes(d) (continued) | |
| Issuer | | Coupon
Rate | | | Principal
Amount ($) | | | Value ($) | |
Food and Beverage 0.3% | |
Dean Foods Co.(b) | |
12/15/18 | | | 9.750% | | | | 1,525,000 | | | | 1,727,063 | |
| | | |
| | | | | | | | | | | | |
Gaming 0.2% | |
Marina District Finance Co., Inc.
Senior Secured | |
10/15/15 | | | 9.500% | | | | 1,004,000 | | | | 1,057,965 | |
| | | |
| | | | | | | | | | | | |
Gas Pipelines 0.3% | |
Copano Energy LLC/Finance Corp.(b) | |
04/01/21 | | | 7.125% | | | | 1,177,000 | | | | 1,430,960 | |
| | | |
| | | | | | | | | | | | |
Health Care 0.6% | |
Alere, Inc. | | | | | | | | | | | | |
10/01/18 | | | 8.625% | | | | 1,207,000 | | | | 1,299,034 | |
|
Health Management Associates, Inc.
Senior Secured | |
04/15/16 | | | 6.125% | | | | 926,000 | | | | 1,011,655 | |
|
Vanguard Health Holding Co. II LLC/Inc. | |
02/01/18 | | | 8.000% | | | | 374,000 | | | | 395,037 | |
02/01/19 | | | 7.750% | | | | 1,103,000 | | | | 1,180,210 | |
| | | | | | | | | | | | | |
Total | | | | | | | | | | | 3,885,936 | |
| | | |
| | | | | | | | | | | | |
Independent Energy 0.5% | |
Chaparral Energy, Inc. | | | | | |
09/01/21 | | | 8.250% | | | | 1,386,000 | | | | 1,444,905 | |
|
Endeavour International Corp.
Senior Secured | |
03/01/18 | | | 12.000% | | | | 923,000 | | | | 950,690 | |
|
Newfield Exploration Co.
Senior Subordinated Notes | |
05/15/18 | | | 7.125% | | | | 1,160,000 | | | | 1,203,500 | |
| | | | | | | | | | | | | |
Total | | | | | | | | | | | 3,599,095 | |
| | | |
| | | | | | | | | | | | |
Media Non-Cable 1.0% | |
Entercom Radio LLC | |
12/01/19 | | | 10.500% | | | | 1,000,000 | | | | 1,132,500 | |
|
Local TV Finance LLC
Senior Unsecured(e) | |
06/15/15 | | | 9.250% | | | | 1,404,000 | | | | 1,421,550 | |
|
Media General, Inc.
Senior Secured | |
02/15/17 | | | 11.750% | | | | 1,740,000 | | | | 1,914,000 | |
|
Reader’s Digest Association, Inc. (The)
Senior Secured(f) | |
02/15/17 | | | 9.500% | | | | 837,000 | �� | | | 326,430 | |
|
Univision Communications, Inc.(e) | |
05/15/21 | | | 8.500% | | | | 467,000 | | | | 505,528 | |
|
YPG Financing, Inc.
Senior Secured(e) | |
11/30/18 | | | 9.250% | | | CAD | 1,498,329 | | | | 1,449,679 | |
| | | | | | | | | | | | | |
Total | | | | | | | | | | | 6,749,687 | |
| | | | | | | | | | | | |
| Corporate Bonds & Notes(d) (continued) | |
| Issuer | | Coupon
Rate | | | Principal
Amount ($) | | | Value ($) | |
Metals 0.1% | |
Midwest Vanadium Pty Ltd.
Senior Secured(e) | |
02/15/18 | | | 11.500% | | | | 967,000 | | | | 696,240 | |
| | | |
| | | | | | | | | | | | |
Oil Field Services 0.4% | |
McMoRan Exploration Co. | |
11/15/14 | | | 11.875% | | | | 1,637,000 | | | | 1,671,518 | |
|
Offshore Group Investments Ltd.
Senior Secured | |
11/01/19 | | | 7.500% | | | | 611,000 | | | | 635,440 | |
| | | | | | | | | | | | | |
Total | | | | | | | | | | | 2,306,958 | |
| | | |
| | | | | | | | | | | | |
Other Financial Institutions 0.2% | |
Icahn Enterprises LP/Finance Corp. | |
01/15/16 | | | 7.750% | | | | 1,512,000 | | | | 1,566,810 | |
| | | |
| | | | | | | | | | | | |
Packaging 0.2% | |
ARD Finance SA
Senior Secured PIK(e) | |
06/01/18 | | | 11.125% | | | | 651,320 | | | | 696,912 | |
|
Packaging Dynamics Corp.
Senior Secured(e) | |
02/01/16 | | | 8.750% | | | | 712,000 | | | | 736,920 | |
| | | | | | | | | | | | | |
Total | | | | | | | | | | | 1,433,832 | |
| | | |
| | | | | | | | | | | | |
Property & Casualty 0.1% | |
HUB International Ltd.(e) | |
10/15/18 | | | 8.125% | | | | 694,000 | | | | 763,400 | |
| | | |
| | | | | | | | | | | | |
Retailers 0.1% | |
Brown Shoe Co., Inc. | |
05/15/19 | | | 7.125% | | | | 618,000 | | | | 645,810 | |
|
YCC Holdings LLC/Yankee Finance, Inc.
Senior Unsecured PIK | |
02/15/16 | | | 10.250% | | | | 222,000 | | | | 228,105 | |
| | | | | | | | | | | | | |
Total | | | | | | | | | | | 873,915 | |
| | | |
| | | | | | | | | | | | |
Technology 0.3% | |
BMC Software, Inc.
Senior Unsecured | |
02/15/22 | | | 4.250% | | | | 699,000 | | | | 682,065 | |
12/01/22 | | | 4.500% | | | | 699,000 | | | | 699,002 | |
|
Nortel Networks Ltd.(f) | |
07/15/16 | | | 10.750% | | | | 759,000 | | | | 869,055 | |
| | | | | | | | | | | | | |
Total | | | | | | | | | | | 2,250,122 | |
| | | |
| | | | | | | | | | | | |
Wireless 0.5% | |
Clearwire Communications LLC/Finance, Inc.(e)
Senior Secured | |
12/01/15 | | | 12.000% | | | | 1,183,000 | | | | 1,246,586 | |
12/01/15 | | | 12.000% | | | | 333,000 | | | | 350,899 | |
The accompanying Notes to Consolidated Financial Statements are an integral part of this statement.
| | |
| |
| | Active Portfolios® Multi-Manager Alternative Strategies Fund |
Consolidated Portfolio of Investments (continued)
August 31, 2013
| | | | | | | | | | | | |
| Corporate Bonds & Notes(d) (continued) | |
| Issuer | | Coupon
Rate | | | Principal
Amount ($) | | | Value ($) | |
NII Capital Corp. | |
04/01/21 | | | 7.625% | | | | 1,545,000 | | | | 1,181,925 | |
|
Sprint Communications, Inc.
Senior Unsecured | |
04/15/22 | | | 9.250% | | | | 522,000 | | | | 602,910 | |
| | | | | | | | | | | | | |
Total | | | | | | | | | | | 3,382,320 | |
| | | |
| | | | | | | | | | | | |
Wirelines 0.4% | |
Cincinnati Bell, Inc. | |
03/15/18 | | | 8.750% | | | | 1,215,000 | | | | 1,260,562 | |
|
Windstream Holdings, Inc. | |
03/15/19 | | | 7.000% | | | | 1,393,000 | | | | 1,427,825 | |
| | | | | | | | | | | | | |
Total | | | | | | | | | | | 2,688,387 | |
| | | | | | | | | | | | | |
Total Corporate Bonds & Notes
(Cost: $42,462,130) | | | | 41,881,582 | |
| | | |
| | | | | | | | | | | | |
| Convertible Bonds(d) 1.0% | |
Consumer Cyclical Services 0.3% | |
Stewart Enterprises, Inc. | |
07/15/16 | | | 3.375% | | | | 1,565,000 | | | | 2,026,675 | |
| | | |
| | | | | | | | | | | | |
Media Non-Cable —% | |
YPG Financing, Inc. | |
11/30/22 | | | 8.000% | | | CAD | 48,878 | | | | 39,815 | |
| | | |
| | | | | | | | | | | | |
Metals 0.2% | |
United States Steel Corp.
Senior Unsecured | |
05/15/14 | | | 4.000% | | | | 1,010,000 | | | | 1,030,831 | |
| | | |
| | | | | | | | | | | | |
Oil Field Services 0.2% | |
McMoRan Exploration Co.
Senior Unsecured | |
10/06/13 | | | 5.250% | | | | 952,000 | | | | $987,205 | |
| | | |
| | | | | | | | | | | | |
Technology 0.1% | |
Nortel Networks Corp.(f) | |
04/15/14 | | | 2.125% | | | | 779,000 | | | | 760,012 | |
| | | |
| | | | | | | | | | | | |
Wireless 0.2% | |
Clearwire Communications LLC/Finance, Inc.(e) | |
12/01/40 | | | 8.250% | | | | 380,000 | | | | 420,375 | |
|
Globalstar, Inc.
Senior Unsecured | |
04/01/28 | | | 8.000% | | | | 1,052,931 | | | | 1,117,423 | |
| | | | | | | | | | | | | |
Total | | | | | | | | | | | 1,537,798 | |
| | | | | | | | | | | | | |
Total Convertible Bonds
(Cost: $5,808,966) | | | | 6,382,336 | |
| | | | | | | | | | | | |
| Inflation-Indexed Bonds(d) 1.2% | |
| Issuer | | Coupon
Rate | | | Principal
Amount ($) | | | Value ($) | |
Australia 0.1% | |
Australia Government Bond
Senior Unsecured | |
02/21/22 | | | 1.250% | | | AUD | 1,018,046 | | | | 893,339 | |
| | | |
| | | | | | | | | | | | |
New Zealand 0.3% | |
New Zealand Government Bond
Senior Unsecured | |
09/20/25 | | | 2.000% | | | NZD | 2,694,246 | | | | 1,960,345 | |
| | | |
| | | | | | | | | | | | |
Turkey 0.8% | |
Turkey Government Bond | |
01/06/21 | | | 3.000% | | | TRY | 8,410,954 | | | | 3,918,057 | |
07/21/21 | | | 3.000% | | | TRY | 3,301,943 | | | | 1,527,370 | |
| | | | | | | | | | | | | |
Total | | | | | | | | | | | 5,445,427 | |
| | | | | | | | | | | | | |
Total Inflation-Indexed Bonds
(Cost: $9,602,886) | | | | 8,299,111 | |
| | | |
| | | | | | | | | | | | |
| Foreign Government Obligations(d) 6.1% | |
Albania 0.1% | |
Albania Government International Bond
Senior Unsecured | |
11/04/15 | | | 7.500% | | | EUR | 390,000 | | | | 529,412 | |
| | | |
| | | | | | | | | | | | |
Australia 0.3% | |
Australia Government Bond
Senior Unsecured | |
07/15/22 | | | 5.750% | | | AUD | 2,203,000 | | | | 2,239,800 | |
| | | |
| | | | | | | | | | | | |
Bahrain 0.2% | |
Bahrain Government International Bond
Senior Unsecured(e) | |
08/01/23 | | | 6.125% | | | | 1,123,000 | | | | 1,076,396 | |
| | | |
| | | | | | | | | | | | |
Bermuda 0.3% | |
Bermuda Government International Bond
Senior Unsecured(e) | |
02/06/24 | | | 4.854% | | | | 1,995,000 | | | | 1,950,266 | |
| | | |
| | | | | | | | | | | | |
Cyprus —% | |
Cyprus Government International Bond
Senior Unsecured(e) | |
02/03/20 | | | 4.625% | | | EUR | 180,000 | | | | 159,462 | |
| | | |
| | | | | | | | | | | | |
Guatemala 0.1% | |
Guatemala Government Bond
Senior Unsecured(e) | |
02/13/28 | | | 4.875% | | | | 740,000 | | | | 664,150 | |
| | | |
| | | | | | | | | | | | |
Jamaica 0.1% | |
Jamaica Government International Bond | |
06/20/17 | | | 10.625% | | | | 415,000 | | | | 452,350 | |
The accompanying Notes to Consolidated Financial Statements are an integral part of this statement.
| | |
| |
| Active Portfolios® Multi-Manager Alternative Strategies Fund | | |
Consolidated Portfolio of Investments (continued)
August 31, 2013
| | | | | | | | | | | | |
| Foreign Government Obligations(d) (continued) | |
| Issuer | | Coupon
Rate | | | Principal
Amount ($) | | | Value ($) | |
Senior Unsecured | |
06/24/19 | | | 8.000% | | | | 320,000 | | | | 314,400 | |
| | | | | | | | | | | | | |
Total | | | | | | | | | | | 766,750 | |
| | | |
| | | | | | | | | | | | |
Lebanon 0.1% | |
Lebanon Government Bond | |
07/17/14 | | | 9.000% | | | LBP | 377,530,000 | | | | 257,325 | |
08/28/14 | | | 8.380% | | | LBP | 228,640,000 | | | | 155,429 | |
| | | | | | | | | | | | | |
Total | | | | | | | | | | | 412,754 | |
| | | |
| | | | | | | | | | | | |
Mexico 1.3% | |
Mexican Bonos | |
06/19/14 | | | 7.000% | | | MXN | 95,643,000 | | | | 7,320,673 | |
12/18/14 | | | 9.500% | | | MXN | 12,500,000 | | | | 998,126 | |
| | | | | | | | | | | | | |
Total | | | | | | | | | | | 8,318,799 | |
| | | |
| | | | | | | | | | | | |
Mongolia 0.1% | |
Mongolia Government International Bond
Senior Unsecured(e) | |
01/05/18 | | | 4.125% | | | | 360,000 | | | | 321,233 | |
| | | |
| | | | | | | | | | | | |
Netherlands —% | |
Republic of Angola Via Northern Lights III BV
Senior Unsecured | |
08/16/19 | | | 7.000% | | | | 250,000 | | | | 265,000 | |
| | | |
| | | | | | | | | | | | |
New Zealand 0.2% | |
New Zealand Government Bond
Senior Unsecured | |
12/15/17 | | | 6.000% | | | NZD | 940,000 | | | | 788,535 | |
03/15/19 | | | 5.000% | | | NZD | 940,000 | | | | 759,092 | |
| | | | | | | | | | | | | |
Total | | | | | | | | | | | 1,547,627 | |
| | | |
| | | | | | | | | | | | |
Paraguay —% | |
Republic of Paraguay
Senior Unsecured(e) | |
01/25/23 | | | 4.625% | | | | 303,000 | | | | 275,730 | |
| | | |
| | | | | | | | | | | | |
Philippines 0.3% | |
Philippine Government International Bond
Senior Unsecured | |
01/14/36 | | | 6.250% | | | PHP | 87,000,000 | | | | 2,096,319 | |
| | | |
| | | | | | | | | | | | |
Romania 1.3% | |
Romania Government Bond | |
07/28/14 | | | 5.850% | | | RON | 1,850,000 | | | | 559,220 | |
04/30/15 | | | 6.000% | | | RON | 1,030,000 | | | | 315,305 | |
10/26/15 | | | 5.800% | | | RON | 9,660,000 | | | | 2,955,519 | |
01/27/16 | | | 5.750% | | | RON | 11,940,000 | | | | 3,663,554 | |
04/30/16 | | | 6.000% | | | RON | 420,000 | | | | 129,698 | |
07/26/17 | | | 5.900% | | | RON | 3,280,000 | | | | 1,017,984 | |
| | | | | | | | | | | | | |
Total | | | | | | | | | | | 8,641,280 | |
| | | | | | | | | | | | |
| Foreign Government Obligations(d) (continued) | |
| Issuer | | Coupon
Rate | | | Principal
Amount ($) | | | Value ($) | |
Rwanda 0.1% | |
Rwanda Government Bond
Senior Unsecured(e) | |
05/02/23 | | | 6.625% | | | | 1,090,000 | | | | 926,500 | |
| | | |
| | | | | | | | | | | | |
Serbia 0.3% | |
Serbia Government Bond | |
04/04/15 | | | 10.000% | | | RSD | 100,000,000 | | | | 1,130,287 | |
05/16/15 | | | 10.000% | | | RSD | 62,100,000 | | | | 699,812 | |
| | | | | | | | | | | | | |
Total | | | | | | | | | | | 1,830,099 | |
| | | |
| | | | | | | | | | | | |
Slovenia 0.7% | |
Slovenia Government Bond | |
01/18/21 | | | 4.375% | | | EUR | 1,386,000 | | | | 1,630,968 | |
Senior Unsecured | |
01/26/20 | | | 4.125% | | | EUR | 442,000 | | | | 521,955 | |
|
Slovenia Government Bond(e) | |
05/10/23 | | | 5.850% | | | | 2,794,000 | | | | 2,626,419 | |
| | | | | | | | | | | | | |
Total | | | | | | | | | | | 4,779,342 | |
| | | |
| | | | | | | | | | | | |
Sri Lanka 0.3% | |
Republic of Sri Lanka
Senior Unsecured(e) | |
07/27/21 | | | 6.250% | | | | 1,084,000 | | | | 1,008,120 | |
|
Sri Lanka Government International Bond
Senior Unsecured | |
07/27/21 | | | 6.250% | | | | 249,000 | | | | 231,570 | |
|
Sri Lanka Government International Bond(e)
Senior Unsecured | |
10/04/20 | | | 6.250% | | | | 318,000 | | | | 301,305 | |
07/25/22 | | | 5.875% | | | | 400,000 | | | | 356,032 | |
| | | | | | | | | | | | | |
Total | | | | | | | | | | | 1,897,027 | |
| | | |
| | | | | | | | | | | | |
Venezuela 0.3% | |
Venezuela Government International Bond
Senior Unsecured | |
10/08/14 | | | 8.500% | | | | 1,967,000 | | | | 1,980,769 | |
| | | | | | | | | | | | | |
Total Foreign Government Obligations
(Cost: $41,598,596) | | | | 40,678,715 | |
| | | |
| | | | | | | | | | | | |
| | | | | | | | | | | | | | | | |
| Treasury Bills(d) 16.9% | |
| Issuer | | Effective
Yield | | | | | | Principal
Amount ($) | | | Value ($) | |
Croatia 0.4% | |
Croatian Treasury Bills | |
02/12/15 | | | 4.740% | | | | EUR | | | | 2,442,000 | | | | 3,019,269 | |
| | | | |
| | | | | | | | | | | | | | | | |
Lebanon 0.4% | |
Lebanon Treasury Bills | |
10/10/13 | | | 4.650% | | | | LBP | | | | 249,150,000 | | | | 163,925 | |
11/07/13 | | | 4.630% | | | | LBP | | | | 79,220,000 | | | | 51,940 | |
11/21/13 | | | 4.680% | | | | LBP | | | | 463,310,000 | | | | 303,192 | |
12/05/13 | | | 4.730% | | | | LBP | | | | 494,010,000 | | | | 322,672 | |
12/19/13 | | | 4.760% | | | | LBP | | | | 310,820,000 | | | | 202,634 | |
The accompanying Notes to Consolidated Financial Statements are an integral part of this statement.
| | |
| |
| | Active Portfolios® Multi-Manager Alternative Strategies Fund |
Consolidated Portfolio of Investments (continued)
August 31, 2013
| | | | | | | | | | | | | | | | |
| Treasury Bills(d) (continued) | |
| Issuer | | Effective
Yield | | | | | | Principal
Amount ($) | | | Value ($) | |
01/02/14 | | | 4.790% | | | | LBP | | | | 616,200,000 | | | | 400,960 | |
01/16/14 | | | 4.850% | | | | LBP | | | | 787,380,000 | | | | 511,316 | |
07/10/14 | | | 5.210% | | | | LBP | | | | 539,710,000 | | | | 341,641 | |
07/24/14 | | | 5.300% | | | | LBP | | | | 407,690,000 | | | | 257,382 | |
| | | | | | | | | | | | | | | | | |
Total | | | | | | | | | | | | | | | 2,555,662 | |
| | | | |
| | | | | | | | | | | | | | | | |
Mexico 0.3% | |
Mexican Cetes | |
03/06/14 | | | 3.920% | | | | MXN | | | | 5,540,200 | | | | 406,449 | |
06/26/14 | | | 4.000% | | | | MXN | | | | 4,130,000 | | | | 299,266 | |
|
Mexican Treasury Bills | |
10/03/13 | | | 3.720% | | | | MXN | | | | 9,820,000 | | | | 732,436 | |
10/31/13 | | | 3.670% | | | | MXN | | | | 5,368,000 | | | | 399,277 | |
| | | | | | | | | | | | | | | | | |
Total | | | | | | | | | | | | | | | 1,837,428 | |
| | | | |
| | | | | | | | | | | | | | | | |
Norway 0.7% | |
Norway Treasury Bills | |
09/18/13 | | | 1.560% | | | | NOK | | | | 22,955,000 | | | | 3,747,871 | |
12/18/13 | | | 1.560% | | | | NOK | | | | 5,145,000 | | | | 836,773 | |
| | | | | | | | | | | | | | | | | |
Total | | | | | | | | | | | | | | | 4,584,644 | |
| | | | |
| | | | | | | | | | | | | | | | |
Romania 0.2% | |
Romania Treasury Bills | |
01/15/14 | | | 3.990% | | | | RON | | | | 4,500,000 | | | | 1,320,831 | |
| | | | |
| | | | | | | | | | | | | | | | |
Serbia 1.0% | |
Serbia Treasury Bills | |
12/12/13 | | | 9.940% | | | | RSD | | | | 121,890,000 | | | | 1,369,941 | |
02/20/14 | | | 10.040% | | | | RSD | | | | 300,000,000 | | | | 3,308,876 | |
04/03/14 | | | 10.300% | | | | RSD | | | | 14,310,000 | | | | 155,887 | |
05/22/14 | | | 10.600% | | | | RSD | | | | 64,200,000 | | | | 688,967 | |
05/29/14 | | | 10.640% | | | | RSD | | | | 106,000,000 | | | | 1,135,066 | |
| | | | | | | | | | | | | | | | | |
Total | | | | | | | | | | | | | | | 6,658,737 | |
| | | | |
| | | | | | | | | | | | | | | | |
Singapore 1.0% | |
Monetary Authority of Singapore | |
09/20/13 | | | 0.230% | | | | SGD | | | | 1,224,000 | | | | 959,420 | |
|
Singapore Treasury Bills | |
09/05/13 | | | 0.250% | | | | SGD | | | | 4,239,000 | | | | 3,323,003 | |
11/15/13 | | | 0.250% | | | | SGD | | | | 3,284,000 | | | | 2,573,097 | |
| | | | | | | | | | | | | | | | | |
Total | | | | | | | | | | | | | | | 6,855,520 | |
| | | | |
| | | | | | | | | | | | | | | | |
Turkey 0.1% | |
Turkey Treasury Bills | |
04/09/14 | | | 9.460% | | | | TRY | | | | 1,074,386 | | | | 498,791 | |
| | | | |
| | | | | | | | | | | | | | | | |
United States 12.7% | |
U.S. Treasury Bills | |
10/17/13 | | | 0.020% | | | | | | | | 5,000,000 | | | | 4,999,900 | |
12/12/13 | | | 0.020% | | | | | | | | 17,900,000 | | | | 17,898,872 | |
01/30/14 | | | 0.040% | | | | | | | | 13,336,500 | | | | 13,334,433 | |
02/06/14 | | | 0.040% | | | | | | | | 13,336,500 | | | | 13,334,193 | |
| | | | | | | | | | | | | | | | |
| Treasury Bills(d) (continued) | |
| Issuer | | Effective
Yield | | | | | | Principal
Amount ($) | | | Value ($) | |
U.S. Treasury Bills(l) | |
09/19/13 | | | 0.010% | | | | | | | | 20,200,000 | | | | 20,199,841 | |
10/24/13 | | | 0.020% | | | | | | | | 14,700,000 | | | | 14,699,456 | |
| | | | | | | | | | | | | | | | | |
Total | | | | | | | | | | | | | | | 84,466,695 | |
| | | | |
| | | | | | | | | | | | | | | | |
Zambia 0.1% | |
Zambia Treasury Bills | |
07/28/14 | | | 12.370% | | | | ZMW | | | | 1,100,000 | | | | 184,132 | |
08/25/14 | | | 13.010% | | | | ZMW | | | | 3,900,000 | | | | 643,651 | |
| | | | | | | | | | | | | | | | | |
Total | | | | | | | | | | | | | | | 827,783 | |
| | | | | | | | | | | | | | | | | |
Total Treasury Bills
(Cost: $113,080,982) | | | | | | | | 112,625,360 | |
| | | | |
| | | | | | | | | | | | | | | | |
| Exchange-Traded Funds ��% | | | | | |
| | | | | | | | | Shares | | | Value ($) | |
SPDR S&P 500 ETF Trust | | | | 939 | | | | 153,667 | |
| | | | | | | | | | | | | | | | | |
Total Exchange-Traded Funds
(Cost: $154,389) | | | | | | | | 153,667 | |
| | | | | | | | | | | | | | | | | | | | |
| Options Purchased Calls(j) —% | |
| Issuer | | Contracts | | | | | | Exercise
Price | | | Expiration
Date | | | Value ($) | |
Colombian Peso | |
| | | 532,200,000 | | | | COP | | | | 1,757.00 | | | | 02/18/14 | | | | 559 | |
| | | 1,458,400,000 | | | | COP | | | | 1,757.00 | | | | 02/18/14 | | | | 1,530 | |
| | | 841,000,000 | | | | COP | | | | 1,757.00 | | | | 02/18/14 | | | | 882 | |
| | | 714,914,000 | | | | COP | | | | 1,757.00 | | | | 02/18/14 | | | | 750 | �� |
| | | 2,188,231,000 | | | | COP | | | | 1,757.00 | | | | 02/18/14 | | | | 2,296 | |
| | | 812,250,000 | | | | COP | | | | 1,757.00 | | | | 02/18/14 | | | | 852 | |
| | | 2,260,370,000 | | | | COP | | | | 1,757.00 | | | | 02/18/14 | | | | 2,372 | |
| | | 2,296,050,000 | | | | COP | | | | 1,757.00 | | | | 02/18/14 | | | | 2,409 | |
|
Dell, Inc. | |
| | | 412 | | | | | | | | 13.00 | | | | 09/21/13 | | | | 33,784 | |
| | | 596 | | | | | | | | 13.00 | | | | 11/16/13 | | | | 51,256 | |
|
Kospi 200 Index | |
| | | 84 | | | | | | | | 300.00 | | | | 08/14/14 | | | | 129,220 | |
|
Leap Wireless International, Inc. | |
| | | 559 | | | | | | | | 18.00 | | | | 10/19/13 | | | | 2,236 | |
|
Onyx Pharmaceuticals, Inc. | |
| | | 100 | | | | | | | | 120.00 | | | | 10/19/13 | | | | 47,500 | |
| | | | | | | | | | | | | | | | | | | | | |
Total Options Purchased Calls
(Cost: $338,480) | | | | | | | | 275,646 | |
| | | | | |
| | | | | | | | | | | | | | | | | | | | |
| Options Purchased Puts(k) —% | |
Activision Blizzard, Inc. | |
| | | 325 | | | | | | | | 16.00 | | | | 09/21/13 | | | | 9,913 | |
|
Brent Crude Oil Futures | |
| | | 53 | | | | | | | | 94.80 | | | | 09/30/13 | | | | 6,360 | |
| | | |
British Pound | | | | | | | | | | | | | |
| | | 4,618,000 | | | | GBP | | | | 1.40 | | | | 03/13/14 | | | | 25,305 | |
| | | 9,251,000 | | | | GBP | | | | 1.35 | | | | 03/13/14 | | | | 26,106 | |
The accompanying Notes to Consolidated Financial Statements are an integral part of this statement.
| | |
| |
| Active Portfolios® Multi-Manager Alternative Strategies Fund | | |
Consolidated Portfolio of Investments (continued)
August 31, 2013
| | | | | | | | | | | | | | | | | | | | |
| Options Purchased Puts(k) (continued) | |
| Issuer | | Contracts | | | | | | Exercise
Price | | | Expiration
Date | | | Value ($) | |
Colombian Peso | | | | | | | | | | | | | |
| | | 1,790,000 | | | | | | | | 1,845.00 | | | | 06/12/14 | | | | 8,732 | |
|
Dole Food Co., Inc. | |
| | | 136 | | | | | | | | 11.00 | | | | 10/19/13 | | | | 340 | |
| | | | | |
Euro | | | | | | | | | | | | | | | | | | | | |
| | | 2,300,000 | | | | EUR | | | | 1.26 | | | | 10/31/13 | | | | 6,560 | |
| | | 4,586,018 | | | | EUR | | | | 1.26 | | | | 01/21/14 | | | | 45,610 | |
| | | 6,000,000 | | | | EUR | | | | 1.23 | | | | 04/29/14 | | | | 77,309 | |
|
Genworth Financial, Inc., Class A | |
| | | 340 | | | | | | | | 11.00 | | | | 10/19/13 | | | | 9,860 | |
|
Indian Rupee | |
| | | 1,863,000 | | | | | | | | 56.50 | | | | 06/09/14 | | | | 4,274 | |
| | | 1,871,000 | | | | | | | | 56.50 | | | | 06/09/14 | | | | 4,292 | |
| | | 3,696,000 | | | | | | | | 57.00 | | | | 06/16/14 | | | | 8,516 | |
| | | 2,944,341 | | | | | | | | 58.00 | | | | 06/19/14 | | | | 6,866 | |
| | | 2,082,000 | | | | | | | | 59.00 | | | | 07/01/14 | | | | 6,329 | |
| | | 2,186,000 | | | | | | | | 59.00 | | | | 07/01/14 | | | | 6,645 | |
|
Onyx Pharmaceuticals, Inc. | |
| | | 38 | | | | | | | | 115.00 | | | | 09/21/13 | | | | 1,710 | |
| | | | | | | | | | | | | | | | | | | | | |
Total Options Purchased Puts
(Cost: $1,251,115) | | | | | | | | 254,727 | |
| | | | | |
| | | | | | | | | | | | | | | | |
| | | | | | | | |
| Money Market Funds 25.2% | |
| | | Shares | | | Value ($) | |
Columbia Short-Term Cash Fund, 0.097%(g)(h)(i) | | | 167,785,255 | | | | 167,785,255 | |
| | |
JPMorgan Prime Money Market Fund, 0.010%(g)(l) | | | 1,250,170 | | | | 1,250,170 | |
| | | | | | | | | |
Total Money Market Funds
(Cost: $169,035,425) | | | | 169,035,425 | |
| | | | | | | | | |
Total Investments
(Cost: $617,325,869) | | | | 633,946,935 | |
| | |
| | | | | | | | |
| Investments Sold Short (6.1)% | |
| Common Stocks (5.0)% | |
| Issuer | | Shares | | | Value ($) | |
Consumer Discretionary (1.7)% | |
Auto Components (0.3)% | |
| | |
Goodyear Tire & Rubber Co. (The)(a) | | | (86,910 | ) | | | (1,748,629 | ) |
|
Diversified Consumer Services (0.2)% | |
| | |
Stewart Enterprises, Inc., Class A | | | (108,534 | ) | | | (1,419,625 | ) |
|
Media —% | |
| | |
Gannett Co. | | | (4,698 | ) | | | (113,175 | ) |
|
Multiline Retail (0.3)% | |
| | |
J.C. Penney Co., Inc.(a) | | | (153,587 | ) | | | (1,916,766 | ) |
|
Specialty Retail (0.6)% | |
| | |
Office Depot, Inc.(a) | | | (250,227 | ) | | | (1,048,451 | ) |
| | | | | | | | |
| Common Stocks (continued) | |
| Issuer | | Shares | | | Value ($) | |
Tiffany & Co. | | | (40,264 | ) | | | (3,104,757 | ) |
| | | | | | | | | |
Total | | | | | | | (4,153,208 | ) |
|
Textiles, Apparel & Luxury Goods (0.3)% | |
| | |
Michael Kors Holdings Ltd.(a) | | | (28,819 | ) | | | (2,135,199 | ) |
| | | | | | | | | |
Total Consumer Discretionary | | | | | | | (11,486,602 | ) |
| | |
| | | | | | | | |
Consumer Staples (0.1)% | |
Food & Staples Retailing (0.1)% | |
| | |
Loblaw Companies Ltd. | | | (6,368 | ) | | | (271,878 | ) |
| | | | | | | | | |
Total Consumer Staples | | | | | | | (271,878 | ) |
| | |
| | | | | | | | |
Energy (0.3)% | |
Oil, Gas & Consumable Fuels (0.3)% | |
| | |
Exxon Mobil Corp. | | | (22,055 | ) | | | (1,922,314 | ) |
| | | | | | | | | |
Total Energy | | | | | | | (1,922,314 | ) |
| | |
| | | | | | | | |
Financials (1.5)% | |
Commercial Banks (0.5)% | |
| | |
M&T Bank Corp. | | | (32,181 | ) | | | (3,647,395 | ) |
|
Diversified Financial Services (0.7)% | |
| | |
IntercontinentalExchange, Inc.(a) | | | (24,343 | ) | | | (4,375,654 | ) |
|
Insurance (0.1)% | |
| | |
Fidelity National Financial, Class A | | | (19,814 | ) | | | (469,790 | ) |
|
Real Estate Investment Trusts (REITs) (0.2)% | |
| | |
Regency Centers Corp. | | | (35,800 | ) | | | (1,702,290 | ) |
| | | | | | | | | |
Total Financials | | | | | | | (10,195,129 | ) |
| | |
| | | | | | | | |
Health Care (0.2)% | |
Pharmaceuticals (0.2)% | |
| | |
Perrigo Co. | | | (12,085 | ) | | | (1,468,932 | ) |
| | | | | | | | | |
Total Health Care | | | | | | | (1,468,932 | ) |
| | |
| | | | | | | | |
Industrials —% | |
Electrical Equipment —% | |
| | |
Schneider Electric SA | | | (1,081 | ) | | | (82,722 | ) |
|
Professional Services —% | |
| | |
Nielsen Holdings NV | | | (2,415 | ) | | | (83,317 | ) |
| | | | | | | | | |
Total Industrials | | | | | | | (166,039 | ) |
| | |
| | | | | | | | |
Information Technology (0.6)% | |
IT Services (0.2)% | |
| | |
Accenture PLC, Class A | | | (17,948 | ) | | | (1,296,743 | ) |
|
Software (0.4)% | |
| | |
Salesforce.com, Inc.(a) | | | (55,347 | ) | | | (2,719,198 | ) |
| | | | | | | | | |
Total Information Technology | | | | | | | (4,015,941 | ) |
The accompanying Notes to Consolidated Financial Statements are an integral part of this statement.
| | |
| |
| | Active Portfolios® Multi-Manager Alternative Strategies Fund |
Consolidated Portfolio of Investments (continued)
August 31, 2013
| | | | | | | | |
| Common Stocks (continued) | |
| Issuer | | Shares | | | Value ($) | |
Materials —% | |
Metals & Mining —% | |
| | |
United States Steel Corp. | | | (2,217 | ) | | | (39,684 | ) |
| | | | | | | | | |
Total Materials | | | | | | | (39,684 | ) |
| | |
| | | | | | | | |
Telecommunication Services (0.4)% | |
Diversified Telecommunication Services (0.4)% | |
| | |
AT&T, Inc. | | | (12,044 | ) | | | (407,449 | ) |
| | |
Verizon Communications, Inc. | | | (39,746 | ) | | | (1,883,165 | ) |
| | | | | | | | | |
Total | | | | | | | (2,290,614 | ) |
| | | | | | | | | |
Total Telecommunication Services | | | | | | | (2,290,614 | ) |
| | |
| | | | | | | | |
Utilities (0.2)% | |
Electric Utilities (0.2)% | |
| | |
Exelon Corp. | | | (45,022 | ) | | | (1,372,721 | ) |
| | |
Gas Utilities —% | | | | | | | | |
| | |
APA Group | | | (33,925 | ) | | | (180,409 | ) |
| | | | | | | | | |
Total Utilities | | | | | | | (1,553,130 | ) |
| | | | | | | | | |
Total Common Stocks | | | | | | | | |
(Proceeds: $31,039,279) | | | | | | | (33,410,263 | ) |
| | |
| | | | | | | | |
| | | | | | | | | | | | |
| Corporate Bonds & Notes (0.2)% | |
| Issuer | | Coupon
Rate | | | Principal
Amount ($) | | | Value ($) | |
Gas Pipelines (0.1)% | |
Kinder Morgan Energy Partners LP
Senior Unsecured | |
09/01/22 | | | 3.950% | | | | (726,000 | ) | | | (709,381 | ) |
| | | | | | | | | | | | |
| Corporate Bonds & Notes (continued) | |
| Issuer | | Coupon
Rate | | | Principal
Amount ($) | | | Value ($) | |
Wireless (0.1)% | |
SoftBank Corp. | |
04/15/20 | | | 4.500% | | | | (766,000 | ) | | | (724,207 | ) |
| | | | | | | | | | | | | |
Total Corporate Bonds & Notes
(Proceeds: $1,520,912) | | | | (1,433,588 | ) |
| | | |
| | | | | | | | | | | | |
| Exchange-Traded Funds (0.9)% | | | | | |
| | | | | | Shares | | | Value ($) | |
| | | |
Health Care Select Sector | | | | | | | (17,986 | ) | | | (885,271 | ) |
| | |
SPDR Barclays High Yield Bond ETF | | | | (73,984 | ) | | | (2,934,945 | ) |
| | | |
SPDR S&P 500 ETF Trust | | | | | | | (9,615 | ) | | | (1,573,495 | ) |
| | |
SPDR S&P 500 Insurance ETF | | | | (7,227 | ) | | | (393,221 | ) |
| | | | | | | | | | | | | |
Total Exchange-Traded Funds | | | | | | | | | |
(Proceeds: $5,761,671) | | | | | | | | | | | (5,786,932 | ) |
| | | |
| | | | | | | | | | | | |
| Exchange-Traded Notes —% | |
| | | |
iShares S&P | | | | | | | (17,778 | ) | | | (275,286 | ) |
| | |
Total Exchange-Traded Notes | | | | | | | | | |
(Proceeds: $305,765) | | | | | | | | | | | (275,286 | ) |
| | | | | | | | | | | | | |
Total Investments Sold Short | | | | | | | | | |
(Proceeds: $38,627,627) | | | | | | | | | | | (40,906,069 | ) |
| | | | | | | | | | | | | |
Total Investments, Net of Investments Sold Short | | | | | | | | 593,040,866 | |
| | | | | | | | | | | | | |
Other Assets & Liabilities, Net | | | | | | | | 73,186,707 | |
| | | | | | | | | | | | | |
Net Assets | | | | | | | | | | | 666,227,573 | |
| | | | | | | | | | | | | |
Investments in Derivatives
Forward Foreign Currency Exchange Contracts Open at August 31, 2013
At August 31, 2013, securities and cash totaling $4,022,977 were pledged as collateral to cover forward foreign currency exchange contracts.
| | | | | | | | | | | | | | | | | | | | | | | | | | | | |
| Counterparty | | Exchange
Date | | | Currency to be
Delivered | | | Currency to be
Received | | | Unrealized
Appreciation
($) | | | Unrealized
Depreciation
($) | |
J.P. Morgan Securities, Inc. | | | September 3, 2013 | | | | USD | | | | 365,542 | | | | PHP | | | | 15,812,252 | | | | — | | | | (11,007 | ) |
| | | | | | | |
Goldman, Sachs & Co. | | | September 3, 2013 | | | | USD | | | | 719,406 | | | | PHP | | | | 31,119,357 | | | | — | | | | (21,663 | ) |
| | | | | | | |
Goldman, Sachs & Co. | | | September 5, 2013 | | | | USD | | | | 663,130 | | | | PHP | | | | 28,815,000 | | | | — | | | | (17,052 | ) |
| | | | | | | |
J.P. Morgan Securities, Inc. | | | September 5, 2013 | | | | USD | | | | 697,801 | | | | PHP | | | | 30,332,000 | | | | — | | | | (17,708 | ) |
| | | | | | | |
Goldman, Sachs & Co. | | | September 5, 2013 | | | | USD | | | | 6,059,934 | | | | MYR | | | | 19,676,000 | | | | — | | | | (71,680 | ) |
| | | | | | | |
Standard Chartered Bank | | | September 5, 2013 | | | | MYR | | | | 6,241,000 | | | | USD | | | | 1,917,829 | | | | 18,425 | | | | — | |
| | | | | | | |
Standard Chartered Bank | | | September 5, 2013 | | | | USD | | | | 6,292,271 | | | | RUB | | | | 209,218,000 | | | | — | | | | (19,275 | ) |
| | | | | | | |
J.P. Morgan Securities, Inc. | | | September 5, 2013 | | | | MYR | | | | 6,735,000 | | | | USD | | | | 2,068,870 | | | | 19,121 | | | | — | |
| | | | | | | |
Goldman, Sachs & Co. | | | September 5, 2013 | | | | MYR | | | | 6,898,000 | | | | USD | | | | 2,119,201 | | | | 19,844 | | | | — | |
| | | | | | | |
Standard Chartered Bank | | | September 5, 2013 | | | | RUB | | | | 52,354,818 | | | | USD | | | | 1,589,761 | | | | 20,005 | | | | — | |
| | | | | | | |
Citibank | | | September 5, 2013 | | | | RUB | | | | 156,863,112 | | | | USD | | | | 4,761,725 | | | | 58,489 | | | | — | |
| | | | | | | |
J.P. Morgan Securities, Inc. | | | September 6, 2013 | | | | USD | | | | 1,053,696 | | | | PHP | | | | 46,931,609 | | | | — | | | | (1,378 | ) |
| | | | | | | |
Standard Chartered Bank | | | September 6, 2013 | | | | PHP | | | | 139,416,677 | | | | USD | | | | 3,126,285 | | | | 328 | | | | — | |
The accompanying Notes to Consolidated Financial Statements are an integral part of this statement.
| | |
| |
| Active Portfolios® Multi-Manager Alternative Strategies Fund | | |
Consolidated Portfolio of Investments (continued)
August 31, 2013
Forward Foreign Currency Exchange Contracts Open at August 31, 2013 (continued)
| | | | | | | | | | | | | | | | | | | | | | | | | | | | |
| Counterparty | | Exchange
Date | | | Currency to be
Delivered | | | Currency to be
Received | | | Unrealized
Appreciation
($) | | | Unrealized
Depreciation
($) | |
Standard Chartered Bank | | | September 9, 2013 | | | | EUR | | | | 272,067 | | | | NOK | | | | 2,147,000 | | | | — | | | | (8,822 | ) |
| | | | | | | |
Standard Chartered Bank | | | September 9, 2013 | | | | NOK | | | | 2,147,000 | | | | EUR | | | | 265,068 | | | | — | | | | (428 | ) |
| | | | | | | |
Goldman, Sachs & Co. | | | September 10, 2013 | | | | USD | | | | 959,448 | | | | INR | | | | 59,587,000 | | | | — | | | | (61,406 | ) |
| | | | | | | |
Wells Fargo Investments, LLC | | | September 10, 2013 | | | | USD | | | | 1,429,995 | | | | EUR | | | | 1,081,000 | | | | — | | | | (1,264 | ) |
| | | | | | | |
Goldman, Sachs & Co. | | | September 10, 2013 | | | | EUR | | | | 2,401,731 | | | | USD | | | | 3,127,027 | | | | — | | | | (47,282 | ) |
| | | | | | | |
Goldman, Sachs & Co. | | | September 10, 2013 | | | | USD | | | | 2,438,635 | | | | EUR | | | | 1,859,817 | | | | 19,440 | | | | — | |
| | | | | | | |
Goldman, Sachs & Co. | | | September 10, 2013 | | | | USD | | | | 8,655,150 | | | | EUR | | | | 6,496,517 | | | | — | | | | (68,861 | ) |
| | | | | | | |
Wells Fargo Investments, LLC | | | September 10, 2013 | | | | EUR | | | | 15,810,744 | | | | USD | | | | 20,779,666 | | | | — | | | | (117,012 | ) |
| | | | | | | |
Standard Chartered Bank | | | September 10, 2013 | | | | RUB | | | | 49,131,990 | | | | USD | | | | 1,504,601 | | | | 32,505 | | | | — | |
| | | | | | | |
Standard Chartered Bank | | | September 11, 2013 | | | | USD | | | | 30,783 | | | | ZAR | | | | 312,000 | | | | — | | | | (469 | ) |
| | | | | | | |
Goldman, Sachs & Co. | | | September 11, 2013 | | | | TRY | | | | 576,568 | | | | USD | | | | 297,200 | | | | 14,766 | | | | — | |
| | | | | | | |
Goldman, Sachs & Co. | | | September 12, 2013 | | | | USD | | | | 745,506 | | | | ILS | | | | 2,671,000 | | | | — | | | | (10,271 | ) |
| | | | | | | |
Citibank | | | September 13, 2013 | | | | RSD | | | | 59,657,000 | | | | EUR | | | | 517,127 | | | | — | | | | (4,663 | ) |
| | | | | | | |
Goldman, Sachs & Co. | | | September 16, 2013 | | | | GBP | | | | 161,150 | | | | USD | | | | 249,148 | | | | — | | | | (563 | ) |
| | | | | | | |
Goldman, Sachs & Co. | | | September 16, 2013 | | | | USD | | | | 307,592 | | | | EUR | | | | 230,000 | | | | — | | | | (3,601 | ) |
| | | | | | | |
Goldman, Sachs & Co. | | | September 16, 2013 | | | | USD | | | | 364,606 | | | | CAD | | | | 377,000 | | | | — | | | | (6,789 | ) |
| | | | | | | |
Goldman, Sachs & Co. | | | September 16, 2013 | | | | USD | | | | 411,270 | | | | AUD | | | | 455,000 | | | | — | | | | (6,616 | ) |
| | | | | | | |
J.P. Morgan Securities, Inc. | | | September 16, 2013 | | | | USD | | | | 862,904 | | | | RUB | | | | 27,600,000 | | | | — | | | | (36,645 | ) |
| | | | | | | |
Goldman, Sachs & Co. | | | September 16, 2013 | | | | USD | | | | 1,566,824 | | | | NOK | | | | 9,515,000 | | | | — | | | | (12,738 | ) |
| | | | | | | |
Goldman, Sachs & Co. | | | September 16, 2013 | | | | AUD | | | | 3,617,500 | | | | USD | | | | 3,301,750 | | | | 84,526 | | | | — | |
| | | | | | | |
Goldman, Sachs & Co. | | | September 16, 2013 | | | | CAD | | | | 6,171,000 | | | | USD | | | | 5,982,603 | | | | 125,608 | | | | — | |
| | | | | | | |
Goldman, Sachs & Co. | | | September 16, 2013 | | | | EUR | | | | 7,421,000 | | | | USD | | | | 9,874,008 | | | | 65,660 | | | | — | |
| | | | | | | |
Goldman, Sachs & Co. | | | September 16, 2013 | | | | NOK | | | | 13,254,000 | | | | USD | | | | 2,256,318 | | | | 91,540 | | | | — | |
| | | | | | | |
Goldman, Sachs & Co. | | | September 16, 2013 | | | | THB | | | | 18,950,000 | | | | USD | | | | 585,926 | | | | — | | | | (2,360 | ) |
| | | | | | | |
J.P. Morgan Securities, Inc. | | | September 16, 2013 | | | | RUB | | | | 27,600,000 | | | | USD | | | | 854,040 | | | | 27,780 | | | | — | |
| | | | | | | |
Goldman, Sachs & Co. | | | September 16, 2013 | | | | THB | | | | 56,131,000 | | | | USD | | | | 1,777,382 | | | | 34,842 | | | | — | |
| | | | | | | |
Goldman, Sachs & Co. | | | September 17, 2013 | | | | JPY | | | | 1,520,096,000 | | | | USD | | | | 15,315,829 | | | | — | | | | (167,018 | ) |
| | | | | | | |
Royal Bank of Scotland | | | September 18, 2013 | | | | CHF | | | | 11,000 | | | | USD | | | | 11,850 | | | | 26 | | | | — | |
| | | | | | | |
Royal Bank of Scotland | | | September 18, 2013 | | | | USD | | | | 14,588 | | | | TRY | | | | 30,000 | | | | 89 | | | | — | |
| | | | | | | |
Royal Bank of Scotland | | | September 18, 2013 | | | | USD | | | | 37,853 | | | | CHF | | | | 35,000 | | | | — | | | | (234 | ) |
| | | | | | | |
Royal Bank of Scotland | | | September 18, 2013 | | | | AUD | | | | 40,000 | | | | USD | | | | 35,541 | | | | — | | | | (29 | ) |
| | | | | | | |
Royal Bank of Scotland | | | September 18, 2013 | | | | USD | | | | 52,990 | | | | CAD | | | | 56,000 | | | | 158 | | | | — | |
| | | | | | | |
Royal Bank of Scotland | | | September 18, 2013 | | | | USD | | | | 78,274 | | | | SGD | | | | 100,000 | | | | 122 | | | | — | |
| | | | | | | |
Royal Bank of Scotland | | | September 18, 2013 | | | | USD | | | | 163,205 | | | | INR | | | | 11,000,000 | | | | 1,634 | | | | — | |
| | | | | | | |
Royal Bank of Scotland | | | September 18, 2013 | | | | USD | | | | 196,453 | | | | HUF | | | | 45,000,000 | | | | 755 | | | | — | |
| | | | | | | |
Royal Bank of Scotland | | | September 18, 2013 | | | | USD | | | | 298,879 | | | | BRL | | | | 720,000 | | | | 1,897 | | | | — | |
| | | | | | | |
Royal Bank of Scotland | | | September 18, 2013 | | | | CHF | | | | 367,000 | | | | USD | | | | 388,606 | | | | — | | | | (5,868 | ) |
| | | | | | | |
Royal Bank of Scotland | | | September 18, 2013 | | | | USD | | | | 392,576 | | | | CHF | | | | 369,000 | | | | 4,047 | | | | — | |
| | | | | | | |
Royal Bank of Scotland | | | September 18, 2013 | | | | USD | | | | 407,177 | | | | COP | | | | 780,000,000 | | | | — | | | | (4,167 | ) |
| | | | | | | |
Goldman, Sachs & Co. | | | September 18, 2013 | | | | EUR | | | | 564,058 | | | | ILS | | | | 2,650,000 | | | | — | | | | (16,187 | ) |
| | | | | | | |
Royal Bank of Scotland | | | September 18, 2013 | | | | USD | | | | 607,513 | | | | BRL | | | | 1,410,000 | | | | — | | | | (18,493 | ) |
| | | | | | | |
Royal Bank of Scotland | | | September 18, 2013 | | | | USD | | | | 611,621 | | | | IDR | | | | 6,200,000,000 | | | | — | | | | (56,008 | ) |
| | | | | | | |
Royal Bank of Scotland | | | September 18, 2013 | | | | MYR | | | | 700,000 | | | | USD | | | | 210,213 | | | | — | | | | (1,971 | ) |
The accompanying Notes to Consolidated Financial Statements are an integral part of this statement.
| | |
| |
| | Active Portfolios® Multi-Manager Alternative Strategies Fund |
Consolidated Portfolio of Investments (continued)
August 31, 2013
Forward Foreign Currency Exchange Contracts Open at August 31, 2013 (continued)
| | | | | | | | | | | | | | | | | | | | | | | | | | | | |
| Counterparty | | Exchange
Date | | | Currency to be
Delivered | | | Currency to be
Received | | | Unrealized
Appreciation
($) | | | Unrealized
Depreciation
($) | |
Royal Bank of Scotland | | | September 18, 2013 | | | | USD | | | | 729,016 | | | | PHP | | | | 30,800,000 | | | | — | | | | (38,397 | ) |
| | | | | | | |
Royal Bank of Scotland | | | September 18, 2013 | | | | USD | | | | 973,071 | | | | ZAR | | | | 10,100,000 | | | | 7,194 | | | | — | |
| | | | | | | |
Standard Chartered Bank | | | September 18, 2013 | | | | EUR | | | | 1,137,625 | | | | PLN | | | | 4,858,000 | | | | — | | | | (1,809 | ) |
| | | | | | | |
Royal Bank of Scotland | | | September 18, 2013 | | | | GBP | | | | 1,762,000 | | | | USD | | | | 2,745,390 | | | | 15,113 | | | | — | |
| | | | | | | |
Royal Bank of Scotland | | | September 18, 2013 | | | | USD | | | | 1,804,871 | | | | ZAR | | | | 18,100,000 | | | | — | | | | (48,157 | ) |
| | | | | | | |
Standard Chartered Bank | | | September 18, 2013 | | | | USD | | | | 2,280,610 | | | | INR | | | | 137,116,000 | | | | — | | | | (225,884 | ) |
| | | | | | | |
Royal Bank of Scotland | | | September 18, 2013 | | | | USD | | | | 2,346,073 | | | | TWD | | | | 70,400,000 | | | | 7,230 | | | | — | |
| | | | | | | |
Royal Bank of Scotland | | | September 18, 2013 | | | | USD | | | | 2,555,981 | | | | MYR | | | | 8,040,000 | | | | — | | | | (118,899 | ) |
| | | | | | | |
Royal Bank of Scotland | | | September 18, 2013 | | | | ZAR | | | | 2,600,000 | | | | USD | | | | 249,867 | | | | — | | | | (2,479 | ) |
| | | | | | | |
Royal Bank of Scotland | | | September 18, 2013 | | | | USD | | | | 2,655,226 | | | | TWD | | | | 79,300,000 | | | | — | | | | (4,418 | ) |
| | | | | | | |
Royal Bank of Scotland | | | September 18, 2013 | | | | USD | | | | 3,023,480 | | | | ILS | | | | 11,000,000 | | | | 3,946 | | | | — | |
| | | | | | | |
Royal Bank of Scotland | | | September 18, 2013 | | | | SGD | | | | 3,050,000 | | | | USD | | | | 2,382,779 | | | | — | | | | (8,296 | ) |
| | | | | | | |
Royal Bank of Scotland | | | September 18, 2013 | | | | USD | | | | 3,246,961 | | | | TRY | | | | 6,210,000 | | | | — | | | | (208,945 | ) |
| | | | | | | |
Royal Bank of Scotland | | | September 18, 2013 | | | | USD | | | | 3,363,312 | | | | SGD | | | | 4,220,000 | | | | — | | | | (55,004 | ) |
| | | | | | | |
Royal Bank of Scotland | | | September 18, 2013 | | | | USD | | | | 3,591,649 | | | | CZK | | | | 70,600,000 | | | | 33,658 | | | | — | |
| | | | | | | |
Royal Bank of Scotland | | | September 18, 2013 | | | | USD | | | | 3,846,810 | | | | ILS | | | | 13,800,000 | | | | — | | | | (48,768 | ) |
| | | | | | | |
Royal Bank of Scotland | | | September 18, 2013 | | | | PLN | | | | 4,310,000 | | | | USD | | | | 1,347,180 | | | | 14,788 | | | | — | |
| | | | | | | |
Royal Bank of Scotland | | | September 18, 2013 | | | | MXN | | | | 4,500,000 | | | | USD | | | | 335,628 | | | | — | | | | (742 | ) |
| | | | | | | |
Royal Bank of Scotland | | | September 18, 2013 | | | | USD | | | | 4,732,282 | | | | HUF | | | | 1,075,000,000 | | | | — | | | | (21,211 | ) |
| | | | | | | |
Royal Bank of Scotland | | | September 18, 2013 | | | | USD | | | | 5,447,165 | | | | PLN | | | | 17,780,000 | | | | 49,342 | | | | — | |
| | | | | | | |
Royal Bank of Scotland | | | September 18, 2013 | | | | CAD | | | | 5,935,000 | | | | USD | | | | 5,622,541 | | | | — | | | | (10,185 | ) |
| | | | | | | |
Royal Bank of Scotland | | | September 18, 2013 | | | | USD | | | | 6,232,311 | | | | PLN | | | | 19,930,000 | | | | — | | | | (71,155 | ) |
| | | | | | | |
Royal Bank of Scotland | | | September 18, 2013 | | | | USD | | | | 6,775,075 | | | | INR | | | | 394,800,000 | | | | — | | | | (858,873 | ) |
| | | | | | | |
Royal Bank of Scotland | | | September 18, 2013 | | | | ILS | | | | 6,900,000 | | | | USD | | | | 1,916,459 | | | | 17,437 | | | | — | |
| | | | | | | |
Royal Bank of Scotland | | | September 18, 2013 | | | | USD | | | | 7,122,765 | | | | MXN | | | | 91,700,000 | | | | — | | | | (268,304 | ) |
| | | | | | | |
Royal Bank of Scotland | | | September 18, 2013 | | | | USD | | | | 7,734,686 | | | | CZK | | | | 149,400,000 | | | | — | | | | (63,004 | ) |
| | | | | | | |
Royal Bank of Scotland | | | September 18, 2013 | | | | BRL | | | | 8,590,000 | | | | USD | | | | 3,911,150 | | | | 322,722 | | | | — | |
| | | | | | | |
Royal Bank of Scotland | | | September 18, 2013 | | | | NZD | | | | 8,942,000 | | | | USD | | | | 6,885,135 | | | | — | | | | (18,691 | ) |
| | | | | | | |
Royal Bank of Scotland | | | September 18, 2013 | | | | ILS | | | | 9,100,000 | | | | USD | | | | 2,484,626 | | | | — | | | | (19,883 | ) |
| | | | | | | |
Royal Bank of Scotland | | | September 18, 2013 | | | | USD | | | | 9,348,620 | | | | RUB | | | | 306,600,000 | | | | — | | | | (172,528 | ) |
| | | | | | | |
Royal Bank of Scotland | | | September 18, 2013 | | | | SGD | | | | 10,540,000 | | | | USD | | | | 8,330,117 | | | | 67,188 | | | | — | |
| | | | | | | |
Royal Bank of Scotland | | | September 18, 2013 | | | | MYR | | | | 13,230,000 | | | | USD | | | | 4,101,403 | | | | 91,129 | | | | — | |
| | | | | | | |
Royal Bank of Scotland | | | September 18, 2013 | | | | EUR | | | | 13,248,000 | | | | USD | | | | 17,656,606 | | | | 146,590 | | | | — | |
| | | | | | | |
Royal Bank of Scotland | | | September 18, 2013 | | | | TRY | | | | 14,710,000 | | | | USD | | | | 7,635,118 | | | | 438,784 | | | | — | |
| | | | | | | |
Royal Bank of Scotland | | | September 18, 2013 | | | | RUB | | | | 17,000,000 | | | | USD | | | | 505,613 | | | | — | | | | (3,173 | ) |
| | | | | | | |
Royal Bank of Scotland | | | September 18, 2013 | | | | USD | | | | 17,036,213 | | | | AUD | | | | 18,573,000 | | | | — | | | | (520,480 | ) |
| | | | | | | |
Royal Bank of Scotland | | | September 18, 2013 | | | | USD | | | | 18,221,195 | | | | NOK | | | | 107,159,000 | | | | — | | | | (720,194 | ) |
| | | | | | | |
Royal Bank of Scotland | | | September 18, 2013 | | | | USD | | | | 19,759,021 | | | | CAD | | | | 20,420,000 | | | | — | | | | (379,027 | ) |
| | | | | | | |
Royal Bank of Scotland | | | September 18, 2013 | | | | USD | | | | 22,329,256 | | | | GBP | | | | 14,323,000 | | | | — | | | | (135,305 | ) |
| | | | | | | |
Royal Bank of Scotland | | | September 18, 2013 | | | | EUR | | | | 22,734,000 | | | | USD | | | | 29,687,720 | | | | — | | | | (360,042 | ) |
| | | | | | | |
Royal Bank of Scotland | | | September 18, 2013 | | | | PLN | | | | 23,100,000 | | | | USD | | | | 6,940,743 | | | | — | | | | (200,387 | ) |
| | | | | | | |
Royal Bank of Scotland | | | September 18, 2013 | | | | USD | | | | 23,927,917 | | | | JPY | | | | 2,385,140,000 | | | | 365,890 | | | | — | |
| | | | | | | |
Royal Bank of Scotland | | | September 18, 2013 | | | | USD | | | | 26,571,870 | | | | GBP | | | | 17,343,000 | | | | 301,669 | | | | — | |
The accompanying Notes to Consolidated Financial Statements are an integral part of this statement.
| | |
| |
| Active Portfolios® Multi-Manager Alternative Strategies Fund | | |
Consolidated Portfolio of Investments (continued)
August 31, 2013
Forward Foreign Currency Exchange Contracts Open at August 31, 2013 (continued)
| | | | | | | | | | | | | | | | | | | | | | | | | | | | |
| Counterparty | | Exchange
Date | | | Currency to be
Delivered | | | Currency to be
Received | | | Unrealized
Appreciation
($) | | | Unrealized
Depreciation
($) | |
Royal Bank of Scotland | | | September 18, 2013 | | | | USD | | | | 27,304,670 | | | | SEK | | | | 177,756,000 | | | | — | | | | (491,527 | ) |
| | | | | | | |
Royal Bank of Scotland | | | September 18, 2013 | | | | NOK | | | | 27,700,000 | | | | USD | | | | 4,480,160 | | | | — | | | | (43,752 | ) |
| | | | | | | |
Royal Bank of Scotland | | | September 18, 2013 | | | | GBP | | | | 30,225,000 | | | | USD | | | | 45,769,935 | | | | — | | | | (1,064,681 | ) |
| | | | | | | |
Royal Bank of Scotland | | | September 18, 2013 | | | | USD | | | | 34,572,535 | | | | NZD | | | | 43,464,000 | | | | — | | | | (1,015,402 | ) |
| | | | | | | |
Royal Bank of Scotland | | | September 18, 2013 | | | | CAD | | | | 45,452,000 | | | | USD | | | | 43,699,170 | | | | 562,072 | | | | — | |
| | | | | | | |
Royal Bank of Scotland | | | September 18, 2013 | | | | AUD | | | | 45,561,000 | | | | USD | | | | 42,964,184 | | | | 2,449,821 | | | | — | |
| | | | | | | |
Royal Bank of Scotland | | | September 18, 2013 | | | | NZD | | | | 46,629,000 | | | | USD | | | | 36,747,544 | | | | 746,815 | | | | — | |
| | | | | | | |
Royal Bank of Scotland | | | September 18, 2013 | | | | USD | | | | 73,800,514 | | | | EUR | | | | 56,639,000 | | | | 1,059,835 | | | | — | |
| | | | | | | |
Royal Bank of Scotland | | | September 18, 2013 | | | | ZAR | | | | 74,300,000 | | | | USD | | | | 7,325,115 | | | | 113,856 | | | | — | |
| | | | | | | |
Royal Bank of Scotland | | | September 18, 2013 | | | | USD | | | | 79,121,807 | | | | JPY | | | | 7,674,980,000 | | | | — | | | | (948,414 | ) |
| | | | | | | |
Royal Bank of Scotland | | | September 18, 2013 | | | | USD | | | | 80,988,170 | | | | EUR | | | | 60,922,000 | | | | — | | | | (466,937 | ) |
| | | | | | | |
Royal Bank of Scotland | | | September 18, 2013 | | | | COP | | | | 90,000,000 | | | | USD | | | | 45,965 | | | | — | | | | (536 | ) |
| | | | | | | |
Royal Bank of Scotland | | | September 18, 2013 | | | | MXN | | | | 93,800,000 | | | | USD | | | | 7,262,303 | | | | 250,868 | | | | — | |
| | | | | | | |
Royal Bank of Scotland | | | September 18, 2013 | | | | SEK | | | | 105,170,000 | | | | USD | | | | 15,618,270 | | | | — | | | | (245,827 | ) |
| | | | | | | |
Royal Bank of Scotland | | | September 18, 2013 | | | | SEK | | | | 127,333,000 | | | | USD | | | | 19,369,093 | | | | 161,877 | | | | — | |
| | | | | | | |
Royal Bank of Scotland | | | September 18, 2013 | | | | PHP | | | | 166,000,000 | | | | USD | | | | 3,857,057 | | | | 134,888 | | | | — | |
| | | | | | | |
Royal Bank of Scotland | | | September 18, 2013 | | | | TWD | | | | 166,000,000 | | | | USD | | | | 5,568,271 | | | | 19,289 | | | | — | |
| | | | | | | |
Royal Bank of Scotland | | | September 18, 2013 | | | | TWD | | | | 168,100,000 | | | | USD | | | | 5,607,981 | | | | — | | | | (11,200 | ) |
| | | | | | | |
Royal Bank of Scotland | | | September 18, 2013 | | | | NOK | | | | 206,191,000 | | | | USD | | | | 34,476,974 | | | | 802,258 | | | | — | |
| | | | | | | |
Royal Bank of Scotland | | | September 18, 2013 | | | | CZK | | | | 217,100,000 | | | | USD | | | | 11,009,051 | | | | — | | | | (139,025 | ) |
| | | | | | | |
Royal Bank of Scotland | | | September 18, 2013 | | | | RUB | | | | 393,700,000 | | | | USD | | | | 11,957,866 | | | | 174,997 | | | | — | |
| | | | | | | |
Royal Bank of Scotland | | | September 18, 2013 | | | | HUF | | | | 409,000,000 | | | | USD | | | | 1,778,324 | | | | — | | | | (14,074 | ) |
| | | | | | | |
Royal Bank of Scotland | | | September 18, 2013 | | | | INR | | | | 602,000,000 | | | | USD | | | | 10,115,433 | | | | 1,094,274 | | | | — | |
| | | | | | | |
Royal Bank of Scotland | | | September 18, 2013 | | | | HUF | | | | 957,000,000 | | | | USD | | | | 4,230,150 | | | | 36,201 | | | | — | |
| | | | | | | |
Royal Bank of Scotland | | | September 18, 2013 | | | | JPY | | | | 1,088,549,000 | | | | USD | | | | 11,143,769 | | | | 56,371 | | | | — | |
| | | | | | | |
Royal Bank of Scotland | | | September 18, 2013 | | | | COP | | | | 1,480,000,000 | | | | USD | | | | 769,815 | | | | 5,129 | | | | — | |
| | | | | | | |
Royal Bank of Scotland | | | September 18, 2013 | | | | JPY | | | | 8,912,362,000 | | | | USD | | | | 89,710,545 | | | | — | | | | (1,066,184 | ) |
| | | | | | | |
Royal Bank of Scotland | | | September 18, 2013 | | | | IDR | | | | 25,700,000,000 | | | | USD | | | | 2,460,177 | | | | 157,073 | | | | — | |
| | | | | | | |
Goldman, Sachs & Co. | | | September 19, 2013 | | | | ZAR | | | | 44,256,000 | | | | USD | | | | 4,356,206 | | | | 61,548 | | | | — | |
| | | | | | | |
Goldman, Sachs & Co. | | | September 23, 2013 | | | | USD | | | | 1,086,782 | | | | INR | | | | 65,859,000 | | | | — | | | | (103,396 | ) |
| | | | | | | |
Royal Bank of Scotland | | | September 23, 2013 | | | | USD | | | | 1,131,516 | | | | CLP | | | | 575,000,000 | | | | — | | | | (8,277 | ) |
| | | | | | | |
Royal Bank of Scotland | | | September 23, 2013 | | | | USD | | | | 13,471,044 | | | | KRW | | | | 15,210,000,000 | | | | 213,866 | | | | — | |
| | | | | | | |
Royal Bank of Scotland | | | September 23, 2013 | | | | CLP | | | | 340,000,000 | | | | USD | | | | 673,312 | | | | 9,135 | | | | — | |
| | | | | | | |
Royal Bank of Scotland | | | September 23, 2013 | | | | CLP | | | | 360,000,000 | | | | USD | | | | 693,413 | | | | — | | | | (9,831 | ) |
| | | | | | | |
Royal Bank of Scotland | | | September 23, 2013 | | | | KRW | | | | 12,670,000,000 | | | | USD | | | | 11,204,795 | | | | — | | | | (194,798 | ) |
| | | | | | | |
Citibank | | | September 25, 2013 | | | | USD | | | | 762,341 | | | | ILS | | | | 2,715,000 | | | | — | | | | (15,261 | ) |
| | | | | | | |
Standard Chartered Bank | | | September 25, 2013 | | | | USD | | | | 1,871,865 | | | | ILS | | | | 6,666,700 | | | | — | | | | (37,405 | ) |
| | | | | | | |
J.P. Morgan Securities, Inc. | | | September 25, 2013 | | | | USD | | | | 1,930,732 | | | | PHP | | | | 83,383,000 | | | | — | | | | (61,011 | ) |
| | | | | | | |
Goldman, Sachs & Co. | | | September 25, 2013 | | | | USD | | | | 2,580,968 | | | | TWD | | | | 77,300,000 | | | | 3,378 | | | | — | |
| | | | | | | |
Standard Chartered Bank | | | September 25, 2013 | | | | TWD | | | | 38,650,000 | | | | USD | | | | 1,281,499 | | | | — | | | | (10,675 | ) |
| | | | | | | |
Goldman, Sachs & Co. | | | September 25, 2013 | | | | TWD | | | | 38,650,000 | | | | USD | | | | 1,284,053 | | | | — | | | | (8,120 | ) |
| | | | | | | |
Standard Chartered Bank | | | September 26, 2013 | | | | USD | | | | 2,084,018 | | | | COP | | | | 3,971,200,000 | | | | — | | | | (33,707 | ) |
| | | | | | | |
J.P. Morgan Securities, Inc. | | | September 27, 2013 | | | | INR | | | | 34,076,475 | | | | USD | | | | 522,085 | | | | 14,727 | | | | — | |
The accompanying Notes to Consolidated Financial Statements are an integral part of this statement.
| | |
| |
| | Active Portfolios® Multi-Manager Alternative Strategies Fund |
Consolidated Portfolio of Investments (continued)
August 31, 2013
Forward Foreign Currency Exchange Contracts Open at August 31, 2013 (continued)
| | | | | | | | | | | | | | | | | | | | | | | | | | | | |
| Counterparty | | Exchange
Date | | | Currency to be
Delivered | | | Currency to be
Received | | | Unrealized
Appreciation
($) | | | Unrealized
Depreciation
($) | |
Goldman, Sachs & Co. | | | September 27, 2013 | | | | INR | | | | 68,190,897 | | | | USD | | | | 1,044,671 | | | | 29,391 | | | | — | |
| | | | | | | |
Standard Chartered Bank | | | September 27, 2013 | | | | INR | | | | 124,947,075 | | | | USD | | | | 1,914,311 | | | | 54,000 | | | | — | |
| | | | | | | |
Goldman, Sachs & Co. | | | September 30, 2013 | | | | USD | | | | 296,417 | | | | NZD | | | | 382,998 | | | | — | | | | (957 | ) |
| | | | | | | |
Citibank | | | September 30, 2013 | | | | EUR | | | | 460,762 | | | | RON | | | | 2,055,000 | | | | 1,934 | | | | — | |
| | | | | | | |
Wells Fargo Investments, LLC | | | September 30, 2013 | | | | NZD | | | | 2,140,000 | | | | USD | | | | 1,660,940 | | | | 10,059 | | | | — | |
| | | | | | | |
Goldman, Sachs & Co. | | | September 30, 2013 | | | | NZD | | | | 3,220,611 | | | | USD | | | | 2,499,999 | | | | 15,493 | | | | — | |
| | | | | | | |
Goldman, Sachs & Co. | | | October 1, 2013 | | | | USD | | | | 359,557 | | | | PHP | | | | 15,560,566 | | | | — | | | | (10,631 | ) |
| | | | | | | |
J.P. Morgan Securities, Inc. | | | October 1, 2013 | | | | USD | | | | 726,189 | | | | PHP | | | | 31,441,825 | | | | — | | | | (21,145 | ) |
| | | | | | | |
Standard Chartered Bank | | | October 2, 2013 | | | | AUD | | | | 402,000 | | | | USD | | | | 368,739 | | | | 11,595 | | | | — | |
| | | | | | | |
Goldman, Sachs & Co. | | | October 2, 2013 | | | | USD | | | | 5,102,434 | | | | AUD | | | | 5,567,000 | | | | — | | | | (156,619 | ) |
| | | | | | | |
Goldman, Sachs & Co. | | | October 2, 2013 | | | | AUD | | | | 9,063,832 | | | | USD | | | | 8,289,009 | | | | 236,551 | | | | — | |
| | | | | | | |
Standard Chartered Bank | | | October 2, 2013 | | | | ZAR | | | | 16,437,215 | | | | USD | | | | 1,622,590 | | | | 30,648 | | | | — | |
| | | | | | | |
Standard Chartered Bank | | | October 2, 2013 | | | | RUB | | | | 209,218,000 | | | | USD | | | | 6,263,804 | | | | 14,498 | | | | — | |
| | | | | | | |
Goldman, Sachs & Co. | | | October 3, 2013 | | | | INR | | | | 40,081,000 | | | | USD | | | | 591,165 | | | | — | | | | (3,013 | ) |
| | | | | | | |
Standard Chartered Bank | | | October 3, 2013 | | | | INR | | | | 88,237,620 | | | | USD | | | | 1,291,862 | | | | — | | | | (16,212 | ) |
| | | | | | | |
Goldman, Sachs & Co. | | | October 7, 2013 | | | | EUR | | | | 1,200,000 | | | | USD | | | | 1,587,948 | | | | 1,794 | | | | — | |
| | | | | | | |
Goldman, Sachs & Co. | | | October 10, 2013 | | | | USD | | | | 1,255,695 | | | | PHP | | | | 54,899,000 | | | | — | | | | (24,748 | ) |
| | | | | | | |
Goldman, Sachs & Co. | | | October 15, 2013 | | | | USD | | | | 3,338,464 | | | | TWD | | | | 99,987,000 | | | | 6,666 | | | | — | |
| | | | | | | |
Goldman, Sachs & Co. | | | October 15, 2013 | | | | GBP | | | | 5,621,061 | | | | USD | | | | 8,715,539 | | | | 7,365 | | | | — | |
| | | | | | | |
Goldman, Sachs & Co. | | | October 15, 2013 | | | | TWD | | | | 99,987,000 | | | | USD | | | | 3,346,509 | | | | 1,379 | | | | — | |
| | | | | | | |
Standard Chartered Bank | | | October 15, 2013 | | | | HUF | | | | 231,318,806 | | | | EUR | | | | 785,010 | | | | 26,432 | | | | — | |
| | | | | | | |
J.P. Morgan Securities, Inc. | | | October 15, 2013 | | | | HUF | | | | 2,526,882,000 | | | | EUR | | | | 8,570,931 | | | | 282,965 | | | | — | |
| | | | | | | |
J.P. Morgan Securities, Inc. | | | October 21, 2013 | | | | USD | | | | 456,089 | | | | SGD | | | | 575,000 | | | | — | | | | (5,293 | ) |
| | | | | | | |
Citibank | | | October 21, 2013 | | | | USD | | | | 5,394,058 | | | | PHP | | | | 236,017,000 | | | | — | | | | (102,948 | ) |
| | | | | | | |
Standard Chartered Bank | | | October 22, 2013 | | | | MYR | | | | 2,601,828 | | | | USD | | | | 785,055 | | | | 1,201 | | | | — | |
| | | | | | | |
Goldman, Sachs & Co. | | | October 22, 2013 | | | | MYR | | | | 2,888,000 | | | | USD | | | | 869,749 | | | | — | | | | (320 | ) |
| | | | | | | |
Standard Chartered Bank | | | October 23, 2013 | | | | MYR | | | | 2,601,843 | | | | USD | | | | 788,557 | | | | 4,748 | | | | — | |
| | | | | | | |
J.P. Morgan Securities, Inc. | | | October 24, 2013 | | | | USD | | | | 2,069,281 | | | | INR | | | | 125,446,000 | | | | — | | | | (223,314 | ) |
| | | | | | | |
Goldman, Sachs & Co. | | | October 30, 2013 | | | | USD | | | | 2,537,017 | | | | EUR | | | | 1,899,122 | | | | — | | | | (26,533 | ) |
| | | | | | | |
Goldman, Sachs & Co. | | | October 30, 2013 | | | | EUR | | | | 7,476,325 | | | | USD | | | | 9,933,451 | | | | 50,358 | | | | — | |
| | | | | | | |
Citibank | | | October 30, 2013 | | | | EUR | | | | 15,476,106 | | | | USD | | | | 20,557,066 | | | | 98,915 | | | | — | |
| | | | | | | |
Goldman, Sachs & Co. | | | October 31, 2013 | | | | USD | | | | 934,040 | | | | INR | | | | 56,600,000 | | | | — | | | | (103,109 | ) |
| | | | | | | |
Goldman, Sachs & Co. | | | November 5, 2013 | | | | CHF | | | | 1,077,271 | | | | USD | | | | 1,149,077 | | | | — | | | | (9,299 | ) |
| | | | | | | |
Goldman, Sachs & Co. | | | November 5, 2013 | | | | CHF | | | | 3,954,510 | | | | USD | | | | 4,279,330 | | | | 27,095 | | | | — | |
| | | | | | | |
Citibank | | | November 5, 2013 | | | | INR | | | | 83,167,698 | | | | USD | | | | 1,202,106 | | | | — | | | | (16,991 | ) |
| | | | | | | |
J.P. Morgan Securities, Inc. | | | November 13, 2013 | | | | EUR | | | | 89,399 | | | | RON | | | | 400,000 | | | | 283 | | | | — | |
| | | | | | | |
Goldman, Sachs & Co. | | | November 15, 2013 | | | | EUR | | | | 4,153,219 | | | | SEK | | | | 36,084,000 | | | | — | | | | (54,890 | ) |
| | | | | | | |
Citibank | | | November 18, 2013 | | | | USD | | | | 1,291,403 | | | | COP | | | | 2,449,792,000 | | | | — | | | | (32,957 | ) |
| | | | | | | |
J.P. Morgan Securities, Inc. | | | November 20, 2013 | | | | CLP | | | | 229,641,000 | | | | USD | | | | 441,278 | | | | — | | | | (3,401 | ) |
| | | | | | | |
Standard Chartered Bank | | | November 20, 2013 | | | | CLP | | | | 529,510,000 | | | | USD | | | | 1,018,288 | | | | — | | | | (7,059 | ) |
| | | | | | | |
J.P. Morgan Securities, Inc. | | | November 26, 2013 | | | | MYR | | | | 2,105,240 | | | | USD | | | | 629,915 | | | | — | | | | (3,017 | ) |
| | | | | | | |
Goldman, Sachs & Co. | | | December 16, 2013 | | | | USD | | | | 849,178 | | | | RUB | | | | 27,490,000 | | | | — | | | | (38,019 | ) |
| | | | | | | |
Goldman, Sachs & Co. | | | December 16, 2013 | | | | RUB | | | | 27,490,000 | �� | | | USD | | | | 837,599 | | | | 26,440 | | | | — | |
The accompanying Notes to Consolidated Financial Statements are an integral part of this statement.
| | |
| |
| Active Portfolios® Multi-Manager Alternative Strategies Fund | | |
Consolidated Portfolio of Investments (continued)
August 31, 2013
Forward Foreign Currency Exchange Contracts Open at August 31, 2013 (continued)
| | | | | | | | | | | | | | | | | | | | | | | | | | | | |
| Counterparty | | Exchange
Date | | | Currency to be
Delivered | | | Currency to be
Received | | | Unrealized
Appreciation
($) | | | Unrealized
Depreciation
($) | |
Royal Bank of Scotland | | | December 18, 2013 | | | | CHF | | | | 3,000 | | | | USD | | | | 3,256 | | | | 29 | | | | — | |
| | | | | | | |
Royal Bank of Scotland | | | December 18, 2013 | | | | EUR | | | | 3,000 | | | | USD | | | | 3,963 | | | | — | | | | (3 | ) |
| | | | | | | |
Royal Bank of Scotland | | | December 18, 2013 | | | | USD | | | | 3,258 | | | | CHF | | | | 3,000 | | | | — | | | | (31 | ) |
| | | | | | | |
Royal Bank of Scotland | | | December 18, 2013 | | | | USD | | | | 48,174 | | | | TRY | | | | 100,000 | | | | — | | | | (275 | ) |
| | | | | | | |
Royal Bank of Scotland | | | December 18, 2013 | | | | ILS | | | | 100,000 | | | | USD | | | | 27,583 | | | | 129 | | | | — | |
| | | | | | | |
Royal Bank of Scotland | | | December 18, 2013 | | | | USD | | | | 137,578 | | | | AUD | | | | 155,000 | | | | — | | | | (625 | ) |
| | | | | | | |
Royal Bank of Scotland | | | December 18, 2013 | | | | USD | | | | 215,983 | | | | INR | | | | 15,000,000 | | | | 1,446 | | | | — | |
| | | | | | | |
Royal Bank of Scotland | | | December 18, 2013 | | | | NZD | | | | 243,000 | | | | USD | | | | 187,159 | | | | 854 | | | | — | |
| | | | | | | |
Royal Bank of Scotland | | | December 18, 2013 | | | | USD | | | | 447,621 | | | | SGD | | | | 570,000 | | | | — | | | | (704 | ) |
| | | | | | | |
Royal Bank of Scotland | | | December 18, 2013 | | | | NOK | | | | 541,000 | | | | USD | | | | 88,327 | | | | 296 | | | | — | |
| | | | | | | |
Royal Bank of Scotland | | | December 18, 2013 | | | | USD | | | | 573,271 | | | | KRW | | | | 640,000,000 | | | | — | | | | (481 | ) |
| | | | | | | |
Royal Bank of Scotland | | | December 18, 2013 | | | | USD | | | | 775,620 | | | | GBP | | | | 500,000 | | | | — | | | | (1,404 | ) |
| | | | | | | |
Royal Bank of Scotland | | | December 18, 2013 | | | | EUR | | | | 1,426,000 | | | | USD | | | | 1,886,598 | | | | 1,115 | | | | — | |
| | | | | | | |
Royal Bank of Scotland | | | December 18, 2013 | | | | CZK | | | | 1,900,000 | | | | USD | | | | 97,617 | | | | 5 | | | | — | |
| | | | | | | |
Royal Bank of Scotland | | | December 18, 2013 | | | | PLN | | | | 2,500,000 | | | | USD | | | | 767,917 | | | | — | | | | (368 | ) |
| | | | | | | |
Royal Bank of Scotland | | | December 18, 2013 | | | | MXN | | | | 2,800,000 | | | | USD | | | | 208,279 | | | | 784 | | | | — | |
| | | | | | | |
Royal Bank of Scotland | | | December 18, 2013 | | | | JPY | | | | 94,000,000 | | | | USD | | | | 956,159 | | | | — | | | | (1,834 | ) |
| | | | | | | |
Goldman, Sachs & Co. | | | January 23, 2014 | | | | EUR | | | | 1,147,900 | | | | USD | | | | 1,534,168 | | | | 16,230 | | | | — | |
| | | | | | | |
Goldman, Sachs & Co. | | | January 23, 2014 | | | | USD | | | | 1,536,400 | | | | EUR | | | | 1,147,900 | | | | — | | | | (18,460 | ) |
| | | | | | | |
Goldman, Sachs & Co. | | | February 18, 2014 | | | | EUR | | | | 1,338,396 | | | | SGD | | | | 2,256,000 | | | | — | | | | (942 | ) |
| | | | | | | |
Goldman, Sachs & Co. | | | February 18, 2014 | | | | JPY | | | | 116,241,723 | | | | SGD | | | | 1,505,137 | | | | — | | | | (4,906 | ) |
| | | | | | | |
Morgan Stanley | | | March 21, 2014 | | | | HRK | | | | 2,088,000 | | | | EUR | | | | 273,603 | | | | — | | | | (186 | ) |
| | | | | | | |
Citibank | | | March 21, 2014 | | | | HRK | | | | 4,048,000 | | | | EUR | | | | 527,394 | | | | — | | | | (4,381 | ) |
| | | | | | | |
Citibank | | | April 2, 2014 | | | | HRK | | | | 8,558,600 | | | | EUR | | | | 1,115,625 | | | | — | | | | (8,356 | ) |
| | | | | | | |
Citibank | | | April 3, 2014 | | | | HRK | | | | 2,374,000 | | | | EUR | | | | 308,472 | | | | — | | | | (3,612 | ) |
| | | | | | | |
Standard Chartered Bank | | | May 16, 2014 | | | | USD | | | | 1,650,738 | | | | RUB | | | | 55,089,266 | | | | — | | | | (61,475 | ) |
| | | | | | | |
Citibank | | | May 16, 2014 | | | | USD | | | | 4,946,803 | | | | RUB | | | | 165,050,070 | | | | — | | | | (185,295 | ) |
| | | | | | | |
Standard Chartered Bank | | | May 27, 2014 | | | | USD | | | | 1,560,241 | | | | RUB | | | | 51,698,586 | | | | — | | | | (71,144 | ) |
| | | | | | | |
Standard Chartered Bank | | | July 21, 2014 | | | | USD | | | | 539,950 | | | | IDR | | | | 6,101,440,000 | | | | — | | | | (52,115 | ) |
| | | | | | | |
Goldman, Sachs & Co. | | | July 22, 2014 | | | | USD | | | | 535,151 | | | | IDR | | | | 6,111,421,300 | | | | — | | | | (46,603 | ) |
| | | | | | | |
Standard Chartered Bank | | | August 20, 2014 | | | | USD | | | | 481,936 | | | | IDR | | | | 5,588,051,506 | | | | — | | | | (37,518 | ) |
| | | | | | | |
J.P. Morgan Securities, Inc. | | | August 20, 2014 | | | | USD | | | | 1,238,333 | | | | IDR | | | | 14,420,391,000 | | | | — | | | | (91,479 | ) |
| | | | | | | | | | | | | | | | | | | | | | | | | | | | | |
Total | | | | | | | | | | | | | | | | | | | | | | | 11,613,263 | | | | (12,846,480 | ) |
| | | | | | | | | | | | | | | | | | | | | | | | | | | | | |
Futures Contracts Outstanding at August 31, 2013
At August 31, 2013, $10,813,369 was held in a margin deposit account as collateral to cover initial margin requirements on open futures contracts.
| | | | | | | | | | | | | | | | | | | | |
| Contract Description | | Number of
Contracts
Long (Short) | | | Notional
Market
Value ($) | | | Expiration
Date | | | Unrealized
Appreciation
($) | | | Unrealized
Depreciation
($) | |
Euro-Bobl, 5-year | | | (171 | ) | | | (28,266,088 | ) | | | September 2013 | | | | 156,317 | | | | — | |
| | | | | |
Euro-Bund, 10-year | | | (70 | ) | | | (13,013,230 | ) | | | September 2013 | | | | 102,436 | | | | — | |
| | | | | |
Euro-Buxl, 30-year | | | (54 | ) | | | (8,939,693 | ) | | | September 2013 | | | | 181,351 | | | | — | |
| | | | | |
Euro-OAT, 10-year | | | (105 | ) | | | (18,338,884 | ) | | | September 2013 | | | | 437,957 | | | | — | |
The accompanying Notes to Consolidated Financial Statements are an integral part of this statement.
| | |
| |
| | Active Portfolios® Multi-Manager Alternative Strategies Fund |
Consolidated Portfolio of Investments (continued)
August 31, 2013
Futures Contracts Outstanding at August 31, 2013 (continued)
| | | | | | | | | | | | | | | | | | | | |
| Contract Description | | Number of
Contracts
Long (Short) | | | Notional
Market
Value ($) | | | Expiration
Date | | | Unrealized
Appreciation
($) | | | Unrealized
Depreciation
($) | |
Euro-SCHATZ, 2-year | | | (96 | ) | | | (14,003,568 | ) | | | September 2013 | | | | 8,664 | | | | — | |
| | | | | |
Japanese Government Bond, 10-year | | | (5 | ) | | | (7,350,919 | ) | | | September 2013 | | | | — | | | | (97,663 | ) |
| | | | | |
Mini Japanese Government Bond, 10-year | | | 111 | | | | 16,316,779 | | | | September 2013 | | | | 31,041 | | | | — | |
| | | | | |
KOSPI 200 Index | | | (27 | ) | | | (3,051,957 | ) | | | September 2013 | | | | — | | | | (110,129 | ) |
| | | | | |
Nikkei 225 | | | 27 | | | | 3,671,131 | | | | September 2013 | | | | 19,167 | | | | — | |
| | | | | |
TOPIX | | | (1 | ) | | | (112,288 | ) | | | September 2013 | | | | 3,942 | | | | — | |
| | | | | |
Australian Treasury Bond, 10-year | | | (84 | ) | | | (8,750,787 | ) | | | September 2013 | | | | 40,882 | | | | — | |
| | | | | |
Australian Treasury Bond, 3-year | | | (287 | ) | | | (27,919,431 | ) | | | September 2013 | | | | — | | | | (63,225 | ) |
| | | | | |
LME Copper | | | (11 | ) | | | (1,948,650 | ) | | | September 2013 | | | | — | | | | (35,359 | ) |
| | | | | |
LME Nickel | | | (13 | ) | | | (1,071,564 | ) | | | September 2013 | | | | 128,701 | | | | — | |
| | | | | |
LME Primary Aluminum | | | (11 | ) | | | (487,988 | ) | | | September 2013 | | | | 3,365 | | | | — | |
| | | | | |
LME Zinc | | | 4 | | | | 187,600 | | | | September 2013 | | | | — | | | | (7,971 | ) |
| | | | | |
USD Deliverable Interest Rate Swap, 10-year | | | (121 | ) | | | (11,321,063 | ) | | | September 2013 | | | | 252,968 | | | | — | |
| | | | | |
USD Deliverable Interest Rate Swap, 5-year | | | (6 | ) | | | (584,250 | ) | | | September 2013 | | | | 4,829 | | | | — | |
| | | | | |
FTSE/JSE Top 40 Index | | | 137 | | | | 5,056,268 | | | | September 2013 | | | | 225,863 | | | | — | |
| | | | | |
SPI 200 Index | | | 69 | | | | 7,857,854 | | | | September 2013 | | | | 186,191 | | | | — | |
| | | | | |
Amsterdam Index | | | 37 | | | | 3,548,749 | | | | September 2013 | | | | — | | | | (129,441 | ) |
| | | | | |
CAC 40 Index | | | 72 | | | | 3,745,450 | | | | September 2013 | | | | — | | | | (160,995 | ) |
| | | | | |
CAC 40 Index | | | (39 | ) | | | (2,028,786 | ) | | | September 2013 | | | | 79,358 | | | | — | |
| | | | | |
Crude Oil | | | 5 | | | | 538,250 | | | | September 2013 | | | | — | | | | (5,840 | ) |
| | | | | |
DAX Index | | | 7 | | | | 1,877,486 | | | | September 2013 | | | | — | | | | (46,160 | ) |
| | | | | |
DJIA Mini | | | (4 | ) | | | (295,900 | ) | | | September 2013 | | | | 396 | | | | — | |
| | | | | |
E-Mini NASDAQ 100 Index | | | 77 | | | | 4,733,190 | | | | September 2013 | | | | 56,901 | | | | — | |
| | | | | |
E-Mini Russell 2000 Index | | | 33 | | | | 3,333,330 | | | | September 2013 | | | | — | | | | (42,307 | ) |
| | | | | |
E-Mini S&P 500 Index | | | 21 | | | | 1,712,865 | | | | September 2013 | | | | — | | | | (53,117 | ) |
| | | | | |
E-Mini S&P MidCap 400 Index | | | 23 | | | | 2,720,670 | | | | September 2013 | | | | — | | | | (43,799 | ) |
| | | | | |
Euro Stoxx 50 | | | 77 | | | | 2,775,187 | | | | September 2013 | | | | — | | | | (126,632 | ) |
| | | | | |
FTSE 100 Index | | | 11 | | | | 1,092,353 | | | | September 2013 | | | | — | | | | (7,531 | ) |
| | | | | |
FTSE/MIB Index | | | 13 | | | | 1,433,706 | | | | September 2013 | | | | 28,004 | | | | — | |
| | | | | |
IBEX 35 Index | | | 19 | | | | 2,082,961 | | | | September 2013 | | | | — | | | | (111,187 | ) |
| | | | | |
S&P/TSE 60 Index | | | 37 | | | | 5,103,351 | | | | September 2013 | | | | 38,755 | | | | — | |
| | | | | |
S&P CNX Nifty Index | | | 58 | | | | 631,620 | | | | September 2013 | | | | 14,398 | | | | — | |
| | | | | |
Hang Seng Index | | | 16 | | | | 2,225,097 | | | | September 2013 | | | | — | | | | (8,933 | ) |
| | | | | |
H-Shares Index | | | (5 | ) | | | (314,626 | ) | | | September 2013 | | | | 3,382 | | | | — | |
| | | | | |
MSCI Singapore Index | | | 12 | | | | 647,413 | | | | September 2013 | | | | 313 | | | | — | |
| | | | | |
MSCI Taiwan Index | | | (12 | ) | | | (338,640 | ) | | | September 2013 | | | | — | | | | (8,238 | ) |
| | | | | |
NY Harbor ULSD | | | 9 | | | | 1,185,635 | | | | September 2013 | | | | — | | | | (24,985 | ) |
| | | | | |
RBOB Gasoline | | | 4 | | | | 485,537 | | | | September 2013 | | | | — | | | | (7,394 | ) |
| | | | | |
Sugar #11 | | | (322 | ) | | | (5,892,858 | ) | | | September 2013 | | | | 38,433 | | | | — | |
| | | | | |
European ICE Gasoil | | | 6 | | | | 581,550 | | | | October 2013 | | | | — | | | | (4,220 | ) |
| | | | | |
Lean Hogs | | | 14 | | | | 490,700 | | | | October 2013 | | | | 19,438 | | | | — | |
| | | | | |
Platinum | | | 78 | | | | 5,955,690 | | | | October 2013 | | | | 757,934 | | | | — | |
The accompanying Notes to Consolidated Financial Statements are an integral part of this statement.
| | |
| |
| Active Portfolios® Multi-Manager Alternative Strategies Fund | | |
Consolidated Portfolio of Investments (continued)
August 31, 2013
Futures Contracts Outstanding at August 31, 2013 (continued)
| | | | | | | | | | | | | | | | | | | | |
| Contract Description | | Number of
Contracts
Long (Short) | | | Notional
Market
Value ($) | | | Expiration
Date | | | Unrealized
Appreciation
($) | | | Unrealized
Depreciation
($) | |
Soybeans | | | 18 | | | | 1,221,750 | | | | November 2013 | | | | — | | | | (11,646 | ) |
| | | | | |
Cotton #2 | | | 33 | | | | 1,377,585 | | | | December 2013 | | | | — | | | | (112,357 | ) |
| | | | | |
Cocoa | | | 46 | | | | 1,120,560 | | | | December 2013 | | | | — | | | | (25,315 | ) |
| | | | | |
Corn | | | (196 | ) | | | (4,723,600 | ) | | | December 2013 | | | | — | | | | (220,428 | ) |
| | | | | |
Soybean Meal | | | 11 | | | | 466,070 | | | | December 2013 | | | | — | | | | (11,772 | ) |
| | | | | |
Soybean Oil | | | (79 | ) | | | (2,099,346 | ) | | | December 2013 | | | | 100,394 | | | | — | |
| | | | | |
Wheat | | | (143 | ) | | | (4,676,100 | ) | | | December 2013 | | | | — | | | | (72,176 | ) |
| | | | | |
Canadian Bank Acceptance, 3-month | | | (6 | ) | | | (1,405,725 | ) | | | December 2013 | | | | — | | | | (677 | ) |
| | | | | |
Euro Euribor, 3-month | | | (35 | ) | | | (11,530,900 | ) | | | December 2013 | | | | — | | | | (1,507 | ) |
| | | | | |
Euro Swiss Franc, 3-month | | | (66 | ) | | | (17,729,808 | ) | | | December 2013 | | | | — | | | | (1,049 | ) |
| | | | | |
Eurodollar, 90-day | | | 5 | | | | 1,246,250 | | | | December 2013 | | | | 165 | | | | — | |
| | | | | |
Canadian Government Bond, 10-year | | | (92 | ) | | | (11,249,976 | ) | | | December 2013 | | | | — | | | | (44,086 | ) |
| | | | | |
Coffee | | | (49 | ) | | | (2,137,013 | ) | | | December 2013 | | | | 115,048 | | | | — | |
| | | | | |
Sterling, 90-day | | | (76 | ) | | | (14,639,710 | ) | | | December 2013 | | | | — | | | | (2,452 | ) |
| | | | | |
U.S. Treasury Long Bond, 20-year | | | (56 | ) | | | (7,386,750 | ) | | | December 2013 | | | | — | | | | (74,968 | ) |
| | | | | |
United Kingdom Long GILT, 10-year | | | (65 | ) | | | (11,019,920 | ) | | | December 2013 | | | | — | | | | (15,129 | ) |
| | | | | |
U.S. Treasury Note, 10-year | | | (92 | ) | | | (11,433,875 | ) | | | December 2013 | | | | — | | | | (35,397 | ) |
| | | | | |
U.S. Treasury Note, 2-year | | | (13 | ) | | | (2,856,750 | ) | | | December 2013 | | | | — | | | | (512 | ) |
| | | | | |
U.S. Treasury Note, 5-year | | | (174 | ) | | | (20,824,266 | ) | | | December 2013 | | | | 21,798 | | | | — | |
| | | | | |
Euro Euribor, 3-month | | | (45 | ) | | | (14,813,548 | ) | | | March 2014 | | | | — | | | | (904 | ) |
| | | | | |
Eurodollar, 90-day | | | (17 | ) | | | (4,234,700 | ) | | | March 2014 | | | | — | | | | (1,422 | ) |
| | | | | |
Euro Swiss Franc, 3-month | | | (73 | ) | | | (19,604,358 | ) | | | March 2014 | | | | — | | | | (2,340 | ) |
| | | | | |
Sterling, 90-day | | | (98 | ) | | | (18,866,131 | ) | | | March 2014 | | | | — | | | | (4,515 | ) |
| | | | | |
Euro Euribor, 3-month | | | (54 | ) | | | (17,762,876 | ) | | | June 2014 | | | | 895 | | | | — | |
| | | | | |
Eurodollar, 90-day | | | (35 | ) | | | (8,711,063 | ) | | | June 2014 | | | | — | | | | (2,987 | ) |
| | | | | |
Sterling, 90-day | | | (116 | ) | | | (22,315,609 | ) | | | June 2014 | | | | — | | | | (1,566 | ) |
| | | | | |
Euro Euribor, 3-month | | | (56 | ) | | | (18,406,883 | ) | | | September 2014 | | | | 2,422 | | | | — | |
| | | | | |
Eurodollar, 90-day | | | (59 | ) | | | (14,667,400 | ) | | | September 2014 | | | | — | | | | (3,136 | ) |
| | | | | |
Sterling, 90-day | | | (126 | ) | | | (24,217,401 | ) | | | September 2014 | | | | 5,566 | | | | — | |
| | | | | |
Euro Euribor, 3-month | | | (57 | ) | | | (18,719,569 | ) | | | December 2014 | | | | 4,071 | | | | — | |
| | | | | |
Eurodollar, 90-day | | | (81 | ) | | | (20,109,263 | ) | | | December 2014 | | | | — | | | | (2,341 | ) |
| | | | | |
LME Copper | | | (9 | ) | | | (1,614,600 | ) | | | December 2014 | | | | 34,624 | | | | — | |
| | | | | |
Sterling, 90-day | | | (123 | ) | | | (23,619,353 | ) | | | December 2014 | | | | 6,204 | | | | — | |
| | | | | |
Euro Euribor, 3-month | | | (66 | ) | | | (21,654,574 | ) | | | March 2015 | | | | 10,108 | | | | — | |
| | | | | |
Eurodollar, 90-day | | | (103 | ) | | | (25,527,263 | ) | | | March 2015 | | | | — | | | | (2,117 | ) |
| | | | | |
Sterling, 90-day | | | (130 | ) | | | (24,935,842 | ) | | | March 2015 | | | | 9,591 | | | | — | |
| | | | | |
Euro Euribor, 3-month | | | (69 | ) | | | (22,612,654 | ) | | | June 2015 | | | | 15,649 | | | | — | |
| | | | | |
Eurodollar, 90-day | | | (119 | ) | | | (29,428,700 | ) | | | June 2015 | | | | 6,817 | | | | — | |
| | | | | |
Sterling, 90-day | | | (138 | ) | | | (26,432,930 | ) | | | June 2015 | | | | 17,352 | | | | — | |
| | | | | |
Sterling, 90-day | | | 322 | | | | 61,068,677 | | | | September 2016 | | | | — | | | | (148,111 | ) |
| | | | | | | | | | | | | | | | | | | | | |
Total | | | | | | | | | | | | | | | 3,171,690 | | | | (1,894,036 | ) |
| | | | | | | | | | | | | | | | | | | | | |
The accompanying Notes to Consolidated Financial Statements are an integral part of this statement.
| | |
| |
| | Active Portfolios® Multi-Manager Alternative Strategies Fund |
Consolidated Portfolio of Investments (continued)
August 31, 2013
Open Options Contracts Written at August 31, 2013
At August 31, 2013, securities totaling $735,702 were pledged as collateral to cover open options contracts written.
| | | | | | | | | | | | | | | | | | | | | | | | |
| Issuer | | Puts/Calls | | | Number of
Contracts | | | Exercise
Price ($) | | | Premium
Received ($) | | | Expiration
Date | | | Value ($) | |
Genworth Financial, Inc. Class C | | | Put | | | | 117 | | | | 13.00 | | | | 5,173 | | | | September 2013 | | | | 14,508 | |
| | | | | | |
Leap Wireless International, Inc. | | | Put | | | | 53 | | | | 17.00 | | | | 1,865 | | | | September 2013 | | | | 10,733 | |
| | | | | | |
Leap Wireless International, Inc. | | | Put | | | | 559 | | | | 16.00 | | | | 13,247 | | | | October 2013 | | | | 46,118 | |
| | | | | | |
Leap Wireless International, Inc. | | | Put | | | | 555 | | | | 15.00 | | | | 4,426 | | | | October 2013 | | | | 13,875 | |
| | | | | | |
Leap Wireless International, Inc. | | | Put | | | | 57 | | | | 17.00 | | | | 5,071 | | | | October 2013 | | | | 10,118 | |
| | | | | | |
Office Depot | | | Put | | | | 89 | | | | 4.50 | | | | 2,654 | | | | September 2013 | | | | 3,115 | |
| | | | | | |
Office Depot | | | Put | | | | 10 | | | | 4.00 | | | | 43 | | | | September 2013 | | | | 100 | |
| | | | | | |
Optimer Pharmaceutical, Inc. | | | Put | | | | 768 | | | | 12.50 | | | | 3,399 | | | | September 2013 | | | | 7,680 | |
| | | | | | |
Saks, Inc. | | | Put | | | | 9 | | | | 16.00 | | | | 43 | | | | September 2013 | | | | 135 | |
| | | | | | |
Saks, Inc. | | | Put | | | | 13 | | | | 16.00 | | | | 142 | | | | November 2013 | | | | 195 | |
| | | | | | |
Apple, Inc. | | | Call | | | | 18 | | | | 515.00 | | | | 36,508 | | | | December 2013 | | | | 33,615 | |
| | | | | | |
Bill Barrett Corp. | | | Call | | | | 139 | | | | 22.50 | | | | 35,559 | | | | September 2013 | | | | 4,865 | |
| | | | | | |
General Motors Co. | | | Call | | | | 191 | | | | 31.00 | | | | 40,428 | | | | September 2013 | | | | 62,075 | |
| | | | | | |
Genworth Financial, Inc., Class C | | | Call | | | | 117 | | | | 13.00 | | | | 6,926 | | | | September 2013 | | | | 643 | |
| | | | | | |
Genworth Financial, Inc., Class C | | | Call | | | | 340 | | | | 13.00 | | | | 5,351 | | | | October 2013 | | | | 6,120 | |
| | | | | | |
Indian Rupee | | | Call | | | | 1,480,000 | | | | 65.00 | | | | 27,602 | | | | June 2014 | | | | 154,571 | |
| | | | | | |
Indian Rupee | | | Call | | | | 1,507,000 | | | | 65.00 | | | | 26,825 | | | | June 2014 | | | | 157,391 | |
| | | | | | |
Indian Rupee | | | Call | | | | 2,957,000 | | | | 67.00 | | | | 58,401 | | | | June 2014 | | | | 260,293 | |
| | | | | | |
Indian Rupee | | | Call | | | | 2,944,341 | | | | 70.00 | | | | 48,876 | | | | June 2014 | | | | 202,671 | |
| | | | | | |
Indian Rupee | | | Call | | | | 2,186,000 | | | | 72.00 | | | | 42,518 | | | | July 2014 | | | | 131,499 | |
| | | | | | |
Indian Rupee | | | Call | | | | 2,082,000 | | | | 72.00 | | | | 42,369 | | | | July 2014 | | | | 125,243 | |
| | | | | | |
Leap Wireless International, Inc. | | | Call | | | | 69 | | | | 17.00 | | | | 2,672 | | | | September 2013 | | | | 138 | |
| | | | | | |
Leap Wireless International, Inc. | | | Call | | | | 555 | | | | 21.00 | | | | 12,380 | | | | October 2013 | | | | 1,110 | |
| | | | | | |
Leap Wireless International, Inc. | | | Call | | | | 57 | | | | 17.00 | | | | 912 | | | | October 2013 | | | | 171 | |
| | | | | | |
Mosaic Co. (The) | | | Call | | | | 446 | | | | 62.50 | | | | 151,573 | | | | September 2013 | | | | 669 | |
| | | | | | |
Officemax, Inc. | | | Call | | | | 64 | | | | 11.00 | | | | 1,927 | | | | September 2013 | | | | 1,920 | |
| | | | | | |
Officemax, Inc. | | | Call | | | | 7 | | | | 10.00 | | | | 650 | | | | September 2013 | | | | 682 | |
| | | | | | |
Optimer Pharmaceutical, Inc. | | | Call | | | | 768 | | | | 12.50 | | | | 14,588 | | | | September 2013 | | | | 5,760 | |
| | | | | | |
Outerwall, Inc. | | | Call | | | | 217 | | | | 65.00 | | | | 120,164 | | | | January 2014 | | | | 92,225 | |
| | | | | | |
Perrigo Co. | | | Call | | | | 19 | | | | 120.00 | | | | 15,547 | | | | September 2013 | | | | 6,365 | |
| | | | | | |
Questcor Pharmaceuticals | | | Call | | | | 140 | | | | 46.00 | | | | 65,030 | | | | October 2013 | | | | 300,300 | |
| | | | | | |
Saks, Inc. | | | Call | | | | 9 | | | | 16.00 | | | | 214 | | | | September 2013 | | | | 22 | |
| | | | | | |
Saks, Inc. | | | Call | | | | 13 | | | | 16.00 | | | | 372 | | | | November 2013 | | | | 97 | |
| | | | | | |
Silicon Graphics International | | | Call | | | | 535 | | | | 15.00 | | | | 66,270 | | | | September 2013 | | | | 21,400 | |
| | | | | | |
Silicon Graphics International | | | Call | | | | 314 | | | | 20.00 | | | | 63,032 | | | | December 2013 | | | | 7,850 | |
| | | | | | |
Sprint Corp. | | | Call | | | | 168 | | | | 6.00 | | | | 8,885 | | | | September 2013 | | | | 11,592 | |
| | | | | | |
Sprint Corp. | | | Call | | | | 264 | | | | 7.00 | | | | 3,950 | | | | September 2013 | | | | 2,508 | |
| | |
Total | | | | | | | | | | | | | | | | | | | | | | | 1,698,372 | |
| | |
The accompanying Notes to Consolidated Financial Statements are an integral part of this statement.
| | |
| |
| Active Portfolios® Multi-Manager Alternative Strategies Fund | | |
Consolidated Portfolio of Investments (continued)
August 31, 2013
Credit Default Swap Contracts Outstanding at August 31, 2013
Buy Protection
At August 31, 2013, securities totaling $228,181 were pledged as collateral to cover open credit default swap contracts. In addition, cash totaling $2,452,902 was received from broker as collateral.
| | | | | | | | | | | | | | | | | | | | | | | | | | | | | | | | |
| Counterparty | | Reference
Entity | | Expiration
Date | | Pay
Fixed
Rate (%) | | | Notional
Amount ($) | | | Market
Value ($) | | | Unamortized
Premium
(Paid)
Received ($) | | | Periodic
Payments
Receivable
(Payable) ($) | | | Unrealized
Appreciation
($) | | | Unrealized
Depreciation
($) | |
Morgan Stanley | | Republic of Croatia | | December 20, 2016 | | | 1.000 | | | | 224,000 | | | | 13,433 | | | | (10,404 | ) | | | (448 | ) | | | 2,581 | | | | — | |
| | | | | | | | | |
JPMorgan | | Kingdom of Thailand | | June 20, 2017 | | | 1.000 | | | | 1,800,000 | | | | 10,789 | | | | (20,545 | ) | | | (3,600 | ) | | | — | | | | (13,356 | ) |
| | | | | | | | | |
Morgan Stanley | | Kingdom of Thailand | | June 20, 2017 | | | 1.000 | | | | 380,000 | | | | 2,278 | | | | (8,042 | ) | | | (760 | ) | | | — | | | | (6,524 | ) |
| | | | | | | | | |
Citibank | | People’s Republic of China | | June 20, 2017 | | | 1.000 | | | | 380,000 | | | | (2,817 | ) | | | (5,007 | ) | | | (760 | ) | | | — | | | | (8,584 | ) |
| | | | | | | | | |
JPMorgan | | People’s Republic of China | | June 20, 2017 | | | 1.000 | | | | 1,800,000 | | | | (13,345 | ) | | | (7,770 | ) | | | (3,600 | ) | | | — | | | | (24,715 | ) |
| | | | | | | | | |
Goldman Sachs International | | Republic of Colombia | | June 20, 2017 | | | 1.000 | | | | 380,000 | | | | 2,578 | | | | (9,493 | ) | | | (760 | ) | | | — | | | | (7,675 | ) |
| | | | | | | | | |
Morgan Stanley | | Tunisian Republic | | June 20, 2017 | | | 1.000 | | | | 2,200,000 | | | | 191,435 | | | | (139,786 | ) | | | (4,400 | ) | | | 47,249 | | | | — | |
| | | | | | | | | |
Citibank | | Republic of Croatia | | December 20, 2017 | | | 1.000 | | | | 1,360,000 | | | | 118,701 | | | | (77,927 | ) | | | (2,720 | ) | | | 38,054 | | | | — | |
| | | | | | | | | |
Goldman Sachs International | | Republic of Croatia | | December 20, 2017 | | | 1.000 | | | | 610,000 | | | | 53,241 | | | | (35,045 | ) | | | (1,220 | ) | | | 16,976 | | | | — | |
| | | | | | | | | |
Morgan Stanley | | Republic of Croatia | | December 20, 2017 | | | 1.000 | | | | 540,000 | | | | 47,131 | | | | (30,011 | ) | | | (1,080 | ) | | | 16,040 | | | | — | |
| | | | | | | | | |
Citibank | | Kingdom of Thailand | | March 20, 2018 | | | 1.000 | | | | 530,000 | | | | 8,445 | | | | 230 | | | | (1,060 | ) | | | 7,615 | | | | — | |
| | | | | | | | | |
JPMorgan | | Lebanese Republic | | March 20, 2018 | | | 5.000 | | | | 557,000 | | | | (22,005 | ) | | | 20,950 | | | | (5,570 | ) | | | — | | | | (6,625 | ) |
| | | | | | | | | |
JPMorgan | | People’s Republic of China | | March 20, 2018 | | | 1.000 | | | | 1,200,000 | | | | (1,449 | ) | | | 16,891 | | | | (2,400 | ) | | | 13,042 | | | | — | |
| | | | | | | | | |
Citibank | | Republic of Croatia | | March 20, 2018 | | | 1.000 | | | | 422,000 | | | | 39,864 | | | | (35,449 | ) | | | (844 | ) | | | 3,571 | | | | — | |
| | | | | | | | | |
JPMorgan | | State of Qatar | | March 20, 2018 | | | 1.000 | | | | 344,000 | | | | (3,204 | ) | | | 5,262 | | | | (688 | ) | | | 1,370 | | | | — | |
| | | | | | | | | |
Citibank | | Bolivarian Republic of Venezuela | | June 20, 2018 | | | 5.000 | | | | 470,000 | | | | 77,631 | | | | (51,227 | ) | | | (4,700 | ) | | | 21,704 | | | | — | |
| | | | | | | | | |
Citibank | | Bolivarian Republic of Venezuela | | June 20, 2018 | | | 5.000 | | | | 1,400,000 | | | | 231,240 | | | | (154,884 | ) | | | (14,000 | ) | | | 62,356 | | | | — | |
| | | | | | | | | |
Citibank | | Bolivarian Republic of Venezuela | | June 20, 2018 | | | 5.000 | | | | 268,000 | | | | 44,266 | | | | (30,270 | ) | | | (2,680 | ) | | | 11,316 | | | | — | |
| | | | | | | | | |
Citibank | | Bolivarian Republic of Venezuela | | June 20, 2018 | | | 5.000 | | | | 808,000 | | | | 133,458 | | | | (91,243 | ) | | | (8,080 | ) | | | 34,135 | | | | — | |
| | | | | | | | | |
Goldman Sachs International | | Lebanese Republic | | June 20, 2018 | | | 1.000 | | | | 4,147,000 | | | | 549,652 | | | | (537,393 | ) | | | (8,294 | ) | | | 3,965 | | | | — | |
| | | | | | | | | |
Citibank | | Markit iTraxx Asia Ex-Japan Investment Grade | | June 20, 2018 | | | 1.000 | | | | 631,000 | | | | 17,092 | | | | (11,889 | ) | | | (1,262 | ) | | | 3,941 | | | | — | |
The accompanying Notes to Consolidated Financial Statements are an integral part of this statement.
| | |
| |
| | Active Portfolios® Multi-Manager Alternative Strategies Fund |
Consolidated Portfolio of Investments (continued)
August 31, 2013
Credit Default Swap Contracts Outstanding at August 31, 2013 (continued)
Buy Protection (continued)
| | | | | | | | | | | | | | | | | | | | | | | | | | | | | | | | |
| Counterparty | | Reference
Entity | | Expiration
Date | | Pay
Fixed
Rate (%) | | | Notional
Amount ($) | | | Market
Value ($) | | | Unamortized
Premium
(Paid)
Received ($) | | | Periodic
Payments
Receivable
(Payable) ($) | | | Unrealized
Appreciation
($) | | | Unrealized
Depreciation
($) | |
Goldman Sachs International | | Markit iTraxx Asia Ex-Japan Investment Grade | | June 20, 2018 | | | 1.000 | | | | 842,000 | | | | 22,807 | | | | (15,678 | ) | | | (1,684 | ) | | | 5,445 | | | | — | |
| | | | | | | | | |
Morgan Stanley | | Markit iTraxx Europe Senior Financials | | June 20, 2018 | | | 1.000 | | | | 1,730,000 | | | | 51,623 | | | | (90,553 | ) | | | (4,573 | ) | | | — | | | | (43,503 | ) |
| | | | | | | | | |
JPMorgan | | Markit iTraxx Europe Subordinated Financials | | June 20, 2018 | | | 5.000 | | | | 1,151,000 | | | | (186,154 | ) | | | 119,016 | | | | (15,212 | ) | | | — | | | | (82,350 | ) |
| | | | | | | | | |
Morgan Stanley | | Markit iTraxx Europe Subordinated Financials | | June 20, 2018 | | | 5.000 | | | | 1,041,000 | | | | (168,363 | ) | | | 153,331 | | | | (13,758 | ) | | | — | | | | (28,790 | ) |
| | | | | | | | | |
Citibank | | Republic of Croatia | | June 20, 2018 | | | 1.000 | | | | 630,000 | | | | 64,025 | | | | (56,308 | ) | | | (1,260 | ) | | | 6,457 | | | | — | |
| | | | | | | | | |
Citibank | | Republic of Croatia | | June 20, 2018 | | | 1.000 | | | | 260,000 | | | | 26,423 | | | | (20,213 | ) | | | (520 | ) | | | 5,690 | | | | — | |
| | | | | | | | | |
Morgan Stanley | | Republic of Croatia | | June 20, 2018 | | | 1.000 | | | | 346,000 | | | | 35,163 | | | | (33,492 | ) | | | (692 | ) | | | 979 | | | | — | |
| | | | | | | | | |
Morgan Stanley | | Republic of Croatia | | June 20, 2018 | | | 1.000 | | | | 217,000 | | | | 22,053 | | | | (20,518 | ) | | | (434 | ) | | | 1,101 | | | | — | |
| | | | | | | | | |
JPMorgan | | Russian Federation | | June 20, 2018 | | | 1.000 | | | | 940,000 | | | | 41,168 | | | | (16,237 | ) | | | (1,880 | ) | | | 23,051 | | | | — | |
| | | | | | | | | |
JPMorgan | | Russian Federation | | June 20, 2018 | | | 1.000 | | | | 2,239,000 | | | | 98,059 | | | | (37,677 | ) | | | (4,478 | ) | | | 55,904 | | | | — | |
| | | | | | | | | |
JPMorgan | | Russian Federation | | June 20, 2018 | | | 1.000 | | | | 360,000 | | | | 15,767 | | | | (5,611 | ) | | | (720 | ) | | | 9,436 | | | | — | |
| | | | | | | | | |
Goldman Sachs International | | State of Qatar | | June 20, 2018 | | | 1.000 | | | | 1,160,000 | | | | (9,270 | ) | | | 15,699 | | | | (2,320 | ) | | | 4,109 | | | | — | |
| | | | | | | | | |
JPMorgan | | State of Qatar | | September 20, 2018 | | | 1.000 | | | | 2,384,000 | | | | (15,946 | ) | | | 11,509 | | | | (4,768 | ) | | | — | | | | (9,205 | ) |
| | | | | | | | | |
Goldman Sachs International | | Republic of Colombia | | June 20, 2022 | | | 1.000 | | | | 1,270,000 | | | | 74,020 | | | | (81,864 | ) | | | (2,540 | ) | | | — | | | | (10,384 | ) |
| | | | | | | | | |
Morgan Stanley | | Republic of Colombia | | June 20, 2022 | | | 1.000 | | | | 1,760,000 | | | | 102,578 | | | | (68,566 | ) | | | (3,520 | ) | | | 30,492 | | | | — | |
| | | | | | | | | |
Morgan Stanley | | Republic of Colombia | | June 20, 2022 | | | 1.000 | | | | 2,000,000 | | | | 116,566 | | | | (113,996 | ) | | | (4,000 | ) | | | — | | | | (1,430 | ) |
| | | | | | | | | |
Citibank | | United Mexican States | | June 20, 2022 | | | 1.000 | | | | 1,520,000 | | | | 82,187 | | | | (88,971 | ) | | | (3,040 | ) | | | — | | | | (9,824 | ) |
| | | | | | | | | |
Citibank | | United Mexican States | | June 20, 2022 | | | 1.000 | | | | 370,000 | | | | 20,006 | | | | (24,493 | ) | | | (740 | ) | | | — | | | | (5,227 | ) |
| | | | | | | | | |
Goldman Sachs International | | United Mexican States | | June 20, 2022 | | | 1.000 | | | | 300,000 | | | | 16,221 | | | | (17,312 | ) | | | (600 | ) | | | — | | | | (1,691 | ) |
| | | | | | | | | |
Citibank | | Federative Republic of Brazil | | September 20, 2022 | | | 1.000 | | | | 1,750,000 | | | | 189,366 | | | | (121,764 | ) | | | (3,500 | ) | | | 64,102 | | | | — | |
| | | | | | | | | |
Goldman Sachs International | | Federative Republic of Brazil | | September 20, 2022 | | | 1.000 | | | | 1,400,000 | | | | 151,492 | | | | (114,330 | ) | | | (2,800 | ) | | | 34,362 | | | | — | |
| | | | | | | | | |
Citibank | | Republic of South Africa | | September 20, 2022 | | | 1.000 | | | | 2,450,000 | | | | 331,860 | | | | (198,363 | ) | | | (4,900 | ) | | | 128,597 | | | | — | |
The accompanying Notes to Consolidated Financial Statements are an integral part of this statement.
| | |
| |
| Active Portfolios® Multi-Manager Alternative Strategies Fund | | |
Consolidated Portfolio of Investments (continued)
August 31, 2013
Credit Default Swap Contracts Outstanding at August 31, 2013 (continued)
Buy Protection (continued)
| | | | | | | | | | | | | | | | | | | | | | | | | | | | | | | | |
| Counterparty | | Reference
Entity | | Expiration
Date | | Pay
Fixed
Rate (%) | | | Notional
Amount ($) | | | Market
Value ($) | | | Unamortized
Premium
(Paid)
Received ($) | | | Periodic
Payments
Receivable
(Payable) ($) | | | Unrealized
Appreciation
($) | | | Unrealized
Depreciation
($) | |
Goldman Sachs International | | Republic of South Africa | | September 20, 2022 | | | 1.000 | | | | 3,800,000 | | | | 514,721 | | | | (339,716 | ) | | | (7,600 | ) | | | 167,405 | | | | — | |
| | | | | | | | | |
Goldman Sachs International | | Republic of South Africa | | September 20, 2022 | | | 1.000 | | | | 2,900,000 | | | | 392,814 | | | | (205,024 | ) | | | (5,800 | ) | | | 181,990 | | | | — | |
| | | | | | | | | |
JPMorgan | | Republic of South Africa | | September 20, 2022 | | | 1.000 | | | | 2,550,000 | | | | 345,405 | | | | (202,894 | ) | | | (5,100 | ) | | | 137,411 | | | | — | |
| | | | | | | | | |
Morgan Stanley | | Republic of South Africa | | September 20, 2022 | | | 1.000 | | | | 2,150,000 | | | | 291,224 | | | | (167,665 | ) | | | (4,300 | ) | | | 119,259 | | | | — | |
| | | | | | | | | |
JPMorgan | | Russian Federation | | September 20, 2022 | | | 1.000 | | | | 600,000 | | | | 65,164 | | | | (45,710 | ) | | | (1,200 | ) | | | 18,254 | | | | — | |
| | | | | | | | | |
Morgan Stanley | | Russian Federation | | September 20, 2022 | | | 1.000 | | | | 2,880,000 | | | | 312,788 | | | | (366,116 | ) | | | (5,760 | ) | | | — | | | | (59,088 | ) |
| | | | | | | | | |
Goldman Sachs International | | Republic of South Africa | | December 20, 2022 | | | 1.000 | | | | 1,386,000 | | | | 192,812 | | | | (125,256 | ) | | | (2,772 | ) | | | 64,784 | | | | — | |
| | | | | | | | | |
Citibank | | Republic of South Africa | | June 20, 2023 | | | 1.000 | | | | 2,110,000 | | | | 308,431 | | | | (185,028 | ) | | | (4,220 | ) | | | 119,183 | | | | — | |
| | | | | | | | | |
Citibank | | United Mexican States | | June 20, 2023 | | | 1.000 | | | | 214,000 | | | | 13,317 | | | | (6,685 | ) | | | (428 | ) | | | 6,204 | | | | — | |
Total | | | | | | | | | | | | | | | | | | | | | | | | | | | 1,468,130 | | | | (318,971 | ) |
Credit Default Swap Contracts Outstanding at August 31, 2013
Sell Protection
| | | | | | | | | | | | | | | | | | | | | | | | | | | | | | | | | | | | |
| Counterparty | | Reference
Entity | | Expiration
Date | | Receive
Fixed
Rate (%) | | | Implied
Credit
Spread (%)** | | | Notional
Amount ($) | | | Market
Value ($) | | | Unamortized
Premium
(Paid)
Received ($) | | | Periodic
Payments
Receivable
(Payable) ($) | | | Unrealized
Appreciation
($) | | | Unrealized
Depreciation
($) | |
Citibank | | Federative Republic of Brazil | | September 20, 2014 | | | 1.000 | | | | 0.987 | | | | 1,750,000 | | | | 233 | | | | (2,783 | ) | | | 3,500 | | | | 950 | | | | — | |
| | | | | | | | | | |
Goldman Sachs International | | Federative Republic of Brazil | | September 20, 2014 | | | 1.000 | | | | 0.987 | | | | 1,400,000 | | | | 186 | | | | (2,300 | ) | | | 2,800 | | | | 686 | | | | — | |
| | | | | | | | | | |
Morgan Stanley | | Republic of Colombia | | September 20, 2014 | | | 1.000 | | | | 0.697 | | | | 2,707,000 | | | | 8,716 | | | | (12,944 | ) | | | 5,414 | | | | 1,186 | | | | — | |
| | | | | | | | | | |
Citibank | | United Mexican States | | September 20, 2014 | | | 1.000 | | | | 0.640 | | | | 1,196,000 | | | | 4,580 | | | | (5,720 | ) | | | 2,392 | | | | 1,252 | | | | — | |
| | | | | | | | | | |
Citibank | | Republic of South Africa | | September 20, 2017 | | | 1.000 | | | | 2.122 | | | | 4,100,000 | | | | (176,940 | ) | | | 90,711 | | | | 8,200 | | | | — | | | | (78,029 | ) |
| | | | | | | | | | |
Goldman Sachs International | | Republic of South Africa | | September 20, 2017 | | | 1.000 | | | | 2.122 | | | | 3,800,000 | | | | (163,992 | ) | | | 101,050 | | | | 7,600 | | | | — | | | | (55,342 | ) |
| | | | | | | | | | |
Goldman Sachs International | | Republic of South Africa | | September 20, 2017 | | | 1.000 | | | | 2.122 | | | | 2,900,000 | | | | (125,152 | ) | | | 39,109 | | | | 5,800 | | | | — | | | | (80,243 | ) |
| | | | | | | | | | |
JPMorgan | | Republic of South Africa | | September 20, 2017 | | | 1.000 | | | | 2.122 | | | | 2,550,000 | | | | (110,047 | ) | | | 54,509 | | | | 5,100 | | | | — | | | | (50,438 | ) |
| | | | | | | | | | |
Morgan Stanley | | Republic of South Africa | | September 20, 2017 | | | 1.000 | | | | 2.122 | | | | 2,150,000 | | | | (92,785 | ) | | | 38,069 | | | | 4,300 | | | | — | | | | (50,416 | ) |
The accompanying Notes to Consolidated Financial Statements are an integral part of this statement.
| | |
| |
| | Active Portfolios® Multi-Manager Alternative Strategies Fund |
Consolidated Portfolio of Investments (continued)
August 31, 2013
Credit Default Swap Contracts Outstanding at August 31, 2013 (continued)
Sell Protection (continued)
| | | | | | | | | | | | | | | | | | | | | | | | | | | | | | | | | | | | |
| Counterparty | | Reference
Entity | | Expiration
Date | | Receive
Fixed
Rate (%) | | | Implied
Credit
Spread (%)** | | | Notional
Amount ($) | | | Market
Value ($) | | | Unamortized
Premium
(Paid)
Received ($) | | | Periodic
Payments
Receivable
(Payable) ($) | | | Unrealized
Appreciation
($) | | | Unrealized
Depreciation
($) | |
Goldman Sachs International | | Republic of South Africa | | December 20, 2017 | | | 1.000 | | | | 2.197 | | | | 1,386,000 | | | | (67,293 | ) | | | 28,294 | | | | 2,772 | | | | — | | | | (36,227 | ) |
| | | | | | | | | | |
Citibank | | Republic of South Africa | | June 20, 2018 | | | 1.000 | | | | 2.323 | | | | 2,110,000 | | | | (124,520 | ) | | | 49,080 | | | | 4,220 | | | | — | | | | (71,220 | ) |
| | | | | | | | | | |
JPMorgan | | Republic of Turkey | | September 20, 2022 | | | 1.000 | | | | 2.802 | | | | 2,880,000 | | | | (376,926 | ) | | | 157,487 | | | | 5,760 | | | | — | | | | (213,679 | ) |
| | | | | | | | | | |
JPMorgan | | Republic of Turkey | | September 20, 2022 | | | 1.000 | | | | 2.802 | | | | 600,000 | | | | (78,526 | ) | | | 40,514 | | | | 1,200 | | | | — | | | | (36,812 | ) |
Total | | | | | | | | | | | | | | | | | | | | | | | | | | | | | | | 4,074 | | | | (672,406 | ) |
| | ** | Implied credit spreads, represented in absolute terms, utilized in determining the market value of credit default swap agreements on corporate or sovereign issues as of period end serve as an indicator of the current status of the payment/performance risk and represent the likelihood or risk of default for the credit derivative. The implied credit spread of a particular referenced entity reflects the cost of buying/ selling protection and may include upfront payments required to be made to enter into the agreement. Wider credit spreads represent a deterioration of the referenced entity’s credit soundness and a greater likelihood or risk of default or other credit event occurring as defined under the terms of the agreement. |
Cross-Currency Swap Contracts Outstanding at August 31, 2013
At August 31, 2013, cash totaling $590,937 was received from broker as collateral to cover open cross-currency swap contracts.
| | | | | | | | | | | | | | | | | | | | | | | | | | | | | | | | |
| Counterparty | | Fund Receives | | Fund Pays | | Expiration
Date | | | Notional
Amount of
Currency
Received ($) | | | Notional
Amount of
Currency
Delivered | | | Unrealized
Appreciation
($) | | | Unrealized
Depreciation
($) | |
Goldman Sachs International | | Floating rate equal to 3-month USD-LIBOR-BBA based on the notional amount of the currency delivered | | Fixed rate equal to 6.25% based on the notional amount of the currency received | | | October 16, 2020 | | | | TRY | | | | 900,000 | | | | USD | | | | 498,339 | | | | 95,014 | | | | — | |
| | | | | | | | | |
Citibank | | Floating rate equal to 3-month USD-LIBOR-BBA based on the notional amount of the currency delivered | | Fixed rate equal to 6.95% based on the notional amount of the currency received | | | January 6, 2021 | | | | TRY | | | | 6,195,838 | | | | USD | | | | 3,520,362 | | | | 673,042 | | | | — | |
| | | | | | | | | |
JPMorgan | | Floating rate equal to 3-month USD-LIBOR-BBA based on the notional amount of the currency delivered | | Fixed rate equal to 6.89% based on the notional amount of the currency received | | | January 6, 2021 | | | | TRY | | | | 1,810,195 | | | | USD | | | | 980,073 | | | | 151,330 | | | | — | |
| | | | | | | | | |
JPMorgan | | Floating rate equal to 3-month USD-LIBOR-BBA based on the notional amount of the currency delivered | | Fixed rate equal to 7.86% based on the notional amount of the currency received | | | July 21, 2021 | | | | TRY | | | | 2,770,890 | | | | USD | | | | 1,446,940 | | | | 162,369 | | | | — | |
| | | | | | |
Total | | | | | | | | | | | | | | | | | | | | | | | | | | | 1,081,755 | | | | — | |
| | | | | | |
The accompanying Notes to Consolidated Financial Statements are an integral part of this statement.
| | |
| |
| Active Portfolios® Multi-Manager Alternative Strategies Fund | | |
Consolidated Portfolio of Investments (continued)
August 31, 2013
Interest Rate Swap Contracts Outstanding at August 31, 2013
At August 31, 2013, securities and cash totaling $205,060 were pledged as collateral to cover open interest rate swap contracts. In addition, cash totaling $25,125 was received from broker as collateral.
| | | | | | | | | | | | | | | | | | | | | | | | | | | | |
| Counterparty | | Floating Rate Index | | Fund
Pay/Receive
Floating
Rate | | | Fixed
Rate (%) | | | Expiration
Date | | Notional
Currency | | | Notional
Amount | | | Unrealized
Appreciation
($) | | | Unrealized
Depreciation
($) | |
JPMorgan | | 1-Day Overnight Brazil CETIP Interbank Deposit | | | Pay | | | | 11.443 | | | January 2, 2017 | | | BRL | | | | 24,730,650 | | | | — | | | | (66,716 | ) |
| | | | | | | | |
Citibank New York | | 6-Month PLN-WIBOR-WIBO | | | Pay | | | | 4.333 | | | July 30, 2017 | | | PLN | | | | 3,120,000 | | | | 19,741 | | | | — | |
| | | | | | | | |
Goldman Sachs International | | 6-Month PLN-WIBOR-WIBO | | | Pay | | | | 4.345 | | | August 1, 2017 | | | PLN | | | | 3,860,000 | | | | 24,860 | | | | — | |
| | | | | | | | |
Citibank New York | | 6-Month PLN-WIBOR-WIBO | | | Pay | | | | 4.240 | | | August 7, 2017 | | | PLN | | | | 9,400,000 | | | | 48,408 | | | | — | |
| | | | | | | | |
Citibank New York | | 6-Month PLN-WIBOR-WIBO | | | Pay | | | | 4.300 | | | August 10, 2017 | | | PLN | | | | 2,028,000 | | | | 11,738 | | | | — | |
| | | | | | | | |
JPMorgan Chase Bank New York | | 6-Month PLN-WIBOR-WIBO | | | Pay | | | | 4.325 | | | August 17, 2017 | | | PLN | | | | 2,160,000 | | | | 12,882 | | | | — | |
| | | | | | | | |
Citibank New York | | 6-Month PLN-WIBOR-WIBO | | | Pay | | | | 4.400 | | | August 20, 2017 | | | PLN | | | | 1,980,000 | | | | 13,370 | | | | — | |
| | | | | | | | |
Morgan Stanley Capital Services | | 6-Month PLN-WIBOR-WIBO | | | Pay | | | | 4.370 | | | August 23, 2017 | | | PLN | | | | 2,040,000 | | | | 12,986 | | | | — | |
| | | | | | | | |
Citibank | | 6-Month PLN-WIBOR-WIBO | | | Receive | | | | 3.350 | | | August 27, 2017 | | | PLN | | | | 1,200,000 | | | | 6,348 | | | | — | |
| | | | | | | | |
Citibank New York | | 6-Month PLN-WIBOR-WIBO | | | Pay | | | | 4.350 | | | August 27, 2017 | | | PLN | | | | 1,200,000 | | | | 7,289 | | | | — | |
| | | | | | | | |
Citibank | | 6-Month PLN-WIBOR-WIBO | | | Receive | | | | 3.590 | | | September 18, 2017 | | | PLN | | | | 1,860,000 | | | | 4,835 | | | | — | |
| | | | | | | | |
Citibank | | 6-Month PLN-WIBOR-WIBO | | | Pay | | | | 4.300 | | | September 18, 2017 | | | PLN | | | | 1,860,000 | | | | 24,167 | | | | — | |
| | | | | | | | |
Citibank | | 6-Month PLN-WIBOR-WIBO | | | Pay | | | | 3.810 | | | November 13, 2017 | | | PLN | | | | 1,600,000 | | | | 9,483 | | | | — | |
| | | | | | | | |
Citibank | | 6-Month PLN-WIBOR-WIBO | | | Pay | | | | 3.820 | | | November 14, 2017 | | | PLN | | | | 4,090,000 | | | | 24,956 | | | | — | |
| | | | | | | | |
Citibank | | 6-Month PLN-WIBOR-WIBO | | | Receive | | | | 3.597 | | | November 19, 2017 | | | PLN | | | | 11,730,000 | | | | 5,176 | | | | — | |
| | | | | | | | |
Citibank | | 6-Month PLN-WIBOR-WIBO | | | Pay | | | | 3.815 | | | November 19, 2017 | | | PLN | | | | 11,730,000 | | | | 71,655 | | | | — | |
| | | | | | | | |
Goldman Sachs International | | 6-Month PLN-WIBOR-WIBO | | | Pay | | | | 3.800 | | | November 20, 2017 | | | PLN | | | | 4,264,000 | | | | 25,068 | | | | — | |
| | | | | | | | |
Citibank | | 28-Day MXN TIIE-Banxico | | | Receive | | | | 5.400 | | | July 13, 2018 | | | MXN | | | | 22,720,000 | | | | 39,835 | | | | — | |
| | | | | | | | |
JPMorgan | | 28-Day MXN TIIE-Banxico | | | Receive | | | | 5.410 | | | July 13, 2018 | | | MXN | | | | 33,397,000 | | | | 57,460 | | | | — | |
| | | | | | | | |
Citibank | | 28-Day MXN TIIE-Banxico | | | Receive | | | | 5.440 | | | July 17, 2018 | | | MXN | | | | 11,590,000 | | | | 19,105 | | | | — | |
| | | | | | | | |
JPMorgan | | 28-Day MXN TIIE-Banxico | | | Receive | | | | 5.445 | | | July 17, 2018 | | | MXN | | | | 8,690,000 | | | | 14,182 | | | | — | |
| | | | | | | | |
Citibank | | 28-Day MXN TIIE-Banxico | | | Receive | | | | 5.395 | | | July 18, 2018 | | | MXN | | | | 11,630,000 | | | | 20,960 | | | | — | |
| | | | | | | | |
Citibank | | 3-Month KRW-CD-KSDA-Bloomberg | | | Receive | | | | 3.246 | | | August 19, 2018 | | | KRW | | | | 2,365,157,000 | | | | — | | | | (9,247 | ) |
The accompanying Notes to Consolidated Financial Statements are an integral part of this statement.
| | |
| |
| | Active Portfolios® Multi-Manager Alternative Strategies Fund |
Consolidated Portfolio of Investments (continued)
August 31, 2013
Interest Rate Swap Contracts Outstanding at August 31, 2013 (continued)
| | | | | | | | | | | | | | | | | | | | | | | | | | | | |
| Counterparty | | Floating Rate Index | | Fund
Pay/Receive
Floating
Rate | | | Fixed
Rate (%) | | | Expiration
Date | | Notional
Currency | | | Notional
Amount | | | Unrealized
Appreciation
($) | | | Unrealized
Depreciation
($) | |
| | | | | | | | |
Goldman Sachs International | | 3-Month KRW-CD-KSDA-Bloomberg | | | Receive | | | | 3.263 | | | August 19, 2018 | | | KRW | | | | 872,245,000 | | | | — | | | | (4,032 | ) |
| | | | | | | | |
JPMorgan | | 3-Month KRW-CD-KSDA-Bloomberg | | | Receive | | | | 3.260 | | | August 19, 2018 | | | KRW | | | | 290,748,000 | | | | — | | | | (1,304 | ) |
Citibank | | 3-Month KRW-CD-KSDA-Bloomberg | | | Receive | | | | 3.300 | | | August 20, 2018 | | | KRW | | | | 1,219,628,000 | | | | — | | | | (7,482 | ) |
| | | | | | | | |
JPMorgan | | 3-Month KRW-CD-KSDA-Bloomberg | | | Receive | | | | 3.293 | | | August 20, 2018 | | | KRW | | | | 1,844,219,000 | | | | — | | | | (10,775 | ) |
| | | | | | | | |
Citibank | | 3-Month KRW-CD-KSDA-Bloomberg | | | Receive | | | | 3.263 | | | August 22, 2018 | | | KRW | | | | 9,328,225,754 | | | | — | | | | (42,248 | ) |
| | | | | | | | |
Citibank London | | 3-Month NZD-BBR | | | Pay | | | | 3.815 | | | August 13, 2022 | | | NZD | | | | 1,362,000 | | | | — | | | | (79,196 | ) |
| | | | | | | | |
Citibank New York | | 3-Month NZD FIX-FRA | | | Pay | | | | 3.899 | | | August 13, 2022 | | | NZD | | | | 1,760,000 | | | | — | | | | (93,958 | ) |
| | | | | | | | |
Citibank | | 3-Month NZD-BBR | | | Pay | | | | 3.775 | | | October 30, 2022 | | | NZD | | | | 701,000 | | | | — | | | | (38,486 | ) |
| | | | | | | | |
JPMorgan | | 3-Month NZD-BBR-BRA | | | Pay | | | | 4.060 | | | June 4, 2023 | | | NZD | | | | 1,140,000 | | | | — | | | | (55,497 | ) |
| | | | | | | | |
JPMorgan | | 3-Month NZD-BBR-FRA | | | Pay | | | | 4.060 | | | June 4, 2023 | | | NZD | | | | 1,140,000 | | | | — | | | | (55,452 | ) |
| | | | | | | | |
Citibank | | 6-Month AUD Bankbills | | | Pay | | | | 4.308 | | | July 4, 2023 | | | AUD | | | | 2,289,000 | | | | — | | | | (12,203 | ) |
| | | | | | | | |
Citibank | | 28-Day MXN TIIE-Banxico | | | Pay | | | | 6.380 | | | July 7, 2023 | | | MXN | | | | 13,040,000 | | | | — | | | | (46,008 | ) |
| | | | | | | | |
JPMorgan | | 28-Day MXN TIIE-Banxico | | | Pay | | | | 6.390 | | | July 7, 2023 | | | MXN | | | | 18,850,000 | | | | — | | | | (65,459 | ) |
| | | | | | | | |
Citibank | | 28-Day MXN TIIE-Banxico | | | Pay | | | | 6.404 | | | July 11, 2023 | | | MXN | | | | 6,650,000 | | | | — | | | | (22,763 | ) |
| | | | | | | | |
JPMorgan | | 28-Day MXN TIIE-Banxico | | | Pay | | | | 6.410 | | | July 11, 2023 | | | MXN | | | | 4,920,000 | | | | — | | | | (16,678 | ) |
| | | | | | | | |
Citibank | | 28-Day MXN TIIE-Banxico | | | Pay | | | | 6.360 | | | July 12, 2023 | | | MXN | | | | 6,670,000 | | | | — | | | | (24,507 | ) |
| | | | | | | | |
Citibank | | 6-Month AUD Bankbills | | | Pay | | | | 4.309 | | | July 15, 2023 | | | AUD | | | | 2,427,000 | | | | — | | | | (13,324 | ) |
| | | | | | | | |
Citibank | | 6-Month AUD Bankbills | | | Pay | | | | 4.300 | | | July 15, 2023 | | | AUD | | | | 1,578,000 | | | | — | | | | (9,709 | ) |
| | | | | | | | |
Citibank | | 6-Month AUD Bankbills | | | Pay | | | | 4.478 | | | August 20, 2023 | | | AUD | | | | 1,820,000 | | | | 9,324 | | | | — | |
| | | | | | | | |
Citibank | | 6-Month AUD Bankbills | | | Pay | | | | 4.523 | | | August 26, 2023 | | | AUD | | | | 2,559,000 | | | | 20,538 | | | | — | |
| | | | | | | | | | | | | | | | | | | | | | | | | | | | | |
Total | | | | | | | | | | | | | | | | | | | | | | | 504,366 | | | | (675,044 | ) |
| | | | | | | | | | | | | | | | | | | | | | | | | | | | | |
Total Return Swap Contracts Outstanding at August 31, 2013
At August 31, 2013, cash totaling $187,393 was received from broker as collateral to cover open total return swap contracts.
| | | | | | | | | | | | | | | | | | | | | | | | |
| Counterparty | | Fund Receives | | Fund Pays | | Expiration
Date | | | Notional
Currency | | | Notional
Amount | | | Unrealized
Appreciation
($) | | | Unrealized
Depreciation
($) | |
Standard Chartered New York | | Total return on Nigeria T-Bill | | Floating rate based on 3-month USD LIBOR plus 1.50% | | | September 30, 2013 | | | | NGN | | | | 1,205,233,966 | | | | 585,397 | | | | — | |
| | | | | | | |
Goldman Sachs | | Total return on Ithaca Energy Inc. | | Floating rate based on 1-month GBP LIBOR-BBA plus 0.45% | | | April 19, 2014 | | | | GBP | | | | 275 | | | | 322 | | | | — | |
The accompanying Notes to Consolidated Financial Statements are an integral part of this statement.
| | |
| |
| Active Portfolios® Multi-Manager Alternative Strategies Fund | | |
Consolidated Portfolio of Investments (continued)
August 31, 2013
Total Return Swap Contracts Outstanding at August 31, 2013 (continued)
| | | | | | | | | | | | | | | | | | | | | | | | |
| Counterparty | | Fund Receives | | Fund Pays | | Expiration
Date | | | Notional
Currency | | | Notional
Amount | | | Unrealized
Appreciation
($) | | | Unrealized
Depreciation
($) | |
| | | | | | | |
Goldman Sachs | | Total return on Whitehaven Coal Ltd. | | Floating rate based on 1-month AUD LIBOR-BBA plus 0.50% | |
| April 30,
2014 |
| | | AUD | | | | 24,871 | | | | 94 | | | | — | |
| | | | | | | |
Goldman Sachs | | Floating rate based on 1-month HKD HIBOR-HKAB minus 1.00% | | Total return on Yanzhou Coal Mining Co., Class H | | | May 23, 2014 | | | | HKD | | | | 12,204 | | | | — | | | | (566 | ) |
| | | | | | | |
Goldman Sachs | | Floating rate based on 1-month HKD HIBOR-HKAB minus 1.00% | | Total return on Yanzhou Coal Mining Co., Class H | | | June 4, 2014 | | | | HKD | | | | 11,874 | | | | — | | | | (551 | ) |
| | | | | | | |
Goldman Sachs | | Floating rate based on 1-month HKD HIBOR-HKAB minus 1.00% | | Total return on Yanzhou Coal Mining Co., Class H | | | June 6, 2014 | | | | HKD | | | | 20,793 | | | | — | | | | (964 | ) |
Goldman Sachs | | Total return on Yancoal Australian Ltd. | | Floating rate based on 1-month AUD LIBOR-BBA plus 0.50% | | | June 6, 2014 | | | | AUD | | | | 6,235 | | | | — | | | | (83 | ) |
| | | | | | | |
Goldman Sachs | | Total return on Yancoal Australian Ltd. | | Floating rate based on 1-month AUD LIBOR-BBA plus 0.50% | | | July 14, 2014 | | | | AUD | | | | 59,782 | | | | — | | | | (801 | ) |
| | |
Total | | | | | | | | | | | | | | | | | | | 585,813 | | | | (2,965 | ) |
| | |
Total Return Swap Contracts on Futures at August 31, 2013
At August 31, 2013, securities and cash totaling $4,487,725 were pledged as collateral to cover open total return swap contracts on futures.
| | | | | | | | | | | | | | | | | | | | | | |
| Counterparty | | Reference Instrument | | Expiration
Date | | | Notional
Currency | | | Notional
Amount | | | Unrealized
Appreciation
($) | | | Unrealized
(Depreciation)
($) | |
J.P. Morgan | | Swiss Market Index Futures | | | September 2013 | | | | CHF | | | | 1,837,176 | | | | — | | | | (52,527 | ) |
| | | | | | |
Barclays | | Euro-SCHATZ Futures | | | September 2013 | | | | EUR | | | | (51,638,159 | ) | | | — | | | | (39,600 | ) |
| | | | | | |
Barclays | | European ICE Gasoil Futures | | | September 2013 | | | | USD | | | | 3,684,100 | | | | 98,386 | | | | — | |
| | | | | | |
Barclays | | Brent Crude Oil Futures | | | September 2013 | | | | USD | | | | 5,244,460 | | | | 173,925 | | | | — | |
| | | | | | |
Barclays | | LME Primary Aluminum Futures | | | September 2013 | | | | USD | | | | (1,242,150 | ) | | | 10,041 | | | | — | |
| | | | | | |
Barclays | | Crude Oil Futures | | | September 2013 | | | | USD | | | | 4,951,900 | | | | 18,918 | | | | — | |
| | | | | | |
Barclays | | Henry Hub Natural Gas Futures | | | September 2013 | | | | USD | | | | (2,542,510 | ) | | | — | | | | (120,645 | ) |
| | | | | | |
Barclays | | NY Harb ULSD Future | | | September 2013 | | | | USD | | | | 2,898,218 | | | | 24,481 | | | | — | |
| | | | | | |
Barclays | | RBOB Gasoline Futures | | | September 2013 | | | | USD | | | | 4,127,063 | | | | 48,659 | | | | — | |
| | | | | | |
Barclays | | Sugar #11 Futures | | | September 2013 | | | | USD | | | | (54,902 | ) | | | 1,445 | | | | — | |
| | | | | | |
Barclays | | Lean Hogs Futures | | | October 2013 | | | | USD | | | | 2,032,900 | | | | 36,237 | | | | — | |
| | | | | | |
Barclays | | Soybean Oil Futures | | | December 2013 | | | | USD | | | | (956,664 | ) | | | 66,127 | | | | — | |
| | | | | | |
Barclays | | Wheat Futures | | | December 2013 | | | | USD | | | | (2,812,200 | ) | | | — | | | | (50,502 | ) |
| | | | | | |
Barclays | | Coffee Futures | | | December 2013 | | | | USD | | | | (43,613 | ) | | | 1,519 | | | | — | |
| | | | | | |
Barclays | | Gold 100 oz. Futures | | | December 2013 | | | | USD | | | | (2,512,980 | ) | | | — | | | | (164,460 | ) |
| | | | | | |
Citibank | | Gold Bars Futures | | | December 2013 | | | | USD | | | | (3,208,877 | ) | | | — | | | | (54,128 | ) |
| | | | | | |
Barclays | | Silver Futures | | | December 2013 | | | | USD | | | | (1,175,650 | ) | | | — | | | | (102,000 | ) |
| | | | | | |
Barclays | | U.S. 2 Year Note | | | December 2013 | | | | USD | | | | (16,041,750 | ) | | | — | | | | (3,885 | ) |
| | | | | | | | | | | | | | | | | | | | | | | |
Total | | | | | | | | | | | | | | | | | 479,738 | | | | (587,747 | ) |
| | | | | | | | | | | | | | | | | | | | | | | |
The accompanying Notes to Consolidated Financial Statements are an integral part of this statement.
| | |
| |
| | Active Portfolios® Multi-Manager Alternative Strategies Fund |
Consolidated Portfolio of Investments (continued)
August 31, 2013
Notes to Portfolio of Investments
| (b) | Securities are pledged with brokers as collateral for securities sold short. |
| (c) | Variable rate security. |
| (d) | Principal amounts are denominated in United States Dollars unless otherwise noted. |
| (e) | Security exempt from registration pursuant to Rule 144A under the Securities Act of 1933. This security may be resold in transactions exempt from registration, normally to qualified institutional buyers. At August 31, 2013, the value of these securities amounted to $17,953,702 or 2.69% of net assets. |
| (f) | Represents securities that have defaulted on payment of interest. The Fund has stopped accruing interest on these securities. At August 31, 2013, the value of these securities amounted to $1,955,497, which represents 0.29% of net assets. |
| (g) | The rate shown is the seven-day current annualized yield at August 31, 2013. |
| (h) | As defined in the Investment Company Act of 1940, an affiliated company is one in which the Fund owns 5% or more of its outstanding voting securities, or a company which is under common ownership or control with the Fund. Holdings and transactions in these affiliated companies during the year ended August 31, 2013, are as follows: |
| | | | | | | | | | | | | | | | | | | | | | | | | | | | |
| Issuer | | Beginning
Cost ($) | | | Purchase
Cost ($) | | | Proceeds
From Sales ($) | | | Realized
Gain (Loss) ($) | | | Ending
Cost ($) | | | Dividends —
Affiliated
Issuers ($) | | | Value ($) | |
Columbia Short-Term Cash Fund | | | 126,810,627 | | | | 530,681,949 | | | | (489,707,321 | ) | | | — | | | | 167,785,255 | | | | 217,826 | | | | 167,785,255 | |
| | | | | | | |
Aerosonic Corp | | | — | | | | 1,723,685 | | | | (1,725,129 | ) | | | 1,444 | | | | — | | | | — | | | | — | |
| | |
Total | | | 126,810,627 | | | | 532,405,634 | | | | (491,432,450 | ) | | | 1,444 | | | | 167,785,255 | | | | 217,826 | | | | 167,785,255 | |
| | |
| (i) | At August 31, 2013, long- or short-term securities were designated to cover open put and/or call options written. |
| (j) | At August 31, 2013, cash totaling $48,078 was received from broker as collateral to cover open options purchased calls. |
| (k) | At August 31, 2013, cash totaling $123,039 was received from broker as collateral to cover open options purchased puts. |
| (l) | This security, or a portion of this security, has been pledged as collateral in connection with forward foreign currency exchange contracts, options contracts and swap contracts. Those values are denoted within the Investments in Derivatives section of the Consolidated Portfolio of Investments. |
Abbreviation Legend
| | |
| ADR | | American Depositary Receipt |
| NVDR | | Non-voting Depository Receipt |
| PIK | | Payment-in-Kind |
Currency Legend
| | |
| AUD | | Australian Dollar |
| BRL | | Brazilian Real |
| CAD | | Canadian Dollar |
| CHF | | Swiss Franc |
| CLP | | Chilean Peso |
| COP | | Colombian Peso |
| CZK | | Czech Koruna |
| EUR | | Euro |
| GBP | | British Pound |
| HRK | | Croatian Kuna |
| HUF | | Hungarian Forint |
| IDR | | Indonesian Rupiah |
| ILS | | New Israeli Sheqel |
| INR | | Indian Rupee |
| JPY | | Japanese Yen |
| KRW | | South Korean Won |
| LBP | | Lebanese Pound |
| MXN | | Mexican Peso |
| MYR | | Malaysian Ringgit |
| NGN | | Nigerian Naira |
| NOK | | Norwegian Krone |
| NZD | | New Zealand Dollar |
| PHP | | Philippine Peso |
| PLN | | Polish Zloty |
| RON | | Romania, New Lei |
The accompanying Notes to Consolidated Financial Statements are an integral part of this statement.
| | |
| |
| Active Portfolios® Multi-Manager Alternative Strategies Fund | | |
Consolidated Portfolio of Investments (continued)
August 31, 2013
Currency Legend (continued)
| | |
| RSD | | Serbian Dinar |
| RUB | | Russian Rouble |
| SEK | | Swedish Krona |
| SGD | | Singapore Dollar |
| THB | | Thailand Baht |
| TRY | | Turkish Lira |
| TWD | | Taiwan Dollar |
| USD | | US Dollar |
| ZAR | | South African Rand |
| ZMW | | Zambian Kwacha |
Fair Value Measurements
Generally accepted accounting principles (GAAP) require disclosure regarding the inputs and valuation techniques used to measure fair value and any changes in valuation inputs or techniques. In addition, investments shall be disclosed by major category.
The Fund categorizes its fair value measurements according to a three-level hierarchy that maximizes the use of observable inputs and minimizes the use of unobservable inputs by prioritizing that the most observable input be used when available. Observable inputs are those that market participants would use in pricing an investment based on market data obtained from sources independent of the reporting entity. Unobservable inputs are those that reflect the Fund’s assumptions about the information market participants would use in pricing an investment. An investment’s level within the fair value hierarchy is based on the lowest level of any input that is deemed significant to the asset or liability’s fair value measurement. The input levels are not necessarily an indication of the risk or liquidity associated with investments at that level. For example, certain U.S. government securities are generally high quality and liquid, however, they are reflected as Level 2 because the inputs used to determine fair value may not always be quoted prices in an active market.
Fair value inputs are summarized in the three broad levels listed below:
| > | | Level 1 — Valuations based on quoted prices for investments in active markets that the Fund has the ability to access at the measurement date (including NAV for open-end mutual funds). Valuation adjustments are not applied to Level 1 investments. |
| > | | Level 2 — Valuations based on other significant observable inputs (including quoted prices for similar securities, interest rates, prepayment speeds, credit risks, etc.). |
| > | | Level 3 — Valuations based on significant unobservable inputs (including the Fund’s own assumptions and judgment in determining the fair value of investments). |
Inputs that are used in determining fair value of an investment may include price information, credit data, volatility statistics, and other factors. These inputs can be either observable or unobservable. The availability of observable inputs can vary between investments, and is affected by various factors such as the type of investment, and the volume and level of activity for that investment or similar investments in the marketplace. The inputs will be considered by the Investment Manager, along with any other relevant factors in the calculation of an investment’s fair value. The Fund uses prices and inputs that are current as of the measurement date, which may include periods of market dislocations. During these periods, the availability of prices and inputs may be reduced for many investments. This condition could cause an investment to be reclassified between the various levels within the hierarchy.
Foreign equity securities actively traded in markets where there is a significant delay in the local close relative to the New York Stock Exchange (NYSE) are classified as Level 2. The values of these securities may include an adjustment to reflect the impact of significant market movements following the close of local trading, as described in Note 2 to the financial statements — Security Valuation.
Investments falling into the Level 3 category are primarily supported by quoted prices from brokers and dealers participating in the market for those investments. However, these may be classified as Level 3 investments due to lack of market transparency and corroboration to support these quoted prices. Additionally, valuation models may be used as the pricing source for any remaining investments classified as Level 3. These models may rely on one or more significant unobservable inputs and/or significant assumptions by the Investment Manager. Inputs used in valuations may include, but are not limited to, financial statement analysis, capital account balances, discount rates and estimated cash flows, and comparable company data.
Under the direction of the Fund’s Board of Trustees (the Board), the Investment Manager’s Valuation Committee (the Committee) is responsible for carrying out the valuation procedures approved by the Board. The Committee consists of voting and non-voting members from various groups within the Investment Manager’s organization, including operations and accounting, trading and investments, compliance, risk management and legal.
The Committee meets at least monthly to review and approve valuation matters, which may include a description of specific valuation determinations, data regarding pricing information received from approved pricing vendors and brokers and the results of Board-approved valuation control policies and procedures (the Policies). The Policies address, among other things, instances when market quotations are or are not readily available, including recommendations of third party pricing vendors and a determination of appropriate pricing methodologies; events that require specific valuation determinations and assessment of fair value techniques; securities with a potential for stale pricing, including those that are illiquid, restricted, or in default; and the effectiveness of third-party pricing vendors, including periodic reviews of vendors. The Committee meets more frequently, as needed, to discuss additional valuation matters, which may include the need to review back-testing results, review time-sensitive information or approve related valuation actions. The Committee reports to the Board, with members of the Committee meeting with the Board at each of its regularly scheduled meetings to discuss valuation matters and actions during the period, similar to those described earlier.
For investments categorized as Level 3, the Committee monitors information similar to that described above, which may include: (i) data specific to the issuer or comparable issuers, (ii) general market or specific sector news and (iii) quoted prices and specific or similar security transactions. The Committee considers this data and any changes from prior periods in order to assess the reasonableness of observable and unobservable inputs, any assumptions or internal models used to value those securities and changes in fair value. This data is also used to corroborate, when available, information received from approved pricing vendors and brokers. Various factors impact the frequency of monitoring this information (which may occur as often as daily). However, the Committee may determine that changes to inputs, assumptions and models are not required as a result of the monitoring procedures performed.
The accompanying Notes to Consolidated Financial Statements are an integral part of this statement.
| | |
| |
| | Active Portfolios® Multi-Manager Alternative Strategies Fund |
Consolidated Portfolio of Investments (continued)
August 31, 2013
Fair Value Measurements (continued)
The following table is a summary of the inputs used to value the Fund’s investments at August 31, 2013:
| | | | | | | | | | | | | | | | |
| Description | | Level 1
Quoted Prices in Active
Markets for Identical
Assets ($) | | | Level 2
Other Significant
Observable Inputs ($) | | | Level 3
Significant
Unobservable Inputs ($) | | | Total ($) | |
Equity Securities | | | | | | | | | | | | | | | | |
| | | | |
Common Stocks | | | | | | | | | | | | | | | | |
| | | | |
Consumer Discretionary | | | 32,558,807 | | | | 3,464,246 | | | | — | | | | 36,023,053 | |
| | | | |
Consumer Staples | | | 10,730,743 | | | | 7,706,266 | | | | — | | | | 18,437,009 | |
| | | | |
Energy | | | 47,582,674 | | | | 858,352 | | | | — | | | | 48,441,026 | |
| | | | |
Financials | | | 38,028,016 | | | | 4,565,937 | | | | — | | | | 42,593,953 | |
| | | | |
Health Care | | | 29,087,999 | | | | 168,796 | | | | — | | | | 29,256,795 | |
| | | | |
Industrials | | | 14,360,215 | | | | 445,598 | | | | — | | | | 14,805,813 | |
| | | | |
Information Technology | | | 46,833,862 | | | | — | | | | — | | | | 46,833,862 | |
| | | | |
Materials | | | 11,426,171 | | | | 549,337 | | | | — | | | | 11,975,508 | |
| | | | |
Telecommunication Services | | | 4,032,049 | | | | 376,599 | | | | — | | | | 4,408,648 | |
| | | | |
Utilities | | | — | | | | 204,049 | | | | — | | | | 204,049 | |
| | | | |
Common Stocks — Investments Sold Short | | | | | | | | | | | | | | | | |
| | | | |
Consumer Discretionary | | | (11,486,602 | ) | | | — | | | | — | | | | (11,486,602 | ) |
| | | | |
Consumer Staples | | | (271,878 | ) | | | — | | | | — | | | | (271,878 | ) |
| | | | |
Energy | | | (1,922,314 | ) | | | — | | | | — | | | | (1,922,314 | ) |
| | | | |
Financials | | | (10,195,129 | ) | | | — | | | | — | | | | (10,195,129 | ) |
| | | | |
Health Care | | | (1,468,932 | ) | | | — | | | | — | | | | (1,468,932 | ) |
| | | | |
Industrials | | | (83,317 | ) | | | (82,722 | ) | | | — | | | | (166,039 | ) |
| | | | |
Information Technology | | | (4,015,941 | ) | | | — | | | | — | | | | (4,015,941 | ) |
| | | | |
Materials | | | (39,684 | ) | | | — | | | | — | | | | (39,684 | ) |
| | | | |
Telecommunication Services | | | (2,290,614 | ) | | | — | | | | — | | | | (2,290,614 | ) |
| | | | |
Utilities | | | (1,372,721 | ) | | | (180,409 | ) | | | — | | | | (1,553,130 | ) |
| | | | |
Preferred Stocks | | | | | | | | | | | | | | | | |
| | | | |
Financials | | | 1,380,650 | | | | — | | | | — | | | | 1,380,650 | |
| | | | |
Exchange-Traded Funds | | | 153,667 | | | | — | | | | — | | | | 153,667 | |
| | | | |
Exchange-Traded Funds — Investments Sold Short | | | (5,786,932 | ) | | | — | | | | — | | | | (5,786,932 | ) |
| | |
Total Equity Securities | | | 197,240,789 | | | | 18,076,049 | | | | — | | | | 215,316,838 | |
| | |
Bonds | | | | | | | | | | | | | | | | |
| | | | |
Corporate Bonds & Notes | | | — | | | | 41,881,582 | | | | — | | | | 41,881,582 | |
| | | | |
Corporate Bonds & Notes — Investments Sold Short | | | — | | | | (1,433,588 | ) | | | — | | | | (1,433,588 | ) |
| | | | |
Convertible Bonds | | | — | | | | 6,382,336 | | | | — | | | | 6,382,336 | |
| | | | |
Inflation-Indexed Bonds | | | — | | | | 8,299,111 | | | | — | | | | 8,299,111 | |
| | | | |
Foreign Government Obligations | | | — | | | | 40,678,715 | | | | — | | | | 40,678,715 | |
| | |
Total Bonds | | | — | | | | 95,808,156 | | | | — | | | | 95,808,156 | |
| | |
Short-Term Securities | | | | | | | | | | | | | | | | |
| | | | |
Treasury Bills | | | 84,466,696 | | | | 28,158,664 | | | | — | | | | 112,625,360 | |
| | |
Total Short-Term Securities | | | 84,466,696 | | | | 28,158,664 | | | | — | | | | 112,625,360 | |
| | |
The accompanying Notes to Consolidated Financial Statements are an integral part of this statement.
| | |
| |
| Active Portfolios® Multi-Manager Alternative Strategies Fund | | |
Consolidated Portfolio of Investments (continued)
August 31, 2013
Fair Value Measurements (continued)
| | | | | | | | | | | | | | | | |
| Description | | Level 1
Quoted Prices in Active
Markets for Identical
Assets ($) | | | Level 2
Other Significant
Observable Inputs ($) | | | Level 3
Significant
Unobservable Inputs ($) | | | Total ($) | |
Other | | | | | | | | | | | | | | | | |
| | | | |
Exchange-Traded Notes — Investments Sold Short | | | (275,286 | ) | | | — | | | | — | | | | (275,286 | ) |
| | | | |
Options Purchased Calls | | | 275,646 | | | | — | | | | — | | | | 275,646 | |
| | | | |
Options Purchased Puts | | | 254,727 | | | | — | | | | — | | | | 254,727 | |
| | |
Total Other | | | 255,087 | | | | — | | | | — | | | | 255,087 | |
| | |
Mutual Funds | | | | | | | | | | | | | | | | |
| | | | |
Money Market Funds | | | 169,035,425 | | | | — | | | | — | | | | 169,035,425 | |
| | |
Total Mutual Funds | | | 169,035,425 | | | | — | | | | — | | | | 169,035,425 | |
| | |
Investments in Securities | | | 450,997,997 | | | | 142,042,869 | | | | — | | | | 593,040,866 | |
| | | | |
Derivatives | | | | | | | | | | | | | | | | |
| | | | |
Assets | | | | | | | | | | | | | | | | |
| | | | |
Futures Contracts | | | 3,171,690 | | | | — | | | | — | | | | 3,171,690 | |
| | | | |
Forward Foreign Currency Exchange Contracts | | | — | | | | 11,613,263 | | | | — | | | | 11,613,263 | |
| | | | |
Swap Contracts | | | — | | | | 4,123,876 | | | | — | | | | 4,123,876 | |
| | | | |
Liabilities | | | | | | | | | | | | | | | | |
| | | | |
Futures Contracts | | | (1,894,036 | ) | | | — | | | | — | | | | (1,894,036 | ) |
| | | | |
Options Contracts Written | | | — | | | | (1,698,372 | ) | | | — | | | | (1,698,372 | ) |
| | | | |
Forward Foreign Currency Exchange Contracts | | | — | | | | (12,846,480 | ) | | | — | | | | (12,846,480 | ) |
| | | | |
Swap Contracts | | | | | | | (2,257,133 | ) | | | — | | | | (2,257,133 | ) |
| | |
Total | | | 452,275,651 | | | | 140,978,023 | | | | — | | | | 593,253,674 | |
| | |
See the Portfolio of Investments for all investment classifications not indicated in the table.
The Fund’s assets assigned to the Level 2 input category are generally valued using the market approach, in which a security’s value is determined through reference to prices and information from market transactions for similar or identical assets. These assets include certain foreign securities for which a third party statistical pricing service may be employed for purposes of fair market valuation. The models utilized by the third party statistical pricing service take into account a security’s correlation to available market data including, but not limited to, intraday index, ADR, and ETF movements.
There were no transfers of financial assets between Levels 1 and 2 during the period.
Futures contracts, forward foreign currency exchange contracts and swap contracts are valued at unrealized appreciation (depreciation).
The following table is a reconciliation of Level 3 assets for which significant observable and/or unobservable inputs were used to determine fair value.
| | | | |
| | | Corporate Bonds &
Notes ($) | |
Balance as of August 31, 2012 | | | 1,140,000 | |
| |
Accrued discounts/premiums | | | 7 | |
| |
Realized gain (loss) | | | (49,993 | ) |
| |
Change in unrealized appreciation (depreciation) | | | (90,007 | ) |
| |
Sales | | | (1,000,007 | ) |
| |
Purchases | | | — | |
| |
Transfers into Level 3 | | | — | |
| |
Transfers out of Level 3 | | | — | |
| | |
Balance as of August 31, 2013 | | | — | |
| | |
The Fund does not hold any significant investments with unobservable inputs which are categorized as Level 3.
Transfers in and/or out of Level 3 are determined based on the fair value at the beginning of the period for security positions held throughout the period.
The accompanying Notes to Consolidated Financial Statements are an integral part of this statement.
| | |
| |
| | Active Portfolios® Multi-Manager Alternative Strategies Fund |
Consolidated Statement of Assets and Liabilities
August 31, 2013
| | | | |
Assets | | | | |
| |
Investments, at value | | | | |
| |
Unaffiliated issuers (identified cost $449,540,614) | | | $466,161,680 | |
| |
Affiliated issuers (identified cost $167,785,255) | | | 167,785,255 | |
| |
Total investments (identified cost $617,325,869) | | | 633,946,935 | |
| |
Cash | | | 48,831,811 | |
| |
Foreign currency (identified cost $2,347,531) | | | 2,331,607 | |
| |
Cash collateral held at broker | | | 4,828,118 | |
| |
Margin deposits | | | 10,813,369 | |
| |
Unrealized appreciation on forward foreign currency exchange contracts | | | 11,613,263 | |
| |
Unrealized appreciation on swap contracts | | | 4,123,876 | |
| |
Premiums paid on outstanding swap contracts | | | 4,050,172 | |
| |
Receivable for: | | | | |
| |
Investments sold | | | 2,172,776 | |
| |
Capital shares sold | | | 3,223,104 | |
| |
Dividends | | | 264,335 | |
| |
Interest | | | 1,795,032 | |
| |
Reclaims | | | 37,360 | |
| |
Variation margin | | | 282,014 | |
| |
Expense reimbursement due from Investment Manager | | | 319 | |
| |
Due from broker | | | 3,065,270 | |
| |
Prepaid expenses | | | 7,624 | |
| |
Trustees’ deferred compensation plan | | | 6,904 | |
| |
Total assets | | | 731,393,889 | |
| |
| |
Liabilities | | | | |
| |
Securities sold short, at value (proceeds $38,627,627) | | | 40,906,069 | |
| |
Option contracts written, at value (premiums received $935,592) | | | 1,698,372 | |
| |
Unrealized depreciation on forward foreign currency exchange contracts | | | 12,846,480 | |
| |
Unrealized depreciation on swap contracts | | | 2,257,133 | |
| |
Premiums received on outstanding swap contracts | | | 941,711 | |
| |
Payable for: | | | | |
| |
Investments purchased | | | 3,494,481 | |
| |
Capital shares purchased | | | 858,342 | |
| |
Dividends and interest on securities sold short | | | 79,333 | |
| |
Variation margin | | | 592,557 | |
| |
Due to broker | | | 1,329,168 | |
| |
Investment management fees | | | 18,407 | |
| |
Distribution and/or service fees | | | 4,562 | |
| |
Transfer agent fees | | | 50,191 | |
| |
Administration fees | | | 1,437 | |
| |
Chief compliance officer expenses | | | 117 | |
| |
Other expenses | | | 81,052 | |
| |
Trustees’ deferred compensation plan | | | 6,904 | |
| |
Total liabilities | | | 65,166,316 | |
| |
Net assets applicable to outstanding capital stock | | | $666,227,573 | |
| |
The accompanying Notes to Consolidated Financial Statements are an integral part of this statement.
| | |
| |
| Active Portfolios® Multi-Manager Alternative Strategies Fund | | |
Consolidated Statement of Assets and Liabilities (continued)
August 31, 2013
| | | | |
| |
Represented by | | | | |
| |
Paid-in capital | | | $641,349,322 | |
| |
Undistributed net investment income | | | 6,525,021 | |
| |
Accumulated net realized gain | | | 2,883,490 | |
| |
Unrealized appreciation (depreciation) on: | | | | |
| |
Investments | | | 16,621,066 | |
| |
Foreign currency translations | | | (21,284 | ) |
| |
Forward foreign currency exchange contracts | | | (1,233,217 | ) |
| |
Futures contracts | | | 1,277,654 | |
| |
Options contracts written | | | (762,780 | ) |
| |
Securities sold short | | | (2,278,442 | ) |
| |
Swap contracts | | | 1,866,743 | |
| |
Total — representing net assets applicable to outstanding capital stock | | | $666,227,573 | |
| |
| |
Class A | | | | |
| |
Net assets | | | $666,227,573 | |
| |
Shares outstanding | | | 63,507,458 | |
| |
Net asset value per share | | | $10.49 | |
| |
The accompanying Notes to Consolidated Financial Statements are an integral part of this statement.
| | |
| |
| | Active Portfolios® Multi-Manager Alternative Strategies Fund |
Consolidated Statement of Operations
Year Ended August 31, 2013
| | | | |
Net investment income | | | | |
| |
Income: | | | | |
| |
Dividends — unaffiliated issuers | | | $3,692,156 | |
| |
Dividends — affiliated issuers | | | 217,826 | |
| |
Interest | | | 6,493,799 | |
| |
Foreign taxes withheld | | | (51,581 | ) |
| |
Total income | | | 10,352,200 | |
| |
| |
Expenses: | | | | |
| |
Investment management fees | | | 5,713,001 | |
| |
Distribution and/or service fees | | | | |
| |
Class A | | | 1,407,702 | |
| |
Transfer agent fees | | | | |
| |
Class A | | | 567,522 | |
| |
Administration fees | | | 447,084 | |
| |
Compensation of board members | | | 42,443 | |
| |
Custodian fees | | | 212,319 | |
| |
Printing and postage fees | | | 87,776 | |
| |
Registration fees | | | 46,917 | |
| |
Professional fees | | | 47,394 | |
| |
Dividends and interest on securities sold short | | | 965,075 | |
| |
Chief compliance officer expenses | | | 451 | |
| |
Other | | | 55,168 | |
| |
Total expenses | | | 9,592,852 | |
| |
Fees waived or expenses reimbursed by Investment Manager and its affiliates | | | (174,772 | ) |
| |
Total net expenses | | | 9,418,080 | |
| |
Net investment income | | | 934,120 | |
| |
| |
Realized and unrealized gain (loss) — net | | | | |
| |
Net realized gain (loss) on: | | | | |
| |
Investments — unaffiliated issuers | | | 13,850,425 | |
| |
Investments — affiliated issuers | | | 1,444 | |
| |
Foreign currency translations | | | (372,091 | ) |
| |
Forward foreign currency exchange contracts | | | 5,380,062 | |
| |
Futures contracts | | | 1,286,064 | |
| |
Options contracts written | | | 1,479,860 | |
| |
Securities sold short | | | (7,065,649 | ) |
| |
Swap contracts | | | (3,248,900 | ) |
| |
Net realized gain | | | 11,311,215 | |
| |
Net change in unrealized appreciation (depreciation) on: | | | | |
| |
Investments | | | 14,979,705 | |
| |
Foreign currency translations | | | (110,328 | ) |
| |
Forward foreign currency exchange contracts | | | 1,306,011 | |
| |
Futures contracts | | | 119,185 | |
| |
Options contracts written | | | (641,953 | ) |
| |
Securities sold short | | | (2,522,577 | ) |
| |
Swap contracts | | | 2,123,781 | |
| |
Foreign capital gains tax | | | 6,278 | |
| |
Net change in unrealized appreciation (depreciation) | | | 15,260,102 | |
| |
Net realized and unrealized gain | | | 26,571,317 | |
| |
Net increase in net assets resulting from operations | | | $27,505,437 | |
| |
The accompanying Notes to Consolidated Financial Statements are an integral part of this statement.
| | |
| |
| Active Portfolios® Multi-Manager Alternative Strategies Fund | | |
Consolidated Statement of Changes in Net Assets
| | | | | | | | |
| | | Year Ended
August 31, 2013 | | | Year Ended
August 31, 2012(a) | |
Operations | | | | | | | | |
| | |
Net investment income | | | $934,120 | | | | $482,769 | |
| | |
Net realized gain | | | 11,311,215 | | | | 1,761,163 | |
| | |
Net change in unrealized appreciation (depreciation) | | | 15,260,102 | | | | 209,638 | |
| |
Net increase in net assets resulting from operations | | | 27,505,437 | | | | 2,453,570 | |
| |
| | |
Distributions to shareholders | | | | | | | | |
| | |
Net investment income | | | | | | | | |
| | |
Class A | | | (3,992,195 | ) | | | — | |
| | |
Net realized gains | | | | | | | | |
| | |
Class A | | | (675,854 | ) | | | — | |
| |
Total distributions to shareholders | | | (4,668,049 | ) | | | — | |
| |
Increase (decrease) in net assets from capital stock activity | | | 166,870,030 | | | | 474,046,585 | |
| |
Total increase in net assets | | | 189,707,418 | | | | 476,500,155 | |
| | |
Net assets at beginning of year | | | 476,520,155 | | | | 20,000 | |
| |
Net assets at end of year | | | $666,227,573 | | | | $476,520,155 | |
| |
Undistributed net investment income | | | $6,525,021 | | | | $3,892,273 | |
| |
| (a) | For the period from April 23, 2012 (commencement of operations) to August 31, 2012. |
The accompanying Notes to Consolidated Financial Statements are an integral part of this statement.
| | |
| |
| | Active Portfolios® Multi-Manager Alternative Strategies Fund |
Consolidated Statement of Changes in Net Assets (continued)
| | | | | | | | | | | | | | | | |
| | | Year Ended
August 31, 2013 | | | Year Ended
August 31, 2012(a) | |
| | | Shares | | | Dollars ($) | | | Shares | | | Dollars ($) | |
Capital stock activity | | | | | | | | | | | | | | | | |
| | | | |
Class A shares | | | | | | | | | | | | | | | | |
| | | | |
Subscriptions | | | 25,683,649 | | | | 268,016,845 | | | | 50,269,507 | | | | 501,301,813 | |
| | | | |
Distributions reinvested | | | 460,342 | | | | 4,667,867 | | | | — | | | | — | |
| | | | |
Redemptions | | | (10,167,078 | ) | | | (105,814,682 | ) | | | (2,740,962 | ) | | | (27,255,228 | ) |
| |
Total net increase | | | 15,976,913 | | | | 166,870,030 | | | | 47,528,545 | | | | 474,046,585 | |
| |
| (a) | For the period from April 23, 2012 (commencement of operations) to August 31, 2012. |
The accompanying Notes to Consolidated Financial Statements are an integral part of this statement.
| | |
| |
| Active Portfolios® Multi-Manager Alternative Strategies Fund | | |
Consolidated Financial Highlights
The following table is intended to help you understand the Fund’s financial performance. Certain information reflects financial results for a single share of a class held for the periods shown. Per share net investment income (loss) amounts are calculated based on average shares outstanding during the period. Total return assumes reinvestment of all dividends and distributions, if any. Total return does not reflect payment of sales charges, if any, and is not annualized for periods of less than one year.
| | | | | | | | |
| | | Year Ended August 31, | |
Class A | | | 2013 | | | | 2012(a) | |
Per share data | | | | | | | | |
Net asset value, beginning of period | | | $10.03 | | | | $10.00 | |
| | | | | | | | | |
Income from investment operations: | | | | | | | | |
| | |
Net investment income | | | 0.02 | | | | 0.01 | |
| | | | | | | | | |
Net realized and unrealized gain | | | 0.53 | | | | 0.02 | |
| | | | | | | | | |
Total from investment operations | | | 0.55 | | | | 0.03 | |
| | | | | | | | | |
Less distributions to shareholders: | | | | | | | | |
| | |
Net investment income | | | (0.08 | ) | | | — | |
| | | | | | | | | |
Net realized gains | | | (0.01 | ) | | | — | |
| | | | | | | | | |
Total distributions to shareholders | | | (0.09 | ) | | | — | |
| | | | | | | | | |
Net asset value, end of period | | | $10.49 | | | | $10.03 | |
| | | | | | | | | |
Total return | | | 5.53 | % | | | 0.30 | % |
| | | | | | | | | |
Ratios to average net assets(b)(c) | | | | | | | | |
| | |
Total gross expenses | | | 1.70 | %(d) | | | 1.73 | %(d)(e) |
| | | | | | | | | |
Total net expenses(f) | | | 1.67 | %(d) | | | 1.63 | %(d)(e) |
| | | | | | | | | |
Net investment income | | | 0.17 | % | | | 0.31 | %(e) |
| | | | | | | | | |
Supplemental data | | | | | | | | |
| | |
Net assets, end of period (in thousands) | | | $666,228 | | | | $476,520 | |
| | | | | | | | | |
Portfolio turnover | | | 239 | % | | | 141 | % |
| | | | | | | | | |
Notes to Financial Highlights
| (a) | For the period from April 23, 2012 (commencement of operations) to August 31, 2012. |
| (b) | In addition to the fees and expenses which the Fund bears directly, the Fund indirectly bears a pro rata share of the fees and expenses of the acquired funds in which it invests. Such indirect expenses are not included in the reported expense ratios. |
| (c) | Certain line items from prior years have been reclassified to conform to the current presentation. |
| (d) | Ratios include dividends and interest on securities sold short. If dividends and interest on securities sold short had been excluded, expenses would have been lower by 0.17% and 0.13% for the years ended August 31, 2013 and 2012, respectively. |
| (f) | Total net expenses include the impact of certain waivers/reimbursements made by the Investment Manager and certain of its affiliates, if applicable. |
The accompanying Notes to Consolidated Financial Statements are an integral part of this statement.
| | |
| |
| | Active Portfolios® Multi-Manager Alternative Strategies Fund |
Notes to Consolidated Financial Statements
August 31, 2013
Note 1. Organization
Active Portfolios® Multi-Manager Alternative Strategies Fund (the Fund), a series of Columbia Funds Series Trust I (the Trust), is a non-diversified fund. The Trust is registered under the Investment Company Act of 1940, as amended (the 1940 Act), as an open-end management investment company organized as a Massachusetts business trust.
Basis for Consolidation
ASGM Offshore Fund, Ltd. and ASMF Offshore Fund, Ltd. (each, a Subsidiary) are each a Cayman Islands exempted company and wholly-owned subsidiary of the Fund. Each Subsidiary operates as an investment vehicle to provide the Fund with exposure to the commodities markets consistent with the Fund’s investment objective and policies as stated in its prospectus and statement of additional information. In accordance with the Memorandum and Articles of Association of the Subsidiary (the Articles), the Fund owns the sole issued share of each Subsidiary and retains all rights associated with such share, including the right to receive notice of, attend and vote at general meetings of the Subsidiaries, rights in a winding-up or repayment of capital and the right to participate in the profits or assets of the Subsidiaries. Columbia Management Investment Advisers, LLC (the Investment Manager), a wholly-owned subsidiary of Ameriprise Financial, Inc. (Ameriprise Financial), is responsible for each Subsidiary’s day-to-day business pursuant to a separate investment management services agreement between each Subsidiary and the Investment Manager. At August 31, 2013, ASGM Offshore Fund, Ltd. and ASMF Offshore Fund, Ltd. represented $44,805,044 or 6.7% of the net assets of the Fund.
The consolidated financial statements present the portfolio holdings, financial position and results of operations of the Fund and Subsidiaries on a consolidated basis.
Fund Shares
The Trust may issue an unlimited number of shares (without par value). The Fund only offers Class A shares that are available only to certain eligible investors through certain wrap fee programs sponsored and/or managed by Ameriprise Financial or its affiliates.
Class A shares are not subject to any front-end sales charge or contingent deferred sales charge.
Note 2. Summary of Significant Accounting Policies
Use of Estimates
The preparation of consolidated financial statements in accordance with U.S. generally accepted accounting principles
(GAAP) requires management to make certain estimates and assumptions that affect the reported amounts of assets and liabilities, the disclosure of contingent assets and liabilities at the date of the financial statements and the reported amounts of revenue and expenses during the reporting period. Actual results could differ from those estimates.
The following is a summary of significant accounting policies consistently followed by the Fund in the preparation of its consolidated financial statements.
Security Valuation
All equity securities and exchange traded funds (ETFs) are valued at the close of business of the New York Stock Exchange (NYSE). Equity securities and ETFs are valued at the last quoted sales price on the principal exchange or market on which they trade, except for securities traded on the NASDAQ Stock Market, which are valued at the NASDAQ official close price. Unlisted securities or listed securities for which there were no sales during the day are valued at the mean of the latest quoted bid and ask prices on such exchanges or markets.
Debt securities generally are valued by pricing services approved by the Board of Trustees (the Board) based upon market transactions for normal, institutional-size trading units of similar securities. The services may use various pricing techniques which take into account appropriate factors such as yield, quality, coupon rate, maturity, type of issue, trading characteristics and other data, as well as broker quotes. Debt securities for which quotations are readily available may also be valued based upon an over-the-counter or exchange bid quotation.
Foreign equity securities are valued based on quotations from the principal market in which such securities are normally traded. If any foreign share prices are not readily available as a result of limited share activity the securities are valued at the mean of the latest quoted bid and ask prices on such exchanges or markets. Foreign currency exchange rates are generally determined at 4:00 p.m. Eastern (U.S.) time. However, many securities markets and exchanges outside the U.S. close prior to the close of the NYSE; therefore, the closing prices for securities in such markets or on such exchanges may not fully reflect events that occur after such close but before the close of the NYSE. In those situations, foreign securities will be fair valued pursuant to the policy adopted by the Board, including utilizing a third party pricing service to determine these fair values. The third party pricing service takes into account multiple factors, including, but not limited to, movements in the U.S. securities markets, certain depositary receipts, futures contracts and foreign exchange rates that have occurred subsequent to the close of the foreign
| | |
| |
| Active Portfolios® Multi-Manager Alternative Strategies Fund | | |
Notes to Consolidated Financial Statements (continued)
August 31, 2013
exchange or market, to determine a good faith estimate that reasonably reflects the current market conditions as of the close of the NYSE. The fair value of a security is likely to be different from the quoted or published price, if available.
Investments in open-end investment companies, including money market funds, are valued at net asset value.
Short-term securities purchased within 60 days to maturity are valued at amortized cost, which approximates market value. The value of short-term securities originally purchased with maturities greater than 60 days is determined based on an amortized value to par upon reaching 60 days to maturity. Short-term securities maturing in more than 60 days from the valuation date are valued at the market price or approximate market value based on current interest rates.
Forward foreign currency exchange contracts are marked-to-market based upon foreign currency exchange rates provided by a pricing service.
Futures and options on futures contracts are valued based upon the settlement price established each day by the board of trade or exchange on which they are traded.
Option contracts are valued at the mean of the latest quoted bid and asked prices on their primary exchanges. Option contracts, including over-the-counter (OTC) option contracts, with no readily available market value are valued using quotations obtained from independent brokers as of the close of the NYSE.
Swap transactions are valued through an independent pricing service or broker, or if neither is available, through an internal model based upon observable inputs.
Investments for which market quotations are not readily available, or that have quotations which management believes are not reliable, are valued at fair value as determined in good faith under consistently applied procedures established by and under the general supervision of the Board. If a security or class of securities (such as foreign securities) is valued at fair value, such value is likely to be different from the last quoted market price for the security.
The determination of fair value often requires significant judgment. To determine fair value, management may use assumptions including but not limited to future cash flows and estimated risk premiums. Multiple inputs from various sources may be used to determine fair value.
Foreign Currency Transactions and Translations
The values of all assets and liabilities denominated in foreign currencies are translated into U.S. dollars at that day’s exchange rates. Net realized and unrealized gains (losses) on
foreign currency transactions and translations include gains (losses) arising from the fluctuation in exchange rates between trade and settlement dates on securities transactions, gains (losses) arising from the disposition of foreign currency and currency gains (losses) between the accrual and payment dates on dividends, interest income and foreign withholding taxes.
For consolidated financial statement purposes, the Fund does not distinguish that portion of gains (losses) on investments which is due to changes in foreign exchange rates from that which is due to changes in market prices of the investments. Such fluctuations are included with the net realized and unrealized gains (losses) on investments in the Consolidated Statement of Operations.
Derivative Instruments
The Fund invests in certain derivative instruments, as detailed below, to meet its investment objectives. Derivatives are instruments whose values depend on, or are derived from, in whole or in part, the value of one or more other assets, such as securities, currencies, commodities or indices. Derivative instruments may be used to maintain cash reserves while maintaining exposure to certain other assets, to offset anticipated declines in values of investments, to facilitate trading, to reduce transaction costs and to pursue higher investment returns. The Fund may also use derivative instruments to mitigate certain investment risks, such as foreign currency exchange rate risk, interest rate risk and credit risk. Derivatives may involve various risks, including the potential inability of the counterparty to fulfill its obligation under the terms of the contract, the potential for an illiquid secondary market (making it difficult for the Fund to sell, including at favorable prices) and the potential for market movements which may expose the Fund to gains or losses in excess of the amount shown in the Consolidated Statement of Assets and Liabilities. The notional amounts of derivative instruments, if applicable, are not recorded in the consolidated financial statements.
A derivative instrument may suffer a mark to market loss if the value of the contract decreases due to an unfavorable change in the market rates or values of the underlying instrument. Losses can also occur if the counterparty does not perform under the contract. A Fund’s risk of loss from counterparty credit risk on OTC derivatives is generally limited to the aggregate unrealized gain netted against any collateral held by the Fund and the amount of any initial margin held by the counterparty. With exchange traded or centrally cleared derivatives, there is minimal counterparty credit risk to the Fund since the exchange’s clearinghouse, as counterparty to such instruments, guarantees against a possible default. The clearinghouse stands between the buyer
| | |
| |
| | Active Portfolios® Multi-Manager Alternative Strategies Fund |
Notes to Consolidated Financial Statements (continued)
August 31, 2013
and the seller of the contract; therefore, the counterparty credit risk is limited to failure of the clearinghouse. However, credit risk still exists in exchange traded or centrally cleared derivatives with respect to initial and variation margin that is held in a broker’s customer accounts. While brokers are required to segregate customer margin from their own assets, in the event that a broker becomes insolvent or goes into bankruptcy and at that time there is a shortfall in the aggregate amount of margin held by the broker for all its clients, U.S. bankruptcy laws will typically allocate that shortfall on a pro-rata basis across all the broker’s customers, potentially resulting in losses to the Fund.
In order to better define its contractual rights and to secure rights that will help the Fund mitigate its counterparty risk, the Fund may enter into an International Swaps and Derivatives Association, Inc. Master Agreement (ISDA Master Agreement) or similar agreement with its derivative contract counterparties. An ISDA Master Agreement is an agreement between a Fund and a counterparty that governs OTC derivatives and forward foreign currency exchange contracts and typically contains, among other things, collateral posting terms and netting provisions in the event of a default and/or termination event. Under an ISDA Master Agreement, the Fund may, under certain circumstances, offset with the counterparty certain derivative instrument’s payables and/or receivables with collateral held and/or posted and create one single net payment. The provisions of the ISDA Master Agreement typically permit a single net payment in the event of default (close-out netting) including the bankruptcy or insolvency of the counterparty. Note, however, that bankruptcy or insolvency laws of a particular jurisdiction may impose restrictions on or prohibitions against the right of offset in bankruptcy, insolvency or other events.
Collateral (margin) requirements differ by type of derivative. Margin requirements are established by the exchange or clearinghouse for exchange traded and centrally cleared derivatives. Brokers can ask for margin in excess of the minimum in certain circumstances. Collateral terms are contract specific for OTC derivatives. For OTC derivatives traded under an ISDA Master Agreement, the collateral requirements are typically calculated by netting the mark to market amount for each transaction under such agreement and comparing that amount to the value of any variation margin currently pledged by the Fund and/or the counterparty. Generally, the amount of collateral due from or to a party has to exceed a minimum transfer amount threshold (e.g. $500,000) before a transfer has to be made. To the extent amounts due to the Fund from its counterparties are not fully collateralized, contractually or otherwise, the Fund bears the risk of loss from counterparty nonperformance. The Fund
attempts to mitigate counterparty risk by only entering into agreements with counterparties that it believes have the financial resources to honor their obligations and by monitoring the financial stability of those counterparties.
Certain ISDA Master Agreements allow counterparties to OTC derivatives to terminate derivative contracts prior to maturity in the event the Fund’s net assets decline by a stated percentage over a specified time period or the Fund fails to meet the terms of the ISDA Master Agreement, which would cause the Fund to accelerate payment of any net liability owed to the counterparty. The Fund also has termination rights if the counterparty fails to meet the terms of the ISDA Master Agreement. In addition to considering counterparty credit risk, the Fund would consider terminating the derivative contracts based on whether termination would result in a net liability owed from the counterparty.
For financial reporting purposes, the Fund does not offset derivative assets and derivative liabilities that are subject to netting arrangements in the Consolidated Statement of Assets and Liabilities.
Forward Foreign Currency Exchange Contracts
Forward foreign currency exchange contracts are OTC agreements between two parties to buy and sell a currency at a set price on a future date. These contracts are typically intended to be used to minimize the exposure to foreign exchange rate fluctuations during the period between the trade and settlement dates of the contract. The Fund utilized forward foreign currency exchange contracts to hedge the currency exposure associated with some or all of the Fund’s securities, to shift foreign currency exposure back to U.S. dollars, to shift investment exposure from one currency to another, to enhance returns, as a substitute for the purchase or sale of securities and to obtain and manage long and short exposure to foreign currencies. These instruments may be used for other purposes in future periods.
The values of forward foreign currency exchange contracts fluctuate with changes in foreign currency exchange rates. The Fund will record a realized gain or loss when the forward foreign currency exchange contract expires or is closed.
The use of forward foreign currency exchange contracts does not eliminate fluctuations in the prices of the Fund’s portfolio securities. The risks of forward foreign currency exchange contracts include movement in the values of the foreign currencies relative to the U.S. dollar (or other foreign currencies) and the possibility that counterparties will not complete their contractual obligations, which may be in excess of the amount reflected, if any, in the Consolidated Statement of Assets and Liabilities.
| | |
| |
| Active Portfolios® Multi-Manager Alternative Strategies Fund | | |
Notes to Consolidated Financial Statements (continued)
August 31, 2013
Futures Contracts
Futures contracts are exchange traded and represent commitments for the future purchase or sale of an asset at a specified price on a specified date. The Fund bought and sold futures contracts to produce incremental earnings, manage exposure to movements in interest rates, manage exposure to the securities market, manage the duration and yield curve exposure of the Fund versus the benchmark and to obtain and manage long and short exposure to sovereign bonds, equity indices, and commodities. These instruments may be used for other purposes in future periods. Upon entering into futures contracts, the Fund bears risks which may include interest rates, exchange rates or securities prices moving unexpectedly, in which case, the Fund may not achieve the anticipated benefits of the futures contracts and may realize a loss. Additional risks include counterparty credit risk, the possibility of an illiquid market, and that a change in the value of the contract or option may not correlate with changes in the value of the underlying asset.
Upon entering into a futures contract, the Fund pledges cash or securities with the broker in an amount sufficient to meet the initial margin requirement. The initial margin deposit must be maintained at an established level over the life of the contract. Cash deposited as initial margin is recorded in the Consolidated Statement of Assets and Liabilities as margin deposits. Securities deposited as initial margin are designated in the Consolidated Portfolio of Investments. Subsequent payments (variation margin) are made or received by the Fund each day. In the event of a bankruptcy or insolvency of a futures commission merchant that holds the margin on behalf of the Fund, the Fund may not be entitled to the return of the entire margin owed to the Fund, resulting in a loss. The variation margin payments are equal to the daily change in the contract value and are recorded as variation margin receivable or payable and are offset in unrealized gains or losses. The Fund recognizes a realized gain or loss when the contract is closed or expires. Futures contracts involve, to varying degrees, risk of loss in excess of the variation margin disclosed in the Consolidated Statement of Assets and Liabilities.
Options Contracts
Options are contracts which entitle the holder to purchase or sell securities or other identified assets at a specified price, or in the case of index option contracts, to receive or pay the difference between the index value and the strike price of the index option contract. Option contracts can be either exchange traded or OTC. The Fund purchased and wrote option contracts to decrease the Fund’s exposure to equity market risk, to increase return on investments, and facilitate buying
and selling of securities for investments. These instruments may be used for other purposes in future periods. Completion of transactions for option contracts traded in the OTC market depends upon the performance of the other party. Cash collateral may be collected or posted by the Fund to secure certain OTC option contract trades. Cash collateral held or posted by the Fund for such option contract trades must be returned to the counterparty or the Fund upon closure, exercise or expiration of the contract.
Options contracts purchased are recorded as investments. When the Fund writes an options contract, the premium received is recorded as an asset and an amount equivalent to the premium is recorded as a liability in the Consolidated Statement of Assets and Liabilities and is subsequently adjusted to reflect the current fair value of the option written. The Fund will realize a gain or loss when the option contract is closed or expires. When option contracts are exercised, the proceeds on sales for a written call or purchased put option contract, or the purchase cost for a written put or purchased call option contract, is adjusted by the amount of premium received or paid.
For OTC options purchased, the Fund bears the risk of loss of the amount of the premiums paid plus the positive change in market values net of any collateral held by the Fund should the counterparty fail to perform under the contracts. The Fund also has the additional risk of being unable to enter into a closing transaction if a liquid secondary market does not exist. The risk in writing a call option contract is that the Fund gives up the opportunity for profit if the market price of the security increases above the strike price. The risk in writing a put option contract is that the Fund may incur a loss if the market price of the security decreases below the strike price and the option contract is exercised. The Fund’s maximum payout in the case of written put option contracts represents the maximum potential amount of future payments (undiscounted) that the Fund could be required to make under the contract. For OTC options contracts, the transaction is also subject to counterparty credit risk. Option contracts written by the Fund do not typically give rise to counterparty credit risk, as options written generally obligate the Fund and not the counterparty to perform. The maximum payout amount may be offset by the subsequent sale, if any, of assets obtained upon the exercise of the put option contracts by holders of the option contracts or proceeds received upon entering into the contracts. The maximum payout amount was $3,105,250 at August 31, 2013.
| | |
| |
| | Active Portfolios® Multi-Manager Alternative Strategies Fund |
Notes to Consolidated Financial Statements (continued)
August 31, 2013
Contracts and premiums associated with options contracts written for the year ended August 31, 2013 are as follows:
| | | | | | | | | | | | | | | | |
| | | Calls | | | Puts | |
| | | Contracts | | | Premiums
($) | | | Contracts | | | Premiums
($) | |
Balance at August 31, 2012 | | | 4,891 | | | | 947,180 | | | | 286,700,357 | | | | 137,341 | |
Opened | | | 1,239,892,078 | | | | 4,145,166 | | | | 11,540,495,390 | | | | 812,617 | |
Closed | | | (6,019 | ) | | | (582,414 | ) | | | (11,540,482,012 | ) | | | (255,545 | ) |
Expired | | | (1,226,715,386 | ) | | | (1,935,786 | ) | | | (286,707,694 | ) | | | (436,951 | ) |
Exercised | | | (14,773 | ) | | | (1,674,620 | ) | | | (3,811 | ) | | | (221,396 | ) |
| | | | | | | | | | | | | | | | | |
Balance at August 31, 2013 | | | 13,160,791 | | | | 899,526 | | | | 2,230 | | | | 36,066 | |
| | | | | | | | | | | | | | | | | |
Interest Rate Swap Contracts
The Fund entered into interest rate swap transactions to obtain and manage long and short exposure to sovereign bonds, commodities, and the Swiss Market Index, to produce incremental earnings, or to gain exposure to or protect itself from market rate changes, or to synthetically add or subtract principal exposure to a market. These instruments may be used for other purposes in future periods. Interest rate swaps are agreements between two parties that involve the exchange of one type of interest rate for another type of interest rate cash flow on specified dates in the future, based on a predetermined, specified notional amount. Certain interest rate swaps are considered forward-starting, whereby the accrual for the exchange of cash flows does not begin until a specified date in the future (the effective date). The net cash flow for a standard interest rate swap transaction is generally the difference between a floating market interest rate versus a fixed interest rate.
Interest rate swaps are valued daily and unrealized appreciation (depreciation) is recorded. Certain interest rate swaps may accrue periodic interest on a daily basis as a component of unrealized appreciation (depreciation); the Fund will realize a gain or loss upon the payment or receipt of accrued interest. The Fund will realize a gain or a loss when the interest rate swap is terminated.
Risks of entering into interest rate swaps include a lack of correlation between the swaps and the portfolio of bonds the swaps are designed to hedge or replicate. A lack of correlation may cause the interest rate swaps to experience adverse changes in value relative to expectations. In addition, interest rate swaps are subject to the risk of default of a counterparty, and the risk of adverse movements in market interest rates relative to the interest rate swap positions taken. The Fund’s maximum risk of loss from counterparty credit risk is the discounted net value of the cash flows to be received from/paid to the counterparty over the contract’s remaining life to the extent that such amount is positive, plus the cost of entering into a similar transaction with another counterparty.
The Fund attempts to mitigate counterparty credit risk by entering into interest rate swap transactions only with counterparties that meet prescribed levels of creditworthiness, as determined by the Investment Manager. The Fund and any counterparty are required to maintain an agreement that requires the Fund and that counterparty to monitor (on a daily basis) the net market value of all derivative transactions entered into pursuant to the contract between the Fund and such counterparty. If the net market value of such derivatives transactions between the Fund and that counterparty exceeds a certain threshold (as defined in the agreement), the Fund or the counterparty is required to post cash and/or securities as collateral. Market values of derivatives transactions presented in the financial statements are not netted with the market values of other derivatives transactions or with any collateral amounts posted by the Fund or any counterparty.
Cross-Currency Swap Transactions
The Fund entered into cross-currency swap transactions to gain or mitigate exposure on currency risk, to hedge currency risk exposure and to enhance returns. These instruments may be used for other purposes in future periods. Cross-currency swaps are agreements between two parties that involve the exchange of one currency for another currency with an agreement to reverse the exchange at a later date at specified exchange rates. The exchange of currencies at the inception date of the contract takes place at the current spot rate. The re-exchange at maturity may take place at the same exchange rate, a specified rate, or the then current spot rate. Interest payments, if applicable, are made between the parties in the currency of the principal received based on interest rates available in the two currencies at the inception of the contract. The terms of cross-currency swaps may extend for many years. Cross-currency swaps are usually negotiated with commercial and investment banks. Some cross-currency swaps may not provide for exchanging principal cash flows, but only for exchanging interest cash flows.
Cross-currency swaps are valued daily and unrealized appreciation (depreciation) is recorded. Certain cross-currency swaps may accrue periodic interest on a daily basis as a component of unrealized appreciation (depreciation); the Fund will realize a gain or loss upon the payment or receipt of accrued interest. The Fund will realize a gain or a loss when the cross-currency swap is terminated.
The risks of cross-currency swaps include the possibility that counterparties will not complete their contractual obligations, which may be in excess of the amount reflected, if any, in the Consolidated Statement of Assets and Liabilities.
| | |
| |
| Active Portfolios® Multi-Manager Alternative Strategies Fund | | |
Notes to Consolidated Financial Statements (continued)
August 31, 2013
Credit Default Swap Contracts
The Fund entered into credit default swap contracts to increase or decrease its credit exposure to an index, increase or decrease its credit exposure to a single issuer of debt securities, enhance returns, increase or decrease its credit exposure to a specific debt security or a basket of debt securities and as a protection buyer to reduce overall credit exposure. Additionally, credit default swap contracts were used to hedge the Fund’s exposure on a debt security that it owns or in lieu of selling such debt security. These instruments may be used for other purposes in future periods. Credit default swap contracts are agreements in which one party pays fixed periodic payments to a counterparty in consideration for a guarantee from the counterparty to make a specific payment should a specified credit event(s) take place. Although specified events are contract specific, credit events are generally defined as bankruptcy, failure to pay, restructuring, obligation acceleration, obligation default, or repudiation/moratorium.
As the purchaser of a credit default swap contract, the Fund purchases protection by paying a periodic interest rate on the notional amount to the counterparty. The interest amount is accrued daily as a component of unrealized appreciation (depreciation) and is recorded as a realized loss upon payment. If a credit event as specified in the contract occurs, the Fund may have the option either to deliver the reference obligation to the seller in exchange for a cash payment of its par amount, or to receive a net cash settlement equal to the par amount less an agreed-upon value of the reference obligation as of the date of the credit event. Credit events are contact specific but may include bankruptcy, failure to pay, restructuring and obligation acceleration. The difference between the value of the obligation or cash delivered and the notional amount received will be recorded as a realized gain (loss).
As the seller of a credit default swap contract, the Fund sells protection to a buyer and will generally receive a periodic interest rate on the notional amount. The interest amount is accrued daily as a component of unrealized appreciation (depreciation) and is recorded as a realized gain upon receipt of the payment. If a credit event as specified in the contract occurs, the Fund may either be required to accept the reference obligation from the buyer in exchange for a cash payment of its notional amount, or to pay the buyer a net cash settlement equal to the notional amount less an agreed-upon value of the reference obligation (recovery value) as of the date of the credit event. The difference between the value of the obligation or cash received and the notional amount paid will be recorded as a realized gain (loss). The maximum potential amount of undiscounted future payments the Fund could be required to make as the seller of protection under a
credit default swap contract is equal to the notional amount of the reference obligation. These potential amounts may be partially offset by any recovery values of the respective reference obligations or premiums received upon entering into the agreement. The notional amounts and market values of all credit default swap contracts in which the Fund is the seller of protection, if any, are disclosed in the Credit Default Swap Contracts Outstanding schedule following the Consolidated Portfolio of Investments. These potential amounts may be partially offset by any recovery values of the respective reference obligations or premiums received upon entering into the agreement.
As a protection seller, the Fund bears the risk of loss from the credit events specified in the contract. For credit default swap contracts on credit indices, quoted market prices and resulting market values serve as an indicator of the current status of the payment/performance risk. Increasing market values, in absolute terms when compared to the notional amount of the swap, represent a deterioration of the reference entity’s credit soundness and a greater likelihood or risk of default or other credit event occurring as defined under the terms of the contract.
Any premium paid or received by the Fund upon entering into a credit default swap contract is recorded as an asset or liability, respectively, and amortized daily as a component of realized gain (loss) in the Consolidated Statement of Operations. Credit default swap contracts are valued daily, and the change in value is recorded as unrealized appreciation (depreciation) until the termination of the swap, at which time a realized gain (loss) is recorded.
Credit default swap contracts can involve greater risks than if a fund had invested in the reference obligation directly since, in addition to general market risks, credit default swaps are subject to counterparty credit risk, leverage risk, hedging risk, correlation risk and liquidity risk. The Fund will enter into credit default swap transactions only with counterparties that meet certain standards of creditworthiness.
Total Return Swap Contracts
The Fund entered into total return swap contracts to obtain long or short exposure to the total return on a specified reference security or a basket of reference securities during the specified period, enhance returns, manage exposure to the securities market, in return for periodic payments based on a fixed or variable interest rate and to obtain and manage long and short exposure to sovereign bonds and commodities, and the Swiss Market index. These instruments may be used for other purposes in future periods. Total return swap contracts may be used to obtain exposure to a reference security or
| | |
| |
| | Active Portfolios® Multi-Manager Alternative Strategies Fund |
Notes to Consolidated Financial Statements (continued)
August 31, 2013
market without owning, taking physical custody of, or short selling such security or securities in a market.
Total return swap contracts are valued daily, and the change in value is recorded as unrealized appreciation (depreciation) until the termination of the swap, at which time the Fund will realize a gain or (loss). Periodic payments received (or made) by the Fund over the term of the contract are recorded as realized gains (losses).
Total return swap contracts may be subject to liquidity risk, which exists when a particular swap contract is difficult to purchase or sell. It may not be possible for the Fund to initiate a transaction or liquidate a position at an advantageous time or price, which may result in significant losses. Total return swap contracts are subject to the risk associated with the investment in the reference securities. The risk in the case of short total return swap contracts is unlimited based on the potential for unlimited increases in the market value of the reference securities. This risk may be offset if the Fund holds any of the reference securities. The risk in the case of long total return swap contracts is limited to the current notional amount of the total return swap contract.
Total return swap contracts are also subject to the risk of the counterparty not fulfilling its obligations under the contract (counterparty credit risk). The Fund attempts to mitigate counterparty credit risk by entering into total return swap contracts only with counterparties that meet prescribed levels of creditworthiness, as determined by the Investment Manager.
Effects of Derivative Transactions in the Financial Statements
The following tables are intended to provide additional information about the effect of derivatives on the financial statements of the Fund, including: the fair value of derivatives by risk category and the location of those fair values in the Consolidated Statement of Assets and Liabilities; the impact of derivative transactions over the period in the Consolidated Statement of Operations including realized gains or losses and unrealized gains or losses. The derivative schedules following the Consolidated Portfolio of Investments present additional information regarding derivative instruments outstanding at the end of the period, if any.
The following table is a summary of the fair value of derivative instruments at August 31, 2013:
| | | | | | |
| | Asset Derivatives | |
Risk Exposure
Category | | Statement of Assets and Liabilities Location | | | Fair Value ($) | |
Credit risk | | Unrealized appreciation on swap contracts | | | 1,472,204 | |
| | | | | | |
| | Asset Derivatives | |
Risk Exposure
Category | | Statement of Assets and Liabilities Location | | | Fair Value ($) | |
Credit risk | | Premiums paid on outstanding credit default swap contracts | | | 4,050,172 | |
Equity risk | | Unrealized appreciation on swap contracts | | | 416 | |
Equity risk | | Net assets — unrealized appreciation on futures contracts | | | 656,672 | * |
Equity risk | | Investments at value — unaffiliated issuers (for purchased options) | | | 285,819 | |
Foreign exchange risk | | Investments at value — unaffiliated issuers (for purchased options) | | | 238,194 | |
Foreign exchange risk | | Unrealized appreciation on forward foreign currency exchange contracts | | | 11,613,263 | |
Foreign exchange risk | | Net assets — unrealized appreciation on futures contracts | | | 45,696 | * |
Foreign exchange risk | | Unrealized appreciation on swap contracts | | | 1,667,152 | |
Interest rate risk | | Unrealized appreciation on swap contracts | | | 504,366 | |
Interest rate risk | | Net assets — unrealized appreciation on futures contracts | | | 1,271,387 | * |
Commodity-related investment risk | | Unrealized appreciation on swap contracts | | | 479,738 | |
Commodity-related investment risk | | Investments at value — unaffiliated issuers (for purchased options) | | | 6,360 | |
Commodity-related investment risk | | Net assets — unrealized appreciation on futures contracts | | | 1,197,935 | * |
Total | | | | | 23,489,374 | |
| |
| | Liability Derivatives | |
Risk Exposure
Category | | Statement of Assets and Liabilities Location | | | Fair Value ($) | |
Credit risk | | Unrealized depreciation on swap contracts | | | 991,377 | |
Credit risk | | Premiums received on outstanding credit default swap contracts | | | 941,711 | |
Equity risk | | Options contracts written, at value | | | 666,704 | |
Equity risk | | Unrealized depreciation on swap contracts | | | 55,492 | |
Equity risk | | Net assets — unrealized depreciation on futures contracts | | | 848,470 | * |
| | |
| |
| Active Portfolios® Multi-Manager Alternative Strategies Fund | | |
Notes to Consolidated Financial Statements (continued)
August 31, 2013
| | | | | | |
| |
| | Liability Derivatives | |
Risk Exposure
Category | | Statement of Assets and Liabilities Location | | | Fair Value ($) | |
Foreign exchange risk | | Options contracts written, at value | | | 1,031,668 | |
Foreign exchange risk | | Unrealized depreciation on forward foreign currency exchange contracts | | | 12,846,480 | |
Foreign exchange risk | | Net assets — unrealized depreciation on futures contracts | | | 172,036 | * |
Interest rate risk | | Unrealized depreciation on swap contracts | | | 718,529 | |
Interest rate risk | | Net assets — unrealized depreciation on futures contracts | | | 334,066 | * |
| | | | | | |
| |
| | Liability Derivatives | |
Risk Exposure
Category | | Statement of Assets and Liabilities Location | | | Fair Value ($) | |
Commodity-related investment risk | | Unrealized depreciation on swap contracts | | | 491,735 | |
Commodity-related investment risk | | Net assets — unrealized depreciation on futures contracts | | | 539,464 | * |
Total | | | | | 19,637,732 | |
| * | Includes cumulative appreciation (depreciation) of futures contracts as reported in the Futures Contracts Outstanding table following the Portfolio of Investments. Only the current day’s variation margin is reported in receivables or payables in the Statement of Assets and Liabilities. |
The following table indicates the effect of derivative instruments in the Statement of Operations for the year ended August 31, 2013:
| | | | | | | | | | | | | | | | | | | | |
| Amount of Realized Gain (Loss) on Derivatives Recognized in Income | |
| Risk Exposure Category | | Forward Foreign
Currency Exchange
Contracts ($) | | | Futures Contracts ($) | | | Options Contracts
Written and
Purchased ($) | | | Swap Contracts ($) | | | Total ($) | |
Credit risk | | | — | | | | — | | | | — | | | | (3,744,661 | ) | | | (3,744,661 | ) |
Equity risk | | | — | | | | 5,848,014 | | | | (445,231 | ) | | | 1,308,551 | | | | 6,711,334 | |
Foreign exchange risk | | | 5,380,062 | | | | (261,764 | ) | | | 74,054 | | | | (211,779 | ) | | | 4,980,573 | |
Interest rate risk | | | — | | | | (2,345,828 | ) | | | (160,781 | ) | | | (1,367,161 | ) | | | (3,873,770 | ) |
Commodity-related investment risk | | | — | | | | (1,954,358 | ) | | | (16,960 | ) | | | 766,150 | | | | (1,205,168 | ) |
Total | | | 5,380,062 | | | | 1,286,064 | | | | (548,918 | ) | | | (3,248,900 | ) | | | 2,868,308 | |
| Change in Unrealized Appreciation (Depreciation) on Derivatives Recognized in Income | |
| Risk Exposure Category | | Forward Foreign
Currency Exchange
Contracts ($) | | | Futures Contracts ($) | | | Options Contracts
Written and
Purchased ($) | | | Swap Contracts ($) | | | Total ($) | |
Credit risk | | | — | | | | — | | | | — | | | | 781,396 | | | | 781,396 | |
Equity risk | | | — | | | | (81,319 | ) | | | 223,623 | | | | (63,017 | ) | | | 79,287 | |
Foreign exchange risk | | | 1,306,011 | | | | (126,340 | ) | | | (1,149,649 | ) | | | 1,892,032 | | | | 1,922,054 | |
Interest rate risk | | | — | | | | 550,438 | | | | — | | | | (294,765 | ) | | | 255,673 | |
Commodity-related investment risk | | | — | | | | (223,594 | ) | | | (411,280 | ) | | | (191,865 | ) | | | (826,739 | ) |
Total | | | 1,306,011 | | | | 119,185 | | | | (1,337,306 | ) | | | 2,123,781 | | | | 2,211,671 | |
The following table is a summary of the volume of derivative instruments for the year ended August 31, 2013:
| | | | |
| Derivative Instrument | | Contracts Opened | |
Forward foreign currency exchange contracts | | | 4,646 | |
Futures contracts | | | 47,150 | |
Options contracts | | | 71,017 | |
Swap contracts | | | 547 | |
| |
| Derivative Instrument | | Aggregate Notional
Opened ($) | |
Credit default swap contracts — buy protection | | | 38,522,000 | |
Credit default swap contracts — sell protection | | | 29,557,000 | |
Treasury Inflation Protected Securities
The Fund may invest in treasury inflation protected securities (TIPS). The principal amount of TIPS is adjusted periodically and is increased for inflation or decreased for deflation based on a monthly published index. Interest payments are based on the adjusted principal at the time the interest is paid. These adjustments are recorded as interest income in the Consolidated Statement of Operations.
Short Sales
The Fund may sell a security it does not own in anticipation of a decline in the fair value of the security. When the Fund sells
| | |
| |
| | Active Portfolios® Multi-Manager Alternative Strategies Fund |
Notes to Consolidated Financial Statements (continued)
August 31, 2013
a security short, it must borrow the security sold short and deliver it to the broker-dealer through which it made the short sale. The Fund is required to maintain a margin account with the broker and to pledge assets to the broker as collateral for the borrowed security. Securities pledged as collateral are designated in the Consolidated Portfolio of Investments. The Fund can purchase the same security at the current market price and deliver it to the broker to close out the short sale. The Fund is obligated to pay the broker a fee for borrowing the security. The fee is recorded as interest expense in the Consolidated Statement of Operations and a short position is reported as a liability at fair value in the Consolidated Statement of Asset and Liabilities. The Fund must also pay the broker for any dividends accrued (recognized on ex-date) on the borrowed security. This amount is recorded as an expense in the Consolidated Statement of Operations. The Fund will record a gain if the security declines in value, and will realize a loss if the security appreciates. Such gain, limited to the price at which the Fund sold the security short, or such loss, potentially unlimited in size because the short position loses value as the market price of the security sold short increases, will be recognized upon the termination of a short sale.
Security Transactions
Security transactions are accounted for on the trade date. Cost is determined and gains (losses) are based upon the specific identification method for both financial statement and federal income tax purposes.
Income Recognition
Corporate actions and dividend income are generally recorded net of any non-reclaimable tax withholdings, on the ex-dividend date or upon receipt of ex-dividend notification in the case of certain foreign securities.
Interest income is recorded on an accrual basis. Market premiums and discounts, including original issue discounts, are amortized and accreted, respectively, over the expected life of the security on all debt securities, unless otherwise noted.
The Fund may receive distributions from holdings in business development companies (BDCs), exchange traded funds (ETFs) and real estate investment trusts (REITs), which report information on the character of their distributions annually. These distributions are allocated to dividend income, capital gain and return of capital based on estimates made by the Fund’s management if actual information has not yet been reported. Return of capital is recorded as a reduction of the cost basis of securities held. If the Fund no longer owns the applicable securities, return of capital is recorded as a realized
gain. Management’s estimates are subsequently adjusted when the actual character of the distributions is disclosed by the BDCs, ETFs and REITs, which could result in a proportionate change in return of capital to shareholders.
The value of additional securities received as an income payment is recorded as income and increases the cost basis of such securities.
Expenses
General expenses of the Trust are allocated to the Fund and other funds of the Trust based upon relative net assets or other expense allocation methodologies determined by the nature of the expense. Expenses directly attributable to the Fund are charged to the Fund.
Federal Income Tax Status
The Fund intends to qualify each year as a regulated investment company under Subchapter M of the Internal Revenue Code, as amended, and will distribute substantially all of its taxable income (including net short-term capital gains), if any, for its tax year, and as such will not be subject to federal income taxes. In addition, the Fund intends to distribute in each calendar year substantially all of its net investment income, capital gains and certain other amounts, if any, such that the Fund should not be subject to federal excise tax. Therefore, no federal income or excise tax provision is recorded.
Foreign Taxes
The Fund may be subject to foreign taxes on income, gains on investments or currency repatriation, a portion of which may be recoverable. The Fund will accrue such taxes and recoveries, as applicable, based upon its current interpretation of tax rules and regulations that exist in the markets in which it invests.
Realized gains in certain countries may be subject to foreign taxes at the Fund level, based on statutory rates. The Fund accrues for such foreign taxes on realized and unrealized gains at the appropriate rate for each jurisdiction, as applicable. The amount, if any, is disclosed as a liability on the Consolidated Statement of Assets and Liabilities.
Distributions to Shareholders
Distributions from net investment income, if any, are declared and paid annually. Net realized capital gains, if any, are distributed along with the income distribution. Income distributions and capital gain distributions are determined in accordance with federal income tax regulations, which may differ from GAAP.
| | |
| |
| Active Portfolios® Multi-Manager Alternative Strategies Fund | | |
Notes to Consolidated Financial Statements (continued)
August 31, 2013
Guarantees and Indemnifications
Under the Trust’s organizational documents and, in some cases, by contract, its officers and trustees are indemnified against certain liabilities arising out of the performance of their duties to the Trust or its funds. In addition, certain of the Fund’s contracts with its service providers contain general indemnification clauses. The Fund’s maximum exposure under these arrangements is unknown since the amount of any future claims that may be made against the Fund cannot be determined, and the Fund has no historical basis for predicting the likelihood of any such claims.
Recent Accounting Pronouncement
Disclosures about Offsetting Assets and Liabilities
In December 2011, the Financial Accounting Standards Board (FASB) issued Accounting Standards Update (ASU) No. 2011-11, Disclosures about Offsetting Assets and Liabilities and in January 2013, ASU No. 2013-1, Clarifying the Scope of Disclosures about Offsetting Assets and Liabilities (collectively, the ASUs). Specifically, the ASUs require an entity to disclose both gross and net information for derivatives and other financial instruments that are subject to a master netting arrangement or similar agreement. The ASUs require disclosure of collateral received in connection with the master netting agreements or similar agreements. The disclosure requirements are effective for interim and annual periods beginning on or after January 1, 2013. At this time, management is evaluating the implications of this guidance and the impact it will have on the consolidated financial statement amounts and footnote disclosures, if any.
Note 3. Fees and Compensation Paid to Affiliates
Investment Management Fees
Under an Investment Management Services Agreement, the Investment Manager is responsible for the ultimate oversight of investments made by the Fund. The Fund’s subadvisers (see Subadvisory Agreements below) have the primary responsibility for the day-to-day portfolio management of the Fund. The investment management fee is an annual fee that is equal to a percentage of the Fund’s average daily net assets that declines from 1.02% to 0.90% as the Fund’s net assets increase. The effective investment management fee rate for the year ended August 31, 2013 was 1.01% of the Fund’s average daily net assets.
Subadvisory Agreements
The Investment Manager has entered into Subadvisory Agreements with AQR Capital Management, LLC, Eaton
Vance Management, Wasatch Advisors, Inc. and Water Island Capital, LLC, each of which subadvises a portion of the assets of the Fund. New investments in the Fund, net of any redemptions, are allocated in accordance with the Investment Manager’s determination, subject to the oversight of the Fund’s Board. Each subadviser’s proportionate share of investments in the Fund will vary due to market fluctuations. The Investment Manager compensates each subadviser to manage the investment of the Fund’s assets.
Administration Fees
Under an Administrative Services Agreement, the Investment Manager also serves as the Fund Administrator. The Fund pays the Fund Administrator an annual fee for administration and accounting services equal to a percentage of the Fund’s average daily net assets that declines from 0.08% to 0.05% as the Fund’s net assets increase. The effective administration fee rate for the year ended August 31, 2013 was 0.08% of the Fund’s average daily net assets.
Compensation of Board Members
Board members are compensated for their services to the Fund as disclosed in the Consolidated Statement of Operations. The Trust’s eligible Trustees may participate in a Deferred Compensation Plan (the Plan) which may be terminated at any time. Obligations of the Plan will be paid solely out of the Fund’s assets.
Compensation of Chief Compliance Officer
The Board has appointed a Chief Compliance Officer to the Fund in accordance with federal securities regulations. The Fund pays its pro-rata share of the expenses associated with the Chief Compliance Officer. The Fund’s expenses for the Chief Compliance Officer will not exceed $15,000 per year.
Transfer Agent Fees
Under a Transfer and Dividend Disbursing Agent Agreement, Columbia Management Investment Services Corp. (the Transfer Agent), an affiliate of the Investment Manager and a wholly-owned subsidiary of Ameriprise Financial, is responsible for providing transfer agency services to the Fund. The Transfer Agent has contracted with Boston Financial Data Services (BFDS) to serve as sub-transfer agent.
The Transfer Agent receives monthly account-based service fees based on the number of open accounts and is reimbursed by the Fund for the fees and expenses the Transfer Agent pays to financial intermediaries that maintain omnibus accounts with the Fund that is a percentage of the average aggregate value of the Fund’s shares maintained in each such omnibus account (other than omnibus accounts for which American Enterprise Investment Services Inc. is the broker of record or
| | |
| |
| | Active Portfolios® Multi-Manager Alternative Strategies Fund |
Notes to Consolidated Financial Statements (continued)
August 31, 2013
accounts where the beneficial shareholder is a customer of Ameriprise Financial Services, Inc., which are paid a per account fee). The Transfer Agent pays the fees of BFDS for services as sub-transfer agent and is not entitled to reimbursement for such fees from the Fund (with the exception of out-of-pocket fees).
The Transfer Agent also receives compensation from fees for various shareholder services and reimbursements for certain out-of-pocket fees.
For the year ended August 31, 2013, the Fund’s effective transfer agent fee rate as a percentage of average daily net assets for Class A shares was 0.10%.
Distribution and Service Fees
The Fund has an agreement with Columbia Management Investment Distributors, Inc. (the Distributor), an affiliate of the Investment Manager and a wholly-owned subsidiary of Ameriprise Financial, for distribution and shareholder services. Pursuant to Rule 12b-1 under the 1940 Act, the Board has approved, and the Fund has adopted, distribution and shareholder service plans (the Plans) which set the distribution and service fees for the Fund. These fees are calculated daily and are intended to compensate the Distributor and/or eligible selling and/or servicing agents for selling shares of the Fund and providing services to investors.
The Fund may pay a distribution fee of up to 0.25% of the Fund’s average daily net assets attributable to Class A shares and a service fee of up to 0.25% of the Fund’s average daily net assets attributable to Class A shares, provided, however, that the aggregate fee shall not exceed 0.25% of the Fund’s average daily net assets attributable to Class A shares.
Expenses Waived/Reimbursed by the Investment Manager and its Affiliates
The Investment Manager and certain of its affiliates have contractually agreed to waive fees and/or reimburse expenses (excluding certain fees and expenses described below) through December 31, 2014, unless sooner terminated at the sole discretion of the Board, so that the Fund’s net operating expenses, after giving effect to fees waived/expenses reimbursed and any balance credits and/or overdraft charges from the Fund’s custodian, do not exceed the annual rate of 1.50% of Class A shares’ average daily net assets.
Under the agreement governing these fee waivers and/or expense reimbursement arrangements, the following fees and expenses are excluded from the waiver/reimbursement commitment, and therefore will be paid by the Fund, if applicable: taxes (including foreign transaction taxes), expenses associated with investments in affiliated and non-
affiliated pooled investment vehicles (including mutual funds and exchange traded funds), transaction costs and brokerage commissions, costs related to any securities lending program, dividend expenses associated with securities sold short, inverse floater program fees and expenses, transaction charges and interest on borrowed money, interest, extraordinary expenses and any other expenses the exclusion of which is specifically approved by the Board. This agreement may be modified or amended only with approval from all parties.
Note 4. Federal Tax Information
The timing and character of income and capital gain distributions are determined in accordance with income tax regulations, which may differ from GAAP because of temporary or permanent book to tax differences.
At August 31, 2013, these differences are primarily due to differing treatment for principal and/or interest of fixed income securities, deferral/reversal of wash sales losses, Trustees’ deferred compensation, foreign currency transactions, passive foreign investment company (PFIC) holdings, re-characterization of distributions for investments, derivative investments, adjustments on certain convertible preferred securities, investments in commodity subsidiaries and constructive sales of appreciated financial positions. To the extent these differences are permanent, reclassifications are made among the components of the Fund’s net assets in the Consolidated Statement of Assets and Liabilities. Temporary differences do not require reclassifications. In the Consolidated Statement of Assets and Liabilities the following reclassifications were made:
| | | | |
Undistributed net investment income | | | $5,690,823 | |
Accumulated net realized gain | | | (5,359,054 | ) |
Paid-in capital | | | (331,769 | ) |
Net investment income and net realized gains (losses), as disclosed in the Consolidated Statement of Operations, and net assets were not affected by this reclassification.
The tax character of distributions paid during the years indicated was as follows:
| | | | | | | | |
| | | Year Ended
August 31,2013 | | | Year Ended
August 31,2012 | |
Ordinary income | | | $4,353,912 | | | | $— | |
Long-term capital gains | | | 314,137 | | | | — | |
Total | | | $4,668,049 | | | | $— | |
Short-term capital gain distributions, if any, are considered ordinary income distributions for tax purposes.
| | |
| |
| Active Portfolios® Multi-Manager Alternative Strategies Fund | | |
Notes to Consolidated Financial Statements (continued)
August 31, 2013
At August 31, 2013, the components of distributable earnings on a tax basis were as follows:
| | | | |
Undistributed ordinary income | | | $14,156,754 | |
Undistributed accumulated long-term gain | | | 969,268 | |
Unrealized appreciation | | | $13,557,278 | |
At August 31, 2013, the cost of investments for federal income tax purposes was $626,995,265 and the aggregate gross unrealized appreciation and depreciation based on that cost was:
| | | | |
Unrealized appreciation | | | $25,849,040 | |
Unrealized depreciation | | | (12,291,762 | ) |
Net unrealized appreciation | | | $13,557,278 | |
For the year ended August 31, 2013, $113,840 of capital loss carryforward was utilized.
Management of the Fund has concluded that there are no significant uncertain tax positions that would require recognition in the financial statements. However, management’s conclusion may be subject to review and adjustment at a later date based on factors including, but not limited to, new tax laws, regulations, and administrative interpretations (including relevant court decisions). Generally, the Fund’s federal tax returns for the prior three fiscal years remain subject to examination by the Internal Revenue Service.
Note 5. Portfolio Information
The cost of purchases and proceeds from sales of securities, excluding short-term obligations, aggregated to $764,987,673 and $724,063,816, respectively, for the year ended August 31, 2013, of which $92,291,236 and $119,225,997, respectively, were U.S. government securities.
Note 6. Affiliated Money Market Fund
The Fund invests its daily cash balances in Columbia Short-Term Cash Fund, an affiliated money market fund established for the exclusive use by the Fund and other affiliated funds. The income earned by the Fund from such investments is included as “Dividends — affiliated issuers” in the Consolidated Statement of Operations. As an investing fund, the Fund indirectly bears its proportionate share of the expenses of Columbia Short-Term Cash Fund.
Note 7. Shareholder Concentration
At August 31, 2013, one unaffiliated shareholder account owned 100.0% of the outstanding shares of the Fund. The Fund has no knowledge about whether any portion of those shares was owned beneficially by such account.
Note 8. Line of Credit
The Fund has entered into a revolving credit facility with a syndicate of banks led by JPMorgan Chase Bank N.A. whereby the Fund may borrow for the temporary funding of shareholder redemptions or for other temporary or emergency purposes. The credit facility agreement, as amended, which is a collective agreement between the Fund and certain other funds managed by the Investment Manager, severally and not jointly, permits collective borrowings up to $500 million. Interest is charged to each participating fund based on its borrowings at a rate equal to the higher of (i) the overnight federal funds rate plus 1.00% or (ii) the one-month LIBOR rate plus 1.00%. Each borrowing under the credit facility matures no later than 60 days after the date of borrowing. The Fund also pays a commitment fee equal to its pro rata share of the amount of the credit facility at a rate of 0.08% per annum. The commitment fee is included in other expenses in the Consolidated Statement of Operations.
The Fund had no borrowings during the year ended August 31, 2013.
Note 9. Significant Risks
Non-Diversification Risk
A non-diversified fund is permitted to invest a greater percentage of its total assets in fewer issuers than a diversified fund. The Fund may, therefore, have a greater risk of loss from a few issuers than a similar fund that invests more broadly.
Note 10. Subsequent Events
Management has evaluated the events and transactions that have occurred through the date the consolidated financial statements were issued and noted no items requiring adjustment of the consolidated financial statements or additional disclosure.
Note 11. Information Regarding Pending and Settled Legal Proceedings
In December 2005, without admitting or denying the allegations, American Express Financial Corporation (AEFC, which is now known as Ameriprise Financial, Inc. (Ameriprise Financial)) entered into settlement agreements with the Securities and Exchange Commission (SEC) and Minnesota Department of Commerce (MDOC) related to market timing activities. As a result, AEFC was censured and ordered to cease and desist from committing or causing any violations of certain provisions of the Investment Advisers Act of 1940, the Investment Company Act of 1940, and various Minnesota laws. AEFC agreed to pay disgorgement of
| | |
| |
| | Active Portfolios® Multi-Manager Alternative Strategies Fund |
Notes to Consolidated Financial Statements (continued)
August 31, 2013
$10 million and civil money penalties of $7 million. AEFC also agreed to retain an independent distribution consultant to assist in developing a plan for distribution of all disgorgement and civil penalties ordered by the SEC in accordance with various undertakings detailed at www.sec.gov/litigation/admin/ia-2451.pdf. Ameriprise Financial and its affiliates have cooperated with the SEC and the MDOC in these legal proceedings, and have made regular reports to the funds’ Boards of Trustees.
Ameriprise Financial and certain of its affiliates have historically been involved in a number of legal, arbitration and regulatory proceedings, including routine litigation, class actions, and governmental actions, concerning matters arising in connection with the conduct of their business activities. Ameriprise Financial believes that the Funds are not currently the subject of, and that neither Ameriprise Financial nor any of its affiliates are the subject of, any pending legal, arbitration or regulatory proceedings that are likely to have a material adverse effect on the Funds or the ability of Ameriprise Financial or its affiliates to perform under their
contracts with the Funds. Ameriprise Financial is required to make 10-Q, 10-K and, as necessary, 8-K filings with the Securities and Exchange Commission on legal and regulatory matters that relate to Ameriprise Financial and its affiliates. Copies of these filings may be obtained by accessing the SEC website at www.sec.gov.
There can be no assurance that these matters, or the adverse publicity associated with them, will not result in increased fund redemptions, reduced sale of fund shares or other adverse consequences to the Funds. Further, although we believe proceedings are not likely to have a material adverse effect on the Funds or the ability of Ameriprise Financial or its affiliates to perform under their contracts with the Funds, these proceedings are subject to uncertainties and, as such, we are unable to estimate the possible loss or range of loss that may result. An adverse outcome in one or more of these proceedings could result in adverse judgments, settlements, fines, penalties or other relief that could have a material adverse effect on the consolidated financial condition or results of operations of Ameriprise Financial.
| | |
| |
| Active Portfolios® Multi-Manager Alternative Strategies Fund | | |
Report of Independent Registered Public Accounting Firm
To the Trustees of Columbia Funds Series Trust I and the Shareholders of
Active Portfolios® Multi-Manager Alternative Strategies Fund
In our opinion, the accompanying consolidated statement of assets and liabilities, including the consolidated portfolio of investments, and the related consolidated statements of operations and of consolidated changes in net assets and the consolidated financial highlights present fairly, in all material respects, the financial position of Active Portfolios® Multi-Manager Alternative Strategies Fund (the “Fund”) (a series of Columbia Funds Series Trust I) at August 31, 2013, the results of its operations, the changes in its net assets and the financial highlights for the periods indicated, in conformity with accounting principles generally accepted in the United States of America. These financial statements and financial highlights (hereafter referred to as “financial statements”) are the responsibility of the Fund’s management. Our responsibility is to express an opinion on these financial statements based on our audits. We conducted our audits of these financial statements in accordance with the standards of the Public Company Accounting Oversight Board (United States). Those standards require that we plan and perform the audit to obtain reasonable assurance about whether the financial statements are free of material misstatement. An audit includes examining, on a test basis, evidence supporting the amounts and disclosures in the financial statements, assessing the accounting principles used and significant estimates made by management, and evaluating the overall financial statement presentation. We believe that our audits, which included confirmation of securities at August 31, 2013 by correspondence with the custodian, brokers and transfer agent, provide a reasonable basis for our opinion.
PricewaterhouseCoopers LLP
Minneapolis, Minnesota
October 28, 2013
| | |
| |
| | Active Portfolios® Multi-Manager Alternative Strategies Fund |
Federal Income Tax Information
(Unaudited)
The Fund hereby designates the following tax attributes for the fiscal year ended August 31, 2013. Shareholders will be notified in early 2014 of the amounts for use in preparing 2013 income tax returns.
Tax Designations
| | | | |
| | | | | |
Qualified Dividend Income | | | 24.91 | % |
Dividends Received Deduction | | | 26.20 | % |
Capital Gain Dividend | | | $1,347,576 | |
Qualified Dividend Income. For taxable, non-corporate shareholders, the percentage of ordinary income dividends paid during the fiscal year that represents qualified dividend income subject to reduced tax rates.
Dividends Received Deduction. The percentage of ordinary income dividends paid during the fiscal year that qualifies for the corporate dividends received deduction.
Capital Gain Dividend. The Fund designates as a capital gain dividend the amount reflected above, or if subsequently determined to be different, the net capital gain of such fiscal period. The Fund also designates as capital gain dividends, to the extent necessary to fully distribute such capital gains, earnings and profits distributed to shareholders on the redemption of shares.
| | |
| |
| Active Portfolios® Multi-Manager Alternative Strategies Fund | | |
Trustees and Officers
The Trustees serve terms of indefinite duration. The names, addresses and birth years of the Trustees and Officers of the Funds in Columbia Funds Series Trust I, the year each was first elected or appointed to office, their principal business occupations during at least the last five years, the number of Funds overseen by each Trustee and other directorships they hold are shown below. Each officer listed below serves as an officer of each Fund in Columbia Funds Series Trust I.
| | |
| Independent Trustees |
Name, Address and Year of Birth, Position with Funds, Year First Elected or Appointed to Office | | Principal Occupation(s) During Past Five Years, Number of Funds in Columbia
Funds Complex Overseen by Trustee, Other Directorships Held |
Rodman L. Drake (Born 1943)
c/o Columbia Management Investment Advisers, LLC 225 Franklin Street Boston, MA 02110 Trustee (since 1994) and Chairman of the Board (since 2009) | | Independent consultant since 2010; Co-Founder of Baringo Capital LLC (private equity) from 1997 to 2008; Chairman (from 2003 to 2010) and CEO (from 2008 to 2010) of Crystal River Capital, Inc. (real estate investment trust); Oversees 52; Jackson Hewitt Tax Service Inc. (tax preparation services) from 2004 to 2011; Student Loan Corporation (student loan provider) from 2005 to 2010; Celgene Corporation (global biotechnology company); The Helios Funds and Brookfield Funds (closed-end funds); Chimerix, Inc. (biopharmaceutical company) since August 1, 2013; Crystal River Capital, Inc. from 2005 to 2010; Parsons Brinckerhoff from 1995 to 2008; and Apex Silver Mines Ltd. from 2007 to 2009 |
Douglas A. Hacker (Born 1955)
c/o Columbia Management Investment Advisers, LLC 225 Franklin Street Boston, MA 02110 Trustee (since 1996) | | Independent business executive since May 2006; Executive Vice President — Strategy of United Airlines from December 2002 to May 2006; President of UAL Loyalty Services (airline marketing company) from September 2001 to December 2002; Executive Vice President and Chief Financial Officer of United Airlines from July 1999 to September 2001. Oversees 52; Nash Finch Company (food distributor); Aircastle Limited (aircraft leasing); and SeaCube Container Leasing Ltd. (container leasing) |
Janet Langford Kelly (Born 1957)
c/o Columbia Management Investment Advisers, LLC 225 Franklin Street Boston, MA 02110 Trustee (since 1996) | | Senior Vice President, General Counsel and Corporate Secretary, ConocoPhillips (integrated energy company) since September 2007; Deputy General Counsel — Corporate Legal Services, ConocoPhillips from August 2006 to August 2007; Partner, Zelle, Hofmann, Voelbel, Mason & Gette LLP (law firm) from March 2005 to July 2006; Adjunct Professor of Law, Northwestern University from September 2004 to June 2006; Director, UAL Corporation (airline) from February 2006 to July 2006; Chief Administrative Officer and Senior Vice President, Kmart Holding Corporation (consumer goods) from September 2003 to March 2004. Oversees 52; None |
Nancy T. Lukitsh (Born 1956)
c/o Columbia Management Investment Advisers, LLC 225 Franklin Street Boston, MA 02110 Trustee (since 2011) | | Senior Vice President, Partner and Director of Marketing, Wellington Management Company, LLP (investment adviser) from 1997 to 2010; Chair, Wellington Management Investment Portfolios (commingled non-U.S. investment pools) from 2007 to 2010; Director, Wellington Trust Company, NA and other Wellington affiliates from 1997 to 2010. Oversees 52; None |
William E. Mayer (Born 1940)
c/o Columbia Management Investment Advisers, LLC 225 Franklin Street Boston, MA 02110 Trustee (since 1994) | | Partner, Park Avenue Equity Partners (private equity) since February 1999; Dean and Professor, College of Business and Management, University of Maryland from 1992 to 1996. Oversees 52; DynaVox Inc. (speech creation); Lee Enterprises (print media); WR Hambrecht + Co. (financial service provider) from 2000 to 2012; BlackRock Kelso Capital Corporation (investment company) |
David M. Moffett (Born 1952)
c/o Columbia Management Investment Advisers, LLC 225 Franklin Street Boston, MA 02110 Trustee (since 2011) | | Retired. Chief Executive Officer, Federal Home Loan Mortgage Corporation, from 2008 to 2009; Senior Adviser, Global Financial Services Group, Carlyle Group, Inc., from 2007 to 2008; Vice Chairman and Chief Financial Officer, U.S. Bancorp, from 1993 to 2007. Oversees 52; CIT Group Inc. (commercial and consumer finance); eBay Inc. (online trading community); MBIA Inc. (financial service provider); E.W. Scripps Co. (print and television media), Building Materials Holding Corp. (building materials and construction services); Genworth Financial, Inc. (financial and insurance products and services); and University of Oklahoma Foundation |
Charles R. Nelson (Born 1942)
c/o Columbia Management Investment Advisers, LLC 225 Franklin Street Boston, MA 02110 Trustee (since 1981) | | Retired. Professor Emeritus, University of Washington, since 2011; Professor of Economics, University of Washington from 1976 to 2011; Ford and Louisa Van Voorhis Professor of Political Economy, University of Washington from 1993 to 2011; Adjunct Professor of Statistics, University of Washington from 1980 to 2011; Associate Editor, Journal of Money, Credit and Banking from September 1993 to 2008; consultant on econometric and statistical matters. Oversees 52; None |
John J. Neuhauser (Born 1943)
c/o Columbia Management Investment Advisers, LLC 225 Franklin Street Boston, MA 02110 Trustee (since 1984) | | President, Saint Michael’s College, since August 2007; Director or Trustee of several non-profit organizations, including Fletcher Allen Health Care, Inc.; University Professor, Boston College from November 2005 to August 2007; Academic Vice President and Dean of Faculties, Boston College from August 1999 to October 2005. Oversees 52; Liberty All-Star Equity Fund and Liberty All-Star Growth Fund (closed-end funds) |
| | |
| |
| | Active Portfolios® Multi-Manager Alternative Strategies Fund |
Trustees and Officers (continued)
| | |
| Independent Trustees (continued) |
Name, Address and Year of Birth, Position with Funds, Year First Elected or Appointed to Office | | Principal Occupation(s) During Past Five Years, Number of Funds in Columbia
Funds Complex Overseen by Trustee, Other Directorships Held |
Patrick J. Simpson (Born 1944)
c/o Columbia Management Investment Advisers, LLC 225 Franklin Street Boston, MA 02110 Trustee (since 2000) | | Partner, Perkins Coie LLP (law firm). Oversees 52; None |
Anne-Lee Verville (Born 1945)
c/o Columbia Management Investment Advisers, LLC 225 Franklin Street Boston, MA 02110 Trustee (since 1998) | | Retired. General Manager — Global Education Industry from 1994 to 1997, President — Application Systems Division from 1991 to 1994, Chief Financial Officer — US Marketing & Services from 1988 to 1991, and Chief Information Officer from 1987 to 1988, IBM Corporation (computer and technology). Oversees 52; Enesco Group, Inc. (producer of giftware and home and garden decor products) from 2001 to 2006 |
| | |
| Interested Trustee | | |
Name, Address and Year of Birth, Position with Funds, Year First Elected or Appointed to Office | | Principal Occupation(s) During Past Five Years, Number of Funds in Columbia
Funds Complex Overseen by Trustee, Other Directorships Held |
William F. Truscott (Born 1960)
53600 Ameriprise Financial Center Minneapolis, MN 55474 Senior Vice President (since 2012) | | Chairman of the Board and President, Columbia Management Investment Advisers, LLC since May 2010 and February 2012 (previously President and Chief Investment Officer, from 2001 to April 2010); Chief Executive Officer, Global Asset Management, Ameriprise Financial, Inc. since September 2012 (previously, Chief Executive Officer, U.S. Asset Management & President, Annuities, from May 2010 to September 2012 and President — U.S. Asset Management and Chief Investment Officer from 2005 to April 2010); Director and Chief Executive Officer, Columbia Management Investment Distributors, Inc. since May 2010 and February 2012, respectively (previously Chairman of the Board and Chief Executive Officer from 2006 to April 2010); Chairman of the Board and Chief Executive Officer, RiverSource Distributors, Inc. since 2006; President and Chief Executive Officer, Ameriprise Certificate Company, 2006 to August 2012; Oversees 184; Director, Ameriprise Certificate Company, 2006-January 2013 |
The Statement of Additional Information includes additional information about the Trustees of the Funds and is available, without charge, upon request by calling 800.345.6611.
The Board has appointed officers who are responsible for day-to-day business decisions based on policies it has established. The officers serve at the pleasure of the Board. In addition to Mr. Truscott, who is Senior Vice President, the Funds’ other officers are:
| | |
| Officers |
Name, Year of Birth and Address | | Principal Occupation(s) During the Past Five Years |
J. Kevin Connaughton (Born 1964) 225 Franklin Street Boston, MA 02110 President (since 2009) | | Senior Vice President and General Manager — Mutual Fund Products, Columbia Management Investment Advisers, LLC since May 2010; President, Columbia Funds since 2009 and RiverSource Funds since May 2010; Managing Director, Columbia Management Advisors, LLC, December 2004-April 2010; Senior Vice President and Chief Financial Officer, Columbia Funds, June 2008-January 2009; Treasurer, Columbia Funds, October 2003-May 2008; and senior officer of various other affiliated funds since 2000 |
Amy Johnson (Born 1965) 5228 Ameriprise Financial Center Minneapolis, MN 55474 Vice President (since 2010) | | Senior Vice President and Chief Operating Officer, Columbia Management Investment Advisers, LLC since May 2010 (previously Chief Administrative Officer, from 2009-April 2010, Vice President — Asset Management and Trust Company Services, from 2006-2009) |
Michael G. Clarke (Born 1969) 225 Franklin Street Boston, MA 02110 Treasurer (since 2011) and Chief Financial Officer (since 2009) | | Vice President, Columbia Management Investment Advisers, LLC since May 2010; Managing Director of Fund Administration, Columbia Management Advisors, LLC, September 2004-April 2010; senior officer of Columbia Funds and affiliated funds since 2002 |
Scott R. Plummer (Born 1959) 5228 Ameriprise Financial Center Minneapolis, MN 55474 Senior Vice President, Assistant Secretary and Chief Legal Officer (since 2010) | | Senior Vice President, Chief Legal Officer and Assistant Secretary, Columbia Management Investment Advisers, LLC since June 2005; Senior Vice President and Lead Chief Counsel — Asset Management, Ameriprise Financial, Inc. since May 2010 (previously Vice President and Chief Counsel — Asset Management, 2005-April 2010); Vice President, Chief Counsel and Assistant Secretary, Columbia Management Investment Distributors, Inc. since 2008; Vice President, General Counsel and Secretary, Ameriprise Certificate Company since 2005; Chief Counsel, RiverSource Distributors, Inc. since 2006; senior officer of Columbia Funds and affiliated funds since 2010 |
| | |
| |
| Active Portfolios® Multi-Manager Alternative Strategies Fund | | |
Trustees and Officers (continued)
| | |
| Officers (continued) |
Name, Year of Birth and Address | | Principal Occupation(s) During the Past Five Years |
Colin Moore (Born 1958) 225 Franklin Street Boston, MA 02110 Senior Vice President (since 2010) | | Executive Vice President and Global Chief Investment Officer, Ameriprise Financial, Inc. since July 2013; Director and Global Chief Investment Officer, Columbia Management Investment Advisers, LLC since May 2010; Manager, Managing Director and Chief Investment Officer of Columbia Management Advisors, LLC, 2007-April 2010 |
Thomas P. McGuire (Born 1972) 225 Franklin Street Boston, MA 02110 Chief Compliance Officer (since 2012) | | Vice President — Asset Management Compliance, Columbia Management Investment Advisers, LLC since 2010; Chief Compliance Officer, Ameriprise Certificate Company, since September 2010; Compliance Executive, Bank of America, N.A. 2005-2010 |
Stephen T. Welsh (Born 1957) 225 Franklin Street Boston, MA 02110 Vice President (since 2006) | | President and Director, Columbia Management Investment Services Corp. since May 2010; President and Director, Columbia Management Services, Inc., July 2004-April 2010; Managing Director, Columbia Management Distributors, Inc., August 2007-April 2010 |
Christopher O. Petersen (Born 1970) 5228 Ameriprise Financial Center Minneapolis, MN 55474 Vice President (since 2010) and Secretary (since 2011) | | Vice President and Chief Counsel, Ameriprise Financial, Inc. since January 2010 (formerly Vice President and Group Counsel or Counsel, April 2004-January 2010); Assistant Secretary of Columbia Funds, January 2007-April 2011 |
Paul D. Pearson (Born 1956) 10468 Ameriprise Financial Center Minneapolis, MN 55474 Vice President and Assistant Treasurer (since 2011) | | Vice President, Investment Accounting, Columbia Management Investment Advisers, LLC, since May 2010; Vice President — Managed Assets, Investment Accounting, Ameriprise Financial, Inc., February 1998-May 2010 |
Joseph F. DiMaria (Born 1968) 225 Franklin Street Boston, MA 02110 Vice President (since 2011) and Chief Accounting Officer (since 2008) | | Vice President, Mutual Fund Administration, Columbia Management Investment Advisers, LLC, since May 2010; Director of Fund Administration, Columbia Management Advisors, LLC, January 2006-April 2010 |
Paul B. Goucher (Born 1968) 100 Park Avenue New York, NY 10017 Vice President and Assistant Secretary (since 2010) | | Vice President and Lead Chief Counsel, Ameriprise Financial, Inc. since November 2008 and January 2013, respectively (formerly, Chief Counsel from January 2010-January 2013 and Group Counsel from November 2008-January 2010); Director, Managing Director and General Counsel, J. & W. Seligman & Co. Incorporated, July 2008-November 2008 (previously, Managing Director and Associate General Counsel, January 2005-July 2008) |
Michael E. DeFao (Born 1968) 225 Franklin Street Boston, MA 02110 Vice President and Assistant Secretary (since 2011) | | Vice President and Chief Counsel, Ameriprise Financial, Inc. since May 2010; Associate General Counsel, Bank of America, N.A. June 2005-April 2010 |
| | |
| |
| | Active Portfolios® Multi-Manager Alternative Strategies Fund |
Board Consideration and Approval of Advisory Agreement and Subadvisory Agreements
On June 14, 2013, the Board of Trustees (the “Board”) and the Trustees who are not interested persons (as defined in the Investment Company Act of 1940) of the Trust (the “Independent Trustees”) unanimously approved the continuation of the Investment Management Services Agreement (the “Advisory Agreement”) with Columbia Management Investment Advisers, LLC (the “Investment Manager”) and the Subadvisory Agreements (the “Subadvisory Agreements”) between the Investment Manager and AQR Capital Management, LLC, Eaton Vance Management, Wasatch Advisors, Inc. and Water Island Capital, LLC (the “Subadvisers”) with respect to Active Portfolios® Multi-Manager Alternative Strategies Fund (the “Fund”), a series of the Trust. As detailed below, the Advisory Fees and Expenses Committee (the “Committee”) and the Board met on multiple occasions to review and discuss, both among themselves and with the management team of the Investment Manager, materials provided by the Investment Manager before determining to approve the continuation of the Advisory Agreement and the Subadvisory Agreements (collectively, the “Agreements”).
In connection with their deliberations regarding the continuation of the Agreements, the Committee and the Board evaluated materials requested from the Investment Manager regarding the Fund and the Agreements, and discussed these materials with representatives of the Investment Manager at Committee meetings held on March 5, 2013, April 24, 2013 and June 13, 2013, and at the Board meeting held on June 14, 2013. In addition, the Board considers matters bearing on the Agreements at most of its other meetings throughout the year and meets regularly with senior management of the Funds and the Investment Manager. Through the Board’s Investment Oversight Committees, Trustees also meet with selected Fund portfolio managers and other investment personnel at various times throughout the year. The Committee and the Board also consulted with Fund counsel and with the Independent Trustees’ independent legal counsel, who advised on various matters with respect to the Committee’s and the Board’s considerations and otherwise assisted the Committee and the Board in their deliberations. On June 13, 2013, the Committee recommended that the Board approve the continuation of the Agreements. On June 14, 2013, the Board, including the Independent Trustees, voting separately, unanimously approved the continuation of the Agreements for the Fund.
The Committee and the Board considered all information that they, their legal counsel, or the Investment Manager believed reasonably necessary to evaluate and to determine whether to approve the continuation of the Agreements. The information and factors considered by the Committee and the Board in recommending for approval or approving the continuation of the Agreements for the Fund included the following:
| • | | Information on the investment performance of the Fund from the date of its inception through December 31, 2012, including performance relative to a group of mutual funds determined to be comparable to the Fund by an independent third party data provider, as well as performance relative to benchmarks; |
| • | | Information on the Fund’s advisory fees and total expenses, including information comparing the Fund’s expenses to those of a group of comparable mutual funds, as determined by the independent third-party data provider; |
| • | | The Investment Manager’s agreement to contractually limit or cap total operating expenses for the Fund so that total operating expenses (excluding certain fees and expenses, such as transaction costs and certain other investment related expenses, interest, taxes, acquired fund fees and expenses, and extraordinary expenses) would not exceed the median expenses of a group of comparable funds (as determined from time to time, generally annually, by the independent third-party data provider); |
| • | | The terms and conditions of the Agreements; |
| • | | The terms and conditions of other agreements and arrangements with affiliates of the Investment Manager relating to the operations of the Fund, including the Administrative Services Agreement, the Distribution Agreement and the Transfer and Dividend Disbursing Agent Agreement; |
| • | | Descriptions of various functions performed by the Investment Manager and the Subadvisers under the Agreements, including portfolio management and portfolio trading practices; |
| • | | Information regarding the management fees and investment performance of comparable portfolios of other clients of the Investment Manager, including institutional separate accounts; |
| • | | Information regarding the reputation, regulatory history and resources of the Investment Manager and the Subadvisers, including information regarding senior management, portfolio managers and other personnel; |
| | |
| |
| Active Portfolios® Multi-Manager Alternative Strategies Fund | | |
Board Consideration and Approval of Advisory Agreement and Subadvisory Agreements (continued)
| • | | Information regarding the capabilities of the Investment Manager and the Subadvisers with respect to compliance monitoring services, including an assessment of the Investment Manager’s and the Subadvisers’ compliance system by the Fund’s Chief Compliance Officer; and |
| • | | The profitability to the Investment Manager and its affiliates from their relationships with the Fund. |
Nature, Extent and Quality of Services Provided under the Agreements
The Committee and the Board considered the nature, extent and quality of services provided to the Fund by the Investment Manager and the Subadvisers and the Investment Manager’s affiliates under the Agreements and under separate agreements for the provision of transfer agency and administrative services, and the resources dedicated to the Fund and the other Columbia Funds by the Investment Manager and the Subadvisers and the Investment Manager’s affiliates. The Committee and the Board considered, among other things, the Investment Manager’s ability to attract, motivate and retain highly qualified research, advisory and supervisory investment professionals (including personnel and other resources, compensation programs for personnel involved in fund management, reputation and other attributes), the portfolio management services provided by those investment professionals, and the quality of the Investment Manager’s investment research capabilities and trade execution services. The Committee and the Board also considered the potential benefits to shareholders of investing in a mutual fund that is part of a fund complex offering exposure to a variety of asset classes and investment disciplines and providing a variety of fund and shareholder services.
The Committee and the Board also considered the professional experience and qualifications of the senior personnel of the Investment Manager and the Subadvisers, which included consideration of the Investment Manager’s and the Subadvisers’ experience with similarly-structured funds. The Committee and the Board noted the compliance programs of and the compliance-related resources provided to the Fund by the Investment Manager and its affiliates, and considered the Investment Manager’s ability to provide administrative services to the Fund pursuant to a separate Administrative Services Agreement, including the Investment Manager’s ability to coordinate the activities of the Fund’s other service providers. The Committee and the Board also noted that the Board had approved each Subadvisers’ code of ethics and compliance program, and that the Chief Compliance Officer of the Funds monitors each code of ethics and compliance program.
The Committee and the Board considered the diligence and selection process undertaken to select the Subadvisers, including the Investment Manager’s rationale for recommending approval of the Subadvisory Agreements, and the process for monitoring the Subadvisers’ ongoing performance of services for the Fund. As part of these deliberations, the Committee and the Board considered the ability of the Investment Manager, subject to the approval of the Board, to modify or enter into new Subadvisory Agreements without a shareholder vote pursuant to an exemptive order of the Securities and Exchange Commission. The Committee and the Board also considered the scope of services provided to the Fund by the Investment Manager that are distinct from and in addition to those provided by the Subadvisers, including cash flow management, treasury services, risk oversight, investment oversight and Subadvisers selection, oversight and transition management. After reviewing these and related factors, the Committee and the Board concluded, within the context of their overall conclusions, that the nature, extent and quality of the services provided to the Fund under the Agreements supported the continuation of the Agreements.
Investment Performance
The Committee and the Board reviewed information about the performance of the Fund from its date of inception through December 31, 2012, including performance information relative to benchmarks and information based on reports of the independent third-party data provider that compared the performance of the Fund to the performance of a group of comparable mutual funds. Because the Fund did not have a complete year of performance from its date of inception, the Committee and the Board did not have information regarding the percentile ranking of the Fund’s performance relative to the returns of a group of comparable funds. However, the Committee and the Board expected to consider, in connection with their next review and consideration of the continuation of the Agreements, the investment performance of the Fund in relation to the annualized return for various time periods of both a group of comparable funds, as determined by the independent third party data provider, and a benchmark.
The Committee and the Board also considered the Investment Manager’s and Subadvisers’ performance and reputation generally, the Investment Manager’s historical responsiveness to Board concerns about performance, and the Investment Manager’s willingness to take steps intended to improve performance. After reviewing these and related factors, the Committee and the Board concluded, within the context of their overall conclusions, that the performance of the Fund, the Investment Manager and the Subadvisers supported the continuation of the Agreements.
| | |
| |
| | Active Portfolios® Multi-Manager Alternative Strategies Fund |
Board Consideration and Approval of Advisory Agreement and Subadvisory Agreements (continued)
Investment Advisory Fee Rates and Other Expenses
The Committee and the Board considered the advisory fees charged to the Fund under the Agreements, as well as the total expenses incurred by the Fund. In assessing the reasonableness of the fees under the Advisory Agreement, the Committee and the Board considered, among other information, the Fund’s advisory fee and its total expense ratio as a percentage of average daily net assets. The Committee and the Board noted that the Fund’s actual management fee and net expense ratio are ranked in the third and second quintiles, respectively, (where the lowest fees and expenses would be in the first quintile) against the Fund’s expense universe as determined by the independent third-party data provider for purposes of expense comparison. The Committee and the Board also noted that the Investment Manager pays the fees of the Subadvisers. The Committee and the Board also took into account the fee waiver and expense limitation arrangements agreed to by the Investment Manager, as noted above.
The Committee and the Board also received and considered information about the advisory fees charged by the Investment Manager to institutional separate accounts. In considering the fees charged to those accounts, the Committee and the Board took into account, among other things, the Investment Manager’s representations about the differences between managing mutual funds as compared to other types of accounts, including differences in the services provided, differences in the risk profile of such business for the Investment Manager and the additional resources required to manage mutual funds effectively. In evaluating the Fund’s advisory fees, the Committee and the Board also took into account the demands, complexity and quality of the investment management of the Fund.
After reviewing these and related factors, the Committee and the Board concluded, within the context of their overall conclusions, that the advisory fee rates and expenses of the Fund supported the continuation of the Agreements.
Costs of Services Provided and Profitability
The Committee and the Board also took note of the costs of the services provided (both on an absolute and relative basis) and the profitability to the Investment Manager and its affiliates in connection with their relationships with the Fund. In evaluating these considerations, the Committee and the Board took note of the advisory fees charged by the Investment Manager to other clients, including fees charged by the Investment Manager to institutional separate account clients with similar investment strategies to those of the Fund.
The Committee and the Board also considered the compensation directly or indirectly received by the Investment Manager’s affiliates in connection with their relationships with the Fund. The Committee and the Board reviewed information provided by management as to the profitability of the Investment Manager and its affiliates of their relationships with the Fund, information about the allocation of expenses used to calculate profitability, and comparisons of profitability levels realized in 2012 to profitability levels realized in 2011. When reviewing profitability, the Committee and the Board also considered court cases in which adviser profitability was an issue in whole or in part, the performance of the Fund, the expense ratio of the Fund, and the implementation of expense limitations with respect to the Fund. The Committee and the Board also considered information provided by the Investment Manager regarding its financial condition and comparing its profitability to that of other asset management firms that are, or are subsidiaries of, publicly traded companies. Because the Subadvisory Agreements were negotiated at arms-length by the Investment Manager, which is responsible for payments to the Subadvisers thereunder, the Committee and the Board did not consider the profitability to the Subadvisers of its relationship with the Fund.
After reviewing these and related factors, the Committee and the Board concluded, within the context of their overall conclusions, that the costs of services provided and the profitability to the Investment Manager and its affiliates from their relationships with the Fund supported the continuation of the Agreements.
Economies of Scale
The Committee and the Board considered the potential existence of economies of scale in the provision by the Investment Manager and the Subadvisers of services to the Fund, to groups of related funds, and to the Investment Manager’s and the Subadvisers’ investment advisory clients as a whole, and whether those economies of scale were shared with the Fund through breakpoints in investment advisory fees or other means, such as expense limitation arrangements and additional investments by the Investment Manager and/or the Subadvisers in investment, trading and compliance resources. The Committee and the Board noted that the investment advisory fee schedules for the Fund contained breakpoints that would reduce the fee rate on assets above specified threshold levels.
| | |
| |
| Active Portfolios® Multi-Manager Alternative Strategies Fund | | |
Board Consideration and Approval of Advisory Agreement and Subadvisory Agreements (continued)
The Committee and the Board noted that the breakpoints in the Advisory Agreement did not occur at the same levels as the breakpoints in the Subadvisory Agreements. The Committee and the Board noted that absent a shareholder vote, the Investment Manager would bear any increase in fees payable under the Subadvisory Agreements. The Committee and the Board also noted the potential challenges of seeking to tailor the Advisory Agreement breakpoints to those of a Subadvisory Agreements in this context, and the effect that capacity constraints on a subadviser’s ability to manage assets could potentially have on the ability of the Investment Manager to achieve economies of scale, as new subadvisers might need to be added as the Fund grows, increasing the Investment Manager’s cost of compensating and overseeing the Fund’s subadvisers.
In considering these matters, the Committee and the Board also considered the costs of the services provided and the profitability to the Investment Manager and its affiliates from their relationships with the Fund, as discussed above. After reviewing these and related factors, the Committee and the Board concluded, within the context of their overall conclusions, that the extent to which any economies of scale were expected to be shared with the Fund supported the continuation of the Agreements.
Other Benefits to the Investment Manager
The Committee and the Board received and considered information regarding “fall-out” or ancillary benefits received by the Investment Manager and its affiliates as a result of their relationships with the Fund, such as the engagement of the Investment Manager to provide administrative services to the Fund and the engagement of the Investment Manager’s affiliates to provide distribution and transfer agency services to the Fund. The Committee and the Board considered that the Fund’s distributor retains a portion of the distribution fees from the Fund and receives a portion of the sales charges on sales or redemptions of certain classes of shares of the Fund. The Committee and the Board also considered the benefits of research made available to the Investment Manager by reason of brokerage commissions generated by the Fund’s securities transactions, and reviewed information about the Investment Manager’s practices with respect to allocating portfolio transactions for brokerage and research services. The Committee and the Board considered the possible conflicts of interest associated with certain fall-out or other ancillary benefits and the reporting, disclosure and other processes that are in place to address such possible conflicts of interest. The Committee and the Board recognized that the Investment Manager’s profitability would be somewhat lower without these benefits.
Conclusion
The Committee and the Board reviewed all of the above considerations in reaching their decisions to recommend or approve the continuation of the Agreements. In their deliberations, the Trustees did not identify any particular information that was all-important or controlling, and individual Trustees may have attributed different weights to the various factors. Based on their evaluation of all factors that they deemed to be material, including those factors described above, and assisted by the advice of independent legal counsel, the Board, including the Independent Trustees, voting separately, unanimously approved the continuation of the Agreements.
| | |
| |
| | Active Portfolios® Multi-Manager Alternative Strategies Fund |
[THIS PAGE INTENTIONALLY LEFT BLANK]
| | |
| |
| Active Portfolios® Multi-Manager Alternative Strategies Fund | | |
Important Information About This Report
Each fund mails one shareholder report to each shareholder address. If you would like more than one report, please call shareholder services at 800.345.6611 and additional reports will be sent to you.
The policy of the Board is to vote the proxies of the companies in which each fund holds investments consistent with the procedures as stated in the Statement of Additional Information (SAI). You may obtain a copy of the SAI without charge by calling 800.345.6611; contacting your financial intermediary; visiting columbiamanagement.com; or searching the website of the Securities and Exchange Commission (SEC) at sec.gov. Information regarding how each fund voted proxies relating to portfolio securities is filed with the SEC by August 31 for the most recent 12-month period ending June 30 of that year, and is available without charge by visiting columbiamanagement.com; or searching the website of the SEC at sec.gov.
Each fund files a complete schedule of portfolio holdings with the SEC for the first and third quarters of each fiscal year on Form N-Q. Each fund’s Form N-Q is available on the SEC’s website at sec.gov and may be reviewed and copied at the SEC’s Public Reference Room in Washington, D.C. Information on the operation of the Public Reference Room may be obtained by calling 800.SEC.0330. Each fund’s complete schedule of portfolio holdings, as filed on Form N-Q, can also be obtained without charge, upon request, by calling 800.345.6611.
You may obtain the current net asset value (NAV) of Fund shares at no cost by calling 800.345.6611 or by sending an e-mail to serviceinquiries@columbiamanagement.com.

Active Portfolios® Multi-Manager Alternative Strategies Fund
P.O. Box 8081
Boston, MA 02266-8081
columbiamanagement.com
Information is for use with concurrent or prior delivery of a fund prospectus. Please read and consider the investment objectives, risks, charges and expenses for any fund carefully before investing. For a prospectus which contains this and other important information about the Fund, go to columbiamanagement.com. The Fund is distributed by Columbia Management Investment Distributors, Inc., member FINRA, and managed by Columbia Management Investment Advisers, LLC.
© 2013 Columbia Management Investment Advisers, LLC. All rights reserved.
ANN100_08_C01_(10/13)
| | |
Annual Report August 31, 2013 | |  |
| | |
Active Portfolios® Multi-Manager Core Plus Bond Fund | | |

President’s Message

Dear Shareholders,
A return to volatility
Volatility returned to the financial markets in the second quarter of 2013, as uncertainty about the global economy, monetary policy and the impact of the sequester’s spending cuts weighed on investors. Households advanced their spending but also allocated less to savings. Labor markets continued to crank out jobs at a steady pace, slowly reducing unemployment. Housing activity remained strong and retail sales were higher despite no real increase in income. The single weak spot was in the manufacturing sector, where activity slowed. While the consumer has weathered the domestic drag well, business has been closer to the global slowdown and effects of sequestration. Businesses remain very cautious, keeping inventories and staffs lean, and are planning for but not yet confident enough to make capital expenditures.
Against this backdrop, equities outperformed fixed income during the second quarter of 2013. Small-cap stocks outperformed large- and mid-cap stocks, and growth outperformed value except for in the large-cap sector. Outside the United States, foreign stock markets generally lost ground, with the most significant losses sustained by emerging markets.
Columbia Management to begin delivering summary prospectuses
Each Columbia fund is required to update its prospectus on an annual basis. Beginning with June 2013 prospectus updates, shareholders of Columbia retail mutual funds will start to receive a summary prospectus, rather than the full length (statutory) mutual fund prospectus they have received in the past.
Each fund’s summary prospectus will include the following key information:
| > | | Portfolio turnover rate information |
| > | | Principal investment strategies, principal risks and performance information |
| > | | Purchase and sale information |
| > | | Financial intermediary compensation information |
Each fund’s statutory prospectus will contain additional information about the fund and its risks. Both the statutory and summary prospectus will be updated each year, and will be available at columbiamanagement.com. Shareholders may request a printed version of a statutory prospectus at no cost by calling 800.345.6611 or sending an email to serviceinquiries@columbiamanagement.com.
Stay on track with Columbia Management
Backed by more than 100 years of experience, Columbia Management is one of the nation’s largest asset managers. At the heart of our success — and, most importantly, that of our investors — are highly talented industry professionals, brought together by a unique way of working. We are dedicated to helping you take advantage of today’s opportunities and anticipate tomorrow’s. We stay abreast of the latest investment trends and ideas, using our collective insight to evaluate events and transform them into solutions you can use.
Visit columbiamanagement.com for:
| > | | The Columbia Management Perspectives blog, featuring timely posts by our investment teams |
| > | | Detailed up-to-date fund performance and portfolio information |
| > | | Economic analysis and market commentary |
| > | | Quarterly fund commentaries |
| > | | Columbia Management Investor, our award-winning quarterly newsletter for shareholders |
Thank you for your continued support of the Columbia Funds. We look forward to serving your investment needs for many years to come.
Best Regards,

J. Kevin Connaughton
President, Columbia Funds
Investors should consider the investment objectives, risks, charges and expenses of a mutual fund carefully before investing. For a free prospectus, which contains this and other important information about a fund, visit columbiamanagement.com. The prospectus should be read carefully before investing.
Columbia Funds are distributed by Columbia Management Investment Distributors, Inc., member FINRA, and managed by Columbia Management Investment Advisers, LLC.
© 2013 Columbia Management Investment Advisers, LLC. All rights reserved.
Annual Report 2013
| | |
| |
| Active Portfolios® Multi-Manager Core Plus Bond Fund | | |
Table of Contents
Fund Investment Manager
Columbia Management Investment
Advisers, LLC
225 Franklin Street
Boston, MA 02110
Fund Distributor
Columbia Management Investment
Distributors, Inc.
225 Franklin Street
Boston, MA 02110
Fund Transfer Agent
Columbia Management Investment
Services Corp.
P.O. Box 8081
Boston, MA 02266-8081
For more information about any of the funds, please visit columbiamanagement.com or call 800.345.6611. Customer Service Representatives are available to answer your questions Monday through Friday from 8 a.m. to 8 p.m. Eastern time.
The views expressed in this report reflect the current views of the respective parties. These views are not guarantees of future performance and involve certain risks, uncertainties and assumptions that are difficult to predict, so actual outcomes and results may differ significantly from the views expressed. These views are subject to change at any time based upon economic, market or other conditions and the respective parties disclaim any responsibility to update such views. These views may not be relied on as investment advice and, because investment decisions for a Columbia Fund are based on numerous factors, may not be relied on as an indication of trading intent on behalf of any particular Columbia Fund. References to specific securities should not be construed as a recommendation or investment advice.
Annual Report 2013
| | |
| |
| | Active Portfolios® Multi-Manager Core Plus Bond Fund |
Performance Overview
Performance Summary
| > | | Active Portfolios® Multi-Manager Core Plus Bond Fund (the Fund) Class A shares returned -1.16% for the 12-month period that ended August 31, 2013. |
| > | | The Fund outperformed its benchmark, the Barclays U.S. Aggregate Bond Index, which returned -2.47% over the same period. |
| > | | The Fund’s outperformance can be attributed primarily to effective sector allocation. |
| | | | | | | | | | |
Average Annual Total Returns (%) (for period ended August 31, 2013) | |
| | | Inception | | 1 Year | | | Life | |
Class A | | 04/20/12 | | | -1.16 | | | | 1.44 | |
Barclays U.S. Aggregate Bond Index | | | | | -2.47 | | | | 0.06 | |
All results shown assume reinvestment of distributions during the period. Returns do not reflect the deduction of taxes that a shareholder may pay on Fund distributions or on the redemption of Fund shares. Performance results reflect the effect of any fee waivers or reimbursements of Fund expenses by Columbia Management Investment Advisers, LLC and/or any of its affiliates. Absent these fee waivers or expense reimbursement arrangements, performance results would have been lower.
The performance information shown represents past performance and is not a guarantee of future results. The investment return and principal value of your investment will fluctuate so that your shares, when redeemed, may be worth more or less than their original cost. Current performance may be lower or higher than the performance information shown. You may obtain performance information current to the most recent month-end by contacting your financial intermediary, visiting columbiamanagement.com or calling 800.345.6611.
The Barclays U.S. Aggregate Bond Index is a broad-based benchmark that measures the investment grade, U.S. dollar-denominated, fixed-rate taxable bond market, including Treasuries, government-related and corporate securities, mortgage-backed securities (agency fixed-rate and hybrid adjustable-rate mortgage passthroughs), asset-backed securities, and commercial mortgage-backed securities.
Indices are not available for investment, are not professionally managed and do not reflect sales charges, fees, brokerage commissions, taxes or other expenses of investing. Securities in the Fund may not match those in an index.
| | |
| |
| Active Portfolios® Multi-Manager Core Plus Bond Fund | | |
Performance Overview (continued)
|
Performance of a Hypothetical $10,000 Investment (April 20, 2012 — August 31, 2013) |
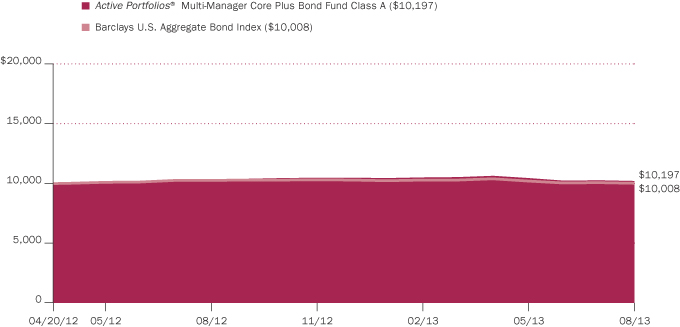
The chart above shows the change in value of a hypothetical $10,000 investment in Class A shares of Active Portfolios® Multi-Manager Core Plus Bond Fund during the stated time period, and does not reflect the deduction of taxes that a shareholder may pay on Fund distributions or on the redemption of Fund shares.
| | |
| |
| | Active Portfolios® Multi-Manager Core Plus Bond Fund |
Manager Discussion of Fund Performance
Portfolio Management
Columbia Management Investment Advisers, LLC
Carl Pappo, CFA
Brian Lavin, CFA
Michael Zazzarino
Federated Investment Management Company
Donald Ellenberger
Jerome Conner, CFA*
* Effective May 1, 2013, Mr. Connor assumed responsibility for the day-to-day portfolio management of the Fund, replacing Joseph Balestrino.
TCW Investment Management Company
Tad Rivelle
Laird Landmann
Stephen Kane, CFA
| | | | |
Portfolio Breakdown (%) (at August 31, 2013) | | | | |
Asset-Backed Securities — Agency | | | 0.5 | |
Asset-Backed Securities —
Non-Agency | | | 4.8 | |
Commercial Mortgage-Backed Securities — Agency | | | 1.9 | |
Commercial Mortgage-Backed Securities — Non-Agency | | | 4.9 | |
Corporate Bonds & Notes | | | 33.0 | |
Foreign Government Obligations | | | 1.7 | |
Inflation-Indexed Bonds | | | 4.7 | |
Money Market Funds | | | 7.5 | |
Municipal Bonds | | | 1.5 | |
Preferred Debt | | | 0.8 | |
Residential Mortgage-Backed Securities — Agency | | | 21.0 | |
Residential Mortgage-Backed Securities — Non-Agency | | | 5.0 | |
Senior Loans | | | 0.2 | |
Treasury Bills | | | 1.3 | |
U.S. Government & Agency Obligations | | | 1.0 | |
U.S. Treasury Obligations | | | 10.2 | |
Warrants | | | 0.0 | (a) |
Total | | | 100.0 | |
Percentages indicated are based upon total investments. The Fund's portfolio composition is subject to change.
(a) Rounds to zero.
Active Portfolios® Multi-Manager Core Plus Bond Fund is managed by two independent money management firms and by Columbia Management and each invests a portion of the portfolio’s assets. As of August 31, 2013, Federated Investment Management Company (Federated), TCW Investment Management Company (TCW) and Columbia Management Investment Advisers, LLC (Columbia) managed approximately 25%, 41% and 34% of the portfolio, respectively.
For the 12-month period that ended August 31, 2013, the Fund’s Class A shares returned -1.16%. The Fund outperformed its benchmark, the Barclays U.S. Aggregate Bond Index, which returned -2.47% over the same 12-month period. The Fund’s outperformance can be attributed primarily to effective sector allocation.
Fed Policy Shaped Fixed Income Markets
While a number of economic and geopolitical events shaped short-term moves in the fixed income market during the 12-month period ended August 31, 2013, the overriding factor influencing the bond market was Federal Reserve (Fed) policy. In general, the Fed’s policies continued to support risk assets for much of the fiscal period, and all spread (non-U.S. Treasury) sectors outperformed U.S. Treasury securities up to mid-May 2013 when the Fed began discussing a possible reduction of its monthly purchases of U.S. Treasury and mortgage-backed securities. Despite the lack of fundamental changes across asset classes, sectors with the least liquidity and most duration risk, such as long-maturity Treasury inflation protected securities (TIPS), high yield corporate bonds and emerging market bonds, were then hit the hardest, as a changing supply/demand landscape pushed interest rates higher. The result was negative absolute returns across fixed income spread sectors in the last months of the annual period and outperformance of U.S. Treasuries on a duration-adjusted basis.
For the period overall, interest rates rose despite tepid economic growth and declining inflation. Ten-year U.S. Treasury yields rose from 1.55% in August 2012 to 2.79% in August 2013, while short-term rates rose only modestly, anchored by the Fed’s comments implying the targeted federal funds rate would likely not increase until 2015. With the exception of high yield corporate bonds and financial-related corporate bonds, which gained ground, the corporate bond sector declined but still outpaced comparable duration U.S. Treasury securities. Securitized product returns were mixed but also outpaced duration-matched U.S. Treasury securities, with the exception of mortgage-backed securities, which lagged, as the potential for Fed tapering sooner than originally expected drove outsized volatility in the sector. Non-agency mortgage-backed securities outpaced all other fixed income spread sectors, benefiting from improving fundamentals, a shrinking market, little new issuance and an improving housing market. Commercial mortgage-backed securities rallied for most of the period but lagged in the last few months as new issuance outpaced demand. Emerging market bonds were among the weakest performers, as U.S. interest rate volatility, ongoing political unrest in Greece and Egypt and growth concerns for Russia, China and Brazil drove large outflows from the sector.
Allocations to Non-Government Sectors Boosted Returns
Federated: Our portion of the Fund’s portfolio outperformed the benchmark during the period primarily due to effective sector allocation. Duration, yield curve positioning and security selection also contributed positively, albeit more modestly.
| | |
| |
| Active Portfolios® Multi-Manager Core Plus Bond Fund | | |
Manager Discussion of Fund Performance (continued)
Overall, credit was the primary driver of our portion of the Fund’s relative outperformance during the period. Within credit, high yield, investment grade and commercial mortgage-backed securities all added value, although an allocation to longer-maturity corporate positions in the emerging markets detracted from returns, hurt by the global economic slowdown — especially in China. At the sub-sector level, an overweight to finance in corporate bonds added particular value. An underweighted allocation to residential mortgage-backed securities in 2013 (through August 31, 2013) also contributed positively to our portion of the Fund’s results, especially having an underweight to GNMAs.
We actively managed our portion of the Fund’s duration within a range of 80% to 120% of the duration of the benchmark. Duration positioning added value, primarily between June and August 2013 when our portion of the Fund was positioned modestly shorter than that of the benchmark as interest rates rose. Yield curve positioning also boosted relative results, especially a steepening bias implemented in the summer of 2013. The yield curve steepened during the period, meaning the differential in yields between shorter-term and longer-term maturities widened. Having an overweight position in intermediate maturities earlier in the period also helped. Treasury note futures contracts added to total returns over the 12 month period. These trades were made to align our portion of the portfolio’s duration and yield curve positioning with the forecasts of what we call our Alpha Pods. Alpha Pods are our critical decision making tools built around five crucial factors in bond Fund strategy — duration management, sector allocation, yield curve analysis, currency management and security selection.
In terms of security selection, positions in Mass Mutual and Morgan Stanley added to returns. So, too, did having a bias toward lower quality credits. Detracting from results were positions in Barrick Gold, private label mortgage-backed securities issued by Sequoia, and Treasury inflation protected securities (TIPS).
TCW: Our portion of the Fund’s portfolio outperformed the benchmark during the period, predominantly due to its relative overweight allocations to rallying non-government sectors — particularly non-agency mortgage-backed securities and corporate financials.
Non-agency mortgage-backed securities were among the best performing fixed income sectors as solid fundamentals, such as improving roll rates, increased credit burnout and a shorter foreclosure pipeline resulted in strong investor demand. Our portion of the Fund had an emphasis on the higher-returning subprime and option adjustable rate mortgage segments of the sector. Both strong fundamentals (such as capital structure deleveraging) and technicals (such as limited new issuance) for financials led to outperformance for that segment of the investment grade corporate bond sector. Our portion of the Fund was primarily focused on the bonds of money center, deposit-funded banks, which enjoyed price appreciation as a result of deleveraging their balance sheets to the advantage of creditors. An exposure to U.S. dollar-denominated emerging market bonds further benefited returns; these issues held up relatively well amidst global volatility, outpacing duration-matched U.S. Treasury securities for the fiscal period as a whole. Issue selection among asset-backed securities — favoring non-traditional sectors — was another source of positive contribution, as private student loans, shipping containers and collateralized loan obligations benefited from premium yields and tighter spreads to outpace the benchmark’s asset-backed securities. In addition, the defensive duration position of our portion of the Fund, maintained at approximately one year shorter than that of the benchmark throughout the fiscal period, significantly boosted returns as U.S. Treasury rates rose across the yield curve.
| | | | |
Quality Breakdown (%) (at August 31, 2013) | | | | |
AAA rating | | | 49.3 | |
AA rating | | | 4.3 | |
A rating | | | 11.2 | |
BBB rating | | | 20.8 | |
BB rating | | | 5.3 | |
B rating | | | 2.7 | |
CCC rating | | | 2.7 | |
CC rating | | | 1.1 | |
C rating | | | 0.3 | |
D rating | | | 0.8 | |
Not rated | | | 1.5 | |
Total | | | 100.0 | |
Percentages indicated are based upon total fixed income securities (excluding Money Market Funds).
Bond ratings apply to the underlying holdings of the Fund and not the Fund itself and are divided into categories ranging from AAA (highest) to D (lowest), and are subject to change. The ratings shown are determined by using the middle rating of Moody's, S&P, and Fitch after dropping the highest and lowest available ratings. When a rating from only two agencies is available, the lower rating is used. When a rating from only one agency is available, that rating is used. When a bond is not rated by one of these agencies, it is designated as Not rated. Credit ratings are subjective opinions and not statements of fact.
Investment Risks
Asset allocation does not assure a profit or protect against loss. Derivative instruments are financial instruments that have a value dependent on the value of something else, such as one or more underlying securities. Gains or losses may be substantial, because a relatively small price movement in an underlying security may result in a substantial gain or loss. International investing involves increased risk and volatility due to potential political and economic instability, currency fluctuations, and differences in financial reporting and accounting standards and oversight. Risks are particularly significant in emerging markets. There are risks associated with an investment in a bond fund, including credit risk, interest rate risk, and prepayment and extension risk. In general, bond prices rise when interest rates fall and vice versa. See the Fund’s prospectus for information on these and other risks associated with the Fund. This effect is more pronounced for longer-term securities. The Fund should be considered part of an overall investment program, and not a complete investment program.
| | |
| |
| | Active Portfolios® Multi-Manager Core Plus Bond Fund |
Manager Discussion of Fund Performance (continued)
While our portion of the Fund’s overweight to corporate financials was a significant contributor to performance, its allocation to the corporate bond sector was slightly underweight that of the benchmark, which detracted, as corporate bonds significantly outperformed the benchmark for the period. Among commercial mortgage-backed securities, an allocation to higher-quality agency securities detracted from returns as higher-quality issues lagged. A position in agency mortgage-backed securities modestly detracted, as low coupon issues, a focus within our strategy, were outpaced by higher coupon securities. Approximately 14% of our portion of the portfolio’s agency mortgage-backed securities exposure was expressed via generic TBA (to be announced) positions, which detracted from performance during the period due to higher interest rates. A modest allocation to U.S. Treasury securities was a drag on relative results, as yields rose significantly in the sector. Finally, yield curve positioning detracted from our portion of the Fund’s performance. Given significant stimulus over the past several years from the Fed, expectations were for a pick-up in inflation in the intermediate term that would likely push longer-maturity U.S. Treasury rates higher. As a result, our yield curve positioning maintained a modest underweight to the long-term end of the curve in favor of the intermediate, or seven-to-ten-year, segment. During the period, intermediate and long-term rates rose, while yields on shorter maturities declined, resulting in a drag on performance.
Columbia: Our portion of the Fund’s portfolio outperformed the benchmark during the period, as effective sector allocation and issue selection overall contributed positively to relative results.
A sizable allocation to and issue selection in investment grade corporate bonds, which outpaced the benchmark, helped our portion of the Fund’s performance most — particularly an emphasis on financial institutions and securities lower in the capital structure. Exposure to non-agency mortgage-backed securities boosted relative results as well. This sector benefited both from attractive yields and slower prepayment speeds through most of the period, although performance moderated after Fed chair Bernanke’s tapering comments in mid-May 2013 caused investors to pull back. An overweight allocation relative to the benchmark to commercial mortgage-backed securities and an underweighted position in non-corporate sovereign debt added value as well. Eliminating exposure to emerging markets debt and shifting away from high yield corporate debt in late 2012 was positive for performance, as spreads (yield differentials between these securities and U.S. Treasuries) tightened and risk aversion heightened following Bernanke’s comments. Similarly, a shift toward higher credit quality buoyed our portion of the Fund’s results.
Duration and yield curve positioning detracted from our portion of the Fund’s results. A slightly longer duration stance in our portion of the Fund relative to that of the benchmark hurt our portion of the Fund’s results, as interest rates rose during the period overall. Yield curve positioning biased toward a flattening of the yield curve while interest rates rose also detracted from performance, as the two-year to ten-year portion of the curve steepened during the latter part of the period, meaning longer-term yields rose more than shorter-term yields. Additionally, issue selection within the commercial mortgage-backed securities sector detracted from results relative to the benchmark, as our portion of the Fund owned higher-quality commercial mortgage-backed securities during a period when lower-quality commercial mortgage-backed securities outperformed higher-quality tranches.
| | |
| |
| Active Portfolios® Multi-Manager Core Plus Bond Fund | | |
Manager Discussion of Fund Performance (continued)
Fed Policy and Economic Conditions Drove Portfolio Changes
Federated: Broadly speaking, our portion of the Fund transitioned from one geared to modest economic growth to one positioned for a recession from December 2012 through March 2013. Then, we moved back to a portfolio positioned for modest economic growth from April 2013 through the end of the period. These decisions were driven by our Alpha Pods.
During the period, we added a number of high quality municipal securities to the portfolio at historically attractive levels. Issuers included New York City and Minnesota state general obligation bonds, Texas A&M University, Florida State Turnpike Authority and Los Angeles Waste Water System. We reduced the portfolio’s position in intermediate maturity TIPS, which had performed well through the first half of 2013 but then lagged on Fed tapering talk, declining inflation and withdrawals from TIPS mutual funds. We retained a modest position in short-maturity TIPS, which have more attractive inflation break-evens than longer-maturity TIPS. We also reduced our portion of the Fund’s position in Hewlett-Packard due to restructuring charges, significant margin pressures and declining free cash flow.
At the end of August 2013, our portion of the Fund was overweight high yield and investment grade corporate bonds, CMBS and emerging markets debt relative to the benchmark. On the same date, our portion of the Fund was underweight the benchmark in agency mortgage-backed securities, agency securities and U.S. Treasury securities. Our portion of the Fund was positioned modestly short relative to that of the benchmark at the end of the period.
TCW: During the period, we increased exposure to spread, or non-U.S. Treasury, sectors and deployed additional cash contributions. We particularly added exposure across the corporate subsectors, and we established an allocation to foreign agency securities. We also added various high quality non-agency mortgage-backed securities and commercial mortgage-backed securities.
At the end of the period, the low rate regime along the U.S. Treasury curve, offering insufficient compensation for the assumed risk, in our view, led to a substantial underweight in the sector. The underweight in U.S. Treasury securities remained offset by the significant allocation to non-agency mortgage-backed securities, with a preference toward higher-quality, shorter-duration, currently amortizing bonds, as well as floating rate issues given better total return potential and protection from higher interest rates. Holdings in agency mortgage-backed securities moved up in coupon modestly, though we continued to avoid premium coupon issues where prepayment risk remained a concern. Our corporate bond positioning continued to favor financials, which benefit from regulatory limits on leverage and which maintain strong balance sheets versus unrelated industrials. We viewed select commercial mortgage-backed securities and asset-backed securities as a high quality alternative to corporate bonds and, as such, our portion of the Fund’s overweight was maintained among top of the capital structure, super-senior tranches of both seasoned and recent vintage commercial mortgage-backed securities and non-traditional asset-backed securities. Our portion of the Fund’s duration positioning was relatively consistent over the period at approximately one year short that of the benchmark, reflecting an effort to seek protection against elevated inflation risk after extensive Fed stimulus.
Columbia: As indicated earlier, we reduced our portion of the Fund’s exposure to high yield corporate bonds and emerging markets debt in late 2012, prompted by a tightening of spreads. Increasing regulatory capital requirements for U.S. and
| | |
| |
| | Active Portfolios® Multi-Manager Core Plus Bond Fund |
Manager Discussion of Fund Performance (continued)
European banks justified to us our portion of the Fund’s overweight to financial institutions and securities lower in the capital structure within the investment grade corporate bond sector. Also, during the period, with the rise in interest rates, we initiated a shift in coupon exposure within the mortgage-backed securities sector to help manage duration, convexity and expectations. Our portion of the Fund had been overweight higher-coupon mortgage-backed securities relative to the benchmark; as interest rates began to move higher, we shifted toward a more neutral coupon exposure. We improved the credit quality of our portion of the Fund by reducing exposure to commercial mortgage-backed securities and increasing exposure to government-guaranteed debt.
At the end of the period, our portion of the Fund was overweight relative to the benchmark in investment grade corporate bonds, mortgage-backed securities and commercial mortgage-backed securities and was underweight relative to the benchmark in U.S. Treasury securities and U.S. agency securities.
Looking Ahead
Federated: At the end of the period, we had positioned our portion of the Fund for a macroeconomic environment of modest growth. This resulted in a bias for higher interest rates, as over the remainder of 2013, we currently expect interest rates to rise but at a slower pace than seen from May through August 2013. In implementing this bias, we expect to emphasize shorter-duration investments. We also had positioned our portion of the Fund with a significant overweight to the credit sectors. We believe moderate economic growth is the sweet spot for credit, as growth too slow that risks recession would result in wider spreads (yield differentials) while growth too fast would likely pull forward the start of the Fed’s renormalization of the targeted federal funds rate from its current zero interest rate policy.
TCW: Although economic growth remains sluggish, there appears to have been a paradigm shift at the Fed, with more weight given to the risk posed by quantitative easing versus its benefits. Nevertheless, inflation risk remains a concern given extensive stimulus to date. As a result, we intend to maintain a defensive duration profile relative to the benchmark and an underweight to U.S. Treasury securities in our portion of the Fund. Our corporate allocation favors financials given regulatory limits on leverage and attractive valuations. We expect to maintain a significant overweight to non-agency mortgage-backed securities, as it presents, we believe, one of the most attractive domestic fixed income sectors, which should perform well in a wide variety of economic and interest rate scenarios. Also, senior tranches of commercial mortgage-backed securities appear to us to provide good value, and thus we expect to maintain our portion of the Fund’s exposure.
Columbia: At the end of August 2013, we believed the biggest factors likely to affect the fixed income market looking ahead were the pace of economic recovery and the pace of quantitative easing program tapering employed by the Fed. Both factors, in our view, will influence interest rates and the shape of the yield curve. Given this view, we currently intend to hold to a modestly bearish yield curve flattening position in our portion of the Fund and to adjust duration accordingly. At present, we expect our portion of the Fund to remain overweight relative to the benchmark in investment grade corporate bonds, as we continue to look favorably on credit fundamentals. At the same time we highlight the need to be selective, as we believe merger and acquisition activity and other corporate events more friendly to equity holders are anticipated to become more frequent occurrences. All that said, we believe effective sector allocation and issue selection will remain key to Fund performance in the months ahead, and so, as always, we will maintain our disciplined investment strategy.
| | |
| |
| Active Portfolios® Multi-Manager Core Plus Bond Fund | | |
Understanding Your Fund’s Expenses
(Unaudited)
As an investor, you incur two types of costs. There are transaction costs, which generally include sales charges on purchases and may include redemption fees. There are also ongoing costs, which generally include management fees, distribution and service (Rule 12b-1) fees, and other fund expenses. The following information is intended to help you understand your ongoing costs (in dollars) of investing in the Fund and to help you compare these costs with the ongoing costs of investing in other mutual funds.
Analyzing Your Fund’s Expenses
To illustrate these ongoing costs, we have provided examples and calculated the expenses paid by investors in each share class of the Fund during the period. The actual and hypothetical information in the table is based on an initial investment of $1,000 at the beginning of the period indicated and held for the entire period. Expense information is calculated two ways and each method provides you with different information. The amount listed in the “Actual” column is calculated using the Fund’s actual operating expenses and total return for the period. You may use the Actual information, together with the amount invested, to estimate the expenses that you paid over the period. Simply divide your account value by $1,000 (for example, an $8,600 account value divided by $1,000 = 8.6), then multiply the results by the expenses paid during the period under the Actual column. The amount listed in the “Hypothetical” column assumes a 5% annual rate of return before expenses (which is not the Fund’s actual return) and then applies the Fund’s actual expense ratio for the period to the hypothetical return. You should not use the hypothetical account values and expenses to estimate either your actual account balance at the end of the period or the expenses you paid during the period. See “Compare With Other Funds” below for details on how to use the hypothetical data.
Compare With Other Funds
Since all mutual funds are required to include the same hypothetical calculations about expenses in shareholder reports, you can use this information to compare the ongoing cost of investing in the Fund with other funds. To do so, compare the hypothetical example with the 5% hypothetical examples that appear in the shareholder reports of other funds. As you compare hypothetical examples of other funds, it is important to note that hypothetical examples are meant to highlight the ongoing costs of investing in a fund only and do not reflect any transaction costs, such as sales charges, or redemption or exchange fees. Therefore, the hypothetical calculations are useful in comparing ongoing costs only, and will not help you determine the relative total costs of owning different funds. If transaction costs were included in these calculations, your costs would be higher.
March 1, 2013 – August 31, 2013
| | | | | | | | | | | | | | | | | | | | | | | | | | | | |
| | | Account Value at the
Beginning of the
Period ($) | | | Account Value at the
End of the
Period ($) | | | Expenses Paid During
the Period ($) | | | Fund’s Annualized
Expense Ratio (%) | |
| | | | Actual | | | | Hypothetical | | | | Actual | | | | Hypothetical | | | | Actual | | | | Hypothetical | | | | Actual | |
Class A | | | 1,000.00 | | | | 1,000.00 | | | | 971.20 | | | | 1,021.06 | | | | 3.95 | | | | 4.05 | | | | 0.80 | |
Expenses paid during the period are equal to the annualized expense ratio for each class as indicated above, multiplied by the average account value over the period and then multiplied by the number of days in the Fund's most recent fiscal half year and divided by 365.
Expenses do not include fees and expenses incurred indirectly by the Fund from the underlying funds in which the Fund may invest (also referred to as "acquired funds"), including affiliated and non-affiliated pooled investment vehicles (including mutual funds and exchange-traded funds).
Class A shares of the Fund are available only to certain eligible investors through certain wrap fee programs sponsored and/or managed by Ameriprise Financial, Inc. or its affiliates. Fund shares are sold in accordance with the terms of the account through which you invest in the Fund. Participants in wrap fee programs pay an asset-based fee that is not included in the above table. Please read the wrap program documents for information regarding fees charged.
| | |
| |
| | Active Portfolios® Multi-Manager Core Plus Bond Fund |
Portfolio of Investments
August 31, 2013
(Percentages represent value of investments compared to net assets)
| | | | | | | | | | | | |
| Corporate Bonds & Notes 35.5% | |
| Issuer | | Coupon
Rate | | | Principal
Amount ($) | | | Value ($) | |
| | | | | | | | | | |
Aerospace & Defense 0.2% | | | | | |
ADS Tactical, Inc.
Senior Secured(a) | | | | | |
04/01/18 | | | 11.000% | | | | 283,000 | | | | 266,020 | |
| |
B/E Aerospace, Inc.
Senior Unsecured | | | | | |
04/01/22 | | | 5.250% | | | | 550,000 | | | | 544,500 | |
| |
Bombardier, Inc.(a)
Senior Notes | | | | | |
01/15/16 | | | 4.250% | | | | 95,000 | | | | 98,206 | |
01/15/23 | | | 6.125% | | | | 41,000 | | | | 40,077 | |
| |
Embraer SA
Senior Unsecured | | | | | |
06/15/22 | | | 5.150% | | | | 1,950,000 | | | | 1,940,250 | |
| |
FGI Operating Co. LLC/Finance, Inc.
Secured(a) | | | | | |
05/01/20 | | | 7.875% | | | | 450,000 | | | | 462,375 | |
| |
Huntington Ingalls Industries, Inc. | | | | | |
03/15/18 | | | 6.875% | | | | 124,000 | | | | 133,610 | |
| |
Kratos Defense & Security Solutions, Inc.
Senior Secured | | | | | |
06/01/17 | | | 10.000% | | | | 117,000 | | | | 126,360 | |
| |
L-3 Communications Corp. | | | | | |
02/15/21 | | | 4.950% | | | | 2,045,000 | | | | 2,148,925 | |
| |
Lockheed Martin Corp.
Senior Unsecured | | | | | |
09/15/21 | | | 3.350% | | | | 965,000 | | | | 954,997 | |
| |
TransDigm, Inc. | | | | | |
12/15/18 | | | 7.750% | | | | 350,000 | | | | 374,500 | |
10/15/20 | | | 5.500% | | | | 83,000 | | | | 80,925 | |
| |
TransDigm, Inc.(a) | | | | | |
07/15/21 | | | 7.500% | | | | 376,000 | | | | 397,620 | |
| | | | | | | | | | | | | |
Total | | | | 7,568,365 | |
| | | |
| | | | | | | | | | | | |
Airlines 1.0% | | | | | |
American Airlines Pass-Through Trust
Series 2013-2 Class A(a) | | | | | |
01/15/23 | | | 4.950% | | | | 7,500,000 | | | | 7,453,125 | |
| |
Continental Airlines Pass-Through Trust
Pass-Through Certificates
Series 1997-4 Class A | | | | | |
01/02/18 | | | 6.900% | | | | 865,136 | | | | 901,905 | |
Series 1999-1 Class A | |
08/02/20 | | | 6.545% | | | | 3,552,519 | | | | 3,836,720 | |
Series 2007-1 Class A | |
04/19/22 | | | 5.983% | | | | 5,491,561 | | | | 5,848,512 | |
| |
Delta Air Lines Pass-Through Trust
Pass-Through Certificates | | | | | |
01/02/23 | | | 6.718% | | | | 3,715,613 | | | | 4,031,440 | |
| |
JetBlue Airways Pass-Through Trust
Pass-Through Certificates
Series 2004-2 Class G-2(b) | | | | | |
05/15/18 | | | 0.714% | | | | 5,910,000 | | | | 5,324,910 | |
| | | | | | | | | | | | |
| Corporate Bonds & Notes (continued) | |
| Issuer | | Coupon
Rate | | | Principal
Amount ($) | | | Value ($) | |
| | | | | | | | | | |
Southwest Airlines Co.
Senior Unsecured | | | | | |
03/01/17 | | | 5.125% | | | | 5,000,000 | | | | 5,379,085 | |
| |
U.S. Airways Pass-Through Trust
Pass-Through Certificates | | | | | |
12/03/26 | | | 4.625% | | | | 4,425,000 | | | | 4,281,188 | |
Series 2012-1 Class A | |
04/01/26 | | | 5.900% | | | | 3,992,793 | | | | 4,182,451 | |
| | | | | | | | | | | | | |
Total | | | | 41,239,336 | |
| | | |
| | | | | | | | | | | | |
Automotive 1.6% | | | | | |
Affinia Group, Inc.(a) | | | | | |
05/01/21 | | | 7.750% | | | | 325,000 | | | | 333,938 | |
| |
Allison Transmission, Inc.(a) | | | | | |
05/15/19 | | | 7.125% | | | | 371,000 | | | | 393,260 | |
| |
American Axle & Manufacturing, Inc. | | | | | |
11/15/19 | | | 7.750% | | | | 350,000 | | | | 385,000 | |
03/15/21 | | | 6.250% | | | | 131,000 | | | | 133,293 | |
10/15/22 | | | 6.625% | | | | 325,000 | | | | 332,313 | |
| |
American Honda Finance Corp.
Senior Unsecured(a) | | | | | |
10/01/18 | | | 7.625% | | | | 2,250,000 | | | | 2,797,580 | |
| |
Chrysler Group LLC/Co-Issuer, Inc.
Secured | | | | | |
06/15/19 | | | 8.000% | | | | 167,000 | | | | 181,404 | |
06/15/21 | | | 8.250% | | | | 200,000 | | | | 219,500 | |
| |
Daimler Finance North America LLC(a) | | | | | |
01/11/17 | | | 2.950% | | | | 8,000,000 | | | | 8,237,728 | |
01/11/18 | | | 1.875% | | | | 2,000,000 | | | | 1,962,742 | |
| |
Dana Holding Corp.
Senior Unsecured | | | | | |
02/15/21 | | | 6.750% | | | | 104,000 | | | | 110,500 | |
| |
Delphi Corp. | | | | | |
02/15/23 | | | 5.000% | | | | 95,000 | | | | 96,544 | |
| |
Exide Technologies
Senior Secured(c) | | | | | |
02/01/18 | | | 8.625% | | | | 225,000 | | | | 155,250 | |
| |
Ford Motor Co.
Senior Unsecured | | | | | |
08/01/18 | | | 6.500% | | | | 1,975,000 | | | | 2,242,010 | |
02/01/29 | | | 6.375% | | | | 1,990,000 | | | | 2,146,591 | |
07/16/31 | | | 7.450% | | | | 1,502,000 | | | | 1,810,177 | |
01/15/43 | | | 4.750% | | | | 5,000,000 | | | | 4,420,125 | |
11/01/46 | | | 7.400% | | | | 1,295,000 | | | | 1,542,705 | |
| |
Ford Motor Credit Co. LLC
Senior Unsecured | | | | | |
04/15/16 | | | 4.207% | | | | 1,455,000 | | | | 1,523,897 | |
05/09/16 | | | 1.700% | | | | 5,000,000 | | | | 4,937,010 | |
06/15/16 | | | 3.984% | | | | 8,437,000 | | | | 8,808,506 | |
06/12/17 | | | 3.000% | | | | 1,600,000 | | | | 1,612,045 | |
09/20/22 | | | 4.250% | | | | 1,100,000 | | | | 1,071,831 | |
| |
General Motors Financial Co., Inc.(a)
Senior Unsecured | | | | | |
05/15/18 | | | 3.250% | | | | 27,000 | | | | 25,920 | |
05/15/23 | | | 4.250% | | | | 39,000 | | | | 35,100 | |
The accompanying Notes to Financial Statements are an integral part of this statement.
| | |
| |
| Active Portfolios® Multi-Manager Core Plus Bond Fund | | |
Portfolio of Investments (continued)
August 31, 2013
| | | | | | | | | | | | |
| Corporate Bonds & Notes (continued) | |
| Issuer | | Coupon
Rate | | | Principal
Amount ($) | | | Value ($) | |
| | | | | | | | | | |
Harley-Davidson Financial Services, Inc.(a) | | | | | |
03/15/17 | | | 2.700% | | | | 1,380,000 | | | | 1,387,515 | |
| |
Hyundai Capital America(a) | | | | | |
08/09/18 | | | 2.875% | | | | 1,250,000 | | | | 1,243,584 | |
| |
Hyundai Capital Services, Inc.
Senior Unsecured(a) | | | | | |
07/27/16 | | | 4.375% | | | | 2,000,000 | | | | 2,118,034 | |
| |
IDQ Holdings, Inc.
Senior Secured(a) | | | | | |
04/01/17 | | | 11.500% | | | | 250,000 | | | | 276,875 | |
| |
International Automotive Components Group SA Secured(a) | | | | | |
06/01/18 | | | 9.125% | | | | 250,000 | | | | 255,000 | |
| |
JB Poindexter & Co., Inc.
Senior Unsecured(a) | | | | | |
04/01/22 | | | 9.000% | | | | 250,000 | | | | 262,500 | |
| |
Jaguar Land Rover Automotive PLC(a) | | | | | |
05/15/21 | | | 8.125% | | | | 425,000 | | | | 472,281 | |
02/01/23 | | | 5.625% | | | | 140,000 | | | | 134,750 | |
| |
Lear Corp.(a) | | | | | |
01/15/23 | | | 4.750% | | | | 500,000 | | | | 467,500 | |
| |
Nissan Motor Acceptance Corp.
Senior Unsecured(a) | | | | | |
09/12/17 | | | 1.950% | | | | 2,500,000 | | | | 2,463,035 | |
| |
Pittsburgh Glass Works LLC
Senior Secured(a) | | | | | |
04/15/16 | | | 8.500% | | | | 250,000 | | | | 258,125 | |
| |
RCI Banque SA(a)
Senior Unsecured | | | | | |
04/12/16 | | | 4.600% | | | | 1,120,000 | | | | 1,174,320 | |
04/03/18 | | | 3.500% | | | | 4,000,000 | | | | 3,988,480 | |
| |
Schaeffler Finance BV
Senior Secured(a) | | | | | |
02/15/19 | | | 8.500% | | | | 583,000 | | | | 655,146 | |
| |
Schaeffler Holding Finance BV
Senior Secured PIK(a) | | | | | |
08/15/18 | | | 6.875% | | | | 576,000 | | | | 602,195 | |
| |
UCI International, Inc. | | | | | |
02/15/19 | | | 8.625% | | | | 625,000 | | | | 640,625 | |
| |
Visteon Corp. | | | | | |
04/15/19 | | | 6.750% | | | | 211,000 | | | | 223,660 | |
| | | | | | | | | | | | | |
Total | | | | 62,138,594 | |
| | | |
| | | | | | | | | | | | |
Banking 6.7% | | | | | | | | | | | | |
Abbey National Treasury Services PLC Bank Guaranteed(a) | | | | | |
11/10/14 | | | 3.875% | | | | 2,375,000 | | | | 2,446,891 | |
| | | |
Ally Financial, Inc. | | | | | | | | | | | | |
07/18/16 | | | 3.500% | | | | 625,000 | | | | 628,906 | |
02/15/17 | | | 5.500% | | | | 225,000 | | | | 237,179 | |
12/01/17 | | | 6.250% | | | | 325,000 | | | | 348,492 | |
03/15/20 | | | 8.000% | | | | 608,000 | | | | 699,960 | |
| | | | | | | | | | | | |
| Corporate Bonds & Notes (continued) | |
| Issuer | | Coupon
Rate | | | Principal
Amount ($) | | | Value ($) | |
| | | | | | | | | | |
BNP Paribas SA(a)(b) | | | | | | | | | | | | |
06/29/49 | | | 5.186% | | | | 600,000 | | | | 593,250 | |
| | | |
Banco Bradesco SA
Subordinated Notes | | | | | | | | | | | | |
01/16/21 | | | 5.900% | | | | 100,000 | | | | 96,500 | |
| |
Banco Santander SA
Senior Unsecured(a) | | | | | |
11/09/22 | | | 4.125% | | | | 200,000 | | | | 181,500 | |
| |
Bank of America Corp.
Senior Unsecured | | | | | |
09/01/15 | | | 3.700% | | | | 5,640,000 | | | | 5,889,773 | |
01/11/18 | | | 2.000% | | | | 4,000,000 | | | | 3,882,940 | |
01/24/22 | | | 5.700% | | | | 4,800,000 | | | | 5,297,448 | |
01/11/23 | | | 3.300% | | | | 10,859,000 | | | | 10,038,407 | |
| |
Bank of America NA
Subordinated Notes(b) | | | | | |
06/15/16 | | | 0.553% | | | | 1,760,000 | | | | 1,715,495 | |
| |
Bank of Montreal
Senior Unsecured | | | | | |
04/09/18 | | | 1.450% | | | | 750,000 | | | | 726,904 | |
11/06/22 | | | 2.550% | | | | 4,865,000 | | | | 4,458,490 | |
| |
Bank of New York Mellon Corp. (The)
Senior Unsecured | | | | | |
05/15/19 | | | 5.450% | | | | 800,000 | | | | 914,574 | |
| |
Bank of New York Mellon Corp. (The)(b) | | | | | |
12/29/49 | | | 4.500% | | | | 4,110,000 | | | | 3,657,900 | |
| |
Barclays Bank PLC(a)(b) | | | | | |
09/29/49 | | | 7.434% | | | | 6,184,000 | | | | 6,647,800 | |
| |
Barclays Bank PLC(b) | | | | | |
12/15/49 | | | 6.278% | | | | 2,520,000 | | | | 2,318,400 | |
| |
Citigroup, Inc.
Senior Unsecured | | | | | |
01/10/17 | | | 4.450% | | | | 1,000,000 | | | | 1,076,644 | |
08/15/17 | | | 6.000% | | | | 4,000,000 | | | | 4,527,916 | |
05/15/18 | | | 6.125% | | | | 6,500,000 | | | | 7,457,326 | |
08/09/20 | | | 5.375% | | | | 10,000,000 | | | | 11,086,540 | |
Subordinated Notes | | | | | |
08/25/36 | | | 6.125% | | | | 3,175,000 | | | | 3,182,718 | |
| |
Citigroup, Inc.(b)
Senior Unsecured | | | | | |
07/25/16 | | | 1.226% | | | | 3,000,000 | | | | 3,013,644 | |
05/15/18 | | | 1.964% | | | | 2,275,000 | | | | 2,361,389 | |
| |
Commonwealth Bank of Australia
Senior Unsecured(a) | | | | | |
10/15/14 | | | 3.750% | | | | 1,000,000 | | | | 1,034,500 | |
|
Cooperatieve Centrale Raiffeisen-Boerenleenbank BA(a)(b) | |
12/31/49 | | | 11.000% | | | | 460,000 | | | | 595,125 | |
| |
Credit Agricole SA(a)(b) | | | | | |
12/31/49 | | | 8.375% | | | | 3,965,000 | | | | 4,321,850 | |
| |
Discover Bank
Senior Unsecured | | | | | |
02/21/18 | | | 2.000% | | | | 680,000 | | | | 658,235 | |
The accompanying Notes to Financial Statements are an integral part of this statement.
| | |
| |
| | Active Portfolios® Multi-Manager Core Plus Bond Fund |
Portfolio of Investments (continued)
August 31, 2013
| | | | | | | | | | | | |
| Corporate Bonds & Notes (continued) | |
| Issuer | | Coupon
Rate | | | Principal
Amount ($) | | | Value ($) | |
| | | | | | | | | | |
Goldman Sachs Group, Inc. (The)
Senior Unsecured | | | | | |
05/03/15 | | | 3.300% | | | | 1,670,000 | | | | 1,728,515 | |
01/18/18 | | | 5.950% | | | | 4,000,000 | | | | 4,474,916 | |
04/01/18 | | | 6.150% | | | | 4,810,000 | | | | 5,437,907 | |
07/19/18 | | | 2.900% | | | | 2,200,000 | | | | 2,195,575 | |
01/24/22 | | | 5.750% | | | | 2,500,000 | | | | 2,745,615 | |
| |
Grupo Aval Ltd.(a) | | | | | |
09/26/22 | | | 4.750% | | | | 3,000,000 | | | | 2,632,500 | |
| |
HBOS Capital Funding LP(a)(b) | | | | | |
12/31/49 | | | 6.071% | | | | 420,000 | | | | 404,775 | |
| |
HBOS PLC(a)
Subordinated Notes | | | | | |
05/21/18 | | | 6.750% | | | | 13,270,000 | | | | 14,507,481 | |
11/01/33 | | | 6.000% | | | | 5,600,000 | | | | 5,329,240 | |
| |
HSBC USA, Inc.
Senior Unsecured | | | | | |
01/16/18 | | | 1.625% | | | | 6,000,000 | | | | 5,818,698 | |
| |
ICICI Bank Ltd.
Senior Unsecured | | | | | |
11/25/16 | | | 4.750% | | | | 200,000 | | | | 201,332 | |
11/16/20 | | | 5.750% | | | | 200,000 | | | | 194,263 | |
| |
Industrial Senior Trust(a) | | | | | |
11/01/22 | | | 5.500% | | | | 5,000,000 | | | | 4,500,000 | |
| |
JPMorgan Chase & Co.
Senior Unsecured | | | | | |
01/15/18 | | | 6.000% | | | | 1,400,000 | | | | 1,601,995 | |
04/23/19 | | | 6.300% | | | | 5,000,000 | | | | 5,810,450 | |
10/15/20 | | | 4.250% | | | | 2,000,000 | | | | 2,084,796 | |
01/24/22 | | | 4.500% | | | | 1,000,000 | | | | 1,037,517 | |
09/23/22 | | | 3.250% | | | | 2,235,000 | | | | 2,092,675 | |
Subordinated Notes | | | | | |
05/01/23 | | | 3.375% | | | | 1,000,000 | | | | 908,300 | |
| |
JPMorgan Chase Bank NA
Subordinated Notes | | | | | |
10/01/17 | | | 6.000% | | | | 2,605,000 | | | | 2,958,303 | |
| |
JPMorgan Chase Bank NA(b)
Subordinated Notes | | | | | |
06/13/16 | | | 0.602% | | | | 1,500,000 | | | | 1,476,286 | |
| |
JPMorgan Chase Capital XXI(b) | | | | | |
02/02/37 | | | 1.216% | | | | 28,154,000 | | | | 21,115,500 | |
| |
JPMorgan Chase Capital XXIII(b) | | | | | |
05/15/47 | | | 1.264% | | | | 7,120,000 | | | | 5,268,800 | |
| |
Lloyds Banking Group PLC(a)(b) | | | | | |
11/29/49 | | | 6.267% | | | | 2,900,000 | | | | 2,479,500 | |
12/31/49 | | | 6.413% | | | | 1,490,000 | | | | 1,318,650 | |
12/31/49 | | | 6.657% | | | | 1,318,000 | | | | 1,192,790 | |
| |
M&T Bank Corp.(a) | | | | | |
12/31/49 | | | 6.875% | | | | 6,429,000 | | | | 6,495,559 | |
| |
Macquarie Bank Ltd.
Subordinated Notes(a) | | | | | |
04/07/21 | | | 6.625% | | | | 1,860,000 | | | | 2,000,138 | |
| |
Mellon Capital IV(b) | | | | | |
06/29/49 | | | 4.000% | | | | 250,000 | | | | 215,000 | |
| | | | | | | | | | | | |
| Corporate Bonds & Notes (continued) | |
| Issuer | | Coupon
Rate | | | Principal
Amount ($) | | | Value ($) | |
| | | | | | | | | | |
Merrill Lynch & Co., Inc.
Subordinated Notes | | | | | |
05/02/17 | | | 5.700% | | | | 2,120,000 | | | | 2,306,278 | |
| |
Morgan Stanley
Senior Unsecured | | | | | |
03/22/17 | | | 4.750% | | | | 4,000,000 | | | | 4,291,324 | |
08/28/17 | | | 6.250% | | | | 1,600,000 | | | | 1,806,976 | |
07/24/42 | | | 6.375% | | | | 6,300,000 | | | | 6,999,426 | |
Subordinated Notes | | | | | |
05/22/23 | | | 4.100% | | | | 1,220,000 | | | | 1,118,661 | |
| |
National Australia Bank Ltd.
Senior Unsecured | | | | | |
08/07/15 | | | 1.600% | | | | 1,250,000 | | | | 1,269,434 | |
03/09/17 | | | 2.750% | | | | 4,000,000 | | | | 4,098,828 | |
| |
Natixis(a)(b) | | | | | |
12/31/49 | | | 10.000% | | | | 695,000 | | | | 785,350 | |
| |
Northern Trust Corp.
Senior Unsecured | | | | | |
05/01/14 | | | 4.625% | | | | 1,000,000 | | | | 1,028,454 | |
| |
PNC Financial Services Group, Inc. (The)(b) | | | | | |
05/29/49 | | | 4.483% | | | | 4,830,000 | | | | 4,817,925 | |
| |
RBS Citizens Financial Group, Inc.
Subordinated Notes(a) | | | | | |
09/28/22 | | | 4.150% | | | | 2,000,000 | | | | 1,914,280 | |
| |
Rabobank Capital Funding Trust III(a)(b) | | | | | |
12/31/49 | | | 5.254% | | | | 280,000 | | | | 284,200 | |
| |
Royal Bank of Scotland Group PLC
Senior Unsecured | | | | | |
09/18/15 | | | 2.550% | | | | 7,000,000 | | | | 7,136,437 | |
| |
Santander Holdings USA, Inc.
Senior Unsecured | | | | | |
08/27/18 | | | 3.450% | | | | 4,829,000 | | | | 4,891,338 | |
| |
Societe Generale SA
Subordinated Notes(b) | | | | | |
12/31/49 | | | 6.625% | | | | 2,241,000 | | | | 2,265,248 | |
| |
State Street Capital Trust IV(b) | | | | | |
06/01/67 | | | 1.273% | | | | 2,777,000 | | | | 2,249,370 | |
| |
State Street Corp. | | | | | |
03/15/18 | | | 4.956% | | | | 6,595,000 | | | | 7,202,835 | |
| |
Synovus Financial Corp.
Senior Unsecured | | | | | |
02/15/19 | | | 7.875% | | | | 131,000 | | | | 150,322 | |
| |
U.S. Bancorp
Subordinated Notes | | | | | |
07/15/22 | | | 2.950% | | | | 3,267,000 | | | | 3,052,806 | |
| |
UBS Preferred Funding Trust V(b) | | | | | |
05/29/49 | | | 6.243% | | | | 560,000 | | | | 589,400 | |
| |
Vesey Street Investment Trust 1(b) | | | | | |
09/01/16 | | | 4.404% | | | | 480,000 | | | | 518,625 | |
| |
Wachovia Capital Trust III(b) | | | | | |
03/29/49 | | | 5.570% | | | | 5,645,000 | | | | 5,334,525 | |
| |
Wells Fargo Capital X | | | | | |
12/15/36 | | | 5.950% | | | | 1,860,000 | | | | 1,785,624 | |
The accompanying Notes to Financial Statements are an integral part of this statement.
| | |
| |
| Active Portfolios® Multi-Manager Core Plus Bond Fund | | |
Portfolio of Investments (continued)
August 31, 2013
| | | | | | | | | | | | |
| Corporate Bonds & Notes (continued) | |
| Issuer | | Coupon
Rate | | | Principal
Amount ($) | | | Value ($) | |
| | | | | | | | | | |
Westpac Banking Corp.
Senior Unsecured | | | | | |
11/19/19 | | | 4.875% | | | | 1,200,000 | | | | 1,335,284 | |
| |
Yapi ve Kredi Bankasi AS
Subordinated Notes(a) | | | | | |
12/06/22 | | | 5.500% | | | | 3,000,000 | | | | 2,490,000 | |
| | | | | | | | | | | | | |
Total | | | | | | | | | | | 268,046,722 | |
| | | |
| | | | | | | | | | | | |
Brokerage 0.4% | |
Cantor Fitzgerald LP(a) | |
10/15/19 | | | 7.875% | | | | 1,600,000 | | | | 1,640,938 | |
|
E*TRADE Financial Corp.
Senior Unsecured | |
11/15/19 | | | 6.375% | | | | 186,000 | | | | 195,300 | |
|
Janus Capital Group, Inc.
Senior Unsecured | |
06/15/17 | | | 6.700% | | | | 1,000,000 | | | | 1,112,717 | |
|
Jefferies Group LLC
Senior Unsecured | |
07/15/19 | | | 8.500% | | | | 2,800,000 | | | | 3,392,575 | |
01/20/23 | | | 5.125% | | | | 1,000,000 | | | | 1,003,329 | |
01/20/43 | | | 6.500% | | | | 600,000 | | | | 603,479 | |
|
Legg Mason, Inc.
Senior Unsecured | |
05/21/19 | | | 5.500% | | | | 580,000 | | | | 622,737 | |
|
Neuberger Berman Group LLC/Finance Corp.
Senior Unsecured(a) | |
03/15/22 | | | 5.875% | | | | 300,000 | | | | 306,750 | |
|
Nuveen Investments, Inc.
Senior Unsecured(a) | |
10/15/20 | | | 9.500% | | | | 650,000 | | | | 638,625 | |
|
Raymond James Financial, Inc.
Senior Unsecured | |
04/15/16 | | | 4.250% | | | | 3,345,000 | | | | 3,526,168 | |
|
TD Ameritrade Holding Corp. | |
12/01/14 | | | 4.150% | | | | 1,000,000 | | | | 1,043,447 | |
| | | | | | | | | | | | | |
Total | | | | 14,086,065 | |
| | | |
| | | | | | | | | | | | |
Building Materials 0.2% | |
American Builders & Contractors Supply Co., Inc.
Senior Unsecured(a) | |
04/15/21 | | | 5.625% | | | | 170,000 | | | | 164,900 | |
|
Building Materials Corp. of America(a) | |
03/15/20 | | | 7.500% | | | | 300,000 | | | | 318,000 | |
|
Cemex Espana SA
Senior Secured(a) | |
04/30/19 | | | 9.875% | | | | 1,000,000 | | | | 1,082,500 | |
|
Gibraltar Industries, Inc.(a) | |
02/01/21 | | | 6.500% | | | | 56,000 | | | | 56,840 | |
|
HD Supply, Inc. Secured | |
04/15/20 | | | 11.000% | | | | 105,000 | | | | 125,475 | |
| | | | | | | | | | | | |
| Corporate Bonds & Notes (continued) | |
| Issuer | | Coupon
Rate | | | Principal
Amount ($) | | | Value ($) | |
| | | | | | | | | | |
HD Supply, Inc.(a)
Senior Unsecured | |
07/15/20 | | | 7.500% | | | | 85,000 | | | | 88,825 | |
|
Masco Corp.
Senior Unsecured | |
04/15/18 | | | 6.625% | | | | 600,000 | | | | 658,500 | |
03/15/22 | | | 5.950% | | | | 3,000,000 | | | | 3,135,000 | |
|
Masonite International Corp.(a) | |
04/15/21 | | | 8.250% | | | | 300,000 | | | | 327,000 | |
|
Norcraft Companies LP/Finance Corp.
Secured | |
12/15/15 | | | 10.500% | | | | 428,000 | | | | 446,190 | |
|
Nortek, Inc. | |
12/01/18 | | | 10.000% | | | | 32,000 | | | | 35,040 | |
04/15/21 | | | 8.500% | | | | 816,000 | | | | 883,320 | |
|
Odebrecht Finance Ltd.(a) | |
06/26/22 | | | 5.125% | | | | 300,000 | | | | 285,000 | |
|
Ply Gem Industries, Inc. | |
04/15/17 | | | 9.375% | | | | 30,000 | | | | 31,575 | |
Senior Secured | |
02/15/18 | | | 8.250% | | | | 358,000 | | | | 383,060 | |
|
RSI Home Products, Inc.
Secured(a) | |
03/01/18 | | | 6.875% | | | | 300,000 | | | | 311,250 | |
|
Roofing Supply Group LLC/Finance, Inc.(a) | |
06/01/20 | | | 10.000% | | | | 250,000 | | | | 273,750 | |
| | | | | | | | | | | | | |
Total | | | | 8,606,225 | |
| | | |
| | | | | | | | | | | | |
Chemicals 0.4% | |
Ashland, Inc.(a) | |
08/15/22 | | | 4.750% | | | | 358,000 | | | | 334,730 | |
Senior Unsecured | | | | | | | | | | | | |
04/15/18 | | | 3.875% | | | | 50,000 | | | | 49,250 | |
|
Axiell Corp.(a) | |
05/15/23 | | | 4.875% | | | | 50,000 | | | | 46,375 | |
|
Braskem Finance Ltd. | |
04/15/21 | | | 5.750% | | | | 250,000 | | | | 234,688 | |
|
Celanese U.S. Holdings LLC | |
06/15/21 | | | 5.875% | | | | 151,000 | | | | 154,775 | |
11/15/22 | | | 4.625% | | | | 43,000 | | | | 39,775 | |
|
Chemtura Corp. | |
07/15/21 | | | 5.750% | | | | 200,000 | | | | 197,500 | |
|
Dow Chemical Co. (The)
Senior Unsecured | |
05/15/19 | | | 8.550% | | | | 500,000 | | | | 636,189 | |
|
Eagle Spinco, Inc.(a) | |
02/15/21 | | | 4.625% | | | | 225,000 | | | | 211,500 | |
|
Hexion U.S. Finance Corp./Nova Scotia ULC
Secured | |
11/15/20 | | | 9.000% | | | | 250,000 | | | | 247,500 | |
Senior Secured | |
02/01/18 | | | 8.875% | | | | 575,000 | | | | 587,937 | |
The accompanying Notes to Financial Statements are an integral part of this statement.
| | |
| |
| | Active Portfolios® Multi-Manager Core Plus Bond Fund |
Portfolio of Investments (continued)
August 31, 2013
| | | | | | | | | | | | |
| Corporate Bonds & Notes (continued) | |
| Issuer | | Coupon
Rate | | | Principal
Amount ($) | | | Value ($) | |
| | | | | | | | | | |
Huntsman International LLC | |
11/15/20 | | | 4.875% | | | | 90,000 | | | | 85,725 | |
|
Incitec Pivot Finance LLC(a) | |
12/10/19 | | | 6.000% | | | | 1,000,000 | | | | 1,087,973 | |
|
JM Huber Corp.
Senior Notes(a) | |
11/01/19 | | | 9.875% | | | | 213,000 | | | | 238,294 | |
|
Lubrizol Corp. | |
02/01/19 | | | 8.875% | | | | 1,166,000 | | | | 1,523,945 | |
|
LyondellBasell Industries NV
Senior Unsecured | |
04/15/19 | | | 5.000% | | | | 1,555,000 | | | | 1,700,385 | |
11/15/21 | | | 6.000% | | | | 5,140,000 | | | | 5,829,181 | |
|
Mexichem SAB de CV
Senior Unsecured(a) | |
09/19/22 | | | 4.875% | | | | 300,000 | | | | 282,750 | |
|
Momentive Performance Materials, Inc.
Senior Secured | |
10/15/20 | | | 8.875% | | | | 160,000 | | | | 166,400 | |
10/15/20 | | | 10.000% | | | | 29,000 | | | | 29,943 | |
|
NOVA Chemicals Corp.
Senior Unsecured(a) | |
08/01/23 | | | 5.250% | | | | 72,000 | | | | 71,820 | |
|
Omnova Solutions, Inc. | |
11/01/18 | | | 7.875% | | | | 250,000 | | | | 262,500 | |
|
PQ Corp.
Secured(a) | |
05/01/18 | | | 8.750% | | | | 401,000 | | | | 421,050 | |
|
Rentech Nitrogen Partners LP/Finance Corp.
Secured(a) | |
04/15/21 | | | 6.500% | | | | 150,000 | | | | 147,000 | |
|
U.S. Coatings Acquisition, Inc./Axalta Coating Systems
Dutch Holding B BV(a) | |
05/01/21 | | | 7.375% | | | | 617,000 | | | | 633,967 | |
| | | | | | | | | | | | | |
Total | | | | 15,221,152 | |
| | | |
| | | | | | | | | | | | |
Construction Machinery 0.1% | |
CNH Capital LLC | |
04/15/18 | | | 3.625% | | | | 104,000 | | | | 101,920 | |
|
Case New Holland, Inc. | |
12/01/17 | | | 7.875% | | | | 205,000 | | | | 235,750 | |
|
Caterpillar, Inc.
Senior Unsecured | |
06/26/22 | | | 2.600% | | | | 1,675,000 | | | | 1,555,596 | |
|
Columbus McKinnon Corp. | |
02/01/19 | | | 7.875% | | | | 113,000 | | | | 118,650 | |
|
H&E Equipment Services, Inc. | |
09/01/22 | | | 7.000% | | | | 28,000 | | | | 29,750 | |
|
Neff Rental LLC/Finance Corp.
Secured(a) | |
05/15/16 | | | 9.625% | | | | 263,000 | | | | 278,780 | |
| | | | | | | | | | | | |
| Corporate Bonds & Notes (continued) | |
| Issuer | | Coupon
Rate | | | Principal
Amount ($) | | | Value ($) | |
| | | | | | | | | | |
United Rentals North America, Inc. | |
12/15/19 | | | 9.250% | | | | 187,000 | | | | 209,674 | |
09/15/20 | | | 8.375% | | | | 525,000 | | | | 574,875 | |
04/15/22 | | | 7.625% | | | | 188,000 | | | | 202,100 | |
Secured | |
07/15/18 | | | 5.750% | | | | 139,000 | | | | 148,382 | |
| | | | | | | | | | | | | |
Total | | | | 3,455,477 | |
| | | |
| | | | | | | | | | | | |
Consumer Cyclical Services 0.1% | |
Corrections Corp. of America | |
05/01/23 | | | 4.625% | | | | 81,000 | | | | 75,330 | |
|
Expedia, Inc. | |
08/15/20 | | | 5.950% | | | | 1,380,000 | | | | 1,435,632 | |
|
GNET Escrow Corp.
Senior Secured(a) | |
07/01/18 | | | 12.125% | | | | 70,000 | | | | 74,550 | |
|
Garda World Security Corp.
Senior Unsecured(a) | |
03/15/17 | | | 9.750% | | | | 600,000 | | | | 637,320 | |
|
Goodman Networks, Inc.
Senior Secured(a) | |
07/01/18 | | | 13.125% | | | | 91,000 | | | | 96,460 | |
|
MasTec, Inc. | |
03/15/23 | | | 4.875% | | | | 75,000 | | | | 69,563 | |
|
Monitronics International, Inc. | |
04/01/20 | | | 9.125% | | | | 365,000 | | | | 376,862 | |
|
Monitronics International, Inc.(a)
Senior Unsecured | |
04/01/20 | | | 9.125% | | | | 98,000 | | | | 101,430 | |
|
Service Corp., International
Senior Unsecured(a) | |
01/15/22 | | | 5.375% | | | | 60,000 | | | | 58,275 | |
|
ServiceMaster Co. (The) | |
02/15/20 | | | 8.000% | | | | 775,000 | | | | 741,094 | |
|
ServiceMaster Co. | |
08/15/20 | | | 7.000% | | | | 200,000 | | | | 183,000 | |
|
Vivint, Inc.(a)
Senior Secured | |
12/01/19 | | | 6.375% | | | | 300,000 | | | | 282,750 | |
Senior Unsecured | |
12/01/20 | | | 8.750% | | | | 194,000 | | | | 191,090 | |
| | | | | | | | | | | | | |
Total | | | | 4,323,356 | |
| | | |
| | | | | | | | | | | | |
Consumer Products 0.1% | |
First Quality Finance Co., Inc.
Senior Unsecured(a) | |
05/15/21 | | | 4.625% | | | | 294,000 | | | | 273,420 | |
|
Libbey Glass, Inc.
Senior Secured | |
05/15/20 | | | 6.875% | | | | 507,000 | | | | 541,856 | |
|
Serta Simmons Holdings LLC
Senior Unsecured(a) | |
10/01/20 | | | 8.125% | | | | 751,000 | | | | 788,550 | |
The accompanying Notes to Financial Statements are an integral part of this statement.
| | |
| |
| Active Portfolios® Multi-Manager Core Plus Bond Fund | | |
Portfolio of Investments (continued)
August 31, 2013
| | | | | | | | | | | | |
| Corporate Bonds & Notes (continued) | |
| Issuer | | Coupon
Rate | | | Principal
Amount ($) | | | Value ($) | |
| | | | | | | | | | |
Spectrum Brands Escrow Corp.(a) | |
11/15/20 | | | 6.375% | | | | 97,000 | | | | 100,395 | |
11/15/22 | | | 6.625% | | | | 342,000 | | | | 350,550 | |
|
Spectrum Brands, Inc. | |
03/15/20 | | | 6.750% | | | | 504,000 | | | | 531,720 | |
|
Springs Window Fashions LLC
Senior Secured(a) | |
06/01/21 | | | 6.250% | | | | 407,000 | | | | 401,912 | |
|
Tempur Sealy International, Inc. | |
12/15/20 | | | 6.875% | | | | 30,000 | | | | 31,313 | |
|
Visant Corp. | |
10/01/17 | | | 10.000% | | | | 400,000 | | | | 373,000 | |
| | | | | | | | | | | | | |
Total | | | | 3,392,716 | |
| | | |
| | | | | | | | | | | | |
Diversified Manufacturing 0.3% | |
ABB Finance U.S.A., Inc. | | | | | | | | | | | | |
05/08/22 | | | 2.875% | | | | 630,000 | | | | 599,417 | |
|
Amsted Industries, Inc.
Senior Notes(a) | |
03/15/18 | | | 8.125% | | | | 29,000 | | | | 30,595 | |
|
Apex Tool Group LLC(a) | |
02/01/21 | | | 7.000% | | | | 305,000 | | | | 312,625 | |
|
Dynacast International LLC/Finance, Inc.
Secured | |
07/15/19 | | | 9.250% | | | | 500,000 | | | | 545,000 | |
|
Gardner Denver, Inc.
Senior Unsecured(a) | |
08/15/21 | | | 6.875% | | | | 172,000 | | | | 168,130 | |
|
General Electric Co.
Senior Unsecured | |
10/09/22 | | | 2.700% | | | | 7,175,000 | | | | 6,694,203 | |
10/09/42 | | | 4.125% | | | | 2,409,000 | | | | 2,199,383 | |
|
Hamilton Sundstrand Corp.(a) Senior Unsecured | |
12/15/20 | | | 7.750% | | | | 571,000 | | | | 590,985 | |
|
Hutchison Whampoa International Ltd.(b) | |
12/31/49 | | | 6.000% | | | | 100,000 | | | | 105,500 | |
|
Mcron Finance Sub LLC/Corp.
Senior Secured(a) | |
05/15/19 | | | 8.375% | | | | 325,000 | | | | 349,375 | |
|
Metalloinvest Finance Ltd.(a) | |
04/17/20 | | | 5.625% | | | | 1,500,000 | | | | 1,402,500 | |
|
Voto-Votorantim Overseas Trading Operations NV | |
09/25/19 | | | 6.625% | | | | 350,000 | | | | 373,800 | |
| | | | | | | | | | | | | |
Total | | | | 13,371,513 | |
| | | |
| | | | | | | | | | | | |
Electric 2.1% | |
Alabama Power Co.
Senior Unsecured | |
03/15/41 | | | 5.500% | | | | 3,317,000 | | | | 3,721,624 | |
01/15/42 | | | 4.100% | | | | 1,209,000 | | | | 1,103,886 | |
| | | | | | | | | | | | |
| Corporate Bonds & Notes (continued) | |
| Issuer | | Coupon
Rate | | | Principal
Amount ($) | | | Value ($) | |
| | | | | | | | | | |
American Electric Power Co., Inc.
Senior Unsecured | |
12/15/22 | | | 2.950% | | | | 750,000 | | | | 686,195 | |
|
American Transmission Systems, Inc.
Senior Unsecured(a) | |
01/15/22 | | | 5.250% | | | | 2,200,000 | | | | 2,348,691 | |
|
Appalachian Power Co.
Senior Unsecured | |
01/15/20 | | | 7.950% | | | | 1,000,000 | | | | 1,255,044 | |
|
CMS Energy Corp.
Senior Unsecured | |
02/15/18 | | | 5.050% | | | | 1,748,000 | | | | 1,911,157 | |
|
Calpine Corp.
Senior Secured(a) | |
02/15/21 | | | 7.500% | | | | 146,000 | | | | 154,395 | |
|
Commonwealth Edison Co.
1st Mortgage | |
03/15/36 | | | 5.900% | | | | 1,200,000 | | | | 1,410,830 | |
|
Consolidated Edison Co. of New York, Inc.
Senior Unsecured | |
04/01/18 | | | 5.850% | | | | 3,000,000 | | | | 3,491,160 | |
04/01/38 | | | 6.750% | | | | 1,399,000 | | | | 1,800,923 | |
|
DPL, Inc.
Senior Unsecured | |
10/15/21 | | | 7.250% | | | | 4,110,000 | | | | 4,192,200 | |
|
Dominion Resources, Inc.
Senior Unsecured | |
01/15/19 | | | 8.875% | | | | 800,000 | | | | 1,032,139 | |
|
Duke Energy Carolinas LLC
1st Refunding Mortgage | |
09/30/42 | | | 4.000% | | | | 2,593,000 | | | | 2,354,540 | |
|
Dynegy, Inc.(a) | |
06/01/23 | | | 5.875% | | | | 300,000 | | | | 276,750 | |
|
Enel Finance International NV(a) | |
10/07/14 | | | 3.875% | | | | 630,000 | | | | 645,914 | |
|
Energy Future Intermediate Holding Co. LLC/Finance, Inc.
Senior Secured(a) | |
08/15/17 | | | 6.875% | | | | 125,000 | | | | 126,406 | |
|
Energy Future Intermediate Holding Co. LLC/Finance, Inc.
Senior Secured | |
12/01/20 | | | 10.000% | | | | 225,000 | | | | 237,094 | |
|
Energy Future Intermediate Holding Co. LLC/Finance, Inc.(a)
Secured | |
03/01/22 | | | 12.250% | | | | 100,000 | | | | 110,750 | |
|
Entergy Mississippi, Inc. | |
07/01/23 | | | 3.100% | | | | 2,000,000 | | | | 1,870,544 | |
|
Exelon Generation Co. LLC
Senior Unsecured | |
10/01/41 | | | 5.750% | | | | 2,000,000 | | | | 1,984,756 | |
|
FirstEnergy Corp.
Senior Unsecured | |
03/15/18 | | | 2.750% | | | | 3,825,000 | | | | 3,670,512 | |
03/15/23 | | | 4.250% | | | | 3,340,000 | | | | 3,033,729 | |
11/15/31 | | | 7.375% | | | | 4,000,000 | | | | 4,047,452 | |
The accompanying Notes to Financial Statements are an integral part of this statement.
| | |
| |
| | Active Portfolios® Multi-Manager Core Plus Bond Fund |
Portfolio of Investments (continued)
August 31, 2013
| | | | | | | | | | | | |
| Corporate Bonds & Notes (continued) | |
| Issuer | | Coupon
Rate | | | Principal
Amount ($) | | | Value ($) | |
| | | | | | | | | | |
GenOn Energy, Inc.
Senior Unsecured | |
10/15/18 | | | 9.500% | | | | 188,000 | | | | 212,440 | |
|
Georgia Power Co.
Senior Unsecured | |
09/01/40 | | | 4.750% | | | | 1,616,000 | | | | 1,590,621 | |
|
Israel Electric Corp., Ltd.
Senior Secured | |
01/15/19 | | | 7.250% | | | | 300,000 | | | | 320,250 | |
|
Mexico Generadora de Energia S de RL
Senior Secured(a) | |
12/06/32 | | | 5.500% | | | | 2,800,000 | | | | 2,576,000 | |
|
NRG Energy, Inc. | |
01/15/18 | | | 7.625% | | | | 575,000 | | | | 636,813 | |
03/15/23 | | | 6.625% | | | | 150,000 | | | | 148,875 | |
|
National Rural Utilities Cooperative Finance Corp. | |
11/01/18 | | | 10.375% | | | | 2,500,000 | | | | 3,435,295 | |
|
Nevada Power Co. | |
05/15/18 | | | 6.500% | | | | 2,486,000 | | | | 2,950,740 | |
08/01/18 | | | 6.500% | | | | 2,305,000 | | | | 2,749,935 | |
05/15/41 | | | 5.450% | | | | 3,120,000 | | | | 3,503,131 | |
|
Niagara Mohawk Power Corp.
Senior Unsecured(a) | |
08/15/19 | | | 4.881% | | | | 910,000 | | | | 1,011,575 | |
|
Oncor Electric Delivery Co. LLC
Senior Secured | |
09/30/40 | | | 5.250% | | | | 5,717,000 | | | | 6,072,866 | |
06/01/42 | | | 5.300% | | | | 1,250,000 | | | | 1,335,614 | |
|
PPL Capital Funding, Inc. | |
06/01/18 | | | 1.900% | | | | 2,470,000 | | | | 2,403,303 | |
06/15/22 | | | 4.200% | | | | 603,000 | | | | 607,415 | |
06/01/23 | | | 3.400% | | | | 5,435,000 | | | | 5,094,622 | |
|
Pacific Gas & Electric Co.
Senior Unsecured | |
06/15/23 | | | 3.250% | | | | 3,026,000 | | | | 2,876,936 | |
01/15/40 | | | 5.400% | | | | 760,000 | | | | 800,193 | |
|
Southern California Edison Co.
1st Refunding Mortgage | |
09/01/40 | | | 4.500% | | | | 435,000 | | | | 431,972 | |
|
Tucson Electric Power Co.
Senior Unsecured | |
03/15/23 | | | 3.850% | | | | 3,600,000 | | | | 3,420,497 | |
|
UIL Holdings Corp.
Senior Unsecured | |
10/01/20 | | | 4.625% | | | | 300,000 | | | | 305,166 | |
|
Virginia Electric and Power Co.
Senior Unsecured | |
06/30/19 | | | 5.000% | | | | 1,280,000 | | | | 1,450,967 | |
| | | | | | | | | | | | | |
Total | | | | 85,401,917 | |
| | | |
| | | | | | | | | | | | |
Entertainment 0.2% | |
AMC Entertainment, Inc. | |
06/01/19 | | | 8.750% | | | | 178,000 | | | | 191,350 | |
12/01/20 | | | 9.750% | | | | 23,000 | | | | 26,278 | |
| | | | | | | | | | | | |
| Corporate Bonds & Notes (continued) | |
| Issuer | | Coupon
Rate | | | Principal
Amount ($) | | | Value ($) | |
| | | | | | | | | | |
Cedar Fair LP/Canada’s Wonderland Co./Magnum
Management Corp.(a) | |
03/15/21 | | | 5.250% | | | | 452,000 | | | | 431,660 | |
|
Cinemark USA, Inc. | |
12/15/22 | | | 5.125% | | | | 82,000 | | | | 76,670 | |
|
Regal Entertainment Group
Senior Unsecured | |
02/01/25 | | | 5.750% | | | | 350,000 | | | | 322,000 | |
|
Six Flags Entertainment Corp.(a) | |
01/15/21 | | | 5.250% | | | | 400,000 | | | | 378,000 | |
|
Time Warner, Inc. | |
03/29/41 | | | 6.250% | | | | 2,280,000 | | | | 2,498,736 | |
|
Viacom, Inc.
Senior Unsecured | |
04/01/17 | | | 3.500% | | | | 1,500,000 | | | | 1,560,456 | |
09/01/23 | | | 4.250% | | | | 500,000 | | | | 494,804 | |
| | | | | | | | | | | | | |
Total | | | | 5,979,954 | |
| | | |
| | | | | | | | | | | | |
Environmental —% | |
ADS Waste Holdings, Inc.
Senior Unsecured(a) | |
10/01/20 | | | 8.250% | | | | 150,000 | | | | 158,250 | |
|
Clean Harbors, Inc. | |
08/01/20 | | | 5.250% | | | | 73,000 | | | | 72,088 | |
| | | | | | | | | | | | | |
Total | | | | 230,338 | |
| | | |
| | | | | | | | | | | | |
Food and Beverage 0.9% | |
ARAMARK Corp.(a) | |
03/15/20 | | | 5.750% | | | | 831,000 | | | | 847,620 | |
|
B&G Foods, Inc. | |
06/01/21 | | | 4.625% | | | | 392,000 | | | | 364,070 | |
|
BRF — Brasil Foods SA
Senior Unsecured(a) | |
05/22/23 | | | 3.950% | | | | 200,000 | | | | 170,700 | |
|
Campbell Soup Co.
Senior Unsecured | |
08/02/22 | | | 2.500% | | | | 1,651,000 | | | | 1,484,330 | |
08/02/42 | | | 3.800% | | | | 2,464,000 | | | | 2,012,790 | |
|
Coca-Cola Co. (The)
Senior Unsecured | |
09/01/21 | | | 3.300% | | | | 3,602,000 | | | | 3,642,656 | |
|
ConAgra Foods, Inc.
Senior Unsecured | |
01/25/18 | | | 1.900% | | | | 3,997,000 | | | | 3,926,061 | |
01/25/23 | | | 3.200% | | | | 1,000,000 | | | | 934,198 | |
10/01/28 | | | 7.000% | | | | 2,045,000 | | | | 2,462,382 | |
|
ConAgra Foods, Inc.(a)
Senior Unsecured | |
08/15/39 | | | 6.625% | | | | 1,000,000 | | | | 1,165,842 | |
|
Constellation Brands Inc.
Senior Unsecured | |
05/01/21 | | | 3.750% | | | | 92,000 | | | | 85,100 | |
05/01/23 | | | 4.250% | | | | 225,000 | | | | 206,438 | |
The accompanying Notes to Financial Statements are an integral part of this statement.
| | |
| |
| Active Portfolios® Multi-Manager Core Plus Bond Fund | | |
Portfolio of Investments (continued)
August 31, 2013
| | | | | | | | | | | | |
| Corporate Bonds & Notes (continued) | |
| Issuer | | Coupon
Rate | | | Principal
Amount ($) | | | Value ($) | |
| | | | | | | | | | |
Corporacion Lindley SA
Senior Unsecured(a) | |
04/12/23 | | | 4.625% | | | | 150,000 | | | | 137,250 | |
|
Del Monte Corp. | |
02/15/19 | | | 7.625% | | | | 825,000 | | | | 858,000 | |
|
Diageo Capital PLC | |
01/15/14 | | | 7.375% | | | | 1,000,000 | | | | 1,024,449 | |
|
Fomento Economico Mexicano SAB de CV
Senior Unsecured | |
05/10/43 | | | 4.375% | | | | 200,000 | | | | 171,311 | |
|
Grupo Bimbo SAB de CV(a) | |
01/25/22 | | | 4.500% | | | | 140,000 | | | | 138,557 | |
|
HJ Heinz Co.
Secured(a) | |
10/15/20 | | | 4.250% | | | | 976,000 | | | | 922,320 | |
|
Heineken NV
Senior Unsecured(a) | |
10/01/42 | | | 4.000% | | | | 690,000 | | | | 586,221 | |
|
Kraft Foods Group, Inc.
Senior Unsecured | |
06/04/15 | | | 1.625% | | | | 1,000,000 | | | | 1,014,222 | |
|
Michael Foods Group, Inc. | |
07/15/18 | | | 9.750% | | | | 300,000 | | | | 329,250 | |
|
Michael Foods Holding, Inc.
Senior Unsecured(a) | |
07/18/18 | | | 8.500% | | | | 675,000 | | | | 696,937 | |
|
Mondelez International, Inc.
Senior Unsecured | |
02/01/18 | | | 6.125% | | | | 5,000,000 | | | | 5,752,085 | |
02/09/40 | | | 6.500% | | | | 945,000 | | | | 1,116,403 | |
|
Pinnacle Foods Finance LLC/Corp.(a) | |
05/01/21 | | | 4.875% | | | | 637,000 | | | | 592,410 | |
|
Shearer’s Foods, Inc. LLC
Senior Secured(a) | |
11/01/19 | | | 9.000% | | | | 206,000 | | | | 216,815 | |
|
Smithfield Foods, Inc.
Senior Unsecured | |
07/01/17 | | | 7.750% | | | | 425,000 | | | | 478,125 | |
08/15/22 | | | 6.625% | | | | 50,000 | | | | 51,250 | |
|
Sun Merger Sub, Inc.(a)
Senior Unsecured | |
08/01/18 | | | 5.250% | | | | 50,000 | | | | 50,188 | |
08/01/21 | | | 5.875% | | | | 225,000 | | | | 224,437 | |
|
Tyson Foods, Inc. | |
06/15/22 | | | 4.500% | | | | 2,000,000 | | | | 2,057,180 | |
|
US Foods, Inc. | |
06/30/19 | | | 8.500% | | | | 900,000 | | | | 947,250 | |
|
Virgolino de Oliveira Finance Ltd.(a) | |
02/09/22 | | | 11.750% | | | | 3,000,000 | | | | 2,025,000 | |
| | | | | | | | | | | | | |
Total | | | | 36,691,847 | |
| | | |
| | | | | | | | | | | | |
| | | | | | | | | | | | |
| Corporate Bonds & Notes (continued) | |
| Issuer | | Coupon
Rate | | | Principal
Amount ($) | | | Value ($) | |
| | | | | | | | | | |
Foreign Agencies 0.4% | |
Brazil Minas SPE via State of Minas Gerais(a) | |
02/15/28 | | | 5.333% | | | | 1,000,000 | | | | 935,482 | |
|
CNOOC Finance Ltd. | |
05/09/23 | | | 3.000% | | | | 4,200,000 | | | | 3,731,553 | |
|
Dubai Electricity & Water Authority
Senior Unsecured(a) | |
10/21/20 | | | 7.375% | | | | 250,000 | | | | 280,313 | |
|
Electricite de France SA
Subordinated Notes(a)(b) | |
12/31/49 | | | 5.250% | | | | 3,370,000 | | | | 3,159,375 | |
|
Hrvatska Elektroprivreda
Senior Unsecured(a) | |
11/09/17 | | | 6.000% | | | | 5,000,000 | | | | 5,073,878 | |
|
KazAgro National Management Holding JSC
Senior Unsecured(a) | |
05/24/23 | | | 4.625% | | | | 200,000 | | | | 175,143 | |
|
Petroleos Mexicanos
U.S. Government Guaranteed | |
12/20/22 | | | 1.700% | | | | 973,750 | | | | 934,461 | |
| | | | | | | | | | | | | |
Total | | | | 14,290,205 | |
| | | |
| | | | | | | | | | | | |
Gaming 0.1% | |
Affinity Gaming LLC/Finance Corp. | |
05/15/18 | | | 9.000% | | | | 450,000 | | | | 474,750 | |
|
Boyd Gaming Corp. | |
07/01/20 | | | 9.000% | | | | 22,000 | | | | 23,595 | |
|
Caesars Entertainment Operating Co., Inc.
Senior Secured | |
02/15/20 | | | 8.500% | | | | 120,000 | | | | 114,600 | |
02/15/20 | | | 9.000% | | | | 77,000 | | | | 73,920 | |
|
Chester Downs & Marina LLC/Finance Corp.
Senior Secured(a) | |
02/01/20 | | | 9.250% | | | | 275,000 | | | | 274,313 | |
|
MGM Resorts International | |
03/01/18 | | | 11.375% | | | | 251,000 | | | | 313,750 | |
02/01/19 | | | 8.625% | | | | 775,000 | | | | 869,937 | |
10/01/20 | | | 6.750% | | | | 31,000 | | | | 31,620 | |
12/15/21 | | | 6.625% | | | | 58,000 | | | | 58,870 | |
|
Mohegan Tribal Gaming Authority
Senior Unsecured(a) | |
09/01/21 | | | 9.750% | | | | 400,000 | | | | 406,000 | |
|
PNK Finance Corp.(a) | |
08/01/21 | | | 6.375% | | | | 580,000 | | | | 578,550 | |
|
Pinnacle Entertainment, Inc. | |
04/15/21 | | | 7.500% | | | | 125,000 | | | | 133,750 | |
04/01/22 | | | 7.750% | | | | 180,000 | | | | 186,750 | |
|
ROC Finance LLC/Corp.
Secured(a) | |
09/01/18 | | | 12.125% | | | | 294,000 | | | | 327,075 | |
|
Rivers Pittsburgh Borrower LP/Finance Corp.
Senior Secured(a) | |
06/15/19 | | | 9.500% | | | | 302,000 | | | | 324,650 | |
The accompanying Notes to Financial Statements are an integral part of this statement.
| | |
| |
| | Active Portfolios® Multi-Manager Core Plus Bond Fund |
Portfolio of Investments (continued)
August 31, 2013
| | | | | | | | | | | | |
| Corporate Bonds & Notes (continued) | |
| Issuer | | Coupon
Rate | | | Principal
Amount ($) | | | Value ($) | |
| | | | | | | | | | |
Seminole Indian Tribe of Florida(a)
Secured | |
10/01/17 | | | 7.750% | | | | 406,000 | | | | 431,375 | |
Senior Secured | |
10/01/20 | | | 6.535% | | | | 165,000 | | | | 174,900 | |
|
Seneca Gaming Corp.(a) | |
12/01/18 | | | 8.250% | | | | 130,000 | | | | 139,100 | |
|
Station Casinos LLC | |
03/01/21 | | | 7.500% | | | | 400,000 | | | | 412,000 | |
|
Studio City Finance Ltd.(a) | |
12/01/20 | | | 8.500% | | | | 255,000 | | | | 269,025 | |
|
SugarHouse HSP Gaming LP/Finance Corp.
Senior Secured(a) | |
06/01/21 | | | 6.375% | | | | 114,000 | | | | 108,300 | |
|
Tunica-Biloxi Gaming Authority
Senior Unsecured(a) | |
11/15/15 | | | 9.000% | | | | 99,000 | | | | 89,595 | |
| | | | | | | | | | | | | |
Total | | | | 5,816,425 | |
| | | |
| | | | | | | | | | | | |
Gas Distributors 0.1% | |
National Fuel Gas Co.
Senior Unsecured | |
03/01/23 | | | 3.750% | | | | 730,000 | | | | 699,031 | |
|
Sempra Energy
Senior Unsecured | |
06/01/16 | | | 6.500% | | | | 1,275,000 | | | | 1,448,852 | |
02/15/19 | | | 9.800% | | | | 1,000,000 | | | | 1,334,587 | |
|
Suburban Propane Partners LP/Energy Finance Corp.
Senior Unsecured | |
08/01/21 | | | 7.375% | | | | 386,000 | | | | 406,265 | |
| | | | | | | | | | | | | |
Total | | | | 3,888,735 | |
| | | |
| | | | | | | | | | | | |
Gas Pipelines 1.7% | |
Access Midstream Partners LP/Finance Corp. | |
04/15/21 | | | 5.875% | | | | 54,000 | | | | 55,485 | |
07/15/22 | | | 6.125% | | | | 325,000 | | | | 333,937 | |
05/15/23 | | | 4.875% | | | | 406,000 | | | | 377,580 | |
|
DCP Midstream LLC(a)(b) | |
05/21/43 | | | 5.850% | | | | 3,405,000 | | | | 3,158,137 | |
|
El Paso LLC
Senior Secured | |
09/15/20 | | | 6.500% | | | | 825,000 | | | | 871,105 | |
|
El Paso Pipeline Partners Operating Co. LLC | |
10/01/21 | | | 5.000% | | | | 3,075,000 | | | | 3,248,301 | |
|
Energy Transfer Equity LP
Senior Secured | |
10/15/20 | | | 7.500% | | | | 425,000 | | | | 462,187 | |
|
Enterprise Products Operating LLC | |
03/15/23 | | | 3.350% | | | | 2,115,000 | | | | 2,008,709 | |
02/01/41 | | | 5.950% | | | | 1,938,000 | | | | 2,132,345 | |
02/15/42 | | | 5.700% | | | | 980,000 | | | | 1,043,978 | |
| | | | | | | | | | | | |
| Corporate Bonds & Notes (continued) | |
| Issuer | | Coupon
Rate | | | Principal
Amount ($) | | | Value ($) | |
| | | | | | | | | | |
Florida Gas Transmission Co. LLC
Senior Unsecured(a) | |
07/15/22 | | | 3.875% | | | | 2,250,000 | | | | 2,227,593 | |
|
Hiland Partners LP/Finance Corp.(a) | |
10/01/20 | | | 7.250% | | | | 317,000 | | | | 328,887 | |
|
Holly Energy Partners LP/Finance Corp. | |
03/01/20 | | | 6.500% | | | | 325,000 | | | | 334,750 | |
|
Inergy Midstream LP/Finance Corp.(a) | |
12/15/20 | | | 6.000% | | | | 125,000 | | | | 123,437 | |
|
Kinder Morgan Energy Partners LP
Senior Unsecured | |
09/01/22 | | | 3.950% | | | | 7,750,000 | | | | 7,572,595 | |
01/15/38 | | | 6.950% | | | | 1,085,000 | | | | 1,277,538 | |
09/01/39 | | | 6.500% | | | | 1,377,000 | | | | 1,534,449 | |
|
MarkWest Energy Partners LP/Finance Corp. | |
06/15/22 | | | 6.250% | | | | 317,000 | | | | 331,265 | |
02/15/23 | | | 5.500% | | | | 164,000 | | | | 161,130 | |
07/15/23 | | | 4.500% | | | | 211,000 | | | | 192,010 | |
|
NiSource Finance Corp. | |
02/15/23 | | | 3.850% | | | | 1,750,000 | | | | 1,696,093 | |
12/15/40 | | | 6.250% | | | | 1,815,000 | | | | 1,996,395 | |
02/15/43 | | | 5.250% | | | | 1,650,000 | | | | 1,594,017 | |
|
Regency Energy Partners LP/Finance Corp. | |
07/15/21 | | | 6.500% | | | | 59,000 | | | | 62,540 | |
04/15/23 | | | 5.500% | | | | 261,000 | | | | 251,865 | |
|
Regency Energy Partners LP/Finance Corp.(a) | |
11/01/23 | | | 4.500% | | | | 434,000 | | | | 387,345 | |
|
Sabine Pass Liquefaction LLC
Senior Secured(a) | |
02/01/21 | | | 5.625% | | | | 755,000 | | | | 721,025 | |
|
Southern Natural Gas Co. LLC/Issuing Corp.
Senior Unsecured | |
06/15/21 | | | 4.400% | | | | 2,350,000 | | | | 2,441,671 | |
|
Southern Natural Gas Co. LLC
Senior Unsecured | |
02/15/31 | | | 7.350% | | | | 2,910,000 | | | | 3,506,963 | |
03/01/32 | | | 8.000% | | | | 1,375,000 | | | | 1,779,323 | |
|
Spectra Energy Capital LLC | |
02/15/32 | | | 6.750% | | | | 1,740,000 | | | | 1,859,117 | |
|
Tennessee Gas Pipeline Co. LLC
Senior Unsecured | |
06/15/32 | | | 8.375% | | | | 5,465,000 | | | | 7,246,994 | |
04/01/37 | | | 7.625% | | | | 550,000 | | | | 716,028 | |
|
Tesoro Logistics LP/Finance Corp.(a) | |
10/15/21 | | | 6.125% | | | | 300,000 | | | | 299,250 | |
|
Texas Eastern Transmission LP
Senior Unsecured(a) | |
10/15/22 | | | 2.800% | | | | 3,350,000 | | | | 3,052,918 | |
|
TransCanada PipeLines Ltd.(b) | |
05/15/67 | | | 6.350% | | | | 7,413,000 | | | | 7,709,520 | |
|
Transcontinental Gas Pipe Line Co. LLC
Senior Unsecured | |
08/01/42 | | | 4.450% | | | | 2,255,000 | | | | 2,048,776 | |
The accompanying Notes to Financial Statements are an integral part of this statement.
| | |
| |
| Active Portfolios® Multi-Manager Core Plus Bond Fund | | |
Portfolio of Investments (continued)
August 31, 2013
| | | | | | | | | | | | |
| Corporate Bonds & Notes (continued) | |
| Issuer | | Coupon
Rate | | | Principal
Amount ($) | | | Value ($) | |
| | | | | | | | | | |
Transportadora de Gas Internacional SA ESP
Senior Unsecured | |
03/20/22 | | | 5.700% | | | | 200,000 | | | | 200,000 | |
|
Williams Companies, Inc. (The)
Senior Unsecured | |
01/15/31 | | | 7.500% | | | | 850,000 | | | | 953,280 | |
|
Williams Partners LP
Senior Unsecured | |
11/15/20 | | | 4.125% | | | | 1,000,000 | | | | 1,005,267 | |
04/15/40 | | | 6.300% | | | | 1,460,000 | | | | 1,538,820 | |
| | | | | | | | | | | | | |
Total | | | | 68,842,625 | |
| | | |
| | | | | | | | | | | | |
Health Care 1.0% | |
Biomet, Inc. | |
08/01/20 | | | 6.500% | | | | 186,000 | | | | 190,650 | |
10/01/20 | | | 6.500% | | | | 725,000 | | | | 723,187 | |
|
CHS/Community Health Systems, Inc. | |
11/15/19 | | | 8.000% | | | | 121,000 | | | | 127,050 | |
Senior Secured | | | | | | | | | | | | |
08/15/18 | | | 5.125% | | | | 128,000 | | | | 130,880 | |
|
CRC Health Corp.(d) | |
02/01/16 | | | 10.750% | | | | 75,000 | | | | 74,813 | |
|
ConvaTec Finance International SA Senior Unsecured(a) | |
01/15/19 | | | 8.250% | | | | 135,000 | | | | 132,975 | |
|
ConvaTec Healthcare E SA
Senior Unsecured(a) | |
12/15/18 | | | 10.500% | | | | 148,000 | | | | 165,760 | |
|
DJO Finance LLC/Corp. | |
04/15/18 | | | 7.750% | | | | 775,000 | | | | 761,437 | |
|
DaVita HealthCare Partners, Inc. | |
08/15/22 | | | 5.750% | | | | 477,000 | | | | 472,230 | |
|
Emdeon, Inc. | |
12/31/19 | | | 11.000% | | | | 538,000 | | | | 610,630 | |
|
Envision Healthcare Corp. | |
06/01/19 | | | 8.125% | | | | 625,000 | | | | 675,781 | |
|
Express Scripts Holding Co. | |
02/15/22 | | | 3.900% | | | | 2,410,000 | | | | 2,418,724 | |
|
Fresenius Medical Care U.S. Finance II, Inc.(a) | |
07/31/19 | | | 5.625% | | | | 87,000 | | | | 89,610 | |
|
Fresenius Medical Care U.S. Finance, Inc.(a) | |
09/15/18 | | | 6.500% | | | | 215,000 | | | | 234,350 | |
|
HCA Holdings, Inc.
Senior Unsecured | |
02/15/21 | | | 6.250% | | | | 92,000 | | | | 92,230 | |
|
HCA, Inc. | |
02/15/22 | | | 7.500% | | | | 723,000 | | | | 786,262 | |
05/01/23 | | | 5.875% | | | | 123,000 | | | | 119,925 | |
| | | | | | | | | | | | |
| Corporate Bonds & Notes (continued) | |
| Issuer | | Coupon
Rate | | | Principal
Amount ($) | | | Value ($) | |
| | | | | | | | | | |
Senior Secured | | | | | | | | | | | | |
04/15/19 | | | 8.500% | | | | 1,500,000 | | | | 1,620,000 | |
02/15/20 | | | 6.500% | | | | 148,000 | | | | 158,915 | |
02/15/20 | | | 7.875% | | | | 3,827,000 | | | | 4,128,376 | |
09/15/20 | | | 7.250% | | | | 3,712,000 | | | | 4,041,440 | |
03/15/22 | | | 5.875% | | | | 1,000,000 | | | | 1,032,500 | |
05/01/23 | | | 4.750% | | | | 32,000 | | | | 29,880 | |
|
Healthcare Technology Intermediate, Inc.
Senior Unsecured(a) | |
09/01/18 | | | 7.375% | | | | 275,000 | | | | 278,781 | |
|
Hologic, Inc. | |
08/01/20 | | | 6.250% | | | | 250,000 | | | | 260,625 | |
|
IASIS Healthcare LLC/Capital Corp. | |
05/15/19 | | | 8.375% | | | | 653,000 | | | | 684,018 | |
|
IMS Health, Inc.
Senior Unsecured(a) | |
11/01/20 | | | 6.000% | | | | 126,000 | | | | 129,308 | |
|
Kinetic Concepts, Inc./KCI U.S.A., Inc.
Secured | |
11/01/18 | | | 10.500% | | | | 124,000 | | | | 136,245 | |
|
Laboratory Corp. of America Holdings
Senior Unsecured | |
08/23/22 | | | 3.750% | | | | 1,000,000 | | | | 962,370 | |
|
Long Island College Hospital
Secured | |
11/01/42 | | | 4.800% | | | | 4,400,000 | | | | 4,071,278 | |
|
MPH Intermediate Holding Co. 2
Senior Unsecured PIK(a) | |
08/01/18 | | | 8.375% | | | | 392,000 | | | | 399,840 | |
|
McKesson Corp.
Senior Unsecured | |
12/15/22 | | | 2.700% | | | | 4,010,000 | | | | 3,697,653 | |
|
Multiplan, Inc.(a) | |
09/01/18 | | | 9.875% | | | | 637,000 | | | | 705,478 | |
|
Physio-Control International, Inc.
Senior Secured(a) | |
01/15/19 | | | 9.875% | | | | 112,000 | | | | 123,760 | |
|
Quest Diagnostics, Inc. | |
01/30/20 | | | 4.750% | | | | 500,000 | | | | 531,161 | |
|
Radnet Management, Inc. | |
04/01/18 | | | 10.375% | | | | 101,000 | | | | 107,060 | |
|
STHI Holding Corp.
Secured(a) | |
03/15/18 | | | 8.000% | | | | 203,000 | | | | 219,240 | |
|
St. Barnabas Corp.
Secured | |
07/01/28 | | | 4.000% | | | | 4,000,000 | | | | 3,542,516 | |
|
Stryker Corp.
Senior Unsecured | |
04/01/18 | | | 1.300% | | | | 800,000 | | | | 771,638 | |
|
Tenet Healthcare Corp.
Senior Secured | |
06/01/20 | | | 4.750% | | | | 4,000 | | | | 3,785 | |
The accompanying Notes to Financial Statements are an integral part of this statement.
| | |
| |
| | Active Portfolios® Multi-Manager Core Plus Bond Fund |
Portfolio of Investments (continued)
August 31, 2013
| | | | | | | | | | | | |
| Corporate Bonds & Notes (continued) | |
| Issuer | | Coupon
Rate | | | Principal
Amount ($) | | | Value ($) | |
| | | | | | | | | | |
Tenet Healthcare Corp.(a)
Senior Secured | |
04/01/21 | | | 4.500% | | | | 765,000 | | | | 703,800 | |
|
Truven Health Analytics, Inc. | |
06/01/20 | | | 10.625% | | | | 387,000 | | | | 411,188 | |
|
United Surgical Partners International, Inc. | |
04/01/20 | | | 9.000% | | | | 375,000 | | | | 413,438 | |
|
Universal Hospital Services, Inc.
Secured | |
08/15/20 | | | 7.625% | | | | 430,000 | | | | 447,200 | |
|
VWR Funding, Inc. | |
09/15/17 | | | 7.250% | | | | 625,000 | | | | 650,000 | |
| | | | | | | | | | | | | |
Total | | | | | | | | | | | 38,067,987 | |
| | | |
| | | | | | | | | | | | |
Healthcare Insurance 0.1% | |
Aetna, Inc.
Senior Unsecured | |
11/15/22 | | | 2.750% | | | | 2,300,000 | | | | 2,097,347 | |
|
UnitedHealth Group, Inc.
Senior Unsecured | |
11/15/17 | | | 6.000% | | | | 2,383,000 | | | | 2,697,065 | |
| | | | | | | | | | | | | |
Total | | | | | | | | | | | 4,794,412 | |
| | | |
| | | | | | | | | | | | |
Home Construction —% | |
Ashton Woods U.S.A. LLC/Finance Co.(a) | |
02/15/21 | | | 6.875% | | | | 23,000 | | | | 22,770 | |
|
Beazer Homes USA, Inc. | |
05/15/19 | | | 9.125% | | | | 87,000 | | | | 92,003 | |
02/01/23 | | | 7.250% | | | | 74,000 | | | | 74,740 | |
|
Brookfield Residential Properties, Inc./U.S. Corp.(a) | |
07/01/22 | | | 6.125% | | | | 50,000 | | | | 49,375 | |
|
KB Home | |
03/15/20 | | | 8.000% | | | | 108,000 | | | | 116,910 | |
|
Meritage Homes Corp. | |
03/01/18 | | | 4.500% | | | | 86,000 | | | | 84,925 | |
04/01/22 | | | 7.000% | | | | 120,000 | | | | 128,400 | |
|
Shea Homes LP/Funding Corp.
Senior Secured | |
05/15/19 | | | 8.625% | | | | 90,000 | | | | 98,775 | |
|
Standard Pacific Corp. | |
12/15/21 | | | 6.250% | | | | 155,000 | | | | 155,387 | |
|
Taylor Morrison Communities, Inc./Monarch, Inc.(a) | |
04/15/20 | | | 7.750% | | | | 129,000 | | | | 140,933 | |
04/15/21 | | | 5.250% | | | | 27,000 | | | | 25,515 | |
|
Woodside Homes Co., LLC/Finance, Inc.
Senior Unsecured(a) | |
12/15/21 | | | 6.750% | | | | 58,000 | | | | 57,710 | |
| | | | | | | | | | | | | |
Total | | | | | | | | | | | 1,047,443 | |
| | | |
| | | | | | | | | | | | |
| | | | | | | | | | | | |
| Corporate Bonds & Notes (continued) | |
| Issuer | | Coupon
Rate | | | Principal
Amount ($) | | | Value ($) | |
| | | | | | | | | | |
Independent Energy 1.2% | |
ATP Oil & Gas Corp.
Secured(c) | |
05/01/15 | | | 11.875% | | | | 350,000 | | | | 1,750 | |
|
Afren PLC
Senior Secured | |
04/08/19 | | | 10.250% | | | | 200,000 | | | | 227,000 | |
|
Alliance Oil Co., Ltd.(a) | |
05/04/20 | | | 7.000% | | | | 200,000 | | | | 198,486 | |
|
Anadarko Petroleum Corp.
Senior Unsecured | |
09/15/17 | | | 6.375% | | | | 1,255,000 | | | | 1,453,050 | |
03/15/40 | | | 6.200% | | | | 760,000 | | | | 860,952 | |
|
Antero Resources Finance Corp. | |
08/01/19 | | | 7.250% | | | | 57,000 | | | | 59,850 | |
12/01/20 | | | 6.000% | | | | 400,000 | | | | 399,000 | |
|
Apache Corp.
Senior Unsecured | |
01/15/44 | | | 4.250% | | | | 3,250,000 | | | | 2,892,055 | |
|
Approach Resources, Inc. | |
06/15/21 | | | 7.000% | | | | 375,000 | | | | 379,687 | |
|
Athlon Holdings LP/Finance Corp.(a) | |
04/15/21 | | | 7.375% | | | | 388,000 | | | | 391,880 | |
|
Aurora U.S.A. Oil & Gas, Inc.(a) | |
04/01/20 | | | 7.500% | | | | 260,000 | | | | 257,400 | |
|
Canadian Natural Resources Ltd.
Senior Unsecured | |
12/01/14 | | | 4.900% | | | | 2,000,000 | | | | 2,096,446 | |
|
Carrizo Oil & Gas, Inc. | |
10/15/18 | | | 8.625% | | | | 257,000 | | | | 279,487 | |
09/15/20 | | | 7.500% | | | | 375,000 | | | | 395,625 | |
|
Chaparral Energy, Inc. | |
10/01/20 | | | 9.875% | | | | 325,000 | | | | 364,000 | |
11/15/22 | | | 7.625% | | | | 150,000 | | | | 151,500 | |
|
Chesapeake Energy Corp. | |
08/15/20 | | | 6.625% | | | | 310,000 | | | | 332,475 | |
11/15/20 | | | 6.875% | | | | 125,000 | | | | 135,313 | |
02/15/21 | | | 6.125% | | | | 430,000 | | | | 447,200 | |
03/15/23 | | | 5.750% | | | | 430,000 | | | | 427,850 | |
|
Chesapeake Oilfield Operating LLC/Finance, Inc. | |
11/15/19 | | | 6.625% | | | | 400,000 | | | | 402,000 | |
|
Comstock Resources, Inc. | |
06/15/20 | | | 9.500% | | | | 387,000 | | | | 419,895 | |
|
Concho Resources, Inc. | |
01/15/21 | | | 7.000% | | | | 444,000 | | | | 487,290 | |
|
Conoco Funding Co. | |
10/15/31 | | | 7.250% | | | | 2,000,000 | | | | 2,644,970 | |
|
Continental Resources, Inc. | |
04/01/21 | | | 7.125% | | | | 301,000 | | | | 331,100 | |
04/15/23 | | | 4.500% | | | | 4,793,000 | | | | 4,709,122 | |
The accompanying Notes to Financial Statements are an integral part of this statement.
| | |
| |
| Active Portfolios® Multi-Manager Core Plus Bond Fund | | |
Portfolio of Investments (continued)
August 31, 2013
| | | | | | | | | | | | |
| Corporate Bonds & Notes (continued) | |
| Issuer | | Coupon
Rate | | | Principal
Amount ($) | | | Value ($) | |
| | | | | | | | | | |
Devon Energy Corp.
Senior Unsecured | |
01/15/19 | | | 6.300% | | | | 1,100,000 | | | | 1,268,034 | |
05/15/42 | | | 4.750% | | | | 1,175,000 | | | | 1,082,597 | |
|
EP Energy Holdings LLC/Bond Co., Inc.
Senior Unsecured PIK(a) | |
12/15/17 | | | 8.125% | | | | 130,361 | | | | 132,968 | |
|
EP Energy LLC/Finance, Inc.
Senior Unsecured | |
05/01/20 | | | 9.375% | | | | 108,000 | | | | 118,935 | |
|
EnCana Corp.
Senior Unsecured | |
11/15/21 | | | 3.900% | | | | 1,095,000 | | | | 1,085,165 | |
|
Energy XXI Gulf Coast, Inc. | |
12/15/17 | | | 9.250% | | | | 175,000 | | | | 194,687 | |
|
Forest Oil Corp. | |
06/15/19 | | | 7.250% | | | | 475,000 | | | | 471,437 | |
|
Halcon Resources Corp. | |
05/15/21 | | | 8.875% | | | | 198,000 | | | | 198,495 | |
|
Hess Corp.
Senior Unsecured | |
02/15/19 | | | 8.125% | | | | 760,000 | | | | 947,614 | |
10/01/29 | | | 7.875% | | | | 970,000 | | | | 1,213,077 | |
08/15/31 | | | 7.300% | | | | 591,000 | | | | 716,298 | |
02/15/41 | | | 5.600% | | | | 2,000,000 | | | | 2,060,925 | |
|
Kodiak Oil & Gas Corp. | |
12/01/19 | | | 8.125% | | | | 25,000 | | | | 27,375 | |
|
Kodiak Oil & Gas Corp.(a) | |
01/15/21 | | | 5.500% | | | | 184,000 | | | | 182,160 | |
02/01/22 | | | 5.500% | | | | 69,000 | | | | 66,585 | |
|
Laredo Petroleum, Inc. | |
02/15/19 | | | 9.500% | | | | 143,000 | | | | 159,087 | |
05/01/22 | | | 7.375% | | | | 209,000 | | | | 220,495 | |
|
Linn Energy LLC/Finance Corp.(a) | |
11/01/19 | | | 6.250% | | | | 390,000 | | | | 358,800 | |
|
Newfield Exploration Co.
Senior Unsecured | |
07/01/24 | | | 5.625% | | | | 2,725,000 | | | | 2,629,625 | |
|
Nexen, Inc.
Senior Unsecured | |
05/15/37 | | | 6.400% | | | | 1,865,000 | | | | 2,019,661 | |
07/30/39 | | | 7.500% | | | | 2,185,000 | | | | 2,681,312 | |
|
Northern Oil and Gas, Inc. | |
06/01/20 | | | 8.000% | | | | 300,000 | | | | 304,500 | |
|
Oasis Petroleum, Inc. | |
11/01/21 | | | 6.500% | | | | 888,000 | | | | 932,400 | |
01/15/23 | | | 6.875% | | | | 148,000 | | | | 155,770 | |
|
PTTEP Canada International Finance Ltd(a) | |
06/12/42 | | | 6.350% | | | | 300,000 | | | | 303,746 | |
|
Plains Exploration & Production Co. | |
02/15/23 | | | 6.875% | | | | 197,000 | | | | 209,658 | |
|
QEP Resources, Inc.
Senior Unsecured | |
05/01/23 | | | 5.250% | | | | 148,000 | | | | 138,750 | |
| | | | | | | | | | | | |
| Corporate Bonds & Notes (continued) | |
| Issuer | | Coupon
Rate | | | Principal
Amount ($) | | | Value ($) | |
| | | | | | | | | | |
Range Resources Corp. | |
05/15/19 | | | 8.000% | | | | 246,000 | | | | 264,450 | |
|
Ras Laffan Liquefied Natural Gas Co., Ltd. II
Senior Secured(a) | |
09/30/20 | | | 5.298% | | | | 1,237,052 | | | | 1,315,605 | |
|
SM Energy Co.
Senior Unsecured | |
11/15/21 | | | 6.500% | | | | 115,000 | | | | 120,750 | |
01/01/23 | | | 6.500% | | | | 138,000 | | | | 142,140 | |
|
SM Energy Co.(a)
Senior Unsecured | |
01/15/24 | | | 5.000% | | | | 57,000 | | | | 52,868 | |
|
SandRidge Energy, Inc. | |
03/15/21 | | | 7.500% | | | | 200,000 | | | | 199,000 | |
10/15/22 | | | 8.125% | | | | 300,000 | | | | 301,500 | |
|
W&T Offshore, Inc. | |
06/15/19 | | | 8.500% | | | | 375,000 | | | | 397,500 | |
|
Whiting Petroleum Corp. | |
10/01/18 | | | 6.500% | | | | 13,000 | | | | 13,683 | |
|
Woodside Finance Ltd.(a) | |
05/10/21 | | | 4.600% | | | | 3,488,000 | | | | 3,636,969 | |
|
Zhaikmunai LP(a) | |
11/13/19 | | | 7.125% | | | | 226,000 | | | | 232,497 | |
| | | | | | | | | | | | | |
Total | | | | 47,302,501 | |
| | | |
| | | | | | | | | | | | |
Integrated Energy 0.6% | |
BP Capital Markets PLC | |
03/11/21 | | | 4.742% | | | | 3,500,000 | | | | 3,754,219 | |
11/01/21 | | | 3.561% | | | | 2,000,000 | | | | 1,972,318 | |
|
Chevron Corp. | |
06/24/18 | | | 1.718% | | | | 695,000 | | | | 684,882 | |
Senior Unsecured | | | | | | | | | | | | |
06/24/20 | | | 2.427% | | | | 6,200,000 | | | | 6,050,332 | |
06/24/23 | | | 3.191% | | | | 700,000 | | | | 679,375 | |
|
Husky Energy, Inc.
Senior Unsecured | |
04/15/22 | | | 3.950% | | | | 3,000,000 | | | | 2,995,749 | |
|
Lone Pine Resources Canada Ltd.(c)(d) | |
02/15/17 | | | 10.375% | | | | 200,000 | | | | 126,000 | |
|
Lukoil International Finance BV(a) | |
04/24/18 | | | 3.416% | | | | 200,000 | | | | 196,467 | |
04/24/23 | | | 4.563% | | | | 200,000 | | | | 180,512 | |
|
Pacific Rubiales Energy Corp.(a) | |
12/12/21 | | | 7.250% | | | | 200,000 | | | | 207,000 | |
|
Shell International Finance BV | |
08/21/22 | | | 2.375% | | | | 5,590,000 | | | | 5,110,154 | |
03/25/40 | | | 5.500% | | | | 1,463,000 | | | | 1,659,987 | |
| | | | | | | | | | | | | |
Total | | | | 23,616,995 | |
| | | |
| | | | | | | | | | | | |
Life Insurance 1.7% | | | | | | | | | | | | |
AXA SA
Subordinated Notes | |
12/15/30 | | | 8.600% | | | | 1,000,000 | | | | 1,185,000 | |
The accompanying Notes to Financial Statements are an integral part of this statement.
| | |
| |
| | Active Portfolios® Multi-Manager Core Plus Bond Fund |
Portfolio of Investments (continued)
August 31, 2013
| | | | | | | | | | | | |
| Corporate Bonds & Notes (continued) | |
| Issuer | | Coupon
Rate | | | Principal
Amount ($) | | | Value ($) | |
| | | | | | | | | | |
Aflac, Inc.
Senior Unsecured | |
06/15/23 | | | 3.625% | | | | 10,000,000 | | | | 9,652,000 | |
|
American International Group, Inc.
Senior Unsecured | |
08/15/20 | | | 3.375% | | | | 1,000,000 | | | | 988,093 | |
12/15/20 | | | 6.400% | | | | 3,000,000 | | | | 3,502,230 | |
|
Hartford Financial Services Group, Inc.
Senior Unsecured | |
04/15/22 | | | 5.125% | | | | 2,600,000 | | | | 2,831,135 | |
|
ING Capital Funding Trust III(b) | |
12/31/49 | | | 3.874% | | | | 985,000 | | | | 956,681 | |
|
ING US, Inc. | |
07/15/22 | | | 5.500% | | | | 1,685,000 | | | | 1,801,946 | |
|
ING US, Inc.(b) | |
05/15/53 | | | 5.650% | | | | 2,330,000 | | | | 2,159,397 | |
|
Lincoln National Corp.
Senior Unsecured | |
06/24/21 | | | 4.850% | | | | 2,000,000 | | | | 2,130,932 | |
06/15/40 | | | 7.000% | | | | 2,610,000 | | | | 3,304,795 | |
|
Massachusetts Mutual Life Insurance Co.
Subordinated Notes(a) | |
06/01/39 | | | 8.875% | | | | 5,500,000 | | | | 7,984,026 | |
|
MetLife Capital Trust X(a) | |
04/08/38 | | | 9.250% | | | | 3,720,000 | | | | 4,817,400 | |
|
MetLife, Inc. | |
08/01/39 | | | 10.750% | | | | 585,000 | | | | 865,800 | |
Senior Unsecured | | | | | | | | | | | | |
08/15/18 | | | 6.817% | | | | 3,000,000 | | | | 3,617,778 | |
|
Metropolitan Life Global Funding I(a)
Secured | |
06/29/15 | | | 1.700% | | | | 2,000,000 | | | | 2,026,458 | |
Senior Secured | | | | | | | | | | | | |
04/11/22 | | | 3.875% | | | | 4,000,000 | | | | 4,066,068 | |
|
Northwestern Mutual Life Insurance Co. (The)
Subordinated Notes(a) | |
03/30/40 | | | 6.063% | | | | 2,800,000 | | | | 3,223,550 | |
|
Principal Financial Group, Inc. | |
09/15/22 | | | 3.300% | | | | 1,510,000 | | | | 1,461,833 | |
05/15/23 | | | 3.125% | | | | 667,000 | | | | 629,758 | |
|
Prudential Financial, Inc.
Senior Unsecured | |
09/17/15 | | | 4.750% | | | | 3,000,000 | | | | 3,227,547 | |
12/01/17 | | | 6.000% | | | | 217,000 | | | | 249,835 | |
|
Prudential Financial, Inc.(b) | |
06/15/38 | | | 8.875% | | | | 4,504,000 | | | | 5,427,320 | |
09/15/42 | | | 5.875% | | | | 2,025,000 | | | | 1,974,375 | |
03/15/44 | | | 5.200% | | | | 305,000 | | | | 274,500 | |
| | | | | | | | | | | | | |
Total | | | | 68,358,457 | |
| | | |
| | | | | | | | | | | | |
Lodging 0.1% | |
Choice Hotels International, Inc. | |
07/01/22 | | | 5.750% | | | | 125,000 | | | | 128,750 | |
| | | | | | | | | | | | |
| Corporate Bonds & Notes (continued) | |
| Issuer | | Coupon
Rate | | | Principal
Amount ($) | | | Value ($) | |
| | | | | | | | | | |
Hyatt Hotels Corp.
Senior Unsecured | |
07/15/23 | | | 3.375% | | | | 1,350,000 | | | | 1,247,327 | |
|
Playa Resorts Holding BV
Senior Unsecured(a) | |
08/15/20 | | | 8.000% | | | | 59,000 | | | | 60,277 | |
|
Wyndham Worldwide Corp.
Senior Unsecured | |
03/01/22 | | | 4.250% | | | | 4,155,000 | | | | 4,059,685 | |
| | | | | | | | | | | | | |
Total | | | | 5,496,039 | |
| | | |
| | | | | | | | | | | | |
Media Cable 0.6% | |
CCO Holdings LLC/Capital Corp. | |
01/15/19 | | | 7.000% | | | | 5,000,000 | | | | 5,287,500 | |
01/31/22 | | | 6.625% | | | | 228,000 | | | | 231,420 | |
|
CCO Holdings LLC/Capital Corp.(a) | |
03/15/21 | | | 5.250% | | | | 61,000 | | | | 57,950 | |
09/01/23 | | | 5.750% | | | | 1,175,000 | | | | 1,092,750 | |
|
COX Communications, Inc.
Senior Unsecured(a) | |
12/15/22 | | | 3.250% | | | | 500,000 | | | | 440,802 | |
| | | |
CSC Holdings LLC
Senior Unsecured | | | | | | | | | | | | |
02/15/18 | | | 7.875% | | | | 188,000 | | | | 213,380 | |
02/15/19 | | | 8.625% | | | | 44,000 | | | | 50,600 | |
|
CSC Holdings, Inc.
Senior Unsecured | |
11/15/21 | | | 6.750% | | | | 64,000 | | | | 67,360 | |
|
Cablevision Systems Corp.
Senior Unsecured | |
04/15/20 | | | 8.000% | | | | 121,000 | | | | 134,008 | |
09/15/22 | | | 5.875% | | | | 15,000 | | | | 14,325 | |
|
Cequel Communications Holdings I LLC/Capital Corp.(a)
Senior Unsecured | |
09/15/20 | | | 6.375% | | | | 435,000 | | | | 433,912 | |
12/15/21 | | | 5.125% | | | | 150,000 | | | | 138,000 | |
|
Cogeco Cable, Inc.(a) | |
05/01/20 | | | 4.875% | | | | 38,000 | | | | 36,480 | |
|
Comcast Corp. | |
01/15/17 | | | 6.500% | | | | 1,700,000 | | | | 1,967,400 | |
07/15/22 | | | 3.125% | | | | 3,780,000 | | | | 3,658,919 | |
|
DIRECTV Holdings LLC/Financing Co., Inc. | |
03/15/17 | | | 2.400% | | | | 3,440,000 | | | | 3,417,224 | |
03/01/21 | | | 5.000% | | | | 1,171,000 | | | | 1,196,728 | |
03/01/41 | | | 6.375% | | | | 1,500,000 | | | | 1,499,988 | |
|
DISH DBS Corp. | |
06/01/21 | | | 6.750% | | | | 421,000 | | | | 438,892 | |
07/15/22 | | | 5.875% | | | | 175,000 | | | | 171,500 | |
03/15/23 | | | 5.000% | | | | 49,000 | | | | 45,203 | |
|
DISH DBS Corp.(a) | |
05/01/20 | | | 5.125% | | | | 750,000 | | | | 725,625 | |
|
Midcontinent Communications & Finance Corp.(a) | |
08/01/21 | | | 6.250% | | | | 26,000 | | | | 26,130 | |
The accompanying Notes to Financial Statements are an integral part of this statement.
| | |
| |
| Active Portfolios® Multi-Manager Core Plus Bond Fund | | |
Portfolio of Investments (continued)
August 31, 2013
| | | | | | | | | | | | |
| Corporate Bonds & Notes (continued) | |
| Issuer | | Coupon
Rate | | | Principal
Amount ($) | | | Value ($) | |
| | | | | | | | | | |
NBCUniversal Enterprise, Inc.(a) | |
04/15/19 | | | 1.974% | | | | 2,175,000 | | | | 2,096,106 | |
|
Quebecor Media, Inc.
Senior Unsecured | |
01/15/23 | | | 5.750% | | | | 180,000 | | | | 167,850 | |
|
Time Warner Cable, Inc. | |
09/01/41 | | | 5.500% | | | | 1,410,000 | | | | 1,204,442 | |
|
Videotron Ltd. | |
07/15/22 | | | 5.000% | | | | 107,000 | | | | 99,510 | |
|
Virgin Media Finance PLC(a) | |
04/15/23 | | | 6.375% | | | | 300,000 | | | | 297,750 | |
|
WaveDivision Escrow LLC/Corp.
Senior Unsecured(a) | |
09/01/20 | | | 8.125% | | | | 7,000 | | | | 7,245 | |
|
WideOpenWest Finance LLC/Capital Corp. | |
07/15/19 | | | 10.250% | | | | 42,000 | | | | 45,045 | |
| | | | | | | | | | | | | |
Total | | | | | | | | | | | 25,264,044 | |
| | | |
| | | | | | | | | | | | |
Media Non-Cable 1.1% | |
AMC Networks, Inc. | |
07/15/21 | | | 7.750% | | | | 282,000 | | | | 311,610 | |
12/15/22 | | | 4.750% | | | | 275,000 | | | | 257,813 | |
|
Clear Channel Communications, Inc.
Senior Secured | |
03/01/21 | | | 9.000% | | | | 999,000 | | | | 949,050 | |
|
Clear Channel Worldwide Holdings, Inc. | |
03/15/20 | | | 7.625% | | | | 1,156,000 | | | | 1,158,890 | |
11/15/22 | | | 6.500% | | | | 319,000 | | | | 319,000 | |
|
Crown Media Holdings, Inc. | |
07/15/19 | | | 10.500% | | | | 600,000 | | | | 669,000 | |
|
Cumulus Media Holdings, Inc. | |
05/01/19 | | | 7.750% | | | | 400,000 | | | | 406,000 | |
|
DigitalGlobe, Inc.(a) | |
02/01/21 | | | 5.250% | | | | 88,000 | | | | 82,500 | |
|
Entercom Radio LLC | |
12/01/19 | | | 10.500% | | | | 300,000 | | | | 339,750 | |
|
Expo Event Transco, Inc.
Senior Unsecured(a) | |
06/15/21 | | | 9.000% | | | | 375,000 | | | | 369,375 | |
|
Grupo Televisa SAB
Senior Unsecured | |
03/18/25 | | | 6.625% | | | | 200,000 | | | | 226,363 | |
01/15/40 | | | 6.625% | | | | 200,000 | | | | 215,455 | |
|
Hughes Satellite Systems Corp. | |
06/15/21 | | | 7.625% | | | | 42,000 | | | | 45,045 | |
Senior Secured | | | | | | | | | | | | |
06/15/19 | | | 6.500% | | | | 111,000 | | | | 116,828 | |
|
IAC/InterActiveCorp | |
12/15/22 | | | 4.750% | | | | 675,000 | | | | 622,687 | |
|
Intelsat Jackson Holdings SA | |
11/01/19 | | | 8.500% | | | | 2,400,000 | | | | 2,610,000 | |
10/15/20 | | | 7.250% | | | | 448,000 | | | | 478,240 | |
| | | | | | | | | | | | |
| Corporate Bonds & Notes (continued) | |
| Issuer | | Coupon
Rate | | | Principal
Amount ($) | | | Value ($) | |
| | | | | | | | | | |
Intelsat Jackson Holdings SA(a) | |
12/15/22 | | | 6.625% | | | | 275,000 | | | | 274,313 | |
|
Intelsat Luxembourg SA(a) | |
06/01/21 | | | 7.750% | | | | 466,000 | | | | 479,980 | |
06/01/23 | | | 8.125% | | | | 580,000 | | | | 606,100 | |
|
Interpublic Group of Companies, Inc. (The)
Senior Unsecured | |
11/15/17 | | | 2.250% | | | | 1,500,000 | | | | 1,461,868 | |
03/15/22 | | | 4.000% | | | | 1,605,000 | | | | 1,537,776 | |
02/15/23 | | | 3.750% | | | | 2,000,000 | | | | 1,856,508 | |
|
Lamar Media Corp. | |
05/01/23 | | | 5.000% | | | | 300,000 | | | | 278,250 | |
|
MDC Partners, Inc.(a) | |
04/01/20 | | | 6.750% | | | | 162,000 | | | | 164,025 | |
|
NBCUniversal Media LLC | |
04/30/20 | | | 5.150% | | | | 2,280,000 | | | | 2,570,757 | |
01/15/23 | | | 2.875% | | | | 720,000 | | | | 677,213 | |
|
National CineMedia LLC
Senior Secured | |
04/15/22 | | | 6.000% | | | | 129,000 | | | | 131,580 | |
|
News America, Inc. | |
08/15/20 | | | 5.650% | | | | 1,760,000 | | | | 1,974,268 | |
03/15/33 | | | 6.550% | | | | 1,000,000 | | | | 1,124,071 | |
12/15/35 | | | 6.400% | | | | 855,000 | | | | 945,430 | |
01/09/38 | | | 6.750% | | | | 2,500,000 | | | | 2,733,045 | |
|
Nielsen Finance LLC/Co. | |
10/15/18 | | | 7.750% | | | | 2,585,000 | | | | 2,811,187 | |
10/01/20 | | | 4.500% | | | | 4,218,000 | | | | 4,007,100 | |
|
Omnicom Group, Inc. | |
05/01/22 | | | 3.625% | | | | 3,000,000 | | | | 2,897,115 | |
|
Pearson Funding Five PLC(a) | |
05/08/23 | | | 3.250% | | | | 480,000 | | | | 436,897 | |
|
Pearson Funding Two PLC(a) | |
05/17/16 | | | 4.000% | | | | 1,200,000 | | | | 1,270,896 | |
|
Reed Elsevier Capital, Inc. | |
10/15/22 | | | 3.125% | | | | 3,320,000 | | | | 3,052,225 | |
|
SSI Investments II Ltd./Co-Issuer LLC | |
06/01/18 | | | 11.125% | | | | 650,000 | | | | 716,625 | |
|
Sirius XM Radio, Inc.(a) | |
08/15/22 | | | 5.250% | | | | 425,000 | | | | 394,187 | |
Senior Unsecured | | | | | | | | | | | | |
05/15/23 | | | 4.625% | | | | 211,000 | | | | 186,208 | |
|
Southern Graphics, Inc. Senior Notes(a) | |
10/15/20 | | | 8.375% | | | | 500,000 | | | | 516,250 | |
|
Townsquare Radio LLC/Inc.(a) | |
04/01/19 | | | 9.000% | | | | 375,000 | | | | 398,437 | |
|
Univision Communications, Inc.(a) | |
05/15/21 | | | 8.500% | | | | 94,000 | | | | 101,755 | |
Senior Secured | | | | | | | | | | | | |
09/15/22 | | | 6.750% | | | | 185,000 | | | | 191,938 | |
05/15/23 | | | 5.125% | | | | 44,000 | | | | 41,525 | |
The accompanying Notes to Financial Statements are an integral part of this statement.
| | |
| |
| | Active Portfolios® Multi-Manager Core Plus Bond Fund |
Portfolio of Investments (continued)
August 31, 2013
| | | | | | | | | | | | |
| Corporate Bonds & Notes (continued) | |
| Issuer | | Coupon
Rate | | | Principal
Amount ($) | | | Value ($) | |
| | | | | | | | | | |
WPP Finance 2010 | |
09/07/42 | | | 5.125% | | | | 2,500,000 | | | | 2,262,840 | |
| | | | | | | | | | | | | |
Total | | | | 45,277,975 | |
| | | |
| | | | | | | | | | | | |
Metals 1.4% | |
ALROSA Finance SA | |
11/03/20 | | | 7.750% | | | | 200,000 | | | | 217,620 | |
|
Alcoa, Inc.
Senior Unsecured | |
04/15/21 | | | 5.400% | | | | 2,250,000 | | | | 2,222,397 | |
|
Allegheny Technologies, Inc.
Senior Unsecured | |
06/01/19 | | | 9.375% | | | | 1,470,000 | | | | 1,740,723 | |
|
Alpha Natural Resources, Inc. | |
04/15/18 | | | 9.750% | | | | 73,000 | | | | 73,365 | |
|
Anglo American Capital PLC(a) | |
04/03/17 | | | 2.625% | | | | 2,000,000 | | | | 1,952,948 | |
|
AngloGold Ashanti Holdings PLC | |
07/30/20 | | | 8.500% | | | | 2,230,000 | | | | 2,222,932 | |
08/01/22 | | | 5.125% | | | | 550,000 | | | | 462,055 | |
04/15/40 | | | 6.500% | | | | 1,010,000 | | | | 765,176 | |
|
ArcelorMittal
Senior Unsecured | |
02/25/15 | | | 4.250% | | | | 3,280,000 | | | | 3,366,100 | |
08/05/15 | | | 4.250% | | | | 3,656,000 | | | | 3,765,680 | |
08/05/20 | | | 5.750% | | | | 5,000,000 | | | | 4,968,750 | |
10/15/39 | | | 7.500% | | | | 336,000 | | | | 309,120 | |
03/01/41 | | | 7.250% | | | | 1,155,000 | | | | 1,036,612 | |
|
Arch Coal, Inc. | |
06/15/21 | | | 7.250% | | | | 8,000 | | | | 6,180 | |
|
Arch Coal, Inc.(a) | |
06/15/19 | | | 9.875% | | | | 177,000 | | | | 153,990 | |
|
Barrick Gold Corp.
Senior Unsecured | |
04/01/19 | | | 6.950% | | | | 3,100,000 | | | | 3,429,121 | |
|
Barrick Gold Corp.(a)
Senior Unsecured | |
05/01/18 | | | 2.500% | | | | 375,000 | | | | 353,179 | |
05/01/23 | | | 4.100% | | | | 2,630,000 | | | | 2,311,870 | |
|
Barrick North America Finance LLC | |
05/30/21 | | | 4.400% | | | | 1,000,000 | | | | 934,416 | |
|
CONSOL Energy, Inc. | |
03/01/21 | | | 6.375% | | | | 8,000 | | | | 8,080 | |
|
Calcipar SA
Senior Secured(a) | |
05/01/18 | | | 6.875% | | | | 115,000 | | | | 118,594 | |
|
Carpenter Technology Corp.
Senior Unsecured | |
03/01/23 | | | 4.450% | | | | 2,000,000 | | | | 1,939,850 | |
|
Century Aluminum Co.
Secured(a) | |
06/01/21 | | | 7.500% | | | | 250,000 | | | | 234,375 | |
| | | | | | | | | | | | |
| Corporate Bonds & Notes (continued) | |
| Issuer | | Coupon
Rate | | | Principal
Amount ($) | | | Value ($) | |
| | | | | | | | | | |
Cia Minera Milpo SAA
Senior Unsecured(a) | |
03/28/23 | | | 4.625% | | | | 3,750,000 | | | | 3,291,588 | |
|
FMG Resources August 2006 Proprietary Ltd.(a) | |
11/01/19 | | | 8.250% | | | | 197,000 | | | | 208,820 | |
|
FQM Akubra, Inc.(a) | |
06/01/20 | | | 8.750% | | | | 250,000 | | | | 261,250 | |
06/01/21 | | | 7.500% | | | | 120,000 | | | | 120,600 | |
|
Gerdau Trade, Inc.(a) | |
01/30/21 | | | 5.750% | | | | 1,500,000 | | | | 1,447,500 | |
|
Goldcorp, Inc.
Senior Unsecured | |
03/15/23 | | | 3.700% | | | | 2,000,000 | | | | 1,823,410 | |
|
Hyundai Steel Co.
Senior Unsecured(a) | |
04/21/16 | | | 4.625% | | | | 1,000,000 | | | | 1,045,807 | |
|
JMC Steel Group, Inc.
Senior Notes(a) | |
03/15/18 | | | 8.250% | | | | 138,000 | | | | 134,550 | |
|
Newcrest Finance Pty Ltd.(a) | |
10/01/22 | | | 4.200% | | | | 1,000,000 | | | | 829,091 | |
|
Newmont Mining Corp. | |
10/01/19 | | | 5.125% | | | | 300,000 | | | | 314,278 | |
|
Nucor Corp.
Senior Unsecured | |
09/15/22 | | | 4.125% | | | | 810,000 | | | | 808,532 | |
08/01/23 | | | 4.000% | | | | 7,035,000 | | | | 6,860,905 | |
|
OJSC Novolipetsk Steel via Steel Funding Ltd. | |
09/26/19 | | | 4.950% | | | | 200,000 | | | | 193,000 | |
|
Peabody Energy Corp. | |
11/15/21 | | | 6.250% | | | | 148,000 | | | | 142,820 | |
|
Reliance Steel & Aluminum Co. | |
04/15/23 | | | 4.500% | | | | 1,500,000 | | | | 1,432,308 | |
|
Rio Tinto Finance USA Ltd. | |
07/15/18 | | | 6.500% | | | | 1,580,000 | | | | 1,835,511 | |
|
Rio Tinto Finance USA PLC | |
12/14/18 | | | 2.250% | | | | 450,000 | | | | 436,263 | |
08/21/22 | | | 2.875% | | | | 1,000,000 | | | | 904,043 | |
|
Samarco Mineracao SA
Senior Unsecured(a) | |
11/01/22 | | | 4.125% | | | | 3,200,000 | | | | 2,720,071 | |
|
Vale Overseas Ltd. | |
01/11/22 | | | 4.375% | | | | 150,000 | | | | 139,583 | |
11/21/36 | | | 6.875% | | | | 100,000 | | | | 96,837 | |
| | | | | | | | | | | | | |
Total | | | | 57,639,900 | |
| | | |
| | | | | | | | | | | | |
Non-Captive Consumer 0.4% | |
Discover Financial Services
Senior Unsecured | |
04/27/22 | | | 5.200% | | | | 1,632,000 | | | | 1,689,425 | |
11/21/22 | | | 3.850% | | | | 2,993,000 | | | | 2,823,869 | |
The accompanying Notes to Financial Statements are an integral part of this statement.
| | |
| |
| Active Portfolios® Multi-Manager Core Plus Bond Fund | | |
Portfolio of Investments (continued)
August 31, 2013
| | | | | | | | | | | | |
| Corporate Bonds & Notes (continued) | |
| Issuer | | Coupon
Rate | | | Principal
Amount ($) | | | Value ($) | |
| | | | | | | | | | |
HSBC Finance Capital Trust IX(b) | |
11/30/35 | | | 5.911% | | | | 2,100,000 | | | | 2,128,875 | |
|
HSBC Finance Corp.
Subordinated Notes | |
01/15/21 | | | 6.676% | | | | 7,560,000 | | | | 8,535,580 | |
|
Provident Funding Associates LP/PFG Finance Corp.(a) | |
06/15/21 | | | 6.750% | | | | 88,000 | | | | 88,880 | |
|
Springleaf Finance Corp.
Senior Unsecured | |
12/15/17 | | | 6.900% | | | | 128,000 | | | | 130,240 | |
| | | | | | | | | | | | | |
Total | | | | 15,396,869 | |
| | | |
| | | | | | | | | | | | |
Non-Captive Diversified 1.0% | |
Air Lease Corp. | |
03/01/20 | | | 4.750% | | | | 228,000 | | | | 227,430 | |
|
CIT Group, Inc.
Senior Unsecured | |
05/15/17 | | | 5.000% | | | | 2,000,000 | | | | 2,075,000 | |
03/15/18 | | | 5.250% | | | | 770,000 | | | | 795,025 | |
08/01/23 | | | 5.000% | | | | 305,000 | | | | 285,635 | |
| | | |
CIT Group, Inc.(a) Senior Unsecured | | | | | | | | | | | | |
02/15/19 | | | 5.500% | | | | 591,000 | | | | 605,775 | |
|
General Electric Capital Corp.
Senior Unsecured | |
01/08/20 | | | 5.500% | | | | 5,000,000 | | | | 5,624,830 | |
10/17/21 | | | 4.650% | | | | 1,700,000 | | | | 1,791,649 | |
09/07/22 | | | 3.150% | | | | 5,500,000 | | | | 5,110,187 | |
01/09/23 | | | 3.100% | | | | 6,000,000 | | | | 5,547,126 | |
01/14/38 | | | 5.875% | | | | 10,325,000 | | | | 11,198,072 | |
|
General Electric Capital Corp.(b)
Senior Unsecured | |
08/15/36 | | | 0.744% | | | | 2,930,000 | | | | 2,347,446 | |
Subordinated Notes | | | | | | | | | | | | |
11/15/67 | | | 6.375% | | | | 3,919,000 | | | | 4,134,545 | |
|
International Lease Finance Corp.
Senior Unsecured | |
03/15/17 | | | 8.750% | | | | 250,000 | | | | 283,437 | |
04/15/18 | | | 3.875% | | | | 19,000 | | | | 18,145 | |
12/15/20 | | | 8.250% | | | | 576,000 | | | | 640,800 | |
04/15/21 | | | 4.625% | | | | 275,000 | | | | 250,250 | |
08/15/22 | | | 5.875% | | | | 575,000 | | | | 553,437 | |
| | | | | | | | | | | | | |
Total | | | | 41,488,789 | |
| | | |
| | | | | | | | | | | | |
Oil Field Services 0.3% | |
Atwood Oceanics, Inc.
Senior Unsecured | |
02/01/20 | | | 6.500% | | | | 348,000 | | | | 372,360 | |
|
Basic Energy Services, Inc. | |
02/15/19 | | | 7.750% | | | | 275,000 | | | | 278,438 | |
|
CGG | |
05/15/17 | | | 7.750% | | | | 175,000 | | | | 179,375 | |
06/01/21 | | | 6.500% | | | | 375,000 | | | | 379,687 | |
| | | | | | | | | | | | |
| Corporate Bonds & Notes (continued) | |
| Issuer | | Coupon
Rate | | | Principal
Amount ($) | | | Value ($) | |
| | | | | | | | | | |
Drill Rigs Holdings, Inc.
Senior Secured(a) | |
10/01/17 | | | 6.500% | | | | 75,000 | | | | 76,500 | |
|
Green Field Energy Services, Inc.(a) | |
Secured | | | | | | | | | | | | |
11/15/16 | | | 13.250% | | | | 8,000 | | | | 7,840 | |
11/15/16 | | | 13.250% | | | | 327,000 | | | | 320,460 | |
|
Nabors Industries, Inc. | |
09/15/21 | | | 4.625% | | | | 3,250,000 | | | | 3,223,288 | |
|
Noble Holding International Ltd. | |
08/01/20 | | | 4.900% | | | | 1,400,000 | | | | 1,466,790 | |
|
Oil States International, Inc.(a) | |
01/15/23 | | | 5.125% | | | | 98,000 | | | | 107,065 | |
|
PHI, Inc. | |
10/15/18 | | | 8.625% | | | | 400,000 | | | | 422,500 | |
|
Pacific Drilling SA
Senior Secured(a) | |
06/01/20 | | | 5.375% | | | | 190,000 | | | | 183,350 | |
|
SESI LLC | |
05/01/19 | | | 6.375% | | | | 250,000 | | | | 263,125 | |
12/15/21 | | | 7.125% | | | | 150,000 | | | | 162,375 | |
|
Weatherford International Ltd. | |
03/15/18 | | | 6.000% | | | | 1,000,000 | | | | 1,113,683 | |
03/15/38 | | | 7.000% | | | | 1,740,000 | | | | 1,849,253 | |
03/01/39 | | | 9.875% | | | | 940,000 | | | | 1,269,799 | |
| | | | | | | | | | | | | |
Total | | | | 11,675,888 | |
| | | |
| | | | | | | | | | | | |
Other Financial Institutions —% | |
NASDAQ OMX Group, Inc. (The)
Senior Unsecured | |
01/15/20 | | | 5.550% | | | | 600,000 | | | | 631,120 | |
|
Patriot Merger Corp.
Senior Unsecured(a) | |
07/15/21 | | | 9.000% | | | | 54,000 | | | | 55,755 | |
|
Sasol Financing International PLC | |
11/14/22 | | | 4.500% | | | | 200,000 | | | | 180,967 | |
| | | | | | | | | | | | | |
Total | | | | 867,842 | |
| | | |
| | | | | | | | | | | | |
Other Industry 0.6% | | | | | | | | | | | | |
Belden, Inc.(a) | |
09/01/22 | | | 5.500% | | | | 250,000 | | | | 242,500 | |
|
CBRE Services, Inc. | |
03/15/23 | | | 5.000% | | | | 61,000 | | | | 56,578 | |
|
Cleaver-Brooks, Inc.
Senior Secured(a) | |
12/15/19 | | | 8.750% | | | | 250,000 | | | | 265,000 | |
|
DH Services Luxembourg SARL(a) | |
12/15/20 | | | 7.750% | | | | 425,000 | | | | 438,812 | |
|
General Cable Corp.(a) | |
10/01/22 | | | 5.750% | | | | 225,000 | | | | 216,563 | |
|
Hillman Group, Inc. (The) | |
06/01/18 | | | 10.875% | | | | 500,000 | | | | 541,250 | |
The accompanying Notes to Financial Statements are an integral part of this statement.
| | |
| |
| | Active Portfolios® Multi-Manager Core Plus Bond Fund |
Portfolio of Investments (continued)
August 31, 2013
| | | | | | | | | | | | |
| Corporate Bonds & Notes (continued) | |
| Issuer | | Coupon
Rate | | | Principal
Amount ($) | | | Value ($) | |
| | | | | | | | | | |
Hutchison Whampoa International Ltd.(a) | |
01/13/17 | | | 3.500% | | | | 1,000,000 | | | | 1,032,054 | |
|
Igloo Holdings Corp. PIK
Senior Unsecured(a) | |
12/15/17 | | | 8.250% | | | | 700,000 | | | | 715,750 | |
|
Interline Brands, Inc. | |
11/15/18 | | | 7.500% | | | | 201,000 | | | | 211,050 | |
Senior Unsecured | | | | | | | | | | | | |
11/15/18 | | | 10.000% | | | | 575,000 | | | | 619,562 | |
|
Memorial Sloan-Kettering Cancer Center
Senior Unsecured | |
07/01/52 | | | 4.125% | | | | 4,330,000 | | | | 3,612,385 | |
|
Mueller Water Products, Inc. | |
06/01/17 | | | 7.375% | | | | 525,000 | | | | 537,469 | |
|
NYU Hospitals Center Secured | |
07/01/42 | | | 4.428% | | | | 4,000,000 | | | | 3,317,896 | |
|
Odebrecht Offshore Drilling Finance Ltd.
Senior Secured(a) | |
10/01/22 | | | 6.750% | | | | 3,000,000 | | | | 2,925,000 | |
|
President and Fellows of Harvard College
Senior Notes | |
10/15/40 | | | 4.875% | | | | 805,000 | | | | 853,865 | |
|
President and Fellows of Harvard College(a) | |
01/15/39 | | | 6.500% | | | | 3,545,000 | | | | 4,672,349 | |
|
Rexel SA(a)
Senior Unsecured | |
12/15/19 | | | 6.125% | | | | 350,000 | | | | 357,000 | |
06/15/20 | | | 5.250% | | | | 250,000 | | | | 247,842 | |
|
Sutter Health | |
08/15/53 | | | 2.286% | | | | 2,300,000 | | | | 2,309,231 | |
|
Unifrax I LLC/Holding Co.(a) | |
02/15/19 | | | 7.500% | | | | 418,000 | | | | 418,522 | |
|
Valmont Industries, Inc. | |
04/20/20 | | | 6.625% | | | | 1,065,000 | | | | 1,194,043 | |
| | | | | | | | | | | | | |
Total | | | | 24,784,721 | |
| | | |
| | | | | | | | | | | | |
Packaging 0.2% | |
Ardagh Packaging Finance PLC/MP Holdings U.S.A., Inc.(a)
Senior Secured | |
11/15/22 | | | 4.875% | | | | 84,000 | | | | 80,640 | |
Senior Unsecured | | | | | | | | | | | | |
11/15/20 | | | 7.000% | | | | 356,000 | | | | 345,320 | |
|
Ardagh Packaging Finance PLC(a) | |
10/15/20 | | | 9.125% | | | | 400,000 | | | | 427,000 | |
|
BOE Intermediate Holding Corp.
Senior Unsecured PIK(a) | |
11/01/17 | | | 9.000% | | | | 38,000 | | | | 38,760 | |
|
BOE Merger Corp.
Senior Unsecured PIK(a) | |
11/01/17 | | | 9.500% | | | | 325,000 | | | | 344,500 | |
|
Ball Corp. | |
11/15/23 | | | 4.000% | | | | 325,000 | | | | 290,063 | |
| | | | | | | | | | | | |
| Corporate Bonds & Notes (continued) | |
| Issuer | | Coupon
Rate | | | Principal
Amount ($) | | | Value ($) | |
| | | | | | | | | | |
Berry Plastics Corp.
Secured | |
05/15/18 | | | 9.500% | | | | 150,000 | | | | 162,938 | |
|
Crown Americas LLC/Capital Corp. IV(a) | |
01/15/23 | | | 4.500% | | | | 325,000 | | | | 299,812 | |
|
Greif, Inc.
Senior Unsecured | |
08/01/19 | | | 7.750% | | | | 275,000 | | | | 312,125 | |
|
Mustang Merger Corp.
Senior Unsecured(a) | |
08/15/21 | | | 8.500% | | | | 50,000 | | | | 49,250 | |
|
Reynolds Group Issuer, Inc./LLC | |
04/15/19 | | | 9.000% | | | | 103,000 | | | | 106,348 | |
08/15/19 | | | 9.875% | | | | 262,000 | | | | 278,375 | |
02/15/21 | | | 8.250% | | | | 2,050,000 | | | | 2,024,375 | |
Senior Secured | | | | | | | | | | | | |
08/15/19 | | | 7.875% | | | | 152,000 | | | | 167,200 | |
|
Sealed Air Corp.(a) | |
09/15/21 | | | 8.375% | | | | 550,000 | | | | 622,187 | |
|
Sonoco Products Co.
Senior Unsecured | |
11/01/40 | | | 5.750% | | | | 1,000,000 | | | | 1,048,752 | |
| | | | | | | | | | | | | |
Total | | | | 6,597,645 | |
| | | |
| | | | | | | | | | | | |
Paper 0.2% | | | | | | | | | | | | |
Clearwater Paper Corp. | |
02/01/23 | | | 4.500% | | | | 150,000 | | | | 135,750 | |
|
Fibria Overseas Finance Ltd. | |
03/03/21 | | | 6.750% | | | | 240,000 | | | | 252,907 | |
|
Graphic Packaging International, Inc. | |
04/15/21 | | | 4.750% | | | | 463,000 | | | | 444,480 | |
|
International Paper Co.
Senior Unsecured | |
08/15/21 | | | 7.500% | | | | 3,000,000 | | | | 3,692,625 | |
|
Plum Creek Timberlands LP | |
03/15/23 | | | 3.250% | | | | 1,630,000 | | | | 1,477,166 | |
|
Weyerhaeuser Co.
Senior Unsecured | |
10/01/19 | | | 7.375% | | | | 1,000,000 | | | | 1,202,559 | |
03/15/32 | | | 7.375% | | | | 1,630,000 | | | | 1,966,236 | |
| | | | | | | | | | | | | |
Total | | | | 9,171,723 | |
| | | |
| | | | | | | | | | | | |
Pharmaceuticals 0.4% | | | | | | | | | | | | |
Gilead Sciences, Inc.
Senior Unsecured | |
04/01/21 | | | 4.500% | | | | 1,500,000 | | | | 1,603,195 | |
|
Hospira, Inc.
Senior Unsecured | |
08/12/20 | | | 5.200% | | | | 1,350,000 | | | | 1,356,259 | |
|
Jaguar Holding Co. I
Senior Unsecured PIK(a) | |
10/15/17 | | | 9.375% | | | | 175,000 | | | | 185,500 | |
The accompanying Notes to Financial Statements are an integral part of this statement.
| | |
| |
| Active Portfolios® Multi-Manager Core Plus Bond Fund | | |
Portfolio of Investments (continued)
August 31, 2013
| | | | | | | | | | | | |
| Corporate Bonds & Notes (continued) | |
| Issuer | | Coupon
Rate | | | Principal
Amount ($) | | | Value ($) | |
| | | | | | | | | | |
Jaguar Holding Co. II/Merger Sub, Inc.
Senior Unsecured(a) | |
12/01/19 | | | 9.500% | | | | 355,000 | | | | 401,150 | |
|
Johnson & Johnson
Senior Unsecured | |
05/15/41 | | | 4.850% | | | | 2,003,000 | | | | 2,151,392 | |
|
Merck & Co., Inc.
Senior Unsecured | |
09/15/22 | | | 2.400% | | | | 3,535,000 | | | | 3,246,784 | |
09/15/42 | | | 3.600% | | | | 2,795,000 | | | | 2,371,499 | |
|
Roche Holdings, Inc.(a) | |
03/01/19 | | | 6.000% | | | | 1,243,000 | | | | 1,473,420 | |
|
VPII Escrow Corp.(a) Senior Unsecured | |
08/15/18 | | | 6.750% | | | | 109,000 | | | | 115,404 | |
07/15/21 | | | 7.500% | | | | 855,000 | | | | 914,850 | |
|
Valeant Pharmaceuticals International(a) | |
10/15/20 | | | 6.375% | | | | 260,000 | | | | 263,900 | |
| | | | | | | | | | | | | |
Total | | | | 14,083,353 | |
| | | |
| | | | | | | | | | | | |
Property & Casualty 0.8% | |
Alliant Holdings, Inc.
Senior Unsecured(a) | |
12/15/20 | | | 7.875% | | | | 147,000 | | | | 150,307 | |
|
Berkshire Hathaway Finance Corp. | |
05/15/42 | | | 4.400% | | | | 3,850,000 | | | | 3,580,050 | |
|
Berkshire Hathaway, Inc.
Senior Unsecured | |
02/11/23 | | | 3.000% | | | | 1,000,000 | | | | 957,842 | |
|
CNA Financial Corp.
Senior Unsecured | |
11/15/19 | | | 7.350% | | | | 3,435,000 | | | | 4,149,030 | |
08/15/21 | | | 5.750% | | | | 925,000 | | | | 1,034,278 | |
|
Farmers Exchange Capital(a) Subordinated Notes | |
07/15/28 | | | 7.050% | | | | 1,615,000 | | | | 1,921,729 | |
07/15/48 | | | 7.200% | | | | 1,615,000 | | | | 1,812,766 | |
|
Farmers Insurance Exchange
Subordinated Notes(a) | |
05/01/24 | | | 8.625% | | | | 1,075,000 | | | | 1,368,194 | |
|
HUB International Ltd.(a) | |
10/15/18 | | | 8.125% | | | | 204,000 | | | | 224,400 | |
|
Liberty Mutual Group, Inc.(a) | |
05/01/22 | | | 4.950% | | | | 4,280,000 | | | | 4,401,376 | |
06/15/23 | | | 4.250% | | | | 275,000 | | | | 265,391 | |
05/01/42 | | | 6.500% | | | | 2,605,000 | | | | 2,871,708 | |
|
Nationwide Mutual Insurance Co.(a)
Subordinated Notes | |
08/15/39 | | | 9.375% | | | | 1,700,000 | | | | 2,362,271 | |
|
Nationwide Mutual Insurance Co.(a)(b)
Subordinated Notes | |
12/15/24 | | | 5.810% | | | | 1,725,000 | | | | 1,725,000 | |
| | | | | | | | | | | | |
| Corporate Bonds & Notes (continued) | |
| Issuer | | Coupon
Rate | | | Principal
Amount ($) | | | Value ($) | |
| | | | | | | | | | |
Transatlantic Holdings, Inc.
Senior Unsecured | |
11/30/39 | | | 8.000% | | | | 2,670,000 | | | | 3,347,950 | |
| | | | | | | | | | | | | |
Total | | | | 30,172,292 | |
| | | |
| | | | | | | | | | | | |
Railroads 0.3% | |
BNSF Funding Trust I(b) | |
12/15/55 | | | 6.613% | | | | 3,777,000 | | | | 4,301,059 | |
|
Burlington Northern Santa Fe LLC
Senior Unsecured | |
09/15/21 | | | 3.450% | | | | 295,000 | | | | 293,786 | |
09/01/22 | | | 3.050% | | | | 475,000 | | | | 448,811 | |
|
CSX Corp.
Senior Unsecured | |
05/30/42 | | | 4.750% | | | | 1,755,000 | | | | 1,687,062 | |
|
Kansas City Southern de Mexico SA de CV
Senior Unsecured(a) | |
05/15/23 | | | 3.000% | | | | 1,000,000 | | | | 916,525 | |
|
Norfolk Southern Corp.
Senior Unsecured | |
04/01/22 | | | 3.000% | | | | 2,000,000 | | | | 1,909,406 | |
|
Union Pacific Corp.
Senior Unsecured | |
08/15/18 | | | 5.700% | | | | 1,486,000 | | | | 1,711,266 | |
| | | | | | | | | | | | | |
Total | | | | 11,267,915 | |
| | | |
| | | | | | | | | | | | |
Refining 0.1% | |
Citgo Petroleum Corp.
Senior Secured | |
07/01/17 | | | 11.500% | | | | 250,000 | | | | 277,500 | |
|
Marathon Petroleum Corp.
Senior Unsecured | |
03/01/41 | | | 6.500% | | | | 1,170,000 | | | | 1,288,697 | |
|
Valero Energy Corp. | |
03/15/19 | | | 9.375% | | | | 2,000,000 | | | | 2,583,830 | |
| | | | | | | | | | | | | |
Total | | | | 4,150,027 | |
| | | |
| | | | | | | | | | | | |
REITs 2.2% | | | | | | | | | | | | |
Alexandria Real Estate Equities, Inc. | |
04/01/22 | | | 4.600% | | | | 1,198,000 | | | | 1,198,035 | |
06/15/23 | | | 3.900% | | | | 1,300,000 | | | | 1,214,366 | |
|
AvalonBay Communities, Inc.
Senior Unsecured | |
03/15/17 | | | 5.700% | | | | 500,000 | | | | 557,689 | |
03/15/20 | | | 6.100% | | | | 1,865,000 | | | | 2,143,527 | |
|
Boston Properties LP
Senior Unsecured | |
11/15/20 | | | 5.625% | | | | 4,590,000 | | | | 5,140,566 | |
05/15/21 | | | 4.125% | | | | 3,810,000 | | | | 3,889,438 | |
02/01/23 | | | 3.850% | | | | 1,000,000 | | | | 971,556 | |
02/01/24 | | | 3.800% | | | | 1,355,000 | | | | 1,298,613 | |
The accompanying Notes to Financial Statements are an integral part of this statement.
| | |
| |
| | Active Portfolios® Multi-Manager Core Plus Bond Fund |
Portfolio of Investments (continued)
August 31, 2013
| | | | | | | | | | | | |
| Corporate Bonds & Notes (continued) | |
| Issuer | | Coupon
Rate | | | Principal
Amount ($) | | | Value ($) | |
| | | | | | | | | | |
Colonial Realty LP
Senior Unsecured | |
10/01/15 | | | 5.500% | | | | 4,650,000 | | | | 5,020,763 | |
|
CyrusOne LP/Finance Corp. | |
11/15/22 | | | 6.375% | | | | 157,000 | | | | 157,785 | |
|
Duke Realty LP | |
02/15/15 | | | 7.375% | | | | 1,036,000 | | | | 1,122,271 | |
08/15/19 | | | 8.250% | | | | 1,657,000 | | | | 2,038,314 | |
06/15/22 | | | 4.375% | | | | 1,855,000 | | | | 1,810,571 | |
|
Essex Portfolio LP | |
08/15/22 | | | 3.625% | | | | 4,650,000 | | | | 4,402,598 | |
|
HCP, Inc.
Senior Unsecured | |
06/15/14 | | | 6.000% | | | | 2,400,000 | | | | 2,491,289 | |
02/01/19 | | | 3.750% | | | | 3,750,000 | | | | 3,842,407 | |
02/01/20 | | | 2.625% | | | | 850,000 | | | | 796,013 | |
02/01/21 | | | 5.375% | | | | 1,650,000 | | | | 1,786,879 | |
|
Health Care REIT, Inc.
Senior Unsecured | |
03/15/18 | | | 2.250% | | | | 3,655,000 | | | | 3,584,162 | |
04/01/19 | | | 4.125% | | | | 2,000,000 | | | | 2,080,898 | |
04/15/20 | | | 6.125% | | | | 4,000,000 | | | | 4,506,844 | |
|
Healthcare Realty Trust, Inc.
Senior Unsecured | |
01/17/17 | | | 6.500% | | | | 4,946,000 | | | | 5,520,147 | |
|
Healthcare Trust of America Holdings LP(a) | |
04/15/23 | | | 3.700% | | | | 800,000 | | | | 744,592 | |
|
Highwoods Realty LP
Senior Unsecured | |
03/15/17 | | | 5.850% | | | | 3,069,000 | | | | 3,356,737 | |
|
Nationwide Health Properties, Inc.
Senior Unsecured | |
05/20/15 | | | 6.000% | | | | 3,000,000 | | | | 3,252,138 | |
|
Post Apartment Homes LP
Senior Unsecured | |
12/01/22 | | | 3.375% | | | | 1,000,000 | | | | 919,306 | |
|
ProLogis LP | |
03/15/20 | | | 6.875% | | | | 2,500,000 | | | | 2,928,250 | |
|
SL Green Realty Corp./Operating Partnership/Reckson
Senior Unsecured | |
08/15/18 | | | 5.000% | | | | 6,935,000 | | | | 7,336,765 | |
|
Simon Property Group LP
Senior Unsecured | |
02/01/23 | | | 2.750% | | | | 3,445,000 | | | | 3,130,627 | |
|
UDR, Inc. | |
01/10/22 | | | 4.625% | | | | 1,000,000 | | | | 1,025,517 | |
|
Ventas Realty LP/Capital Corp. | |
04/30/19 | | | 4.000% | | | | 3,000,000 | | | | 3,111,042 | |
|
WCI Finance LLC/WEA LLC(a) | |
10/01/16 | | | 5.700% | | | | 903,000 | | | | 1,006,737 | |
|
WEA Finance LLC/WT Finance Australia Propriety Ltd.(a) | |
09/02/15 | | | 5.750% | | | | 3,912,000 | | | | 4,267,483 | |
| | | | | | | | | | | | | |
Total | | | | 86,653,925 | |
| | | | | | | | | | | | |
| Corporate Bonds & Notes (continued) | |
| Issuer | | Coupon
Rate | | | Principal
Amount ($) | | | Value ($) | |
Restaurants 0.1% | |
DineEquity, Inc. | |
10/30/18 | | | 9.500% | | | | 425,000 | | | | 472,813 | |
|
McDonald’s Corp.
Senior Unsecured | |
05/01/43 | | | 3.625% | | | | 5,020,000 | | | | 4,314,849 | |
|
NPC International, Inc./Operating Co., Inc. | |
01/15/20 | | | 10.500% | | | | 375,000 | | | | 427,500 | |
|
Seminole Hard Rock Entertainment Inc./International LLC(a) | |
05/15/21 | | | 5.875% | | | | 450,000 | | | | 436,500 | |
| | | | | | | | | | | | | |
Total | | | | 5,651,662 | |
| | | |
| | | | | | | | | | | | |
Retailers 0.6% | |
Academy Ltd./Finance Corp.(a) | |
08/01/19 | | | 9.250% | | | | 425,000 | | | | 472,812 | |
|
Amazon.com, Inc.
Senior Unsecured | |
11/29/22 | | | 2.500% | | | | 3,210,000 | | | | 2,899,394 | |
|
Burlington Coat Factory Warehouse Corp. | |
02/15/19 | | | 10.000% | | | | 195,000 | | | | 217,425 | |
|
Burlington Holdings LLC/Finance, Inc.
Senior Unsecured PIK(a) | |
02/15/18 | | | 9.000% | | | | 171,000 | | | | 174,848 | |
|
CVS Caremark Corp.
Senior Unsecured | |
06/01/17 | | | 5.750% | | | | 1,457,000 | | | | 1,661,455 | |
|
Claire’s Stores, Inc.
Senior Secured(a) | |
03/15/20 | | | 6.125% | | | | 425,000 | | | | 422,875 | |
|
Golden Eagle Retail Group Ltd.
Senior Unsecured(a) | |
05/21/23 | | | 4.625% | | | | 5,000,000 | | | | 4,252,681 | |
|
Gymboree Corp. (The) | |
12/01/18 | | | 9.125% | | | | 200,000 | | | | 189,000 | |
|
Home Depot, Inc. (The)
Senior Unsecured | |
04/01/41 | | | 5.950% | | | | 1,300,000 | | | | 1,548,516 | |
|
Jo-Ann Stores Holdings, Inc.
Senior Unsecured PIK(a) | |
10/15/19 | | | 9.750% | | | | 450,000 | | | | 463,500 | |
|
Jo-Ann Stores, Inc.
Senior Unsecured(a) | |
03/15/19 | | | 8.125% | | | | 643,000 | | | | 654,252 | |
|
L Brands, Inc. | |
06/15/19 | | | 8.500% | | | | 180,000 | | | | 212,625 | |
02/15/22 | | | 5.625% | | | | 250,000 | | | | 251,875 | |
|
Macy’s Retail Holdings, Inc. | |
07/15/27 | | | 6.790% | | | | 4,495,000 | | | | 4,973,812 | |
03/15/37 | | | 6.375% | | | | 1,020,000 | | | | 1,131,933 | |
|
Michaels FinCo Holdings LLC/Inc. Senior Unsecured PIK(a) | |
08/01/18 | | | 7.500% | | | | 425,000 | | | | 426,062 | |
The accompanying Notes to Financial Statements are an integral part of this statement.
| | |
| |
| Active Portfolios® Multi-Manager Core Plus Bond Fund | | |
Portfolio of Investments (continued)
August 31, 2013
| | | | | | | | | | | | |
| Corporate Bonds & Notes (continued) | |
| Issuer | | Coupon
Rate | | | Principal
Amount ($) | | | Value ($) | |
| | | | | | | | | | |
Michaels Stores, Inc. | |
11/01/18 | | | 7.750% | | | | 500,000 | | | | 538,125 | |
|
New Academy Finance Co. LLC/Corp.
Senior Unsecured(a) | |
06/15/18 | | | 8.000% | | | | 275,000 | | | | 281,875 | |
|
PC Nextco Holdings LLC/Finance, Inc.(a) | |
08/15/19 | | | 8.750% | | | | 425,000 | | | | 420,219 | |
|
Party City Holdings, Inc.(a) | |
08/01/20 | | | 8.875% | | | | 375,000 | | | | 401,719 | |
|
PetCo Holdings, Inc.
Senior Notes(a) | |
10/15/17 | | | 8.500% | | | | 425,000 | | | | 433,500 | |
|
Rite Aid Corp. | |
03/15/20 | | | 9.250% | | | | 44,000 | | | | 49,775 | |
Senior Unsecured | | | | | | | | | | | | |
02/15/27 | | | 7.700% | | | | 55,000 | | | | 55,963 | |
|
SACI Falabella
Senior Unsecured(a) | |
04/30/23 | | | 3.750% | | | | 200,000 | | | | 173,240 | |
|
Sally Holdings LLC/Capital, Inc. | |
06/01/22 | | | 5.750% | | | | 540,000 | | | | 540,675 | |
|
William Carter Co. (The)(a) | |
08/15/21 | | | 5.250% | | | | 28,000 | | | | 28,140 | |
|
Yankee Candle Co., Inc. (The) | |
02/15/17 | | | 9.750% | | | | 425,000 | | | | 439,875 | |
| | | | | | | | | | | | | |
Total | | | | 23,316,171 | |
| | | |
| | | | | | | | | | | | |
Supermarkets 0.4% | |
Cencosud SA | |
01/20/23 | | | 4.875% | | | | 200,000 | | | | 183,370 | |
|
Kroger Co. (The) | |
12/15/18 | | | 6.800% | | | | 5,274,000 | | | | 6,268,581 | |
06/01/29 | | | 7.700% | | | | 2,085,000 | | | | 2,590,154 | |
|
Safeway, Inc.
Senior Unsecured | |
02/01/31 | | | 7.250% | | | | 5,869,000 | | | | 6,288,258 | |
| | | | | | | | | | | | | |
Total | | | | 15,330,363 | |
| | | |
| | | | | | | | | | | | |
Technology 1.0% | |
Advanced Micro Devices, Inc. Senior Unsecured | |
08/15/22 | | | 7.500% | | | | 250,000 | | | | 235,625 | |
|
Agilent Technologies, Inc.
Senior Unsecured | |
10/01/22 | | | 3.200% | | | | 1,000,000 | | | | 925,246 | |
07/15/23 | | | 3.875% | | | | 950,000 | | | | 917,816 | |
|
Alliance Data Systems Corp.(a) | |
12/01/17 | | | 5.250% | | | | 178,000 | | | | 183,785 | |
04/01/20 | | | 6.375% | | | | 141,000 | | | | 145,230 | |
|
Anixter, Inc. | |
05/01/19 | | | 5.625% | | | | 375,000 | | | | 387,187 | |
| | | | | | | | | | | | |
| Corporate Bonds & Notes (continued) | |
| Issuer | | Coupon
Rate | | | Principal
Amount ($) | | | Value ($) | |
| | | | | | | | | | |
Apple, Inc.
Senior Unsecured | |
05/03/18 | | | 1.000% | | | | 500,000 | | | | 477,688 | |
05/03/23 | | | 2.400% | | | | 315,000 | | | | 284,640 | |
|
Aspect Software, Inc.
Secured | |
05/15/17 | | | 10.625% | | | | 150,000 | | | | 150,375 | |
|
Audatex North America, Inc.(a) | |
06/15/21 | | | 6.000% | | | | 650,000 | | | | 658,125 | |
|
BMC Software Finance, Inc.
Senior Unsecured(a) | |
07/15/21 | | | 8.125% | | | | 275,000 | | | | 278,438 | |
|
BMC Software, Inc.
Senior Unsecured | |
02/15/22 | | | 4.250% | | | | 1,700,000 | | | | 1,658,812 | |
|
Brocade Communications Systems, Inc.
Senior Secured | |
01/15/20 | | | 6.875% | | | | 128,000 | | | | 137,920 | |
|
CDW LLC/Finance Corp. | |
04/01/19 | | | 8.500% | | | | 752,000 | | | | 825,320 | |
|
CommScope Holdings Co., Inc.
Senior Unsecured PIK(a) | |
06/01/20 | | | 6.625% | | | | 400,000 | | | | 396,000 | |
|
CommScope, Inc.(a) | |
01/15/19 | | | 8.250% | | | | 575,000 | | | | 626,750 | |
|
CompuCom Systems, Inc.
Senior Unsecured(a) | |
05/01/21 | | | 7.000% | | | | 300,000 | | | | 288,000 | |
|
CoreLogic, Inc. | |
06/01/21 | | | 7.250% | | | | 425,000 | | | | 454,750 | |
|
Corning, Inc.
Senior Unsecured | |
03/15/42 | | | 4.750% | | | | 600,000 | | �� | | 590,319 | |
|
Eagle Midco, Inc.
Senior Unsecured(a) | |
06/15/18 | | | 9.000% | | | | 425,000 | | | | 425,000 | |
|
Epicor Software Corp. | |
05/01/19 | | | 8.625% | | | | 625,000 | | | | 659,375 | |
|
Equinix, Inc.
Senior Unsecured | |
04/01/20 | | | 4.875% | | | | 60,000 | | | | 57,750 | |
07/15/21 | | | 7.000% | | | | 67,000 | | | | 71,690 | |
|
First Data Corp.(a) | |
01/15/21 | | | 11.250% | | | | 82,000 | | | | 84,050 | |
06/15/21 | | | 10.625% | | | | 215,000 | | | | 213,656 | |
08/15/21 | | | 11.750% | | | | 55,000 | | | | 51,425 | |
Secured | | | | | | | | | | | | |
01/15/21 | | | 8.250% | | | | 189,000 | | | | 193,253 | |
01/15/22 | | | 8.750% | | | | 1,300,000 | | | | 1,342,250 | |
Senior Secured | | | | | | | | | | | | |
08/15/20 | | | 8.875% | | | | 127,000 | | | | 137,160 | |
11/01/20 | | | 6.750% | | | | 107,000 | | | | 108,873 | |
|
Flextronics International Ltd. | |
02/15/20 | | | 4.625% | | | | 275,000 | | | | 267,438 | |
The accompanying Notes to Financial Statements are an integral part of this statement.
| | |
| |
| | Active Portfolios® Multi-Manager Core Plus Bond Fund |
Portfolio of Investments (continued)
August 31, 2013
| | | | | | | | | | | | |
| Corporate Bonds & Notes (continued) | |
| Issuer | | Coupon
Rate | | | Principal
Amount ($) | | | Value ($) | |
| | | | | | | | | | |
Hewlett-Packard Co.
Senior Unsecured | |
06/02/14 | | | 4.750% | | | | 1,800,000 | | | | 1,849,952 | |
09/15/17 | | | 2.600% | | | | 1,000,000 | | | | 1,002,755 | |
|
Infor US, Inc. | |
04/01/19 | | | 9.375% | | | | 475,000 | | | | 528,437 | |
|
Ingram Micro, Inc.
Senior Unsecured | |
08/10/22 | | | 5.000% | | | | 1,030,000 | | | | 1,013,291 | |
|
Iron Mountain, Inc. | |
08/15/23 | | | 6.000% | | | | 75,000 | | | | 74,438 | |
|
KLA-Tencor Corp.
Senior Unsecured | |
05/01/18 | | | 6.900% | | | | 1,450,000 | | | | 1,681,797 | |
|
Kemet Corp.
Senior Secured | |
05/01/18 | | | 10.500% | | | | 325,000 | | | | 310,375 | |
|
Lawson Software, Inc. | |
07/15/18 | | | 11.500% | | | | 150,000 | | | | 174,000 | |
|
Lender Processing Services, Inc. | |
04/15/23 | | | 5.750% | | | | 300,000 | | | | 312,000 | |
|
MModal, Inc.
Senior Notes(a) | |
08/15/20 | | | 10.750% | | | | 200,000 | | | | 162,000 | |
|
MagnaChip Semiconductor Corp.
Senior Unsecured(a) | |
07/15/21 | | | 6.625% | | | | 175,000 | | | | 175,438 | |
|
Microsoft Corp.
Senior Unsecured | |
11/15/22 | | | 2.125% | | | | 1,095,000 | | | | 980,760 | |
|
NCR Corp. | |
02/15/21 | | | 4.625% | | | | 600,000 | | | | 571,500 | |
|
NXP BV/Funding LLC(a) | |
06/01/18 | | | 3.750% | | | | 421,000 | | | | 406,791 | |
02/15/21 | | | 5.750% | | | | 153,000 | | | | 153,000 | |
Senior Unsecured | | | | | | | | | | | | |
03/15/23 | | | 5.750% | | | | 200,000 | | | | 197,000 | |
|
Nuance Communications, Inc.(a) | |
08/15/20 | | | 5.375% | | | | $595,000 | | | | $566,737 | |
|
Oracle Corp.
Senior Unsecured | |
10/15/22 | | | 2.500% | | | | 6,078,000 | | | | 5,567,308 | |
07/15/23 | | | 3.625% | | | | 1,530,000 | | | | 1,518,153 | |
|
STATS ChipPAC Ltd. | |
03/20/18 | | | 4.500% | | | | 200,000 | | | | 195,000 | |
|
Seagate Technology HDD Holdings | |
11/01/21 | | | 7.000% | | | | 400,000 | | | | 433,000 | |
|
Seagate Technology HDD Holdings(a) | |
06/01/23 | | | 4.750% | | | | 100,000 | | | | 92,250 | |
|
Serena Software, Inc. | |
03/15/16 | | | 10.375% | | | | 100,000 | | | | 98,500 | |
|
Sophia LP/Finance, Inc.(a) | |
01/15/19 | | | 9.750% | | | | 525,000 | | | | 569,625 | |
| | | | | | | | | | | | |
| Corporate Bonds & Notes (continued) | |
| Issuer | | Coupon
Rate | | | Principal
Amount ($) | | | Value ($) | |
| | | | | | | | | | |
SunGard Data Systems, Inc. | |
11/01/19 | | | 6.625% | | | | 300,000 | | | | 304,500 | |
|
Syniverse Holdings, Inc. | |
01/15/19 | | | 9.125% | | | | 725,000 | | | | 779,375 | |
|
Telefonaktiebolaget LM Ericsson
Senior Unsecured | |
05/15/22 | | | 4.125% | | | | 3,270,000 | | | | 3,195,666 | |
|
TransUnion Holding Co., Inc.
Senior Unsecured | |
06/15/18 | | | 8.125% | | | | 150,000 | | | | 158,063 | |
Senior Unsecured PIK | | | | | | | | | | | | |
06/15/18 | | | 9.625% | | | | 300,000 | | | | 324,000 | |
|
Tyco Electronics Group SA | |
01/15/14 | | | 5.950% | | | | 1,000,000 | | | | 1,019,367 | |
|
VeriSign, Inc.(a) | |
05/01/23 | | | 4.625% | | | | 200,000 | | | | 187,000 | |
|
Verisk Analytics, Inc. | |
09/12/22 | | | 4.125% | | | | 3,000,000 | | | | 2,950,251 | |
|
Viasystems, Inc.
Senior Secured(a) | |
05/01/19 | | | 7.875% | | | | 275,000 | | | | 292,875 | |
| | | | | | | | | | | | | |
Total | | | | 41,079,150 | |
| | | |
| | | | | | | | | | | | |
Textile —% | |
Wolverine World Wide, Inc.(a) | |
10/15/20 | | | 6.125% | | | | 275,000 | | | | 285,313 | |
| | | |
| | | | | | | | | | | | |
Transportation Services 0.4% | |
Autopistas Metropolitanas de Puerto Rico LLC
Senior Secured(a) | |
06/30/35 | | | 6.750% | | | | 1,750,000 | | | | 1,715,080 | |
|
Avis Budget Car Rental LLC/Finance, Inc. | |
01/15/19 | | | 8.250% | | | | 97,000 | | | | 105,487 | |
|
DP World Ltd.
Senior Unsecured | |
07/02/37 | | | 6.850% | | | | 5,000,000 | | | | 4,737,500 | |
|
ERAC U.S.A. Finance LLC(a) | |
10/15/37 | | | 7.000% | | | | 848,000 | | | | 1,007,118 | |
|
Hertz Corp. (The) | |
04/15/19 | | | 6.750% | | | | 275,000 | | | | 293,219 | |
10/15/20 | | | 5.875% | | | | 50,000 | | | | 51,313 | |
01/15/21 | | | 7.375% | | | | 104,000 | | | | 112,320 | |
10/15/22 | | | 6.250% | | | | 175,000 | | | | 178,062 | |
|
Hertz Corp. (The)(a) | |
04/01/18 | | | 4.250% | | | | 100,000 | | | | 98,000 | |
|
LBC Tank Terminals Holding Netherlands BV(a) | |
05/15/23 | | | 6.875% | | | | 129,000 | | | | 129,645 | |
|
Ryder System, Inc.
Senior Unsecured | |
06/01/17 | | | 3.500% | | | | 1,000,000 | | | | 1,034,460 | |
The accompanying Notes to Financial Statements are an integral part of this statement.
| | |
| |
| Active Portfolios® Multi-Manager Core Plus Bond Fund | | |
Portfolio of Investments (continued)
August 31, 2013
| | | | | | | | | | | | |
| Corporate Bonds & Notes (continued) | |
| Issuer | | Coupon
Rate | | | Principal
Amount ($) | | | Value ($) | |
| | | | | | | | | | |
Sydney Airport Finance Co. Pty Ltd.(a)
Senior Secured | |
02/22/21 | | | 5.125% | | | | 2,055,000 | | | | 2,130,468 | |
03/22/23 | | | 3.900% | | | | 3,700,000 | | | | 3,463,707 | |
| | | | | | | | | | | | | |
Total | | | | 15,056,379 | |
| | | |
| | | | | | | | | | | | |
Wireless 0.5% | |
AT&T Wireless Services, Inc.
Senior Unsecured | |
03/01/31 | | | 8.750% | | | | 2,000,000 | | | | 2,895,984 | |
|
America Movil SAB de CV | |
01/15/15 | | | 5.750% | | | | 800,000 | | | | 849,282 | |
10/16/19 | | | 5.000% | | | | 100,000 | | | | 107,462 | |
Senior Unsecured | | | | | | | | | | | | |
07/16/22 | | | 3.125% | | | | 320,000 | | | | 288,793 | |
|
American Tower Corp.
Senior Unsecured | |
01/15/18 | | | 4.500% | | | | 1,000,000 | | | | 1,057,606 | |
02/15/24 | | | 5.000% | | | | 665,000 | | | | 660,763 | |
|
Digicel Group Ltd.
Senior Unsecured(a) | |
09/30/20 | | | 8.250% | | | | 975,000 | | | | 1,033,500 | |
|
MetroPCS Wireless, Inc.(a) | |
04/01/21 | | | 6.250% | | | | 250,000 | | | | 249,375 | |
04/01/23 | | | 6.625% | | | | 476,000 | | | | 472,430 | |
|
NII International Telecom SCA(a) | |
08/15/19 | | | 7.875% | | | | 110,000 | | | | 103,675 | |
08/15/19 | | | 11.375% | | | | 310,000 | | | | 333,250 | |
|
SBA Telecommunications, Inc. | |
07/15/20 | | | 5.750% | | | | 490,000 | | | | 492,450 | |
|
Softbank Corp.(a) | |
04/15/20 | | | 4.500% | | | | 201,000 | | | | 190,033 | |
|
Sprint Capital Corp. | |
05/01/19 | | | 6.900% | | | | 325,000 | | | | 334,750 | |
11/15/28 | | | 6.875% | | | | 625,000 | | | | 564,062 | |
|
Sprint Communications, Inc.
Senior Unsecured | |
08/15/20 | | | 7.000% | | | | 138,000 | | | | 142,485 | |
11/15/21 | | | 11.500% | | | | 193,000 | | | | 251,865 | |
04/15/22 | | | 9.250% | | | | 3,650,000 | | | | 4,215,750 | |
11/15/22 | | | 6.000% | | | | 1,275,000 | | | | 1,192,125 | |
|
Sprint Communications, Inc.(a) | |
11/15/18 | | | 9.000% | | | | 518,000 | | | | 606,060 | |
03/01/20 | | | 7.000% | | | | 50,000 | | | | 53,750 | |
|
Telemovil Finance Co., Ltd. | |
10/01/17 | | | 8.000% | | | | 150,000 | | | | 157,500 | |
|
United States Cellular Corp.
Senior Unsecured | |
12/15/33 | | | 6.700% | | | | 1,019,000 | | | | 990,837 | |
|
VimpelCom Holdings BV | |
03/01/22 | | | 7.504% | | | | 220,000 | | | | 222,200 | |
|
VimpelCom Holdings BV(a) | |
02/13/23 | | | 5.950% | | | | 2,500,000 | | | | 2,235,925 | |
| | | | | | | | | | | | |
| Corporate Bonds & Notes (continued) | |
| Issuer | | Coupon
Rate | | | Principal
Amount ($) | | | Value ($) | |
| | | | | | | | | | |
Vodafone Group PLC
Senior Unsecured | |
02/27/17 | | | 5.625% | | | | 1,000,000 | | | | 1,116,641 | |
|
Wind Acquisition Finance SA
Senior Secured(a) | |
04/30/20 | | | 6.500% | | | | 188,000 | | | | 188,000 | |
| | | | | | | | | | | | | |
Total | | | | 21,006,553 | |
| | | |
| | | | | | | | | | | | |
Wirelines 1.6% | | | | | | | | | | | | |
AT&T, Inc.
Senior Unsecured | | | | | | | | | | | | |
08/15/15 | | | 2.500% | | | | 8,000,000 | | | | 8,258,180 | |
12/01/22 | | | 2.625% | | | | 10,600,000 | | | | 9,460,935 | |
|
CenturyLink, Inc.
Senior Unsecured | |
06/15/21 | | | 6.450% | | | | 6,702,000 | | | | 6,668,490 | |
|
Embarq Corp.
Senior Unsecured | |
06/01/36 | | | 7.995% | | | | 2,495,000 | | | | 2,560,761 | |
|
Frontier Communications Corp.
Senior Unsecured | |
04/15/22 | | | 8.750% | | | | 121,000 | | | | 130,982 | |
01/15/23 | | | 7.125% | | | | 88,000 | | | | 85,580 | |
04/15/24 | | | 7.625% | | | | 68,000 | | | | 66,470 | |
|
Level 3 Communications, Inc.
Senior Unsecured | |
02/01/19 | | | 11.875% | | | | 50,000 | | | | 57,375 | |
06/01/19 | | | 8.875% | | | | 323,000 | | | | 344,802 | |
|
Level 3 Financing, Inc. | |
04/01/19 | | | 9.375% | | | | 190,000 | | | | 208,525 | |
07/01/19 | | | 8.125% | | | | 475,000 | | | | 502,312 | |
07/15/20 | | | 8.625% | | | | 150,000 | | | | 160,500 | |
|
PAETEC Holding Corp. | |
12/01/18 | | | 9.875% | | | | 200,000 | | | | 222,500 | |
|
Qtel International Finance, Ltd.(a) | |
02/21/23 | | | 3.250% | | | | 450,000 | | | | 403,794 | |
|
Qwest Corp.
Senior Unsecured | |
09/15/25 | | | 7.250% | | | | 3,978,000 | | | | 4,399,935 | |
|
Telecom Italia Capital SA | |
06/04/18 | | | 6.999% | | | | 4,330,000 | | | | 4,686,095 | |
07/18/36 | | | 7.200% | | | | 1,518,000 | | | | 1,475,624 | |
|
Telefonica Celular del Paraguay SA
Senior Unsecured(a) | |
12/13/22 | | | 6.750% | | | | 200,000 | | | | 201,001 | |
|
Telefonica Emisiones SAU | |
06/20/16 | | | 6.421% | | | | 1,925,000 | | | | 2,107,758 | |
07/03/17 | | | 6.221% | | | | 1,125,000 | | | | 1,230,437 | |
04/27/18 | | | 3.192% | | | | 5,645,000 | | | | 5,507,589 | |
04/27/20 | | | 5.134% | | | | 765,000 | | | | 772,876 | |
02/16/21 | | | 5.462% | | | | 4,040,000 | | | | 4,126,467 | |
04/27/23 | | | 4.570% | | | | 1,250,000 | | | | 1,181,792 | |
The accompanying Notes to Financial Statements are an integral part of this statement.
| | |
| |
| | Active Portfolios® Multi-Manager Core Plus Bond Fund |
Portfolio of Investments (continued)
August 31, 2013
| | | | | | | | | | | | |
| Corporate Bonds & Notes (continued) | |
| Issuer | | Coupon
Rate | | | Principal
Amount ($) | | | Value ($) | |
| | | | | | | | | | |
Verizon Communications, Inc.
Senior Unsecured | |
04/15/18 | | | 6.100% | | | | 2,000,000 | | | | 2,309,084 | |
11/01/22 | | | 2.450% | | | | 2,665,000 | | | | 2,345,363 | |
|
Verizon New England, Inc. | |
11/15/29 | | | 7.875% | | | | 985,000 | | | | 1,179,664 | |
|
Verizon New York, Inc. | |
04/01/32 | | | 7.375% | | | | 2,913,000 | | | | 3,338,117 | |
|
Verizon Virginia LLC | |
10/01/29 | | | 8.375% | | | | 1,255,000 | | | | 1,515,007 | |
|
Windstream Holdings, Inc. | |
08/01/23 | | | 6.375% | | | | 108,000 | | | | 97,605 | |
|
Zayo Group LLC/Capital, Inc. | |
07/01/20 | | | 10.125% | | | | 253,000 | | | | 287,155 | |
| | | | | | | | | | | | | |
Total | | | | 65,892,775 | |
| | | | | | | | | | | | | |
Total Corporate Bonds & Notes | | | | | |
(Cost: $1,456,968,129) | | | | 1,423,386,675 | |
| | | |
| | | | | | | | | | | | |
| Residential Mortgage-Backed Securities — Agency 22.5% | |
Federal Home Loan Mortgage Corp.(b)(e) | |
CMO Series 3085 Class FV | |
08/15/35 | | | 0.884% | | | | 5,178,563 | | | | 5,238,484 | |
|
Federal Home Loan Mortgage Corp.(b)(e)(f) | |
CMO IO Series 3404 Class AS | |
01/15/38 | | | 5.711% | | | | 13,130,277 | | | | 2,073,645 | |
|
Federal Home Loan Mortgage Corp.(e) | |
01/01/17 - 02/01/25 | | | 8.000% | | | | 64,404 | | | | 74,902 | |
03/01/17 - 08/01/22 | | | 8.500% | | | | 22,064 | | | | 25,145 | |
06/01/19 - 07/01/41 | | | 4.500% | | | | 14,507,639 | | | | 15,316,107 | |
02/01/20 - 01/01/42 | | | 4.000% | | | | 23,566,075 | | | | 24,562,336 | |
04/01/21 | | | 9.000% | | | | 3,214 | | | | 3,525 | |
01/01/22 - 09/01/39 | | | 5.500% | | | | 7,095,704 | | | | 7,683,658 | |
07/01/23 - 05/01/41 | | | 5.000% | | | | 5,599,623 | | | | 6,034,164 | |
11/01/27 | | | 2.500% | | | | 9,355,879 | | | | 9,300,708 | |
10/01/28 - 07/01/32 | | | 7.000% | | | | 704,841 | | | | 812,261 | |
10/01/31 - 09/01/37 | | | 6.000% | | | | 3,076,532 | | | | 3,437,552 | |
11/01/36 - 10/01/37 | | | 6.500% | | | | 1,340,749 | | | | 1,499,841 | |
04/01/42 - 07/01/43 | | | 3.500% | | | | 26,353,667 | | | | 26,311,614 | |
11/01/42 - 07/01/43 | | | 3.000% | | | | 19,694,830 | | | | 18,866,228 | |
CMO STRIPS Series 276 Class 30 | |
09/15/42 | | | 3.000% | | | | 12,013,751 | | | | 11,291,971 | |
CMO STRIPS Series 277 Class 30 | |
09/15/42 | | | 3.000% | | | | 13,298,676 | | | | 12,502,857 | |
CMO Series 4037 Class CA | |
04/15/27 | | | 3.000% | | | | 6,129,117 | | | | 6,059,126 | |
Series 204048 Class AZ | |
03/15/42 | | | 4.000% | | | | 1,276,178 | | | | 1,272,596 | |
|
Federal National Mortgage Association(b)(e) | |
CMO Series 2003-134 Class FC | |
12/25/32 | | | 0.784% | | | | 7,137,607 | | | | 7,186,357 | |
CMO Series 2003-90 Class SL | |
03/25/31 | | | 16.205% | | | | 303,457 | | | | 310,306 | |
| | | | | | | | | | | | |
| Residential Mortgage-Backed Securities — Agency (continued) | |
| Issuer | | Coupon
Rate | | | Principal
Amount ($) | | | Value ($) | |
| | | | | | | | | | |
CMO Series 2007-W7 Class 1A4 | |
07/25/37 | | | 38.076% | | | | 831,300 | | | | 1,416,288 | |
CMO Series 2012-1 Class FA | |
02/25/42 | | | 0.684% | | | | 7,105,468 | | | | 7,174,050 | |
CMO Series 2012-110 Class CF | |
10/25/42 | | | 0.684% | | | | 16,667,704 | | | | 16,782,111 | |
|
Federal National Mortgage Association(e) | |
11/01/22 - 10/01/27 | | | 2.500% | | | | 25,960,985 | | | | 26,229,503 | |
04/01/23 | | | 8.500% | | | | 22,707 | | | | 24,784 | |
06/01/24 | | | 9.000% | | | | 25,667 | | | | 28,922 | |
02/01/25 - 08/01/27 | | | 8.000% | | | | 104,297 | | | | 122,764 | |
10/01/25 - 05/01/43 | | | 3.500% | | | | 26,851,161 | | | | 27,213,066 | |
03/01/26 - 07/01/38 | | | 7.000% | | | | 2,139,424 | | | | 2,412,935 | |
11/01/26 - 07/01/33 | | | 3.000% | | | | 68,368,660 | | | | 68,849,767 | |
04/01/27 - 06/01/32 | | | 7.500% | | | | 219,501 | | | | 251,942 | |
05/01/29 - 10/01/40 | | | 6.000% | | | | 11,696,646 | | | | 12,987,015 | |
05/01/32 - 10/01/38 | | | 6.500% | | | | 1,020,799 | | | | 1,136,744 | |
09/01/32 - 05/01/43 | | | 4.000% | | | | 100,077,022 | | | | 103,688,574 | |
03/01/33 - 04/01/41 | | | 5.500% | | | | 6,693,309 | | | | 7,335,258 | |
07/01/34 - 10/01/41 | | | 5.000% | | | | 21,434,964 | | | | 23,305,480 | |
07/01/40 - 02/01/42 | | | 4.500% | | | | 42,141,623 | | | | 44,642,173 | |
CMO Series 2009-111 Class DA | |
12/25/39 | | | 5.000% | | | | 2,253,877 | | | | 2,414,443 | |
|
Federal National Mortgage Association(e)(f) | |
CMO IO Series 2003-71 Class IM | |
12/25/31 | | | 5.500% | | | | 182,627 | | | | 10,713 | |
|
Federal National Mortgage Association(e)(g) | |
CMO PO STRIPS Series 43 Class 1 | |
09/01/18 | | | 0.000% | | | | 1,312 | | | | 1,288 | |
|
Federal National Mortgage Association(e)(h) | |
09/01/28 - 09/01/43 | | | 3.000% | | | | 111,265,000 | | | | 111,715,770 | |
03/01/43 - 09/01/43 | | | 3.500% | | | | 122,027,049 | | | | 121,998,357 | |
09/01/43 | | | 4.000% | | | | 50,840,000 | | | | 52,516,134 | |
|
Federal National Mortgage Association(e)(i) | |
09/01/41 | | | 4.000% | | | | 14,370,737 | | | | 14,875,145 | |
|
Government National Mortgage Association(b)(e)(j) | |
CMO Series 2013-H19 Class FC | |
08/20/63 | | | 0.795% | | | | 6,000,000 | | | | 6,000,000 | |
|
Government National Mortgage Association(e) | |
03/15/38 - 09/20/41 | | | 4.500% | | | | 15,291,290 | | | | 16,382,094 | |
03/15/40 - 05/15/40 | | | 5.000% | | | | 3,219,614 | | | | 3,489,518 | |
09/15/41 - 08/20/42 | | | 3.500% | | | | 10,315,817 | | | | 10,440,796 | |
11/20/41 - 02/15/42 | | | 4.000% | | | | 5,926,623 | | | | 6,235,620 | |
05/15/42 | | | 3.000% | | | | 5,294,436 | | | | 5,139,819 | |
CMO Series 2013-53 Class AD | |
12/20/26 | | | 1.500% | | | | 15,214,904 | | | | 15,329,212 | |
|
Government National Mortgage Association(e)(h) | |
09/01/43 | | | 3.000% | | | | 12,190,000 | | | | 11,820,489 | |
09/01/43 | | | 3.500% | | | | 21,110,000 | | | | 21,320,433 | |
| | | | | | | | | | | | | |
Total Residential Mortgage-Backed Securities — Agency | |
(Cost: $920,001,849) | | | | 903,154,590 | |
The accompanying Notes to Financial Statements are an integral part of this statement.
| | |
| |
| Active Portfolios® Multi-Manager Core Plus Bond Fund | | |
Portfolio of Investments (continued)
August 31, 2013
| | | | | | | | | | | | |
| Residential Mortgage-Backed Securities — Non-Agency 5.3% | |
| Issuer | | Coupon
Rate | | | Principal
Amount ($) | | | Value ($) | |
| | | | | | | | | | |
American General Mortgage Loan Trust(a)(b)(e) | |
CMO Series 2009-1 Class A7 | |
09/25/48 | | | 5.750% | | | | 4,495,236 | | | | 4,605,666 | |
CMO Series 2010-1A Class A1 | |
03/25/58 | | | 5.150% | | | | 265,302 | | | | 267,909 | |
|
American Home Mortgage Investment Trust
CMO Series 2007-1 Class GA1C(b)(e) | |
05/25/47 | | | 0.374% | | | | 8,794,243 | | | | 5,589,471 | |
|
BCAP LLC Trust(a)(b)(e) | |
CMO Series 2012-RR10 Class 5A5 | |
04/26/36 | | | 0.453% | | | | 4,029,604 | | | | 3,893,529 | |
|
BCAP LLC Trust(a)(b)(e) | |
09/26/36 | | | 3.500% | | | | 3,925,848 | | | | 4,021,561 | |
01/26/37 | | | 0.360% | | | | 2,494,219 | | | | 2,424,748 | |
08/26/36 | | | 0.310% | | | | 1,673,576 | | | | 1,634,776 | |
CMO Series 2013-RR5 Class 1A1 | |
10/26/36 | | | 3.500% | | | | 3,377,066 | | | | 3,453,050 | |
|
BCAP LLC Trust(b)(e) | |
CMO Series 2007-AA1 Class 1A2 | |
02/25/47 | | | 0.344% | | | | 4,337,680 | | | | 3,691,058 | |
|
BCAP LLC(a)(b)(e) | |
05/26/47 | | | 0.394% | | | | 1,635,794 | | | | 1,463,136 | |
CMO Series 2013-RR3 Class 2A1 | |
02/26/37 | | | 2.472% | | | | 1,288,927 | | | | 1,287,236 | |
Series 2013-RR2 Class 7A1 | |
07/26/36 | | | 3.000% | | | | 2,042,602 | | | | 2,016,886 | |
|
BNPP Mortgage Securities LLC
CMO Series 2009-1 Class A1(a)(e) | |
08/27/37 | | | 6.000% | | | | 792,022 | | | | 830,040 | |
|
Banc of America Funding Corp.(a)(b)(e) | |
CMO Series 2012-R5 Class A | |
10/03/39 | | | 0.447% | | | | 2,700,120 | | | | 2,638,637 | |
|
Banc of America Funding Corp.(b)(e) | |
CMO Series 2006-D Class 3A1 | |
05/20/36 | | | 2.863% | | | | 4,949,937 | | | | 4,210,516 | |
|
Banc of America Funding Trust(e) | |
CMO Series 2006-3 Class 4A14 | |
03/25/36 | | | 6.000% | | | | 3,795,310 | | | | 3,741,177 | |
CMO Series 2006-3 Class 5A3 | |
03/25/36 | | | 5.500% | | | | 3,847,891 | | | | 3,648,466 | |
|
Bayview Opportunity Master Fund Trust IIB LP(a)(b)(e) | |
CMO Series 2012-6NPL Class A | |
01/28/33 | | | 2.981% | | | | 871,223 | | | | 866,867 | |
Series 2012-4NPL Class A | |
07/28/32 | | | 3.475% | | | | 517,952 | | | | 518,515 | |
|
Citicorp Mortgage Securities, Inc.
CMO Series 2007-8 Class 1A3(e) | |
09/25/37 | | | 6.000% | | | | 2,643,062 | | | | 2,700,078 | |
|
Citigroup Mortgage Loan Trust, Inc.(a)(b)(e) | |
CMO Series 2012-7 Class 12A1 | |
03/25/36 | | | 2.641% | | | | 1,172,813 | | | | 1,200,783 | |
CMO Series 2012-9 Class 1A1 | |
02/20/36 | | | 5.143% | | | | 2,158,939 | | | | 2,189,102 | |
CMO Series 2013-2 Class 1A1 | |
11/25/37 | | | 5.977% | | | | 2,283,992 | | | | 2,382,469 | |
| | | | | | | | | | | | |
| Residential Mortgage-Backed Securities — Non-Agency (continued) | |
| Issuer | | Coupon
Rate | | | Principal
Amount ($) | | | Value ($) | |
| | | | | | | | | | |
Citigroup Mortgage Loan Trust, Inc.(a)(e)(j) | |
CMO Series 2012-A Class A | |
06/25/51 | | | 2.500% | | | | 1,732,254 | | | | 1,680,286 | |
|
Citigroup Mortgage Loan Trust, Inc.(b)(e) | |
CMO Series 2005-8 Class 1A1A | |
10/25/35 | | | 2.769% | | | | 4,663,629 | | | | 3,783,467 | |
|
Countrywide Home Loan Mortgage Pass-Through Trust
CMO Series 2007-HY5 Class 1A1(b)(e) | |
09/25/47 | | | 2.905% | | | | 2,096,853 | | | | 1,678,319 | |
|
Credit Suisse First Boston Mortgage Securities Corp.
CMO Series 2005-11 Class 8A9(e) | |
12/25/35 | | | 5.250% | | | | 2,015,407 | | | | 2,025,138 | |
|
Credit Suisse Mortgage Capital Certificates(a)(b)(e) | |
CMO Series 2010-12R Class 13A1 | |
12/26/37 | | | 2.888% | | | | 88,152 | | | | 88,021 | |
CMO Series 2011-16R Class 7A3 | |
12/27/36 | | | 3.500% | | | | 840,063 | | | | 853,699 | |
CMO Series 2011-17R Class 2A1 | |
12/27/37 | | | 3.400% | | | | 841,337 | | | | 847,349 | |
CMO Series 2011-17R Class 3A1 | |
10/27/35 | | | 2.410% | | | | 3,090,551 | | | | 3,113,832 | |
CMO Series 2012-4R Class 8A1 | |
06/27/47 | | | 3.262% | | | | 1,156,574 | | | | 1,158,137 | |
CMO Series 2013-IVR3 Class A2 | |
05/25/43 | | | 3.000% | | | | 2,979,861 | | | | 2,736,653 | |
|
Downey Savings & Loan Association Mortgage Loan Trust(b)(e) | |
CMO Series 2005-AR6 Class 2A1A | |
10/19/45 | | | 0.474% | | | | 4,005,974 | | | | 3,311,058 | |
CMO Series 2006-AR2 Class 2A1A | |
10/19/36 | | | 0.384% | | | | 4,271,554 | | | | 3,421,511 | |
|
First Horizon Asset Securities, Inc.
CMO Series 2007-AR1 Class 1A1(b)(e) | |
05/25/37 | | | 2.618% | | | | 1,277,292 | | | | 998,093 | |
|
GCAT
Series 2013-RP1 Class A1(a)(b)(e) | |
06/25/18 | | | 3.500% | | | | 2,125,519 | | | | 2,080,351 | |
|
GSR Mortgage Loan Trust
CMO Series 2006-AR2 Class 2A1(b)(e) | |
04/25/36 | | | 2.873% | | | | 4,599,601 | | | | 4,194,440 | |
|
GreenPoint Mortgage Funding Trust
CMO Series 2006-AR8 Class 1A2A(b)(e) | |
01/25/47 | | | 0.364% | | | | 4,004,897 | | | | 3,491,749 | |
|
Indymac Index Mortgage Loan Trust
CMO Series 2006-AR3 Class 1A1(b)(e) | |
12/25/36 | | | 2.883% | | | | 4,018,567 | | | | 3,338,758 | |
|
JPMorgan Mortgage Trust(e) | |
CMO Series 2006-S2 Class 2A2 | |
06/25/21 | | | 5.875% | | | | 2,965,359 | | | | 2,966,992 | |
CMO Series 2007-S1 Class 1A2 | |
03/25/22 | | | 5.500% | | | | 2,052,002 | | | | 2,034,714 | |
|
Jefferies & Co., Inc.
CMO Series 2010-R7 Class 7A4(a)(b)(e) | |
10/26/36 | | | 3.250% | | | | 462,227 | | | | 449,370 | |
The accompanying Notes to Financial Statements are an integral part of this statement.
| | |
| |
| | Active Portfolios® Multi-Manager Core Plus Bond Fund |
Portfolio of Investments (continued)
August 31, 2013
| | | | | | | | | | | | |
| Residential Mortgage-Backed Securities — Non-Agency (continued) | |
| Issuer | | Coupon
Rate | | | Principal
Amount ($) | | | Value ($) | |
| | | | | | | | | | |
Lehman XS Trust(b)(e) | |
CMO Series 2006-10N Class 1A3A | |
07/25/46 | | | 0.394% | | | | 5,262,002 | | | | 3,782,379 | |
Series 2005-4 Class 1A3 | |
10/25/35 | | | 0.584% | | | | 4,227,546 | | | | 3,976,404 | |
Series 2005-5N Class 3A1A | |
11/25/35 | | | 0.484% | | | | 6,117,533 | | | | 5,053,450 | |
|
Lehman XS Trust(c)(e) | |
CMO Series 2007-10H Class 2A2 | |
07/25/37 | | | 7.500% | | | | 3,533,959 | | | | 2,828,591 | |
|
MASTR Adjustable Rate Mortgages Trust
CMO Series 2006-OA1 Class 1A1(b)(e) | |
04/25/46 | | | 0.394% | | | | 3,236,876 | | | | 2,269,202 | |
|
MASTR Alternative Loans Trust
CMO Series 2004-12 Class 4A1(e) | |
12/25/34 | | | 5.500% | | | | 2,352,109 | | | | 2,501,875 | |
|
Morgan Stanley Re-Remic Trust(a)(b)(e)(j) | |
CMO Series 2012-R2 Class 1A | |
11/26/36 | | | 0.344% | | | | 1,287,238 | | | | 1,242,545 | |
10/26/36 | | | 4.385% | | | | 3,789,236 | | | | 3,732,398 | |
|
Morgan Stanley Re-Remic Trust(a)(b)(e) | |
CMO Series 2013-R1 Class 4A | |
12/26/36 | | | 2.360% | | | | 1,836,956 | | | | 1,874,586 | |
|
MortgageIT Trust
CMO Series 2005-5 Class A1(b)(e) | |
12/25/35 | | | 0.444% | | | | 4,727,056 | | | | 4,105,741 | |
|
Nomura Asset Acceptance Corp.(b)(e) | |
CMO Series 2007-1 Class 1A3 (AGM) | |
03/25/47 | | | 5.957% | | | | 135,554 | | | | 135,298 | |
CMO Series 2007-1 Class 1A4 (AGM) | |
03/25/47 | | | 6.138% | | | | 858,507 | | | | 856,759 | |
|
Nomura Resecuritization Trust
CMO Series 2012-3R Class 1A1(a)(b)(e) | |
01/26/37 | | | 0.363% | | | | 1,699,220 | | | | 1,595,450 | |
|
RALI Trust(b)(d)(e)(f) | |
CMO IO Series 2006-QS18 Class 1AV | |
12/25/36 | | | 0.407% | | | | 110,550,660 | | | | 1,736,198 | |
CMO IO Series 2006-QS9 Class 1AV | |
07/25/36 | | | 0.597% | | | | 54,913,355 | | | | 1,297,877 | |
CMO IO Series 2007-QS1 Class 2AV | |
01/25/37 | | | 0.174% | | | | 112,837,006 | | | | 818,971 | |
|
RALI Trust(b)(e) | |
CMO Series 2005-QA4 Class A41 | |
04/25/35 | | | 3.071% | | | | 3,249,931 | | | | 3,101,630 | |
CMO Series 2006-QO9 Class 1A4A | |
12/25/46 | | | 0.354% | | | | 4,123,877 | | | | 3,401,333 | |
|
RFMSI Trust(b)(e) | |
CMO Series 2005-SA5 Class 1A | |
11/25/35 | | | 3.075% | | | | 3,595,661 | | | | 2,735,378 | |
CMO Series 2006-SA4 Class 2A1 | |
11/25/36 | | | 3.802% | | | | 1,094,620 | | | | 904,159 | |
|
Residential Mortgage Asset Trust
Series 2012-1A Class A1(a)(b)(e) | |
08/26/52 | | | 2.734% | | | | 1,091,231 | | | | 1,080,830 | |
| | | | | | | | | | | | |
| Residential Mortgage-Backed Securities — Non-Agency (continued) | |
| Issuer | | Coupon
Rate | | | Principal
Amount ($) | | | Value ($) | |
| | | | | | | | | | |
Sequoia Mortgage Trust(b)(e) | |
CMO Series 2013-2 Class A1 | |
02/25/43 | | | 1.874% | | | | 5,532,427 | | | | 4,815,131 | |
CMO Series 2013-6 Class A2 | |
05/25/43 | | | 3.000% | | | | 2,962,902 | | | | 2,718,020 | |
|
Springleaf Mortgage Loan Trust
CMO Series 2012-1A Class A(a)(b)(e) | |
09/25/57 | | | 2.667% | | | | 1,170,798 | | | | 1,192,536 | |
|
Structured Adjustable Rate Mortgage Loan Trust(b)(e) | |
CMO Series 2004-20 Class 1A2 | |
01/25/35 | | | 2.534% | | | | 2,109,042 | | | | 1,954,056 | |
CMO Series 2006-5 Class 1A1 | |
06/25/36 | | | 2.724% | | | | 4,713,447 | | | | 3,555,787 | |
CMO Series 2007-5 Class 2A1 | |
06/25/37 | | | 4.760% | | | | 2,859,831 | | | | 2,453,280 | |
|
Structured Asset Securities Corp.
CMO Series 2004-21XS Class 2A6A(b)(e) | |
12/25/34 | | | 4.740% | | | | 215,458 | | | | 217,699 | |
|
VOLT LLC
Series 2012-RP3A Class A1(a)(b)(e) | |
11/27/17 | | | 3.475% | | | | 579,500 | | | | 580,691 | |
|
WaMu Mortgage Pass-Through Certificates(b)(e) | |
CMO Series 2005-AR11 Class A1A | |
08/25/45 | | | 0.504% | | | | 3,513,735 | | | | 3,217,524 | |
CMO Series 2005-AR17 Class A1A1 | |
12/25/45 | | | 0.454% | | | | 7,961,633 | | | | 7,079,673 | |
CMO Series 2005-AR19 Class A1A1 | |
12/25/45 | | | 0.454% | | | | 4,537,419 | | | | 4,086,469 | |
CMO Series 2005-AR2 Class 2A1A | |
01/25/45 | | | 0.494% | | | | 2,477,057 | | | | 2,260,074 | |
CMO Series 2005-AR8 Class 2A1A | |
07/25/45 | | | 0.498% | | | | 3,446,274 | | | | 3,138,711 | |
CMO Series 2005-AR9 Class A1A | |
07/25/45 | | | 0.504% | | | | 3,343,116 | | | | 3,065,417 | |
CMO Series 2006-AR4 Class 1A1A | |
05/25/46 | | | 1.098% | | | | 5,331,371 | | | | 4,706,018 | |
CMO Series 2006-AR5 Class A12A | |
06/25/46 | | | 1.138% | | | | 1,598,631 | | | | 1,423,690 | |
CMO Series 2007-HY1 Class 4A1 | |
02/25/37 | | | 2.544% | | | | 3,789,910 | | | | 3,207,658 | |
CMO Series 2007-HY3 Class 1A1 | |
03/25/37 | | | 2.298% | | | | 1,787,387 | | | | 1,386,939 | |
|
Washington Mutual Alternative Mortgage Pass-Through Certificates(b)(e) | |
CMO Series 2007-OA3 Class 5A | |
04/25/47 | | | 2.204% | | | | 3,103,767 | | | | 2,002,262 | |
CMO Series 2007-OC2 Class A3 | |
06/25/37 | | | 0.494% | | | | 7,118,323 | | | | 5,035,836 | |
|
Wells Fargo Mortgage-Backed Securities Trust
CMO Series 2006-AR17 Class A1(b)(e) | |
10/25/36 | | | 2.631% | | | | 3,143,369 | | | | 2,801,506 | |
| | | | | | | | | | | | | |
Total Residential Mortgage-Backed Securities — Non-Agency | |
(Cost: $201,702,737) | | | | 213,457,644 | |
The accompanying Notes to Financial Statements are an integral part of this statement.
| | |
| |
| Active Portfolios® Multi-Manager Core Plus Bond Fund | | |
Portfolio of Investments (continued)
August 31, 2013
| | | | | | | | | | | | |
| Commercial Mortgage-Backed Securities —Agency 2.1% | |
| Issuer | | Coupon
Rate | | | Principal
Amount ($) | | | Value ($) | |
| | | | | | | | | | |
Federal Home Loan Mortgage Corp.
Structured Pass-Through Certificates
Series K020 Class A2(e) | |
05/25/40 | | | 2.373% | | | | 7,685,000 | | | | 7,154,922 | |
| |
Federal Home Loan Mortgage Corp.
Multifamily Structured Pass-Through Certificates
Series K004 Class A2(e) | | | | | |
08/25/19 | | | 4.186% | | | | 5,000,000 | | | | 5,405,875 | |
| |
Federal National Mortgage Association(b)(e)
Series 2012-M12 Class 1A | | | | | |
08/25/22 | | | 2.935% | | | | 11,734,844 | | | | 11,512,065 | |
Series 2012-M15 Class A | | | | | |
10/25/22 | | | 2.745% | | | | 7,783,347 | | | | 7,492,079 | |
| |
Federal National Mortgage Association(e) | | | | | |
09/01/20 | | | 3.584% | | | | 5,628,847 | | | | 5,859,994 | |
12/01/20 | | | 3.763% | | | | 4,784,354 | | | | 5,039,861 | |
11/01/20 | | | 3.375% | | | | 5,482,438 | | | | 5,629,690 | |
04/01/21 | | | 4.377% | | | | 5,814,455 | | | | 6,258,578 | |
06/01/21 | | | 4.426% | | | | 6,943,175 | | | | 7,532,985 | |
12/01/20 | | | 3.522% | | | | 5,845,043 | | | | 6,052,252 | |
05/01/23 | | | 2.460% | | | | 8,302,143 | | | | 7,744,803 | |
11/01/22 | | | 2.646% | | | | 7,107,692 | | | | 7,095,226 | |
| | | | | | | | | | | | | |
Total Commercial Mortgage-Backed Securities — Agency | |
(Cost: $87,517,894) | | | | | | | | | | | 82,778,330 | |
| | | |
| | | | | | | | | | | | |
| Commercial Mortgage-Backed Securities — Non-Agency 5.3% | |
Banc of America Commercial Mortgage, Inc.
Series 2005-6 Class A4(b)(e) | | | | | |
09/10/47 | | | 5.358% | | | | 4,450,000 | | | | 4,773,088 | |
|
Banc of America Merrill Lynch Commercial Mortgage, Inc.
Series 2007-4 Class AM(b)(e) | |
02/10/51 | | | 6.001% | | | | 2,300,000 | | | | 2,488,561 | |
| |
Citigroup Commercial Mortgage Trust(e)
Series 2006-C5 Class A4 | | | | | |
10/15/49 | | | 5.431% | | | | 1,588,000 | | | | 1,744,212 | |
Series 2013-GC11 Class AS | |
04/10/23 | | | 3.422% | | | | 2,200,000 | | | | 2,066,940 | |
|
Citigroup/Deutsche Bank Commercial Mortgage Trust(b)(e)
Series 2005-CD1 Class A4 | |
07/15/44 | | | 5.393% | | | | 830,000 | | | | 889,316 | |
|
Citigroup/Deutsche Bank Commercial Mortgage Trust(e)
Series 2007-CD4 Class A4 | |
12/11/49 | | | 5.322% | | | | 6,379,000 | | | | 6,978,073 | |
| |
Commercial Mortgage Pass-Through Certificates(b)(e)
Series 2005-C6 Class A5A | | | | | |
06/10/44 | | | 5.116% | | | | 4,635,000 | | | | 4,931,997 | |
| |
Commercial Mortgage Pass-Through Certificates(e)
Series 2013-LC6 Class A2 | | | | | |
01/10/46 | | | 1.906% | | | | 390,000 | | | | 385,399 | |
| |
Commercial Mortgage Trust
Series 2013-CR8 Class B(a)(b)(e) | | | | | |
06/10/46 | | | 4.104% | | | | 5,500,000 | | | | 5,191,120 | |
| | | | | | | | | | | | |
| Commercial Mortgage-Backed Securities — Non-Agency (continued) | |
| Issuer | | Coupon
Rate | | | Principal
Amount ($) | | | Value ($) | |
| | | | | | | | | | |
Credit Suisse Commercial Mortgage Trust
Series 2006-C3 Class A3(b)(e) | | | | | |
06/15/38 | | | 5.992% | | | | 1,085,305 | | | | 1,184,641 | |
|
Credit Suisse First Boston Mortgage Securities Corp.
Series 2004-C2 Class A1(e) | |
05/15/36 | | | 3.819% | | | | 49,763 | | | | 49,955 | |
| |
Credit Suisse Mortgage Capital Certificates
Series 2010-RR4 Class 2A(a)(b)(e) | | | | | |
09/18/39 | | | 5.467% | | | | 1,509,360 | | | | 1,651,984 | |
| |
DBRR Trust(a)(b)(e)
Series 2013-EZ2 Class A | | | | | |
02/25/45 | | | 0.853% | | | | 5,290,925 | | | | 5,292,565 | |
| |
DBRR Trust(a)(e)
Series 2012-EZ1 Class A | | | | | |
09/25/45 | | | 0.946% | | | | 7,834,050 | | | | 7,846,036 | |
09/25/45 | | | 1.393% | | | | 581,000 | | | | 578,536 | |
09/25/45 | | | 2.062% | | | | 2,574,943 | | | | 2,557,062 | |
| |
DBUBS Mortgage Trust
Series 2011-LC3A Class A2(e) | | | | | |
08/10/44 | | | 3.642% | | | | 5,200,000 | | | | 5,471,440 | |
| |
GE Capital Commercial Mortgage Corp.
Series 2005-C1 Class A5(b)(e) | | | | | |
06/10/48 | | | 4.772% | | | | 651,000 | | | | 682,300 | |
| |
GS Mortgage Securities Corp. II(b)(e)
Series 2007-GG10 Class A4 | | | | | |
08/10/45 | | | 5.995% | | | | 3,467,000 | | | | 3,816,976 | |
| |
GS Mortgage Securities Corp. II(e)
Series 2005-GG4 Class A4A | | | | | |
07/10/39 | | | 4.751% | | | | 2,500,000 | | | | 2,608,655 | |
Series 2011-GC5 Class A4 | |
08/10/44 | | | 3.707% | | | | 5,000,000 | | | | 5,049,425 | |
Series 2012-GCJ7 Class A2 | |
05/10/45 | | | 2.318% | | | | 590,000 | | | | 598,673 | |
| |
General Electric Capital Assurance Co.(a)(b)(e)
Series 2003-1 Class A4 | | | | | |
05/12/35 | | | 5.254% | | | | 928,286 | | | | 968,699 | |
Series 2003-1 Class A5 | |
05/12/35 | | | 5.743% | | | | 1,704,000 | | | | 1,941,976 | |
| |
Greenwich Capital Commercial Funding Corp.(b)(e)
Series 2005-GG5 Class AM | | | | | |
04/10/37 | | | 5.277% | | | | 4,717,000 | | | | 4,980,053 | |
Series 2006-GG7 Class AM | |
07/10/38 | | | 6.056% | | | | 2,095,000 | | | | 2,282,544 | |
| |
Greenwich Capital Commercial Funding Corp.(e)
Series 2007-GG11 Class A4 | | | | | |
12/10/49 | | | 5.736% | | | | 5,975,000 | | | | 6,644,405 | |
Series 2007-GG9 Class A4 | |
03/10/39 | | | 5.444% | | | | 3,160,000 | | | | 3,468,707 | |
| |
JPMBB Commercial Mortgage Securities Trust
Series 2013-C14 Class A4(b)(e) | | | | | |
08/15/46 | | | 4.133% | | | | 670,000 | | | | 680,525 | |
|
JPMorgan Chase Commercial Mortgage Securities Corp.(b)(e)
Series 2006-LDP6 Class ASB | |
04/15/43 | | | 5.490% | | | | 1,835,056 | | | | 1,897,758 | |
The accompanying Notes to Financial Statements are an integral part of this statement.
| | |
| |
| | Active Portfolios® Multi-Manager Core Plus Bond Fund |
Portfolio of Investments (continued)
August 31, 2013
| | | | | | | | | | | | |
| Commercial Mortgage-Backed Securities — Non-Agency (continued) | |
| Issuer | | Coupon
Rate | | | Principal
Amount ($) | | | Value ($) | |
| | | | | | | | | | |
Series 2007-CB19 Class A4 | |
02/12/49 | | | 5.900% | | | | 3,825,000 | | | | 4,262,817 | |
Series 2007-CB19 Class AM | | | | | |
02/12/49 | | | 5.900% | | | | 2,300,000 | | | | 2,434,131 | |
|
JPMorgan Chase Commercial Mortgage Securities Corp.(e)
Series 2006-LDP8 Class A4 | |
05/15/45 | | | 5.399% | | | | 5,340,000 | | | | 5,834,457 | |
|
JPMorgan Chase Commercial Mortgage Securities Trust(b)(e)
Series 2005-LDP3 Class ASB | |
08/15/42 | | | 4.893% | | | | 1,483,092 | | | | 1,529,802 | |
Series 2005-LDP5 Class A3 | |
12/15/44 | | | 5.396% | | | | 7,100,000 | | | | 7,236,348 | |
|
JPMorgan Chase Commercial Mortgage Securities Trust(e)
Series 2004-LN2 Class A1 | |
07/15/41 | | | 4.475% | | | | 204,099 | | | | 203,852 | |
Series 2005-CB12 Class A4 | |
09/12/37 | | | 4.895% | | | | 4,650,000 | | | | 4,918,231 | |
Series 2005-LDP2 Class A3 | |
07/15/42 | | | 4.697% | | | | 497,210 | | | | 497,073 | |
| |
LB-UBS Commercial Mortgage Trust(b)(e)
Series 2006-C4 Class AM | | | | | |
06/15/38 | | | 6.081% | | | | 700,000 | | | | 758,187 | |
Series 2007-C7 Class A3 | |
09/15/45 | | | 5.866% | | | | 1,249,429 | | | | 1,381,797 | |
| |
LB-UBS Commercial Mortgage Trust(e)
Series 2005-C3 Class A5 | | | | | |
07/15/30 | | | 4.739% | | | | 1,514,000 | | | | 1,586,372 | |
Series 2006-C1 Class A4 | |
02/15/31 | | | 5.156% | | | | 1,187,000 | | | | 1,274,487 | |
Series 2007-C2 Class A3 | |
02/15/40 | | | 5.430% | | | | 6,663,015 | | | | 7,296,942 | |
|
Merrill Lynch/Countrywide Commercial Mortgage Trust
Series 2007-6 Class A4(b)(e) | |
03/12/51 | | | 5.485% | | | | 3,885,000 | | | | 4,255,081 | |
| |
Morgan Stanley Capital I, Inc.(b)(e)
Series 2006-T23 Class A4 | | | | | |
08/12/41 | | | 5.987% | | | | 7,095,000 | | | | 7,838,272 | |
Series 2007-IQ15 Class A4 | |
06/11/49 | | | 6.090% | | | | 4,335,000 | | | | 4,832,203 | |
Series 2007-IQ16 Class A4 | | | | | |
12/12/49 | | | 5.809% | | | | 1,000,000 | | | | 1,118,324 | |
Series 2007-IQ16 Class AM | | | | | |
12/12/49 | | | 6.298% | | | | 6,000,000 | | | | 6,825,102 | |
| |
Morgan Stanley Capital I
Series 2007-T27 Class A4(b)(e) | | | | | |
06/11/42 | | | 5.816% | | | | 4,589,000 | | | | 5,148,092 | |
| |
Morgan Stanley Re-Remic Trust(a)(b)(e)
Series 2009-GG10 Class A4B | | | | | |
08/12/45 | | | 5.995% | | | | 2,220,000 | | | | 2,418,244 | |
Series 2010-GG10 Class A4A | | | | | |
08/15/45 | | | 5.995% | | | | 6,928,000 | | | | 7,657,200 | |
| |
ORES NPL LLC
Series 2012-LV1 Class A(a)(e) | | | | | |
09/25/44 | | | 4.000% | | | | 125,898 | | | | 125,849 | |
| | | | | | | | | | | | |
| Commercial Mortgage-Backed Securities — Non-Agency (continued) | |
| Issuer | | Coupon
Rate | | | Principal
Amount ($) | | | Value ($) | |
| | | | | | | | | | |
RIAL(a)(e) | | | | | |
06/20/28 | | | 2.500% | | | | 986,513 | | | | 986,513 | |
| |
Rialto Real Estate Fund
Series 2013-LT2 Class A(a)(e) | | | | | |
05/22/28 | | | 2.833% | | | | 848,349 | | | | 846,928 | |
| |
S2 Hospitality LLC
Series 2012-LV1 Class A(a)(e) | | | | | |
04/15/25 | | | 4.500% | | | | 194,100 | | | | 193,815 | |
| |
SMA 1 LLC
Series 2012-LV1 Class A(a)(e) | | | | | |
08/20/25 | | | 3.500% | | | | 284,044 | | | | 285,526 | |
| |
TIAA Seasoned Commercial Mortgage Trust
Series 2007-C4 Class A3(b)(e) | | | | | |
08/15/39 | | | 5.546% | | | | 604,318 | | | | 630,130 | |
| |
UBS-Barclays Commercial Mortgage Trust
Series 2013-C6 Class AS(e) | | | | | |
05/10/43 | | | 3.469% | | | | 800,000 | | | | 756,656 | |
| |
UBS-Citigroup Commercial Mortgage Trust
Series 2011-C1 Class AS(a)(e) | | | | | |
01/10/45 | | | 5.154% | | | | 3,600,000 | | | | 3,860,478 | |
| |
WF-RBS Commercial Mortgage Trust(a)(e)
Series 2011-C3 Class A4 | | | | | |
03/15/44 | | | 4.375% | | | | 3,170,000 | | | | 3,329,689 | |
| |
WF-RBS Commercial Mortgage Trust(e)
Series 2011-C5 Class A4 | | | | | |
11/15/44 | | | 3.667% | | | | 4,885,000 | | | | 4,891,902 | |
Series 2012-C6 Class AS | |
04/15/45 | | | 3.835% | | | | 5,500,000 | | | | 5,435,600 | |
Series 2012-C7 Class A2 | |
06/15/45 | | | 3.431% | | | | 7,495,000 | | | | 7,338,420 | |
Series 2012-C8 Class A3 | |
08/15/45 | | | 3.001% | | | | 2,880,000 | | | | 2,721,263 | |
Series 2013-C11 Class A2 | |
03/15/45 | | | 2.029% | | | | 870,000 | | | | 865,359 | |
| |
Wachovia Bank Commercial Mortgage Trust(b)(e)
Series 2005-C20 Class A7 | | | | | |
07/15/42 | | | 5.118% | | | | 4,705,000 | | | | 4,992,334 | |
Series 2006-C24 Class A3 | |
03/15/45 | | | 5.558% | | | | 1,547,000 | | | | 1,678,396 | |
Series 2006-C27 Class AM | |
07/15/45 | | | 5.795% | | | | 1,595,000 | | | | 1,728,691 | |
| |
Wells Fargo Commercial Mortgage Trust
Series 2013-LC12 Class A4(b)(e) | | | | | |
07/15/46 | | | 4.218% | | | | 2,000,000 | | | | 2,042,371 | |
| | | | | | | | | | | | | |
Total Commercial Mortgage-Backed Securities — Non-Agency | |
(Cost: $217,007,845) | | | | | | | | | | | 211,718,555 | |
| | | |
| | | | | | | | | | | | |
| Asset-Backed Securities — Agency 0.6% | |
Small Business Administration Participation Certificates
Series 2012-20L Class 1 | |
12/01/32 | | | 1.930% | | | | 511,942 | | | | 473,540 | |
Series 2013-20A Class 1 | |
01/01/33 | | | 2.130% | | | | 1,306,907 | | | | 1,218,466 | |
The accompanying Notes to Financial Statements are an integral part of this statement.
| | |
| |
| Active Portfolios® Multi-Manager Core Plus Bond Fund | | |
Portfolio of Investments (continued)
August 31, 2013
| | | | | | | | | | | | |
| Asset-Backed Securities — Agency (continued) | |
| Issuer | | Coupon
Rate | | | Principal
Amount ($) | | | Value ($) | |
| | | | | | | | | | |
Series 2013-20B Class 1 | |
02/01/33 | | | 2.210% | | | | 5,467,017 | | | | 5,120,775 | |
Series 2013-20C Class 1 | |
03/01/33 | | | 2.220% | | | | 4,305,000 | | | | 4,050,857 | |
Series 2013-20D Class 1 | |
04/01/33 | | | 2.080% | | | | 4,800,000 | | | | 4,472,765 | |
Series 2013-20F Class 1 | |
06/01/33 | | | 2.450% | | | | 3,330,000 | | | | 3,213,384 | |
Series 2013-20H Class 1 | |
08/01/33 | | | 3.160% | | | | 5,545,000 | | | | 5,528,642 | |
| | | | | | | | | | | | | |
Total Asset-Backed Securities — Agency | | | | | |
(Cost: $25,280,753) | | | | 24,078,429 | |
| | | |
| | | | | | | | | | | | |
| Asset-Backed Securities — Non-Agency 5.1% | |
ARES XXVI CLO Ltd.
Series 2013-1A Class A(a)(b) | | | | | |
04/15/25 | | | 1.410% | | | | 8,575,000 | | | | 8,485,854 | |
| |
Academic Loan Funding Trust
Series 2012-1A Class A2(a)(b) | | | | | |
12/27/44 | | | 1.284% | | | | 3,500,000 | | | | 3,501,643 | |
| |
Access Group, Inc.
Series 2005-2 Class A3(b) | | | | | |
11/22/24 | | | 0.442% | | | | 2,070,335 | | | | 2,032,293 | |
| |
Aircastle Aircraft Lease-Backed Trust
Series 2007-1A Class G1(a)(b) | | | | | |
06/14/37 | | | 0.495% | | | | 2,811,734 | | | | 2,540,683 | |
| |
Ally Master Owner Trust
Series 2012-5 Class A | | | | | |
09/15/19 | | | 1.540% | | | | 1,195,000 | | | | 1,173,354 | |
| |
Argent Securities, Inc.
Series 2005-W2 Class A2B1(b) | | | | | |
10/25/35 | | | 0.384% | | | | 4,622,183 | | | | 4,530,211 | |
| |
Arizona Educational Loan Marketing Corp.
Series 2004A Class A2(b) | | | | | |
12/01/23 | | | 0.495% | | | | 3,376,974 | | | | 3,372,752 | |
| |
Atrium X(a)(b)
Series 10A Class A | | | | | |
07/16/25 | | | 1.396% | | | | 8,000,000 | | | | 7,906,032 | |
Series 10A Class B1 | |
07/16/25 | | | 1.926% | | | | 1,250,000 | | | | 1,234,156 | |
| |
Babcock & Brown Air Funding I Ltd.
Series 2007-1A Class G1(a)(b) | | | | | |
11/14/33 | | | 0.542% | | | | 2,911,295 | | | | 2,474,601 | |
| |
Beacon Container Finance LLC
Series 2012-1A Class A(a) | | | | | |
09/20/27 | | | 3.720% | | | | 2,732,781 | | | | 2,723,539 | |
| |
Brazos Higher Education Authority
Series 2005-1 Class 1A3(b) | | | | | |
09/26/22 | | | 0.383% | | | | 2,750,000 | | | | 2,717,880 | |
| |
CIT Education Loan Trust
Series 2007-1 Class B(a)(b) | | | | | |
06/25/42 | | | 0.573% | | | | 1,350,000 | | | | 1,166,254 | |
| | | | | | | | | | | | |
| Asset-Backed Securities — Non-Agency (continued) | |
| Issuer | | Coupon
Rate | | | Principal
Amount ($) | | | Value ($) | |
| | | | | | | | | | |
Carlyle Global Market Strategies
Series 2013-2A Class A1(a)(b) | | | | | |
04/18/25 | | | 1.416% | | | | 5,390,000 | | | | 5,350,507 | |
| |
Citicorp Residential Mortgage Securities, Inc.
Series 2007-2 Class A3(b) | | | | | |
06/25/37 | | | 5.963% | | | | 847,649 | | | | 857,711 | |
| |
Citigroup Mortgage Loan Trust, Inc.
Series 2006-AMC1 Class A2B(b) | | | | | |
09/25/36 | | | 0.344% | | | | 3,546,730 | | | | 1,759,618 | |
| |
Countrywide Asset-Backed Certificates(b)
Series 2005-1 Class MV3 | | | | | |
07/25/35 | | | 0.664% | | | | 3,505,000 | | | | 3,373,636 | |
Series 2005-2 Class M1 | |
08/25/35 | | | 0.604% | | | | 661,337 | | | | 657,349 | |
Series 2007-S2 Class A3 (NPFGC) | |
05/25/37 | | | 5.813% | | | | 659,080 | | | | 630,039 | |
Series 2007-S2 Class A6 (NPFGC) | |
05/25/37 | | | 5.779% | | | | 1,248,763 | | | | 1,222,216 | |
|
Credit-Based Asset Servicing and Securitization LLC(b)
Series 2005-CB7 Class AF3 | |
11/25/35 | | | 4.452% | | | | 2,198,820 | | | | 2,159,657 | |
Series 2007-CB1 Class AF3 | |
01/25/37 | | | 4.560% | | | | 5,434,438 | | | | 2,711,795 | |
| |
Cronos Containers Program Ltd.(a)
Series 2012-1A Class A | | | | | |
05/18/27 | | | 4.210% | | | | 1,312,500 | | | | 1,331,459 | |
Series 2012-2A Class A | |
09/18/27 | | | 3.810% | | | | 2,725,000 | | | | 2,741,709 | |
| |
Crown Castle Towers LLC
Senior Secured(a) | | | | | |
01/15/37 | | | 5.495% | | | | 2,000,000 | | | | 2,167,518 | |
| |
EFS Volunteer No. 2 LLC
Series 2012-1 Class A2(a)(b) | | | | | |
03/25/36 | | | 1.540% | | | | 2,700,000 | | | | 2,730,327 | |
| |
Educational Funding of the South, Inc.
Series 2011-1 Class A2(b) | | | | | |
04/25/35 | | | 0.916% | | | | 6,000,000 | | | | 5,977,128 | |
| |
Educational Services of America, Inc.
Series 2012-2 Class A(a)(b) | | | | | |
04/25/39 | | | 0.914% | | | | 3,600,475 | | | | 3,611,524 | |
|
First Franklin Mortgage Loan Asset-Backed Certificates(b)
Series 2006-FF18 Class A2D | |
12/25/37 | | | 0.394% | | | | 5,422,923 | | | | 3,132,193 | |
Series 2007-FF2 Class A2B | | | | | |
03/25/37 | | | 0.284% | | | | 9,286,434 | | | | 5,031,464 | |
| |
GE Business Loan Trust(a)(b)
Series 2004-1 Class A | | | | | |
05/15/32 | | | 0.474% | | | | 2,761,216 | | | | 2,658,104 | |
Series 2004-2A Class A | | | | | |
12/15/32 | | | 0.404% | | | | 1,734,815 | | | | 1,634,464 | |
Series 2005-2A Class B | | | | | |
11/15/33 | | | 0.684% | | | | 2,142,431 | | | | 1,759,755 | |
| |
GE Equipment Small Ticket LLC
Series 2011-1A Class A3(a) | | | | | |
01/21/18 | | | 1.450% | | | | 673,197 | | | | 674,146 | |
The accompanying Notes to Financial Statements are an integral part of this statement.
| | |
| |
| | Active Portfolios® Multi-Manager Core Plus Bond Fund |
Portfolio of Investments (continued)
August 31, 2013
| | | | | | | | | | | | |
| Asset-Backed Securities — Non-Agency (continued) | |
| Issuer | | Coupon
Rate | | | Principal
Amount ($) | | | Value ($) | |
| | | | | | | | | | |
GE Seaco Finance
Series 2005-1A Class A(a)(b) | | | | | |
11/17/20 | | | 0.434% | | | | 1,687,500 | | | | 1,669,875 | |
| |
Goal Capital Funding Trust
Series 2006-1 Class B(b) | | | | | |
08/25/42 | | | 0.712% | | | | 1,726,508 | | | | 1,451,063 | |
| |
HSBC Home Equity Loan Trust
Series 2007-3 Class APT(b) | | | | | |
11/20/36 | | | 1.384% | | | | 5,679,131 | | | | 5,657,352 | |
| |
ING Investment Management CLO V Ltd.
Series 2007-5A Class A1A(a)(b) | | | | | |
05/01/22 | | | 0.495% | | | | 5,500,000 | | | | 5,331,090 | |
| |
JPMorgan Mortgage Acquisition Corp.(b)
Series 2007-CH1 Class AV4 | | | | | |
11/25/36 | | | 0.314% | | | | 4,000,000 | | | | 3,912,508 | |
Series 2007-CH2 Class AV2 | | | | | |
01/25/37 | | | 0.254% | | | | 118,608 | | | | 117,662 | |
| |
Long Beach Mortgage Loan Trust
Series 2005-1 Class M1(b) | | | | | |
02/25/35 | | | 0.934% | | | | 2,223,704 | | | | 2,208,967 | |
| |
Merrill Lynch First Franklin Mortgage Loan Trust(b)
Series 2007-2 Class A2C | | | | | |
05/25/37 | | | 0.424% | | | | 11,124,786 | | | | 6,543,744 | |
Series 2007-5 Class 2A2 | | | | | |
10/25/37 | | | 1.184% | | | | 7,743,541 | | | | 5,985,850 | |
| |
Mid-State Trust Series 7 Class A | | | | | |
10/15/36 | | | 6.340% | | | | 2,297,836 | | | | 2,419,929 | |
| |
Mid-State Trust(a)
Series 2006-1 Class A | | | | | |
10/15/40 | | | 5.787% | | | | 1,704,054 | | | | 1,795,493 | |
|
Montana Higher Education Student Assistance Corp.
Series 2012-1 Class A3(b) | |
07/20/43 | | | 1.234% | | | | 3,000,000 | | | | 2,912,932 | |
| |
Mountain View CLO III Ltd.
Series 2007-3A Class A1(a)(b) | | | | | |
04/16/21 | | | 0.483% | | | | 5,847,847 | | | | 5,731,551 | |
| |
Nationstar Home Equity Loan Trust
Series 2007-B Class 2AV3(b) | | | | | |
04/25/37 | | | 0.434% | | | | 7,509,000 | | | | 4,740,244 | |
| |
Nelnet Student Loan Trust
Series 2012-5A Class A(a)(b) | | | | | |
10/27/36 | | | 0.784% | | | | 3,906,090 | | | | 3,881,494 | |
| |
Newcastle Mortgage Securities Trust
Series 2006-1 Class A3(b) | | | | | |
03/25/36 | | | 0.364% | | | | 1,436,104 | | | | 1,413,230 | |
| |
Nomad CLO Ltd.
Series 2013-1A Class A1(a)(b) | | | | | |
01/15/25 | | | 1.468% | | | | 5,995,000 | | | | 5,947,196 | |
| |
OHA Credit Partners VIII Ltd.(a)(b)
Series 2013-8A Class A | | | | | |
04/20/25 | | | 1.395% | | | | 2,500,000 | | | | 2,472,483 | |
Series 2013-8A Class B | | | | | |
04/20/25 | | | 1.925% | | | | 2,000,000 | | | | 1,981,810 | |
| | | | | | | | | | | | |
| Asset-Backed Securities — Non-Agency (continued) | |
| Issuer | | Coupon
Rate | | | Principal
Amount ($) | | | Value ($) | |
| | | | | | | | | | |
Park Place Securities, Inc.(b)
Series 2004-WWF1 Class M2 | | | | | |
12/25/34 | | | 1.204% | | | | 4,142,015 | | | | 4,133,110 | |
Series 2005-WCW1 Class A3D | | | | | |
05/25/35 | | | 0.524% | | | | 2,690,817 | | | | 2,664,281 | |
| |
Race Point VIII CLO Ltd.
Series 2013-8A Class A(a)(b) | | | | | |
02/20/25 | | | 1.514% | | | | 5,105,000 | | | | 5,070,235 | |
| |
Residential Asset Mortgage Products, Inc.
Series 2006-RS3 Class A3(b) | | | | | |
05/25/36 | | | 0.384% | | | | 2,026,343 | | | | 1,871,757 | |
| |
SG Mortgage Securities Trust
Series 2005-OPT1 Class A3(b) | | | | | |
10/25/35 | | | 0.534% | | | | 3,100,000 | | | | 2,997,167 | |
| |
SLC Student Loan Trust
Series 2006-2 Class A5(b) | | | | | |
09/15/26 | | | 0.373% | | | | 4,000,000 | | | | 3,893,224 | |
| |
SLM Private Education Loan Trust
Series 2013-B Class A2B(a)(b) | | | | | |
05/15/30 | | | 1.284% | | | | 1,200,000 | | | | 1,181,693 | |
| |
SLM Student Loan Trust(b)
Series 2011-1 Class A2 | | | | | |
10/25/34 | | | 1.334% | | | | 3,285,000 | | | | 3,360,975 | |
Series 2012-7 Class A3 | | | | | |
05/26/26 | | | 0.834% | | | | 4,000,000 | | | | 3,958,778 | |
| |
SMART Trust
Series 2012-1USA Class A4A(a) | | | | | |
12/14/17 | | | 2.010% | | | | 1,349,000 | | | | 1,365,363 | |
| |
SVO VOI Mortgage Corp.
Series 2012-AA Class A(a) | | | | | |
09/20/29 | | | 2.000% | | | | 1,671,590 | | | | 1,663,400 | |
| |
Schahin II Finance Co. SPV Ltd.
Senior Secured(a) | | | | | |
09/25/22 | | | 5.875% | | | | 1,835,093 | | | | 1,706,637 | |
| |
Scholar Funding Trust
Series 2011-A Class A(a)(b) | | | | | |
10/28/43 | | | 1.164% | | | | 1,622,014 | | | | 1,612,412 | |
| |
Sierra Receivables Funding Co. LLC
Series 2012-3A Class A(a) | | | | | |
08/20/29 | | | 1.870% | | | | 1,644,395 | | | | 1,641,992 | |
| |
TAL Advantage I LLC
Series 2006-1A Class NOTE(a)(b) | | | | | |
04/20/21 | | | 0.374% | | | | 1,240,000 | | | | 1,221,727 | |
| |
Triton Container Finance LLC
Series 2012-1A Class A(a) | | | | | |
05/14/27 | | | 4.210% | | | | 1,837,500 | | | | 1,867,466 | |
| |
WaMu Asset-Backed Certificates
Series 2007-HE1 Class 2A3(b) | | | | | |
01/25/37 | | | 0.334% | | | | 7,115,291 | | | | 3,487,617 | |
| |
Wells Fargo Home Equity Trust
Series 2007-2 Class A1(b) | | | | | |
04/25/37 | | | 0.274% | | | | 515,252 | | | | 512,674 | |
| | | | | | | | | | | | | |
Total Asset-Backed Securities — Non-Agency | | | | | |
(Cost: $197,950,551) | | | | | | | | | | | 206,416,552 | |
The accompanying Notes to Financial Statements are an integral part of this statement.
| | |
| |
| Active Portfolios® Multi-Manager Core Plus Bond Fund | | |
Portfolio of Investments (continued)
August 31, 2013
| | | | | | | | | | | | |
| Inflation-Indexed Bonds 5.1% | |
| Issuer | | Coupon
Rate | | | Principal
Amount ($) | | | Value ($) | |
| | | | | | | | | | |
United States 5.1% | |
U.S. Treasury Inflation-Indexed Bond | |
04/15/14 | | | 1.250% | | | | 20,057,267 | | | | 20,287,605 | |
07/15/14 | | | 2.000% | | | | 24,940,620 | | | | 25,655,718 | |
04/15/15 | | | 0.500% | | | | 18,762,921 | | | | 19,207,077 | |
04/15/16 | | | 0.125% | | | | 47,796,241 | | | | 48,979,963 | |
04/15/17 | | | 0.125% | | | | 57,443,522 | | | | 58,870,649 | |
04/15/18 | | | 0.125% | | | | 24,483,854 | | | | 24,965,880 | |
02/15/41 | | | 2.125% | | | | 4,851,165 | | | | 5,676,241 | |
| | | | | | | | | | | | | |
Total United States | | | | | | | | | | | 203,643,133 | |
| | | | | | | | | | | | | |
Total Inflation-Indexed Bonds | | | | | |
(Cost: $208,332,749) | | | | 203,643,133 | |
| | | |
| | | | | | | | | | | | |
| U.S. Treasury Obligations 10.9% | |
U.S. Treasury | | | | | | | | | | | | |
08/15/23 | | | 2.500% | | | | 40,466,400 | | | | 39,593,863 | |
05/31/16 | | | 1.750% | | | | 7,500,000 | | | | 7,717,380 | |
05/15/23 | | | 1.750% | | | | 9,580,000 | | | | 8,761,207 | |
05/15/22 | | | 1.750% | | | | 3,300,000 | | | | 3,081,375 | |
09/30/19 | | | 1.000% | | | | 11,000,000 | | | | 10,393,284 | |
09/30/17 | | | 0.625% | | | | 17,400,000 | | | | 16,943,250 | |
10/31/19 | | | 1.250% | | | | 23,000,000 | | | | 22,033,287 | |
08/15/42 | | | 2.750% | | | | 9,075,000 | | | | 7,540,762 | |
05/15/43 | | | 2.875% | | | | 35,903,000 | | | | 30,556,819 | |
05/15/16 | | | 0.250% | | | | 6,433,000 | | | | 6,364,148 | |
05/31/15 | | | 0.250% | | | | 15,000,000 | | | | 14,976,562 | |
06/30/18 | | | 1.375% | | | | 55,450,000 | | | | 54,990,819 | |
07/31/15 | | | 0.250% | | | | 25,525,000 | | | | 25,465,176 | |
07/31/20 | | | 2.000% | | | | 4,666,000 | | | | 4,609,499 | |
| | | |
U.S. Treasury(i) | | | | | | | | | | | | |
04/30/17 | | | 0.875% | | | | 75,000,000 | | | | 74,396,475 | |
| | | |
U.S. Treasury(k)
STRIPS | | | | | | | | | | | | |
11/15/18 | | | 0.000% | | | | 17,333,000 | | | | 15,861,082 | |
02/15/40 | | | 0.000% | | | | 19,934,000 | | | | 7,274,116 | |
11/15/19 | | | 0.000% | | | | 16,408,000 | | | | 14,447,080 | |
| | | |
U.S. Treasury(k)(l)
STRIPS | | | | | | | | | | | | |
11/15/18 | | | 0.000% | | | | 56,931,000 | | | | 52,068,182 | |
| | | |
U.S. Treasury(l) | | | | | | | | | | | | |
07/31/18 | | | 1.375% | | | | 20,736,700 | | | | 20,539,058 | |
| | | | | | | | | | | | | |
Total U.S. Treasury Obligations | | | | | |
(Cost: $445,372,688) | | | | 437,613,424 | |
| | | |
| | | | | | | | | | | | |
| U.S. Government & Agency Obligations 1.1% | |
Federal Home Loan Banks(b) | |
05/26/28 | | | 0.750% | | | | 8,870,000 | | | | 8,447,567 | |
|
Federal Home Loan Mortgage Corp. | |
12/05/14 | | | 0.350% | | | | 10,000,000 | | | | 10,010,080 | |
|
Federal National Mortgage Association | |
10/22/15 | | | 0.500% | | | | 7,660,000 | | | | 7,651,589 | |
02/12/18 | | | 8.950% | | | | 9,612,000 | | | | 12,585,799 | |
| | | | | | | | | | | | |
| U.S. Government & Agency Obligations (continued) | |
| Issuer | | Coupon
Rate | | | Principal
Amount ($) | | | Value ($) | |
| | | | | | | | | | |
Residual Funding Corp.
STRIPS(k) | |
10/15/20 | | | 0.000% | | | | 4,625,000 | | | | 3,860,594 | |
| | | | | | | | | | | | | |
Total U.S. Government & Agency Obligations | | | | | |
(Cost: $43,605,087) | | | | | | | | | | | 42,555,629 | |
| | | |
| | | | | | | | | | | | |
| Foreign Government Obligations(m) 1.8% | |
Argentina —% | |
Argentina Boden Bonds | | | | | | | | | | | | |
10/03/15 | | | 7.000% | | | | 300,000 | | | | 276,750 | |
| | | |
| | | | | | | | | | | | |
Bahrain —% | |
Bahrain Government International Bond
Senior Unsecured(a) | | | | | |
08/01/23 | | | 6.125% | | | | 200,000 | | | | 191,700 | |
| | | |
| | | | | | | | | | | | |
Brazil 0.5% | |
Banco do Brasil SA(b) | | | | | |
12/31/49 | | | 8.500% | | | | 250,000 | | | | 267,500 | |
| |
Brazilian Government International Bond | | | | | |
01/15/18 | | | 8.000% | | | | 300,000 | | | | 337,500 | |
Senior Unsecured | | | | | |
01/17/17 | | | 6.000% | | | | 4,000,000 | | | | 4,454,000 | |
01/07/41 | | | 5.625% | | | | 3,475,000 | | | | 3,339,475 | |
| |
Petrobras Global Finance BV | | | | | |
05/20/23 | | | 4.375% | | | | 1,750,000 | | | | 1,531,238 | |
| |
Petrobras Global Finance BV(b) | | | | | |
05/20/16 | | | 1.884% | | | | 7,000,000 | | | | 6,929,448 | |
| |
Petrobras International Finance Co. | | | | | |
01/27/21 | | | 5.375% | | | | 200,000 | | | | 196,282 | |
01/27/41 | | | 6.750% | | | | 1,820,000 | | | | 1,690,809 | |
| | | | | | | | | | | | | |
Total | | | | | | | | | | | 18,746,252 | |
| | | |
| | | | | | | | | | | | |
Chile —% | |
Chile Government International Bond
Senior Unsecured | | | | | |
10/30/22 | | | 2.250% | | | | 730,000 | | | | 635,100 | |
| |
Codelco
Senior Unsecured(a) | | | | | |
07/17/22 | | | 3.000% | | | | 600,000 | | | | 532,209 | |
| | | | | | | | | | | | | |
Total | | | | | | | | | | | 1,167,309 | |
|
| |
Colombia 0.1% | |
Colombia Government International Bond
Senior Unsecured | | | | | |
01/27/17 | | | 7.375% | | | | 200,000 | | | | 233,000 | |
09/18/37 | | | 7.375% | | | | 100,000 | | | | 121,000 | |
01/18/41 | | | 6.125% | | | | 2,770,000 | | | | 2,905,861 | |
| |
Corporación Andina de Fomento | | | | | |
06/15/22 | | | 4.375% | | | | 400,000 | | | | 396,122 | |
The accompanying Notes to Financial Statements are an integral part of this statement.
| | |
| |
| | Active Portfolios® Multi-Manager Core Plus Bond Fund |
Portfolio of Investments (continued)
August 31, 2013
| | | | | | | | | | | | |
| Foreign Government Obligations(m) (continued) | |
| Issuer | | Coupon
Rate | | | Principal
Amount ($) | | | Value ($) | |
| | | | | | | | | | |
Senior Unsecured | | | | | |
06/04/19 | | | 8.125% | | | | 1,400,000 | | | | 1,709,747 | |
| |
Ecopetrol SA
Senior Unsecured | | | | | |
07/23/19 | | | 7.625% | | | | 125,000 | | | | 143,125 | |
| | | | | | | | | | | | | |
Total | | | | | | | | | | | 5,508,855 | |
|
| |
Costa Rica 0.1% | |
Instituto Costarricense de Electricidad
Senior Unsecured(a) | | | | | |
11/10/21 | | | 6.950% | | | | 2,400,000 | | | | 2,490,000 | |
|
| |
Croatia —% | |
Hrvatska Elektroprivreda
Senior Unsecured | | | | | |
11/09/17 | | | 6.000% | | | | 200,000 | | | | 203,000 | |
|
| |
Ghana —% | | | | | | | | | | | | |
Republic of Ghana(a) | | | | | |
08/07/23 | | | 7.875% | | | | 200,000 | | | | 193,500 | |
| | | |
| | | | | | | | | | | | |
Hungary —% | |
Hungary Government International Bond
Senior Unsecured | | | | | |
02/19/18 | | | 4.125% | | | | 70,000 | | | | 67,792 | |
01/29/20 | | | 6.250% | | | | 70,000 | | | | 72,289 | |
03/29/21 | | | 6.375% | | | | 70,000 | | | | 72,275 | |
| | | | | | | | | | | | | |
Total | | | | | | | | | | | 212,356 | |
| | | |
| | | | | | | | | | | | |
Indonesia 0.1% | |
Indonesia Government International Bond
Senior Unsecured | | | | | |
03/04/19 | | | 11.625% | | | | 200,000 | | | | 257,000 | |
10/12/35 | | | 8.500% | | | | 100,000 | | | | 113,500 | |
| |
Majapahit Holding BV | | | | | |
01/20/20 | | | 7.750% | | | | 200,000 | | | | 211,000 | |
| |
PT Pertamina Persero
Senior Unsecured | | | | | |
05/03/22 | | | 4.875% | | | | 200,000 | | | | 174,000 | |
| |
PT Pertamina Persero(a)
Senior Unsecured | | | | | |
05/20/23 | | | 4.300% | | | | 200,000 | | | | 163,000 | |
| |
PT Perusahaan Listrik Negara
Senior Unsecured(a) | | | | | |
10/24/42 | | | 5.250% | | | | 5,000,000 | | | | 3,462,500 | |
| | | | | | | | | | | | | |
Total | | | | | | | | | | | 4,381,000 | |
| | | |
| | | | | | | | | | | | |
Italy —% | |
Republic of Italy
Senior Unsecured | | | | | |
09/27/23 | | | 6.875% | | | | 1,270,000 | | | | 1,487,322 | |
| | | | | | | | | | | | |
| Foreign Government Obligations(m) (continued) | |
| Issuer | | Coupon
Rate | | | Principal
Amount ($) | | | Value ($) | |
| | | | | | | | | | |
Kazakhstan —% | |
KazMunayGas National Co. JSC
Senior Unsecured | | | | | |
04/09/21 | | | 6.375% | | | | 200,000 | | | | 210,000 | |
| | | |
| | | | | | | | | | | | |
Lithuania —% | |
Lithuania Government International Bond
Senior Unsecured | | | | | |
03/09/21 | | | 6.125% | | | | 110,000 | | | | 122,100 | |
| | | |
| | | | | | | | | | | | |
Luxembourg —% | |
VTB Bank OJSC Via VTB Capital SA
Senior Unsecured | | | | | |
02/22/18 | | | 6.950% | | | | 200,000 | | | | 210,500 | |
| | | |
| | | | | | | | | | | | |
Mexico 0.3% | |
Comision Federal de Electricidad
Senior Unsecured | | | | | |
02/14/42 | | | 5.750% | | | | 200,000 | | | | 179,000 | |
| |
Mexico Government International Bond
Senior Unsecured | | | | | |
03/19/19 | | | 5.950% | | | | 220,000 | | | | 251,350 | |
01/15/20 | | | 5.125% | | | | 350,000 | | | | 384,650 | |
03/15/22 | | | 3.625% | | | | 1,500,000 | | | | 1,461,750 | |
03/08/44 | | | 4.750% | | | | 620,000 | | | | 540,330 | |
| |
Pemex Project Funding Master Trust | | | | | |
03/05/20 | | | 6.000% | | | | 5,965,000 | | | | 6,561,500 | |
| |
Petroleos Mexicanos | | | | | |
05/03/19 | | | 8.000% | | | | 300,000 | | | | 361,050 | |
| |
Petroleos Mexicanos(a) | | | | | |
07/18/18 | | | 3.500% | | | | 55,000 | | | | 55,266 | |
| |
Petroleos Mexicanos(a)(b) | | | | | |
07/18/18 | | | 2.286% | | | | 75,000 | | | | 77,055 | |
| | | | | | | | | | | | | |
Total | | | | 9,871,951 | |
| | | |
| | | | | | | | | | | | |
Morocco —% | |
Morocco Government International Bond
Senior Unsecured | | | | | |
12/11/22 | | | 4.250% | | | | 200,000 | | | | 170,500 | |
| | | |
| | | | | | | | | | | | |
Nigeria —% | |
Nigeria Government International Bond(a) | | | | | |
07/12/18 | | | 5.125% | | | | 200,000 | | | | 201,961 | |
| | | |
| | | | | | | | | | | | |
Norway 0.2% | |
Kommunalbanken AS
Senior Unsecured(a) | | | | | |
05/23/18 | | | 1.125% | | | | 8,860,000 | | | | 8,533,066 | |
| | | |
| | | | | | | | | | | | |
The accompanying Notes to Financial Statements are an integral part of this statement.
| | |
| |
| Active Portfolios® Multi-Manager Core Plus Bond Fund | | |
Portfolio of Investments (continued)
August 31, 2013
| | | | | | | | | | | | |
| Foreign Government Obligations(m) (continued) | |
| Issuer | | Coupon
Rate | | | Principal
Amount ($) | | | Value ($) | |
| | | | | | | | | | |
Panama —% | |
Panama Government International Bond
Senior Unsecured | | | | | |
01/26/36 | | | 6.700% | | | | 200,000 | | | | 222,000 | |
| | | |
| | | | | | | | | | | | |
Peru —% | |
Peruvian Government International Bond
Senior Unsecured | | | | | |
07/21/25 | | | 7.350% | | | | 300,000 | | | | 372,000 | |
| | | |
| | | | | | | | | | | | |
Poland 0.1% | |
Poland Government International Bond
Senior Unsecured | | | | | |
03/23/22 | | | 5.000% | | | | 1,450,000 | | | | 1,516,700 | |
03/17/23 | | | 3.000% | | | | 225,000 | | | | 200,299 | |
| | | | | | | | | | | | | |
Total | | | | 1,716,999 | |
| | | |
| | | | | | | | | | | | |
Qatar 0.1% | |
Nakilat, Inc.
Senior Secured(a) | | | | | |
12/31/33 | | | 6.067% | | | | 1,835,000 | | | | 1,926,750 | |
| | | |
| | | | | | | | | | | | |
Romania —% | |
Romanian Government International Bond
Senior Unsecured(a) | | | | | |
08/22/23 | | | 4.375% | | | | 100,000 | | | | 93,499 | |
| | | |
| | | | | | | | | | | | |
Russian Federation 0.1% | |
Gazprom OAO Via Gaz Capital SA
Senior Unsecured | | | | | |
04/28/34 | | | 8.625% | | | | 350,000 | | | | 406,000 | |
|
Russian Foreign Bond — Eurobond
Senior Unsecured | |
04/29/20 | | | 5.000% | | | | 500,000 | | | | 526,500 | |
|
Russian Foreign Bond — Eurobond(b)
Senior Unsecured | |
03/31/30 | | | 7.500% | | | | 700,300 | | | | 807,663 | |
|
Vnesheconombank Via VEB Finance PLC
Senior Unsecured | |
02/13/17 | | | 5.375% | | | | 200,000 | | | | 210,540 | |
| | | | | | | | | | | | | |
Total | | | | 1,950,703 | |
| | | |
| | | | | | | | | | | | |
South Africa —% | |
Eskom Holdings SOC Ltd.
Senior Unsecured(a) | | | | | |
08/06/23 | | | 6.750% | | | | 200,000 | | | | 195,972 | |
| | | |
| | | | | | | | | | | | |
Sri Lanka —% | |
Sri Lanka Government International Bond
Senior Unsecured | | | | | |
10/04/20 | | | 6.250% | | | | 180,000 | | | | 170,550 | |
| | | |
| | | | | | | | | | | | |
| | | | | | | | | | | | |
| Foreign Government Obligations(m) (continued) | |
| Issuer | | Coupon
Rate | | | Principal
Amount ($) | | | Value ($) | |
| | | | | | | | | | |
Supra-National —% | |
African Export-Import Bank
Senior Unsecured | | | | | |
07/27/16 | | | 5.750% | | | | 300,000 | | | | 312,750 | |
| | | |
| | | | | | | | | | | | |
Trinidad and Tobago —% | |
Petroleum Co. of Trinidad & Tobago Ltd.
Senior Unsecured | | | | | |
05/08/22 | | | 6.000% | | | | 187,500 | | | | 194,063 | |
| | | |
| | | | | | | | | | | | |
Turkey —% | |
Turkey Government International Bond
Senior Unsecured | | | | | |
03/30/21 | | | 5.625% | | | | 900,000 | | | | 902,475 | |
03/17/36 | | | 6.875% | | | | 600,000 | | | | 599,400 | |
| | | | | | | | | | | | | |
Total | | | | 1,501,875 | |
| | | |
| | | | | | | | | | | | |
Ukraine 0.1% | |
Ukraine Government International Bond
Senior Unsecured | | | | | |
06/04/14 | | | 7.950% | | | | 3,000,000 | | | | 2,962,500 | |
| | | |
| | | | | | | | | | | | |
United Arab Emirates —% | |
Abu Dhabi National Energy Co.
Senior Unsecured(a) | | | | | |
01/12/23 | | | 3.625% | | | | 300,000 | | | | 276,000 | |
|
Emirate of Dubai Government Bonds
Senior Unsecured | |
01/30/43 | | | 5.250% | | | | 200,000 | | | | 160,000 | |
| | | | | | | | | | | | | |
Total | | | | 436,000 | |
| | | |
| | | | | | | | | | | | |
Uruguay —% | |
Uruguay Government International Bond | | | | | |
11/18/22 | | | 8.000% | | | | 250,000 | | | | 307,500 | |
Senior Unsecured | |
03/21/36 | | | 7.625% | | | | 175,000 | | | | 208,687 | |
| | | | | | | | | | | | | |
Total | | | | 516,187 | |
| | | |
| | | | | | | | | | | | |
Venezuela 0.1% | |
Petroleos de Venezuela SA | | | | | |
11/02/17 | | | 8.500% | | | | 5,975,000 | | | | 5,338,663 | |
Senior Unsecured | | | | | |
10/28/14 | | | 4.900% | | | | 100,000 | | | | 94,095 | |
| |
Venezuela Government International Bond
Senior Unsecured | | | | | |
10/13/19 | | | 7.750% | | | | 250,000 | | | | 204,375 | |
| | | | | | | | | | | | | |
Total | | | | 5,637,133 | |
| | | | | | | | | | | | | |
Total Foreign Government Obligations | | | | | |
(Cost: $77,357,564) | | | | | | | | | | | 72,387,103 | |
| | | |
| | | | | | | | | | | | |
The accompanying Notes to Financial Statements are an integral part of this statement.
| | |
| |
| | Active Portfolios® Multi-Manager Core Plus Bond Fund |
Portfolio of Investments (continued)
August 31, 2013
| | | | | | | | | | | | |
| Municipal Bonds 1.6% | |
Issue
Description | | Coupon
Rate | | | Principal
Amount ($) | | | Value ($) | |
California 0.4% | |
City of Los Angeles Wastewater System | | | | | |
06/01/23 | | | 5.000% | | | | 945,000 | | | | 1,082,460 | |
| | |
Los Angeles Community College District Series 2010 | | | | | | | | | |
08/01/49 | | | 6.750% | | | | 2,325,000 | | | | 2,869,236 | |
| | |
Los Angeles Unified School District Series 2009 | | | | | | | | | |
07/01/34 | | | 5.750% | | | | 655,000 | | | | 723,493 | |
|
State of California Unlimited General Obligation Bonds
Build America Bonds
Series 2010 | |
03/01/22 | | | 6.650% | | | | 750,000 | | | | 891,465 | |
03/01/40 | | | 7.625% | | | | 800,000 | | | | 1,037,056 | |
11/01/21 | | | 5.700% | | | | 3,000,000 | | | | 3,424,080 | |
|
Taxable Build America Bonds
Series 2009 | |
04/01/39 | | | 7.550% | | | | 1,000,000 | | | | 1,296,230 | |
|
Taxable-Various Purpose
Series 2009 | |
10/01/19 | | | 6.200% | | | | 1,025,000 | | | | 1,188,569 | |
Series 2010 | | | | | | | | | | | | |
03/01/19 | | | 6.200% | | | | 2,700,000 | | | | 3,098,925 | |
| | | | | | | | | | | | | |
Total | | | | 15,611,514 | |
| | | |
| | | | | | | | | | | | |
Florida 0.1% | |
Florida Hurricane Catastrophe Fund Finance Corp. Series 2013A | | | | | |
07/01/16 | | | 1.298% | | | | 1,290,000 | | | | 1,276,764 | |
| |
Florida State Department of Transportation Series 2013B | | | | | |
07/01/20 | | | 5.000% | | | | 1,145,000 | | | | 1,326,563 | |
| | | | | | | | | | | | | |
Total | | | | 2,603,327 | |
| | | |
| | | | | | | | | | | | |
Georgia 0.1% | |
State of Georgia | | | | | | | | | | | | |
10/01/23 | | | 4.000% | | | | 2,395,000 | | | | 2,573,332 | |
| | | |
| | | | | | | | | | | | |
Illinois 0.4% | |
City of Chicago Waterworks Series 2010 | | | | | | | | | | | | |
11/01/40 | | | 6.742% | | | | 375,000 | | | | 423,540 | |
| | | |
City of Chicago Series 2012B | | | | | | | | | | | | |
01/01/42 | | | 5.432% | | | | 2,070,000 | | | | 1,640,703 | |
|
State of Illinois
Revenue Bonds
Series 2013
Sales Tax | |
06/15/28 | | | 3.350% | | | | 2,500,000 | | | | 2,204,200 | |
|
Unlimited General Obligation Bonds
Build America Bonds
Series 2010 | |
07/01/21 | | | 6.200% | | | | 1,000,000 | | | | 1,071,500 | |
|
Taxable Build America Bonds
Series 2010 | |
02/01/35 | | | 6.630% | | | | 4,265,000 | | | | 4,228,193 | |
| | | | | | | | | | | | |
| Municipal Bonds (continued) | |
Issue
Description | | Coupon
Rate | | | Principal
Amount ($) | | | Value ($) | |
|
Taxable Pension
Series 2003 | |
06/01/18 | | | 4.350% | | | | 4,000,000 | | | | 4,162,120 | |
Taxable Pension Bonds
Series 2003 | |
06/01/33 | | | 5.100% | | | | 1,500,000 | | | | 1,314,225 | |
| | | | | | | | | | | | | |
Total | | | | 15,044,481 | |
|
| |
Kentucky 0.2% | |
Kentucky Asset Liability Commission Series 2010 | | | | | | | | | | | | |
04/01/18 | | | 3.165% | | | | 6,669,907 | | | | 6,881,210 | |
|
| |
Massachusetts —% | |
Commonwealth of Massachusetts Series 2010Z | | | | | | | | | | | | |
06/01/30 | | | 5.631% | | | | 240,000 | | | | 259,937 | |
| | | |
Massachusetts Bay Transportation Authority | | | | | | | | | | | | |
07/01/21 | | | 5.250% | | | | 915,000 | | | | 1,075,976 | |
| | | | | | | | | | | | | |
Total | | | | 1,335,913 | |
|
| |
Minnesota —% | |
State of Minnesota Series 2012A | | | | | | | | | | | | |
08/01/22 | | | 5.000% | | | | 1,580,000 | | | | 1,838,883 | |
|
| |
New York 0.1% | |
City of New York | | | 5.000% | | | | 1,895,000 | | | | 2,117,265 | |
08/01/24 | | | | | | | | | | | | |
| | | |
New York State Urban Development Corp. Series 2013A-1 | | | | | | | | | | | | |
03/15/20 | | | 5.000% | | | | 790,000 | | | | 912,813 | |
| | | | | | | | | | | | | |
Total | | | | 3,030,078 | |
|
| |
Ohio 0.1% | |
JobsOhio Beverage System
Taxable Revenue Bonds
Series 2013-B | |
01/01/29 | | | 3.985% | | | | 2,295,000 | | | | 2,101,555 | |
Series 2013-B | |
01/01/35 | | | 4.532% | | | | 2,160,000 | | | | 2,025,842 | |
| | | | | | | | | | | | | |
Total | | | | 4,127,397 | |
|
| |
Texas 0.2% | |
City of Houston Series 2009-A | | | | | | | | | | | | |
03/01/32 | | | 6.290% | | | | 5,500,000 | | | | 6,154,005 | |
| | | |
State of Texas Series 2009 | | | | | | | | | | | | |
04/01/39 | | | 5.517% | | | | 2,500,000 | | | | 2,838,500 | |
| | | |
Texas A&M University Series 2013B | | | | | | | | | | | | |
05/15/22 | | | 5.000% | | | | 1,330,000 | | | | 1,535,604 | |
| | | | | | | | | | | | | |
Total | | | | 10,528,109 | |
The accompanying Notes to Financial Statements are an integral part of this statement.
| | |
| |
| Active Portfolios® Multi-Manager Core Plus Bond Fund | | |
Portfolio of Investments (continued)
August 31, 2013
| | | | | | | | | | | | |
| Municipal Bonds (continued) | |
Issue
Description | | Coupon
Rate | | | Principal
Amount ($) | | | Value ($) | |
Washington —% | |
State of Washington Series 2013R-C | | | | | | | | | | | | |
07/01/24 | | | 5.000% | | | | 1,580,000 | | | | 1,779,238 | |
| | | | | | | | | | | | | |
Total Municipal Bonds | |
(Cost: $68,034,492) | | | | 65,353,482 | |
|
| |
| Preferred Debt 0.8% | |
| Issuer | | Coupon
Rate | | | Principal
Amount ($) | | | Value ($) | |
Banking 0.8% | |
Citigroup Capital XIII(b) | |
10/30/40 | | | 7.875% | | | | 436,800 | | | | 12,012,000 | |
|
HSBC Holdings PLC | |
12/31/49 | | | 8.000% | | | | 131,050 | | | | 3,554,076 | |
|
M&T Bank Corp.(b) | |
12/31/49 | | | 5.000% | | | | 435 | | | | 445,222 | |
12/31/49 | | | 5.000% | | | | 4,540 | | | | 4,680,377 | |
|
PNC Financial Services Group, Inc. (The)(b) | |
12/31/49 | | | 6.125% | | | | 154,700 | | | | 3,946,397 | |
|
Synovus Financial Corp.(b) | |
06/15/17 | | | 7.875% | | | | 5,600 | | | | 150,640 | |
|
U.S. Bancorp(b) | |
12/31/49 | | | 6.500% | | | | 132,350 | | | | 3,462,276 | |
|
Wells Fargo & Co.(b) | |
12/31/49 | | | 5.850% | | | | 90,000 | | | | 2,174,400 | |
| | | | | | | | | | | | | |
Total | | | | 30,425,388 | |
|
| |
Building Materials —% | |
Stanley Black & Decker, Inc. | |
07/25/52 | | | 5.750% | | | | 87,900 | | | | 2,004,999 | |
|
| |
Property & Casualty —% | |
Allstate Corp. (The)(b) | |
01/15/53 | | | 5.100% | | | | 78,900 | | | | 1,897,545 | |
| | |
Total Preferred Debt | |
(Cost: $35,160,081) | | | | 34,327,932 | |
|
| |
| Senior Loans 0.2% | |
| Borrower | | Weighted
Average
Coupon | | | Principal
Amount ($) | | | Value ($) | |
Automotive —% | |
Affinia Group, Inc.
Tranche B2 Term Loan(b)(n) | |
04/25/20 | | | 4.750% | | | | 54,000 | | | | 54,000 | |
|
| |
Brokerage —% | |
Nuveen Investments, Inc.
Tranche B 2nd Lien Term Loan(b)(n) | |
02/28/19 | | | 6.500% | | | | 120,000 | | | | 119,300 | |
| | | | | | | | | | | | |
| Senior Loans (continued) | |
| Borrower | | Weighted
Average
Coupon | | | Principal
Amount ($) | | | Value ($) | |
Chemicals —% | |
Axalta Coating Systems Dutch Holding BBV/U.S. Holdings, Inc.
Tranche B Term Loan(b)(n) | |
02/01/20 | | | 4.750% | | | | 93,765 | | | | 94,374 | |
|
MacDermid, Inc.
Tranche B 2nd Lien Term Loan(b)(n) | |
12/07/20 | | | 7.750% | | | | 99,000 | | | | 99,990 | |
| | | | | | | | | | | | | |
Total | | | | 194,364 | |
| | | |
| | | | | | | | | | | | |
Construction Machinery —% | |
CPM Acquisition Corp.(b)(n)
1st Lien Term Loan | |
08/29/17 | | | 6.250% | | | | 120,861 | | | | 120,937 | |
2nd Lien Term Loan | |
03/01/18 | | | 10.250% | | | | 72,000 | | | | 72,136 | |
| | | | | | | | | | | | | |
Total | | | | 193,073 | |
|
| |
Consumer Cyclical Services —% | |
New Breed, Inc.
Term Loan(b)(n) | |
10/01/19 | | | 6.000% | | | | 97,510 | | | | 97,429 | |
|
| |
Food and Beverage 0.1% | |
HJ Heinz Co.
Tranche B1 Term Loan(b)(n) | |
06/07/19 | | | 3.250% | | | | 3,100,000 | | | | 3,108,711 | |
|
New HB Acquisition LLC
Tranche B Term Loan(b)(n) | |
04/09/20 | | | 6.750% | | | | 78,000 | | | | 79,853 | |
| | | | | | | | | | | | | |
Total | | | | 3,188,564 | |
|
| |
Gaming —% | |
ROC Finance LLC
Tranche B Term Loan(b)(n) | |
06/20/19 | | | 5.000% | | | | 80,000 | | | | 80,100 | |
|
| |
Health Care 0.1% | |
American Renal Holdings, Inc.
2nd Lien Term Loan(b)(n) | |
03/20/20 | | | 8.500% | | | | 285,000 | | | | 281,438 | |
|
ConvaTec, Inc.
Term Loan(b)(n) | |
12/22/16 | | | 5.000% | | | | 41,693 | | | | 41,859 | |
|
U.S. Renal Care, Inc.(b)(h)(n)
2nd Lien Term Loan | |
01/03/20 | | | 10.250% | | | | 45,000 | | | | 45,000 | |
Tranche B1 1st Lien Term Loan | |
07/03/19 | | | 5.250% | | | | 226,647 | | | | 226,552 | |
|
U.S. Renal Care, Inc.(b)(n)
2nd Lien Term Loan | |
01/03/20 | | | 10.250% | | | | 193,000 | | | | 193,000 | |
|
United Surgical Partners International, Inc.
Tranche B Term Loan(b)(n) | |
04/03/19 | | | 4.750% | | | | 254,601 | | | | 256,403 | |
| | | | | | | | | | | | | |
Total | | | | 1,044,252 | |
The accompanying Notes to Financial Statements are an integral part of this statement.
| | |
| |
| | Active Portfolios® Multi-Manager Core Plus Bond Fund |
Portfolio of Investments (continued)
August 31, 2013
| | | | | | | | | | | | |
| Senior Loans (continued) | |
| Borrower | | Weighted
Average
Coupon | | | Principal
Amount ($) | | | Value ($) | |
Life Insurance —% | |
Alliant Holdings I, Inc.
Term Loan(b)(n) | |
12/20/19 | | | 5.000% | | | | 98,505 | | | | 98,813 | |
| | | |
| | | | | | | | | | | | |
Lodging —% | |
Four Seasons Holdings, Inc.
2nd Lien Term Loan(b)(n) | |
12/27/20 | | | 6.250% | | | | 36,000 | | | | 36,540 | |
|
Playa Resorts Holding BV
Tranche B Term Loan(b)(h)(n) | |
12/27/20 | | | 6.250% | | | | 51,000 | | | | 51,149 | |
| | | | | | | | | | | | | |
Total | | | | 87,689 | |
|
| |
Media Cable —% | |
TWCC Holding Corp.
2nd Lien Term Loan(b)(h)(n) | |
06/26/20 | | | 7.000% | | | | 17,000 | | | | 17,425 | |
|
WideOpenWest Finance LLC
Tranche B Term Loan(b)(n) | |
04/01/19 | | | 4.750% | | | | 175,233 | | | | 176,269 | |
| | | | | | | | | | | | | |
Total | | | | 193,694 | |
|
| |
Property & Casualty —% | |
Asurion LLC
Tranche B1 Term Loan(b)(n) | |
05/24/19 | | | 4.500% | | | | 269,645 | | | | 266,161 | |
|
Lonestar Intermediate Super Holdings LLC
Term Loan(b)(n) | |
09/02/19 | | | 11.000% | | | | 401,000 | | | | 418,043 | |
| | | | | | | | | | | | | |
Total | | | | 684,204 | |
|
| |
Retailers —% | |
Rite Aid Corp.
Tranche 1 2nd Lien Term Loan(b)(n) | |
08/21/20 | | | 5.750% | | | | 148,000 | | | | 151,654 | |
|
| |
Technology —% | |
Ancestry.com, Inc.
Tranche B1 Term Loan(b)(n) | |
12/28/18 | | | 5.250% | | | | 102,767 | | | | 103,366 | |
|
Blue Coat Systems, Inc.
2nd Lien Term Loan(b)(n) | |
06/28/20 | | | 9.500% | | | | 194,126 | | | | 194,369 | |
|
Freescale Semiconductor, Inc.
Tranche B4 Term Loan(b)(n) | |
03/01/20 | | | 5.000% | | | | 251,246 | | | | 252,053 | |
|
Ion Trading Technologies SARL
2nd Lien Term Loan(b)(n) | |
05/22/21 | | | 8.250% | | | | 202,933 | | | | 202,807 | |
|
Triple Point Group Holdings, Inc.(b)(n)
1st Lien Term Loan | |
07/10/20 | | | 5.250% | | | | 111,000 | | | | 108,872 | |
| | | | | | | | | | | | |
| Senior Loans (continued) | |
| Borrower | | Weighted
Average
Coupon | | | Principal
Amount ($) | | | Value ($) | |
2nd Lien Term Loan | | | | | | | | | | | | |
07/10/21 | | | 9.250% | | | | 107,000 | | | | 102,720 | |
| | | | | | | | | | | | | |
Total | | | | 964,187 | |
| | | |
| | | | | | | | | | | | |
Wirelines —% | |
Integra Telecom Holdings, Inc.(b)(n)
2nd Lien Term Loan | |
02/21/20 | | | 9.750% | | | | 26,000 | | | | 26,683 | |
Tranche B Term Loan | |
02/22/19 | | | 5.250% | | | | 74,813 | | | | 75,467 | |
| | | | | | | | | | | | | |
Total | | | | 102,150 | |
| | | | | | | | | | | | | |
Total Senior Loans | |
(Cost: $7,211,538) | | | | 7,253,473 | |
|
| |
| | | | | | | | |
| Warrants —% | |
| Issuer | | Shares | | | Value ($) | |
| | | | | | | | |
Energy —% | |
Energy Equipment & Services —% | |
| | |
Green Field Energy Services, Inc.(o) | | | 327 | | | | 13,080 | |
| | | | | | | | | |
Total Energy | | | | 13,080 | |
| | | | | | | | | |
Total Warrants | | | | | | | | |
(Cost: $19,947) | | | | 13,080 | |
| | |
| | | | | | | | |
| | | | | | | | | | | | |
| Treasury Bills 1.3% | |
| Issuer | | Effective
Yield | | | Principal
Amount ($) | | | Value ($) | |
| | | | | | | | | | |
United States 1.3% | |
U.S. Treasury Bills | |
09/19/13 | | | 0.045% | | | | 53,651,700 | | | | 53,651,261 | |
|
U.S. Treasury Bills(i) | |
12/05/13 | | | 0.030% | | | | 485,000 | | | | 484,965 | |
| | | | | | | | | | | | | |
Total | | | | 54,136,226 | |
| | | | | | | | | | | | | |
Total Treasury Bills | |
(Cost: $54,135,218) | | | | 54,136,226 | |
|
| |
| | | | | | | | |
| Money Market Funds 8.1% | |
| | | Shares | | | Value ($) | |
| | | | | | | | |
| | |
Columbia Short-Term Cash Fund, 0.097%(p)(q) | | | 324,817,096 | | | | 324,817,096 | |
| | | | | | | | | |
Total Money Market Funds | |
(Cost: $324,817,096) | | | | 324,817,096 | |
| | | | | | | | | |
Total Investments | |
(Cost: $4,370,476,218) | | | | 4,307,091,353 | |
| | | | | | | | | |
Other Assets & Liabilities, Net | | | | (293,213,176 | ) |
| | | | | | | | | |
Net Assets | | | | 4,013,878,177 | |
| | | | | | | | | |
The accompanying Notes to Financial Statements are an integral part of this statement.
| | |
| |
| Active Portfolios® Multi-Manager Core Plus Bond Fund | | |
Portfolio of Investments (continued)
August 31, 2013
Investments in Derivatives
Futures Contracts Outstanding at August 31, 2013
| | | | | | | | | | | | | | | | | | | | |
| Contract Description | | Number of
Contracts
Long (Short) | | | Notional
Market
Value ($) | | | Expiration
Date | | | Unrealized
Appreciation ($) | | | Unrealized
Depreciation ($) | |
U.S. Treasury Long Bond, 20-year | | | (154 | ) | | | (20,313,562 | ) | | | December 2013 | | | | — | | | | (56,161 | ) |
| | | | | |
U.S. Treasury Note, 2-year | | | 1,325 | | | | 291,168,750 | | | | December 2013 | | | | 104,841 | | | | — | |
| | | | | |
U.S. Treasury Note, 5-year | | | 1,234 | | | | 147,684,737 | | | | December 2013 | | | | 438,860 | | | | — | |
| | | | | |
U.S. Treasury Note, 10-year | | | (2,815 | ) | | | (349,851,719 | ) | | | December 2013 | | | | — | | | | (1,778,309 | ) |
| | | | | |
U.S. Treasury Ultra Bond, 30-year | | | (93 | ) | | | (13,194,375 | ) | | | December 2013 | | | | — | | | | (285,008 | ) |
| | | | | | | | | | | | | | | | | | | | | |
Total | | | | | | | | | | | | | | | 543,701 | | | | (2,119,478 | ) |
| | | | | | | | | | | | | | | | | | | | | |
Credit Default Swap Contracts Outstanding at August 31, 2013
Buy Protection
At August 31, 2013, securities valued at $2,177,164 were pledged as collateral to cover open credit default swap contracts. In addition, cash totaling $875,000 was received from the broker as collateral.
| | | | | | | | | | | | | | | | | | | | | | | | | | | | | | | | |
| Counterparty | | Reference Entity | | Expiration
Date | | Pay
Fixed
Rate (%) | | | Notional
Amount ($) | | | Market
Value ($) | | | Unamortized
Premium
(Paid)
Received ($) | | | Periodic
Payments
Receivable
(Payable) ($) | | | Unrealized
Appreciation
($) | | | Unrealized
Depreciation
($) | |
Goldman Sachs
International | | H.J. Heinz
Company | | December 20,
2017 | | | 1.00 | | | | 6,670,000 | | | | 68,091 | | | | 129,002 | | | | (13,340 | ) | | | 183,753 | | | | — | |
| | | | | | | | | |
Goldman Sachs
International | | Bank of
America Corp. | | June 20,
2018 | | | 1.00 | | | | 11,835,000 | | | | 51,420 | | | | (128,920 | ) | | | (23,670 | ) | | | — | | | | (101,170 | ) |
| | | | | | | | | |
Morgan Stanley | | Barclays Bank,
PLC | | June 20,
2018 | | | 1.00 | | | | 7,230,000 | | | | 90,987 | | | | (196,790 | ) | | | (14,460 | ) | | | — | | | | (120,263 | ) |
| | | | | | | | | |
Citibank | | CDX Emerging
Markets Index
19-V1 | | June 20,
2018 | | | 5.00 | | | | 3,480,000 | | | | (233,898 | ) | | | 182,281 | | | | (34,800 | ) | | | — | | | | (86,417 | ) |
| | | | | | | | | |
Goldman Sachs
International | | CDX Emerging
Markets Index
19-V1 | | June 20,
2018 | | | 5.00 | | | | 3,455,000 | | | | (232,218 | ) | | | 133,115 | | | | (34,550 | ) | | | — | | | | (133,653 | ) |
| | | | | | | | | |
Goldman Sachs
International | | CDX North
America High
Yield 20 | | June 20,
2018 | | | 5.00 | | | | 15,390,000 | | | | (600,254 | ) | | | 722,766 | | | | (153,900 | ) | | | — | | | | (31,388 | ) |
| | | | | | | | | |
JPMorgan | | CDX North
America High
Yield 20 | | June 20,
2018 | | | 5.00 | | | | 17,040,000 | | | | (664,610 | ) | | | 910,817 | | | | (170,400 | ) | | | 75,807 | | | | — | |
| | | | | | | | | |
Barclays | | CDX North
America High
Yield Index
20-V1 | | June 20,
2018 | | | 5.00 | | | | 13,875,000 | | | | (541,165 | ) | | | 399,702 | | | | (138,750 | ) | | | — | | | | (280,213 | ) |
| | | | | | | | | |
Citibank | | CDX North
America
Investment
Grade 20 | | June 20,
2018 | | | 1.00 | | | | 12,170,000 | | | | (90,565 | ) | | | 143,475 | | | | (24,340 | ) | | | 28,570 | | | | — | |
| | | | | | | | | |
JPMorgan | | CDX North
America
Investment
Grade 20 | | June 20,
2018 | | | 1.00 | | | | 23,680,000 | | | | (176,219 | ) | | | 190,228 | | | | (47,360 | ) | | | — | | | | (33,351 | ) |
| | | | | | | | | |
Morgan Stanley* | | CDX North
America
Investment
Grade 20-V1 | | June 20,
2018 | | | 1.00 | | | | 100,000 | | | | (744 | ) | | | 1,032 | | | | (200 | ) | | | 88 | | | | — | |
| | | | | | | | | |
Goldman Sachs
International | | Citigroup, Inc. | | June 20,
2018 | | | 1.00 | | | | 6,265,000 | | | | 3,041 | | | | (17,216 | ) | | | (12,530 | ) | | | — | | | | (26,705 | ) |
The accompanying Notes to Financial Statements are an integral part of this statement.
| | |
| |
| | Active Portfolios® Multi-Manager Core Plus Bond Fund |
Portfolio of Investments (continued)
August 31, 2013
Buy Protection (continued)
| | | | | | | | | | | | | | | | | | | | | | | | | | | | | | | | |
| Counterparty | | Reference Entity | | Expiration
Date | | Pay
Fixed
Rate (%) | | | Notional
Amount ($) | | | Market
Value ($) | | | Unamortized
Premium
(Paid)
Received ($) | | | Periodic
Payments
Receivable
(Payable) ($) | | | Unrealized
Appreciation
($) | | | Unrealized
Depreciation
($) | |
JPMorgan | | Citigroup, Inc. | | June 20,
2018 | | | 1.00 | | | | 6,265,000 | | | | 3,040 | | | | (22,934 | ) | | | (12,530 | ) | | | — | | | | (32,424 | ) |
| | | | | | | | | |
Barclays | | D.R. Horton,
Inc. | | June 20,
2018 | | | 1.00 | | | | 1,335,000 | | | | 78,028 | | | | (35,830 | ) | | | (2,670 | ) | | | 39,528 | | | | — | |
| | | | | | | | | |
JPMorgan | | D.R. Horton,
Inc. | | June 20,
2018 | | | 1.00 | | | | 10,795,000 | | | | 630,947 | | | | (369,510 | ) | | | (21,590 | ) | | | 239,847 | | | | — | |
| | | | | | | | | |
Barclays | | Goldman
Sachs
Group, Inc. | | June 20,
2018 | | | 1.00 | | | | 25,000 | | | | 339 | | | | (407 | ) | | | (50 | ) | | | — | | | | (118 | ) |
| | | | | | | | | |
Morgan Stanley | | Goldman
Sachs
Group, Inc. | | June 20,
2018 | | | 1.00 | | | | 7,175,000 | | | | 97,102 | | | | (113,283 | ) | | | (14,350 | ) | | | — | | | | (30,531 | ) |
| | | | | | | | | |
Goldman Sachs International | | Home Depot,
Inc. | | June 20,
2018 | | | 1.00 | | | | 10,480,000 | | | | (327,648 | ) | | | 306,012 | | | | (20,960 | ) | | | — | | | | (42,596 | ) |
| | | | | | | | | |
JPMorgan | | Home Depot,
Inc. | | June 20,
2018 | | | 1.00 | | | | 285,000 | | | | (8,911 | ) | | | 8,746 | | | | (570 | ) | | | — | | | | (735 | ) |
| | | | | | | | | |
Barclays | | Limited
Brands, Inc. | | June 20,
2018 | | | 1.00 | | | | 5,685,000 | | | | 240,201 | | | | (292,614 | ) | | | (11,370 | ) | | | — | | | | (63,783 | ) |
| | | | | | | | | |
Citibank | | Marriott
International,
Inc. | | June 20,
2018 | | | 1.00 | | | | 5,260,000 | | | | (75,942 | ) | | | 116,875 | | | | (10,520 | ) | | | 30,413 | | | | — | |
| | | | | | | | | |
Goldman Sachs
International | | Textron, Inc. | | June 20,
2018 | | | 1.00 | | | | 5,595,000 | | | | 92,237 | | | | (50,876 | ) | | | (11,190 | ) | | | 30,171 | | | | — | |
| | | | | | | | | |
Morgan Stanley | | Toll Brothers,
Inc. | | June 20,
2018 | | | 1.00 | | | | 16,400,000 | | | | 714,797 | | | | (295,893 | ) | | | (32,800 | ) | | | 386,104 | | | | — | |
| | | | | | | | | |
Citibank | | H.J. Heinz
Company | | September 20,
2018 | | | 1.00 | | | | 2,970,000 | | | | 86,534 | | | | (95,389 | ) | | | (5,940 | ) | | | — | | | | (14,795 | ) |
| | | | | | | | | |
Goldman Sachs
International | | Home Depot,
Inc. | | September 20,
2018 | | | 1.00 | | | | 6,055,000 | | | | (193,432 | ) | | | 180,311 | | | | (12,110 | ) | | | — | | | | (25,231 | ) |
| | | | | | | | | |
Barclays | | Morgan
Stanley | | September 20,
2018 | | | 1.00 | | | | 2,745,000 | | | | 54,651 | | | | (105,029 | ) | | | (5,490 | ) | | | — | | | | (55,868 | ) |
| | | | | | | | | |
Citibank | | Morgan
Stanley | | September 20,
2018 | | | 1.00 | | | | 4,120,000 | | | | 82,028 | | | | (164,956 | ) | | | (8,240 | ) | | | — | | | | (91,168 | ) |
| | | | | | | | | |
Citibank | | Nucor Corp. | | September 20,
2018 | | | 1.00 | | | | 2,645,000 | | | | (27,244 | ) | | | 19,108 | | | | (5,290 | ) | | | — | | | | (13,426 | ) |
| | | | | | | | | |
Goldman Sachs
International | | Nucor Corp. | | September 20,
2018 | | | 1.00 | | | | 1,060,000 | | | | (10,919 | ) | | | 9,193 | | | | (2,120 | ) | | | — | | | | (3,846 | ) |
| | | | | | | | | |
Barclays | | Telecom
Italia SPA | | September 20,
2018 | | | 1.00 | | | | 1,080,000 | | | | 127,879 | | | | (107,178 | ) | | | (2,160 | ) | | | 18,541 | | | | — | |
| | | | | | | | | | | | | | | | | | | | | | | | | | | | | | | | | |
Total | | | | | | | | | | | | | | | | | | | | | | | | | | | 1,032,822 | | | | (1,187,681 | ) |
| | | | | | | | | | | | | | | | | | | | | | | | | | | | | | | | | |
| | * | At August 31, 2013, $1,542 was held in a margin deposit account as collateral to cover initial margin requirments on open centrally cleared swap contracts. |
Notes to Portfolio of Investments
| (a) | Security exempt from registration pursuant to Rule 144A under the Securities Act of 1933. This security may be resold in transactions exempt from registration, normally to qualified institutional buyers. At August 31, 2013, the value of these securities amounted to $513,802,620 or 12.80% of net assets. |
| (b) | Variable rate security. |
| (c) | Represents securities that have defaulted on payment of interest. The Fund has stopped accruing interest on these securities. At August 31, 2013, the value of these securities amounted to $3,111,591, which represents 0.08% of net assets. |
The accompanying Notes to Financial Statements are an integral part of this statement.
| | |
| |
| Active Portfolios® Multi-Manager Core Plus Bond Fund | | |
Portfolio of Investments (continued)
August 31, 2013
Notes to Portfolio of Investments (continued)
| (d) | Identifies issues considered to be illiquid as to their marketability. The aggregate value of such securities at August 31, 2013 was $4,053,859, representing 0.10% of net assets. Information concerning such security holdings at August 31, 2013 is as follows: |
| | | | | | | | |
| Security Description | | Acquisition Dates | | | Cost ($) | |
CRC Health Corp. | | | | | | | | |
02/01/16 10.750% | | | 04/30/12 | | | | 70,935 | |
| | |
Lone Pine Resources Canada Ltd. | | | | | | | | |
02/15/17 10.375% | | | 07/10/12 | | | | 193,632 | |
| | |
RALI Trust | | | | | | | | |
CMO IO Series 2006-QS18 Class 1AV | | | | | | | | |
12/25/36 0.407% | | | 05/04/12 | | | | 1,539,664 | |
| | |
RALI Trust | | | | | | | | |
CMO IO Series 2006-QS9 Class 1AV | | | | | | | | |
07/25/36 0.597% | | | 05/09/12 | | | | 1,196,674 | |
| | |
RALI Trust | | | | | | | | |
CMO IO Series 2007-QS1 Class 2AV | | | | | | | | |
01/25/37 0.174% | | | 05/07/12 | | | | 725,319 | |
| (e) | The maturity dates shown represent the original maturity of the underlying obligation. Actual maturity may vary based upon prepayment activity on these obligations. Unless otherwise noted, the coupon rates presented are fixed rates. |
| (f) | Interest Only (IO) security. The actual effective yield of this security is different than the stated coupon rate. |
| (g) | Principal Only (PO) security issued with a zero coupon. Income is recognized through the accretion of discount. |
| (h) | Represents a security purchased on a when-issued or delayed delivery basis. |
| (i) | At August 31, 2013, investments in securities included securities valued at $6,244,917 that were partially pledged as collateral to cover initial margin deposits on open interest rate futures contracts. |
| (j) | Represents fair value as determined in good faith under procedures approved by the Board of Trustees. At August 31, 2013, the value of these securities amounted to $12,655,229, which represents 0.32% of net assets. |
| (l) | This security, or a portion of this security, has been pledged as collateral in connection with swap contracts. These values are denoted within the Investments in Derivatives section of the Portfolio of Investments. |
| (m) | Principal amounts are denominated in United States Dollars unless otherwise noted. |
| (n) | Senior loans have rates of interest that float periodically based primarily on the London Interbank Offered Rate (“LIBOR”) and other short-term rates. The interest rate shown reflects the weighted average coupon as of August 31, 2013. The interest rate shown for senior loans purchased on a when-issued or delayed delivery basis, if any, reflects an estimated average coupon. Remaining maturities of senior loans may be less than the stated maturities shown as a result of contractual or optional prepayments by the borrower. Such prepayments cannot be predicted with certainty. |
| (p) | The rate shown is the seven-day current annualized yield at August 31, 2013. |
| (q) | As defined in the Investment Company Act of 1940, an affiliated company is one in which the Fund owns 5% or more of its outstanding voting securities, or a company which is under common ownership or control with the Fund. Holdings and transactions in these affiliated companies during the year ended August 31, 2013, are as follows: |
| | | | | | | | | | | | | | | | | | | | | | | | |
| Issuer | | Beginning
Cost ($) | | | Purchase
Cost ($) | | | Proceeds
From Sales ($) | | | Ending
Cost ($) | | | Dividends —
Affiliated
Issuers ($) | | | Value ($) | |
Columbia Short-Term Cash Fund | | | 502,632,840 | | | | 2,319,015,310 | | | | (2,496,831,054 | ) | | | 324,817,096 | | | | 458,458 | | | | 324,817,096 | |
Abbreviation Legend
| | |
| |
| AGM | | Assured Guaranty Municipal Corporation |
| CMO | | Collateralized Mortgage Obligation |
| NPFGC | | National Public Finance Guarantee Corporation |
| PIK | | Payment-in-Kind |
| STRIPS | | Separate Trading of Registered Interest and Principal Securities |
The accompanying Notes to Financial Statements are an integral part of this statement.
| | |
| |
| | Active Portfolios® Multi-Manager Core Plus Bond Fund |
Portfolio of Investments (continued)
August 31, 2013
Fair Value Measurements
Generally accepted accounting principles (GAAP) require disclosure regarding the inputs and valuation techniques used to measure fair value and any changes in valuation inputs or techniques. In addition, investments shall be disclosed by major category.
The Fund categorizes its fair value measurements according to a three-level hierarchy that maximizes the use of observable inputs and minimizes the use of unobservable inputs by prioritizing that the most observable input be used when available. Observable inputs are those that market participants would use in pricing an investment based on market data obtained from sources independent of the reporting entity. Unobservable inputs are those that reflect the Fund’s assumptions about the information market participants would use in pricing an investment. An investment’s level within the fair value hierarchy is based on the lowest level of any input that is deemed significant to the asset or liability’s fair value measurement. The input levels are not necessarily an indication of the risk or liquidity associated with investments at that level. For example, certain U.S. government securities are generally high quality and liquid, however, they are reflected as Level 2 because the inputs used to determine fair value may not always be quoted prices in an active market.
Fair value inputs are summarized in the three broad levels listed below:
| > | | Level 1 — Valuations based on quoted prices for investments in active markets that the Fund has the ability to access at the measurement date (including NAV for open-end mutual funds). Valuation adjustments are not applied to Level 1 investments. |
| > | | Level 2 — Valuations based on other significant observable inputs (including quoted prices for similar securities, interest rates, prepayment speeds, credit risks, etc.). |
| > | | Level 3 — Valuations based on significant unobservable inputs (including the Fund’s own assumptions and judgment in determining the fair value of investments). |
Inputs that are used in determining fair value of an investment may include price information, credit data, volatility statistics, and other factors. These inputs can be either observable or unobservable. The availability of observable inputs can vary between investments, and is affected by various factors such as the type of investment, and the volume and level of activity for that investment or similar investments in the marketplace. The inputs will be considered by the Investment Manager, along with any other relevant factors in the calculation of an investment’s fair value. The Fund uses prices and inputs that are current as of the measurement date, which may include periods of market dislocations. During these periods, the availability of prices and inputs may be reduced for many investments. This condition could cause an investment to be reclassified between the various levels within the hierarchy.
Investments falling into the Level 3 category are primarily supported by quoted prices from brokers and dealers participating in the market for those investments. However, these may be classified as Level 3 investments due to lack of market transparency and corroboration to support these quoted prices. Additionally, valuation models may be used as the pricing source for any remaining investments classified as Level 3. These models may rely on one or more significant unobservable inputs and/or significant assumptions by the Investment Manager. Inputs used in valuations may include, but are not limited to, financial statement analysis, capital account balances, discount rates and estimated cash flows, and comparable company data.
Under the direction of the Fund’s Board of Trustees (the Board), the Investment Manager’s Valuation Committee (the Committee) is responsible for carrying out the valuation procedures approved by the Board. The Committee consists of voting and non-voting members from various groups within the Investment Manager’s organization, including operations and accounting, trading and investments, compliance, risk management and legal.
The Committee meets at least monthly to review and approve valuation matters, which may include a description of specific valuation determinations, data regarding pricing information received from approved pricing vendors and brokers and the results of Board-approved valuation control policies and procedures (the Policies). The Policies address, among other things, instances when market quotations are or are not readily available, including recommendations of third party pricing vendors and a determination of appropriate pricing methodologies; events that require specific valuation determinations and assessment of fair value techniques; securities with a potential for stale pricing, including those that are illiquid, restricted, or in default; and the effectiveness of third- party pricing vendors, including periodic reviews of vendors. The Committee meets more frequently, as needed, to discuss additional valuation matters, which may include the need to review back-testing results, review time-sensitive information or approve related valuation actions. The Committee reports to the Board, with members of the Committee meeting with the Board at each of its regularly scheduled meetings to discuss valuation matters and actions during the period, similar to those described earlier.
For investments categorized as Level 3, the Committee monitors information similar to that described above, which may include: (i) data specific to the issuer or comparable issuers, (ii) general market or specific sector news and (iii) quoted prices and specific or similar security transactions. The Committee considers this data and any changes from prior periods in order to assess the reasonableness of observable and unobservable inputs, any assumptions or internal models used to value those securities and changes in fair value. This data is also used to corroborate, when available, information received from approved pricing vendors and brokers. Various factors impact the frequency of monitoring this information (which may occur as often as daily). However, the Committee may determine that changes to inputs, assumptions and models are not required as a result of the monitoring procedures performed.
The accompanying Notes to Financial Statements are an integral part of this statement.
| | |
| |
| Active Portfolios® Multi-Manager Core Plus Bond Fund | | |
Portfolio of Investments (continued)
August 31, 2013
Fair Value Measurements (continued)
The following table is a summary of the inputs used to value the Fund’s investments at August 31, 2013:
| | | | | | | | | | | | | | | | |
| Description | | Level 1 Quoted Prices in Active
Markets for Identical Assets ($) | | | Level 2 Other Significant Observable Inputs ($) | | | Level 3 Significant Unobservable Inputs ($) | | | Total ($) | |
Bonds | | | | | | | | | | | | | | | | |
Corporate Bonds & Notes | | | | | | | | | | | | | | | | |
Airlines | | | — | | | | 25,327,289 | | | | 15,912,047 | | | | 41,239,336 | |
All Other Industries | | | — | | | | 1,382,147,339 | | | | — | | | | 1,382,147,339 | |
Residential Mortgage-Backed Securities — Agency | | | — | | | | 897,154,590 | | | | 6,000,000 | | | | 903,154,590 | |
Residential Mortgage-Backed Securities — Non-Agency | | | — | | | | 191,819,735 | | | | 21,637,909 | | | | 213,457,644 | |
Commercial Mortgage-Backed Securities — Agency | | | — | | | | 82,778,330 | | | | — | | | | 82,778,330 | |
Commercial Mortgage-Backed Securities — Non-Agency | | | — | | | | 199,750,408 | | | | 11,968,147 | | | | 211,718,555 | |
Asset-Backed Securities — Agency | | | — | | | | 24,078,429 | | | | — | | | | 24,078,429 | |
Asset-Backed Securities — Non-Agency | | | — | | | | 201,401,268 | | | | 5,015,284 | | | | 206,416,552 | |
Inflation-Indexed Bonds | | | — | | | | 203,643,133 | | | | — | | | | 203,643,133 | |
U.S. Treasury Obligations | | | 347,962,965 | | | | 89,650,459 | | | | — | | | | 437,613,424 | |
U.S. Government & Agency Obligations | | | — | | | | 42,555,629 | | | | — | | | | 42,555,629 | |
Foreign Government Obligations | | | — | | | | 72,387,103 | | | | — | | | | 72,387,103 | |
Municipal Bonds | | | — | | | | 65,353,482 | | | | — | | | | 65,353,482 | |
Preferred Debt | | | 34,327,932 | | | | — | | | | — | | | | 34,327,932 | |
| | | | | | | | | | | | | | | | | |
Total Bonds | | | 382,290,897 | | | | 3,478,047,194 | | | | 60,533,387 | | | | 3,920,871,478 | |
| | | | | | | | | | | | | | | | | |
Equity Securities | | | | | | | | | | | | | | | | |
Warrants | | | | | | | | | | | | | | | | |
Energy | | | — | | | | 13,080 | | | | — | | | | 13,080 | |
| | | | | | | | | | | | | | | | | |
Total Equity Securities | | | — | | | | 13,080 | | | | — | | | | 13,080 | |
| | | | | | | | | | | | | | | | | |
Short-Term Securities | | | | | | | | | | | | | | | | |
Treasury Bills | | | 54,136,226 | | | | — | | | | — | | | | 54,136,226 | |
| | | | | | | | | | | | | | | | | |
Total Short-Term Securities | | | 54,136,226 | | | | — | | | | — | | | | 54,136,226 | |
| | | | | | | | | | | | | | | | | |
Other | | | | | | | | | | | | | | | | |
Senior Loans | | | — | | | | 7,253,473 | | | | — | | | | 7,253,473 | |
| | | | | | | | | | | | | | | | | |
Total Other | | | — | | | | 7,253,473 | | | | — | | | | 7,253,473 | |
| | | | | | | | | | | | | | | | | |
Mutual Funds | | | | | | | | | | | | | | | | |
Money Market Funds | | | 324,817,096 | | | | — | | | | — | | | | 324,817,096 | |
| | | | | | | | | | | | | | | | | |
Total Mutual Funds | | | 324,817,096 | | | | — | | | | — | | | | 324,817,096 | |
| | | | | | | | | | | | | | | | | |
Investments in Securities | | | 761,244,219 | | | | 3,485,313,747 | | | | 60,533,387 | | | | 4,307,091,353 | |
Derivatives | | | | | | | | | | | | | | | | |
Assets | | | | | | | | | | | | | | | | |
Futures Contracts | | | 543,701 | | | | — | | | | — | | | | 543,701 | |
Swap Contracts | | | — | | | | 1,032,822 | | | | — | | | | 1,032,822 | |
Liabilities | | | | | | | | | | | | | | | | |
Futures Contracts | | | (2,119,478 | ) | | | — | | | | — | | | | (2,119,478 | ) |
Swap Contracts | | | — | | | | (1,187,681 | ) | | | — | | | | (1,187,681 | ) |
| | | | | | | | | | | | | | | | | |
Total | | | 759,668,442 | | | | 3,485,158,888 | | | | 60,533,387 | | | | 4,305,360,717 | |
| | | | | | | | | | | | | | | | | |
See the Portfolio of Investments for all investment classifications not indicated in the table.
The Fund’s assets assigned to the Level 2 input category are generally valued using the market approach, in which a security’s value is determined through reference to prices and information from market transactions for similar or identical assets.
There were no transfers of financial assets between Levels 1 and 2 during the period.
Derivative instruments are valued at unrealized appreciation (depreciation).
The accompanying Notes to Financial Statements are an integral part of this statement.
| | |
| |
| | Active Portfolios® Multi-Manager Core Plus Bond Fund |
Portfolio of Investments (continued)
August 31, 2013
Fair Value Measurements (continued)
The following table is a reconciliation of Level 3 assets for which significant observable and/or unobservable inputs were used to determine fair value.
| | | | | | | | | | | | | | | | | | | | | | | | | | | | | | | | | | | | |
| | | Corporate
Bonds &
Notes ($) | | | Residential
Mortgage-
Backed
Securities — Agency
($) | | | Residential
Mortgage-
Backed
Securities —
Non-Agency
($) | | | Commercial
Mortgage-
Backed
Securities —
Non-Agency
($) | | | Asset-
Backed
Securities —
Non-Agency
($) | | | U.S.
Government
& Agency
Obligations
($) | | | Foreign
Government
Obligations
($) | | | Preferred
Debt ($) | | | Total ($) | |
Balance as of August 31, 2012 | | | 9,435,166 | | | | — | | | | 8,072,357 | | | | — | | | | 10,114,491 | | | | 12,979,169 | | | | 164,475 | | | | 4,174,538 | | | | 44,940,196 | |
| | | | | | | | | |
Accrued discounts/premiums | | | 33,318 | | | | — | | | | (24,648 | ) | | | (471 | ) | | | 85,795 | | | | — | | | | — | | | | — | | | | 93,994 | |
| | | | | | | | | |
Realized gain (loss) | | | (40,220 | ) | | | — | | | | 27,554 | | | | 1,730 | | | | 227,190 | | | | — | | | | — | | | | — | | | | 216,254 | |
| | | | | | | | | |
Change in unrealized appreciation (depreciation)(a) | | | (70,864 | ) | | | — | | | | (217,063 | ) | | | (14,881 | ) | | | 171,092 | | | | — | | | | — | | | | — | | | | (131,716 | ) |
| | | | | | | | | |
Sales | | | (654,921 | ) | | | — | | | | (6,161,859 | ) | | | (2,792,553 | ) | | | (5,583,284 | ) | | | — | | | | — | | | | — | | | | (15,192,617 | ) |
| | | | | | | | | |
Purchases | | | 2,097,418 | | | | 6,000,000 | | | | 24,184,970 | | | | 14,774,322 | | | | — | | | | — | | | | — | | | | — | | | | 47,056,710 | |
| | | | | | | | | |
Transfers into Level 3 | | | 5,112,150 | | | | — | | | | — | | | | — | | | | — | | | | — | | | | — | | | | — | | | | 5,112,150 | |
| | | | | | | | | |
Transfers out of Level 3 | | | — | | | | — | | | | (4,243,402 | ) | | | — | | | | — | | | | (12,979,169 | ) | | | (164,475 | ) | | | (4,174,538 | ) | | | (21,561,584 | ) |
| | | | | | | | | | | | | | | | | | | | | | | | | | | | | | | | | | | | |
Balance as of August 31, 2013 | | | 15,912,047 | | | | 6,000,000 | | | | 21,637,909 | | | | 11,968,147 | | | | 5,015,284 | | | | — | | | | — | | | | — | | | | 60,533,387 | |
| | | | | | | | | | | | | | | | | | | | | | | | | | | | | | | | | | | | |
| | (a) | Change in unrealized appreciation (depreciation) relating to securities held at August 31, 2013 was $(196,080), which is comprised of Corporate Bonds & Notes of $(70,864), Residential Mortgage-Backed Securities — Non-Agency of $(217,063), Commercial Mortgage-Backed Securities — Non-Agency of $(14,881) and Asset-Backed Securities—Non-Agency of $106,728. |
The Fund does not hold any significant investments with unobservable inputs which are categorized as Level 3.
The Fund’s assets assigned to the Level 3 category are valued utilizing the valuation technique deemed the most appropriate in the circumstances. Certain Corporate Bonds, Residential Mortgage-Backed Securities, Commercial Mortgage-Backed Securities and Asset-Backed Securities are valued using the market approach and utilize single market quotations from broker dealers which may have included, but not limited to, the distressed nature of the security and observable transactions for similar assets in the market. Significant increases (decreases) to any of these inputs would result in a significantly lower (higher) fair value measurement.
Transfers in and/or out of Level 3 are determined based on the fair value at the beginning of the period for security positions held throughout the period.
The accompanying Notes to Financial Statements are an integral part of this statement.
| | |
| |
| Active Portfolios® Multi-Manager Core Plus Bond Fund | | |
Statement of Assets and Liabilities
August 31, 2013
| | | | |
Assets | |
| |
Investments, at value | | | | |
| |
Unaffiliated issuers (identified cost $4,045,659,122) | | | $3,982,274,257 | |
| |
Affiliated issuers (identified cost $324,817,096) | | | 324,817,096 | |
| |
Total investments (identified cost $4,370,476,218) | | | 4,307,091,353 | |
| |
Foreign currency (identified cost $45,858) | | | 43,363 | |
| |
Margin deposits | | | 1,542 | |
| |
Unrealized appreciation on swap contracts | | | 1,032,734 | |
| |
Premiums paid on outstanding swap contracts | | | 1,996,825 | |
| |
Receivable for: | | | | |
| |
Investments sold | | | 32,447,912 | |
| |
Investments sold on a delayed delivery basis | | | 67,421,477 | |
| |
Capital shares sold | | | 20,635,171 | |
| |
Dividends | | | 110,977 | |
| |
Interest | | | 25,718,149 | |
| |
Reclaims | | | 84,878 | |
| |
Variation margin | | | 474,102 | |
| |
Prepaid expenses | | | 51,420 | |
| |
Trustees’ deferred compensation plan | | | 16,217 | |
| |
Total assets | | | 4,457,126,120 | |
| |
|
Liabilities | |
| |
Disbursements in excess of cash | | | 295,905 | |
| |
Unrealized depreciation on swap contracts | | | 1,187,681 | |
| |
Premiums received on outstanding swap contracts | | | 3,452,663 | |
| |
Payable for: | | | | |
| |
Investments purchased | | | 31,712,320 | |
| |
Investments purchased on a delayed delivery basis | | | 388,290,597 | |
| |
Capital shares purchased | | | 10,828,046 | |
| |
Dividend distributions to shareholders | | | 6,846,826 | |
| |
Variation margin | | | 221,583 | |
| |
Investment management fees | | | 45,242 | |
| |
Distribution and/or service fees | | | 27,420 | |
| |
Transfer agent fees | | | 181,656 | |
| |
Administration fees | | | 6,511 | |
| |
Chief compliance officer expenses | | | 623 | |
| |
Other expenses | | | 134,653 | |
| |
Trustees’ deferred compensation plan | | | 16,217 | |
| |
Total liabilities | | | 443,247,943 | |
| |
Net assets applicable to outstanding capital stock | | | $4,013,878,177 | |
| |
| |
Represented by | | | | |
| |
Paid-in capital | | | $4,071,002,130 | |
| |
Undistributed net investment income | | | 3,191,459 | |
| |
Accumulated net realized gain | | | 4,802,584 | |
| |
Unrealized appreciation (depreciation) on: | | | | |
| |
Investments | | | (63,384,865 | ) |
| |
Foreign currency translations | | | (2,495 | ) |
| |
Futures contracts | | | (1,575,777 | ) |
| |
Swap contracts | | | (154,859 | ) |
| |
Total — representing net assets applicable to outstanding capital stock | | | $4,013,878,177 | |
| |
| |
Class A | | | | |
| |
Net assets | | | $4,013,878,177 | |
| |
Shares outstanding | | | 406,810,849 | |
| |
Net asset value per share | | | $9.87 | |
| |
The accompanying Notes to Financial Statements are an integral part of this statement.
| | |
| |
| | Active Portfolios® Multi-Manager Core Plus Bond Fund |
Statement of Operations
Year Ended August 31, 2013
| | | | |
Net investment income | | | | |
| |
Income: | | | | |
| |
Dividends — unaffiliated issuers | | | $2,404,164 | |
| |
Dividends — affiliated issuers | | | 458,458 | |
| |
Interest | | | 120,527,445 | |
| |
Total income | | | 123,390,067 | |
| |
| |
Expenses: | | | | |
| |
Investment management fees | | | 18,964,179 | |
| |
Distribution and/or service fees | | | | |
| |
Class A | | | 11,541,254 | |
| |
Transfer agent fees | | | | |
| |
Class A | | | 2,257,869 | |
| |
Administration fees | | | 2,681,881 | |
| |
Compensation of board members | | | 123,616 | |
| |
Custodian fees | | | 113,930 | |
| |
Printing and postage fees | | | 227,691 | |
| |
Registration fees | | | 192,941 | |
| |
Professional fees | | | 154,906 | |
| |
Chief compliance officer expenses | | | 3,541 | |
| |
Other | | | 136,030 | |
| |
Total expenses | | | 36,397,838 | |
| |
Net investment income | | | 86,992,229 | |
| |
| |
Realized and unrealized gain (loss) — net | | | | |
| |
Net realized gain (loss) on: | | | | |
| |
Investments | | | 21,463,318 | |
| |
Foreign currency translations | | | 2,438 | |
| |
Futures contracts | | | 14,898,705 | |
| |
Options contracts written | | | 62,292 | |
| |
Swap contracts | | | (12,389,568 | ) |
| |
Net realized gain | | | 24,037,185 | |
| |
Net change in unrealized appreciation (depreciation) on: | | | | |
| |
Investments | | | (155,252,625 | ) |
| |
Foreign currency translations | | | (3,286 | ) |
| |
Futures contracts | | | (66,943 | ) |
| |
Swap contracts | | | 2,343,652 | |
| |
Net change in unrealized appreciation (depreciation) | | | (152,979,202 | ) |
| |
Net realized and unrealized loss | | | (128,942,017 | ) |
| |
Net decrease in net assets from operations | | | $(41,949,788 | ) |
| |
The accompanying Notes to Financial Statements are an integral part of this statement.
| | |
| |
| Active Portfolios® Multi-Manager Core Plus Bond Fund | | |
Statement of Changes in Net Assets
| | | | | | | | |
| | | Year Ended
August 31, 2013 | | | Year Ended
August 31, 2012(a) | |
Operations | | | | | | | | |
| | |
Net investment income | | | $86,992,229 | | | | $31,856,785 | |
| | |
Net realized gain | | | 24,037,185 | | | | 14,207,398 | |
| | |
Net change in unrealized appreciation (depreciation) | | | (152,979,202 | ) | | | 87,861,206 | |
| |
Net increase (decrease) in net assets resulting from operations | | | (41,949,788 | ) | | | 133,925,389 | |
| |
| | |
Distributions to shareholders | | | | | | | | |
| | |
Net investment income | | | | | | | | |
| | |
Class A | | | (83,044,907 | ) | | | (31,016,690 | ) |
| | |
Net realized gains | | | | | | | | |
| | |
Class A | | | (35,037,957 | ) | | | — | |
| |
Total distributions to shareholders | | | (118,082,864 | ) | | | (31,016,690 | ) |
| |
Increase (decrease) in net assets from capital stock activity | | | (567,132,438 | ) | | | 4,638,114,568 | |
| |
Total increase (decrease) in net assets | | | (727,165,090 | ) | | | 4,741,023,267 | |
| | |
Net assets at beginning of year | | | 4,741,043,267 | | | | 20,000 | |
| |
Net assets at end of year | | | $4,013,878,177 | | | | $4,741,043,267 | |
| |
Undistributed net investment income | | | $3,191,459 | | | | $558,871 | |
| |
| (a) | For the period from April 20, 2012 (commencement of operations) to August 31, 2012. |
| | | | | | | | | | | | | | | | |
| | | Year Ended August 31, 2013 | | | Year Ended August 31, 2012(a) | |
| | | Shares | | | Dollars ($) | | | Shares | | | Dollars ($) | |
Capital stock activity | | | | | | | | | | | | | | | | |
| | | | |
Class A shares | | | | | | | | | | | | | | | | |
| | | | |
Subscriptions | | | 165,549,020 | | | | 1,691,295,213 | | | | 507,315,340 | | | | 5,082,255,141 | |
| | | | |
Distributions reinvested | | | 11,558,711 | | | | 118,082,300 | | | | 3,064,103 | | | | 31,016,519 | |
| | | | |
Redemptions | | | (233,454,259 | ) | | | (2,376,509,951 | ) | | | (47,224,066 | ) | | | (475,157,092 | ) |
| |
Net increase (decrease) | | | (56,346,528 | ) | | | (567,132,438 | ) | | | 463,155,377 | | | | 4,638,114,568 | |
| |
Total net increase (decrease) | | | (56,346,528 | ) | | | (567,132,438 | ) | | | 463,155,377 | | | | 4,638,114,568 | |
| |
| (a) | For the period from April 20, 2012 (commencement of operations) to August 31, 2012. |
The accompanying Notes to Financial Statements are an integral part of this statement.
| | |
| |
| | Active Portfolios® Multi-Manager Core Plus Bond Fund |
Financial Highlights
The following table is intended to help you understand the Fund’s financial performance. Certain information reflects financial results for a single share of a class held for the periods shown. Per share net investment income (loss) amounts are calculated based on average shares outstanding during the period. Total return assumes reinvestment of all dividends and distributions, if any. Total return does not reflect payment of sales charges, if any, and is not annualized for periods of less than one year.
| | | | | | | | |
| | | Year Ended August 31, | |
Class A | | | 2013 | | | | 2012(a) | |
Per share data | | | | | | | | |
Net asset value, beginning of period | | | $10.24 | | | | $10.00 | |
| | | | | | | | | |
Income from investment operations: | | | | | | | | |
| | |
Net investment income | | | 0.19 | | | | 0.08 | |
| | | | | | | | | |
Net realized and unrealized gain (loss) | | | (0.30 | ) | | | 0.24 | |
| | | | | | | | | |
Total from investment operations | | | (0.11 | ) | | | 0.32 | |
| | | | | | | | | |
Less distributions to shareholders: | | | | | | | | |
| | |
Net investment income | | | (0.19 | ) | | | (0.08 | ) |
| | | | | | | | | |
Net realized gains | | | (0.07 | ) | | | — | |
| | | | | | | | | |
Total distributions to shareholders | | | (0.26 | ) | | | (0.08 | ) |
| | | | | | | | | |
Net asset value, end of period | | | $9.87 | | | | $10.24 | |
| | | | | | | | | |
Total return | | | (1.16 | %) | | | 3.17 | % |
| | | | | | | | | |
Ratios to average net assets(b) | | | | | | | | |
| | |
Total gross expenses | | | 0.79 | % | | | 0.81 | %(c) |
| | | | | | | | | |
Total net expenses(d) | | | 0.79 | % | | | 0.81 | %(c) |
| | | | | | | | | |
Net investment income | | | 1.88 | % | | | 2.09 | %(c) |
| | | | | | | | | |
Supplemental data | | | | | | | | |
| | |
Net assets, end of period (in thousands) | | | $4,013,878 | | | | $4,741,043 | |
| | | | | | | | | |
Portfolio turnover(e) | | | 213 | % | | | 78 | % |
| | | | | | | | | |
Notes to Financial Highlights
| (a) | For the period from April 20, 2012 (commencement of operations) to August 31, 2012. |
| (b) | In addition to the fees and expenses which the Fund bears directly, the Fund indirectly bears a pro rata share of the fees and expenses of the acquired funds in which it invests. Such indirect expenses are not included in the reported expense ratios. |
| (d) | Total net expenses include the impact of certain waivers/reimbursements made by the Investment Manager and certain of its affiliates, if applicable. |
| (e) | Includes mortgage dollar rolls. If mortgage dollar roll transactions were excluded, the portfolio turnover would have been 194% and 76% for the years ended August 31, 2013 and 2012, respectively. |
The accompanying Notes to Financial Statements are an integral part of this statement.
| | |
| |
| Active Portfolios® Multi-Manager Core Plus Bond Fund | | |
Notes to Financial Statements
August 31, 2013
Note 1. Organization
Active Portfolios® Multi-Manager Core Plus Bond Fund (the Fund), a series of Columbia Funds Series Trust I (the Trust), is a diversified fund. The Trust is registered under the Investment Company Act of 1940, as amended (the 1940 Act), as an open-end management investment company organized as a Massachusetts business trust.
Fund Shares
The Trust may issue an unlimited number of shares (without par value). The Fund only offers Class A shares that are available only to certain eligible investors through certain wrap fee programs sponsored and/or managed by Ameriprise Financial or its affiliates.
Class A shares are not subject to any front-end sales charge or contingent deferred sales charge.
Note 2. Summary of Significant Accounting Policies
Use of Estimates
The preparation of financial statements in accordance with U.S. generally accepted accounting principles (GAAP) requires management to make certain estimates and assumptions that affect the reported amounts of assets and liabilities, the disclosure of contingent assets and liabilities at the date of the financial statements and the reported amounts of revenue and expenses during the reporting period. Actual results could differ from those estimates.
The following is a summary of significant accounting policies consistently followed by the Fund in the preparation of its financial statements.
Security Valuation
Debt securities generally are valued by pricing services approved by the Board of Trustees (the Board) based upon market transactions for normal, institutional-size trading units of similar securities. The services may use various pricing techniques which take into account appropriate factors such as yield, quality, coupon rate, maturity, type of issue, trading characteristics and other data, as well as broker quotes. Debt securities for which quotations are readily available may also be valued based upon an over-the-counter or exchange bid quotation.
Asset and mortgage-backed securities are generally valued by pricing services, which utilize pricing models that incorporate the securities’ cash flow and loan performance data. These models also take into account available market data, including trades, market quotations, and benchmark yield curves for
identical or similar securities. Factors used to identify similar securities may include, but are not limited to, issuer, collateral type, vintage, prepayment speeds, collateral performance, credit ratings, credit enhancement and expected life. Asset-backed securities for which quotations are readily available may also be valued based upon an over-the-counter or exchange bid quotation.
All equity securities are valued at the close of business of the New York Stock Exchange (NYSE). Equity securities are valued at the last quoted sales price on the principal exchange or market on which they trade, except for securities traded on the NASDAQ Stock Market, which are valued at the NASDAQ official close price. Unlisted securities or listed securities for which there were no sales during the day are valued at the mean of the latest quoted bid and ask prices on such exchanges or markets.
Foreign equity securities are valued based on quotations from the principal market in which such securities are normally traded. If any foreign share prices are not readily available as a result of limited share activity the securities are valued at the mean of the latest quoted bid and ask prices on such exchanges or markets. Foreign currency exchange rates are generally determined at 4:00 p.m. Eastern (U.S.) time. However, many securities markets and exchanges outside the U.S. close prior to the close of the NYSE; therefore, the closing prices for securities in such markets or on such exchanges may not fully reflect events that occur after such close but before the close of the NYSE. In those situations, foreign securities will be fair valued pursuant to the policy adopted by the Board, including utilizing a third party pricing service to determine these fair values. The third party pricing service takes into account multiple factors, including, but not limited to, movements in the U.S. securities markets, certain depositary receipts, futures contracts and foreign exchange rates that have occurred subsequent to the close of the foreign exchange or market, to determine a good faith estimate that reasonably reflects the current market conditions as of the close of the NYSE. The fair value of a security is likely to be different from the quoted or published price, if available.
Investments in open-end investment companies, including money market funds, are valued at net asset value.
Short-term securities purchased within 60 days to maturity are valued at amortized cost, which approximates market value. The value of short-term securities originally purchased with maturities greater than 60 days is determined based on an amortized value to par upon reaching 60 days to maturity. Short-term securities maturing in more than 60 days from the valuation date are valued at the market price or approximate market value based on current interest rates.
| | |
| |
| | Active Portfolios® Multi-Manager Core Plus Bond Fund |
Notes to Financial Statements (continued)
August 31, 2013
Futures and options on futures contracts are valued based upon the settlement price established each day by the board of trade or exchange on which they are traded.
Option contracts are valued at the mean of the latest quoted bid and asked prices on their primary exchanges. Option contracts, including over-the-counter (OTC) option contracts, with no readily available market value are valued using quotations obtained from independent brokers as of the close of the NYSE.
Swap transactions are valued through an independent pricing service or broker, or if neither is available, through an internal model based upon observable inputs.
Investments for which market quotations are not readily available, or that have quotations which management believes are not reliable, are valued at fair value as determined in good faith under consistently applied procedures established by and under the general supervision of the Board. If a security or class of securities (such as foreign securities) is valued at fair value, such value is likely to be different from the last quoted market price for the security.
The determination of fair value often requires significant judgment. To determine fair value, management may use assumptions including but not limited to future cash flows and estimated risk premiums. Multiple inputs from various sources may be used to determine fair value.
Foreign Currency Transactions and Translations
The values of all assets and liabilities denominated in foreign currencies are translated into U.S. dollars at that day’s exchange rates. Net realized and unrealized gains (losses) on foreign currency transactions and translations include gains (losses) arising from the fluctuation in exchange rates between trade and settlement dates on securities transactions, gains (losses) arising from the disposition of foreign currency and currency gains (losses) between the accrual and payment dates on dividends, interest income and foreign withholding taxes.
For financial statement purposes, the Fund does not distinguish that portion of gains (losses) on investments which is due to changes in foreign exchange rates from that which is due to changes in market prices of the investments. Such fluctuations are included with the net realized and unrealized gains (losses) on investments in the Statement of Operations.
Derivative Instruments
The Fund invests in certain derivative instruments, as detailed below, to meet its investment objectives. Derivatives are instruments whose values depend on, or are derived from, in whole or in part, the value of one or more other assets, such as securities, currencies, commodities or indices. Derivative
instruments may be used to maintain cash reserves while maintaining exposure to certain other assets, to offset anticipated declines in values of investments, to facilitate trading, to reduce transaction costs and to pursue higher investment returns. The Fund may also use derivative instruments to mitigate certain investment risks, such as foreign currency exchange rate risk, interest rate risk and credit risk. Derivatives may involve various risks, including the potential inability of the counterparty to fulfill its obligation under the terms of the contract, the potential for an illiquid secondary market (making it difficult for the Fund to sell, including at favorable prices) and the potential for market movements which may expose the Fund to gains or losses in excess of the amount shown in the Statement of Assets and Liabilities. The notional amounts of derivative instruments, if applicable, are not recorded in the financial statements.
A derivative instrument may suffer a mark to market loss if the value of the contract decreases due to an unfavorable change in the market rates or values of the underlying instrument. Losses can also occur if the counterparty does not perform under the contract. A Fund’s risk of loss from counterparty credit risk on OTC derivatives is generally limited to the aggregate unrealized gain netted against any collateral held by the Fund and the amount of any initial margin held by the counterparty. With exchange traded or centrally cleared derivatives, there is minimal counterparty credit risk to the Fund since the exchange’s clearinghouse, as counterparty to such instruments, guarantees against a possible default. The clearinghouse stands between the buyer and the seller of the contract; therefore, the counterparty credit risk is limited to failure of the clearinghouse. However, credit risk still exists in exchange traded or centrally cleared derivatives with respect to initial and variation margin that is held in a broker’s customer accounts. While brokers are required to segregate customer margin from their own assets, in the event that a broker becomes insolvent or goes into bankruptcy and at that time there is a shortfall in the aggregate amount of margin held by the broker for all its clients, U.S. bankruptcy laws will typically allocate that shortfall on a pro-rata basis across all the broker’s customers, potentially resulting in losses to the Fund.
In order to better define its contractual rights and to secure rights that will help the Fund mitigate its counterparty risk, the Fund may enter into an International Swaps and Derivatives Association, Inc. Master Agreement (ISDA Master Agreement) or similar agreement with its derivative contract counterparties. An ISDA Master Agreement is an agreement between a Fund and a counterparty that governs OTC derivatives and forward foreign currency exchange contracts and typically contains, among other things, collateral posting
| | |
| |
| Active Portfolios® Multi-Manager Core Plus Bond Fund | | |
Notes to Financial Statements (continued)
August 31, 2013
terms and netting provisions in the event of a default and/or termination event. Under an ISDA Master Agreement, the Fund may, under certain circumstances, offset with the counterparty certain derivative instrument’s payables and/or receivables with collateral held and/or posted and create one single net payment. The provisions of the ISDA Master Agreement typically permit a single net payment in the event of default (close-out netting) including the bankruptcy or insolvency of the counterparty. Note, however, that bankruptcy or insolvency laws of a particular jurisdiction may impose restrictions on or prohibitions against the right of offset in bankruptcy, insolvency or other events.
Collateral (margin) requirements differ by type of derivative. Margin requirements are established by the exchange or clearinghouse for exchange traded and centrally cleared derivatives. Brokers can ask for margin in excess of the minimum in certain circumstances. Collateral terms are contract specific for OTC derivatives. For OTC derivatives traded under an ISDA Master Agreement, the collateral requirements are typically calculated by netting the mark to market amount for each transaction under such agreement and comparing that amount to the value of any variation margin currently pledged by the Fund and/or the counterparty. Generally, the amount of collateral due from or to a party has to exceed a minimum transfer amount threshold (e.g. $500,000) before a transfer has to be made. To the extent amounts due to the Fund from its counterparties are not fully collateralized, contractually or otherwise, the Fund bears the risk of loss from counterparty nonperformance. The Fund attempts to mitigate counterparty risk by only entering into agreements with counterparties that it believes have the financial resources to honor their obligations and by monitoring the financial stability of those counterparties.
Certain ISDA Master Agreements allow counterparties to OTC derivatives to terminate derivative contracts prior to maturity in the event the Fund’s net assets decline by a stated percentage over a specified time period or the Fund fails to meet the terms of the ISDA Master Agreement, which would cause the Fund to accelerate payment of any net liability owed to the counterparty. The Fund also has termination rights if the counterparty fails to meet the terms of the ISDA Master Agreement. In addition to considering counterparty credit risk, the Fund would consider terminating the derivative contracts based on whether termination would result in a net liability owed from the counterparty.
For financial reporting purposes, the Fund does not offset derivative assets and derivative liabilities that are subject to netting arrangements in the Statement of Assets and Liabilities.
Futures Contracts
Futures contracts are exchange traded and represent commitments for the future purchase or sale of an asset at a specified price on a specified date. The Fund bought and sold futures contracts to produce incremental earnings, manage the duration and yield curve exposure of the Fund versus the benchmark and to manage exposure to movements in interest rates. These instruments may be used for other purposes in future periods. Upon entering into futures contracts, the Fund bears risks that it may not achieve the anticipated benefits of the futures contracts and may realize a loss. Additional risks include counterparty credit risk, the possibility of an illiquid market, and that a change in the value of the contract or option may not correlate with changes in the value of the underlying asset.
Upon entering into a futures contract, the Fund pledges cash or securities with the broker in an amount sufficient to meet the initial margin requirement. The initial margin deposit must be maintained at an established level over the life of the contract. Cash deposited as initial margin is recorded in the Statement of Assets and Liabilities as margin deposits. Securities deposited as initial margin are designated in the Portfolio of Investments. Subsequent payments (variation margin) are made or received by the Fund each day. In the event of a bankruptcy or insolvency of a futures commission merchant that holds the margin on behalf of the Fund, the Fund may not be entitled to the return of the entire margin owed to the Fund, resulting in a loss. The variation margin payments are equal to the daily change in the contract value and are recorded as variation margin receivable or payable and are offset in unrealized gains or losses. The Fund recognizes a realized gain or loss when the contract is closed or expires. Futures contracts involve, to varying degrees, risk of loss in excess of the variation margin disclosed in the Statement of Assets and Liabilities.
Options Contracts
Options are contracts which entitle the holder to purchase or sell securities or other identified assets at a specified price, or in the case of index option contracts, to receive or pay the difference between the index value and the strike price of the index option contract. Option contracts can be either exchange traded or OTC. The Fund purchased and wrote option contracts to manage the duration and yield curve exposure of the Fund vs. the benchmark. These instruments may be used for other purposes in future periods. Completion of transactions for option contracts traded in the OTC market depends upon the performance of the other party. Cash collateral may be collected or posted by the Fund to secure certain OTC option contract trades. Cash collateral held or
| | |
| |
| | Active Portfolios® Multi-Manager Core Plus Bond Fund |
Notes to Financial Statements (continued)
August 31, 2013
posted by the Fund for such option contract trades must be returned to the counterparty or the Fund upon closure, exercise or expiration of the contract.
Options contracts purchased are recorded as investments. When the Fund writes an options contract, the premium received is recorded as an asset and an amount equivalent to the premium is recorded as a liability in the Statement of Assets and Liabilities and is subsequently adjusted to reflect the current fair value of the option written. The Fund will realize a gain or loss when the option contract is closed or expires. When option contracts are exercised, the proceeds on sales for a written call or purchased put option contract, or the purchase cost for a written put or purchased call option contract, is adjusted by the amount of premium received or paid.
For OTC options purchased, the Fund bears the risk of loss of the amount of the premiums paid plus the positive change in market values net of any collateral held by the Fund should the counterparty fail to perform under the contracts. The Fund also has the additional risk of being unable to enter into a closing transaction if a liquid secondary market does not exist. The risk in writing a call option contract is that the Fund gives up the opportunity for profit if the market price of the security increases above the strike price. The risk in writing a put option contract is that the Fund may incur a loss if the market price of the security decreases below the strike price and the option contract is exercised. The Fund’s maximum payout in the case of written put option contracts represents the maximum potential amount of future payments (undiscounted) that the Fund could be required to make under the contract. For OTC options contracts, the transaction is also subject to counterparty credit risk. Option contracts written by the Fund do not typically give rise to counterparty credit risk, as options written generally obligate the Fund and not the counterparty to perform. The maximum payout amount may be offset by the subsequent sale, if any, of assets obtained upon the exercise of the put option contracts by holders of the option contracts or proceeds received upon entering into the contracts.
Contracts and premiums associated with options contracts written for the year ended August 31, 2013 are as follows:
| | | | | | | | | | | | | | | | |
| | | Calls | | | Puts | |
| | | Contracts | | | Premiums ($) | | | Contracts | | | Premiums ($) | |
Balance at August 31, 2012 | | | — | | | | — | | | | — | | | | — | |
Opened | | | 95 | | | | 18,043 | | | | 95 | | | | 44,249 | |
Exercised | | | — | | | | — | | | | 95 | | | | (44,249 | ) |
Expired | | | 95 | | | | (18,043 | ) | | | — | | | | — | |
Balance at August 31, 2013 | | | — | | | | — | | | | — | | | | — | |
Swap Contracts
Swap contracts are privately negotiated in the OTC market and may be entered into as a bilateral contract or centrally cleared (centrally cleared swap contract). In a centrally cleared swap contract, immediately following execution of the swap contract, the swap contract is novated to a central counterparty (the CCP) and the Fund faces the CCP through a broker. Upon entering into a centrally cleared swap contract, the Fund is required to deposit initial margin with the broker in the form of cash or securities in an amount that varies depending on the size and risk profile of the particular swap contract. Securities deposited as initial margin are designated in the Portfolio of Investments and cash deposited is recorded in the Statements of Assets and Liabilities as margin deposits. Unlike a bilateral swap contract, for centrally cleared swap contacts, the Fund has minimal credit exposure to the counterparty as the CCP stands between the Fund and the counterparty. Swap contracts are marked-to-market daily and changes in value are recorded as unrealized appreciation (depreciation). The daily change in valuation of centrally cleared swap contracts, if any, is recorded as a receivable or payable for variation margin in the Statements of Assets and Liabilities.
Credit Default Swap Contracts
The Fund entered into credit default swap contracts to increase or decrease its credit exposure to an index, to increase or decrease its credit exposure to a single issuer of debt securities, and to increase or decrease its credit exposure to a specific debt security or a basket of debt securities as a protection buyer to reduce overall credit exposure. Additionally, credit default swap contracts were used to hedge the Fund’s exposure on a debt security that it owns or in lieu of selling such debt security. These instruments may be used for other purposes in future periods. Credit default swap contracts are agreements in which one party pays fixed periodic payments to a counterparty in consideration for a guarantee from the counterparty to make a specific payment should a specified credit event(s) take place. Although specified events are contract specific, credit events are generally defined as bankruptcy, failure to pay, restructuring, obligation acceleration, obligation default, or repudiation/moratorium.
As the purchaser of a credit default swap contract, the Fund purchases protection by paying a periodic interest rate on the notional amount to the counterparty. The interest amount is accrued daily as a component of unrealized appreciation (depreciation) and is recorded as a realized loss upon payment. If a credit event as specified in the contract occurs, the Fund may have the option either to deliver the reference obligation to the seller in exchange for a cash payment of its
| | |
| |
| Active Portfolios® Multi-Manager Core Plus Bond Fund | | |
Notes to Financial Statements (continued)
August 31, 2013
par amount, or to receive a net cash settlement equal to the par amount less an agreed-upon value of the reference obligation as of the date of the credit event. Credit events are contact specific but may include bankruptcy, failure to pay, restructuring and obligation acceleration. The difference between the value of the obligation or cash delivered and the notional amount received will be recorded as a realized gain (loss).
Any premium paid or received by the Fund upon entering into a credit default swap contract is recorded as an asset or liability, respectively, and amortized daily as a component of realized gain (loss) in the Statement of Operations. Credit default swap contracts are valued daily, and the change in value is recorded as unrealized appreciation (depreciation) until the termination of the swap, at which time a realized gain (loss) is recorded.
Credit default swap contracts can involve greater risks than if a fund had invested in the reference obligation directly since, in addition to general market risks, credit default swaps are subject to counterparty credit risk, leverage risk, hedging risk, correlation risk and liquidity risk. The Fund will enter into credit default swap transactions only with counterparties that meet certain standards of creditworthiness.
Effects of Derivative Transactions in the Financial Statements
The following tables are intended to provide additional information about the effect of derivatives on the financial statements of the Fund, including: the fair value of derivatives by risk category and the location of those fair values in the Statement of Assets and Liabilities; the impact of derivative transactions over the period in the Statement of Operations including realized gains or losses and unrealized gains or losses. The derivative schedules following the Portfolio of Investments present additional information regarding derivative instruments outstanding at the end of the period, if any.
The following table is a summary of the fair value of derivative instruments at August 31, 2013:
| | | | | | |
| | Asset Derivatives | |
Risk Exposure
Category | | Statement of Assets and Liabilities Location | | | Fair Value ($) | |
Credit risk | | Unrealized appreciation on swap contracts | | | 1,032,822 | |
Credit risk | | Premiums paid on outstanding credit default swap contracts | | | 1,996,825 | |
Interest rate risk | | Net assets — unrealized appreciation on futures contracts | | | 543,701 | * |
Total | | | | | 3,573,348 | |
| | | | | | |
| | Liability Derivatives | |
Risk Exposure
Category | | Statement of Assets and Liabilities Location | | | Fair Value ($) | |
Credit risk | | Unrealized depreciation on swap contracts | | | 1,187,681 | |
Credit risk | | Premiums received on outstanding credit default swap contracts | | | 3,452,663 | |
Interest rate risk | | Net assets — unrealized depreciation on futures contracts | | | 2,119,478 | * |
Total | | | | | 6,759,822 | |
| * | Includes cumulative appreciation (depreciation) of futures contracts as reported in the Futures Contracts Outstanding table following the Portfolio of Investments. Only the current day’s variation margin is reported in receivables or payables in the Statement of Assets and Liabilities. |
The following table indicates the effect of derivative instruments in the Statement of Operations for the year ended August 31, 2013:
| | | | | | | | | | | | | | | | |
Amount of Realized Gain (Loss) on Derivatives Recognized in
Income | |
Risk
Exposure
Category | | Futures
Contracts ($) | | | Options
Contracts
Written and
Purchased ($) | | | Swap
Contracts ($) | | | Total ($) | |
Credit risk | | | — | | | | — | | | | (12,389,568 | ) | | | (12,389,568 | ) |
Interest rate risk | | | 14,898,705 | | | | (283 | ) | | | — | | | | 14,898,422 | |
Total | | | 14,898,705 | | | | (283 | ) | | | (12,389,568 | ) | | | 2,508,854 | |
Change in Unrealized Appreciation (Depreciation) on Derivatives
Recognized in Income | |
Risk
Exposure
Category | | Futures
Contracts ($) | | | | | | Swap
Contracts ($) | | | Total ($) | |
Credit risk | | | — | | | | | | | | 2,343,652 | | | | 2,343,652 | |
Interest rate risk | | | (66,943 | ) | | | | | | | — | | | | (66,943 | ) |
Total | | | (66,943 | ) | | | | | | | 2,343,652 | | | | 2,276,709 | |
The following table is a summary of the volume of derivative instruments for the year ended August 31, 2013:
| | | | |
| Derivative Instrument | | Contracts Opened | |
Futures contracts | | | 35,251 | |
Options contracts | | | 285 | |
| Derivative Instrument | | Aggregate Notional
Opened ($) | |
Credit default swap contracts — buy protection | | | 317,420,750 | |
Credit default swap contracts — sell protection | | | 77,640,000 | |
| | |
| |
| | Active Portfolios® Multi-Manager Core Plus Bond Fund |
Notes to Financial Statements (continued)
August 31, 2013
Investments in Loans
The Fund may invest in loan participations and assignments of all or a portion of a loan. When the Fund purchases a loan participation, the Fund typically enters into a contractual relationship with the lender or third party selling such participations (Selling Participant), but not the borrower, and assumes the credit risk of the borrower, Selling Participant and any other persons interpositioned between the Fund and the borrower. In addition, the Fund may not directly benefit from the collateral supporting the loan that it has purchased from the Selling Participant. In contrast, when the Fund purchases an assignment of a loan, the Fund typically has direct rights against the borrower; provided, however, that the Fund’s rights may be more limited than the lender from which it acquired the assignment and the Fund may be able to enforce their rights only through an administrative agent. Although certain loan participations or assignments are secured by collateral, the Fund could experience delays or limitations in realizing such collateral or have their interest subordinated to other indebtedness of the obligor. In the event that the administrator or collateral agent of a loan becomes insolvent, enters into receivership or bankruptcy, the Fund may incur costs and delays in realizing payment or may suffer a loss of principal and/or interest. The risk of loss is greater for unsecured or subordinated loans. In addition, loan participations and assignments are vulnerable to market conditions such that economic conditions or other events may reduce the demand for loan participations and assignments and certain loan participations and assignments which were liquid, when purchased, may become illiquid.
Delayed Delivery Securities
The Fund may trade securities on other than normal settlement terms, including securities purchased or sold on a “when-issued” basis. This may increase the risk if the other party to the transaction fails to deliver and causes the Fund to subsequently invest at less advantageous prices. The Fund designates cash or liquid securities in an amount equal to the delayed delivery commitment.
Mortgage Dollar Roll Transactions
The Fund may enter into mortgage “dollar rolls” in which the Fund sells securities for delivery in the current month and simultaneously contracts with the same counterparty to repurchase similar but not identical securities (same type, coupon and maturity) on a specified future date. During the roll period, the Fund loses the right to receive principal and interest paid on the securities sold. However, the Fund will benefit because it receives negotiated amounts in the form of reductions of the purchase price for the future purchase plus the interest earned on the cash proceeds of the securities sold
until the settlement date of the forward purchase. The Fund records the incremental difference between the forward purchase and sale of each forward roll as a realized gain or loss. Unless any realized gains exceed the income, capital appreciation, and gain or loss due to mortgage prepayments that would have been realized on the securities sold as part of the mortgage dollar roll, the use of this technique will diminish the investment performance of the Fund compared to what the performance would have been without the use of mortgage dollar rolls. All cash proceeds will be invested in instruments that are permissible investments for the Fund. The Fund identifies cash or liquid securities in an amount equal to the forward purchase price.
For financial reporting and tax purposes, the Fund treats “to be announced” mortgage dollar rolls as two separate transactions, one involving the purchase of a security and a separate transaction involving a sale. These transactions may increase the Fund’s portfolio turnover rate. The Fund does not currently enter into mortgage dollar rolls that are accounted for as financing transactions.
Mortgage dollar rolls involve the risk that the market value of the securities the Fund is obligated to repurchase may decline below the repurchase price, or that the counterparty may default on its obligations.
Treasury Inflation Protected Securities
The Fund may invest in treasury inflation protected securities (TIPS). The principal amount of TIPS is adjusted periodically and is increased for inflation or decreased for deflation based on a monthly published index. Interest payments are based on the adjusted principal at the time the interest is paid. These adjustments are recorded as interest income in the Statement of Operations.
Interest Only Securities
The Fund may invest in Interest Only Securities (IOs). IOs are stripped securities entitled to receive all of the security’s interest, but none of its principal. The Fund may also invest in stripped mortgage-backed securities. If the underlying obligations experience greater than anticipated prepayments of principal, the Fund may fail to fully recoup its initial investment in an IO. As a result of the prepayments the daily interest accrual factor is adjusted periodically (typically, each month) to reflect the paydown of principal. IOs are particularly sensitive to changes in interest rates and therefore subject to greater fluctuations in price than typical interest bearing debt securities. IOs are also subject to credit risk because the Fund may not receive all or part of the interest payments if the issuer or credit enhanced defaults on its obligation.
| | |
| |
| Active Portfolios® Multi-Manager Core Plus Bond Fund | | |
Notes to Financial Statements (continued)
August 31, 2013
Principal Only Securities
The Fund may invest in Principal Only Securities (POs). POs are stripped securities entitled to receive most, if not all, of the principal from the underlying obligation, but not the interest. The Fund may also invest in stripped mortgage-backed securities. POs are particularly sensitive to changes in interest rates and therefore are subject to fluctuations in price. POs are also subject to credit risk because the Fund may not receive all or part of its principal if the issuer or credit enhancer defaults on its obligation.
Security Transactions
Security transactions are accounted for on the trade date. Cost is determined and gains (losses) are based upon the specific identification method for both financial statement and federal income tax purposes.
Income Recognition
Interest income is recorded on an accrual basis. Market premiums and discounts, including original issue discounts, are amortized and accreted, respectively, over the expected life of the security on all debt securities, unless otherwise noted.
Corporate actions and dividend income are generally recorded net of any non-reclaimable tax withholdings, on the ex-dividend date or upon receipt of ex-dividend notification in the case of certain foreign securities.
The value of additional securities received as an income payment is recorded as income and increases the cost basis of such securities.
Expenses
General expenses of the Trust are allocated to the Fund and other funds of the Trust based upon relative net assets or other expense allocation methodologies determined by the nature of the expense. Expenses directly attributable to the Fund are charged to the Fund.
Federal Income Tax Status
The Fund intends to qualify each year as a regulated investment company under Subchapter M of the Internal Revenue Code, as amended, and will distribute substantially all of its taxable income (including net short-term capital gains), if any, for its tax year, and as such will not be subject to federal income taxes. In addition, the Fund intends to distribute in each calendar year substantially all of its net investment income, capital gains and certain other amounts, if any, such that the Fund should not be subject to federal excise tax. Therefore, no federal income or excise tax provision is recorded.
Foreign Taxes
The Fund may be subject to foreign taxes on income, gains on investments or currency repatriation, a portion of which may be recoverable. The Fund will accrue such taxes and recoveries, as applicable, based upon its current interpretation of tax rules and regulations that exist in the markets in which it invests.
Realized gains in certain countries may be subject to foreign taxes at the Fund level, based on statutory rates. The Fund accrues for such foreign taxes on realized and unrealized gains at the appropriate rate for each jurisdiction, as applicable. The amount, if any, is disclosed as a liability on the Statement of Assets and Liabilities.
Distributions to Shareholders
Distributions from net investment income, if any, are declared daily and paid monthly. Net realized capital gains, if any, are distributed at least annually. Income distributions and capital gain distributions are determined in accordance with federal income tax regulations, which may differ from GAAP.
Guarantees and Indemnifications
Under the Trust’s organizational documents and, in some cases, by contract, its officers and trustees are indemnified against certain liabilities arising out of the performance of their duties to the Trust or its funds. In addition, certain of the Fund’s contracts with its service providers contain general indemnification clauses. The Fund’s maximum exposure under these arrangements is unknown since the amount of any future claims that may be made against the Fund cannot be determined, and the Fund has no historical basis for predicting the likelihood of any such claims.
Recent Accounting Pronouncement
Disclosures about Offsetting Assets and Liabilities
In December 2011, the Financial Accounting Standards Board (FASB) issued Accounting Standards Update (ASU) No. 2011-11, Disclosures about Offsetting Assets and Liabilities and in January 2013, ASU No. 2013-1, Clarifying the Scope of Disclosures about Offsetting Assets and Liabilities (collectively, the ASUs). Specifically, the ASUs require an entity to disclose both gross and net information for derivatives and other financial instruments that are subject to a master netting arrangement or similar agreement. The ASUs require disclosure of collateral received in connection with the master netting agreements or similar agreements. The disclosure requirements are effective for interim and annual periods beginning on or after January 1, 2013. At this time, management is evaluating the implications of this guidance and the impact it will have on the financial statement amounts and footnote disclosures, if any.
| | |
| |
| | Active Portfolios® Multi-Manager Core Plus Bond Fund |
Notes to Financial Statements (continued)
August 31, 2013
Note 3. Fees and Compensation Paid to Affiliates
Investment Management Fees
Under an Investment Management Services Agreement, Columbia Management Investment Advisers, LLC (the Investment Manager), a wholly-owned subsidiary of Ameriprise Financial, Inc. (Ameriprise Financial), is responsible for the ultimate oversight of investments made by the Fund. The Fund’s subadvisers (see Subadvisory Agreements below) each share the primary responsibility for the day-to-day portfolio management of the Fund with the Investment Manager. The investment management fee is an annual fee that is equal to a percentage of the Fund’s average daily net assets that declines from 0.43% to 0.30% as the Fund’s net assets increase. The effective investment management fee rate for the year ended August 31, 2013 was 0.41% of the Fund’s average daily net assets.
Subadvisory Agreements
The Investment Manager has entered into Subadvisory Agreements with Federated Investment Management Company and TCW Investment Management Company, each of which subadvises a portion of the assets of the Fund. New investments in the Fund, net of any redemptions, are allocated in accordance with the Investment Manager’s determination, subject to the oversight of the Fund’s Board. Each subadviser’s proportionate share of investments in the Fund will vary due to market fluctuations. The Investment Manager compensates each subadviser to manage the investment of the Fund’s assets.
Administration Fees
Under an Administrative Services Agreement, the Investment Manager also serves as the Fund Administrator. The Fund pays the Fund Administrator an annual fee for administration and accounting services equal to a percentage of the Fund’s average daily net assets that declines from 0.07% to 0.04% as the Fund’s net assets increase. The effective administration fee rate for the year ended August 31, 2013 was 0.06% of the Fund’s average daily net assets.
Other Expenses
Other expenses include offering costs which were incurred prior to the shares of the Fund being offered. Offering costs include, among other things, state registration filing fees and printing costs. The Fund amortizes offering costs over a period of 12 months from the commencement of operations.
Compensation of Board Members
Board members are compensated for their services to the Fund as disclosed in the Statement of Operations. The Trust’s eligible Trustees may participate in a Deferred Compensation Plan (the Plan) which may be terminated at any time. Obligations of the Plan will be paid solely out of the Fund’s assets.
Compensation of Chief Compliance Officer
The Board has appointed a Chief Compliance Officer to the Fund in accordance with federal securities regulations. The Fund pays its pro-rata share of the expenses associated with the Chief Compliance Officer. The Fund’s expenses for the Chief Compliance Officer will not exceed $15,000 per year.
Transfer Agent Fees
Under a Transfer and Dividend Disbursing Agent Agreement, Columbia Management Investment Services Corp. (the Transfer Agent), an affiliate of the Investment Manager and a wholly-owned subsidiary of Ameriprise Financial, is responsible for providing transfer agency services to the Fund. The Transfer Agent has contracted with Boston Financial Data Services (BFDS) to serve as sub-transfer agent.
The Transfer Agent receives monthly account-based service fees based on the number of open accounts and is reimbursed by the Fund for the fees and expenses the Transfer Agent pays to financial intermediaries that maintain omnibus accounts with the Fund that is a percentage of the average aggregate value of the Fund’s shares maintained in each such omnibus account (other than omnibus accounts for which American Enterprise Investment Services Inc. is the broker of record or accounts where the beneficial shareholder is a customer of Ameriprise Financial Services, Inc., which are paid a per account fee). The Transfer Agent pays the fees of BFDS for services as sub-transfer agent and is not entitled to reimbursement for such fees from the Fund (with the exception of out-of-pocket fees).
The Transfer Agent also receives compensation from fees for various shareholder services and reimbursements for certain out-of-pocket fees.
For the year ended August 31, 2013, the Fund’s effective transfer agent fee rate as a percentage of average daily net assets for Class A shares was 0.05%.
Distribution and Service Fees
The Fund has an agreement with Columbia Management Investment Distributors, Inc. (the Distributor), an affiliate of the Investment Manager and a wholly-owned subsidiary of Ameriprise Financial, for distribution and shareholder
| | |
| |
| Active Portfolios® Multi-Manager Core Plus Bond Fund | | |
Notes to Financial Statements (continued)
August 31, 2013
services. Pursuant to Rule 12b-1 under the 1940 Act, the Board has approved, and the Fund has adopted, distribution and shareholder service plans (the Plans) which set the distribution and service fees for the Fund. These fees are calculated daily and are intended to compensate the Distributor and/or eligible selling and/or servicing agents for selling shares of the Fund and providing services to investors.
The Fund may pay a distribution fee of up to 0.25% of the Fund’s average daily net assets attributable to Class A shares and a service fee of up to 0.25% of the Fund’s average daily net assets attributable to Class A shares, provided, however, that the aggregate fee shall not exceed 0.25% of the Fund’s average daily net assets attributable to Class A shares.
Expenses Waived/Reimbursed by the Investment Manager and its Affiliates
The Investment Manager and certain of its affiliates have contractually agreed to waive fees and/or reimburse expenses (excluding certain fees and expenses described below), through December 31, 2014, unless sooner terminated at the sole discretion of the Board, so that the Fund’s net operating expenses, after giving effect to fees waived/expenses reimbursed and any balance credits and/or overdraft charges from the Fund’s custodian, do not exceed the annual rate of 0.84% of Class A shares’ average daily net assets.
Under the agreement, the following fees and expenses are excluded from the waiver/reimbursement commitment, and therefore will be paid by the Fund, if applicable: taxes (including foreign transaction taxes), expenses associated with investments in affiliated and non-affiliated pooled investment vehicles (including mutual funds and exchange traded funds), transaction costs and brokerage commissions, costs related to any securities lending program, dividend expenses associated with securities sold short, inverse floater program fees and expenses, transaction charges and interest on borrowed money, interest, extraordinary expenses and any other expenses the exclusion of which is specifically approved by the Board. This agreement may be modified or amended only with approval from all parties.
Note 4. Federal Tax Information
The timing and character of income and capital gain distributions are determined in accordance with income tax regulations, which may differ from GAAP because of temporary or permanent book to tax differences.
At August 31, 2013, these differences are primarily due to differing treatment for tax straddles, paydown reclassifications, principal and/or interest of fixed income securities, deferral/reversal of wash sales losses, Trustees’
deferred compensation, distribution reclassifications, foreign currency transactions, non-deductible expenses, post-October capital losses, derivative investments and adjustments on certain convertible preferred securities. To the extent these differences are permanent, reclassifications are made among the components of the Fund’s net assets in the Statement of Assets and Liabilities. Temporary differences do not require reclassifications. In the Statement of Assets and Liabilities the following reclassifications were made:
| | | | |
Undistributed net investment income | | $ | (1,314,734 | ) |
Accumulated net realized gain | | | 1,314,734 | |
Net investment income and net realized gains (losses), as disclosed in the Statement of Operations, and net assets were not affected by this reclassification.
The tax character of distributions paid during the years indicated was as follows:
| | | | | | | | |
| | | Year Ended
August 31, 2013 ($) | | | Year Ended
August 31, 2012 ($) | |
Ordinary income | | | 118,082,864 | | | | 31,016,690 | |
Short-term capital gain distributions, if any, are considered ordinary income distributions for tax purposes.
At August 31, 2013, the components of distributable earnings on a tax basis were as follows:
| | | | |
Undistributed ordinary income | | | $10,185,424 | |
Undistributed accumulated long-term gain | | | 12,740,448 | |
Unrealized depreciation | | | (66,043,500 | ) |
At August 31, 2013, the cost of investments for federal income tax purposes was $4,373,134,853 and the aggregate gross unrealized appreciation and depreciation based on that cost was:
| | | | |
Unrealized appreciation | | | $40,603,761 | |
Unrealized depreciation | | | (106,647,261) | |
Net unrealized depreciation | | | $(66,043,500) | |
Under current tax rules, regulated investment companies can elect to treat certain late-year ordinary losses incurred and post-October capital losses (capital losses realized after October 31) as arising on the first day of the following taxable year. As of August 31, 2013, the Fund will elect to treat post-October capital losses of $6,779,783 as arising on September 1, 2013.
Management of the Fund has concluded that there are no significant uncertain tax positions that would require recognition in the financial statements. However, management’s conclusion may be subject to review and
| | |
| |
| | Active Portfolios® Multi-Manager Core Plus Bond Fund |
Notes to Financial Statements (continued)
August 31, 2013
adjustment at a later date based on factors including, but not limited to, new tax laws, regulations, and administrative interpretations (including relevant court decisions). Generally, the Fund’s federal tax returns for the prior three fiscal years remain subject to examination by the Internal Revenue Service.
Note 5. Portfolio Information
The cost of purchases and proceeds from sales of securities, excluding short-term obligations but including mortgage dollar rolls, aggregated to $9,498,670,788 and $9,923,466,831, respectively, for the year ended August 31, 2013, of which $7,624,675,903 and $8,166,266,354, respectively, were U.S. government securities.
Note 6. Affiliated Money Market Fund
The Fund invests its daily cash balances in Columbia Short-Term Cash Fund, an affiliated money market fund established for the exclusive use by the Fund and other affiliated funds. The income earned by the Fund from such investments is included as “Dividends — affiliated issuers” in the Statement of Operations. As an investing fund, the Fund indirectly bears its proportionate share of the expenses of Columbia Short-Term Cash Fund.
Note 7. Shareholder Concentration
At August 31, 2013, affiliated shareholder accounts owned 100.0% of the outstanding shares of the Fund. Subscription and redemption activity by concentrated accounts may have a significant effect on the operations of the Fund.
Note 8. Line of Credit
The Fund has entered into a revolving credit facility with a syndicate of banks led by JPMorgan Chase Bank N.A. whereby the Fund may borrow for the temporary funding of shareholder redemptions or for other temporary or emergency purposes. The credit facility agreement, as amended, which is a collective agreement between the Fund and certain other funds managed by the Investment Manager, severally and not jointly, permits collective borrowings up to $500 million. Interest is charged to each participating fund based on its borrowings at a rate equal to the higher of (i) the overnight federal funds rate plus 1.00% or (ii) the one-month LIBOR rate plus 1.00%. Each borrowing under the credit facility matures no later than 60 days after the date of borrowing. The Fund also pays a commitment fee equal to its pro rata share of the amount of the credit facility at a rate of 0.08% per annum. The commitment fee is included in other expenses in the Statement of Operations.
The Fund had no borrowings during the year ended August 31, 2013.
Note 9. Subsequent Events
Management has evaluated the events and transactions that have occurred through the date the financial statements were issued and noted no items requiring adjustment of the financial statements or additional disclosure.
Note 10. Information Regarding Pending and Settled Legal Proceedings
In December 2005, without admitting or denying the allegations, American Express Financial Corporation (AEFC, which is now known as Ameriprise Financial, Inc. (Ameriprise Financial)) entered into settlement agreements with the Securities and Exchange Commission (SEC) and Minnesota Department of Commerce (MDOC) related to market timing activities. As a result, AEFC was censured and ordered to cease and desist from committing or causing any violations of certain provisions of the Investment Advisers Act of 1940, the Investment Company Act of 1940, and various Minnesota laws. AEFC agreed to pay disgorgement of $10 million and civil money penalties of $7 million. AEFC also agreed to retain an independent distribution consultant to assist in developing a plan for distribution of all disgorgement and civil penalties ordered by the SEC in accordance with various undertakings detailed at www.sec.gov/litigation/admin/ia-2451.pdf. Ameriprise Financial and its affiliates have cooperated with the SEC and the MDOC in these legal proceedings, and have made regular reports to the funds’ Boards of Trustees.
Ameriprise Financial and certain of its affiliates have historically been involved in a number of legal, arbitration and regulatory proceedings, including routine litigation, class actions, and governmental actions, concerning matters arising in connection with the conduct of their business activities. Ameriprise Financial believes that the Funds are not currently the subject of, and that neither Ameriprise Financial nor any of its affiliates are the subject of, any pending legal, arbitration or regulatory proceedings that are likely to have a material adverse effect on the Funds or the ability of Ameriprise Financial or its affiliates to perform under their contracts with the Funds. Ameriprise Financial is required to make 10-Q, 10-K and, as necessary, 8-K filings with the Securities and Exchange Commission on legal and regulatory matters that relate to Ameriprise Financial and its affiliates. Copies of these filings may be obtained by accessing the SEC website at www.sec.gov.
| | |
| |
| Active Portfolios® Multi-Manager Core Plus Bond Fund | | |
Notes to Financial Statements (continued)
August 31, 2013
There can be no assurance that these matters, or the adverse publicity associated with them, will not result in increased fund redemptions, reduced sale of fund shares or other adverse consequences to the Funds. Further, although we believe proceedings are not likely to have a material adverse effect on the Funds or the ability of Ameriprise Financial or its affiliates to perform under their contracts with the Funds, these proceedings are subject to uncertainties and, as such, we are unable to estimate the possible loss or range of loss that may result. An adverse outcome in one or more of these proceedings could result in adverse judgments, settlements, fines, penalties or other relief that could have a material adverse effect on the consolidated financial condition or results of operations of Ameriprise Financial.
| | |
| |
| | Active Portfolios® Multi-Manager Core Plus Bond Fund |
Report of Independent Registered Public Accounting Firm
To the Trustees of Columbia Funds Series Trust I and the Shareholders of Active Portfolios® Multi-Manager Core Plus Bond Fund
In our opinion, the accompanying statement of assets and liabilities, including the portfolio of investments, and the related statements of operations and of changes in net assets and the financial highlights present fairly, in all material respects, the financial position of Active Portfolios® Multi-Manager Core Plus Bond Fund (the “Fund”) (a series of Columbia Funds Series Trust I) at August 31, 2013, the results of its operations, the changes in its net assets and the financial highlights for the periods indicated, in conformity with accounting principles generally accepted in the United States of America. These financial statements and financial highlights (hereafter referred to as “financial statements”) are the responsibility of the Fund’s management. Our responsibility is to express an opinion on these financial statements based on our audits. We conducted our audits of these financial statements in accordance with the standards of the Public Company Accounting Oversight Board (United States). Those standards require that we plan and perform the audit to obtain reasonable assurance about whether the financial statements are free of material misstatement. An audit includes examining, on a test basis, evidence supporting the amounts and disclosures in the financial statements, assessing the accounting principles used and significant estimates made by management, and evaluating the overall financial statement presentation. We believe that our audits, which included confirmation of securities at August 31, 2013 by correspondence with the custodian, brokers and transfer agent, provide a reasonable basis for our opinion.
PricewaterhouseCoopers LLP
Minneapolis, Minnesota
October 22, 2013
| | |
| |
| Active Portfolios® Multi-Manager Core Plus Bond Fund | | |
Federal Income Tax Information
(Unaudited)
The Fund hereby designates the following tax attributes for the fiscal year ended August 31, 2013. Shareholders will be notified in early 2014 of the amounts for use in preparing 2013 income tax returns.
Tax Designations
| | | | |
| | | | | |
Capital Gain Dividend | | | $13,377,470 | |
Capital Gain Dividend. The Fund designates as a capital gain dividend the amount reflected above, or if subsequently determined to be different, the net capital gain of such fiscal period. The Fund also designates as capital gain dividends, to the extent necessary to fully distribute such capital gains, earnings and profits distributed to shareholders on the redemption of shares.
| | |
| |
| | Active Portfolios® Multi-Manager Core Plus Bond Fund |
Trustees and Officers
The Trustees serve terms of indefinite duration. The names, addresses and birth years of the Trustees and Officers of the Funds in Columbia Funds Series Trust I, the year each was first elected or appointed to office, their principal business occupations during at least the last five years, the number of Funds overseen by each Trustee and other directorships they hold are shown below. Each officer listed below serves as an officer of each Fund in Columbia Funds Series Trust I.
| | |
| Independent Trustees |
Name, Address and Year of Birth, Position with Funds, Year First Elected or Appointed to Office | | Principal Occupation(s) During Past Five Years, Number of Funds in Columbia
Funds Complex Overseen by Trustee, Other Directorships Held |
Rodman L. Drake (Born 1943) c/o Columbia Management Investment Advisers, LLC 225 Franklin Street Boston, MA 02110 Trustee (since 1994) and Chairman of the Board (since 2009) | | Independent consultant since 2010; Co-Founder of Baringo Capital LLC (private equity) from 1997 to 2008; Chairman (from 2003 to 2010) and CEO (from 2008 to 2010) of Crystal River Capital, Inc. (real estate investment trust); Oversees 52; Jackson Hewitt Tax Service Inc. (tax preparation services) from 2004 to 2011; Student Loan Corporation (student loan provider) from 2005 to 2010; Celgene Corporation (global biotechnology company); The Helios Funds and Brookfield Funds (closed-end funds); Chimerix, Inc. (biopharmaceutical company) since August 1, 2013; Crystal River Capital, Inc. from 2005 to 2010; Parsons Brinckerhoff from 1995 to 2008; and Apex Silver Mines Ltd. from 2007 to 2009 |
Douglas A. Hacker (Born 1955) c/o Columbia Management Investment Advisers, LLC 225 Franklin Street Boston, MA 02110 Trustee (since 1996) | | Independent business executive since May 2006; Executive Vice President — Strategy of United Airlines from December 2002 to May 2006; President of UAL Loyalty Services (airline marketing company) from September 2001 to December 2002; Executive Vice President and Chief Financial Officer of United Airlines from July 1999 to September 2001. Oversees 52; Nash Finch Company (food distributor); Aircastle Limited (aircraft leasing); and SeaCube Container Leasing Ltd. (container leasing) |
Janet Langford Kelly (Born 1957) c/o Columbia Management Investment Advisers, LLC 225 Franklin Street Boston, MA 02110 Trustee (since 1996) | | Senior Vice President, General Counsel and Corporate Secretary, ConocoPhillips (integrated energy company) since September 2007; Deputy General Counsel — Corporate Legal Services, ConocoPhillips from August 2006 to August 2007; Partner, Zelle, Hofmann, Voelbel, Mason & Gette LLP (law firm) from March 2005 to July 2006; Adjunct Professor of Law, Northwestern University from September 2004 to June 2006; Director, UAL Corporation (airline) from February 2006 to July 2006; Chief Administrative Officer and Senior Vice President, Kmart Holding Corporation (consumer goods) from September 2003 to March 2004. Oversees 52; None |
Nancy T. Lukitsh (Born 1956) c/o Columbia Management Investment Advisers, LLC 225 Franklin Street Boston, MA 02110 Trustee (since 2011) | | Senior Vice President, Partner and Director of Marketing, Wellington Management Company, LLP (investment adviser) from 1997 to 2010; Chair, Wellington Management Investment Portfolios (commingled non-U.S. investment pools) from 2007 to 2010; Director, Wellington Trust Company, NA and other Wellington affiliates from 1997 to 2010. Oversees 52; None |
William E. Mayer (Born 1940) c/o Columbia Management Investment Advisers, LLC 225 Franklin Street Boston, MA 02110 Trustee (since 1994) | | Partner, Park Avenue Equity Partners (private equity) since February 1999; Dean and Professor, College of Business and Management, University of Maryland from 1992 to 1996. Oversees 52; DynaVox Inc. (speech creation); Lee Enterprises (print media); WR Hambrecht + Co. (financial service provider) from 2000 to 2012; BlackRock Kelso Capital Corporation (investment company) |
David M. Moffett (Born 1952) c/o Columbia Management Investment Advisers, LLC 225 Franklin Street Boston, MA 02110 Trustee (since 2011) | | Retired. Chief Executive Officer, Federal Home Loan Mortgage Corporation, from 2008 to 2009; Senior Adviser, Global Financial Services Group, Carlyle Group, Inc., from 2007 to 2008; Vice Chairman and Chief Financial Officer, U.S. Bancorp, from 1993 to 2007. Oversees 52; CIT Group Inc. (commercial and consumer finance); eBay Inc. (online trading community); MBIA Inc. (financial service provider); E.W. Scripps Co. (print and television media), Building Materials Holding Corp. (building materials and construction services); Genworth Financial, Inc. (financial and insurance products and services); and University of Oklahoma Foundation |
Charles R. Nelson (Born 1942) c/o Columbia Management Investment Advisers, LLC 225 Franklin Street Boston, MA 02110 Trustee (since 1981) | | Retired. Professor Emeritus, University of Washington, since 2011; Professor of Economics, University of Washington from 1976 to 2011; Ford and Louisa Van Voorhis Professor of Political Economy, University of Washington from 1993 to 2011; Adjunct Professor of Statistics, University of Washington from 1980 to 2011; Associate Editor, Journal of Money, Credit and Banking from September 1993 to 2008; consultant on econometric and statistical matters. Oversees 52; None |
John J. Neuhauser (Born 1943) c/o Columbia Management Investment Advisers, LLC 225 Franklin Street Boston, MA 02110 Trustee (since 1984) | | President, Saint Michael’s College, since August 2007; Director or Trustee of several non-profit organizations, including Fletcher Allen Health Care, Inc.; University Professor, Boston College from November 2005 to August 2007; Academic Vice President and Dean of Faculties, Boston College from August 1999 to October 2005. Oversees 52; Liberty All-Star Equity Fund and Liberty All-Star Growth Fund (closed-end funds) |
| | |
| |
| Active Portfolios® Multi-Manager Core Plus Bond Fund | | |
Trustees and Officers (continued)
| | |
| Independent Trustees (continued) |
Name, Address and Year of Birth, Position with Funds, Year First Elected or Appointed to Office | | Principal Occupation(s) During Past Five Years, Number of Funds in Columbia
Funds Complex Overseen by Trustee, Other Directorships Held |
Patrick J. Simpson (Born 1944) c/o Columbia Management Investment Advisers, LLC 225 Franklin Street Boston, MA 02110 Trustee (since 2000) | | Partner, Perkins Coie LLP (law firm). Oversees 52; None |
Anne-Lee Verville (Born 1945) c/o Columbia Management Investment Advisers, LLC 225 Franklin Street Boston, MA 02110 Trustee (since 1998) | | Retired. General Manager — Global Education Industry from 1994 to 1997, President — Application Systems Division from 1991 to 1994, Chief Financial Officer — US Marketing & Services from 1988 to 1991, and Chief Information Officer from 1987 to 1988, IBM Corporation (computer and technology). Oversees 52; Enesco Group, Inc. (producer of giftware and home and garden decor products) from 2001 to 2006 |
| |
| Interested Trustee | | |
Name, Address and Year of Birth, Position with Funds, Year First Elected or Appointed to Office | | Principal Occupation(s) During Past Five Years, Number of Funds in Columbia
Funds Complex Overseen by Trustee, Other Directorships Held |
William F. Truscott (Born 1960) 53600 Ameriprise Financial Center Minneapolis, MN 55474 Senior Vice President (since 2012) | | Chairman of the Board and President, Columbia Management Investment Advisers, LLC since May 2010 and February 2012 (previously President and Chief Investment Officer, from 2001 to April 2010); Chief Executive Officer, Global Asset Management, Ameriprise Financial, Inc. since September 2012 (previously, Chief Executive Officer, U.S. Asset Management & President, Annuities, from May 2010 to September 2012 and President — U.S. Asset Management and Chief Investment Officer from 2005 to April 2010); Director and Chief Executive Officer, Columbia Management Investment Distributors, Inc. since May 2010 and February 2012, respectively (previously Chairman of the Board and Chief Executive Officer from 2006 to April 2010); Chairman of the Board and Chief Executive Officer, RiverSource Distributors, Inc. since 2006; President and Chief Executive Officer, Ameriprise Certificate Company, 2006 to August 2012; Oversees 184; Director, Ameriprise Certificate Company, 2006-January 2013 |
The Statement of Additional Information includes additional information about the Trustees of the Funds and is available, without charge, upon request by calling 800.345.6611.
The Board has appointed officers who are responsible for day-to-day business decisions based on policies it has established. The officers serve at the pleasure of the Board. In addition to Mr. Truscott, who is Senior Vice President, the Funds’ other officers are:
| | |
| Officers |
Name, Year of Birth and Address | | Principal Occupation(s) During the Past Five Years |
J. Kevin Connaughton (Born 1964) 225 Franklin Street Boston, MA 02110 President (since 2009) | | Senior Vice President and General Manager — Mutual Fund Products, Columbia Management Investment Advisers, LLC since May 2010; President, Columbia Funds since 2009 and RiverSource Funds since May 2010; Managing Director, Columbia Management Advisors, LLC, December 2004-April 2010; Senior Vice President and Chief Financial Officer, Columbia Funds, June 2008-January 2009; Treasurer, Columbia Funds, October 2003-May 2008; and senior officer of various other affiliated funds since 2000 |
Amy Johnson (Born 1965) 5228 Ameriprise Financial Center Minneapolis, MN 55474 Vice President (since 2010) | | Senior Vice President and Chief Operating Officer, Columbia Management Investment Advisers, LLC since May 2010 (previously Chief Administrative Officer, from 2009-April 2010, Vice President — Asset Management and Trust Company Services, from 2006-2009) |
Michael G. Clarke (Born 1969) 225 Franklin Street Boston, MA 02110 Treasurer (since 2011) and Chief Financial Officer (since 2009) | | Vice President, Columbia Management Investment Advisers, LLC since May 2010; Managing Director of Fund Administration, Columbia Management Advisors, LLC, September 2004-April 2010; senior officer of Columbia Funds and affiliated funds since 2002 |
| | |
| |
| | Active Portfolios® Multi-Manager Core Plus Bond Fund |
Trustees and Officers (continued)
| | |
| Officers (continued) |
Name, Year of Birth and Address | | Principal Occupation(s) During the Past Five Years |
Scott R. Plummer (Born 1959) 5228 Ameriprise Financial Center Minneapolis, MN 55474 Senior Vice President, Assistant Secretary and Chief Legal Officer (since 2010) | | Senior Vice President, Chief Legal Officer and Assistant Secretary, Columbia Management Investment Advisers, LLC since June 2005; Senior Vice President and Lead Chief Counsel — Asset Management, Ameriprise Financial, Inc. since May 2010 (previously Vice President and Chief Counsel — Asset Management, 2005-April 2010); Vice President, Chief Counsel and Assistant Secretary, Columbia Management Investment Distributors, Inc. since 2008; Vice President, General Counsel and Secretary, Ameriprise Certificate Company since 2005; Chief Counsel, RiverSource Distributors, Inc. since 2006; senior officer of Columbia Funds and affiliated funds since 2010 |
Colin Moore (Born 1958) 225 Franklin Street Boston, MA 02110 Senior Vice President (since 2010) | | Executive Vice President and Global Chief Investment Officer, Ameriprise Financial, Inc. since July 2013; Director and Global Chief Investment Officer, Columbia Management Investment Advisers, LLC since May 2010; Manager, Managing Director and Chief Investment Officer of Columbia Management Advisors, LLC, 2007-April 2010 |
Thomas P. McGuire (Born 1972) 225 Franklin Street Boston, MA 02110 Chief Compliance Officer (since 2012) | | Vice President — Asset Management Compliance, Columbia Management Investment Advisers, LLC since 2010; Chief Compliance Officer, Ameriprise Certificate Company, since September 2010; Compliance Executive, Bank of America, N.A. 2005-2010 |
Stephen T. Welsh (Born 1957) 225 Franklin Street Boston, MA 02110 Vice President (since 2006) | | President and Director, Columbia Management Investment Services Corp. since May 2010; President and Director, Columbia Management Services, Inc., July 2004-April 2010; Managing Director, Columbia Management Distributors, Inc., August 2007-April 2010 |
Christopher O. Petersen (Born 1970) 5228 Ameriprise Financial Center Minneapolis, MN 55474 Vice President (since 2010) and Secretary (since 2011) | | Vice President and Chief Counsel, Ameriprise Financial, Inc. since January 2010 (formerly Vice President and Group Counsel or Counsel, April 2004-January 2010); Assistant Secretary of Columbia Funds, January 2007-April 2011 |
Paul D. Pearson (Born 1956) 10468 Ameriprise Financial Center Minneapolis, MN 55474 Vice President and Assistant Treasurer (since 2011) | | Vice President, Investment Accounting, Columbia Management Investment Advisers, LLC, since May 2010; Vice President — Managed Assets, Investment Accounting, Ameriprise Financial, Inc., February 1998-May 2010 |
Joseph F. DiMaria (Born 1968) 225 Franklin Street Boston, MA 02110 Vice President (since 2011) and Chief Accounting Officer (since 2008) | | Vice President, Mutual Fund Administration, Columbia Management Investment Advisers, LLC, since May 2010; Director of Fund Administration, Columbia Management Advisors, LLC, January 2006-April 2010 |
Paul B. Goucher (Born 1968) 100 Park Avenue New York, NY 10017 Vice President and Assistant Secretary (since 2010) | | Vice President and Lead Chief Counsel, Ameriprise Financial, Inc. since November 2008 and January 2013, respectively (formerly, Chief Counsel from January 2010-January 2013 and Group Counsel from November 2008-January 2010); Director, Managing Director and General Counsel, J. & W. Seligman & Co. Incorporated, July 2008-November 2008 (previously, Managing Director and Associate General Counsel, January 2005-July 2008) |
Michael E. DeFao (Born 1968) 225 Franklin Street Boston, MA 02110 Vice President and Assistant Secretary (since 2011) | | Vice President and Chief Counsel, Ameriprise Financial, Inc. since May 2010; Associate General Counsel, Bank of America, N.A. June 2005-April 2010 |
| | |
| |
| Active Portfolios® Multi-Manager Core Plus Bond Fund | | |
Board Consideration and Approval of Advisory Agreement and Subadvisory Agreements
On June 14, 2013, the Board of Trustees (the “Board”) and the Trustees who are not interested persons (as defined in the Investment Company Act of 1940) of the Trust (the “Independent Trustees”) unanimously approved the continuation of the Investment Management Services Agreement (the “Advisory Agreement”) with Columbia Management Investment Advisers, LLC (the “Investment Manager”) and the Subadvisory Agreements (the “Subadvisory Agreements”) between the Investment Manager and Federated Investment Management Company and TCW Investment Management Company (the “Subadvisers”) with respect to Active Portfolios Multi-Manager Core Plus Bond Fund (the “Fund”), a series of the Trust. As detailed below, the Advisory Fees and Expenses Committee (the “Committee”) and the Board met on multiple occasions to review and discuss, both among themselves and with the management team of the Investment Manager, materials provided by the Investment Manager before determining to approve the continuation of the Advisory Agreement and the Subadvisory Agreements (collectively, the “Agreements”).
In connection with their deliberations regarding the continuation of the Agreements, the Committee and the Board evaluated materials requested from the Investment Manager regarding the Fund and the Agreements, and discussed these materials with representatives of the Investment Manager at Committee meetings held on March 5, 2013, April 24, 2013 and June 13, 2013, and at the Board meeting held on June 14, 2013. In addition, the Board considers matters bearing on the Agreements at most of its other meetings throughout the year and meets regularly with senior management of the Funds and the Investment Manager. Through the Board’s Investment Oversight Committees, Trustees also meet with selected Fund portfolio managers and other investment personnel at various times throughout the year. The Committee and the Board also consulted with Fund counsel and with the Independent Trustees’ independent legal counsel, who advised on various matters with respect to the Committee’s and the Board’s considerations and otherwise assisted the Committee and the Board in their deliberations. On June 13, 2013, the Committee recommended that the Board approve the continuation of the Agreements. On June 14, 2013, the Board, including the Independent Trustees, voting separately, unanimously approved the continuation of the Agreements for the Fund.
The Committee and the Board considered all information that they, their legal counsel, or the Investment Manager believed reasonably necessary to evaluate and to determine whether to approve the continuation of the Agreements. The information and factors considered by the Committee and the Board in recommending for approval or approving the continuation of the Agreements for the Fund included the following:
| • | | Information on the investment performance of the Fund from the date of its inception through December 31, 2012, including performance relative to a group of mutual funds determined to be comparable to the Fund by an independent third party data provider, as well as performance relative to benchmarks; |
| • | | Information on the Fund’s advisory fees and total expenses, including information comparing the Fund’s expenses to those of a group of comparable mutual funds, as determined by the independent third-party data provider; |
| • | | The Investment Manager’s agreement to contractually limit or cap total operating expenses for the Fund so that total operating expenses (excluding certain fees and expenses, such as transaction costs and certain other investment related expenses, interest, taxes, acquired fund fees and expenses, and extraordinary expenses) would not exceed the median expenses of a group of comparable funds (as determined from time to time, generally annually, by the independent third-party data provider); |
| • | | The terms and conditions of the Agreements; |
| • | | The terms and conditions of other agreements and arrangements with affiliates of the Investment Manager relating to the operations of the Fund, including the Administrative Services Agreement, the Distribution Agreement and the Transfer and Dividend Disbursing Agent Agreement; |
| • | | Descriptions of various functions performed by the Investment Manager and the Subadvisers under the Agreements, including portfolio management and portfolio trading practices; |
| • | | Information regarding the management fees and investment performance of comparable portfolios of other clients of the Investment Manager, including institutional separate accounts; |
| • | | Information regarding the reputation, regulatory history and resources of the Investment Manager and the Subadvisers, including information regarding senior management, portfolio managers and other personnel; |
| | |
| |
| | Active Portfolios® Multi-Manager Core Plus Bond Fund |
Board Consideration and Approval of Advisory Agreement and Subadvisory Agreements (continued)
| • | | Information regarding the capabilities of the Investment Manager and the Subadvisers with respect to compliance monitoring services, including an assessment of the Investment Manager’s and the Subadvisers’ compliance system by the Fund’s Chief Compliance Officer; and |
| • | | The profitability to the Investment Manager and its affiliates from their relationships with the Fund. |
Nature, Extent and Quality of Services Provided under the Agreements
The Committee and the Board considered the nature, extent and quality of services provided to the Fund by the Investment Manager and the Subadvisers and the Investment Manager’s affiliates under the Agreements and under separate agreements for the provision of transfer agency and administrative services, and the resources dedicated to the Fund and the other Columbia Funds by the Investment Manager and the Subadvisers and the Investment Manager’s affiliates. The Committee and the Board considered, among other things, the Investment Manager’s ability to attract, motivate and retain highly qualified research, advisory and supervisory investment professionals (including personnel and other resources, compensation programs for personnel involved in fund management, reputation and other attributes), the portfolio management services provided by those investment professionals, and the quality of the Investment Manager’s investment research capabilities and trade execution services. The Committee and the Board also considered the potential benefits to shareholders of investing in a mutual fund that is part of a fund complex offering exposure to a variety of asset classes and investment disciplines and providing a variety of fund and shareholder services.
The Committee and the Board also considered the professional experience and qualifications of the senior personnel of the Investment Manager and the Subadvisers, which included consideration of the Investment Manager’s and the Subadvisers’ experience with similarly-structured funds. The Committee and the Board noted the compliance programs of and the compliance-related resources provided to the Fund by the Investment Manager and its affiliates, and considered the Investment Manager’s ability to provide administrative services to the Fund pursuant to a separate Administrative Services Agreement, including the Investment Manager’s ability to coordinate the activities of the Fund’s other service providers. The Committee and the Board also noted that the Board had approved each Subadvisers’ code of ethics and compliance program, and that the Chief Compliance Officer of the Funds monitors each code of ethics and compliance program.
The Committee and the Board considered the diligence and selection process undertaken to select the Subadvisers, including the Investment Manager’s rationale for recommending approval of the Subadvisory Agreements, and the process for monitoring the Subadvisers’ ongoing performance of services for the Fund. As part of these deliberations, the Committee and the Board considered the ability of the Investment Manager, subject to the approval of the Board, to modify or enter into new Subadvisory Agreements without a shareholder vote pursuant to an exemptive order of the Securities and Exchange Commission. The Committee and the Board also considered the scope of services provided to the Fund by the Investment Manager that are distinct from and in addition to those provided by the Subadvisers, including cash flow management, treasury services, risk oversight, investment oversight and Subadvisers selection, oversight and transition management. After reviewing these and related factors, the Committee and the Board concluded, within the context of their overall conclusions, that the nature, extent and quality of the services provided to the Fund under the Agreements supported the continuation of the Agreements.
Investment Performance
The Committee and the Board reviewed information about the performance of the Fund from its date of inception through December 31, 2012, including performance information relative to benchmarks and information based on reports of the independent third-party data provider that compared the performance of the Fund to the performance of a group of comparable mutual funds. Because the Fund did not have a complete year of performance from its date of inception, the Committee and the Board did not have information regarding the percentile ranking of the Fund’s performance relative to the returns of a group of comparable funds. However, the Committee and the Board expected to consider, in connection with their next review and consideration of the continuation of the Agreements, the investment performance of the Fund in relation to the annualized return for various time periods of both a group of comparable funds, as determined by the independent third party data provider, and a benchmark.
The Committee and the Board also considered the Investment Manager’s and Subadvisers’ performance and reputation generally, the Investment Manager’s historical responsiveness to Board concerns about performance, and the Investment Manager’s willingness to take steps intended to improve performance. After reviewing these and related factors, the Committee and the
| | |
| |
| Active Portfolios® Multi-Manager Core Plus Bond Fund | | |
Board Consideration and Approval of Advisory Agreement and Subadvisory Agreements (continued)
Board concluded, within the context of their overall conclusions, that the performance of the Fund, the Investment Manager and the Subadvisers supported the continuation of the Agreements.
Investment Advisory Fee Rates and Other Expenses
The Committee and the Board considered the advisory fees charged to the Fund under the Agreements, as well as the total expenses incurred by the Fund. In assessing the reasonableness of the fees under the Advisory Agreement, the Committee and the Board considered, among other information, the Fund’s advisory fee and its total expense ratio as a percentage of average daily net assets. The Committee and the Board noted that the Fund’s actual management fee and total expense ratio are both ranked in the first quintile (where the lowest fees and expenses would be in the first quintile) against the Fund’s expense universe as determined by the independent third-party data provider for purposes of expense comparison. The Committee and the Board also noted that the Investment Manager pays the fees of the Subadvisers. The Committee and the Board also took into account the fee waiver and expense limitation arrangements agreed to by the Investment Manager, as noted above.
The Committee and the Board also received and considered information about the advisory fees charged by the Investment Manager to institutional separate accounts. In considering the fees charged to those accounts, the Committee and the Board took into account, among other things, the Investment Manager’s representations about the differences between managing mutual funds as compared to other types of accounts, including differences in the services provided, differences in the risk profile of such business for the Investment Manager and the additional resources required to manage mutual funds effectively. In evaluating the Fund’s advisory fees, the Committee and the Board also took into account the demands, complexity and quality of the investment management of the Fund.
After reviewing these and related factors, the Committee and the Board concluded, within the context of their overall conclusions, that the advisory fee rates and expenses of the Fund supported the continuation of the Agreements.
Costs of Services Provided and Profitability
The Committee and the Board also took note of the costs of the services provided (both on an absolute and relative basis) and the profitability to the Investment Manager and its affiliates in connection with their relationships with the Fund. In evaluating these considerations, the Committee and the Board took note of the advisory fees charged by the Investment Manager to other clients, including fees charged by the Investment Manager to institutional separate account clients with similar investment strategies to those of the Fund.
The Committee and the Board also considered the compensation directly or indirectly received by the Investment Manager’s affiliates in connection with their relationships with the Fund. The Committee and the Board reviewed information provided by management as to the profitability of the Investment Manager and its affiliates of their relationships with the Fund, information about the allocation of expenses used to calculate profitability, and comparisons of profitability levels realized in 2012 to profitability levels realized in 2011. When reviewing profitability, the Committee and the Board also considered court cases in which adviser profitability was an issue in whole or in part, the performance of the Fund, the expense ratio of the Fund, and the implementation of expense limitations with respect to the Fund. The Committee and the Board also considered information provided by the Investment Manager regarding its financial condition and comparing its profitability to that of other asset management firms that are, or are subsidiaries of, publicly traded companies. Because the Subadvisory Agreements were negotiated at arms-length by the Investment Manager, which is responsible for payments to the Subadvisers thereunder, the Committee and the Board did not consider the profitability to the Subadvisers of its relationship with the Fund.
After reviewing these and related factors, the Committee and the Board concluded, within the context of their overall conclusions, that the costs of services provided and the profitability to the Investment Manager and its affiliates from their relationships with the Fund supported the continuation of the Agreements.
Economies of Scale
The Committee and the Board considered the potential existence of economies of scale in the provision by the Investment Manager and the Subadvisers of services to the Fund, to groups of related funds, and to the Investment Manager’s and the Subadvisers’ investment advisory clients as a whole, and whether those economies of scale were shared with the Fund through breakpoints in investment advisory fees or other means, such as expense limitation arrangements and additional investments by the Investment Manager and/or the Subadvisers in investment, trading and compliance resources. The Committee and the Board
| | |
| |
| | Active Portfolios® Multi-Manager Core Plus Bond Fund |
Board Consideration and Approval of Advisory Agreement and Subadvisory Agreements (continued)
noted that the investment advisory fee schedules for the Fund contained breakpoints that would reduce the fee rate on assets above specified threshold levels.
The Committee and the Board noted that the breakpoints in the Advisory Agreement did not occur at the same levels as the breakpoints in the Subadvisory Agreements. The Committee and the Board noted that absent a shareholder vote, the Investment Manager would bear any increase in fees payable under the Subadvisory Agreements. The Committee and the Board also noted the potential challenges of seeking to tailor the Advisory Agreement breakpoints to those of a Subadvisory Agreements in this context, and the effect that capacity constraints on a subadviser’s ability to manage assets could potentially have on the ability of the Investment Manager to achieve economies of scale, as new subadvisers might need to be added as the Fund grows, increasing the Investment Manager’s cost of compensating and overseeing the Fund’s subadvisers.
In considering these matters, the Committee and the Board also considered the costs of the services provided and the profitability to the Investment Manager and its affiliates from their relationships with the Fund, as discussed above. After reviewing these and related factors, the Committee and the Board concluded, within the context of their overall conclusions, that the extent to which any economies of scale were expected to be shared with the Fund supported the continuation of the Agreements.
Other Benefits to the Investment Manager
The Committee and the Board received and considered information regarding “fall-out” or ancillary benefits received by the Investment Manager and its affiliates as a result of their relationships with the Fund, such as the engagement of the Investment Manager to provide administrative services to the Fund and the engagement of the Investment Manager’s affiliates to provide distribution and transfer agency services to the Fund. The Committee and the Board considered that the Fund’s distributor retains a portion of the distribution fees from the Fund and receives a portion of the sales charges on sales or redemptions of certain classes of shares of the Fund. The Committee and the Board also considered the benefits of research made available to the Investment Manager by reason of brokerage commissions generated by the Fund’s securities transactions, and reviewed information about the Investment Manager’s practices with respect to allocating portfolio transactions for brokerage and research services. The Committee and the Board considered the possible conflicts of interest associated with certain fall-out or other ancillary benefits and the reporting, disclosure and other processes that are in place to address such possible conflicts of interest. The Committee and the Board recognized that the Investment Manager’s profitability would be somewhat lower without these benefits.
Conclusion
The Committee and the Board reviewed all of the above considerations in reaching their decisions to recommend or approve the continuation of the Agreements. In their deliberations, the Trustees did not identify any particular information that was all-important or controlling, and individual Trustees may have attributed different weights to the various factors. Based on their evaluation of all factors that they deemed to be material, including those factors described above, and assisted by the advice of independent legal counsel, the Board, including the Independent Trustees, voting separately, unanimously approved the continuation of the Agreements.
| | |
| |
| Active Portfolios® Multi-Manager Core Plus Bond Fund | | |
[THIS PAGE INTENTIONALLY LEFT BLANK]
| | |
| |
| | Active Portfolios® Multi-Manager Core Plus Bond Fund |
[THIS PAGE INTENTIONALLY LEFT BLANK]
| | |
| |
| Active Portfolios® Multi-Manager Core Plus Bond Fund | | |
Important Information About This Report
Each fund mails one shareholder report to each shareholder address. If you would like more than one report, please call shareholder services at 800.345.6611 and additional reports will be sent to you.
The policy of the Board is to vote the proxies of the companies in which each fund holds investments consistent with the procedures as stated in the Statement of Additional Information (SAI). You may obtain a copy of the SAI without charge by calling 800.345.6611; contacting your financial intermediary; visiting columbiamanagement.com; or searching the website of the Securities and Exchange Commission (SEC) at sec.gov. Information regarding how each fund voted proxies relating to portfolio securities is filed with the SEC by August 31 for the most recent 12-month period ending June 30 of that year, and is available without charge by visiting columbiamanagement.com; or searching the website of the SEC at sec.gov.
Each fund files a complete schedule of portfolio holdings with the SEC for the first and third quarters of each fiscal year on Form N-Q. Each fund’s Form N-Q is available on the SEC’s website at sec.gov and may be reviewed and copied at the SEC’s Public Reference Room in Washington, D.C. Information on the operation of the Public Reference Room may be obtained by calling 800.SEC.0330. Each fund’s complete schedule of portfolio holdings, as filed on Form N-Q, can also be obtained without charge, upon request, by calling 800.345.6611.

Active Portfolios® Multi-Manager Core Plus Bond Fund
P.O. Box 8081
Boston, MA 02266-8081
columbiamanagement.com
This information is for use with concurrent or prior delivery of a fund prospectus. Please read and consider the investment objectives, risks, charges and expenses for any fund carefully before investing. For a prospectus which contains this and other important information about the Fund, go to columbiamanagement.com. The Fund is distributed by Columbia Management Investment Distributors, Inc., member FINRA, and managed by Columbia Management Investment Advisers, LLC.
© 2013 Columbia Management Investment Advisers, LLC. All rights reserved.
ANN101_08_C01_(10/13)
| | |
Annual Report August 31, 2013 | |  |
| | |
Active Portfolios® Multi-Manager Small Cap Equity Fund | | |

President’s Message

Dear Shareholders,
A return to volatility
Volatility returned to the financial markets in the second quarter of 2013, as uncertainty about the global economy, monetary policy and the impact of the sequester’s spending cuts weighed on investors. Households advanced their spending but also allocated less to savings. Labor markets continued to crank out jobs at a steady pace, slowly reducing unemployment. Housing activity remained strong and retail sales were higher despite no real increase in income. The single weak spot was in the manufacturing sector, where activity slowed. While the consumer has weathered the domestic drag well, business has been closer to the global slowdown and effects of sequestration. Businesses remain very cautious, keeping inventories and staffs lean, and are planning for but not yet confident enough to make capital expenditures.
Against this backdrop, equities outperformed fixed income during the second quarter of 2013. Small-cap stocks outperformed large- and mid-cap stocks, and growth outperformed value except for in the large-cap sector. Outside the United States, foreign stock markets generally lost ground, with the most significant losses sustained by emerging markets.
Columbia Management to begin delivering summary prospectuses
Each Columbia fund is required to update its prospectus on an annual basis. Beginning with June 2013 prospectus updates, shareholders of Columbia retail mutual funds will start to receive a summary prospectus, rather than the full length (statutory) mutual fund prospectus they have received in the past.
Each fund’s summary prospectus will include the following key information:
| > | | Portfolio turnover rate information |
| > | | Principal investment strategies, principal risks and performance information |
| > | | Purchase and sale information |
| > | | Financial intermediary compensation information |
Each fund’s statutory prospectus will contain additional information about the fund and its risks. Both the statutory and summary prospectus will be updated each year, and will be available at columbiamanagement.com. Shareholders may request a printed version of a statutory prospectus at no cost by calling 800.345.6611 or sending an email to serviceinquiries@columbiamanagement.com.
Stay on track with Columbia Management
Backed by more than 100 years of experience, Columbia Management is one of the nation’s largest asset managers. At the heart of our success — and, most importantly, that of our investors — are highly talented industry professionals, brought together by a unique way of working. We are dedicated to helping you take advantage of today’s opportunities and anticipate tomorrow’s. We stay abreast of the latest investment trends and ideas, using our collective insight to evaluate events and transform them into solutions you can use.
Visit columbiamanagement.com for:
| > | | The Columbia Management Perspectives blog, featuring timely posts by our investment teams |
| > | | Detailed up-to-date fund performance and portfolio information |
| > | | Economic analysis and market commentary |
| > | | Quarterly fund commentaries |
| > | | Columbia Management Investor, our award-winning quarterly newsletter for shareholders |
Thank you for your continued support of the Columbia Funds. We look forward to serving your investment needs for many years to come.
Best Regards,

J. Kevin Connaughton
President, Columbia Funds
Investors should consider the investment objectives, risks, charges and expenses of a mutual fund carefully before investing. For a free prospectus, which contains this and other important information about a fund, visit columbiamanagement.com. The prospectus should be read carefully before investing.
Columbia Funds are distributed by Columbia Management Investment Distributors, Inc., member FINRA, and managed by Columbia Management Investment Advisers, LLC.
© 2013 Columbia Management Investment Advisers, LLC. All rights reserved.
Annual Report 2013
| | |
| |
| Active Portfolios® Multi-Manager Small Cap Equity Fund | | |
Table of Contents
Fund Investment Manager
Columbia Management Investment
Advisers, LLC
225 Franklin Street
Boston, MA 02110
Fund Distributor
Columbia Management Investment
Distributors, Inc.
225 Franklin Street
Boston, MA 02110
Fund Transfer Agent
Columbia Management Investment
Services Corp.
P.O. Box 8081
Boston, MA 02266-8081
For more information about any of the funds, please visit columbiamanagement.com or call 800.345.6611. Customer Service Representatives are available to answer your questions Monday through Friday from 8 a.m. to 8 p.m. Eastern time.
The views expressed in this report reflect the current views of the respective parties. These views are not guarantees of future performance and involve certain risks, uncertainties and assumptions that are difficult to predict, so actual outcomes and results may differ significantly from the views expressed. These views are subject to change at any time based upon economic, market or other conditions and the respective parties disclaim any responsibility to update such views. These views may not be relied on as investment advice and, because investment decisions for a Columbia Fund are based on numerous factors, may not be relied on as an indication of trading intent on behalf of any particular Columbia Fund. References to specific securities should not be construed as a recommendation or investment advice.
Annual Report 2013
| | |
| |
| | Active Portfolios® Multi-Manager Small Cap Equity Fund |
Performance Overview
Performance Summary
| > | | Active Portfolios® Multi-Manager Small Cap Equity Fund (the Fund) Class A shares returned 27.11% for the 12-month period that ended August 31, 2013. |
| > | | The Fund outperformed its benchmark, the Russell 2000 Index, which returned 26.27% for the same 12-month period. |
| > | | Overall individual stock selection generally accounted for the Fund’s outperformance during the period. |
| | | | | | | | | | |
Average Annual Total Returns (%) (for period ended August 31, 2013) | |
| | | Inception | | 1 Year | | | Life | |
Class A | | 04/20/12 | | | 27.11 | | | | 19.83 | |
Russell 2000 Index | | | | | 26.27 | | | | 19.97 | |
All results shown assume reinvestment of distributions during the period. Returns do not reflect the deduction of taxes that a shareholder may pay on Fund distributions or on the redemption of Fund shares. Performance results reflect the effect of any fee waivers or reimbursements of Fund expenses by Columbia Management Investment Advisers, LLC and/or any of its affiliates. Absent these fee waivers or expense reimbursement arrangements, performance results would have been lower.
The performance information shown represents past performance and is not a guarantee of future results. The investment return and principal value of your investment will fluctuate so that your shares, when redeemed, may be worth more or less than their original cost. Current performance may be lower or higher than the performance information shown. You may obtain performance information current to the most recent month-end by contacting your financial intermediary, visiting columbiamanagement.com or calling 800.345.6611.
The Russell 2000 Index measures the performance of the small-cap segment of the U.S. equity universe. The Russell 2000 is a subset of the Russell 3000 Index representing approximately 10% of the total market capitalization of that index. It includes approximately 2000 of the smallest securities based on a combination of their market cap and current index membership.
Indices are not available for investment, are not professionally managed and do not reflect sales charges, fees, brokerage commissions, taxes or other expenses of investing. Securities in the Fund may not match those in an index.
| | |
| |
| Active Portfolios® Multi-Manager Small Cap Equity Fund | | |
Performance Overview (continued)
|
Performance of a Hypothetical $10,000 Investment (April 20, 2012 — August 31, 2013) |
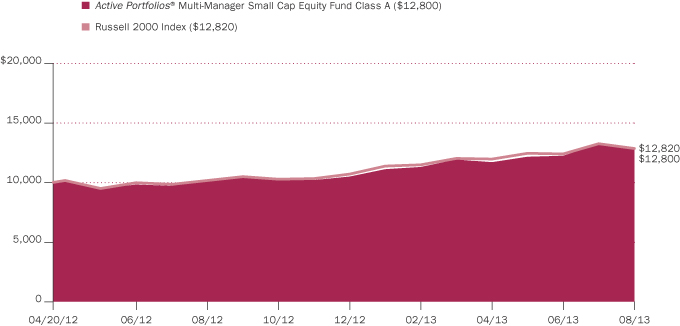
The chart above shows the change in value of a hypothetical $10,000 investment in Class A shares of Active Portfolios® Multi-Manager Small Cap Equity Fund during the stated time period, and does not reflect the deduction of taxes that a shareholder may pay on Fund distributions or on the redemption of Fund shares.
| | |
| |
| | Active Portfolios® Multi-Manager Small Cap Equity Fund |
Manager Discussion of Fund Performance
Portfolio Management
Columbia Management Investment Advisers, LLC
Christian Stadlinger, Ph.D., CFA
Jarl Ginsberg,CFA
Conestoga Capital Advisors, LLC
William Martindale, Jr.
Robert Mitchell
Dalton, Greiner, Hartman, Maher & Co., LLC
Bruce Geller, CFA
Jeffery Baker, CFA
Peter Gulli, CFA
Edward Turville, CFA (with REMS)
EAM Investors, LLC
Montie Weisenberger
Morningstar Style Box™

The Morningstar Style Box™ is based on a fund’s portfolio holdings. For equity funds, the vertical axis shows the market capitalization of the stocks owned, and the horizontal axis shows investment style (value, blend, or growth). Information shown is based on the most recent data provided by Morningstar.
©2013 Morningstar, Inc. All rights reserved. The Morningstar information contained herein: (1) is proprietary to Morningstar and/or its content providers; (2) may not be copied or distributed; and (3) is not warranted to be accurate, complete or timely. Neither Morningstar nor its content providers are responsible for any damages or losses arising from any use of this information.
Active Portfolios® Multi-Manager Small Cap Equity Fund is managed by three independent money management firms and by Columbia Management Investment Advisers, LLC (Columbia) and each invests a portion of the portfolio’s assets. Columbia also manages a liquidity sleeve to help manage cash flow. As of August 31, 2013, Dalton, Greiner, Hartman, Maher & Co., LLC (DGHM), EAM Investors, LLC (EAM), Conestoga Capital Advisors LLC (Conestoga) and Columbia managed approximately 24%, 25%, 25% and 26% of the portfolio, respectively. Effective October 1, 2012, Conestoga replaced RS Investment Management as a subadviser to the Fund, assuming the day-to-day investment decisions for the portion of the Fund for which RS Investment Management was previously responsible.
For the 12-month period that ended August 31, 2013, the Fund’s Class A shares returned 27.11%. The Fund outperformed its benchmark, the Russell 2000 Index, which returned 26.27% for the same period. Individual stock selection amongst the Fund’s four managers generally accounted for the Fund’s outperformance during the period.
Small Cap Equity Markets Seesawed to New Highs
U.S. equity markets, including small cap equities, weathered multiple headwinds through the annual period but seesawed their way to repeated new highs. Challenges included sluggish domestic and international economic growth, uncertainty over the fiscal cliff of tax increases and spending cuts, and natural disasters such as Superstorm Sandy. Balancing these challenges were positive U.S. economic releases, especially regarding the housing market, some degree of improved consumer confidence, and the Federal Reserve’s (Fed) extension of quantitative easing — although the latter roiled U.S. equity markets late in the annual period on concerns the program of asset purchases would be tapered later in 2013. (Following the close of the reporting period, the Fed announced that it would continue its bond-buying program.) The prospect of rising interest rates toward the end of the annual period also produced both challenges and opportunities for investors to find companies that could benefit as the economy moved away from historically low rates.
In short, the frequent juxtaposition of positive and negative drivers produced volatile markets for all asset classes. Still, for the reporting period overall, small-cap U.S. equity indices performed better than their mid-cap and large-cap counterparts. Within the small-cap segment of the U.S. equity market, growth stocks outpaced value stocks.
Individual Stock Selection Impacted Performance Most
DGHM: Individual stock selection contributed positively to our portion of the Fund’s relative results, more than offsetting the impact of sector allocation overall, which detracted. Stock selection proved most effective in the insurance, capital goods and health care industries. Detracting most from our portion of the Fund’s return was weak stock selection in the retail/apparel, consumer services and technology industries.
The individual positions in our portion of the Fund’s portfolio that contributed most positively were recreational vehicle manufacturer Thor Industries, specialty polymer materials manufacturer PolyOne and natural gas exploration and production company PDC Energy. We sold our portion of the Fund’s shares in PolyOne as they had reached what we considered to be full valuation.
| | |
| |
| Active Portfolios® Multi-Manager Small Cap Equity Fund | | |
Manager Discussion of Fund Performance (continued)
Individual positions in apparel retailer Chico’s FAS, mobile storage and communications company Silicon Motion Technology and host bus adapter maker QLogic disappointed most during the annual period. We sold our position in Silicon Motion Technology.
EAM: Individual stock selection contributed most positively to our portion of the Fund’s relative results, more than offsetting the impact of sector allocation overall, which modestly detracted. Effective stock selection in the health care, energy and consumer discretionary sectors more than offset weaker stock selection in the consumer staples sector, the only sector to detract from our portion of the Fund’s relative results.
Positions in pharmaceuticals companies Santarus and Aegerion Pharmaceuticals and oil and gas exploration and production company Bonanza Creek Energy were top contributors to our portion of the Fund’s results. The biggest individual detractors from our portion of the Fund’s results during the annual period were pharmaceuticals company Nektar Therapeutics, Internet media content provider Yelp and industrial gas equipment manufacturer Chart Industries. We sold our position in Nektar Therapeutics.
Conestoga: Our portion of the Fund outperformed the benchmark since we assumed management responsibility on October 1, 2012, benefiting from both effective stock selection and sector allocation. Our strategy performed particularly well when volatility heightened during the period, however, the transitioning of the portfolio in October 2012 acted as a drag on relative returns. Effective stock selection and prudent relative allocations in the information technology, financials and health care sectors contributed most positively to results in our portion of the Fund. Stock selection in energy, consumer discretionary and consumer staples detracted from results as did having underweight allocations to the consumer discretionary and consumer staples sectors, each of which outpaced the benchmark during the period.
The biggest individual contributors to our portion of the Fund’s results were commercial real estate data base services provider CoStar Group, plastics producer Proto Labs and business and financial management software package provider Tyler Technologies. Positions in exploration and production energy company Contango Oil & Gas, technology company NVE and patent service provider Acacia Research detracted most from our portion of the Fund’s results.
Columbia: During the period, our portion of the Fund outperformed the benchmark. Stock selection was the primary driver of outperformance in our portion of the Fund — particularly in the financials, materials and industrials sectors. Investments in insurance companies and paper and forest products companies proved especially beneficial. Only partially offsetting these positive contributors was stock selection in information technology, which detracted. Sector allocation overall had a neutral impact on our portion of the Fund’s results during the annual period.
From an individual holdings perspective, the top three positive contributors to our portion of the Fund’s results were auto components maker Tower International, oil and gas exploration and production company Gulfport Energy and transportation and logistics services provider Swift Transportation, each of which produced triple-digit gains during the annual period. It is also worth noting that corporate actions were on the rise during the annual period, and several of the holdings in our portion of the Fund benefited from increased merger and acquisition activity, both as acquirers and acquirees. Significant contributors to performance included KapStone Paper and Packaging, National Financial Partners, Stewart Enterprises and Metropolitan Health Networks.
| | | | |
Top Ten Holdings (%)
(at August 31, 2013) | |
CoStar Group, Inc. | | | 1.2 | |
Tyler Technologies, Inc. | | | 1.1 | |
Proto Labs, Inc. | | | 1.0 | |
American Equity Investment Life Holding Co. | | | 0.9 | |
Anixter International, Inc. | | | 0.8 | |
Medidata Solutions, Inc. | | | 0.8 | |
Thor Industries, Inc. | | | 0.8 | |
HealthStream, Inc. | | | 0.8 | |
PDC Energy, Inc. | | | 0.7 | |
EMCOR Group, Inc. | | | 0.7 | |
Percentages indicated are based upon total investments (excluding Money Market Funds).
For further detail about these holdings, please refer to the section entitled “Portfolio of Investments.”
Fund holdings are as of the date given, are subject to change at any time, and are not recommendations to buy or sell any security.
Investment Risks
Investments in small-cap companies involve greater risks and volatility than investments in larger, more established companies. Asset allocation does not assure a profit or protect against loss. International investing involves increased risk and volatility due to potential political and economic instability, currency fluctuations, and differences in financial reporting and accounting standards and oversight. Risks are particularly significant in emerging markets. The share price of a fund that invests primarily in one sector will likely be subject to more volatility than a fund that invests across many sectors. The Fund also has potentially greater price volatility due to the Fund’s concentration in a limited number of stocks. Derivative instruments are financial instruments that have a value dependent on the value of something else, such as one or more underlying securities. Gains or losses may be substantial, because a relatively small price movement in an underlying security may result in a substantial gain or loss. Securities of issuers in the technology, energy and natural resources industry may underperform other market sectors or the market as a whole and may have greater volatility than other types of investments. See the Fund’s prospectus for information on these and other risks associated with the Fund. The Fund should be considered part of an overall investment program, and not a complete investment program.
| | |
| |
| | Active Portfolios® Multi-Manager Small Cap Equity Fund |
Manager Discussion of Fund Performance (continued)
| | | | |
Portfolio Breakdown (%)
(at August 31, 2013) | |
Common Stocks | | | 96.5 | |
Consumer Discretionary | | | 11.3 | |
Consumer Staples | | | 1.3 | |
Energy | | | 6.4 | |
Financials | | | 18.1 | |
Health Care | | | 14.2 | |
Industrials | | | 14.4 | |
Information Technology | | | 22.9 | |
Materials | | | 5.0 | |
Telecommunication Services | | | 0.4 | |
Utilities | | | 2.5 | |
Money Market Funds | | | 3.5 | |
Total | | | 100.0 | |
Percentages indicated are based upon total investments. The Fund’s portfolio composition is subject to change.
The biggest individual detractors from our portion of the Fund’s results were semiconductor companies Cirrus Logic and Fairchild Semiconductor International and oil and gas exploration and production company Midstates Petroleum, each of which posted negative absolute returns during the annual period.
Changes Were Driven By Bottom-Up Stock Selection
DGHM: Among the names purchased in our portion of the Fund during the annual period were American Equity Investment Life, Hyster-Yale Materials Handling, JDA Software Group and PDC Energy. In addition to the sales of the Fund’s positions in PolyOne and Silicon Motion Technology, already mentioned, we sold the Fund’s position in The Hanover Insurance Group, an A rated super-regional property and casualty insurance company based in Massachusetts.
We do not engage in significant sector timing activities. Based on individual stock selection, our portion of the Fund was overweight relative to the benchmark in technology; underweight financials and utilities; and relatively neutral to the remaining sectors in the benchmark at the end of the annual period.
EAM: We initiated positions in pharmaceuticals companies Alnylam Pharmaceuticals and Trius Therapeutics during the period. We sold the Fund’s position in computer storage solutions company Fusion-io and in medical device and diagnostic products manufacturer OraSure Technologies.
Overall, we increased our portion of the Fund’s exposure relative to the benchmark in technology, energy and health care during the annual period. We decreased relative allocations to financial services and consumer staples. As of August 31, 2013, our portion of the Fund was overweight relative to the benchmark in technology, health care and energy and underweight relative to the benchmark in financial services, consumer staples and materials and processing. Our portion of the Fund was rather neutrally weighted to the benchmark in consumer discretionary, utilities and producer durables at the end of the reporting period.
Conestoga: Among the names purchased in our portion of the Fund during the period were Geospace Technologies, Medidata Solutions and Mesa Laboratories. We sold our portion of the Fund’s positions in industrial equipment auctioneer Ritchie Brothers Auctioneers and industrial consulting services firm Tetra Tech.
During the period, we trimmed our portion of the Fund’s exposure to technology, as it bumped up against our maximum exposure parameters. At the end of August 2013, our portion of the Fund was overweight relative to the benchmark in technology, producer durables and health care; underweight consumer discretionary, financials and utilities; and relatively neutral in energy and materials and processing.
Columbia: Based on individual stock selection decisions, our portion of the Fund moved from modest overweights to underweights in industrials and consumer staples during the annual period and shifted from underweight allocations to overweight allocations in consumer discretionary and materials relative to the Russell 2000 Value Index. Our portion of the Fund’s already underweighted exposure to financials decreased further, and its already overweighted allocations to information technology and health care increased further.
At the end of the annual period, our portion of the Fund was overweight relative to the Russell 2000 Value Index in information technology, health care and materials. Our portion of the Fund was underweight relative to the Russell 2000 Value Index in financials, industrials, utilities and consumer staples and was rather neutrally
| | |
| |
| Active Portfolios® Multi-Manager Small Cap Equity Fund | | |
Manager Discussion of Fund Performance (continued)
weighted to the Russell 2000 Value Index in energy, consumer discretionary and telecommunication services at the end of August 2013.
Looking Ahead
DGHM: We do not employ macroeconomic analysis in a conventional fashion. Each sector specialist includes a global perspective, featuring a risk/reward assessment, in his or her stock selection. With that understanding, our approach in light of the global macroeconomic issues has been to emphasize our focus on strength of balance sheet and to proceed with some caution by favoring high quality companies.
EAM: Going forward, we intend to continue to execute our disciplined, bottom-up investment process, which seeks to capitalize on companies benefiting from positive fundamental change, in a timely fashion. That said, we also intend to continue to position our portion of the Fund in securities with characteristics we believe may enable them to outperform their small cap peers over our typical investment horizon. Events that might affect the positioning of our portion of the Fund include the impact of fiscal cliff developments; the economic impact associated with sequestration, or automatic spending cuts, plans, long-term deficit spending and debt ceiling negotiations; any actions taken or discussed by the U.S. Federal Reserve to maintain or withdraw monetary stimulus; the potential impact of regulatory actions on select sectors; events that impact the direction and pace of economic growth in Europe; actions taken by China’s government leaders; and potential economic impact associated with geopolitical tensions, especially in the Middle East.
Conestoga: Given our focus on higher quality companies, our strategy typically lags modestly in surging equity markets such as that seen during the past year or so. We are therefore pleased that Conestoga’s portfolio sleeve performed well relative to the benchmark. We believe our portion of the Fund remains well positioned if market volatility does return. Further, we believe the strategy is well positioned vs. an overall market that may be near fully valued. Finally, we expect our portion of the Fund to hold up well in a rising rate environment given the average portfolio holding’s low level of debt.
Columbia: We believe our focus on small-cap value companies with what we consider to be strong underlying earnings prospects and attractively priced shares has the potential to reward investors over the long term. Going forward, we remain disciplined in our research of those companies where we believe the valuation gap is likely to shrink in the near term and look for a company’s upward inflection point — that is, we seek stocks that are, in our view, both inexpensive and demonstrating improving operating performance and operating metrics. As we do this, three categories of opportunity typically come to light: 1) “out of the limelight” companies missed by the Wall Street research community; 2) companies in industries that may be out of favor; and 3) companies with compressed near-term operating fundamentals, which managers believe are poised to expand within a reasonable timeframe.
Going forward, we expect our portion of the Fund’s performance to continue to be driven by our bottom-up stock selection process and for this process to continue to drive sector allocations.
| | |
| |
| | Active Portfolios® Multi-Manager Small Cap Equity Fund |
Understanding Your Fund’s Expenses
(Unaudited)
As an investor, you incur two types of costs. There are transaction costs, which generally include sales charges on purchases and may include redemption fees. There are also ongoing costs, which generally include management fees, distribution and service (Rule 12b-1) fees, and other fund expenses. The following information is intended to help you understand your ongoing costs (in dollars) of investing in the Fund and to help you compare these costs with the ongoing costs of investing in other mutual funds.
Analyzing Your Fund’s Expenses
To illustrate these ongoing costs, we have provided examples and calculated the expenses paid by investors in each share class of the Fund during the period. The actual and hypothetical information in the table is based on an initial investment of $1,000 at the beginning of the period indicated and held for the entire period. Expense information is calculated two ways and each method provides you with different information. The amount listed in the “Actual” column is calculated using the Fund’s actual operating expenses and total return for the period. You may use the Actual information, together with the amount invested, to estimate the expenses that you paid over the period. Simply divide your account value by $1,000 (for example, an $8,600 account value divided by $1,000 = 8.6), then multiply the results by the expenses paid during the period under the Actual column. The amount listed in the “Hypothetical” column assumes a 5% annual rate of return before expenses (which is not the Fund’s actual return) and then applies the Fund’s actual expense ratio for the period to the hypothetical return. You should not use the hypothetical account values and expenses to estimate either your actual account balance at the end of the period or the expenses you paid during the period. See “Compare With Other Funds” below for details on how to use the hypothetical data.
Compare With Other Funds
Since all mutual funds are required to include the same hypothetical calculations about expenses in shareholder reports, you can use this information to compare the ongoing cost of investing in the Fund with other funds. To do so, compare the hypothetical example with the 5% hypothetical examples that appear in the shareholder reports of other funds. As you compare hypothetical examples of other funds, it is important to note that hypothetical examples are meant to highlight the ongoing costs of investing in a fund only and do not reflect any transaction costs, such as sales charges, or redemption or exchange fees. Therefore, the hypothetical calculations are useful in comparing ongoing costs only, and will not help you determine the relative total costs of owning different funds. If transaction costs were included in these calculations, your costs would be higher.
March 1, 2013 – August 31, 2013
| | | | | | | | | | | | | | | | | | | | | | | | | | | | |
| | | Account Value at the
Beginning of the
Period ($) | | | Account Value at the
End of the
Period ($) | | | Expenses Paid During
the Period ($) | | | Fund’s Annualized
Expense Ratio (%) | |
| | | | Actual | | | | Hypothetical | | | | Actual | | | | Hypothetical | | | | Actual | | | | Hypothetical | | | | Actual | |
Class A | | | 1,000.00 | | | | 1,000.00 | | | | 1,135.60 | | | | 1,018.35 | | | | 7.17 | | | | 6.78 | | | | 1.34 | |
Expenses paid during the period are equal to the annualized expense ratio for each class as indicated above, multiplied by the average account value over the period and then multiplied by the number of days in the Fund’s most recent fiscal half year and divided by 365.
Expenses do not include fees and expenses incurred indirectly by the Portfolio from the underlying funds in which the Portfolio may invest (also referred to as “acquired funds”), including affiliated and non-affiliated pooled investment vehicles (including mutual funds and exchange-traded funds).
Had Columbia Management Investment Advisers, LLC and/or certain of its affiliates not waived/reimbursed certain fees and expenses, account value at the end of the period would have been reduced.
Class A shares of the Fund are available only to certain eligible investors through certain wrap fee programs sponsored and/or managed by Ameriprise Financial, Inc. or its affiliates. Fund shares are sold in accordance with the terms of the account through which you invest in the Fund. Participants in wrap fee programs pay an asset-based fee that is not included in the above table. Please read the wrap program documents for information regarding fees charged.
| | |
| |
| Active Portfolios® Multi-Manager Small Cap Equity Fund | | |
Portfolio of Investments
August 31, 2013
(Percentages represent value of investments compared to net assets)
| | | | | | | | |
| Common Stocks 96.5% | |
| Issuer | | Shares | | | Value ($) | |
Consumer Discretionary 11.3% | |
Auto Components 1.0% | |
| | |
American Axle & Manufacturing Holdings, Inc.(a) | | | 68,000 | | | | 1,307,640 | |
| | |
Dorman Products, Inc. | | | 22,726 | | | | 1,141,754 | |
| | |
Tenneco, Inc.(a) | | | 35,500 | | | | 1,637,615 | |
| | |
Tower International, Inc.(a) | | | 74,500 | | | | 1,525,760 | |
| | | | | | | | | |
Total | | | | | | | 5,612,769 | |
| | |
Automobiles 0.8% | | | | | | | | |
| | |
Thor Industries, Inc. | | | 87,275 | | | | 4,471,098 | |
|
Diversified Consumer Services 1.1% | |
| | |
Grand Canyon Education, Inc.(a) | | | 105,812 | | | | 3,651,572 | |
| | |
LifeLock, Inc.(a) | | | 85,561 | | | | 1,078,924 | |
| | |
Steiner Leisure Ltd.(a) | | | 33,045 | | | | 1,841,268 | |
| | | | | | | | | |
Total | | | | | | | 6,571,764 | |
|
Hotels, Restaurants & Leisure 1.7% | |
| | |
AFC Enterprises, Inc.(a) | | | 18,936 | | | | 775,429 | |
| | |
Bally Technologies, Inc.(a) | | | 14,401 | | | | 1,038,744 | |
| | |
Bloomin’ Brands, Inc.(a) | | | 34,405 | | | | 774,112 | |
| | |
Domino’s Pizza, Inc. | | | 13,174 | | | | 809,411 | |
| | |
Jack in the Box, Inc.(a) | | | 23,894 | | | | 943,574 | |
| | |
Papa John’s International, Inc. | | | 17,168 | | | | 1,169,656 | |
| | |
Red Robin Gourmet Burgers, Inc.(a) | | | 15,521 | | | | 1,006,692 | |
| | |
Ruby Tuesday, Inc.(a) | | | 97,000 | | | | 704,220 | |
| | |
Sonic Corp.(a) | | | 149,475 | | | | 2,385,621 | |
| | | | | | | | | |
Total | | | | | | | 9,607,459 | |
| | |
Household Durables 0.9% | | | | | | | | |
| | |
Helen of Troy Ltd.(a) | | | 52,113 | | | | 2,093,900 | |
| | |
KB Home | | | 64,000 | | | | 1,025,920 | |
| | |
La-Z-Boy, Inc. | | | 43,971 | | | | 934,824 | |
| | |
Standard Pacific Corp.(a) | | | 157,000 | | | | 1,120,980 | |
| | | | | | | | | |
Total | | | | | | | 5,175,624 | |
| | |
Internet & Catalog Retail 0.2% | | | | | | | | |
| | |
Shutterfly, Inc.(a) | | | 19,018 | | | | 988,175 | |
| | |
Media 1.8% | | | | | | | | |
| | |
Belo Corp., Class A | | | 149,750 | | | | 2,117,465 | |
| | |
Carmike Cinemas, Inc.(a) | | | 46,134 | | | | 808,729 | |
| | |
Cinemark Holdings, Inc. | | | 25,524 | | | | 752,192 | |
| | |
Gray Television, Inc.(a) | | | 238,467 | | | | 1,573,882 | |
| | |
Live Nation Entertainment, Inc.(a) | | | 52,602 | | | | 886,870 | |
| | |
MDC Partners, Inc., Class A | | | 47,757 | | | | 1,068,802 | |
| | |
Morningstar, Inc. | | | 27,825 | | | | 2,089,379 | |
| | |
Sinclair Broadcast Group, Inc., Class A | | | 50,000 | | | | 1,196,000 | |
| | | | | | | | | |
Total | | | | | | | 10,493,319 | |
| | | | | | | | |
| Common Stocks (continued) | |
| Issuer | | Shares | | | Value ($) | |
Multiline Retail 0.2% | | | | | | | | |
| | |
Tuesday Morning Corp.(a) | | | 75,127 | | | | 924,813 | |
| | |
Specialty Retail 3.3% | | | | | | | | |
| | |
Cato Corp. (The), Class A | | | 73,620 | | | | 1,852,279 | |
| | |
Chico’s FAS, Inc. | | | 210,101 | | | | 3,277,576 | |
| | |
Conn’s, Inc.(a) | | | 14,916 | | | | 993,555 | |
| | |
Haverty Furniture Companies, Inc. | | | 37,502 | | | | 907,923 | |
| | |
Hibbett Sports, Inc.(a) | | | 51,375 | | | | 2,661,225 | |
| | |
Lithia Motors, Inc., Class A | | | 18,588 | | | | 1,219,745 | |
| | |
Lumber Liquidators Holdings, Inc.(a) | | | 10,209 | | | | 1,014,979 | |
| | |
OfficeMax, Inc. | | | 85,000 | | | | 923,950 | |
| | |
Pier 1 Imports, Inc. | | | 37,000 | | | | 811,040 | |
| | |
Restoration Hardware Holdings, Inc.(a) | | | 13,444 | | | | 934,761 | |
| | |
Sonic Automotive, Inc., Class A | | | 63,000 | | | | 1,372,770 | |
| | |
Wet Seal, Inc. (The), Class A(a) | | | 195,000 | | | | 711,750 | |
| | |
Zale Corp.(a) | | | 156,737 | | | | 1,960,780 | |
| | | | | | | | | |
Total | | | | | | | 18,642,333 | |
|
Textiles, Apparel & Luxury Goods 0.3% | |
| | |
Hanesbrands, Inc. | | | 15,889 | | | | 945,078 | |
| | |
Steven Madden Ltd.(a) | | | 17,540 | | | | 947,160 | |
| | | | | | | | | |
Total | | | | | | | 1,892,238 | |
| | | | | | | | | |
Total Consumer Discretionary | | | | | | | 64,379,592 | |
| | |
| | | | | | | | |
Consumer Staples 1.4% | |
Food & Staples Retailing 0.6% | | | | | | | | |
| | |
Andersons, Inc. (The) | | | 15,127 | | | | 993,239 | |
| | |
Weis Markets, Inc. | | | 53,195 | | | | 2,499,101 | |
| | | | | | | | | |
Total | | | | | | | 3,492,340 | |
| | |
Personal Products 0.8% | | | | | | | | |
| | |
Medifast, Inc.(a) | | | 55,500 | | | | 1,379,730 | |
| | |
Nu Skin Enterprises, Inc., Class A | | | 33,419 | | | | 2,797,504 | |
| | | | | | | | | |
Total | | | | | | | 4,177,234 | |
| | | | | | | | | |
Total Consumer Staples | | | | | | | 7,669,574 | |
| | |
| | | | | | | | |
Energy 6.4% | |
Energy Equipment & Services 3.1% | | | | | | | | |
| | |
CARBO Ceramics, Inc. | | | 31,325 | | | | 2,555,807 | |
| | |
Dril-Quip, Inc.(a) | | | 9,797 | | | | 999,392 | |
| | |
Geospace Technologies Corp.(a) | | | 42,775 | | | | 2,983,984 | |
| | |
Helix Energy Solutions Group, Inc.(a) | | | 51,000 | | | | 1,276,530 | |
| | |
Hercules Offshore, Inc.(a) | | | 180,000 | | | | 1,296,000 | |
| | |
Hornbeck Offshore Services, Inc.(a) | | | 51,637 | | | | 2,813,184 | |
| | |
Pioneer Energy Services Corp.(a) | | | 318,620 | | | | 2,153,871 | |
| | |
Precision Drilling Corp. | | | 235,603 | | | | 2,330,114 | |
The accompanying Notes to Financial Statements are an integral part of this statement.
| | |
| |
| | Active Portfolios® Multi-Manager Small Cap Equity Fund |
Portfolio of Investments (continued)
August 31, 2013
| | | | | | | | |
| Common Stocks (continued) | |
| Issuer | | Shares | | | Value ($) | |
Tesco Corp.(a) | | | 68,000 | | | | 1,050,600 | |
| | | | | | | | | |
Total | | | | | | | 17,459,482 | |
| | |
Oil, Gas & Consumable Fuels 3.3% | | | | | | | | |
| | |
Athlon Energy, Inc.(a) | | | 36,000 | | | | 1,000,800 | |
| | |
Bonanza Creek Energy, Inc.(a) | | | 24,098 | | | | 956,691 | |
| | |
Contango Oil & Gas Co. | | | 60,000 | | | | 2,151,600 | |
| | |
Delek U.S. Holdings, Inc. | | | 19,000 | | | | 472,340 | |
| | |
Goodrich Petroleum Corp.(a) | | | 56,652 | | | | 1,215,185 | |
| | |
Gulfport Energy Corp.(a) | | | 41,318 | | | | 2,437,762 | |
| | |
Matador Resources Co.(a) | | | 43,853 | | | | 742,870 | |
| | |
Midstates Petroleum Co., Inc.(a) | | | 75,000 | | | | 339,000 | |
| | |
PDC Energy, Inc.(a) | | | 70,292 | | | | 4,033,355 | |
| | |
Rex Energy Corp.(a) | | | 102,422 | | | | 2,130,377 | |
| | |
Sanchez Energy Corp.(a) | | | 40,111 | | | | 969,082 | |
| | |
Solazyme, Inc.(a) | | | 81,220 | | | | 913,725 | |
| | |
Targa Resources Corp. | | | 12,607 | | | | 858,411 | |
| | |
Triangle Petroleum Corp.(a) | | | 117,359 | | | | 780,437 | |
| | | | | | | | | |
Total | | | | | | | 19,001,635 | |
| | | | | | | | | |
Total Energy | | | | | | | 36,461,117 | |
| | |
| | | | | | | | |
Financials 18.1% | |
Capital Markets 2.1% | | | | | | | | |
| | |
Apollo Investment Corp. | | | 80,000 | | | | 631,200 | |
| | |
Financial Engines, Inc. | | | 20,706 | | | | 1,106,736 | |
| | |
FXCM, Inc., Class A | | | 50,998 | | | | 968,452 | |
| | |
GAMCO Investors, Inc., Class A | | | 45,596 | | | | 2,620,858 | |
| | |
Medley Capital Corp. | | | 95,000 | | | | 1,249,250 | |
| | |
Piper Jaffray Companies(a) | | | 51,358 | | | | 1,669,649 | |
| | |
Walter Investment Management Corp.(a) | | | 28,000 | | | | 1,027,320 | |
| | |
Westwood Holdings Group, Inc. | | | 55,275 | | | | 2,626,115 | |
| | | | | | | | | |
Total | | | | | | | 11,899,580 | |
| | |
Commercial Banks 6.0% | | | | | | | | |
| | |
Associated Banc-Corp. | | | 166,591 | | | | 2,657,126 | |
| | |
Community Bank System, Inc. | | | 46,000 | | | | 1,529,040 | |
| | |
FirstMerit Corp. | | | 58,000 | | | | 1,227,280 | |
| | |
Hancock Holding Co. | | | 37,371 | | | | 1,201,478 | |
| | |
Independent Bank Corp. | | | 44,000 | | | | 1,562,440 | |
| | |
National Penn Bancshares, Inc. | | | 208,207 | | | | 2,090,398 | |
| | |
Old National Bancorp | | | 185,433 | | | | 2,436,590 | |
| | |
PacWest Bancorp | | | 26,616 | | | | 884,982 | |
| | |
PrivateBancorp, Inc. | | | 41,000 | | | | 894,620 | |
| | |
Prosperity Bancshares, Inc. | | | 30,000 | | | | 1,794,000 | |
| | |
Renasant Corp. | | | 62,000 | | | | 1,560,540 | |
| | |
Sandy Spring Bancorp, Inc. | | | 141,102 | | | | 3,153,630 | |
| | | | | | | | |
| Common Stocks (continued) | |
| Issuer | | Shares | | | Value ($) | |
Sterling Bancorp | | | 115,000 | | | | 1,459,350 | |
| | |
Susquehanna Bancshares, Inc. | | | 116,000 | | | | 1,462,760 | |
| | |
Umpqua Holdings Corp. | | | 110,000 | | | | 1,786,400 | |
| | |
Union First Market Bankshares Corp. | | | 62,500 | | | | 1,336,875 | |
| | |
Webster Financial Corp. | | | 70,783 | | | | 1,872,918 | |
| | |
WesBanco, Inc. | | | 75,020 | | | | 2,152,324 | |
| | |
Western Alliance Bancorp(a) | | | 88,000 | | | | 1,440,560 | |
| | |
Wilshire Bancorp, Inc. | | | 124,900 | | | | 1,015,437 | |
| | |
Wintrust Financial Corp. | | | 25,000 | | | | 991,000 | |
| | | | | | | | | |
Total | | | | | | | 34,509,748 | |
| | |
Insurance 3.6% | | | | | | | | |
| | |
American Equity Investment Life Holding Co. | | | 257,619 | | | | 5,103,432 | |
| | |
AMERISAFE, Inc. | | | 45,000 | | | | 1,466,550 | |
| | |
Amtrust Financial Services, Inc. | | | 48,142 | | | | 1,719,632 | |
| | |
Argo Group International Holdings Ltd. | | | 35,000 | | | | 1,429,400 | |
| | |
CNO Financial Group, Inc. | | | 120,000 | | | | 1,630,800 | |
| | |
Employers Holdings, Inc. | | | 34,434 | | | | 912,845 | |
| | |
First American Financial Corp. | | | 71,537 | | | | 1,495,123 | |
| | |
HCI Group, Inc. | | | 25,264 | | | | 880,956 | |
| | |
Hilltop Holdings, Inc.(a) | | | 65,000 | | | | 1,017,900 | |
| | |
Maiden Holdings Ltd. | | | 243,958 | | | | 3,190,971 | |
| | |
Symetra Financial Corp. | | | 102,000 | | | | 1,761,540 | |
| | | | | | | | | |
Total | | | | | | | 20,609,149 | |
|
Real Estate Investment Trusts (REITs) 4.5% | |
| | |
American Assets Trust, Inc. | | | 52,000 | | | | 1,539,720 | |
| | |
BioMed Realty Trust, Inc. | | | 121,462 | | | | 2,236,116 | |
| | |
Brandywine Realty Trust | | | 94,000 | | | | 1,205,080 | |
| | |
Colonial Properties Trust | | | 94,447 | | | | 2,086,334 | |
| | |
Colony Financial, Inc. | | | 110,081 | | | | 2,176,301 | |
| | |
Cousins Properties, Inc. | | | 241,027 | | | | 2,393,398 | |
| | |
CubeSmart | | | 76,000 | | | | 1,265,400 | |
| | |
First Industrial Realty Trust, Inc. | | | 97,000 | | | | 1,467,610 | |
| | |
Geo Group, Inc. (The) | | | 21,000 | | | | 655,410 | |
| | |
Glimcher Realty Trust | | | 202,377 | | | | 2,003,532 | |
| | |
Hersha Hospitality Trust | | | 428,922 | | | | 2,247,551 | |
| | |
Highwoods Properties, Inc. | | | 29,500 | | | | 996,510 | |
| | |
Kilroy Realty Corp. | | | 13,000 | | | | 634,270 | |
| | |
LaSalle Hotel Properties | | | 35,000 | | | | 928,550 | |
| | |
Pennsylvania Real Estate Investment Trust | | | 44,000 | | | | 816,200 | |
| | |
PennyMac Mortgage Investment Trust | | | 36,000 | | | | 757,800 | |
| | |
Sun Communities, Inc. | | | 47,446 | | | | 2,038,755 | |
| | | | | | | | | |
Total | | | | | | | 25,448,537 | |
|
Thrifts & Mortgage Finance 1.9% | |
| | |
EverBank Financial Corp. | | | 87,000 | | | | 1,223,220 | |
The accompanying Notes to Financial Statements are an integral part of this statement.
| | |
| |
| Active Portfolios® Multi-Manager Small Cap Equity Fund | | |
Portfolio of Investments (continued)
August 31, 2013
| | | | | | | | |
| Common Stocks (continued) | |
| Issuer | | Shares | | | Value ($) | |
MGIC Investment Corp.(a) | | | 118,000 | | | | 851,960 | |
| | |
Ocwen Financial Corp.(a) | | | 25,500 | | | | 1,286,220 | |
| | |
Oritani Financial Corp. | | | 73,000 | | | | 1,132,230 | |
| | |
Provident Financial Services, Inc. | | | 140,667 | | | | 2,275,992 | |
| | |
Radian Group, Inc. | | | 287,823 | | | | 3,900,002 | |
| | | | | | | | | |
Total | | | | | | | 10,669,624 | |
| | | | | | | | | |
Total Financials | | | | | | | 103,136,638 | |
| | |
| | | | | | | | |
Health Care 14.2% | |
Biotechnology 3.5% | | | | | | | | |
| | |
ACADIA Pharmaceuticals, Inc.(a) | | | 50,529 | | | | 1,008,559 | |
| | |
Acorda Therapeutics, Inc.(a) | | | 22,411 | | | | 757,268 | |
| | |
Aegerion Pharmaceuticals, Inc.(a) | | | 13,852 | | | | 1,200,691 | |
| | |
Alnylam Pharmaceuticals, Inc.(a) | | | 23,813 | | | | 1,233,513 | |
| | |
Anacor Pharmaceuticals, Inc.(a) | | | 93,543 | | | | 945,720 | |
| | |
Celldex Therapeutics, Inc.(a) | | | 60,148 | | | | 1,306,415 | |
| | |
Insmed, Inc.(a) | | | 69,706 | | | | 1,060,228 | |
| | |
Insys Therapeutics, Inc.(a) | | | 34,805 | | | | 974,888 | |
| | |
InterMune, Inc.(a) | | | 64,471 | | | | 921,291 | |
| | |
Keryx Biopharmaceuticals, Inc.(a) | | | 108,086 | | | | 921,974 | |
| | |
Ligand Pharmaceuticals, Inc.(a) | | | 26,043 | | | | 1,252,408 | |
| | |
Neurocrine Biosciences, Inc.(a) | | | 75,133 | | | | 1,094,688 | |
| | |
NPS Pharmaceuticals, Inc.(a) | | | 42,222 | | | | 1,059,772 | |
| | |
Orexigen Therapeutics, Inc.(a) | | | 137,018 | | | | 939,943 | |
| | |
Pharmacyclics, Inc.(a) | | | 9,198 | | | | 1,025,577 | |
| | |
Raptor Pharmaceutical Corp.(a) | | | 100,737 | | | | 1,363,979 | |
| | |
TESARO, Inc.(a) | | | 22,992 | | | | 795,063 | |
| | |
Theravance, Inc.(a) | | | 31,537 | | | | 1,130,601 | |
| | |
Vanda Pharmaceuticals, Inc.(a) | | | 84,233 | | | | 962,783 | |
| | | | | | | | | |
Total | | | | | | | 19,955,361 | |
|
Health Care Equipment & Supplies 4.0% | |
| | |
Abaxis, Inc. | | | 71,577 | | | | 2,804,387 | |
| | |
Align Technology, Inc.(a) | | | 90,675 | | | | 3,948,896 | |
| | |
Cardiovascular Systems, Inc.(a) | | | 42,288 | | | | 867,750 | |
| | |
CONMED Corp. | | | 43,000 | | | | 1,336,870 | |
| | |
DexCom, Inc.(a) | | | 41,059 | | | | 1,110,646 | |
| | |
Globus Medical, Inc. - A(a) | | | 50,819 | | | | 895,431 | |
| | |
ICU Medical, Inc.(a) | | | 38,586 | | | | 2,758,127 | |
| | |
Meridian Bioscience, Inc. | | | 114,875 | | | | 2,583,539 | |
| | |
Neogen Corp.(a) | | | 64,775 | | | | 3,504,327 | |
| | |
STERIS Corp. | | | 18,500 | | | | 756,465 | |
| | |
Symmetry Medical, Inc.(a) | | | 99,000 | | | | 777,150 | |
| | |
TearLab Corp.(a) | | | 94,487 | | | | 1,241,559 | |
| | | | | | | | | |
Total | | | | | | | 22,585,147 | |
| | | | | | | | |
| Common Stocks (continued) | |
| Issuer | | Shares | | | Value ($) | |
Health Care Providers & Services 3.0% | |
| | |
Acadia Healthcare Co., Inc.(a) | | | 28,009 | | | | 1,073,585 | |
| | |
AMN Healthcare Services, Inc.(a) | | | 75,089 | | | | 1,021,210 | |
| | |
Hanger, Inc.(a) | | | 72,838 | | | | 2,236,855 | |
| | |
HealthSouth Corp.(a) | | | 32,221 | | | | 1,013,673 | |
| | |
Healthways, Inc.(a) | | | 77,000 | | | | 1,469,160 | |
| | |
Kindred Healthcare, Inc. | | | 97,000 | | | | 1,425,900 | |
| | |
LHC Group, Inc.(a) | | | 38,000 | | | | 859,940 | |
| | |
LifePoint Hospitals, Inc.(a) | | | 17,159 | | | | 776,102 | |
| | |
Mednax, Inc.(a) | | | 8,735 | | | | 850,527 | |
| | |
National Research Corp., Class A(a) | | | 117,600 | | | | 1,927,464 | |
| | |
National Research Corp., Class B | | | 19,600 | | | | 567,616 | |
| | |
Team Health Holdings, Inc.(a) | | | 24,370 | | | | 936,539 | |
| | |
VCA Antech, Inc.(a) | | | 56,000 | | | | 1,528,240 | |
| | |
WellCare Health Plans, Inc.(a) | | | 23,500 | | | | 1,496,245 | |
| | | | | | | | | |
Total | | | | | | | 17,183,056 | |
| | |
Health Care Technology 2.4% | | | | | | | | |
| | |
HealthStream, Inc.(a) | | | 126,700 | | | | 4,200,105 | |
| | |
MedAssets, Inc.(a) | | | 58,000 | | | | 1,300,360 | |
| | |
Medidata Solutions, Inc.(a) | | | 50,354 | | | | 4,503,662 | |
| | |
Omnicell, Inc.(a) | | | 165,560 | | | | 3,599,274 | |
| | | | | | | | | |
Total | | | | | | | 13,603,401 | |
| | |
Life Sciences Tools & Services 0.8% | | | | | | | | |
| | |
ICON PLC(a) | | | 80,023 | | | | 2,924,041 | |
| | |
Techne Corp. | | | 22,375 | | | | 1,734,286 | |
| | | | | | | | | |
Total | | | | | | | 4,658,327 | |
| | |
Pharmaceuticals 0.5% | | | | | | | | |
| | |
AcelRx Pharmaceuticals, Inc.(a) | | | 111,214 | | | | 1,102,131 | |
| | |
Pacira Pharmaceuticals, Inc.(a) | | | 30,374 | | | | 1,100,146 | |
| | |
Santarus, Inc.(a) | | | 38,671 | | | | 870,871 | |
| | | | | | | | | |
Total | | | | | | | 3,073,148 | |
| | | | | | | | | |
Total Health Care | | | | | | | 81,058,440 | |
| | |
| | | | | | | | |
Industrials 14.4% | |
Aerospace & Defense 0.8% | | | | | | | | |
| | |
Aerovironment, Inc.(a) | | | 64,450 | | | | 1,412,099 | |
| | |
DigitalGlobe, Inc.(a) | | | 27,168 | | | | 820,474 | |
| | |
Hexcel Corp.(a) | | | 24,286 | | | | 863,853 | |
| | |
Kratos Defense & Security Solutions, Inc.(a) | | | 112,070 | | | | 945,871 | |
| | |
Triumph Group, Inc. | | | 10,247 | | | | 737,476 | |
| | | | | | | | | |
Total | | | | | | | 4,779,773 | |
| | |
Airlines 0.5% | | | | | | | | |
| | |
Alaska Air Group, Inc. | | | 15,000 | | | | 849,300 | |
| | |
Spirit Airlines, Inc.(a) | | | 41,363 | | | | 1,289,285 | |
The accompanying Notes to Financial Statements are an integral part of this statement.
| | |
| |
| | Active Portfolios® Multi-Manager Small Cap Equity Fund |
Portfolio of Investments (continued)
August 31, 2013
| | | | | | | | |
| Common Stocks (continued) | |
| Issuer | | Shares | | | Value ($) | |
U.S. Airways Group, Inc.(a) | | | 40,000 | | | | 646,400 | |
| | | | | | | | | |
Total | | | | | | | 2,784,985 | |
| | |
Building Products 1.5% | | | | | | | | |
| | |
AAON, Inc. | | | 154,300 | | | | 3,598,276 | |
| | |
AO Smith Corp. | | | 18,078 | | | | 760,180 | |
| | |
Simpson Manufacturing Co., Inc. | | | 102,300 | | | | 3,198,921 | |
| | |
USG Corp.(a) | | | 40,000 | | | | 933,600 | |
| | | | | | | | | |
Total | | | | | | | 8,490,977 | |
|
Commercial Services & Supplies 2.1% | |
| | |
Deluxe Corp. | | | 36,000 | | | | 1,416,600 | |
| | |
Herman Miller, Inc. | | | 72,655 | | | | 1,850,523 | |
| | |
InnerWorkings, Inc.(a) | | | 140,025 | | | | 1,438,057 | |
| | |
Rollins, Inc. | | | 105,450 | | | | 2,609,887 | |
| | |
Steelcase, Inc., Class A | | | 81,000 | | | | 1,176,120 | |
| | |
TMS International Corp., Class A | | | 62,000 | | | | 1,079,420 | |
| | |
Unifirst Corp. | | | 9,754 | | | | 935,214 | |
| | |
United Stationers, Inc. | | | 40,500 | | | | 1,609,470 | |
| | | | | | | | | |
Total | | | | | | | 12,115,291 | |
| | |
Construction & Engineering 1.4% | | | | | | | | |
| | |
Dycom Industries, Inc.(a) | | | 37,161 | | | | 944,261 | |
| | |
EMCOR Group, Inc. | | | 107,117 | | | | 4,026,528 | |
| | |
MasTec, Inc.(a) | | | 60,557 | | | | 1,925,712 | |
| | |
Primoris Services Corp. | | | 40,818 | | | | 917,589 | |
| | | | | | | | | |
Total | | | | | | | 7,814,090 | |
| | |
Electrical Equipment 0.5% | | | | | | | | |
| | |
Acuity Brands, Inc. | | | 10,201 | | | | 872,186 | |
| | |
Powell Industries, Inc.(a) | | | 18,595 | | | | 980,514 | |
| | |
PowerSecure International, Inc.(a) | | | 59,758 | | | | 917,285 | |
| | | | | | | | | |
Total | | | | | | | 2,769,985 | |
| | |
Industrial Conglomerates 0.7% | | | | | | | | |
| | |
Raven Industries, Inc. | | | 130,700 | | | | 3,817,747 | |
| | |
Machinery 3.5% | | | | | | | | |
| | |
Chart Industries, Inc.(a) | | | 7,990 | | | | 912,298 | |
| | |
CIRCOR International, Inc. | | | 16,780 | | | | 964,682 | |
| | |
ExOne Co. (The)(a) | | | 13,474 | | | | 923,104 | |
| | |
Hyster-Yale Materials Handling, Inc. | | | 21,074 | | | | 1,593,405 | |
| | |
LB Foster Co., Class A | | | 49,789 | | | | 2,112,049 | |
| | |
Middleby Corp. (The)(a) | | | 6,030 | | | | 1,121,218 | |
| | |
Mueller Industries, Inc. | | | 35,837 | | | | 1,918,713 | |
| | |
Proto Labs, Inc.(a) | | | 73,815 | | | | 5,243,818 | |
| | |
Sun Hydraulics Corp. | | | 125,250 | | | | 3,837,660 | |
| | |
Wabash National Corp.(a) | | | 135,000 | | | | 1,406,700 | |
| | | | | | | | | |
Total | | | | | | | 20,033,647 | |
| | | | | | | | |
| Common Stocks (continued) | |
| Issuer | | Shares | | | Value ($) | |
Professional Services 1.6% | | | | | | | | |
| | |
Acacia Research Corp. | | | 79,300 | | | | 1,742,221 | |
| | |
Advisory Board Co. (The)(a) | | | 56,910 | | | | 3,116,961 | |
| | |
Navigant Consulting, Inc.(a) | | | 118,000 | | | | 1,610,700 | |
| | |
On Assignment, Inc.(a) | | | 40,927 | | | | 1,234,768 | |
| | |
TrueBlue, Inc.(a) | | | 36,047 | | | | 876,663 | |
| | |
Wageworks, Inc.(a) | | | 21,418 | | | | 893,987 | |
| | | | | | | | | |
Total | | | | | | | 9,475,300 | |
| | |
Road & Rail 1.5% | | | | | | | | |
| | |
Arkansas Best Corp. | | | 34,904 | | | | 868,412 | |
| | |
Heartland Express, Inc. | | | 117,324 | | | | 1,633,150 | |
| | |
Old Dominion Freight Line, Inc.(a) | | | 83,280 | | | | 3,616,018 | |
| | |
Roadrunner Transportation Systems, Inc.(a) | | | 33,661 | | | | 912,886 | |
| | |
Swift Transportation Co.(a) | | | 86,000 | | | | 1,544,560 | |
| | | | | | | | | |
Total | | | | | | | 8,575,026 | |
|
Trading Companies & Distributors 0.3% | |
| | |
United Rentals, Inc.(a) | | | 14,000 | | | | 766,780 | |
| | |
Watsco, Inc. | | | 9,999 | | | | 897,910 | |
| | | | | | | | | |
Total | | | | | | | 1,664,690 | |
| | | | | | | | | |
Total Industrials | | | | | | | 82,321,511 | |
| | |
| | | | | | | | |
Information Technology 22.9% | |
Communications Equipment 1.7% | | | | | | | | |
| | |
Alliance Fiber Optic Product | | | 36,493 | | | | 1,351,336 | |
| | |
CalAmp Corp.(a) | | | 69,725 | | | | 1,142,793 | |
| | |
Calix, Inc.(a) | | | 95,000 | | | | 1,220,750 | |
| | |
Ciena Corp.(a) | | | 95,673 | | | | 1,905,806 | |
| | |
Finisar Corp.(a) | | | 95,857 | | | | 1,962,193 | |
| | |
Sonus Networks, Inc.(a) | | | 290,705 | | | | 1,002,932 | |
| | |
Ubiquiti Networks, Inc. | | | 34,816 | | | | 1,220,649 | |
| | | | | | | | | |
Total | | | | | | | 9,806,459 | |
| | |
Computers & Peripherals 1.0% | | | | | | | | |
| | |
QLogic Corp.(a) | | | 131,490 | | | | 1,392,479 | |
| | |
Silicon Graphics International Corp.(a) | | | 57,721 | | | | 850,808 | |
| | |
Stratasys Ltd.(a) | | | 32,875 | | | | 3,526,501 | |
| | | | | | | | | |
Total | | | | | | | 5,769,788 | |
|
Electronic Equipment, Instruments & Components 2.7% | |
| | |
Anixter International, Inc.(a) | | | 55,250 | | | | 4,616,690 | |
| | |
Belden, Inc. | | | 16,084 | | | | 912,285 | |
| | |
Checkpoint Systems, Inc.(a) | | | 59,030 | | | | 865,970 | |
| | |
Electro Scientific Industries, Inc. | | | 159,871 | | | | 1,756,982 | |
| | |
FARO Technologies, Inc.(a) | | | 90,625 | | | | 3,364,906 | |
| | |
FEI Co. | | | 10,872 | | | | 851,060 | |
| | |
Mesa Laboratories, Inc. | | | 12,225 | | | | 795,359 | |
The accompanying Notes to Financial Statements are an integral part of this statement.
| | |
| |
| Active Portfolios® Multi-Manager Small Cap Equity Fund | | |
Portfolio of Investments (continued)
August 31, 2013
| | | | | | | | |
| Common Stocks (continued) | |
| Issuer | | Shares | | | Value ($) | |
Methode Electronics, Inc. | | | 56,409 | | | | 1,347,611 | |
| | |
Rogers Corp.(a) | | | 18,500 | | | | 1,026,195 | |
| | | | | | | | | |
Total | | | | | | | 15,537,058 | |
| | |
Internet Software & Services 4.5% | | | | | | | | |
| | |
Cornerstone OnDemand, Inc.(a) | | | 25,666 | | | | 1,322,056 | |
| | |
CoStar Group, Inc.(a) | | | 43,325 | | | | 6,434,196 | |
| | |
Dealertrack Technologies, Inc.(a) | | | 24,131 | | | | 955,346 | |
| | |
Demandware, Inc.(a) | | | 22,258 | | | | 936,617 | |
| | |
IntraLinks Holdings, Inc.(a) | | | 99,415 | | | | 777,425 | |
| | |
Move, Inc.(a) | | | 69,086 | | | | 1,001,747 | |
| | |
NIC, Inc. | | | 130,625 | | | | 2,907,712 | |
| | |
Saba Software, Inc.(a) | | | 91,000 | | | | 903,175 | |
| | |
SciQuest, Inc.(a) | | | 116,575 | | | | 2,424,760 | |
| | |
SPS Commerce, Inc.(a) | | | 31,575 | | | | 1,968,385 | |
| | |
Stamps.com, Inc.(a) | | | 84,275 | | | | 3,529,437 | |
| | |
Web.com Group, Inc.(a) | | | 43,121 | | | | 1,216,875 | |
| | |
Yelp, Inc.(a) | | | 16,836 | | | | 875,135 | |
| | | | | | | | | |
Total | | | | | | | 25,252,866 | |
| | |
IT Services 1.7% | | | | | | | | |
| | |
Acxiom Corp.(a) | | | 158,287 | | | | 3,938,181 | |
| | |
Global Cash Access Holdings, Inc.(a) | | | 150,000 | | | | 1,155,000 | |
| | |
NeuStar, Inc., Class A(a) | | | 14,500 | | | | 732,830 | |
| | |
Sykes Enterprises, Inc.(a) | | | 148,774 | | | | 2,533,621 | |
| | |
Unisys Corp.(a) | | | 54,000 | | | | 1,358,640 | |
| | | | | | | | | |
Total | | | | | | | 9,718,272 | |
|
Semiconductors & Semiconductor Equipment 2.9% | |
| | |
Advanced Energy Industries, Inc.(a) | | | 42,594 | | | | 776,489 | |
| | |
Applied Micro Circuits Corp.(a) | | | 100,160 | | | | 1,077,721 | |
| | |
Cirrus Logic, Inc.(a) | | | 55,500 | | | | 1,248,750 | |
| | |
Diodes, Inc.(a) | | | 37,152 | | | | 925,085 | |
| | |
Fairchild Semiconductor International, Inc.(a) | | | 60,000 | | | | 732,600 | |
| | |
Hittite Microwave Corp.(a) | | | 43,000 | | | | 2,629,880 | |
| | |
Integrated Silicon Solution(a) | | | 80,000 | | | | 832,800 | |
| | |
IXYS Corp. | | | 92,000 | | | | 852,840 | |
| | |
Kulicke & Soffa Industries, Inc.(a) | | | 236,033 | | | | 2,610,525 | |
| | |
Micrel, Inc. | | | 85,000 | | | | 782,000 | |
| | |
NVE Corp.(a) | | | 24,675 | | | | 1,216,971 | |
| | |
Rambus, Inc.(a) | | | 104,735 | | | | 854,638 | |
| | |
RF Micro Devices, Inc.(a) | | | 125,000 | | | | 620,000 | |
| | |
Rudolph Technologies, Inc.(a) | | | 73,000 | | | | 755,550 | |
| | |
SunEdison, Inc.(a) | | | 104,500 | | | | 769,120 | |
| | | | | | | | | |
Total | | | | | | | 16,684,969 | |
| | | | | | | | |
| Common Stocks (continued) | |
| Issuer | | Shares | | | Value ($) | |
Software 8.4% | | | | | | | | |
| | |
Accelrys, Inc.(a) | | | 253,050 | | | | 2,287,572 | |
| | |
ACI Worldwide, Inc.(a) | | | 78,675 | | | | 3,829,112 | |
| | |
Advent Software, Inc. | | | 100,000 | | | | 2,699,000 | |
| | |
Aspen Technology, Inc.(a) | | | 26,017 | | | | 869,748 | |
| | |
Blackbaud, Inc. | | | 86,975 | | | | 3,132,839 | |
| | |
Bottomline Technologies de, Inc.(a) | | | 132,375 | | | | 3,603,247 | |
| | |
BroadSoft, Inc.(a) | | | 37,000 | | | | 1,191,030 | |
| | |
CommVault Systems, Inc.(a) | | | 11,213 | | | | 939,986 | |
| | |
Envivio, Inc.(a) | | | 73,000 | | | | 181,040 | |
| | |
EPIQ Systems, Inc. | | | 65,000 | | | | 796,250 | |
| | |
Factset Research Systems, Inc. | | | 21,100 | | | | 2,159,585 | |
| | |
FleetMatics Group PLC(a) | | | 2,425 | | | | 119,916 | |
| | |
Infoblox, Inc.(a) | | | 29,805 | | | | 1,040,195 | |
| | |
Manhattan Associates, Inc.(a) | | | 12,375 | | | | 1,082,813 | |
| | |
Mentor Graphics Corp. | | | 115,097 | | | | 2,550,550 | |
| | |
Netscout Systems, Inc.(a) | | | 80,782 | | | | 2,006,625 | |
| | |
NetSuite, Inc.(a) | | | 9,389 | | | | 933,548 | |
| | |
Proofpoint, Inc.(a) | | | 43,261 | | | | 1,246,349 | |
| | |
PROS Holdings, Inc.(a) | | | 107,325 | | | | 3,520,260 | |
| | |
PTC, Inc.(a) | | | 77,571 | | | | 2,022,276 | |
| | |
QLIK Technologies, Inc.(a) | | | 29,115 | | | | 954,681 | |
| | |
Splunk, Inc.(a) | | | 20,119 | | | | 1,110,770 | |
| | |
Synchronoss Technologies, Inc.(a) | | | 26,639 | | | | 915,849 | |
| | |
Take-Two Interactive Software, Inc.(a) | | | 66,220 | | | | 1,215,799 | |
| | |
Tangoe, Inc.(a) | | | 47,092 | | | | 979,043 | |
| | |
Tyler Technologies, Inc.(a) | | | 78,344 | | | | 5,788,838 | |
| | |
Ultimate Software Group, Inc.(a) | | | 6,085 | | | | 853,178 | |
| | | | | | | | | |
Total | | | | | | | 48,030,099 | |
| | | | | | | | | |
Total Information Technology | | | | | | | 130,799,511 | |
| | |
| | | | | | | | |
Materials 5.0% | |
Chemicals 2.2% | |
| | |
Advanced Emissions Solutions(a) | | | 20,982 | | | | 819,347 | |
| | |
Balchem Corp. | | | 74,450 | | | | 3,563,177 | |
| | |
Cytec Industries, Inc. | | | 25,236 | | | | 1,887,148 | |
| | |
Koppers Holdings, Inc. | | | 48,948 | | | | 1,897,714 | |
| | |
Minerals Technologies, Inc. | | | 19,043 | | | | 845,509 | |
| | |
OM Group, Inc.(a) | | | 41,000 | | | | 1,165,220 | |
| | |
PolyOne Corp. | | | 32,667 | | | | 882,662 | |
| | |
Taminco Corp.(a) | | | 63,810 | | | | 1,260,248 | |
| | | | | | | | | |
Total | | | | | | | 12,321,025 | |
|
Containers & Packaging 0.3% | |
| | |
Boise, Inc. | | | 202,290 | | | | 1,729,580 | |
The accompanying Notes to Financial Statements are an integral part of this statement.
| | |
| |
| | Active Portfolios® Multi-Manager Small Cap Equity Fund |
Portfolio of Investments (continued)
August 31, 2013
| | | | | | | | |
| Common Stocks (continued) | |
| Issuer | | Shares | | | Value ($) | |
Metals & Mining 1.2% | |
| | |
Constellium NV(a) | | | 73,000 | | | | 1,292,100 | |
| | |
Kaiser Aluminum Corp. | | | 40,157 | | | | 2,775,652 | |
| | |
Reliance Steel & Aluminum Co. | | | 27,864 | | | | 1,858,250 | |
| | |
Worthington Industries, Inc. | | | 30,000 | | | | 999,900 | |
| | | | | | | | | |
Total | | | | | | | 6,925,902 | |
|
Paper & Forest Products 1.3% | |
| | |
Boise Cascade Co.(a) | | | 29,000 | | | | 669,900 | |
| | |
Clearwater Paper Corp.(a) | | | 27,500 | | | | 1,310,650 | |
| | |
KapStone Paper and Packaging Corp. | | | 54,407 | | | | 2,285,094 | |
| | |
Neenah Paper, Inc. | | | 43,000 | | | | 1,573,800 | |
| | |
PH Glatfelter Co. | | | 38,213 | | | | 979,017 | |
| | |
Schweitzer-Mauduit International, Inc. | | | 10,000 | | | | 572,700 | |
| | | | | | | | | |
Total | | | | | | | 7,391,161 | |
| | | | | | | | | |
Total Materials | | | | | | | 28,367,668 | |
| | |
| | | | | | | | |
Telecommunication Services 0.4% | |
Diversified Telecommunication Services 0.2% | |
| | |
inContact, Inc.(a) | | | 116,249 | | | | 945,104 | |
|
Wireless Telecommunication Services 0.2% | |
| | |
NII Holdings, Inc.(a) | | | 80,000 | | | | 478,400 | |
| | |
Telephone & Data Systems, Inc. | | | 30,000 | | | | 830,700 | |
| | | | | | | | | |
Total | | | | | | | 1,309,100 | |
| | | | | | | | | |
Total Telecommunication Services | | | | | | | 2,254,204 | |
| | |
| | | | | | | | |
Utilities 2.4% | |
Electric Utilities 1.2% | |
| | |
Cleco Corp. | | | 41,196 | | | | 1,860,411 | |
| | |
Pinnacle West Capital Corp. | | | 28,133 | | | | 1,526,778 | |
| | | | | | | | |
| Common Stocks (continued) | |
| Issuer | | Shares | | | Value ($) | |
Portland General Electric Co. | | | 67,591 | | | | 1,947,297 | |
| | |
UIL Holdings Corp. | | | 40,000 | | | | 1,510,400 | |
| | | | | | | | | |
Total | | | | | | | 6,844,886 | |
|
Gas Utilities 0.6% | |
| | |
New Jersey Resources Corp. | | | 28,000 | | | | 1,206,240 | |
| | |
South Jersey Industries, Inc. | | | 22,000 | | | | 1,270,720 | |
| | |
Southwest Gas Corp. | | | 22,500 | | | | 1,052,550 | |
| | | | | | | | | |
Total | | | | | | | 3,529,510 | |
|
Multi-Utilities 0.6% | |
| | |
Avista Corp. | | | 60,000 | | | | 1,576,200 | |
| | |
Vectren Corp. | | | 60,669 | | | | 1,977,809 | |
| | | | | | | | | |
Total | | | | | | | 3,554,009 | |
| | | | | | | | | |
Total Utilities | | | | | | | 13,928,405 | |
| | | | | | | | | |
Total Common Stocks | | | | | | | | |
(Cost: $464,587,031) | | | | | | | 550,376,660 | |
| | |
| | | | | | | | |
| Money Market Funds 3.5% | |
| | | Shares | | | Value ($) | |
| | |
Columbia Short-Term Cash Fund, 0.097%(b)(c) | | | 20,216,439 | | | | 20,216,439 | |
| | | | | | | | | |
Total Money Market Funds | | | | | | | | |
(Cost: $20,216,439) | | | | | | | 20,216,439 | |
| | | | | | | | | |
Total Investments | | | | | | | | |
(Cost: $484,803,470) | | | | | | | 570,593,099 | |
| | | | | | | | | |
Other Assets & Liabilities, Net | | | | 193,022 | |
| | | | | | | | | |
Net Assets | | | | | | | 570,786,121 | |
| | | | | | | | | |
Notes to Portfolio of Investments
| (b) | The rate shown is the seven-day current annualized yield at August 31, 2013. |
| (c) | As defined in the Investment Company Act of 1940, an affiliated company is one in which the Fund owns 5% or more of its outstanding voting securities, or a company which is under common ownership or control with the Fund. Holdings and transactions in these affiliated companies during the year ended August 31, 2013, are as follows: |
| | | | | | | | | | | | | | | | | | | | | | | | |
| Issuer | | Beginning
Cost ($) | | | Purchase
Cost ($) | | | Proceeds
From Sales ($) | | | Ending
Cost ($) | | | Dividends -
Affiliated
Issuers ($) | | | Value ($) | |
Columbia Short-Term Cash Fund | | | 19,091,625 | | | | 254,347,739 | | | | (253,222,925 | ) | | | 20,216,439 | | | | 25,170 | | | | 20,216,439 | |
Fair Value Measurements
Generally accepted accounting principles (GAAP) require disclosure regarding the inputs and valuation techniques used to measure fair value and any changes in valuation inputs or techniques. In addition, investments shall be disclosed by major category.
The Fund categorizes its fair value measurements according to a three-level hierarchy that maximizes the use of observable inputs and minimizes the use of unobservable inputs by prioritizing that the most observable input be used when available. Observable inputs are those that market participants would use in pricing an investment based on market data obtained from sources independent of the reporting entity. Unobservable inputs are those that reflect the Fund’s assumptions about the information market participants would use in pricing an investment. An investment’s
The accompanying Notes to Financial Statements are an integral part of this statement.
| | |
| |
| Active Portfolios® Multi-Manager Small Cap Equity Fund | | |
Portfolio of Investments (continued)
August 31, 2013
Fair Value Measurements (continued)
level within the fair value hierarchy is based on the lowest level of any input that is deemed significant to the asset or liability’s fair value measurement. The input levels are not necessarily an indication of the risk or liquidity associated with investments at that level. For example, certain U.S. government securities are generally high quality and liquid, however, they are reflected as Level 2 because the inputs used to determine fair value may not always be quoted prices in an active market.
Fair value inputs are summarized in the three broad levels listed below:
| > | | Level 1 — Valuations based on quoted prices for investments in active markets that the Fund has the ability to access at the measurement date (including NAV for open-end mutual funds). Valuation adjustments are not applied to Level 1 investments. |
| > | | Level 2 — Valuations based on other significant observable inputs (including quoted prices for similar securities, interest rates, prepayment speeds, credit risks, etc.). |
| > | | Level 3 — Valuations based on significant unobservable inputs (including the Fund’s own assumptions and judgment in determining the fair value of investments). |
Inputs that are used in determining fair value of an investment may include price information, credit data, volatility statistics, and other factors. These inputs can be either observable or unobservable. The availability of observable inputs can vary between investments, and is affected by various factors such as the type of investment, and the volume and level of activity for that investment or similar investments in the marketplace. The inputs will be considered by the Investment Manager, along with any other relevant factors in the calculation of an investment’s fair value. The Fund uses prices and inputs that are current as of the measurement date, which may include periods of market dislocations. During these periods, the availability of prices and inputs may be reduced for many investments. This condition could cause an investment to be reclassified between the various levels within the hierarchy.
Investments falling into the Level 3 category are primarily supported by quoted prices from brokers and dealers participating in the market for those investments. However, these may be classified as Level 3 investments due to lack of market transparency and corroboration to support these quoted prices. Additionally, valuation models may be used as the pricing source for any remaining investments classified as Level 3. These models may rely on one or more significant unobservable inputs and/or significant assumptions by the Investment Manager. Inputs used in valuations may include, but are not limited to, financial statement analysis, capital account balances, discount rates and estimated cash flows, and comparable company data.
Under the direction of the Fund’s Board of Trustees (the Board), the Investment Manager’s Valuation Committee (the Committee) is responsible for carrying out the valuation procedures approved by the Board. The Committee consists of voting and non-voting members from various groups within the Investment Manager’s organization, including operations and accounting, trading and investments, compliance, risk management and legal.
The Committee meets at least monthly to review and approve valuation matters, which may include a description of specific valuation determinations, data regarding pricing information received from approved pricing vendors and brokers and the results of Board-approved valuation control policies and procedures (the Policies). The Policies address, among other things, instances when market quotations are or are not readily available, including recommendations of third party pricing vendors and a determination of appropriate pricing methodologies; events that require specific valuation determinations and assessment of fair value techniques; securities with a potential for stale pricing, including those that are illiquid, restricted, or in default; and the effectiveness of third-party pricing vendors, including periodic reviews of vendors. The Committee meets more frequently, as needed, to discuss additional valuation matters, which may include the need to review back-testing results, review time-sensitive information or approve related valuation actions. The Committee reports to the Board, with members of the Committee meeting with the Board at each of its regularly scheduled meetings to discuss valuation matters and actions during the period, similar to those described earlier.
For investments categorized as Level 3, the Committee monitors information similar to that described above, which may include: (i) data specific to the issuer or comparable issuers, (ii) general market or specific sector news and (iii) quoted prices and specific or similar security transactions. The Committee considers this data and any changes from prior periods in order to assess the reasonableness of observable and unobservable inputs, any assumptions or internal models used to value those securities and changes in fair value. This data is also used to corroborate, when available, information received from approved pricing vendors and brokers. Various factors impact the frequency of monitoring this information (which may occur as often as daily). However, the Committee may determine that changes to inputs, assumptions and models are not required as a result of the monitoring procedures performed.
The accompanying Notes to Financial Statements are an integral part of this statement.
| | |
| |
| | Active Portfolios® Multi-Manager Small Cap Equity Fund |
Portfolio of Investments (continued)
August 31, 2013
Fair Value Measurements (continued)
The following table is a summary of the inputs used to value the Fund’s investments at August 31, 2013:
| | | | | | | | | | | | | | | | |
| Description | | Level 1
Quoted Prices in Active
Markets for Identical
Assets ($) | | | Level 2
Other Significant
Observable Inputs ($) | | | Level 3
Significant
Unobservable Inputs ($) | | | Total ($) | |
Equity Securities | | | | | | | | | | | | | | | | |
| | | | |
Common Stocks | | | | | | | | | | | | | | | | |
| | | | |
Consumer Discretionary | | | 64,379,592 | | | | — | | | | — | | | | 64,379,592 | |
| | | | |
Consumer Staples | | | 7,669,574 | | | | — | | | | — | | | | 7,669,574 | |
| | | | |
Energy | | | 36,461,117 | | | | — | | | | — | | | | 36,461,117 | |
| | | | |
Financials | | | 103,136,638 | | | | — | | | | — | | | | 103,136,638 | |
| | | | |
Health Care | | | 81,058,440 | | | | — | | | | — | | | | 81,058,440 | |
| | | | |
Industrials | | | 82,321,511 | | | | — | | | | — | | | | 82,321,511 | |
| | | | |
Information Technology | | | 130,799,511 | | | | — | | | | — | | | | 130,799,511 | |
| | | | |
Materials | | | 28,367,668 | | | | — | | | | — | | | | 28,367,668 | |
| | | | |
Telecommunication Services | | | 2,254,204 | | | | — | | | | — | | | | 2,254,204 | |
| | | | |
Utilities | | | 13,928,405 | | | | — | | | | — | | | | 13,928,405 | |
| | | | | | | | | | | | | | | | | |
Total Equity Securities | | | 550,376,660 | | | | — | | | | — | | | | 550,376,660 | |
| | | | | | | | | | | | | | | | | |
Mutual Funds | | | | | | | | | | | | | | | | |
| | | | |
Money Market Funds | | | 20,216,439 | | | | — | | | | — | | | | 20,216,439 | |
| | | | | | | | | | | | | | | | | |
Total Mutual Funds | | | 20,216,439 | | | | — | | | | — | | | | 20,216,439 | |
| | | | | | | | | | | | | | | | | |
Total | | | 570,593,099 | | | | — | | | | — | | | | 570,593,099 | |
| | | | | | | | | | | | | | | | | |
See the Portfolio of Investments for all investment classifications not indicated in the table.
There were no transfers of financial assets between Levels 1 and 2 during the period.
The accompanying Notes to Financial Statements are an integral part of this statement.
| | |
| |
| Active Portfolios® Multi-Manager Small Cap Equity Fund | | |
Statement of Assets and Liabilities
August 31, 2013
| | | | |
Assets | | | | |
| |
Investments, at value | | | | |
| |
Unaffiliated issuers (identified cost $464,587,031) | | | $550,376,660 | |
| |
Affiliated issuers (identified cost $20,216,439) | | | 20,216,439 | |
| |
Total investments (identified cost $484,803,470) | | | 570,593,099 | |
| |
Receivable for: | | | | |
| |
Investments sold | | | 2,999,635 | |
| |
Capital shares sold | | | 3,059,461 | |
| |
Dividends | | | 354,466 | |
| |
Reclaims | | | 4,849 | |
| |
Expense reimbursement due from Investment Manager | | | 4,016 | |
| |
Prepaid expenses | | | 6,603 | |
| |
Trustees’ deferred compensation plan | | | 3,495 | |
| |
Total assets | | | 577,025,624 | |
| |
| |
Liabilities | | | | |
| |
Payable for: | | | | |
| |
Investments purchased | | | 5,303,886 | |
| |
Capital shares purchased | | | 673,510 | |
| |
Investment management fees | | | 13,681 | |
| |
Distribution and/or service fees | | | 3,954 | |
| |
Transfer agent fees | | | 153,577 | |
| |
Administration fees | | | 1,255 | |
| |
Chief compliance officer expenses | | | 100 | |
| |
Other expenses | | | 86,045 | |
| |
Trustees’ deferred compensation plan | | | 3,495 | |
| |
Total liabilities | | | 6,239,503 | |
| |
Net assets applicable to outstanding capital stock | | | $570,786,121 | |
| |
| |
Represented by | | | | |
| |
Paid-in capital | | | $454,523,992 | |
| |
Excess of distributions over net investment income | | | (8,023 | ) |
| |
Accumulated net realized gain | | | 30,480,523 | |
| |
Unrealized appreciation (depreciation) on: | | | | |
| |
Investments | | | 85,789,629 | |
| |
Total — representing net assets applicable to outstanding capital stock | | | $570,786,121 | |
| |
| |
Class A | | | | |
| |
Net assets | | | $570,786,121 | |
| |
Shares outstanding | | | 44,829,044 | |
| |
Net asset value per share | | | $12.73 | |
| |
The accompanying Notes to Financial Statements are an integral part of this statement.
| | |
| |
| | Active Portfolios® Multi-Manager Small Cap Equity Fund |
Statement of Operations
Year Ended August 31, 2013
| | | | |
Net investment income | | | | |
| |
Income: | | | | |
| |
Dividends — unaffiliated issuers | | | $7,994,600 | |
| |
Dividends — affiliated issuers | | | 25,170 | |
| |
Foreign taxes withheld | | | (13,692 | ) |
| |
Total income | | | 8,006,078 | |
| |
| |
Expenses: | | | | |
| |
Investment management fees | | | 4,261,994 | |
| |
Distribution and/or service fees | | | | |
| |
Class A | | | 1,220,137 | |
| |
Transfer agent fees | | | | |
| |
Class A | | | 1,730,538 | |
| |
Administration fees | | | 389,342 | |
| |
Compensation of board members | | | 25,815 | |
| |
Custodian fees | | | 43,453 | |
| |
Printing and postage fees | | | 180,236 | |
| |
Registration fees | | | 46,434 | |
| |
Professional fees | | | 31,902 | |
| |
Chief compliance officer expenses | | | 384 | |
| |
Other | | | 35,992 | |
| |
Total expenses | | | 7,966,227 | |
| |
Fees waived or expenses reimbursed by Investment Manager and its affiliates | | | (1,421,145 | ) |
| |
Total net expenses | | | 6,545,082 | |
| |
Net investment income | | | 1,460,996 | |
| |
| |
Realized and unrealized gain (loss) — net | | | | |
| |
Net realized gain (loss) on: | | | | |
| |
Investments | | | 39,227,258 | |
| |
Net realized gain | | | 39,227,258 | |
| |
Net change in unrealized appreciation (depreciation) on: | | | | |
| |
Investments | | | 78,045,287 | |
| |
Net change in unrealized appreciation (depreciation) | | | 78,045,287 | |
| |
Net realized and unrealized gain | | | 117,272,545 | |
| |
Net increase in net assets resulting from operations | | | $118,733,541 | |
| |
The accompanying Notes to Financial Statements are an integral part of this statement.
| | |
| |
| Active Portfolios® Multi-Manager Small Cap Equity Fund | | |
Statement of Changes in Net Assets
| | | | | | | | |
| | | Year Ended
August 31, 2013 | | | Year Ended
August 31, 2012(a) | |
Operations | | | | | | | | |
| | |
Net investment income (loss) | | | $1,460,996 | | | | $(275,226 | ) |
| | |
Net realized gain (loss) | | | 39,227,258 | | | | (7,892,027 | ) |
| | |
Net change in unrealized appreciation (depreciation) | | | 78,045,287 | | | | 7,744,342 | |
| |
Net increase (decrease) in net assets resulting from operations | | | 118,733,541 | | | | (422,911 | ) |
| |
| | |
Distributions to shareholders | | | | | | | | |
| | |
Net investment income | | | | | | | | |
| | |
Class A | | | (2,318,639 | ) | | | — | |
| |
Total distributions to shareholders | | | (2,318,639 | ) | �� | | — | |
| |
Increase (decrease) in net assets from capital stock activity | | | 48,378,889 | | | | 406,395,241 | |
| |
Total increase in net assets | | | 164,793,791 | | | | 405,972,330 | |
| | |
Net assets at beginning of year | | | 405,992,330 | | | | 20,000 | |
| |
Net assets at end of year | | | $570,786,121 | | | | $405,992,330 | |
| |
Excess of distributions over net investment income | | | $(8,023 | ) | | | $(5,088 | ) |
| |
| (a) | For the period from April 20, 2012 (commencement of operations) to August 31, 2012. |
The accompanying Notes to Financial Statements are an integral part of this statement.
| | |
| |
| | Active Portfolios® Multi-Manager Small Cap Equity Fund |
Statement of Changes in Net Assets (continued)
| | | | | | | | | | | | | | | | |
| | | Year ended August 31, 2013 | | | Year ended August 31, 2012(a) | |
| | | Shares | | | Dollars ($) | | | Shares | | | Dollars ($) | |
Capital stock activity | | | | | | | | | | | | | | | | |
| | | | |
Class A shares | | | | | | | | | | | | | | | | |
| | | | |
Subscriptions | | | 18,174,886 | | | | 207,600,076 | | | | 42,801,363 | | | | 430,642,561 | |
| | | | |
Distributions reinvested | | | 229,104 | | | | 2,318,528 | | | | — | | | | — | |
| | | | |
Redemptions | | | (13,881,945 | ) | | | (161,539,715 | ) | | | (2,496,364 | ) | | | (24,247,320 | ) |
| |
Net increase | | | 4,522,045 | | | | 48,378,889 | | | | 40,304,999 | | | | 406,395,241 | |
| |
Total net increase | | | 4,522,045 | | | | 48,378,889 | | | | 40,304,999 | | | | 406,395,241 | |
| |
| (a) | For the period from April 20, 2012 (commencement of operations) to August 31, 2012. |
The accompanying Notes to Financial Statements are an integral part of this statement.
| | |
| |
| Active Portfolios® Multi-Manager Small Cap Equity Fund | | |
Financial Highlights
The following table is intended to help you understand the Fund’s financial performance. Certain information reflects financial results for a single share of a class held for the periods shown. Per share net investment income (loss) amounts are calculated based on average shares outstanding during the period. Total return assumes reinvestment of all dividends and distributions, if any. Total return does not reflect payment of sales charges, if any, and is not annualized for periods of less than one year.
| | | | | | | | |
| | | Year ended August 31, | |
Class A | | | 2013 | | | | 2012(a) | |
Per share data | | | | | | | | |
Net asset value, beginning of period | | | $10.07 | | | | $10.00 | |
| | | | | | | | | |
Income from investment operations: | | | | | | | | |
| | |
Net investment income (loss) | | | 0.03 | | | | (0.01 | ) |
| | | | | | | | | |
Net realized and unrealized gain | | | 2.69 | | | | 0.08 | (b) |
| | | | | | | | | |
Total from investment operations | | | 2.72 | | | | 0.07 | |
| | | | | | | | | |
Less distributions to shareholders: | | | | | | | | |
| | |
Net investment income | | | (0.06 | ) | | | — | |
| | | | | | | | | |
Total distributions to shareholders | | | (0.06 | ) | | | — | |
| | | | | | | | | |
Net asset value, end of period | | | $12.73 | | | | $10.07 | |
| | | | | | | | | |
Total return | | | 27.11 | % | | | 0.70 | % |
| | | | | | | | | |
Ratios to average net assets(c) | | | | | | | | |
| | |
Total gross expenses | | | 1.63 | % | | | 1.77 | %(d) |
| | | | | | | | | |
Total net expenses(e) | | | 1.34 | % | | | 1.34 | %(d) |
| | | | | | | | | |
Net investment income (loss) | | | 0.30 | % | | | (0.21 | %)(d) |
| | | | | | | | | |
Supplemental data | | | | | | | | |
| | |
Net assets, end of period (in thousands) | | | $570,786 | | | | $405,992 | |
| | | | | | | | | |
Portfolio turnover | | | 97 | % | | | 26 | % |
| | | | | | | | | |
Notes to Financial Highlights
| (a) | For the period from April 20, 2012 (commencement of operations) to August 31, 2012. |
| (b) | Calculation of the net gain (loss) per share (both realized and unrealized) does not correlate to the aggregate realized and unrealized gain (loss) presented in the Statement of Operations due to the timing of sales and repurchases of Fund shares in relation to fluctuations in the market value of the portfolio. |
| (c) | In addition to the fees and expenses which the Fund bears directly, the Fund indirectly bears a pro rata share of the fees and expenses of the acquired funds in which it invests. Such indirect expenses are not included in the reported expense ratios. |
| (e) | Total net expenses include the impact of certain waivers/reimbursements made by the Investment Manager and certain of its affiliates, if applicable. |
The accompanying Notes to Financial Statements are an integral part of this statement.
| | |
| |
| | Active Portfolios® Multi-Manager Small Cap Equity Fund |
Notes to Financial Statements
August 31, 2013
Note 1. Organization
Active Portfolios Multi-Manager Small Cap Equity Fund (the Fund), a series of Columbia Funds Series Trust I (the Trust), is a diversified fund. The Trust is registered under the Investment Company Act of 1940, as amended (the 1940 Act), as an open-end management investment company organized as a Massachusetts business trust.
Fund Shares
The Trust may issue an unlimited number of shares (without par value). The Fund only offers Class A shares that are available only to certain eligible investors through certain wrap fee programs sponsored and/or managed by Ameriprise Financial or its affiliates.
Class A shares are not subject to any front-end sales charge or contingent deferred sales charge.
Note 2. Summary of Significant Accounting Policies
Use of Estimates
The preparation of financial statements in accordance with U.S. generally accepted accounting principles (GAAP) requires management to make certain estimates and assumptions that affect the reported amounts of assets and liabilities, the disclosure of contingent assets and liabilities at the date of the financial statements and the reported amounts of revenue and expenses during the reporting period. Actual results could differ from those estimates.
The following is a summary of significant accounting policies consistently followed by the Fund in the preparation of its financial statements.
Security Valuation
All equity securities and exchange traded funds (ETFs) are valued at the close of business of the New York Stock Exchange (NYSE). Equity securities and ETFs are valued at the last quoted sales price on the principal exchange or market on which they trade, except for securities traded on the NASDAQ Stock Market, which are valued at the NASDAQ official close price. Unlisted securities or listed securities for which there were no sales during the day are valued at the mean of the latest quoted bid and ask prices on such exchanges or markets.
Foreign equity securities are valued based on quotations from the principal market in which such securities are normally traded. If any foreign share prices are not readily available as a result of limited share activity the securities are valued at the mean of the latest quoted bid and ask prices on such
exchanges or markets. Foreign currency exchange rates are generally determined at 4:00 p.m. Eastern (U.S.) time. However, many securities markets and exchanges outside the U.S. close prior to the close of the NYSE; therefore, the closing prices for securities in such markets or on such exchanges may not fully reflect events that occur after such close but before the close of the NYSE. In those situations, foreign securities will be fair valued pursuant to the policy adopted by the Board of Trustees (the Board), including utilizing a third party pricing service to determine these fair values. The third party pricing service takes into account multiple factors, including, but not limited to, movements in the U.S. securities markets, certain depositary receipts, futures contracts and foreign exchange rates that have occurred subsequent to the close of the foreign exchange or market, to determine a good faith estimate that reasonably reflects the current market conditions as of the close of the NYSE. The fair value of a security is likely to be different from the quoted or published price, if available.
Investments in open-end investment companies, including money market funds, are valued at net asset value.
Investments for which market quotations are not readily available, or that have quotations which management believes are not reliable, are valued at fair value as determined in good faith under consistently applied procedures established by and under the general supervision of the Board. If a security or class of securities (such as foreign securities) is valued at fair value, such value is likely to be different from the last quoted market price for the security.
The determination of fair value often requires significant judgment. To determine fair value, management may use assumptions including but not limited to future cash flows and estimated risk premiums. Multiple inputs from various sources may be used to determine fair value.
Security Transactions
Security transactions are accounted for on the trade date. Cost is determined and gains (losses) are based upon the specific identification method for both financial statement and federal income tax purposes.
Income Recognition
Corporate actions and dividend income are generally recorded net of any non-reclaimable tax withholdings, on the ex-dividend date or upon receipt of ex-dividend notification in the case of certain foreign securities.
The Fund may receive distributions from holdings in business development companies (BDCs), exchange traded funds (ETFs) and real estate investment trusts (REITs), which report
| | |
| |
| Active Portfolios® Multi-Manager Small Cap Equity Fund | | |
Notes to Financial Statements (continued)
August 31, 2013
information on the character of their distributions annually. These distributions are allocated to dividend income, capital gain and return of capital based on estimates made by the Fund’s management if actual information has not yet been reported. Return of capital is recorded as a reduction of the cost basis of securities held. If the Fund no longer owns the applicable securities, return of capital is recorded as a realized gain. Management’s estimates are subsequently adjusted when the actual character of the distributions is disclosed by the BDCs, ETFs and REITs, which could result in a proportionate change in return of capital to shareholders.
The value of additional securities received as an income payment is recorded as income and increases the cost basis of such securities.
Expenses
General expenses of the Trust are allocated to the Fund and other funds of the Trust based upon relative net assets or other expense allocation methodologies determined by the nature of the expense. Expenses directly attributable to the Fund are charged to the Fund.
Federal Income Tax Status
The Fund intends to qualify each year as a regulated investment company under Subchapter M of the Internal Revenue Code, as amended, and will distribute substantially all of its taxable income (including net short-term capital gains), if any, for its tax year, and as such will not be subject to federal income taxes. In addition, the Fund intends to distribute in each calendar year substantially all of its net investment income, capital gains and certain other amounts, if any, such that the Fund should not be subject to federal excise tax. Therefore, no federal income or excise tax provision is recorded.
Foreign Taxes
The Fund may be subject to foreign taxes on income, gains on investments or currency repatriation, a portion of which may be recoverable. The Fund will accrue such taxes and recoveries, as applicable, based upon its current interpretation of tax rules and regulations that exist in the markets in which it invests.
Realized gains in certain countries may be subject to foreign taxes at the Fund level, based on statutory rates. The Fund accrues for such foreign taxes on realized and unrealized gains at the appropriate rate for each jurisdiction, as applicable. The amount, if any, is disclosed as a liability on the Statement of Assets and Liabilities.
Distributions to Shareholders
Distributions from net investment income, if any, are declared and paid annually. Net realized capital gains, if any, are distributed along with the income distribution. Income distributions and capital gain distributions are determined in accordance with federal income tax regulations, which may differ from GAAP.
Guarantees and Indemnifications
Under the Trust’s organizational documents and, in some cases, by contract, its officers and trustees are indemnified against certain liabilities arising out of the performance of their duties to the Trust or its funds. In addition, certain of the Fund’s contracts with its service providers contain general indemnification clauses. The Fund’s maximum exposure under these arrangements is unknown since the amount of any future claims that may be made against the Fund cannot be determined, and the Fund has no historical basis for predicting the likelihood of any such claims.
Recent Accounting Pronouncement
Disclosures about Offsetting Assets and Liabilities
In December 2011, the Financial Accounting Standards Board (FASB) issued Accounting Standards Update (ASU) No. 2011-11, Disclosures about Offsetting Assets and Liabilities and in January 2013, ASU No. 2013-1, Clarifying the Scope of Disclosures about Offsetting Assets and Liabilities (collectively, the ASUs). Specifically, the ASUs require an entity to disclose both gross and net information for derivatives and other financial instruments that are subject to a master netting arrangement or similar agreement. The ASUs require disclosure of collateral received in connection with the master netting agreements or similar agreements. The disclosure requirements are effective for interim and annual periods beginning on or after January 1, 2013. At this time, management is evaluating the implications of this guidance and the impact it will have on the financial statement amounts and footnote disclosures, if any.
Note 3. Fees and Compensation Paid to Affiliates
Investment Management Fees
Under an Investment Management Services Agreement, Columbia Management Investment Advisers, LLC (the Investment Manager), a wholly-owned subsidiary of Ameriprise Financial, Inc. (Ameriprise Financial), is responsible for the ultimate oversight of investments made by the Fund. The Fund’s subadviser (see Subadvisory Agreement below) has the primary responsibility for the day-to-day
| | |
| |
| | Active Portfolios® Multi-Manager Small Cap Equity Fund |
Notes to Financial Statements (continued)
August 31, 2013
portfolio management of the Fund. The investment management fee is an annual fee that is equal to a percentage of the Fund’s average daily net assets that declines from 0.90% to 0.80% as the Fund’s net assets increase. The effective investment management fee rate for the year ended August 31, 2013 was 0.87% of the Fund’s average daily net assets.
Subadvisory Agreements
The Investment Manager has entered into Subadvisory Agreements with Conestega Capital Advisors, LLC (Contestega), Dalton, Greiner, Hartman, Maher & Co., LLC (DGHM) and EAM Investors, LLC, each of which subadvises a portion of the assets of the Fund. In addition, Real Estate Management Services Group provides advisory services with respect to REITs in DGHM’s sleeve of investments. Effective October 1, 2012, Contestega replaced RS Investment Management Co. LLC (RS Investments) as the subadviser of the portion of the Fund for which RS Investments was responsible for day-to-day investment decisions. New investments in the Fund, net of any redemptions, are allocated in accordance with the Investment Manager’s determination, subject to the oversight of the Fund’s Board. Each subadviser’s proportionate share of investments in the Fund will vary due to market fluctuations. The Investment Manager compensates each subadviser to manage the investment of the Fund’s assets.
Administration Fees
Under an Administrative Services Agreement, the Investment Manager also serves as the Fund Administrator. The Fund pays the Fund Administrator an annual fee for administration and accounting services equal to a percentage of the Fund’s average daily net assets that declines from 0.08% to 0.05% as the Fund’s net assets increase. The effective administration fee rate for the year ended August 31, 2013 was 0.08% of the Fund’s average daily net assets.
Other Expenses
Other expenses also include offering costs which were incurred prior to the shares of the Fund being offered. Offering costs include, among other things, state registration filing fees and printing costs. The Fund amortizes offering costs over a period of 12 months from the commencement of operations.
Compensation of Board Members
Board members are compensated for their services to the Fund as disclosed in the Statement of Operations. The Trust’s eligible Trustees may participate in a Deferred Compensation Plan (the Plan) which may be terminated at any time. Obligations of the Plan will be paid solely out of the Fund’s assets.
Compensation of Chief Compliance Officer
The Board has appointed a Chief Compliance Officer to the Fund in accordance with federal securities regulations. The Fund pays its pro-rata share of the expenses associated with the Chief Compliance Officer. The Fund’s expenses for the Chief Compliance Officer will not exceed $15,000 per year.
Transfer Agent Fees
Under a Transfer and Dividend Disbursing Agent Agreement, Columbia Management Investment Services Corp. (the Transfer Agent), an affiliate of the Investment Manager and a wholly-owned subsidiary of Ameriprise Financial, is responsible for providing transfer agency services to the Fund. The Transfer Agent has contracted with Boston Financial Data Services (BFDS) to serve as sub-transfer agent.
The Transfer Agent receives monthly account-based service fees based on the number of open accounts and is reimbursed by the Fund for the fees and expenses the Transfer Agent pays to financial intermediaries that maintain omnibus accounts with the Fund that is a percentage of the average aggregate value of the Fund’s shares maintained in each such omnibus account (other than omnibus accounts for which American Enterprise Investment Services Inc. is the broker of record or accounts where the beneficial shareholder is a customer of Ameriprise Financial Services, Inc., which are paid a per account fee). The Transfer Agent pays the fees of BFDS for services as sub-transfer agent and is not entitled to reimbursement for such fees from the Fund (with the exception of out-of-pocket fees).
The Transfer Agent also receives compensation from fees for various shareholder services and reimbursements for certain out-of-pocket fees.
For the year ended August 31, 2013, the Fund’s effective transfer agent fee rate as a percentage of average daily net assets for Class A shares was 0.35%.
Distribution and Service Fees
The Fund has an agreement with Columbia Management Investment Distributors, Inc. (the Distributor), an affiliate of the Investment Manager and a wholly-owned subsidiary of Ameriprise Financial, for distribution and shareholder services. Pursuant to Rule 12b-1 under the 1940 Act, the Board has approved, and the Fund has adopted, distribution and shareholder service plans (the Plans) which set the distribution and service fees for the Fund. These fees are calculated daily and are intended to compensate the Distributor and/or eligible selling and/or servicing agents for selling shares of the Fund and providing services to investors.
The Fund may pay a distribution fee of up to 0.25% of the Fund’s average daily net assets attributable to Class A shares
| | |
| |
| Active Portfolios® Multi-Manager Small Cap Equity Fund | | |
Notes to Financial Statements (continued)
August 31, 2013
and a service fee of up to 0.25% of the Fund’s average daily net assets attributable to Class A shares, provided, however, that the aggregate fee shall not exceed 0.25% of the Fund’s average daily net assets attributable to Class A shares.
Expenses Waived/Reimbursed by the Investment Manager and its Affiliates
The Investment Manager and certain of its affiliates have contractually agreed to waive fees and/or reimburse expenses (excluding certain fees and expenses described below), through December 31, 2014, unless sooner terminated at the sole discretion of the Board, so that the Fund’s net operating expenses, after giving effect to fees waived/expenses reimbursed and any balance credits and/or overdraft charges from the Fund’s custodian, do not exceed the annual rate of 1.34% of Class A shares’ average daily net assets.
Under the agreement, the following fees and expenses are excluded from the waiver/reimbursement commitment, and therefore will be paid by the Fund, if applicable: taxes (including foreign transaction taxes), expenses associated with investments in affiliated and non-affiliated pooled investment vehicles (including mutual funds and exchange traded funds), transaction costs and brokerage commissions, costs related to any securities lending program, dividend expenses associated with securities sold short, inverse floater program fees and expenses, transaction charges and interest on borrowed money, interest, extraordinary expenses and any other expenses the exclusion of which is specifically approved by the Board. This agreement may be modified or amended only with approval from all parties.
Note 4. Federal Tax Information
The timing and character of income and capital gain distributions are determined in accordance with income tax regulations, which may differ from GAAP because of temporary or permanent book to tax differences.
At August 31, 2013, these differences are primarily due to differing treatment for deferral/reversal of wash sales losses, Trustees’ deferred compensation, non-deductible expenses and distribution reclassifications. To the extent these differences are permanent, reclassifications are made among the components of the Fund’s net assets in the Statement of Assets and Liabilities. Temporary differences do not require reclassifications. In the Statement of Assets and Liabilities the following reclassifications were made:
| | | | |
Excess of distributions over net investment income | | | $854,708 | |
Accumulated net realized gain | | | (854,708 | ) |
Paid-in capital | | | — | |
Net investment income and net realized gains (losses), as disclosed in the Statement of Operations, and net assets were not affected by this reclassification.
The tax character of distributions paid during the years indicated was as follows:
| | | | | | | | |
| | | Year Ended August 31, 2013 ($) | | | Year Ended
August 31,
2012 ($) | |
Ordinary income | | | 2,318,639 | | | | — | |
Total | | | 2,318,639 | | | | — | |
Short-term capital gain distributions, if any, are considered ordinary income distributions for tax purposes.
For the years ended August 31, 2012, there were no distributions.
At August 31, 2013, the components of distributable earnings on a tax basis were as follows:
| | | | |
Undistributed ordinary income | | | $14,785,519 | |
Undistributed accumulated long-term gain | | | $16,707,636 | |
Unrealized appreciation | | | $84,776,997 | |
At August 31, 2013, the cost of investments for federal income tax purposes was $485,816,102 and the aggregate gross unrealized appreciation and depreciation based on that cost was:
| | | | |
Unrealized appreciation | | | $94,958,243 | |
Unrealized depreciation | | | (10,181,246 | ) |
Net unrealized appreciation | | | $84,776,997 | |
For the year ended August 31, 2013, $6,663,530 of capital loss carryforward was utilized.
Management of the Fund has concluded that there are no significant uncertain tax positions that would require recognition in the financial statements. However, management’s conclusion may be subject to review and adjustment at a later date based on factors including, but not limited to, new tax laws, regulations, and administrative interpretations (including relevant court decisions). Generally, the Fund’s federal tax returns for the prior three fiscal years remain subject to examination by the Internal Revenue Service.
Note 5. Portfolio Information
The cost of purchases and proceeds from sales of securities, excluding short-term obligations, aggregated to $505,007,854 and $457,828,109, respectively, for the year ended August 31, 2013.
Note 6. Affiliated Money Market Fund
The Fund invests its daily cash balances in Columbia Short-Term Cash Fund, an affiliated money market fund established for the exclusive use by the Fund and other affiliated funds. The income earned by the Fund from such investments is
| | |
| |
| | Active Portfolios® Multi-Manager Small Cap Equity Fund |
Notes to Financial Statements (continued)
August 31, 2013
included as “Dividends — affiliated issuers” in the Statement of Operations. As an investing fund, the Fund indirectly bears its proportionate share of the expenses of Columbia Short-Term Cash Fund.
Note 7. Shareholder Concentration
At August 31, 2013, one affiliated shareholder account owned 100.0% of the outstanding shares of the Fund. Subscription and redemption activity by concentrated accounts may have a significant effect on the operations of the Fund.
Note 8. Line of Credit
The Fund has entered into a revolving credit facility with a syndicate of banks led by JPMorgan Chase Bank N.A. whereby the Fund may borrow for the temporary funding of shareholder redemptions or for other temporary or emergency purposes. The credit facility agreement, as amended, which is a collective agreement between the Fund and certain other funds managed by the Investment Manager, severally and not jointly, permits collective borrowings up to $500 million. Interest is charged to each participating fund based on its borrowings at a rate equal to the higher of (i) the overnight federal funds rate plus 1.00% or (ii) the one-month LIBOR rate plus 1.00%. Each borrowing under the credit facility matures no later than 60 days after the date of borrowing. The Fund also pays a commitment fee equal to its pro rata share of the amount of the credit facility at a rate of 0.08% per annum. The commitment fee is included in other expenses in the Statement of Operations.
The Fund had no borrowings during the year ended August 31, 2013.
Note 9. Significant Risks
Technology and Technology-related Investment Risk
The Fund invested a substantial portion of its assets in technology and technology-related companies. The market prices of technology and technology-related stocks tend to exhibit a greater degree of market risk and price volatility than other types of investments.
Note 10. Subsequent Events
Management has evaluated the events and transactions that have occurred through the date the financial statements were issued and noted no items requiring adjustment of the financial statements or additional disclosure.
Note 11. Information Regarding Pending and Settled Legal Proceedings
In December 2005, without admitting or denying the allegations, American Express Financial Corporation (AEFC,
which is now known as Ameriprise Financial, Inc. (Ameriprise Financial)) entered into settlement agreements with the Securities and Exchange Commission (SEC) and Minnesota Department of Commerce (MDOC) related to market timing activities. As a result, AEFC was censured and ordered to cease and desist from committing or causing any violations of certain provisions of the Investment Advisers Act of 1940, the Investment Company Act of 1940, and various Minnesota laws. AEFC agreed to pay disgorgement of $10 million and civil money penalties of $7 million. AEFC also agreed to retain an independent distribution consultant to assist in developing a plan for distribution of all disgorgement and civil penalties ordered by the SEC in accordance with various undertakings detailed at www.sec.gov/litigation/admin/ia-2451.pdf. Ameriprise Financial and its affiliates have cooperated with the SEC and the MDOC in these legal proceedings, and have made regular reports to the funds’ Boards of Trustees.
Ameriprise Financial and certain of its affiliates have historically been involved in a number of legal, arbitration and regulatory proceedings, including routine litigation, class actions, and governmental actions, concerning matters arising in connection with the conduct of their business activities. Ameriprise Financial believes that the Funds are not currently the subject of, and that neither Ameriprise Financial nor any of its affiliates are the subject of, any pending legal, arbitration or regulatory proceedings that are likely to have a material adverse effect on the Funds or the ability of Ameriprise Financial or its affiliates to perform under their contracts with the Funds. Ameriprise Financial is required to make 10-Q, 10-K and, as necessary, 8-K filings with the Securities and Exchange Commission on legal and regulatory matters that relate to Ameriprise Financial and its affiliates. Copies of these filings may be obtained by accessing the SEC website at www.sec.gov.
There can be no assurance that these matters, or the adverse publicity associated with them, will not result in increased fund redemptions, reduced sale of fund shares or other adverse consequences to the Funds. Further, although we believe proceedings are not likely to have a material adverse effect on the Funds or the ability of Ameriprise Financial or its affiliates to perform under their contracts with the Funds, these proceedings are subject to uncertainties and, as such, we are unable to estimate the possible loss or range of loss that may result. An adverse outcome in one or more of these proceedings could result in adverse judgments, settlements, fines, penalties or other relief that could have a material adverse effect on the consolidated financial condition or results of operations of Ameriprise Financial.
| | |
| |
| Active Portfolios® Multi-Manager Small Cap Equity Fund | | |
Report of Independent Registered Public Accounting Firm
To the Trustees of Columbia Funds Series Trust I and the Shareholders of Active Portfolios®
Multi-Manager Small Cap Equity Fund
In our opinion, the accompanying statement of assets and liabilities, including the portfolio of investments, and the related statements of operations and of changes in net assets and the financial highlights present fairly, in all material respects, the financial position of Active Portfolios® Multi-Manager Small Cap Equity Fund (the “Fund”) (a series of Columbia Funds Series Trust I) at August 31, 2013, the results of its operations, the changes in its net assets and the financial highlights for the periods indicated, in conformity with accounting principles generally accepted in the United States of America. These financial statements and financial highlights (hereafter referred to as “financial statements”) are the responsibility of the Fund’s management. Our responsibility is to express an opinion on these financial statements based on our audits. We conducted our audits of these financial statements in accordance with the standards of the Public Company Accounting Oversight Board (United States). Those standards require that we plan and perform the audit to obtain reasonable assurance about whether the financial statements are free of material misstatement. An audit includes examining, on a test basis, evidence supporting the amounts and disclosures in the financial statements, assessing the accounting principles used and significant estimates made by management, and evaluating the overall financial statement presentation. We believe that our audits, which included confirmation of securities at August 31, 2013 by correspondence with the custodian, brokers and transfer agent, provide a reasonable basis for our opinion.
PricewaterhouseCoopers LLP
Minneapolis, Minnesota
October 22, 2013
| | |
| |
| | Active Portfolios® Multi-Manager Small Cap Equity Fund |
Federal Income Tax Information
(Unaudited)
The Fund hereby designates the following tax attributes for the fiscal year ended August 31, 2013. Shareholders will be notified in early 2014 of the amounts for use in preparing 2013 income tax returns.
Tax Designations
| | | | |
| | | | | |
Qualified Dividend Income | | | 42.86 | % |
Dividends Received Deduction | | | 41.54 | % |
Capital Gain Dividend | | | $17,543,018 | |
Qualified Dividend Income. For taxable, non-corporate shareholders, the percentage of ordinary income dividends paid during the fiscal year that represents qualified dividend income subject to reduced tax rates.
Dividends Received Deduction. The percentage of ordinary income dividends paid during the fiscal year that qualifies for the corporate dividends received deduction.
Capital Gain Dividend. The Fund designates as a capital gain dividend the amount reflected above, or if subsequently determined to be different, the net capital gain of such fiscal period. The Fund also designates as capital gain dividends, to the extent necessary to fully distribute such capital gains, earnings and profits distributed to shareholders on the redemption of shares.
| | |
| |
| Active Portfolios® Multi-Manager Small Cap Equity Fund | | |
Trustees and Officers
The Trustees serve terms of indefinite duration. The names, addresses and birth years of the Trustees and Officers of the Funds in Columbia Funds Series Trust I, the year each was first elected or appointed to office, their principal business occupations during at least the last five years, the number of Funds overseen by each Trustee and other directorships they hold are shown below. Each officer listed below serves as an officer of each Fund in Columbia Funds Series Trust I.
| | |
| Independent Trustees |
Name, Address and Year of Birth, Position with Funds, Year First Elected or Appointed to Office | | Principal Occupation(s) During Past Five Years, Number of Funds in Columbia
Funds Complex Overseen by Trustee, Other Directorships Held |
Rodman L. Drake (Born 1943) c/o Columbia Management Investment Advisers, LLC 225 Franklin Street
Boston, MA 02110
Trustee (since 1994) and Chairman of the Board (since 2009) | | Independent consultant since 2010; Co-Founder of Baringo Capital LLC (private equity) from 1997 to 2008; Chairman (from 2003 to 2010) and CEO (from 2008 to 2010) of Crystal River Capital, Inc. (real estate investment trust); Oversees 52; Jackson Hewitt Tax Service Inc. (tax preparation services) from 2004 to 2011; Student Loan Corporation (student loan provider) from 2005 to 2010; Celgene Corporation (global biotechnology company); The Helios Funds and Brookfield Funds (closed-end funds); Chimerix, Inc. (biopharmaceutical company) since August 1, 2013; Crystal River Capital, Inc. from 2005 to 2010; Parsons Brinckerhoff from 1995 to 2008; and Apex Silver Mines Ltd. from 2007 to 2009 |
Douglas A. Hacker (Born 1955) c/o Columbia Management Investment Advisers, LLC 225 Franklin Street
Boston, MA 02110
Trustee (since 1996) | | Independent business executive since May 2006; Executive Vice President — Strategy of United Airlines from December 2002 to May 2006; President of UAL Loyalty Services (airline marketing company) from September 2001 to December 2002; Executive Vice President and Chief Financial Officer of United Airlines from July 1999 to September 2001. Oversees 52; Nash Finch Company (food distributor); Aircastle Limited (aircraft leasing); and SeaCube Container Leasing Ltd. (container leasing) |
Janet Langford Kelly (Born 1957) c/o Columbia Management Investment Advisers, LLC 225 Franklin Street
Boston, MA 02110
Trustee (since 1996) | | Senior Vice President, General Counsel and Corporate Secretary, ConocoPhillips (integrated energy company) since September 2007; Deputy General Counsel — Corporate Legal Services, ConocoPhillips from August 2006 to August 2007; Partner, Zelle, Hofmann, Voelbel, Mason & Gette LLP (law firm) from March 2005 to July 2006; Adjunct Professor of Law, Northwestern University from September 2004 to June 2006; Director, UAL Corporation (airline) from February 2006 to July 2006; Chief Administrative Officer and Senior Vice President, Kmart Holding Corporation (consumer goods) from September 2003 to March 2004. Oversees 52; None |
Nancy T. Lukitsh (Born 1956) c/o Columbia Management Investment Advisers, LLC
225 Franklin Street
Boston, MA 02110
Trustee (since 2011) | | Senior Vice President, Partner and Director of Marketing, Wellington Management Company, LLP (investment adviser) from 1997 to 2010; Chair, Wellington Management Investment Portfolios (commingled non-U.S. investment pools) from 2007 to 2010; Director, Wellington Trust Company, NA and other Wellington affiliates from 1997 to 2010. Oversees 52; None |
William E. Mayer (Born 1940) c/o Columbia Management Investment Advisers, LLC
225 Franklin Street
Boston, MA 02110
Trustee (since 1994) | | Partner, Park Avenue Equity Partners (private equity) since February 1999; Dean and Professor, College of Business and Management, University of Maryland from 1992 to 1996. Oversees 52; DynaVox Inc. (speech creation); Lee Enterprises (print media); WR Hambrecht + Co. (financial service provider) from 2000 to 2012; BlackRock Kelso Capital Corporation (investment company) |
David M. Moffett (Born 1952) c/o Columbia Management Investment Advisers, LLC
225 Franklin Street
Boston, MA 02110
Trustee (since 2011) | | Retired. Chief Executive Officer, Federal Home Loan Mortgage Corporation, from 2008 to 2009; Senior Adviser, Global Financial Services Group, Carlyle Group, Inc., from 2007 to 2008; Vice Chairman and Chief Financial Officer, U.S. Bancorp, from 1993 to 2007. Oversees 52; CIT Group Inc. (commercial and consumer finance); eBay Inc. (online trading community); MBIA Inc. (financial service provider); E.W. Scripps Co. (print and television media), Building Materials Holding Corp. (building materials and construction services); Genworth Financial, Inc. (financial and insurance products and services); and University of Oklahoma Foundation |
Charles R. Nelson (Born 1942) c/o Columbia Management Investment Advisers, LLC
225 Franklin Street
Boston, MA 02110
Trustee (since 1981) | | Retired. Professor Emeritus, University of Washington, since 2011; Professor of Economics, University of Washington from 1976 to 2011; Ford and Louisa Van Voorhis Professor of Political Economy, University of Washington from 1993 to 2011; Adjunct Professor of Statistics, University of Washington from 1980 to 2011; Associate Editor, Journal of Money, Credit and Banking from September 1993 to 2008; consultant on econometric and statistical matters. Oversees 52; None |
John J. Neuhauser (Born 1943) c/o Columbia Management Investment Advisers, LLC
225 Franklin Street
Boston, MA 02110
Trustee (since 1984) | | President, Saint Michael’s College, since August 2007; Director or Trustee of several non-profit organizations, including Fletcher Allen Health Care, Inc.; University Professor, Boston College from November 2005 to August 2007; Academic Vice President and Dean of Faculties, Boston College from August 1999 to October 2005. Oversees 52; Liberty All-Star Equity Fund and Liberty All-Star Growth Fund (closed-end funds) |
| | |
| |
| | Active Portfolios® Multi-Manager Small Cap Equity Fund |
Trustees and Officers (continued)
| | |
| Independent Trustees (continued) |
Name, Address and Year of Birth, Position with Funds, Year First Elected or Appointed to Office | | Principal Occupation(s) During Past Five Years, Number of Funds in Columbia
Funds Complex Overseen by Trustee, Other Directorships Held |
Patrick J. Simpson (Born 1944) c/o Columbia Management Investment Advisers, LLC
225 Franklin Street
Boston, MA 02110
Trustee (since 2000) | | Partner, Perkins Coie LLP (law firm). Oversees 52; None |
Anne-Lee Verville (Born 1945) c/o Columbia Management Investment Advisers, LLC
225 Franklin Street
Boston, MA 02110
Trustee (since 1998) | | Retired. General Manager — Global Education Industry from 1994 to 1997, President — Application Systems Division from 1991 to 1994, Chief Financial Officer — US Marketing & Services from 1988 to 1991, and Chief Information Officer from 1987 to 1988, IBM Corporation (computer and technology). Oversees 52; Enesco Group, Inc. (producer of giftware and home and garden decor products) from 2001 to 2006 |
| | |
| Interested Trustee | | |
Name, Address and Year of Birth, Position with Funds, Year First Elected or Appointed to Office | | Principal Occupation(s) During Past Five Years, Number of Funds in Columbia
Funds Complex Overseen by Trustee, Other Directorships Held |
William F. Truscott (Born 1960) 53600 Ameriprise Financial Center Minneapolis, MN 55474
Senior Vice President (since 2012) | | Chairman of the Board and President, Columbia Management Investment Advisers, LLC since May 2010 and February 2012 (previously President and Chief Investment Officer, from 2001 to April 2010); Chief Executive Officer, Global Asset Management, Ameriprise Financial, Inc. since September 2012 (previously, Chief Executive Officer, U.S. Asset Management & President, Annuities, from May 2010 to September 2012 and President — U.S. Asset Management and Chief Investment Officer from 2005 to April 2010); Director and Chief Executive Officer, Columbia Management Investment Distributors, Inc. since May 2010 and February 2012, respectively (previously Chairman of the Board and Chief Executive Officer from 2006 to April 2010); Chairman of the Board and Chief Executive Officer, RiverSource Distributors, Inc. since 2006; President and Chief Executive Officer, Ameriprise Certificate Company, 2006 to August 2012; Oversees 184; Director, Ameriprise Certificate Company, 2006-January 2013 |
The Statement of Additional Information includes additional information about the Trustees of the Funds and is available, without charge, upon request by calling 800.345.6611.
The Board has appointed officers who are responsible for day-to-day business decisions based on policies it has established. The officers serve at the pleasure of the Board. In addition to Mr. Truscott, who is Senior Vice President, the Funds’ other officers are:
| | |
| Officers |
Name, Year of Birth and Address | | Principal Occupation(s) During the Past Five Years |
J. Kevin Connaughton (Born 1964) 225 Franklin Street
Boston, MA 02110
President (since 2009) | | Senior Vice President and General Manager — Mutual Fund Products, Columbia Management Investment Advisers, LLC since May 2010; President, Columbia Funds since 2009 and RiverSource Funds since May 2010; Managing Director, Columbia Management Advisors, LLC, December 2004- April 2010; Senior Vice President and Chief Financial Officer, Columbia Funds, June 2008-January 2009; Treasurer, Columbia Funds, October 2003-May 2008; and senior officer of various other affiliated funds since 2000 |
Amy Johnson (Born 1965)
5228 Ameriprise Financial Center Minneapolis, MN 55474
Vice President (since 2010) | | Senior Vice President and Chief Operating Officer, Columbia Management Investment Advisers, LLC since May 2010 (previously Chief Administrative Officer, from 2009-April 2010, Vice President — Asset Management and Trust Company Services, from 2006-2009) |
Michael G. Clarke (Born 1969)
225 Franklin Street
Boston, MA 02110
Treasurer (since 2011) and
Chief Financial Officer (since 2009) | | Vice President, Columbia Management Investment Advisers, LLC since May 2010; Managing Director of Fund Administration, Columbia Management Advisors, LLC, September 2004-April 2010; senior officer of Columbia Funds and affiliated funds since 2002 |
Scott R. Plummer (Born 1959) 5228 Ameriprise Financial Center Minneapolis, MN 55474
Senior Vice President, Assistant Secretary and Chief Legal Officer (since 2010) | | Senior Vice President, Chief Legal Officer and Assistant Secretary, Columbia Management Investment Advisers, LLC since June 2005; Senior Vice President and Lead Chief Counsel — Asset Management, Ameriprise Financial, Inc. since May 2010 (previously Vice President and Chief Counsel — Asset Management, 2005-April 2010); Vice President, Chief Counsel and Assistant Secretary, Columbia Management Investment Distributors, Inc. since 2008; Vice President, General Counsel and Secretary, Ameriprise Certificate Company since 2005; Chief Counsel, RiverSource Distributors, Inc. since 2006; senior officer of Columbia Funds and affiliated funds since 2010 |
| | |
| |
| Active Portfolios® Multi-Manager Small Cap Equity Fund | | |
Trustees and Officers (continued)
| | |
| Officers (continued) |
Name, Year of Birth and Address | | Principal Occupation(s) During the Past Five Years |
Colin Moore (Born 1958)
225 Franklin Street
Boston, MA 02110
Senior Vice President (since 2010) | | Executive Vice President and Global Chief Investment Officer, Ameriprise Financial, Inc. since July 2013; Director and Global Chief Investment Officer, Columbia Management Investment Advisers, LLC since May 2010; Manager, Managing Director and Chief Investment Officer of Columbia Management Advisors, LLC, 2007-April 2010 |
Thomas P. McGuire (Born 1972)
225 Franklin Street
Boston, MA 02110
Chief Compliance Officer
(since 2012) | | Vice President — Asset Management Compliance, Columbia Management Investment Advisers, LLC since 2010; Chief Compliance Officer, Ameriprise Certificate Company, since September 2010; Compliance Executive, Bank of America, N.A. 2005-2010 |
Stephen T. Welsh (Born 1957)
225 Franklin Street
Boston, MA 02110
Vice President (since 2006) | | President and Director, Columbia Management Investment Services Corp. since May 2010; President and Director, Columbia Management Services, Inc., July 2004-April 2010; Managing Director, Columbia Management Distributors, Inc., August 2007-April 2010 |
Christopher O. Petersen (Born 1970)
5228 Ameriprise Financial Center
Minneapolis, MN 55474
Vice President (since 2010) and
Secretary (since 2011) | | Vice President and Chief Counsel, Ameriprise Financial, Inc. since January 2010 (formerly Vice President and Group Counsel or Counsel, April 2004-January 2010); Assistant Secretary of Columbia Funds, January 2007-April 2011 |
Paul D. Pearson (Born 1956)
10468 Ameriprise Financial Center
Minneapolis, MN 55474
Vice President and Assistant
Treasurer (since 2011) | | Vice President, Investment Accounting, Columbia Management Investment Advisers, LLC, since May 2010; Vice President — Managed Assets, Investment Accounting, Ameriprise Financial, Inc., February 1998-May 2010 |
Joseph F. DiMaria (Born 1968)
225 Franklin Street
Boston, MA 02110
Vice President (since 2011) and
Chief Accounting Officer
(since 2008) | | Vice President, Mutual Fund Administration, Columbia Management Investment Advisers, LLC, since May 2010; Director of Fund Administration, Columbia Management Advisors, LLC, January 2006- April 2010 |
Paul B. Goucher (Born 1968)
100 Park Avenue
New York, NY 10017
Vice President and Assistant
Secretary (since 2010) | | Vice President and Lead Chief Counsel, Ameriprise Financial, Inc. since November 2008 and January 2013, respectively (formerly, Chief Counsel from January 2010-January 2013 and Group Counsel from November 2008-January 2010); Director, Managing Director and General Counsel, J. & W. Seligman & Co. Incorporated, July 2008-November 2008 (previously, Managing Director and Associate General Counsel, January 2005-July 2008) |
Michael E. DeFao (Born 1968)
225 Franklin Street
Boston, MA 02110
Vice President and Assistant
Secretary (since 2011) | | Vice President and Chief Counsel, Ameriprise Financial, Inc. since May 2010; Associate General Counsel, Bank of America, N.A. June 2005-April 2010 |
| | |
| |
| | Active Portfolios® Multi-Manager Small Cap Equity Fund |
Board Consideration and Approval of Advisory Agreement and Subadvisory Agreements
On June 14, 2013, the Board of Trustees (the “Board”) and the Trustees who are not interested persons (as defined in the Investment Company Act of 1940) of the Trust (the “Independent Trustees”) unanimously approved the continuation of the Investment Management Services Agreement (the “Advisory Agreement”) with Columbia Management Investment Advisers, LLC (the “Investment Manager”) and the Subadvisory Agreements (the “Subadvisory Agreements”) between the Investment Manager and Dalton, Greiner, Hartman, Maher & Co., LLC, EAM Investors, LLC and Conestoga Capital Advisors, LLC (the “Subadvisers”) with respect to Active Portfolios Multi-Manager Small Cap Equity Fund (the “Fund”), a series of the Trust. As detailed below, the Advisory Fees and Expenses Committee (the “Committee”) and the Board met on multiple occasions to review and discuss, both among themselves and with the management team of the Investment Manager, materials provided by the Investment Manager before determining to approve the continuation of the Advisory Agreement and the Subadvisory Agreements (collectively, the “Agreements”).
In connection with their deliberations regarding the continuation of the Agreements, the Committee and the Board evaluated materials requested from the Investment Manager regarding the Fund and the Agreements, and discussed these materials with representatives of the Investment Manager at Committee meetings held on March 5, 2013, April 24, 2013 and June 13, 2013, and at the Board meeting held on June 14, 2013. In addition, the Board considers matters bearing on the Agreements at most of its other meetings throughout the year and meets regularly with senior management of the Funds and the Investment Manager. Through the Board’s Investment Oversight Committees, Trustees also meet with selected Fund portfolio managers and other investment personnel at various times throughout the year. The Committee and the Board also consulted with Fund counsel and with the Independent Trustees’ independent legal counsel, who advised on various matters with respect to the Committee’s and the Board’s considerations and otherwise assisted the Committee and the Board in their deliberations. On June 13, 2013, the Committee recommended that the Board approve the continuation of the Agreements. On June 14, 2013, the Board, including the Independent Trustees, voting separately, unanimously approved the continuation of the Agreements for the Fund.
The Committee and the Board considered all information that they, their legal counsel, or the Investment Manager believed reasonably necessary to evaluate and to determine whether to approve the continuation of the Agreements. The information and factors considered by the Committee and the Board in recommending for approval or approving the continuation of the Agreements for the Fund included the following:
| • | | Information on the investment performance of the Fund from the date of its inception through December 31, 2012, including performance relative to a group of mutual funds determined to be comparable to the Fund by an independent third party data provider, as well as performance relative to benchmarks; |
| • | | Information on the Fund’s advisory fees and total expenses, including information comparing the Fund’s expenses to those of a group of comparable mutual funds, as determined by the independent third-party data provider; |
| • | | The Investment Manager’s agreement to contractually limit or cap total operating expenses for the Fund so that total operating expenses (excluding certain fees and expenses, such as transaction costs and certain other investment related expenses, interest, taxes, acquired fund fees and expenses, and extraordinary expenses) would not exceed the median expenses of a group of comparable funds (as determined from time to time, generally annually, by the independent third-party data provider); |
| • | | The terms and conditions of the Agreements; |
| • | | The terms and conditions of other agreements and arrangements with affiliates of the Investment Manager relating to the operations of the Fund, including the Administrative Services Agreement, the Distribution Agreement and the Transfer and Dividend Disbursing Agent Agreement; |
| • | | Descriptions of various functions performed by the Investment Manager and the Subadvisers under the Agreements, including portfolio management and portfolio trading practices; |
| • | | Information regarding the management fees and investment performance of comparable portfolios of other clients of the Investment Manager, including institutional separate accounts; |
| • | | Information regarding the reputation, regulatory history and resources of the Investment Manager and the Subadvisers, including information regarding senior management, portfolio managers and other personnel; |
| | |
| |
| Active Portfolios® Multi-Manager Small Cap Equity Fund | | |
Board Consideration and Approval of Advisory Agreement and Subadvisory Agreements (continued)
| • | | Information regarding the capabilities of the Investment Manager and the Subadvisers with respect to compliance monitoring services, including an assessment of the Investment Manager’s and the Subadvisers’ compliance system by the Fund’s Chief Compliance Officer; and |
| • | | The profitability to the Investment Manager and its affiliates from their relationships with the Fund. |
Nature, Extent and Quality of Services Provided under the Agreements
The Committee and the Board considered the nature, extent and quality of services provided to the Fund by the Investment Manager and the Subadvisers and the Investment Manager’s affiliates under the Agreements and under separate agreements for the provision of transfer agency and administrative services, and the resources dedicated to the Fund and the other Columbia Funds by the Investment Manager and the Subadvisers and the Investment Manager’s affiliates. The Committee and the Board considered, among other things, the Investment Manager’s ability to attract, motivate and retain highly qualified research, advisory and supervisory investment professionals (including personnel and other resources, compensation programs for personnel involved in fund management, reputation and other attributes), the portfolio management services provided by those investment professionals, and the quality of the Investment Manager’s investment research capabilities and trade execution services. The Committee and the Board also considered the potential benefits to shareholders of investing in a mutual fund that is part of a fund complex offering exposure to a variety of asset classes and investment disciplines and providing a variety of fund and shareholder services.
The Committee and the Board also considered the professional experience and qualifications of the senior personnel of the Investment Manager and the Subadvisers, which included consideration of the Investment Manager’s and the Subadvisers’ experience with similarly-structured funds. The Committee and the Board noted the compliance programs of and the compliance-related resources provided to the Fund by the Investment Manager and its affiliates, and considered the Investment Manager’s ability to provide administrative services to the Fund pursuant to a separate Administrative Services Agreement, including the Investment Manager’s ability to coordinate the activities of the Fund’s other service providers. The Committee and the Board also noted that the Board had approved each Subadvisers’ code of ethics and compliance program, and that the Chief Compliance Officer of the Funds monitors each code of ethics and compliance program.
The Committee and the Board considered the diligence and selection process undertaken to select the Subadvisers, including the Investment Manager’s rationale for recommending approval of the Subadvisory Agreements, and the process for monitoring the Subadvisers’ ongoing performance of services for the Fund. As part of these deliberations, the Committee and the Board considered the ability of the Investment Manager, subject to the approval of the Board, to modify or enter into new Subadvisory Agreements without a shareholder vote pursuant to an exemptive order of the Securities and Exchange Commission. The Committee and the Board also considered the scope of services provided to the Fund by the Investment Manager that are distinct from and in addition to those provided by the Subadvisers, including cash flow management, treasury services, risk oversight, investment oversight and Subadvisers selection, oversight and transition management. After reviewing these and related factors, the Committee and the Board concluded, within the context of their overall conclusions, that the nature, extent and quality of the services provided to the Fund under the Agreements supported the continuation of the Agreements.
Investment Performance
The Committee and the Board reviewed information about the performance of the Fund from its date of inception through December 31, 2012, including performance information relative to benchmarks and information based on reports of the independent third-party data provider that compared the performance of the Fund to the performance of a group of comparable mutual funds. Because the Fund did not have a complete year of performance from its date of inception, the Committee and the Board did not have information regarding the percentile ranking of the Fund’s performance relative to the returns of a group of comparable funds. However, the Committee and the Board expected to consider, in connection with their next review and consideration of the continuation of the Agreements, the investment performance of the Fund in relation to the annualized return for various time periods of both a group of comparable funds, as determined by the independent third party data provider, and a benchmark.
The Committee and the Board also considered the Investment Manager’s and Subadvisers’ performance and reputation generally, the Investment Manager’s historical responsiveness to Board concerns about performance, and the Investment Manager’s willingness to take steps intended to improve performance. After reviewing these and related factors, the Committee and the
| | |
| |
| | Active Portfolios® Multi-Manager Small Cap Equity Fund |
Board Consideration and Approval of Advisory Agreement and Subadvisory Agreements (continued)
Board concluded, within the context of their overall conclusions, that the performance of the Fund, the Investment Manager and the Subadvisers supported the continuation of the Agreements.
Investment Advisory Fee Rates and Other Expenses
The Committee and the Board considered the advisory fees charged to the Fund under the Agreements, as well as the total expenses incurred by the Fund. In assessing the reasonableness of the fees under the Advisory Agreement, the Committee and the Board considered, among other information, the Fund’s advisory fee and its total expense ratio as a percentage of average daily net assets. The Committee and the Board noted that the Fund’s actual management fee and total/net expense ratio are both ranked in the second quintile (where the lowest fees and expenses would be in the first quintile) against the Fund’s expense universe as determined by the independent third-party data provider for purposes of expense comparison. The Committee and the Board also noted that the Investment Manager pays the fees of the Subadvisers. The Committee and the Board also took into account the fee waiver and expense limitation arrangements agreed to by the Investment Manager, as noted above.
The Committee and the Board also received and considered information about the advisory fees charged by the Investment Manager to institutional separate accounts. In considering the fees charged to those accounts, the Committee and the Board took into account, among other things, the Investment Manager’s representations about the differences between managing mutual funds as compared to other types of accounts, including differences in the services provided, differences in the risk profile of such business for the Investment Manager and the additional resources required to manage mutual funds effectively. In evaluating the Fund’s advisory fees, the Committee and the Board also took into account the demands, complexity and quality of the investment management of the Fund.
After reviewing these and related factors, the Committee and the Board concluded, within the context of their overall conclusions, that the advisory fee rates and expenses of the Fund supported the continuation of the Agreements.
Costs of Services Provided and Profitability
The Committee and the Board also took note of the costs of the services provided (both on an absolute and relative basis) and the profitability to the Investment Manager and its affiliates in connection with their relationships with the Fund. In evaluating these considerations, the Committee and the Board took note of the advisory fees charged by the Investment Manager to other clients, including fees charged by the Investment Manager to institutional separate account clients with similar investment strategies to those of the Fund.
The Committee and the Board also considered the compensation directly or indirectly received by the Investment Manager’s affiliates in connection with their relationships with the Fund. The Committee and the Board reviewed information provided by management as to the profitability of the Investment Manager and its affiliates of their relationships with the Fund, information about the allocation of expenses used to calculate profitability, and comparisons of profitability levels realized in 2012 to profitability levels realized in 2011. When reviewing profitability, the Committee and the Board also considered court cases in which adviser profitability was an issue in whole or in part, the performance of the Fund, the expense ratio of the Fund, and the implementation of expense limitations with respect to the Fund. The Committee and the Board also considered information provided by the Investment Manager regarding its financial condition and comparing its profitability to that of other asset management firms that are, or are subsidiaries of, publicly traded companies. Because the Subadvisory Agreements were negotiated at arms-length by the Investment Manager, which is responsible for payments to the Subadvisers thereunder, the Committee and the Board did not consider the profitability to the Subadvisers of its relationship with the Fund.
After reviewing these and related factors, the Committee and the Board concluded, within the context of their overall conclusions, that the costs of services provided and the profitability to the Investment Manager and its affiliates from their relationships with the Fund supported the continuation of the Agreements.
Economies of Scale
The Committee and the Board considered the potential existence of economies of scale in the provision by the Investment Manager and the Subadvisers of services to the Fund, to groups of related funds, and to the Investment Manager’s and the Subadvisers’ investment advisory clients as a whole, and whether those economies of scale were shared with the Fund through breakpoints in investment advisory fees or other means, such as expense limitation arrangements and additional investments by the Investment Manager and/or the Subadvisers in investment, trading and compliance resources. The Committee and the Board
| | |
| |
| Active Portfolios® Multi-Manager Small Cap Equity Fund | | |
Board Consideration and Approval of Advisory Agreement and Subadvisory Agreements (continued)
noted that the investment advisory fee schedules for the Fund contained breakpoints that would reduce the fee rate on assets above specified threshold levels.
The Committee and the Board noted that the breakpoints in the Advisory Agreement did not occur at the same levels as the breakpoints in the Subadvisory Agreements. The Committee and the Board noted that absent a shareholder vote, the Investment Manager would bear any increase in fees payable under the Subadvisory Agreements. The Committee and the Board also noted the potential challenges of seeking to tailor the Advisory Agreement breakpoints to those of a Subadvisory Agreements in this context, and the effect that capacity constraints on a subadviser’s ability to manage assets could potentially have on the ability of the Investment Manager to achieve economies of scale, as new subadvisers might need to be added as the Fund grows, increasing the Investment Manager’s cost of compensating and overseeing the Fund’s subadvisers.
In considering these matters, the Committee and the Board also considered the costs of the services provided and the profitability to the Investment Manager and its affiliates from their relationships with the Fund, as discussed above. After reviewing these and related factors, the Committee and the Board concluded, within the context of their overall conclusions, that the extent to which any economies of scale were expected to be shared with the Fund supported the continuation of the Agreements.
Other Benefits to the Investment Manager
The Committee and the Board received and considered information regarding “fall-out” or ancillary benefits received by the Investment Manager and its affiliates as a result of their relationships with the Fund, such as the engagement of the Investment Manager to provide administrative services to the Fund and the engagement of the Investment Manager’s affiliates to provide distribution and transfer agency services to the Fund. The Committee and the Board considered that the Fund’s distributor retains a portion of the distribution fees from the Fund and receives a portion of the sales charges on sales or redemptions of certain classes of shares of the Fund. The Committee and the Board also considered the benefits of research made available to the Investment Manager by reason of brokerage commissions generated by the Fund’s securities transactions, and reviewed information about the Investment Manager’s practices with respect to allocating portfolio transactions for brokerage and research services. The Committee and the Board considered the possible conflicts of interest associated with certain fall-out or other ancillary benefits and the reporting, disclosure and other processes that are in place to address such possible conflicts of interest. The Committee and the Board recognized that the Investment Manager’s profitability would be somewhat lower without these benefits.
Conclusion
The Committee and the Board reviewed all of the above considerations in reaching their decisions to recommend or approve the continuation of the Agreements. In their deliberations, the Trustees did not identify any particular information that was all-important or controlling, and individual Trustees may have attributed different weights to the various factors. Based on their evaluation of all factors that they deemed to be material, including those factors described above, and assisted by the advice of independent legal counsel, the Board, including the Independent Trustees, voting separately, unanimously approved the continuation of the Agreements.
| | |
| |
| | Active Portfolios® Multi-Manager Small Cap Equity Fund |
[THIS PAGE INTENTIONALLY LEFT BLANK]
| | |
| |
| Active Portfolios® Multi-Manager Small Cap Equity Fund | | |
Important Information About This Report
Each fund mails one shareholder report to each shareholder address. If you would like more than one report, please call shareholder services at 800.345.6611 and additional reports will be sent to you.
The policy of the Board is to vote the proxies of the companies in which each fund holds investments consistent with the procedures as stated in the Statement of Additional Information (SAI). You may obtain a copy of the SAI without charge by calling 800.345.6611; contacting your financial intermediary; visiting columbiamanagement.com; or searching the website of the Securities and Exchange Commission (SEC) at sec.gov. Information regarding how each fund voted proxies relating to portfolio securities is filed with the SEC by August 31 for the most recent 12-month period ending June 30 of that year, and is available without charge by visiting columbiamanagement.com; or searching the website of the SEC at sec.gov.
Each fund files a complete schedule of portfolio holdings with the SEC for the first and third quarters of each fiscal year on Form N-Q. Each fund’s Form N-Q is available on the SEC’s website at sec.gov and may be reviewed and copied at the SEC’s Public Reference Room in Washington, D.C. Information on the operation of the Public Reference Room may be obtained by calling 800.SEC.0330. Each fund’s complete schedule of portfolio holdings, as filed on Form N-Q, can also be obtained without charge, upon request, by calling 800.345.6611.

Active Portfolios® Multi-Manager Small Cap Equity Fund
P.O. Box 8081
Boston, MA 02266-8081
columbiamanagement.com
This information is for use with concurrent or prior delivery of a fund prospectus. Please read and consider the investment objectives, risks, charges and expenses for any fund carefully before investing. For a prospectus which contains this and other important information about the Fund, go to columbiamanagement.com. The Fund is distributed by Columbia Management Investment Distributors, Inc., member FINRA, and managed by Columbia Management Investment Advisers, LLC.
© 2013 Columbia Management Investment Advisers, LLC. All rights reserved.
ANN102_08_C01_(10/13)
Item 2. Code of Ethics.
(a) The registrant has adopted a code of ethics that applies to the registrant’s principal executive officer, principal financial officer, principal accounting officer or controller, or persons performing similar functions, regardless of whether these individuals are employed by the registrant or a third party.
(b) During the period covered by this report, there were not any amendments to a provision of the code of ethics adopted in 2(a) above.
(c) During the period covered by this report, there were no waivers, including any implicit waivers, from a provision of the code of ethics described in 2(a) above that relates to one or more of the items set forth in paragraph (b) of this item’s instructions.
Item 3. Audit Committee Financial Expert.
The registrant’s Board of Trustees has determined that Douglas A. Hacker, David M. Moffett and Anne-Lee Verville, each of whom are members of the registrant’s Board of Trustees and Audit Committee, each qualify as an audit committee financial expert. Mr. Hacker, Mr. Moffett and Ms. Verville are each independent trustees, as defined in paragraph (a)(2) of this item’s instructions.
Item 4. Principal Accountant Fees and Services.
Fee information below is disclosed for the fourteen series of the registrant whose reports to stockholders are included in this annual filing. In addition, a fifteenth series merged away on March 15, 2013 and the fees incurred by that series through its merger date are included in the response to this Item.
(a) Audit Fees. Aggregate Audit Fees billed by the principal accountant for professional services rendered during the fiscal years ended August 31, 2013 and August 31, 2012 are approximately as follows:
2013 | | 2012 | |
$ | 313,900 | | $ | 247,000 | |
| | | | | |
Audit Fees include amounts related to the audit of the registrant’s annual financial statements or services that are normally provided by the accountant in connection with statutory and regulatory filings or engagements for those fiscal years. Fiscal years 2013 and 2012 also include audit fees for the review and provision of consent in connection with filing Form N-1A for new funds and new share classes and Form N-14 for fund mergers.
(b) Audit-Related Fees. Aggregate Audit-Related Fees billed to the registrant by the principal accountant for professional services rendered during the fiscal years ended August 31, 2013 and August 31, 2012 are approximately as follows:
Audit-Related Fees include amounts for assurance and related services by the principal accountant that are reasonably related to the performance of the audit of the registrant’s financial statements and are not reported in Audit Fees above. In fiscal years 2013 and 2012, Audit-Related Fees consist of agreed-upon procedures performed for semi-annual shareholder reports. Fiscal year 2013 includes Audit-Related Fees for agreed-upon procedures related to fund mergers.
During the fiscal years ended August 31, 2013 and August 31, 2012, there were no Audit-Related Fees billed by the registrant’s principal accountant to the registrant’s investment adviser (not including any sub-adviser whose role is primarily portfolio management and is subcontracted with or overseen by another investment adviser) and any entity controlling, controlled by, or under common control with the adviser that provides ongoing services to the registrant for an engagement that related directly to the operations and financial reporting of the registrant.
(c) Tax Fees. Aggregate Tax Fees billed by the principal accountant to the registrant for professional services rendered during the fiscal years ended August 31, 2013 and August 31, 2012 are approximately as follows:
2013 | | 2012 | |
$ | 82,700 | | $ | 44,600 | |
| | | | | |
Tax Fees include amounts for the review of annual tax returns, the review of required shareholder distribution calculations and typically include amounts for professional services by the principal accountant for tax compliance, tax advice and tax planning. Fiscal year 2013 also includes Tax Fees for agreed-upon procedures for a fund merger and the review of a final tax return. Fiscal years 2013 and 2012 also include Tax Fees for the review of foreign tax filings.
During the fiscal years ended August 31, 2013 and August 31, 2012, there were no Tax Fees billed by the registrant’s principal accountant to the registrant’s investment adviser (not including any sub-adviser whose role is primarily portfolio management and is
subcontracted with or overseen by another investment adviser) and any entity controlling, controlled by, or under common control with the adviser that provides ongoing services to the registrant for an engagement that related directly to the operations and financial reporting of the registrant.
(d) All Other Fees. Aggregate All Other Fees billed by the principal accountant to the registrant for professional services rendered during the fiscal years ended August 31, 2013 and August 31, 2012 are approximately as follows:
All Other Fees include amounts for products and services provided by the principal accountant, other than the services reported in paragraphs (a) through (c) above.
Aggregate All Other Fees billed by the registrant’s principal accountant to the registrant’s investment adviser (not including any sub-adviser whose role is primarily portfolio management and is subcontracted with or overseen by another investment adviser) and any entity controlling, controlled by, or under common control with the adviser that provides ongoing services to the registrant for an engagement that related directly to the operations and financial reporting of the registrant during the fiscal years ended August 31, 2013 and August 31, 2012 are approximately as follows:
2013 | | 2012 | |
$ | 251,500 | | $ | 395,800 | |
| | | | | |
In fiscal years 2013 and 2012, All Other Fees consist of fees billed for internal control examinations of the registrant’s transfer agent and investment advisor. Fiscal year 2013 also includes fees billed for the preparation of tax returns and the review and provision of consent in connection with filing Form N-14 for fund mergers.
(e)(1) Audit Committee Pre-Approval Policies and Procedures
The registrant’s Audit Committee is required to pre-approve the engagement of the registrant’s independent auditors to provide audit and non-audit services to the registrant and non-audit services to its investment adviser (excluding any sub-adviser whose role is primarily portfolio management and is sub-contracted or overseen by another investment adviser (the “Adviser”) or any entity controlling, controlled by or under common control with the Adviser that provides ongoing services to the Fund (a “Control Affiliate”) if the engagement relates directly to the operations and financial reporting of the registrant.
The Audit Committee has adopted a Policy for Engagement of Independent Auditors for Audit and Non-Audit Services (the “Policy”). The Policy sets forth the understanding of the Audit Committee regarding the engagement of the registrant’s independent accountants to provide (i) audit and permissible audit-related, tax and other services to the registrant (“Fund Services”); (ii) non-audit services to the registrant’s Adviser and any Control Affiliates, that relates directly to the operations and financial reporting of a Fund (“Fund-related Adviser Services”); and (iii) certain other audit and non-audit
services to the registrant’s Adviser and its Control Affiliates. A service will require specific pre-approval by the Audit Committee if it is to be provided by the Fund’s independent auditor; provided, however, that pre-approval of non-audit services to the Fund, the Adviser or Control Affiliates may be waived if certain de minimis requirements set forth in the SEC’s rules are met.
Under the Policy, the Audit Committee may delegate pre-approval authority to any pre-designated member or members who are independent board members. The member(s) to whom such authority is delegated must report, for informational purposes only, any pre-approval decisions to the Audit Committee at its next regular meeting. The Audit Committee’s responsibilities with respect to the pre-approval of services performed by the independent auditor may not be delegated to management.
On an annual basis, at a regularly scheduled Audit Committee meeting, the Fund’s Treasurer or other Fund officer shall submit to the Audit Committee a schedule of the types of Fund Services and Fund-related Adviser Services that are subject to specific pre-approval. This schedule will provide a description of each type of service that is subject to specific pre-approval, along with total projected fees for each service. The pre-approval will generally cover a one-year period. The Audit Committee will review and approve the types of services and the projected fees for the next one-year period and may add to, or subtract from, the list of pre-approved services from time to time, based on subsequent determinations. This specific approval acknowledges that the Audit Committee is in agreement with the specific types of services that the independent auditor will be permitted to perform and the projected fees for each service.
The Fund’s Treasurer or other Fund officer shall report to the Audit Committee at each of its regular meetings regarding all Fund Services or Fund-related Adviser Services provided since the last such report was rendered, including a description of the services, by category, with forecasted fees for the annual reporting period, proposed changes requiring specific pre-approval and a description of services provided by the independent auditor, by category, with actual fees during the current reporting period.
*****
(e)(2) 100% of the services performed for items (b) through (d) above during 2013 and 2012 were pre-approved by the registrant’s Audit Committee.
(f) Not applicable.
(g) The aggregate non-audit fees billed by the registrant’s accountant for services rendered to the registrant, and rendered to the registrant’s investment adviser (not including any sub-adviser whose role is primarily portfolio management and is subcontracted with or overseen by another investment adviser), and any entity controlling, controlled by, or under common control with the adviser that provides ongoing services to the registrant during the fiscal years ended August 31, 2013 and August 31, 2012 are approximately as follows:
2013 | | 2012 | |
$ | 346,200 | | $ | 443,600 | |
| | | | | |
(h) The registrant’s Audit Committee of the Board of Directors has considered whether the provision of non-audit services that were rendered to the registrant’s adviser (not including any sub-adviser whose role is primarily portfolio management and is subcontracted with or overseen by another investment adviser), and any entity controlling, controlled by, or under common control with the investment adviser that provides ongoing services to the registrant that were not pre-approved pursuant to paragraph (c)(7)(ii) of Rule 2-01 of Regulation S-X, is compatible with maintaining the principal accountant’s independence.
Item 5. Audit Committee of Listed Registrants.
Not applicable.
Item 6. Investments
(a) The registrant’s “Schedule I — Investments in securities of unaffiliated issuers” (as set forth in 17 CFR 210.12-12) is included in Item 1 of this Form N-CSR.
(b) Not applicable.
Item 7. Disclosure of Proxy Voting Policies and Procedures for Closed-End Management Investment Companies.
Not applicable.
Item 8. Portfolio Managers of Closed-End Management Investment Companies.
Not applicable.
Item 9. Purchases of Equity Securities by Closed-End Management Investment Company and Affiliated Purchasers.
Not applicable.
Item 10. Submission of Matters to a Vote of Security Holders.
There were no material changes to the procedures by which shareholders may recommend nominees to the registrant’s board of directors.
Item 11. Controls and Procedures.
(a) The registrant’s principal executive officer and principal financial officers, based on their evaluation of the registrant’s disclosure controls and procedures as of a date within 90 days of the filing of this report, have concluded that such controls and procedures are adequately designed to ensure that material information required to be disclosed by the registrant in Form N-CSR is accumulated and communicated to the registrant’s management, including the principal executive officer and principal financial officer, or persons performing similar functions, as appropriate to allow timely decisions regarding required disclosure.
(b) There was no change in the registrant’s internal control over financial reporting that occurred during the registrant’s second fiscal quarter of the period covered by this report that has materially affected, or is reasonably likely to materially affect, the registrant’s internal control over financial reporting.
Item 12. Exhibits.
(a)(1) Code of ethics required to be disclosed under Item 2 of Form N-CSR attached hereto as Exhibit 99.CODE ETH.
(a)(2) Certifications pursuant to Rule 30a-2(a) under the Investment Company Act of 1940 (17 CFR 270.30a-2(a)) attached hereto as Exhibit 99.CERT.
(a)(3) Not applicable.
(b) Certification pursuant to Rule 30a-2(b) under the Investment Company Act of 1940 (17 CFR 270.30a-2(b)) attached hereto as Exhibit 99.906CERT.
SIGNATURES
Pursuant to the requirements of the Securities Exchange Act of 1934 and the Investment Company Act of 1940, the registrant has duly caused this report to be signed on its behalf by the undersigned, thereunto duly authorized.
(registrant) | | | Columbia Funds Series Trust I | |
| | |
| | |
By (Signature and Title) | | | /s/ J. Kevin Connaughton | |
| | J. Kevin Connaughton, President and Principal Executive Officer |
| | |
| | |
Date | | | October 28, 2013 | |
| | |
| | |
Pursuant to the requirements of the Securities Exchange Act of 1934 and the Investment Company Act of 1940, this report has been signed below by the following persons on behalf of the registrant and in the capacities and on the dates indicated. |
| | |
| | |
By (Signature and Title) | | | /s/ J. Kevin Connaughton | |
| | J. Kevin Connaughton, President and Principal Executive Officer |
| | |
| | |
Date | | | October 28, 2013 | |
| | |
| | |
By (Signature and Title) | | | /s/ Michael G. Clarke | |
| | Michael G. Clarke, Treasurer and Chief Financial Officer |
| | |
| | |
Date | | | October 28, 2013 | |
| | | | | | |