UNITED STATES
SECURITIES AND EXCHANGE COMMISSION
Washington, D.C. 20549
FORM N-CSR
CERTIFIED SHAREHOLDER REPORT OF REGISTERED
MANAGEMENT INVESTMENT COMPANIES
Investment Company Act file number | 811-04367 |
|
Columbia Funds Series Trust I |
(Exact name of registrant as specified in charter) |
|
225 Franklin Street, Boston, Massachusetts | | 02110 |
(Address of principal executive offices) | | (Zip code) |
|
Christopher O. Petersen, Esq.
c/o Columbia Management Investment Advisers, LLC
225 Franklin Street
Boston, MA 02110 |
(Name and address of agent for service) |
|
Registrant’s telephone number, including area code: | (800) 345-6611 | |
|
Date of fiscal year end: | October 31 | |
|
Date of reporting period: | October 31, 2013 | |
| | | | | | | | |
Form N-CSR is to be used by management investment companies to file reports with the Commission not later than 10 days after the transmission to stockholders of any report that is required to be transmitted to stockholders under Rule 30e-1 under the Investment Company Act of 1940 (17 CFR 270.30e-1). The Commission may use the information provided on Form N-CSR in its regulatory, disclosure review, inspection, and policymaking roles.
A registrant is required to disclose the information specified by Form N-CSR, and the Commission will make this information public. A registrant is not required to respond to the collection of information contained in Form N-CSR unless the Form displays a currently valid Office of Management and Budget (“OMB”) control number. Please direct comments concerning the accuracy of the information collection burden estimate and any suggestions for reducing the burden to Secretary, Securities and Exchange Commission, 450 Fifth Street, NW, Washington, DC 20549-0609. The OMB has reviewed this collection of information under the clearance requirements of 44 U.S.C. § 3507.
Item 1. Reports to Stockholders.
Annual Report
October 31, 2013

Columbia California Tax-Exempt Fund
Not FDIC insured • No bank guarantee • May lose value
 Dear Shareholders,
A market rally led by equities
Despite threats of military action in Syria, rumblings from Iran and an impending showdown over the debt ceiling here at home, the U.S. financial markets delivered positive results in the third quarter of 2013. Stocks outperformed bonds by a substantial margin. Still, robust growth continued to elude the U.S. economy, which merely plodded along. New job growth was solid but not spectacular. Consumer spending remained steady, but the only obvious beneficiary was the auto industry. Gains in the housing market met some headwinds, as mortgage rates rose and sales slipped somewhat. Nevertheless, the recovery in housing remained intact.
The Federal Reserve (the Fed) unsettled investors with a hint that it was ready to taper its purchase of U.S. Treasury and mortgage securities. However, its failure to take any action in a September meeting rallied stocks to new highs and brought bonds back into positive territory for the quarter. Small-cap stocks were the U.S. market leaders. Growth outperformed value in a quarter dominated by the materials, industrials and consumer discretionary sectors. Developed markets led the global rally, driven by strengthening economic conditions in the eurozone. Certain emerging stock markets, including China's, bounced back with returns in line with those of the United States. India and Indonesia were exceptions to that trend, as fears of the Fed's tapering efforts rattled investors in both countries.
Improved risk appetites boosted fixed income
Following a weak second quarter, the fixed-income markets made up some ground in the third quarter of 2013. As yields fell, bond prices rallied enough to push returns on non-Treasury sectors into positive territory. Risk appetites improved in response to continued liquidity from the Fed. Against this backdrop, U.S. high-yield and foreign bonds led the fixed-income markets, along with mortgage-backed securities and emerging market bonds. The U.S. municipal bond market was the exception, as it slipped into negative territory in the final week of the period, pressured by heightened concerns over Puerto Rico, potential municipal bankruptcies and continued fund redemptions.
Stay on track with Columbia Management
Backed by more than 100 years of experience, Columbia Management is one of the nation's largest asset managers. At the heart of our success and, most importantly, that of our investors, are highly talented industry professionals, brought together by a unique way of working. At Columbia Management, reaching our performance goals matters, and how we reach them matters just as much.
Visit columbiamanagement.com for:
> The Columbia Management Perspectives blog, offering insights on current market events and investment opportunities
> Detailed up-to-date fund performance and portfolio information
> Quarterly fund commentaries
> Columbia Management Investor, our award-winning quarterly newsletter for shareholders
Thank you for your continued support of the Columbia Funds. We look forward to serving your investment needs for many years to come.
Best Regards,

J. Kevin Connaughton
President, Columbia Funds
Investing involves risk including the risk of loss of principal.
Investors should consider the investment objectives, risks, charges and expenses of a mutual fund carefully before investing. For a free prospectus, which contains this and other important information about a fund, visit columbiamanagement.com. The prospectus should be read carefully before investing.
Columbia Funds are distributed by Columbia Management Investment Distributors, Inc., member FINRA, and managed by Columbia Management Investment Advisers, LLC.
© 2013 Columbia Management Investment Advisers, LLC. All rights reserved.
Columbia California Tax-Exempt Fund
Performance Overview | | | 2 | | |
Manager Discussion of Fund Performance | | | 4 | | |
Understanding Your Fund's Expenses | | | 6 | | |
Portfolio of Investments | | | 7 | | |
Statement of Assets and Liabilities | | | 18 | | |
Statement of Operations | | | 20 | | |
Statement of Changes in Net Assets | | | 21 | | |
Financial Highlights | | | 23 | | |
Notes to Financial Statements | | | 28 | | |
Report of Independent Registered
Public Accounting Firm | | | 34 | | |
Federal Income Tax Information | | | 35 | | |
Trustees and Officers | | | 36 | | |
Board Consideration and Approval of Advisory Agreement | | | 39 | | |
Important Information About This Report | | | 45 | | |
Fund Investment Manager
Columbia Management Investment
Advisers, LLC
225 Franklin Street
Boston, MA 02110
Fund Distributor
Columbia Management Investment
Distributors, Inc.
225 Franklin Street
Boston, MA 02110
Fund Transfer Agent
Columbia Management Investment
Services Corp.
P.O. Box 8081
Boston, MA 02266-8081
For more information about any of the funds, please visit columbiamanagement.com or call 800.345.6611. Customer Service Representatives are available to answer your questions Monday through Friday from 8 a.m. to 8 p.m. Eastern time.
The views expressed in this report reflect the current views of the respective parties. These views are not guarantees of future performance and involve certain risks, uncertainties and assumptions that are difficult to predict, so actual outcomes and results may differ significantly from the views expressed. These views are subject to change at any time based upon economic, market or other conditions and the respective parties disclaim any responsibility to update such views. These views may not be relied on as investment advice and, because investment decisions for a Columbia Fund are based on numerous factors, may not be relied on as an indication of trading intent on behalf of any particular Columbia Fund. References to specific securities should not be construed as a recommendation or investment advice.
Columbia California Tax-Exempt Fund
Performance Summary
> Columbia California Tax-Exempt Fund (the Fund) Class A shares returned -1.80% excluding sales charges for the 12-month period that ended October 31, 2013. The Fund's Class Z shares returned -1.54% during the same time frame.
> During the 12-month period, the Barclays California Municipal Bond Index returned -0.78% and the broader Barclays Municipal Bond Index returned -1.72%.
> Effective sector allocation overall was more than offset by duration and yield curve positioning, which detracted.
Average Annual Total Returns (%) (for period ended October 31, 2013)
| | Inception | | 1 Year | | 5 Years | | 10 Years | |
Class A | | 06/16/86 | | | | | | | | | | | | | |
Excluding sales charges | | | | | | | -1.80 | | | | 7.22 | | | | 4.57 | | |
Including sales charges | | | | | | | -6.48 | | | | 6.20 | | | | 4.07 | | |
Class B | | 08/04/92 | | | | | | | | | | | | | |
Excluding sales charges | | | | | | | -2.53 | | | | 6.42 | | | | 3.79 | | |
Including sales charges | | | | | | | -7.25 | | | | 6.11 | | | | 3.79 | | |
Class C | | 08/01/97 | | | | | | | | | | | | | |
Excluding sales charges | | | | | | | -2.24 | | | | 6.74 | | | | 4.10 | | |
Including sales charges | | | | | | | -3.18 | | | | 6.74 | | | | 4.10 | | |
Class R4* | | 03/19/13 | | | -1.53 | | | | 7.28 | | | | 4.60 | | |
Class Z* | | 09/19/05 | | | -1.54 | | | | 7.50 | | | | 4.78 | | |
Barclays California Municipal Bond Index | | | | | | | -0.78 | | | | 6.87 | | | | 4.84 | | |
Barclays Municipal Bond Index | | | | | | | -1.72 | | | | 6.37 | | | | 4.53 | | |
Returns for Class A are shown with and without the maximum initial sales charge of 4.75%. Returns for Class B are shown with and without the applicable contingent deferred sales charge (CDSC) of 5.00% in the first year, declining to 1.00% in the sixth year and eliminated thereafter. Returns for Class C are shown with and without the 1.00% CDSC for the first year only. The Fund's other classes are not subject to sales charges and have limited eligibility. Please see the Fund's prospectus for details. Performance for different share classes will vary based on differences in sales charges and fees associated with each class. All results shown assume reinvestment of distributions during the period. Returns do not reflect the deduction of taxes that a shareholder may pay on Fund distributions or on the redemption of Fund shares. Performance results reflect the effect of any fee waivers or reimbursements of Fund expenses by Columbia Management Investment Advisers, LLC and/or any of its affiliates. Absent these fee waivers or expense reimbursement arrangements, performance results would have been lower.
The performance information shown represents past performance and is not a guarantee of future results. The investment return and principal value of your investment will fluctuate so that your shares, when redeemed, may be worth more or less than their original cost. Current performance may be lower or higher than the performance information shown. You may obtain performance information current to the most recent month-end by contacting your financial intermediary, visiting columbiamanagement.com or calling 800.345.6611.
*The returns shown for periods prior to the share class inception date (including returns for the Life of the Fund, if shown, which are since Fund inception) include the returns of the Fund's oldest share class. These returns are adjusted to reflect any higher class-related operating expenses of the newer share classes, as applicable. Please visit columbiamanagement.com/mutual-funds/appended-performance for more information.
The Barclays California Municipal Bond Index is a subset of the Barclays Municipal Bond Index consisting solely of bonds issued by obligors located in the state of California.
The Barclays Municipal Bond Index is an unmanaged index considered representative of the broad market for investment-grade, tax-exempt bonds with a maturity of at least one year.
Indices are not available for investment, are not professionally managed and do not reflect sales charges, fees, brokerage commissions, taxes or other expenses of investing. Securities in the Fund may not match those in an index.
Annual Report 2013
2
Columbia California Tax-Exempt Fund
Performance Overview (continued)
Performance of a Hypothetical $10,000 Investment (November 1, 2003 – October 31, 2013)
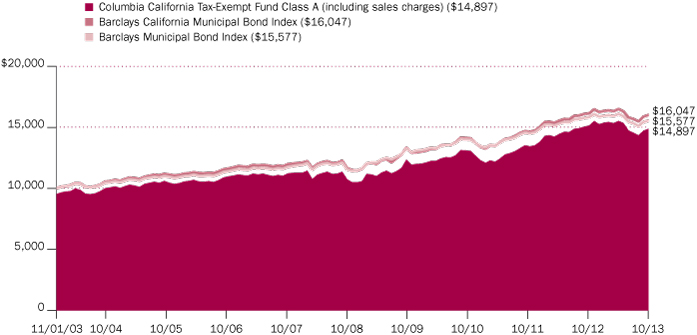
The chart above shows the change in value of a hypothetical $10,000 investment in Class A shares of Columbia California Tax-Exempt Fund during the stated time period, and does not reflect the deduction of taxes that a shareholder may pay on Fund distributions or on the redemption of Fund shares.
Annual Report 2013
3
Columbia California Tax-Exempt Fund
Manager Discussion of Fund Performance
For the 12-month period that ended October 31, 2013, the Fund's Class A shares returned -1.80% excluding sales charges. The Fund's Class Z shares returned -1.54% for the same time frame. By comparison, the Fund's benchmarks, the Barclays California Municipal Bond Index (Barclays CA Index) and the broad Barclays Municipal Bond Index returned -0.78% and -1.72%, respectively, for the same period. Effective sector allocation overall was more than offset by duration and yield curve positioning, which detracted.
Tax-Exempt Bond Market Faced Multiple Headwinds
The tax-exempt fixed income market struggled during the period, with municipal bond yields rising across the yield curve. (Remember, there is usually an inverse relationship between bond prices and yield movements, so that bond prices fall when yields rise and vice versa.) Yields on longer-term maturities rose more than on shorter-term maturities, which resulted in a steeper municipal bond yield curve.
When the period began in November 2012, the municipal bond market was strong. Municipal bond yields were generally falling and demand was high, as the potential for higher taxes and a limit on deductions following the U.S. elections drove investors to the tax-exempt asset class. However, in December 2012, there was a sharp correction, as U.S. Treasury yields rose with expectations that Congress would negotiate a deal to avert the fiscal cliff, increased amounts of debt came to market and investors started assessing the tax benefits of taking gains ahead of suspected tax increases in 2013. Following a rebound in January 2013, fund outflows picked up in February and remained elevated through most of the period, as market tone softened, despite modest municipal supply. By April, typical bond selling that occurs to pay tax bills appeared to be compounded by strong stock market performance and increasing talk of a rotation out of bonds into riskier assets. In June 2013, following mid-May comments by Federal Reserve (Fed) Chair Bernanke, the markets began anticipating the tapering of monetary policy stimulus. A stronger belief in brightening economic growth prospects perpetuated heavy municipal bond fund outflows, causing significant selling pressure and, in turn, higher yields.
July and August 2013 saw negative returns in the Barclays Municipal Bond Index due to sharply higher interest rates that resulted from confusion over Fed policy and heightened concerns about the fiscal health of Detroit and Puerto Rico. Municipal bond mutual fund redemptions hit record levels, further pressuring bond prices. September 2013 reversed course, with the municipal bond market posting gains as market fears faded with the Fed's unanticipated decision to delay any tapering of its quantitative easing program along with continued slow issuance. The broad fixed income market rally continued into October. The U.S. government shutdown and Puerto Rico's debt were notable concerns, but neither seemed to materially impact the municipal bond market in October. Both concerns were more than offset by the positive impact of mid-month actions on both fronts along with low net new supply and seemingly stabilizing mutual fund outflows. Municipal bond yields fell through the last two months of the period.
From a fundamental perspective, states posted better revenue results on the back of increasing sales, income and property taxes. While negative credit stories made headlines — including the state of Illinois' inability to balance its budget, Puerto Rico's two-notch downgrade by Moody's and Detroit's Chapter 9 bankruptcy filing — it is well worth noting that such issues are not representative of the broad municipal bond market. Overall default rates trended down and were
Portfolio Management
Catherine Stienstra
Quality Breakdown (%)
(at October 31, 2013) | |
AAA rating | | | 2.3 | | |
AA rating | | | 16.6 | | |
A rating | | | 52.2 | | |
BBB rating | | | 20.2 | | |
Non-investment grade | | | 2.4 | | |
Not rated | | | 6.3 | | |
Total | | | 100.0 | | |
Percentages indicated are based upon total fixed income securities (excluding Money Market Funds).
Bond ratings apply to the underlying holdings of the Fund and not the Fund itself and are divided into categories ranging from AAA (highest) to D (lowest), and are subject to change. The ratings shown are determined by using the middle rating of Moody's, S&P, and Fitch after dropping the highest and lowest available ratings. When a rating from only two agencies is available, the lower rating is used. When a rating from only one agency is available, that rating is used. When a bond is not rated by one of these agencies, it is designated as Not rated. Credit ratings are subjective opinions and not statements of fact.
Investment Risks
There are risks associated with an investment in a municipal bond fund, including credit risk, interest rate risk, prepayment and extension risk, and geographic concentration risk. In general, bond prices rise when interest rates fall and vice versa. This effect is more pronounced for longer-term securities. Because the Fund concentrates its investments in municipal securities issued by a single state and its municipalities, specific events or factors affecting a particular state can cause more volatility in the Fund than a fund that is more geographically diversified. Non-investment grade securities, commonly called "high-yield" or "junk" bonds, have more volatile prices and carry more risk to principal and income than investment grade securities. Income from tax-exempt funds may be subject to state and local taxes and a portion of income may be subject to the federal and/or state alternative minimum tax for certain investors. Federal and state income tax rules will apply to any capital gain distributions and any gains or losses on sales. See the Fund's prospectus for information on these and other risks.
Annual Report 2013
4
Columbia California Tax-Exempt Fund
Manager Discussion of Fund Performance (continued)
at their lowest level since at least 2009. The fundamentals of California in particular improved with increased revenues, allowing it to balance its budget on time. Two independent ratings agencies upgraded California by one notch during the period.
Duration and Yield Curve Positioning Hampered Returns
Detracting most from Fund results was the combined effect of duration and yield curve positioning. The Fund had a longer duration than the Barclays CA Index, which hurt as tax-exempt bond rates rose. (Duration is a measure of the Fund's sensitivity to changes in interest rates.) Also, an overweight relative to the Barclays CA Index to bonds with maturities of 15 to 30 years and an underweight to bonds with maturities of one to 15 years detracted, as longer-dated maturities underperformed shorter-term maturities given the steepening of the municipal bond yield curve. Security selection among bonds rated Baa2 and hospital and leasing bonds also hurt the Fund's results.
Effective Sector Allocation Boosted Fund Performance
The Fund benefited from its significant allocation to the special tax sector, which outpaced the Barclays CA Index, and from its underweighted exposure to the water and sewer sector, which lagged the Barclays CA Index. From a credit quality perspective, the Fund's results were boosted by its lesser exposure relative to the Barclays CA Index to securities rated AA and by its significant allocation to bonds rated BBB, for lower-rated credits outperformed higher quality tax-exempt bonds within the Barclays CA Index.
Fundamental Analysis Drove Portfolio Changes
During the period, we decreased the Fund's exposure to state general obligation bonds and to the health care sector. We further reduced an already underweighted exposure to Puerto Rico debt to less than 1% of the Fund's total net assets. We increased the Fund's exposure to the sales tax revenue and education sectors and to single A rated securities. In anticipation of an eventual rise in interest rates, we decreased the Fund's positions in bonds with what we considered to be less defensive coupon structures in favor of bonds with more defensive (higher) coupon structures.
Looking Ahead
In our current view, supply/demand factors should be supportive of the municipal bond market over the near term, although we believe such factors remain sensitive to news flow regarding fiscal policy negotiations, Detroit's and Puerto Rico's credit, and Fed decisions. As such, we intend to monitor supply/demand factors closely in the months ahead.
Given what we believe is the potential for interest rates to continue to rise until further developments out of Washington, D.C. and/or the sustainability of economic growth become clearer, we intend to seek to bring the Fund's duration closer to that of the Barclays CA Index. To help sustain a competitive yield, we currently expect to implement this strategy by selling longer-term, higher quality securities in favor of shorter maturity, lower investment grade securities. As always, the Fund's emphasis remains on generating both a high level of income generally exempt from federal income tax and California state and local taxes as well as capital appreciation, consistent with moderate fluctuation of principal.
Annual Report 2013
5
Columbia California Tax-Exempt Fund
Understanding Your Fund's Expenses
(Unaudited)
As an investor, you incur two types of costs. There are transaction costs, which generally include sales charges on purchases and may include redemption fees. There are also ongoing costs, which generally include management fees, distribution and service (Rule 12b-1) fees, and other fund expenses. The following information is intended to help you understand your ongoing costs (in dollars) of investing in the Fund and to help you compare these costs with the ongoing costs of investing in other mutual funds.
Analyzing Your Fund's Expenses
To illustrate these ongoing costs, we have provided examples and calculated the expenses paid by investors in each share class of the Fund during the period. The actual and hypothetical information in the table is based on an initial investment of $1,000 at the beginning of the period indicated and held for the entire period. Expense information is calculated two ways and each method provides you with different information. The amount listed in the "Actual" column is calculated using the Fund's actual operating expenses and total return for the period. You may use the Actual information, together with the amount invested, to estimate the expenses that you paid over the period. Simply divide your account value by $1,000 (for example, an $8,600 account value divided by $1,000 = 8.6), then multiply the results by the expenses paid during the period under the Actual column. The amount listed in the "Hypothetical" column assumes a 5% annual rate of return before expenses (which is not the Fund's actual return) and then applies the Fund's actual expense ratio for the period to the hypothetical return. You should not use the hypothetical account values and expenses to estimate either your actual account balance at the end of the period or the expenses you paid during the period. See "Compare With Other Funds" below for details on how to use the hypothetical data.
Compare With Other Funds
Since all mutual funds are required to include the same hypothetical calculations about expenses in shareholder reports, you can use this information to compare the ongoing cost of investing in the Fund with other funds. To do so, compare the hypothetical example with the 5% hypothetical examples that appear in the shareholder reports of other funds. As you compare hypothetical examples of other funds, it is important to note that hypothetical examples are meant to highlight the ongoing costs of investing in a fund only and do not reflect any transaction costs, such as sales charges, or redemption or exchange fees. Therefore, the hypothetical calculations are useful in comparing ongoing costs only, and will not help you determine the relative total costs of owning different funds. If transaction costs were included in these calculations, your costs would be higher.
May 1, 2013 – October 31, 2013
| | Account Value at the Beginning
of the Period ($) | | Account Value at the End of the
Period ($) | | Expenses Paid During the
Period ($) | | Fund's Annualized
Expense Ratio (%) | |
| | Actual | | Hypothetical | | Actual | | Hypothetical | | Actual | | Hypothetical | | Actual | |
Class A | | | 1,000.00 | | | | 1,000.00 | | | | 957.20 | | | | 1,021.27 | | | | 3.85 | | | | 3.97 | | | | 0.78 | | |
Class B | | | 1,000.00 | | | | 1,000.00 | | | | 953.60 | | | | 1,017.49 | | | | 7.53 | | | | 7.78 | | | | 1.53 | | |
Class C | | | 1,000.00 | | | | 1,000.00 | | | | 953.90 | | | | 1,019.00 | | | | 6.06 | | | | 6.26 | | | | 1.23 | | |
Class R4 | | | 1,000.00 | | | | 1,000.00 | | | | 959.70 | | | | 1,022.53 | | | | 2.62 | | | | 2.70 | | | | 0.53 | | |
Class Z | | | 1,000.00 | | | | 1,000.00 | | | | 958.50 | | | | 1,022.53 | | | | 2.62 | | | | 2.70 | | | | 0.53 | | |
Expenses paid during the period are equal to the annualized expense ratio for each class as indicated above, multiplied by the average account value over the period and then multiplied by the number of days in the Fund's most recent fiscal half year and divided by 365.
Expenses do not include fees and expenses incurred indirectly by the Fund from the underlying funds in which the Fund may invest (also referred to as "acquired funds"), including affiliated and non-affiliated pooled investment vehicles (including mutual funds and exchange-traded funds).
Had Columbia Management Investment Advisers, LLC and/or certain of its affiliates not waived/reimbursed certain fees and expenses, account value at the end of the period would have been reduced.
Annual Report 2013
6
Columbia California Tax-Exempt Fund
Portfolio of Investments
October 31, 2013
(Percentages represent value of investments compared to net assets)
Municipal Bonds 97.6%
Issue
Description | | Coupon
Rate | | Principal
Amount ($) | | Value ($) | |
Airport 3.3% | |
City of Fresno Airport(a)
Refunding Revenue Bonds
Series 2013B AMT
07/01/28 | | | 5.000 | % | | | 500,000 | | | | 501,485 | | |
07/01/30 | | | 5.125 | % | | | 1,050,000 | | | | 1,043,532 | | |
County of Orange Airport
Revenue Bonds
Series 2009A
07/01/39 | | | 5.250 | % | | | 2,500,000 | | | | 2,614,325 | | |
County of Sacramento Airport System
Revenue Bonds
Senior Series 2009B
07/01/39 | | | 5.750 | % | | | 3,000,000 | | | | 3,325,620 | | |
County of Sacramento Airport System(a)
Revenue Bonds
Senior Series 2008B (AGM) AMT
07/01/39 | | | 5.250 | % | | | 1,000,000 | | | | 1,028,220 | | |
San Francisco City & County Airports Commission(a)
Refunding Revenue Bonds
2nd Series 2008-34E (AGM) AMT
05/01/25 | | | 5.750 | % | | | 1,500,000 | | | | 1,695,285 | | |
2nd Series 2011F AMT
05/01/29 | | | 5.000 | % | | | 5,210,000 | | | | 5,421,370 | | |
Total | | | | | | | 15,629,837 | | |
Disposal 0.4% | |
California Pollution Control Financing Authority
Refunding Revenue Bonds
Waste Management
Series 2002A AMT(a)
01/01/22 | | | 5.000 | % | | | 2,000,000 | | | | 2,082,820 | | |
Higher Education 6.5% | |
California Educational Facilities Authority
Revenue Bonds
California College of the Arts
Series 2005
06/01/26 | | | 5.000 | % | | | 1,000,000 | | | | 1,005,240 | | |
06/01/35 | | | 5.000 | % | | | 1,500,000 | | | | 1,433,205 | | |
California Lutheran University
Series 2008
10/01/21 | | | 5.250 | % | | | 665,000 | | | | 716,424 | | |
10/01/38 | | | 5.750 | % | | | 3,000,000 | | | | 3,039,480 | | |
Chapman University
Series 2011
04/01/31 | | | 5.000 | % | | | 4,375,000 | | | | 4,567,544 | | |
Loyola Marymount University
Series 2010A
10/01/40 | | | 5.125 | % | | | 1,250,000 | | | | 1,278,413 | | |
Woodbury University
Series 2006
01/01/25 | | | 5.000 | % | | | 1,830,000 | | | | 1,823,686 | | |
Municipal Bonds (continued)
Issue
Description | | Coupon
Rate | | Principal
Amount ($) | | Value ($) | |
California Municipal Finance Authority
Revenue Bonds
Biola University
Series 2008
10/01/28 | | | 5.800 | % | | | 2,000,000 | | | | 2,090,140 | | |
Series 2013
10/01/38 | | | 5.000 | % | | | 1,000,000 | | | | 981,790 | | |
10/01/42 | | | 5.000 | % | | | 1,000,000 | | | | 954,400 | | |
Emerson College
Series 2011
01/01/42 | | | 6.000 | % | | | 1,250,000 | | | | 1,367,038 | | |
California State University
Revenue Bonds
Systemwide
Series 2009A
11/01/40 | | | 6.000 | % | | | 2,000,000 | | | | 2,239,000 | | |
California Statewide Communities Development Authority
Revenue Bonds
Lancer Plaza Project
Series 2013
11/01/33 | | | 5.625 | % | | | 1,400,000 | | | | 1,249,626 | | |
11/01/43 | | | 5.875 | % | | | 1,875,000 | | | | 1,632,862 | | |
University of California
Revenue Bonds
Series 2013AK(b)
05/15/48 | | | 5.000 | % | | | 5,000,000 | | | | 5,896,650 | | |
Total | | | | | | | 30,275,498 | | |
Hospital 12.7% | |
California Health Facilities Financing Authority
Refunding Revenue Bonds
Cedars Sinai Medical Center
Series 2005
11/15/34 | | | 5.000 | % | | | 4,025,000 | | | | 4,062,151 | | |
Revenue Bonds
Adventist Health System West
Series 2009A
09/01/39 | | | 5.750 | % | | | 7,000,000 | | | | 7,564,200 | | |
Catholic Healthcare
Series 2011A
03/01/41 | | | 5.250 | % | | | 3,000,000 | | | | 3,045,360 | | |
Catholic Healthcare West
Series 2009A
07/01/39 | | | 6.000 | % | | | 1,000,000 | | | | 1,089,870 | | |
Series 2009E
07/01/25 | | | 5.625 | % | | | 1,125,000 | | | | 1,228,725 | | |
Kaiser Permanente
Series 2006A
04/01/39 | | | 5.250 | % | | | 3,350,000 | | | | 3,379,312 | | |
Providence Health & Services
Series 2008C
10/01/28 | | | 6.250 | % | | | 500,000 | | | | 576,470 | | |
St. Joseph Health System
Series 2009A
07/01/29 | | | 5.500 | % | | | 1,500,000 | | | | 1,661,880 | | |
The accompanying Notes to Financial Statements are an integral part of this statement.
Annual Report 2013
7
Columbia California Tax-Exempt Fund
Portfolio of Investments (continued)
October 31, 2013
Municipal Bonds (continued)
Issue
Description | | Coupon
Rate | | Principal
Amount ($) | | Value ($) | |
St. Joseph Health Systems
Series 2013A
07/01/37 | | | 5.000 | % | | | 2,000,000 | | | | 2,022,800 | | |
Sutter Health
Series 2008A
08/15/30 | | | 5.000 | % | | | 2,500,000 | | | | 2,557,475 | | |
Series 2011B
08/15/31 | | | 5.875 | % | | | 1,815,000 | | | | 2,065,288 | | |
Unrefunded Revenue Bonds
Providence Health
Series 2008
10/01/38 | | | 6.500 | % | | | 1,470,000 | | | | 1,685,605 | | |
California Municipal Finance Authority
Certificate of Participation
Community Hospital of Central California
Series 2007
02/01/37 | | | 5.250 | % | | | 2,500,000 | | | | 2,386,800 | | |
Revenue Bonds
Community Hospitals of Central California
Series 2009
02/01/39 | | | 5.500 | % | | | 4,000,000 | | | | 3,994,200 | | |
California Statewide Communities Development Authority
Revenue Bonds
Catholic Healthcare West
Series 2008B
07/01/30 | | | 5.500 | % | | | 1,935,000 | | | | 2,097,521 | | |
John Muir Health
Series 2006A
08/15/32 | | | 5.000 | % | | | 3,000,000 | | | | 3,022,290 | | |
Series 2009
07/01/39 | | | 5.125 | % | | | 500,000 | | | | 515,950 | | |
Kaiser Permanente
Series 2006B
03/01/45 | | | 5.250 | % | | | 1,000,000 | | | | 1,007,340 | | |
Sutter Health
Series 2011A
08/15/42 | | | 6.000 | % | | | 2,000,000 | | | | 2,283,200 | | |
Various Kaiser
Series 2001C
08/01/31 | | | 5.250 | % | | | 1,100,000 | | | | 1,120,471 | | |
City of Marysville
Revenue Bonds
Fremont-Rideout Health
Series 2011
01/01/42 | | | 5.250 | % | | | 4,000,000 | | | | 4,032,960 | | |
City of Torrance
Revenue Bonds
Torrance Memorial Medical Center
Series 2010A
09/01/30 | | | 5.000 | % | | | 3,000,000 | | | | 3,117,630 | | |
Sierra View Local Health Care District
Revenue Bonds
Series 2007
07/01/37 | | | 5.250 | % | | | 3,500,000 | | | | 3,434,655 | | |
Municipal Bonds (continued)
Issue
Description | | Coupon
Rate | | Principal
Amount ($) | | Value ($) | |
University of California
Revenue Bonds
Series 2008D
05/15/27 | | | 5.000 | % | | | 1,500,000 | | | | 1,619,610 | | |
Total | | | | | | | 59,571,763 | | |
Investor Owned 1.0% | |
City of Chula Vista
Revenue Bonds
San Diego Gas & Electric Co.
Series 2004D
01/01/34 | | | 5.875 | % | | | 1,000,000 | | | | 1,114,600 | | |
City of Chula Vista(a)
Revenue Bonds
San Diego Gas & Electric Co.
Series 2005D AMT
12/01/27 | | | 5.000 | % | | | 3,500,000 | | | | 3,669,750 | | |
Total | | | | | | | 4,784,350 | | |
Joint Power Authority 0.5% | |
California Infrastructure & Economic Development Bank
Prerefunded 02/01/15 Revenue Bonds
California Independent System Operator
Series 2009A
02/01/39 | | | 6.250 | % | | | 2,000,000 | | | | 2,149,180 | | |
Local Appropriation 4.5% | |
Anaheim Public Financing Authority
Subordinated Revenue Bonds
Public Improvements Project
Series 1997C (AGM)
09/01/14 | | | 6.000 | % | | | 2,000,000 | | | | 2,093,820 | | |
City of Modesto
Certificate of Participation
Community Center Refinancing Project
Series 1993A (AMBAC)
11/01/23 | | | 5.000 | % | | | 2,235,000 | | | | 2,203,911 | | |
County of San Joaquin
Certificate of Participation
Capital Facilities Project
Series 1993 (NPFGC)
11/15/13 | | | 5.500 | % | | | 620,000 | | | | 621,099 | | |
Los Angeles Municipal Improvement Corp.
Revenue Bonds
Capital Equipment
Series 2008A
09/01/24 | | | 5.000 | % | | | 1,000,000 | | | | 1,072,850 | | |
Series 2008B
09/01/38 | | | 5.000 | % | | | 3,000,000 | | | | 3,027,990 | | |
Pico Rivera Public Financing Authority
Revenue Bonds
Series 2009
09/01/31 | | | 5.500 | % | | | 1,500,000 | | | | 1,600,665 | | |
The accompanying Notes to Financial Statements are an integral part of this statement.
Annual Report 2013
8
Columbia California Tax-Exempt Fund
Portfolio of Investments (continued)
October 31, 2013
Municipal Bonds (continued)
Issue
Description | | Coupon
Rate | | Principal
Amount ($) | | Value ($) | |
San Jose Financing Authority
Refunding Revenue Bonds
Civic Center Project
Series 2013A
06/01/33 | | | 5.000 | % | | | 5,000,000 | | | | 5,276,350 | | |
San Mateo County Board of Education
Refunding Certificate of Participation
Series 2009
06/01/35 | | | 5.250 | % | | | 2,000,000 | | | | 2,081,260 | | |
Victor Elementary School District
Certificate of Participation
School Construction Refinancing
Series 1996 (NPFGC)
05/01/18 | | | 6.450 | % | | | 2,670,000 | | | | 2,846,541 | | |
Total | | | | | | | 20,824,486 | | |
Local General Obligation 5.6% | |
Central Valley Schools Financing Authority
Refunding Revenue Bonds
School District General Obligation Bond Program
Series 1998A (NPFGC)
02/01/18 | | | 6.450 | % | | | 710,000 | | | | 765,565 | | |
Culver City School Facilities Financing Authority
Revenue Bonds
Culver City United School District
Series 2005 (AGM)
08/01/26 | | | 5.500 | % | | | 1,750,000 | | | | 2,148,318 | | |
East Side Union High School District
Unlimited General Obligation Refunding Bonds
Series 2003B (NPFGC)
08/01/26 | | | 5.250 | % | | | 2,010,000 | | | | 2,273,069 | | |
Grossmont Healthcare District
Unlimited General Obligation Bonds
2006 Election
Series 2011B
07/15/34 | | | 6.000 | % | | | 2,000,000 | | | | 2,278,500 | | |
Los Angeles Unified School District
Unlimited General Obligation Bonds
Series 2009D
01/01/34 | | | 5.000 | % | | | 750,000 | | | | 779,063 | | |
Manteca Unified School District
Unlimited General Obligation Bonds
Capital Appreciation-Election of 2004
Series 2006 (NPFGC)(c)
08/01/32 | | | 0.000 | % | | | 5,440,000 | | | | 1,680,579 | | |
Menifee Union School District
Unlimited General Obligation Bonds
Election of 2008
Series 2008A
08/01/33 | | | 5.500 | % | | | 3,125,000 | | | | 3,427,156 | | |
Municipal Bonds (continued)
Issue
Description | | Coupon
Rate | | Principal
Amount ($) | | Value ($) | |
New Haven Unified School District
Unlimited General Obligation Refunding Bonds
Series 2002 (AGM)
08/01/17 | | | 12.000 | % | | | 1,565,000 | | | | 2,184,317 | | |
Oakland Unified School District/Alameda County
Unlimited General Obligation Bonds
Election of 2006
Series 2012A
08/01/22 | | | 5.000 | % | | | 750,000 | | | | 804,015 | | |
08/01/32 | | | 5.500 | % | | | 2,500,000 | | | | 2,541,425 | | |
Series 2013
08/01/30 | | | 6.250 | % | | | 1,095,000 | | | | 1,175,406 | | |
Rocklin Unified School District
Unlimited General Obligation Bonds
Capital Appreciation
Series 1995C (NPFGC)(c)
07/01/20 | | | 0.000 | % | | | 3,460,000 | | | | 2,728,867 | | |
San Bernardino City Unified School District
Unlimited General Obligation Refunding Bonds
Series 2013A (AGM)
08/01/28 | | | 5.000 | % | | | 1,250,000 | | | | 1,328,225 | | |
San Marino Unified School District
Unlimited General Obligation Bonds
Series 1998B
06/01/23 | | | 5.000 | % | | | 1,000,000 | | | | 1,182,710 | | |
Simi Valley Unified School District
Refunding Certificate of Participation
Capital Improvement Projects
Series 1998 (AMBAC)
08/01/22 | | | 5.250 | % | | | 925,000 | | | | 984,986 | | |
Total | | | | | | | 26,282,201 | | |
Multi-Family 2.1% | |
California Housing Finance Agency
Revenue Bonds
Multifamily Housing III
Series 1999A AMT(a)
02/01/36 | | | 5.375 | % | | | 2,280,000 | | | | 2,280,023 | | |
California Statewide Communities Development Authority
Refunding Revenue Bonds
University of California Irvine East Campus Apartments
Series 2006
05/15/38 | | | 5.000 | % | | | 2,500,000 | | | | 2,374,625 | | |
Series 2012
05/15/31 | | | 5.125 | % | | | 2,000,000 | | | | 2,013,000 | | |
Revenue Bonds
CHF-Irvine LLC-UCI East Campus
Series 2008
05/15/17 | | | 5.000 | % | | | 1,600,000 | | | | 1,771,872 | | |
University of California Irvine East Campus Apartments
Series 2008
05/15/32 | | | 5.750 | % | | | 1,500,000 | | | | 1,539,030 | | |
Total | | | | | | | 9,978,550 | | |
The accompanying Notes to Financial Statements are an integral part of this statement.
Annual Report 2013
9
Columbia California Tax-Exempt Fund
Portfolio of Investments (continued)
October 31, 2013
Municipal Bonds (continued)
Issue
Description | | Coupon
Rate | | Principal
Amount ($) | | Value ($) | |
Municipal Power 3.5% | |
Anaheim Public Financing Authority
Revenue Bonds
Anaheim Electric Systems Distribution
Series 2009
10/01/25 | | | 5.000 | % | | | 1,000,000 | | | | 1,094,270 | | |
City of Redding
Certificate of Participation
Series 2008A (AGM)
06/01/27 | | | 5.000 | % | | | 865,000 | | | | 934,183 | | |
City of Riverside Electric
Revenue Bonds
Series 2008D (AGM)
10/01/28 | | | 5.000 | % | | | 1,325,000 | | | | 1,407,256 | | |
City of Vernon Electric System
Revenue Bonds
Series 2009A
08/01/21 | | | 5.125 | % | | | 2,730,000 | | | | 2,956,262 | | |
Series 2012A
08/01/30 | | | 5.000 | % | | | 1,000,000 | | | | 1,005,560 | | |
Imperial Irrigation District
Refunding Revenue Bonds
System
Series 2011A
11/01/31 | | | 6.250 | % | | | 1,000,000 | | | | 1,125,160 | | |
Modesto Irrigation District
Certificate of Participation
Series 2004B
07/01/35 | | | 5.500 | % | | | 2,000,000 | | | | 2,105,560 | | |
Puerto Rico Electric Power Authority
Revenue Bonds
Series 2013A(d)
07/01/36 | | | 6.750 | % | | | 3,000,000 | | | | 2,554,890 | | |
Southern California Public Power Authority
Revenue Bonds
Milford Wind Corridor Project
Series 2010-1
07/01/30 | | | 5.000 | % | | | 500,000 | | | | 540,070 | | |
Walnut Energy Center Authority
Revenue Bonds
Series 2004A (AMBAC)
01/01/29 | | | 5.000 | % | | | 2,500,000 | | | | 2,513,900 | | |
Total | | | | | | | 16,237,111 | | |
Other Bond Issue 1.3% | |
California Infrastructure & Economic Development Bank
Revenue Bonds
Series 2008
02/01/33 | | | 5.250 | % | | | 3,000,000 | | | | 3,118,230 | | |
02/01/38 | | | 5.250 | % | | | 3,050,000 | | | | 3,121,583 | | |
Total | | | | | | | 6,239,813 | | |
Municipal Bonds (continued)
Issue
Description | | Coupon
Rate | | Principal
Amount ($) | | Value ($) | |
Ports 1.1% | |
Port Commission of the City & County of San Francisco
Revenue Bonds
Series 2010A
03/01/40 | | | 5.125 | % | | | 5,000,000 | | | | 5,114,900 | | |
Prep School 0.3% | |
California Statewide Communities Development Authority
Revenue Bonds
Aspire Public Schools
Series 2010
07/01/30 | | | 6.000 | % | | | 1,420,000 | | | | 1,393,489 | | |
Prepaid Gas 0.3% | |
M-S-R Energy Authority
Revenue Bonds
Series 2009B
11/01/34 | | | 7.000 | % | | | 1,000,000 | | | | 1,258,330 | | |
Refunded/Escrowed 4.6% | |
California Health Facilities Financing Authority
Prerefunded 02/01/20 Revenue Bonds
Insured Episcopal Home
Series 2010B
02/01/32 | | | 6.000 | % | | | 2,000,000 | | | | 2,491,640 | | |
Prerefunded 10/01/18 Revenue Bonds
Providence Health
Series 2008
10/01/38 | | | 6.500 | % | | | 30,000 | | | | 37,794 | | |
City of Newport Beach
Prerefunded 12/01/21 Revenue Bonds
Hoag Memorial Presbyterian Hospital
Series 2011
12/01/40 | | | 6.000 | % | | | 1,000,000 | | | | 1,295,990 | | |
City of Pomona
Refunding Revenue Bonds
Series 1990B Escrowed to Maturity (GNMA/FHLMC)
08/01/23 | | | 7.500 | % | | | 845,000 | | | | 1,089,281 | | |
City of Redding
Revenue Bonds
Series 1992 Escrowed to Maturity (NPFGC)(b)
07/01/22 | | | 12.203 | % | | | 400,000 | | | | 576,640 | | |
County of Riverside
Revenue Bonds
Series 1989A Escrowed to Maturity (GNMA) AMT(a)
05/01/21 | | | 7.800 | % | | | 2,500,000 | | | | 3,432,325 | | |
Los Angeles Harbor Department
Revenue Bonds
Series 1988 Escrowed to Maturity
10/01/18 | | | 7.600 | % | | | 455,000 | | | | 539,503 | | |
The accompanying Notes to Financial Statements are an integral part of this statement.
Annual Report 2013
10
Columbia California Tax-Exempt Fund
Portfolio of Investments (continued)
October 31, 2013
Municipal Bonds (continued)
Issue
Description | | Coupon
Rate | | Principal
Amount ($) | | Value ($) | |
Manteca Financing Authority
Prerefunded 02/01/13 Revenue Bonds
Series 2003B (NPFGC)
12/01/33 | | | 5.000 | % | | | 345,000 | | | | 346,397 | | |
San Bernardino Community College District
Prerefunded 08/01/18 Unlimited General Obligation Bonds
Election of 2002
Series 2008A
08/01/33 | | | 6.250 | % | | | 1,000,000 | | | | 1,243,250 | | |
San Joaquin Hills Transportation Corridor Agency
Revenue Bonds
Senior Lien
Series 1993 Escrowed to Maturity(c)
01/01/20 | | | 0.000 | % | | | 12,000,000 | | | | 10,588,200 | | |
Total | | | | | | | 21,641,020 | | |
Resource Recovery 0.6% | |
California Municipal Finance Authority
Revenue Bonds
UTS Renewable Energy - Waste Water
Series 2011 AMT(a)(e)(f)
12/01/32 | | | 7.500 | % | | | 2,885,000 | | | | 2,832,031 | | |
Retirement Communities 2.8% | |
ABAG Finance Authority for Nonprofit Corps.
Refunding Revenue Bonds
Episcopal Senior Communities
Series 2011
07/01/31 | | | 6.000 | % | | | 2,200,000 | | | | 2,339,942 | | |
Series 2012
07/01/47 | | | 5.000 | % | | | 4,000,000 | | | | 3,513,800 | | |
California Statewide Communities Development Authority
Refunding Revenue Bonds
Episcopal Communities and Services
Series 2012
05/15/42 | | | 5.000 | % | | | 3,000,000 | | | | 2,697,810 | | |
Revenue Bonds
American Baptist Homes West
Series 2010
10/01/39 | | | 6.250 | % | | | 1,500,000 | | | | 1,548,450 | | |
Covenant Retirement Communities, Inc.
Series 2013
12/01/36 | | | 5.625 | % | | | 2,000,000 | | | | 1,938,360 | | |
Eskaton Properties, Inc.
Series 2012
11/15/34 | | | 5.250 | % | | | 1,250,000 | | | | 1,193,312 | | |
Total | | | | | | | 13,231,674 | | |
Single Family 0.7% | |
California Housing Finance Agency(a)
Revenue Bonds
Home Mortgage
Series 2006H (FGIC) AMT
08/01/30 | | | 5.750 | % | | | 530,000 | | | | 554,364 | | |
Municipal Bonds (continued)
Issue
Description | | Coupon
Rate | | Principal
Amount ($) | | Value ($) | |
Series 2006K AMT
08/01/26 | | | 4.625 | % | | | 2,500,000 | | | | 2,388,000 | | |
02/01/42 | | | 5.500 | % | | | 250,000 | | | | 256,933 | | |
Total | | | | | | | 3,199,297 | | |
Special Non Property Tax 1.1% | |
Riverside County Transportation Commission
Revenue Bonds
Limited Tax
Series 2010A
06/01/32 | | | 5.000 | % | | | 5,000,000 | | | | 5,319,450 | | |
Special Property Tax 20.4% | |
Anaheim Community Facilities District No. 06-2
Special Tax Bonds
Stadium Lofts
Series 2007
09/01/37 | | | 5.000 | % | | | 1,000,000 | | | | 882,040 | | |
Bakersfield Redevelopment Agency
Tax Allocation Bonds
Old Town Kern Pioneer
Series 2009A
08/01/29 | | | 7.500 | % | | | 1,785,000 | | | | 1,839,532 | | |
Southeast Bakersfield
Series 2009B
08/01/29 | | | 7.250 | % | | | 835,000 | | | | 870,713 | | |
Carson Redevelopment Agency
Tax Allocation Bonds
Housing
Series 2010A
10/01/30 | | | 5.000 | % | | | 5,000,000 | | | | 5,072,750 | | |
Cerritos Public Financing Authority
Tax Allocation Bonds
Los Coyotes Redevelopment Project Loan
Series 1993A (AMBAC)
11/01/23 | | | 6.500 | % | | | 2,000,000 | | | | 2,351,020 | | |
Chino Public Financing Authority
Refunding Special Tax Bonds
Series 2012
09/01/30 | | | 5.000 | % | | | 2,500,000 | | | | 2,480,175 | | |
09/01/38 | | | 5.000 | % | | | 625,000 | | | | 586,119 | | |
City of Carson
Special Assessment Bonds
District No. 92-1
Series 1992
09/02/22 | | | 7.375 | % | | | 100,000 | | | | 100,489 | | |
City of Palo Alto
Refunding & Improvement Special Assessment Bonds
Limited Obligation-University Ave.
Series 2012
09/02/29 | | | 5.000 | % | | | 800,000 | | | | 812,704 | | |
The accompanying Notes to Financial Statements are an integral part of this statement.
Annual Report 2013
11
Columbia California Tax-Exempt Fund
Portfolio of Investments (continued)
October 31, 2013
Municipal Bonds (continued)
Issue
Description | | Coupon
Rate | | Principal
Amount ($) | | Value ($) | |
City of Yucaipa
Refunding Special Tax Bonds
Community Facilities District No. 98-1
Series 2011
09/01/30 | | | 5.375 | % | | | 1,500,000 | | | | 1,529,160 | | |
Corona-Norca Unified School District
Refunding Special Tax Bonds
Community Facilities District #98-1
Series 2013
09/01/32 | | | 5.000 | % | | | 1,300,000 | | | | 1,301,911 | | |
Corona-Norco Unified School District Public Financing
Authority
Refunding Special Tax Bonds
Senior Lien
Series 2013-A
09/01/32 | | | 5.000 | % | | | 500,000 | | | | 483,385 | | |
Eastern Municipal Water District
Special Tax Bonds
District No. 2004-27 Cottonwood
Series 2006
09/01/27 | | | 5.000 | % | | | 190,000 | | | | 186,639 | | |
09/01/36 | | | 5.000 | % | | | 480,000 | | | | 442,526 | | |
Elk Grove Unified School District
Refunding Special Tax Bonds
Community Facilities District No. 1
Series 1995 (AMBAC)
12/01/24 | | | 6.500 | % | | | 3,000,000 | | | | 3,544,890 | | |
Elk Grove Unified School District(c)
Refunding Special Tax Bonds
Capital Appreciation-Community Facilities No. 1
Series 1995 (AMBAC)
12/01/18 | | | 0.000 | % | | | 2,720,000 | | | | 2,115,344 | | |
Folsom Redevelopment Agency
Tax Allocation Bonds
Central Folsom Redevelopment Project
Series 2009
08/01/29 | | | 5.125 | % | | | 1,000,000 | | | | 1,015,580 | | |
08/01/36 | | | 5.500 | % | | | 1,000,000 | | | | 1,010,210 | | |
Inglewood Redevelopment Agency
Refunding Tax Allocation Bonds
Merged Redevelopment Project
Series 1998A (AMBAC)
05/01/23 | | | 5.250 | % | | | 2,100,000 | | | | 2,120,328 | | |
Lammersville School District Community Facilities
District No. 2002
Special Tax Bonds
Mountain House
Series 2006
09/01/35 | | | 5.125 | % | | | 1,000,000 | | | | 906,610 | | |
Lancaster Financing Authority
Subordinated Tax Allocation Bonds
No. 5 & 6 Redevelopment Projects
Series 2003 (NPFGC)
02/01/17 | | | 5.125 | % | | | 1,270,000 | | | | 1,327,645 | | |
Municipal Bonds (continued)
Issue
Description | | Coupon
Rate | | Principal
Amount ($) | | Value ($) | |
Long Beach Bond Finance Authority
Tax Allocation Bonds
Series 2006C (AMBAC)
08/01/31 | | | 5.500 | % | | | 3,250,000 | | | | 3,016,747 | | |
Los Angeles Community Redevelopment Agency
Tax Allocation Bonds
Hollywood Redevelopment Project
Series 1998C (NPFGC)
07/01/18 | | | 5.375 | % | | | 1,665,000 | | | | 1,811,720 | | |
Los Angeles County Public Works Financing Authority
Refunding Revenue Bonds
Senior Lien
Series 1996A (AGM)
10/01/18 | | | 5.500 | % | | | 1,520,000 | | | | 1,693,250 | | |
Mountain View Shoreline Regional Park Community
Tax Allocation Bonds
Series 2011A
08/01/35 | | | 5.625 | % | | | 1,300,000 | | | | 1,341,444 | | |
08/01/40 | | | 5.750 | % | | | 2,000,000 | | | | 2,073,120 | | |
Oakdale Public Financing Authority
Tax Allocation Bonds
Central City Redevelopment Project
Series 2004
06/01/33 | | | 5.375 | % | | | 1,500,000 | | | | 1,398,615 | | |
Oakland Redevelopment Agency
Refunding Senior Tax Allocation Bonds
Central District Redevelopment
Series 1992 (AMBAC)
02/01/14 | | | 5.500 | % | | | 1,565,000 | | | | 1,576,221 | | |
Oakland Redevelopment Successor Agency
Refunding Tax Allocation Bonds
Subordinated Series 2013
09/01/19 | | | 5.000 | % | | | 3,000,000 | | | | 3,423,840 | | |
09/01/20 | | | 5.000 | % | | | 2,000,000 | | | | 2,277,140 | | |
Oceanside Community Facilities District
Special Tax Bonds
Ocean Ranch Corp.
Series 2004
09/01/34 | | | 5.875 | % | | | 1,000,000 | | | | 964,440 | | |
Orange County Community Facilities District
Special Tax Bonds
Ladera Ranch
Series 2004A
08/15/34 | | | 5.625 | % | | | 850,000 | | | | 850,485 | | |
Orange Unified School District Community Facilities
District No. 2005-2
Special Tax Bonds
Del Rio School Facilities
Series 2007
09/01/37 | | | 5.000 | % | | | 1,000,000 | | | | 882,040 | | |
The accompanying Notes to Financial Statements are an integral part of this statement.
Annual Report 2013
12
Columbia California Tax-Exempt Fund
Portfolio of Investments (continued)
October 31, 2013
Municipal Bonds (continued)
Issue
Description | | Coupon
Rate | | Principal
Amount ($) | | Value ($) | |
Palmdale Civic Authority
Refunding Revenue Bonds
Redevelopment Project No. 1
Series 2009A
07/01/27 | | | 6.000 | % | | | 4,780,000 | | | | 5,209,579 | | |
Pittsburg Redevelopment Agency
Tax Allocation Bonds
Los Medanos Community Development Project
Series 1999 (AMBAC)(c)
08/01/24 | | | 0.000 | % | | | 2,100,000 | | | | 1,227,429 | | |
Poway Unified School District
Special Tax Bonds
Community Facilities District No. 6-4S Ranch
Series 2012
09/01/31 | | | 5.000 | % | | | 1,370,000 | | | | 1,395,372 | | |
Rancho Cucamonga Redevelopment Agency
Tax Allocation Bonds
Housing Set Aside
Series 2007A (NPFGC)
09/01/34 | | | 5.000 | % | | | 3,200,000 | | | | 3,095,232 | | |
Riverside Public Financing Authority
Unrefunded Revenue Bonds
Multiple Loans
Series 1991A
02/01/18 | | | 8.000 | % | | | 15,000 | | | | 15,131 | | |
San Diego Redevelopment Agency
Tax Allocation Bonds
Capital Appreciation
Series 2001 (AGM)(c)
09/01/20 | | | 0.000 | % | | | 3,630,000 | | | | 2,905,053 | | |
San Francisco City & County Redevelopment Agency
Tax Allocation Bonds
Mission Bay North Redevelopment
Series 2009C
08/01/29 | | | 6.000 | % | | | 1,035,000 | | | | 1,134,194 | | |
08/01/39 | | | 6.500 | % | | | 2,625,000 | | | | 2,889,547 | | |
Mission Bay South Redevelopment
Series 2009D
08/01/29 | | | 6.375 | % | | | 1,000,000 | | | | 1,094,510 | | |
San Francisco Redevelopment Projects
Series 2009B
08/01/28 | | | 6.125 | % | | | 1,010,000 | | | | 1,105,496 | | |
08/01/32 | | | 6.500 | % | | | 500,000 | | | | 545,895 | | |
Series 2011B
08/01/26 | | | 6.125 | % | | | 500,000 | | | | 562,550 | | |
08/01/31 | | | 6.250 | % | | | 2,600,000 | | | | 2,825,004 | | |
08/01/41 | | | 6.625 | % | | | 1,600,000 | | | | 1,743,136 | | |
Santa Monica Redevelopment Agency
Tax Allocation Bonds
Earthquake Recovery Redevelopment
Series 2011
07/01/36 | | | 5.875 | % | | | 1,250,000 | | | | 1,379,912 | | |
Municipal Bonds (continued)
Issue
Description | | Coupon
Rate | | Principal
Amount ($) | | Value ($) | |
Santee Community Development Commission
Tax Allocation Bonds
Santee Community Redevelopment Project
Series 2011A
08/01/31 | | | 7.000 | % | | | 1,000,000 | | | | 1,161,830 | | |
Sulphur Springs Union School District
Refunding Special Tax Bonds
Community Facilities District No. 2002-1-SE
Series 2012
09/01/30 | | | 5.000 | % | | | 1,270,000 | | | | 1,273,518 | | |
09/01/31 | | | 5.000 | % | | | 1,365,000 | | | | 1,358,530 | | |
09/01/33 | | | 5.000 | % | | | 1,000,000 | | | | 983,870 | | |
Temecula Redevelopment Agency
Tax Allocation Bonds
Housing Redevelopment Project No. 1
Series 2011A
08/01/31 | | | 6.750 | % | | | 1,000,000 | | | | 1,154,950 | | |
08/01/39 | | | 7.000 | % | | | 2,100,000 | | | | 2,425,248 | | |
Union City Community Redevelopment Agency
Tax Allocation Bonds
Subordinated Lien-Community Redevelopment Project
Series 2011
12/01/33 | | | 6.875 | % | | | 1,500,000 | | | | 1,742,415 | | |
West Covina Community Development Commission
Refunding Special Tax Bonds
Fashion Plaza
Series 1996
09/01/17 | | | 6.000 | % | | | 2,435,000 | | | | 2,643,753 | | |
Yorba Linda Redevelopment Agency
Tax Allocation Bonds
Subordinated Lien-Redevelopment Project
Series 2011A
09/01/26 | | | 6.000 | % | | | 1,000,000 | | | | 1,111,500 | | |
09/01/32 | | | 6.500 | % | | | 2,000,000 | | | | 2,261,460 | | |
Total | | | | | | | 95,533,946 | | |
State Appropriated 6.8% | |
California State Public Works Board
Refunding Revenue Bonds
Department of Corrections State Prisons
Series 1993A (AMBAC)
12/01/19 | | | 5.000 | % | | | 6,000,000 | | | | 6,680,880 | | |
Various Capital Projects
Series 2012G
11/01/29 | | | 5.000 | % | | | 2,500,000 | | | | 2,658,250 | | |
Revenue Bonds
Judicial Council Projects
Series 2011D
12/01/31 | | | 5.000 | % | | | 5,100,000 | | | | 5,299,053 | | |
Series 2013A
03/01/32 | | | 5.000 | % | | | 1,500,000 | | | | 1,560,030 | | |
State University Projects
Series 2011B
10/01/31 | | | 5.000 | % | | | 1,200,000 | | | | 1,239,540 | | |
The accompanying Notes to Financial Statements are an integral part of this statement.
Annual Report 2013
13
Columbia California Tax-Exempt Fund
Portfolio of Investments (continued)
October 31, 2013
Municipal Bonds (continued)
Issue
Description | | Coupon
Rate | | Principal
Amount ($) | | Value ($) | |
Various Capital Projects
Series 2011A
10/01/31 | | | 5.125 | % | | | 5,000,000 | | | | 5,233,150 | | |
Subordinated Series 2009I-1
11/01/29 | | | 6.125 | % | | | 5,000,000 | | | | 5,805,950 | | |
Subordinated Series 2010A-1
03/01/35 | | | 6.000 | % | | | 2,750,000 | | | | 3,123,642 | | |
Total | | | | | | | 31,600,495 | | |
State General Obligation 12.4% | |
State of California
Unlimited General Obligation Bonds
Series 2003 (AMBAC)
02/01/27 | | | 5.000 | % | | | 1,140,000 | | | | 1,294,048 | | |
Series 2008
08/01/34 | | | 5.000 | % | | | 3,000,000 | | | | 3,140,340 | | |
Series 2010
11/01/29 | | | 5.200 | % | | | 1,000,000 | | | | 1,099,010 | | |
Various Purpose
Series 2005
03/01/32 | | | 5.000 | % | | | 1,000,000 | | | | 1,028,530 | | |
Series 2007
12/01/31 | | | 5.000 | % | | | 3,500,000 | | | | 3,669,855 | | |
12/01/32 | | | 5.000 | % | | | 5,000,000 | | | | 5,230,600 | | |
Series 2009
04/01/25 | | | 5.625 | % | | | 500,000 | | | | 573,500 | | |
10/01/29 | | | 5.000 | % | | | 4,500,000 | | | | 4,744,575 | | |
04/01/31 | | | 5.750 | % | | | 2,750,000 | | | | 3,072,933 | | |
04/01/35 | | | 6.000 | % | | | 4,000,000 | | | | 4,584,960 | | |
04/01/38 | | | 6.000 | % | | | 10,500,000 | | | | 11,956,770 | | |
11/01/39 | | | 5.500 | % | | | 4,965,000 | | | | 5,361,555 | | |
Series 2010
03/01/24 | | | 5.250 | % | | | 1,000,000 | | | | 1,144,490 | | |
03/01/30 | | | 5.250 | % | | | 1,000,000 | | | | 1,090,880 | | |
03/01/33 | | | 6.000 | % | | | 4,000,000 | | | | 4,677,240 | | |
03/01/40 | | | 5.500 | % | | | 4,800,000 | | | | 5,201,808 | | |
Unrefunded Unlimited General Obligation Bonds
Series 2000
05/01/26 | | | 5.625 | % | | | 95,000 | | | | 95,393 | | |
Series 2004
04/01/29 | | | 5.300 | % | | | 2,000 | | | | 2,031 | | |
Total | | | | | | | 57,968,518 | | |
Turnpike/Bridge/Toll Road 2.4% | |
Foothill-Eastern Transportation Corridor Agency
Refunding Revenue Bonds
Capital Appreciation
Series 1999
01/15/26 | | | 5.875 | % | | | 1,500,000 | | | | 1,510,455 | | |
Series 1999
01/15/40 | | | 5.750 | % | | | 5,500,000 | | | | 5,354,360 | | |
Municipal Bonds (continued)
Issue
Description | | Coupon
Rate | | Principal
Amount ($) | | Value ($) | |
Revenue Bonds
Senior Lien
Series 1995A (NPFGC)
01/01/35 | | | 5.000 | % | | | 2,000,000 | | | | 1,817,560 | | |
Riverside County Transportation Commission
Revenue Bonds
Senior Lien
Series 2013A
06/01/48 | | | 5.750 | % | | | 1,500,000 | | | | 1,488,315 | | |
San Joaquin Hills Transportation Corridor Agency
Revenue Bonds
Senior Lien
Series 1993
01/01/33 | | | 5.000 | % | | | 1,100,000 | | | | 977,911 | | |
Total | | | | | | | 11,148,601 | | |
Water & Sewer 2.7% | |
City of Big Bear Lake Water
Refunding Revenue Bonds
Series 1996 (NPFGC)
04/01/15 | | | 6.000 | % | | | 715,000 | | | | 738,552 | | |
City of Lodi
Certificate of Participation
Series 2007A (AGM)
10/01/37 | | | 5.000 | % | | | 1,250,000 | | | | 1,274,412 | | |
Eastern Municipal Water District
Certificate of Participation
Series 2008H
07/01/33 | | | 5.000 | % | | | 1,000,000 | | | | 1,044,730 | | |
Rowland Water District
Certificate of Participation
Recycled Water Project
Series 2008
12/01/39 | | | 6.250 | % | | | 2,235,000 | | | | 2,532,680 | | |
San Diego Public Facilities Financing Authority Sewer
Revenue Bonds
Senior Series 2009A
05/15/34 | | | 5.250 | % | | | 1,500,000 | | | | 1,607,895 | | |
05/15/39 | | | 5.250 | % | | | 3,000,000 | | | | 3,170,040 | | |
San Diego Public Facilities Financing Authority
Revenue Bonds
Series 2009B
08/01/34 | | | 5.375 | % | | | 2,000,000 | | | | 2,188,720 | | |
Total | | | | | | | 12,557,029 | | |
Total Municipal Bonds
(Cost: $432,299,758) | | | | | | | 456,854,389 | | |
The accompanying Notes to Financial Statements are an integral part of this statement.
Annual Report 2013
14
Columbia California Tax-Exempt Fund
Portfolio of Investments (continued)
October 31, 2013
Floating Rate Notes 0.4%
Issue
Description | | Effective
Yield | | Principal
Amount ($) | | Value ($) | |
California Pollution Control Financing Authority
Refunding Revenue Bonds
Pacific Gas & Electric Co.
VRDN Series 1996C (JP Morgan Chase Bank)(g)(h)
11/01/26 | | | 0.060 | % | | | 1,000,000 | | | | 1,000,000 | | |
State of California
Unlimited General Obligation Bonds
VRDN Subordinated Series 2005B-7 (JPMorgan Chase
Bank)(g)(h)
05/01/40 | | | 0.070 | % | | | 1,000,000 | | | | 1,000,000 | | |
Total Floating Rate Notes
(Cost: $2,000,000) | | | | | | | 2,000,000 | | |
Money Market Funds 0.9%
| | | Shares | | Value ($) | |
Dreyfus General California
Municipal Money Market Fund,
0.000%(i) | | | 2,311,912 | | | | 2,311,912 | | |
JPMorgan Tax-Free Money Market Fund,
0.010%(i) | | | 2,071,583 | | | | 2,071,583 | | |
Total Money Market Funds
(Cost: $4,383,495) | | | | | 4,383,495 | | |
Total Investments
(Cost: $438,683,253) | | | | | 463,237,884 | | |
Other Assets & Liabilities, Net | | | | | 5,192,446 | | |
Net Assets | | | | | 468,430,330 | | |
Notes to Portfolio of Investments
(a) Income from this security may be subject to alternative minimum tax.
(b) Variable rate security.
(c) Zero coupon bond.
(d) Municipal obligations include debt obligations issued by or on behalf of territories, possessions, or sovereign nations within the territorial boundaries of the United States. At October 31, 2013, the value of these securities amounted to $2,554,890 or 0.55% of net assets.
(e) Security exempt from registration pursuant to Rule 144A under the Securities Act of 1933. This security may be resold in transactions exempt from registration, normally to qualified institutional buyers. At October 31, 2013, the value of these securities amounted to $2,832,031 or 0.60% of net assets.
(f) Identifies issues considered to be illiquid as to their marketability. The aggregate value of such securities at October 31, 2013 was $2,832,031, representing 0.60% of net assets. Information concerning such security holdings at October 31, 2013 is as follows:
Security Description | | Acquisition Dates | | Cost ($) | |
California Municipal Finance Authority
Revenue Bonds
UTS Renewable Energy - Waste Water
Series 2011 AMT
12/01/32 7.500% | | 12/22/11 | | | 2,885,000 | | |
(g) Interest rate varies to reflect current market conditions; rate shown is the effective rate on October 31, 2013.
(h) The Fund is entitled to receive principal and interest from the guarantor after a day or a week's notice or upon maturity. The maturity date disclosed represents the final maturity.
(i) The rate shown is the seven-day current annualized yield at October 31, 2013.
Abbreviation Legend
AGM Assured Guaranty Municipal Corporation
AMBAC Ambac Assurance Corporation
AMT Alternative Minimum Tax
FGIC Financial Guaranty Insurance Company
FHLMC Federal Home Loan Mortgage Corporation
GNMA Government National Mortgage Association
NPFGC National Public Finance Guarantee Corporation
VRDN Variable Rate Demand Note
The accompanying Notes to Financial Statements are an integral part of this statement.
Annual Report 2013
15
Columbia California Tax-Exempt Fund
Portfolio of Investments (continued)
October 31, 2013
Fair Value Measurements
Generally accepted accounting principles (GAAP) require disclosure regarding the inputs and valuation techniques used to measure fair value and any changes in valuation inputs or techniques. In addition, investments shall be disclosed by major category.
The Fund categorizes its fair value measurements according to a three-level hierarchy that maximizes the use of observable inputs and minimizes the use of unobservable inputs by prioritizing that the most observable input be used when available. Observable inputs are those that market participants would use in pricing an investment based on market data obtained from sources independent of the reporting entity. Unobservable inputs are those that reflect the Fund's assumptions about the information market participants would use in pricing an investment. An investment's level within the fair value hierarchy is based on the lowest level of any input that is deemed significant to the asset or liability's fair value measurement. The input levels are not necessarily an indication of the risk or liquidity associated with investments at that level. For example, certain U.S. government securities are generally high quality and liquid, however, they are reflected as Level 2 because the inputs used to determine fair value may not always be quoted prices in an active market.
Fair value inputs are summarized in the three broad levels listed below:
> Level 1 — Valuations based on quoted prices for investments in active markets that the Fund has the ability to access at the measurement date (including NAV for open-end mutual funds). Valuation adjustments are not applied to Level 1 investments.
> Level 2 — Valuations based on other significant observable inputs (including quoted prices for similar securities, interest rates, prepayment speeds, credit risks, etc.).
> Level 3 — Valuations based on significant unobservable inputs (including the Fund's own assumptions and judgment in determining the fair value of investments).
Inputs that are used in determining fair value of an investment may include price information, credit data, volatility statistics, and other factors. These inputs can be either observable or unobservable. The availability of observable inputs can vary between investments, and is affected by various factors such as the type of investment, and the volume and level of activity for that investment or similar investments in the marketplace. The inputs will be considered by the Investment Manager, along with any other relevant factors in the calculation of an investment's fair value. The Fund uses prices and inputs that are current as of the measurement date, which may include periods of market dislocations. During these periods, the availability of prices and inputs may be reduced for many investments. This condition could cause an investment to be reclassified between the various levels within the hierarchy.
Investments falling into the Level 3 category are primarily supported by quoted prices from brokers and dealers participating in the market for those investments. However, these may be classified as Level 3 investments due to lack of market transparency and corroboration to support these quoted prices. Additionally, valuation models may be used as the pricing source for any remaining investments classified as Level 3. These models may rely on one or more significant unobservable inputs and/or significant assumptions by the Investment Manager. Inputs used in valuations may include, but are not limited to, financial statement analysis, capital account balances, discount rates and estimated cash flows, and comparable company data.
Under the direction of the Fund's Board of Trustees (the Board), the Investment Manager's Valuation Committee (the Committee) is responsible for carrying out the valuation procedures approved by the Board. The Committee consists of voting and non-voting members from various groups within the Investment Manager's organization, including operations and accounting, trading and investments, compliance, risk management and legal.
The Committee meets at least monthly to review and approve valuation matters, which may include a description of specific valuation determinations, data regarding pricing information received from approved pricing vendors and brokers and the results of Board-approved valuation control policies and procedures (the Policies). The Policies address, among other things, instances when market quotations are or are not readily available, including recommendations of third party pricing vendors and a determination of appropriate pricing methodologies; events that require specific valuation determinations and assessment of fair value techniques; securities with a potential for stale pricing, including those that are illiquid, restricted, or in default; and the effectiveness of third-party pricing vendors, including periodic reviews of vendors. The Committee meets more frequently, as needed, to discuss additional valuation matters, which may include the need to review back-testing results, review time-sensitive information or approve related valuation actions. The Committee reports to the Board, with members of the Committee meeting with the Board at each of its regularly scheduled meetings to discuss valuation matters and actions during the period, similar to those described earlier.
For investments categorized as Level 3, the Committee monitors information similar to that described above, which may include: (i) data specific to the issuer or comparable issuers, (ii) general market or specific sector news and (iii) quoted prices and specific or similar security transactions. The Committee considers this data and any changes from prior periods in order to assess the reasonableness of observable and unobservable inputs, any assumptions or internal models used to value those securities and changes in fair value. This data is also used to corroborate, when available, information received from approved pricing vendors and brokers. Various factors impact the frequency of monitoring this information (which may occur as often as daily). However, the Committee may determine that changes to inputs, assumptions and models are not required as a result of the monitoring procedures performed.
The accompanying Notes to Financial Statements are an integral part of this statement.
Annual Report 2013
16
Columbia California Tax-Exempt Fund
Portfolio of Investments (continued)
October 31, 2013
Fair Value Measurements (continued)
The following table is a summary of the inputs used to value the Fund's investments at October 31, 2013:
Description | | Level 1
Quoted Prices in Active
Markets for Identical
Assets ($) | |
Level 2
Other Significant
Observable Inputs ($) | |
Level 3
Significant
Unobservable Inputs ($) | |
Total ($) | |
Bonds | |
Municipal Bonds | | | — | | | | 456,854,389 | | | | — | | | | 456,854,389 | | |
Total Bonds | | | — | | | | 456,854,389 | | | | — | | | | 456,854,389 | | |
Short-Term Securities | |
Floating Rate Notes | | | — | | | | 2,000,000 | | | | — | | | | 2,000,000 | | |
Total Short-Term Securities | | | — | | | | 2,000,000 | | | | — | | | | 2,000,000 | | |
Mutual Funds | |
Money Market Funds | | | 4,383,495 | | | | — | | | | — | | | | 4,383,495 | | |
Total Mutual Funds | | | 4,383,495 | | | | — | | | | — | | | | 4,383,495 | | |
Total | | | 4,383,495 | | | | 458,854,389 | | | | — | | | | 463,237,884 | | |
See the Portfolio of Investments for all investment classifications not indicated in the table.
The Fund's assets assigned to the Level 2 input category are generally valued using the market approach, in which a security's value is determined through reference to prices and information from market transactions for similar or identical assets.
There were no transfers of financial assets between Levels 1 and 2 during the period.
The accompanying Notes to Financial Statements are an integral part of this statement.
Annual Report 2013
17
Columbia California Tax-Exempt Fund
Statement of Assets and Liabilities
October 31, 2013
Assets | |
Investments, at value | |
(identified cost $438,683,253) | | $ | 463,237,884 | | |
Receivable for: | |
Capital shares sold | | | 1,310,049 | | |
Interest | | | 6,285,472 | | |
Expense reimbursement due from Investment Manager | | | 875 | | |
Prepaid expenses | | | 4,863 | | |
Trustees' deferred compensation plan | | | 53,838 | | |
Other assets | | | 1,000 | | |
Total assets | | | 470,893,981 | | |
Liabilities | |
Payable for: | |
Capital shares purchased | | | 569,652 | | |
Dividend distributions to shareholders | | | 1,674,709 | | |
Investment management fees | | | 5,122 | | |
Distribution and/or service fees | | | 3,218 | | |
Transfer agent fees | | | 58,829 | | |
Administration fees | | | 867 | | |
Compensation of board members | | | 24,103 | | |
Chief compliance officer expenses | | | 36 | | |
Other expenses | | | 73,277 | | |
Trustees' deferred compensation plan | | | 53,838 | | |
Total liabilities | | | 2,463,651 | | |
Net assets applicable to outstanding capital stock | | $ | 468,430,330 | | |
Represented by | |
Paid-in capital | | $ | 440,711,676 | | |
Undistributed net investment income | | | 89,825 | | |
Accumulated net realized gain | | | 3,074,198 | | |
Unrealized appreciation (depreciation) on: | |
Investments | | | 24,554,631 | | |
Total — representing net assets applicable to outstanding capital stock | | $ | 468,430,330 | | |
The accompanying Notes to Financial Statements are an integral part of this statement.
Annual Report 2013
18
Columbia California Tax-Exempt Fund
Statement of Assets and Liabilities (continued)
October 31, 2013
Class A | |
Net assets | | $ | 357,344,214 | | |
Shares outstanding | | | 47,373,193 | | |
Net asset value per share | | $ | 7.54 | | |
Maximum offering price per share(a) | | $ | 7.92 | | |
Class B | |
Net assets | | $ | 768,930 | | |
Shares outstanding | | | 101,928 | | |
Net asset value per share | | $ | 7.54 | | |
Class C | |
Net assets | | $ | 39,464,944 | | |
Shares outstanding | | | 5,230,845 | | |
Net asset value per share | | $ | 7.54 | | |
Class R4 | |
Net assets | | $ | 2,376 | | |
Shares outstanding | | | 315 | | |
Net asset value per share(b) | | $ | 7.55 | | |
Class Z | |
Net assets | | $ | 70,849,866 | | |
Shares outstanding | | | 9,389,763 | | |
Net asset value per share | | $ | 7.55 | | |
(a) The maximum offering price per share is calculated by dividing the net asset value per share by 1.0 minus the maximum sales charge of 4.75%.
(b) Net asset value per share rounds to this amount due to fractional shares outstanding.
The accompanying Notes to Financial Statements are an integral part of this statement.
Annual Report 2013
19
Columbia California Tax-Exempt Fund
Statement of Operations
Year Ended October 31, 2013
Net investment income | |
Income: | |
Dividends | | $ | 379 | | |
Interest | | | 24,723,241 | | |
Total income | | | 24,723,620 | | |
Expenses: | |
Investment management fees | | | 2,089,802 | | |
Distribution and/or service fees | |
Class A | | | 1,003,711 | | |
Class B | | | 11,359 | | |
Class C | | | 436,560 | | |
Transfer agent fees | |
Class A | | | 491,297 | | |
Class B | | | 1,386 | | |
Class C | | | 53,424 | | |
Class R4(a) | | | 2 | | |
Class Z | | | 98,455 | | |
Administration fees | | | 354,853 | | |
Compensation of board members | | | 34,461 | | |
Custodian fees | | | 5,688 | | |
Printing and postage fees | | | 34,103 | | |
Registration fees | | | 40,241 | | |
Professional fees | | | 39,244 | | |
Chief compliance officer expenses | | | 343 | | |
Other | | | 25,137 | | |
Total expenses | | | 4,720,066 | | |
Fees waived or expenses reimbursed by Investment Manager and its affiliates | | | (455,738 | ) | |
Fees waived by Distributor — Class C | | | (131,079 | ) | |
Expense reductions | | | (700 | ) | |
Total net expenses | | | 4,132,549 | | |
Net investment income | | | 20,591,071 | | |
Realized and unrealized gain (loss) — net | |
Net realized gain (loss) on: | |
Investments | | $ | 3,635,525 | | |
Net realized gain | | | 3,635,525 | | |
Net change in unrealized appreciation (depreciation) on: | |
Investments | | | (34,163,023 | ) | |
Net change in unrealized appreciation (depreciation) | | | (34,163,023 | ) | |
Net realized and unrealized loss | | | (30,527,498 | ) | |
Net decrease in net assets from operations | | $ | (9,936,427 | ) | |
(a) For the period from March 19, 2013 (commencement of operations) to October 31, 2013.
The accompanying Notes to Financial Statements are an integral part of this statement.
Annual Report 2013
20
Columbia California Tax-Exempt Fund
Statement of Changes in Net Assets
| | | Year Ended
October 31,
2013(a) | | Year Ended
October 31,
2012 | |
Operations | |
Net investment income | | $ | 20,591,071 | | | $ | 21,807,326 | | |
Net realized gain | | | 3,635,525 | | | | 2,296,555 | | |
Net change in unrealized appreciation (depreciation) | | | (34,163,023 | ) | | | 41,126,087 | | |
Net increase (decrease) in net assets resulting from operations | | | (9,936,427 | ) | | | 65,229,968 | | |
Distributions to shareholders | |
Net investment income | | | | | |
Class A | | | (15,699,029 | ) | | | (16,846,780 | ) | |
Class B | | | (35,598 | ) | | | (59,769 | ) | |
Class C | | | (1,511,619 | ) | | | (1,480,827 | ) | |
Class R4 | | | (63 | ) | | | — | | |
Class Z | | | (3,345,308 | ) | | | (3,417,858 | ) | |
Net realized gains | | | | | |
Class A | | | (276,495 | ) | | | — | | |
Class B | | | (932 | ) | | | — | | |
Class C | | | (29,562 | ) | | | — | | |
Class Z | | | (54,442 | ) | | | — | | |
Total distributions to shareholders | | | (20,953,048 | ) | | | (21,805,234 | ) | |
Increase (decrease) in net assets from capital stock activity | | | (62,827,380 | ) | | | (6,354,597 | ) | |
Total increase (decrease) in net assets | | | (93,716,855 | ) | | | 37,070,137 | | |
Net assets at beginning of year | | | 562,147,185 | | | | 525,077,048 | | |
Net assets at end of year | | $ | 468,430,330 | | | $ | 562,147,185 | | |
Undistributed net investment income | | $ | 89,825 | | | $ | 90,371 | | |
(a) Class R4 shares are for the period from March 19, 2013 (commencement of operations) to October 31, 2013.
The accompanying Notes to Financial Statements are an integral part of this statement.
Annual Report 2013
21
Columbia California Tax-Exempt Fund
Statement of Changes in Net Assets (continued)
| | | Year Ended October 31, 2013(a) | | Year Ended October 31, 2012 | |
| | | Shares | | Dollars ($) | | Shares | | Dollars ($) | |
Capital stock activity | |
Class A shares | |
Subscriptions(b) | | | 2,100,772 | | | | 16,607,171 | | | | 3,499,638 | | | | 27,061,115 | | |
Distributions reinvested | | | 1,531,575 | | | | 11,942,961 | | | | 1,535,440 | | | | 11,955,391 | | |
Redemptions | | | (10,137,669 | ) | | | (78,339,999 | ) | | | (6,376,320 | ) | | | (49,402,686 | ) | |
Net decrease | | | (6,505,322 | ) | | | (49,789,867 | ) | | | (1,341,242 | ) | | | (10,386,180 | ) | |
Class B shares | |
Subscriptions | | | 2,410 | | | | 19,341 | | | | 3,011 | | | | 23,390 | | |
Distributions reinvested | | | 4,146 | | | | 32,508 | | | | 6,146 | | | | 47,801 | | |
Redemptions(b) | | | (86,763 | ) | | | (675,142 | ) | | | (96,661 | ) | | | (756,737 | ) | |
Net decrease | | | (80,207 | ) | | | (623,293 | ) | | | (87,504 | ) | | | (685,546 | ) | |
Class C shares | |
Subscriptions | | | 804,466 | | | | 6,360,219 | | | | 1,162,896 | | | | 9,019,211 | | |
Distributions reinvested | | | 96,897 | | | | 754,731 | | | | 81,998 | | | | 639,123 | | |
Redemptions | | | (1,384,378 | ) | | | (10,756,621 | ) | | | (820,922 | ) | | | (6,316,408 | ) | |
Net increase (decrease) | | | (483,015 | ) | | | (3,641,671 | ) | | | 423,972 | | | | 3,341,926 | | |
Class R4 shares | |
Subscriptions | | | 314 | | | | 2,500 | | | | — | | | | — | | |
Distributions reinvested | | | 1 | | | | 9 | | | | — | | | | — | | |
Net increase | | | 315 | | | | 2,509 | | | | — | | | | — | | |
Class Z shares | |
Subscriptions | | | 1,445,948 | | | | 11,366,678 | | | | 1,687,077 | | | | 13,109,221 | | |
Distributions reinvested | | | 51,005 | | | | 397,710 | | | | 33,737 | | | | 263,937 | | |
Redemptions | | | (2,657,247 | ) | | | (20,539,446 | ) | | | (1,543,794 | ) | | | (11,997,955 | ) | |
Net increase (decrease) | | | (1,160,294 | ) | | | (8,775,058 | ) | | | 177,020 | | | | 1,375,203 | | |
Total net decrease | | | (8,228,523 | ) | | | (62,827,380 | ) | | | (827,754 | ) | | | (6,354,597 | ) | |
(a) Class R4 shares are for the period from March 19, 2013 (commencement of operations) to October 31, 2013.
(b) Includes conversions of Class B shares to Class A shares, if any.
The accompanying Notes to Financial Statements are an integral part of this statement.
Annual Report 2013
22
Columbia California Tax-Exempt Fund
The following tables are intended to help you understand the Fund's financial performance. Certain information reflects financial results for a single share of a class held for the periods shown. Per share net investment income (loss) amounts are calculated based on average shares outstanding during the period. Total return assumes reinvestment of all dividends and distributions, if any. Total return does not reflect payment of sales charges, if any, and is not annualized for periods of less than one year.
| | | Year Ended October 31, | |
Class A | | 2013 | | 2012 | | 2011 | | 2010 | | 2009 | |
Per share data | |
Net asset value, beginning of period | | $ | 7.99 | | | $ | 7.38 | | | $ | 7.64 | | | $ | 7.30 | | | $ | 6.71 | | |
Income from investment operations: | |
Net investment income | | | 0.31 | | | | 0.31 | | | | 0.31 | | | | 0.32 | | | | 0.31 | | |
Net realized and unrealized gain (loss) | | | (0.45 | ) | | | 0.61 | | | | (0.12 | ) | | | 0.36 | | | | 0.59 | | |
Total from investment operations | | | (0.14 | ) | | | 0.92 | | | | 0.19 | | | | 0.68 | | | | 0.90 | | |
Less distributions to shareholders: | |
Net investment income | | | (0.30 | ) | | | (0.31 | ) | | | (0.31 | ) | | | (0.32 | ) | | | (0.30 | ) | |
Net realized gains | | | (0.01 | ) | | | — | | | | (0.14 | ) | | | (0.02 | ) | | | (0.01 | ) | |
Total distributions to shareholders | | | (0.31 | ) | | | (0.31 | ) | | | (0.45 | ) | | | (0.34 | ) | | | (0.31 | ) | |
Proceeds from regulatory settlements | | | — | | | | — | | | | — | | | | — | | | | 0.00 | (a) | |
Net asset value, end of period | | $ | 7.54 | | | $ | 7.99 | | | $ | 7.38 | | | $ | 7.64 | | | $ | 7.30 | | |
Total return | | | (1.80 | %) | | | 12.63 | % | | | 2.84 | % | | | 9.52 | % | | | 13.76 | % | |
Ratios to average net assets(b) | |
Total gross expenses | | | 0.87 | % | | | 0.86 | % | | | 0.92 | % | | | 0.87 | % | | | 0.86 | % | |
Total net expenses(c) | | | 0.78 | %(d) | | | 0.78 | %(d) | | | 0.81 | %(d) | | | 0.84 | %(d) | | | 0.84 | %(d) | |
Net investment income | | | 3.91 | % | | | 3.97 | % | | | 4.30 | % | | | 4.25 | % | | | 4.38 | % | |
Supplemental data | |
Net assets, end of period (in thousands) | | $ | 357,344 | | | $ | 430,657 | | | $ | 407,479 | | | $ | 259,552 | | | $ | 265,594 | | |
Portfolio turnover | | | 14 | % | | | 14 | % | | | 28 | % | | | 12 | % | | | 14 | % | |
Notes to Financial Highlights
(a) Rounds to zero.
(b) In addition to the fees and expenses which the Fund bears directly, the Fund indirectly bears a pro rata share of the fees and expenses of the acquired funds in which it invests. Such indirect expenses are not included in the reported expense ratios.
(c) Total net expenses include the impact of certain waivers/reimbursements made by the Investment Manager and certain of its affiliates, if applicable.
(d) The benefits derived from expense reductions had an impact of less than 0.01%.
The accompanying Notes to Financial Statements are an integral part of this statement.
Annual Report 2013
23
Columbia California Tax-Exempt Fund
Financial Highlights (continued)
| | | Year Ended October 31, | |
Class B | | 2013 | | 2012 | | 2011 | | 2010 | | 2009 | |
Per share data | |
Net asset value, beginning of period | | $ | 7.99 | | | $ | 7.38 | | | $ | 7.64 | | | $ | 7.30 | | | $ | 6.71 | | |
Income from investment operations: | |
Net investment income | | | 0.25 | | | | 0.25 | | | | 0.25 | | | | 0.26 | | | | 0.26 | | |
Net realized and unrealized gain (loss) | | | (0.45 | ) | | | 0.61 | | | | (0.12 | ) | | | 0.36 | | | | 0.59 | | |
Total from investment operations | | | (0.20 | ) | | | 0.86 | | | | 0.13 | | | | 0.62 | | | | 0.85 | | |
Less distributions to shareholders: | |
Net investment income | | | (0.24 | ) | | | (0.25 | ) | | | (0.25 | ) | | | (0.26 | ) | | | (0.25 | ) | |
Net realized gains | | | (0.01 | ) | | | — | | | | (0.14 | ) | | | (0.02 | ) | | | (0.01 | ) | |
Total distributions to shareholders | | | (0.25 | ) | | | (0.25 | ) | | | (0.39 | ) | | | (0.28 | ) | | | (0.26 | ) | |
Proceeds from regulatory settlements | | | — | | | | — | | | | — | | | | — | | | | 0.00 | (a) | |
Net asset value, end of period | | $ | 7.54 | | | $ | 7.99 | | | $ | 7.38 | | | $ | 7.64 | | | $ | 7.30 | | |
Total return | | | (2.53 | %) | | | 11.78 | % | | | 2.06 | % | | | 8.71 | % | | | 12.92 | % | |
Ratios to average net assets(b) | |
Total gross expenses | | | 1.62 | % | | | 1.61 | % | | | 1.68 | % | | | 1.62 | % | | | 1.61 | % | |
Total net expenses(c) | | | 1.53 | %(d) | | | 1.53 | %(d) | | | 1.58 | %(d) | | | 1.59 | %(d) | | | 1.59 | %(d) | |
Net investment income | | | 3.13 | % | | | 3.22 | % | | | 3.53 | % | | | 3.52 | % | | | 3.65 | % | |
Supplemental data | |
Net assets, end of period (in thousands) | | $ | 769 | | | $ | 1,456 | | | $ | 1,989 | | | $ | 2,095 | | | $ | 5,377 | | |
Portfolio turnover | | | 14 | % | | | 14 | % | | | 28 | % | | | 12 | % | | | 14 | % | |
Notes to Financial Highlights
(a) Rounds to zero.
(b) In addition to the fees and expenses which the Fund bears directly, the Fund indirectly bears a pro rata share of the fees and expenses of the acquired funds in which it invests. Such indirect expenses are not included in the reported expense ratios.
(c) Total net expenses include the impact of certain waivers/reimbursements made by the Investment Manager and certain of its affiliates, if applicable.
(d) The benefits derived from expense reductions had an impact of less than 0.01%.
The accompanying Notes to Financial Statements are an integral part of this statement.
Annual Report 2013
24
Columbia California Tax-Exempt Fund
Financial Highlights (continued)
| | | Year Ended October 31, | |
Class C | | 2013 | | 2012 | | 2011 | | 2010 | | 2009 | |
Per share data | |
Net asset value, beginning of period | | $ | 7.99 | | | $ | 7.38 | | | $ | 7.64 | | | $ | 7.30 | | | $ | 6.71 | | |
Income from investment operations: | |
Net investment income | | | 0.27 | | | | 0.27 | | | | 0.28 | | | | 0.28 | | | | 0.28 | | |
Net realized and unrealized gain (loss) | | | (0.44 | ) | | | 0.61 | | | | (0.13 | ) | | | 0.37 | | | | 0.59 | | |
Total from investment operations | | | (0.17 | ) | | | 0.88 | | | | 0.15 | | | | 0.65 | | | | 0.87 | | |
Less distributions to shareholders: | |
Net investment income | | | (0.27 | ) | | | (0.27 | ) | | | (0.27 | ) | | | (0.29 | ) | | | (0.27 | ) | |
Net realized gains | | | (0.01 | ) | | | — | | | | (0.14 | ) | | | (0.02 | ) | | | (0.01 | ) | |
Total distributions to shareholders | | | (0.28 | ) | | | (0.27 | ) | | | (0.41 | ) | | | (0.31 | ) | | | (0.28 | ) | |
Proceeds from regulatory settlements | | | — | | | | — | | | | — | | | | — | | | | 0.00 | (a) | |
Net asset value, end of period | | $ | 7.54 | | | $ | 7.99 | | | $ | 7.38 | | | $ | 7.64 | | | $ | 7.30 | | |
Total return | | | (2.24 | %) | | | 12.12 | % | | | 2.37 | % | | | 9.03 | % | | | 13.25 | % | |
Ratios to average net assets(b) | |
Total gross expenses | | | 1.62 | % | | | 1.61 | % | | | 1.69 | % | | | 1.62 | % | | | 1.61 | % | |
Total net expenses(c) | | | 1.23 | %(d) | | | 1.23 | %(d) | | | 1.27 | %(d) | | | 1.29 | %(d) | | | 1.29 | %(d) | |
Net investment income | | | 3.46 | % | | | 3.52 | % | | | 3.86 | % | | | 3.79 | % | | | 3.91 | % | |
Supplemental data | |
Net assets, end of period (in thousands) | | $ | 39,465 | | | $ | 45,680 | | | $ | 39,040 | | | $ | 32,080 | | | $ | 28,928 | | |
Portfolio turnover | | | 14 | % | | | 14 | % | | | 28 | % | | | 12 | % | | | 14 | % | |
Notes to Financial Highlights
(a) Rounds to zero.
(b) In addition to the fees and expenses which the Fund bears directly, the Fund indirectly bears a pro rata share of the fees and expenses of the acquired funds in which it invests. Such indirect expenses are not included in the reported expense ratios.
(c) Total net expenses include the impact of certain waivers/reimbursements made by the Investment Manager and certain of its affiliates, if applicable.
(d) The benefits derived from expense reductions had an impact of less than 0.01%.
The accompanying Notes to Financial Statements are an integral part of this statement.
Annual Report 2013
25
Columbia California Tax-Exempt Fund
Financial Highlights (continued)
Class R4 | | Year Ended
October 31,
2013(a) | |
Per share data | |
Net asset value, beginning of period | | $ | 7.97 | | |
Income from investment operations: | |
Net investment income | | | 0.20 | | |
Net realized and unrealized loss | | | (0.42 | ) | |
Total from investment operations | | | (0.22 | ) | |
Less distributions to shareholders: | |
Net investment income | | | (0.20 | ) | |
Total distributions to shareholders | | | (0.20 | ) | |
Net asset value, end of period | | $ | 7.55 | | |
Total return | | | (2.75 | %) | |
Ratios to average net assets(b) | |
Total gross expenses | | | 0.60 | %(c) | |
Total net expenses(d) | | | 0.53 | %(c)(e) | |
Net investment income | | | 4.32 | %(c) | |
Supplemental data | |
Net assets, end of period (in thousands) | | $ | 2 | | |
Portfolio turnover | | | 14 | % | |
Notes to Financial Highlights
(a) For the period from March 19, 2013 (commencement of operations) to October 31, 2013.
(b) In addition to the fees and expenses which the Fund bears directly, the Fund indirectly bears a pro rata share of the fees and expenses of the acquired funds in which it invests. Such indirect expenses are not included in the reported expense ratios.
(c) Annualized.
(d) Total net expenses include the impact of certain waivers/reimbursements made by the Investment Manager and certain of its affiliates, if applicable.
(e) The benefits derived from expense reductions had an impact of less than 0.01%.
The accompanying Notes to Financial Statements are an integral part of this statement.
Annual Report 2013
26
Columbia California Tax-Exempt Fund
Financial Highlights (continued)
| | | Year Ended October 31, | |
Class Z | | 2013 | | 2012 | | 2011 | | 2010 | | 2009 | |
Per share data | |
Net asset value, beginning of period | | $ | 8.00 | | | $ | 7.38 | | | $ | 7.64 | | | $ | 7.30 | | | $ | 6.71 | | |
Income from investment operations: | |
Net investment income | | | 0.33 | | | | 0.33 | | | | 0.33 | | | | 0.33 | | | | 0.32 | | |
Net realized and unrealized gain (loss) | | | (0.45 | ) | | | 0.62 | | | | (0.13 | ) | | | 0.37 | | | | 0.60 | | |
Total from investment operations | | | (0.12 | ) | | | 0.95 | | | | 0.20 | | | | 0.70 | | | | 0.92 | | |
Less distributions to shareholders: | |
Net investment income | | | (0.32 | ) | | | (0.33 | ) | | | (0.32 | ) | | | (0.34 | ) | | | (0.32 | ) | |
Net realized gains | | | (0.01 | ) | | | — | | | | (0.14 | ) | | | (0.02 | ) | | | (0.01 | ) | |
Total distributions to shareholders | | | (0.33 | ) | | | (0.33 | ) | | | (0.46 | ) | | | (0.36 | ) | | | (0.33 | ) | |
Proceeds from regulatory settlements | | | — | | | | — | | | | — | | | | — | | | | 0.00 | (a) | |
Net asset value, end of period | | $ | 7.55 | | | $ | 8.00 | | | $ | 7.38 | | | $ | 7.64 | | | $ | 7.30 | | |
Total return | | | (1.54 | %) | | | 13.05 | % | | | 3.05 | % | | | 9.78 | % | | | 14.03 | % | |
Ratios to average net assets(b) | |
Total gross expenses | | | 0.62 | % | | | 0.61 | % | | | 0.70 | % | | | 0.63 | % | | | 0.62 | % | |
Total net expenses(c) | | | 0.53 | %(d) | | | 0.53 | %(d) | | | 0.59 | %(d) | | | 0.60 | %(d) | | | 0.60 | %(d) | |
Net investment income | | | 4.16 | % | | | 4.22 | % | | | 4.57 | % | | | 4.49 | % | | | 4.61 | % | |
Supplemental data | |
Net assets, end of period (in thousands) | | $ | 70,850 | | | $ | 84,354 | | | $ | 76,568 | | | $ | 94,541 | | | $ | 107,246 | | |
Portfolio turnover | | | 14 | % | | | 14 | % | | | 28 | % | | | 12 | % | | | 14 | % | |
Notes to Financial Highlights
(a) Rounds to zero.
(b) In addition to the fees and expenses which the Fund bears directly, the Fund indirectly bears a pro rata share of the fees and expenses of the acquired funds in which it invests. Such indirect expenses are not included in the reported expense ratios.
(c) Total net expenses include the impact of certain waivers/reimbursements made by the Investment Manager and certain of its affiliates, if applicable.
(d) The benefits derived from expense reductions had an impact of less than 0.01%.
The accompanying Notes to Financial Statements are an integral part of this statement.
Annual Report 2013
27
Columbia California Tax-Exempt Fund
Notes to Financial Statements
October 31, 2013
Note 1. Organization
Columbia California Tax-Exempt Fund (the Fund), a series of Columbia Funds Series Trust I (the Trust), is a non-diversified fund. The Trust is registered under the Investment Company Act of 1940, as amended (the 1940 Act), as an open-end management investment company organized as a Massachusetts business trust.
Fund Shares
The Trust may issue an unlimited number of shares (without par value). The Fund offers Class A, Class B, Class C, Class R4 and Class Z shares. Although all share classes generally have identical voting, dividend and liquidation rights, each share class votes separately when required by law. Different share classes pay different distribution amounts to the extent the expenses of such share classes differ, and distributions in liquidation will be proportional to the net asset value of each share class. Each share class has its own expense structure and sales charges, as applicable.
Class A shares are subject to a maximum front-end sales charge of 4.75% based on the initial investment amount. Class A shares purchased without an initial sales charge in accounts aggregating $1 million to $50 million at the time of purchase are subject to a contingent deferred sales charge (CDSC) if the shares are sold within 18 months of purchase, charged as follows: 1.00% CDSC if redeemed within 12 months of purchase, and 0.50% CDSC if redeemed more than 12, but less than 18, months after purchase.
Class B shares may be subject to a maximum CDSC of 5.00% based upon the holding period after purchase. Class B shares will generally convert to Class A shares eight years after purchase. The Fund no longer accepts investments by new or existing investors in the Fund's Class B shares, except in connection with the reinvestment of any dividend and/or capital gain distributions in Class B shares of the Fund and exchanges by existing Class B shareholders of certain other funds within the Columbia Family of Funds.
Class C shares are subject to a 1.00% CDSC on shares redeemed within one year of purchase.
Class R4 shares are not subject to sales charges and are only available to investors purchasing through authorized investment professionals. Class R4 shares commenced operations on March 19, 2013.
Class Z shares are not subject to sales charges and are available only to certain eligible investors, which are subject to different investment minimums.
Note 2. Summary of Significant Accounting Policies
Use of Estimates
The preparation of financial statements in accordance with U.S. generally accepted accounting principles (GAAP) requires management to make certain estimates and assumptions that affect the reported amounts of assets and liabilities, the disclosure of contingent assets and liabilities at the date of the financial statements and the reported amounts of revenue and expenses during the reporting period. Actual results could differ from those estimates.
The following is a summary of significant accounting policies consistently followed by the Fund in the preparation of its financial statements.
Security Valuation
Debt securities generally are valued by pricing services approved by the Board of Trustees (the Board) based upon market transactions for normal, institutional-size trading units of similar securities. The services may use various pricing techniques which take into account appropriate factors such as yield, quality, coupon rate, maturity, type of issue, trading characteristics and other data, as well as broker quotes. Debt securities for which quotations are readily available may also be valued based upon an over-the-counter or exchange bid quotation.
Investments in open-end investment companies, including money market funds, are valued at net asset value.
Short-term securities purchased within 60 days to maturity are valued at amortized cost, which approximates market value. The value of short-term securities originally purchased with maturities greater than 60 days is determined based on an amortized value to par upon reaching 60 days to maturity. Short-term securities maturing in more than 60 days from the valuation date are valued at the market price or approximate market value based on current interest rates.
Investments for which market quotations are not readily available, or that have quotations which management believes are not reliable, are valued at fair value as determined in good faith under consistently applied procedures established by and under the general supervision of the Board. If a security or class of securities (such as foreign securities) is valued at fair value, such value is likely to be different from the last quoted market price for the security.
The determination of fair value often requires significant judgment. To determine fair value, management may use assumptions including but not limited to future cash flows and estimated risk premiums. Multiple inputs from various sources may be used to determine fair value.
Annual Report 2013
28
Columbia California Tax-Exempt Fund
Notes to Financial Statements (continued)
October 31, 2013
Security Transactions
Security transactions are accounted for on the trade date. Cost is determined and gains (losses) are based upon the specific identification method for both financial statement and federal income tax purposes.
Income Recognition
Interest income is recorded on an accrual basis. Market premiums and discounts, including original issue discounts, are amortized and accreted, respectively, over the expected life of the security on all debt securities, unless otherwise noted.
Dividend income is recorded on the ex-dividend date.
Expenses
General expenses of the Trust are allocated to the Fund and other funds of the Trust based upon relative net assets or other expense allocation methodologies determined by the nature of the expense. Expenses directly attributable to the Fund are charged to the Fund. Expenses directly attributable to a specific class of shares are charged to that share class.
Determination of Class Net Asset Value
All income, expenses (other than class-specific expenses, which are charged to that share class, as shown in the Statement of Operations) and realized and unrealized gains (losses) are allocated to each class of the Fund on a daily basis, based on the relative net assets of each class, for purposes of determining the net asset value of each class.
Federal Income Tax Status
The Fund intends to qualify each year as a regulated investment company under Subchapter M of the Internal Revenue Code, as amended, and will distribute substantially all of its tax exempt and taxable income (including net short-term capital gains), if any, for its tax year, and as such will not be subject to federal income taxes. In addition, the Fund intends to distribute in each calendar year substantially all of its net investment income, capital gains and certain other amounts, if any, such that the Fund should not be subject to federal excise tax. Therefore, no federal income or excise tax provision is recorded.
Distributions to Shareholders
Distributions from net investment income, if any, are declared daily and paid monthly. Net realized capital gains, if any, are distributed at least annually. Income distributions and capital gain distributions are determined in accordance with federal income tax regulations, which may differ from GAAP.
Guarantees and Indemnifications
Under the Trust's organizational documents and, in some cases, by contract, its officers and trustees are indemnified
against certain liabilities arising out of the performance of their duties to the Trust or its funds. In addition, certain of the Fund's contracts with its service providers contain general indemnification clauses. The Fund's maximum exposure under these arrangements is unknown since the amount of any future claims that may be made against the Fund cannot be determined, and the Fund has no historical basis for predicting the likelihood of any such claims.
Recent Accounting Pronouncement
Disclosures about Offsetting Assets and Liabilities
In December 2011, the Financial Accounting Standards Board (FASB) issued Accounting Standards Update (ASU) No. 2011-11, Disclosures about Offsetting Assets and Liabilities and in January 2013, ASU No. 2013-1, Clarifying the Scope of Disclosures about Offsetting Assets and Liabilities (collectively, the ASUs). Specifically, the ASUs require an entity to disclose both gross and net information for derivatives and other financial instruments that are subject to a master netting arrangement or similar agreement. The ASUs require disclosure of collateral received in connection with the master netting agreements or similar agreements. The disclosure requirements are effective for interim and annual periods beginning on or after January 1, 2013. At this time, management is evaluating the implications of this guidance and the impact it will have on the financial statement amounts and footnote disclosures, if any.
Note 3. Fees and Compensation Paid to Affiliates
Investment Management Fees
Under an Investment Management Services Agreement, Columbia Management Investment Advisers, LLC (the Investment Manager), a wholly-owned subsidiary of Ameriprise Financial, Inc. (Ameriprise Financial), determines which securities will be purchased, held or sold. The investment management fee is an annual fee that is equal to a percentage of the Fund's average daily net assets that declines from 0.40% to 0.27% as the Fund's net assets increase. The effective investment management fee rate for the year ended October 31, 2013 was 0.40% of the Fund's average daily net assets.
Administration Fees
Under an Administrative Services Agreement, the Investment Manager also serves as the Fund Administrator. The Fund pays the Fund Administrator an annual fee for administration and accounting services equal to a percentage of the Fund's average daily net assets that declines from 0.07% to 0.04% as the Fund's net assets increase. The effective administration fee rate for the year ended October 31, 2013 was 0.07% of the Fund's average daily net assets.
Annual Report 2013
29
Columbia California Tax-Exempt Fund
Notes to Financial Statements (continued)
October 31, 2013
Compensation of Board Members
Board members are compensated for their services to the Fund as disclosed in the Statement of Operations. The Trust's eligible Trustees may participate in a Deferred Compensation Plan (the Plan) which may be terminated at any time. Obligations of the Plan will be paid solely out of the Fund's assets.
Compensation of Chief Compliance Officer
The Board has appointed a Chief Compliance Officer to the Fund in accordance with federal securities regulations. The Fund pays its pro-rata share of the expenses associated with the Chief Compliance Officer. The Fund's expenses for the Chief Compliance Officer will not exceed $15,000 per year.
Transfer Agent Fees
Under a Transfer and Dividend Disbursing Agent Agreement, Columbia Management Investment Services Corp. (the Transfer Agent), an affiliate of the Investment Manager and a wholly-owned subsidiary of Ameriprise Financial, is responsible for providing transfer agency services to the Fund. The Transfer Agent has contracted with Boston Financial Data Services (BFDS) to serve as sub-transfer agent.
The Transfer Agent receives monthly account-based service fees based on the number of open accounts and also receives sub-transfer agency fees based on a percentage of the average aggregate value of the Fund's shares maintained in omnibus accounts (other than omnibus accounts for which American Enterprise Investment Services Inc. is the broker of record or accounts where the beneficial shareholder is a customer of Ameriprise Financial Services, Inc., which are paid a per account fee). The Transfer Agent pays the fees of BFDS for services as sub-transfer agent and is not entitled to reimbursement for such fees from the Fund (with the exception of out-of-pocket fees).
The Transfer Agent also receives compensation from fees for various shareholder services and reimbursements for certain out-of-pocket fees.
For the year ended October 31, 2013, the Fund's effective transfer agent fee rates as a percentage of average daily net assets of each class were as follows:
Class A | | | 0.12 | % | |
Class B | | | 0.12 | | |
Class C | | | 0.12 | | |
Class R4 | | | 0.14 | * | |
Class Z | | | 0.12 | | |
*Annualized.
The Fund and certain other associated investment companies, have severally, but not jointly, guaranteed the performance
and observance of all the terms and conditions of a lease entered into by Seligman Data Corp. (SDC), the former transfer agent, including the payment of rent by SDC (the Guaranty). The lease and the Guaranty expire in January 2019. At October 31, 2013, the Fund's total potential future obligation over the life of the Guaranty is $66,506. The liability remaining at October 31, 2013 for non-recurring charges associated with the lease amounted to $32,919 and is recorded as a part of the payable for other expenses in the Statement of Assets and Liabilities.
An annual minimum account balance fee of $20 may apply to certain accounts with a value below the applicable share class' initial minimum investment requirements to reduce the impact of small accounts on transfer agent fees. These minimum account balance fees are recorded as part of expense reductions in the Statement of Operations. For the year ended October 31, 2013, these minimum account balance fees reduced total expenses by $700.
Distribution and Service Fees
The Fund has an agreement with Columbia Management Investment Distributors, Inc. (the Distributor), an affiliate of the Investment Manager and a wholly-owned subsidiary of Ameriprise Financial, for distribution and shareholder services. Pursuant to Rule 12b-1 under the 1940 Act, the Board has approved, and the Fund has adopted, distribution and shareholder service plans (the Plans) which set the distribution and service fees for the Fund. These fees are calculated daily and are intended to compensate the Distributor and/or eligible selling and/or servicing agents for selling shares of the Fund and providing services to investors.
Under the Plans, the Fund pays a monthly service fee to the Distributor at the maximum annual rate of 0.25% of the average daily net assets attributable to Class A, Class B and Class C shares of the Fund. Also under the Plans, the Fund pays a monthly distribution fee to the Distributor at the maximum annual rate of 0.75% of the average daily net assets attributable to Class B and Class C shares only.
The Distributor has voluntarily agreed to waive a portion of the distribution fee for Class C shares so that the distribution fee does not exceed 0.45% annually of the average daily net assets attributable to Class C shares. This arrangement may be modified or terminated by the Distributor at any time.
Sales Charges
Sales charges, including front-end charges and CDSCs, received by the Distributor for distributing Fund shares were $175,307 for Class A, $200 for Class B and $6,031 for Class C shares for the year ended October 31, 2013.
Annual Report 2013
30
Columbia California Tax-Exempt Fund
Notes to Financial Statements (continued)
October 31, 2013
Expenses Waived/Reimbursed by the Investment Manager and its Affiliates
The Investment Manager and certain of its affiliates have contractually agreed to waive fees and/or reimburse expenses (excluding certain fees and expenses described below) for the periods disclosed below, unless sooner terminated at the sole discretion of the Board, so that the Fund's net operating expenses, after giving effect to fees waived/expenses reimbursed and any balance credits and/or overdraft charges from the Fund's custodian, do not exceed the following annual rates as a percentage of the class' average daily net assets:
| | | March 1, 2013
through
February 28, 2014 | | Prior to
March 1, 2013 | |
Class A | | | 0.78 | % | | | 0.79 | % | |
Class B | | | 1.53 | | | | 1.54 | | |
Class C | | | 1.53 | | | | 1.54 | | |
Class R4 | | | 0.53 | * | | | — | | |
Class Z | | | 0.53 | | | | 0.54 | | |
*Annual rate is contractual from March 19, 2013 (the commencement of operations of Class R4 shares) through February 28, 2014.
Under the agreement governing these fee waivers and/or expense reimbursement arrangements, the following fees and expenses are excluded from the waiver/reimbursement commitment, and therefore will be paid by the Fund, if applicable: taxes (including foreign transaction taxes), expenses associated with investments in affiliated and non-affiliated pooled investment vehicles (including mutual funds and exchange traded funds), transaction costs and brokerage commissions, costs related to any securities lending program, dividend expenses associated with securities sold short, inverse floater program fees and expenses, transaction charges and interest on borrowed money, interest, extraordinary expenses and any other expenses the exclusion of which is specifically approved by the Board. This agreement may be modified or amended only with approval from all parties. Class C distribution fees waived by the Distributor, as discussed above, are in addition to the waiver/reimbursement commitment under the agreement.
Note 4. Federal Tax Information
The timing and character of income and capital gain distributions are determined in accordance with income tax regulations, which may differ from GAAP because of temporary or permanent book to tax differences.
At October 31, 2013, these differences are primarily due to differing treatment for Trustees' deferred compensation, distributions, principal and/or interest of fixed income securities, and tax straddles. To the extent these differences are
permanent, reclassifications are made among the components of the Fund's net assets in the Statement of Assets and Liabilities. Temporary differences do not require reclassifications.
The Fund did not have any permanent differences; therefore, no reclassifications were made to the Statement of Assets and Liabilities.
The tax character of distributions paid during the years indicated was as follows:
Year Ended October 31, | | 2013 | | 2012 | |
Tax-exempt income | | $ | 20,549,016 | | | $ | 21,740,939 | | |
Ordinary income | | | 42,601 | | | | 64,295 | | |
Long-term capital gains | | | 361,431 | | | | — | | |
Total | | $ | 20,953,048 | | | $ | 21,805,234 | | |
Short-term capital gain distributions, if any, are considered ordinary income distributions for tax purposes.
At October 31, 2013, the components of distributable earnings on a tax basis were as follows:
Undistributed tax-exempt income | | $ | 1,831,426 | | |
Undistributed accumulated long-term capital gains | | | 3,545,529 | | |
Unrealized appreciation | | | 24,161,247 | | |
At October 31, 2013, the cost of investments for federal income tax purposes was $439,076,637 and the aggregate gross unrealized appreciation and depreciation based on that cost was:
Unrealized appreciation | | $ | 30,272,552 | | |
Unrealized depreciation | | | (6,111,305 | ) | |
Net unrealized appreciation | | $ | 24,161,247 | | |
Management of the Fund has concluded that there are no significant uncertain tax positions that would require recognition in the financial statements. However, management's conclusion may be subject to review and adjustment at a later date based on factors including, but not limited to, new tax laws, regulations, and administrative interpretations (including relevant court decisions). Generally, the Fund's federal tax returns for the prior three fiscal years remain subject to examination by the Internal Revenue Service.
Note 5. Portfolio Information
The cost of purchases and proceeds from sales of securities, excluding short-term obligations, aggregated to $70,923,054 and $115,829,397, respectively, for the year ended October 31, 2013.
Note 6. Shareholder Concentration
At October 31, 2013, one unaffiliated shareholder account owned 23.8% of the outstanding shares of the Fund. The Fund
Annual Report 2013
31
Columbia California Tax-Exempt Fund
Notes to Financial Statements (continued)
October 31, 2013
has no knowledge about whether any portion of those shares was owned beneficially by such account. Subscription and redemption activity by concentrated accounts may have a significant effect on the operations of the Fund.
Note 7. Line of Credit
The Fund has entered into a revolving credit facility with a syndicate of banks led by JPMorgan Chase Bank N.A. (JPMorgan) whereby the Fund may borrow for the temporary funding of shareholder redemptions or for other temporary or emergency purposes. The credit facility agreement, as amended, which is a collective agreement between the Fund and certain other funds managed by the Investment Manager, severally and not jointly, permits collective borrowings up to $500 million. Interest is charged to each participating fund based on its borrowings at a rate equal to the higher of (i) the overnight federal funds rate plus 1.00% or (ii) the one-month LIBOR rate plus 1.00%. Each borrowing under the credit facility matures no later than 60 days after the date of borrowing. The Fund also pays a commitment fee equal to its pro rata share of the amount of the credit facility at a rate of 0.08% per annum. The commitment fee is included in other expenses in the Statement of Operations.
Effective December 10, 2013, the Fund extended its revolving credit facility with JPMorgan. The credit facility agreement, as amended, continues to permit collective borrowings up to $500 million under the same terms and interest rates as described above. Effective December 10, 2013, the Fund pays a commitment fee equal to its pro rata share of the amount of the credit facility at a rate of 0.075% per annum.
The Fund had no borrowings during the year ended October 31, 2013.
Note 8. Significant Risks
Geographic Concentration Risk
Because state-specific tax-exempt funds invest primarily in the municipal securities issued by the state and political sub-divisions of the state, the Fund will be particularly affected by political and economic conditions and developments in the state in which it invests. The Fund may, therefore, have a greater risk than that of a municipal bond fund which is more geographically diversified. The value of the municipal securities owned by the Fund also may be adversely affected by future changes in federal or state income tax laws.
Non-Diversification Risk
A non-diversified fund is permitted to invest a greater percentage of its total assets in fewer issuers than a diversified
fund. The Fund may, therefore, have a greater risk of loss from a few issuers than a similar fund that invests more broadly.
Note 9. Subsequent Events
Management has evaluated the events and transactions that have occurred through the date the financial statements were issued and noted no items requiring adjustment of the financial statements or additional disclosure.
Note 10. Information Regarding Pending and Settled Legal Proceedings
In December 2005, without admitting or denying the allegations, American Express Financial Corporation (AEFC, which is now known as Ameriprise Financial, Inc. (Ameriprise Financial)) entered into settlement agreements with the Securities and Exchange Commission (SEC) and Minnesota Department of Commerce (MDOC) related to market timing activities. As a result, AEFC was censured and ordered to cease and desist from committing or causing any violations of certain provisions of the Investment Advisers Act of 1940, the Investment Company Act of 1940, and various Minnesota laws. AEFC agreed to pay disgorgement of $10 million and civil money penalties of $7 million. AEFC also agreed to retain an independent distribution consultant to assist in developing a plan for distribution of all disgorgement and civil penalties ordered by the SEC in accordance with various undertakings detailed at www.sec.gov/litigation/admin/ia-2451.pdf. Ameriprise Financial and its affiliates have cooperated with the SEC and the MDOC in these legal proceedings, and have made regular reports to the funds' Boards of Trustees.
Ameriprise Financial and certain of its affiliates have historically been involved in a number of legal, arbitration and regulatory proceedings, including routine litigation, class actions, and governmental actions, concerning matters arising in connection with the conduct of their business activities. Ameriprise Financial believes that the Funds are not currently the subject of, and that neither Ameriprise Financial nor any of its affiliates are the subject of, any pending legal, arbitration or regulatory proceedings that are likely to have a material adverse effect on the Funds or the ability of Ameriprise Financial or its affiliates to perform under their contracts with the Funds. Ameriprise Financial is required to make 10-Q, 10-K and, as necessary, 8-K filings with the Securities and Exchange Commission on legal and regulatory matters that relate to Ameriprise Financial and its affiliates. Copies of these filings may be obtained by accessing the SEC website at www.sec.gov.
There can be no assurance that these matters, or the adverse publicity associated with them, will not result in increased
Annual Report 2013
32
Columbia California Tax-Exempt Fund
Notes to Financial Statements (continued)
October 31, 2013
fund redemptions, reduced sale of fund shares or other adverse consequences to the Funds. Further, although we believe proceedings are not likely to have a material adverse effect on the Funds or the ability of Ameriprise Financial or its affiliates to perform under their contracts with the Funds, these proceedings are subject to uncertainties and, as such, we are unable to estimate the possible loss or range of loss that may result. An adverse outcome in one or more of these proceedings could result in adverse judgments, settlements, fines, penalties or other relief that could have a material adverse effect on the consolidated financial condition or results of operations of Ameriprise Financial.
Annual Report 2013
33
Columbia California Tax-Exempt Fund
Report of Independent Registered Public Accounting Firm
To the Trustees of Columbia Funds Series Trust I and the Shareholders of
Columbia California Tax-Exempt Fund
In our opinion, the accompanying statement of assets and liabilities, including the portfolio of investments, and the related statements of operations and of changes in net assets and the financial highlights present fairly, in all material respects, the financial position of Columbia California Tax-Exempt Fund (the "Fund", a series of Columbia Funds Series Trust I) at October 31, 2013, and the results of its operations, the changes in its net assets and the financial highlights for each of the periods indicated, in conformity with accounting principles generally accepted in the United States of America. These financial statements and financial highlights (hereafter referred to as "financial statements") are the responsibility of the Fund's management; our responsibility is to express an opinion on these financial statements based on our audits. We conducted our audits of these financial statements in accordance with the standards of the Public Company Accounting Oversight Board (United States). Those standards require that we plan and perform the audit to obtain reasonable assurance about whether the financial statements are free of material misstatement. An audit includes examining, on a test basis, evidence supporting the amounts and disclosures in the financial statements, assessing the accounting principles used and significant estimates made by management, and evaluating the overall financial statement presentation. We believe that our audits, which included confirmation of securities at October 31, 2013 by correspondence with the custodian, brokers and transfer agent, provide a reasonable basis for our opinion expressed above.
PricewaterhouseCoopers LLP
Minneapolis, Minnesota
December 19, 2013
Annual Report 2013
34
Columbia California Tax-Exempt Fund
Federal Income Tax Information
(Unaudited)
The Fund hereby designates the following tax attributes for the fiscal year ended October 31, 2013. Shareholders will be notified in early 2014 of the amounts for use in preparing 2013 income tax returns.
Tax Designations:
| Capital Gain Dividend | | $ | 3,754,072 | | |
| Exempt-Interest Dividends | | | 99.79 | % | |
Capital Gain Dividend. The Fund designates as a capital gain dividend the amount reflected above, or if subsequently determined to be different, the net capital gain of such fiscal period. The Fund also designates as capital gain dividends, to the extent necessary to fully distribute such capital gains, earnings and profits distributed to shareholders on the redemption of shares.
Exempt-Interest Dividends. The percentage of net investment income distributions paid during the fiscal year that qualifies as exempt-interest dividends for federal income tax purposes.
Annual Report 2013
35
Columbia California Tax-Exempt Fund
The Trustees serve terms of indefinite duration. The names, addresses and birth years of the Trustees and Officers of the Funds in Columbia Funds Series Trust I, the year each was first elected or appointed to office, their principal business occupations during at least the last five years, the number of Funds overseen by each Trustee and other directorships they hold are shown below. Each officer listed below serves as an officer of each Fund in Columbia Funds Series Trust I.
Independent Trustees
Name, Address and Year of Birth,
Position with Funds, Year First
Elected or Appointed to Office | | Principal Occupation(s) During Past Five Years, Number of Funds in Columbia
Funds Complex Overseen by Trustee, Other Directorships Held | |
Rodman L. Drake (Born 1943)
c/o Columbia Management
Investment Advisers, LLC
225 Franklin Street
Boston, MA 02110
Trustee (since 1994) and
Chairman of the Board (since 2009) | | Independent consultant since 2010; Co-Founder of Baringo Capital LLC (private equity) from 1997 to 2008; Chairman (from 2003 to 2010) and CEO (from 2008 to 2010) of Crystal River Capital, Inc. (real estate investment trust); Oversees 52; Jackson Hewitt Tax Service Inc. (tax preparation services) from 2004 to 2011; Student Loan Corporation (student loan provider) from 2005 to 2010; Celgene Corporation (global biotechnology company); The Helios Funds and Brookfield Funds (closed-end funds); Chimerix, Inc. (biopharmaceutical company) since August 1, 2013; Crystal River Capital, Inc. from 2005 to 2010; Parsons Brinckerhoff from 1995 to 2008; and Apex Silver Mines Ltd. from 2007 to 2009 | |
Douglas A. Hacker (Born 1955)
c/o Columbia Management
Investment Advisers, LLC
225 Franklin Street
Boston, MA 02110
Trustee (since 1996) | | Independent business executive since May 2006; Executive Vice President — Strategy of United Airlines from December 2002 to May 2006; President of UAL Loyalty Services (airline marketing company) from September 2001 to December 2002; Executive Vice President and Chief Financial Officer of United Airlines from July 1999 to September 2001. Oversees 52; Nash Finch Company (food distributor); Aircastle Limited (aircraft leasing); and SeaCube Container Leasing Ltd. (container leasing) | |
Janet Langford Kelly (Born 1957)
c/o Columbia Management
Investment Advisers, LLC
225 Franklin Street
Boston, MA 02110
Trustee (since 1996) | | Senior Vice President, General Counsel and Corporate Secretary, ConocoPhillips (integrated energy company) since September 2007; Deputy General Counsel — Corporate Legal Services, ConocoPhillips from August 2006 to August 2007; Partner, Zelle, Hofmann, Voelbel, Mason & Gette LLP (law firm) from March 2005 to July 2006; Adjunct Professor of Law, Northwestern University from September 2004 to June 2006; Director, UAL Corporation (airline) from February 2006 to July 2006; Chief Administrative Officer and Senior Vice President, Kmart Holding Corporation (consumer goods) from September 2003 to March 2004. Oversees 52; None | |
Nancy T. Lukitsh (Born 1956)
c/o Columbia Management
Investment Advisers, LLC
225 Franklin Street
Boston, MA 02110
Trustee (since 2011) | | Senior Vice President, Partner and Director of Marketing, Wellington Management Company, LLP (investment adviser) from 1997 to 2010; Chair, Wellington Management Investment Portfolios (commingled non-U.S. investment pools) from 2007 to 2010; Director, Wellington Trust Company, NA and other Wellington affiliates from 1997 to 2010. Oversees 52; None | |
William E. Mayer (Born 1940)
c/o Columbia Management
Investment Advisers, LLC
225 Franklin Street
Boston, MA 02110
Trustee (since 1994) | | Partner, Park Avenue Equity Partners (private equity) since February 1999; Dean and Professor, College of Business and Management, University of Maryland from 1992 to 1996. Oversees 52; DynaVox Inc. (speech creation); Lee Enterprises (print media); WR Hambrecht + Co. (financial service provider) from 2000 to 2012; BlackRock Kelso Capital Corporation (investment company) | |
David M. Moffett (Born 1952)
c/o Columbia Management
Investment Advisers, LLC
225 Franklin Street
Boston, MA 02110
Trustee (since 2011) | | Retired. Chief Executive Officer, Federal Home Loan Mortgage Corporation, from 2008 to 2009; Senior Adviser, Global Financial Services Group, Carlyle Group, Inc., from 2007 to 2008; Vice Chairman and Chief Financial Officer, U.S. Bancorp, from 1993 to 2007. Oversees 52; CIT Group Inc. (commercial and consumer finance); eBay Inc. (online trading community); MBIA Inc. (financial service provider); E.W. Scripps Co. (print and television media), Building Materials Holding Corp. (building materials and construction services); Genworth Financial, Inc. (financial and insurance products and services); and University of Oklahoma Foundation | |
Charles R. Nelson (Born 1942)
c/o Columbia Management
Investment Advisers, LLC
225 Franklin Street
Boston, MA 02110
Trustee (since 1981) | | Retired. Professor Emeritus, University of Washington, since 2011; Professor of Economics, University of Washington from 1976 to 2011; Ford and Louisa Van Voorhis Professor of Political Economy, University of Washington from 1993 to 2011; Adjunct Professor of Statistics, University of Washington from 1980 to 2011; Associate Editor, Journal of Money, Credit and Banking from September 1993 to 2008; consultant on econometric and statistical matters. Oversees 52; None | |
John J. Neuhauser (Born 1943)
c/o Columbia Management
Investment Advisers, LLC
225 Franklin Street
Boston, MA 02110
Trustee (since 1984) | | President, Saint Michael's College, since August 2007; Director or Trustee of several non-profit organizations, including Fletcher Allen Health Care, Inc.; University Professor, Boston College from November 2005 to August 2007; Academic Vice President and Dean of Faculties, Boston College from August 1999 to October 2005. Oversees 52; Liberty All-Star Equity Fund and Liberty All-Star Growth Fund (closed-end funds) | |
Annual Report 2013
36
Columbia California Tax-Exempt Fund
Trustees and Officers (continued)
Independent Trustees (continued)
Name, Address and Year of Birth,
Position with Funds, Year First
Elected or Appointed to Office | | Principal Occupation(s) During Past Five Years, Number of Funds in Columbia
Funds Complex Overseen by Trustee, Other Directorships Held | |
Patrick J. Simpson (Born 1944)
c/o Columbia Management
Investment Advisers, LLC
225 Franklin Street
Boston, MA 02110
Trustee (since 2000) | | Partner, Perkins Coie LLP (law firm). Oversees 52; None | |
Anne-Lee Verville (Born 1945)
c/o Columbia Management
Investment Advisers, LLC
225 Franklin Street
Boston, MA 02110
Trustee (since 1998) | | Retired. General Manager — Global Education Industry from 1994 to 1997, President — Application Systems Division from 1991 to 1994, Chief Financial Officer — US Marketing & Services from 1988 to 1991, and Chief Information Officer from 1987 to 1988, IBM Corporation (computer and technology). Oversees 52; Enesco Group, Inc. (producer of giftware and home and garden decor products) from 2001 to 2006 | |
Interested Trustee
Name, Address and Year of Birth,
Position with Funds, Year First
Elected or Appointed to Office | | Principal Occupation(s) During Past Five Years, Number of Funds in Columbia
Funds Complex Overseen by Trustee, Other Directorships Held | |
William F. Truscott (born 1960)
53600 Ameriprise Financial Center
Minneapolis, MN 55474
Senior Vice President (since 2012) | | Chairman of the Board and President, Columbia Management Investment Advisers, LLC since May 2010 and February 2012 (previously President and Chief Investment Officer, from 2001 to April 2010); Chief Executive Officer, Global Asset Management, Ameriprise Financial, Inc. since September 2012 (previously, Chief Executive Officer, U.S. Asset Management & President, Annuities, from May 2010 to September 2012 and President — U.S. Asset Management and Chief Investment Officer from 2005 to April 2010); Director and Chief Executive Officer, Columbia Management Investment Distributors, Inc. since May 2010 and February 2012, respectively (previously Chairman of the Board and Chief Executive Officer from 2006 to April 2010); Chairman of the Board and Chief Executive Officer, RiverSource Distributors, Inc. since 2006; President and Chief Executive Officer, Ameriprise Certificate Company, 2006 to August 2012; Oversees 184; Director, Ameriprise Certificate Company, 2006-January 2013 | |
The Statement of Additional Information includes additional information about the Trustees of the Funds and is available, without charge, upon request by calling 800.345.6611.
The Board has appointed officers who are responsible for day-to-day business decisions based on policies it has established. The officers serve at the pleasure of the Board. In addition to Mr. Truscott, who is Senior Vice President, the Funds' other officers are:
Officers
Name,
Address and
Year of Birth | | Position and Year
First Appointed to
Position for any Fund
in the Columbia
Funds Complex or a
Predecessor Thereof | | Principal Occupation(s) During Past Five Years | |
J. Kevin Connaughton
225 Franklin Street
Boston, MA 02110
Born 1964 | | President and Principal Executive Officer (2009) | | Senior Vice President and General Manager — Mutual Fund Products, Columbia Management Investment Advisers, LLC, since May 2010; and President, Columbia Funds since 2009; previously, Managing Director, Columbia Management Advisors, LLC, from December 2004 to April 2010; Senior Vice President and Chief Financial Officer, Columbia Funds, from June 2008 to January 2009; and senior officer of Columbia Funds and affiliated funds since 2003. | |
Michael G. Clarke
225 Franklin Street
Boston, MA 02110
Born 1969 | | Treasurer (2011) and Chief Financial Officer (2009) | | Vice President, Columbia Management Investment Advisers, LLC, since May 2010; previously, Managing Director of Fund Administration, Columbia Management Advisors, LLC, from September 2004 to April 2010; and senior officer of Columbia Funds and affiliated funds since 2002. | |
Annual Report 2013
37
Columbia California Tax-Exempt Fund
Trustees and Officers (continued)
Officers (continued)
Name,
Address and
Year of Birth | | Position and Year
First Appointed to
Position for any Fund
in the Columbia
Funds Complex or a
Predecessor Thereof | | Principal Occupation(s) During Past Five Years | |
Scott R. Plummer
5228 Ameriprise
Financial Center
Minneapolis, MN 55474
Born 1959 | | Senior Vice President (2006), Chief Legal Officer (2006) and Assistant Secretary (2011) | | Senior Vice President, Chief Legal Officer and Assistant Secretary, Columbia Management Investment Advisers, LLC, since June 2005; Senior Vice President and Lead Chief Counsel — Asset Management, Ameriprise Financial, Inc., since May 2010 (previously, Vice President and Chief Counsel — Asset Management, from 2005 to April 2010); Vice President, Chief Counsel and Assistant Secretary, Columbia Management Investment Distributors, Inc., since 2008; Vice President, General Counsel and Secretary, Ameriprise Certificate Company, since 2005; Chief Counsel, RiverSource Distributors, Inc., since 2006; and senior officer of Columbia Funds and affiliated funds since 2006. | |
Thomas P. McGuire
225 Franklin Street
Boston, MA 02110
Born 1972 | | Chief Compliance Officer (2012) | | Vice President — Asset Management Compliance, Ameriprise Financial, Inc., since May 2010; Chief Compliance Officer, Ameriprise Certificate Company, since September 2010; Compliance Executive, Bank of America, from 2005 to April 2010. | |
Colin Moore
225 Franklin Street
Boston, MA 02110
Born 1958 | | Senior Vice President (2010) | | Executive Vice President and Global Chief Investment Officer, Ameriprise Financial, Inc., since July 2013; Director and Global Chief Investment Officer, Columbia Management Investment Advisers, LLC, since May 2010; previously, Manager, Managing Director and Chief Investment Officer, Columbia Management Advisors, LLC, from 2007 to April 2010. | |
Michael E. DeFao
225 Franklin Street
Boston, MA 02110
Born 1968 | | Vice President (2011) and Assistant Secretary (2010) | | Vice President and Chief Counsel, Ameriprise Financial, Inc., since May 2010; Associate General Counsel, Bank of America from 2005 to April 2010. | |
Joseph F. DiMaria
225 Franklin Street
Boston, MA 02110
Born 1968 | | Vice President (2011) and Chief Accounting Officer (2008) | | Vice President — Mutual Fund Administration, Columbia Management Investment Advisers, LLC, since May 2010; previously, Director of Fund Administration, Columbia Management Advisors, LLC, from 2006 to April 2010. | |
Paul B. Goucher
100 Park Avenue
New York, NY 10017
Born 1968 | | Vice President (2011) and Assistant Secretary (2008) | | Vice President and Lead Chief Counsel, Ameriprise Financial, Inc., since November 2008 and January 2013, respectively (previously, Chief Counsel, from January 2010 to January 2013, and Group Counsel from November 2008 to January 2010); previously, Director, Managing Director and General Counsel, J. & W. Seligman & Co. Incorporated, from July 2008 to November 2008. | |
Amy Johnson
5228 Ameriprise
Financial Center
Minneapolis, MN
Born 1965 | | Vice President (2006) | | Senior Vice President and Chief Operating Officer, Columbia Management Investment Advisers, LLC, since May 2010; previously, Chief Administrative Officer, from 2009 to April 2010, and Vice President — Asset Management and Trust Company Services, from 2006 to 2009. | |
Paul D. Pearson
5228 Ameriprise
Financial Center
Minneapolis, MN
Born 1956 | | Vice President (2011) and Assistant Treasurer (1999) | | Vice President — Investment Accounting, Columbia Management Investment Advisers, LLC, since May 2010; previously, Vice President — Managed Assets, Investment Accounting, Ameriprise Financial, Inc. from 1998 to April 2010. | |
Christopher O. Petersen
5228 Ameriprise
Financial Center
Minneapolis, MN 55474
Born 1970 | | Vice President and Secretary (2010) | | Vice President and Chief Counsel, Ameriprise Financial, Inc., since January 2010 (previously, Vice President and Group Counsel or Counsel from 2004 to January 2010); officer of Columbia Funds and affiliated funds since 2007. | |
Stephen T. Welsh
225 Franklin Street
Boston, MA 02110
Born 1957 | | Vice President (2006) | | President and Director, Columbia Management Investment Services Corp., since May 2010; previously, President and Director, Columbia Management Services, Inc., from 2004 to April 2010; and Managing Director, Columbia Management Distributors, Inc., from 2007 to April 2010. | |
Annual Report 2013
38
Columbia California Tax-Exempt Fund
Board Consideration and Approval of Advisory Agreement
On June 14, 2013, the Board of Trustees (the "Board") and the Trustees who are not interested persons (as defined in the Investment Company Act of 1940) of the Trust (the "Independent Trustees") unanimously approved the continuation of the Investment Management Services Agreement (the "Advisory Agreement") with Columbia Management Investment Advisers, LLC (the "Investment Manager") with respect to Columbia California Tax-Exempt Fund (the "Fund"), a series of the Trust. As detailed below, the Advisory Fees and Expenses Committee (the "Committee") and the Board met on multiple occasions to review and discuss, both among themselves and with the management team of the Investment Manager, materials provided by the Investment Manager before determining to approve the continuation of the Advisory Agreement.
In connection with their deliberations regarding the continuation of the Advisory Agreement, the Committee and the Board evaluated materials requested from the Investment Manager regarding the Fund and the Advisory Agreement, and discussed these materials with representatives of the Investment Manager at Committee meetings held on March 5, 2013, April 24, 2013 and June 13, 2013, and at the Board meeting held on June 14, 2013. In addition, the Board considers matters bearing on the Advisory Agreement at most of its other meetings throughout the year and meets regularly with senior management of the Funds and the Investment Manager. Through the Board's Investment Oversight Committees, Trustees also meet with selected Fund portfolio managers and other investment personnel at various times throughout the year. The Committee and the Board also consulted with Fund counsel and with the Independent Trustees' independent legal counsel, who advised on various matters with respect to the Committee's and the Board's considerations and otherwise assisted the Committee and the Board in their deliberations. On June 13, 2013, the Committee recommended that the Board approve the continuation of the Advisory Agreement. On June 14, 2013, the Board, including the Independent Trustees, voting separately, unanimously approved the continuation of the Advisory Agreement for the Fund.
The Committee and the Board considered all information that they, their legal counsel, or the Investment Manager believed reasonably necessary to evaluate and to determine whether to approve the continuation of the Advisory Agreement. The information and factors considered by the Committee and the Board in recommending for approval or approving the continuation of the Advisory Agreement for the Fund included the following:
• Information on the investment performance of the Fund relative to the performance of a group of mutual funds determined to be comparable to the Fund by an independent third-party data provider, as well as performance relative to benchmarks;
• Information on the Fund's advisory fees and total expenses, including information comparing the Fund's expenses to those of a group of comparable mutual funds, as determined by the independent third-party data provider;
• The Investment Manager's agreement to contractually limit or cap total operating expenses for the Fund so that total operating expenses (excluding certain fees and expenses, such as transaction costs and certain other investment related expenses, interest, taxes, acquired fund fees and expenses, and extraordinary expenses) would not exceed the median expenses of a group of comparable funds (as determined from time to time, generally annually, by the independent third-party data provider);
• The terms and conditions of the Advisory Agreement;
• The terms and conditions of other agreements and arrangements with affiliates of the Investment Manager relating to the operations of the Fund, including the Administrative Services Agreement, the Distribution Agreement and the Transfer and Dividend Disbursing Agent Agreement;
• Descriptions of various functions performed by the Investment Manager under the Advisory Agreement, including portfolio management and portfolio trading practices;
• Information regarding the management fees and investment performance of comparable portfolios of other clients of the Investment Manager, including institutional separate accounts;
• Information regarding the reputation, regulatory history and resources of the Investment Manager, including information regarding senior management, portfolio managers and other personnel;
• Information regarding the capabilities of the Investment Manager with respect to compliance monitoring services, including an assessment of the Investment Manager's compliance system by the Fund's Chief Compliance Officer; and
• The profitability to the Investment Manager and its affiliates from their relationships with the Fund.
Annual Report 2013
39
Columbia California Tax-Exempt Fund
Board Consideration and Approval of Advisory Agreement (continued)
Nature, Extent and Quality of Services Provided under the Advisory Agreement
The Committee and the Board considered the nature, extent and quality of services provided to the Fund by the Investment Manager and its affiliates under the Advisory Agreement and under separate agreements for the provision of transfer agency and administrative services, and the resources dedicated to the Fund and the other Columbia Funds by the Investment Manager and its affiliates. The Committee and the Board considered, among other things, the Investment Manager's ability to attract, motivate and retain highly qualified research, advisory and supervisory investment professionals (including personnel and other resources, compensation programs for personnel involved in fund management, reputation and other attributes), the portfolio management services provided by those investment professionals, and the quality of the Investment Manager's investment research capabilities and trade execution services. The Committee and the Board also considered the potential benefits to shareholders of investing in a mutual fund that is part of a fund complex offering exposure to a variety of asset classes and investment disciplines and providing a variety of fund and shareholder services.
The Committee and the Board also considered the professional experience and qualifications of the senior personnel of the Investment Manager, which included consideration of the Investment Manager's experience with similarly-structured funds. The Committee and the Board noted the compliance programs of and the compliance-related resources provided to the Fund by the Investment Manager and its affiliates, and considered the Investment Manager's ability to provide administrative services to the Fund pursuant to a separate Administrative Services Agreement, including the Investment Manager's ability to coordinate the activities of the Fund's other service providers. After reviewing these and related factors, the Committee and the Board concluded, within the context of their overall conclusions, that the nature, extent and quality of the services provided to the Fund under the Advisory Agreement supported the continuation of the Advisory Agreement.
Investment Performance
The Committee and the Board reviewed information about the performance of the Fund over various time periods, including performance information relative to benchmarks and information based on reports of the independent third-party data provider that compared the performance of the Fund to the performance of a group of comparable mutual funds. The Committee and the Board also reviewed a description of the third party's methodology for identifying the Fund's peer groups for purposes of performance and expense comparisons.
The Committee and the Board noted that, through December 31, 2012, the Fund's performance was in the thirty-sixth, thirtieth and twenty-first percentile (where the best performance would be in the first percentile) of its category selected by the independent third-party data provider for the purposes of performance comparisons for the one-, three- and five- year periods, respectively.
The Committee and the Board also considered the Investment Manager's performance and reputation generally, the Investment Manager's historical responsiveness to Board concerns about performance, and the Investment Manager's willingness to take steps intended to improve performance. After reviewing these and related factors, the Committee and the Board concluded, within the context of their overall conclusions, that the performance of the Fund supported the continuation of the Advisory Agreement.
Investment Advisory Fee Rates and Other Expenses
The Committee and the Board considered the advisory fees charged to the Fund under the Advisory Agreement as well as the total expenses incurred by the Fund. In assessing the reasonableness of the fees under the Advisory Agreement, the Committee and the Board considered, among other information, the Fund's advisory fee and its total expense ratio as a percentage of average daily net assets. The Committee and the Board noted that the Fund's actual management fee and net expense ratio are ranked in the first and third quintiles, respectively, (where the lowest fees and expenses would be in the first quintile) against the Fund's expense universe as determined by the independent third-party data provider for purposes of expense comparison. The Committee and the Board also took into account the fee waiver and expense limitation arrangements agreed to by the Investment Manager, as noted above.
The Committee and the Board also received and considered information about the advisory fees charged by the Investment Manager to institutional separate accounts. In considering the fees charged to those accounts, the Committee and the Board took into account, among other things, the Investment Manager's representations about the differences between managing mutual funds as compared to other types of accounts, including differences in the services provided, differences in the risk
Annual Report 2013
40
Columbia California Tax-Exempt Fund
Board Consideration and Approval of Advisory Agreement (continued)
profile of such business for the Investment Manager and the additional resources required to manage mutual funds effectively. In evaluating the Fund's advisory fees, the Committee and the Board also took into account the demands, complexity and quality of the investment management of the Fund.
After reviewing these and related factors, the Committee and the Board concluded, within the context of their overall conclusions, that the advisory fee rates and expenses of the Fund supported the continuation of the Advisory Agreement.
Costs of Services Provided and Profitability
The Committee and the Board also took note of the costs of the services provided (both on an absolute and relative basis) and the profitability to the Investment Manager and its affiliates in connection with their relationships with the Fund. In evaluating these considerations, the Committee and the Board took note of the advisory fees charged by the Investment Manager to other clients, including fees charged by the Investment Manager to institutional separate account clients with similar investment strategies to those of the Fund.
The Committee and the Board also considered the compensation directly or indirectly received by the Investment Manager's affiliates in connection with their relationships with the Fund. The Committee and the Board reviewed information provided by management as to the profitability of the Investment Manager and its affiliates of their relationships with the Fund, information about the allocation of expenses used to calculate profitability, and comparisons of profitability levels realized in 2012 to profitability levels realized in 2011. When reviewing profitability, the Committee and the Board also considered court cases in which adviser profitability was an issue in whole or in part, the performance of the Fund, the expense ratio of the Fund, and the implementation of expense limitations with respect to the Fund. The Committee and the Board also considered information provided by the Investment Manager regarding its financial condition and comparing its profitability to that of other asset management firms that are, or are subsidiaries of, publicly traded companies.
After reviewing these and related factors, the Committee and the Board concluded, within the context of their overall conclusions, that the costs of services provided and the profitability to the Investment Manager and its affiliates from their relationships with the Fund supported the continuation of the Advisory Agreement.
Economies of Scale
The Committee and the Board considered the potential existence of economies of scale in the provision by the Investment Manager of services to the Fund, to groups of related funds, and to the Investment Manager's investment advisory clients as a whole, and whether those economies of scale were shared with the Fund through breakpoints in investment advisory fees or other means, such as expense limitation arrangements and additional investments by the Investment Manager in investment, trading and compliance resources. The Committee and the Board noted that the investment advisory fee schedules for the Fund contained breakpoints that would reduce the fee rate on assets above specified threshold levels.
In considering these matters, the Committee and the Board also considered the costs of the services provided and the profitability to the Investment Manager and its affiliates from their relationships with the Fund, as discussed above. After reviewing these and related factors, the Committee and the Board concluded, within the context of their overall conclusions, that the extent to which any economies of scale were expected to be shared with the Fund supported the continuation of the Advisory Agreement.
Other Benefits to the Investment Manager
The Committee and the Board received and considered information regarding "fall-out" or ancillary benefits received by the Investment Manager and its affiliates as a result of their relationships with the Fund, such as the engagement of the Investment Manager to provide administrative services to the Fund and the engagement of the Investment Manager's affiliates to provide distribution and transfer agency services to the Fund. The Committee and the Board considered that the Fund's distributor retains a portion of the distribution fees from the Fund. The Committee and the Board also considered the benefits of research made available to the Investment Manager by reason of brokerage commissions generated by the Fund's securities transactions, and reviewed information about the Investment Manager's practices with respect to allocating portfolio transactions for brokerage and research services. The Committee and the Board considered the possible conflicts of interest associated with certain fall-out or other ancillary benefits and the reporting, disclosure and other processes that are in place to address such possible conflicts of interest. The Committee and the Board recognized that the Investment Manager's profitability would be somewhat lower without these benefits.
Annual Report 2013
41
Columbia California Tax-Exempt Fund
Board Consideration and Approval of Advisory Agreement (continued)
Conclusion
The Committee and the Board reviewed all of the above considerations in reaching their decisions to recommend or approve the continuation of the Advisory Agreement. In their deliberations, the Trustees did not identify any particular information that was all-important or controlling, and individual Trustees may have attributed different weights to the various factors. Based on their evaluation of all factors that they deemed to be material, including those factors described above, and assisted by the advice of independent legal counsel, the Board, including the Independent Trustees, voting separately, unanimously approved the continuation of the Advisory Agreement.
Annual Report 2013
42
This page intentionally left blank.
Annual Report 2013
43
This page intentionally left blank.
Annual Report 2013
44
Columbia California Tax-Exempt Fund
Important Information About This Report
Each fund mails one shareholder report to each shareholder address. If you would like more than one report, please call shareholder services at 800.345.6611 and additional reports will be sent to you.
The policy of the Board is to vote the proxies of the companies in which each fund holds investments consistent with the procedures as stated in the Statement of Additional Information (SAI). You may obtain a copy of the SAI without charge by calling 800.345.6611; contacting your financial intermediary; visiting columbiamanagement.com; or searching the website of the Securities and Exchange Commission (SEC) at sec.gov. Information regarding how each fund voted proxies relating to portfolio securities is filed with the SEC by August 31 for the most recent 12-month period ending June 30 of that year, and is available without charge by visiting columbiamanagement.com; or searching the website of the SEC at sec.gov.
Each fund files a complete schedule of portfolio holdings with the SEC for the first and third quarters of each fiscal year on Form N-Q. Each fund's Form N-Q is available on the SEC's website at sec.gov and may be reviewed and copied at the SEC's Public Reference Room in Washington, D.C. Information on the operation of the Public Reference Room may be obtained by calling 800.SEC.0330. Each fund's complete schedule of portfolio holdings, as filed on Form N-Q, can also be obtained without charge, upon request, by calling 800.345.6611.
Annual Report 2013
45

Columbia California Tax-Exempt Fund
P.O. Box 8081
Boston, MA 02266-8081
columbiamanagement.com
This information is for use with concurrent or prior delivery of a fund prospectus. Please read and consider the investment objectives, risks, charges and expenses for any fund carefully before investing. For a prospectus and, if available, a summary prospectus, which contains this and other important information about the Fund go to columbiamanagement.com. The Fund is distributed by Columbia Management Investment Distributors, Inc., member FINRA, and managed by Columbia Management Investment Advisers, LLC.
© 2013 Columbia Management Investment Advisers, LLC. All rights reserved.
ANN123_10_C01_(12/13)
Annual Report
October 31, 2013

Columbia Connecticut Intermediate Municipal Bond Fund
Not FDIC insured • No bank guarantee • May lose value
 Dear Shareholders,
A market rally led by equities
Despite threats of military action in Syria, rumblings from Iran and an impending showdown over the debt ceiling here at home, the U.S. financial markets delivered positive results in the third quarter of 2013. Stocks outperformed bonds by a substantial margin. Still, robust growth continued to elude the U.S. economy, which merely plodded along. New job growth was solid but not spectacular. Consumer spending remained steady, but the only obvious beneficiary was the auto industry. Gains in the housing market met some headwinds, as mortgage rates rose and sales slipped somewhat. Nevertheless, the recovery in housing remained intact.
The Federal Reserve (the Fed) unsettled investors with a hint that it was ready to taper its purchase of U.S. Treasury and mortgage securities. However, its failure to take any action in a September meeting rallied stocks to new highs and brought bonds back into positive territory for the quarter. Small-cap stocks were the U.S. market leaders. Growth outperformed value in a quarter dominated by the materials, industrials and consumer discretionary sectors. Developed markets led the global rally, driven by strengthening economic conditions in the eurozone. Certain emerging stock markets, including China's, bounced back with returns in line with those of the United States. India and Indonesia were exceptions to that trend, as fears of the Fed's tapering efforts rattled investors in both countries.
Improved risk appetites boosted fixed income
Following a weak second quarter, the fixed-income markets made up some ground in the third quarter of 2013. As yields fell, bond prices rallied enough to push returns on non-Treasury sectors into positive territory. Risk appetites improved in response to continued liquidity from the Fed. Against this backdrop, U.S. high-yield and foreign bonds led the fixed-income markets, along with mortgage-backed securities and emerging market bonds. The U.S. municipal bond market was the exception, as it slipped into negative territory in the final week of the period, pressured by heightened concerns over Puerto Rico, potential municipal bankruptcies and continued fund redemptions.
Stay on track with Columbia Management
Backed by more than 100 years of experience, Columbia Management is one of the nation's largest asset managers. At the heart of our success and, most importantly, that of our investors, are highly talented industry professionals, brought together by a unique way of working. At Columbia Management, reaching our performance goals matters, and how we reach them matters just as much.
Visit columbiamanagement.com for:
> The Columbia Management Perspectives blog, offering insights on current market events and investment opportunities
> Detailed up-to-date fund performance and portfolio information
> Quarterly fund commentaries
> Columbia Management Investor, our award-winning quarterly newsletter for shareholders
Thank you for your continued support of the Columbia Funds. We look forward to serving your investment needs for many years to come.
Best Regards,

J. Kevin Connaughton
President, Columbia Funds
Investing involves risk including the risk of loss of principal.
Investors should consider the investment objectives, risks, charges and expenses of a mutual fund carefully before investing. For a free prospectus, which contains this and other important information about a fund, visit columbiamanagement.com. The prospectus should be read carefully before investing.
Columbia Funds are distributed by Columbia Management Investment Distributors, Inc., member FINRA, and managed by Columbia Management Investment Advisers, LLC.
© 2013 Columbia Management Investment Advisers, LLC. All rights reserved.
Columbia Connecticut Intermediate Municipal Bond Fund
Performance Overview | | | 2 | | |
Manager Discussion of Fund Performance | | | 4 | | |
Understanding Your Fund's Expenses | | | 6 | | |
Portfolio of Investments | | | 7 | | |
Statement of Assets and Liabilities | | | 13 | | |
Statement of Operations | | | 15 | | |
Statement of Changes in Net Assets | | | 16 | | |
Financial Highlights | | | 18 | | |
Notes to Financial Statements | | | 24 | | |
Report of Independent Registered
Public Accounting Firm | | | 30 | | |
Federal Income Tax Information | | | 31 | | |
Trustees and Officers | | | 32 | | |
Board Consideration and Approval of Advisory Agreement | | | 35 | | |
Important Information About This Report | | | 41 | | |
Fund Investment Manager
Columbia Management Investment
Advisers, LLC
225 Franklin Street
Boston, MA 02110
Fund Distributor
Columbia Management Investment
Distributors, Inc.
225 Franklin Street
Boston, MA 02110
Fund Transfer Agent
Columbia Management Investment
Services Corp.
P.O. Box 8081
Boston, MA 02266-8081
For more information about any of the funds, please visit columbiamanagement.com or call 800.345.6611. Customer Service Representatives are available to answer your questions Monday through Friday from 8 a.m. to 8 p.m. Eastern time.
The views expressed in this report reflect the current views of the respective parties. These views are not guarantees of future performance and involve certain risks, uncertainties and assumptions that are difficult to predict, so actual outcomes and results may differ significantly from the views expressed. These views are subject to change at any time based upon economic, market or other conditions and the respective parties disclaim any responsibility to update such views. These views may not be relied on as investment advice and, because investment decisions for a Columbia Fund are based on numerous factors, may not be relied on as an indication of trading intent on behalf of any particular Columbia Fund. References to specific securities should not be construed as a recommendation or investment advice.
Columbia Connecticut Intermediate Municipal Bond Fund
Performance Summary
> Columbia Connecticut Intermediate Municipal Bond Fund (the Fund) Class A shares returned -1.34% excluding sales charges for the 12-month period that ended October 31, 2013. The Fund's Class Z shares returned -1.10% for the same time period.
> By comparison, the Fund's benchmark, the Barclays 3-15 Year Blend Municipal Bond Index, returned -0.53% for the same 12-month period.
> Heavier exposure to bonds with 4% coupons and maturities longer than 10 years generally accounted for the Fund's shortfall relative to the benchmark. When these bonds fell below par, the rate of decline was greater than that of the overall market.
Average Annual Total Returns (%) (for period ended October 31, 2013)
| | | Inception | | 1 Year | | 5 Years | | 10 Years | |
Class A | | 11/18/02 | | | | | | | |
Excluding sales charges | | | | | -1.34 | | | | 4.69 | | | | 3.15 | | |
Including sales charges | | | | | -4.54 | | | | 4.00 | | | | 2.65 | | |
Class B | | 11/18/02 | | | | | | | |
Excluding sales charges | | | | | -2.08 | | | | 3.91 | | | | 2.38 | | |
Including sales charges | | | | | -4.95 | | | | 3.91 | | | | 2.38 | | |
Class C | | 11/18/02 | | | | | | | |
Excluding sales charges | | | | | -1.74 | | | | 4.28 | | | | 2.74 | | |
Including sales charges | | | | | -2.70 | | | | 4.28 | | | | 2.74 | | |
Class R4 * | | 03/19/13 | | | -1.12 | | | | 4.95 | | | | 3.41 | | |
Class T | | 06/26/00 | | | | | | | |
Excluding sales charges | | | | | -1.25 | | | | 4.80 | | | | 3.26 | | |
Including sales charges | | | | | -5.97 | | | | 3.79 | | | | 2.75 | | |
Class Z | | 08/01/94 | | | -1.10 | | | | 4.95 | | | | 3.41 | | |
Barclays 3-15 Year Blend Municipal Bond Index | | | | | -0.53 | | | | 5.88 | | | | 4.47 | | |
Returns for Class A are shown with and without the maximum initial sales charge of 3.25% (for the one-year and five-year periods) and 4.75% (for the 10-year period). (Prior to August 22, 2005, new purchases of Class A shares had a maximum initial sales charge of 4.75%.) Returns for Class B are shown with and without the applicable contingent deferred sales charge (CDSC) of 3.00% in the first year, declining to 1.00% in the fourth year and eliminated thereafter. Returns for Class C are shown with and without the 1.00% CDSC for the first year only. Returns for Class T are shown with and without the maximum sales charge of 4.75%. The Fund's other classes are not subject to sales charges and have limited eligibility. Please see the Fund's prospectus for details. Performance for different share classes will vary based on differences in sales charges and fees associated with each class. All results shown assume reinvestment of distributions during the period. Returns do not reflect the deduction of taxes that a shareholder may pay on Fund distributions or on the redemption of Fund shares. Performance results reflect the effect of any fee waivers or reimbursements of Fund expenses by Columbia Management Investment Advisers, LLC and/or any of its affiliates. Absent these fee waivers or expense reimbursement arrangements, performance results would have been lower.
The performance information shown represents past performance and is not a guarantee of future results. The investment return and principal value of your investment will fluctuate so that your shares, when redeemed, may be worth more or less than their original cost. Current performance may be lower or higher than the performance information shown. You may obtain performance information current to the most recent month-end by contacting your financial intermediary, visiting columbiamanagement.com or calling 800.345.6611.
*The returns shown for periods prior to the share class inception date (including returns for the Life of the Fund, if shown, which are since Fund inception) include the returns of the Fund's oldest share class. These returns are adjusted to reflect any higher class-related operating expenses of the newer share classes, as applicable. Please visit columbiamanagement.com/mutual-funds/appended-performance for more information.
The Barclays 3-15 Year Blend Municipal Bond Index is an unmanaged index that tracks the performance of municipal bonds issued after December 31, 1990, with remaining maturities between 2 and 17 years and at least $7 million in principal amount outstanding.
Indices are not available for investment, are not professionally managed and do not reflect sales charges, fees, brokerage commissions, taxes or other expenses of investing. Securities in the Fund may not match those in an index.
Annual Report 2013
2
Columbia Connecticut Intermediate Municipal Bond Fund
Performance Overview (continued)
Performance of a Hypothetical $10,000 Investment (November 1, 2003 – October 31, 2013)
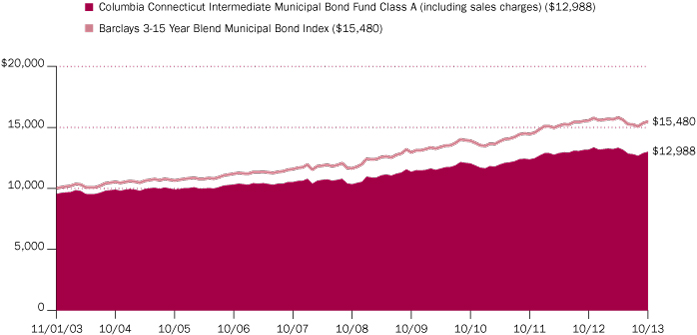
The chart above shows the change in value of a hypothetical $10,000 investment in Class A shares of Columbia Connecticut Intermediate Municipal Bond Fund during the stated time period, and does not reflect the deduction of taxes that a shareholder may pay on Fund distributions or on the redemption of Fund shares. The performance of a $10,000 with sales charge for Class A shares is calculated with an initial sales charge of 4.75%, which was the effective sales charge prior to August 22, 2005.
Annual Report 2013
3
Columbia Connecticut Intermediate Municipal Bond Fund
Manager Discussion of Fund Performance
For the 12-month period that ended October 31, 2013, the Fund's Class A shares returned -1.34% excluding sales charges. The Fund's Class Z shares returned -1.10% for the same time frame. By comparison, the Fund's benchmark, the Barclays 3-15 Year Blend Municipal Bond Index, which is national in scope, returned -0.53% for the same 12 months. Heavier exposure to bonds with 4% coupons and maturities longer than 10 years generally accounted for the Fund's shortfall relative to the benchmark. When these bonds fell below par, the rate of decline was greater than that of the overall market. The Fund sold its only Puerto Rico holding early in the period, which contributed positively to performance. Selling pressure sent Puerto Rico bonds down more than 17% for the 12-month period.
Second Half Rate Rise Pressures Municipal Market
The first half of the Fund's fiscal year was relatively uneventful, with interest rates range bound from November 2012 through April 2013. However, the Federal Reserve's (the Fed's) May announcement that it might begin to taper its monthly securities purchase program, known popularly as QE3 (the QE for "quantitative easing"), drove a sharp sell-off in the municipal market from May through mid-September. During this period, 10-year AAA municipal yields rose to close to 3.00%, matching the yield on the 10-year Treasury. New issue supply was down versus 2012, as higher rates made refinancing less viable. In addition, two major credit events clouded the outlook for municipal bonds: the city of Detroit filed for bankruptcy and Puerto Rico bonds fell sharply on negative economic news. Puerto Rico bonds are widely held in many mutual funds because they are triple tax-free.
Contributors and Detractors
We did well to eliminate exposure to Puerto Rico early in the period. At higher yields near the end of the period, we added a small position of Puerto Rico electric utilities, which we believe is one of the better names on the island. During the period, we decreased duration (a measure of interest rate sensitivity) to bring it generally in line with the benchmark by selling longer maturity bonds and decreasing exposure to 4% coupons, which helped decrease Fund volatility. We also decreased exposure to very short maturities, using the proceeds to cover redemptions from the Fund.
The Fund's exposure to bonds with 4% coupons and maturities longer than ten years detracted from performance relative to the benchmark. When these bonds fell below par, the rate of decline was greater than the decline of the overall market. The Fund's duration was also slightly longer than that of the benchmark, which hampered results as rates rose. In addition, the Fund held one large state general obligation holding, which was in the 15-year maturity range, the worst performing maturity segment for the period. Local general obligation bonds marginally lagged the benchmark overall. Despite accounting for the Fund's biggest allocation, the Fund's holdings in this area matched the performance of the benchmark's general obligation bonds.
A Slow Recovery for Connecticut Economy
Helped by continued growth in health care, education and recovery in the construction sector, Connecticut recorded slow but solid growth over the past 12-month period ended October 31, 2013. However, the long-term outlook for the
Portfolio Management
Brian McGreevy
Quality Breakdown (%)
(at October 31, 2013) | |
AAA rating | | | 11.5 | | |
AA rating | | | 32.2 | | |
A rating | | | 48.2 | | |
BBB rating | | | 3.9 | | |
Not rated | | | 4.2 | | |
Total | | | 100.0 | | |
Percentages indicated are based upon total fixed income securities (excluding Money Market Funds).
Bond ratings apply to the underlying holdings of the Fund and not the Fund itself and are divided into categories ranging from AAA (highest) to D (lowest), and are subject to change. The ratings shown are determined by using the middle rating of Moody's, S&P, and Fitch after dropping the highest and lowest available ratings. When a rating from only two agencies is available, the lower rating is used. When a rating from only one agency is available, that rating is used. When a bond is not rated by one of these agencies, it is designated as Not rated. Credit ratings are subjective opinions and not statements of fact.
Investment Risks
There are risks associated with an investment in a municipal bond fund, including credit risk, interest rate risk, prepayment and extension risk, and geographic concentration risk. In general, bond prices rise when interest rates fall and vice versa. This effect is more pronounced for longer-term securities. Because the Fund concentrates its investments in municipal securities issued by a single state and its municipalities, specific events or factors affecting a particular state can cause more volatility in the Fund than a fund that is more geographically diversified. Non-investment grade securities, commonly called "high-yield" or "junk" bonds, have more volatile prices and carry more risk to principal and income than investment grade securities. Income from tax-exempt funds may be subject to state and local taxes and a portion of income may be subject to the federal and/or state alternative minimum tax for certain investors. Federal and state income tax rules will apply to any capital gain distributions and any gains or losses on sales. See the Fund's prospectus for information on these and other risks.
Annual Report 2013
4
Columbia Connecticut Intermediate Municipal Bond Fund
Manager Discussion of Fund Performance (continued)
state currently remains mixed. At present, local government payrolls are trending downward, reflecting a reduced property tax base. Large firms that depend on federal defense spending are subject to serious downside risks, with federal budget pressures intact. In addition, higher energy bills will push up the cost of living across the state. Yet, the presence of civilian aerospace, health care and prestigious educational institutions will drive output, and household income growth is likely to be higher than the U.S. average.
Looking Ahead
A drop in new issue supply is currently projected for 2014, as issuers remain cautious about taking on new debt. In this environment, we will look to our credit research team to help us seek to identify opportunities in the higher yielding A and BBB rated segments of the market that we believe are attractively valued and offer sound fundamentals. We believe the eight- to 12-year maturity range offers value because the vast majority of yield available in the intermediate space can be captured in this maturity range. We also currently plan to continue to maintain a neutral duration relative to the benchmark until there is more clarity around the Fed's intentions and the arrival of a new Fed chairman at the beginning of 2014.
Annual Report 2013
5
Columbia Connecticut Intermediate Municipal Bond Fund
Understanding Your Fund's Expenses
(Unaudited)
As an investor, you incur two types of costs. There are transaction costs, which generally include sales charges on purchases and may include redemption fees. There are also ongoing costs, which generally include management fees, distribution and service (Rule 12b-1) fees, and other fund expenses. The following information is intended to help you understand your ongoing costs (in dollars) of investing in the Fund and to help you compare these costs with the ongoing costs of investing in other mutual funds.
Analyzing Your Fund's Expenses
To illustrate these ongoing costs, we have provided examples and calculated the expenses paid by investors in each share class of the Fund during the period. The actual and hypothetical information in the table is based on an initial investment of $1,000 at the beginning of the period indicated and held for the entire period. Expense information is calculated two ways and each method provides you with different information. The amount listed in the "Actual" column is calculated using the Fund's actual operating expenses and total return for the period. You may use the Actual information, together with the amount invested, to estimate the expenses that you paid over the period. Simply divide your account value by $1,000 (for example, an $8,600 account value divided by $1,000 = 8.6), then multiply the results by the expenses paid during the period under the Actual column. The amount listed in the "Hypothetical" column assumes a 5% annual rate of return before expenses (which is not the Fund's actual return) and then applies the Fund's actual expense ratio for the period to the hypothetical return. You should not use the hypothetical account values and expenses to estimate either your actual account balance at the end of the period or the expenses you paid during the period. See "Compare With Other Funds" below for details on how to use the hypothetical data.
Compare With Other Funds
Since all mutual funds are required to include the same hypothetical calculations about expenses in shareholder reports, you can use this information to compare the ongoing cost of investing in the Fund with other funds. To do so, compare the hypothetical example with the 5% hypothetical examples that appear in the shareholder reports of other funds. As you compare hypothetical examples of other funds, it is important to note that hypothetical examples are meant to highlight the ongoing costs of investing in a fund only and do not reflect any transaction costs, such as sales charges, or redemption or exchange fees. Therefore, the hypothetical calculations are useful in comparing ongoing costs only, and will not help you determine the relative total costs of owning different funds. If transaction costs were included in these calculations, your costs would be higher.
May 1, 2013 — October 31, 2013
| | | Account Value at the Beginning
of the Period ($) | | Account Value at the End of the
Period ($) | | Expenses Paid During the
Period ($) | | Fund's Annualized
Expense Ratio (%) | |
| | | Actual | | Hypothetical | | Actual | | Hypothetical | | Actual | | Hypothetical | | Actual | |
Class A | | | 1,000.00 | | | | 1,000.00 | | | | 974.30 | | | | 1,021.12 | | | | 4.03 | | | | 4.13 | | | | 0.81 | | |
Class B | | | 1,000.00 | | | | 1,000.00 | | | | 970.60 | | | | 1,017.34 | | | | 7.75 | | | | 7.93 | | | | 1.56 | | |
Class C | | | 1,000.00 | | | | 1,000.00 | | | | 972.30 | | | | 1,019.11 | | | | 6.02 | | | | 6.16 | | | | 1.21 | | |
Class R4 | | | 1,000.00 | | | | 1,000.00 | | | | 975.40 | | | | 1,022.38 | | | | 2.79 | | | | 2.85 | | | | 0.56 | | |
Class T | | | 1,000.00 | | | | 1,000.00 | | | | 974.80 | | | | 1,021.63 | | | | 3.53 | | | | 3.62 | | | | 0.71 | | |
Class Z | | | 1,000.00 | | | | 1,000.00 | | | | 975.50 | | | | 1,022.38 | | | | 2.79 | | | | 2.85 | | | | 0.56 | | |
Expenses paid during the period are equal to the annualized expense ratio for each class as indicated above, multiplied by the average account value over the period and then multiplied by the number of days in the Fund's most recent fiscal half year and divided by 365.
Expenses do not include fees and expenses incurred indirectly by the Fund from the underlying funds in which the Fund may invest (also referred to as "acquired funds"), including affiliated and non-affiliated pooled investment vehicles (including mutual funds and exchange-traded funds).
Had Columbia Management Investment Advisers, LLC and/or certain of its affiliates not waived/reimbursed certain fees and expenses, account value at the end of the period would have been reduced.
Annual Report 2013
6
Columbia Connecticut Intermediate Municipal Bond Fund
Portfolio of Investments
October 31, 2013
(Percentages represent value of investments compared to net assets)
Municipal Bonds 97.4%
Issue
Description | | Coupon
Rate | | Principal
Amount ($) | | Value ($) | |
Disposal 0.9% | |
New Haven Solid Waste Authority
Revenue Bonds
Series 2008
06/01/23 | | | 5.125 | % | | | 1,520,000 | | | | 1,694,800 | | |
Higher Education 10.9% | |
Connecticut State Health & Educational Facility Authority
Refunding Revenue Bonds
Sacred Heart University
Series 2012H (AGM)
07/01/19 | | | 5.000 | % | | | 2,350,000 | | | | 2,744,471 | | |
Revenue Bonds
Fairfield University
Series 2008N
07/01/18 | | | 5.000 | % | | | 2,120,000 | | | | 2,430,559 | | |
07/01/22 | | | 5.000 | % | | | 2,500,000 | | | | 2,796,750 | | |
Quinnipiac University
Series 2007I (NPFGC)
07/01/22 | | | 5.000 | % | | | 2,000,000 | | | | 2,196,680 | | |
Quinnipiac University Health & Education
Series 2007 (NPFGC)
07/01/28 | | | 5.000 | % | | | 2,000,000 | | | | 2,148,760 | | |
Sacred Heart University
Series 2011G
07/01/20 | | | 5.000 | % | | | 1,190,000 | | | | 1,307,524 | | |
Trinity College
Series 1998F (NPFGC)
07/01/21 | | | 5.500 | % | | | 500,000 | | | | 584,100 | | |
Series 2004H (NPFGC)
07/01/25 | | | 5.000 | % | | | 540,000 | | | | 554,548 | | |
Yale University
Series 1997T-1
07/01/29 | | | 4.700 | % | | | 4,800,000 | | | | 5,008,032 | | |
Total | | | | | | | 19,771,424 | | |
Hospital 12.8% | |
Connecticut State Health & Educational Facility Authority
Revenue Bonds
Bridgeport Hospital
Series 2012D
07/01/22 | | | 5.000 | % | | | 1,400,000 | | | | 1,553,020 | | |
Health System Catholic East
Series 2010
11/15/29 | | | 4.750 | % | | | 3,420,000 | | | | 3,493,804 | | |
Hospital for Special Care
Series 2007C (RAD)
07/01/17 | | | 5.250 | % | | | 500,000 | | | | 553,245 | | |
07/01/20 | | | 5.250 | % | | | 1,235,000 | | | | 1,319,239 | | |
07/01/27 | | | 5.250 | % | | | 750,000 | | | | 762,180 | | |
Lawrence & Memorial Hospital
Series 2011S
07/01/15 | | | 5.000 | % | | | 850,000 | | | | 912,807 | | |
Middlesex Hospital
Series 2006M (AGM)
07/01/27 | | | 4.875 | % | | | 500,000 | | | | 519,405 | | |
Municipal Bonds (continued)
Issue
Description | | Coupon
Rate | | Principal
Amount ($) | | Value ($) | |
Series 2011N
07/01/17 | | | 5.000 | % | | | 1,175,000 | | | | 1,323,872 | | |
07/01/20 | | | 5.000 | % | | | 1,365,000 | | | | 1,534,069 | | |
07/01/21 | | | 5.000 | % | | | 1,000,000 | | | | 1,113,940 | | |
Stamford Hospital
Series 2012J
07/01/19 | | | 4.000 | % | | | 1,435,000 | | | | 1,545,696 | | |
07/01/20 | | | 5.000 | % | | | 1,525,000 | | | | 1,715,854 | | |
Western Connecticut Health Network
Series 2011
07/01/19 | | | 5.000 | % | | | 1,760,000 | | | | 1,993,094 | | |
07/01/20 | | | 5.000 | % | | | 1,630,000 | | | | 1,837,140 | | |
William W Backus Hospital
Series 2005G (AGM)
07/01/24 | | | 5.000 | % | | | 2,060,000 | | | | 2,159,560 | | |
Yale-New Haven Hospital
Series 2013N
07/01/25 | | | 5.000 | % | | | 300,000 | | | | 333,501 | | |
07/01/26 | | | 5.000 | % | | | 570,000 | | | | 624,395 | | |
Total | | | | | | | 23,294,821 | | |
Human Service Provider 0.1% | |
Connecticut State Health & Educational Facility Authority
Revenue Bonds
Village Families & Children
Series 2002A (AMBAC)
07/01/23 | | | 5.000 | % | | | 260,000 | | | | 260,000 | | |
Investor Owned 2.8% | |
Connecticut State Development Authority
Refunding Revenue Bonds
Connecticut Light & Power Co. Project
Series 2011
09/01/28 | | | 4.375 | % | | | 5,000,000 | | | | 5,104,550 | | |
Joint Power Authority 0.6% | |
Connecticut Municipal Electric Energy Cooperative
Revenue Bonds
Series 2012A
01/01/27 | | | 5.000 | % | | | 1,000,000 | | | | 1,096,030 | | |
Local General Obligation 27.9% | |
City of Bridgeport
Unlimited General Obligation Refunding Bonds
Series 2004C (NPFGC)
08/15/17 | | | 5.250 | % | | | 1,500,000 | | | | 1,707,420 | | |
08/15/21 | | | 5.500 | % | | | 1,125,000 | | | | 1,312,909 | | |
Series 2012B
08/15/19 | | | 4.000 | % | | | 3,000,000 | | | | 3,263,970 | | |
City of Danbury
Unlimited General Obligation Refunding Bonds
Series 2004 (NPFGC)
08/01/16 | | | 4.750 | % | | | 1,270,000 | | | | 1,322,946 | | |
The accompanying Notes to Financial Statements are an integral part of this statement.
Annual Report 2013
7
Columbia Connecticut Intermediate Municipal Bond Fund
Portfolio of Investments (continued)
October 31, 2013
Municipal Bonds (continued)
Issue
Description | | Coupon
Rate | | Principal
Amount ($) | | Value ($) | |
City of Hartford
Unlimited General Obligation Bonds
Series 2011A
04/01/22 | | | 5.250 | % | | | 1,325,000 | | | | 1,544,182 | | |
04/01/23 | | | 5.250 | % | | | 1,325,000 | | | | 1,523,101 | | |
04/01/24 | | | 5.250 | % | | | 1,325,000 | | | | 1,507,254 | | |
Unlimited General Obligation Refunding Bonds
Series 2005C (NPFGC)
09/01/19 | | | 5.000 | % | | | 2,085,000 | | | | 2,406,590 | | |
Series 2013A
04/01/26 | | | 5.000 | % | | | 1,810,000 | | | | 1,993,371 | | |
City of New Britain
Unlimited General Obligation Bonds
Series 2006 (AMBAC)
04/15/17 | | | 5.000 | % | | | 1,165,000 | | | | 1,318,396 | | |
City of New Haven
Unlimited General Obligation Bonds
Series 2011 (AGM)
08/01/18 | | | 5.000 | % | | | 820,000 | | | | 937,227 | | |
Unlimited General Obligation Refunding Bonds
Series 2008 (AGM)
11/01/18 | | | 5.000 | % | | | 4,410,000 | | | | 5,060,210 | | |
City of Stamford
Unlimited General Obligation Refunding Bonds
Series 2003B
08/15/17 | | | 5.250 | % | | | 1,125,000 | | | | 1,312,301 | | |
City of West Haven
Unlimited General Obligation Bonds
Series 2012 (AGM)
08/01/17 | | | 4.000 | % | | | 2,215,000 | | | | 2,356,627 | | |
Regional School District No. 15
Limited General Obligation Refunding Bonds
Series 2003 (NPFGC)
02/01/15 | | | 5.000 | % | | | 1,105,000 | | | | 1,167,974 | | |
02/01/16 | | | 5.000 | % | | | 1,025,000 | | | | 1,124,733 | | |
Town of East Haven
Unlimited General Obligation Refunding Bonds
Series 2003 (NPFGC)
09/01/15 | | | 5.000 | % | | | 640,000 | | | | 687,795 | | |
Town of Fairfield
Unlimited General Obligation Refunding Bonds
Series 2008
01/01/20 | | | 5.000 | % | | | 1,000,000 | | | | 1,195,630 | | |
01/01/22 | | | 5.000 | % | | | 500,000 | | | | 602,870 | | |
Town of Guilford
Refunding Unlimited General Obligation Bonds
Series 2012-A
08/15/26 | | | 3.000 | % | | | 960,000 | | | | 903,264 | | |
Town of Hamden
Unlimited General Obligation Refunding Bonds
Series 2013 (AGM)
08/15/20 | | | 5.000 | % | | | 1,000,000 | | | | 1,129,550 | | |
08/15/21 | | | 5.000 | % | | | 1,000,000 | | | | 1,122,600 | | |
Town of New Milford
Unlimited General Obligation Bonds
Series 2004 (AMBAC)
01/15/16 | | | 5.000 | % | | | 1,025,000 | | | | 1,129,437 | | |
Municipal Bonds (continued)
Issue
Description | | Coupon
Rate | | Principal
Amount ($) | | Value ($) | |
Town of Newtown
Unlimited General Obligation Refunding Bonds
Series 2010
07/01/20 | | | 4.500 | % | | | 1,500,000 | | | | 1,749,765 | | |
Town of North Haven
Unlimited General Obligation Bonds
Series 2007
07/15/24 | | | 4.750 | % | | | 1,150,000 | | | | 1,336,162 | | |
07/15/25 | | | 4.750 | % | | | 1,150,000 | | | | 1,328,572 | | |
Town of Ridgefield
Unlimited General Obligation Refunding Bonds
Series 2009
09/15/20 | | | 5.000 | % | | | 2,130,000 | | | | 2,579,217 | | |
Town of Trumbull
Unlimited General Obligation Refunding Bonds
Series 2009
09/15/20 | | | 4.000 | % | | | 575,000 | | | | 639,469 | | |
09/15/21 | | | 4.000 | % | | | 600,000 | | | | 655,674 | | |
Town of Watertown
Unlimited General Obligation Refunding Bonds
Series 2005 (NPFGC)
08/01/17 | | | 5.000 | % | | | 1,060,000 | | | | 1,222,795 | | |
Series 2009B
07/01/17 | | | 5.000 | % | | | 2,000,000 | | | | 2,303,740 | | |
Town of Weston
Unlimited General Obligation Bonds
Series 2004
07/15/15 | | | 5.250 | % | | | 1,300,000 | | | | 1,409,954 | | |
Town of Windham
Unlimited General Obligation Refunding Bonds
Series 2004 (NPFGC)
06/15/15 | | | 5.000 | % | | | 785,000 | | | | 844,338 | | |
Total | | | | | | | 50,700,043 | | |
Multi-Family 1.2% | |
Bridgeport Housing Authority
Revenue Bonds
Custodial Receipts Energy Performance
Series 2009
06/01/22 | | | 5.000 | % | | | 1,035,000 | | | | 1,087,402 | | |
06/01/23 | | | 5.000 | % | | | 1,085,000 | | | | 1,134,129 | | |
Total | | | | | | | 2,221,531 | | |
Municipal Power 0.7% | |
Guam Power Authority
Refunding Revenue Bonds
Series 2012A (AGM)(a)
10/01/24 | | | 5.000 | % | | | 315,000 | | | | 351,549 | | |
Puerto Rico Electric Power Authority
Refunding Revenue Bonds
Series 2010ZZ(a)
07/01/17 | | | 5.000 | % | | | 1,000,000 | | | | 888,690 | | |
Total | | | | | | | 1,240,239 | | |
The accompanying Notes to Financial Statements are an integral part of this statement.
Annual Report 2013
8
Columbia Connecticut Intermediate Municipal Bond Fund
Portfolio of Investments (continued)
October 31, 2013
Municipal Bonds (continued)
Issue
Description | | Coupon
Rate | | Principal
Amount ($) | | Value ($) | |
Nursing Home 0.7% | |
Connecticut State Development Authority
Revenue Bonds
Alzheimer's Resource Center Project
Series 2007
08/15/21 | | | 5.400 | % | | | 500,000 | | | | 516,570 | | |
Alzheimers Residence Center, Inc. Project
Series 2007
08/15/17 | | | 5.200 | % | | | 785,000 | | | | 823,732 | | |
Total | | | | | | | 1,340,302 | | |
Pool/Bond Bank 1.3% | |
State of Connecticut
Refunding Revenue Bonds
Revolving Fund
Series 2003B
10/01/15 | | | 5.000 | % | | | 1,000,000 | | | | 1,089,650 | | |
Series 2009C
10/01/18 | | | 5.000 | % | | | 1,000,000 | | | | 1,184,830 | | |
Total | | | | | | | 2,274,480 | | |
Prep School 3.2% | |
Connecticut State Health & Educational Facility Authority
Revenue Bonds
Greenwich Academy
Series 2007E (AGM)
03/01/26 | | | 5.250 | % | | | 2,770,000 | | | | 3,214,668 | | |
Loomis Chaffe School
Series 2005F (AMBAC)
07/01/27 | | | 5.250 | % | | | 1,670,000 | | | | 1,997,320 | | |
Miss Porters School Issue
Series 2006B (AMBAC)
07/01/29 | | | 4.500 | % | | | 600,000 | | | | 603,714 | | |
Total | | | | | | | 5,815,702 | | |
Refunded/Escrowed 4.1% | |
City of Hartford
Unlimited General Obligation Bonds
Series 2006 (AMBAC)
07/15/22 | | | 5.000 | % | | | 600,000 | | | | 671,682 | | |
Series 2009A (AGM)
08/15/17 | | | 5.000 | % | | | 695,000 | | | | 804,873 | | |
Connecticut Municipal Electric Energy Cooperative
Revenue Bonds
Series 2006A (AMBAC)
01/01/22 | | | 5.000 | % | | | 2,000,000 | | | | 2,272,900 | | |
Series 2009A (AGM)
01/01/17 | | | 5.000 | % | | | 1,525,000 | | | | 1,733,086 | | |
Puerto Rico Highways & Transportation Authority
Revenue Bonds
Series 2005BB (AGM) Escrowed to Maturity(a)
07/01/22 | | | 5.250 | % | | | 895,000 | | | | 1,102,577 | | |
Municipal Bonds (continued)
Issue
Description | | Coupon
Rate | | Principal
Amount ($) | | Value ($) | |
State of Connecticut
Special Tax Bonds
Transportation Infrastructure
Series 2003B (NPFGC)
01/01/23 | | | 5.000 | % | | | 800,000 | | | | 806,488 | | |
Total | | | | | | | 7,391,606 | | |
Single Family 4.0% | |
Connecticut Housing Finance Authority
Revenue Bonds
Subordinated Series 2008B-1
11/15/23 | | | 4.750 | % | | | 3,000,000 | | | | 3,135,330 | | |
Subordinated Series 2009B-1
11/15/24 | | | 4.550 | % | | | 4,000,000 | | | | 4,150,280 | | |
Total | | | | | | | 7,285,610 | | |
Special Non Property Tax 8.3% | |
State of Connecticut Special Tax
Revenue Bonds
Transportation Infrastructure
Series 2009A
12/01/19 | | | 4.500 | % | | | 3,765,000 | | | | 4,388,296 | | |
State of Connecticut
Refunding Special Tax Bonds
2nd Lien Transportation Infrastructure
Series 2009-1
02/01/17 | | | 4.250 | % | | | 2,000,000 | | | | 2,229,640 | | |
02/01/19 | | | 5.000 | % | | | 3,450,000 | | | | 4,070,655 | | |
Transportation Infrastructure
Series 2004B (AMBAC)
07/01/18 | | | 5.250 | % | | | 1,500,000 | | | | 1,782,450 | | |
Territory of Guam
Revenue Bonds
Series 2011A(a)
01/01/31 | | | 5.000 | % | | | 550,000 | | | | 565,933 | | |
Virgin Islands Public Finance Authority
Revenue Bonds
Senior Lien-Matching Fund Loan Note
Series 2010A(a)
10/01/25 | | | 5.000 | % | | | 2,020,000 | | | | 2,122,879 | | |
Total | | | | | | | 15,159,853 | | |
Special Property Tax 1.7% | |
Harbor Point Infrastructure Improvement District
Tax Allocation Bonds
Harbor Point Project
Series 2010A
04/01/22 | | | 7.000 | % | | | 2,803,000 | | | | 3,037,022 | | |
The accompanying Notes to Financial Statements are an integral part of this statement.
Annual Report 2013
9
Columbia Connecticut Intermediate Municipal Bond Fund
Portfolio of Investments (continued)
October 31, 2013
Municipal Bonds (continued)
Issue
Description | | Coupon
Rate | | Principal
Amount ($) | | Value ($) | |
State Appropriated 3.1% | |
Connecticut State Health & Educational Facility Authority
Refunding Revenue Bonds
Connecticut State University System
Series 2007I (AGM)
11/01/17 | | | 5.250 | % | | | 1,000,000 | | | | 1,168,290 | | |
University of Connecticut
Revenue Bonds
Series 2007A
04/01/24 | | | 4.000 | % | | | 2,100,000 | | | | 2,180,493 | | |
Series 2009A
02/15/23 | | | 5.000 | % | | | 2,000,000 | | | | 2,284,360 | | |
Total | | | | | | | 5,633,143 | | |
State General Obligation 9.7% | |
Connecticut Housing Finance Authority
Revenue Bonds
State Supported Special Obligation
Series 2009-10
06/15/18 | | | 5.000 | % | | | 1,755,000 | | | | 2,024,217 | | |
06/15/19 | | | 5.000 | % | | | 1,840,000 | | | | 2,133,296 | | |
State of Connecticut
Unlimited General Obligation Bonds
Series 2005D (NPFGC)
11/15/23 | | | 5.000 | % | | | 4,000,000 | | | | 4,355,160 | | |
Series 2008B
04/15/22 | | | 5.000 | % | | | 5,415,000 | | | | 6,130,592 | | |
Unlimited General Obligation Refunding Bonds
Series 2005B (AMBAC)
06/01/20 | | | 5.250 | % | | | 600,000 | | | | 720,396 | | |
Series 2006E
12/15/20 | | | 5.000 | % | | | 2,000,000 | | | | 2,249,320 | | |
Total | | | | | | | 17,612,981 | | |
Water & Sewer 3.4% | |
South Central Connecticut Regional Water Authority
Refunding Revenue Bonds
20th Series 2007A (NPFGC)
08/01/22 | | | 5.250 | % | | | 1,370,000 | | | | 1,646,014 | | |
08/01/23 | | | 5.250 | % | | | 500,000 | | | | 601,310 | | |
Series 2012-27
08/01/29 | | | 5.000 | % | | | 2,945,000 | | | | 3,183,044 | | |
South Central Connecticut Regional Water Authority(b)
Revenue Bonds
18th Series 2003B (NPFGC)
08/01/29 | | | 5.250 | % | | | 750,000 | | | | 815,588 | | |
Total | | | | | | | 6,245,956 | | |
Total Municipal Bonds
(Cost: $167,557,123) | | | | | | | 177,180,093 | | |
Money Market Funds 1.7%
Issue
Description | | Shares | | Value ($) | |
Dreyfus Tax-Exempt Cash Management Fund,
0.000%(c) | | | 1,600,007 | | | | 1,600,007 | | |
JPMorgan Tax-Free Money Market Fund,
0.010%(c) | | | 1,497,262 | | | | 1,497,262 | | |
Total Money Market Funds
(Cost: $3,097,269) | | | | | 3,097,269 | | |
Total Investments
(Cost: $170,654,392) | | | | | 180,277,362 | | |
Other Assets & Liabilities, Net | | | | | 1,690,774 | | |
Net Assets | | | | | 181,968,136 | | |
The accompanying Notes to Financial Statements are an integral part of this statement.
Annual Report 2013
10
Columbia Connecticut Intermediate Municipal Bond Fund
Portfolio of Investments (continued)
October 31, 2013
Notes to Portfolio of Investments
(a) Municipal obligations include debt obligations issued by or on behalf of territories, possessions, or sovereign nations within the territorial boundaries of the United States. At October 31, 2013, the value of these securities amounted to $5,031,628 or 2.77% of net assets.
(b) Variable rate security.
(c) The rate shown is the seven-day current annualized yield at October 31, 2013.
Abbreviation Legend
AGM Assured Guaranty Municipal Corporation
AMBAC Ambac Assurance Corporation
NPFGC National Public Finance Guarantee Corporation
RAD Radian Asset Assurance, Inc.
Fair Value Measurements
Generally accepted accounting principles (GAAP) require disclosure regarding the inputs and valuation techniques used to measure fair value and any changes in valuation inputs or techniques. In addition, investments shall be disclosed by major category.
The Fund categorizes its fair value measurements according to a three-level hierarchy that maximizes the use of observable inputs and minimizes the use of unobservable inputs by prioritizing that the most observable input be used when available. Observable inputs are those that market participants would use in pricing an investment based on market data obtained from sources independent of the reporting entity. Unobservable inputs are those that reflect the Fund's assumptions about the information market participants would use in pricing an investment. An investment's level within the fair value hierarchy is based on the lowest level of any input that is deemed significant to the asset or liability's fair value measurement. The input levels are not necessarily an indication of the risk or liquidity associated with investments at that level. For example, certain U.S. government securities are generally high quality and liquid, however, they are reflected as Level 2 because the inputs used to determine fair value may not always be quoted prices in an active market.
Fair value inputs are summarized in the three broad levels listed below:
> Level 1 — Valuations based on quoted prices for investments in active markets that the Fund has the ability to access at the measurement date (including NAV for open-end mutual funds). Valuation adjustments are not applied to Level 1 investments.
> Level 2 — Valuations based on other significant observable inputs (including quoted prices for similar securities, interest rates, prepayment speeds, credit risks, etc.).
> Level 3 — Valuations based on significant unobservable inputs (including the Fund's own assumptions and judgment in determining the fair value of investments).
Inputs that are used in determining fair value of an investment may include price information, credit data, volatility statistics, and other factors. These inputs can be either observable or unobservable. The availability of observable inputs can vary between investments, and is affected by various factors such as the type of investment, and the volume and level of activity for that investment or similar investments in the marketplace. The inputs will be considered by the Investment Manager, along with any other relevant factors in the calculation of an investment's fair value. The Fund uses prices and inputs that are current as of the measurement date, which may include periods of market dislocations. During these periods, the availability of prices and inputs may be reduced for many investments. This condition could cause an investment to be reclassified between the various levels within the hierarchy.
Investments falling into the Level 3 category are primarily supported by quoted prices from brokers and dealers participating in the market for those investments. However, these may be classified as Level 3 investments due to lack of market transparency and corroboration to support these quoted prices. Additionally, valuation models may be used as the pricing source for any remaining investments classified as Level 3. These models may rely on one or more significant unobservable inputs and/or significant assumptions by the Investment Manager. Inputs used in valuations may include, but are not limited to, financial statement analysis, capital account balances, discount rates and estimated cash flows, and comparable company data.
Under the direction of the Fund's Board of Trustees (the Board), the Investment Manager's Valuation Committee (the Committee) is responsible for carrying out the valuation procedures approved by the Board. The Committee consists of voting and non-voting members from various groups within the Investment Manager's organization, including operations and accounting, trading and investments, compliance, risk management and legal.
The accompanying Notes to Financial Statements are an integral part of this statement.
Annual Report 2013
11
Columbia Connecticut Intermediate Municipal Bond Fund
Portfolio of Investments (continued)
October 31, 2013
Fair Value Measurements (continued)
The Committee meets at least monthly to review and approve valuation matters, which may include a description of specific valuation determinations, data regarding pricing information received from approved pricing vendors and brokers and the results of Board-approved valuation control policies and procedures (the Policies). The Policies address, among other things, instances when market quotations are or are not readily available, including recommendations of third party pricing vendors and a determination of appropriate pricing methodologies; events that require specific valuation determinations and assessment of fair value techniques; securities with a potential for stale pricing, including those that are illiquid, restricted, or in default; and the effectiveness of third-party pricing vendors, including periodic reviews of vendors. The Committee meets more frequently, as needed, to discuss additional valuation matters, which may include the need to review back-testing results, review time-sensitive information or approve related valuation actions. The Committee reports to the Board, with members of the Committee meeting with the Board at each of its regularly scheduled meetings to discuss valuation matters and actions during the period, similar to those described earlier.
For investments categorized as Level 3, the Committee monitors information similar to that described above, which may include: (i) data specific to the issuer or comparable issuers, (ii) general market or specific sector news and (iii) quoted prices and specific or similar security transactions. The Committee considers this data and any changes from prior periods in order to assess the reasonableness of observable and unobservable inputs, any assumptions or internal models used to value those securities and changes in fair value. This data is also used to corroborate, when available, information received from approved pricing vendors and brokers. Various factors impact the frequency of monitoring this information (which may occur as often as daily). However, the Committee may determine that changes to inputs, assumptions and models are not required as a result of the monitoring procedures performed.
The following table is a summary of the inputs used to value the Fund's investments at October 31, 2013:
Description | | Level 1
Quoted Prices in Active
Markets for Identical
Assets ($) | | Level 2
Other Significant
Observable Inputs ($) | | Level 3
Significant
Unobservable Inputs ($) | | Total ($) | |
Bonds | |
Municipal Bonds | | | — | | | | 177,180,093 | | | | — | | | | 177,180,093 | | |
Total Bonds | | | — | | | | 177,180,093 | | | | — | | | | 177,180,093 | | |
Mutual Funds | |
Money Market Funds | | | 3,097,269 | | | | — | | | | — | | | | 3,097,269 | | |
Total Mutual Funds | | | 3,097,269 | | | | — | | | | — | | | | 3,097,269 | | |
Total | | | 3,097,269 | | | | 177,180,093 | | | | — | | | | 180,277,362 | | |
See the Portfolio of Investments for all investment classifications not indicated in the table.
The Fund's assets assigned to the Level 2 input category are generally valued using the market approach, in which a security's value is determined through reference to prices and information from market transactions for similar or identical assets.
There were no transfers of financial assets between Levels 1 and 2 during the period.
The accompanying Notes to Financial Statements are an integral part of this statement.
Annual Report 2013
12
Columbia Connecticut Intermediate Municipal Bond Fund
Statement of Assets and Liabilities
October 31, 2013
Assets | |
Investments, at value
(identified cost $170,654,392) | | $ | 180,277,362 | | |
Receivable for: | |
Capital shares sold | | | 79,128 | | |
Interest | | | 2,237,125 | | |
Expense reimbursement due from Investment Manager | | | 146 | | |
Prepaid expenses | | | 1,858 | | |
Trustees' deferred compensation plan | | | 31,159 | | |
Other assets | | | 2,980 | | |
Total assets | | | 182,629,758 | | |
Liabilities | |
Payable for: | |
Capital shares purchased | | | 102,024 | | |
Dividend distributions to shareholders | | | 462,401 | | |
Investment management fees | | | 1,996 | | |
Distribution and/or service fees | | | 244 | | |
Transfer agent fees | | | 32,148 | | |
Administration fees | | | 349 | | |
Chief compliance officer expenses | | | 13 | | |
Other expenses | | | 31,288 | | |
Trustees' deferred compensation plan | | | 31,159 | | |
Total liabilities | | | 661,622 | | |
Net assets applicable to outstanding capital stock | | $ | 181,968,136 | | |
Represented by | |
Paid-in capital | | $ | 172,723,632 | | |
Undistributed net investment income | | | 141,748 | | |
Accumulated net realized loss | | | (520,214 | ) | |
Unrealized appreciation (depreciation) on: | |
Investments | | | 9,622,970 | | |
Total — representing net assets applicable to outstanding capital stock | | $ | 181,968,136 | | |
The accompanying Notes to Financial Statements are an integral part of this statement.
Annual Report 2013
13
Columbia Connecticut Intermediate Municipal Bond Fund
Statement of Assets and Liabilities (continued)
October 31, 2013
Class A | |
Net assets | | $ | 9,015,829 | | |
Shares outstanding | | | 830,692 | | |
Net asset value per share | | $ | 10.85 | | |
Maximum offering price per share(a) | | $ | 11.21 | | |
Class B | |
Net assets | | $ | 142,898 | | |
Shares outstanding | | | 13,167 | | |
Net asset value per share | | $ | 10.85 | | |
Class C | |
Net assets | | $ | 6,977,022 | | |
Shares outstanding | | | 642,906 | | |
Net asset value per share | | $ | 10.85 | | |
Class R4 | |
Net assets | | $ | 2,428 | | |
Shares outstanding | | | 224 | | |
Net asset value per share | | $ | 10.84 | | |
Class T | |
Net assets | | $ | 13,287,239 | | |
Shares outstanding | | | 1,224,351 | | |
Net asset value per share | | $ | 10.85 | | |
Maximum offering price per share(a) | | $ | 11.39 | | |
Class Z | |
Net assets | | $ | 152,542,720 | | |
Shares outstanding | | | 14,056,388 | | |
Net asset value per share | | $ | 10.85 | | |
(a) The maximum offering price per share is calculated by dividing the net asset value per share by 1.0 minus the maximum sales charge of 3.25% for Class A and 4.75% for Class T.
The accompanying Notes to Financial Statements are an integral part of this statement.
Annual Report 2013
14
Columbia Connecticut Intermediate Municipal Bond Fund
Statement of Operations
Year Ended October 31, 2013
Net investment income | |
Income: | |
Dividends | | $ | 183 | | |
Interest | | | 6,987,300 | | |
Total income | | | 6,987,483 | | |
Expenses: | |
Investment management fees | | | 807,504 | | |
Distribution and/or service fees | |
Class A | | | 22,583 | | |
Class B | | | 1,563 | | |
Class C | | | 74,454 | | |
Class T | | | 20,972 | | |
Transfer agent fees | |
Class A | | | 17,412 | | |
Class B | | | 300 | | |
Class C | | | 14,331 | | |
Class R4(a) | | | 2 | | |
Class T | | | 26,927 | | |
Class Z | | | 329,730 | | |
Administration fees | | | 141,313 | | |
Compensation of board members | | | 20,777 | | |
Custodian fees | | | 2,581 | | |
Printing and postage fees | | | 17,911 | | |
Registration fees | | | 36,939 | | |
Professional fees | | | 29,784 | | |
Chief compliance officer expenses | | | 130 | | |
Other | | | 9,920 | | |
Total expenses | | | 1,575,133 | | |
Fees waived or expenses reimbursed by Investment Manager and its affiliates | | | (338,425 | ) | |
Fees waived by Distributor — Class C | | | (26,076 | ) | |
Expense reductions | | | (60 | ) | |
Total net expenses | | | 1,210,572 | | |
Net investment income | | | 5,776,911 | | |
Realized and unrealized gain (loss) — net | |
Net realized gain (loss) on: | |
Investments | | | (511,379 | ) | |
Net realized loss | | | (511,379 | ) | |
Net change in unrealized appreciation (depreciation) on: | |
Investments | | | (7,683,067 | ) | |
Net change in unrealized appreciation (depreciation) | | | (7,683,067 | ) | |
Net realized and unrealized loss | | | (8,194,446 | ) | |
Net decrease in net assets from operations | | $ | (2,417,535 | ) | |
(a) For the period from March 19, 2013 (commencement of operations) to October 31, 2013.
The accompanying Notes to Financial Statements are an integral part of this statement.
Annual Report 2013
15
Columbia Connecticut Intermediate Municipal Bond Fund
Statement of Changes in Net Assets
| | | Year Ended
October 31,
2013 | | Year Ended
October 31,
2012 | |
Operations | |
Net investment income | | $ | 5,776,911 | | | $ | 6,479,838 | | |
Net realized gain (loss) | | | (511,379 | ) | | | 905,873 | | |
Net change in unrealized appreciation (depreciation) | | | (7,683,067 | ) | | | 6,420,027 | | |
Net increase (decrease) in net assets resulting from operations | | | (2,417,535 | ) | | | 13,805,738 | | |
Distributions to shareholders | |
Net investment income | |
Class A | | | (240,467 | ) | | | (229,355 | ) | |
Class B | | | (2,976 | ) | | | (4,861 | ) | |
Class C | | | (167,685 | ) | | | (171,721 | ) | |
Class R4(a) | | | (44 | ) | | | — | | |
Class T | | | (385,443 | ) | | | (438,059 | ) | |
Class Z | | | (4,973,046 | ) | | | (5,624,284 | ) | |
Net realized gains | |
Class A | | | (36,990 | ) | | | (5,890 | ) | |
Class B | | | (807 | ) | | | (198 | ) | |
Class C | | | (30,336 | ) | | | (5,430 | ) | |
Class T | | | (59,534 | ) | | | (11,410 | ) | |
Class Z | | | (746,436 | ) | | | (138,191 | ) | |
Total distributions to shareholders | | | (6,643,764 | ) | | | (6,629,399 | ) | |
Increase (decrease) in net assets from capital stock activity | | | (23,061,437 | ) | | | (7,140,775 | ) | |
Total increase (decrease) in net assets | | | (32,122,736 | ) | | | 35,564 | | |
Net assets at beginning of year | | | 214,090,872 | | | | 214,055,308 | | |
Net assets at end of year | | $ | 181,968,136 | | | $ | 214,090,872 | | |
Undistributed net investment income | | $ | 141,748 | | | $ | 159,453 | | |
(a) Class R4 shares are for the period from March 19, 2013 (commencement of operations) to October 31, 2013.
The accompanying Notes to Financial Statements are an integral part of this statement.
Annual Report 2013
16
Columbia Connecticut Intermediate Municipal Bond Fund
Statement of Changes in Net Assets (continued)
| | | Year ended October 31, 2013(a) | | Year ended October 31, 2012 | |
| | | Shares | | Dollars ($) | | Shares | | Dollars ($) | |
Capital stock activity | |
Class A shares | |
Subscriptions(b) | | | 271,318 | | | | 3,047,855 | | | | 228,505 | | | | 2,573,955 | | |
Distributions reinvested | | | 20,678 | | | | 229,031 | | | | 16,061 | | | | 180,719 | | |
Redemptions | | | (249,512 | ) | | | (2,763,143 | ) | | | (286,767 | ) | | | (3,201,169 | ) | |
Net increase (decrease) | | | 42,484 | | | | 513,743 | | | | (42,201 | ) | | | (446,495 | ) | |
Class B shares | |
Subscriptions | | | 87 | | | | 974 | | | | 146 | | | | 1,642 | | |
Distributions reinvested | | | 242 | | | | 2,684 | | | | 292 | | | | 3,279 | | |
Redemptions(b) | | | (4,580 | ) | | | (51,593 | ) | | | (7,204 | ) | | | (81,242 | ) | |
Net decrease | | | (4,251 | ) | | | (47,935 | ) | | | (6,766 | ) | | | (76,321 | ) | |
Class C shares | |
Subscriptions | | | 161,593 | | | | 1,783,135 | | | | 125,172 | | | | 1,404,628 | | |
Distributions reinvested | | | 11,462 | | | | 127,275 | | | | 9,899 | | | | 111,347 | | |
Redemptions | | | (193,430 | ) | | | (2,125,797 | ) | | | (125,712 | ) | | | (1,409,142 | ) | |
Net increase (decrease) | | | (20,375 | ) | | | (215,387 | ) | | | 9,359 | | | | 106,833 | | |
Class R4 shares | |
Subscriptions | | | 223 | | | | 2,500 | | | | — | | | | — | | |
Distributions reinvested | | | 1 | | | | 6 | | | | — | | | | — | | |
Net increase | | | 224 | | | | 2,506 | | | | — | | | | — | | |
Class T shares | |
Subscriptions | | | 8,291 | | | | 91,194 | | | | 4,949 | | | | 55,653 | | |
Distributions reinvested | | | 22,804 | | | | 253,463 | | | | 22,302 | | | | 250,774 | | |
Redemptions | | | (121,242 | ) | | | (1,347,078 | ) | | | (90,480 | ) | | | (1,017,917 | ) | |
Net decrease | | | (90,147 | ) | | | (1,002,421 | ) | | | (63,229 | ) | | | (711,490 | ) | |
Class Z shares | |
Subscriptions | | | 1,263,206 | | | | 14,097,975 | | | | 1,836,040 | | | | 20,639,272 | | |
Distributions reinvested | | | 26,613 | | | | 295,542 | | | | 19,839 | | | | 223,272 | | |
Redemptions | | | (3,334,224 | ) | | | (36,705,460 | ) | | | (2,386,699 | ) | | | (26,875,846 | ) | |
Net decrease | | | (2,044,405 | ) | | | (22,311,943 | ) | | | (530,820 | ) | | | (6,013,302 | ) | |
Total net decrease | | | (2,116,470 | ) | | | (23,061,437 | ) | | | (633,657 | ) | | | (7,140,775 | ) | |
(a) Class R4 shares are for the period from March 19, 2013 (commencement of operations) to October 31, 2013.
(b) Includes conversions of Class B shares to Class A shares, if any.
The accompanying Notes to Financial Statements are an integral part of this statement.
Annual Report 2013
17
Columbia Connecticut Intermediate Municipal Bond Fund
The following tables are intended to help you understand the Fund's financial performance. Certain information reflects financial results for a single share of a class held for the periods shown. Per share net investment income (loss) amounts are calculated based on average shares outstanding during the period. Total return assumes reinvestment of all dividends and distributions, if any. Total return does not reflect payment of sales charges, if any, and is not annualized for periods of less than one year.
| | | Year Ended October 31, 2013 | |
Class A | | 2013 | | 2012 | | 2011 | | 2010 | | 2009 | |
Per share data | |
Net asset value, beginning of period | | $ | 11.34 | | | $ | 10.97 | | | $ | 11.00 | | | $ | 10.69 | | | $ | 10.06 | | |
Income from investment operations: | |
Net investment income | | | 0.29 | | | | 0.31 | | | | 0.33 | | | | 0.33 | | | | 0.35 | | |
Net realized and unrealized gain (loss) | | | (0.44 | ) | | | 0.38 | | | | (0.03 | ) | | | 0.31 | | | | 0.63 | | |
Total from investment operations | | | (0.15 | ) | | | 0.69 | | | | 0.30 | | | | 0.64 | | | | 0.98 | | |
Less distributions to shareholders: | |
Net investment income | | | (0.29 | ) | | | (0.31 | ) | | | (0.33 | ) | | | (0.33 | ) | | | (0.35 | ) | |
Net realized gains | | | (0.05 | ) | | | (0.01 | ) | | | — | | | | — | | | | — | | |
Total distributions to shareholders | | | (0.34 | ) | | | (0.32 | ) | | | (0.33 | ) | | | (0.33 | ) | | | (0.35 | ) | |
Net asset value, end of period | | $ | 10.85 | | | $ | 11.34 | | | $ | 10.97 | | | $ | 11.00 | | | $ | 10.69 | | |
Total return | | | (1.34 | %) | | | 6.36 | % | | | 2.83 | % | | | 6.10 | % | | | 9.87 | % | |
Ratios to average net assets(a) | |
Total gross expenses | | | 0.97 | % | | | 1.00 | % | | | 1.03 | % | | | 0.94 | % | | | 0.94 | % | |
Total net expenses(b) | | | 0.80 | %(c) | | | 0.79 | %(c) | | | 0.79 | %(c) | | | 0.80 | %(c) | | | 0.78 | %(c) | |
Net investment income | | | 2.67 | % | | | 2.79 | % | | | 3.09 | % | | | 3.08 | % | | | 3.35 | % | |
Supplemental data | |
Net assets, end of period (in thousands) | | $ | 9,016 | | | $ | 8,937 | | | $ | 9,108 | | | $ | 11,458 | | | $ | 10,863 | | |
Portfolio turnover | | | 9 | % | | | 19 | % | | | 6 | % | | | 10 | % | | | 12 | % | |
Notes to Financial Highlights
(a) In addition to the fees and expenses which the Fund bears directly, the Fund indirectly bears a pro rata share of the fees and expenses of the acquired funds in which it invests. Such indirect expenses are not included in the reported expense ratios.
(b) Total net expenses include the impact of certain waivers/reimbursements made by the Investment Manager and certain of its affiliates, if applicable.
(c) The benefits derived from expense reductions had an impact of less than 0.01%.
The accompanying Notes to Financial Statements are an integral part of this statement.
Annual Report 2013
18
Columbia Connecticut Intermediate Municipal Bond Fund
Financial Highlights (continued)
| | | Year Ended October 31, 2013 | |
Class B | | 2013 | | 2012 | | 2011 | | 2010 | | 2009 | |
Per share data | |
Net asset value, beginning of period | | $ | 11.34 | | | $ | 10.97 | | | $ | 11.00 | | | $ | 10.69 | | | $ | 10.06 | | |
Income from investment operations: | |
Net investment income | | | 0.21 | | | | 0.23 | | | | 0.25 | | | | 0.25 | | | | 0.28 | | |
Net realized and unrealized gain (loss) | | | (0.44 | ) | | | 0.38 | | | | (0.03 | ) | | | 0.31 | | | | 0.62 | | |
Total from investment operations | | | (0.23 | ) | | | 0.61 | | | | 0.22 | | | | 0.56 | | | | 0.90 | | |
Less distributions to shareholders: | |
Net investment income | | | (0.21 | ) | | | (0.23 | ) | | | (0.25 | ) | | | (0.25 | ) | | | (0.27 | ) | |
Net realized gains | | | (0.05 | ) | | | (0.01 | ) | | | — | | | | — | | | | — | | |
Total distributions to shareholders | | | (0.26 | ) | | | (0.24 | ) | | | (0.25 | ) | | | (0.25 | ) | | | (0.27 | ) | |
Net asset value, end of period | | $ | 10.85 | | | $ | 11.34 | | | $ | 10.97 | | | $ | 11.00 | | | $ | 10.69 | | |
Total return | | | (2.08 | %) | | | 5.56 | % | | | 2.05 | % | | | 5.31 | % | | | 9.05 | % | |
Ratios to average net assets(a) | |
Total gross expenses | | | 1.72 | % | | | 1.84 | % | | | 1.83 | % | | | 1.69 | % | | | 1.69 | % | |
Total net expenses(b) | | | 1.55 | %(c) | | | 1.54 | %(c) | | | 1.55 | %(c) | | | 1.55 | %(c) | | | 1.53 | %(c) | |
Net investment income | | | 1.91 | % | | | 2.06 | % | | | 2.35 | % | | | 2.34 | % | | | 2.62 | % | |
Supplemental data | |
Net assets, end of period (in thousands) | | $ | 143 | | | $ | 197 | | | $ | 265 | | | $ | 1,467 | | | $ | 1,995 | | |
Portfolio turnover | | | 9 | % | | | 19 | % | | | 6 | % | | | 10 | % | | | 12 | % | |
Notes to Financial Highlights
(a) In addition to the fees and expenses which the Fund bears directly, the Fund indirectly bears a pro rata share of the fees and expenses of the acquired funds in which it invests. Such indirect expenses are not included in the reported expense ratios.
(b) Total net expenses include the impact of certain waivers/reimbursements made by the Investment Manager and certain of its affiliates, if applicable.
(c) The benefits derived from expense reductions had an impact of less than 0.01%.
The accompanying Notes to Financial Statements are an integral part of this statement.
Annual Report 2013
19
Columbia Connecticut Intermediate Municipal Bond Fund
Financial Highlights (continued)
| | | Year Ended October 31, 2013 | |
Class C | | 2013 | | 2012 | | 2011 | | 2010 | | 2009 | |
Per share data | |
Net asset value, beginning of period | | $ | 11.34 | | | $ | 10.97 | | | $ | 11.00 | | | $ | 10.69 | | | $ | 10.06 | | |
Income from investment operations: | |
Net investment income | | | 0.25 | | | | 0.27 | | | | 0.29 | | | | 0.29 | | | | 0.31 | | |
Net realized and unrealized gain (loss) | | | (0.44 | ) | | | 0.38 | | | | (0.03 | ) | | | 0.31 | | | | 0.63 | | |
Total from investment operations | | | (0.19 | ) | | | 0.65 | | | | 0.26 | | | | 0.60 | | | | 0.94 | | |
Less distributions to shareholders: | |
Net investment income | | | (0.25 | ) | | | (0.27 | ) | | | (0.29 | ) | | | (0.29 | ) | | | (0.31 | ) | |
Net realized gains | | | (0.05 | ) | | | (0.01 | ) | | | — | | | | — | | | | — | | |
Total distributions to shareholders | | | (0.30 | ) | | | (0.28 | ) | | | (0.29 | ) | | | (0.29 | ) | | | (0.31 | ) | |
Net asset value, end of period | | $ | 10.85 | | | $ | 11.34 | | | $ | 10.97 | | | $ | 11.00 | | | $ | 10.69 | | |
Total return | | | (1.74 | %) | | | 5.94 | % | | | 2.41 | % | | | 5.68 | % | | | 9.43 | % | |
Ratios to average net assets(a) | |
Total gross expenses | | | 1.72 | % | | | 1.74 | % | | | 1.79 | % | | | 1.69 | % | | | 1.69 | % | |
Total net expenses(b) | | | 1.20 | %(c) | | | 1.19 | %(c) | | | 1.19 | %(c) | | | 1.20 | %(c) | | | 1.18 | %(c) | |
Net investment income | | | 2.26 | % | | | 2.39 | % | | | 2.68 | % | | | 2.68 | % | | | 2.94 | % | |
Supplemental data | |
Net assets, end of period (in thousands) | | $ | 6,977 | | | $ | 7,520 | | | $ | 7,172 | | | $ | 7,897 | | | $ | 8,047 | | |
Portfolio turnover | | | 9 | % | | | 19 | % | | | 6 | % | | | 10 | % | | | 12 | % | |
Notes to Financial Highlights
(a) In addition to the fees and expenses which the Fund bears directly, the Fund indirectly bears a pro rata share of the fees and expenses of the acquired funds in which it invests. Such indirect expenses are not included in the reported expense ratios.
(b) Total net expenses include the impact of certain waivers/reimbursements made by the Investment Manager and certain of its affiliates, if applicable.
(c) The benefits derived from expense reductions had an impact of less than 0.01%.
The accompanying Notes to Financial Statements are an integral part of this statement.
Annual Report 2013
20
Columbia Connecticut Intermediate Municipal Bond Fund
Financial Highlights (continued)
Class R4 | | Year Ended
October 31, 2013
2013(a) | |
Per share data | |
Net asset value, beginning of period | | $ | 11.19 | | |
Income from investment operations: | |
Net investment income | | | 0.20 | | |
Net realized and unrealized loss | | | (0.35 | ) | |
Total from investment operations | | | (0.15 | ) | |
Less distributions to shareholders: | |
Net investment income | | | (0.20 | ) | |
Total distributions to shareholders | | | (0.20 | ) | |
Net asset value, end of period | | $ | 10.84 | | |
Total return | | | (1.36 | %) | |
Ratios to average net assets(b) | |
Total gross expenses | | | 0.62 | %(c) | |
Total net expenses(d) | | | 0.56 | %(c)(e) | |
Net investment income | | | 2.92 | %(c) | |
Supplemental data | |
Net assets, end of period (in thousands) | | $ | 2 | | |
Portfolio turnover | | | 9 | % | |
Notes to Financial Highlights
(a) For the period from March 19, 2013 (commencement of operations) to October 31, 2013.
(b) In addition to the fees and expenses which the Fund bears directly, the Fund indirectly bears a pro rata share of the fees and expenses of the acquired funds in which it invests. Such indirect expenses are not included in the reported expense ratios.
(c) Annualized.
(d) Total net expenses include the impact of certain waivers/reimbursements made by the Investment Manager and certain of its affiliates, if applicable.
(e) The benefits derived from expense reductions had an impact of less than 0.01%.
The accompanying Notes to Financial Statements are an integral part of this statement.
Annual Report 2013
21
Columbia Connecticut Intermediate Municipal Bond Fund
Financial Highlights (continued)
| | | Year Ended October 31, 2013 | |
Class T | | 2013 | | 2012 | | 2011 | | 2010 | | 2009 | |
Per share data | |
Net asset value, beginning of period | | $ | 11.34 | | | $ | 10.97 | | | $ | 11.00 | | | $ | 10.69 | | | $ | 10.06 | | |
Income from investment operations: | |
Net investment income | | | 0.31 | | | | 0.32 | | | | 0.34 | | | | 0.35 | | | | 0.36 | | |
Net realized and unrealized gain (loss) | | | (0.45 | ) | | | 0.38 | | | | (0.03 | ) | | | 0.30 | | | | 0.63 | | |
Total from investment operations | | | (0.14 | ) | | | 0.70 | | | | 0.31 | | | | 0.65 | | | | 0.99 | | |
Less distributions to shareholders: | |
Net investment income | | | (0.30 | ) | | | (0.32 | ) | | | (0.34 | ) | | | (0.34 | ) | | | (0.36 | ) | |
Net realized gains | | | (0.05 | ) | | | (0.01 | ) | | | — | | | | — | | | | — | | |
Total distributions to shareholders | | | (0.35 | ) | | | (0.33 | ) | | | (0.34 | ) | | | (0.34 | ) | | | (0.36 | ) | |
Net asset value, end of period | | $ | 10.85 | | | $ | 11.34 | | | $ | 10.97 | | | $ | 11.00 | | | $ | 10.69 | | |
Total return | | | (1.25 | %) | | | 6.47 | % | | | 2.93 | % | | | 6.21 | % | | | 9.98 | % | |
Ratios to average net assets(a) | |
Total gross expenses | | | 0.87 | % | | | 0.89 | % | | | 0.94 | % | | | 0.84 | % | | | 0.84 | % | |
Total net expenses(b) | | | 0.70 | %(c) | | | 0.69 | %(c) | | | 0.69 | %(c) | | | 0.70 | %(c) | | | 0.68 | %(c) | |
Net investment income | | | 2.76 | % | | | 2.89 | % | | | 3.18 | % | | | 3.18 | % | | | 3.46 | % | |
Supplemental data | |
Net assets, end of period (in thousands) | | $ | 13,287 | | | $ | 14,903 | | | $ | 15,110 | | | $ | 16,603 | | | $ | 16,889 | | |
Portfolio turnover | | | 9 | % | | | 19 | % | | | 6 | % | | | 10 | % | | | 12 | % | |
Notes to Financial Highlights
(a) In addition to the fees and expenses which the Fund bears directly, the Fund indirectly bears a pro rata share of the fees and expenses of the acquired funds in which it invests. Such indirect expenses are not included in the reported expense ratios.
(b) Total net expenses include the impact of certain waivers/reimbursements made by the Investment Manager and certain of its affiliates, if applicable.
(c) The benefits derived from expense reductions had an impact of less than 0.01%.
The accompanying Notes to Financial Statements are an integral part of this statement.
Annual Report 2013
22
Columbia Connecticut Intermediate Municipal Bond Fund
Financial Highlights (continued)
| | | Year Ended October 31, 2013 | |
Class Z | | 2013 | | 2012 | | 2011 | | 2010 | | 2009 | |
Per share data | |
Net asset value, beginning of period | | $ | 11.34 | | | $ | 10.97 | | | $ | 11.00 | | | $ | 10.69 | | | $ | 10.06 | | |
Income from investment operations: | |
Net investment income | | | 0.32 | | | | 0.34 | | | | 0.36 | | | | 0.36 | | | | 0.38 | | |
Net realized and unrealized gain (loss) | | | (0.44 | ) | | | 0.38 | | | | (0.03 | ) | | | 0.31 | | | | 0.63 | | |
Total from investment operations | | | (0.12 | ) | | | 0.72 | | | | 0.33 | | | | 0.67 | | | | 1.01 | | |
Less distributions to shareholders: | |
Net investment income | | | (0.32 | ) | | | (0.34 | ) | | | (0.36 | ) | | | (0.36 | ) | | | (0.38 | ) | |
Net realized gains | | | (0.05 | ) | | | (0.01 | ) | | | — | | | | — | | | | — | | |
Total distributions to shareholders | | | (0.37 | ) | | | (0.35 | ) | | | (0.36 | ) | | | (0.36 | ) | | | (0.38 | ) | |
Net asset value, end of period | | $ | 10.85 | | | $ | 11.34 | | | $ | 10.97 | | | $ | 11.00 | | | $ | 10.69 | | |
Total return | | | (1.10 | %) | | | 6.63 | % | | | 3.08 | % | | | 6.37 | % | | | 10.14 | % | |
Ratios to average net assets(a) | |
Total gross expenses | | | 0.72 | % | | | 0.74 | % | | | 0.79 | % | | | 0.69 | % | | | 0.69 | % | |
Total net expenses(b) | | | 0.55 | %(c) | | | 0.54 | %(c) | | | 0.54 | %(c) | | | 0.55 | %(c) | | | 0.53 | %(c) | |
Net investment income | | | 2.91 | % | | | 3.04 | % | | | 3.33 | % | | | 3.33 | % | | | 3.60 | % | |
Supplemental data | |
Net assets, end of period (in thousands) | | $ | 152,543 | | | $ | 182,533 | | | $ | 182,400 | | | $ | 209,384 | | | $ | 200,830 | | |
Portfolio turnover | | | 9 | % | | | 19 | % | | | 6 | % | | | 10 | % | | | 12 | % | |
Notes to Financial Highlights
(a) In addition to the fees and expenses which the Fund bears directly, the Fund indirectly bears a pro rata share of the fees and expenses of the acquired funds in which it invests. Such indirect expenses are not included in the reported expense ratios.
(b) Total net expenses include the impact of certain waivers/reimbursements made by the Investment Manager and certain of its affiliates, if applicable.
(c) The benefits derived from expense reductions had an impact of less than 0.01%.
The accompanying Notes to Financial Statements are an integral part of this statement.
Annual Report 2013
23
Columbia Connecticut Intermediate Municipal Bond Fund
Notes to Financial Statements
October 31, 2013
Note 1. Organization
Columbia Connecticut Intermediate Municipal Bond Fund (the Fund), a series of Columbia Funds Series Trust I (the Trust), is a non-diversified fund. The Trust is registered under the Investment Company Act of 1940, as amended (the 1940 Act), as an open-end management investment company organized as a Massachusetts business trust.
Fund Shares
The Trust may issue an unlimited number of shares (without par value). The Fund offers Class A, Class B, Class C, Class R4, Class T and Class Z shares. Although all share classes generally have identical voting, dividend and liquidation rights, each share class votes separately when required by law. Different share classes pay different distribution amounts to the extent the expenses of such share classes differ, and distributions in liquidation will be proportional to the net asset value of each share class. Each share class has its own expense structure and sales charges, as applicable.
Class A shares are subject to a maximum front-end sales charge of 3.25% based on the initial investment amount. Class A shares purchased without an initial sales charge in accounts aggregating $1 million to $50 million at the time of purchase are subject to a contingent deferred sales charge (CDSC) if the shares are sold within 18 months of purchase, charged as follows: 1.00% CDSC if redeemed within 12 months of purchase, and 0.50% CDSC if redeemed more than 12, but less than 18, months after purchase.
Class B shares may be subject to a maximum CDSC of 3.00% based upon the holding period after purchase. Class B shares will generally convert to Class A shares eight years after purchase. The Fund no longer accepts investments by new or existing investors in the Fund's Class B shares, except in connection with the reinvestment of any dividend and/or capital gain distributions in Class B shares of the Fund and exchanges by existing Class B shareholders of certain other funds within the Columbia Family of Funds.
Class C shares are subject to a 1.00% CDSC on shares redeemed within one year of purchase.
Class R4 shares are not subject to sales charges and are only available to investors purchasing through authorized investment professionals. Class R4 shares commenced operations on March 19, 2013.
Class T shares are subject to a maximum front-end sales charge of 4.75% based on the investment amount. Class T shares purchased without an initial sales charge in accounts aggregating $1 million to $50 million at the time of purchase
are subject to a CDSC if the shares are sold within 18 months of purchase, charged as follows: 1.00% CDSC if redeemed within 12 months of purchase, and 0.50% CDSC if redeemed more than 12, but less than 18, months after purchase. Class T shares are available only to investors who received (and who have continuously held) Class T shares in connection with the merger of certain Galaxy Funds into various Columbia Funds (formerly named Liberty Funds).
Class Z shares are not subject to sales charges and are available only to certain eligible investors, which are subject to different investment minimums.
Note 2. Summary of Significant Accounting Policies
Use of Estimates
The preparation of financial statements in accordance with U.S. generally accepted accounting principles (GAAP) requires management to make certain estimates and assumptions that affect the reported amounts of assets and liabilities, the disclosure of contingent assets and liabilities at the date of the financial statements and the reported amounts of revenue and expenses during the reporting period. Actual results could differ from those estimates.
The following is a summary of significant accounting policies consistently followed by the Fund in the preparation of its financial statements.
Security Valuation
Debt securities generally are valued by pricing services approved by the Board of Trustees (the Board) based upon market transactions for normal, institutional-size trading units of similar securities. The services may use various pricing techniques which take into account appropriate factors such as yield, quality, coupon rate, maturity, type of issue, trading characteristics and other data, as well as broker quotes. Debt securities for which quotations are readily available may also be valued based upon an over-the-counter or exchange bid quotation.
Investments in open-end investment companies, including money market funds, are valued at net asset value.
Investments for which market quotations are not readily available, or that have quotations which management believes are not reliable, are valued at fair value as determined in good faith under consistently applied procedures established by and under the general supervision of the Board. If a security or class of securities (such as foreign securities) is valued at fair value, such value is likely to be different from the last quoted market price for the security.
Annual Report 2013
24
Columbia Connecticut Intermediate Municipal Bond Fund
Notes to Financial Statements (continued)
October 31, 2013
The determination of fair value often requires significant judgment. To determine fair value, management may use assumptions including but not limited to future cash flows and estimated risk premiums. Multiple inputs from various sources may be used to determine fair value.
Security Transactions
Security transactions are accounted for on the trade date. Cost is determined and gains (losses) are based upon the specific identification method for both financial statement and federal income tax purposes.
Income Recognition
Interest income is recorded on an accrual basis. Market premiums and discounts, including original issue discounts, are amortized and accreted, respectively, over the expected life of the security on all debt securities, unless otherwise noted.
Dividend income is recorded on the ex-dividend date.
Expenses
General expenses of the Trust are allocated to the Fund and other funds of the Trust based upon relative net assets or other expense allocation methodologies determined by the nature of the expense. Expenses directly attributable to the Fund are charged to the Fund. Expenses directly attributable to a specific class of shares are charged to that share class.
Determination of Class Net Asset Value
All income, expenses (other than class-specific expenses, which are charged to that share class, as shown in the Statement of Operations) and realized and unrealized gains (losses) are allocated to each class of the Fund on a daily basis, based on the relative net assets of each class, for purposes of determining the net asset value of each class.
Federal Income Tax Status
The Fund intends to qualify each year as a regulated investment company under Subchapter M of the Internal Revenue Code, as amended, and will distribute substantially all of its tax exempt and taxable income (including net short-term capital gains), if any, for its tax year, and as such will not be subject to federal income taxes. In addition, the Fund intends to distribute in each calendar year substantially all of its net investment income, capital gains and certain other amounts, if any, such that the Fund should not be subject to federal excise tax. Therefore, no federal income or excise tax provision is recorded.
Distributions to Shareholders
Distributions from net investment income, if any, are declared daily and paid monthly. Net realized capital gains, if any, are
distributed at least annually. Income distributions and capital gain distributions are determined in accordance with federal income tax regulations, which may differ from GAAP.
Guarantees and Indemnifications
Under the Trust's organizational documents and, in some cases, by contract, its officers and trustees are indemnified against certain liabilities arising out of the performance of their duties to the Trust or its funds. In addition, certain of the Fund's contracts with its service providers contain general indemnification clauses. The Fund's maximum exposure under these arrangements is unknown since the amount of any future claims that may be made against the Fund cannot be determined, and the Fund has no historical basis for predicting the likelihood of any such claims.
Recent Accounting Pronouncement
Disclosures about Offsetting Assets and Liabilities
In December 2011, the Financial Accounting Standards Board (FASB) issued Accounting Standards Update (ASU) No. 2011-11, Disclosures about Offsetting Assets and Liabilities and in January 2013, ASU No. 2013-1, Clarifying the Scope of Disclosures about Offsetting Assets and Liabilities (collectively, the ASUs). Specifically, the ASUs require an entity to disclose both gross and net information for derivatives and other financial instruments that are subject to a master netting arrangement or similar agreement. The ASUs require disclosure of collateral received in connection with the master netting agreements or similar agreements. The disclosure requirements are effective for interim and annual periods beginning on or after January 1, 2013. At this time, management is evaluating the implications of this guidance and the impact it will have on the financial statement amounts and footnote disclosures, if any.
Note 3. Fees and Compensation Paid to Affiliates
Investment Management Fees
Under an Investment Management Services Agreement, Columbia Management Investment Advisers, LLC (the Investment Manager), a wholly-owned subsidiary of Ameriprise Financial, Inc. (Ameriprise Financial), determines which securities will be purchased, held or sold. The investment management fee is an annual fee that is equal to a percentage of the Fund's average daily net assets that declines from 0.40% to 0.27% as the Fund's net assets increase. The effective investment management fee rate for the year ended October 31, 2013 was 0.40% of the Fund's average daily net assets.
Annual Report 2013
25
Columbia Connecticut Intermediate Municipal Bond Fund
Notes to Financial Statements (continued)
October 31, 2013
Administration Fees
Under an Administrative Services Agreement, the Investment Manager also serves as the Fund Administrator. The Fund pays the Fund Administrator an annual fee for administration and accounting services equal to a percentage of the Fund's average daily net assets that declines from 0.07% to 0.04% as the Fund's net assets increase. The effective administration fee rate for the year ended October 31, 2013 was 0.07% of the Fund's average daily net assets.
Compensation of Board Members
Board members are compensated for their services to the Fund as disclosed in the Statement of Operations. The Trust's eligible Trustees may participate in a Deferred Compensation Plan (the Plan) which may be terminated at any time. Obligations of the Plan will be paid solely out of the Fund's assets.
Compensation of Chief Compliance Officer
The Board has appointed a Chief Compliance Officer to the Fund in accordance with federal securities regulations. The Fund pays its pro-rata share of the expenses associated with the Chief Compliance Officer. The Fund's expenses for the Chief Compliance Officer will not exceed $15,000 per year.
Transfer Agent Fees
Under a Transfer and Dividend Disbursing Agent Agreement, Columbia Management Investment Services Corp. (the Transfer Agent), an affiliate of the Investment Manager and a wholly-owned subsidiary of Ameriprise Financial, is responsible for providing transfer agency services to the Fund. The Transfer Agent has contracted with Boston Financial Data Services (BFDS) to serve as sub-transfer agent.
The Transfer Agent receives monthly account-based service fees based on the number of open accounts and also receives sub-transfer agency fees based on a percentage of the average aggregate value of the Fund's shares maintained in omnibus accounts (other than omnibus accounts for which American Enterprise Investment Services Inc. is the broker of record or accounts where the beneficial shareholder is a customer of Ameriprise Financial Services, Inc., which are paid a per account fee). The Transfer Agent pays the fees of BFDS for services as sub-transfer agent and is not entitled to reimbursement for such fees from the Fund (with the exception of out-of-pocket fees).
The Transfer Agent also receives compensation from fees for various shareholder services and reimbursements for certain out-of-pocket fees.
For the year ended October 31, 2013, the Fund's effective transfer agent fee rates as a percentage of average daily net assets of each class were as follows:
Class A | | | 0.19 | % | |
Class B | | | 0.19 | | |
Class C | | | 0.19 | | |
Class R4 | | | 0.14 | * | |
Class T | | | 0.19 | | |
Class Z | | | 0.19 | | |
*Annualized.
An annual minimum account balance fee of $20 may apply to certain accounts with a value below the applicable share class' initial minimum investment requirements to reduce the impact of small accounts on transfer agent fees. These minimum account balance fees are recorded as part of expense reductions in the Statement of Operations. For the year ended October 31, 2013, these minimum account balance fees reduced total expenses by $60.
Distribution and Service Fees
The Fund has an agreement with Columbia Management Investment Distributors, Inc. (the Distributor), an affiliate of the Investment Manager and a wholly-owned subsidiary of Ameriprise Financial, for distribution and shareholder services. Pursuant to Rule 12b-1 under the 1940 Act, the Board has approved, and the Fund has adopted, distribution and shareholder service plans (the Plans) which set the distribution and service fees for the Fund. These fees are calculated daily and are intended to compensate the Distributor and/or eligible selling and/or servicing agents for selling shares of the Fund and providing services to investors.
Under the Plans, the Fund pays a monthly service fee to the Distributor at the maximum annual rate of 0.25% of the average daily net assets attributable to Class A, Class B and Class C shares of the Fund. Also under the Plans, the Fund pays a monthly distribution fee to the Distributor at the maximum annual rate of 0.75% of the average daily net assets attributable to Class B and Class C shares only.
The Distributor has voluntarily agreed to waive a portion of the distribution fee for Class C shares so that the distribution fee does not exceed 0.40% annually of the average daily net assets attributable to Class C shares. This arrangement may be modified or terminated by the Distributor at any time.
Shareholder Services Fees
The Fund has adopted a shareholder services plan that permits it to pay for certain services provided to Class T shareholders by their selling and/or servicing agents. The Fund may pay
Annual Report 2013
26
Columbia Connecticut Intermediate Municipal Bond Fund
Notes to Financial Statements (continued)
October 31, 2013
shareholder servicing fees up to an aggregate annual rate of 0.40% of the Fund's average daily net assets attributable to Class T shares (comprised of up to 0.20% for shareholder liaison services and up to 0.20% for administrative support services). These fees are currently limited to an aggregate annual rate of not more than 0.15% of the Fund's average daily net assets attributable to Class T shares. In addition, the servicing fee for Class T shares will be waived by selling and/or servicing agents to the extent necessary to prevent the net investment income for the Class T shares from falling below 0.00% on a daily basis. The effective shareholder services fee rate for the year ended October 31, 2013 was 0.15% of the Fund's average daily net assets attributable to Class T shares.
Sales Charges
Sales charges, including front-end charges and CDSCs, received by the Distributor for distributing Fund shares were $12,459 for Class A, $1,078 for Class C and $1,047 for Class T shares for the year ended October 31, 2013.
Expenses Waived/Reimbursed by the Investment Manager and its Affiliates
The Investment Manager and certain of its affiliates have contractually agreed to waive fees and/or reimburse expenses (excluding certain fees and expenses described below) for the periods disclosed below, unless sooner terminated at the sole discretion of the Board, so that the Fund's net operating expenses, after giving effect to fees waived/expenses reimbursed and any balance credits and/or overdraft charges from the Fund's custodian, do not exceed the following annual rates as a percentage of the class' average daily net assets:
| | | March 1, 2013
through
February 28, 2014 | | Prior to
March 1, 2013 | |
Class A | | | 0.81 | % | | | 0.79 | % | |
Class B | | | 1.56 | | | | 1.54 | | |
Class C | | | 1.56 | | | | 1.54 | | |
Class R4 | | | 0.56 | * | | | — | | |
Class T | | | 0.71 | | | | 0.69 | | |
Class Z | | | 0.56 | | | | 0.54 | | |
*Annual rate is contractual from March 19, 2013 (the commencement of operations of Class R4 shares) through February 28, 2014.
Under the agreement governing these fee waivers and/or expense reimbursement arrangements, the following fees and expenses are excluded from the waiver/reimbursement commitment, and therefore will be paid by the Fund, if applicable: taxes (including foreign transaction taxes), expenses associated with investments in affiliated and non-affiliated pooled investment vehicles (including mutual funds
and exchange traded funds), transaction costs and brokerage commissions, costs related to any securities lending program, dividend expenses associated with securities sold short, inverse floater program fees and expenses, transaction charges and interest on borrowed money, interest, extraordinary expenses and any other expenses the exclusion of which is specifically approved by the Board. This agreement may be modified or amended only with approval from all parties. Class C distribution fees waived by the Distributor, as discussed above, are in addition to the waiver/reimbursement commitment under the agreement.
Note 4. Federal Tax Information
The timing and character of income and capital gain distributions are determined in accordance with income tax regulations, which may differ from GAAP because of temporary or permanent book to tax differences.
At October 31, 2013, these differences are primarily due to differing treatment for capital loss carryforwards, principal and/or interest of fixed income securities, Trustees' deferred compensation and distribution reclassifications. To the extent these differences are permanent, reclassifications are made among the components of the Fund's net assets in the Statement of Assets and Liabilities. Temporary differences do not require reclassifications. In the Statement of Assets and Liabilities the following reclassifications were made:
Undistributed net investment income | | $ | (24,955 | ) | |
Accumulated net realized loss | | | 24,954 | | |
Paid-in capital | | | 1 | | |
Net investment income and net realized gains (losses), as disclosed in the Statement of Operations, and net assets were not affected by this reclassification.
The tax character of distributions paid during the years indicated was as follows:
Year Ended October 31, | | 2013 | | 2012 | |
Ordinary income | | $ | 26,528 | | | $ | 6,468,280 | | |
Long-term capital gains | | | 849,148 | | | | 161,119 | | |
Tax-exempt income | | | 5,768,088 | | | | — | | |
Total | | $ | 6,643,764 | | | $ | 6,629,399 | | |
Short-term capital gain distributions, if any, are considered ordinary income distributions for tax purposes.
At October 31, 2013, the components of distributable earnings on a tax basis were as follows:
Undistributed tax-exempt income | | $ | 616,988 | | |
Unrealized appreciation | | | 9,641,291 | | |
Annual Report 2013
27
Columbia Connecticut Intermediate Municipal Bond Fund
Notes to Financial Statements (continued)
October 31, 2013
At October 31, 2013, the cost of investments for federal income tax purposes was $170,636,071 and the aggregate gross unrealized appreciation and depreciation based on that cost was:
Unrealized appreciation | | $ | 10,256,977 | | |
Unrealized depreciation | | | (615,686 | ) | |
Net unrealized appreciation | | $ | 9,641,291 | | |
The following capital loss carryforward, determined at October 31, 2013, may be available to reduce taxable income arising from future net realized gains on investments, if any, to the extent permitted by the Internal Revenue Code:
Year of Expiration | | Amount ($) | |
Unlimited short-term | | | 520,214 | | |
Total | | | 520,214 | | |
Management of the Fund has concluded that there are no significant uncertain tax positions that would require recognition in the financial statements. However, management's conclusion may be subject to review and adjustment at a later date based on factors including, but not limited to, new tax laws, regulations, and administrative interpretations (including relevant court decisions). Generally, the Fund's federal tax returns for the prior three fiscal years remain subject to examination by the Internal Revenue Service.
Note 5. Portfolio Information
The cost of purchases and proceeds from sales of securities, excluding short-term obligations, aggregated to $17,488,013 and $37,315,756, respectively, for the year ended October 31, 2013.
Note 6. Shareholder Concentration
At October 31, 2013, one unaffiliated shareholder account owned 82.4% of the outstanding shares of the Fund. The Fund has no knowledge about whether any portion of those shares was owned beneficially by such account. Subscription and redemption activity by concentrated accounts may have a significant effect on the operations of the Fund
Note 7. Line of Credit
The Fund has entered into a revolving credit facility with a syndicate of banks led by JPMorgan Chase Bank N.A. (JPMorgan) whereby the Fund may borrow for the temporary funding of shareholder redemptions or for other temporary or emergency purposes. The credit facility agreement, as amended, which is a collective agreement between the Fund and certain other funds managed by the Investment Manager, severally and not jointly, permits collective borrowings up to
$500 million. Interest is charged to each participating fund based on its borrowings at a rate equal to the higher of (i) the overnight federal funds rate plus 1.00% or (ii) the one-month LIBOR rate plus 1.00%. Each borrowing under the credit facility matures no later than 60 days after the date of borrowing. The Fund also pays a commitment fee equal to its pro rata share of the amount of the credit facility at a rate of 0.08% per annum. The commitment fee is included in other expenses in the Statement of Operations.
Effective December 10, 2013, the Fund extended its revolving credit facility with JPMorgan. The credit facility agreement, as amended, continues to permit collective borrowings up to $500 million under the same terms and interest rates as described above. Effective December 10, 2013, the Fund pays a commitment fee equal to its pro rata share of the amount of the credit facility at a rate of 0.075% per annum.
The Fund had no borrowings during the year ended October 31, 2013.
Note 8. Significant Risks
Geographic Concentration Risk
Because state-specific tax-exempt funds invest primarily in the municipal securities issued by the state and political sub-divisions of the state, the Fund will be particularly affected by political and economic conditions and developments in the state in which it invests. The Fund may, therefore, have a greater risk than that of a municipal bond fund which is more geographically diversified. The value of the municipal securities owned by the Fund also may be adversely affected by future changes in federal or state income tax laws.
Non-Diversification Risk
A non-diversified fund is permitted to invest a greater percentage of its total assets in fewer issuers than a diversified fund. The Fund may, therefore, have a greater risk of loss from a few issuers than a similar fund that invests more broadly.
Note 9. Subsequent Events
Management has evaluated the events and transactions that have occurred through the date the financial statements were issued and noted no items requiring adjustment of the financial statements or additional disclosure.
Note 10. Information Regarding Pending and Settled Legal Proceedings
In December 2005, without admitting or denying the allegations, American Express Financial Corporation (AEFC, which is now known as Ameriprise Financial, Inc. (Ameriprise Financial)) entered into settlement agreements with the
Annual Report 2013
28
Columbia Connecticut Intermediate Municipal Bond Fund
Notes to Financial Statements (continued)
October 31, 2013
Securities and Exchange Commission (SEC) and Minnesota Department of Commerce (MDOC) related to market timing activities. As a result, AEFC was censured and ordered to cease and desist from committing or causing any violations of certain provisions of the Investment Advisers Act of 1940, the Investment Company Act of 1940, and various Minnesota laws. AEFC agreed to pay disgorgement of $10 million and civil money penalties of $7 million. AEFC also agreed to retain an independent distribution consultant to assist in developing a plan for distribution of all disgorgement and civil penalties ordered by the SEC in accordance with various undertakings detailed at www.sec.gov/litigation/admin/ia-2451.pdf. Ameriprise Financial and its affiliates have cooperated with the SEC and the MDOC in these legal proceedings, and have made regular reports to the funds' Boards of Trustees.
Ameriprise Financial and certain of its affiliates have historically been involved in a number of legal, arbitration and regulatory proceedings, including routine litigation, class actions, and governmental actions, concerning matters arising in connection with the conduct of their business activities. Ameriprise Financial believes that the Funds are not currently the subject of, and that neither Ameriprise Financial nor any of its affiliates are the subject of, any pending legal, arbitration or regulatory proceedings that are likely to have a material adverse effect on the Funds or the ability of Ameriprise Financial or its affiliates to perform under their contracts with the Funds. Ameriprise Financial is required to make 10-Q, 10-K and, as necessary, 8-K filings with the Securities and Exchange Commission on legal and regulatory matters that relate to Ameriprise Financial and its affiliates. Copies of these filings may be obtained by accessing the SEC website at www.sec.gov.
There can be no assurance that these matters, or the adverse publicity associated with them, will not result in increased fund redemptions, reduced sale of fund shares or other adverse consequences to the Funds. Further, although we believe proceedings are not likely to have a material adverse effect on the Funds or the ability of Ameriprise Financial or its affiliates to perform under their contracts with the Funds, these proceedings are subject to uncertainties and, as such, we are unable to estimate the possible loss or range of loss that may result. An adverse outcome in one or more of these proceedings could result in adverse judgments, settlements, fines, penalties or other relief that could have a material adverse effect on the consolidated financial condition or results of operations of Ameriprise Financial.
Annual Report 2013
29
Columbia Connecticut Intermediate Municipal Bond Fund
Report of Independent Registered Public Accounting Firm
To the Trustees of Columbia Funds Series Trust I and the Shareholders of
Columbia Connecticut Intermediate Municipal Bond Fund
In our opinion, the accompanying statement of assets and liabilities, including the portfolio of investments, and the related statements of operations and of changes in net assets and the financial highlights present fairly, in all material respects, the financial position of Columbia Connecticut Intermediate Municipal Bond Fund (the "Fund", a series of Columbia Funds Series Trust I) at October 31, 2013, and the results of its operations, the changes in its net assets and the financial highlights for each of the periods indicated, in conformity with accounting principles generally accepted in the United States of America. These financial statements and financial highlights (hereafter referred to as "financial statements") are the responsibility of the Fund's management; our responsibility is to express an opinion on these financial statements based on our audits. We conducted our audits of these financial statements in accordance with the standards of the Public Company Accounting Oversight Board (United States). Those standards require that we plan and perform the audit to obtain reasonable assurance about whether the financial statements are free of material misstatement. An audit includes examining, on a test basis, evidence supporting the amounts and disclosures in the financial statements, assessing the accounting principles used and significant estimates made by management, and evaluating the overall financial statement presentation. We believe that our audits, which included confirmation of securities at October 31, 2013 by correspondence with the custodian, brokers and transfer agent, provide a reasonable basis for our opinion expressed above.
PricewaterhouseCoopers LLP
Minneapolis, Minnesota
December 19, 2013
Annual Report 2013
30
Columbia Connecticut Intermediate Municipal Bond Fund
Federal Income Tax Information
(Unaudited)
The Fund hereby designates the following tax attributes for the fiscal year ended October 31, 2013. Shareholders will be notified in early 2014 of the amounts for use in preparing 2013 income tax returns.
Tax Designations
Capital Gain Dividend | | $ | 5,768,088 | | |
| Exempt-Interest Dividends | | | 99.54 | % | |
Capital Gain Dividend. The Fund designates as a capital gain dividend the amount reflected above, or if subsequently determined to be different, the net capital gain of such fiscal period. The Fund also designates as capital gain dividends, to the extent necessary to fully distribute such capital gains, earnings and profits distributed to shareholders on the redemption of shares.
Exempt-Interest Dividends. The percentage of net investment income dividends paid during the fiscal year that qualifies as exempt-interest dividends for federal income tax purposes.
Annual Report 2013
31
Columbia Connecticut Intermediate Municipal Bond Fund
The Trustees serve terms of indefinite duration. The names, addresses and birth years of the Trustees and Officers of the Funds in Columbia Funds Series Trust I, the year each was first elected or appointed to office, their principal business occupations during at least the last five years, the number of Funds overseen by each Trustee and other directorships they hold are shown below. Each officer listed below serves as an officer of each Fund in Columbia Funds Series Trust I.
Independent Trustees
Name, Address and Year of Birth,
Position with Funds, Year First
Elected or Appointed to Office | | Principal Occupation(s) During Past Five Years, Number of Funds in Columbia
Funds Complex Overseen by Trustee, Other Directorships Held | |
Rodman L. Drake (Born 1943)
c/o Columbia Management
Investment Advisers, LLC
225 Franklin Street
Boston, MA 02110
Trustee (since 1994) and
Chairman of the Board (since 2009) | | Independent consultant since 2010; Co-Founder of Baringo Capital LLC (private equity) from 1997 to 2008; Chairman (from 2003 to 2010) and CEO (from 2008 to 2010) of Crystal River Capital, Inc. (real estate investment trust); Oversees 52; Jackson Hewitt Tax Service Inc. (tax preparation services) from 2004 to 2011; Student Loan Corporation (student loan provider) from 2005 to 2010; Celgene Corporation (global biotechnology company); The Helios Funds and Brookfield Funds (closed-end funds); Chimerix, Inc. (biopharmaceutical company) since August 1, 2013; Crystal River Capital, Inc. from 2005 to 2010; Parsons Brinckerhoff from 1995 to 2008; and Apex Silver Mines Ltd. from 2007 to 2009 | |
Douglas A. Hacker (Born 1955)
c/o Columbia Management
Investment Advisers, LLC
225 Franklin Street
Boston, MA 02110
Trustee (since 1996) | | Independent business executive since May 2006; Executive Vice President — Strategy of United Airlines from December 2002 to May 2006; President of UAL Loyalty Services (airline marketing company) from September 2001 to December 2002; Executive Vice President and Chief Financial Officer of United Airlines from July 1999 to September 2001. Oversees 52; Nash Finch Company (food distributor); Aircastle Limited (aircraft leasing); and SeaCube Container Leasing Ltd. (container leasing) | |
Janet Langford Kelly (Born 1957)
c/o Columbia Management
Investment Advisers, LLC
225 Franklin Street
Boston, MA 02110
Trustee (since 1996) | | Senior Vice President, General Counsel and Corporate Secretary, ConocoPhillips (integrated energy company) since September 2007; Deputy General Counsel — Corporate Legal Services, ConocoPhillips from August 2006 to August 2007; Partner, Zelle, Hofmann, Voelbel, Mason & Gette LLP (law firm) from March 2005 to July 2006; Adjunct Professor of Law, Northwestern University from September 2004 to June 2006; Director, UAL Corporation (airline) from February 2006 to July 2006; Chief Administrative Officer and Senior Vice President, Kmart Holding Corporation (consumer goods) from September 2003 to March 2004. Oversees 52; None | |
Nancy T. Lukitsh (Born 1956)
c/o Columbia Management
Investment Advisers, LLC
225 Franklin Street
Boston, MA 02110
Trustee (since 2011) | | Senior Vice President, Partner and Director of Marketing, Wellington Management Company, LLP (investment adviser) from 1997 to 2010; Chair, Wellington Management Investment Portfolios (commingled non-U.S. investment pools) from 2007 to 2010; Director, Wellington Trust Company, NA and other Wellington affiliates from 1997 to 2010. Oversees 52; None | |
William E. Mayer (Born 1940)
c/o Columbia Management
Investment Advisers, LLC
225 Franklin Street
Boston, MA 02110
Trustee (since 1994) | | Partner, Park Avenue Equity Partners (private equity) since February 1999; Dean and Professor, College of Business and Management, University of Maryland from 1992 to 1996. Oversees 52; DynaVox Inc. (speech creation); Lee Enterprises (print media); WR Hambrecht + Co. (financial service provider) from 2000 to 2012; BlackRock Kelso Capital Corporation (investment company) | |
David M. Moffett (Born 1952)
c/o Columbia Management
Investment Advisers, LLC
225 Franklin Street
Boston, MA 02110
Trustee (since 2011) | | Retired. Chief Executive Officer, Federal Home Loan Mortgage Corporation, from 2008 to 2009; Senior Adviser, Global Financial Services Group, Carlyle Group, Inc., from 2007 to 2008; Vice Chairman and Chief Financial Officer, U.S. Bancorp, from 1993 to 2007. Oversees 52; CIT Group Inc. (commercial and consumer finance); eBay Inc. (online trading community); MBIA Inc. (financial service provider); E.W. Scripps Co. (print and television media), Building Materials Holding Corp. (building materials and construction services); Genworth Financial, Inc. (financial and insurance products and services); and University of Oklahoma Foundation | |
Charles R. Nelson (Born 1942)
c/o Columbia Management
Investment Advisers, LLC
225 Franklin Street
Boston, MA 02110
Trustee (since 1981) | | Retired. Professor Emeritus, University of Washington, since 2011; Professor of Economics, University of Washington from 1976 to 2011; Ford and Louisa Van Voorhis Professor of Political Economy, University of Washington from 1993 to 2011; Adjunct Professor of Statistics, University of Washington from 1980 to 2011; Associate Editor, Journal of Money, Credit and Banking from September 1993 to 2008; consultant on econometric and statistical matters. Oversees 52; None | |
John J. Neuhauser (Born 1943)
c/o Columbia Management
Investment Advisers, LLC
225 Franklin Street
Boston, MA 02110
Trustee (since 1984) | | President, Saint Michael's College, since August 2007; Director or Trustee of several non-profit organizations, including Fletcher Allen Health Care, Inc.; University Professor, Boston College from November 2005 to August 2007; Academic Vice President and Dean of Faculties, Boston College from August 1999 to October 2005. Oversees 52; Liberty All-Star Equity Fund and Liberty All-Star Growth Fund (closed-end funds) | |
Annual Report 2013
32
Columbia Connecticut Intermediate Municipal Bond Fund
Trustees and Officers (continued)
Independent Trustees (continued)
Name, Address and Year of Birth,
Position with Funds, Year First
Elected or Appointed to Office | | Principal Occupation(s) During Past Five Years, Number of Funds in Columbia
Funds Complex Overseen by Trustee, Other Directorships Held | |
Patrick J. Simpson (Born 1944)
c/o Columbia Management
Investment Advisers, LLC
225 Franklin Street
Boston, MA 02110
Trustee (since 2000) | | Partner, Perkins Coie LLP (law firm). Oversees 52; None | |
Anne-Lee Verville (Born 1945)
c/o Columbia Management
Investment Advisers, LLC
225 Franklin Street
Boston, MA 02110
Trustee (since 1998) | | Retired. General Manager — Global Education Industry from 1994 to 1997, President — Application Systems Division from 1991 to 1994, Chief Financial Officer — US Marketing & Services from 1988 to 1991, and Chief Information Officer from 1987 to 1988, IBM Corporation (computer and technology). Oversees 52; Enesco Group, Inc. (producer of giftware and home and garden decor products) from 2001 to 2006 | |
Interested Trustee
Name, Address and Year of Birth,
Position with Funds, Year First
Elected or Appointed to Office | | Principal Occupation(s) During Past Five Years, Number of Funds in Columbia
Funds Complex Overseen by Trustee, Other Directorships Held | |
William F. Truscott (born 1960)
53600 Ameriprise Financial Center
Minneapolis, MN 55474
Senior Vice President (since 2012) | | Chairman of the Board and President, Columbia Management Investment Advisers, LLC since May 2010 and February 2012 (previously President and Chief Investment Officer, from 2001 to April 2010); Chief Executive Officer, Global Asset Management, Ameriprise Financial, Inc. since September 2012 (previously, Chief Executive Officer, U.S. Asset Management & President, Annuities, from May 2010 to September 2012 and President — U.S. Asset Management and Chief Investment Officer from 2005 to April 2010); Director and Chief Executive Officer, Columbia Management Investment Distributors, Inc. since May 2010 and February 2012, respectively (previously Chairman of the Board and Chief Executive Officer from 2006 to April 2010); Chairman of the Board and Chief Executive Officer, RiverSource Distributors, Inc. since 2006; President and Chief Executive Officer, Ameriprise Certificate Company, 2006 to August 2012; Oversees 184; Director, Ameriprise Certificate Company, 2006-January 2013 | |
The Statement of Additional Information includes additional information about the Trustees of the Funds and is available, without charge, upon request by calling 800.345.6611.
The Board has appointed officers who are responsible for day-to-day business decisions based on policies it has established. The officers serve at the pleasure of the Board. In addition to Mr. Truscott, who is Senior Vice President, the Funds' other officers are:
Officers
Name, Address and
Year of Birth | | Position and Year
Appointed to
Position for any Fund
in the Columbia
Funds Complex or a
Predecessor Thereof | | First Principal Occupation(s) During Past Five Years | |
J. Kevin Connaughton
225 Franklin Street
Boston, MA 02110
Born 1964 | | President and
Principal Executive
Officer (2009) | | Senior Vice President and General Manager — Mutual Fund Products, Columbia Management Investment Advisers, LLC, since May 2010; and President, Columbia Funds since 2009; previously, Managing Director, Columbia Management Advisors, LLC, from December 2004 to April 2010; Senior Vice President and Chief Financial Officer, Columbia Funds, from June 2008 to January 2009; and senior officer of Columbia Funds and affiliated funds since 2003. | |
Michael G. Clarke
225 Franklin Street
Boston, MA 02110
Born 1969 | | Treasurer (2011) and
Chief Financial Officer
(2009) | | Vice President, Columbia Management Investment Advisers, LLC, since May 2010; previously, Managing Director of Fund Administration, Columbia Management Advisors, LLC, from September 2004 to April 2010; and senior officer of Columbia Funds and affiliated funds since 2002. | |
Annual Report 2013
33
Columbia Connecticut Intermediate Municipal Bond Fund
Trustees and Officers (continued)
Name, Address and
Year of Birth | | Position and Year
Appointed to
Position for any Fund
in the Columbia
Funds Complex or a
Predecessor Thereof | | First Principal Occupation(s) During Past Five Years | |
Scott R. Plummer
5228 Ameriprise
Financial Center
Minneapolis, MN 55474
Born 1959 | | Senior Vice President
(2006), Chief Legal
Officer (2006) and
Assistant Secretary
(2011) | | Senior Vice President, Chief Legal Officer and Assistant Secretary, Columbia Management Investment Advisers, LLC, since June 2005; Senior Vice President and Lead Chief Counsel — Asset Management, Ameriprise Financial, Inc., since May 2010 (previously, Vice President and Chief Counsel — Asset Management, from 2005 to April 2010); Vice President, Chief Counsel and Assistant Secretary, Columbia Management Investment Distributors, Inc., since 2008; Vice President, General Counsel and Secretary, Ameriprise Certificate Company, since 2005; Chief Counsel, RiverSource Distributors, Inc., since 2006; and senior officer of Columbia Funds and affiliated funds since 2006. | |
Thomas P. McGuire
225 Franklin Street
Boston, MA 02110
Born 1972 | | Chief Compliance
Officer (2012) | | Vice President — Asset Management Compliance, Ameriprise Financial, Inc., since May 2010; Chief Compliance Officer, Ameriprise Certificate Company, since September 2010; Compliance Executive, Bank of America, from 2005 to April 2010. | |
Colin Moore
225 Franklin Street
Boston, MA 02110
Born 1958 | | Senior Vice President
(2010) | | Executive Vice President and Global Chief Investment Officer, Ameriprise Financial, Inc., since July 2013; Director and Global Chief Investment Officer, Columbia Management Investment Advisers, LLC, since May 2010; previously, Manager, Managing Director and Chief Investment Officer, Columbia Management Advisors, LLC, from 2007 to April 2010. | |
Michael E. DeFao
225 Franklin Street
Boston, MA 02110
Born 1968 | | Vice President (2011)
and Assistant
Secretary (2010) | | Vice President and Chief Counsel, Ameriprise Financial, Inc., since May 2010; Associate General Counsel, Bank of America from 2005 to April 2010. | |
Joseph F. DiMaria
225 Franklin Street
Boston, MA 02110
Born 1968 | | Vice President (2011)
and Chief Accounting
Officer (2008) | | Vice President — Mutual Fund Administration, Columbia Management Investment Advisers, LLC, since May 2010; previously, Director of Fund Administration, Columbia Management Advisors, LLC, from 2006 to April 2010. | |
Paul B. Goucher
100 Park Avenue
New York, NY 10017
Born 1968 | | Vice President (2011)
and Assistant
Secretary (2008) | | Vice President and Lead Chief Counsel, Ameriprise Financial, Inc., since November 2008 and January 2013, respectively (previously, Chief Counsel, from January 2010 to January 2013, and Group Counsel from November 2008 to January 2010); previously, Director, Managing Director and General Counsel, J. & W. Seligman & Co. Incorporated, from July 2008 to November 2008. | |
Amy Johnson
5228 Ameriprise
Financial Center
Minneapolis, MN
Born 1965 | | Vice President (2006) | | Senior Vice President and Chief Operating Officer, Columbia Management Investment Advisers, LLC, since May 2010; previously, Chief Administrative Officer, from 2009 to April 2010, and Vice President — Asset Management and Trust Company Services, from 2006 to 2009. | |
Paul D. Pearson
5228 Ameriprise
Financial Center
Minneapolis, MN
Born 1956 | | Vice President (2011)
and Assistant
Treasurer (1999) | | Vice President — Investment Accounting, Columbia Management Investment Advisers, LLC, since May 2010; previously, Vice President — Managed Assets, Investment Accounting, Ameriprise Financial, Inc. from 1998 to April 2010. | |
Christopher O. Petersen
5228 Ameriprise
Financial Center
Minneapolis, MN 55474
Born 1970 | | Vice President and
Secretary (2010) | | Vice President and Chief Counsel, Ameriprise Financial, Inc., since January 2010 (previously, Vice President and Group Counsel or Counsel from 2004 to January 2010); officer of Columbia Funds and affiliated funds since 2007. | |
Stephen T. Welsh
225 Franklin Street
Boston, MA 02110
Born 1957 | | Vice President (2006) | | President and Director, Columbia Management Investment Services Corp., since May 2010; previously, President and Director, Columbia Management Services, Inc., from 2004 to April 2010; and Managing Director, Columbia Management Distributors, Inc., from 2007 to April 2010. | |
Annual Report 2013
34
Columbia Connecticut Intermediate Municipal Bond Fund
Board Consideration and Approval of
Advisory Agreement
On June 14, 2013, the Board of Trustees (the "Board") and the Trustees who are not interested persons (as defined in the Investment Company Act of 1940) of the Trust (the "Independent Trustees") unanimously approved the continuation of the Investment Management Services Agreement (the "Advisory Agreement") with Columbia Management Investment Advisers, LLC (the "Investment Manager") with respect to Columbia Connecticut Intermediate Municipal Bond Fund (the "Fund"), a series of the Trust. As detailed below, the Advisory Fees and Expenses Committee (the "Committee") and the Board met on multiple occasions to review and discuss, both among themselves and with the management team of the Investment Manager, materials provided by the Investment Manager before determining to approve the continuation of the Advisory Agreement.
In connection with their deliberations regarding the continuation of the Advisory Agreement, the Committee and the Board evaluated materials requested from the Investment Manager regarding the Fund and the Advisory Agreement, and discussed these materials with representatives of the Investment Manager at Committee meetings held on March 5, 2013, April 24, 2013 and June 13, 2013, and at the Board meeting held on June 14, 2013. In addition, the Board considers matters bearing on the Advisory Agreement at most of its other meetings throughout the year and meets regularly with senior management of the Funds and the Investment Manager. Through the Board's Investment Oversight Committees, Trustees also meet with selected Fund portfolio managers and other investment personnel at various times throughout the year. The Committee and the Board also consulted with Fund counsel and with the Independent Trustees' independent legal counsel, who advised on various matters with respect to the Committee's and the Board's considerations and otherwise assisted the Committee and the Board in their deliberations. On June 13, 2013, the Committee recommended that the Board approve the continuation of the Advisory Agreement. On June 14, 2013, the Board, including the Independent Trustees, voting separately, unanimously approved the continuation of the Advisory Agreement for the Fund.
The Committee and the Board considered all information that they, their legal counsel, or the Investment Manager believed reasonably necessary to evaluate and to determine whether to approve the continuation of the Advisory Agreement. The information and factors considered by the Committee and the Board in recommending for approval or approving the continuation of the Advisory Agreement for the Fund included the following:
• Information on the investment performance of the Fund relative to the performance of a group of mutual funds determined to be comparable to the Fund by an independent third-party data provider, as well as performance relative to benchmarks;
• Information on the Fund's advisory fees and total expenses, including information comparing the Fund's expenses to those of a group of comparable mutual funds, as determined by the independent third-party data provider;
• The Investment Manager's agreement to contractually limit or cap total operating expenses for the Fund so that total operating expenses (excluding certain fees and expenses, such as transaction costs and certain other investment related expenses, interest, taxes, acquired fund fees and expenses, and extraordinary expenses) would not exceed the median expenses of a group of comparable funds (as determined from time to time, generally annually, by the independent third-party data provider);
• The terms and conditions of the Advisory Agreement;
• The terms and conditions of other agreements and arrangements with affiliates of the Investment Manager relating to the operations of the Fund, including the Administrative Services Agreement, the Distribution Agreement and the Transfer and Dividend Disbursing Agent Agreement;
• Descriptions of various functions performed by the Investment Manager under the Advisory Agreement, including portfolio management and portfolio trading practices;
• Information regarding the management fees and investment performance of comparable portfolios of other clients of the Investment Manager, including institutional separate accounts;
• Information regarding the reputation, regulatory history and resources of the Investment Manager, including information regarding senior management, portfolio managers and other personnel;
• Information regarding the capabilities of the Investment Manager with respect to compliance monitoring services, including an assessment of the Investment Manager's compliance system by the Fund's Chief Compliance Officer; and
Annual Report 2013
35
Columbia Connecticut Intermediate Municipal Bond Fund
Board Consideration and Approval of
Advisory Agreement (continued)
• The profitability to the Investment Manager and its affiliates from their relationships with the Fund.
Nature, Extent and Quality of Services Provided under the Advisory Agreement
The Committee and the Board considered the nature, extent and quality of services provided to the Fund by the Investment Manager and its affiliates under the Advisory Agreement and under separate agreements for the provision of transfer agency and administrative services, and the resources dedicated to the Fund and the other Columbia Funds by the Investment Manager and its affiliates. The Committee and the Board considered, among other things, the Investment Manager's ability to attract, motivate and retain highly qualified research, advisory and supervisory investment professionals (including personnel and other resources, compensation programs for personnel involved in fund management, reputation and other attributes), the portfolio management services provided by those investment professionals, and the quality of the Investment Manager's investment research capabilities and trade execution services. The Committee and the Board also considered the potential benefits to shareholders of investing in a mutual fund that is part of a fund complex offering exposure to a variety of asset classes and investment disciplines and providing a variety of fund and shareholder services.
The Committee and the Board also considered the professional experience and qualifications of the senior personnel of the Investment Manager, which included consideration of the Investment Manager's experience with similarly-structured funds. The Committee and the Board noted the compliance programs of and the compliance-related resources provided to the Fund by the Investment Manager and its affiliates, and considered the Investment Manager's ability to provide administrative services to the Fund pursuant to a separate Administrative Services Agreement, including the Investment Manager's ability to coordinate the activities of the Fund's other service providers. After reviewing these and related factors, the Committee and the Board concluded, within the context of their overall conclusions, that the nature, extent and quality of the services provided to the Fund under the Advisory Agreement supported the continuation of the Advisory Agreement.
Investment Performance
The Committee and the Board reviewed information about the performance of the Fund over various time periods, including performance information relative to benchmarks and information based on reports of the independent third-party data provider that compared the performance of the Fund to the performance of a group of comparable mutual funds. The Committee and the Board also reviewed a description of the third party's methodology for identifying the Fund's peer groups for purposes of performance and expense comparisons. Although the Fund's performance lagged that of a relevant peer group for certain (although not necessarily all) periods, the Committee and the Board concluded that other factors relevant to performance were sufficient, in light of other considerations, to warrant continuation of the Fund's Advisory Agreement. Those factors included one or more of the following: (i) that the Fund's performance, although lagging in certain recent periods, was stronger over the longer term; (ii) that the underperformance was attributable, to a significant extent, to investment decisions that were reasonable and consistent with the Fund's investment strategy and policies and that the Fund was performing within a reasonable range of expectations, given those investment decisions, market conditions and the Fund's investment strategy; (iii) that the Fund's performance was competitive when compared to other relevant performance benchmarks or peer groups; and (iv) that the Investment Manager had taken or was taking steps designed to help improve the Fund's investment performance, including, but not limited to, replacing portfolio managers, enhancing the resources supporting the portfolio managers, or modifying investment strategies.
The Committee and the Board noted that, through December 31, 2012, the Fund's performance was in the forty-ninth, sixtieth and eighty-second percentiles (where the best performance would be in the first percentile) of its category selected by the independent third-party data provider for the purposes of performance comparisons for the one-, three- and five- year periods, respectively.
The Committee and the Board also considered the Investment Manager's performance and reputation generally, the Investment Manager's historical responsiveness to Board concerns about performance, and the Investment Manager's willingness to take steps intended to improve performance. After reviewing these and related factors, the Committee and the Board concluded, within the context of their overall conclusions, that the performance of the Fund and the Investment Manager was sufficient, in light of other considerations, to warrant the continuation of the Advisory Agreement.
Annual Report 2013
36
Columbia Connecticut Intermediate Municipal Bond Fund
Board Consideration and Approval of
Advisory Agreement (continued)
Investment Advisory Fee Rates and Other Expenses
The Committee and the Board considered the advisory fees charged to the Fund under the Advisory Agreement as well as the total expenses incurred by the Fund. In assessing the reasonableness of the fees under the Advisory Agreement, the Committee and the Board considered, among other information, the Fund's advisory fee and its total expense ratio as a percentage of average daily net assets. The Committee and the Board noted that the Fund's actual management fee and net expense ratio are both ranked in the second quintile (where the lowest fees and expenses would be in the first quintile) against the Fund's expense universe as determined by the independent third-party data provider for purposes of expense comparison. The Committee and the Board also took into account the fee waiver and expense limitation arrangements agreed to by the Investment Manager, as noted above.
The Committee and the Board also received and considered information about the advisory fees charged by the Investment Manager to institutional separate accounts. In considering the fees charged to those accounts, the Committee and the Board took into account, among other things, the Investment Manager's representations about the differences between managing mutual funds as compared to other types of accounts, including differences in the services provided, differences in the risk profile of such business for the Investment Manager and the additional resources required to manage mutual funds effectively. In evaluating the Fund's advisory fees, the Committee and the Board also took into account the demands, complexity and quality of the investment management of the Fund.
After reviewing these and related factors, the Committee and the Board concluded, within the context of their overall conclusions, that the advisory fee rates and expenses of the Fund supported the continuation of the Advisory Agreement.
Costs of Services Provided and Profitability
The Committee and the Board also took note of the costs of the services provided (both on an absolute and relative basis) and the profitability to the Investment Manager and its affiliates in connection with their relationships with the Fund. In evaluating these considerations, the Committee and the Board took note of the advisory fees charged by the Investment Manager to other clients, including fees charged by the Investment Manager to institutional separate account clients with similar investment strategies to those of the Fund.
The Committee and the Board also considered the compensation directly or indirectly received by the Investment Manager's affiliates in connection with their relationships with the Fund. The Committee and the Board reviewed information provided by management as to the profitability of the Investment Manager and its affiliates of their relationships with the Fund, information about the allocation of expenses used to calculate profitability, and comparisons of profitability levels realized in 2012 to profitability levels realized in 2011. When reviewing profitability, the Committee and the Board also considered court cases in which adviser profitability was an issue in whole or in part, the performance of the Fund, the expense ratio of the Fund, and the implementation of expense limitations with respect to the Fund. The Committee and the Board also considered information provided by the Investment Manager regarding its financial condition and comparing its profitability to that of other asset management firms that are, or are subsidiaries of, publicly traded companies.
After reviewing these and related factors, the Committee and the Board concluded, within the context of their overall conclusions, that the costs of services provided and the profitability to the Investment Manager and its affiliates from their relationships with the Fund supported the continuation of the Advisory Agreement.
Economies of Scale
The Committee and the Board considered the potential existence of economies of scale in the provision by the Investment Manager of services to the Fund, to groups of related funds, and to the Investment Manager's investment advisory clients as a whole, and whether those economies of scale were shared with the Fund through breakpoints in investment advisory fees or other means, such as expense limitation arrangements and additional investments by the Investment Manager in investment, trading and compliance resources. The Committee and the Board noted that the investment advisory fee schedules for the Fund contained breakpoints that would reduce the fee rate on assets above specified threshold levels.
In considering these matters, the Committee and the Board also considered the costs of the services provided and the profitability to the Investment Manager and its affiliates from their relationships with the Fund, as discussed above. After reviewing these and related factors, the Committee and the Board concluded, within the context of their overall conclusions,
Annual Report 2013
37
Columbia Connecticut Intermediate Municipal Bond Fund
Board Consideration and Approval of
Advisory Agreement (continued)
that the extent to which any economies of scale were expected to be shared with the Fund supported the continuation of the Advisory Agreement.
Other Benefits to the Investment Manager
The Committee and the Board received and considered information regarding "fall-out" or ancillary benefits received by the Investment Manager and its affiliates as a result of their relationships with the Fund, such as the engagement of the Investment Manager to provide administrative services to the Fund and the engagement of the Investment Manager's affiliates to provide distribution and transfer agency services to the Fund. The Committee and the Board considered that the Fund's distributor retains a portion of the distribution fees from the Fund. The Committee and the Board also considered the benefits of research made available to the Investment Manager by reason of brokerage commissions generated by the Fund's securities transactions, and reviewed information about the Investment Manager's practices with respect to allocating portfolio transactions for brokerage and research services. The Committee and the Board considered the possible conflicts of interest associated with certain fall-out or other ancillary benefits and the reporting, disclosure and other processes that are in place to address such possible conflicts of interest. The Committee and the Board recognized that the Investment Manager's profitability would be somewhat lower without these benefits.
Conclusion
The Committee and the Board reviewed all of the above considerations in reaching their decisions to recommend or approve the continuation of the Advisory Agreement. In their deliberations, the Trustees did not identify any particular information that was all-important or controlling, and individual Trustees may have attributed different weights to the various factors. Based on their evaluation of all factors that they deemed to be material, including those factors described above, and assisted by the advice of independent legal counsel, the Board, including the Independent Trustees, voting separately, unanimously approved the continuation of the Advisory Agreement.
Annual Report 2013
38
This page intentionally left blank.
Annual Report 2013
39
This page intentionally left blank.
Annual Report 2013
40
Columbia Connecticut Intermediate Municipal Bond Fund
Important Information About This Report
Each fund mails one shareholder report to each shareholder address. If you would like more than one report, please call shareholder services at 800.345.6611 and additional reports will be sent to you.
The policy of the Board is to vote the proxies of the companies in which each fund holds investments consistent with the procedures as stated in the Statement of Additional Information (SAI). You may obtain a copy of the SAI without charge by calling 800.345.6611; contacting your financial intermediary; visiting columbiamanagement.com; or searching the website of the Securities and Exchange Commission (SEC) at sec.gov. Information regarding how each fund voted proxies relating to portfolio securities is filed with the SEC by August 31 for the most recent 12-month period ending June 30 of that year, and is available without charge by visiting columbiamanagement.com; or searching the website of the SEC at sec.gov.
Each fund files a complete schedule of portfolio holdings with the SEC for the first and third quarters of each fiscal year on Form N-Q. Each fund's Form N-Q is available on the SEC's website at sec.gov and may be reviewed and copied at the SEC's Public Reference Room in Washington, D.C. Information on the operation of the Public Reference Room may be obtained by calling 800.SEC.0330. Each fund's complete schedule of portfolio holdings, as filed on Form N-Q, can also be obtained without charge, upon request, by calling 800.345.6611.
Annual Report 2013
41

Columbia Connecticut Intermediate Municipal Bond Fund
P.O. Box 8081
Boston, MA 02266-8081
columbiamanagement.com
This information is for use with concurrent or prior delivery of a fund prospectus. Please read and consider the investment objectives, risks, charges and expenses for any fund carefully before investing. For a prospectus and, if available, a summary prospectus, which contains this and other important information about the Fund go to columbiamanagement.com. The Fund is distributed by Columbia Management Investment Distributors, Inc., member FINRA, and managed by Columbia Management Investment Advisers, LLC.
© 2013 Columbia Management Investment Advisers, LLC. All rights reserved.
ANN131_10_C01_(12/13)
Annual Report
October 31, 2013

Columbia Intermediate Municipal Bond Fund
Not FDIC insured • No bank guarantee • May lose value
 Dear Shareholders,
A market rally led by equities
Despite threats of military action in Syria, rumblings from Iran and an impending showdown over the debt ceiling here at home, the U.S. financial markets delivered positive results in the third quarter of 2013. Stocks outperformed bonds by a substantial margin. Still, robust growth continued to elude the U.S. economy, which merely plodded along. New job growth was solid but not spectacular. Consumer spending remained steady, but the only obvious beneficiary was the auto industry. Gains in the housing market met some headwinds, as mortgage rates rose and sales slipped somewhat. Nevertheless, the recovery in housing remained intact.
The Federal Reserve (the Fed) unsettled investors with a hint that it was ready to taper its purchase of U.S. Treasury and mortgage securities. However, its failure to take any action in a September meeting rallied stocks to new highs and brought bonds back into positive territory for the quarter. Small-cap stocks were the U.S. market leaders. Growth outperformed value in a quarter dominated by the materials, industrials and consumer discretionary sectors. Developed markets led the global rally, driven by strengthening economic conditions in the eurozone. Certain emerging stock markets, including China's, bounced back with returns in line with those of the United States. India and Indonesia were exceptions to that trend, as fears of the Fed's tapering efforts rattled investors in both countries.
Improved risk appetites boosted fixed income
Following a weak second quarter, the fixed-income markets made up some ground in the third quarter of 2013. As yields fell, bond prices rallied enough to push returns on non-Treasury sectors into positive territory. Risk appetites improved in response to continued liquidity from the Fed. Against this backdrop, U.S. high-yield and foreign bonds led the fixed-income markets, along with mortgage-backed securities and emerging market bonds. The U.S. municipal bond market was the exception, as it slipped into negative territory in the final week of the period, pressured by heightened concerns over Puerto Rico, potential municipal bankruptcies and continued fund redemptions.
Stay on track with Columbia Management
Backed by more than 100 years of experience, Columbia Management is one of the nation's largest asset managers. At the heart of our success and, most importantly, that of our investors, are highly talented industry professionals, brought together by a unique way of working. At Columbia Management, reaching our performance goals matters, and how we reach them matters just as much.
Visit columbiamanagement.com for:
> The Columbia Management Perspectives blog, offering insights on current market events and investment opportunities
> Detailed up-to-date fund performance and portfolio information
> Quarterly fund commentaries
> Columbia Management Investor, our award-winning quarterly newsletter for shareholders
Thank you for your continued support of the Columbia Funds. We look forward to serving your investment needs for many years to come.
Best Regards,

J. Kevin Connaughton
President, Columbia Funds
Investing involves risk including the risk of loss of principal.
Investors should consider the investment objectives, risks, charges and expenses of a mutual fund carefully before investing. For a free prospectus, which contains this and other important information about a fund, visit columbiamanagement.com. The prospectus should be read carefully before investing.
Columbia Funds are distributed by Columbia Management Investment Distributors, Inc., member FINRA, and managed by Columbia Management Investment Advisers, LLC.
© 2013 Columbia Management Investment Advisers, LLC. All rights reserved.
Columbia Intermediate Municipal Bond Fund
Performance Overview | | | 2 | | |
Manager Discussion of Fund Performance | | | 4 | | |
Understanding Your Fund's Expenses | | | 6 | | |
Portfolio of Investments | | | 7 | | |
Statement of Assets and Liabilities | | | 27 | | |
Statement of Operations | | | 29 | | |
Statement of Changes in Net Assets | | | 30 | | |
Financial Highlights | | | 32 | | |
Notes to Financial Statements | | | 39 | | |
Report of Independent Registered
Public Accounting Firm | | | 45 | | |
Federal Income Tax Information | | | 46 | | |
Trustees and Officers | | | 47 | | |
Board Consideration and Approval of Advisory Agreement | | | 50 | | |
Important Information About This Report | | | 57 | | |
Fund Investment Manager
Columbia Management Investment
Advisers, LLC
225 Franklin Street
Boston, MA 02110
Fund Distributor
Columbia Management Investment
Distributors, Inc.
225 Franklin Street
Boston, MA 02110
Fund Transfer Agent
Columbia Management Investment
Services Corp.
P.O. Box 8081
Boston, MA 02266-8081
For more information about any of the funds, please visit columbiamanagement.com or call 800.345.6611. Customer Service Representatives are available to answer your questions Monday through Friday from 8 a.m. to 8 p.m. Eastern time.
The views expressed in this report reflect the current views of the respective parties. These views are not guarantees of future performance and involve certain risks, uncertainties and assumptions that are difficult to predict, so actual outcomes and results may differ significantly from the views expressed. These views are subject to change at any time based upon economic, market or other conditions and the respective parties disclaim any responsibility to update such views. These views may not be relied on as investment advice and, because investment decisions for a Columbia Fund are based on numerous factors, may not be relied on as an indication of trading intent on behalf of any particular Columbia Fund. References to specific securities should not be construed as a recommendation or investment advice.
Columbia Intermediate Municipal Bond Fund
Performance Summary
> Columbia Intermediate Municipal Bond Fund (the Fund) Class A shares returned -1.39% excluding sales charges for the 12-month period that ended October 31, 2013. The Fund's Class Z shares returned -1.28% for the same time period.
> By comparison, the Fund's benchmark, the Barclays 3-15 Year Blend Municipal Bond Index, returned -0.53% for the 12-month period.
> The Fund modestly lagged the benchmark because of its slightly longer duration (a measure of interest rate sensitivity) and also because of its coupon structure in the 15- to 20-year maturity range.
Average Annual Total Returns (%) (for period ended October 31, 2013)
| | Inception | | 1 Year | | 5 Years | | 10 Years | |
Class A | | 11/25/02 | | | | | | | | | | | | | |
Excluding sales charges | | | | | | | -1.39 | | | | 5.37 | | | | 3.60 | | |
Including sales charges | | | | | | | -4.59 | | | | 4.68 | | | | 3.10 | | |
Class B | | 11/25/02 | | | | | | | | | | | | | |
Excluding sales charges | | | | | | | -2.02 | | | | 4.69 | | | | 2.93 | | |
Including sales charges | | | | | | | -4.89 | | | | 4.69 | | | | 2.93 | | |
Class C | | 11/25/02 | | | | | | | | | | | | | |
Excluding sales charges | | | | | | | -1.58 | | | | 5.16 | | | | 3.39 | | |
Including sales charges | | | | | | | -2.54 | | | | 5.16 | | | | 3.39 | | |
Class R4* | | 03/19/13 | | | -1.30 | | | | 5.56 | | | | 3.79 | | |
Class R5* | | 11/08/12 | | | -1.21 | | | | 5.58 | | | | 3.80 | | |
Class T | | 06/26/00 | | | | | | | | | | | | | |
Excluding sales charges | | | | | | | -1.34 | | | | 5.42 | | | | 3.65 | | |
Including sales charges | | | | | | | -6.02 | | | | 4.40 | | | | 3.15 | | |
Class Z | | 06/14/93 | | | -1.28 | | | | 5.57 | | | | 3.79 | | |
Barclays 3-15 Year Blend Municipal Bond Index | | | | | | | -0.53 | | | | 5.88 | | | | 4.47 | | |
Returns for Class A are shown with and without the maximum initial sales charge of 3.25% (for the one-year and five-year periods) and 4.75% (for the 10-year period). (Prior to August 22, 2005, new purchases of Class A shares had a maximum initial sales charge of 4.75%.) Returns for Class B are shown with and without the applicable contingent deferred sales charge (CDSC) of 3.00% in the first year, declining to 1.00% in the fourth year and eliminated thereafter. Returns for Class C are shown with and without the 1.00% CDSC for the first year only. Returns for Class T are shown with and without the maximum sales charge of 4.75%. The Fund's other classes are not subject to sales charges and have limited eligibility. Please see the Fund's prospectus for details. Performance for different share classes will vary based on differences in sales charges and fees associated with each class. All results shown assume reinvestment of distributions during the period. Returns do not reflect the deduction of taxes that a shareholder may pay on Fund distributions or on the redemption of Fund shares. Performance results reflect the effect of any fee waivers or reimbursements of Fund expenses by Columbia Management Investment Advisers, LLC and/or any of its affiliates. Absent these fee waivers or expense reimbursement arrangements, performance results would have been lower.
The performance information shown represents past performance and is not a guarantee of future results. The investment return and principal value of your investment will fluctuate so that your shares, when redeemed, may be worth more or less than their original cost. Current performance may be lower or higher than the performance information shown. You may obtain performance information current to the most recent month-end by contacting your financial intermediary, visiting columbiamanagement.com or calling 800.345.6611.
*The returns shown for periods prior to the share class inception date (including returns for the Life of the Fund, if shown, which are since Fund inception) include the returns of the Fund's oldest share class. These returns are adjusted to reflect any higher class-related operating expenses of the newer share classes, as applicable. Please visit columbiamanagement.com/mutual-funds/appended-performance for more information.
The Barclays 3-15 Year Blend Municipal Bond Index is an unmanaged index that tracks the performance of municipal bonds issued after December 31, 1990, with remaining maturities between 2 and 17 years and at least $7 million in principal amount outstanding.
Indices are not available for investment, are not professionally managed and do not reflect sales charges, fees, brokerage commissions, taxes or other expenses of investing. Securities in the Fund may not match those in an index.
Annual Report 2013
2
Columbia Intermediate Municipal Bond Fund
Performance Overview (continued)
Performance of a Hypothetical $10,000 Investment (November 1, 2003 – October 31, 2013)
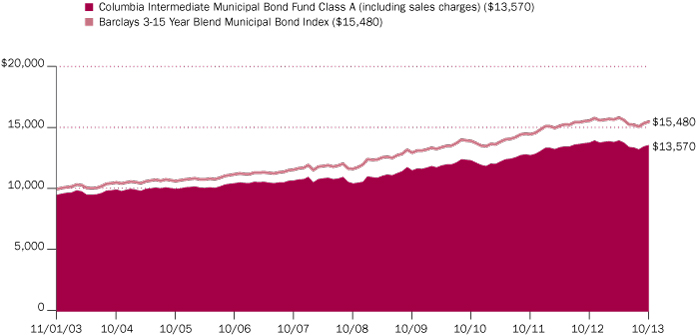
The chart above shows the change in value of a hypothetical $10,000 investment in Class A shares of Columbia Intermediate Municipal Bond Fund during the stated time period, and does not reflect the deduction of taxes that a shareholder may pay on Fund distributions or on the redemption of Fund shares. The performance of a $10,000 with sales charge for Class A shares is calculated with an initial sales charge of 4.75%, which was the effective sales charge prior to August 22, 2005.
Annual Report 2013
3
Columbia Intermediate Municipal Bond Fund
Manager Discussion of Fund Performance
For the 12-month period that ended October 31, 2013, the Fund's Class A shares returned -1.39% excluding sales charges. The Fund's Class Z shares returned -1.28% for the same time frame. By comparison, the Fund's benchmark, the Barclays 3-15 Year Blend Municipal Bond Index, returned -0.53% for the 12-month period. The Fund modestly lagged the benchmark because of its slightly longer duration (a measure of interest rate sensitivity) and also because of its coupon structure in the 15- to 20-year maturity range. Exposure to BBB rated credits aided performance, as the Fund did better than the benchmark in this quality segment. Lower A rated names also aided results.
Second Half Rate Rise Spurs Municipal Fund Outflows
The first half of the Fund's fiscal year was relatively uneventful, with interest rates range bound from November 2012 through April 2013. However, the Federal Reserve's (the Fed's) May announcement that it might begin to taper its monthly securities purchase program, known popularly as QE3 (QE refers to "quantitative easing"), drove a sharp and prolonged sell-off in the municipal market from May through mid-September. During this period 10-year AAA municipal yields rose to close to 3.00%, matching the yield on the 10-year Treasury. New issue supply was down versus 2012, as higher rates made refinancing less viable. In addition, two major credit events clouded the outlook for municipal bonds: the city of Detroit filed for bankruptcy and Puerto Rico bonds fell sharply on negative economic news. Puerto Rico bonds are widely held in many mutual funds because they are triple tax-free.
Within the benchmark, returns were slightly positive on one, three and five-year municipals. The worst returns were generated by bonds in the 12-17 year range. A rated bonds posted slightly better returns than higher quality AA and AAA rated bonds, due to the additional yield they generated. BBB rated bonds were the worst performers, dragged down by Puerto Rico exposure.
Market Environment Pressured Fund Results
Early in the period, we decreased Fund exposure to bonds with very short maturities. However, as interest rates rose, we decreased duration exposure overall and sold more longer maturity issues, particularly those with 4% coupons, which underperformed as rates rose and added volatility to the Fund. As a result of these actions, we realized losses that offset gains that had been made from previous activity.
Contributors and Detractors
Overweights in hospital bonds and industrial development revenue/pollution control revenue bonds helped performance because both generated positive returns in a period of generally negative performance for the municipal market. The Fund's BBB rated holdings aided relative performance, even though BBB bonds were generally poor performers for the period. That's because the Fund had very little exposure to Puerto Rico bonds. Lower A rated names also aided results. The Fund's Massachusetts and Florida holdings outperformed the benchmark and California bonds generally did well, even though the Fund's longer duration exposure within California holdings offset some of these gains. An underweight in longer maturity (12-17 year) bonds was also positive for the
Portfolio Management
Brian McGreevy
Paul Fuchs, CFA
Top Ten States (%)
(at October 31, 2013) | |
California | | | 14.6 | | |
New York | | | 13.0 | | |
Texas | | | 8.9 | | |
Florida | | | 7.1 | | |
Illinois | | | 6.0 | | |
New Jersey | | | 5.3 | | |
Massachusetts | | | 5.2 | | |
Pennsylvania | | | 3.8 | | |
Colorado | | | 2.7 | | |
Rhode Island | | | 2.5 | | |
Percentages indicated are based upon total investments (excluding Money Market Funds).
For further detail about these holdings, please refer to the section entitled "Portfolio of Investments."
Fund holdings are as of the date given, are subject to change at any time, and are not recommendations to buy or sell any security.
Quality Breakdown (%)
(at October 31, 2013) | |
AAA rating | | | 5.8 | | |
AA rating | | | 34.7 | | |
A rating | | | 42.8 | | |
BBB rating | | | 12.0 | | |
Non-investment grade | | | 1.1 | | |
Not rated | | | 3.6 | | |
Total | | | 100.0 | | |
Percentages indicated are based upon total fixed income securities (excluding Money Market Funds).
Bond ratings apply to the underlying holdings of the Fund and not the Fund itself and are divided into categories ranging from AAA (highest) to D (lowest), and are subject to change. The ratings shown are determined by using the middle rating of Moody's, S&P, and Fitch after dropping the highest and lowest available ratings. When a rating from only two agencies is available, the lower rating is used. When a rating from only one agency is available, that rating is used. When a bond is not rated by one of these agencies, it is designated as Not rated. Credit ratings are subjective opinions and not statements of fact.
Annual Report 2013
4
Columbia Intermediate Municipal Bond Fund
Manager Discussion of Fund Performance (continued)
Fund. However, all of these positive factors were not enough to offset the impact of the Fund's long duration and its 4% coupon holdings.
Looking Ahead
A drop in new issue supply is currently projected for 2014, as issuers remain cautious about taking on new debt. In this environment, we will look to our credit research team to help us seek to identify opportunities in the higher yielding A and BBB rated segment of the market with issues that we believe are attractively valued and offer sound fundamentals. We believe the eight- to 12-year maturity range offers value because the vast majority of yield available in the intermediate space can be captured in this maturity range. We also currently plan to continue to maintain a neutral duration relative to the benchmark until there is more clarity around the Fed's intentions and the arrival of a new Fed chairman at the beginning of 2014.
Investment Risks
There are risks associated with an investment in a bond fund, including credit risk, interest rate risk, and prepayment and extension risk. In general, bond prices rise when interest rates fall and vice versa. This effect is more pronounced for longer-term securities. Non-investment grade securities, commonly called "high-yield" or "junk" bonds, have more volatile prices and carry more risk to principal and income than investment grade securities. Income from tax-exempt funds may be subject to state and local taxes and a portion of income may. See the Fund's prospectus for information on these and other risks.
Annual Report 2013
5
Columbia Intermediate Municipal Bond Fund
Understanding Your Fund's Expenses
(Unaudited)
As an investor, you incur two types of costs. There are transaction costs, which generally include sales charges on purchases and may include redemption fees. There are also ongoing costs, which generally include management fees, distribution and service (Rule 12b-1) fees, and other fund expenses. The following information is intended to help you understand your ongoing costs (in dollars) of investing in the Fund and to help you compare these costs with the ongoing costs of investing in other mutual funds.
Analyzing Your Fund's Expenses
To illustrate these ongoing costs, we have provided examples and calculated the expenses paid by investors in each share class of the Fund during the period. The actual and hypothetical information in the table is based on an initial investment of $1,000 at the beginning of the period indicated and held for the entire period. Expense information is calculated two ways and each method provides you with different information. The amount listed in the "Actual" column is calculated using the Fund's actual operating expenses and total return for the period. You may use the Actual information, together with the amount invested, to estimate the expenses that you paid over the period. Simply divide your account value by $1,000 (for example, an $8,600 account value divided by $1,000 = 8.6), then multiply the results by the expenses paid during the period under the Actual column. The amount listed in the "Hypothetical" column assumes a 5% annual rate of return before expenses (which is not the Fund's actual return) and then applies the Fund's actual expense ratio for the period to the hypothetical return. You should not use the hypothetical account values and expenses to estimate either your actual account balance at the end of the period or the expenses you paid during the period. See "Compare With Other Funds" below for details on how to use the hypothetical data.
Compare With Other Funds
Since all mutual funds are required to include the same hypothetical calculations about expenses in shareholder reports, you can use this information to compare the ongoing cost of investing in the Fund with other funds. To do so, compare the hypothetical example with the 5% hypothetical examples that appear in the shareholder reports of other funds. As you compare hypothetical examples of other funds, it is important to note that hypothetical examples are meant to highlight the ongoing costs of investing in a fund only and do not reflect any transaction costs, such as sales charges, or redemption or exchange fees. Therefore, the hypothetical calculations are useful in comparing ongoing costs only, and will not help you determine the relative total costs of owning different funds. If transaction costs were included in these calculations, your costs would be higher.
May 1, 2013 – October 31, 2013
| | Account Value at the Beginning
of the Period ($) | | Account Value at the End of the
Period ($) | | Expenses Paid During the
Period ($) | | Fund's Annualized
Expense Ratio (%) | |
| | Actual | | Hypothetical | | Actual | | Hypothetical | | Actual | | Hypothetical | | Actual | |
Class A | | | 1,000.00 | | | | 1,000.00 | | | | 972.20 | | | | 1,021.48 | | | | 3.68 | | | | 3.77 | | | | 0.74 | | |
Class B | | | 1,000.00 | | | | 1,000.00 | | | | 969.00 | | | | 1,018.20 | | | | 6.90 | | | | 7.07 | | | | 1.39 | | |
Class C | | | 1,000.00 | | | | 1,000.00 | | | | 970.40 | | | | 1,020.47 | | | | 4.67 | | | | 4.79 | | | | 0.94 | | |
Class R4 | | | 1,000.00 | | | | 1,000.00 | | | | 972.20 | | | | 1,022.48 | | | | 2.68 | | | | 2.75 | | | | 0.54 | | |
Class R5 | | | 1,000.00 | | | | 1,000.00 | | | | 972.70 | | | | 1,022.94 | | | | 2.24 | | | | 2.29 | | | | 0.45 | | |
Class T | | | 1,000.00 | | | | 1,000.00 | | | | 972.50 | | | | 1,021.73 | | | | 3.43 | | | | 3.52 | | | | 0.69 | | |
Class Z | | | 1,000.00 | | | | 1,000.00 | | | | 972.30 | | | | 1,022.48 | | | | 2.68 | | | | 2.75 | | | | 0.54 | | |
Expenses paid during the period are equal to the annualized expense ratio for each class as indicated above, multiplied by the average account value over the period and then multiplied by the number of days in the Fund's most recent fiscal half year and divided by 365.
Expenses do not include fees and expenses incurred indirectly by the Fund from the underlying funds in which the Fund may invest (also referred to as "acquired funds"), including affiliated and non-affiliated pooled investment vehicles (including mutual funds and exchange-traded funds).
Had Columbia Management Investment Advisers, LLC and/or certain of its affiliates not waived/reimbursed certain fees and expenses, account value at the end of the period would have been reduced.
Annual Report 2013
6
Columbia Intermediate Municipal Bond Fund
Portfolio of Investments
October 31, 2013
(Percentages represent value of investments compared to net assets)
Municipal Bonds 97.9%
Issue
Description | | Coupon
Rate | | Principal
Amount ($) | |
Value ($) | |
Alabama 0.6% | |
Alabama 21st Century Authority
Revenue Bonds
Series 2012A
06/01/19 | | | 5.000 | % | | | 1,750,000 | | | | 1,991,342 | | |
Alabama Public School & College Authority
Refunding Revenue Bonds
Series 2009A
05/01/19 | | | 5.000 | % | | | 10,000,000 | | | | 11,864,900 | | |
Total | | | | | | | 13,856,242 | | |
Alaska 1.0% | |
City of Valdez
Refunding Revenue Bonds
BP Pipelines Project
Series 2003B
01/01/21 | | | 5.000 | % | | | 19,460,000 | | | | 22,426,482 | | |
Arizona 1.6% | |
Arizona School Facilities Board
Certificate of Participation
Series 2008
09/01/15 | | | 5.500 | % | | | 7,500,000 | | | | 8,163,675 | | |
City of Tucson
Unlimited General Obligation Refunding Bonds
Series 1998
07/01/18 | | | 5.500 | % | | | 4,760,000 | | | | 5,667,208 | | |
Maricopa County Industrial Development Authority
Revenue Bonds
Catholic Healthcare West
Series 2007A
07/01/18 | | | 5.000 | % | | | 3,500,000 | | | | 3,923,500 | | |
Maricopa County Pollution Control Corp.
Refunding Revenue Bonds
Arizona Public Service Co.
Series 2009D(a)
05/01/29 | | | 6.000 | % | | | 10,000,000 | | | | 10,261,200 | | |
Salt River Project Agricultural Improvement & Power
District
Revenue Bonds
Series 2009A
01/01/22 | | | 5.000 | % | | | 1,000,000 | | | | 1,143,900 | | |
State of Arizona
Certificate of Participation
Department of Administration
Series 2010A (AGM)
10/01/18 | | | 5.000 | % | | | 5,000,000 | | | | 5,732,450 | | |
Total | | | | | | | 34,891,933 | | |
Municipal Bonds (continued)
Issue
Description | | Coupon
Rate | | Principal
Amount ($) | |
Value ($) | |
Arkansas 0.2% | |
County of Independence
Refunding Revenue Bonds
Entergy Mississippi, Inc. Project
Series 1999 (AMBAC)
07/01/22 | | | 4.900 | % | | | 4,600,000 | | | | 4,708,974 | | |
California 14.3% | |
California Health Facilities Financing Authority
Revenue Bonds
St. Joseph Health System
Series 2009B
07/01/18 | | | 5.000 | % | | | 10,445,000 | | | | 12,120,169 | | |
California Municipal Finance Authority
Revenue Bonds
Biola University
Series 2008
10/01/23 | | | 5.625 | % | | | 3,000,000 | | | | 3,230,070 | | |
California State Department of Water Resources
Revenue Bonds
Power Supply
Series 2008H
05/01/21 | | | 5.000 | % | | | 5,000,000 | | | | 5,824,850 | | |
California State Public Works Board
Refunding Revenue Bonds
Department of Corrections and Rehab
Series 2006F (NPFGC)
11/01/18 | | | 5.250 | % | | | 4,000,000 | | | | 4,747,720 | | |
Various Capital Projects
Series 2012G
11/01/28 | | | 5.000 | % | | | 5,510,000 | | | | 5,910,136 | | |
Revenue Bonds
Various Capital Projects
Series 2011A
10/01/22 | | | 5.250 | % | | | 3,395,000 | | | | 3,961,524 | | |
Series 2012A
04/01/28 | | | 5.000 | % | | | 10,000,000 | | | | 10,686,200 | | |
California State University
Revenue Bonds
Systemwide
Series 2008A (AGM)
11/01/22 | | | 5.000 | % | | | 5,000,000 | | | | 5,651,400 | | |
City of Fresno Sewer System
Revenue Bonds
Series 1993A-1 (AMBAC)
09/01/19 | | | 5.250 | % | | | 5,000,000 | | | | 5,587,450 | | |
City of Vernon Electric System
Revenue Bonds
Series 2009A
08/01/21 | | | 5.125 | % | | | 15,435,000 | | | | 16,714,253 | | |
The accompanying Notes to Financial Statements are an integral part of this statement.
Annual Report 2013
7
Columbia Intermediate Municipal Bond Fund
Portfolio of Investments (continued)
October 31, 2013
Municipal Bonds (continued)
Issue
Description | | Coupon
Rate | | Principal
Amount ($) | | Value ($) | |
County of Sacramento Airport System
Revenue Bonds
Series 2009B
07/01/24 | | | 5.000 | % | | | 1,000,000 | | | | 1,104,390 | | |
Los Angeles Unified School District
Unlimited General Obligation Bonds
Election of 2005
Series 2007E (AGM)
07/01/20 | | | 5.000 | % | | | 6,230,000 | | | | 7,094,973 | | |
Manteca Unified School District
Unlimited General Obligation Bonds
Capital Appreciation-Election of 2004
Series 2006 (NPFGC)(b)
08/01/24 | | | 0.000 | % | | | 5,000,000 | | | | 2,880,400 | | |
Monrovia Unified School District
Unlimited General Obligation Refunding Bonds
Series 2005 (NPFGC)
08/01/21 | | | 5.250 | % | | | 5,600,000 | | | | 6,560,344 | | |
Oakland Unified School District
Unlimited General Obligation Bonds
Election of 2006
Series 2009A
08/01/29 | | | 6.125 | % | | | 14,500,000 | | | | 15,574,595 | | |
Orange County Public Financing Authority
Refunding Revenue Bonds
Series 2005 (NPFGC)
07/01/16 | | | 5.000 | % | | | 10,000,000 | | | | 11,124,200 | | |
Oxnard Financing Authority
Revenue Bonds
Redwood Trunk Sewer & Headworks
Series 2004A (NPFGC)
06/01/29 | | | 5.000 | % | | | 3,795,000 | | | | 3,802,400 | | |
Pico Rivera Water Authority
Revenue Bonds
Water System Project
Series 1999A (NPFGC)
05/01/29 | | | 5.500 | % | | | 3,000,000 | | | | 3,093,630 | | |
Rancho Santiago Community College District
Unlimited General Obligation Bonds
Capital Appreciation-Election of 2002
Series 2006C (AGM)(b)
09/01/31 | | | 0.000 | % | | | 28,000,000 | | | | 11,040,400 | | |
Sacramento Municipal Utility District
Revenue Bonds
Cosumnes Project
Series 2006 (NPFGC)
07/01/29 | | | 5.125 | % | | | 7,035,000 | | | | 7,284,320 | | |
San Francisco City & County Airports Commission
Revenue Bonds
Series 2010A
05/01/29 | | | 4.900 | % | | | 5,000,000 | | | | 5,245,450 | | |
Municipal Bonds (continued)
Issue
Description | | Coupon
Rate | | Principal
Amount ($) | | Value ($) | |
San Joaquin Hills Transportation Corridor Agency
Revenue Bonds
Senior Lien
Series 1993 Escrowed to Maturity(b)
01/01/25 | | | 0.000 | % | | | 22,405,000 | | | | 15,717,556 | | |
San Jose Financing Authority
Refunding Revenue Bonds
Civic Center Project
Series 2013A
06/01/29 | | | 5.000 | % | | | 14,925,000 | | | | 16,053,629 | | |
San Mateo County Community College District
Unlimited General Obligation Bonds
Capital Appreciation Election of 2005
Series 2006A (NPFGC)(b)
09/01/20 | | | 0.000 | % | | | 9,310,000 | | | | 7,863,226 | | |
Southern California Public Power Authority
Revenue Bonds
Project No. 1
Series 2007A
11/01/22 | | | 5.250 | % | | | 2,500,000 | | | | 2,774,200 | | |
Windy Point/Flats Project 1
Series 2010
07/01/28 | | | 5.000 | % | | | 10,000,000 | | | | 10,868,800 | | |
Windy Point/Windy Flats Project
Series 2010-1
07/01/30 | | | 5.000 | % | | | 15,875,000 | | | | 17,147,222 | | |
State of California
Unlimited General Obligation Bonds
Series 2002 (AMBAC)
02/01/18 | | | 6.000 | % | | | 5,000,000 | | | | 6,036,700 | | |
Various Purpose
Series 2009
04/01/22 | | | 5.250 | % | | | 1,000,000 | | | | 1,128,230 | | |
10/01/22 | | | 5.250 | % | | | 25,000,000 | | | | 28,420,000 | | |
Series 2010
03/01/25 | | | 5.000 | % | | | 1,000,000 | | | | 1,116,740 | | |
Series 2011
10/01/19 | | | 5.000 | % | | | 12,000,000 | | | | 14,227,320 | | |
09/01/31 | | | 5.000 | % | | | 15,000,000 | | | | 15,957,900 | | |
Unlimited General Obligation Refunding Bonds
Series 2009A
07/01/20 | | | 5.000 | % | | | 12,500,000 | | | | 14,729,000 | | |
07/01/21 | | | 5.250 | % | | | 1,000,000 | | | | 1,191,780 | | |
West Contra Costa Unified School District
Unlimited General Obligation Bonds
Series 2005 (NPFGC)(b)
08/01/20 | | | 0.000 | % | | | 7,285,000 | | | | 5,934,434 | | |
Total | | | | | | | 308,405,611 | | |
Colorado 2.7% | |
Baptist Road Rural Transportation Authority
Revenue Bonds
Series 2007
12/01/17 | | | 4.800 | % | | | 340,000 | | | | 329,096 | | |
The accompanying Notes to Financial Statements are an integral part of this statement.
Annual Report 2013
8
Columbia Intermediate Municipal Bond Fund
Portfolio of Investments (continued)
October 31, 2013
Municipal Bonds (continued)
Issue
Description | | Coupon
Rate | | Principal
Amount ($) | | Value ($) | |
Colorado Health Facilities Authority
Refunding Revenue Bonds
Covenant Retirement Communities
Series 2012A
12/01/27 | | | 5.000 | % | | | 4,000,000 | | | | 4,006,080 | | |
Revenue Bonds
Covenant Retirement Communities, Inc.
Series 2005
12/01/18 | | | 5.000 | % | | | 1,000,000 | | | | 1,042,560 | | |
Evangelical Lutheran
Series 2005
06/01/23 | | | 5.250 | % | | | 500,000 | | | | 521,765 | | |
Colorado Health Facilities Authority(a)
Revenue Bonds
Catholic Health Initiatives
Series 2008D-3
10/01/38 | | | 5.500 | % | | | 5,000,000 | | | | 5,498,100 | | |
Colorado State Board of Governors
Refunding Revenue Bonds
Series 2013A
03/01/31 | | | 5.000 | % | | | 4,560,000 | | | | 4,999,812 | | |
County of Adams
Refunding Revenue Bonds
Public Service Co. of Colorado Project
Series 2005A (NPFGC)
09/01/17 | | | 4.375 | % | | | 11,550,000 | | | | 12,207,888 | | |
Denver Urban Renewal Authority
Tax Allocation Bonds
Stapleton
Senior Series 2013A-1
12/01/20 | | | 5.000 | % | | | 2,700,000 | | | | 3,074,814 | | |
12/01/21 | | | 5.000 | % | | | 3,645,000 | | | | 4,126,942 | | |
E-470 Public Highway Authority
Revenue Bonds
Capital Appreciation
Senior Series 2000B (NPFGC)(b)
09/01/18 | | | 0.000 | % | | | 1,500,000 | | | | 1,298,505 | | |
North Range Metropolitan District No. 1
Limited General Obligation Refunding Bonds
Series 2007 (ACA)
12/15/15 | | | 5.000 | % | | | 365,000 | | | | 369,077 | | |
12/15/17 | | | 5.000 | % | | | 350,000 | | | | 356,661 | | |
North Range Metropolitan District No. 2
Limited Tax General Obligation Bonds
Series 2007
12/15/14 | | | 5.500 | % | | | 555,000 | | | | 554,900 | | |
Northwest Parkway Public Highway Authority
Prerefunded 06/15/16 Revenue Bonds
Capital Appreciation
Series 2001C (AMBAC)
06/15/21 | | | 5.700 | % | | | 4,000,000 | | | | 4,539,720 | | |
Municipal Bonds (continued)
Issue
Description | | Coupon
Rate | | Principal
Amount ($) | | Value ($) | |
Regional Transportation District
Certificate of Participation
Series 2010A
06/01/25 | | | 5.000 | % | | | 10,000,000 | | | | 10,831,200 | | |
University of Colorado Hospital Authority
Revenue Bonds
Series 2012-A
11/15/27 | | | 5.000 | % | | | 3,750,000 | | | | 3,991,800 | | |
Total | | | | | | | 57,748,920 | | |
Connecticut 1.2% | |
City of Bridgeport
Unlimited General Obligation Refunding Bonds
Series 2012B
08/15/18 | | | 4.000 | % | | | 5,000,000 | | | | 5,473,450 | | |
08/15/19 | | | 4.000 | % | | | 5,680,000 | | | | 6,179,783 | | |
City of West Haven
Unlimited General Obligation Bonds
Series 2012 (AGM)
08/01/19 | | | 4.000 | % | | | 2,000,000 | | | | 2,119,780 | | |
Connecticut State Development Authority
Refunding Revenue Bonds
Connecticut Light & Power Co. Project
Series 2011
09/01/28 | | | 4.375 | % | | | 3,615,000 | | | | 3,690,590 | | |
Connecticut State Health & Educational Facility Authority
Revenue Bonds
Trinity College
Series 1998F (NPFGC)
07/01/21 | | | 5.500 | % | | | 1,000,000 | | | | 1,168,200 | | |
Harbor Point Infrastructure Improvement District
Tax Allocation Bonds
Harbor Point Project
Series 2010A
04/01/22 | | | 7.000 | % | | | 6,941,000 | | | | 7,520,504 | | |
Total | | | | | | | 26,152,307 | | |
District of Columbia 1.4% | |
District of Columbia Water & Sewer Authority
Revenue Bonds
Series 2009A
10/01/24 | | | 5.000 | % | | | 1,000,000 | | | | 1,139,850 | | |
Metropolitan Washington Airports Authority
Revenue Bonds
Series 2009C
10/01/25 | | | 5.250 | % | | | 8,920,000 | | | | 10,177,096 | | |
Metropolitan Washington Airports Authority(b)
Revenue Bonds
Capital Appreciation-2nd Senior Lien
Series 2009B (AGM)
10/01/24 | | | 0.000 | % | | | 20,980,000 | | | | 12,756,259 | | |
The accompanying Notes to Financial Statements are an integral part of this statement.
Annual Report 2013
9
Columbia Intermediate Municipal Bond Fund
Portfolio of Investments (continued)
October 31, 2013
Municipal Bonds (continued)
Issue
Description | | Coupon
Rate | | Principal
Amount ($) | | Value ($) | |
10/01/25 | | | 0.000 | % | | | 7,500,000 | | | | 4,250,550 | | |
10/01/26 | | | 0.000 | % | | | 5,000,000 | | | | 2,657,050 | | |
Total | | | | | | | 30,980,805 | | |
Florida 7.0% | |
Capital Trust Agency, Inc.
Revenue Bonds
Atlantic Housing Foundation
Subordinated Series 2008B(c)
07/15/32 | | | 7.000 | % | | | 1,835,000 | | | | 825,053 | | |
Citizens Property Insurance Corp.
Revenue Bonds
Senior Secured
Series 2012A-1
06/01/20 | | | 5.000 | % | | | 10,000,000 | | | | 11,375,300 | | |
06/01/21 | | | 5.000 | % | | | 16,965,000 | | | | 19,070,526 | | |
City of Cocoa Water & Sewer
Refunding Revenue Bonds
Series 2003 (AMBAC)
10/01/19 | | | 5.500 | % | | | 1,000,000 | | | | 1,196,370 | | |
City of Lakeland
Refunding Revenue Bonds
1st Mortgage-Carpenters Accident Investor
Series 2008
01/01/19 | | | 5.875 | % | | | 1,785,000 | | | | 1,872,162 | | |
City of Tallahassee
Refunding Revenue Bonds
Series 2001 (NPFGC)
10/01/17 | | | 5.500 | % | | | 1,900,000 | | | | 2,221,594 | | |
10/01/18 | | | 5.500 | % | | | 1,000,000 | | | | 1,194,400 | | |
County of Broward
Refunding Revenue Bonds
Civic Arena Project
Series 2006A (AMBAC)
09/01/18 | | | 5.000 | % | | | 2,500,000 | | | | 2,724,350 | | |
County of Miami-Dade Aviation
Revenue Bonds
Miami International Airport
Series 2010A
10/01/25 | | | 5.500 | % | | | 6,000,000 | | | | 6,690,360 | | |
County of Miami-Dade Water & Sewer System
Refunding Revenue Bonds
System
Series 2008B (AGM)
10/01/21 | | | 5.250 | % | | | 20,000,000 | | | | 23,562,200 | | |
County of Miami-Dade
Prerefunded 04/01/15 Revenue Bonds
Series 2004 (NPFGC)
04/01/24 | | | 5.000 | % | | | 2,445,000 | | | | 2,607,152 | | |
Revenue Bonds
Transit System Sales Surtax
Series 2006 (XLCA)
07/01/19 | | | 5.000 | % | | | 5,040,000 | | | | 5,580,187 | | |
Municipal Bonds (continued)
Issue
Description | | Coupon
Rate | | Principal
Amount ($) | | Value ($) | |
Hillsborough County Industrial Development Authority
Revenue Bonds
Tampa Electric
Series 2007(a)
05/15/18 | | | 5.650 | % | | | 3,425,000 | | | | 3,987,899 | | |
Lake County School Board
Certificate of Participation
Series 2006C (AMBAC)
06/01/18 | | | 5.250 | % | | | 1,500,000 | | | | 1,736,475 | | |
Lee County Industrial Development Authority
Refunding Revenue Bonds
Shell Point/Alliance Community Project
Series 2007
11/15/22 | | | 5.000 | % | | | 7,650,000 | | | | 7,701,561 | | |
Orange County Health Facilities Authority
Refunding Revenue Bonds
Health Care-Orlando Lutheran
Series 2005
07/01/20 | | | 5.375 | % | | | 4,150,000 | | | | 4,152,033 | | |
Revenue Bonds
Series 1996A Escrowed to Maturity (NPFGC)
10/01/16 | | | 6.250 | % | | | 4,705,000 | | | | 5,232,242 | | |
Unrefunded Revenue Bonds
Series 1996A (NPFGC)
10/01/16 | | | 6.250 | % | | | 1,700,000 | | | | 1,825,834 | | |
Orange County School Board
Certificate of Participation
Series 2005A (NPFGC)
08/01/18 | | | 5.000 | % | | | 1,000,000 | | | | 1,076,700 | | |
Series 2012B
08/01/26 | | | 5.000 | % | | | 6,500,000 | | | | 7,122,180 | | |
Orlando Utilities Commission
Prerefunded 10/01/15 Revenue Bonds
Series 2005B
10/01/24 | | | 5.000 | % | | | 3,000,000 | | | | 3,265,920 | | |
Refunding Revenue Bonds
Subordinated Series 1989D Escrowed to Maturity
10/01/17 | | | 6.750 | % | | | 1,130,000 | | | | 1,280,527 | | |
Sarasota County Health Facilities Authority
Refunding Revenue Bonds
Village on the Isle Project
Series 2007
01/01/27 | | | 5.500 | % | | | 4,000,000 | | | | 4,096,720 | | |
Seminole Tribe of Florida, Inc.
Revenue Bonds
Series 2007A(d)
10/01/22 | | | 5.750 | % | | | 9,530,000 | | | | 10,100,370 | | |
State Board of Administration Finance Corp.
Revenue Bonds
Series 2008A
07/01/14 | | | 5.000 | % | | | 15,000,000 | | | | 15,481,500 | | |
The accompanying Notes to Financial Statements are an integral part of this statement.
Annual Report 2013
10
Columbia Intermediate Municipal Bond Fund
Portfolio of Investments (continued)
October 31, 2013
Municipal Bonds (continued)
Issue
Description | | Coupon
Rate | | Principal
Amount ($) | | Value ($) | |
Sterling Hill Community Development District
Special Assessment Bonds
Series 2003B(c)(e)
11/01/10 | | | 5.500 | % | | | 150,000 | | | | 96,641 | | |
Tampa Bay Water
Improvement Refunding Revenue Bonds
Series 2005 (NPFGC)
10/01/19 | | | 5.500 | % | | | 1,500,000 | | | | 1,827,075 | | |
Tampa Sports Authority
Sales Tax Revenue Bonds
Tampa Bay Arena Project
Series 1995 (NPFGC)
10/01/15 | | | 5.750 | % | | | 1,085,000 | | | | 1,116,932 | | |
10/01/20 | | | 5.750 | % | | | 1,000,000 | | | | 1,087,400 | | |
Village Center Community Development District
Revenue Bonds
Subordinated Series 2003B
01/01/18 | | | 6.350 | % | | | 1,000,000 | | | | 1,000,620 | | |
Total | | | | | | | 151,108,283 | | |
Georgia 1.6% | |
City of Atlanta Department of Aviation
Revenue Bonds
Series 2012-A
01/01/31 | | | 5.000 | % | | | 2,270,000 | | | | 2,389,516 | | |
City of Atlanta Water & Wastewater
Revenue Bonds
Series 1999A (NPFGC)
11/01/18 | | | 5.500 | % | | | 15,305,000 | | | | 18,270,191 | | |
DeKalb County Hospital Authority
Revenue Bonds
DeKalb Medical Center, Inc. Project
Series 2010
09/01/30 | | | 6.000 | % | | | 5,000,000 | | | | 5,172,000 | | |
Gwinnett County Water & Sewerage Authority
Revenue Bonds
Series 2008
08/01/19 | | | 5.000 | % | | | 1,000,000 | | | | 1,165,870 | | |
State of Georgia
Unlimited General Obligation Bonds
Series 2007G
12/01/17 | | | 5.000 | % | | | 500,000 | | | | 584,225 | | |
Series 2012A
07/01/31 | | | 4.000 | % | | | 7,550,000 | | | | 7,733,238 | | |
Total | | | | | | | 35,315,040 | | |
Hawaii 0.7% | |
Hawaii State Department of Budget & Finance
Revenue Bonds
Hawaii Pacific University
Series 2013A
07/01/20 | | | 5.000 | % | | | 870,000 | | | | 874,350 | | |
Municipal Bonds (continued)
Issue
Description | | Coupon
Rate | | Principal
Amount ($) | | Value ($) | |
07/01/23 | | | 5.750 | % | | | 1,015,000 | | | | 1,014,909 | | |
07/01/27 | | | 6.250 | % | | | 1,400,000 | | | | 1,392,230 | | |
State of Hawaii
Unlimited General Obligation Bonds
Series 2008DK
05/01/22 | | | 5.000 | % | | | 10,750,000 | | | | 12,210,065 | | |
Total | | | | | | | 15,491,554 | | |
Illinois 5.9% | |
Chicago Board of Education
Unlimited General Obligation Refunding Bonds
Dedicated Revenues
Series 2005B (AMBAC)
12/01/21 | | | 5.000 | % | | | 5,825,000 | | | | 5,910,511 | | |
Chicago Transit Authority
Revenue Bonds
Federal Transit Administration Section 5309
Series 2008A
06/01/16 | | | 5.000 | % | | | 2,500,000 | | | | 2,736,275 | | |
Series 2011
12/01/29 | | | 5.250 | % | | | 4,000,000 | | | | 4,226,240 | | |
City of Chicago O'Hare International Airport
Refunding Revenue Bonds
General Airport 3rd Lien
Series 2005B (NPFGC)
01/01/17 | | | 5.250 | % | | | 10,000,000 | | | | 11,271,200 | | |
General Senior Lien
Series 2013B
01/01/28 | | | 5.250 | % | | | 11,180,000 | | | | 11,855,160 | | |
Passenger Facility Charge
Series 2012A
01/01/28 | | | 5.000 | % | | | 2,590,000 | | | | 2,688,291 | | |
01/01/29 | | | 5.000 | % | | | 2,500,000 | | | | 2,567,275 | | |
01/01/30 | | | 5.000 | % | | | 3,000,000 | | | | 3,058,230 | | |
City of Chicago
Limited General Obligation Refunding Bonds
Emergency Telephone System
Series 1999 (NPFGC)
01/01/18 | | | 5.250 | % | | | 7,540,000 | | | | 8,320,767 | | |
Revenue Bonds
Asphalt Operating Services - Recovery Zone Facility
Series 2010
12/01/18 | | | 6.125 | % | | | 3,270,000 | | | | 3,501,058 | | |
County of Cook
Unlimited General Obligation Refunding Bonds
Series 2010A
11/15/22 | | | 5.250 | % | | | 12,000,000 | | | | 13,094,760 | | |
Illinois Finance Authority
Refunding Revenue Bonds
DePaul University
Series 2004A
10/01/17 | | | 5.375 | % | | | 1,000,000 | | | | 1,155,830 | | |
10/01/18 | | | 5.375 | % | | | 2,000,000 | | | | 2,354,040 | | |
The accompanying Notes to Financial Statements are an integral part of this statement.
Annual Report 2013
11
Columbia Intermediate Municipal Bond Fund
Portfolio of Investments (continued)
October 31, 2013
Municipal Bonds (continued)
Issue
Description | | Coupon
Rate | | Principal
Amount ($) | | Value ($) | |
Revenue Bonds
OSF Healthcare System
Series 2012A
05/15/24 | | | 4.500 | % | | | 7,350,000 | | | | 7,671,783 | | |
Illinois State Toll Highway Authority
Revenue Bonds
Senior Priority
Series 2006A-1 (AGM)
01/01/18 | | | 5.000 | % | | | 2,000,000 | | | | 2,208,860 | | |
Kendall & Kane Counties Community Unit School
District No. 115(b)
Unlimited General Obligation Bonds
Capital Appreciation
Series 2002 Escrowed to Maturity (FGIC)
01/01/17 | | | 0.000 | % | | | 600,000 | | | | 580,980 | | |
Unrefunded Unlimited General Obligation Bonds
Capital Appreciation
Series 2002 (NPFGC)
01/01/17 | | | 0.000 | % | | | 3,050,000 | | | | 2,850,286 | | |
Railsplitter Tobacco Settlement Authority
Revenue Bonds
Series 2010
06/01/19 | | | 5.000 | % | | | 5,000,000 | | | | 5,680,250 | | |
06/01/21 | | | 5.250 | % | | | 12,000,000 | | | | 13,602,240 | | |
State of Illinois
Revenue Bonds
2nd Series 2002 (NPFGC)
06/15/15 | | | 5.500 | % | | | 1,000,000 | | | | 1,081,240 | | |
Unlimited General Obligation Bonds
Series 2013
07/01/26 | | | 5.500 | % | | | 8,550,000 | | | | 9,120,541 | | |
Unlimited General Obligation Refunding Bonds
Series 2012
08/01/24 | | | 5.000 | % | | | 6,000,000 | | | | 6,300,240 | | |
State of Illinois(b)
Revenue Bonds
Capital Appreciation-Civic Center
Series 1990B (AMBAC)
12/15/17 | | | 0.000 | % | | | 5,540,000 | | | | 4,957,968 | | |
Total | | | | | | | 126,794,025 | | |
Indiana 1.6% | |
Indiana Finance Authority
Refunding Revenue Bonds
Clarian Health Obligation Group
Series 2006B
02/15/24 | | | 5.000 | % | | | 1,000,000 | | | | 1,072,340 | | |
Indiana Power & Light Co.
Series 2009B
01/01/16 | | | 4.900 | % | | | 11,000,000 | | | | 11,808,830 | | |
Revenue Bonds
1st Lien-CWA Authority
Series 2011A
10/01/25 | | | 5.250 | % | | | 1,750,000 | | | | 1,993,180 | | |
2nd Lien-CWA Authority
Series 2011B
10/01/23 | | | 5.250 | % | | | 7,035,000 | | | | 8,045,578 | | |
Municipal Bonds (continued)
Issue
Description | | Coupon
Rate | | Principal
Amount ($) | | Value ($) | |
Indiana Health & Educational Facilities Financing Authority
Revenue Bonds
Baptist Homes of Indiana
Series 2005
11/15/25 | | | 5.250 | % | | | 10,640,000 | | | | 10,833,541 | | |
Indiana Toll Road Commission
Revenue Bonds
Series 1980 Escrowed to Maturity
01/01/15 | | | 9.000 | % | | | 1,035,000 | | | | 1,096,479 | | |
Total | | | | | | | 34,849,948 | | |
Iowa 0.2% | |
City of Coralville
Tax Allocation Bonds
Tax Increment
Series 2007C
06/01/17 | | | 5.000 | % | | | 730,000 | | | | 706,961 | | |
Iowa Finance Authority
Refunding Revenue Bonds
Development-Care Initiatives Project
Series 2006A
07/01/18 | | | 5.250 | % | | | 2,695,000 | | | | 2,757,794 | | |
Revenue Bonds
Iowa State Revolving Fund
Series 2008
08/01/20 | | | 5.250 | % | | | 500,000 | | | | 588,965 | | |
Total | | | | | | | 4,053,720 | | |
Kansas 1.0% | |
City of Manhattan
Revenue Bonds
Meadowlark Hills Retirement
Series 2007A
05/15/24 | | | 5.000 | % | | | 6,000,000 | | | | 5,794,860 | | |
Kansas State Department of Transportation
Revenue Bonds
Series 2004A
03/01/18 | | | 5.500 | % | | | 11,775,000 | | | | 14,065,002 | | |
Kansas Turnpike Authority
Revenue Bonds
Series 2002 (AGM)
09/01/16 | | | 5.250 | % | | | 1,230,000 | | | | 1,392,520 | | |
Total | | | | | | | 21,252,382 | | |
Kentucky 0.8% | |
Louisville & Jefferson County Metropolitan Sewer District
Revenue Bonds
Series 2009A
05/15/21 | | | 5.000 | % | | | 7,445,000 | | | | 8,583,638 | | |
05/15/22 | | | 5.000 | % | | | 7,825,000 | | | | 8,913,927 | | |
Total | | | | | | | 17,497,565 | | |
The accompanying Notes to Financial Statements are an integral part of this statement.
Annual Report 2013
12
Columbia Intermediate Municipal Bond Fund
Portfolio of Investments (continued)
October 31, 2013
Municipal Bonds (continued)
Issue
Description | | Coupon
Rate | | Principal
Amount ($) | | Value ($) | |
Louisiana 1.0% | |
Louisiana Office Facilities Corp.
Refunding Revenue Bonds
State Capital
Series 2010A
05/01/20 | | | 5.000 | % | | | 4,290,000 | | | | 4,978,245 | | |
Louisiana Stadium & Exposition District
Refunding Revenue Bonds
Senior Series 2013-A
07/01/24 | | | 5.000 | % | | | 2,000,000 | | | | 2,245,920 | | |
Louisiana State Citizens Property Insurance Corp.
Revenue Bonds
Series 2006B (AMBAC)
06/01/16 | | | 5.000 | % | | | 500,000 | | | | 545,685 | | |
New Orleans Aviation Board
Revenue Bonds
Consolidated Rental Car
Series 2009A
01/01/25 | | | 6.000 | % | | | 4,250,000 | | | | 4,769,307 | | |
Parish of St. Charles
Revenue Bonds
Valero Energy Corp.
Series 2010(a)
12/01/40 | | | 4.000 | % | | | 9,245,000 | | | | 9,225,493 | | |
Total | | | | | | | 21,764,650 | | |
Maryland 0.9% | |
Howard County Housing Commission
Revenue Bonds
Series 2012-A(a)
07/01/34 | | | 1.330 | % | | | 15,000,000 | | | | 15,111,000 | | |
Maryland State Department of Transportation
Revenue Bonds
Series 2002
02/01/15 | | | 5.500 | % | | | 3,750,000 | | | | 3,998,212 | | |
Total | | | | | | | 19,109,212 | | |
Massachusetts 5.1% | |
Commonwealth of Massachusetts
Limited General Obligation Bonds
Consolidated Loan
Series 2002D (AMBAC/TCRS/BNY)
08/01/18 | | | 5.500 | % | | | 6,500,000 | | | | 7,863,635 | | |
Limited General Obligation Refunding Bonds
Series 2003D
10/01/17 | | | 5.500 | % | | | 5,000,000 | | | | 5,899,550 | | |
Revenue Bonds
Consolidated Loan
Series 2005A (AGM)
06/01/16 | | | 5.500 | % | | | 13,615,000 | | | | 15,347,509 | | |
Municipal Bonds (continued)
Issue
Description | | Coupon
Rate | | Principal
Amount ($) | | Value ($) | |
Unlimited General Obligation Bonds
Consolidated Loan
Series 1998C
08/01/17 | | | 5.250 | % | | | 1,775,000 | | | | 2,065,922 | | |
Unlimited General Obligation Refunding Bonds
Series 2004C (AGM)
12/01/16 | | | 5.500 | % | | | 10,000,000 | | | | 11,489,600 | | |
Massachusetts Bay Transportation Authority
Unrefunded Revenue Bonds
General Transportation
Series 1991 (NPFGC)
03/01/21 | | | 7.000 | % | | | 2,395,000 | | | | 3,024,885 | | |
Massachusetts Development Finance Agency
Revenue Bonds
1st Mortgage-Orchard Cove
Series 2007
10/01/17 | | | 5.000 | % | | | 570,000 | | | | 577,655 | | |
Massachusetts Health & Educational Facilities Authority
Revenue Bonds
Boston College
Series 2008M-1
06/01/24 | | | 5.500 | % | | | 2,670,000 | | | | 3,227,336 | | |
Caregroup
Series 2008E-2
07/01/20 | | | 5.375 | % | | | 9,720,000 | | | | 10,956,092 | | |
07/01/22 | | | 5.375 | % | | | 13,345,000 | | | | 15,042,084 | | |
Harvard University
Series 2009A
11/15/19 | | | 5.250 | % | | | 1,000,000 | | | | 1,191,950 | | |
Massachusetts Institute of Technology
Series 2009O
07/01/26 | | | 5.000 | % | | | 500,000 | | | | 575,600 | | |
Massachusetts Port Authority
Refunding Revenue Bonds
Passenger Facility Charge
Series 2007D (AGM)
07/01/17 | | | 5.000 | % | | | 8,500,000 | | | | 9,639,000 | | |
Revenue Bonds
Series 2010A
07/01/25 | | | 5.000 | % | | | 1,500,000 | | | | 1,694,745 | | |
Massachusetts Water Pollution Abatement Trust (The)
Refunding Revenue Bonds
Pool Program
Series 2004A
08/01/17 | | | 5.250 | % | | | 2,920,000 | | | | 3,407,144 | | |
Revenue Bonds
MWRA Program
Subordinated Series 1999A
08/01/19 | | | 6.000 | % | | | 2,500,000 | | | | 3,115,950 | | |
State Revolving Fund
Series 2009-14
08/01/24 | | | 5.000 | % | | | 12,530,000 | | | | 14,448,343 | | |
Total | | | | | | | 109,567,000 | | |
The accompanying Notes to Financial Statements are an integral part of this statement.
Annual Report 2013
13
Columbia Intermediate Municipal Bond Fund
Portfolio of Investments (continued)
October 31, 2013
Municipal Bonds (continued)
Issue
Description | | Coupon
Rate | | Principal
Amount ($) | | Value ($) | |
Michigan 1.3% | |
City of Detroit Sewage Disposal System
Refunding Revenue Bonds
Senior Lien
Series 2012A
07/01/26 | | | 5.250 | % | | | 2,000,000 | | | | 1,905,560 | | |
07/01/27 | | | 5.250 | % | | | 1,500,000 | | | | 1,418,685 | | |
Detroit City School District
Unlimited General Obligation Bonds
School Building & Site Improvement
Series 2002A (FGIC) (Qualified School Bond Loan Fund)
05/01/19 | | | 6.000 | % | | | 2,000,000 | | | | 2,330,880 | | |
Saginaw Hospital Finance Authority
Refunding Revenue Bonds
Covenant Medical Center
Series 2004G
07/01/22 | | | 5.125 | % | | | 10,000,000 | | | | 10,205,700 | | |
State of Michigan Trunk Line
Refunding Revenue Bonds
Series 1998A
11/01/16 | | | 5.500 | % | | | 2,000,000 | | | | 2,274,340 | | |
Series 2005 (AGM)
11/01/17 | | | 5.250 | % | | | 5,050,000 | | | | 5,867,494 | | |
Revenue Bonds
Series 2011
11/15/27 | | | 5.000 | % | | | 1,000,000 | | | | 1,092,760 | | |
11/15/28 | | | 5.000 | % | | | 1,000,000 | | | | 1,084,600 | | |
11/15/29 | | | 5.000 | % | | | 1,205,000 | | | | 1,297,423 | | |
State of Michigan
Unlimited General Obligation Refunding Bonds
Series 2001
12/01/15 | | | 5.500 | % | | | 1,250,000 | | | | 1,378,850 | | |
Total | | | | | | | 28,856,292 | | |
Minnesota 0.1% | |
City of Minneapolis
Revenue Bonds
Fairview Health Services
Series 2008A
11/15/18 | | | 6.000 | % | | | 1,000,000 | | | | 1,114,700 | | |
City of St. Louis Park
Revenue Bonds
Park Nicollet Health Services
Series 2008C
07/01/23 | | | 5.500 | % | | | 750,000 | | | | 805,838 | | |
State of Minnesota
Unlimited General Obligation Bonds
Series 2008C
08/01/19 | | | 5.000 | % | | | 500,000 | | | | 598,495 | | |
Total | | | | | | | 2,519,033 | | |
Municipal Bonds (continued)
Issue
Description | | Coupon
Rate | | Principal
Amount ($) | | Value ($) | |
Missouri 1.3% | |
City of St. Louis
Refunding Revenue Bonds
Lambert International Airport
Series 2007A (AGM)
07/01/21 | | | 5.000 | % | | | 5,000,000 | | | | 5,538,150 | | |
Missouri Highway & Transportation Commission
Revenue Bonds
2nd Lien
Series 2007
05/01/17 | | | 5.000 | % | | | 1,000,000 | | | | 1,147,450 | | |
Missouri Joint Municipal Electric Utility Commission
Revenue Bonds
IATAN 2 Project
Series 2009A
01/01/17 | | | 4.500 | % | | | 1,000,000 | | | | 1,106,170 | | |
Missouri State Environmental Improvement & Energy
Resources Authority
Revenue Bonds
State Revolving Funds Program
Series 2004B
01/01/18 | | | 5.250 | % | | | 7,470,000 | | | | 8,805,935 | | |
Missouri State Health & Educational Facilities Authority
Revenue Bonds
St. Louis University
Series 1998
10/01/16 | | | 5.500 | % | | | 1,000,000 | | | | 1,139,570 | | |
Washington University
Series 2008A
03/15/18 | | | 5.250 | % | | | 1,000,000 | | | | 1,185,030 | | |
Poplar Bluff Regional Transportation Development
District
Revenue Bonds
Series 2012
12/01/26 | | | 3.250 | % | | | 1,250,000 | | | | 1,157,812 | | |
St. Louis County Industrial Development Authority
Revenue Bonds
St. Andrews Residence for Seniors
Series 2007A
12/01/26 | | | 6.250 | % | | | 7,000,000 | | | | 7,002,030 | | |
Total | | | | | | | 27,082,147 | | |
Nebraska 0.1% | |
Municipal Energy Agency of Nebraska
Refunding Revenue Bonds
Series 2009A (BHAC)
04/01/21 | | | 5.000 | % | | | 750,000 | | | | 852,998 | | |
Nebraska Public Power District
Revenue Bonds
Series 2008B
01/01/20 | | | 5.000 | % | | | 570,000 | | | | 648,050 | | |
The accompanying Notes to Financial Statements are an integral part of this statement.
Annual Report 2013
14
Columbia Intermediate Municipal Bond Fund
Portfolio of Investments (continued)
October 31, 2013
Municipal Bonds (continued)
Issue
Description | | Coupon
Rate | | Principal
Amount ($) | | Value ($) | |
University of Nebraska
Revenue Bonds
Lincoln Student Fees & Facilities
Series 2009A
07/01/23 | | | 5.000 | % | | | 700,000 | | | | 789,733 | | |
Total | | | | | | | 2,290,781 | | |
Nevada 1.3% | |
Carson City
Refunding Revenue Bonds
Carson Tahoe Regional Medical Center
Series 2012
09/01/27 | | | 5.000 | % | | | 3,250,000 | | | | 3,304,730 | | |
City of Sparks
Revenue Bonds
Senior Sales Tax Anticipation
Series 2008A(d)
06/15/20 | | | 6.500 | % | | | 5,005,000 | | | | 5,173,468 | | |
County of Clark Airport System
Revenue Bonds
System Subordinated Lien
Series 2009C (AGM)
07/01/25 | | | 5.000 | % | | | 8,190,000 | | | | 8,999,418 | | |
County of Clark
Limited General Obligation Refunding Bonds
Transportation
Series 2009A
12/01/28 | | | 5.000 | % | | | 10,740,000 | | | | 11,439,818 | | |
Total | | | | | | | 28,917,434 | | |
New Hampshire 0.8% | |
New Hampshire Health and Education Facilities Authority Act
Revenue Bonds
Southern New Hampshire Medical Center
Series 2007A
10/01/23 | | | 5.250 | % | | | 7,000,000 | | | | 7,422,800 | | |
University System
Series 2009A
07/01/23 | | | 5.000 | % | | | 8,370,000 | | | | 9,261,489 | | |
Total | | | | | | | 16,684,289 | | |
New Jersey 5.2% | |
Atlantic City
Unlimited General Obligation Bonds
Series 2008A
02/15/18 | | | 5.500 | % | | | 500,000 | | | | 566,730 | | |
Cape May County Municipal Utilities Authority
Refunding Revenue Bonds
Series 2002A (AGM)
01/01/16 | | | 5.750 | % | | | 1,000,000 | | | | 1,113,680 | | |
Municipal Bonds (continued)
Issue
Description | | Coupon
Rate | | Principal
Amount ($) | | Value ($) | |
City of Newark
Unlimited General Obligation Refunding Bonds
General Improvement
Series 2010A
10/01/18 | | | 4.000 | % | | | 1,000,000 | | | | 1,093,930 | | |
County of Passaic
Unlimited General Obligation Refunding Bonds
Series 2003 (AGM)
09/01/16 | | | 5.200 | % | | | 1,500,000 | | | | 1,687,050 | | |
East Orange Board of Education
Certificate of Participation
Capital Appreciation
Series 1998 (AGM)(b)
02/01/18 | | | 0.000 | % | | | 1,000,000 | | | | 893,630 | | |
Essex County Improvement Authority
Refunding Revenue Bonds
County Guaranteed Project Consolidation
Series 2004 (NPFGC)
10/01/26 | | | 5.500 | % | | | 750,000 | | | | 894,855 | | |
Freehold Regional High School District
Unlimited General Obligation Refunding Bonds
Series 2001 (NPFGC)
03/01/20 | | | 5.000 | % | | | 1,205,000 | | | | 1,424,153 | | |
Hudson County Improvement Authority
Refunding Revenue Bonds
Hudson County Lease Project
Series 2010 (AGM)
10/01/24 | | | 5.375 | % | | | 2,000,000 | | | | 2,340,720 | | |
Jersey City Municipal Utilities Authority
Refunding Revenue Bonds
Series 2007 (NPFGC)
01/01/19 | | | 5.250 | % | | | 1,000,000 | | | | 1,129,370 | | |
Manalapan-Englishtown Regional Board Of Education
Unlimited General Obligation Refunding Bonds
Series 2004 (NPFGC)
12/01/20 | | | 5.750 | % | | | 1,325,000 | | | | 1,659,297 | | |
Middlesex County Improvement Authority
Revenue Bonds
Heldrich Center Hotel
Senior Series 2005A
01/01/20 | | | 5.000 | % | | | 815,000 | | | | 586,393 | | |
New Jersey Economic Development Authority
Refunding Revenue Bonds
New Jersey American Water Co.
Series 2010A
06/01/23 | | | 4.450 | % | | | 1,000,000 | | | | 1,074,170 | | |
School Facilities-Construction
Series 2005K (AMBAC)
12/15/20 | | | 5.250 | % | | | 16,710,000 | | | | 19,784,807 | | |
Series 2009AA
12/15/20 | | | 5.250 | % | | | 1,000,000 | | | | 1,160,370 | | |
The accompanying Notes to Financial Statements are an integral part of this statement.
Annual Report 2013
15
Columbia Intermediate Municipal Bond Fund
Portfolio of Investments (continued)
October 31, 2013
Municipal Bonds (continued)
Issue
Description | | Coupon
Rate | | Principal
Amount ($) | | Value ($) | |
Revenue Bonds
Cigarette Tax
Series 2004
06/15/15 | | | 5.375 | % | | | 4,000,000 | | | | 4,328,680 | | |
06/15/16 | | | 5.500 | % | | | 5,500,000 | | | | 6,215,165 | | |
Liberty State Park Project
Series 2005C (AGM)
03/01/19 | | | 5.000 | % | | | 2,000,000 | | | | 2,112,420 | | |
MSU Student Housing Project
Series 2010
06/01/21 | | | 5.000 | % | | | 1,000,000 | | | | 1,103,640 | | |
Newark Downtown District Management Corp.
Series 2007
06/15/27 | | | 5.125 | % | | | 400,000 | | | | 405,048 | | |
New Jersey Economic Development Authority(b)
Revenue Bonds
Capital Appreciation-Motor Vehicle Surcharges
Series 2004 (NPFGC)
07/01/21 | | | 0.000 | % | | | 1,255,000 | | | | 949,307 | | |
New Jersey Educational Facilities Authority
Refunding Revenue Bonds
Rowan University
Series 2008B (AGM)
07/01/23 | | | 5.000 | % | | | 750,000 | | | | 830,212 | | |
New Jersey Health Care Facilities Financing Authority
Revenue Bonds
Children's Specialized Hospital
Series 2005A
07/01/18 | | | 5.000 | % | | | 575,000 | | | | 601,922 | | |
New Jersey Higher Education Student Assistance Authority
Refunding Revenue Bonds
Series 2010-1A
12/01/18 | | | 4.300 | % | | | 680,000 | | | | 735,706 | | |
12/01/25 | | | 5.000 | % | | | 935,000 | | | | 986,472 | | |
New Jersey Housing & Mortgage Finance Agency
Revenue Bonds
Series 2008AA
10/01/28 | | | 6.375 | % | | | 250,000 | | | | 262,375 | | |
New Jersey State Turnpike Authority
Revenue Bonds
Series 1989 Escrowed to Maturity
01/01/19 | | | 6.000 | % | | | 1,000,000 | | | | 1,213,120 | | |
New Jersey Transit Corp.
Certificate of Participation
Federal Transit Administration Grants
Series 2002A (AMBAC)
09/15/15 | | | 5.500 | % | | | 4,000,000 | | | | 4,341,880 | | |
Subordinated Series 2005A (NPFGC)
09/15/17 | | | 5.000 | % | | | 1,000,000 | | | | 1,125,000 | | |
New Jersey Transportation Trust Fund Authority
Revenue Bonds
Transportation System
Series 2001C (AGM)
12/15/18 | | | 5.500 | % | | | 2,000,000 | | | | 2,392,040 | | |
Municipal Bonds (continued)
Issue
Description | | Coupon
Rate | | Principal
Amount ($) | | Value ($) | |
Series 2003A (AMBAC)
12/15/15 | | | 5.500 | % | | | 4,360,000 | | | | 4,823,294 | | |
Series 2006A
12/15/20 | | | 5.250 | % | | | 1,000,000 | | | | 1,179,710 | | |
12/15/21 | | | 5.500 | % | | | 680,000 | | | | 811,872 | | |
Series 2006A (AGM)
12/15/21 | | | 5.500 | % | | | 4,700,000 | | | | 5,626,746 | | |
12/15/22 | | | 5.250 | % | | | 4,000,000 | | | | 4,732,680 | | |
Series 2010D
12/15/23 | | | 5.250 | % | | | 25,000,000 | | | | 29,317,500 | | |
Robbinsville Board of Education
Unlimited General Obligation Refunding Bonds
Series 2005 (AGM)
01/01/28 | | | 5.250 | % | | | 500,000 | | | | 592,740 | | |
State of New Jersey
Certificate of Participation
Equipment Lease Purchase
Series 2008A
06/15/23 | | | 5.000 | % | | | 1,000,000 | | | | 1,086,800 | | |
Series 2009A
06/15/17 | | | 5.000 | % | | | 1,000,000 | | | | 1,135,720 | | |
Total | | | | | | | 112,319,204 | | |
New Mexico 0.2% | |
County of Bernalillo
Refunding Revenue Bonds
Series 1998
04/01/27 | | | 5.250 | % | | | 3,000,000 | | | | 3,519,720 | | |
New York 12.7% | |
Albany Industrial Development Agency
Revenue Bonds
St. Peters Hospital Project
Series 2008A
11/15/16 | | | 5.250 | % | | | 1,750,000 | | | | 1,972,355 | | |
11/15/17 | | | 5.250 | % | | | 1,250,000 | | | | 1,439,663 | | |
City of New York
Unlimited General Obligation Bonds
Series 2007D-1
12/01/21 | | | 5.000 | % | | | 5,900,000 | | | | 6,737,505 | | |
Subordinated Series 2008B-1
09/01/22 | | | 5.250 | % | | | 7,200,000 | | | | 8,271,432 | | |
Unlimited General Obligation Refunding Bonds
Series 2005G
08/01/20 | | | 5.000 | % | | | 10,000,000 | | | | 10,931,300 | | |
Metropolitan Transportation Authority
Revenue Bonds
Commuter Facilities
Series 1993O Escrowed to Maturity
07/01/17 | | | 5.500 | % | | | 3,000,000 | | | | 3,464,910 | | |
Series 2004A (NPFGC)
11/15/16 | | | 5.250 | % | | | 3,000,000 | | | | 3,408,150 | | |
11/15/17 | | | 5.250 | % | | | 4,000,000 | | | | 4,679,760 | | |
The accompanying Notes to Financial Statements are an integral part of this statement.
Annual Report 2013
16
Columbia Intermediate Municipal Bond Fund
Portfolio of Investments (continued)
October 31, 2013
Municipal Bonds (continued)
Issue
Description | | Coupon
Rate | | Principal
Amount ($) | | Value ($) | |
Series 2007A (AGM)
11/15/20 | | | 5.000 | % | | | 5,000,000 | | | | 5,645,550 | | |
11/15/21 | | | 5.000 | % | | | 3,000,000 | | | | 3,374,850 | | |
Series 2009A
11/15/26 | | | 5.300 | % | | | 710,000 | | | | 793,283 | | |
Series 2012E
11/15/28 | | | 5.000 | % | | | 4,000,000 | | | | 4,307,120 | | |
Nassau County Local Economic Assistance Corp.
Refunding Revenue Bonds
Catholic Health Services
Series 2011
07/01/19 | | | 5.000 | % | | | 6,125,000 | | | | 7,033,950 | | |
07/01/20 | | | 5.000 | % | | | 9,390,000 | | | | 10,773,429 | | |
New York City Transitional Finance Authority
Revenue Bonds
Future Tax Secured
Series 2009A-1
05/01/27 | | | 5.000 | % | | | 10,430,000 | | | | 11,693,907 | | |
Subordinated Series 2007C-1
11/01/20 | | | 5.000 | % | | | 10,300,000 | | | | 11,828,005 | | |
Unrefunded Revenue Bonds
Future Tax Secured
Series 2004
02/01/18 | | | 5.250 | % | | | 5,000 | | | | 5,060 | | |
New York State Dormitory Authority
Refunding Revenue Bonds
Consolidated Service Contract
Series 2009A
07/01/24 | | | 5.000 | % | | | 3,500,000 | | | | 3,950,555 | | |
Revenue Bonds
City University System
Series 1995A (AMBAC/TCRS)
07/01/16 | | | 5.625 | % | | | 1,235,000 | | | | 1,320,129 | | |
Series 1995A (FGIC)
07/01/16 | | | 5.625 | % | | | 4,930,000 | | | | 5,269,825 | | |
Court Facilities Lease
Series 2005A (AMBAC)
05/15/18 | | | 5.250 | % | | | 6,000,000 | | | | 7,018,320 | | |
Mount Sinai School of Medicine
Series 2009
07/01/26 | | | 5.500 | % | | | 14,635,000 | | | | 15,962,248 | | |
07/01/27 | | | 5.500 | % | | | 10,675,000 | | | | 11,535,298 | | |
North Shore-Long Island Jewish Obligation Group
Series 2009A
05/01/30 | | | 5.250 | % | | | 4,750,000 | | | | 4,947,695 | | |
St. Johns University
Series 2007C (NPFGC)
07/01/23 | | | 5.250 | % | | | 3,245,000 | | | | 3,807,553 | | |
State University Educational Facilities
3rd General Series 2005A (NPFGC)
05/15/17 | | | 5.500 | % | | | 10,000,000 | | | | 11,600,700 | | |
05/15/22 | | | 5.500 | % | | | 6,730,000 | | | | 8,158,106 | | |
Series 1993A
05/15/15 | | | 5.250 | % | | | 5,850,000 | | | | 6,089,090 | | |
Upstate Community-State Supported
Series 2005B (NPFGC)
07/01/21 | | | 5.500 | % | | | 6,345,000 | | | | 7,619,013 | | |
Municipal Bonds (continued)
Issue
Description | | Coupon
Rate | | Principal
Amount ($) | | Value ($) | |
New York State Thruway Authority
Revenue Bonds
2nd General Series 2005B (AMBAC)
04/01/20 | | | 5.500 | % | | | 10,840,000 | | | | 13,172,226 | | |
2nd General Series 2007B
04/01/19 | | | 5.000 | % | | | 5,000,000 | | | | 5,726,450 | | |
General Revenue
Series 2012I
01/01/24 | | | 5.000 | % | | | 8,500,000 | | | | 9,716,265 | | |
Series 2007H (NPFGC)
01/01/23 | | | 5.000 | % | | | 1,500,000 | | | | 1,684,755 | | |
New York State Urban Development Corp.
Refunding Revenue Bonds
Service Contract
Series 2008B
01/01/19 | | | 5.000 | % | | | 4,000,000 | | | | 4,620,800 | | |
01/01/20 | | | 5.000 | % | | | 10,460,000 | | | | 11,970,633 | | |
Revenue Bonds
State Personal Income Tax-State Facilities
Series 2004A-2 (NPFGC)
03/15/20 | | | 5.500 | % | | | 29,450,000 | | | | 35,901,317 | | |
Port Authority of New York & New Jersey
Revenue Bonds
Consolidated 154th
Series 2009
09/01/26 | | | 4.750 | % | | | 1,000,000 | | | | 1,078,450 | | |
Triborough Bridge & Tunnel Authority
Prerefunded 11/15/18 Revenue Bonds
Subordinated Series 2008D
11/15/22 | | | 5.000 | % | | | 6,165,000 | | | | 7,343,008 | | |
Total | | | | | | | 274,852,665 | | |
North Carolina 1.9% | |
Albemarle Hospital Authority
Refunding Revenue Bonds
Series 2007
10/01/21 | | | 5.250 | % | | | 3,000,000 | | | | 3,007,230 | | |
10/01/27 | | | 5.250 | % | | | 3,700,000 | | | | 3,480,331 | | |
Cape Fear Public Utility Authority
Revenue Bonds
Series 2008
08/01/20 | | | 5.000 | % | | | 800,000 | | | | 920,040 | | |
City of Charlotte Water & Sewer System
Revenue Bonds
Water & Sewer
Series 2008
07/01/26 | | | 5.000 | % | | | 1,250,000 | | | | 1,430,525 | | |
County of Iredell
Certificate of Participation
Iredell County School Project
Series 2008 (AGM)
06/01/17 | | | 5.250 | % | | | 1,710,000 | | | | 1,951,674 | | |
The accompanying Notes to Financial Statements are an integral part of this statement.
Annual Report 2013
17
Columbia Intermediate Municipal Bond Fund
Portfolio of Investments (continued)
October 31, 2013
Municipal Bonds (continued)
Issue
Description | | Coupon
Rate | | Principal
Amount ($) | | Value ($) | |
North Carolina Eastern Municipal Power Agency
Refunding Revenue Bonds
Series 2008A (AGM)
01/01/19 | | | 5.250 | % | | | 5,415,000 | | | | 6,227,358 | | |
Revenue Bonds
Series 2009B
01/01/26 | | | 5.000 | % | | | 21,105,000 | | | | 22,764,275 | | |
North Carolina Medical Care Commission
Revenue Bonds
Health Care Housing-Arc Projects
Series 2004A
10/01/24 | | | 5.500 | % | | | 1,575,000 | | | | 1,618,817 | | |
Total | | | | | | | 41,400,250 | | |
Ohio 1.7% | |
American Municipal Power, Inc.
Revenue Bonds
AMP Fremont Energy Center Project
Series 2012
02/15/24 | | | 5.000 | % | | | 2,000,000 | | | | 2,242,820 | | |
Prairie State Energy Campus Project
Series 2008A
02/15/20 | | | 5.250 | % | | | 4,060,000 | | | | 4,589,871 | | |
02/15/22 | | | 5.250 | % | | | 9,810,000 | | | | 10,983,963 | | |
City of Cleveland
Limited General Obligation Refunding Bonds
Series 2005 (AMBAC)
10/01/16 | | | 5.500 | % | | | 7,710,000 | | | | 8,723,788 | | |
Mason City School District
Unlimited General Obligation Refunding Bonds
Series 2005 (NPFGC)
12/01/19 | | | 5.250 | % | | | 2,250,000 | | | | 2,716,942 | | |
Ohio State Turnpike Commission
Refunding Revenue Bonds
Series 1998A (NPFGC)
02/15/21 | | | 5.500 | % | | | 2,000,000 | | | | 2,416,200 | | |
State of Ohio
Refunding Revenue Bonds
Cleveland Clinic Health System
Series 2011
01/01/25 | | | 5.000 | % | | | 3,750,000 | | | | 4,156,275 | | |
Total | | | | | | | 35,829,859 | | |
Oklahoma 0.1% | |
Chickasaw Nation
Revenue Bonds
Health System
Series 2007(d)
12/01/17 | | | 5.375 | % | | | 2,455,000 | | | | 2,619,878 | | |
Municipal Bonds (continued)
Issue
Description | | Coupon
Rate | | Principal
Amount ($) | | Value ($) | |
Oregon 0.2% | |
Oregon State Lottery
Revenue Bonds
Series 2009A
04/01/24 | | | 5.250 | % | | | 1,000,000 | | | | 1,163,630 | | |
Yamhill Clackamas & Washington Counties School
District No. 29J Newberg
Unlimited General Obligation Refunding Bonds
Series 2005 (NPFGC)
06/15/17 | | | 5.500 | % | | | 2,500,000 | | | | 2,913,975 | | |
Total | | | | | | | 4,077,605 | | |
Pennsylvania 3.7% | |
City of Philadelphia
Unlimited General Obligation Bonds
Series 2011
08/01/19 | | | 5.250 | % | | | 3,795,000 | | | | 4,393,737 | | |
Commonwealth of Pennsylvania
Unlimited General Obligation Refunding Bonds
Series 2002
02/01/15 | | | 5.500 | % | | | 3,000,000 | | | | 3,197,400 | | |
Series 2004 (AGM)
07/01/18 | | | 5.375 | % | | | 12,000,000 | | | | 14,363,880 | | |
Series 2004 (NPFGC)
07/01/16 | | | 5.375 | % | | | 10,000,000 | | | | 11,298,300 | | |
County of Westmoreland
Unlimited General Obligation Bonds
Capital Appreciation
Series 1997 Escrowed to Maturity (NPFGC)(b)
12/01/18 | | | 0.000 | % | | | 1,000,000 | | | | 863,550 | | |
Delaware River Port Authority
Refunding Revenue Bonds
Port District Project
Series 2012
01/01/27 | | | 5.000 | % | | | 1,835,000 | | | | 1,836,211 | | |
Delaware Valley Regional Financial Authority
Revenue Bonds
Series 1997B (AMBAC)
07/01/17 | | | 5.600 | % | | | 2,000,000 | | | | 2,242,020 | | |
Series 2002
07/01/17 | | | 5.750 | % | | | 2,000,000 | | | | 2,256,700 | | |
Elizabeth Forward School District
Unlimited General Obligation Bonds
Capital Appreciation
Series 1994B Escrowed to Maturity (NPFGC)(b)
09/01/21 | | | 0.000 | % | | | 2,210,000 | | | | 1,818,675 | | |
Northampton County General Purpose Authority
Revenue Bonds
Saint Luke's Hospital Project
Series 2008A
08/15/20 | | | 5.000 | % | | | 3,480,000 | | | | 3,786,205 | | |
08/15/21 | | | 5.125 | % | | | 3,715,000 | | | | 4,025,166 | | |
08/15/22 | | | 5.250 | % | | | 1,965,000 | | | | 2,122,180 | | |
The accompanying Notes to Financial Statements are an integral part of this statement.
Annual Report 2013
18
Columbia Intermediate Municipal Bond Fund
Portfolio of Investments (continued)
October 31, 2013
Municipal Bonds (continued)
Issue
Description | | Coupon
Rate | | Principal
Amount ($) | | Value ($) | |
Pennsylvania Turnpike Commission
Revenue Bonds
Subordinated Series 2011A
12/01/31 | | | 5.625 | % | | | 8,150,000 | | | | 8,736,230 | | |
Pennsylvania Turnpike Commission(a)
Revenue Bonds
Capital Appreciation
Subordinated Series 2010B-2
12/01/24 | | | 0.000 | % | | | 20,000,000 | | | | 19,694,400 | | |
Total | | | | | | | 80,634,654 | | |
Puerto Rico 0.5% | |
Commonwealth of Puerto Rico
Unlimited General Obligation Public Improvement Bonds
Series 2006B(f)
07/01/16 | | | 5.250 | % | | | 5,000,000 | | | | 4,669,000 | | |
Puerto Rico Electric Power Authority
Refunding Revenue Bonds
Series 2010ZZ(f)
07/01/17 | | | 5.000 | % | | | 4,000,000 | | | | 3,554,760 | | |
Puerto Rico Highways & Transportation Authority
Refunding Revenue Bonds
Series 2005L (CIFG/TCRS/AGM)(f)
07/01/18 | | | 5.250 | % | | | 2,000,000 | | | | 1,980,000 | | |
Total | | | | | | | 10,203,760 | | |
Rhode Island 2.4% | |
City of Cranston
Unlimited General Obligation Bonds
Series 2008 (AGM)
07/01/26 | | | 4.750 | % | | | 900,000 | | | | 937,404 | | |
07/01/27 | | | 4.750 | % | | | 945,000 | | | | 981,609 | | |
Providence Housing Authority
Revenue Bonds
Capital Fund
Series 2008
09/01/24 | | | 5.000 | % | | | 565,000 | | | | 615,709 | | |
09/01/26 | | | 5.000 | % | | | 310,000 | | | | 332,921 | | |
09/01/27 | | | 5.000 | % | | | 690,000 | | | | 733,905 | | |
Rhode Island Convention Center Authority
Refunding Revenue Bonds
Series 2005A (AGM)
05/15/22 | | | 5.000 | % | | | 3,525,000 | | | | 3,714,997 | | |
05/15/23 | | | 5.000 | % | | | 5,905,000 | | | | 6,212,178 | | |
Rhode Island Depositors Economic Protection Corp.
Revenue Bonds
Series 1993A Escrowed to Maturity (AGM)
08/01/21 | | | 5.750 | % | | | 2,165,000 | | | | 2,699,928 | | |
Municipal Bonds (continued)
Issue
Description | | Coupon
Rate | | Principal
Amount ($) | | Value ($) | |
Rhode Island Economic Development Corp.
Revenue Bonds
East Greenwich Free Library Association
Series 2004
06/15/14 | | | 4.500 | % | | | 100,000 | | | | 100,282 | | |
06/15/24 | | | 5.750 | % | | | 415,000 | | | | 409,240 | | |
Grant Anticipation-Department of Transportation
Series 2009A (AGM)
06/15/21 | | | 5.250 | % | | | 2,000,000 | | | | 2,261,400 | | |
Providence Place Mall
Series 2000
07/01/20 | | | 6.125 | % | | | 1,375,000 | | | | 1,336,404 | | |
Series 2008C (AGM)
07/01/17 | | | 5.000 | % | | | 2,245,000 | | | | 2,511,526 | | |
Rhode Island Health & Educational Building Corp.
Prerefunded 08/15/14 Revenue Bonds
Higher Education Facility
Series 2004D (XLCA)
08/15/17 | | | 5.500 | % | | | 1,345,000 | | | | 1,401,329 | | |
Refunding Revenue Bonds
Hospital Financing-Lifespan Obligation
Series 2006A (AGM)
05/15/26 | | | 5.000 | % | | | 2,000,000 | | | | 2,064,900 | | |
University of Rhode Island
Series 2008A
09/15/28 | | | 6.500 | % | | | 3,000,000 | | | | 3,460,770 | | |
Revenue Bonds
Bond Financing Program
Series 2009
05/15/25 | | | 5.000 | % | | | 1,515,000 | | | | 1,690,922 | | |
Brown University
Series 2007
09/01/18 | | | 5.000 | % | | | 1,000,000 | | | | 1,146,650 | | |
Higher Education-Johnson & Wales
Series 1999 (NPFGC)
04/01/17 | | | 5.500 | % | | | 1,000,000 | | | | 1,130,790 | | |
04/01/18 | | | 5.500 | % | | | 1,420,000 | | | | 1,633,327 | | |
Hospital Financing-Lifespan Obligation
Series 2009A (AGM)
05/15/27 | | | 6.125 | % | | | 400,000 | | | | 445,184 | | |
05/15/30 | | | 6.250 | % | | | 500,000 | | | | 548,365 | | |
New England Institute of Technology
Series 2010
03/01/24 | | | 5.000 | % | | | 1,145,000 | | | | 1,250,832 | | |
Providence Public Schools Financing Program
Series 2006A (AGM)
05/15/23 | | | 5.000 | % | | | 2,000,000 | | | | 2,070,260 | | |
Series 2007A (AGM)
05/15/22 | | | 5.000 | % | | | 2,000,000 | | | | 2,137,780 | | |
Series 2007C (AGM)
05/15/21 | | | 5.000 | % | | | 1,500,000 | | | | 1,629,405 | | |
Public Schools Financing Program
Series 2007B (AMBAC)
05/15/19 | | | 4.250 | % | | | 250,000 | | | | 237,883 | | |
University of Rhode Island
Series 2009A (AGM)
09/15/24 | | | 4.750 | % | | | 1,000,000 | | | | 1,083,420 | | |
The accompanying Notes to Financial Statements are an integral part of this statement.
Annual Report 2013
19
Columbia Intermediate Municipal Bond Fund
Portfolio of Investments (continued)
October 31, 2013
Municipal Bonds (continued)
Issue
Description | | Coupon
Rate | | Principal
Amount ($) | | Value ($) | |
Rhode Island Student Loan Authority
Revenue Bonds
Program
Senior Series 2010A
12/01/20 | | | 4.600 | % | | | 885,000 | | | | 936,799 | | |
State of Rhode Island
Certificate of Participation
Lease-Training School Project
Series 2005A (NPFGC)
10/01/19 | | | 5.000 | % | | | 1,200,000 | | | | 1,305,768 | | |
Unlimited General Obligation Bonds
Consolidated Capital Development Loan
Series 2006C (NPFGC)
11/15/18 | | | 5.000 | % | | | 1,000,000 | | | | 1,119,980 | | |
Unlimited General Obligation Refunding Bonds
Consolidated Capital Development Loan
Series 2005A (AGM)
08/01/17 | | | 5.000 | % | | | 2,000,000 | | | | 2,156,980 | | |
Series 2006A (AGM)
08/01/20 | | | 4.500 | % | | | 1,750,000 | | | | 1,905,470 | | |
Total | | | | | | | 52,204,317 | | |
South Carolina 0.8% | |
Berkeley County School District
Revenue Bonds
Securing Assets for Education
Series 2003
12/01/28 | | | 5.000 | % | | | 190,000 | | | | 190,762 | | |
County of Greenwood
Refunding Revenue Bonds
Self Regional Healthcare
Series 2012B
10/01/31 | | | 5.000 | % | | | 5,000,000 | | | | 5,191,100 | | |
Greenville County School District
Refunding Revenue Bonds
Building Equity Sooner
Series 2005
12/01/18 | | | 5.500 | % | | | 5,000,000 | | | | 5,997,350 | | |
Newberry Investing in Children's Education
Revenue Bonds
Newberry County School District Project
Series 2005
12/01/19 | | | 5.250 | % | | | 1,500,000 | | | | 1,602,855 | | |
South Carolina Jobs-Economic Development Authority
Revenue Bonds
Lutheran Homes of South Carolina
Series 2013
05/01/28 | | | 5.000 | % | | | 3,500,000 | | | | 3,221,505 | | |
Total | | | | | | | 16,203,572 | | |
Municipal Bonds (continued)
Issue
Description | | Coupon
Rate | | Principal
Amount ($) | | Value ($) | |
South Dakota 0.2% | |
South Dakota Health & Educational Facilities Authority
Revenue Bonds
Regional Health
Series 2011
09/01/19 | | | 5.000 | % | | | 1,250,000 | | | | 1,437,875 | | |
09/01/20 | | | 5.000 | % | | | 1,250,000 | | | | 1,436,087 | | |
09/01/21 | | | 5.000 | % | | | 1,000,000 | | | | 1,123,790 | | |
Total | | | | | | | 3,997,752 | | |
Tennessee 0.3% | |
Metropolitan Government Nashville & Davidson County
Health & Educational Facilities Board
Improvement Refunding Revenue Bonds
Meharry Medical College
Series 1996 (AMBAC)
12/01/16 | | | 6.000 | % | | | 5,300,000 | | | | 5,569,876 | | |
Texas 8.8% | |
Central Texas Regional Mobility Authority
Revenue Bonds
Senior Lien
Series 2010
01/01/19 | | | 5.750 | % | | | 750,000 | | | | 826,110 | | |
01/01/20 | | | 5.750 | % | | | 1,250,000 | | | | 1,369,850 | | |
Series 2011
01/01/31 | | | 5.750 | % | | | 15,230,000 | | | | 15,835,392 | | |
City Public Service Board of San Antonio
Refunding Revenue Bonds
Series 2005
02/01/18 | | | 5.000 | % | | | 10,000,000 | | | | 10,569,000 | | |
City of Austin
Refunding Revenue Bonds
Subordinated Lien
Series 1998 (NPFGC)
05/15/18 | | | 5.250 | % | | | 1,100,000 | | | | 1,280,565 | | |
City of Corpus Christi Utility System
Prerefunded 07/15/15 Revenue Bonds
Series 2005A (AMBAC)
07/15/19 | | | 5.000 | % | | | 2,000,000 | | | | 2,158,880 | | |
City of Houston Airport System
Refunding Revenue Bonds
Subordinate Lien
Series 2012B
07/01/28 | | | 5.000 | % | | | 7,000,000 | | | | 7,545,300 | | |
City of Houston Utility System
Refunding Revenue Bonds
1st Lien
Series 2004A (NPFGC)
05/15/24 | | | 5.250 | % | | | 5,000,000 | | | | 5,128,150 | | |
The accompanying Notes to Financial Statements are an integral part of this statement.
Annual Report 2013
20
Columbia Intermediate Municipal Bond Fund
Portfolio of Investments (continued)
October 31, 2013
Municipal Bonds (continued)
Issue
Description | | Coupon
Rate | | Principal
Amount ($) | | Value ($) | |
City of Houston
Revenue Bonds
Capital Appreciation-Convention
Series 2001B (AMBAC)(b)
09/01/17 | | | 0.000 | % | | | 2,000,000 | | | | 1,850,040 | | |
City of Irving
Prerefunded 11/15/15 Limited General Obligation Bonds
Improvement
Series 2005A
11/15/18 | | | 5.000 | % | | | 1,075,000 | | | | 1,176,813 | | |
City of Laredo
Limited General Obligation Refunding Bonds
Series 2005 (AMBAC)
08/15/20 | | | 5.000 | % | | | 1,065,000 | | | | 1,149,572 | | |
Conroe Independent School District
Unlimited General Obligation Bonds
School Building
Series 2009A
02/15/25 | | | 5.250 | % | | | 1,135,000 | | | | 1,294,240 | | |
Dallas County Community College District
Limited General Obligation Bonds
Series 2009
02/15/20 | | | 5.000 | % | | | 750,000 | | | | 878,145 | | |
Dallas-Fort Worth International Airport
Refunding Revenue Bonds
Joint
Series 2012B
11/01/28 | | | 5.000 | % | | | 21,380,000 | | | | 22,355,356 | | |
Dickinson Independent School District
Unlimited General Obligation Bonds
Series 2006 (Permanent School Fund Guarantee)
02/15/20 | | | 5.000 | % | | | 2,405,000 | | | | 2,638,213 | | |
Dripping Springs Independent School District
Unlimited General Obligation Bonds
School Building
Series 2008 (Permanent School Fund Guarantee)
02/15/26 | | | 5.000 | % | | | 1,000,000 | | | | 1,115,020 | | |
Duncanville Independent School District
Unlimited General Obligation Refunding Bonds
Capital Appreciation
Series 2005 (Permanent School Fund Guarantee)(b)
02/15/22 | | | 0.000 | % | | | 2,000,000 | | | | 1,595,480 | | |
Harris County Industrial Development Corp.
Revenue Bonds
Deer Park Refining Project
Series 2008
05/01/18 | | | 4.700 | % | | | 12,000,000 | | | | 13,112,160 | | |
Houston Higher Education Finance Corp.
Revenue Bonds
Cosmos Foundation, Inc.
Series 2011A
05/15/31 | | | 6.500 | % | | | 1,000,000 | | | | 1,096,190 | | |
Municipal Bonds (continued)
Issue
Description | | Coupon
Rate | | Principal
Amount ($) | | Value ($) | |
Lewisville Independent School District
Unlimited General Obligation Bonds
School Building
Series 2009
08/15/21 | | | 5.000 | % | | | 1,000,000 | | | | 1,170,550 | | |
Lower Colorado River Authority
Refunding Revenue Bonds
LCRA Transmission Services Corp. Project
Series 2011
05/15/27 | | | 5.000 | % | | | 11,195,000 | | | | 12,017,161 | | |
North Central Texas Health Facility Development Corp.
Revenue Bonds
Hospital-Presbyterian Healthcare
Series 1996B Escrowed to Maturity (NPFGC)
06/01/16 | | | 5.500 | % | | | 9,450,000 | | | | 10,143,157 | | |
North Harris County Regional Water Authority
Revenue Bonds
Senior Lien
Series 2008
12/15/20 | | | 5.250 | % | | | 4,415,000 | | | | 5,058,928 | | |
North Texas Tollway Authority
Refunding Revenue Bonds
System-1st Tier
Series 2008A
01/01/22 | | | 6.000 | % | | | 14,000,000 | | | | 16,100,560 | | |
North Texas Tollway Authority(a)
Refunding Revenue Bonds
System-1st Tier
Series 2008E-3
01/01/38 | | | 5.750 | % | | | 9,350,000 | | | | 10,261,251 | | |
SA Energy Acquisition Public Facility Corp.
Revenue Bonds
Gas Supply
Series 2007
08/01/16 | | | 5.250 | % | | | 4,450,000 | | | | 4,835,325 | | |
Sam Rayburn Municipal Power Agency
Refunding Revenue Bonds
Series 2012
10/01/21 | | | 5.000 | % | | | 2,300,000 | | | | 2,601,622 | | |
San Juan Higher Education Finance Authority
Revenue Bonds
Idea Public Schools
Series 2010A
08/15/20 | | | 5.125 | % | | | 1,825,000 | | | | 1,944,775 | | |
08/15/24 | | | 5.750 | % | | | 1,590,000 | | | | 1,691,649 | | |
Southwest Higher Education Authority, Inc.
Revenue Bonds
Southern Methodist University Project
Series 2009
10/01/26 | | | 5.000 | % | | | 1,000,000 | | | | 1,135,260 | | |
The accompanying Notes to Financial Statements are an integral part of this statement.
Annual Report 2013
21
Columbia Intermediate Municipal Bond Fund
Portfolio of Investments (continued)
October 31, 2013
Municipal Bonds (continued)
Issue
Description | | Coupon
Rate | | Principal
Amount ($) | | Value ($) | |
Spring Independent School District
Unlimited General Obligation Bonds
Schoolhouse
Series 2009 (Permanent School Fund Guarantee)
08/15/21 | | | 5.000 | % | | | 750,000 | | | | 870,278 | | |
Tarrant County Cultural Education Facilities Finance Corp.
Revenue Bonds
Air Force Obligation Group
Series 2007
05/15/27 | | | 5.125 | % | | | 4,500,000 | | | | 4,376,340 | | |
Texas City Industrial Development Corp.
Refunding Revenue Bonds
Arco Pipe Line Co. Project
Series 1990
10/01/20 | | | 7.375 | % | | | 3,000,000 | | | | 3,905,790 | | |
Texas Public Finance Authority
Revenue Bonds
Stephen F. Austin State University Financing
Series 2005 (NPFGC)
10/15/19 | | | 5.000 | % | | | 2,000,000 | | | | 2,151,360 | | |
Trinity River Authority LLC
Improvement Refunding Revenue Bonds
Tarrant County Water Project
Series 2005 (NPFGC)
02/01/18 | | | 5.000 | % | | | 1,000,000 | | | | 1,072,520 | | |
University of Houston
Refunding Revenue Bonds
Series 2009
02/15/21 | | | 5.000 | % | | | 1,000,000 | | | | 1,142,010 | | |
University of Texas System (The)
Prerefunded 02/15/17 Revenue Bonds
Financing System
Series 2006D
08/15/18 | | | 5.000 | % | | | 8,455,000 | | | | 9,658,823 | | |
Refunding Revenue Bonds
Financing System
Series 2004A
08/15/17 | | | 5.250 | % | | | 2,000,000 | | | | 2,337,900 | | |
Unrefunded Revenue Bonds
Financing System
Series 2006D
08/15/18 | | | 5.000 | % | | | 1,545,000 | | | | 1,742,389 | | |
Uptown Development Authority
Tax Allocation Bonds
Infrastructure Improvement Facilities
Series 2009
09/01/22 | | | 5.000 | % | | | 750,000 | | | | 799,485 | | |
West Harris County Regional Water Authority
Revenue Bonds
Series 2009
12/15/25 | | | 5.000 | % | | | 1,000,000 | | | | 1,098,410 | | |
Total | | | | | | | 189,090,019 | | |
Municipal Bonds (continued)
Issue
Description | | Coupon
Rate | | Principal
Amount ($) | | Value ($) | |
Utah 1.0% | |
Intermountain Power Agency
Refunding Revenue Bonds
Subordinated Series 2007A (AMBAC)
07/01/17 | | | 5.000 | % | | | 15,000,000 | | | | 17,222,250 | | |
Utah State Building Ownership Authority
Refunding Revenue Bonds
State Facilities Master Lease Program
Series 1998C Escrowed to Maturity (AGM)
05/15/14 | | | 5.500 | % | | | 5,000,000 | | | | 5,142,250 | | |
Total | | | | | | | 22,364,500 | | |
Virgin Islands 0.5% | |
Virgin Islands Public Finance Authority
Refunding Revenue Bonds
Series 2013B(f)
10/01/24 | | | 5.000 | % | | | 9,565,000 | | | | 10,211,881 | | |
Virgin Islands Water & Power Authority
Refunding Revenue Bonds
Series 2012A(f)
07/01/21 | | | 4.000 | % | | | 625,000 | | | | 619,900 | | |
Total | | | | | | | 10,831,781 | | |
Virginia 1.3% | |
Augusta County Industrial Development Authority
Refunding Revenue Bonds
Augusta Health Care, Inc.
Series 2003
09/01/18 | | | 5.250 | % | | | 1,500,000 | | | | 1,719,255 | | |
Dulles Town Center Community Development Authority
Refunding Special Assessment Bonds
Dulles Town Center Project
Series 2012
03/01/26 | | | 4.250 | % | | | 1,000,000 | | | | 895,690 | | |
Virginia College Building Authority
Revenue Bonds
Public Higher Education Financing Program
Series 2009A
09/01/24 | | | 5.000 | % | | | 1,000,000 | | | | 1,142,300 | | |
Virginia Gateway Community Development Authority
Refunding Special Assessment Bonds
Series 2012
03/01/30 | | | 5.000 | % | | | 1,500,000 | | | | 1,425,780 | | |
Virginia Public School Authority
Refunding Revenue Bonds
School Financing 1997 Resolution
Series 2005B
08/01/16 | | | 5.250 | % | | | 13,995,000 | | | | 15,797,136 | | |
The accompanying Notes to Financial Statements are an integral part of this statement.
Annual Report 2013
22
Columbia Intermediate Municipal Bond Fund
Portfolio of Investments (continued)
October 31, 2013
Municipal Bonds (continued)
Issue
Description | | Coupon
Rate | | Principal
Amount ($) | | Value ($) | |
Virginia Resources Authority
Revenue Bonds
State Revolving Fund
Series 2009
10/01/22 | | | 5.000 | % | | | 500,000 | | | | 586,630 | | |
Subordinated Series 2008
10/01/19 | | | 5.000 | % | | | 1,000,000 | | | | 1,169,420 | | |
Subordinated Revenue Bonds
Clean Water State Revolving Fund
Series 2007
10/01/17 | | | 5.000 | % | | | 3,760,000 | | | | 4,375,625 | | |
Total | | | | | | | 27,111,836 | | |
Washington 1.1% | |
Clark County School District No. 37 Vancouver
Unlimited General Obligation Bonds
Series 2001C (NPFGC)(b)
12/01/16 | | | 0.000 | % | | | 1,000,000 | | | | 967,420 | | |
Energy Northwest
Revenue Bonds
Columbia Generating Station
Series 2007D
07/01/22 | | | 5.000 | % | | | 1,000,000 | | | | 1,131,130 | | |
State of Washington
Unlimited General Obligation Bonds
Motor Vehicle Fuel
Series 2010B
08/01/26 | | | 5.000 | % | | | 18,270,000 | | | | 21,123,409 | | |
Series 2008D
01/01/20 | | | 5.000 | % | | | 1,000,000 | | | | 1,139,530 | | |
Total | | | | | | | 24,361,489 | | |
West Virginia 0.2% | |
West Virginia Hospital Finance Authority
Revenue Bonds
Charleston Area Medical Center, Inc.
Series 1993A Escrowed to Maturity
09/01/23 | | | 6.500 | % | | | 3,980,000 | | | | 5,081,624 | | |
Wisconsin 1.4% | |
State of Wisconsin
Revenue Bonds
Series 2009A
05/01/22 | | | 5.000 | % | | | 1,000,000 | | | | 1,159,050 | | |
05/01/23 | | | 5.125 | % | | | 14,000,000 | | | | 16,261,980 | | |
Municipal Bonds (continued)
Issue
Description | | Coupon
Rate | | Principal
Amount ($) | | Value ($) | |
Wisconsin Health & Educational Facilities Authority
Refunding Revenue Bonds
Wheaton Healthcare
Series 2006B
08/15/23 | | | 5.125 | % | | | 13,065,000 | | | | 13,430,167 | | |
Total | | | | | | | 30,851,197 | | |
Total Municipal Bonds
(Cost: $1,972,831,749) | | | | | | | 2,115,450,187 | | |
Municipal Short Term 0.1% | |
Issuer | | Effective
Yield | | Principal
Amount ($) | | Value ($) | |
Michigan 0.1% | |
Michigan Finance Authority
Revenue Notes
State Aid Notes
Series 2013C
08/20/14 | | | 3.610 | % | | | 2,125,000 | | | | 2,137,346 | | |
Total Municipal Short Term
(Cost: $2,125,000) | | | | | | | 2,137,346 | | |
Money Market Funds 1.2% | |
| | | | | Shares | | Value ($) | |
Dreyfus Tax-Exempt Cash Management Fund,
0.000%(g) | | | | | 9,919,047 | | | | 9,919,047 | | |
JPMorgan Tax-Free Money Market Fund,
0.010%(g) | | | | | 15,590,408 | | | | 15,590,408 | | |
Total Money Market Funds
(Cost: $25,509,455) | | | | | | | 25,509,455 | | |
Total Investments
(Cost: $2,000,466,204) | | | | | | | 2,143,096,988 | | |
Other Assets & Liabilities, Net | | | | | | | 17,599,122 | | |
Net Assets | | | | | | | 2,160,696,110 | | |
The accompanying Notes to Financial Statements are an integral part of this statement.
Annual Report 2013
23
Columbia Intermediate Municipal Bond Fund
Portfolio of Investments (continued)
October 31, 2013
Notes to Portfolio of Investments
(a) Variable rate security.
(b) Zero coupon bond.
(c) Identifies issues considered to be illiquid as to their marketability. The aggregate value of such securities at October 31, 2013 was $921,694, representing 0.04% of net assets. Information concerning such security holdings at October 31, 2013 is as follows:
Security Description | | Acquisition Dates | | Cost ($) | |
Capital Trust Agency, Inc.
Revenue Bonds
Atlantic Housing Foundation
Subordianated Series 2008B
7.000% 07/15/32 | | 07/23/08 | | | 1,835,000 | | |
Sterling Hill Community Development District
Special Assessment Bonds
Series 2003B
5.500% 11/01/10 | | 10/23/03 | | | 149,141 | | |
(d) Security exempt from registration pursuant to Rule 144A under the Securities Act of 1933. This security may be resold in transactions exempt from registration, normally to qualified institutional buyers. At October 31, 2013, the value of these securities amounted to $17,893,716 or 0.83% of net assets.
(e) Represents securities that have defaulted on payment of interest. The Fund has stopped accruing interest on these securities. At October 31, 2013, the value of these securities amounted to $96,641, which represents less than 0.01% of net assets.
(f) Municipal obligations include debt obligations issued by or on behalf of territories, possessions, or sovereign nations within the territorial boundaries of the United States. At October 31, 2013, the value of these securities amounted to $21,035,541 or 0.97% of net assets.
(g) The rate shown is the seven-day current annualized yield at October 31, 2013.
Abbreviation Legend
ACA ACA Financial Guaranty Corporation
AGM Assured Guaranty Municipal Corporation
AMBAC Ambac Assurance Corporation
BHAC Berkshire Hathaway Assurance Corporation
BNY Bank of New York
CIFG IXIS Financial Guaranty
FGIC Financial Guaranty Insurance Company
NPFGC National Public Finance Guarantee Corporation
TCRS Transferable Custodial Receipts
XLCA XL Capital Assurance
Fair Value Measurements
Generally accepted accounting principles (GAAP) require disclosure regarding the inputs and valuation techniques used to measure fair value and any changes in valuation inputs or techniques. In addition, investments shall be disclosed by major category.
The Fund categorizes its fair value measurements according to a three-level hierarchy that maximizes the use of observable inputs and minimizes the use of unobservable inputs by prioritizing that the most observable input be used when available. Observable inputs are those that market participants would use in pricing an investment based on market data obtained from sources independent of the reporting entity. Unobservable inputs are those that reflect the Fund's assumptions about the information market participants would use in pricing an investment. An investment's level within the fair value hierarchy is based on the lowest level of any input that is deemed significant to the asset or liability's fair value measurement. The input levels are not necessarily an indication of the risk or liquidity associated with investments at that level. For example, certain U.S. government securities are generally high quality and liquid, however, they are reflected as Level 2 because the inputs used to determine fair value may not always be quoted prices in an active market.
The accompanying Notes to Financial Statements are an integral part of this statement.
Annual Report 2013
24
Columbia Intermediate Municipal Bond Fund
Portfolio of Investments (continued)
October 31, 2013
Fair Value Measurements (continued)
Fair value inputs are summarized in the three broad levels listed below:
> Level 1 — Valuations based on quoted prices for investments in active markets that the Fund has the ability to access at the measurement date (including NAV for open-end mutual funds). Valuation adjustments are not applied to Level 1 investments.
> Level 2 — Valuations based on other significant observable inputs (including quoted prices for similar securities, interest rates, prepayment speeds, credit risks, etc.).
> Level 3 — Valuations based on significant unobservable inputs (including the Fund's own assumptions and judgment in determining the fair value of investments).
Inputs that are used in determining fair value of an investment may include price information, credit data, volatility statistics, and other factors. These inputs can be either observable or unobservable. The availability of observable inputs can vary between investments, and is affected by various factors such as the type of investment, and the volume and level of activity for that investment or similar investments in the marketplace. The inputs will be considered by the Investment Manager, along with any other relevant factors in the calculation of an investment's fair value. The Fund uses prices and inputs that are current as of the measurement date, which may include periods of market dislocations. During these periods, the availability of prices and inputs may be reduced for many investments. This condition could cause an investment to be reclassified between the various levels within the hierarchy.
Investments falling into the Level 3 category are primarily supported by quoted prices from brokers and dealers participating in the market for those investments. However, these may be classified as Level 3 investments due to lack of market transparency and corroboration to support these quoted prices. Additionally, valuation models may be used as the pricing source for any remaining investments classified as Level 3. These models may rely on one or more significant unobservable inputs and/or significant assumptions by the Investment Manager. Inputs used in valuations may include, but are not limited to, financial statement analysis, capital account balances, discount rates and estimated cash flows, and comparable company data.
Under the direction of the Fund's Board of Trustees (the Board), the Investment Manager's Valuation Committee (the Committee) is responsible for carrying out the valuation procedures approved by the Board. The Committee consists of voting and non-voting members from various groups within the Investment Manager's organization, including operations and accounting, trading and investments, compliance, risk management and legal.
The Committee meets at least monthly to review and approve valuation matters, which may include a description of specific valuation determinations, data regarding pricing information received from approved pricing vendors and brokers and the results of Board-approved valuation control policies and procedures (the Policies). The Policies address, among other things, instances when market quotations are or are not readily available, including recommendations of third party pricing vendors and a determination of appropriate pricing methodologies; events that require specific valuation determinations and assessment of fair value techniques; securities with a potential for stale pricing, including those that are illiquid, restricted, or in default; and the effectiveness of third-party pricing vendors, including periodic reviews of vendors. The Committee meets more frequently, as needed, to discuss additional valuation matters, which may include the need to review back-testing results, review time-sensitive information or approve related valuation actions. The Committee reports to the Board, with members of the Committee meeting with the Board at each of its regularly scheduled meetings to discuss valuation matters and actions during the period, similar to those described earlier.
For investments categorized as Level 3, the Committee monitors information similar to that described above, which may include: (i) data specific to the issuer or comparable issuers, (ii) general market or specific sector news and (iii) quoted prices and specific or similar security transactions. The Committee considers this data and any changes from prior periods in order to assess the reasonableness of observable and unobservable inputs, any assumptions or internal models used to value those securities and changes in fair value. This data is also used to corroborate, when available, information received from approved pricing vendors and brokers. Various factors impact the frequency of monitoring this information (which may occur as often as daily). However, the Committee may determine that changes to inputs, assumptions and models are not required as a result of the monitoring procedures performed.
The accompanying Notes to Financial Statements are an integral part of this statement.
Annual Report 2013
25
Columbia Intermediate Municipal Bond Fund
Portfolio of Investments (continued)
October 31, 2013
Fair Value Measurements (continued)
The following table is a summary of the inputs used to value the Fund's investments at October 31, 2013:
Description | | Level 1
Quoted Prices in Active
Markets for Identical
Assets ($) | | Level 2
Other Significant
Observable Inputs ($) | | Level 3
Significant
Unobservable Inputs ($) | | Total ($) | |
Bonds | |
Municipal Bonds | | | — | | | | 2,115,450,187 | | | | — | | | | 2,115,450,187 | | |
Total Bonds | | | — | | | | 2,115,450,187 | | | | — | | | | 2,115,450,187 | | |
Short-Term Securities | |
Municipal Short Term | | | — | | | | 2,137,346 | | | | — | | | | 2,137,346 | | |
Total Short-Term Securities | | | — | | | | 2,137,346 | | | | — | | | | 2,137,346 | | |
Mutual Funds | |
Money Market Funds | | | 25,509,455 | | | | — | | | | — | | | | 25,509,455 | | |
Total Mutual Funds | | | 25,509,455 | | | | — | | | | — | | | | 25,509,455 | | |
Total | | | 25,509,455 | | | | 2,117,587,533 | | | | — | | | | 2,143,096,988 | | |
See the Portfolio of Investments for all investment classifications not indicated in the table.
The Fund's assets assigned to the Level 2 input category are generally valued using the market approach, in which a security's value is determined through reference to prices and information from market transactions for similar or identical assets.
There were no transfers of financial assets between Levels 1 and 2 during the period.
The accompanying Notes to Financial Statements are an integral part of this statement.
Annual Report 2013
26
Columbia Intermediate Municipal Bond Fund
Statement of Assets and Liabilities
October 31, 2013
Assets | |
Investments, at value | |
(identified cost $2,000,466,204) | | $ | 2,143,096,988 | | |
Receivable for: | |
Investments sold | | | 5,753,267 | | |
Capital shares sold | | | 2,664,353 | | |
Interest | | | 29,225,319 | | |
Expense reimbursement due from Investment Manager | | | 5,637 | | |
Prepaid expenses | | | 23,354 | | |
Other assets | | | 5,521 | | |
Trustees' deferred compensation plan | | | 190,463 | | |
Total assets | | | 2,180,964,902 | | |
Liabilities | |
Payable for: | |
Investments purchased | | | 9,246,089 | | |
Capital shares purchased | | | 3,631,676 | | |
Dividend distributions to shareholders | | | 6,481,253 | | |
Investment management fees | | | 23,383 | | |
Distribution and/or service fees | | | 1,757 | | |
Transfer agent fees | | | 364,964 | | |
Administration fees | | | 3,760 | | |
Compensation of board members | | | 260,846 | | |
Chief compliance officer expenses | | | 180 | | |
Other expenses | | | 64,421 | | |
Trustees' deferred compensation plan | | | 190,463 | | |
Total liabilities | | | 20,268,792 | | |
Net assets applicable to outstanding capital stock | | $ | 2,160,696,110 | | |
Represented by | |
Paid-in capital | | $ | 2,041,888,109 | | |
Undistributed net investment income | | | 1,843,224 | | |
Accumulated net realized loss | | | (25,666,007 | ) | |
Unrealized appreciation (depreciation) on: | |
Investments | | | 142,630,784 | | |
Total — representing net assets applicable to outstanding capital stock | | $ | 2,160,696,110 | | |
The accompanying Notes to Financial Statements are an integral part of this statement.
Annual Report 2013
27
Columbia Intermediate Municipal Bond Fund
Statement of Assets and Liabilities (continued)
October 31, 2013
Class A | |
Net assets | | $ | 201,053,491 | | |
Shares outstanding | | | 19,078,972 | | |
Net asset value per share | | $ | 10.54 | | |
Maximum offering price per share(a) | | $ | 10.89 | | |
Class B | |
Net assets | | $ | 875,875 | | |
Shares outstanding | | | 83,133 | | |
Net asset value per share | | $ | 10.54 | | |
Class C | |
Net assets | | $ | 51,705,676 | | |
Shares outstanding | | | 4,906,016 | | |
Net asset value per share | | $ | 10.54 | | |
Class R4 | |
Net assets | | $ | 305,966 | | |
Shares outstanding | | | 29,048 | | |
Net asset value per share | | $ | 10.53 | | |
Class R5 | |
Net assets | | $ | 61,935 | | |
Shares outstanding | | | 5,886 | | |
Net asset value per share | | $ | 10.52 | | |
Class T | |
Net assets | | $ | 16,759,274 | | |
Shares outstanding | | | 1,590,442 | | |
Net asset value per share | | $ | 10.54 | | |
Maximum offering price per share(a) | | $ | 11.07 | | |
Class Z | |
Net assets | | $ | 1,889,933,893 | | |
Shares outstanding | | | 179,259,120 | | |
Net asset value per share | | $ | 10.54 | | |
(a) The maximum offering price per share is calculated by dividing the net asset value per share by 1.0 minus the maximum sales charge of 3.25% for Class A and 4.75% for Class T.
The accompanying Notes to Financial Statements are an integral part of this statement.
Annual Report 2013
28
Columbia Intermediate Municipal Bond Fund
Statement of Operations
Year Ended October 31, 2013
Net investment income | |
Income: | |
Dividends | | $ | 1,696 | | |
Interest | | | 98,966,024 | | |
Total income | | | 98,967,720 | | |
Expenses: | |
Investment management fees | | | 9,938,231 | | |
Distribution and/or service fees | |
Class A | | | 423,189 | | |
Class B | | | 11,904 | | |
Class C | | | 474,230 | | |
Class T | | | 27,880 | | |
Transfer agent fees | |
Class A | | | 397,583 | | |
Class B | | | 2,633 | | |
Class C | | | 104,857 | | |
Class R4(a) | | | 48 | | |
Class R5(b) | | | 9 | | |
Class T | | | 34,924 | | |
Class Z | | | 4,257,187 | | |
Administration fees | | | 1,606,395 | | |
Compensation of board members | | | 128,124 | | |
Custodian fees | | | 19,058 | | |
Printing and postage fees | | | 54,514 | | |
Registration fees | | | 106,297 | | |
Professional fees | | | 88,671 | | |
Chief compliance officer expenses | | | 1,682 | | |
Other | | | 62,661 | | |
Total expenses | | | 17,740,077 | | |
Fees waived or expenses reimbursed by Investment Manager and its affiliates | | | (3,012,105 | ) | |
Fees waived by Distributor — Class C | | | (251,117 | ) | |
Expense reductions | | | (740 | ) | |
Total net expenses | | | 14,476,115 | | |
Net investment income | | | 84,491,605 | | |
Realized and unrealized gain (loss) — net | |
Net realized gain (loss) on: | |
Investments | | | (4,452,191 | ) | |
Net realized loss | | | (4,452,191 | ) | |
Net change in unrealized appreciation (depreciation) on: | |
Investments | | | (115,450,512 | ) | |
Net change in unrealized appreciation (depreciation) | | | (115,450,512 | ) | |
Net realized and unrealized loss | | | (119,902,703 | ) | |
Net decrease in net assets from operations | | $ | (35,411,098 | ) | |
(a) For the period from March 19, 2013 (commencement of operations) to October 31, 2013.
(b) For the period from November 8, 2012 (commencement of operations) to October 31, 2013.
The accompanying Notes to Financial Statements are an integral part of this statement.
Annual Report 2013
29
Columbia Intermediate Municipal Bond Fund
Statement of Changes in Net Assets
| | | Year Ended
October 31,
2013(a)(b) | | Year Ended
October 31,
2012 | |
Operations | |
Net investment income | | $ | 84,491,605 | | | $ | 90,061,128 | | |
Net realized loss | | | (4,452,191 | ) | | | (19,837,666 | ) | |
Net change in unrealized appreciation (depreciation) | | | (115,450,512 | ) | | | 132,396,839 | | |
Net increase (decrease) in net assets resulting from operations | | | (35,411,098 | ) | | | 202,620,301 | | |
Distributions to shareholders | |
Net investment income | |
Class A | | | (6,652,613 | ) | | | (6,493,716 | ) | |
Class B | | | (34,607 | ) | | | (58,722 | ) | |
Class C | | | (1,642,196 | ) | | | (1,329,944 | ) | |
Class R4 | | | (1,016 | ) | | | — | | |
Class R5 | | | (616 | ) | | | — | | |
Class T | | | (593,209 | ) | | | (656,047 | ) | |
Class Z | | | (75,543,282 | ) | | | (81,612,772 | ) | |
Total distributions to shareholders | | | (84,467,539 | ) | | | (90,151,201 | ) | |
Increase (decrease) in net assets from capital stock activity | | | (482,843,549 | ) | | | 179,725,667 | | |
Proceeds from regulatory settlements (Note 6) | | | — | | | | 4,227 | | |
Total increase (decrease) in net assets | | | (602,722,186 | ) | | | 292,198,994 | | |
Net assets at beginning of year | | | 2,763,418,296 | | | | 2,471,219,302 | | |
Net assets at end of year | | $ | 2,160,696,110 | | | $ | 2,763,418,296 | | |
Undistributed net investment income | | $ | 1,843,224 | | | $ | 1,480,423 | | |
(a) Class R4 shares are for the period from March 19, 2013 (commencement of operations) to October 31, 2013.
(b) Class R5 shares are for the period from November 8, 2012 (commencement of operations) to October 31, 2013.
The accompanying Notes to Financial Statements are an integral part of this statement.
Annual Report 2013
30
Columbia Intermediate Municipal Bond Fund
Statement of Changes in Net Assets (continued)
| | | Year Ended October 31, 2013(a)(b) | | Year Ended October 31, 2012 | |
| | | Shares | | Dollars ($) | | Shares | | Dollars ($) | |
Capital stock activity | |
Class A shares | |
Subscriptions(c) | | | 4,873,576 | | | | 52,497,246 | | | | 3,755,163 | | | | 40,921,751 | | |
Distributions reinvested | | | 466,757 | | | | 5,024,560 | | | | 410,721 | | | | 4,482,131 | | |
Redemptions | | | (5,493,862 | ) | | | (58,735,063 | ) | | | (2,670,991 | ) | | | (29,076,371 | ) | |
Net increase (decrease) | | | (153,529 | ) | | | (1,213,257 | ) | | | 1,494,893 | | | | 16,327,511 | | |
Class B shares | |
Subscriptions | | | 6,230 | | | | 68,751 | | | | 33,433 | | | | 361,732 | | |
Distributions reinvested | | | 1,913 | | | | 20,665 | | | | 3,143 | | | | 34,222 | | |
Redemptions(c) | | | (91,998 | ) | | | (993,231 | ) | | | (105,809 | ) | | | (1,153,859 | ) | |
Net decrease | | | (83,855 | ) | | | (903,815 | ) | | | (69,233 | ) | | | (757,905 | ) | |
Class C shares | |
Subscriptions | | | 1,413,617 | | | | 15,439,047 | | | | 1,902,465 | | | | 20,750,735 | | |
Distributions reinvested | | | 113,194 | | | | 1,218,453 | | | | 81,625 | | | | 891,224 | | |
Redemptions | | | (1,490,734 | ) | | | (15,988,496 | ) | | | (478,499 | ) | | | (5,218,100 | ) | |
Net increase | | | 36,077 | | | | 669,004 | | | | 1,505,591 | | | | 16,423,859 | | |
Class R4 shares | |
Subscriptions | | | 28,956 | | | | 302,500 | | | | — | | | | — | | |
Distributions reinvested | | | 92 | | | | 972 | | | | — | | | | — | | |
Net increase | | | 29,048 | | | | 303,472 | | | | — | | | | — | | |
Class R5 shares | |
Subscriptions | | | 5,885 | | | | 62,491 | | | | — | | | | — | | |
Distributions reinvested | | | 52 | | | | 541 | | | | — | | | | — | | |
Redemptions | | | (51 | ) | | | (534 | ) | | | — | | | | — | | |
Net increase | | | 5,886 | | | | 62,498 | | | | — | | | | — | | |
Class T shares | |
Subscriptions | | | 10,509 | | | | 113,164 | | | | 8,780 | | | | 95,622 | | |
Distributions reinvested | | | 38,670 | | | | 416,574 | | | | 41,479 | | | | 452,314 | | |
Redemptions | | | (281,318 | ) | | | (3,013,712 | ) | | | (100,424 | ) | | | (1,086,501 | ) | |
Net decrease | | | (232,139 | ) | | | (2,483,974 | ) | | | (50,165 | ) | | | (538,565 | ) | |
Class Z shares | |
Subscriptions | | | 29,873,064 | | | | 325,676,539 | | | | 43,078,479 | | | | 469,076,802 | | |
Distributions reinvested | | | 518,290 | | | | 5,587,311 | | | | 469,549 | | | | 5,127,586 | | |
Redemptions | | | (75,431,524 | ) | | | (810,541,327 | ) | | | (29,912,911 | ) | | | (325,933,621 | ) | |
Net increase (decrease) | | | (45,040,170 | ) | | | (479,277,477 | ) | | | 13,635,117 | | | | 148,270,767 | | |
Total net increase (decrease) | | | (45,438,682 | ) | | | (482,843,549 | ) | | | 16,516,203 | | | | 179,725,667 | | |
(a) Class R4 shares are for the period from March 19, 2013 (commencement of operations) to October 31, 2013.
(b) Class R5 shares are for the period from November 8, 2012 (commencement of operations) to October 31, 2013.
(c) Includes conversions of Class B shares to Class A shares, if any.
The accompanying Notes to Financial Statements are an integral part of this statement.
Annual Report 2013
31
Columbia Intermediate Municipal Bond Fund
The following tables are intended to help you understand the Fund's financial performance. Certain information reflects financial results for a single share of a class held for the periods shown. Per share net investment income (loss) amounts are calculated based on average shares outstanding during the period. Total return assumes reinvestment of all dividends and distributions, if any. Total return does not reflect payment of sales charges, if any, and is not annualized for periods of less than one year.
| | | Year Ended October 31, | |
Class A | | 2013 | | 2012 | | 2011 | | 2010 | | 2009 | |
Per share data | |
Net asset value, beginning of period | | $ | 11.03 | | | $ | 10.56 | | | $ | 10.58 | | | $ | 10.22 | | | $ | 9.62 | | |
Income from investment operations: | |
Net investment income | | | 0.34 | | | | 0.35 | | | | 0.37 | | | | 0.36 | | | | 0.37 | | |
Net realized and unrealized gain (loss) | | | (0.49 | ) | | | 0.47 | | | | (0.02 | ) | | | 0.36 | | | | 0.60 | | |
Total from investment operations | | | (0.15 | ) | | | 0.82 | | | | 0.35 | | | | 0.72 | | | | 0.97 | | |
Less distributions to shareholders: | |
Net investment income | | | (0.34 | ) | | | (0.35 | ) | | | (0.37 | ) | | | (0.36 | ) | | | (0.37 | ) | |
Total distributions to shareholders | | | (0.34 | ) | | | (0.35 | ) | | | (0.37 | ) | | | (0.36 | ) | | | (0.37 | ) | |
Proceeds from regulatory settlements | | | — | | | | 0.00 | (a) | | | — | | | | 0.00 | (a) | | | 0.00 | (a) | |
Net asset value, end of period | | $ | 10.54 | | | $ | 11.03 | | | $ | 10.56 | | | $ | 10.58 | | | $ | 10.22 | | |
Total return | | | (1.39 | %) | | | 7.88 | % | | | 3.43 | % | | | 7.13 | % | | | 10.19 | % | |
Ratios to average net assets(b) | |
Total gross expenses | | | 0.86 | % | | | 0.86 | % | | | 0.86 | % | | | 0.75 | % | | | 0.74 | % | |
Total net expenses(c) | | | 0.74 | %(d) | | | 0.74 | %(d) | | | 0.73 | %(d) | | | 0.75 | %(d) | | | 0.73 | %(d) | |
Net investment income | | | 3.14 | % | | | 3.22 | % | | | 3.52 | % | | | 3.43 | % | | | 3.66 | % | |
Supplemental data | |
Net assets, end of period (in thousands) | | $ | 201,053 | | | $ | 212,161 | | | $ | 187,355 | | | $ | 98,208 | | | $ | 85,642 | | |
Portfolio turnover | | | 15 | % | | | 10 | % | | | 9 | % | | | 13 | % | | | 23 | % | |
Notes to Financial Highlights
(a) Rounds to zero.
(b) In addition to the fees and expenses which the Fund bears directly, the Fund indirectly bears a pro rata share of the fees and expenses of the acquired funds in which it invests. Such indirect expenses are not included in the reported expense ratios.
(c) Total net expenses include the impact of certain waivers/reimbursements made by the Investment Manager and certain of its affiliates, if applicable.
(d) The benefits derived from expense reductions had an impact of less than 0.01%.
The accompanying Notes to Financial Statements are an integral part of this statement.
Annual Report 2013
32
Columbia Intermediate Municipal Bond Fund
Financial Highlights (continued)
| | | Year Ended October 31, | |
Class B | | 2013 | | 2012 | | 2011 | | 2010 | | 2009 | |
Per share data | |
Net asset value, beginning of period | | $ | 11.03 | | | $ | 10.56 | | | $ | 10.58 | | | $ | 10.22 | | | $ | 9.62 | | |
Income from investment operations: | |
Net investment income | | | 0.27 | | | | 0.28 | | | | 0.30 | | | | 0.29 | | | | 0.30 | | |
Net realized and unrealized gain (loss) | | | (0.49 | ) | | | 0.47 | | | | (0.02 | ) | | | 0.36 | | | | 0.60 | | |
Total from investment operations | | | (0.22 | ) | | | 0.75 | | | | 0.28 | | | | 0.65 | | | | 0.90 | | |
Less distributions to shareholders: | |
Net investment income | | | (0.27 | ) | | | (0.28 | ) | | | (0.30 | ) | | | (0.29 | ) | | | (0.30 | ) | |
Total distributions to shareholders | | | (0.27 | ) | | | (0.28 | ) | | | (0.30 | ) | | | (0.29 | ) | | | (0.30 | ) | |
Proceeds from regulatory settlements | | | — | | | | 0.00 | (a) | | | — | | | | 0.00 | (a) | | | 0.00 | (a) | |
Net asset value, end of period | | $ | 10.54 | | | $ | 11.03 | | | $ | 10.56 | | | $ | 10.58 | | | $ | 10.22 | | |
Total return | | | (2.02 | %) | | | 7.17 | % | | | 2.76 | % | | | 6.44 | % | | | 9.48 | % | |
Ratios to average net assets(b) | |
Total gross expenses | | | 1.51 | % | | | 1.51 | % | | | 1.52 | % | | | 1.40 | % | | | 1.39 | % | |
Total net expenses(c) | | | 1.39 | %(d) | | | 1.39 | %(d) | | | 1.40 | %(d) | | | 1.40 | %(d) | | | 1.38 | %(d) | |
Net investment income | | | 2.47 | % | | | 2.58 | % | | | 2.85 | % | | | 2.80 | % | | | 3.03 | % | |
Supplemental data | |
Net assets, end of period (in thousands) | | $ | 876 | | | $ | 1,842 | | | $ | 2,494 | | | $ | 3,285 | | | $ | 5,294 | | |
Portfolio turnover | | | 15 | % | | | 10 | % | | | 9 | % | | | 13 | % | | | 23 | % | |
Notes to Financial Highlights
(a) Rounds to zero.
(b) In addition to the fees and expenses which the Fund bears directly, the Fund indirectly bears a pro rata share of the fees and expenses of the acquired funds in which it invests. Such indirect expenses are not included in the reported expense ratios.
(c) Total net expenses include the impact of certain waivers/reimbursements made by the Investment Manager and certain of its affiliates, if applicable.
(d) The benefits derived from expense reductions had an impact of less than 0.01%.
The accompanying Notes to Financial Statements are an integral part of this statement.
Annual Report 2013
33
Columbia Intermediate Municipal Bond Fund
Financial Highlights (continued)
| | | Year Ended October 31, | |
Class C | | 2013 | | 2012 | | 2011 | | 2010 | | 2009 | |
Per share data | |
Net asset value, beginning of period | | $ | 11.03 | | | $ | 10.56 | | | $ | 10.58 | | | $ | 10.22 | | | $ | 9.62 | | |
Income from investment operations: | |
Net investment income | | | 0.32 | | | | 0.33 | | | | 0.35 | | | | 0.34 | | | | 0.35 | | |
Net realized and unrealized gain (loss) | | | (0.49 | ) | | | 0.47 | | | | (0.02 | ) | | | 0.36 | | | | 0.60 | | |
Total from investment operations | | | (0.17 | ) | | | 0.80 | | | | 0.33 | | | | 0.70 | | | | 0.95 | | |
Less distributions to shareholders: | |
Net investment income | | | (0.32 | ) | | | (0.33 | ) | | | (0.35 | ) | | | (0.34 | ) | | | (0.35 | ) | |
Total distributions to shareholders | | | (0.32 | ) | | | (0.33 | ) | | | (0.35 | ) | | | (0.34 | ) | | | (0.35 | ) | |
Proceeds from regulatory settlements | | | — | | | | 0.00 | (a) | | | — | | | | 0.00 | (a) | | | 0.00 | (a) | |
Net asset value, end of period | | $ | 10.54 | | | $ | 11.03 | | | $ | 10.56 | | | $ | 10.58 | | | $ | 10.22 | | |
Total return | | | (1.58 | %) | | | 7.66 | % | | | 3.22 | % | | | 6.92 | % | | | 9.97 | % | |
Ratios to average net assets(b) | |
Total gross expenses | | | 1.51 | % | | | 1.51 | % | | | 1.52 | % | | | 1.40 | % | | | 1.39 | % | |
Total net expenses(c) | | | 0.94 | %(d) | | | 0.94 | %(d) | | | 0.93 | %(d) | | | 0.95 | %(d) | | | 0.93 | %(d) | |
Net investment income | | | 2.94 | % | | | 3.01 | % | | | 3.33 | % | | | 3.23 | % | | | 3.45 | % | |
Supplemental data | |
Net assets, end of period (in thousands) | | $ | 51,706 | | | $ | 53,729 | | | $ | 35,541 | | | $ | 21,903 | | | $ | 17,304 | | |
Portfolio turnover | | | 15 | % | | | 10 | % | | | 9 | % | | | 13 | % | | | 23 | % | |
Notes to Financial Highlights
(a) Rounds to zero.
(b) In addition to the fees and expenses which the Fund bears directly, the Fund indirectly bears a pro rata share of the fees and expenses of the acquired funds in which it invests. Such indirect expenses are not included in the reported expense ratios.
(c) Total net expenses include the impact of certain waivers/reimbursements made by the Investment Manager and certain of its affiliates, if applicable.
(d) The benefits derived from expense reductions had an impact of less than 0.01%.
The accompanying Notes to Financial Statements are an integral part of this statement.
Annual Report 2013
34
Columbia Intermediate Municipal Bond Fund
Financial Highlights (continued)
Class R4 | | Year Ended
October 31,
2013(a) | |
Per share data | |
Net asset value, beginning of period | | $ | 10.93 | | |
Income from investment operations: | |
Net investment income | | | 0.23 | | |
Net realized and unrealized loss | | | (0.41 | ) | |
Total from investment operations | | | (0.18 | ) | |
Less distributions to shareholders: | |
Net investment income | | | (0.22 | ) | |
Total distributions to shareholders | | | (0.22 | ) | |
Net asset value, end of period | | $ | 10.53 | | |
Total return | | | (1.61 | %) | |
Ratios to average net assets(b) | |
Total gross expenses | | | 0.65 | %(c) | |
Total net expenses(d) | | | 0.54 | %(c)(e) | |
Net investment income | | | 3.66 | %(c) | |
Supplemental data | |
Net assets, end of period (in thousands) | | $ | 306 | | |
Portfolio turnover | | | 15 | % | |
Notes to Financial Highlights
(a) For the period from March 19, 2013 (commencement of operations) to October 31, 2013.
(b) In addition to the fees and expenses which the Fund bears directly, the Fund indirectly bears a pro rata share of the fees and expenses of the acquired funds in which it invests. Such indirect expenses are not included in the reported expense ratios.
(c) Annualized.
(d) Total net expenses include the impact of certain waivers/reimbursements made by the Investment Manager and certain of its affiliates, if applicable.
(e) The benefits derived from expense reductions had an impact of less than 0.01%.
The accompanying Notes to Financial Statements are an integral part of this statement.
Annual Report 2013
35
Columbia Intermediate Municipal Bond Fund
Financial Highlights (continued)
Class R5 | | Year Ended
October 31,
2013(a) | |
Per share data | |
Net asset value, beginning of period | | $ | 11.07 | | |
Income from investment operations: | |
Net investment income | | | 0.37 | | |
Net realized and unrealized loss | | | (0.56 | ) | |
Total from investment operations | | | (0.19 | ) | |
Less distributions to shareholders: | |
Net investment income | | | (0.36 | ) | |
Total distributions to shareholders | | | (0.36 | ) | |
Net asset value, end of period | | $ | 10.52 | | |
Total return | | | (1.73 | %) | |
Ratios to average net assets(b) | |
Total gross expenses | | | 0.52 | %(c) | |
Total net expenses(d) | | | 0.45 | %(c) | |
Net investment income | | | 3.62 | %(c) | |
Supplemental data | |
Net assets, end of period (in thousands) | | $ | 62 | | |
Portfolio turnover | | | 15 | % | |
Notes to Financial Highlights
(a) For the period from November 8, 2012 (commencement of operations) to October 31, 2013.
(b) In addition to the fees and expenses which the Fund bears directly, the Fund indirectly bears a pro rata share of the fees and expenses of the acquired funds in which it invests. Such indirect expenses are not included in the reported expense ratios.
(c) Annualized.
(d) Total net expenses include the impact of certain waivers/reimbursements made by the Investment Manager and certain of its affiliates, if applicable.
The accompanying Notes to Financial Statements are an integral part of this statement.
Annual Report 2013
36
Columbia Intermediate Municipal Bond Fund
Financial Highlights (continued)
| | | Year Ended October 31, | |
Class T | | 2013 | | 2012 | | 2011 | | 2010 | | 2009 | |
Per share data | |
Net asset value, beginning of period | | $ | 11.03 | | | $ | 10.56 | | | $ | 10.58 | | | $ | 10.22 | | | $ | 9.62 | | |
Income from investment operations: | |
Net investment income | | | 0.35 | | | | 0.36 | | | | 0.37 | | | | 0.36 | | | | 0.37 | | |
Net realized and unrealized gain (loss) | | | (0.50 | ) | | | 0.47 | | | | (0.01 | ) | | | 0.36 | | | | 0.60 | | |
Total from investment operations | | | (0.15 | ) | | | 0.83 | | | | 0.36 | | | | 0.72 | | | | 0.97 | | |
Less distributions to shareholders: | |
Net investment income | | | (0.34 | ) | | | (0.36 | ) | | | (0.38 | ) | | | (0.36 | ) | | | (0.37 | ) | |
Total distributions to shareholders | | | (0.34 | ) | | | (0.36 | ) | | | (0.38 | ) | | | (0.36 | ) | | | (0.37 | ) | |
Proceeds from regulatory settlements | | | — | | | | 0.00 | (a) | | | — | | | | 0.00 | (a) | | | 0.00 | (a) | |
Net asset value, end of period | | $ | 10.54 | | | $ | 11.03 | | | $ | 10.56 | | | $ | 10.58 | | | $ | 10.22 | | |
Total return | | | (1.34 | %) | | | 7.93 | % | | | 3.48 | % | | | 7.19 | % | | | 10.25 | % | |
Ratios to average net assets(b) | |
Total gross expenses | | | 0.81 | % | | | 0.81 | % | | | 0.81 | % | | | 0.70 | % | | | 0.69 | % | |
Total net expenses(c) | | | 0.69 | %(d) | | | 0.69 | %(d) | | | 0.68 | %(d) | | | 0.70 | %(d) | | | 0.68 | %(d) | |
Net investment income | | | 3.19 | % | | | 3.28 | % | | | 3.56 | % | | | 3.49 | % | | | 3.72 | % | |
Supplemental data | |
Net assets, end of period (in thousands) | | $ | 16,759 | | | $ | 20,105 | | | $ | 19,780 | | | $ | 10,243 | | | $ | 10,462 | | |
Portfolio turnover | | | 15 | % | | | 10 | % | | | 9 | % | | | 13 | % | | | 23 | % | |
Notes to Financial Highlights
(a) Rounds to zero.
(b) In addition to the fees and expenses which the Fund bears directly, the Fund indirectly bears a pro rata share of the fees and expenses of the acquired funds in which it invests. Such indirect expenses are not included in the reported expense ratios.
(c) Total net expenses include the impact of certain waivers/reimbursements made by the Investment Manager and certain of its affiliates, if applicable.
(d) The benefits derived from expense reductions had an impact of less than 0.01%.
The accompanying Notes to Financial Statements are an integral part of this statement.
Annual Report 2013
37
Columbia Intermediate Municipal Bond Fund
Financial Highlights (continued)
| | | Year Ended October 31, | |
Class Z | | 2013 | | 2012 | | 2011 | | 2010 | | 2009 | |
Per share data | |
Net asset value, beginning of period | | $ | 11.04 | | | $ | 10.57 | | | $ | 10.58 | | | $ | 10.22 | | | $ | 9.62 | | |
Income from investment operations: | |
Net investment income | | | 0.36 | | | | 0.37 | | | | 0.39 | | | | 0.38 | | | | 0.39 | | |
Net realized and unrealized gain (loss) | | | (0.50 | ) | | | 0.47 | | | | (0.01 | ) | | | 0.36 | | | | 0.60 | | |
Total from investment operations | | | (0.14 | ) | | | 0.84 | | | | 0.38 | | | | 0.74 | | | | 0.99 | | |
Less distributions to shareholders: | |
Net investment income | | | (0.36 | ) | | | (0.37 | ) | | | (0.39 | ) | | | (0.38 | ) | | | (0.39 | ) | |
Total distributions to shareholders | | | (0.36 | ) | | | (0.37 | ) | | | (0.39 | ) | | | (0.38 | ) | | | (0.39 | ) | |
Proceeds from regulatory settlements | | | — | | | | 0.00 | (a) | | | — | | | | 0.00 | (a) | | | 0.00 | (a) | |
Net asset value, end of period | | $ | 10.54 | | | $ | 11.04 | | | $ | 10.57 | | | $ | 10.58 | | | $ | 10.22 | | |
Total return | | | (1.28 | %) | | | 8.07 | % | | | 3.69 | % | | | 7.35 | % | | | 10.41 | % | |
Ratios to average net assets(b) | |
Total gross expenses | | | 0.66 | % | | | 0.66 | % | | | 0.66 | % | | | 0.55 | % | | | 0.54 | % | |
Total net expenses(c) | | | 0.54 | %(d) | | | 0.54 | %(d) | | | 0.54 | %(d) | | | 0.55 | %(d) | | | 0.53 | %(d) | |
Net investment income | | | 3.33 | % | | | 3.42 | % | | | 3.74 | % | | | 3.64 | % | | | 3.87 | % | |
Supplemental data | |
Net assets, end of period (in thousands) | | $ | 1,889,934 | | | $ | 2,475,582 | | | $ | 2,226,049 | | | $ | 2,365,718 | | | $ | 2,384,815 | | |
Portfolio turnover | | | 15 | % | | | 10 | % | | | 9 | % | | | 13 | % | | | 23 | % | |
Notes to Financial Highlights
(a) Rounds to zero.
(b) In addition to the fees and expenses which the Fund bears directly, the Fund indirectly bears a pro rata share of the fees and expenses of the acquired funds in which it invests. Such indirect expenses are not included in the reported expense ratios.
(c) Total net expenses include the impact of certain waivers/reimbursements made by the Investment Manager and certain of its affiliates, if applicable.
(d) The benefits derived from expense reductions had an impact of less than 0.01%.
The accompanying Notes to Financial Statements are an integral part of this statement.
Annual Report 2013
38
Columbia Intermediate Municipal Bond Fund
Notes to Financial Statements
October 31, 2013
Note 1. Organization
Columbia Intermediate Municipal Bond Fund (the Fund), a series of Columbia Funds Series Trust I (the Trust), is a diversified fund. The Trust is registered under the Investment Company Act of 1940, as amended (the 1940 Act), as an open-end management investment company organized as a Massachusetts business trust.
Fund Shares
The Trust may issue an unlimited number of shares (without par value). The Fund offers Class A, Class B, Class C, Class R4, Class R5, Class T and Class Z shares. Although all share classes generally have identical voting, dividend and liquidation rights, each share class votes separately when required by law. Different share classes pay different distribution amounts to the extent the expenses of such share classes differ, and distributions in liquidation will be proportional to the net asset value of each share class. Each share class has its own expense structure and sales charges, as applicable.
Class A shares are subject to a maximum front-end sales charge of 3.25% based on the initial investment amount. Class A shares purchased without an initial sales charge in accounts aggregating $1 million to $50 million at the time of purchase are subject to a contingent deferred sales charge (CDSC) if the shares are sold within 18 months of purchase, charged as follows: 1.00% CDSC if redeemed within 12 months of purchase, and 0.50% CDSC if redeemed more than 12, but less than 18, months after purchase.
Class B shares may be subject to a maximum CDSC of 3.00% based upon the holding period after purchase. Class B shares will generally convert to Class A shares eight years after purchase. The Fund no longer accepts investments by new or existing investors in the Fund's Class B shares, except in connection with the reinvestment of any dividend and/or capital gain distributions in Class B shares of the Fund and exchanges by existing Class B shareholders of certain other funds within the Columbia Family of Funds.
Class C shares are subject to a 1.00% CDSC on shares redeemed within one year of purchase.
Class R4 shares are not subject to sales charges and are only available to investors purchasing through authorized investment professionals. Class R4 shares commenced operations on March 19, 2013.
Class R5 shares are not subject to sales charges and are generally available only to investors purchasing through authorized investment professionals and omnibus retirement plans. Class R5 shares commenced operations on November 8, 2012.
Class T shares are subject to a maximum front-end sales charge of 4.75% based on the investment amount. Class T shares purchased without an initial sales charge in accounts
aggregating $1 million to $50 million at the time of purchase are subject to a CDSC if the shares are sold within 18 months of purchase, charged as follows: 1.00% CDSC if redeemed within 12 months of purchase, and 0.50% CDSC if redeemed more than 12, but less than 18, months after purchase. Class T shares are available only to investors who received (and who have continuously held) Class T shares in connection with the merger of certain Galaxy Funds into various Columbia Funds (formerly named Liberty Funds).
Class Z shares are not subject to sales charges and are available only to certain eligible investors, which are subject to different investment minimums.
Note 2. Summary of Significant Accounting Policies
Use of Estimates
The preparation of financial statements in accordance with U.S. generally accepted accounting principles (GAAP) requires management to make certain estimates and assumptions that affect the reported amounts of assets and liabilities, the disclosure of contingent assets and liabilities at the date of the financial statements and the reported amounts of revenue and expenses during the reporting period. Actual results could differ from those estimates.
The following is a summary of significant accounting policies consistently followed by the Fund in the preparation of its financial statements.
Security Valuation
Debt securities generally are valued by pricing services approved by the Board of Trustees (the Board) based upon market transactions for normal, institutional-size trading units of similar securities. The services may use various pricing techniques which take into account appropriate factors such as yield, quality, coupon rate, maturity, type of issue, trading characteristics and other data, as well as broker quotes. Debt securities for which quotations are readily available may also be valued based upon an over-the-counter or exchange bid quotation.
Investments in open-end investment companies, including money market funds, are valued at net asset value.
Short-term securities purchased within 60 days to maturity are valued at amortized cost, which approximates market value. The value of short-term securities originally purchased with maturities greater than 60 days is determined based on an amortized value to par upon reaching 60 days to maturity. Short-term securities maturing in more than 60 days from the valuation date are valued at the market price or approximate market value based on current interest rates.
Annual Report 2013
39
Columbia Intermediate Municipal Bond Fund
Notes to Financial Statements (continued)
October 31, 2013
Investments for which market quotations are not readily available, or that have quotations which management believes are not reliable, are valued at fair value as determined in good faith under consistently applied procedures established by and under the general supervision of the Board. If a security or class of securities (such as foreign securities) is valued at fair value, such value is likely to be different from the last quoted market price for the security.
The determination of fair value often requires significant judgment. To determine fair value, management may use assumptions including but not limited to future cash flows and estimated risk premiums. Multiple inputs from various sources may be used to determine fair value.
Security Transactions
Security transactions are accounted for on the trade date. Cost is determined and gains (losses) are based upon the specific identification method for both financial statement and federal income tax purposes.
Income Recognition
Interest income is recorded on an accrual basis. Market premiums and discounts, including original issue discounts, are amortized and accreted, respectively, over the expected life of the security on all debt securities, unless otherwise noted.
Dividend income is recorded on the ex-dividend date.
Expenses
General expenses of the Trust are allocated to the Fund and other funds of the Trust based upon relative net assets or other expense allocation methodologies determined by the nature of the expense. Expenses directly attributable to the Fund are charged to the Fund. Expenses directly attributable to a specific class of shares are charged to that share class.
Determination of Class Net Asset Value
All income, expenses (other than class-specific expenses, which are charged to that share class, as shown in the Statement of Operations) and realized and unrealized gains (losses) are allocated to each class of the Fund on a daily basis, based on the relative net assets of each class, for purposes of determining the net asset value of each class.
Federal Income Tax Status
The Fund intends to qualify each year as a regulated investment company under Subchapter M of the Internal Revenue Code, as amended, and will distribute substantially all of its tax exempt and taxable income (including net short-term capital gains), if any, for its tax year, and as such will not be subject to federal income taxes. In addition, the Fund intends to distribute in each calendar year substantially all of its net investment income, capital gains and certain other
amounts, if any, such that the Fund should not be subject to federal excise tax. Therefore, no federal income or excise tax provision is recorded.
Distributions to Shareholders
Distributions from net investment income, if any, are declared daily and paid monthly. Net realized capital gains, if any, are distributed at least annually. Income distributions and capital gain distributions are determined in accordance with federal income tax regulations, which may differ from GAAP.
Guarantees and Indemnifications
Under the Trust's organizational documents and, in some cases, by contract, its officers and trustees are indemnified against certain liabilities arising out of the performance of their duties to the Trust or its funds. In addition, certain of the Fund's contracts with its service providers contain general indemnification clauses. The Fund's maximum exposure under these arrangements is unknown since the amount of any future claims that may be made against the Fund cannot be determined, and the Fund has no historical basis for predicting the likelihood of any such claims.
Recent Accounting Pronouncement
Disclosures about Offsetting Assets and Liabilities
In December 2011, the Financial Accounting Standards Board (FASB) issued Accounting Standards Update (ASU) No. 2011-11, Disclosures about Offsetting Assets and Liabilities and in January 2013, ASU No. 2013-1, Clarifying the Scope of Disclosures about Offsetting Assets and Liabilities (collectively, the ASUs). Specifically, the ASUs require an entity to disclose both gross and net information for derivatives and other financial instruments that are subject to a master netting arrangement or similar agreement. The ASUs require disclosure of collateral received in connection with the master netting agreements or similar agreements. The disclosure requirements are effective for interim and annual periods beginning on or after January 1, 2013. At this time, management is evaluating the implications of this guidance and the impact it will have on the financial statement amounts and footnote disclosures, if any.
Note 3. Fees and Compensation Paid to Affiliates
Investment Management Fees
Under an Investment Management Services Agreement, Columbia Management Investment Advisers, LLC (the Investment Manager), a wholly-owned subsidiary of Ameriprise Financial, Inc. (Ameriprise Financial), determines which securities will be purchased, held or sold. The investment management fee is an annual fee that is equal to a percentage of
Annual Report 2013
40
Columbia Intermediate Municipal Bond Fund
Notes to Financial Statements (continued)
October 31, 2013
the Fund's average daily net assets that declines from 0.41% to 0.25% as the Fund's net assets increase. The effective investment management fee rate for the year ended October 31, 2013 was 0.39% of the Fund's average daily net assets.
Administration Fees
Under an Administrative Services Agreement, the Investment Manager also serves as the Fund Administrator. The Fund pays the Fund Administrator an annual fee for administration and accounting services equal to a percentage of the Fund's average daily net assets that declines from 0.07% to 0.04% as the Fund's net assets increase. The effective administration fee rate for the year ended October 31, 2013 was 0.06% of the Fund's average daily net assets.
Compensation of Board Members
Board members are compensated for their services to the Fund as disclosed in the Statement of Operations. The Trust's eligible Trustees may participate in a Deferred Compensation Plan (the Plan) which may be terminated at any time. Obligations of the Plan will be paid solely out of the Fund's assets.
Compensation of Chief Compliance Officer
The Board has appointed a Chief Compliance Officer to the Fund in accordance with federal securities regulations. The Fund pays its pro-rata share of the expenses associated with the Chief Compliance Officer. The Fund's expenses for the Chief Compliance Officer will not exceed $15,000 per year.
Transfer Agent Fees
Under a Transfer and Dividend Disbursing Agent Agreement, Columbia Management Investment Services Corp. (the Transfer Agent), an affiliate of the Investment Manager and a wholly-owned subsidiary of Ameriprise Financial, is responsible for providing transfer agency services to the Fund. The Transfer Agent has contracted with Boston Financial Data Services (BFDS) to serve as sub-transfer agent.
The Transfer Agent receives monthly account-based service fees based on the number of open accounts and also receives sub-transfer agency fees based on a percentage of the average aggregate value of the Fund's shares maintained in omnibus accounts (other than omnibus accounts for which American Enterprise Investment Services Inc. is the broker of record or accounts where the beneficial shareholder is a customer of Ameriprise Financial Services, Inc., which are paid a per account fee). The Transfer Agent pays the fees of BFDS for services as sub-transfer agent and is not entitled to reimbursement for such fees from the Fund (with the exception of out-of-pocket fees).
The Transfer Agent also receives compensation from fees for various shareholder services and reimbursements for certain
out-of-pocket fees. Total transfer agent fees for Class R5 shares are subject to an annual limitation of not more than 0.05% of the average daily net assets attributable to Class R5 shares.
For the year ended October 31, 2013, the Fund's effective transfer agent fee rates as a percentage of average daily net assets of each class were as follows:
Class A | | | 0.19 | % | |
Class B | | | 0.19 | | |
Class C | | | 0.19 | | |
Class R4 | | | 0.17 | * | |
Class R5 | | | 0.05 | * | |
Class T | | | 0.19 | | |
Class Z | | | 0.19 | | |
*Annualized.
An annual minimum account balance fee of $20 may apply to certain accounts with a value below the applicable share class' initial minimum investment requirements to reduce the impact of small accounts on transfer agent fees. These minimum account balance fees are recorded as part of expense reductions in the Statement of Operations. For the year ended October 31, 2013, these minimum account balance fees reduced total expenses by $740.
Distribution and Service Fees
The Fund has an agreement with Columbia Management Investment Distributors, Inc. (the Distributor), an affiliate of the Investment Manager and a wholly-owned subsidiary of Ameriprise Financial, for distribution and shareholder services. Pursuant to Rule 12b-1 under the 1940 Act, the Board has approved, and the Fund has adopted, distribution and shareholder service plans (the Plans) which set the distribution and service fees for the Fund. These fees are calculated daily and are intended to compensate the Distributor and/or eligible selling and/or servicing agents for selling shares of the Fund and providing services to investors.
Under the Plans, the Fund pays a monthly service fee to the Distributor at the maximum annual rate of 0.20% of the average daily net assets attributable to Class A, Class B and Class C shares of the Fund. Also under the Plans, the Fund pays a monthly distribution fee to the Distributor at the maximum annual rate of 0.65% of the average daily net assets attributable to Class B and Class C shares only.
The Distributor has voluntarily agreed to waive a portion of the distribution fee for Class C shares so that the distribution fee does not exceed 0.20% annually of the average daily net assets attributable to Class C shares. This arrangement may be modified or terminated by the Distributor at any time.
Annual Report 2013
41
Columbia Intermediate Municipal Bond Fund
Notes to Financial Statements (continued)
October 31, 2013
Shareholder Services Fees
The Fund has adopted a shareholder services plan that permits it to pay for certain services provided to Class T shareholders by their selling and/or servicing agents. The Fund may pay shareholder servicing fees up to an aggregate annual rate of 0.40% of the Fund's average daily net assets attributable to Class T shares (comprised of up to 0.20% for shareholder liaison services and up to 0.20% for administrative support services). These fees are currently limited to an aggregate annual rate of not more than 0.15% of the Fund's average daily net assets attributable to Class T shares. In addition, the servicing fee for Class T shares will be waived by selling and/or servicing agents to the extent necessary to prevent the net investment income for the Class T shares from falling below 0.00% on a daily basis. The shareholder services fee for the year ended October 31, 2013 was 0.15% of the Fund's average daily net assets attributable to Class T shares.
Sales Charges
Sales charges, including front-end charges and CDSCs, received by the Distributor for distributing Fund shares were $154,031 for Class A, $376 for Class B, $7,887 for Class C and $2,577 for Class T shares for the year ended October 31, 2013.
Expenses Waived/Reimbursed by the Investment Manager and its Affiliates
The Investment Manager and certain of its affiliates have contractually agreed to waive fees and/or reimburse expenses (excluding certain fees and expenses described below), for the period disclosed below, unless sooner terminated at the sole discretion of the Board, so that the Fund's net operating expenses, after giving effect to fees waived/expenses reimbursed and any balance credits and/or overdraft charges from the Fund's custodian, do not exceed the following annual rates as a percentage of the class' average daily net assets:
| | March 1, 2013
through
February 28, 2014 | | Prior to
March 1, 2013 | |
Class A | | | 0.74 | % | | | 0.74 | % | |
Class B | | | 1.39 | | | | 1.39 | | |
Class C | | | 1.39 | | | | 1.39 | | |
Class R4 | | | 0.54 | * | | | — | | |
Class R5 | | | 0.45 | | | | 0.46 | | |
Class T | | | 0.69 | | | | 0.69 | | |
Class Z | | | 0.54 | | | | 0.54 | | |
* Annual rate is contractual from March 19, 2013 (the commencement of operations of Class R4 shares) through February 28, 2014.
Under the agreement governing these fee waivers and/or expense reimbursement arrangements, the following fees and expenses are excluded from the waiver/reimbursement
commitment, and therefore will be paid by the Fund, if applicable: taxes (including foreign transaction taxes), expenses associated with investments in affiliated and non-affiliated pooled investment vehicles (including mutual funds and exchange traded funds), transaction costs and brokerage commissions, costs related to any securities lending program, dividend expenses associated with securities sold short, inverse floater program fees and expenses, transaction charges and interest on borrowed money, interest, extraordinary expenses and any other expenses the exclusion of which is specifically approved by the Board. This agreement may be modified or amended only with approval from all parties. Class C distribution fees waived by the Distributor, as discussed above, are in addition to the waiver/reimbursement commitment under the agreement.
Note 4. Federal Tax Information
The timing and character of income and capital gain distributions are determined in accordance with income tax regulations, which may differ from GAAP because of temporary or permanent book to tax differences.
At October 31, 2013, these differences are primarily due to differing treatment for capital loss carryforwards, principal and/or interest of fixed income securities, Trustees' deferred compensation, distribution reclassifications and tax straddles. To the extent these differences are permanent, reclassifications are made among the components of the Fund's net assets in the Statement of Assets and Liabilities. Temporary differences do not require reclassifications. In the Statement of Assets and Liabilities the following reclassifications were made:
Undistributed net investment income | | $ | 338,735 | | |
Accumulated net realized loss | | | (43,023 | ) | |
Paid-in capital | | | (295,712 | ) | |
Net investment income and net realized gains (losses), as disclosed in the Statement of Operations, and net assets were not affected by this reclassification.
The tax character of distributions paid during the years indicated was as follows:
Year Ended October 31, | | 2013 | | 2012 | |
Ordinary income | | $ | 312,241 | | | $ | 62,042 | | |
Tax-exempt income | | | 84,155,298 | | | | 90,089,159 | | |
Total | | $ | 84,467,539 | | | $ | 90,151,201 | | |
Short-term capital gain distributions, if any, are considered ordinary income distributions for tax purposes.
At October 31, 2013, the components of distributable earnings on a tax basis were as follows:
Undistributed tax-exempt income | | $ | 8,363,128 | | |
Unrealized appreciation | | | 143,036,237 | | |
Annual Report 2013
42
Columbia Intermediate Municipal Bond Fund
Notes to Financial Statements (continued)
October 31, 2013
At October 31, 2013, the cost of investments for federal income tax purposes was $2,000,060,751 and the aggregate gross unrealized appreciation and depreciation based on that cost was:
Unrealized appreciation | | $ | 154,933,823 | | |
Unrealized depreciation | | | (11,897,586 | ) | |
Net unrealized appreciation | | $ | 143,036,237 | | |
The following capital loss carryforward, determined at October 31, 2013, may be available to reduce taxable income arising from future net realized gains on investments, if any, to the extent permitted by the Internal Revenue Code:
Year of Expiration | | Amount ($) | |
2017 | | | 832,773 | | |
2018 | | | 62,558 | | |
Unlimited short-term | | | 17,008,274 | | |
Unlimited long-term | | | 7,615,523 | | |
Total | | | 25,519,128 | | |
Unlimited capital loss carryforwards are required to be utilized prior to any capital losses which carry an expiration date. As a result of this ordering rule, capital loss carryforwards which carry an expiration date may be more likely to expire unused.
Management of the Fund has concluded that there are no significant uncertain tax positions that would require recognition in the financial statements. However, management's conclusion may be subject to review and adjustment at a later date based on factors including, but not limited to, new tax laws, regulations, and administrative interpretations (including relevant court decisions). Generally, the Fund's federal tax returns for the prior three fiscal years remain subject to examination by the Internal Revenue Service.
Note 5. Portfolio Information
The cost of purchases and proceeds from sales of securities, excluding short-term obligations, aggregated to $365,277,586 and $768,410,329, respectively, for the year ended October 31, 2013.
Note 6. Regulatory Settlements
During the year ended October 31, 2012, the Fund received $4,227 as a result of a regulatory settlement proceeding brought by the Securities and Exchange Commission against an unaffiliated third party relating to market timing and/or late trading of mutual funds. This amount represented the Fund's portion of the proceeds from the settlement (the Fund was not a party to the proceeding). The payments have been included in "Proceeds from regulatory settlements" in the Statement of Changes in Net Assets.
Note 7. Shareholder Concentration
At October 31, 2013, one unaffiliated shareholder account owned 81.1% of the outstanding shares of the Fund. The Fund has no knowledge about whether any portion of those shares was owned beneficially by such account.
Note 8. Line of Credit
The Fund has entered into a revolving credit facility with a syndicate of banks led by JPMorgan Chase Bank N.A. (JPMorgan) whereby the Fund may borrow for the temporary funding of shareholder redemptions or for other temporary or emergency purposes. The credit facility agreement, as amended, which is a collective agreement between the Fund and certain other funds managed by the Investment Manager, severally and not jointly, permits collective borrowings up to $500 million. Interest is charged to each participating fund based on its borrowings at a rate equal to the higher of (i) the overnight federal funds rate plus 1.00% or (ii) the one-month LIBOR rate plus 1.00%. Each borrowing under the credit facility matures no later than 60 days after the date of borrowing. The Fund also pays a commitment fee equal to its pro rata share of the amount of the credit facility at a rate of 0.08% per annum. The commitment fee is included in other expenses in the Statement of Operations.
Effective December 10, 2013, the Fund extended its revolving credit facility with JPMorgan. The credit facility agreement, as amended, continues to permit collective borrowings up to $500 million under the same terms and interest rates as described above. Effective December 10, 2013, the Fund pays a commitment fee equal to its pro rata share of the amount of the credit facility at a rate of 0.075% per annum.
The Fund had no borrowings during the year ended October 31, 2013.
Note 9. Subsequent Events
Management has evaluated the events and transactions that have occurred through the date the financial statements were issued and noted no items requiring adjustment of the financial statements or additional disclosure.
Note 10. Information Regarding Pending and Settled Legal Proceedings
In December 2005, without admitting or denying the allegations, American Express Financial Corporation (AEFC, which is now known as Ameriprise Financial, Inc. (Ameriprise Financial)) entered into settlement agreements with the Securities and Exchange Commission (SEC) and Minnesota Department of Commerce (MDOC) related to market timing activities. As a result, AEFC was censured and ordered to cease and desist from committing or causing any violations of certain provisions of the Investment Advisers Act of 1940, the
Annual Report 2013
43
Columbia Intermediate Municipal Bond Fund
Notes to Financial Statements (continued)
October 31, 2013
Investment Company Act of 1940, and various Minnesota laws. AEFC agreed to pay disgorgement of $10 million and civil money penalties of $7 million. AEFC also agreed to retain an independent distribution consultant to assist in developing a plan for distribution of all disgorgement and civil penalties ordered by the SEC in accordance with various undertakings detailed at www.sec.gov/litigation/admin/ia-2451.pdf. Ameriprise Financial and its affiliates have cooperated with the SEC and the MDOC in these legal proceedings, and have made regular reports to the funds' Boards of Trustees.
Ameriprise Financial and certain of its affiliates have historically been involved in a number of legal, arbitration and regulatory proceedings, including routine litigation, class actions, and governmental actions, concerning matters arising in connection with the conduct of their business activities. Ameriprise Financial believes that the Funds are not currently the subject of, and that neither Ameriprise Financial nor any of its affiliates are the subject of, any pending legal, arbitration or regulatory proceedings that are likely to have a material adverse effect on the Funds or the ability of Ameriprise Financial or its affiliates to perform under their contracts with the Funds. Ameriprise Financial is required to make 10-Q, 10-K and, as necessary, 8-K filings with the Securities and Exchange Commission on legal and regulatory matters that relate to Ameriprise Financial and its affiliates. Copies of these filings may be obtained by accessing the SEC website at www.sec.gov.
There can be no assurance that these matters, or the adverse publicity associated with them, will not result in increased fund redemptions, reduced sale of fund shares or other adverse consequences to the Funds. Further, although we believe proceedings are not likely to have a material adverse effect on the Funds or the ability of Ameriprise Financial or its affiliates to perform under their contracts with the Funds, these proceedings are subject to uncertainties and, as such, we are unable to estimate the possible loss or range of loss that may result. An adverse outcome in one or more of these proceedings could result in adverse judgments, settlements, fines, penalties or other relief that could have a material adverse effect on the consolidated financial condition or results of operations of Ameriprise Financial.
Annual Report 2013
44
Columbia Intermediate Municipal Bond Fund
Report of Independent Registered Public Accounting Firm
To the Trustees of Columbia Funds Series Trust I and the Shareholders of
Columbia Intermediate Municipal Bond Fund
In our opinion, the accompanying statement of assets and liabilities, including the portfolio of investments, and the related statements of operations and of changes in net assets and the financial highlights present fairly, in all material respects, the financial position of Columbia Intermediate Municipal Bond Fund (the "Fund", a series of Columbia Funds Series Trust I) at October 31, 2013, and the results of its operations, the changes in its net assets and the financial highlights for each of the periods indicated, in conformity with accounting principles generally accepted in the United States of America. These financial statements and financial highlights (hereafter referred to as "financial statements") are the responsibility of the Fund's management; our responsibility is to express an opinion on these financial statements based on our audits. We conducted our audits of these financial statements in accordance with the standards of the Public Company Accounting Oversight Board (United States). Those standards require that we plan and perform the audit to obtain reasonable assurance about whether the financial statements are free of material misstatement. An audit includes examining, on a test basis, evidence supporting the amounts and disclosures in the financial statements, assessing the accounting principles used and significant estimates made by management, and evaluating the overall financial statement presentation. We believe that our audits, which included confirmation of securities at October 31, 2013 by correspondence with the custodian, brokers and transfer agent, provide a reasonable basis for our opinion expressed above.
PricewaterhouseCoopers LLP
Minneapolis, Minnesota
December 19, 2013
Annual Report 2013
45
Columbia Intermediate Municipal Bond Fund
Federal Income Tax Information
(Unaudited)
The Fund hereby designates the following tax attributes for the fiscal year ended October 31, 2013. Shareholders will be notified in early 2014 of the amounts for use in preparing 2013 income tax returns.
Tax Designations:
| Exempt-Interest Dividends | | | 99.63 | % | |
Exempt-Interest Dividends. The percentage of net investment income dividends paid during the fiscal year that qualifies as exempt-interest dividends for federal income tax purposes.
Annual Report 2013
46
Columbia Intermediate Municipal Bond Fund
The Trustees serve terms of indefinite duration. The names, addresses and birth years of the Trustees and Officers of the Funds in Columbia Funds Series Trust I, the year each was first elected or appointed to office, their principal business occupations during at least the last five years, the number of Funds overseen by each Trustee and other directorships they hold are shown below. Each officer listed below serves as an officer of each Fund in Columbia Funds Series Trust I.
Independent Trustees
Name, Address and Year of Birth,
Position with Funds, Year First
Elected or Appointed to Office | | Principal Occupation(s) During Past Five Years, Number of Funds in Columbia
Funds Complex Overseen by Trustee, Other Directorships Held | |
Rodman L. Drake (Born 1943)
c/o Columbia Management
Investment Advisers, LLC
225 Franklin Street
Boston, MA 02110
Trustee (since 1994) and
Chairman of the Board (since 2009) | | Independent consultant since 2010; Co-Founder of Baringo Capital LLC (private equity) from 1997 to 2008; Chairman (from 2003 to 2010) and CEO (from 2008 to 2010) of Crystal River Capital, Inc. (real estate investment trust); Oversees 52; Jackson Hewitt Tax Service Inc. (tax preparation services) from 2004 to 2011; Student Loan Corporation (student loan provider) from 2005 to 2010; Celgene Corporation (global biotechnology company); The Helios Funds and Brookfield Funds (closed-end funds); Chimerix, Inc. (biopharmaceutical company) since August 1, 2013; Crystal River Capital, Inc. from 2005 to 2010; Parsons Brinckerhoff from 1995 to 2008; and Apex Silver Mines Ltd. from 2007 to 2009 | |
Douglas A. Hacker (Born 1955)
c/o Columbia Management
Investment Advisers, LLC
225 Franklin Street
Boston, MA 02110
Trustee (since 1996) | | Independent business executive since May 2006; Executive Vice President — Strategy of United Airlines from December 2002 to May 2006; President of UAL Loyalty Services (airline marketing company) from September 2001 to December 2002; Executive Vice President and Chief Financial Officer of United Airlines from July 1999 to September 2001. Oversees 52; Nash Finch Company (food distributor); Aircastle Limited (aircraft leasing); and SeaCube Container Leasing Ltd. (container leasing) | |
Janet Langford Kelly (Born 1957)
c/o Columbia Management
Investment Advisers, LLC
225 Franklin Street
Boston, MA 02110
Trustee (since 1996) | | Senior Vice President, General Counsel and Corporate Secretary, ConocoPhillips (integrated energy company) since September 2007; Deputy General Counsel — Corporate Legal Services, ConocoPhillips from August 2006 to August 2007; Partner, Zelle, Hofmann, Voelbel, Mason & Gette LLP (law firm) from March 2005 to July 2006; Adjunct Professor of Law, Northwestern University from September 2004 to June 2006; Director, UAL Corporation (airline) from February 2006 to July 2006; Chief Administrative Officer and Senior Vice President, Kmart Holding Corporation (consumer goods) from September 2003 to March 2004. Oversees 52; None | |
Nancy T. Lukitsh (Born 1956)
c/o Columbia Management
Investment Advisers, LLC
225 Franklin Street
Boston, MA 02110
Trustee (since 2011) | | Senior Vice President, Partner and Director of Marketing, Wellington Management Company, LLP (investment adviser) from 1997 to 2010; Chair, Wellington Management Investment Portfolios (commingled non-U.S. investment pools) from 2007 to 2010; Director, Wellington Trust Company, NA and other Wellington affiliates from 1997 to 2010. Oversees 52; None | |
William E. Mayer (Born 1940)
c/o Columbia Management
Investment Advisers, LLC
225 Franklin Street
Boston, MA 02110
Trustee (since 1994) | | Partner, Park Avenue Equity Partners (private equity) since February 1999; Dean and Professor, College of Business and Management, University of Maryland from 1992 to 1996. Oversees 52; DynaVox Inc. (speech creation); Lee Enterprises (print media); WR Hambrecht + Co. (financial service provider) from 2000 to 2012; BlackRock Kelso Capital Corporation (investment company) | |
David M. Moffett (Born 1952)
c/o Columbia Management
Investment Advisers, LLC
225 Franklin Street
Boston, MA 02110
Trustee (since 2011) | | Retired. Chief Executive Officer, Federal Home Loan Mortgage Corporation, from 2008 to 2009; Senior Adviser, Global Financial Services Group, Carlyle Group, Inc., from 2007 to 2008; Vice Chairman and Chief Financial Officer, U.S. Bancorp, from 1993 to 2007. Oversees 52; CIT Group Inc. (commercial and consumer finance); eBay Inc. (online trading community); MBIA Inc. (financial service provider); E.W. Scripps Co. (print and television media), Building Materials Holding Corp. (building materials and construction services); Genworth Financial, Inc. (financial and insurance products and services); and University of Oklahoma Foundation | |
Charles R. Nelson (Born 1942)
c/o Columbia Management
Investment Advisers, LLC
225 Franklin Street
Boston, MA 02110
Trustee (since 1981) | | Retired. Professor Emeritus, University of Washington, since 2011; Professor of Economics, University of Washington from 1976 to 2011; Ford and Louisa Van Voorhis Professor of Political Economy, University of Washington from 1993 to 2011; Adjunct Professor of Statistics, University of Washington from 1980 to 2011; Associate Editor, Journal of Money, Credit and Banking from September 1993 to 2008; consultant on econometric and statistical matters. Oversees 52; None | |
John J. Neuhauser (Born 1943)
c/o Columbia Management
Investment Advisers, LLC
225 Franklin Street
Boston, MA 02110
Trustee (since 1984) | | President, Saint Michael's College, since August 2007; Director or Trustee of several non-profit organizations, including Fletcher Allen Health Care, Inc.; University Professor, Boston College from November 2005 to August 2007; Academic Vice President and Dean of Faculties, Boston College from August 1999 to October 2005. Oversees 52; Liberty All-Star Equity Fund and Liberty All-Star Growth Fund (closed-end funds) | |
Annual Report 2013
47
Columbia Intermediate Municipal Bond Fund
Trustees and Officers (continued)
Independent Trustees (continued)
Name, Address and Year of Birth,
Position with Funds, Year First
Elected or Appointed to Office | | Principal Occupation(s) During Past Five Years, Number of Funds in Columbia
Funds Complex Overseen by Trustee, Other Directorships Held | |
Patrick J. Simpson (Born 1944)
c/o Columbia Management
Investment Advisers, LLC
225 Franklin Street
Boston, MA 02110
Trustee (since 2000) | | Partner, Perkins Coie LLP (law firm). Oversees 52; None | |
Anne-Lee Verville (Born 1945)
c/o Columbia Management
Investment Advisers, LLC
225 Franklin Street
Boston, MA 02110
Trustee (since 1998) | | Retired. General Manager — Global Education Industry from 1994 to 1997, President — Application Systems Division from 1991 to 1994, Chief Financial Officer — US Marketing & Services from 1988 to 1991, and Chief Information Officer from 1987 to 1988, IBM Corporation (computer and technology). Oversees 52; Enesco Group, Inc. (producer of giftware and home and garden decor products) from 2001 to 2006 | |
Interested Trustee
Name, Address and Year of Birth,
Position with Funds, Year First
Elected or Appointed to Office | | Principal Occupation(s) During Past Five Years, Number of Funds in Columbia
Funds Complex Overseen by Trustee, Other Directorships Held | |
William F. Truscott (born 1960)
53600 Ameriprise Financial Center
Minneapolis, MN 55474
Senior Vice President (since 2012) | | Chairman of the Board and President, Columbia Management Investment Advisers, LLC since May 2010 and February 2012 (previously President and Chief Investment Officer, from 2001 to April 2010); Chief Executive Officer, Global Asset Management, Ameriprise Financial, Inc. since September 2012 (previously, Chief Executive Officer, U.S. Asset Management & President, Annuities, from May 2010 to September 2012 and President — U.S. Asset Management and Chief Investment Officer from 2005 to April 2010); Director and Chief Executive Officer, Columbia Management Investment Distributors, Inc. since May 2010 and February 2012, respectively (previously Chairman of the Board and Chief Executive Officer from 2006 to April 2010); Chairman of the Board and Chief Executive Officer, RiverSource Distributors, Inc. since 2006; President and Chief Executive Officer, Ameriprise Certificate Company, 2006 to August 2012; Oversees 184; Director, Ameriprise Certificate Company, 2006-January 2013 | |
The Statement of Additional Information includes additional information about the Trustees of the Funds and is available, without charge, upon request by calling 800.345.6611.
The Board has appointed officers who are responsible for day-to-day business decisions based on policies it has established. The officers serve at the pleasure of the Board. In addition to Mr. Truscott, who is Senior Vice President, the Funds' other officers are:
Officers
Name,
Address and
Year of Birth | | Position and Year
First Appointed to
Position for any Fund
in the Columbia
Funds Complex or a
Predecessor Thereof | | Principal Occupation(s) During Past Five Years | |
J. Kevin Connaughton
225 Franklin Street
Boston, MA 02110
Born 1964 | | President and Principal Executive Officer (2009) | | Senior Vice President and General Manager — Mutual Fund Products, Columbia Management Investment Advisers, LLC, since May 2010; and President, Columbia Funds since 2009; previously, Managing Director, Columbia Management Advisors, LLC, from December 2004 to April 2010; Senior Vice President and Chief Financial Officer, Columbia Funds, from June 2008 to January 2009; and senior officer of Columbia Funds and affiliated funds since 2003. | |
Michael G. Clarke
225 Franklin Street
Boston, MA 02110
Born 1969 | | Treasurer (2011) and Chief Financial Officer (2009) | | Vice President, Columbia Management Investment Advisers, LLC, since May 2010; previously, Managing Director of Fund Administration, Columbia Management Advisors, LLC, from September 2004 to April 2010; and senior officer of Columbia Funds and affiliated funds since 2002. | |
Annual Report 2013
48
Columbia Intermediate Municipal Bond Fund
Trustees and Officers (continued)
Officers (continued)
Name,
Address and
Year of Birth | | Position and Year
First Appointed to
Position for any Fund
in the Columbia
Funds Complex or a
Predecessor Thereof | | Principal Occupation(s) During Past Five Years | |
Scott R. Plummer
5228 Ameriprise
Financial Center
Minneapolis, MN 55474
Born 1959 | | Senior Vice President (2006), Chief Legal Officer (2006) and Assistant Secretary (2011) | | Senior Vice President, Chief Legal Officer and Assistant Secretary, Columbia Management Investment Advisers, LLC, since June 2005; Senior Vice President and Lead Chief Counsel — Asset Management, Ameriprise Financial, Inc., since May 2010 (previously, Vice President and Chief Counsel — Asset Management, from 2005 to April 2010); Vice President, Chief Counsel and Assistant Secretary, Columbia Management Investment Distributors, Inc., since 2008; Vice President, General Counsel and Secretary, Ameriprise Certificate Company, since 2005; Chief Counsel, RiverSource Distributors, Inc., since 2006; and senior officer of Columbia Funds and affiliated funds since 2006. | |
Thomas P. McGuire
225 Franklin Street
Boston, MA 02110
Born 1972 | | Chief Compliance Officer (2012) | | Vice President — Asset Management Compliance, Ameriprise Financial, Inc., since May 2010; Chief Compliance Officer, Ameriprise Certificate Company, since September 2010; Compliance Executive, Bank of America, from 2005 to April 2010. | |
Colin Moore
225 Franklin Street
Boston, MA 02110
Born 1958 | | Senior Vice President (2010) | | Executive Vice President and Global Chief Investment Officer, Ameriprise Financial, Inc., since July 2013; Director and Global Chief Investment Officer, Columbia Management Investment Advisers, LLC, since May 2010; previously, Manager, Managing Director and Chief Investment Officer, Columbia Management Advisors, LLC, from 2007 to April 2010. | |
Michael E. DeFao
225 Franklin Street
Boston, MA 02110
Born 1968 | | Vice President (2011) and Assistant Secretary (2010) | | Vice President and Chief Counsel, Ameriprise Financial, Inc., since May 2010; Associate General Counsel, Bank of America from 2005 to April 2010. | |
Joseph F. DiMaria
225 Franklin Street
Boston, MA 02110
Born 1968 | | Vice President (2011) and Chief Accounting Officer (2008) | | Vice President — Mutual Fund Administration, Columbia Management Investment Advisers, LLC, since May 2010; previously, Director of Fund Administration, Columbia Management Advisors, LLC, from 2006 to April 2010. | |
Paul B. Goucher
100 Park Avenue
New York, NY 10017
Born 1968 | | Vice President (2011) and Assistant Secretary (2008) | | Vice President and Lead Chief Counsel, Ameriprise Financial, Inc., since November 2008 and January 2013, respectively (previously, Chief Counsel, from January 2010 to January 2013, and Group Counsel from November 2008 to January 2010); previously, Director, Managing Director and General Counsel, J. & W. Seligman & Co. Incorporated, from July 2008 to November 2008. | |
Amy Johnson
5228 Ameriprise
Financial Center
Minneapolis, MN
Born 1965 | | Vice President (2006) | | Senior Vice President and Chief Operating Officer, Columbia Management Investment Advisers, LLC, since May 2010; previously, Chief Administrative Officer, from 2009 to April 2010, and Vice President — Asset Management and Trust Company Services, from 2006 to 2009. | |
Paul D. Pearson
5228 Ameriprise
Financial Center
Minneapolis, MN
Born 1956 | | Vice President (2011) and Assistant Treasurer (1999) | | Vice President — Investment Accounting, Columbia Management Investment Advisers, LLC, since May 2010; previously, Vice President — Managed Assets, Investment Accounting, Ameriprise Financial, Inc. from 1998 to April 2010. | |
Christopher O. Petersen
5228 Ameriprise
Financial Center
Minneapolis, MN 55474
Born 1970 | | Vice President and Secretary (2010) | | Vice President and Chief Counsel, Ameriprise Financial, Inc., since January 2010 (previously, Vice President and Group Counsel or Counsel from 2004 to January 2010); officer of Columbia Funds and affiliated funds since 2007. | |
Stephen T. Welsh
225 Franklin Street
Boston, MA 02110
Born 1957 | | Vice President (2006) | | President and Director, Columbia Management Investment Services Corp., since May 2010; previously, President and Director, Columbia Management Services, Inc., from 2004 to April 2010; and Managing Director, Columbia Management Distributors, Inc., from 2007 to April 2010. | |
Annual Report 2013
49
Columbia Intermediate Municipal Bond Fund
Board Consideration and Approval of Advisory Agreement
On June 14, 2013, the Board of Trustees (the "Board") and the Trustees who are not interested persons (as defined in the Investment Company Act of 1940) of the Trust (the "Independent Trustees") unanimously approved the continuation of the Investment Management Services Agreement (the "Advisory Agreement") with Columbia Management Investment Advisers, LLC (the "Investment Manager") with respect to Columbia Intermediate Municipal Bond Fund (the "Fund"), a series of the Trust. As detailed below, the Advisory Fees and Expenses Committee (the "Committee") and the Board met on multiple occasions to review and discuss, both among themselves and with the management team of the Investment Manager, materials provided by the Investment Manager before determining to approve the continuation of the Advisory Agreement.
In connection with their deliberations regarding the continuation of the Advisory Agreement, the Committee and the Board evaluated materials requested from the Investment Manager regarding the Fund and the Advisory Agreement, and discussed these materials with representatives of the Investment Manager at Committee meetings held on March 5, 2013, April 24, 2013 and June 13, 2013, and at the Board meeting held on June 14, 2013. In addition, the Board considers matters bearing on the Advisory Agreement at most of its other meetings throughout the year and meets regularly with senior management of the Funds and the Investment Manager. Through the Board's Investment Oversight Committees, Trustees also meet with selected Fund portfolio managers and other investment personnel at various times throughout the year. The Committee and the Board also consulted with Fund counsel and with the Independent Trustees' independent legal counsel, who advised on various matters with respect to the Committee's and the Board's considerations and otherwise assisted the Committee and the Board in their deliberations. On June 13, 2013, the Committee recommended that the Board approve the continuation of the Advisory Agreement. On June 14, 2013, the Board, including the Independent Trustees, voting separately, unanimously approved the continuation of the Advisory Agreement for the Fund.
The Committee and the Board considered all information that they, their legal counsel, or the Investment Manager believed reasonably necessary to evaluate and to determine whether to approve the continuation of the Advisory Agreement. The information and factors considered by the Committee and the Board in recommending for approval or approving the continuation of the Advisory Agreement for the Fund included the following:
• Information on the investment performance of the Fund relative to the performance of a group of mutual funds determined to be comparable to the Fund by an independent third-party data provider, as well as performance relative to benchmarks;
• Information on the Fund's advisory fees and total expenses, including information comparing the Fund's expenses to those of a group of comparable mutual funds, as determined by the independent third-party data provider;
• The Investment Manager's agreement to contractually limit or cap total operating expenses for the Fund so that total operating expenses (excluding certain fees and expenses, such as transaction costs and certain other investment related expenses, interest, taxes, acquired fund fees and expenses, and extraordinary expenses) would not exceed the median expenses of a group of comparable funds (as determined from time to time, generally annually, by the independent third-party data provider);
• The terms and conditions of the Advisory Agreement;
• The terms and conditions of other agreements and arrangements with affiliates of the Investment Manager relating to the operations of the Fund, including the Administrative Services Agreement, the Distribution Agreement and the Transfer and Dividend Disbursing Agent Agreement;
• Descriptions of various functions performed by the Investment Manager under the Advisory Agreement, including portfolio management and portfolio trading practices;
• Information regarding the management fees and investment performance of comparable portfolios of other clients of the Investment Manager, including institutional separate accounts;
• Information regarding the reputation, regulatory history and resources of the Investment Manager, including information regarding senior management, portfolio managers and other personnel;
• Information regarding the capabilities of the Investment Manager with respect to compliance monitoring services, including an assessment of the Investment Manager's compliance system by the Fund's Chief Compliance Officer; and
• The profitability to the Investment Manager and its affiliates from their relationships with the Fund.
Annual Report 2013
50
Columbia Intermediate Municipal Bond Fund
Board Consideration and Approval of Advisory Agreement (continued)
Nature, Extent and Quality of Services Provided under the Advisory Agreement
The Committee and the Board considered the nature, extent and quality of services provided to the Fund by the Investment Manager and its affiliates under the Advisory Agreement and under separate agreements for the provision of transfer agency and administrative services, and the resources dedicated to the Fund and the other Columbia Funds by the Investment Manager and its affiliates. The Committee and the Board considered, among other things, the Investment Manager's ability to attract, motivate and retain highly qualified research, advisory and supervisory investment professionals (including personnel and other resources, compensation programs for personnel involved in fund management, reputation and other attributes), the portfolio management services provided by those investment professionals, and the quality of the Investment Manager's investment research capabilities and trade execution services. The Committee and the Board also considered the potential benefits to shareholders of investing in a mutual fund that is part of a fund complex offering exposure to a variety of asset classes and investment disciplines and providing a variety of fund and shareholder services.
The Committee and the Board also considered the professional experience and qualifications of the senior personnel of the Investment Manager, which included consideration of the Investment Manager's experience with similarly-structured funds. The Committee and the Board noted the compliance programs of and the compliance-related resources provided to the Fund by the Investment Manager and its affiliates, and considered the Investment Manager's ability to provide administrative services to the Fund pursuant to a separate Administrative Services Agreement, including the Investment Manager's ability to coordinate the activities of the Fund's other service providers. After reviewing these and related factors, the Committee and the Board concluded, within the context of their overall conclusions, that the nature, extent and quality of the services provided to the Fund under the Advisory Agreement supported the continuation of the Advisory Agreement.
Investment Performance
The Committee and the Board reviewed information about the performance of the Fund over various time periods, including performance information relative to benchmarks and information based on reports of the independent third-party data provider that compared the performance of the Fund to the performance of a group of comparable mutual funds. The Committee and the Board also reviewed a description of the third party's methodology for identifying the Fund's peer groups for purposes of performance and expense comparisons. Although the Fund's performance lagged that of a relevant peer group for certain (although not necessarily all) periods, the Committee and the Board concluded that other factors relevant to performance were sufficient, in light of other considerations, to warrant continuation of the Fund's Advisory Agreement. Those factors included one or more of the following: (i) that the Fund's performance, although lagging in certain recent periods, was stronger over the longer term; (ii) that the underperformance was attributable, to a significant extent, to investment decisions that were reasonable and consistent with the Fund's investment strategy and policies and that the Fund was performing within a reasonable range of expectations, given those investment decisions, market conditions and the Fund's investment strategy; (iii) that the Fund's performance was competitive when compared to other relevant performance benchmarks or peer groups; and (iv) that the Investment Manager had taken or was taking steps designed to help improve the Fund's investment performance, including, but not limited to, replacing portfolio managers, enhancing the resources supporting the portfolio managers, or modifying investment strategies.
The Committee and the Board noted that, through December 31, 2012, the Fund's performance was in the thirty-ninth, thirty-sixth and sixtieth percentile (where the best performance would be in the first percentile) of its category selected by the independent third-party data provider for the purposes of performance comparisons for the one-, three- and five- year periods, respectively.
The Committee and the Board also considered the Investment Manager's performance and reputation generally, the Investment Manager's historical responsiveness to Board concerns about performance, and the Investment Manager's willingness to take steps intended to improve performance. After reviewing these and related factors, the Committee and the Board concluded, within the context of their overall conclusions, that the performance of the Fund and the Investment Manager was sufficient, in light of other considerations, to warrant the continuation of the Advisory Agreement.
Investment Advisory Fee Rates and Other Expenses
The Committee and the Board considered the advisory fees charged to the Fund under the Advisory Agreement as well as the total expenses incurred by the Fund. In assessing the reasonableness of the fees under the Advisory Agreement, the
Annual Report 2013
51
Columbia Intermediate Municipal Bond Fund
Board Consideration and Approval of Advisory Agreement (continued)
Committee and the Board considered, among other information, the Fund's advisory fee and its total expense ratio as a percentage of average daily net assets. The Committee and the Board noted that the Fund's actual management fee and net expense ratio are ranked in the first and second quintiles, respectively, (where the lowest fees and expenses would be in the first quintile) against the Fund's expense universe as determined by the independent third-party data provider for purposes of expense comparison. The Committee and the Board also took into account the fee waiver and expense limitation arrangements agreed to by the Investment Manager, as noted above.
The Committee and the Board also received and considered information about the advisory fees charged by the Investment Manager to institutional separate accounts. In considering the fees charged to those accounts, the Committee and the Board took into account, among other things, the Investment Manager's representations about the differences between managing mutual funds as compared to other types of accounts, including differences in the services provided, differences in the risk profile of such business for the Investment Manager and the additional resources required to manage mutual funds effectively. In evaluating the Fund's advisory fees, the Committee and the Board also took into account the demands, complexity and quality of the investment management of the Fund.
After reviewing these and related factors, the Committee and the Board concluded, within the context of their overall conclusions, that the advisory fee rates and expenses of the Fund supported the continuation of the Advisory Agreement.
Costs of Services Provided and Profitability
The Committee and the Board also took note of the costs of the services provided (both on an absolute and relative basis) and the profitability to the Investment Manager and its affiliates in connection with their relationships with the Fund. In evaluating these considerations, the Committee and the Board took note of the advisory fees charged by the Investment Manager to other clients, including fees charged by the Investment Manager to institutional separate account clients with similar investment strategies to those of the Fund.
The Committee and the Board also considered the compensation directly or indirectly received by the Investment Manager's affiliates in connection with their relationships with the Fund. The Committee and the Board reviewed information provided by management as to the profitability of the Investment Manager and its affiliates of their relationships with the Fund, information about the allocation of expenses used to calculate profitability, and comparisons of profitability levels realized in 2012 to profitability levels realized in 2011. When reviewing profitability, the Committee and the Board also considered court cases in which adviser profitability was an issue in whole or in part, the performance of the Fund, the expense ratio of the Fund, and the implementation of expense limitations with respect to the Fund. The Committee and the Board also considered information provided by the Investment Manager regarding its financial condition and comparing its profitability to that of other asset management firms that are, or are subsidiaries of, publicly traded companies.
After reviewing these and related factors, the Committee and the Board concluded, within the context of their overall conclusions, that the costs of services provided and the profitability to the Investment Manager and its affiliates from their relationships with the Fund supported the continuation of the Advisory Agreement.
Economies of Scale
The Committee and the Board considered the potential existence of economies of scale in the provision by the Investment Manager of services to the Fund, to groups of related funds, and to the Investment Manager's investment advisory clients as a whole, and whether those economies of scale were shared with the Fund through breakpoints in investment advisory fees or other means, such as expense limitation arrangements and additional investments by the Investment Manager in investment, trading and compliance resources. The Committee and the Board noted that the investment advisory fee schedules for the Fund contained breakpoints that would reduce the fee rate on assets above specified threshold levels.
In considering these matters, the Committee and the Board also considered the costs of the services provided and the profitability to the Investment Manager and its affiliates from their relationships with the Fund, as discussed above. After reviewing these and related factors, the Committee and the Board concluded, within the context of their overall conclusions, that the extent to which any economies of scale were expected to be shared with the Fund supported the continuation of the Advisory Agreement.
Annual Report 2013
52
Columbia Intermediate Municipal Bond Fund
Board Consideration and Approval of Advisory Agreement (continued)
Other Benefits to the Investment Manager
The Committee and the Board received and considered information regarding "fall-out" or ancillary benefits received by the Investment Manager and its affiliates as a result of their relationships with the Fund, such as the engagement of the Investment Manager to provide administrative services to the Fund and the engagement of the Investment Manager's affiliates to provide distribution and transfer agency services to the Fund. The Committee and the Board considered that the Fund's distributor retains a portion of the distribution fees from the Fund. The Committee and the Board also considered the benefits of research made available to the Investment Manager by reason of brokerage commissions generated by the Fund's securities transactions, and reviewed information about the Investment Manager's practices with respect to allocating portfolio transactions for brokerage and research services. The Committee and the Board considered the possible conflicts of interest associated with certain fall-out or other ancillary benefits and the reporting, disclosure and other processes that are in place to address such possible conflicts of interest. The Committee and the Board recognized that the Investment Manager's profitability would be somewhat lower without these benefits.
Conclusion
The Committee and the Board reviewed all of the above considerations in reaching their decisions to recommend or approve the continuation of the Advisory Agreement. In their deliberations, the Trustees did not identify any particular information that was all-important or controlling, and individual Trustees may have attributed different weights to the various factors. Based on their evaluation of all factors that they deemed to be material, including those factors described above, and assisted by the advice of independent legal counsel, the Board, including the Independent Trustees, voting separately, unanimously approved the continuation of the Advisory Agreement.
Annual Report 2013
53
This page intentionally left blank.
Annual Report 2013
54
This page intentionally left blank.
Annual Report 2013
55
This page intentionally left blank.
Annual Report 2013
56
Columbia Intermediate Municipal Bond Fund
Important Information About This Report
Each fund mails one shareholder report to each shareholder address. If you would like more than one report, please call shareholder services at 800.345.6611 and additional reports will be sent to you.
The policy of the Board is to vote the proxies of the companies in which each fund holds investments consistent with the procedures as stated in the Statement of Additional Information (SAI). You may obtain a copy of the SAI without charge by calling 800.345.6611; contacting your financial intermediary; visiting columbiamanagement.com; or searching the website of the Securities and Exchange Commission (SEC) at sec.gov. Information regarding how each fund voted proxies relating to portfolio securities is filed with the SEC by August 31 for the most recent 12-month period ending June 30 of that year, and is available without charge by visiting columbiamanagement.com; or searching the website of the SEC at sec.gov.
Each fund files a complete schedule of portfolio holdings with the SEC for the first and third quarters of each fiscal year on Form N-Q. Each fund's Form N-Q is available on the SEC's website at sec.gov and may be reviewed and copied at the SEC's Public Reference Room in Washington, D.C. Information on the operation of the Public Reference Room may be obtained by calling 800.SEC.0330. Each fund's complete schedule of portfolio holdings, as filed on Form N-Q, can also be obtained without charge, upon request, by calling 800.345.6611.
Annual Report 2013
57

Columbia Intermediate Municipal Bond Fund
P.O. Box 8081
Boston, MA 02266-8081
columbiamanagement.com
This information is for use with concurrent or prior delivery of a fund prospectus. Please read and consider the investment objectives, risks, charges and expenses for any fund carefully before investing. For a prospectus and, if available, a summary prospectus, which contains this and other important information about the Fund go to columbiamanagement.com. The Fund is distributed by Columbia Management Investment Distributors, Inc., member FINRA, and managed by Columbia Management Investment Advisers, LLC.
© 2013 Columbia Management Investment Advisers, LLC. All rights reserved.
ANN167_10_C01_(12/13)
Annual Report
October 31, 2013

Columbia New York Tax-Exempt Fund
Not FDIC insured • No bank guarantee • May lose value
 Dear Shareholders,
A market rally led by equities
Despite threats of military action in Syria, rumblings from Iran and an impending showdown over the debt ceiling here at home, the U.S. financial markets delivered positive results in the third quarter of 2013. Stocks outperformed bonds by a substantial margin. Still, robust growth continued to elude the U.S. economy, which merely plodded along. New job growth was solid but not spectacular. Consumer spending remained steady, but the only obvious beneficiary was the auto industry. Gains in the housing market met some headwinds, as mortgage rates rose and sales slipped somewhat. Nevertheless, the recovery in housing remained intact.
The Federal Reserve (the Fed) unsettled investors with a hint that it was ready to taper its purchase of U.S. Treasury and mortgage securities. However, its failure to take any action in a September meeting rallied stocks to new highs and brought bonds back into positive territory for the quarter. Small-cap stocks were the U.S. market leaders. Growth outperformed value in a quarter dominated by the materials, industrials and consumer discretionary sectors. Developed markets led the global rally, driven by strengthening economic conditions in the eurozone. Certain emerging stock markets, including China's, bounced back with returns in line with those of the United States. India and Indonesia were exceptions to that trend, as fears of the Fed's tapering efforts rattled investors in both countries.
Improved risk appetites boosted fixed income
Following a weak second quarter, the fixed-income markets made up some ground in the third quarter of 2013. As yields fell, bond prices rallied enough to push returns on non-Treasury sectors into positive territory. Risk appetites improved in response to continued liquidity from the Fed. Against this backdrop, U.S. high-yield and foreign bonds led the fixed-income markets, along with mortgage-backed securities and emerging market bonds. The U.S. municipal bond market was the exception, as it slipped into negative territory in the final week of the period, pressured by heightened concerns over Puerto Rico, potential municipal bankruptcies and continued fund redemptions.
Stay on track with Columbia Management
Backed by more than 100 years of experience, Columbia Management is one of the nation's largest asset managers. At the heart of our success and, most importantly, that of our investors, are highly talented industry professionals, brought together by a unique way of working. At Columbia Management, reaching our performance goals matters, and how we reach them matters just as much.
Visit columbiamanagement.com for:
> The Columbia Management Perspectives blog, offering insights on current market events and investment opportunities
> Detailed up-to-date fund performance and portfolio information
> Quarterly fund commentaries
> Columbia Management Investor, our award-winning quarterly newsletter for shareholders
Thank you for your continued support of the Columbia Funds. We look forward to serving your investment needs for many years to come.
Best Regards,

J. Kevin Connaughton
President, Columbia Funds
Investing involves risk including the risk of loss of principal.
Investors should consider the investment objectives, risks, charges and expenses of a mutual fund carefully before investing. For a free prospectus, which contains this and other important information about a fund, visit columbiamanagement.com. The prospectus should be read carefully before investing.
Columbia Funds are distributed by Columbia Management Investment Distributors, Inc., member FINRA, and managed by Columbia Management Investment Advisers, LLC.
© 2013 Columbia Management Investment Advisers, LLC. All rights reserved.
Columbia New York Tax-Exempt Fund
Performance Overview | | | 2 | | |
Manager Discussion of Fund Performance | | | 4 | | |
Understanding Your Fund's Expenses | | | 6 | | |
Portfolio of Investments | | | 7 | | |
Statement of Assets and Liabilities | | | 15 | | |
Statement of Operations | | | 17 | | |
Statement of Changes in Net Assets | | | 18 | | |
Financial Highlights | | | 20 | | |
Notes to Financial Statements | | | 26 | | |
Report of Independent Registered
Public Accounting Firm | | | 32 | | |
Federal Income Tax Information | | | 33 | | |
Trustees and Officers | | | 34 | | |
Board Consideration and Approval of Advisory Agreement | | | 37 | | |
Important Information About This Report | | | 41 | | |
Fund Investment Manager
Columbia Management Investment
Advisers, LLC
225 Franklin Street
Boston, MA 02110
Fund Distributor
Columbia Management Investment
Distributors, Inc.
225 Franklin Street
Boston, MA 02110
Fund Transfer Agent
Columbia Management Investment
Services Corp.
P.O. Box 8081
Boston, MA 02266-8081
For more information about any of the funds, please visit columbiamanagement.com or call 800.345.6611. Customer Service Representatives are available to answer your questions Monday through Friday from 8 a.m. to 8 p.m. Eastern time.
The views expressed in this report reflect the current views of the respective parties. These views are not guarantees of future performance and involve certain risks, uncertainties and assumptions that are difficult to predict, so actual outcomes and results may differ significantly from the views expressed. These views are subject to change at any time based upon economic, market or other conditions and the respective parties disclaim any responsibility to update such views. These views may not be relied on as investment advice and, because investment decisions for a Columbia Fund are based on numerous factors, may not be relied on as an indication of trading intent on behalf of any particular Columbia Fund. References to specific securities should not be construed as a recommendation or investment advice.
Columbia New York Tax-Exempt Fund
Performance Summary
> Columbia New York Tax-Exempt Fund (the Fund) Class A shares returned -3.20% excluding sales charges for the 12-month period that ended October 31, 2013. The Fund's Class Z shares returned -2.96% for the same time period.
> By comparison, the Fund's benchmarks, the Barclays New York Municipal Bond Index and the broader Barclays Municipal Bond Index, returned -1.40% and -1.72%, respectively, for the same 12-month period.
> Effective sector allocation overall was more than offset by duration and yield curve positioning and security selection as a whole, which detracted.
Average Annual Total Returns (%) (for period ended October 31, 2013)
| | | Inception | | 1 Year | | 5 Years | | 10 Years | |
Class A | | 09/26/86 | | | | | | | | | | | | | |
Excluding sales charges | | | | | | | -3.20 | | | | 7.21 | | | | 4.25 | | |
Including sales charges | | | | | | | -7.84 | | | | 6.17 | | | | 3.75 | | |
Class B | | 08/04/92 | | | | | | | | | | | | | |
Excluding sales charges | | | | | | | -3.93 | | | | 6.42 | | | | 3.47 | | |
Including sales charges | | | | | | | -8.57 | | | | 6.10 | | | | 3.47 | | |
Class C | | 08/01/97 | | | | | | | | | | | | | |
Excluding sales charges | | | | | | | -3.64 | | | | 6.74 | | | | 3.78 | | |
Including sales charges | | | | | | | -4.57 | | | | 6.74 | | | | 3.78 | | |
Class R4* | | 03/19/13 | | | -3.07 | | | | 7.24 | | | | 4.26 | | |
Class R5* | | 11/08/12 | | | -2.83 | | | | 7.30 | | | | 4.29 | | |
Class Z* | | 09/01/11 | | | -2.96 | | | | 7.33 | | | | 4.30 | | |
Barclays New York Municipal Bond Index | | | | | | | -1.40 | | | | 6.10 | | | | 4.47 | | |
Barclays Municipal Bond Index | | | | | | | -1.72 | | | | 6.37 | | | | 4.53 | | |
Returns for Class A are shown with and without the maximum initial sales charge of 4.75%. Returns for Class B are shown with and without the applicable contingent deferred sales charge (CDSC) of 5.00% in the first year, declining to 1.00% in the sixth year and eliminated thereafter. Returns for Class C are shown with and without the 1.00% CDSC for the first year only. The Fund's other classes are not subject to sales charges and have limited eligibility. Please see the Fund's prospectus for details. Performance for different share classes will vary based on differences in sales charges and fees associated with each class. All results shown assume reinvestment of distributions during the period. Returns do not reflect the deduction of taxes that a shareholder may pay on Fund distributions or on the redemption of Fund shares. Performance results reflect the effect of any fee waivers or reimbursements of Fund expenses by Columbia Management Investment Advisers, LLC and/or any of its affiliates. Absent these fee waivers or expense reimbursement arrangements, performance results would have been lower.
The performance information shown represents past performance and is not a guarantee of future results. The investment return and principal value of your investment will fluctuate so that your shares, when redeemed, may be worth more or less than their original cost. Current performance may be lower or higher than the performance information shown. You may obtain performance information current to the most recent month-end by contacting your financial intermediary, visiting columbiamanagement.com or calling 800.345.6611.
*The returns shown for periods prior to the share class inception date (including returns for the Life of the Fund, if shown, which are since Fund inception) include the returns of the Fund's oldest share class. These returns are adjusted to reflect any higher class-related operating expenses of the newer share classes, as applicable. Please visit columbiamanagement.com/mutual-funds/appended-performance for more information.
The Barclays New York Municipal Bond Index is a market-capitalization-weighted index of New York investment grade bonds with maturity of one year or more.
The Barclays Municipal Bond Index is an unmanaged index considered representative of the broad market for investment-grade, tax-exempt bonds with a maturity of at least one year.
Indices are not available for investment, are not professionally managed and do not reflect sales charges, fees, brokerage commissions, taxes or other expenses of investing. Securities in the Fund may not match those in an index.
Annual Report 2013
2
Columbia New York Tax-Exempt Fund
Performance Overview (continued)
Performance of a Hypothetical $10,000 Investment (November 1, 2003 – October 31, 2013)
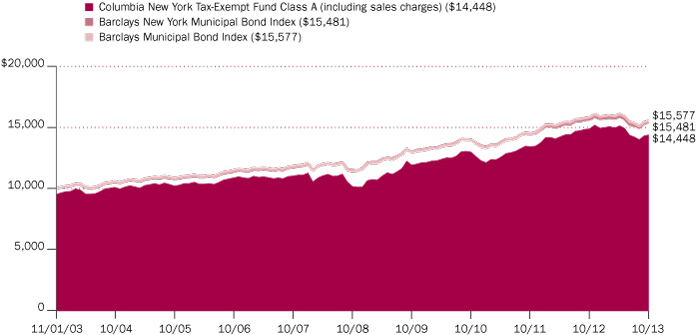
The chart above shows the change in value of a hypothetical $10,000 investment in Class A shares of Columbia New York Tax-Exempt Fund during the stated time period, and does not reflect the deduction of taxes that a shareholder may pay on Fund distributions or on the redemption of Fund shares.
Annual Report 2013
3
Columbia New York Tax-Exempt Fund
Manager Discussion of Fund Performance
For the 12-month period that ended October 31, 2013, the Fund's Class A shares returned -3.20% excluding sales charges. The Fund's Class Z shares returned -2.96% for the same time period. By comparison, the Fund's benchmarks, the Barclays New York Municipal Bond Index (Barclays NY Index) and the broad Barclays Municipal Bond Index, returned -1.40% and -1.72%, respectively, for the same period. Effective sector allocation was more than offset by duration and yield curve positioning and security selection, which detracted.
Tax-Exempt Bond Market Faced Multiple Headwinds
The tax-exempt fixed income market struggled during the period, with municipal bond yields rising across the yield curve. (Remember, there is usually an inverse relationship between bond prices and yield movements, so that bond prices fall when yields rise and vice versa.) Yields on longer-term maturities rose more than on shorter-term maturities, resulting in a steeper municipal bond yield curve.
When the period began in November 2012, the municipal bond market was strong. Municipal bond yields were generally falling and demand was high, as the potential for higher taxes and a limit on deductions following the U.S. elections drove investors to the tax-exempt asset class. However, in December 2012, there was a sharp correction, as U.S. Treasury yields rose with expectations that Congress would negotiate a deal to avert the fiscal cliff, increased amounts of debt came to market and investors started assessing the tax benefits of taking gains ahead of suspected tax increases in 2013. Following a rebound in January 2013, fund outflows picked up in February and were elevated through most of the period, as market tone softened, despite modest municipal supply. By April, typical bond selling that occurs to pay tax bills appeared to be compounded by strong stock market performance and increasing talk of a rotation out of bonds into riskier assets. In June 2013, following mid-May comments by Federal Reserve (Fed) Chair Bernanke, the markets began anticipating the tapering of monetary policy stimulus. A stronger belief in brightening economic growth prospects perpetuated heavy municipal bond fund outflows, causing significant selling pressure and, in turn, higher yields.
July and August 2013 saw negative returns in the Barclays Municipal Bond Index due to sharply higher interest rates that resulted from confusion over Fed policy and heightened concerns about the fiscal health of Detroit and Puerto Rico. Municipal bond mutual fund redemptions hit record levels, further pressuring bond prices. September 2013 reversed course, with the municipal bond market posting gains as market fears faded with the Fed's unanticipated decision to delay tapering of its quantitative easing program along with continued slow issuance. The broad fixed income market rally continued into October. The U.S. government shutdown and Puerto Rico's debt were notable concerns, but neither seemed to materially impact the municipal bond market in October. Both concerns were more than offset by the positive impact of mid-month actions on both fronts along with low net new supply and seemingly stabilizing mutual fund outflows. Municipal bond yields fell through the last two months of the period.
From a fundamental perspective, states posted better revenue results on the back of increasing sales, income and property taxes. While negative credit stories made headlines — including the state of Illinois' inability to balance its budget, Puerto Rico's two-notch downgrade by Moody's and Detroit's Chapter 9 bankruptcy filing — it is well worth noting that such issues are not representative of the broad municipal bond market. Overall default rates trended down and were at their lowest level since at least 2009. The credit trends of New York were particularly positive, driven by improving economic conditions, solid financials
Portfolio Management
Catherine Stienstra
Quality Breakdown (%)
(at October 31, 2013) | |
AAA rating | | | 3.2 | | |
AA rating | | | 30.9 | | |
A rating | | | 43.2 | | |
BBB rating | | | 16.5 | | |
Non-investment grade | | | 2.1 | | |
Not rated | | | 4.1 | | |
Total | | | 100.0 | | |
Percentages indicated are based upon total fixed income securities (excluding Money Market Funds).
Bond ratings apply to the underlying holdings of the Fund and not the Fund itself and are divided into categories ranging from AAA (highest) to D (lowest), and are subject to change. The ratings shown are determined by using the middle rating of Moody's, S&P, and Fitch after dropping the highest and lowest available ratings. When a rating from only two agencies is available, the lower rating is used. When a rating from only one agency is available, that rating is used. When a bond is not rated by one of these agencies, it is designated as Not rated. Credit ratings are subjective opinions and not statements of fact.
Investment Risks
There are risks associated with an investment in a municipal bond fund, including credit risk, interest rate risk, prepayment and extension risk, and geographic concentration risk. In general, bond prices rise when interest rates fall and vice versa. This effect is more pronounced for longer-term securities. Because the Fund concentrates its investments in municipal securities issued by a single state and its municipalities, specific events or factors affecting a particular state can cause more volatility in the Fund than a fund that is more geographically diversified. Non-investment grade securities, commonly called "high-yield" or "junk" bonds, have more volatile prices and carry more risk to principal and income than investment grade securities. Income from tax-exempt funds may be subject to state and local taxes and a portion of income may be subject to the federal and/or state alternative minimum tax for certain investors. Federal and state income tax rules will apply to any capital gain distributions and any gains or losses on sales. See the Fund's prospectus for information on these and other risks.
Annual Report 2013
4
Columbia New York Tax-Exempt Fund
Manager Discussion of Fund Performance (continued)
results and improved governance. The state passed on-time budgets for the past three years and the 2014 enacted budget holds spending to a modest 1.9% growth rate. New York's budget performance and liquidity improved during fiscal 2012 and 2013, with an emphasis on ongoing budget cuts and restraints on automatic growth in school and health care funding.
Duration and Yield Curve Positioning Hampered Returns
Detracting most from Fund results was the combined effect of duration and yield curve positioning. The Fund had a longer duration than the Barclays NY Index, which hurt as tax-exempt bond rates rose. (Duration is a measure of the Fund's sensitivity to changes in interest rates.) Also, an overweight relative to the Barclays NY Index to bonds with maturities of 15 to 25 years and an underweight to bonds with maturities of one to 10 years detracted, as longer-dated maturities underperformed shorter-term maturities given the steepening of the municipal bond yield curve. Having an underweighted allocation to local general obligation bonds, which outperformed the Barclays NY Index, also hurt the Fund's results, as did having an underweighted allocation to securities rated AAA and AA, which was the best performing quality segment of the Barclays NY Index. Security selection among bonds rated AAA and AA and bonds in the education, transportation and leasing sectors detracted as well.
Effective Sector Allocation Boosted Fund Performance
The Fund benefited from its significant allocation to the hospital sector, which outpaced the Barclays NY Index, and from its underweighted exposure to the water and sewer sector, which lagged the Barclays NY Index. The Fund's exposure to high yield municipal bonds also boosted the Fund's results, as the total return generated from these securities was positive.
Fundamental Analysis Drove Portfolio Changes
During the period, we decreased the Fund's exposure to the health care, education and sales tax revenue sectors and to securities rated AA. We further reduced an already underweighted exposure to Puerto Rico debt to less than 1% of the Fund's total net assets. We increased the Fund's exposure to the transportation and local general obligation sectors and to securities rated BBB. In anticipation of an eventual rise in interest rates, we shifted to a more defensive portfolio stance by increasing the average coupon of the Fund.
Looking Ahead
In our current view, supply/demand factors should be supportive of the municipal bond market over the near term, although we believe such factors remain sensitive to news flow regarding fiscal policy negotiations, Detroit's and Puerto Rico's credit, and Fed decisions. As such, we intend to monitor supply/demand factors closely in the months ahead.
Given what we believe is the potential for interest rates to continue to rise until further developments out of Washington, D.C. and/or the sustainability of economic growth become clearer, we currently intend to seek to bring the Fund's duration closer to that of the Barclays NY Index. To help sustain a competitive yield, we expect to implement this strategy by selling longer term, higher quality securities in favor of shorter maturity, lower investment grade securities. As always, the Fund's emphasis remains on generating both a high level of income generally exempt from federal income tax and New York state and local taxes as well as capital appreciation, consistent with moderate fluctuation of principal.
Annual Report 2013
5
Columbia New York Tax-Exempt Fund
Understanding Your Fund's Expenses
(Unaudited)
As an investor, you incur two types of costs. There are transaction costs, which generally include sales charges on purchases and may include redemption fees. There are also ongoing costs, which generally include management fees, distribution and service (Rule 12b-1) fees, and other fund expenses. The following information is intended to help you understand your ongoing costs (in dollars) of investing in the Fund and to help you compare these costs with the ongoing costs of investing in other mutual funds.
Analyzing Your Fund's Expenses
To illustrate these ongoing costs, we have provided examples and calculated the expenses paid by investors in each share class of the Fund during the period. The actual and hypothetical information in the table is based on an initial investment of $1,000 at the beginning of the period indicated and held for the entire period. Expense information is calculated two ways and each method provides you with different information. The amount listed in the "Actual" column is calculated using the Fund's actual operating expenses and total return for the period. You may use the Actual information, together with the amount invested, to estimate the expenses that you paid over the period. Simply divide your account value by $1,000 (for example, an $8,600 account value divided by $1,000 = 8.6), then multiply the results by the expenses paid during the period under the Actual column. The amount listed in the "Hypothetical" column assumes a 5% annual rate of return before expenses (which is not the Fund's actual return) and then applies the Fund's actual expense ratio for the period to the hypothetical return. You should not use the hypothetical account values and expenses to estimate either your actual account balance at the end of the period or the expenses you paid during the period. See "Compare With Other Funds" below for details on how to use the hypothetical data.
Compare With Other Funds
Since all mutual funds are required to include the same hypothetical calculations about expenses in shareholder reports, you can use this information to compare the ongoing cost of investing in the Fund with other funds. To do so, compare the hypothetical example with the 5% hypothetical examples that appear in the shareholder reports of other funds. As you compare hypothetical examples of other funds, it is important to note that hypothetical examples are meant to highlight the ongoing costs of investing in a fund only and do not reflect any transaction costs, such as sales charges, or redemption or exchange fees. Therefore, the hypothetical calculations are useful in comparing ongoing costs only, and will not help you determine the relative total costs of owning different funds. If transaction costs were included in these calculations, your costs would be higher.
May 1, 2013 — October 31, 2013
| | | Account Value at the Beginning
of the Period ($) | | Account Value at the End of the
Period ($) | | Expenses Paid During the
Period ($) | | Fund's Annualized
Expense Ratio (%) | |
| | | Actual | | Hypothetical | | Actual | | Hypothetical | | Actual | | Hypothetical | | Actual | |
Class A | | | 1,000.00 | | | | 1,000.00 | | | | 952.70 | | | | 1,021.27 | | | | 3.84 | | | | 3.97 | | | | 0.78 | | |
Class B | | | 1,000.00 | | | | 1,000.00 | | | | 949.10 | | | | 1,017.49 | | | | 7.52 | | | | 7.78 | | | | 1.53 | | |
Class C | | | 1,000.00 | | | | 1,000.00 | | | | 950.50 | | | | 1,019.00 | | | | 6.05 | | | | 6.26 | | | | 1.23 | | |
Class R4 | | | 1,000.00 | | | | 1,000.00 | | | | 953.80 | | | | 1,022.53 | | | | 2.61 | | | | 2.70 | | | | 0.53 | | |
Class R5 | | | 1,000.00 | | | | 1,000.00 | | | | 955.20 | | | | 1,022.74 | | | | 2.41 | | | | 2.50 | | | | 0.49 | | |
Class Z | | | 1,000.00 | | | | 1,000.00 | | | | 953.90 | | | | 1,022.53 | | | | 2.61 | | | | 2.70 | | | | 0.53 | | |
Expenses paid during the period are equal to the annualized expense ratio for each class as indicated above, multiplied by the average account value over the period and then multiplied by the number of days in the Fund's most recent fiscal half year and divided by 365.
Expenses do not include fees and expenses incurred indirectly by the Fund from the underlying funds in which the Fund may invest (also referred to as "acquired funds"), including affiliated and non-affiliated pooled investment vehicles (including mutual funds and exchange-traded funds).
Had Columbia Management Investment Advisers, LLC and/or certain of its affiliates not waived/reimbursed certain fees and expenses, account value at the end of the period would have been reduced.
Annual Report 2013
6
Columbia New York Tax-Exempt Fund
Portfolio of Investments
October 31, 2013
(Percentages represent value of investments compared to net assets)
Municipal Bonds 96.7%
Issue
Description | | Coupon
Rate | | Principal
Amount ($) | | Value ($) | |
Air Transportation 4.6% | |
New York City Industrial Development Agency(a)
Refunding Revenue Bonds
Trips Obligated Group
Senior Series 2012A AMT
07/01/28 | | | 5.000 | % | | | 2,000,000 | | | | 1,900,080 | | |
Revenue Bonds
Terminal One Group Association Project
Series 2005 AMT
01/01/15 | | | 5.500 | % | | | 1,500,000 | | | | 1,576,815 | | |
New York City Industrial Development Agency(a)(b)
Revenue Bonds
Terminal One Group Association Project
Series 2005 AMT
01/01/24 | | | 5.500 | % | | | 2,000,000 | | | | 2,149,860 | �� | |
Port Authority of New York & New Jersey
Revenue Bonds
JFK International Air Terminal
Series 2010
12/01/42 | | | 6.000 | % | | | 2,000,000 | | | | 2,145,060 | | |
Total | | | | | | | 7,771,815 | | |
Assisted Living 1.3% | |
Huntington Housing Authority
Revenue Bonds
Gurwin Jewish Senior Residences
Series 1999A
05/01/19 | | | 5.875 | % | | | 1,005,000 | | | | 1,007,000 | | |
Mount Vernon Industrial Development Agency
Revenue Bonds
Wartburg Senior Housing, Inc. — Meadowview
Series 1999
06/01/19 | | | 6.150 | % | | | 590,000 | | | | 590,301 | | |
06/01/29 | | | 6.200 | % | | | 615,000 | | | | 608,610 | | |
Total | | | | | | | 2,205,911 | | |
Higher Education 12.2% | |
Dutchess County Local Development Corp.
Refunding Revenue Bonds
Marist College Project
Series 2012A
07/01/21 | | | 5.000 | % | | | 675,000 | | | | 783,641 | | |
Geneva Development Corp.
Refunding Revenue Bonds
Hobart & William Smith College
Series 2012
09/01/25 | | | 5.000 | % | | | 295,000 | | | | 326,547 | | |
Nassau County Industrial Development Agency
Refunding Revenue Bonds
New York Institute of Technology Project
Series 2000A
03/01/26 | | | 4.750 | % | | | 1,210,000 | | | | 1,243,481 | | |
Municipal Bonds (continued)
Issue
Description | | Coupon
Rate | | Principal
Amount ($) | | Value ($) | |
New York State Dormitory Authority
Revenue Bonds
Consolidated City University System 5th General Resolution
Series 2008B
07/01/27 | | | 5.000 | % | | | 1,000,000 | | | | 1,094,500 | | |
Cornell University
Series 2006A
07/01/31 | | | 5.000 | % | | | 1,000,000 | | | | 1,080,360 | | |
Series 2009A
07/01/27 | | | 5.000 | % | | | 1,000,000 | | | | 1,112,260 | | |
Culinary Institute of America
Series 2012
07/01/34 | | | 5.000 | % | | | 350,000 | | | | 342,909 | | |
Manhattan Marymount College
Series 2009
07/01/29 | | | 5.250 | % | | | 1,500,000 | | | | 1,519,680 | | |
Mount Sinai School of Medicine
Series 2009
07/01/39 | | | 5.125 | % | | | 1,000,000 | | | | 1,018,870 | | |
NYSARC, Inc.
Series 2012A
07/01/22 | | | 5.000 | % | | | 890,000 | | | | 1,020,563 | | |
Pratt Institute
Series 2009C (AGM)
07/01/39 | | | 5.125 | % | | | 1,000,000 | | | | 1,028,380 | | |
St. John's University
Series 2007A (NPFGC)
07/01/32 | | | 5.250 | % | | | 1,000,000 | | | | 1,023,670 | | |
Series 2007C (NPFGC)
07/01/26 | | | 5.250 | % | | | 1,205,000 | | | | 1,387,220 | | |
Series 2012A
07/01/27 | | | 5.000 | % | | | 240,000 | | | | 258,331 | | |
State University Dormitory Facilities
Series 2011A
07/01/31 | | | 5.000 | % | | | 1,000,000 | | | | 1,061,340 | | |
Teacher's College
Series 2009
03/01/39 | | | 5.500 | % | | | 500,000 | | | | 523,925 | | |
The New School
Series 2010
07/01/40 | | | 5.500 | % | | | 1,500,000 | | | | 1,574,895 | | |
Niagara Area Development Corp.
Revenue Bonds
Niagra University Project
Series 2012A
05/01/35 | | | 5.000 | % | | | 500,000 | | | | 498,695 | | |
Seneca County Industrial Development Agency
Revenue Bonds
New York Chiropractic College
Series 2007
10/01/27 | | | 5.000 | % | | | 750,000 | | | | 760,073 | | |
The accompanying Notes to Financial Statements are an integral part of this statement.
Annual Report 2013
7
Columbia New York Tax-Exempt Fund
Portfolio of Investments (continued)
October 31, 2013
Municipal Bonds (continued)
Issue
Description | | Coupon
Rate | | Principal
Amount ($) | | Value ($) | |
St. Lawrence County Industrial Development Agency
Revenue Bonds
Clarkson University Project
Series 2007
07/01/31 | | | 5.000 | % | | | 1,000,000 | | | | 1,021,070 | | |
Town of Hempstead Local Development Corp.
Revenue Bonds
Molloy College Project
Series 2009
07/01/39 | | | 5.750 | % | | | 1,000,000 | | | | 1,030,570 | | |
Yonkers Industrial Development Agency
Revenue Bonds
Sarah Lawrence College Project
Series 2001A
06/01/29 | | | 6.000 | % | | | 1,000,000 | | | | 1,082,510 | | |
Total | | | | | | | 20,793,490 | | |
Hospital 17.9% | |
Albany Industrial Development Agency
Revenue Bonds
St. Peters Hospital Project
Series 2008A
11/15/27 | | | 5.250 | % | | | 2,000,000 | | | | 2,097,860 | | |
Monroe County Industrial Development Corp.
Refunding Revenue Bonds
Rochester General Hospital
Series 2013A
12/01/32 | | | 5.000 | % | | | 1,350,000 | | | | 1,366,659 | | |
Revenue Bonds
Unity Hospital-Rochester Project
Series 2010 (FHA)
08/15/35 | | | 5.750 | % | | | 2,000,000 | | | | 2,194,080 | | |
New York State Dormitory Authority
Revenue Bonds
Kaleida Health
Series 2006 (FHA)
02/15/35 | | | 4.700 | % | | | 1,000,000 | | | | 978,850 | | |
Mount Sinai Hospital
Series 2010A
07/01/26 | | | 5.000 | % | | | 2,275,000 | | | | 2,442,667 | | |
Series 2011A
07/01/41 | | | 5.000 | % | | | 2,000,000 | | | | 2,021,440 | | |
NYU Hospital Center
Series 2007B
07/01/37 | | | 5.625 | % | | | 1,000,000 | | | | 1,022,640 | | |
New York Hospital Medical Center
Series 2007 (FHA)
02/15/37 | | | 4.750 | % | | | 975,000 | | | | 977,584 | | |
New York University Hospital Center
Series 2006A
07/01/20 | | | 5.000 | % | | | 500,000 | | | | 542,265 | | |
Series 2007B
07/01/24 | | | 5.250 | % | | | 640,000 | | | | 681,146 | | |
Municipal Bonds (continued)
Issue
Description | | Coupon
Rate | | Principal
Amount ($) | | Value ($) | |
Series 2011A
07/01/31 | | | 5.750 | % | | | 800,000 | | | | 858,416 | | |
North Shore-Long Island Jewish Obligation Group
Series 2007A
05/01/32 | | | 5.000 | % | | | 1,000,000 | | | | 1,009,900 | | |
Series 2009A
05/01/37 | | | 5.500 | % | | | 2,000,000 | | | | 2,085,620 | | |
Orange Regional Medical Center
Series 2008
12/01/29 | | | 6.125 | % | | | 1,900,000 | | | | 1,911,799 | | |
University of Rochester
Series 2007B
07/01/27 | | | 5.000 | % | | | 1,000,000 | | | | 1,078,160 | | |
Series 2009A
07/01/39 | | | 5.125 | % | | | 1,000,000 | | | | 1,059,830 | | |
Saratoga County Industrial Development Agency
Revenue Bonds
Saratoga Hospital Project
Series 2007B
12/01/32 | | | 5.250 | % | | | 500,000 | | | | 506,570 | | |
Suffolk County Economic Development Corp.
Revenue Bonds
Catholic Health Services
Series 2011
07/01/28 | | | 5.000 | % | | | 3,500,000 | | | | 3,589,355 | | |
Westchester County Healthcare Corp.
Revenue Bonds
Senior Lien
Series 2010C-2
11/01/37 | | | 6.125 | % | | | 1,850,000 | | | | 1,999,998 | | |
Series 2011A
11/01/30 | | | 5.000 | % | | | 2,000,000 | | | | 2,047,660 | | |
Total | | | | | | | 30,472,499 | | |
Human Service Provider 0.6% | |
Dutchess County Local Development Corp.
Revenue Bonds
Anderson Center Services, Inc. Project
Series 2010
10/01/30 | | | 6.000 | % | | | 1,000,000 | | | | 994,690 | | |
Independent Power 0.5% | |
Suffolk County Industrial Development Agency
Revenue Bonds
Nissequogue Cogen Partners Facility
Series 1998 AMT(a)
01/01/23 | | | 5.500 | % | | | 1,000,000 | | | | 936,900 | | |
Investor Owned 0.9% | |
New York State Energy Research & Development Authority
Revenue Bonds
Series 1993(b)
04/01/20 | | | 12.336 | % | | | 1,500,000 | | | | 1,502,310 | | |
The accompanying Notes to Financial Statements are an integral part of this statement.
Annual Report 2013
8
Columbia New York Tax-Exempt Fund
Portfolio of Investments (continued)
October 31, 2013
Municipal Bonds (continued)
Issue
Description | | Coupon
Rate | | Principal
Amount ($) | | Value ($) | |
Local Appropriation 0.6% | |
New York State Dormitory Authority
Revenue Bonds
Capital Appreciation-Court Facilities
Series 1998(c)
08/01/19 | | | 0.000 | % | | | 1,200,000 | | | | 1,082,988 | | |
Local General Obligation 7.5% | |
City of New York
Unlimited General Obligation Bonds
Series 2010B
08/01/21 | | | 5.000 | % | | | 500,000 | | | | 584,170 | | |
Series 2013J
08/01/24 | | | 5.000 | % | | | 1,000,000 | | | | 1,163,880 | | |
Subordinated Series 2009I-1
04/01/27 | | | 5.125 | % | | | 1,500,000 | | | | 1,673,850 | | |
City of Syracuse
Unlimited General Obligation Bonds
Airport Terminal Security Access Improvement
Series 2011 AMT(a)
11/01/36 | | | 5.000 | % | | | 1,750,000 | | | | 1,752,292 | | |
County of Monroe
Unlimited General Obligation Refunding & Public Improvement Bonds
Series 1996 (NPFGC)
03/01/15 | | | 6.000 | % | | | 1,250,000 | | | | 1,329,488 | | |
County of Rockland
General Obligation Limited Notes
RAN Series 2013B
06/27/14 | | | 1.750 | % | | | 1,220,000 | | | | 1,220,183 | | |
County of Suffolk
Limited General Obligation Bonds
Public Improvement
Series 2013A (AGM)
06/15/18 | | | 3.250 | % | | | 500,000 | | | | 534,605 | | |
Mount Sinai Union Free School District
Unlimited General Obligation Refunding Bonds
Series 1992 (AMBAC)
02/15/19 | | | 6.200 | % | | | 1,005,000 | | | | 1,237,034 | | |
New York State Dormitory Authority
Revenue Bonds
School Districts Bond Financing
Series 2013F
10/01/21 | | | 5.000 | % | | | 1,000,000 | | | | 1,174,410 | | |
Sullivan West Central School District
Unlimited General Obligation Refunding Bonds
Series 2012
04/15/24 | | | 5.000 | % | | | 500,000 | | | | 580,180 | | |
Town of Ramapo
Refunding General Obligation Limited Notes
BAN Series 2013
05/28/14 | | | 4.700 | % | | | 1,500,000 | | | | 1,509,570 | | |
Total | | | | | | | 12,759,662 | | |
Municipal Bonds (continued)
Issue
Description | | Coupon
Rate | | Principal
Amount ($) | | Value ($) | |
Multi-Family 2.3% | |
Housing Development Corp.
Revenue Bonds
Gateway Apartments
Series 2009A
09/15/25 | | | 4.500 | % | | | 165,000 | | | | 171,519 | | |
Series 2009C-1
11/01/34 | | | 5.500 | % | | | 500,000 | | | | 518,700 | | |
Series 2009M
11/01/45 | | | 5.150 | % | | | 1,250,000 | | | | 1,266,113 | | |
Onondaga Civic Development Corp.
Revenue Bonds
Upstate Properties Development, Inc.
Series 2011
12/01/41 | | | 5.250 | % | | | 1,945,000 | | | | 1,983,394 | | |
Total | | | | | | | 3,939,726 | | |
Municipal Power 3.1% | |
Long Island Power Authority
Revenue Bonds
Series 2008A
05/01/33 | | | 6.000 | % | | | 1,000,000 | | | | 1,139,240 | | |
Series 2009A
04/01/23 | | | 5.000 | % | | | 750,000 | | | | 809,730 | | |
Series 2012A
09/01/37 | | | 5.000 | % | | | 2,000,000 | | | | 2,037,040 | | |
Puerto Rico Electric Power Authority
Revenue Bonds
Series 2013A(d)
07/01/36 | | | 6.750 | % | | | 1,500,000 | | | | 1,277,445 | | |
Total | | | | | | | 5,263,455 | | |
Nursing Home 0.3% | |
Amherst Industrial Development Agency
Revenue Bonds
Beechwood Health Care Center, Inc.
Series 2007
01/01/40 | | | 5.200 | % | | | 720,000 | | | | 593,359 | | |
Other Bond Issue 0.3% | |
Westchester County Industrial Development Agency
Revenue Bonds
Guiding Eyes for the Blind
Series 2004
08/01/24 | | | 5.375 | % | | | 520,000 | | | | 534,196 | | |
Other Industrial Development Bond 3.2% | |
New York Liberty Development Corp.
Revenue Bonds
Goldman Sachs Headquarters
Series 2007
10/01/37 | | | 5.500 | % | | | 1,000,000 | | | | 1,092,870 | | |
The accompanying Notes to Financial Statements are an integral part of this statement.
Annual Report 2013
9
Columbia New York Tax-Exempt Fund
Portfolio of Investments (continued)
October 31, 2013
Municipal Bonds (continued)
Issue
Description | | Coupon
Rate | | Principal
Amount ($) | | Value ($) | |
New York State Energy Research & Development Authority
Revenue Bonds
Brooklyn Union Gas Co. Project
Series 1996 (NPFGC)
01/01/21 | | | 5.500 | % | | | 2,000,000 | | | | 2,007,860 | | |
Onondaga County Industrial Development Agency
Revenue Bonds
Bristol-Meyers Squibb Co. Project
Series 1994 AMT(a)
03/01/24 | | | 5.750 | % | | | 2,000,000 | | | | 2,363,200 | | |
Total | | | | | | | 5,463,930 | | |
Pool/Bond Bank 2.6% | |
New York State Dormitory Authority
Revenue Bonds
School Districts Financing Program
Series 2009C (AGM)
10/01/36 | | | 5.125 | % | | | 1,000,000 | | | | 1,048,510 | | |
New York State Environmental Facilities Corp.
Revenue Bonds
Revolving Funds-Pooled Financing
Series 2005B
04/15/35 | | | 5.500 | % | | | 1,000,000 | | | | 1,157,810 | | |
Series 2009A
06/15/34 | | | 5.000 | % | | | 2,000,000 | | | | 2,138,940 | | |
Total | | | | | | | 4,345,260 | | |
Ports 3.8% | |
Port Authority of New York & New Jersey
Revenue Bonds
Consolidated 85th
Series 1993
03/01/28 | | | 5.375 | % | | | 2,000,000 | | | | 2,337,920 | | |
Consolidated 93rd
Series 1994
06/01/94 | | | 6.125 | % | | | 2,250,000 | | | | 2,500,943 | | |
Port Authority of New York & New Jersey(a)
Revenue Bonds
Consolidated 143rd
Series 2006 (AGM) AMT
10/01/21 | | | 5.000 | % | | | 1,000,000 | | | | 1,080,000 | | |
Consolidated 147th
Series 2007 (NPFGC) AMT
10/15/26 | | | 5.000 | % | | | 500,000 | | | | 530,100 | | |
Total | | | | | | | 6,448,963 | | |
Prep School 1.8% | |
Build NYC Resource Corp.
Revenue Bonds
Bronx Charter School for Excellence
Series 2013A
04/01/33 | | | 5.000 | % | | | 1,000,000 | | | | 928,360 | | |
Municipal Bonds (continued)
Issue
Description | | Coupon
Rate | | Principal
Amount ($) | | Value ($) | |
International Leadership Charter School
Series 2013
07/01/33 | | | 5.750 | % | | | 1,500,000 | | | | 1,340,835 | | |
New York State Dormitory Authority
Revenue Bonds
Convent-Sacred Heart
Series 2011 (AGM)
11/01/35 | | | 5.625 | % | | | 750,000 | | | | 805,673 | | |
Total | | | | | | | 3,074,868 | | |
Recreation 1.8% | |
Build NYC Resource Corp.
Revenue Bonds
YMCA of Greater NY Project
Series 2012
08/01/32 | | | 5.000 | % | | | 500,000 | | | | 510,625 | | |
New York City Industrial Development Agency
Revenue Bonds
Queens Baseball Stadium Pilot
Series 2006 (AMBAC)
01/01/24 | | | 5.000 | % | | | 500,000 | | | | 487,905 | | |
Yankee Stadium Pilot
Series 2009 (AGM)
03/01/49 | | | 7.000 | % | | | 250,000 | | | | 286,353 | | |
New York City Trust for Cultural Resources
Refunding Revenue Bonds
Museum of Modern Art
Series 2008-1A
04/01/31 | | | 5.000 | % | | | 750,000 | | | | 821,618 | | |
Revenue Bonds
Lincoln Center
Series 2008C
12/01/18 | | | 5.250 | % | | | 750,000 | | | | 875,992 | | |
Total | | | | | | | 2,982,493 | | |
Refunded/Escrowed 2.4% | |
Greece Central School District
Unlimited General Obligation Bonds
Series 1992 (FGIC)
06/15/16 | | | 6.000 | % | | | 500,000 | | | | 572,085 | | |
New York State Dormitory Authority
Prerefunded 07/01/18 Revenue Bonds
Rochester Institute of Technology
Series 2008A
07/01/33 | | | 6.000 | % | | | 1,000,000 | | | | 1,223,850 | | |
Triborough Bridge & Tunnel Authority
Prerefunded 01/01/22 Revenue Bonds
General Purpose
Series 1999B
01/01/30 | | | 5.500 | % | | | 1,800,000 | | | | 2,240,226 | | |
Total | | | | | | | 4,036,161 | | |
The accompanying Notes to Financial Statements are an integral part of this statement.
Annual Report 2013
10
Columbia New York Tax-Exempt Fund
Portfolio of Investments (continued)
October 31, 2013
Municipal Bonds (continued)
Issue
Description | | Coupon
Rate | | Principal
Amount ($) | | Value ($) | |
Retirement Communities 2.9% | |
Broome County Industrial Development Agency
Revenue Bonds
Good Shepard Village
Series 2008A
07/01/28 | | | 6.750 | % | | | 500,000 | | | | 506,405 | | |
New York State Dormitory Authority
Revenue Bonds
Miriam Osborn Memorial Home Association
Series 2012
07/01/29 | | | 5.000 | % | | | 1,000,000 | | | | 1,026,720 | | |
Suffolk County Economic Development Corp.
Refunding Revenue Bonds
Peconic Landing Southold
Series 2010
12/01/40 | | | 6.000 | % | | | 1,225,000 | | | | 1,277,969 | | |
Suffolk County Industrial Development Agency
Refunding Revenue Bonds
Jeffersons Ferry Project
Series 2006
11/01/28 | | | 5.000 | % | | | 1,335,000 | | | | 1,361,793 | | |
Ulster County Industrial Development Agency
Revenue Bonds
Series 2007A
09/15/42 | | | 6.000 | % | | | 1,000,000 | | | | 695,820 | | |
Total | | | | | | | 4,868,707 | | |
Single Family 0.3% | |
New York Mortgage Agency
Revenue Bonds
Series 2007-140 AMT(a)
10/01/21 | | | 4.600 | % | | | 500,000 | | | | 511,225 | | |
Special Non Property Tax 7.0% | |
Erie County Fiscal Stability Authority
Revenue Bonds
Sales Tax and State Aid
Secured Series 2013A
03/15/24 | | | 5.000 | % | | | 500,000 | | | | 598,195 | | |
Metropolitan Transportation Authority
Revenue Bonds
Series 2009A
11/15/26 | | | 5.300 | % | | | 700,000 | | | | 782,110 | | |
Series 2009B
11/15/34 | | | 5.000 | % | | | 1,000,000 | | | | 1,043,890 | | |
Nassau County Interim Finance Authority
Revenue Bonds
Secured Sales Tax
Series 2009A
11/15/24 | | | 5.000 | % | | | 250,000 | | | | 286,535 | | |
Municipal Bonds (continued)
Issue
Description | | Coupon
Rate | | Principal
Amount ($) | | Value ($) | |
New York City Transitional Finance Authority Building Aid
Revenue Bonds
Fiscal 2009
Series 2009S-3
01/15/22 | | | 5.000 | % | | | 1,000,000 | | | | 1,150,430 | | |
Series 2009S-5
01/15/32 | | | 5.000 | % | | | 1,000,000 | | | | 1,065,380 | | |
New York City Transitional Finance Authority
Refunded Revenue Bonds
Future Tax Secured
Subordinated Series 2012B
11/01/30 | | | 5.000 | % | | | 500,000 | | | | 544,975 | | |
Subordinated Revenue Bonds
Future Tax Secured
Series 2007B
11/01/26 | | | 5.000 | % | | | 1,035,000 | | | | 1,165,027 | | |
New York State Dormitory Authority
Revenue Bonds
Education
Series 2008B
03/15/36 | | | 5.750 | % | | | 500,000 | | | | 560,355 | | |
Series 2009A
03/15/28 | | | 5.000 | % | | | 1,545,000 | | | | 1,709,002 | | |
Series 2009A
02/15/34 | | | 5.000 | % | | | 1,400,000 | | | | 1,472,870 | | |
New York State Thruway Authority
Revenue Bonds
Series 2005A (NPFGC)
04/01/25 | | | 5.000 | % | | | 500,000 | | | | 531,005 | | |
Series 2009A-1
04/01/29 | | | 5.000 | % | | | 1,000,000 | | | | 1,073,910 | | |
Total | | | | | | | 11,983,684 | | |
State Appropriated 4.0% | |
Erie County Industrial Development Agency (The)
Revenue Bonds
School District Buffalo Project
Series 2011A
05/01/32 | | | 5.250 | % | | | 1,000,000 | | | | 1,063,650 | | |
Series 2013A
05/01/26 | | | 5.000 | % | | | 1,000,000 | | | | 1,114,100 | | |
New York Local Government Assistance Corp.
Refunding Revenue Bonds
Senior Lien
Series 2007A
04/01/19 | | | 5.000 | % | | | 1,000,000 | | | | 1,132,410 | | |
New York State Dormitory Authority
Revenue Bonds
Consolidated City University System 2nd Generation
Series 1993A
07/01/20 | | | 6.000 | % | | | 2,000,000 | | | | 2,396,940 | | |
State University Educational Facilities
Series 2000C (AGM)
05/15/17 | | | 5.750 | % | | | 1,000,000 | | | | 1,166,850 | | |
Total | | | | | | | 6,873,950 | | |
The accompanying Notes to Financial Statements are an integral part of this statement.
Annual Report 2013
11
Columbia New York Tax-Exempt Fund
Portfolio of Investments (continued)
October 31, 2013
Municipal Bonds (continued)
Issue
Description | | Coupon
Rate | | Principal
Amount ($) | | Value ($) | |
Student Loan — % | |
New York Mortgage Agency
Revenue Bonds
New York State Higher Education Finance
Series 2009
11/01/26 | | | 4.750 | % | | | 75,000 | | | | 77,194 | | |
Transportation 6.2% | |
Metropolitan Transportation Authority
Revenue Bonds
Series 2005B (AMBAC)
11/15/23 | | | 5.250 | % | | | 1,250,000 | | | | 1,465,462 | | |
Series 2005F
11/15/35 | | | 5.000 | % | | | 500,000 | | | | 506,170 | | |
Series 2006A
11/15/22 | | | 5.000 | % | | | 750,000 | | | | 835,200 | | |
Series 2010D
11/15/34 | | | 5.000 | % | | | 1,350,000 | | | | 1,391,958 | | |
Series 2011D
11/15/36 | | | 5.000 | % | | | 1,000,000 | | | | 1,022,560 | | |
Series 2012E
11/15/31 | | | 5.000 | % | | | 2,000,000 | | | | 2,103,900 | | |
Transportation System
Series 2013-A
11/15/32 | | | 5.000 | % | | | 2,000,000 | | | | 2,084,700 | | |
Series 2013B
11/15/22 | | | 5.000 | % | | | 1,000,000 | | | | 1,156,780 | | |
Total | | | | | | | 10,566,730 | | |
Turnpike/Bridge/Toll Road 3.8% | |
New York State Thruway Authority
Revenue Bonds
General Revenue
Series 2012I
01/01/32 | | | 5.000 | % | | | 2,000,000 | | | | 2,103,880 | | |
Series 2005F (AMBAC)
01/01/25 | | | 5.000 | % | | | 2,000,000 | | | | 2,091,820 | | |
Triborough Bridge & Tunnel Authority
Refunding Revenue Bonds
Subordinated Series 2013-A
11/15/27 | | | 5.000 | % | | | 2,000,000 | | | | 2,210,720 | | |
Total | | | | | | | 6,406,420 | | |
Water & Sewer 4.8% | |
Great Neck North Water Authority
Revenue Bonds
Series 2008
01/01/33 | | | 5.000 | % | | | 690,000 | | | | 715,033 | | |
New York City Water & Sewer System
Revenue Bonds
Fiscal 2009
Series 2008A
06/15/40 | | | 5.750 | % | | | 1,000,000 | | | | 1,112,230 | | |
Municipal Bonds (continued)
Issue
Description | | Coupon
Rate | | Principal
Amount ($) | | Value ($) | |
New York Water & Sewer System
Revenue Bonds
Series 2008CC
06/15/34 | | | 5.000 | % | | | 3,500,000 | | | | 3,668,805 | | |
Series 2009EE
06/15/40 | | | 5.250 | % | | | 500,000 | | | | 527,050 | | |
Niagara Falls Public Water Authority
Revenue Bonds
Series 2013A
07/15/29 | | | 5.000 | % | | | 1,000,000 | | | | 1,050,140 | | |
Rensselaer County Water Service & Sewer Authority
Revenue Bonds
Water Service
Series 2008
09/01/38 | | | 5.250 | % | | | 1,000,000 | | | | 1,030,880 | | |
Total | | | | | | | 8,104,138 | | |
Total Municipal Bonds
(Cost: $157,885,366) | | | | | | | 164,594,724 | | |
Floating Rate Notes 0.5%
Issue
Description | | Effective
Yield | | Principal
Amount ($) | | Value ($) | |
Triborough Bridge & Tunnel Authority
Revenue Bonds
General
VRDN Series 2005B-2C (U.S. Bank)(e)(f)
01/01/32 | | | 0.070 | % | | | 900,000 | | | | 900,000 | | |
Total Floating Rate Notes
(Cost: $900,000) | | | | | | | 900,000 | | |
Money Market Funds 1.4%
| | | Shares | | Value ($) | |
Dreyfus New York AMT-Free
Municipal Money Market Fund,
0.000%(g) | | | 1,154,868 | | | | 1,154,868 | | |
JPMorgan Tax-Free Money
Market Fund, 0.010%(g) | | | 1,206,017 | | | | 1,206,017 | | |
Total Money Market Funds
(Cost: $2,360,885) | | | | | 2,360,885 | | |
Total Investments
(Cost: $161,146,251) | | | | | 167,855,609 | | |
Other Assets & Liabilities, Net | | | | | 2,355,937 | | |
Net Assets | | | | | 170,211,546 | | |
The accompanying Notes to Financial Statements are an integral part of this statement.
Annual Report 2013
12
Columbia New York Tax-Exempt Fund
Portfolio of Investments (continued)
October 31, 2013
Notes to Portfolio of Investments
(a) Income from this security may be subject to alternative minimum tax.
(b) Variable rate security.
(c) Zero coupon bond.
(d) Municipal obligations include debt obligations issued by or on behalf of territories, possessions, or sovereign nations within the territorial boundaries of the United States. At October 31, 2013, the value of these securities amounted to $1,277,445 or 0.75% of net assets.
(e) Interest rate varies to reflect current market conditions; rate shown is the effective rate on October 31, 2013.
(f) The Fund is entitled to receive principal and interest from the guarantor after a day or a week's notice or upon maturity. The maturity date disclosed represents the final maturity.
(g) The rate shown is the seven-day current annualized yield at October 31, 2013.
Abbreviation Legend
AGM Assured Guaranty Municipal Corporation
AMBAC Ambac Assurance Corporation
AMT Alternative Minimum Tax
BAN Bond Anticipation Note
FGIC Financial Guaranty Insurance Company
FHA Federal Housing Authority
NPFGC National Public Finance Guarantee Corporation
RAN Revenue Anticipation Note
VRDN Variable Rate Demand Note
Fair Value Measurements
Generally accepted accounting principles (GAAP) require disclosure regarding the inputs and valuation techniques used to measure fair value and any changes in valuation inputs or techniques. In addition, investments shall be disclosed by major category.
The Fund categorizes its fair value measurements according to a three-level hierarchy that maximizes the use of observable inputs and minimizes the use of unobservable inputs by prioritizing that the most observable input be used when available. Observable inputs are those that market participants would use in pricing an investment based on market data obtained from sources independent of the reporting entity. Unobservable inputs are those that reflect the Fund's assumptions about the information market participants would use in pricing an investment. An investment's level within the fair value hierarchy is based on the lowest level of any input that is deemed significant to the asset or liability's fair value measurement. The input levels are not necessarily an indication of the risk or liquidity associated with investments at that level. For example, certain U.S. government securities are generally high quality and liquid, however, they are reflected as Level 2 because the inputs used to determine fair value may not always be quoted prices in an active market.
Fair value inputs are summarized in the three broad levels listed below:
> Level 1 — Valuations based on quoted prices for investments in active markets that the Fund has the ability to access at the measurement date (including NAV for open-end mutual funds). Valuation adjustments are not applied to Level 1 investments.
> Level 2 — Valuations based on other significant observable inputs (including quoted prices for similar securities, interest rates, prepayment speeds, credit risks, etc.).
> Level 3 — Valuations based on significant unobservable inputs (including the Fund's own assumptions and judgment in determining the fair value of investments).
Inputs that are used in determining fair value of an investment may include price information, credit data, volatility statistics, and other factors. These inputs can be either observable or unobservable. The availability of observable inputs can vary between investments, and is affected by various factors such as the type of investment, and the volume and level of activity for that investment or similar investments in the marketplace. The inputs will be considered by the Investment Manager, along with any other relevant factors in the calculation of an investment's fair value. The Fund uses prices and inputs that are current as of the measurement date, which may include periods of market dislocations. During these periods, the availability of prices and inputs may be reduced for many investments. This condition could cause an investment to be reclassified between the various levels within the hierarchy.
The accompanying Notes to Financial Statements are an integral part of this statement.
Annual Report 2013
13
Columbia New York Tax-Exempt Fund
Portfolio of Investments (continued)
October 31, 2013
Fair Value Measurements (continued)
Investments falling into the Level 3 category are primarily supported by quoted prices from brokers and dealers participating in the market for those investments. However, these may be classified as Level 3 investments due to lack of market transparency and corroboration to support these quoted prices. Additionally, valuation models may be used as the pricing source for any remaining investments classified as Level 3. These models may rely on one or more significant unobservable inputs and/or significant assumptions by the Investment Manager. Inputs used in valuations may include, but are not limited to, financial statement analysis, capital account balances, discount rates and estimated cash flows, and comparable company data.
Under the direction of the Fund's Board of Trustees (the Board), the Investment Manager's Valuation Committee (the Committee) is responsible for carrying out the valuation procedures approved by the Board. The Committee consists of voting and non-voting members from various groups within the Investment Manager's organization, including operations and accounting, trading and investments, compliance, risk management and legal.
The Committee meets at least monthly to review and approve valuation matters, which may include a description of specific valuation determinations, data regarding pricing information received from approved pricing vendors and brokers and the results of Board-approved valuation control policies and procedures (the Policies). The Policies address, among other things, instances when market quotations are or are not readily available, including recommendations of third party pricing vendors and a determination of appropriate pricing methodologies; events that require specific valuation determinations and assessment of fair value techniques; securities with a potential for stale pricing, including those that are illiquid, restricted, or in default; and the effectiveness of third-party pricing vendors, including periodic reviews of vendors. The Committee meets more frequently, as needed, to discuss additional valuation matters, which may include the need to review back-testing results, review time-sensitive information or approve related valuation actions. The Committee reports to the Board, with members of the Committee meeting with the Board at each of its regularly scheduled meetings to discuss valuation matters and actions during the period, similar to those described earlier.
For investments categorized as Level 3, the Committee monitors information similar to that described above, which may include: (i) data specific to the issuer or comparable issuers, (ii) general market or specific sector news and (iii) quoted prices and specific or similar security transactions. The Committee considers this data and any changes from prior periods in order to assess the reasonableness of observable and unobservable inputs, any assumptions or internal models used to value those securities and changes in fair value. This data is also used to corroborate, when available, information received from approved pricing vendors and brokers. Various factors impact the frequency of monitoring this information (which may occur as often as daily). However, the Committee may determine that changes to inputs, assumptions and models are not required as a result of the monitoring procedures performed.
The following table is a summary of the inputs used to value the Fund's investments at October 31, 2013:
Description | | Level 1
Quoted Prices in Active
Markets for Identical
Assets ($) | | Level 2
Other Significant
Observable Inputs ($) | | Level 3
Significant
Unobservable Inputs ($) | |
Total ($) | |
Bonds | |
Municipal Bonds | | | — | | | | 164,594,724 | | | | — | | | | 164,594,724 | | |
Total Bonds | | | — | | | | 164,594,724 | | | | — | | | | 164,594,724 | | |
Short-Term Securities | |
Floating Rate Notes | | | — | | | | 900,000 | | | | — | | | | 900,000 | | |
Total Short-Term Securities | | | — | | | | 900,000 | | | | — | | | | 900,000 | | |
Mutual Funds | |
Money Market Funds | | | 2,360,885 | | | | — | | | | — | | | | 2,360,885 | | |
Total Mutual Funds | | | 2,360,885 | | | | — | | | | — | | | | 2,360,885 | | |
Total | | | 2,360,885 | | | | 165,494,724 | | | | — | | | | 167,855,609 | | |
See the Portfolio of Investments for all investment classifications not indicated in the table.
The Fund's assets assigned to the Level 2 input category are generally valued using the market approach, in which a security's value is determined through reference to prices and information from market transactions for similar or identical assets.
There were no transfers of financial assets between Levels 1 and 2 during the period.
The accompanying Notes to Financial Statements are an integral part of this statement.
Annual Report 2013
14
Columbia New York Tax-Exempt Fund
Statement of Assets and Liabilities
October 31, 2013
Assets | |
Investments, at value | |
(identified cost $161,146,251) | | $ | 167,855,609 | | |
Receivable for: | |
Capital shares sold | | | 470,957 | | |
Interest | | | 2,670,776 | | |
Expense reimbursement due from Investment Manager | | | 221 | | |
Prepaid expenses | | | 1,768 | | |
Trustees' deferred compensation plan | | | 29,703 | | |
Other assets | | | 2,325 | | |
Total assets | | | 171,031,359 | | |
Liabilities | |
Payable for: | |
Capital shares purchased | | | 160,268 | | |
Dividend distributions to shareholders | | | 537,119 | | |
Investment management fees | | | 1,860 | | |
Distribution and/or service fees | | | 1,325 | | |
Transfer agent fees | | | 20,697 | | |
Administration fees | | | 325 | | |
Chief compliance officer expenses | | | 14 | | |
Other expenses | | | 68,502 | | |
Trustees' deferred compensation plan | | | 29,703 | | |
Total liabilities | | | 819,813 | | |
Net assets applicable to outstanding capital stock | | $ | 170,211,546 | | |
Represented by | |
Paid-in capital | | $ | 162,379,375 | | |
Undistributed net investment income | | | 353,652 | | |
Accumulated net realized gain | | | 769,161 | | |
Unrealized appreciation (depreciation) on: | |
Investments | | | 6,709,358 | | |
Total — representing net assets applicable to outstanding capital stock | | $ | 170,211,546 | | |
The accompanying Notes to Financial Statements are an integral part of this statement.
Annual Report 2013
15
Columbia New York Tax-Exempt Fund
Statement of Assets and Liabilities (continued)
October 31, 2013
Class A | |
Net assets | | $ | 145,383,974 | | |
Shares outstanding | | | 20,156,837 | | |
Net asset value per share | | $ | 7.21 | | |
Maximum offering price per share(a) | | $ | 7.57 | | |
Class B | |
Net assets | | $ | 777,602 | | |
Shares outstanding | | | 107,847 | | |
Net asset value per share | | $ | 7.21 | | |
Class C | |
Net assets | | $ | 16,254,371 | | |
Shares outstanding | | | 2,254,338 | | |
Net asset value per share | | $ | 7.21 | | |
Class R4 | |
Net assets | | $ | 2,367 | | |
Shares outstanding | | | 329 | | |
Net asset value per share(b) | | $ | 7.20 | | |
Class R5 | |
Net assets | | $ | 2,317 | | |
Shares outstanding | | | 322 | | |
Net asset value per share | | $ | 7.20 | | |
Class Z | |
Net assets | | $ | 7,790,915 | | |
Shares outstanding | | | 1,081,069 | | |
Net asset value per share | | $ | 7.21 | | |
(a) The maximum offering price per share is calculated by dividing the net asset value per share by 1.0 minus the maximum sales charge of 4.75%.
(b) Net asset value per share rounds to this amount due to fractional shares outstanding.
The accompanying Notes to Financial Statements are an integral part of this statement.
Annual Report 2013
16
Columbia New York Tax-Exempt Fund
Statement of Operations
Year Ended October 31, 2013
Net investment income | |
Income: | |
Dividends | | $ | 195 | | |
Interest | | | 8,291,715 | | |
Total income | | | 8,291,910 | | |
Expenses: | |
Investment management fees | | | 761,105 | | |
Distribution and/or service fees | |
Class A | | | 412,793 | | |
Class B | | | 10,631 | | |
Class C | | | 192,275 | | |
Transfer agent fees | |
Class A | | | 184,985 | | |
Class B | | | 1,185 | | |
Class C | | | 21,525 | | |
Class R4(a) | | | 2 | | |
Class R5(b) | | | 1 | | |
Class Z | | | 5,550 | | |
Administration fees | | | 133,193 | | |
Compensation of board members | | | 21,568 | | |
Custodian fees | | | 3,185 | | |
Printing and postage fees | | | 32,909 | | |
Registration fees | | | 47,648 | | |
Professional fees | | | 31,462 | | |
Chief compliance officer expenses | | | 125 | | |
Other | | | 13,461 | | |
Total expenses | | | 1,873,603 | | |
Fees waived or expenses reimbursed by Investment Manager and its affiliates | | | (241,744 | ) | |
Fees waived by Distributor — Class C | | | (57,732 | ) | |
Expense reductions | | | (260 | ) | |
Total net expenses | | | 1,573,867 | | |
Net investment income | | | 6,718,043 | | |
Realized and unrealized gain (loss) — net | |
Net realized gain (loss) on: | |
Investments | | | 1,216,313 | | |
Net realized gain | | | 1,216,313 | | |
Net change in unrealized appreciation (depreciation) on: | |
Investments | | | (14,263,344 | ) | |
Net change in unrealized appreciation (depreciation) | | | (14,263,344 | ) | |
Net realized and unrealized loss | | | (13,047,031 | ) | |
Net decrease in net assets from operations | | $ | (6,328,988 | ) | |
(a) For the period from March 19, 2013 (commencement of operations) to October 31, 2013.
(b) For the period from November 8, 2012 (commencement of operations) to October 31, 2013.
The accompanying Notes to Financial Statements are an integral part of this statement.
Annual Report 2013
17
Columbia New York Tax-Exempt Fund
Statement of Changes in Net Assets
| | | Year Ended
October 31,
2013(a)(b) | | Year Ended
October 31,
2012 | |
Operations | |
Net investment income | | $ | 6,718,043 | | | $ | 7,003,149 | | |
Net realized gain | | | 1,216,313 | | | | 1,469,883 | | |
Net change in unrealized appreciation (depreciation) | | | (14,263,344 | ) | | | 11,251,561 | | |
Net increase (decrease) in net assets resulting from operations | | | (6,328,988 | ) | | | 19,724,593 | | |
Distributions to shareholders | |
Net investment income | |
Class A | | | (5,865,166 | ) | | | (6,306,480 | ) | |
Class B | | | (29,594 | ) | | | (55,711 | ) | |
Class C | | | (596,393 | ) | | | (585,801 | ) | |
Class R4 | | | (57 | ) | | | — | | |
Class R5 | | | (90 | ) | | | — | | |
Class Z | | | (188,432 | ) | | | (17,711 | ) | |
Net realized gains | |
Class A | | | (964,902 | ) | | | (267,207 | ) | |
Class B | | | (7,428 | ) | | | (3,562 | ) | |
Class C | | | (110,755 | ) | | | (27,350 | ) | |
Class R5 | | | (13 | ) | | | — | | |
Class Z | | | (5,533 | ) | | | (8 | ) | |
Total distributions to shareholders | | | (7,768,363 | ) | | | (7,263,830 | ) | |
Increase (decrease) in net assets from capital stock activity | | | (16,261,740 | ) | | | 6,333,234 | | |
Total increase (decrease) in net assets | | | (30,359,091 | ) | | | 18,793,997 | | |
Net assets at beginning of year | | | 200,570,637 | | | | 181,776,640 | | |
Net assets at end of year | | $ | 170,211,546 | | | $ | 200,570,637 | | |
Undistributed net investment income | | $ | 353,652 | | | $ | 315,040 | | |
(a) Class R4 shares are for the period from March 19, 2013 (commencement of operations) to October 31, 2013.
(b) Class R5 shares are for the period from November 8, 2012 (commencement of operations) to October 31, 2013.
The accompanying Notes to Financial Statements are an integral part of this statement.
Annual Report 2013
18
Columbia New York Tax-Exempt Fund
Statement of Changes in Net Assets (continued)
| | | Year Ended October 31, 2013(a)(b) | | Year Ended October 31, 2012 | |
| | | Shares | | Dollars ($) | | Shares | | Dollars ($) | |
Capital stock activity | |
Class A shares | |
Subscriptions(c) | | | 1,676,945 | | | | 12,757,758 | | | | 2,154,954 | | | | 16,316,878 | | |
Distributions reinvested | | | 720,949 | | | | 5,430,735 | | | | 656,913 | | | | 4,974,218 | | |
Redemptions | | | (5,173,906 | ) | | | (38,510,384 | ) | | | (2,362,750 | ) | | | (17,887,399 | ) | |
Net increase (decrease) | | | (2,776,012 | ) | | | (20,321,891 | ) | | | 449,117 | | | | 3,403,697 | | |
Class B shares | |
Subscriptions | | | 1,016 | | | | 7,677 | | | | 7,319 | | | | 55,458 | | |
Distributions reinvested | | | 2,861 | | | | 21,689 | | | | 4,754 | | | | 35,836 | | |
Redemptions(c) | | | (75,268 | ) | | | (569,116 | ) | | | (135,943 | ) | | | (1,032,617 | ) | |
Net decrease | | | (71,391 | ) | | | (539,750 | ) | | | (123,870 | ) | | | (941,323 | ) | |
Class C shares | |
Subscriptions | | | 345,250 | | | | 2,621,770 | | | | 725,014 | | | | 5,461,336 | | |
Distributions reinvested | | | 63,230 | | | | 476,946 | | | | 52,599 | | | | 398,568 | | |
Redemptions | | | (763,342 | ) | | | (5,661,238 | ) | | | (393,145 | ) | | | (2,960,844 | ) | |
Net increase (decrease) | | | (354,862 | ) | | | (2,562,522 | ) | | | 384,468 | | | | 2,899,060 | | |
Class R4 shares | |
Subscriptions | | | 328 | | | | 2,500 | | | | — | | | | — | | |
Distributions reinvested | | | 1 | | | | 8 | | | | — | | | | — | | |
Net increase | | | 329 | | | | 2,508 | | | | — | | | | — | | |
Class R5 shares | |
Subscriptions | | | 321 | | | | 2,500 | | | | — | | | | — | | |
Distributions reinvested | | | 1 | | | | 8 | | | | — | | | | — | | |
Net increase | | | 322 | | | | 2,508 | | | | — | | | | — | | |
Class Z shares | |
Subscriptions | | | 1,140,510 | | | | 8,538,104 | | | | 128,984 | | | | 982,563 | | |
Distributions reinvested | | | 6,288 | | | | 47,273 | | | | 2,286 | | | | 17,613 | | |
Redemptions | | | (193,980 | ) | | | (1,427,970 | ) | | | (3,713 | ) | | | (28,376 | ) | |
Net increase | | | 952,818 | | | | 7,157,407 | | | | 127,557 | | | | 971,800 | | |
Total net increase (decrease) | | | (2,248,796 | ) | | | (16,261,740 | ) | | | 837,272 | | | | 6,333,234 | | |
(a) Class R4 shares are for the period from March 19, 2013 (commencement of operations) to October 31, 2013.
(b) Class R5 shares are for the period from November 8, 2012 (commencement of operations) to October 31, 2013.
(c) Includes conversions of Class B shares to Class A shares, if any.
The accompanying Notes to Financial Statements are an integral part of this statement.
Annual Report 2013
19
Columbia New York Tax-Exempt Fund
The following tables are intended to help you understand the Fund's financial performance. Certain information reflects financial results for a single share of a class held for the periods shown. Per share net investment income (loss) amounts are calculated based on average shares outstanding during the period. Total return assumes reinvestment of all dividends and distributions, if any. Total return does not reflect payment of sales charges, if any, and is not annualized for periods of less than one year.
| | | Year Ended October 31, | |
Class A | | 2013 | | 2012 | | 2011 | | 2010 | | 2009 | |
Per share data | |
Net asset value, beginning of period | | $ | 7.76 | | | $ | 7.27 | | | $ | 7.34 | | | $ | 7.25 | | | $ | 6.55 | | |
Income from investment operations: | |
Net investment income | | | 0.27 | | | | 0.28 | | | | 0.29 | | | | 0.30 | | | | 0.31 | | |
Net realized and unrealized gain (loss) | | | (0.51 | ) | | | 0.50 | | | | (0.06 | )(a) | | | 0.31 | | | | 0.78 | | |
Total from investment operations | | | (0.24 | ) | | | 0.78 | | | | 0.23 | | | | 0.61 | | | | 1.09 | | |
Less distributions to shareholders: | |
Net investment income | | | (0.27 | ) | | | (0.28 | ) | | | (0.29 | ) | | | (0.34 | ) | | | (0.30 | ) | |
Net realized gains | | | (0.04 | ) | | | (0.01 | ) | | | (0.01 | ) | | | (0.18 | ) | | | (0.09 | ) | |
Total distributions to shareholders | | | (0.31 | ) | | | (0.29 | ) | | | (0.30 | ) | | | (0.52 | ) | | | (0.39 | ) | |
Net asset value, end of period | | $ | 7.21 | | | $ | 7.76 | | | $ | 7.27 | | | $ | 7.34 | | | $ | 7.25 | | |
Total return | | | (3.20 | %) | | | 10.90 | % | | | 3.40 | % | | | 8.86 | % | | | 17.24 | % | |
Ratios to average net assets(b) | |
Total gross expenses | | | 0.91 | % | | | 0.93 | % | | | 1.02 | % | | | 1.12 | % | | | 1.09 | % | |
Total net expenses(c) | | | 0.78 | %(d) | | | 0.79 | %(d) | | | 0.82 | %(d) | | | 0.84 | %(d) | | | 0.84 | %(d) | |
Net investment income | | | 3.57 | % | | | 3.70 | % | | | 4.04 | % | | | 4.11 | % | | | 4.47 | % | |
Supplemental data | |
Net assets, end of period (in thousands) | | $ | 145,384 | | | $ | 177,945 | | | $ | 163,405 | | | $ | 54,888 | | | $ | 50,469 | | |
Portfolio turnover | | | 15 | % | | | 24 | % | | | 22 | % | | | 9 | % | | | 20 | % | |
Notes to Financial Highlights
(a) Calculation of the net gain (loss) per share (both realized and unrealized) does not correlate to the aggregate realized and unrealized gain (loss) presented in the Statement of Operations due to the timing of sales and repurchases of Fund shares in relation to fluctuations in the market value of the portfolio.
(b) In addition to the fees and expenses which the Fund bears directly, the Fund indirectly bears a pro rata share of the fees and expenses of the acquired funds in which it invests. Such indirect expenses are not included in the reported expense ratios.
(c) Total net expenses include the impact of certain waivers/reimbursements made by the Investment Manager and certain of its affiliates, if applicable.
(d) The benefits derived from expense reductions had an impact of less than 0.01%.
The accompanying Notes to Financial Statements are an integral part of this statement.
Annual Report 2013
20
Columbia New York Tax-Exempt Fund
Financial Highlights (continued)
| | | Year Ended October 31, | |
Class B | | 2013 | | 2012 | | 2011 | | 2010 | | 2009 | |
Per share data | |
Net asset value, beginning of period | | $ | 7.76 | | | $ | 7.27 | | | $ | 7.34 | | | $ | 7.25 | | | $ | 6.55 | | |
Income from investment operations: | |
Net investment income | | | 0.21 | | | | 0.22 | | | | 0.24 | | | | 0.24 | | | | 0.25 | | |
Net realized and unrealized gain (loss) | | | (0.51 | ) | | | 0.50 | | | | (0.06 | )(a) | | | 0.32 | | | | 0.78 | | |
Total from investment operations | | | (0.30 | ) | | | 0.72 | | | | 0.18 | | | | 0.56 | | | | 1.03 | | |
Less distributions to shareholders: | |
Net investment income | | | (0.21 | ) | | | (0.22 | ) | | | (0.24 | ) | | | (0.29 | ) | | | (0.24 | ) | |
Net realized gains | | | (0.04 | ) | | | (0.01 | ) | | | (0.01 | ) | | | (0.18 | ) | | | (0.09 | ) | |
Total distributions to shareholders | | | (0.25 | ) | | | (0.23 | ) | | | (0.25 | ) | | | (0.47 | ) | | | (0.33 | ) | |
Net asset value, end of period | | $ | 7.21 | | | $ | 7.76 | | | $ | 7.27 | | | $ | 7.34 | | | $ | 7.25 | | |
Total return | | | (3.93 | %) | | | 10.08 | % | | | 2.62 | % | | | 8.05 | % | | | 16.38 | % | |
Ratios to average net assets(b) | |
Total gross expenses | | | 1.66 | % | | | 1.70 | % | | | 1.87 | % | | | 1.87 | % | | | 1.84 | % | |
Total net expenses(c) | | | 1.53 | %(d) | | | 1.54 | %(d) | | | 1.60 | %(d) | | | 1.59 | %(d) | | | 1.59 | %(d) | |
Net investment income | | | 2.80 | % | | | 2.95 | % | | | 3.38 | % | | | 3.38 | % | | | 3.73 | % | |
Supplemental data | |
Net assets, end of period (in thousands) | | $ | 778 | | | $ | 1,390 | | | $ | 2,202 | | | $ | 4,540 | | | $ | 8,217 | | |
Portfolio turnover | | | 15 | % | | | 24 | % | | | 22 | % | | | 9 | % | | | 20 | % | |
Notes to Financial Highlights
(a) Calculation of the net gain (loss) per share (both realized and unrealized) does not correlate to the aggregate realized and unrealized gain (loss) presented in the Statement of Operations due to the timing of sales and repurchases of Fund shares in relation to fluctuations in the market value of the portfolio.
(b) In addition to the fees and expenses which the Fund bears directly, the Fund indirectly bears a pro rata share of the fees and expenses of the acquired funds in which it invests. Such indirect expenses are not included in the reported expense ratios.
(c) Total net expenses include the impact of certain waivers/reimbursements made by the Investment Manager and certain of its affiliates, if applicable.
(d) The benefits derived from expense reductions had an impact of less than 0.01%.
The accompanying Notes to Financial Statements are an integral part of this statement.
Annual Report 2013
21
Columbia New York Tax-Exempt Fund
Financial Highlights (continued)
| | | Year Ended October 31, | |
Class C | | 2013 | | 2012 | | 2011 | | 2010 | | 2009 | |
Per share data | |
Net asset value, beginning of period | | $ | 7.76 | | | $ | 7.27 | | | $ | 7.34 | | | $ | 7.25 | | | $ | 6.55 | | |
Income from investment operations: | |
Net investment income | | | 0.23 | | | | 0.25 | | | | 0.26 | | | | 0.26 | | | | 0.28 | | |
Net realized and unrealized gain (loss) | | | (0.51 | ) | | | 0.50 | | | | (0.06 | )(a) | | | 0.32 | | | | 0.78 | | |
Total from investment operations | | | (0.28 | ) | | | 0.75 | | | | 0.20 | | | | 0.58 | | | | 1.06 | | |
Less distributions to shareholders: | |
Net investment income | | | (0.23 | ) | | | (0.25 | ) | | | (0.26 | ) | | | (0.31 | ) | | | (0.27 | ) | |
Net realized gains | | | (0.04 | ) | | | (0.01 | ) | | | (0.01 | ) | | | (0.18 | ) | | | (0.09 | ) | |
Total distributions to shareholders | | | (0.27 | ) | | | (0.26 | ) | | | (0.27 | ) | | | (0.49 | ) | | | (0.36 | ) | |
Net asset value, end of period | | $ | 7.21 | | | $ | 7.76 | | | $ | 7.27 | | | $ | 7.34 | | | $ | 7.25 | | |
Total return | | | (3.64 | %) | | | 10.41 | % | | | 2.95 | % | | | 8.37 | % | | | 16.72 | % | |
Ratios to average net assets(b) | |
Total gross expenses | | | 1.66 | % | | | 1.68 | % | | | 1.82 | % | | | 1.87 | % | | | 1.84 | % | |
Total net expenses(c) | | | 1.23 | %(d) | | | 1.24 | %(d) | | | 1.28 | %(d) | | | 1.29 | %(d) | | | 1.29 | %(d) | |
Net investment income | | | 3.12 | % | | | 3.24 | % | | | 3.64 | % | | | 3.66 | % | | | 4.02 | % | |
Supplemental data | |
Net assets, end of period (in thousands) | | $ | 16,254 | | | $ | 20,240 | | | $ | 16,164 | | | $ | 9,401 | | | $ | 9,031 | | |
Portfolio turnover | | | 15 | % | | | 24 | % | | | 22 | % | | | 9 | % | | | 20 | % | |
Notes to Financial Highlights
(a) Calculation of the net gain (loss) per share (both realized and unrealized) does not correlate to the aggregate realized and unrealized gain (loss) presented in the Statement of Operations due to the timing of sales and repurchases of Fund shares in relation to fluctuations in the market value of the portfolio.
(b) In addition to the fees and expenses which the Fund bears directly, the Fund indirectly bears a pro rata share of the fees and expenses of the acquired funds in which it invests. Such indirect expenses are not included in the reported expense ratios.
(c) Total net expenses include the impact of certain waivers/reimbursements made by the Investment Manager and certain of its affiliates, if applicable.
(d) The benefits derived from expense reductions had an impact of less than 0.01%.
The accompanying Notes to Financial Statements are an integral part of this statement.
Annual Report 2013
22
Columbia New York Tax-Exempt Fund
Financial Highlights (continued)
Class R4 | | Year Ended
October 31,
2013(a) | |
Per share data | |
Net asset value, beginning of period | | $ | 7.63 | | |
Income from investment operations: | |
Net investment income | | | 0.18 | | |
Net realized and unrealized loss | | | (0.43 | ) | |
Total from investment operations | | | (0.25 | ) | |
Less distributions to shareholders: | |
Net investment income | | | (0.18 | ) | |
Total distributions to shareholders | | | (0.18 | ) | |
Net asset value, end of period | | $ | 7.20 | | |
Total return | | | (3.35 | %) | |
Ratios to average net assets(b) | |
Total gross expenses | | | 0.69 | %(c) | |
Total net expenses(d) | | | 0.53 | %(c)(e) | |
Net investment income | | | 3.88 | %(c) | |
Supplemental data | |
Net assets, end of period (in thousands) | | $ | 2 | | |
Portfolio turnover | | | 15 | % | |
Notes to Financial Highlights
(a) For the period from March 19, 2013 (commencement of operations) to October 31, 2013.
(b) In addition to the fees and expenses which the Fund bears directly, the Fund indirectly bears a pro rata share of the fees and expenses of the acquired funds in which it invests. Such indirect expenses are not included in the reported expense ratios.
(c) Annualized.
(d) Total net expenses include the impact of certain waivers/reimbursements made by the Investment Manager and certain of its affiliates, if applicable.
(e) The benefits derived from expense reductions had an impact of less than 0.01%.
The accompanying Notes to Financial Statements are an integral part of this statement.
Annual Report 2013
23
Columbia New York Tax-Exempt Fund
Financial Highlights (continued)
Class R5 | | Year Ended
October 31,
2013(a) | |
Per share data | |
Net asset value, beginning of period | | $ | 7.79 | | |
Income from investment operations: | |
Net investment income | | | 0.28 | | |
Net realized and unrealized loss | | | (0.55 | ) | |
Total from investment operations | | | (0.27 | ) | |
Less distributions to shareholders: | |
Net investment income | | | (0.28 | ) | |
Net realized gains | | | (0.04 | ) | |
Total distributions to shareholders | | | (0.32 | ) | |
Net asset value, end of period | | $ | 7.20 | | |
Total return | | | (3.52 | %) | |
Ratios to average net assets(b) | |
Total gross expenses | | | 0.62 | %(c) | |
Total net expenses(d) | | | 0.50 | %(c) | |
Net investment income | | | 3.85 | %(c) | |
Supplemental data | |
Net assets, end of period (in thousands) | | $ | 2 | | |
Portfolio turnover | | | 15 | % | |
Notes to Financial Highlights
(a) For the period from November 8, 2012 (commencement of operations) to October 31, 2013.
(b) In addition to the fees and expenses which the Fund bears directly, the Fund indirectly bears a pro rata share of the fees and expenses of the acquired funds in which it invests. Such indirect expenses are not included in the reported expense ratios.
(c) Annualized.
(d) Total net expenses include the impact of certain waivers/reimbursements made by the Investment Manager and certain of its affiliates, if applicable.
The accompanying Notes to Financial Statements are an integral part of this statement.
Annual Report 2013
24
Columbia New York Tax-Exempt Fund
Financial Highlights (continued)
| | | Year Ended October 31, | |
Class Z | | 2013 | | 2012 | | 2011(a) | |
Per share data | |
Net asset value, beginning of period | | $ | 7.76 | | | $ | 7.27 | | | $ | 7.25 | | |
Income from investment operations: | |
Net investment income | | | 0.29 | | | | 0.30 | | | | 0.05 | | |
Net realized and unrealized gain (loss) | | | (0.51 | ) | | | 0.50 | | | | 0.02 | | |
Total from investment operations | | | (0.22 | ) | | | 0.80 | | | | 0.07 | | |
Less distributions to shareholders: | |
Net investment income | | | (0.29 | ) | | | (0.30 | ) | | | (0.05 | ) | |
Net realized gains | | | (0.04 | ) | | | (0.01 | ) | | | — | | |
Total distributions to shareholders | | | (0.33 | ) | | | (0.31 | ) | | | (0.05 | ) | |
Net asset value, end of period | | $ | 7.21 | | | $ | 7.76 | | | $ | 7.27 | | |
Total return | | | (2.96 | %) | | | 11.19 | % | | | 0.96 | % | |
Ratios to average net assets(b) | |
Total gross expenses | | | 0.65 | % | | | 0.66 | % | | | 0.61 | %(c) | |
Total net expenses(d) | | | 0.53 | %(e) | | | 0.54 | %(e) | | | 0.52 | %(c) | |
Net investment income | | | 3.86 | % | | | 3.90 | % | | | 4.19 | %(c) | |
Supplemental data | |
Net assets, end of period (in thousands) | | $ | 7,791 | | | $ | 995 | | | $ | 5 | | |
Portfolio turnover | | | 15 | % | | | 24 | % | | | 22 | % | |
Notes to Financial Highlights
(a) For the period from September 1, 2011 (commencement of operations) to October 31, 2011.
(b) In addition to the fees and expenses which the Fund bears directly, the Fund indirectly bears a pro rata share of the fees and expenses of the acquired funds in which it invests. Such indirect expenses are not included in the reported expense ratios.
(c) Annualized.
(d) Total net expenses include the impact of certain waivers/reimbursements made by the Investment Manager and certain of its affiliates, if applicable.
(e) The benefits derived from expense reductions had an impact of less than 0.01%.
The accompanying Notes to Financial Statements are an integral part of this statement.
Annual Report 2013
25
Columbia New York Tax-Exempt Fund
Notes to Financial Statements
October 31, 2013
Note 1. Organization
Columbia New York Tax-Exempt Fund (the Fund), a series of Columbia Funds Series Trust I (the Trust), is a non-diversified fund. The Trust is registered under the Investment Company Act of 1940, as amended (the 1940 Act), as an open-end management investment company organized as a Massachusetts business trust.
Fund Shares
The Trust may issue an unlimited number of shares (without par value). The Fund offers Class A, Class B, Class C, Class R4, Class R5 and Class Z shares. Although all share classes generally have identical voting, dividend and liquidation rights, each share class votes separately when required by law. Different share classes pay different distribution amounts to the extent the expenses of such share classes differ, and distributions in liquidation will be proportional to the net asset value of each share class. Each share class has its own expense structure and sales charges, as applicable.
Class A shares are subject to a maximum front-end sales charge of 4.75% based on the initial investment amount. Class A shares purchased without an initial sales charge in accounts aggregating $1 million to $50 million at the time of purchase are subject to a contingent deferred sales charge (CDSC) if the shares are sold within 18 months of purchase, charged as follows: 1.00% CDSC if redeemed within 12 months of purchase, and 0.50% CDSC if redeemed more than 12, but less than 18, months after purchase.
Class B shares may be subject to a maximum CDSC of 5.00% based upon the holding period after purchase. Class B shares will generally convert to Class A shares eight years after purchase. The Fund no longer accepts investments by new or existing investors in the Fund's Class B shares, except in connection with the reinvestment of any dividend and/or capital gain distributions in Class B shares of the Fund and exchanges by existing Class B shareholders of certain other funds within the Columbia Family of Funds.
Class C shares are subject to a 1.00% CDSC on shares redeemed within one year of purchase.
Class R4 shares are not subject to sales charges and are only available to investors purchasing through authorized investment professionals. Class R4 shares commenced operations on March 19, 2013.
Class R5 shares are not subject to sales charges and are generally available only to investors purchasing through authorized investment professionals and omnibus retirement
plans. Class R5 shares commenced operations on November 8, 2012.
Class Z shares are not subject to sales charges and are available only to certain eligible investors, which are subject to different investment minimums.
Note 2. Summary of Significant Accounting Policies
Use of Estimates
The preparation of financial statements in accordance with U.S. generally accepted accounting principles (GAAP) requires management to make certain estimates and assumptions that affect the reported amounts of assets and liabilities, the disclosure of contingent assets and liabilities at the date of the financial statements and the reported amounts of revenue and expenses during the reporting period. Actual results could differ from those estimates.
The following is a summary of significant accounting policies consistently followed by the Fund in the preparation of its financial statements.
Security Valuation
Debt securities generally are valued by pricing services approved by the Board of Trustees (the Board) based upon market transactions for normal, institutional-size trading units of similar securities. The services may use various pricing techniques which take into account appropriate factors such as yield, quality, coupon rate, maturity, type of issue, trading characteristics and other data, as well as broker quotes. Debt securities for which quotations are readily available may also be valued based upon an over-the-counter or exchange bid quotation.
Investments in open-end investment companies, including money market funds, are valued at net asset value.
Short-term securities purchased within 60 days to maturity are valued at amortized cost, which approximates market value. The value of short-term securities originally purchased with maturities greater than 60 days is determined based on an amortized value to par upon reaching 60 days to maturity. Short-term securities maturing in more than 60 days from the valuation date are valued at the market price or approximate market value based on current interest rates.
Investments for which market quotations are not readily available, or that have quotations which management believes are not reliable, are valued at fair value as determined in good faith under consistently applied procedures established by and under the general supervision of the Board. If a security or class of securities (such as foreign securities) is valued at fair
Annual Report 2013
26
Columbia New York Tax-Exempt Fund
Notes to Financial Statements (continued)
October 31, 2013
value, such value is likely to be different from the last quoted market price for the security.
The determination of fair value often requires significant judgment. To determine fair value, management may use assumptions including but not limited to future cash flows and estimated risk premiums. Multiple inputs from various sources may be used to determine fair value.
Security Transactions
Security transactions are accounted for on the trade date. Cost is determined and gains (losses) are based upon the specific identification method for both financial statement and federal income tax purposes.
Income Recognition
Interest income is recorded on an accrual basis. Market premiums and discounts, including original issue discounts, are amortized and accreted, respectively, over the expected life of the security on all debt securities, unless otherwise noted.
Dividend income is recorded on the ex-dividend date.
Expenses
General expenses of the Trust are allocated to the Fund and other funds of the Trust based upon relative net assets or other expense allocation methodologies determined by the nature of the expense. Expenses directly attributable to the Fund are charged to the Fund. Expenses directly attributable to a specific class of shares are charged to that share class.
Determination of Class Net Asset Value
All income, expenses (other than class-specific expenses, which are charged to that share class, as shown in the Statement of Operations) and realized and unrealized gains (losses) are allocated to each class of the Fund on a daily basis, based on the relative net assets of each class, for purposes of determining the net asset value of each class.
Federal Income Tax Status
The Fund intends to qualify each year as a regulated investment company under Subchapter M of the Internal Revenue Code, as amended, and will distribute substantially all of its tax exempt and taxable income (including net short-term capital gains), if any, for its tax year, and as such will not be subject to federal income taxes. In addition, the Fund intends to distribute in each calendar year substantially all of its net investment income, capital gains and certain other amounts, if any, such that the Fund should not be subject to federal excise tax. Therefore, no federal income or excise tax provision is recorded.
Distributions to Shareholders
Distributions from net investment income, if any, are declared daily and paid monthly. Net realized capital gains, if any, are distributed at least annually. Income distributions and capital gain distributions are determined in accordance with federal income tax regulations, which may differ from GAAP.
Guarantees and Indemnifications
Under the Trust's organizational documents and, in some cases, by contract, its officers and trustees are indemnified against certain liabilities arising out of the performance of their duties to the Trust or its funds. In addition, certain of the Fund's contracts with its service providers contain general indemnification clauses. The Fund's maximum exposure under these arrangements is unknown since the amount of any future claims that may be made against the Fund cannot be determined, and the Fund has no historical basis for predicting the likelihood of any such claims.
Recent Accounting Pronouncement
Disclosures about Offsetting Assets and Liabilities
In December 2011, the Financial Accounting Standards Board (FASB) issued Accounting Standards Update (ASU) No. 2011-11, Disclosures about Offsetting Assets and Liabilities and in January 2013, ASU No. 2013-1, Clarifying the Scope of Disclosures about Offsetting Assets and Liabilities (collectively, the ASUs). Specifically, the ASUs require an entity to disclose both gross and net information for derivatives and other financial instruments that are subject to a master netting arrangement or similar agreement. The ASUs require disclosure of collateral received in connection with the master netting agreements or similar agreements. The disclosure requirements are effective for interim and annual periods beginning on or after January 1, 2013. At this time, management is evaluating the implications of this guidance and the impact it will have on the financial statement amounts and footnote disclosures, if any.
Note 3. Fees and Compensation Paid to Affiliates
Investment Management Fees
Under an Investment Management Services Agreement, Columbia Management Investment Advisers, LLC (the Investment Manager), a wholly-owned subsidiary of Ameriprise Financial, Inc. (Ameriprise Financial), determines which securities will be purchased, held or sold. The investment management fee is an annual fee that is equal to a percentage of the Fund's average daily net assets that declines from 0.40% to 0.27% as the Fund's net assets increase. The effective investment management fee rate for the year ended
Annual Report 2013
27
Columbia New York Tax-Exempt Fund
Notes to Financial Statements (continued)
October 31, 2013
October 31, 2013 was 0.40% of the Fund's average daily net assets.
Administration Fees
Under an Administrative Services Agreement, the Investment Manager also serves as the Fund Administrator. The Fund pays the Fund Administrator an annual fee for administration and accounting services equal to a percentage of the Fund's average daily net assets that declines from 0.07% to 0.04% as the Fund's net assets increase. The effective administration fee rate for the year ended October 31, 2013 was 0.07% of the Fund's average daily net assets.
Compensation of Board Members
Board members are compensated for their services to the Fund as disclosed in the Statement of Operations. The Trust's eligible Trustees may participate in a Deferred Compensation Plan (the Plan) which may be terminated at any time. Obligations of the Plan will be paid solely out of the Fund's assets.
Compensation of Chief Compliance Officer
The Board has appointed a Chief Compliance Officer to the Fund in accordance with federal securities regulations. The Fund pays its pro-rata share of the expenses associated with the Chief Compliance Officer. The Fund's expenses for the Chief Compliance Officer will not exceed $15,000 per year.
Transfer Agent Fees
Under a Transfer and Dividend Disbursing Agent Agreement, Columbia Management Investment Services Corp. (the Transfer Agent), an affiliate of the Investment Manager and a wholly-owned subsidiary of Ameriprise Financial, is responsible for providing transfer agency services to the Fund. The Transfer Agent has contracted with Boston Financial Data Services (BFDS) to serve as sub-transfer agent.
The Transfer Agent receives monthly account-based service fees based on the number of open accounts and also receives sub-transfer agency fees based on a percentage of the average aggregate value of the Fund's shares maintained in omnibus accounts (other than omnibus accounts for which American Enterprise Investment Services Inc. is the broker of record or accounts where the beneficial shareholder is a customer of Ameriprise Financial Services, Inc., which are paid a per account fee). The Transfer Agent pays the fees of BFDS for services as sub-transfer agent and is not entitled to reimbursement for such fees from the Fund (with the exception of out-of-pocket fees).
The Transfer Agent also receives compensation from fees for various shareholder services and reimbursements for certain out-of-pocket fees. Total transfer agent fees for Class R5
shares are subject to an annual limitation of not more than 0.05% of the average daily net assets attributable to Class R5 shares.
For the year ended October 31, 2013, the Fund's effective transfer agent fee rates as a percentage of average daily net assets of each class were as follows:
Class A | | | 0.11 | % | |
Class B | | | 0.11 | | |
Class C | | | 0.11 | | |
Class R4 | | | 0.15 | * | |
Class R5 | | | 0.05 | * | |
Class Z | | | 0.11 | | |
*Annualized.
The Fund and certain other associated investment companies, have severally, but not jointly, guaranteed the performance and observance of all the terms and conditions of a lease entered into by Seligman Data Corp. (SDC), the former transfer agent, including the payment of rent by SDC (the Guaranty). The lease and the Guaranty expire in January 2019. At October 31, 2013, the Fund's total potential future obligation over the life of the Guaranty is $70,738. The liability remaining at October 31, 2013 for non-recurring charges associated with the lease amounted to $33,858 and is recorded as a part of the payable for other expenses in the Statement of Assets and Liabilities.
An annual minimum account balance fee of $20 may apply to certain accounts with a value below the applicable share class' initial minimum investment requirements to reduce the impact of small accounts on transfer agent fees. These minimum account balance fees are recorded as part of expense reductions in the Statement of Operations. For the year ended October 31, 2013, these minimum account balance fees reduced total expenses by $260.
Distribution and Service Fees
The Fund has an agreement with Columbia Management Investment Distributors, Inc. (the Distributor), an affiliate of the Investment Manager and a wholly-owned subsidiary of Ameriprise Financial, for distribution and shareholder services. Pursuant to Rule 12b-1 under the 1940 Act, the Board has approved, and the Fund has adopted, distribution and shareholder service plans (the Plans) which set the distribution and service fees for the Fund. These fees are calculated daily and are intended to compensate the Distributor and/or eligible selling and/or servicing agents for selling shares of the Fund and providing services to investors.
Under the Plans, the Fund pays a monthly service fee to the Distributor at the maximum annual rate of 0.25% of the
Annual Report 2013
28
Columbia New York Tax-Exempt Fund
Notes to Financial Statements (continued)
October 31, 2013
average daily net assets attributable to Class A, Class B and Class C shares of the Fund. Also under the Plans, the Fund pays a monthly distribution fee to the Distributor at the maximum annual rate of 0.75% of the average daily net assets attributable to Class B and Class C shares only.
The Distributor has voluntarily agreed to waive a portion of the distribution fee for Class C shares so that the distribution fee does not exceed 0.45% annually of the average daily net assets attributable to Class C shares. This arrangement may be modified or terminated by the Distributor at any time.
Sales Charges
Sales charges, including front-end charges and CDSCs, received by the Distributor for distributing Fund shares were $94,683 for Class A, $28 for Class B and $2,011 for Class C shares for the year ended October 31, 2013.
Expenses Waived/Reimbursed by the Investment Manager and its Affiliates
The Investment Manager and certain of its affiliates have contractually agreed to waive fees and/or reimburse expenses (excluding certain fees and expenses described below) for the periods disclosed below, unless sooner terminated at the sole discretion of the Board, so that the Fund's net operating expenses, after giving effect to fees waived/expenses reimbursed and any balance credits and/or overdraft charges from the Fund's custodian, do not exceed the following annual rates as a percentage of the class' average daily net assets:
| | | March 1, 2013
through
February 28, 2014 | | Prior to
March 1, 2013 | |
Class A | | | 0.78 | % | | | 0.79 | % | |
Class B | | | 1.53 | | | | 1.54 | | |
Class C | | | 1.53 | | | | 1.54 | | |
Class R4 | | | 0.53 | * | | | — | | |
Class R5 | | | 0.49 | | | | 0.52 | ** | |
Class Z | | | 0.53 | | | | 0.54 | | |
*Annual rate is contractual from March 19, 2013 (the commencement of operations of Class R4 shares) through February 28, 2014.
**Annual rate is contractual from November 8, 2012 (the commencement of operations of Class R5 shares) through February 28, 2013.
Under the agreement governing these fee waivers and/or expense reimbursement arrangements, the following fees and expenses are excluded from the waiver/reimbursement commitment, and therefore will be paid by the Fund, if applicable: taxes (including foreign transaction taxes), expenses associated with investments in affiliated and non-affiliated pooled investment vehicles (including mutual funds and exchange traded funds), transaction costs and brokerage
commissions, costs related to any securities lending program, dividend expenses associated with securities sold short, inverse floater program fees and expenses, transaction charges and interest on borrowed money, interest, extraordinary expenses and any other expenses the exclusion of which is specifically approved by the Board. This agreement may be modified or amended only with approval from all parties. Class C distribution fees waived by the Distributor, as discussed above, are in addition to the waiver/reimbursement commitment under the agreement.
Note 4. Federal Tax Information
The timing and character of income and capital gain distributions are determined in accordance with income tax regulations, which may differ from GAAP because of temporary or permanent book to tax differences.
At October 31, 2013, these differences are primarily due to differing treatment for principal and/or interest of fixed income securities, Trustees' deferred compensation, distribution reclassifications and tax straddles. To the extent these differences are permanent, reclassifications are made among the components of the Fund's net assets in the Statement of Assets and Liabilities. Temporary differences do not require reclassifications. In the Statement of Assets and Liabilities the following reclassifications were made:
Undistributed net investment income | | $ | 301 | | |
Accumulated net realized gain | | | (301 | ) | |
Net investment income and net realized gains (losses), as disclosed in the Statement of Operations, and net assets were not affected by this reclassification.
The tax character of distributions paid during the years indicated was as follows:
Year Ended October 31, | | 2013 | | 2012 | |
Tax-exempt income | | $ | 6,679,732 | | | $ | 6,960,213 | | |
Ordinary income | | | 356,857 | | | | 5,490 | | |
Long-term capital gains | | | 731,774 | | | | 298,127 | | |
Total | | $ | 7,768,363 | | | $ | 7,263,830 | | |
Short-term capital gain distributions, if any, are considered ordinary income distributions for tax purposes.
At October 31, 2013, the components of distributable earnings on a tax basis were as follows:
Undistributed tax-exempt income | | $ | 645,527 | | |
Undistributed accumulated long-term gain | | | 1,062,198 | | |
Unrealized appreciation | | | 6,763,841 | | |
At October 31, 2013, the cost of investments for federal income tax purposes was $161,091,768 and the aggregate
Annual Report 2013
29
Columbia New York Tax-Exempt Fund
Notes to Financial Statements (continued)
October 31, 2013
gross unrealized appreciation and depreciation based on that cost was:
Unrealized appreciation | | $ | 9,261,023 | | |
Unrealized depreciation | | | (2,497,182 | ) | |
Net unrealized appreciation | | | 6,763,841 | | |
Management of the Fund has concluded that there are no significant uncertain tax positions that would require recognition in the financial statements. However, management's conclusion may be subject to review and adjustment at a later date based on factors including, but not limited to, new tax laws, regulations, and administrative interpretations (including relevant court decisions). Generally, the Fund's federal tax returns for the prior three fiscal years remain subject to examination by the Internal Revenue Service.
Note 5. Portfolio Information
The cost of purchases and proceeds from sales of securities, excluding short-term obligations, aggregated to $26,761,125 and $39,741,386, respectively, for the year ended October 31, 2013.
Note 6. Shareholder Concentration
At October 31, 2013, one unaffiliated shareholder account owned 12.2% of the outstanding shares of the Fund. The Fund has no knowledge about whether any portion of those shares was owned beneficially by such account. Affiliated shareholder accounts owned 10.1% of the outstanding shares of the Fund. Subscription and redemption activity by concentrated accounts may have a significant effect on the operations of the Fund.
Note 7. Line of Credit
The Fund has entered into a revolving credit facility with a syndicate of banks led by JPMorgan Chase Bank N.A. (JPMorgan) whereby the Fund may borrow for the temporary funding of shareholder redemptions or for other temporary or emergency purposes. The credit facility agreement, as amended, which is a collective agreement between the Fund and certain other funds managed by the Investment Manager, severally and not jointly, permits collective borrowings up to $500 million. Interest is charged to each participating fund based on its borrowings at a rate equal to the higher of (i) the overnight federal funds rate plus 1.00% or (ii) the one-month LIBOR rate plus 1.00%. Each borrowing under the credit facility matures no later than 60 days after the date of borrowing. The Fund also pays a commitment fee equal to its pro rata share of the amount of the credit facility at a rate of 0.08% per annum. The commitment fee is included in other expenses in the Statement of Operations.
Effective December 10, 2013, the Fund extended its revolving credit facility with JPMorgan. The credit facility agreement, as amended, continues to permit collective borrowings up to $500 million under the same terms and interest rates as described above. Effective December 10, 2013, the Fund pays a commitment fee equal to its pro rata share of the amount of the credit facility at a rate of 0.075% per annum.
The Fund had no borrowings during the year ended October 31, 2013.
Note 8. Significant Risks
Geographic Concentration Risk
Because state-specific tax-exempt funds invest primarily in the municipal securities issued by the state and political sub-divisions of the state, the Fund will be particularly affected by political and economic conditions and developments in the state in which it invests. The Fund may, therefore, have a greater risk than that of a municipal bond fund which is more geographically diversified. The value of the municipal securities owned by the Fund also may be adversely affected by future changes in federal or state income tax laws.
Non-Diversification Risk
A non-diversified fund is permitted to invest a greater percentage of its total assets in fewer issuers than a diversified fund. The Fund may, therefore, have a greater risk of loss from a few issuers than a similar fund that invests more broadly.
Note 9. Subsequent Events
Management has evaluated the events and transactions that have occurred through the date the financial statements were issued and noted no items requiring adjustment of the financial statements or additional disclosure.
Note 10. Information Regarding Pending and Settled Legal Proceedings
In December 2005, without admitting or denying the allegations, American Express Financial Corporation (AEFC, which is now known as Ameriprise Financial, Inc. (Ameriprise Financial)) entered into settlement agreements with the Securities and Exchange Commission (SEC) and Minnesota Department of Commerce (MDOC) related to market timing activities. As a result, AEFC was censured and ordered to cease and desist from committing or causing any violations of certain provisions of the Investment Advisers Act of 1940, the Investment Company Act of 1940, and various Minnesota laws. AEFC agreed to pay disgorgement of $10 million and civil money penalties of $7 million. AEFC also agreed to retain an independent distribution consultant to assist in developing a plan for distribution of all disgorgement and civil penalties
Annual Report 2013
30
Columbia New York Tax-Exempt Fund
Notes to Financial Statements (continued)
October 31, 2013
ordered by the SEC in accordance with various undertakings detailed at www.sec.gov/litigation/admin/ia-2451.pdf. Ameriprise Financial and its affiliates have cooperated with the SEC and the MDOC in these legal proceedings, and have made regular reports to the funds' Boards of Trustees.
Ameriprise Financial and certain of its affiliates have historically been involved in a number of legal, arbitration and regulatory proceedings, including routine litigation, class actions, and governmental actions, concerning matters arising in connection with the conduct of their business activities. Ameriprise Financial believes that the Funds are not currently the subject of, and that neither Ameriprise Financial nor any of its affiliates are the subject of, any pending legal, arbitration or regulatory proceedings that are likely to have a material adverse effect on the Funds or the ability of Ameriprise Financial or its affiliates to perform under their contracts with the Funds. Ameriprise Financial is required to make 10-Q, 10-K and, as necessary, 8-K filings with the Securities and Exchange Commission on legal and regulatory matters that relate to Ameriprise Financial and its affiliates. Copies of these filings may be obtained by accessing the SEC website at www.sec.gov.
There can be no assurance that these matters, or the adverse publicity associated with them, will not result in increased fund redemptions, reduced sale of fund shares or other adverse consequences to the Funds. Further, although we believe proceedings are not likely to have a material adverse effect on the Funds or the ability of Ameriprise Financial or its affiliates to perform under their contracts with the Funds, these proceedings are subject to uncertainties and, as such, we are unable to estimate the possible loss or range of loss that may result. An adverse outcome in one or more of these proceedings could result in adverse judgments, settlements, fines, penalties or other relief that could have a material adverse effect on the consolidated financial condition or results of operations of Ameriprise Financial.
Annual Report 2013
31
Columbia New York Tax-Exempt Fund
Report of Independent Registered Public Accounting Firm
To the Trustees of Columbia Funds Series Trust I and the Shareholders of
Columbia New York Tax-Exempt Fund
In our opinion, the accompanying statement of assets and liabilities, including the portfolio of investments, and the related statements of operations and of changes in net assets and the financial highlights present fairly, in all material respects, the financial position of Columbia New York Tax-Exempt Fund (the "Fund", a series of Columbia Funds Series Trust I) at October 31, 2013, and the results of its operations, the changes in its net assets and the financial highlights for each of the periods indicated, in conformity with accounting principles generally accepted in the United States of America. These financial statements and financial highlights (hereafter referred to as "financial statements") are the responsibility of the Fund's management; our responsibility is to express an opinion on these financial statements based on our audits. We conducted our audits of these financial statements in accordance with the standards of the Public Company Accounting Oversight Board (United States). Those standards require that we plan and perform the audit to obtain reasonable assurance about whether the financial statements are free of material misstatement. An audit includes examining, on a test basis, evidence supporting the amounts and disclosures in the financial statements, assessing the accounting principles used and significant estimates made by management, and evaluating the overall financial statement presentation. We believe that our audits, which included confirmation of securities at October 31, 2013 by correspondence with the custodian, brokers and transfer agent, provide a reasonable basis for the opinion expressed above.
PricewaterhouseCoopers LLP
Minneapolis, Minnesota
December 19, 2013
Annual Report 2013
32
Columbia New York Tax-Exempt Fund
Federal Income Tax Information
(Unaudited)
The Fund hereby designates the following tax attributes for the fiscal year ended October 31, 2013. Shareholders will be notified in early 2014 of the amounts for use in preparing 2013 income tax returns.
Tax Designations
Capital Gain Dividend | | $ | 1,161,130 | | |
| Exempt-Interest Dividends | | | 99.98 | % | |
Capital Gain Dividend. The Fund designates as a capital gain dividend the amount reflected above, or if subsequently determined to be different, the net capital gain of such fiscal period. The Fund also designates as capital gain dividends, to the extent necessary to fully distribute such capital gains, earnings and profits distributed to shareholders on the redemption of shares.
Exempt-Interest Dividends. The percentage of net investment income dividends paid during the fiscal year that qualifies as exempt-interest dividends for federal income tax purposes.
Annual Report 2013
33
Columbia New York Tax-Exempt Fund
The Trustees serve terms of indefinite duration. The names, addresses and birth years of the Trustees and Officers of the Funds in Columbia Funds Series Trust I, the year each was first elected or appointed to office, their principal business occupations during at least the last five years, the number of Funds overseen by each Trustee and other directorships they hold are shown below. Each officer listed below serves as an officer of each Fund in Columbia Funds Series Trust I.
Independent Trustees
Name, Address and Year of Birth,
Position with Funds, Year First
Elected or Appointed to Office | | Principal Occupation(s) During Past Five Years, Number of Funds in Columbia
Funds Complex Overseen by Trustee, Other Directorships Held | |
Rodman L. Drake (Born 1943)
c/o Columbia Management
Investment Advisers, LLC
225 Franklin Street
Boston, MA 02110
Trustee (since 1994) and
Chairman of the Board (since 2009) | | Independent consultant since 2010; Co-Founder of Baringo Capital LLC (private equity) from 1997 to 2008; Chairman (from 2003 to 2010) and CEO (from 2008 to 2010) of Crystal River Capital, Inc. (real estate investment trust); Oversees 52; Jackson Hewitt Tax Service Inc. (tax preparation services) from 2004 to 2011; Student Loan Corporation (student loan provider) from 2005 to 2010; Celgene Corporation (global biotechnology company); The Helios Funds and Brookfield Funds (closed-end funds); Chimerix, Inc. (biopharmaceutical company) since August 1, 2013; Crystal River Capital, Inc. from 2005 to 2010; Parsons Brinckerhoff from 1995 to 2008; and Apex Silver Mines Ltd. from 2007 to 2009 | |
Douglas A. Hacker (Born 1955)
c/o Columbia Management
Investment Advisers, LLC
225 Franklin Street
Boston, MA 02110
Trustee (since 1996) | | Independent business executive since May 2006; Executive Vice President — Strategy of United Airlines from December 2002 to May 2006; President of UAL Loyalty Services (airline marketing company) from September 2001 to December 2002; Executive Vice President and Chief Financial Officer of United Airlines from July 1999 to September 2001. Oversees 52; Nash Finch Company (food distributor); Aircastle Limited (aircraft leasing); and SeaCube Container Leasing Ltd. (container leasing) | |
Janet Langford Kelly (Born 1957)
c/o Columbia Management
Investment Advisers, LLC
225 Franklin Street
Boston, MA 02110
Trustee (since 1996) | | Senior Vice President, General Counsel and Corporate Secretary, ConocoPhillips (integrated energy company) since September 2007; Deputy General Counsel — Corporate Legal Services, ConocoPhillips from August 2006 to August 2007; Partner, Zelle, Hofmann, Voelbel, Mason & Gette LLP (law firm) from March 2005 to July 2006; Adjunct Professor of Law, Northwestern University from September 2004 to June 2006; Director, UAL Corporation (airline) from February 2006 to July 2006; Chief Administrative Officer and Senior Vice President, Kmart Holding Corporation (consumer goods) from September 2003 to March 2004. Oversees 52; None | |
Nancy T. Lukitsh (Born 1956)
c/o Columbia Management
Investment Advisers, LLC
225 Franklin Street
Boston, MA 02110
Trustee (since 2011) | | Senior Vice President, Partner and Director of Marketing, Wellington Management Company, LLP (investment adviser) from 1997 to 2010; Chair, Wellington Management Investment Portfolios (commingled non-U.S. investment pools) from 2007 to 2010; Director, Wellington Trust Company, NA and other Wellington affiliates from 1997 to 2010. Oversees 52; None | |
William E. Mayer (Born 1940)
c/o Columbia Management
Investment Advisers, LLC
225 Franklin Street
Boston, MA 02110
Trustee (since 1994) | | Partner, Park Avenue Equity Partners (private equity) since February 1999; Dean and Professor, College of Business and Management, University of Maryland from 1992 to 1996. Oversees 52; DynaVox Inc. (speech creation); Lee Enterprises (print media); WR Hambrecht + Co. (financial service provider) from 2000 to 2012; BlackRock Kelso Capital Corporation (investment company) | |
David M. Moffett (Born 1952)
c/o Columbia Management
Investment Advisers, LLC
225 Franklin Street
Boston, MA 02110
Trustee (since 2011) | | Retired. Chief Executive Officer, Federal Home Loan Mortgage Corporation, from 2008 to 2009; Senior Adviser, Global Financial Services Group, Carlyle Group, Inc., from 2007 to 2008; Vice Chairman and Chief Financial Officer, U.S. Bancorp, from 1993 to 2007. Oversees 52; CIT Group Inc. (commercial and consumer finance); eBay Inc. (online trading community); MBIA Inc. (financial service provider); E.W. Scripps Co. (print and television media), Building Materials Holding Corp. (building materials and construction services); Genworth Financial, Inc. (financial and insurance products and services); and University of Oklahoma Foundation | |
Charles R. Nelson (Born 1942)
c/o Columbia Management
Investment Advisers, LLC
225 Franklin Street
Boston, MA 02110
Trustee (since 1981) | | Retired. Professor Emeritus, University of Washington, since 2011; Professor of Economics, University of Washington from 1976 to 2011; Ford and Louisa Van Voorhis Professor of Political Economy, University of Washington from 1993 to 2011; Adjunct Professor of Statistics, University of Washington from 1980 to 2011; Associate Editor, Journal of Money, Credit and Banking from September 1993 to 2008; consultant on econometric and statistical matters. Oversees 52; None | |
John J. Neuhauser (Born 1943)
c/o Columbia Management
Investment Advisers, LLC
225 Franklin Street
Boston, MA 02110
Trustee (since 1984) | | President, Saint Michael's College, since August 2007; Director or Trustee of several non-profit organizations, including Fletcher Allen Health Care, Inc.; University Professor, Boston College from November 2005 to August 2007; Academic Vice President and Dean of Faculties, Boston College from August 1999 to October 2005. Oversees 52; Liberty All-Star Equity Fund and Liberty All-Star Growth Fund (closed-end funds) | |
Annual Report 2013
34
Columbia New York Tax-Exempt Fund
Trustees and Officers (continued)
Independent Trustees (continued)
Name, Address and Year of Birth,
Position with Funds, Year First
Elected or Appointed to Office | | Principal Occupation(s) During Past Five Years, Number of Funds in Columbia
Funds Complex Overseen by Trustee, Other Directorships Held | |
Patrick J. Simpson (Born 1944)
c/o Columbia Management
Investment Advisers, LLC
225 Franklin Street
Boston, MA 02110
Trustee (since 2000) | | Partner, Perkins Coie LLP (law firm). Oversees 52; None | |
Anne-Lee Verville (Born 1945)
c/o Columbia Management
Investment Advisers, LLC
225 Franklin Street
Boston, MA 02110
Trustee (since 1998) | | Retired. General Manager — Global Education Industry from 1994 to 1997, President — Application Systems Division from 1991 to 1994, Chief Financial Officer — US Marketing & Services from 1988 to 1991, and Chief Information Officer from 1987 to 1988, IBM Corporation (computer and technology). Oversees 52; Enesco Group, Inc. (producer of giftware and home and garden decor products) from 2001 to 2006 | |
Interested Trustee
Name, Address and Year of Birth,
Position with Funds, Year First
Elected or Appointed to Office | | Principal Occupation(s) During Past Five Years, Number of Funds in Columbia
Funds Complex Overseen by Trustee, Other Directorships Held | |
William F. Truscott (born 1960)
53600 Ameriprise Financial Center
Minneapolis, MN 55474
Senior Vice President (since 2012) | | Chairman of the Board and President, Columbia Management Investment Advisers, LLC since May 2010 and February 2012 (previously President and Chief Investment Officer, from 2001 to April 2010); Chief Executive Officer, Global Asset Management, Ameriprise Financial, Inc. since September 2012 (previously, Chief Executive Officer, U.S. Asset Management & President, Annuities, from May 2010 to September 2012 and President — U.S. Asset Management and Chief Investment Officer from 2005 to April 2010); Director and Chief Executive Officer, Columbia Management Investment Distributors, Inc. since May 2010 and February 2012, respectively (previously Chairman of the Board and Chief Executive Officer from 2006 to April 2010); Chairman of the Board and Chief Executive Officer, RiverSource Distributors, Inc. since 2006; President and Chief Executive Officer, Ameriprise Certificate Company, 2006 to August 2012; Oversees 184; Director, Ameriprise Certificate Company, 2006-January 2013 | |
The Statement of Additional Information includes additional information about the Trustees of the Funds and is available, without charge, upon request by calling 800.345.6611.
The Board has appointed officers who are responsible for day-to-day business decisions based on policies it has established. The officers serve at the pleasure of the Board. In addition to Mr. Truscott, who is Senior Vice President, the Funds' other officers are:
Officers
Name, Address and
Year of Birth | | Position and Year
First Appointed to
Position for any
Fund in the Columbia
Funds Complex or a
Predecessor Thereof | | Principal Occupation(s) During Past Five Years | |
J. Kevin Connaughton
225 Franklin Street
Boston, MA 02110
Born 1964 | | President and Principal Executive Officer (2009) | | Senior Vice President and General Manager — Mutual Fund Products, Columbia Management Investment Advisers, LLC, since May 2010; and President, Columbia Funds since 2009; previously, Managing Director, Columbia Management Advisors, LLC, from December 2004 to April 2010; Senior Vice President and Chief Financial Officer, Columbia Funds, from June 2008 to January 2009; and senior officer of Columbia Funds and affiliated funds since 2003. | |
Michael G. Clarke
225 Franklin Street
Boston, MA 02110
Born 1969 | | Treasurer (2011) and Chief Financial Officer (2009) | | Vice President, Columbia Management Investment Advisers, LLC, since May 2010; previously, Managing Director of Fund Administration, Columbia Management Advisors, LLC, from September 2004 to April 2010; and senior officer of Columbia Funds and affiliated funds since 2002. | |
Annual Report 2013
35
Columbia New York Tax-Exempt Fund
Trustees and Officers (continued)
Officers (continued)
Name, Address and
Year of Birth | | Position and Year
First Appointed to
Position for any
Fund in the Columbia
Funds Complex or a
Predecessor Thereof | | Principal Occupation(s) During Past Five Years | |
Scott R. Plummer
5228 Ameriprise
Financial Center
Minneapolis, MN 55474
Born 1959 | | Senior Vice President (2006), Chief Legal Officer (2006) and Assistant Secretary (2011) | | Senior Vice President, Chief Legal Officer and Assistant Secretary, Columbia Management Investment Advisers, LLC, since June 2005; Senior Vice President and Lead Chief Counsel — Asset Management, Ameriprise Financial, Inc., since May 2010 (previously, Vice President and Chief Counsel — Asset Management, from 2005 to April 2010); Vice President, Chief Counsel and Assistant Secretary, Columbia Management Investment Distributors, Inc., since 2008; Vice President, General Counsel and Secretary, Ameriprise Certificate Company, since 2005; Chief Counsel, RiverSource Distributors, Inc., since 2006; and senior officer of Columbia Funds and affiliated funds since 2006. | |
Thomas P. McGuire
225 Franklin Street
Boston, MA 02110
Born 1972 | | Chief Compliance Officer (2012) | | Vice President — Asset Management Compliance, Ameriprise Financial, Inc., since May 2010; Chief Compliance Officer, Ameriprise Certificate Company, since September 2010; Compliance Executive, Bank of America, from 2005 to April 2010. | |
Colin Moore
225 Franklin Street
Boston, MA 02110
Born 1958 | | Senior Vice President (2010) | | Executive Vice President and Global Chief Investment Officer, Ameriprise Financial, Inc., since July 2013; Director and Global Chief Investment Officer, Columbia Management Investment Advisers, LLC, since May 2010; previously, Manager, Managing Director and Chief Investment Officer, Columbia Management Advisors, LLC, from 2007 to April 2010. | |
Michael E. DeFao
225 Franklin Street
Boston, MA 02110
Born 1968 | | Vice President (2011) and Assistant Secretary (2010) | | Vice President and Chief Counsel, Ameriprise Financial, Inc., since May 2010; Associate General Counsel, Bank of America from 2005 to April 2010. | |
Joseph F. DiMaria
225 Franklin Street
Boston, MA 02110
Born 1968 | | Vice President (2011) and Chief Accounting Officer (2008) | | Vice President — Mutual Fund Administration, Columbia Management Investment Advisers, LLC, since May 2010; previously, Director of Fund Administration, Columbia Management Advisors, LLC, from 2006 to April 2010. | |
Paul B. Goucher
100 Park Avenue
New York, NY 10017
Born 1968 | | Vice President (2011) and Assistant Secretary (2008) | | Vice President and Lead Chief Counsel, Ameriprise Financial, Inc., since November 2008 and January 2013, respectively (previously, Chief Counsel, from January 2010 to January 2013, and Group Counsel from November 2008 to January 2010); previously, Director, Managing Director and General Counsel, J. & W. Seligman & Co. Incorporated, from July 2008 to November 2008. | |
Amy Johnson
5228 Ameriprise
Financial Center
Minneapolis, MN
Born 1965 | | Vice President (2006) | | Senior Vice President and Chief Operating Officer, Columbia Management Investment Advisers, LLC, since May 2010; previously, Chief Administrative Officer, from 2009 to April 2010, and Vice President — Asset Management and Trust Company Services, from 2006 to 2009. | |
Paul D. Pearson
5228 Ameriprise
Financial Center
Minneapolis, MN
Born 1956 | | Vice President (2011) and Assistant Treasurer (1999) | | Vice President — Investment Accounting, Columbia Management Investment Advisers, LLC, since May 2010; previously, Vice President — Managed Assets, Investment Accounting, Ameriprise Financial, Inc. from 1998 to April 2010. | |
Christopher O. Petersen
5228 Ameriprise
Financial Center
Minneapolis, MN 55474
Born 1970 | | Vice President and Secretary (2010) | | Vice President and Chief Counsel, Ameriprise Financial, Inc., since January 2010 (previously, Vice President and Group Counsel or Counsel from 2004 to January 2010); officer of Columbia Funds and affiliated funds since 2007. | |
Stephen T. Welsh
225 Franklin Street
Boston, MA 02110
Born 1957 | | Vice President (2006) | | President and Director, Columbia Management Investment Services Corp., since May 2010; previously, President and Director, Columbia Management Services, Inc., from 2004 to April 2010; and Managing Director, Columbia Management Distributors, Inc., from 2007 to April 2010. | |
Annual Report 2013
36
Columbia New York Tax-Exempt Fund
Board Consideration and Approval of Advisory Agreement
On June 14, 2013, the Board of Trustees (the "Board") and the Trustees who are not interested persons (as defined in the Investment Company Act of 1940) of the Trust (the "Independent Trustees") unanimously approved the continuation of the Investment Management Services Agreement (the "Advisory Agreement") with Columbia Management Investment Advisers, LLC (the "Investment Manager") with respect to Columbia New York Tax-Exempt Fund (the "Fund"), a series of the Trust. As detailed below, the Advisory Fees and Expenses Committee (the "Committee") and the Board met on multiple occasions to review and discuss, both among themselves and with the management team of the Investment Manager, materials provided by the Investment Manager before determining to approve the continuation of the Advisory Agreement.
In connection with their deliberations regarding the continuation of the Advisory Agreement, the Committee and the Board evaluated materials requested from the Investment Manager regarding the Fund and the Advisory Agreement, and discussed these materials with representatives of the Investment Manager at Committee meetings held on March 5, 2013, April 24, 2013 and June 13, 2013, and at the Board meeting held on June 14, 2013. In addition, the Board considers matters bearing on the Advisory Agreement at most of its other meetings throughout the year and meets regularly with senior management of the Funds and the Investment Manager. Through the Board's Investment Oversight Committees, Trustees also meet with selected Fund portfolio managers and other investment personnel at various times throughout the year. The Committee and the Board also consulted with Fund counsel and with the Independent Trustees' independent legal counsel, who advised on various matters with respect to the Committee's and the Board's considerations and otherwise assisted the Committee and the Board in their deliberations. On June 13, 2013, the Committee recommended that the Board approve the continuation of the Advisory Agreement. On June 14, 2013, the Board, including the Independent Trustees, voting separately, unanimously approved the continuation of the Advisory Agreement for the Fund.
The Committee and the Board considered all information that they, their legal counsel, or the Investment Manager believed reasonably necessary to evaluate and to determine whether to approve the continuation of the Advisory Agreement. The information and factors considered by the Committee and the Board in recommending for approval or approving the continuation of the Advisory Agreement for the Fund included the following:
• Information on the investment performance of the Fund relative to the performance of a group of mutual funds determined to be comparable to the Fund by an independent third-party data provider, as well as performance relative to benchmarks;
• Information on the Fund's advisory fees and total expenses, including information comparing the Fund's expenses to those of a group of comparable mutual funds, as determined by the independent third-party data provider;
• The Investment Manager's agreement to contractually limit or cap total operating expenses for the Fund so that total operating expenses (excluding certain fees and expenses, such as transaction costs and certain other investment related expenses, interest, taxes, acquired fund fees and expenses, and extraordinary expenses) would not exceed the median expenses of a group of comparable funds (as determined from time to time, generally annually, by the independent third-party data provider);
• The terms and conditions of the Advisory Agreement;
• The terms and conditions of other agreements and arrangements with affiliates of the Investment Manager relating to the operations of the Fund, including the Administrative Services Agreement, the Distribution Agreement and the Transfer and Dividend Disbursing Agent Agreement;
• Descriptions of various functions performed by the Investment Manager under the Advisory Agreement, including portfolio management and portfolio trading practices;
• Information regarding the management fees and investment performance of comparable portfolios of other clients of the Investment Manager, including institutional separate accounts;
• Information regarding the reputation, regulatory history and resources of the Investment Manager, including information regarding senior management, portfolio managers and other personnel;
• Information regarding the capabilities of the Investment Manager with respect to compliance monitoring services, including an assessment of the Investment Manager's compliance system by the Fund's Chief Compliance Officer; and
• The profitability to the Investment Manager and its affiliates from their relationships with the Fund.
Annual Report 2013
37
Columbia New York Tax-Exempt Fund
Board Consideration and Approval of Advisory Agreement (continued)
Nature, Extent and Quality of Services Provided under the Advisory Agreement
The Committee and the Board considered the nature, extent and quality of services provided to the Fund by the Investment Manager and its affiliates under the Advisory Agreement and under separate agreements for the provision of transfer agency and administrative services, and the resources dedicated to the Fund and the other Columbia Funds by the Investment Manager and its affiliates. The Committee and the Board considered, among other things, the Investment Manager's ability to attract, motivate and retain highly qualified research, advisory and supervisory investment professionals (including personnel and other resources, compensation programs for personnel involved in fund management, reputation and other attributes), the portfolio management services provided by those investment professionals, and the quality of the Investment Manager's investment research capabilities and trade execution services. The Committee and the Board also considered the potential benefits to shareholders of investing in a mutual fund that is part of a fund complex offering exposure to a variety of asset classes and investment disciplines and providing a variety of fund and shareholder services.
The Committee and the Board also considered the professional experience and qualifications of the senior personnel of the Investment Manager, which included consideration of the Investment Manager's experience with similarly-structured funds. The Committee and the Board noted the compliance programs of and the compliance-related resources provided to the Fund by the Investment Manager and its affiliates, and considered the Investment Manager's ability to provide administrative services to the Fund pursuant to a separate Administrative Services Agreement, including the Investment Manager's ability to coordinate the activities of the Fund's other service providers. After reviewing these and related factors, the Committee and the Board concluded, within the context of their overall conclusions, that the nature, extent and quality of the services provided to the Fund under the Advisory Agreement supported the continuation of the Advisory Agreement.
Investment Performance
The Committee and the Board reviewed information about the performance of the Fund over various time periods, including performance information relative to benchmarks and information based on reports of the independent third-party data provider that compared the performance of the Fund to the performance of a group of comparable mutual funds. The Committee and the Board also reviewed a description of the third party's methodology for identifying the Fund's peer groups for purposes of performance and expense comparisons.
The Committee and the Board noted that, through December 31, 2012, the Fund's performance was in the twenty-fifth, twenty-fifth and eight percentile (where the best performance would be in the first percentile) of its category selected by the independent third-party data provider for the purposes of performance comparisons for the one-, three- and five- year periods, respectively.
The Committee and the Board also considered the Investment Manager's performance and reputation generally, the Investment Manager's historical responsiveness to Board concerns about performance, and the Investment Manager's willingness to take steps intended to improve performance. After reviewing these and related factors, the Committee and the Board concluded, within the context of their overall conclusions, that the performance of the Fund supported the continuation of the Advisory Agreement.
Investment Advisory Fee Rates and Other Expenses
The Committee and the Board considered the advisory fees charged to the Fund under the Advisory Agreement as well as the total expenses incurred by the Fund. In assessing the reasonableness of the fees under the Advisory Agreement, the Committee and the Board considered, among other information, the Fund's advisory fee and its total expense ratio as a percentage of average daily net assets. The Committee and the Board noted that the Fund's actual management fee and net expense ratio are ranked in the first and third quintiles, respectively, (where the lowest fees and expenses would be in the first quintile) against the Fund's expense universe as determined by the independent third-party data provider for purposes of expense comparison. The Committee and the Board also took into account the fee waiver and expense limitation arrangements agreed to by the Investment Manager, as noted above.
The Committee and the Board also received and considered information about the advisory fees charged by the Investment Manager to institutional separate accounts. In considering the fees charged to those accounts, the Committee and the Board took into account, among other things, the Investment Manager's representations about the differences between managing mutual funds as compared to other types of accounts, including differences in the services provided, differences in the risk
Annual Report 2013
38
Columbia New York Tax-Exempt Fund
Board Consideration and Approval of Advisory Agreement (continued)
profile of such business for the Investment Manager and the additional resources required to manage mutual funds effectively. In evaluating the Fund's advisory fees, the Committee and the Board also took into account the demands, complexity and quality of the investment management of the Fund.
After reviewing these and related factors, the Committee and the Board concluded, within the context of their overall conclusions, that the advisory fee rates and expenses of the Fund supported the continuation of the Advisory Agreement.
Costs of Services Provided and Profitability
The Committee and the Board also took note of the costs of the services provided (both on an absolute and relative basis) and the profitability to the Investment Manager and its affiliates in connection with their relationships with the Fund. In evaluating these considerations, the Committee and the Board took note of the advisory fees charged by the Investment Manager to other clients, including fees charged by the Investment Manager to institutional separate account clients with similar investment strategies to those of the Fund.
The Committee and the Board also considered the compensation directly or indirectly received by the Investment Manager's affiliates in connection with their relationships with the Fund. The Committee and the Board reviewed information provided by management as to the profitability of the Investment Manager and its affiliates of their relationships with the Fund, information about the allocation of expenses used to calculate profitability, and comparisons of profitability levels realized in 2012 to profitability levels realized in 2011. When reviewing profitability, the Committee and the Board also considered court cases in which adviser profitability was an issue in whole or in part, the performance of the Fund, the expense ratio of the Fund, and the implementation of expense limitations with respect to the Fund. The Committee and the Board also considered information provided by the Investment Manager regarding its financial condition and comparing its profitability to that of other asset management firms that are, or are subsidiaries of, publicly traded companies.
After reviewing these and related factors, the Committee and the Board concluded, within the context of their overall conclusions, that the costs of services provided and the profitability to the Investment Manager and its affiliates from their relationships with the Fund supported the continuation of the Advisory Agreement.
Economies of Scale
The Committee and the Board considered the potential existence of economies of scale in the provision by the Investment Manager of services to the Fund, to groups of related funds, and to the Investment Manager's investment advisory clients as a whole, and whether those economies of scale were shared with the Fund through breakpoints in investment advisory fees or other means, such as expense limitation arrangements and additional investments by the Investment Manager in investment, trading and compliance resources. The Committee and the Board noted that the investment advisory fee schedules for the Fund contained breakpoints that would reduce the fee rate on assets above specified threshold levels.
In considering these matters, the Committee and the Board also considered the costs of the services provided and the profitability to the Investment Manager and its affiliates from their relationships with the Fund, as discussed above. After reviewing these and related factors, the Committee and the Board concluded, within the context of their overall conclusions, that the extent to which any economies of scale were expected to be shared with the Fund supported the continuation of the Advisory Agreement.
Other Benefits to the Investment Manager
The Committee and the Board received and considered information regarding "fall-out" or ancillary benefits received by the Investment Manager and its affiliates as a result of their relationships with the Fund, such as the engagement of the Investment Manager to provide administrative services to the Fund and the engagement of the Investment Manager's affiliates to provide distribution and transfer agency services to the Fund. The Committee and the Board considered that the Fund's distributor retains a portion of the distribution fees from the Fund. The Committee and the Board also considered the benefits of research made available to the Investment Manager by reason of brokerage commissions generated by the Fund's securities transactions, and reviewed information about the Investment Manager's practices with respect to allocating portfolio transactions for brokerage and research services. The Committee and the Board considered the possible conflicts of interest associated with certain fall-out or other ancillary benefits and the reporting, disclosure and other processes that
Annual Report 2013
39
Columbia New York Tax-Exempt Fund
Board Consideration and Approval of Advisory Agreement (continued)
are in place to address such possible conflicts of interest. The Committee and the Board recognized that the Investment Manager's profitability would be somewhat lower without these benefits.
Conclusion
The Committee and the Board reviewed all of the above considerations in reaching their decisions to recommend or approve the continuation of the Advisory Agreement. In their deliberations, the Trustees did not identify any particular information that was all-important or controlling, and individual Trustees may have attributed different weights to the various factors. Based on their evaluation of all factors that they deemed to be material, including those factors described above, and assisted by the advice of independent legal counsel, the Board, including the Independent Trustees, voting separately, unanimously approved the continuation of the Advisory Agreement.
Annual Report 2013
40
Columbia New York Tax-Exempt Fund
Important Information About This Report
Each fund mails one shareholder report to each shareholder address. If you would like more than one report, please call shareholder services at 800.345.6611 and additional reports will be sent to you.
The policy of the Board is to vote the proxies of the companies in which each fund holds investments consistent with the procedures as stated in the Statement of Additional Information (SAI). You may obtain a copy of the SAI without charge by calling 800.345.6611; contacting your financial intermediary; visiting columbiamanagement.com; or searching the website of the Securities and Exchange Commission (SEC) at sec.gov. Information regarding how each fund voted proxies relating to portfolio securities is filed with the SEC by August 31 for the most recent 12-month period ending June 30 of that year, and is available without charge by visiting columbiamanagement.com; or searching the website of the SEC at sec.gov.
Each fund files a complete schedule of portfolio holdings with the SEC for the first and third quarters of each fiscal year on Form N-Q. Each fund's Form N-Q is available on the SEC's website at sec.gov and may be reviewed and copied at the SEC's Public Reference Room in Washington, D.C. Information on the operation of the Public Reference Room may be obtained by calling 800.SEC.0330. Each fund's complete schedule of portfolio holdings, as filed on Form N-Q, can also be obtained without charge, upon request, by calling 800.345.6611.
Annual Report 2013
41

Columbia New York Tax-Exempt Fund
P.O. Box 8081
Boston, MA 02266-8081
columbiamanagement.com
This information is for use with concurrent or prior delivery of a fund prospectus. Please read and consider the investment objectives, risks, charges and expenses for any fund carefully before investing. For a prospectus and, if available, a summary prospectus, which contains this and other important information about the Fund go to columbiamanagement.com. The Fund is distributed by Columbia Management Investment Distributors, Inc., member FINRA, and managed by Columbia Management Investment Advisers, LLC.
© 2013 Columbia Management Investment Advisers, LLC. All rights reserved.
ANN205_10_C01_(12/13)
Annual Report
October 31, 2013

Columbia International Bond Fund
Not FDIC insured • No bank guarantee • May lose value
 Dear Shareholders,
A market rally led by equities
Despite threats of military action in Syria, rumblings from Iran and an impending showdown over the debt ceiling here at home, the U.S. financial markets delivered positive results in the third quarter of 2013. Stocks outperformed bonds by a substantial margin. Still, robust growth continued to elude the U.S. economy, which merely plodded along. New job growth was solid but not spectacular. Consumer spending remained steady, but the only obvious beneficiary was the auto industry. Gains in the housing market met some headwinds, as mortgage rates rose and sales slipped somewhat. Nevertheless, the recovery in housing remained intact.
The Federal Reserve (the Fed) unsettled investors with a hint that it was ready to taper its purchase of U.S. Treasury and mortgage securities. However, its failure to take any action in a September meeting rallied stocks to new highs and brought bonds back into positive territory for the quarter. Small-cap stocks were the U.S. market leaders. Growth outperformed value in a quarter dominated by the materials, industrials and consumer discretionary sectors. Developed markets led the global rally, driven by strengthening economic conditions in the eurozone. Certain emerging stock markets, including China's, bounced back with returns in line with those of the United States. India and Indonesia were exceptions to that trend, as fears of the Fed's tapering efforts rattled investors in both countries.
Improved risk appetites boosted fixed income
Following a weak second quarter, the fixed-income markets made up some ground in the third quarter of 2013. As yields fell, bond prices rallied enough to push returns on non-Treasury sectors into positive territory. Risk appetites improved in response to continued liquidity from the Fed. Against this backdrop, U.S. high-yield and foreign bonds led the fixed-income markets, along with mortgage-backed securities and emerging market bonds. The U.S. municipal bond market was the exception, as it slipped into negative territory in the final week of the period, pressured by heightened concerns over Puerto Rico, potential municipal bankruptcies and continued fund redemptions.
Stay on track with Columbia Management
Backed by more than 100 years of experience, Columbia Management is one of the nation's largest asset managers. At the heart of our success and, most importantly, that of our investors, are highly talented industry professionals, brought together by a unique way of working. At Columbia Management, reaching our performance goals matters, and how we reach them matters just as much.
Visit columbiamanagement.com for:
> The Columbia Management Perspectives blog, offering insights on current market events and investment opportunities
> Detailed up-to-date fund performance and portfolio information
> Quarterly fund commentaries
> Columbia Management Investor, our award-winning quarterly newsletter for shareholders
Thank you for your continued support of the Columbia Funds. We look forward to serving your investment needs for many years to come.
Best Regards,

J. Kevin Connaughton
President, Columbia Funds
Investing involves risk including the risk of loss of principal.
Investors should consider the investment objectives, risks, charges and expenses of a mutual fund carefully before investing. For a free prospectus and, if available, a summary prospectus, which contains this and other important information about a fund, visit columbiamanagement.com. The prospectus should be read carefully before investing.
Columbia Funds are distributed by Columbia Management Investment Distributors, Inc., member FINRA, and managed by Columbia Management Investment Advisers, LLC.
© 2013 Columbia Management Investment Advisers, LLC. All rights reserved.
Columbia International Bond Fund
Performance Overview | | | 2 | | |
Manager Discussion of Fund Performance | | | 4 | | |
Understanding Your Fund's Expenses | | | 6 | | |
Portfolio of Investments | | | 7 | | |
Statement of Assets and Liabilities | | | 14 | | |
Statement of Operations | | | 16 | | |
Statement of Changes in Net Assets | | | 17 | | |
Financial Highlights | | | 19 | | |
Notes to Financial Statements | | | 24 | | |
Report of Independent Registered
Public Accounting Firm | | | 32 | | |
Trustees and Officers | | | 33 | | |
Board Consideration and Approval of Advisory Agreement | | | 36 | | |
Important Information About This Report | | | 41 | | |
Fund Investment Manager
Columbia Management Investment
Advisers, LLC
225 Franklin Street
Boston, MA 02110
Fund Distributor
Columbia Management Investment
Distributors, Inc.
225 Franklin Street
Boston, MA 02110
Fund Transfer Agent
Columbia Management Investment
Services Corp.
P.O. Box 8081
Boston, MA 02266-8081
For more information about any of the funds, please visit columbiamanagement.com or call 800.345.6611. Customer Service Representatives are available to answer your questions Monday through Friday from 8 a.m. to 8 p.m. Eastern time.
The views expressed in this report reflect the current views of the respective parties. These views are not guarantees of future performance and involve certain risks, uncertainties and assumptions that are difficult to predict, so actual outcomes and results may differ significantly from the views expressed. These views are subject to change at any time based upon economic, market or other conditions and the respective parties disclaim any responsibility to update such views. These views may not be relied on as investment advice and, because investment decisions for a Columbia Fund are based on numerous factors, may not be relied on as an indication of trading intent on behalf of any particular Columbia Fund. References to specific securities should not be construed as a recommendation or investment advice.
Columbia International Bond Fund
Performance Summary
> Columbia International Bond Fund (the Fund) Class A shares returned -3.22% excluding sales charges for the 12-month period that ended October 31, 2013.
> The Fund underperformed its Blended Benchmark, which returned -0.06% for the 12-month period.
> The Fund outperformed the Citigroup Non-U.S. Dollar World Government Bond (All Maturities) Index — Unhedged, which returned -3.75% for the same period.
> Exposure to emerging markets debt and an underweighted position in the Japanese yen contributed positively to the Fund's relative results, while country positioning, exposure to U.S. rates and underweighted positions in the euro and Swiss franc detracted.
Average Annual Total Returns (%) (for period ended October 31, 2013)
| | Inception | | 1 Year | | Life | |
Class A | | 12/01/08 | | | | | | | | | |
Excluding sales charges | | | | | | | -3.22 | | | | 4.34 | | |
Including sales charges | | | | | | | -7.82 | | | | 3.31 | | |
Class C | | 12/01/08 | | | | | | | | | |
Excluding sales charges | | | | | | | -4.01 | | | | 3.54 | | |
Including sales charges | | | | | | | -4.96 | | | | 3.54 | | |
Class I* | | 09/27/10 | | | -2.94 | | | | 4.53 | | |
Class W* | | 06/18/12 | | | -3.22 | | | | 3.93 | | |
Class Z | | 12/01/08 | | | -3.01 | | | | 4.60 | | |
Blended Benchmark | | | | | | | -0.06 | | | | 6.71 | | |
Citigroup Non-U.S. Dollar World Government Bond (All Maturities) Index — Unhedged | | | | | | | -3.75 | | | | 4.40 | | |
Returns for Class A are shown with and without the maximum initial sales charge of 4.75%. Returns for Class C are shown with and without the applicable contingent deferred sales charge (CDSC) of 1.00% for the first year only. The Fund's other classes are not subject to sales charges and have limited eligibility. Please see the Fund's prospectus for details. Performance for different share classes will vary based on differences in sales charges and fees associated with each class. All results shown assume reinvestment of distributions during the period. Returns do not reflect the deduction of taxes that a shareholder may pay on Fund distributions or on the redemption of Fund shares. Performance results reflect the effect of any fee waivers or reimbursements of Fund expenses by Columbia Management Investment Advisers, LLC and/or any of its affiliates. Absent these fee waivers or expense reimbursement arrangements, performance results would have been lower.
The performance information shown represents past performance and is not a guarantee of future results. The investment return and principal value of your investment will fluctuate so that your shares, when redeemed, may be worth more or less than their original cost. Current performance may be lower or higher than the performance information shown. You may obtain performance information current to the most recent month-end by contacting your financial intermediary, visiting columbiamanagement.com or calling 800.345.6611.
*The returns shown for periods prior to the share class inception date (including returns for the Life of the Fund, if shown, which are since Fund inception) include the returns of the Fund's oldest share class. Since the Fund launched more than one share class at its inception, Class A shares were used. These returns are adjusted to reflect any higher class-related operating expenses of the newer share classes, as applicable. Please visit columbiamanagement.com/mutual-funds/appended-performance for more information.
The Blended Benchmark, a weighted custom composite, established by the Investment Manager, consists of a 60% weighting in the Citigroup World Government Bond (excluding the U.S. and Japan) Index (the Citigroup WGBI — ex U.S./Japan), a 20% weighting in the Citigroup Japan Government Bond Index (the Citigroup Japan GBI) and a 20% weighting in the JPMorgan Government Bond Index — Emerging Markets Global Diversified Composite (the JPM GBI EM — Global Diversified). The Citigroup WGBI — ex U.S./Japan has the same calculation and inclusion criteria as the Fund's primary benchmark, the Citigroup Non.U.S. WGBI — Unhedged, while excluding issues from the United States and also Japan. The Citigroup Japan GBI is a market-weighted index based on Yen-denominated debt instruments issued by the government of Japan. The JPM GBI — EM Global Diversified tracks total returns for emerging markets local-currency denominated fixed income instruments.
The Citigroup Non-U.S. Dollar World Government Bond (All Maturities) Index — Unhedged (Citigroup Non-U.S. WGBI — Unhedged) is calculated on a market-weighted basis and includes investment-grade, fixed-rate bonds, issued by governments outside of the United States (currently, 21 countries), with a remaining maturity of one year or longer and with amounts outstanding of at least the equivalent of U.S. $25 million.
Indices are not available for investment, are not professionally managed and do not reflect sales charges, fees, brokerage commissions, taxes or other expenses of investing. Securities in the Fund may not match those in an index.
Annual Report 2013
2
Columbia International Bond Fund
Performance Overview (continued)
Performance of a Hypothetical $10,000 Investment (December 1, 2008 – October 31, 2013)
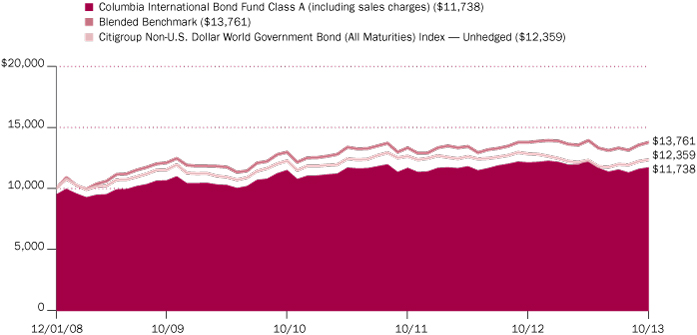
The chart above shows the change in value of a hypothetical $10,000 investment in Class A shares of Columbia International Bond Fund during the stated time period, and does not reflect the deduction of taxes that a shareholder may pay on Fund distributions or on the redemption of Fund shares.
Annual Report 2013
3
Columbia International Bond Fund
Manager Discussion of Fund Performance
At October 31, 2013, approximately 74% of the Fund's shares were owned in the aggregate by affiliated funds-of-funds managed by Columbia Management Investment Advisers, LLC (the Investment Manager). As a result of asset allocation decisions by the Investment Manager, it is possible that the Fund may experience relatively large purchases or redemptions from affiliated funds-of-funds. The Investment Manager seeks to minimize the impact of these transactions by structuring them over a reasonable period of time. The Fund may experience increased expenses as it buys and sells securities as a result of purchases or redemptions by affiliated funds-of-funds.
For the 12-month period that ended October 31, 2013, the Fund's Class A shares returned -3.22% excluding sales charge. The Fund underperformed the Blended Benchmark, which returned -0.06% for the reporting period. The Blended Benchmark consists 60% of the Citigroup World Government Bond (excluding the U.S. and Japan) Index, 20% of the Citigroup Japan Government Bond Index and 20% of the JPMorgan Government Bond Index — Emerging Markets Global Diversified Composite. The Fund outperformed the Citigroup Non-U.S. Dollar World Government Bond (All Maturities) Index — Unhedged (Citigroup Index), which returned -3.75% for the same period. Exposure to emerging markets debt and an underweighted position in the Japanese yen contributed positively to the Fund's relative results, while country positioning, exposure to U.S. rates and underweighted positions in the euro and Swiss franc detracted.
Global Expansion Broadening Slowly
The global economy appears to have risen out of its 2012 doldrums, driven principally by central bank policy actions and as the deleveraging headwinds created by the global financial crisis of 2007-2008 faded further into the background. Still, signs of a broad-based reacceleration in global activity remained limited. For example, measures of excess capacity remained well above normal in the developed economies. Excess capacity was especially obvious in the eurozone, which only just escaped recession and which has historically high unemployment rates in many member countries.
Higher Yielding Bonds Drove Returns
The 12-month period was characterized by improving global economic growth prospects, despite the partial U.S. government shutdown. The European Central Bank's (the ECB's) Outright Monetary Transactions, the U.S. Federal Reserve's (the Fed's) open-ended quantitative easing program, and Japanese "Abenomics" collectively sent a powerful message that the period of easy money would be ongoing for an extended time, thereby significantly reducing tail risks. In turn, risk assets, such as equities and high yield corporate bonds, generally performed strongly during the period. However, emerging market debt posted negative returns, and international government bonds generated only modestly positive returns. Amongst international government bonds broadly, higher-yielding government bonds tended to outperform lower-yielding government bonds in the low nominal interest rate environment that dominated.
Contributors and Detractors
The Fund's country positioning and exposure to rising U.S. interest rates through U.S. dollar-denominated emerging market bonds detracted from its results during the period. Given our concern about the eurozone's unresolved fundamental
Portfolio Management
Nicholas Pifer, CFA
C. Michael Ng, CFA
Jim Cielinski*
Matthew Cobon*
*Effective October 18, 2013, Mr. Cielinski and Mr. Cobon, were named Portfolio Managers of the Fund.
Country Breakdown (%)
(at October 31, 2013) | |
Argentina | | | 0.5 | | |
Australia | | | 4.3 | | |
Austria | | | 0.4 | | |
Belgium | | | 0.2 | | |
Brazil | | | 0.6 | | |
Bulgaria | | | 0.1 | | |
Canada | | | 6.4 | | |
Colombia | | | 0.8 | | |
Denmark | | | 0.2 | | |
Dominican Republic | | | 0.4 | | |
Finland | | | 0.3 | | |
France | | | 13.1 | | |
Germany | | | 12.3 | | |
Guatemala | | | 0.5 | | |
Hungary | | | 0.1 | | |
Indonesia | | | 3.0 | | |
Japan | | | 8.4 | | |
Kazakhstan | | | 0.4 | | |
Lithuania | | | 0.2 | | |
Mexico | | | 6.6 | | |
Netherlands | | | 4.7 | | |
New Zealand | | | 0.9 | | |
Norway | | | 5.5 | | |
Panama | | | 0.1 | | |
Peru | | | 0.6 | | |
Philippines | | | 1.0 | | |
Poland | | | 4.6 | | |
Romania | | | 0.6 | | |
Russian Federation | | | 3.6 | | |
South Africa | | | 2.0 | | |
Supra-National | | | 1.2 | | |
Sweden | | | 2.2 | | |
Turkey | | | 1.4 | | |
Ukraine | | | 0.3 | | |
United Kingdom | | | 6.5 | | |
United States(a) | | | 5.0 | | |
Uruguay | | | 0.1 | | |
Venezuela | | | 0.9 | | |
Total | | | 100.0 | | |
Percentages indicated are based upon total investments. The Fund's portfolio composition is subject to change.
(a) Includes investments in Money Market Funds.
Annual Report 2013
4
Columbia International Bond Fund
Manager Discussion of Fund Performance (continued)
problems, such as high debt burden and low potential growth resulting from aging populations and low productivity, the Fund was rather conservatively structured with an underweight in the euro and the Swiss franc and with no exposure at all to the government bond markets of Italy, Spain and Ireland. As a result, the Fund did not participate in the strong rallies the euro, Swiss franc and peripheral European government bond markets enjoyed during the period. Such detractors were partially offset by the positive contributions made by exposure to emerging market debt and by an underweighted position in the Japanese yen, which depreciated significantly during the period.
The Fund utilized currency forward contracts to manage the currency weights in the Fund for hedging and investment purposes and futures contracts to manage the duration and yield curve exposure of the Fund versus its benchmark during the period. Since we thought the euro would depreciate against the U.S. dollar and the Swiss franc would depreciate against the euro, we sold the Swiss franc against the U.S. dollar. This Swiss franc currency hedge resulted in a loss.
Looking Ahead
In the eurozone, we believe economic growth is likely to occur at a sub-par pace in the year ahead, thereby providing a strong case for the ECB to become even easier on the monetary policy front. Record high unemployment, weak credit growth, inflation readings back in the deflation warning zone, and a euro exchange rate that remains stubbornly high are all signs, in our view, that monetary conditions in the eurozone remain too tight on average.
We expect global bond yields to move higher in the year ahead. However, we expect this move to be more measured than the spike seen from early May to early September 2013, which saw the yield on the benchmark 10-year U.S. Treasury note rise 135 basis points from trough to peak. (A basis point is 1/100th of a percentage point.)
At present, we remain constructive on the outlook for the U.S. dollar over the medium term. The U.S. economy is currently farther along in the structural healing process than either Europe or Japan, and we believe monetary policy is likely to normalize sooner in the U.S. as a result, even with the Fed's unexpected mid-September delay of its tapering process. We believe the rapid increase in U.S. oil and gas production is another medium-term positive for the U.S. currency, since a secular decline in the demand for imported oil should allow the U.S. economy to grow more quickly with less negative impact on the country's external accounts than in the past. But the Fed's reversal on tapering mutes our enthusiasm for the U.S. currency in the near term.
As always, we continue to monitor the international government bond markets for changing conditions and to adjust the Fund's country, currency, duration and yield curve positioning in an effort to seek an attractive balance between risk and potential return.
Quality Breakdown (%)
(at October 31, 2013) | |
AAA rating | | | 34.9 | | |
AA rating | | | 33.6 | | |
A rating | | | 11.1 | | |
BBB rating | | | 15.2 | | |
Non-investment grade | | | 4.7 | | |
Not rated | | | 0.5 | | |
Total | | | 100.0 | | |
Percentages indicated are based upon total fixed income securities (excluding Money Market Funds).
Bond ratings apply to the underlying holdings of the Fund and not the Fund itself and are divided into categories ranging from AAA (highest) to D (lowest), and are subject to change. The ratings shown are determined by using the middle rating of Moody's, S&P, and Fitch after dropping the highest and lowest available ratings. When a rating from only two agencies is available, the lower rating is used. When a rating from only one agency is available, that rating is used. When a bond is not rated by one of these agencies, it is designated as Not rated. Credit ratings are subjective opinions and not statements of fact.
Investment Risks
Risks include prepayments, foreign, political and economic developments and bond market fluctuations due to changes in interest rates. When interest rates go up, bond prices typically drop and vice versa. Lower quality debt securities involve greater risk of default or price volatility from changes in credit quality of individual issuers. Funds which concentrate their investments in a geographic region may expose an investor to greater volatility: for example, currency fluctuations, differences in security regulation, accounting standards, foreign taxation regulations and political risks. These risks may be enhanced in emerging markets. Derivative instruments are financial instruments that have a value dependent on the value of something else, such as one or more underlying securities. Gains or losses may be substantial, because a relatively small price movement in an underlying security may result in a substantial gain or loss. See the Fund's prospectus for information on these and other risks.
Annual Report 2013
5
Columbia International Bond Fund
Understanding Your Fund's Expenses
(Unaudited)
As an investor, you incur two types of costs. There are transaction costs, which generally include sales charges on purchases and may include redemption fees. There are also ongoing costs, which generally include management fees, distribution and service (Rule 12b-1) fees, and other fund expenses. The following information is intended to help you understand your ongoing costs (in dollars) of investing in the Fund and to help you compare these costs with the ongoing costs of investing in other mutual funds.
Analyzing Your Fund's Expenses
To illustrate these ongoing costs, we have provided examples and calculated the expenses paid by investors in each share class of the Fund during the period. The actual and hypothetical information in the table is based on an initial investment of $1,000 at the beginning of the period indicated and held for the entire period. Expense information is calculated two ways and each method provides you with different information. The amount listed in the "Actual" column is calculated using the Fund's actual operating expenses and total return for the period. You may use the Actual information, together with the amount invested, to estimate the expenses that you paid over the period. Simply divide your account value by $1,000 (for example, an $8,600 account value divided by $1,000 = 8.6), then multiply the results by the expenses paid during the period under the Actual column. The amount listed in the "Hypothetical" column assumes a 5% annual rate of return before expenses (which is not the Fund's actual return) and then applies the Fund's actual expense ratio for the period to the hypothetical return. You should not use the hypothetical account values and expenses to estimate either your actual account balance at the end of the period or the expenses you paid during the period. See "Compare With Other Funds" below for details on how to use the hypothetical data.
Compare With Other Funds
Since all mutual funds are required to include the same hypothetical calculations about expenses in shareholder reports, you can use this information to compare the ongoing cost of investing in the Fund with other funds. To do so, compare the hypothetical example with the 5% hypothetical examples that appear in the shareholder reports of other funds. As you compare hypothetical examples of other funds, it is important to note that hypothetical examples are meant to highlight the ongoing costs of investing in a fund only and do not reflect any transaction costs, such as sales charges, or redemption or exchange fees. Therefore, the hypothetical calculations are useful in comparing ongoing costs only, and will not help you determine the relative total costs of owning different funds. If transaction costs were included in these calculations, your costs would be higher.
May 1, 2013 – October 31, 2013
| | Account Value at the Beginning
of the Period ($) | | Account Value at the End of the
Period ($) | | Expenses Paid During the
Period ($) | | Fund's Annualized
Expense Ratio (%) | |
| | Actual | | Hypothetical | | Actual | | Hypothetical | | Actual | | Hypothetical | | Actual | |
Class A | | | 1,000.00 | | | | 1,000.00 | | | | 958.80 | | | | 1,019.71 | | | | 5.38 | | | | 5.55 | | | | 1.09 | | |
Class C | | | 1,000.00 | | | | 1,000.00 | | | | 955.30 | | | | 1,015.93 | | | | 9.07 | | | | 9.35 | | | | 1.84 | | |
Class I | | | 1,000.00 | | | | 1,000.00 | | | | 960.00 | | | | 1,021.48 | | | | 3.66 | | | | 3.77 | | | | 0.74 | | |
Class W | | | 1,000.00 | | | | 1,000.00 | | | | 958.80 | | | | 1,019.71 | | | | 5.38 | | | | 5.55 | | | | 1.09 | | |
Class Z | | | 1,000.00 | | | | 1,000.00 | | | | 959.70 | | | | 1,020.97 | | | | 4.15 | | | | 4.28 | | | | 0.84 | | |
Expenses paid during the period are equal to the annualized expense ratio for each class as indicated above, multiplied by the average account value over the period and then multiplied by the number of days in the Fund's most recent fiscal half year and divided by 365.
Expenses do not include fees and expenses incurred indirectly by the Fund from the underlying funds in which the Fund may invest (also referred to as "acquired funds"), including affiliated and non-affiliated pooled investment vehicles (including mutual funds and exchange-traded funds).
Had Columbia Management Investment Advisers, LLC and/or certain of its affiliates not waived/reimbursed certain fees and expenses, account value at the end of the period would have been reduced.
Annual Report 2013
6
Columbia International Bond Fund
Portfolio of Investments
October 31, 2013
(Percentages represent value of investments compared to net assets)
Corporate Bonds & Notes(a) 1.4%
Issuer | | Coupon
Rate | | Principal
Amount ($) | | Value ($) | |
Supra-National 1.2% | |
Asian Development Bank
Senior Unsecured
06/21/27 | | | 2.350 | % | | JPY | | | | | 50,000,000 | | | | 607,840 | | |
Eurofima
Senior Unsecured
10/21/19 | | | 4.375 | % | | EUR | | | | | 100,000 | | | | 157,342 | | |
Total | | | | | | | | | 765,182 | | |
Ukraine 0.2% | |
MHP SA(b)
04/02/20 | | | 8.250 | % | | | | | | | 200,000 | | | | 171,589 | | |
Total Corporate Bonds & Notes
(Cost: $884,125) | | | | | | | | | 936,771 | | |
Inflation-Indexed Bonds(a) 0.1%
Japan 0.1% | |
Uruguay Government International Bond
04/05/27 | | | 4.250 | % | | UYU | | | | | 1,311,618 | | | | 65,212 | | |
Total Inflation-Indexed Bonds
(Cost: $72,682) | | | | | | | | | 65,212 | | |
Foreign Government Obligations(a)(e) 89.5%
Argentina 0.5% | |
Argentina Boden Bonds
10/03/15 | | | 7.000 | % | | | | | | | 100,000 | | | | 94,650 | | |
Argentina Bonar Bonds
04/17/17 | | | 7.000 | % | | | | | | | 262,000 | | | | 227,940 | | |
Total | | | | | | | | | 322,590 | | |
Australia 4.1% | |
Australia Government Bond
Senior Unsecured
04/21/23 | | | 5.500 | % | | AUD | | | | | 160,000 | | | | 169,658 | | |
Treasury Corp. of Victoria
11/15/18 | | | 5.500 | % | | AUD | | | | | 1,500,000 | | | | 1,530,515 | | |
Local Government Guaranteed
11/15/16 | | | 5.750 | % | | AUD | | | | | 220,000 | | | | 223,099 | | |
06/15/20 | | | 6.000 | % | | AUD | | | | | 720,000 | | | | 755,985 | | |
Total | | | | | | | | | 2,679,257 | | |
Austria 0.4% | |
Austria Government Bond
Senior Unsecured(b)
09/15/17 | | | 4.300 | % | | EUR | | | | | 170,000 | | | | 262,873 | | |
Foreign Government Obligations(a)(e) (continued)
Issuer | | Coupon
Rate | | Principal
Amount ($) | | Value ($) | |
Belgium 0.2% | |
Belgium Government Bond(b)
03/28/15 | | | 3.500 | % | | EUR | | | | | 75,000 | | | | 106,448 | | |
Brazil 0.5% | |
Brazilian Government International Bond
Senior Unsecured
02/03/15 | | | 7.375 | % | | EUR | | | | | 30,000 | | | | 44,003 | | |
03/07/15 | | | 7.875 | % | | | | | | | 50,000 | | | | 54,400 | | |
01/20/34 | | | 8.250 | % | | | | | | | 70,000 | | | | 93,450 | | |
Petrobras International Finance Co.
01/27/21 | | | 5.375 | % | | | | | | | 150,000 | | | | 152,369 | | |
Total | | | | | | | | | 344,222 | | |
Bulgaria 0.1% | |
Bulgaria Government International Bond
Senior Unsecured
01/15/15 | | | 8.250 | % | | | | | | | 60,000 | | | | 65,208 | | |
Canada 6.1% | |
Canadian Government Bond
09/01/18 | | | 1.250 | % | | CAD | | | | | 2,100,000 | | | | 1,970,393 | | |
Province of Ontario
06/02/19 | | | 4.400 | % | | CAD | | | | | 1,100,000 | | | | 1,164,281 | | |
Province of Quebec
12/01/17 | | | 4.500 | % | | CAD | | | | | 700,000 | | | | 738,711 | | |
Senior Unsecured
04/29/19 | | | 5.000 | % | | EUR | | | | | 50,000 | | | | 81,065 | | |
Total | | | | | | | | | 3,954,450 | | |
Colombia 0.8% | |
Colombia Government International Bond
Senior Unsecured
07/12/21 | | | 4.375 | % | | | | | | | 200,000 | | | | 211,800 | | |
05/21/24 | | | 8.125 | % | | | | | | | 50,000 | | | | 66,250 | | |
Ecopetrol SA
Senior Unsecured
07/23/19 | | | 7.625 | % | | | | | | | 45,000 | | | | 54,225 | | |
Empresas Publicas de Medellin ESP
Senior Unsecured(b)
02/01/21 | | | 8.375 | % | | COP | | | | | 340,000,000 | | | | 187,127 | | |
Total | | | | | | | | | 519,402 | | |
Denmark 0.2% | |
Denmark Government Bond
11/15/13 | | | 5.000 | % | | DKK | | | | | 695,000 | | | | 126,743 | | |
Dominican Republic 0.4% | |
Dominican Republic International Bond
Senior Unsecured(b)
05/06/21 | | | 7.500 | % | | | | | | | 250,000 | | | | 277,782 | | |
The accompanying Notes to Financial Statements are an integral part of this statement.
Annual Report 2013
7
Columbia International Bond Fund
Portfolio of Investments (continued)
October 31, 2013
Foreign Government Obligations(a)(e) (continued)
Issuer | | Coupon
Rate | | Principal
Amount ($) | | Value ($) | |
Finland 0.3% | |
Finland Government Bond
Senior Unsecured(b)
07/04/15 | | | 4.250 | % | | EUR | | | | | 145,000 | | | | 210,286 | | |
France 12.6% | |
France Government Bond OAT
04/25/17 | | | 3.750 | % | | EUR | | | | | 350,000 | | | | 526,678 | | |
10/25/18 | | | 4.250 | % | | EUR | | | | | 770,000 | | | | 1,211,650 | | |
11/25/18 | | | 1.000 | % | | EUR | | | | | 500,000 | | | | 677,525 | | |
04/25/19 | | | 4.250 | % | | EUR | | | | | 228,000 | | | | 361,050 | | |
10/25/20 | | | 2.500 | % | | EUR | | | | | 1,810,000 | | | | 2,618,494 | | |
04/25/29 | | | 5.500 | % | | EUR | | | | | 420,000 | | | | 759,328 | | |
French Treasury Note BTAN
02/25/16 | | | 2.250 | % | | EUR | | | | | 1,400,000 | | | | 1,984,479 | | |
Total | | | | | | | | | 8,139,204 | | |
Germany 11.8% | |
Bundesobligation
04/08/16 | | | 2.750 | % | | EUR | | | | | 700,000 | | | | 1,009,997 | | |
Bundesrepublik Deutschland
07/04/17 | | | 4.250 | % | | EUR | | | | | 555,000 | | | | 860,932 | | |
01/04/19 | | | 3.750 | % | | EUR | | | | | 1,010,000 | | | | 1,586,817 | | |
07/04/21 | | | 3.250 | % | | EUR | | | | | 1,600,000 | | | | 2,497,824 | | |
07/04/28 | | | 4.750 | % | | EUR | | | | | 700,000 | | | | 1,247,907 | | |
07/04/42 | | | 3.250 | % | | EUR | | | | | 300,000 | | | | 461,931 | | |
Total | | | | | | | | | 7,665,408 | | |
Guatemala 0.5% | |
Guatemala Government Bond
Senior Unsecured(b)
06/06/22 | | | 5.750 | % | | | | | | | 300,000 | | | | 318,300 | | |
Hungary 0.1% | |
Hungary Government International Bond
Senior Unsecured
07/18/16 | | | 3.500 | % | | EUR | | | | | 40,000 | | | | 55,206 | | |
Indonesia 2.9% | |
Indonesia Government International Bond
Senior Unsecured
04/20/15 | | | 7.250 | % | | | | | | | 38,000 | | | | 40,945 | | |
Indonesia Government International Bond(b)
Senior Unsecured
04/20/15 | | | 7.250 | % | | | | | | | 80,000 | | | | 86,200 | | |
Indonesia Treasury Bond
Senior Unsecured
07/15/17 | | | 10.000 | % | | IDR | | | | | 3,800,000,000 | | | | 368,117 | | |
09/15/25 | | | 11.000 | % | | IDR | | | | | 5,830,000,000 | | | | 642,606 | | |
Majapahit Holding BV(b)
08/07/19 | | | 8.000 | % | | | | | | | 450,000 | | | | 521,437 | | |
Foreign Government Obligations(a)(e) (continued)
Issuer | | Coupon
Rate | | Principal
Amount ($) | | Value ($) | |
PT Perusahaan Listrik Negara
Senior Unsecured(b)
11/22/21 | | | 5.500 | % | | | | | | | 200,000 | | | | 201,578 | | |
Total | | | | | | | | | 1,860,883 | | |
Japan 7.9% | |
Japan Government 20-Year Bond
Senior Unsecured
06/20/25 | | | 1.900 | % | | JPY | | | | | 50,000,000 | | | | 575,563 | | |
09/20/29 | | | 2.100 | % | | JPY | | | | | 80,000,000 | | | | 923,697 | | |
Japan Government 30-Year Bond
Senior Unsecured
03/20/33 | | | 1.100 | % | | JPY | | | | | 360,000,000 | | | | 3,427,751 | | |
09/20/40 | | | 2.000 | % | | JPY | | | | | 20,000,000 | | | | 220,097 | | |
Total | | | | | | | | | 5,147,108 | | |
Kazakhstan 0.4% | |
KazMunayGas National Co. JSC
Senior Unsecured(b)
05/05/20 | | | 7.000 | % | | | | | | | 200,000 | | | | 228,775 | | |
Lithuania 0.2% | |
Lithuania Government International Bond
Senior Unsecured(b)
03/09/21 | | | 6.125 | % | | | | | | | 120,000 | | | | 137,759 | | |
Mexico 6.4% | |
Comision Federal de Electricidad
Senior Unsecured(b)
05/26/21 | | | 4.875 | % | | | | | | | 200,000 | | | | 208,500 | | |
Mexican Bonos
12/13/18 | | | 8.500 | % | | MXN | | | | | 11,205,000 | | | | 987,520 | | |
06/11/20 | | | 8.000 | % | | MXN | | | | | 8,300,000 | | | | 725,303 | | |
05/31/29 | | | 8.500 | % | | MXN | | | | | 19,000,000 | | | | 1,688,517 | | |
Mexico Government International Bond
Senior Unsecured
01/15/17 | | | 5.625 | % | | | | | | | 90,000 | | | | 100,980 | | |
01/11/40 | | | 6.050 | % | | | | | | | 40,000 | | | | 45,300 | | |
Pemex Project Funding Master Trust
01/21/21 | | | 5.500 | % | | | | | | | 300,000 | | | | 327,000 | | |
02/24/25 | | | 5.500 | % | | EUR | | | | | 20,000 | | | | 31,128 | | |
Total | | | | | | | | | 4,114,248 | | |
Netherlands 4.6% | |
Netherlands Government Bond(b)
07/15/18 | | | 4.000 | % | | EUR | | | | | 1,300,000 | | | | 2,019,086 | | |
07/15/20 | | | 3.500 | % | | EUR | | | | | 600,000 | | | | 925,849 | | |
Total | | | | | | | | | 2,944,935 | | |
The accompanying Notes to Financial Statements are an integral part of this statement.
Annual Report 2013
8
Columbia International Bond Fund
Portfolio of Investments (continued)
October 31, 2013
Foreign Government Obligations(a)(e) (continued)
Issuer | | Coupon
Rate | | Principal
Amount ($) | | Value ($) | |
New Zealand 0.9% | |
New Zealand Government Bond
Senior Unsecured
12/15/17 | | | 6.000 | % | | NZD | | | | | 500,000 | | | | 446,370 | | |
05/15/21 | | | 6.000 | % | | NZD | | | | | 150,000 | | | | 136,544 | | |
Total | | | | | | | | | 582,914 | | |
Norway 5.3% | |
Eksportfinans ASA
03/20/14 | | | 1.600 | % | | JPY | | | | | 65,000,000 | | | | 657,824 | | |
Norway Government Bond
05/19/17 | | | 4.250 | % | | NOK | | | | | 5,240,000 | | | | 948,871 | | |
05/22/19 | | | 4.500 | % | | NOK | | | | | 8,000,000 | | | | 1,494,452 | | |
05/24/23 | | | 2.000 | % | | NOK | | | | | 2,150,000 | | | | 336,745 | | |
Total | | | | | | | | | 3,437,892 | | |
Panama 0.1% | |
Panama Government International Bond
Senior Unsecured
01/26/36 | | | 6.700 | % | | | | | | | 65,000 | | | | 76,862 | | |
Peru 0.5% | |
Peruvian Government International Bond
Senior Unsecured
07/21/25 | | | 7.350 | % | | | | | | | 200,000 | | | | 257,800 | | |
11/21/33 | | | 8.750 | % | | | | | | | 27,000 | | | | 39,366 | | |
03/14/37 | | | 6.550 | % | | | | | | | 45,000 | | | | 53,617 | | |
Total | | | | | | | | | 350,783 | | |
Philippines 1.0% | |
Philippine Government International Bond
Senior Unsecured
03/17/15 | | | 8.875 | % | | | | | | | 105,000 | | | | 115,763 | | |
01/15/21 | | | 4.950 | % | | PHP | | | | | 20,000,000 | | | | 506,827 | | |
Total | | | | | | | | | 622,590 | | |
Poland 4.4% | |
Poland Government Bond
10/25/19 | | | 5.500 | % | | PLN | | | | | 7,900,000 | | | | 2,808,003 | | |
Poland Government International Bond
Senior Unsecured
10/19/15 | | | 5.000 | % | | | | | | | 50,000 | | | | 53,750 | | |
Total | | | | | | | | | 2,861,753 | | |
Romania 0.5% | |
Romanian Government International Bond
Senior Unsecured(b)
02/07/22 | | | 6.750 | % | | | | | | | 300,000 | | | | 347,377 | | |
Foreign Government Obligations(a)(e) (continued)
Issuer | | Coupon
Rate | | Principal
Amount ($) | | Value ($) | |
Russian Federation 3.4% | |
Gazprom OAO Via Gaz Capital SA(b)
Senior Unsecured
04/11/18 | | | 8.146 | % | | | | | | | 200,000 | | | | 235,500 | | |
03/07/22 | | | 6.510 | % | | | | | | | 400,000 | | | | 439,000 | | |
Russian Foreign Bond - Eurobond
Senior Unsecured
03/10/18 | | | 7.850 | % | | RUB | | | | | 20,000,000 | | | | 648,566 | | |
03/31/30 | | | 7.500 | % | | | | | | | 101,530 | | | | 120,826 | | |
Russian Foreign Bond - Eurobond(b)
Senior Unsecured
03/10/18 | | | 7.850 | % | | RUB | | | | | 15,000,000 | | | | 486,425 | | |
04/29/20 | | | 5.000 | % | | | | | | | 100,000 | | | | 108,750 | | |
03/31/30 | | | 7.500 | % | | | | | | | 143,000 | | | | 170,177 | | |
Total | | | | | | | | | 2,209,244 | | |
South Africa 1.9% | |
South Africa Government Bond
01/15/20 | | | 7.250 | % | | ZAR | | | | | 11,000,000 | | | | 1,099,984 | | |
South Africa Government International Bond
Senior Unsecured
03/08/41 | | | 6.250 | % | | | | | | | 120,000 | | | | 128,400 | | |
Total | | | | | | | | | 1,228,384 | | |
Sweden 2.1% | |
Sweden Government Bond
08/12/17 | | | 3.750 | % | | SEK | | | | | 8,000,000 | | | | 1,338,674 | | |
Turkey 1.3% | |
Export Credit Bank of Turkey
Senior Unsecured(b)
04/24/19 | | | 5.875 | % | | | | | | | 200,000 | | | | 209,298 | | |
Turkey Government International Bond
Senior Unsecured
03/30/21 | | | 5.625 | % | | | | | | | 450,000 | | | | 480,375 | | |
02/05/25 | | | 7.375 | % | | | | | | | 140,000 | | | | 163,800 | | |
Total | | | | | | | | | 853,473 | | |
United Kingdom 6.2% | |
Network Rail Infrastructure Finance PLC
Government Guaranteed
12/09/30 | | | 4.375 | % | | GBP | | | | | 60,000 | | | | 106,505 | | |
United Kingdom Gilt
03/07/19 | | | 4.500 | % | | GBP | | | | | 700,000 | | | | 1,288,335 | | |
09/07/20 | | | 3.750 | % | | GBP | | | | | 450,000 | | | | 802,579 | | |
09/07/21 | | | 3.750 | % | | GBP | | | | | 430,000 | | | | 764,951 | | |
03/07/25 | | | 5.000 | % | | GBP | | | | | 253,000 | | | | 495,209 | | |
03/07/36 | | | 4.250 | % | | GBP | | | | | 300,000 | | | | 548,391 | | |
Total | | | | | | | | | 4,005,970 | | |
The accompanying Notes to Financial Statements are an integral part of this statement.
Annual Report 2013
9
Columbia International Bond Fund
Portfolio of Investments (continued)
October 31, 2013
Foreign Government Obligations(a)(e) (continued)
Issuer | | Coupon
Rate | | Principal
Amount ($) | | Value ($) | |
Uruguay 0.1% | |
Uruguay Government International Bond
Senior Unsecured PIK
01/15/33 | | | 7.875 | % | | | | | | | 40,000 | | | | 52,340 | | |
Venezuela 0.8% | |
Petroleos de Venezuela SA
11/02/17 | | | 8.500 | % | | | | | | | 500,000 | | | | 448,750 | | |
Venezuela Government International Bond
Senior Unsecured
08/23/22 | | | 12.750 | % | | | | | | | 84,000 | | | | 84,630 | | |
Total | | | | | | | | | 533,380 | | |
Total Foreign Government Obligations
(Cost: $57,450,669) | | | | | | | | | 57,982,723 | | |
Money Market Funds 4.8%
| | | Shares | | Value ($) | |
Columbia Short-Term Cash Fund,
0.093%(c)(d) | | | | | 3,085,789 | | | | 3,085,789 | | |
Total Money Market Funds
(Cost: $3,085,789) | | | | | | | 3,085,789 | | |
Total Investments
(Cost: $61,493,265) | | | | | | | 62,070,495 | | |
Other Assets & Liabilities, Net | | | | | | | 2,753,738 | | |
Net Assets | | | | | | | 64,824,233 | | |
Investments in Derivatives
Futures Contracts Outstanding at October 31, 2013
At October 31, 2013, cash totaling $73,425 was pledged as collateral to cover initial margin requirements on open futures contracts.
Contract Description | | Number of
Contracts
Long (Short) | | Trading
Currency | | Notional
Market
Value ($) | | Expiration
Date | | Unrealized
Appreciation ($) | | Unrealized
Depreciation ($) | |
U.S. Treasury Note, 2-year | | | (5 | ) | | USD | | | | | (1,102,109 | ) | | December 2013 | | | — | | | | (3,836 | ) | |
U.S. Treasury Note, 5-year | | | (72 | ) | | USD | | | | | (8,761,500 | ) | | December 2013 | | | — | | | | (154,232 | ) | |
U.S. Treasury Note, 10-year | | | (5 | ) | | USD | | | | | (636,797 | ) | | December 2013 | | | — | | | | (16,029 | ) | |
Total | | | | | | | | | | | — | | | | (174,097 | ) | |
Forward Foreign Currency Exchange Contracts Open at October 31, 2013
Counterparty | | Exchange Date | | Currency to
be Delivered | | Currency to
be Received | | Unrealized
Appreciation ($) | | Unrealized
Depreciation ($) | |
J.P. Morgan Securities, Inc.
| | November 7, 2013
| | | 685,000
SGD | | | | 548,197
USD | | | | —
| | | | (3,244
| ) | |
Credit Suisse
| | November 8, 2013
| | | 5,000,000
CHF | | | | 5,548,774
USD | | | | 38,043
| | | | —
| | |
Standard Chartered Bank
| | November 8, 2013
| | | 1,260,693
USD | | | | 2,800,000
BRL | | | | —
| | | | (12,009
| ) | |
HSBC Securities (USA), Inc.
| | November 8, 2013
| | | 637,750
USD | | | | 20,695,000
RUB | | | | 7,012
| | | | —
| | |
Deutsche Bank
| | November 21, 2013
| | | 1,939,207
USD | | | | 6,150,000
MYR | | | | —
| | | | (1,672
| ) | |
HSBC Securities (USA), Inc.
| | December 4, 2013
| | | 2,560,000
CAD | | | | 2,449,151
USD | | | | —
| | | | (4,225
| ) | |
The accompanying Notes to Financial Statements are an integral part of this statement.
Annual Report 2013
10
Columbia International Bond Fund
Portfolio of Investments (continued)
October 31, 2013
Forward Foreign Currency Exchange Contracts Open at October 31, 2013 (continued)
Counterparty | | Exchange Date | | Currency to
be Delivered | | Currency to
be Received | | Unrealized
Appreciation ($) | | Unrealized
Depreciation ($) | |
Standard Chartered Bank
| | December 4, 2013
| | | 500,000
GBP | | | | 806,730
USD | | | | 5,210
| | | | —
| | |
J.P. Morgan Securities, Inc.
| | December 4, 2013
| | | 2,000,000
PLN | | | | 658,117
USD | | | | 10,068
| | | | —
| | |
J.P. Morgan Securities, Inc.
| | December 4, 2013
| | | 4,073,465
USD | | | | 400,000,000
JPY | | | | —
| | | | (4,935
| ) | |
Total | | | | | | | | | 60,333 | | | | (26,085 | ) | |
Notes to Portfolio of Investments
(a) Principal amounts are denominated in United States Dollars unless otherwise noted.
(b) Security exempt from registration pursuant to Rule 144A under the Securities Act of 1933. This security may be resold in transactions exempt from registration, normally to qualified institutional buyers. At October 31, 2013, the value of these securities amounted to $7,860,116 or 12.13% of net assets.
(c) The rate shown is the seven-day current annualized yield at October 31, 2013.
(d) As defined in the Investment Company Act of 1940, an affiliated company is one in which the Fund owns 5% or more of its outstanding voting securities, or a company which is under common ownership or control with the Fund. Holdings and transactions in these affiliated companies during the year ended October 31, 2013, are as follows:
Issuer | | Beginning
Cost ($) | | Purchase
Cost ($) | | Proceeds
From Sales ($) | | Ending
Cost ($) | | Dividends —
Affiliated
Issuers ($) | | Value ($) | |
Columbia Short-Term Cash Fund | | | 198,636 | | | | 11,126,253 | | | | (8,239,100 | ) | | | 3,085,789 | | | | 2,103 | | | | 3,085,789 | | |
(e) Principal and interest may not be guaranteed by the government.
Abbreviation Legend
PIK Payment-in-Kind
Currency Legend
AUD Australian Dollar
BRL Brazilian Real
CAD Canadian Dollar
CHF Swiss Franc
COP Colombian Peso
DKK Danish Krone
EUR Euro
GBP British Pound
IDR Indonesian Rupiah
JPY Japanese Yen
MXN Mexican Peso
MYR Malaysia Ringgits
NOK Norwegian Krone
NZD New Zealand Dollar
PHP Philippine Peso
PLN Polish Zloty
The accompanying Notes to Financial Statements are an integral part of this statement.
Annual Report 2013
11
Columbia International Bond Fund
Portfolio of Investments (continued)
October 31, 2013
Currency Legend (continued)
RUB Russian Rouble
SEK Swedish Krona
SGD Singapore Dollar
USD US Dollar
UYU Uruguay Pesos
ZAR South African Rand
Fair Value Measurements
Generally accepted accounting principles (GAAP) require disclosure regarding the inputs and valuation techniques used to measure fair value and any changes in valuation inputs or techniques. In addition, investments shall be disclosed by major category.
The Fund categorizes its fair value measurements according to a three-level hierarchy that maximizes the use of observable inputs and minimizes the use of unobservable inputs by prioritizing that the most observable input be used when available. Observable inputs are those that market participants would use in pricing an investment based on market data obtained from sources independent of the reporting entity. Unobservable inputs are those that reflect the Fund's assumptions about the information market participants would use in pricing an investment. An investment's level within the fair value hierarchy is based on the lowest level of any input that is deemed significant to the asset or liability's fair value measurement. The input levels are not necessarily an indication of the risk or liquidity associated with investments at that level. For example, certain U.S. government securities are generally high quality and liquid, however, they are reflected as Level 2 because the inputs used to determine fair value may not always be quoted prices in an active market.
Fair value inputs are summarized in the three broad levels listed below:
> Level 1 — Valuations based on quoted prices for investments in active markets that the Fund has the ability to access at the measurement date (including NAV for open-end mutual funds). Valuation adjustments are not applied to Level 1 investments.
> Level 2 — Valuations based on other significant observable inputs (including quoted prices for similar securities, interest rates, prepayment speeds, credit risks, etc.).
> Level 3 — Valuations based on significant unobservable inputs (including the Fund's own assumptions and judgment in determining the fair value of investments).
Inputs that are used in determining fair value of an investment may include price information, credit data, volatility statistics, and other factors. These inputs can be either observable or unobservable. The availability of observable inputs can vary between investments, and is affected by various factors such as the type of investment, and the volume and level of activity for that investment or similar investments in the marketplace. The inputs will be considered by the Investment Manager, along with any other relevant factors in the calculation of an investment's fair value. The Fund uses prices and inputs that are current as of the measurement date, which may include periods of market dislocations. During these periods, the availability of prices and inputs may be reduced for many investments. This condition could cause an investment to be reclassified between the various levels within the hierarchy.
Investments falling into the Level 3 category are primarily supported by quoted prices from brokers and dealers participating in the market for those investments. However, these may be classified as Level 3 investments due to lack of market transparency and corroboration to support these quoted prices. Additionally, valuation models may be used as the pricing source for any remaining investments classified as Level 3. These models may rely on one or more significant unobservable inputs and/or significant assumptions by the Investment Manager. Inputs used in valuations may include, but are not limited to, financial statement analysis, capital account balances, discount rates and estimated cash flows, and comparable company data.
Under the direction of the Fund's Board of Trustees (the Board), the Investment Manager's Valuation Committee (the Committee) is responsible for carrying out the valuation procedures approved by the Board. The Committee consists of voting and non-voting members from various groups within the Investment Manager's organization, including operations and accounting, trading and investments, compliance, risk management and legal.
The Committee meets at least monthly to review and approve valuation matters, which may include a description of specific valuation determinations, data regarding pricing information received from approved pricing vendors and brokers and the results of Board-approved valuation control policies and procedures (the Policies). The Policies address, among other things, instances when market quotations are or are not readily available, including recommendations of third party pricing vendors and a determination of appropriate pricing methodologies; events that require specific valuation determinations and assessment of fair value techniques; securities with a potential for stale pricing, including those that are illiquid, restricted, or in default; and the effectiveness of third-party pricing vendors, including periodic reviews of vendors. The Committee meets more frequently, as needed, to discuss additional valuation matters, which may include the need to review back-testing results, review time-sensitive information or approve related valuation actions. The Committee reports to the Board, with members of the Committee meeting with the Board at each of its regularly scheduled meetings to discuss valuation matters and actions during the period, similar to those described earlier.
For investments categorized as Level 3, the Committee monitors information similar to that described above, which may include: (i) data specific to the issuer or comparable issuers, (ii) general market or specific sector news and (iii) quoted prices and specific or similar security
The accompanying Notes to Financial Statements are an integral part of this statement.
Annual Report 2013
12
Columbia International Bond Fund
Portfolio of Investments (continued)
October 31, 2013
Fair Value Measurements (continued)
transactions. The Committee considers this data and any changes from prior periods in order to assess the reasonableness of observable and unobservable inputs, any assumptions or internal models used to value those securities and changes in fair value. This data is also used to corroborate, when available, information received from approved pricing vendors and brokers. Various factors impact the frequency of monitoring this information (which may occur as often as daily). However, the Committee may determine that changes to inputs, assumptions and models are not required as a result of the monitoring procedures performed.
The following table is a summary of the inputs used to value the Fund's investments at October 31, 2013:
Description | | Level 1
Quoted Prices in Active
Markets for Identical
Assets ($) | | Level 2
Other Significant
Observable Inputs ($) | | Level 3
Significant
Unobservable Inputs ($) | | Total ($) | |
Bonds | |
Corporate Bonds & Notes | | | — | | | | 936,771 | | | | — | | | | 936,771 | | |
Inflation-Indexed Bonds | | | — | | | | 65,212 | | | | — | | | | 65,212 | | |
Foreign Government Obligations | | | — | | | | 57,982,723 | | | | — | | | | 57,982,723 | | |
Total Bonds | | | — | | | | 58,984,706 | | | | — | | | | 58,984,706 | | |
Mutual Funds | |
Money Market Funds | | | 3,085,789 | | | | — | | | | — | | | | 3,085,789 | | |
Total Mutual Funds | | | 3,085,789 | | | | — | | | | — | | | | 3,085,789 | | |
Investments in Securities | | | 3,085,789 | | | | 58,984,706 | | | | — | | | | 62,070,495 | | |
Derivatives | |
Assets | |
Forward Foreign Currency Exchange
Contracts | | | — | | | | 60,333 | | | | — | | | | 60,333 | | |
Liabilities | |
Forward Foreign Currency Exchange
Contracts | | | — | | | | (26,085 | ) | | | — | | | | (26,085 | ) | |
Futures Contracts | | | (174,097 | ) | | | — | | | | — | | | | (174,097 | ) | |
Total | | | 2,911,692 | | | | 59,018,954 | | | | — | | | | 61,930,646 | | |
See the Portfolio of Investments for all investment classifications not indicated in the table.
The Fund's assets assigned to the Level 2 input category are generally valued using the market approach, in which a security's value is determined through reference to prices and information from market transactions for similar or identical assets.
There were no transfers of financial assets between Levels 1 and 2 during the period.
Derivative instruments are valued at unrealized appreciation (depreciation).
The accompanying Notes to Financial Statements are an integral part of this statement.
Annual Report 2013
13
Columbia International Bond Fund
Statement of Assets and Liabilities
October 31, 2013
Assets | |
Investments, at value | |
Unaffiliated issuers (identified cost $58,407,476) | | $ | 58,984,706 | | |
Affiliated issuers (identified cost $3,085,789) | | | 3,085,789 | | |
Total investments (identified cost $61,493,265) | | | 62,070,495 | | |
Foreign currency (identified cost $2,047,551) | | | 2,009,527 | | |
Margin deposits | | | 73,425 | | |
Unrealized appreciation on forward foreign currency exchange contracts | | | 60,333 | | |
Receivable for: | |
Capital shares sold | | | 2,047 | | |
Dividends | | | 253 | | |
Interest | | | 700,154 | | |
Reclaims | | | 4,753 | | |
Variation margin | | | 781 | | |
Prepaid expenses | | | 627 | | |
Trustees' deferred compensation plan | | | 10,385 | | |
Other assets | | | 877 | | |
Total assets | | | 64,933,657 | | |
Liabilities | |
Disbursements in excess of cash | | | 1 | | |
Unrealized depreciation on forward foreign currency exchange contracts | | | 26,085 | | |
Payable for: | |
Capital shares purchased | | | 29,810 | | |
Variation margin | | | 719 | | |
Investment management fees | | | 1,018 | | |
Distribution and/or service fees | | | 42 | | |
Transfer agent fees | | | 3,394 | | |
Administration fees | | | 143 | | |
Chief compliance officer expenses | | | 4 | | |
Expense reimbursement due to Investment Manager | | | 251 | | |
Other expenses | | | 37,572 | | |
Trustees' deferred compensation plan | | | 10,385 | | |
Total liabilities | | | 109,424 | | |
Net assets applicable to outstanding capital stock | | $ | 64,824,233 | | |
Represented by | |
Paid-in capital | | $ | 64,593,790 | | |
Undistributed net investment income | | | 8,133 | | |
Accumulated net realized loss | | | (182,607 | ) | |
Unrealized appreciation (depreciation) on: | |
Investments | | | 577,230 | | |
Foreign currency translations | | | (32,464 | ) | |
Forward foreign currency exchange contracts | | | 34,248 | | |
Futures contracts | | | (174,097 | ) | |
Total — representing net assets applicable to outstanding capital stock | | $ | 64,824,233 | | |
The accompanying Notes to Financial Statements are an integral part of this statement.
Annual Report 2013
14
Columbia International Bond Fund
Statement of Assets and Liabilities (continued)
October 31, 2013
Class A | |
Net assets | | $ | 1,673,275 | | |
Shares outstanding | | | 150,911 | | |
Net asset value per share | | $ | 11.09 | | |
Maximum offering price per share(a) | | $ | 11.64 | | |
Class C | |
Net assets | | $ | 138,763 | | |
Shares outstanding | | | 12,554 | | |
Net asset value per share | | $ | 11.05 | | |
Class I | |
Net assets | | $ | 50,831,654 | | |
Shares outstanding | | | 4,582,301 | | |
Net asset value per share | | $ | 11.09 | | |
Class W | |
Net assets | | $ | 3,872,455 | | |
Shares outstanding | | | 349,200 | | |
Net asset value per share | | $ | 11.09 | | |
Class Z | |
Net assets | | $ | 8,308,086 | | |
Shares outstanding | | | 749,326 | | |
Net asset value per share | | $ | 11.09 | | |
(a) The maximum offering price per share is calculated by dividing the net asset value per share by 1.0 minus the maximum sales charge of 4.75%.
The accompanying Notes to Financial Statements are an integral part of this statement.
Annual Report 2013
15
Columbia International Bond Fund
Statement of Operations
Year Ended October 31, 2013
Net investment income | |
Income: | |
Dividends — affiliated issuers | | $ | 2,103 | | |
Interest | | | 2,174,908 | | |
Foreign taxes withheld | | | (12,013 | ) | |
Total income | | | 2,164,998 | | |
Expenses: | |
Investment management fees | | | 378,515 | | |
Distribution and/or service fees | |
Class A | | | 4,771 | | |
Class C | | | 1,977 | | |
Class W | | | 10,896 | | |
Transfer agent fees | |
Class A | | | 4,262 | | |
Class C | | | 427 | | |
Class W | | | 9,677 | | |
Class Z | | | 27,191 | | |
Administration fees | | | 53,125 | | |
Compensation of board members | | | 18,206 | | |
Custodian fees | | | 16,215 | | |
Printing and postage fees | | | 30,745 | | |
Registration fees | | | 49,720 | | |
Professional fees | | | 35,073 | | |
Chief compliance officer expenses | | | 44 | | |
Other | | | 5,304 | | |
Total expenses | | | 646,148 | | |
Fees waived or expenses reimbursed by Investment Manager and its affiliates | | | (117,641 | ) | |
Expense reductions | | | (20 | ) | |
Total net expenses | | | 528,487 | | |
Net investment income | | | 1,636,511 | | |
Realized and unrealized gain (loss) — net | |
Net realized gain (loss) on: | |
Investments | | | (193,276 | ) | |
Foreign currency translations | | | 26,913 | | |
Forward foreign currency exchange contracts | | | (504,824 | ) | |
Futures contracts | | | 91,971 | | |
Net realized loss | | | (579,216 | ) | |
Net change in unrealized appreciation (depreciation) on: | |
Investments | | | (2,909,805 | ) | |
Foreign currency translations | | | (45,554 | ) | |
Forward foreign currency exchange contracts | | | 66,039 | | |
Futures contracts | | | (172,635 | ) | |
Net change in unrealized appreciation (depreciation) | | | (3,061,955 | ) | |
Net realized and unrealized loss | | | (3,641,171 | ) | |
Net decrease in net assets from operations | | $ | (2,004,660 | ) | |
The accompanying Notes to Financial Statements are an integral part of this statement.
Annual Report 2013
16
Columbia International Bond Fund
Statement of Changes in Net Assets
| | | Year Ended
October 31,
2013 | | Year Ended
October 31,
2012(a)(b) | | Year Ended
May 31,
2012 | |
Operations | |
Net investment income | | $ | 1,636,511 | | | $ | 624,072 | | | $ | 1,514,138 | | |
Net realized gain (loss) | | | (579,216 | ) | | | 2,793 | | | | (436,744 | ) | |
Net change in unrealized appreciation (depreciation) | | | (3,061,955 | ) | | | 3,061,256 | | | | (1,895,473 | ) | |
Net increase (decrease) in net assets resulting from operations | | | (2,004,660 | ) | | | 3,688,121 | | | | (818,079 | ) | |
Distributions to shareholders | |
Net investment income | |
Class A | | | (28,349 | ) | | | (10,978 | ) | | | (51,907 | ) | |
Class C | | | (1,901 | ) | | | (657 | ) | | | (6,446 | ) | |
Class I | | | (779,855 | ) | | | (327,828 | ) | | | (1,107,171 | ) | |
Class W | | | (63,316 | ) | | | (17,188 | ) | | | — | | |
Class Z | | | (235,445 | ) | | | (116,180 | ) | | | (435,429 | ) | |
Total distributions to shareholders | | | (1,108,866 | ) | | | (472,831 | ) | | | (1,600,953 | ) | |
Increase (decrease) in net assets from capital stock activity | | | (669,850 | ) | | | 3,627,509 | | | | 16,897,307 | | |
Total increase (decrease) in net assets | | | (3,783,376 | ) | | | 6,842,799 | | | | 14,478,275 | | |
Net assets at beginning of year | | | 68,607,609 | | | | 61,764,810 | | | | 47,286,535 | | |
Net assets at end of year | | $ | 64,824,233 | | | $ | 68,607,609 | | | $ | 61,764,810 | | |
Undistributed net investment income | | $ | 8,133 | | | $ | 239,434 | | | $ | 103,482 | | |
(a) For the period from June 1, 2012 to October 31, 2012. During the period, the Fund's fiscal year end was changed from May 31 to October 31.
(b) Class W shares are for the period from June 18, 2012 (commencement of operations) to October 31, 2012.
The accompanying Notes to Financial Statements are an integral part of this statement.
Annual Report 2013
17
Columbia International Bond Fund
Statement of Changes in Net Assets (continued)
| | | Year Ended October 31,
2013 | | Year Ended October 31,
2012(a)(b) | | Year Ended May 31,
2012 | |
| | | Shares | | Dollars ($) | | Shares | | Dollars ($) | | Shares | | Dollars ($) | |
Capital stock activity | |
Class A shares | |
Subscriptions | | | 82,970 | | | | 942,084 | | | | 45,328 | | | | 520,168 | | | | 142,437 | | | | 1,631,986 | | |
Distributions reinvested | | | 2,353 | | | | 26,994 | | | | 902 | | | | 10,366 | | | | 4,271 | | | | 47,730 | | |
Redemptions | | | (112,934 | ) | | | (1,277,338 | ) | | | (39,733 | ) | | | (444,736 | ) | | | (83,747 | ) | | | (948,460 | ) | |
Net increase (decrease) | | | (27,611 | ) | | | (308,260 | ) | | | 6,497 | | | | 85,798 | | | | 62,961 | | | | 731,256 | | |
Class C shares | |
Subscriptions | | | 3,966 | | | | 45,469 | | | | 4 | | | | 39 | | | | 4,948 | | | | 56,340 | | |
Distributions reinvested | | | 138 | | | | 1,594 | | | | 51 | | | | 588 | | | | 488 | | | | 5,442 | | |
Redemptions | | | (11,363 | ) | | | (126,077 | ) | | | (1,982 | ) | | | (22,043 | ) | | | (20,105 | ) | | | (225,327 | ) | |
Net decrease | | | (7,259 | ) | | | (79,014 | ) | | | (1,927 | ) | | | (21,416 | ) | | | (14,669 | ) | | | (163,545 | ) | |
Class I shares | |
Subscriptions | | | 756,398 | | | | 8,441,218 | | | | 79,775 | | | | 910,924 | | | | 1,943,469 | | | | 22,284,538 | | |
Distributions reinvested | | | 68,323 | | | | 779,812 | | | | 28,563 | | | | 327,809 | | | | 98,887 | | | | 1,107,102 | | |
Redemptions | | | (204,106 | ) | | | (2,331,847 | ) | | | (154,195 | ) | | | (1,756,417 | ) | | | (635,599 | ) | | | (7,329,871 | ) | |
Net increase (decrease) | | | 620,615 | | | | 6,889,183 | | | | (45,857 | ) | | | (517,684 | ) | | | 1,406,757 | | | | 16,061,769 | | |
Class W shares | |
Subscriptions | | | 128,934 | | | | 1,454,318 | | | | 393,364 | | | | 4,507,037 | | | | — | | | | — | | |
Distributions reinvested | | | 5,518 | | | | 63,280 | | | | 1,483 | | | | 17,173 | | | | — | | | | — | | |
Redemptions | | | (165,754 | ) | | | (1,851,195 | ) | | | (14,345 | ) | | | (166,490 | ) | | | — | | | | — | | |
Net increase (decrease) | | | (31,302 | ) | | | (333,597 | ) | | | 380,502 | | | | 4,357,720 | | | | — | | | | — | | |
Class Z shares | |
Subscriptions | | | 43,084 | | | | 492,663 | | | | 132,311 | | | | 1,476,140 | | | | 322,962 | | | | 3,720,761 | | |
Distributions reinvested | | | 456 | | | | 5,230 | | | | 593 | | | | 6,817 | | | | 1,351 | | | | 15,120 | | |
Redemptions | | | (659,599 | ) | | | (7,336,055 | ) | | | (152,222 | ) | | | (1,759,866 | ) | | | (309,422 | ) | | | (3,468,054 | ) | |
Net increase (decrease) | | | (616,059 | ) | | | (6,838,162 | ) | | | (19,318 | ) | | | (276,909 | ) | | | 14,891 | | | | 267,827 | | |
Total net increase (decrease) | | | (61,616 | ) | | | (669,850 | ) | | | 319,897 | | | | 3,627,509 | | | | 1,469,940 | | | | 16,897,307 | | |
(a) For the period from June 1, 2012 to October 31, 2012. During the period, the Fund's fiscal year end was changed from May 31 to October 31.
(b) Class W shares are for the period from June 18, 2012 (commencement of operations) to October 31, 2012.
The accompanying Notes to Financial Statements are an integral part of this statement.
Annual Report 2013
18
Columbia International Bond Fund
The following tables are intended to help you understand the Fund's financial performance. Certain information reflects financial results for a single share of a class held for the periods shown. Per share net investment income (loss) amounts are calculated based on average shares outstanding during the period. Total return assumes reinvestment of all dividends and distributions, if any. Total return does not reflect payment of sales charges, if any, and is not annualized for periods of less than one year.
| | | Year Ended October 31, | | Year Ended May 31, | |
Class A | | 2013 | | 2012(a) | | 2012 | | 2011 | | 2010 | | 2009(b) | |
Per share data | |
Net asset value, beginning of period | | $ | 11.62 | | | $ | 11.06 | | | $ | 11.50 | | | $ | 10.28 | | | $ | 10.39 | | | $ | 10.00 | | |
Income from investment operations: | |
Net investment income | | | 0.24 | | | | 0.10 | | | | 0.26 | | | | 0.21 | | | | 0.19 | | | | 0.07 | | |
Net realized and unrealized gain (loss) | | | (0.61 | ) | | | 0.53 | | | | (0.42 | ) | | | 1.39 | | | | (0.07 | ) | | | 0.36 | | |
Total from investment operations | | | (0.37 | ) | | | 0.63 | | | | (0.16 | ) | | | 1.60 | | | | 0.12 | | | | 0.43 | | |
Less distributions to shareholders: | |
Net investment income | | | (0.16 | ) | | | (0.07 | ) | | | (0.28 | ) | | | (0.36 | ) | | | (0.22 | ) | | | (0.04 | ) | |
Net realized gains | | | — | | | | — | | | | — | | | | (0.02 | ) | | | (0.01 | ) | | | — | | |
Total distributions to shareholders | | | (0.16 | ) | | | (0.07 | ) | | | (0.28 | ) | | | (0.38 | ) | | | (0.23 | ) | | | (0.04 | ) | |
Redemption fees: | |
Redemption fees added to paid-in capital | | | — | | | | — | | | | — | | | | — | | | | 0.00 | (c) | | | 0.00 | (c) | |
Net asset value, end of period | | $ | 11.09 | | | $ | 11.62 | | | $ | 11.06 | | | $ | 11.50 | | | $ | 10.28 | | | $ | 10.39 | | |
Total return | | | (3.22 | %) | | | 5.70 | % | | | (1.40 | %) | | | 15.86 | % | | | 1.07 | % | | | 4.35 | % | |
Ratios to average net assets(d) | |
Total gross expenses | | | 1.36 | % | | | 1.57 | %(e) | | | 1.36 | % | | | 2.09 | % | | | 2.12 | % | | | 4.87 | %(e) | |
Total net expenses(f) | | | 1.09 | %(g) | | | 1.10 | %(e) | | | 1.10 | % | | | 1.07 | %(g) | | | 1.05 | %(g) | | | 1.05 | %(e)(g) | |
Net investment income | | | 2.17 | % | | | 1.99 | %(e) | | | 2.29 | % | | | 1.90 | % | | | 1.78 | % | | | 1.41 | %(e) | |
Supplemental data | |
Net assets, end of period (in thousands) | | $ | 1,673 | | | $ | 2,074 | | | $ | 1,903 | | | $ | 1,254 | | | $ | 990 | | | $ | 131 | | |
Portfolio turnover | | | 16 | % | | | 5 | % | | | 20 | % | | | 31 | % | | | 30 | % | | | 4 | % | |
Notes to Financial Highlights
(a) For the period from June 1, 2012 to October 31, 2012. During the period, the Fund's fiscal year end was changed from May 31 to October 31.
(b) For the period from December 1, 2008 (commencement of operations) to May 31, 2009.
(c) Rounds to zero.
(d) In addition to the fees and expenses which the Fund bears directly, the Fund indirectly bears a pro rata share of the fees and expenses of the acquired funds in which it invests. Such indirect expenses are not included in the reported expense ratios.
(e) Annualized.
(f) Total net expenses include the impact of certain waivers/reimbursements made by the Investment Manager and certain of its affiliates, if applicable.
(g) The benefits derived from expense reductions had an impact of less than 0.01%.
The accompanying Notes to Financial Statements are an integral part of this statement.
Annual Report 2013
19
Columbia International Bond Fund
Financial Highlights (continued)
| | | Year Ended October 31, | | Year Ended May 31, | |
Class C | | 2013 | | 2012(a) | | 2012 | | 2011 | | 2010 | | 2009(b) | |
Per share data | |
Net asset value, beginning of period | | $ | 11.61 | | | $ | 11.05 | | | $ | 11.49 | | | $ | 10.27 | | | $ | 10.39 | | | $ | 10.00 | | |
Income from investment operations: | |
Net investment income | | | 0.16 | | | | 0.06 | | | | 0.18 | | | | 0.12 | | | | 0.11 | | | | 0.03 | | |
Net realized and unrealized gain (loss) | | | (0.62 | ) | | | 0.53 | | | | (0.42 | ) | | | 1.40 | | | | (0.08 | ) | | | 0.37 | | |
Total from investment operations | | | (0.46 | ) | | | 0.59 | | | | (0.24 | ) | | | 1.52 | | | | 0.03 | | | | 0.40 | | |
Less distributions to shareholders: | |
Net investment income | | | (0.10 | ) | | | (0.03 | ) | | | (0.20 | ) | | | (0.28 | ) | | | (0.14 | ) | | | (0.01 | ) | |
Net realized gains | | | — | | | | — | | | | — | | | | (0.02 | ) | | | (0.01 | ) | | | — | | |
Total distributions to shareholders | | | (0.10 | ) | | | (0.03 | ) | | | (0.20 | ) | | | (0.30 | ) | | | (0.15 | ) | | | (0.01 | ) | |
Redemption fees: | |
Redemption fees added to paid-in capital | | | — | | | | — | | | | — | | | | — | | | | 0.00 | (c) | | | 0.00 | (c) | |
Net asset value, end of period | | $ | 11.05 | | | $ | 11.61 | | | $ | 11.05 | | | $ | 11.49 | | | $ | 10.27 | | | $ | 10.39 | | |
Total return | | | (4.01 | %) | | | 5.37 | % | | | (2.10 | %) | | | 15.01 | % | | | 0.21 | % | | | 3.97 | % | |
Ratios to average net assets(d) | |
Total gross expenses | | | 2.11 | % | | | 2.30 | %(e) | | | 2.10 | % | | | 2.85 | % | | | 2.87 | % | | | 5.62 | %(e) | |
Total net expenses(f) | | | 1.84 | %(g) | | | 1.85 | %(e) | | | 1.85 | % | | | 1.83 | %(g) | | | 1.80 | %(g) | | | 1.80 | %(e)(g) | |
Net investment income | | | 1.41 | % | | | 1.23 | %(e) | | | 1.58 | % | | | 1.10 | % | | | 1.06 | % | | | 0.59 | %(e) | |
Supplemental data | |
Net assets, end of period (in thousands) | | $ | 139 | | | $ | 230 | | | $ | 240 | | | $ | 418 | | | $ | 355 | | | $ | 32 | | |
Portfolio turnover | | | 16 | % | | | 5 | % | | | 20 | % | | | 31 | % | | | 30 | % | | | 4 | % | |
Notes to Financial Highlights
(a) For the period from June 1, 2012 to October 31, 2012. During the period, the Fund's fiscal year end was changed from May 31 to October 31.
(b) For the period from December 1, 2008 (commencement of operations) to May 31, 2009.
(c) Rounds to zero.
(d) In addition to the fees and expenses which the Fund bears directly, the Fund indirectly bears a pro rata share of the fees and expenses of the acquired funds in which it invests. Such indirect expenses are not included in the reported expense ratios.
(e) Annualized.
(f) Total net expenses include the impact of certain waivers/reimbursements made by the Investment Manager and certain of its affiliates, if applicable.
(g) The benefits derived from expense reductions had an impact of less than 0.01%.
The accompanying Notes to Financial Statements are an integral part of this statement.
Annual Report 2013
20
Columbia International Bond Fund
Financial Highlights (continued)
| | | Year Ended October 31, | | Year Ended May 31, | |
Class I | | 2013 | | 2012(a) | | 2012 | | 2011(b) | |
Per share data | |
Net asset value, beginning of period | | $ | 11.62 | | | $ | 11.06 | | | $ | 11.48 | | | $ | 11.34 | | |
Income from investment operations: | |
Net investment income | | | 0.28 | | | | 0.11 | | | | 0.29 | | | | 0.23 | | |
Net realized and unrealized gain (loss) | | | (0.62 | ) | | | 0.53 | | | | (0.40 | ) | | | 0.25 | | |
Total from investment operations | | | (0.34 | ) | | | 0.64 | | | | (0.11 | ) | | | 0.48 | | |
Less distributions to shareholders: | |
Net investment income | | | (0.19 | ) | | | (0.08 | ) | | | (0.31 | ) | | | (0.32 | ) | |
Net realized gains | | | — | | | | — | | | | — | | | | (0.02 | ) | |
Total distributions to shareholders | | | (0.19 | ) | | | (0.08 | ) | | | (0.31 | ) | | | (0.34 | ) | |
Net asset value, end of period | | $ | 11.09 | | | $ | 11.62 | | | $ | 11.06 | | | $ | 11.48 | | |
Total return | | | (2.94 | %) | | | 5.82 | % | | | (0.95 | %) | | | 4.44 | % | |
Ratios to average net assets(c) | |
Total gross expenses | | | 0.88 | % | | | 1.13 | %(d) | | | 0.97 | % | | | 1.33 | %(d) | |
Total net expenses(e) | | | 0.74 | % | | | 0.79 | %(d) | | | 0.81 | % | | | 0.84 | %(d)(f) | |
Net investment income | | | 2.52 | % | | | 2.29 | %(d) | | | 2.59 | % | | | 2.96 | %(d) | |
Supplemental data | |
Net assets, end of period (in thousands) | | $ | 50,832 | | | $ | 46,022 | | | $ | 44,311 | | | $ | 29,870 | | |
Portfolio turnover | | | 16 | % | | | 5 | % | | | 20 | % | | | 31 | % | |
Notes to Financial Highlights
(a) For the period from June 1, 2012 to October 31, 2012. During the period, the Fund's fiscal year end was changed from May 31 to October 31.
(b) For the period from September 27, 2010 (commencement of operations) to May 31, 2011.
(c) In addition to the fees and expenses which the Fund bears directly, the Fund indirectly bears a pro rata share of the fees and expenses of the acquired funds in which it invests. Such indirect expenses are not included in the reported expense ratios.
(d) Annualized.
(e) Total net expenses include the impact of certain waivers/reimbursements made by the Investment Manager and certain of its affiliates, if applicable.
(f) The benefits derived from expense reductions had an impact of less than 0.01%.
The accompanying Notes to Financial Statements are an integral part of this statement.
Annual Report 2013
21
Columbia International Bond Fund
Financial Highlights (continued)
| | | Year Ended October 31, | |
Class W | | 2013 | | 2012(a) | |
Per share data | |
Net asset value, beginning of period | | $ | 11.62 | | | $ | 11.21 | | |
Income from investment operations: | |
Net investment income | | | 0.24 | | | | 0.09 | | |
Net realized and unrealized gain (loss) | | | (0.61 | ) | | | 0.39 | | |
Total from investment operations | | | (0.37 | ) | | | 0.48 | | |
Less distributions to shareholders: | |
Net investment income | | | (0.16 | ) | | | (0.07 | ) | |
Total distributions to shareholders | | | (0.16 | ) | | | (0.07 | ) | |
Net asset value, end of period | | $ | 11.09 | | | $ | 11.62 | | |
Total return | | | (3.22 | %) | | | 4.27 | % | |
Ratios to average net assets(b) | |
Total gross expenses | | | 1.36 | % | | | 1.63 | %(c) | |
Total net expenses(d) | | | 1.09 | %(e) | | | 1.10 | %(c) | |
Net investment income | | | 2.17 | % | | | 2.04 | %(c) | |
Supplemental data | |
Net assets, end of period (in thousands) | | $ | 3,872 | | | $ | 4,421 | | |
Portfolio turnover | | | 16 | % | | | 5 | % | |
Notes to Financial Highlights
(a) For the period from June 18, 2012 (commencement of operations) to October 31, 2012.
(b) In addition to the fees and expenses which the Fund bears directly, the Fund indirectly bears a pro rata share of the fees and expenses of the acquired funds in which it invests. Such indirect expenses are not included in the reported expense ratios.
(c) Annualized.
(d) Total net expenses include the impact of certain waivers/reimbursements made by the Investment Manager and certain of its affiliates, if applicable.
(e) The benefits derived from expense reductions had an impact of less than 0.01%.
The accompanying Notes to Financial Statements are an integral part of this statement.
Annual Report 2013
22
Columbia International Bond Fund
Financial Highlights (continued)
| | | Year Ended October 31, | | Year Ended May 31, | |
Class Z | | 2013 | | 2012(a) | | 2012 | | 2011 | | 2010 | | 2009(b) | |
Per share data | |
Net asset value, beginning of period | | $ | 11.62 | | | $ | 11.06 | | | $ | 11.49 | | | $ | 10.28 | | | $ | 10.39 | | | $ | 10.00 | | |
Income from investment operations: | |
Net investment income | | | 0.27 | | | | 0.11 | | | | 0.29 | | | | 0.23 | | | | 0.21 | | | | 0.07 | | |
Net realized and unrealized gain (loss) | | | (0.62 | ) | | | 0.53 | | | | (0.41 | ) | | | 1.39 | | | | (0.06 | ) | | | 0.38 | | |
Total from investment operations | | | (0.35 | ) | | | 0.64 | | | | (0.12 | ) | | | 1.62 | | | | 0.15 | | | | 0.45 | | |
Less distributions to shareholders: | |
Net investment income | | | (0.18 | ) | | | (0.08 | ) | | | (0.31 | ) | | | (0.39 | ) | | | (0.25 | ) | | | (0.06 | ) | |
Net realized gains | | | — | | | | — | | | | — | | | | (0.02 | ) | | | (0.01 | ) | | | — | | |
Total distributions to shareholders | | | (0.18 | ) | | | (0.08 | ) | | | (0.31 | ) | | | (0.41 | ) | | | (0.26 | ) | | | (0.06 | ) | |
Redemption fees: | |
Redemption fees added to paid-in capital | | | — | | | | — | | | | — | | | | — | | | | 0.00 | (c) | | | 0.00 | (c) | |
Net asset value, end of period | | $ | 11.09 | | | $ | 11.62 | | | $ | 11.06 | | | $ | 11.49 | | | $ | 10.28 | | | $ | 10.39 | | |
Total return | | | (3.01 | %) | | | 5.81 | % | | | (1.06 | %) | | | 16.05 | % | | | 1.31 | % | | | 4.48 | % | |
Ratios to average net assets(d) | |
Total gross expenses | | | 1.12 | % | | | 1.30 | %(e) | | | 1.10 | % | | | 1.85 | % | | | 1.87 | % | | | 4.62 | %(e) | |
Total net expenses(f) | | | 0.84 | %(g) | | | 0.85 | %(e) | | | 0.85 | % | | | 0.83 | %(g) | | | 0.80 | %(g) | | | 0.80 | %(e)(g) | |
Net investment income | | | 2.40 | % | | | 2.23 | %(e) | | | 2.56 | % | | | 2.11 | % | | | 1.98 | % | | | 1.50 | %(e) | |
Supplemental data | |
Net assets, end of period (in thousands) | | $ | 8,308 | | | $ | 15,860 | | | $ | 15,311 | | | $ | 15,745 | | | $ | 14,562 | | | $ | 8,790 | | |
Portfolio turnover | | | 16 | % | | | 5 | % | | | 20 | % | | | 31 | % | | | 30 | % | | | 4 | % | |
Notes to Financial Highlights
(a) For the period from June 1, 2012 to October 31, 2012. During the period, the Fund's fiscal year end was changed from May 31 to October 31.
(b) For the period from December 1, 2008 (commencement of operations) to May 31, 2009.
(c) Rounds to zero.
(d) In addition to the fees and expenses which the Fund bears directly, the Fund indirectly bears a pro rata share of the fees and expenses of the acquired funds in which it invests. Such indirect expenses are not included in the reported expense ratios.
(e) Annualized.
(f) Total net expenses include the impact of certain waivers/reimbursements made by the Investment Manager and certain of its affiliates, if applicable.
(g) The benefits derived from expense reductions had an impact of less than 0.01%.
The accompanying Notes to Financial Statements are an integral part of this statement.
Annual Report 2013
23
Columbia International Bond Fund
Notes to Financial Statements
October 31, 2013
Note 1. Organization
Columbia International Bond Fund (the Fund), a series of Columbia Funds Series Trust I (the Trust), is a non-diversified fund. The Trust is registered under the Investment Company Act of 1940, as amended (the 1940 Act), as an open-end management investment company organized as a Massachusetts business trust.
Fund Shares
The Trust may issue an unlimited number of shares (without par value). The Fund offers Class A, Class C, Class I, Class W and Class Z shares. Although all share classes generally have identical voting, dividend and liquidation rights, each share class votes separately when required by law. Different share classes pay different distribution amounts to the extent the expenses of such share classes differ, and distributions in liquidation will be proportional to the net asset value of each share class. Each share class has its own expense structure and sales charges, as applicable.
Class A shares are subject to a maximum front-end sales charge of 4.75% based on the initial investment amount. Class A shares purchased without an initial sales charge in accounts aggregating $1 million to $50 million at the time of purchase are subject to a contingent deferred sales charge (CDSC) if the shares are sold within 18 months of purchase, charged as follows: 1.00% CDSC if redeemed within 12 months of purchase, and 0.50% CDSC if redeemed more than 12, but less than 18, months after purchase.
Class C shares are subject to a 1.00% CDSC on shares redeemed within one year of purchase.
Class I shares are not subject to sales charges and are available only to the Columbia Family of Funds.
Class W shares are not subject to sales charges and are available only to investors purchasing through authorized investment programs managed by investment professionals, including discretionary managed account programs.
Class Z shares are not subject to sales charges and are available only to certain eligible investors, which are subject to different investment minimums.
Note 2. Summary of Significant Accounting Policies
Use of Estimates
The preparation of financial statements in accordance with U.S. generally accepted accounting principles (GAAP) requires management to make certain estimates and assumptions that affect the reported amounts of assets and liabilities, the disclosure of contingent assets and liabilities at
the date of the financial statements and the reported amounts of revenue and expenses during the reporting period. Actual results could differ from those estimates.
The following is a summary of significant accounting policies consistently followed by the Fund in the preparation of its financial statements.
Security Valuation
Debt securities generally are valued by pricing services approved by the Board of Trustees (the Board) based upon market transactions for normal, institutional-size trading units of similar securities. The services may use various pricing techniques which take into account appropriate factors such as yield, quality, coupon rate, maturity, type of issue, trading characteristics and other data, as well as broker quotes. Debt securities for which quotations are readily available may also be valued based upon an over-the-counter or exchange bid quotation.
Investments in open-end investment companies, including money market funds, are valued at net asset value.
Forward foreign currency exchange contracts are marked-to-market based upon foreign currency exchange rates provided by a pricing service.
Futures and options on futures contracts are valued based upon the settlement price established each day by the board of trade or exchange on which they are traded.
Investments for which market quotations are not readily available, or that have quotations which management believes are not reliable, are valued at fair value as determined in good faith under consistently applied procedures established by and under the general supervision of the Board. If a security or class of securities (such as foreign securities) is valued at fair value, such value is likely to be different from the last quoted market price for the security.
The determination of fair value often requires significant judgment. To determine fair value, management may use assumptions including but not limited to future cash flows and estimated risk premiums. Multiple inputs from various sources may be used to determine fair value.
Foreign Currency Transactions and Translations
The values of all assets and liabilities denominated in foreign currencies are translated into U.S. dollars at that day's exchange rates. Net realized and unrealized gains (losses) on foreign currency transactions and translations include gains (losses) arising from the fluctuation in exchange rates between trade and settlement dates on securities transactions, gains (losses) arising from the disposition of foreign currency and
Annual Report 2013
24
Columbia International Bond Fund
Notes to Financial Statements (continued)
October 31, 2013
currency gains (losses) between the accrual and payment dates on dividends, interest income and foreign withholding taxes.
For financial statement purposes, the Fund does not distinguish that portion of gains (losses) on investments which is due to changes in foreign exchange rates from that which is due to changes in market prices of the investments. Such fluctuations are included with the net realized and unrealized gains (losses) on investments in the Statement of Operations.
Derivative Instruments
The Fund invests in certain derivative instruments, as detailed below, to meet its investment objectives. Derivatives are instruments whose values depend on, or are derived from, in whole or in part, the value of one or more other assets, such as securities, currencies, commodities or indices. Derivative instruments may be used to maintain cash reserves while maintaining exposure to certain other assets, to offset anticipated declines in values of investments, to facilitate trading, to reduce transaction costs and to pursue higher investment returns. The Fund may also use derivative instruments to mitigate certain investment risks, such as foreign currency exchange rate risk, interest rate risk and credit risk. Derivatives may involve various risks, including the potential inability of the counterparty to fulfill its obligation under the terms of the contract, the potential for an illiquid secondary market (making it difficult for the Fund to sell, including at favorable prices) and the potential for market movements which may expose the Fund to gains or losses in excess of the amount shown in the Statement of Assets and Liabilities. The notional amounts of derivative instruments, if applicable, are not recorded in the financial statements.
A derivative instrument may suffer a mark to market loss if the value of the contract decreases due to an unfavorable change in the market rates or values of the underlying instrument. Losses can also occur if the counterparty does not perform under the contract. A Fund's risk of loss from counterparty credit risk on over-the-counter derivatives is generally limited to the aggregate unrealized gain netted against any collateral held by the Fund and the amount of any initial margin held by the counterparty. With exchange traded or centrally cleared derivatives, there is minimal counterparty credit risk to the Fund since the exchange's clearinghouse, as counterparty to such instruments, guarantees against a possible default. The clearinghouse stands between the buyer and the seller of the contract; therefore, the counterparty credit risk is limited to failure of the clearinghouse. However, credit risk still exists in exchange traded or centrally cleared derivatives with respect to initial and variation margin that is held in a broker's customer accounts. While brokers are required to segregate customer margin from their own assets, in the event that a broker
becomes insolvent or goes into bankruptcy and at that time there is a shortfall in the aggregate amount of margin held by the broker for all its clients, U.S. bankruptcy laws will typically allocate that shortfall on a pro-rata basis across all the broker's customers, potentially resulting in losses to the Fund.
In order to better define its contractual rights and to secure rights that will help the Fund mitigate its counterparty risk, the Fund may enter into an International Swaps and Derivatives Association, Inc. Master Agreement (ISDA Master Agreement) or similar agreement with its derivative contract counterparties. An ISDA Master Agreement is an agreement between a Fund and a counterparty that governs over-the-counter derivatives and forward foreign currency exchange contracts and typically contains, among other things, collateral posting terms and netting provisions in the event of a default and/or termination event. Under an ISDA Master Agreement, the Fund may, under certain circumstances, offset with the counterparty certain derivative instrument's payables and/or receivables with collateral held and/or posted and create one single net payment. The provisions of the ISDA Master Agreement typically permit a single net payment in the event of default (close-out netting) including the bankruptcy or insolvency of the counterparty. Note, however, that bankruptcy or insolvency laws of a particular jurisdiction may impose restrictions on or prohibitions against the right of offset in bankruptcy, insolvency or other events.
Collateral (margin) requirements differ by type of derivative. Margin requirements are established by the exchange or clearinghouse for exchange traded and centrally cleared derivatives. Brokers can ask for margin in excess of the minimum in certain circumstances. Collateral terms are contract specific for over-the-counter derivatives. For over-the-counter derivatives traded under an ISDA Master Agreement, the collateral requirements are typically calculated by netting the mark to market amount for each transaction under such agreement and comparing that amount to the value of any variation margin currently pledged by the Fund and/or the counterparty. Generally, the amount of collateral due from or to a party has to exceed a minimum transfer amount threshold (e.g. $500,000) before a transfer has to be made. To the extent amounts due to the Fund from its counterparties are not fully collateralized, contractually or otherwise, the Fund bears the risk of loss from counterparty nonperformance. The Fund attempts to mitigate counterparty risk by only entering into agreements with counterparties that it believes have the financial resources to honor their obligations and by monitoring the financial stability of those counterparties.
Annual Report 2013
25
Columbia International Bond Fund
Notes to Financial Statements (continued)
October 31, 2013
Certain ISDA Master Agreements allow counterparties to over-the-counter derivatives to terminate derivative contracts prior to maturity in the event the Fund's net assets decline by a stated percentage over a specified time period or the Fund fails to meet the terms of the ISDA Master Agreement, which would cause the Fund to accelerate payment of any net liability owed to the counterparty. The Fund also has termination rights if the counterparty fails to meet the terms of the ISDA Master Agreement. In addition to considering counterparty credit risk, the Fund would consider terminating the derivative contracts based on whether termination would result in a net liability owed from the counterparty.
For financial reporting purposes, the Fund does not offset derivative assets and derivative liabilities that are subject to netting arrangements in the Statement of Assets and Liabilities.
Forward Foreign Currency Exchange Contracts
Forward foreign currency exchange contracts are over-the-counter agreements between two parties to buy and sell a currency at a set price on a future date. These contracts are typically intended to be used to minimize the exposure to foreign exchange rate fluctuations during the period between the trade and settlement dates of the contract. The Fund utilized forward foreign currency exchange contracts to hedge the currency exposure associated with some or all of the Fund's securities, to shift foreign currency exposure back to U.S. dollars, to shift investment exposure from one currency to another, and to shift U.S. dollar exposure to achieve a representative weighted mix of major currencies in its benchmark, and/or to recover an underweight country exposure in its portfolio. These instruments may be used for other purposes in future periods.
The values of forward foreign currency exchange contracts fluctuate with changes in foreign currency exchange rates. The Fund will record a realized gain or loss when the forward foreign currency exchange contract expires or is closed.
The use of forward foreign currency exchange contracts does not eliminate fluctuations in the prices of the Fund's portfolio securities. The risks of forward foreign currency exchange contracts include movement in the values of the foreign currencies relative to the U.S. dollar (or other foreign currencies) and the possibility that counterparties will not complete their contractual obligations, which may be in excess of the amount reflected, if any, in the Statement of Assets and Liabilities.
Futures Contracts
Futures contracts are exchange traded and represent commitments for the future purchase or sale of an asset at a
specified price on a specified date. The Fund bought and sold futures contracts to manage the duration and yield curve exposure of the Fund versus the benchmark and manage exposure to movements in interest rates. These instruments may be used for other purposes in future periods. Upon entering into futures contracts, the Fund bears risks that it may not achieve the anticipated benefits of the futures contracts and may realize a loss. Additional risks include counterparty credit risk, the possibility of an illiquid market, and that a change in the value of the contract or option may not correlate with changes in the value of the underlying asset.
Upon entering into a futures contract, the Fund pledges cash or securities with the broker in an amount sufficient to meet the initial margin requirement. The initial margin deposit must be maintained at an established level over the life of the contract. Cash deposited as initial margin is recorded in the Statement of Assets and Liabilities as margin deposits. Securities deposited as initial margin are designated in the Portfolio of Investments. Subsequent payments (variation margin) are made or received by the Fund each day. The variation margin payments are equal to the daily change in the contract value and are recorded as variation margin receivable or payable and are offset in unrealized gains or losses. The Fund recognizes a realized gain or loss when the contract is closed or expires. Futures contracts involve, to varying degrees, risk of loss in excess of the variation margin disclosed in the Statement of Assets and Liabilities.
Effects of Derivative Transactions in the Financial Statements
The following tables are intended to provide additional information about the effect of derivatives on the financial statements of the Fund, including: the fair value of derivatives by risk category and the location of those fair values in the Statement of Assets and Liabilities; the impact of derivative transactions over the period in the Statement of Operations including realized gains or losses and unrealized gains or losses. The derivative schedules following the Portfolio of Investments present additional information regarding derivative instruments outstanding at the end of the period, if any.
The following table is a summary of the fair value of derivative instruments at October 31, 2013:
Asset Derivatives | |
Risk Exposure
Category | | Statement of Assets and
Liabilities Location | | Fair Value ($) | |
Foreign exchange
risk
| | Unrealized appreciation on
forward foreign currency
exchange contracts | | | 60,333
| | |
Annual Report 2013
26
Columbia International Bond Fund
Notes to Financial Statements (continued)
October 31, 2013
Liability Derivatives | |
Risk Exposure
Category | | Statement of Assets and
Liabilities Location | | Fair Value ($) | |
Foreign exchange
risk
| | Unrealized depreciation on
forward foreign currency
exchange contracts | | | 26,085
| | |
Interest rate risk
| | Net assets — unrealized
depreciation on futures
contracts | | | 174,097
| * | |
Total | | | | | 200,182 | | |
*Includes cumulative appreciation (depreciation) of futures contracts as reported in the Futures Contracts Outstanding table following the Portfolio of Investments. Only the current day's variation margin is reported in receivables or payables in the Statement of Assets and Liabilities.
The following table indicates the effect of derivative instruments in the Statement of Operations for the year ended October 31, 2013:
Amount of Realized Gain (Loss) on Derivatives Recognized in Income | |
Risk Exposure
Category | | Forward Foreign
Currency Exchange
Contracts ($) | | Futures
Contracts ($) | | Total ($) | |
Foreign exchange
risk | | | (504,824 | ) | | | — | | | | (504,824 | ) | |
Interest rate risk | | | — | | | | 91,971 | | | | 91,971 | | |
Total | | | (504,824 | ) | | | 91,971 | | | | (412,853 | ) | |
Change in Unrealized Appreciation (Depreciation) on
Derivatives Recognized in Income | |
Risk Exposure
Category | | Forward Foreign
Currency Exchange
Contracts ($) | | Futures
Contracts ($) | | Total ($) | |
Foreign exchange
risk | | | 66,039 | | | | — | | | | 66,039 | | |
Interest rate risk | | | — | | | | (172,635 | ) | | | (172,635 | ) | |
Total | | | 66,039 | | | | (172,635 | ) | | | (106,596 | ) | |
The following table is a summary of the volume of derivative instruments for the year ended October 31, 2013:
Derivative Instrument | | Contracts Opened | |
Forward foreign currency exchange contracts | | | 102 | | |
Futures contracts | | | 191 | | |
Treasury Inflation Protected Securities
The Fund may invest in treasury inflation protected securities (TIPS). The principal amount of TIPS is adjusted periodically and is increased for inflation or decreased for deflation based on a monthly published index. Interest payments are based on the adjusted principal at the time the interest is paid. These adjustments are recorded as interest income in the Statement of Operations.
Security Transactions
Security transactions are accounted for on the trade date. Cost is determined and gains (losses) are based upon the specific identification method for both financial statement and federal income tax purposes.
Income Recognition
Interest income is recorded on an accrual basis. Market premiums and discounts, including original issue discounts, are amortized and accreted, respectively, over the expected life of the security on all debt securities, unless otherwise noted.
Corporate actions and dividend income are recorded on the ex-dividend date.
Expenses
General expenses of the Trust are allocated to the Fund and other funds of the Trust based upon relative net assets or other expense allocation methodologies determined by the nature of the expense. Expenses directly attributable to the Fund are charged to the Fund. Expenses directly attributable to a specific class of shares are charged to that share class.
Determination of Class Net Asset Value
All income, expenses (other than class-specific expenses, which are charged to that share class, as shown in the Statement of Operations) and realized and unrealized gains (losses) are allocated to each class of the Fund on a daily basis, based on the relative net assets of each class, for purposes of determining the net asset value of each class.
Federal Income Tax Status
The Fund intends to qualify each year as a regulated investment company under Subchapter M of the Internal Revenue Code, as amended, and will distribute substantially all of its taxable income (including net short-term capital gains), if any, for its tax year, and as such will not be subject to federal income taxes. In addition, the Fund intends to distribute in each calendar year substantially all of its net investment income, capital gains and certain other amounts, if any, such that the Fund should not be subject to federal excise tax. Therefore, no federal income or excise tax provision is recorded.
Foreign Taxes
The Fund may be subject to foreign taxes on income, gains on investments or currency repatriation, a portion of which may be recoverable. The Fund will accrue such taxes and recoveries, as applicable, based upon its current interpretation of tax rules and regulations that exist in the markets in which it invests.
Annual Report 2013
27
Columbia International Bond Fund
Notes to Financial Statements (continued)
October 31, 2013
Realized gains in certain countries may be subject to foreign taxes at the Fund level, based on statutory rates. The Fund accrues for such foreign taxes on realized and unrealized gains at the appropriate rate for each jurisdiction, as applicable. The amount, if any, is disclosed as a liability on the Statement of Assets and Liabilities.
Distributions to Shareholders
Distributions from net investment income, if any, are declared and paid monthly. Net realized capital gains, if any, are distributed at least annually. Income distributions and capital gain distributions are determined in accordance with federal income tax regulations, which may differ from GAAP.
Guarantees and Indemnifications
Under the Trust's organizational documents and, in some cases, by contract, its officers and trustees are indemnified against certain liabilities arising out of the performance of their duties to the Trust or its funds. In addition, certain of the Fund's contracts with its service providers contain general indemnification clauses. The Fund's maximum exposure under these arrangements is unknown since the amount of any future claims that may be made against the Fund cannot be determined, and the Fund has no historical basis for predicting the likelihood of any such claims.
Recent Accounting Pronouncement
Disclosures about Offsetting Assets and Liabilities
In December 2011, the Financial Accounting Standards Board (FASB) issued Accounting Standards Update (ASU) No. 2011-11, Disclosures about Offsetting Assets and Liabilities and in January 2013, ASU No. 2013-1, Clarifying the Scope of Disclosures about Offsetting Assets and Liabilities (collectively, the ASUs). Specifically, the ASUs require an entity to disclose both gross and net information for derivatives and other financial instruments that are subject to a master netting arrangement or similar agreement. The ASUs require disclosure of collateral received in connection with the master netting agreements or similar agreements. The disclosure requirements are effective for interim and annual periods beginning on or after January 1, 2013. At this time, management is evaluating the implications of this guidance and the impact it will have on the financial statement amounts and footnote disclosures, if any.
Note 3. Fees and Compensation Paid to Affiliates
Investment Management Fees
Under an Investment Management Services Agreement, Columbia Management Investment Advisers, LLC (the Investment Manager), a wholly-owned subsidiary of
Ameriprise Financial, Inc. (Ameriprise Financial), determines which securities will be purchased, held or sold. The investment management fee is an annual fee that is equal to a percentage of the Fund's average daily net assets that declines from 0.57% to 0.47% as the Fund's net assets increase. The effective investment management fee rate for the year ended October 31, 2013 was 0.57% of the Fund's average daily net assets.
Administration Fees
Under an Administrative Services Agreement, the Investment Manager also serves as the Fund Administrator. The Fund pays the Fund Administrator an annual fee for administration and accounting services equal to a percentage of the Fund's average daily net assets that declines from 0.08% to 0.05% as the Fund's net assets increase. The effective administration fee rate for the year ended October 31, 2013 was 0.08% of the Fund's average daily net assets.
Compensation of Board Members
Board members are compensated for their services to the Fund as disclosed in the Statement of Operations. The Trust's eligible Trustees may participate in a Deferred Compensation Plan (the Plan) which may be terminated at any time. Obligations of the Plan will be paid solely out of the Fund's assets.
Compensation of Chief Compliance Officer
The Board has appointed a Chief Compliance Officer to the Fund in accordance with federal securities regulations. The Fund pays its pro-rata share of the expenses associated with the Chief Compliance Officer. The Fund's expenses for the Chief Compliance Officer will not exceed $15,000 per year.
Transfer Agent Fees
Under a Transfer and Dividend Disbursing Agent Agreement, Columbia Management Investment Services Corp. (the Transfer Agent), an affiliate of the Investment Manager and a wholly-owned subsidiary of Ameriprise Financial, is responsible for providing transfer agency services to the Fund. The Transfer Agent has contracted with Boston Financial Data Services (BFDS) to serve as sub-transfer agent.
The Transfer Agent receives monthly account-based service fees based on the number of open accounts and also receives sub-transfer agency fees based on a percentage of the average aggregate value of the Fund's shares maintained in omnibus accounts (other than omnibus accounts for which American Enterprise Investment Services Inc. is the broker of record or accounts where the beneficial shareholder is a customer of Ameriprise Financial Services, Inc., which are paid a per account fee). The Transfer Agent pays the fees of BFDS for
Annual Report 2013
28
Columbia International Bond Fund
Notes to Financial Statements (continued)
October 31, 2013
services as sub-transfer agent and is not entitled to reimbursement for such fees from the Fund (with the exception of out-of-pocket fees).
The Transfer Agent also receives compensation from fees for various shareholder services and reimbursements for certain out-of-pocket fees. Class I shares do not pay transfer agent fees.
For the year ended October 31, 2013, the Fund's effective transfer agent fee rates as a percentage of average daily net assets of each class were as follows:
Class A | | | 0.22 | % | |
Class C | | | 0.22 | | |
Class W | | | 0.22 | | |
Class Z | | | 0.21 | | |
An annual minimum account balance fee of $20 may apply to certain accounts with a value below the applicable share class's initial minimum investment requirements to reduce the impact of small accounts on transfer agent fees. These minimum account balance fees are recorded as part of expense reductions in the Statement of Operations. For the year ended October 31, 2013, these minimum account balance fees reduced total expenses by $20.
Distribution and Service Fees
The Fund has an agreement with Columbia Management Investment Distributors, Inc. (the Distributor), an affiliate of the Investment Manager and a wholly-owned subsidiary of Ameriprise Financial, for distribution and shareholder services. Pursuant to Rule 12b-1 under the 1940 Act, the Board has approved, and the Fund has adopted, distribution and shareholder service plans (the Plans) which set the distribution and service fees for the Fund. These fees are calculated daily and are intended to compensate the Distributor and/or eligible selling and/or servicing agents for selling shares of the Fund and providing services to investors.
Under the Plans, the Fund pays a monthly service fee to the Distributor at the maximum annual rate of 0.25% of the average daily net assets attributable to Class A, Class C and Class W shares of the Fund. Also under the Plans, the Fund pays a monthly distribution fee to the Distributor at the maximum annual rates of 0.75% and 0.25% of the average daily net assets attributable to Class C and Class W shares, respectively.
The Fund may pay a distribution fee up to 0.25% of the Fund's average daily net assets attributable to Class W shares and a service fee of up to 0.25% of the Fund's average daily net assets attributable to Class W shares, provided, however, that the aggregate fee shall not exceed 0.25% of the Fund's average daily net assets attributable to Class W shares.
Sales Charges
Sales charges, including front-end charges and CDSCs, received by the Distributor for distributing Fund shares were $4,725 for Class A shares for the year ended October 31, 2013.
Expenses Waived/Reimbursed by the Investment Manager and its Affiliates
The Investment Manager and certain of its affiliates have contractually agreed to waive fees and/or reimburse expenses (excluding certain fees and expenses described below), for the period disclosed below, unless sooner terminated at the sole discretion of the Board, so that the Fund's net operating expenses, after giving effect to fees waived/expenses reimbursed and any balance credits and/or overdraft charges from the Fund's custodian, do not exceed the following annual rates as a percentage of the class' average daily net assets:
| | | Fee Rates Contractual
through
February 28, 2014 | |
Class A | | | 1.09 | % | |
Class C | | | 1.84 | | |
Class I | | | 0.74 | | |
Class W | | | 1.09 | | |
Class Z | | | 0.84 | | |
Under the agreement governing these fee waivers and/or expense reimbursement arrangements, the following fees and expenses are excluded from the waiver/reimbursement commitment, and therefore will be paid by the Fund, if applicable: taxes (including foreign transaction taxes), expenses associated with investments in affiliated and non-affiliated pooled investment vehicles (including mutual funds and exchange traded funds), transaction costs and brokerage commissions, costs related to any securities lending program, dividend expenses associated with securities sold short, inverse floater program fees and expenses, transaction charges and interest on borrowed money, interest, extraordinary expenses and any other expenses the exclusion of which is specifically approved by the Board. This agreement may be modified or amended only with approval from all parties.
Note 4. Federal Tax Information
The timing and character of income and capital gain distributions are determined in accordance with income tax regulations, which may differ from GAAP because of temporary or permanent book to tax differences.
At October 31, 2013, these differences are primarily due to differing treatment for capital loss carryforwards, principal
Annual Report 2013
29
Columbia International Bond Fund
Notes to Financial Statements (continued)
October 31, 2013
and/or interest of fixed income securities, Trustees' deferred compensation, foreign currency transactions, distributions in excess and derivative investments. To the extent these differences are permanent, reclassifications are made among the components of the Fund's net assets in the Statement of Assets and Liabilities. Temporary differences do not require reclassifications. In the Statement of Assets and Liabilities the following reclassifications were made:
Undistributed net investment income | | $ | (758,946 | ) | |
Accumulated net realized loss | | | 871,935 | | |
Paid-in capital | | | (112,989 | ) | |
Net investment income and net realized gains (losses), as disclosed in the Statement of Operations, and net assets were not affected by this reclassification.
The tax character of distributions paid during the years indicated was as follows:
Year Ended October 31, | | 2013 | | 2012 | |
Ordinary income | | $ | 1,108,866 | | | $ | 472,830 | | |
Total | | $ | 1,108,866 | | | $ | 472,830 | | |
Short-term capital gain distributions, if any, are considered ordinary income distributions for tax purposes.
At October 31, 2013, the components of distributable earnings on a tax basis were as follows:
Unrealized appreciation | | $ | 634,916 | | |
At October 31, 2013, the cost of investments for federal income tax purposes was $61,435,579 and the aggregate gross unrealized appreciation and depreciation based on that cost was:
Unrealized appreciation | | $ | 2,135,266 | | |
Unrealized depreciation | | | (1,500,350 | ) | |
Net unrealized appreciation | | $ | 634,916 | | |
The following capital loss carryforward, determined at October 31, 2013, may be available to reduce taxable income arising from future net realized gains on investments, if any, to the extent permitted by the Internal Revenue Code:
Year of Expiration | | Amount | |
Unlimited short-term | | $ | 298,587 | | |
Unlimited long-term | | | 58,115 | | |
Total | | $ | 356,702 | | |
For the year ended October 31, 2013, $120,086 of capital loss carryforward was utilized.
Management of the Fund has concluded that there are no significant uncertain tax positions that would require recognition in the financial statements. However, management's conclusion may be subject to review and
adjustment at a later date based on factors including, but not limited to, new tax laws, regulations, and administrative interpretations (including relevant court decisions). Generally, the Fund's federal tax returns for the prior three fiscal years remain subject to examination by the Internal Revenue Service.
Note 5. Portfolio Information
The cost of purchases and proceeds from sales of securities, excluding short-term obligations, aggregated to $10,186,222 and $14,133,488, respectively, for the year ended October 31, 2013.
Note 6. Affiliated Money Market Fund
The Fund invests its daily cash balances in Columbia Short-Term Cash Fund, an affiliated money market fund established for the exclusive use by the Fund and other affiliated funds. The income earned by the Fund from such investments is included as "Dividends — affiliated issuers" in the Statement of Operations. As an investing fund, the Fund indirectly bears its proportionate share of the expenses of Columbia Short-Term Cash Fund.
Note 7. Shareholder Concentration
At October 31, 2013, one unaffiliated shareholder account owned 12.6% of the outstanding shares of the Fund. The Fund has no knowledge about whether any portion of those shares was owned beneficially by such account. Affiliated shareholder accounts owned 81.7% of the outstanding shares of the Fund. Subscription and redemption activity by concentrated accounts may have a significant effect on the operations of the Fund.
Note 8. Line of Credit
The Fund has entered into a revolving credit facility with a syndicate of banks led by JPMorgan Chase Bank N.A. (JPMorgan) whereby the Fund may borrow for the temporary funding of shareholder redemptions or for other temporary or emergency purposes. The credit facility agreement, as amended, which is a collective agreement between the Fund and certain other funds managed by the Investment Manager, severally and not jointly, permits collective borrowings up to $500 million. Interest is charged to each participating fund based on its borrowings at a rate equal to the higher of (i) the overnight federal funds rate plus 1.00% or (ii) the one-month LIBOR rate plus 1.00%. Each borrowing under the credit facility matures no later than 60 days after the date of borrowing. The Fund also pays a commitment fee equal to its pro rata share of the amount of the credit facility at a rate of 0.08% per annum. The commitment fee is included in other expenses in the Statement of Operations.
Annual Report 2013
30
Columbia International Bond Fund
Notes to Financial Statements (continued)
October 31, 2013
Effective December 10, 2013, the Fund extended its revolving credit facility with JPMorgan. The credit facility agreement, as amended, continues to permit collective borrowings up to $500 million under the same terms and interest rates as described above. Effective December 10, 2013, the Fund pays a commitment fee equal to its pro rata share of the amount of the credit facility at a rate of 0.075% per annum.
The Fund had no borrowings during the year ended October 31, 2013.
Note 9. Significant Risks
Non-Diversification Risk
A non-diversified fund is permitted to invest a greater percentage of its total assets in fewer issuers than a diversified fund. The Fund may, therefore, have a greater risk of loss from a few issuers than a similar fund that invests more broadly.
Foreign Securities Risk
Investing in foreign securities may include certain risks and considerations not typically associated with investing in U.S. securities, such as fluctuating currency values and changing local and regional economic, political and social conditions, which may result in greater market volatility. In addition, certain foreign securities may not be as liquid as U.S. securities. Investing in emerging markets may accentuate these risks.
Investments in emerging market countries are subject to additional risk. The risk of foreign investments is typically increased in less developed countries. These countries are also more likely to experience high levels of inflation, deflation or currency devaluation which could hurt their economies and securities markets.
Note 10. Subsequent Events
Management has evaluated the events and transactions that have occurred through the date the financial statements were issued and noted no items requiring adjustment of the financial statements or additional disclosure.
Note 11. Information Regarding Pending and Settled Legal Proceedings
In December 2005, without admitting or denying the allegations, American Express Financial Corporation (AEFC, which is now known as Ameriprise Financial, Inc. (Ameriprise Financial)) entered into settlement agreements with the Securities and Exchange Commission (SEC) and Minnesota Department of Commerce (MDOC) related to market timing activities. As a result, AEFC was censured and ordered to cease and desist from committing or causing any violations of certain provisions of the Investment Advisers Act of 1940, the
Investment Company Act of 1940, and various Minnesota laws. AEFC agreed to pay disgorgement of $10 million and civil money penalties of $7 million. AEFC also agreed to retain an independent distribution consultant to assist in developing a plan for distribution of all disgorgement and civil penalties ordered by the SEC in accordance with various undertakings detailed at www.sec.gov/litigation/admin/ia-2451.pdf. Ameriprise Financial and its affiliates have cooperated with the SEC and the MDOC in these legal proceedings, and have made regular reports to the funds' Boards of Trustees.
Ameriprise Financial and certain of its affiliates have historically been involved in a number of legal, arbitration and regulatory proceedings, including routine litigation, class actions, and governmental actions, concerning matters arising in connection with the conduct of their business activities. Ameriprise Financial believes that the Funds are not currently the subject of, and that neither Ameriprise Financial nor any of its affiliates are the subject of, any pending legal, arbitration or regulatory proceedings that are likely to have a material adverse effect on the Funds or the ability of Ameriprise Financial or its affiliates to perform under their contracts with the Funds. Ameriprise Financial is required to make 10-Q, 10-K and, as necessary, 8-K filings with the Securities and Exchange Commission on legal and regulatory matters that relate to Ameriprise Financial and its affiliates. Copies of these filings may be obtained by accessing the SEC website at www.sec.gov.
There can be no assurance that these matters, or the adverse publicity associated with them, will not result in increased fund redemptions, reduced sale of fund shares or other adverse consequences to the Funds. Further, although we believe proceedings are not likely to have a material adverse effect on the Funds or the ability of Ameriprise Financial or its affiliates to perform under their contracts with the Funds, these proceedings are subject to uncertainties and, as such, we are unable to estimate the possible loss or range of loss that may result. An adverse outcome in one or more of these proceedings could result in adverse judgments, settlements, fines, penalties or other relief that could have a material adverse effect on the consolidated financial condition or results of operations of Ameriprise Financial.
Annual Report 2013
31
Columbia International Bond Fund
Report of Independent Registered Public Accounting Firm
To the Trustees of Columbia Funds Series Trust I and the Shareholders of
Columbia International Bond Fund
In our opinion, the accompanying statement of assets and liabilities, including the portfolio of investments, and the related statements of operations and of changes in net assets and the financial highlights present fairly, in all material respects, the financial position of Columbia International Bond Fund (the "Fund", a series of Columbia Funds Series Trust I) at October 31, 2013, and the results of its operations, the changes in its net assets and the financial highlights for each of the periods indicated, in conformity with accounting principles generally accepted in the United States of America. These financial statements and financial highlights (hereafter referred to as "financial statements") are the responsibility of the Fund's management; our responsibility is to express an opinion on these financial statements based on our audits. We conducted our audits of these financial statements in accordance with the standards of the Public Company Accounting Oversight Board (United States). Those standards require that we plan and perform the audit to obtain reasonable assurance about whether the financial statements are free of material misstatement. An audit includes examining, on a test basis, evidence supporting the amounts and disclosures in the financial statements, assessing the accounting principles used and significant estimates made by management, and evaluating the overall financial statement presentation. We believe that our audits, which included confirmation of securities at October 31, 2013 by correspondence with the custodian, brokers and transfer agent, provide a reasonable basis for the opinion expressed above.
PricewaterhouseCoopers LLP
Minneapolis, Minnesota
December 19, 2013
Annual Report 2013
32
Columbia International Bond Fund
The Trustees serve terms of indefinite duration. The names, addresses and birth years of the Trustees and Officers of the Funds in Columbia Funds Series Trust I, the year each was first elected or appointed to office, their principal business occupations during at least the last five years, the number of Funds overseen by each Trustee and other directorships they hold are shown below. Each officer listed below serves as an officer of each Fund in Columbia Funds Series Trust I.
Independent Trustees
Name, Address and Year of Birth,
Position with Funds, Year First
Elected or Appointed to Office | | Principal Occupation(s) During Past Five Years, Number of Funds in Columbia
Funds Complex Overseen by Trustee, Other Directorships Held | |
Rodman L. Drake (Born 1943)
c/o Columbia Management
Investment Advisers, LLC
225 Franklin Street
Boston, MA 02110
Trustee (since 1994) and
Chairman of the Board (since 2009) | | Independent consultant since 2010; Co-Founder of Baringo Capital LLC (private equity) from 1997 to 2008; Chairman (from 2003 to 2010) and CEO (from 2008 to 2010) of Crystal River Capital, Inc. (real estate investment trust); Oversees 52; Jackson Hewitt Tax Service Inc. (tax preparation services) from 2004 to 2011; Student Loan Corporation (student loan provider) from 2005 to 2010; Celgene Corporation (global biotechnology company); The Helios Funds and Brookfield Funds (closed-end funds); Chimerix, Inc. (biopharmaceutical company) since August 1, 2013; Crystal River Capital, Inc. from 2005 to 2010; Parsons Brinckerhoff from 1995 to 2008; and Apex Silver Mines Ltd. from 2007 to 2009 | |
Douglas A. Hacker (Born 1955)
c/o Columbia Management
Investment Advisers, LLC
225 Franklin Street
Boston, MA 02110
Trustee (since 1996) | | Independent business executive since May 2006; Executive Vice President — Strategy of United Airlines from December 2002 to May 2006; President of UAL Loyalty Services (airline marketing company) from September 2001 to December 2002; Executive Vice President and Chief Financial Officer of United Airlines from July 1999 to September 2001. Oversees 52; Nash Finch Company (food distributor); Aircastle Limited (aircraft leasing); and SeaCube Container Leasing Ltd. (container leasing) | |
Janet Langford Kelly (Born 1957)
c/o Columbia Management
Investment Advisers, LLC
225 Franklin Street
Boston, MA 02110
Trustee (since 1996) | | Senior Vice President, General Counsel and Corporate Secretary, ConocoPhillips (integrated energy company) since September 2007; Deputy General Counsel — Corporate Legal Services, ConocoPhillips from August 2006 to August 2007; Partner, Zelle, Hofmann, Voelbel, Mason & Gette LLP (law firm) from March 2005 to July 2006; Adjunct Professor of Law, Northwestern University from September 2004 to June 2006; Director, UAL Corporation (airline) from February 2006 to July 2006; Chief Administrative Officer and Senior Vice President, Kmart Holding Corporation (consumer goods) from September 2003 to March 2004. Oversees 52; None | |
Nancy T. Lukitsh (Born 1956)
c/o Columbia Management
Investment Advisers, LLC
225 Franklin Street
Boston, MA 02110
Trustee (since 2011) | | Senior Vice President, Partner and Director of Marketing, Wellington Management Company, LLP (investment adviser) from 1997 to 2010; Chair, Wellington Management Investment Portfolios (commingled non-U.S. investment pools) from 2007 to 2010; Director, Wellington Trust Company, NA and other Wellington affiliates from 1997 to 2010. Oversees 52; None | |
William E. Mayer (Born 1940)
c/o Columbia Management
Investment Advisers, LLC
225 Franklin Street
Boston, MA 02110
Trustee (since 1994) | | Partner, Park Avenue Equity Partners (private equity) since February 1999; Dean and Professor, College of Business and Management, University of Maryland from 1992 to 1996. Oversees 52; DynaVox Inc. (speech creation); Lee Enterprises (print media); WR Hambrecht + Co. (financial service provider) from 2000 to 2012; BlackRock Kelso Capital Corporation (investment company) | |
David M. Moffett (Born 1952)
c/o Columbia Management
Investment Advisers, LLC
225 Franklin Street
Boston, MA 02110
Trustee (since 2011) | | Retired. Chief Executive Officer, Federal Home Loan Mortgage Corporation, from 2008 to 2009; Senior Adviser, Global Financial Services Group, Carlyle Group, Inc., from 2007 to 2008; Vice Chairman and Chief Financial Officer, U.S. Bancorp, from 1993 to 2007. Oversees 52; CIT Group Inc. (commercial and consumer finance); eBay Inc. (online trading community); MBIA Inc. (financial service provider); E.W. Scripps Co. (print and television media), Building Materials Holding Corp. (building materials and construction services); Genworth Financial, Inc. (financial and insurance products and services); and University of Oklahoma Foundation | |
Charles R. Nelson (Born 1942)
c/o Columbia Management
Investment Advisers, LLC
225 Franklin Street
Boston, MA 02110
Trustee (since 1981) | | Retired. Professor Emeritus, University of Washington, since 2011; Professor of Economics, University of Washington from 1976 to 2011; Ford and Louisa Van Voorhis Professor of Political Economy, University of Washington from 1993 to 2011; Adjunct Professor of Statistics, University of Washington from 1980 to 2011; Associate Editor, Journal of Money, Credit and Banking from September 1993 to 2008; consultant on econometric and statistical matters. Oversees 52; None | |
John J. Neuhauser (Born 1943)
c/o Columbia Management
Investment Advisers, LLC
225 Franklin Street
Boston, MA 02110
Trustee (since 1984) | | President, Saint Michael's College, since August 2007; Director or Trustee of several non-profit organizations, including Fletcher Allen Health Care, Inc.; University Professor, Boston College from November 2005 to August 2007; Academic Vice President and Dean of Faculties, Boston College from August 1999 to October 2005. Oversees 52; Liberty All-Star Equity Fund and Liberty All-Star Growth Fund (closed-end funds) | |
Annual Report 2013
33
Columbia International Bond Fund
Trustees and Officers (continued)
Independent Trustees (continued)
Name, Address and Year of Birth,
Position with Funds, Year First
Elected or Appointed to Office | | Principal Occupation(s) During Past Five Years, Number of Funds in Columbia
Funds Complex Overseen by Trustee, Other Directorships Held | |
Patrick J. Simpson (Born 1944)
c/o Columbia Management
Investment Advisers, LLC
225 Franklin Street
Boston, MA 02110
Trustee (since 2000) | | Partner, Perkins Coie LLP (law firm). Oversees 52; None | |
Anne-Lee Verville (Born 1945)
c/o Columbia Management
Investment Advisers, LLC
225 Franklin Street
Boston, MA 02110
Trustee (since 1998) | | Retired. General Manager — Global Education Industry from 1994 to 1997, President — Application Systems Division from 1991 to 1994, Chief Financial Officer — US Marketing & Services from 1988 to 1991, and Chief Information Officer from 1987 to 1988, IBM Corporation (computer and technology). Oversees 52; Enesco Group, Inc. (producer of giftware and home and garden decor products) from 2001 to 2006 | |
Interested Trustee
Name, Address and Year of Birth,
Position with Funds, Year First
Elected or Appointed to Office | | Principal Occupation(s) During Past Five Years, Number of Funds in Columbia
Funds Complex Overseen by Trustee, Other Directorships Held | |
William F. Truscott (born 1960)
53600 Ameriprise Financial Center
Minneapolis, MN 55474
Senior Vice President (since 2012) | | Chairman of the Board and President, Columbia Management Investment Advisers, LLC since May 2010 and February 2012 (previously President and Chief Investment Officer, from 2001 to April 2010); Chief Executive Officer, Global Asset Management, Ameriprise Financial, Inc. since September 2012 (previously, Chief Executive Officer, U.S. Asset Management & President, Annuities, from May 2010 to September 2012 and President — U.S. Asset Management and Chief Investment Officer from 2005 to April 2010); Director and Chief Executive Officer, Columbia Management Investment Distributors, Inc. since May 2010 and February 2012, respectively (previously Chairman of the Board and Chief Executive Officer from 2006 to April 2010); Chairman of the Board and Chief Executive Officer, RiverSource Distributors, Inc. since 2006; President and Chief Executive Officer, Ameriprise Certificate Company, 2006 to August 2012; Oversees 184; Director, Ameriprise Certificate Company, 2006-January 2013 | |
The Statement of Additional Information includes additional information about the Trustees of the Funds and is available, without charge, upon request by calling 800.345.6611.
The Board has appointed officers who are responsible for day-to-day business decisions based on policies it has established. The officers serve at the pleasure of the Board. In addition to Mr. Truscott, who is Senior Vice President, the Funds' other officers are:
Officers
Name,
Address and
Year of Birth | | Position and Year
First Appointed to
Position for any Fund
in the Columbia
Funds Complex or a
Predecessor Thereof | | Principal Occupation(s) During Past Five Years | |
J. Kevin Connaughton
225 Franklin Street
Boston, MA 02110
Born 1964 | | President and Principal Executive Officer (2009) | | Senior Vice President and General Manager — Mutual Fund Products, Columbia Management Investment Advisers, LLC, since May 2010; and President, Columbia Funds since 2009; previously, Managing Director, Columbia Management Advisors, LLC, from December 2004 to April 2010; Senior Vice President and Chief Financial Officer, Columbia Funds, from June 2008 to January 2009; and senior officer of Columbia Funds and affiliated funds since 2003. | |
Michael G. Clarke
225 Franklin Street
Boston, MA 02110
Born 1969 | | Treasurer (2011) and Chief Financial Officer (2009) | | Vice President, Columbia Management Investment Advisers, LLC, since May 2010; previously, Managing Director of Fund Administration, Columbia Management Advisors, LLC, from September 2004 to April 2010; and senior officer of Columbia Funds and affiliated funds since 2002. | |
Annual Report 2013
34
Columbia International Bond Fund
Trustees and Officers (continued)
Officers (continued)
Name,
Address and
Year of Birth | | Position and Year
First Appointed to
Position for any Fund
in the Columbia
Funds Complex or a
Predecessor Thereof | | Principal Occupation(s) During Past Five Years | |
Scott R. Plummer
5228 Ameriprise
Financial Center
Minneapolis, MN 55474
Born 1959 | | Senior Vice President (2006), Chief Legal Officer (2006) and Assistant Secretary (2011) | | Senior Vice President, Chief Legal Officer and Assistant Secretary, Columbia Management Investment Advisers, LLC, since June 2005; Senior Vice President and Lead Chief Counsel — Asset Management, Ameriprise Financial, Inc., since May 2010 (previously, Vice President and Chief Counsel — Asset Management, from 2005 to April 2010); Vice President, Chief Counsel and Assistant Secretary, Columbia Management Investment Distributors, Inc., since 2008; Vice President, General Counsel and Secretary, Ameriprise Certificate Company, since 2005; Chief Counsel, RiverSource Distributors, Inc., since 2006; and senior officer of Columbia Funds and affiliated funds since 2006. | |
Thomas P. McGuire
225 Franklin Street
Boston, MA 02110
Born 1972 | | Chief Compliance Officer (2012) | | Vice President — Asset Management Compliance, Ameriprise Financial, Inc., since May 2010; Chief Compliance Officer, Ameriprise Certificate Company, since September 2010; Compliance Executive, Bank of America, from 2005 to April 2010. | |
Colin Moore
225 Franklin Street
Boston, MA 02110
Born 1958 | | Senior Vice President (2010) | | Executive Vice President and Global Chief Investment Officer, Ameriprise Financial, Inc., since July 2013; Director and Global Chief Investment Officer, Columbia Management Investment Advisers, LLC, since May 2010; previously, Manager, Managing Director and Chief Investment Officer, Columbia Management Advisors, LLC, from 2007 to April 2010. | |
Michael E. DeFao
225 Franklin Street
Boston, MA 02110
Born 1968 | | Vice President (2011) and Assistant Secretary (2010) | | Vice President and Chief Counsel, Ameriprise Financial, Inc., since May 2010; Associate General Counsel, Bank of America from 2005 to April 2010. | |
Joseph F. DiMaria
225 Franklin Street
Boston, MA 02110
Born 1968 | | Vice President (2011) and Chief Accounting Officer (2008) | | Vice President — Mutual Fund Administration, Columbia Management Investment Advisers, LLC, since May 2010; previously, Director of Fund Administration, Columbia Management Advisors, LLC, from 2006 to April 2010. | |
Paul B. Goucher
100 Park Avenue
New York, NY 10017
Born 1968 | | Vice President (2011) and Assistant Secretary (2008) | | Vice President and Lead Chief Counsel, Ameriprise Financial, Inc., since November 2008 and January 2013, respectively (previously, Chief Counsel, from January 2010 to January 2013, and Group Counsel from November 2008 to January 2010); previously, Director, Managing Director and General Counsel, J. & W. Seligman & Co. Incorporated, from July 2008 to November 2008. | |
Amy Johnson
5228 Ameriprise
Financial Center
Minneapolis, MN
Born 1965 | | Vice President (2006) | | Senior Vice President and Chief Operating Officer, Columbia Management Investment Advisers, LLC, since May 2010; previously, Chief Administrative Officer, from 2009 to April 2010, and Vice President — Asset Management and Trust Company Services, from 2006 to 2009. | |
Paul D. Pearson
5228 Ameriprise
Financial Center
Minneapolis, MN
Born 1956 | | Vice President (2011) and Assistant Treasurer (1999) | | Vice President — Investment Accounting, Columbia Management Investment Advisers, LLC, since May 2010; previously, Vice President — Managed Assets, Investment Accounting, Ameriprise Financial, Inc. from 1998 to April 2010. | |
Christopher O. Petersen
5228 Ameriprise
Financial Center
Minneapolis, MN 55474
Born 1970 | | Vice President and Secretary (2010) | | Vice President and Chief Counsel, Ameriprise Financial, Inc., since January 2010 (previously, Vice President and Group Counsel or Counsel from 2004 to January 2010); officer of Columbia Funds and affiliated funds since 2007. | |
Stephen T. Welsh
225 Franklin Street
Boston, MA 02110
Born 1957 | | Vice President (2006) | | President and Director, Columbia Management Investment Services Corp., since May 2010; previously, President and Director, Columbia Management Services, Inc., from 2004 to April 2010; and Managing Director, Columbia Management Distributors, Inc., from 2007 to April 2010. | |
Annual Report 2013
35
Columbia International Bond Fund
Board Consideration and Approval of Advisory Agreement
On June 14, 2013, the Board of Trustees (the "Board") and the Trustees who are not interested persons (as defined in the Investment Company Act of 1940) of the Trust (the "Independent Trustees") unanimously approved the continuation of the Investment Management Services Agreement (the "Advisory Agreement") with Columbia Management Investment Advisers, LLC (the "Investment Manager") with respect to Columbia International Bond Fund (the "Fund"), a series of the Trust. As detailed below, the Advisory Fees and Expenses Committee (the "Committee") and the Board met on multiple occasions to review and discuss, both among themselves and with the management team of the Investment Manager, materials provided by the Investment Manager before determining to approve the continuation of the Advisory Agreement.
In connection with their deliberations regarding the continuation of the Advisory Agreement, the Committee and the Board evaluated materials requested from the Investment Manager regarding the Fund and the Advisory Agreement, and discussed these materials with representatives of the Investment Manager at Committee meetings held on March 5, 2013, April 24, 2013 and June 13, 2013, and at the Board meeting held on June 14, 2013. In addition, the Board considers matters bearing on the Advisory Agreement at most of its other meetings throughout the year and meets regularly with senior management of the Funds and the Investment Manager. Through the Board's Investment Oversight Committees, Trustees also meet with selected Fund portfolio managers and other investment personnel at various times throughout the year. The Committee and the Board also consulted with Fund counsel and with the Independent Trustees' independent legal counsel, who advised on various matters with respect to the Committee's and the Board's considerations and otherwise assisted the Committee and the Board in their deliberations. On June 13, 2013, the Committee recommended that the Board approve the continuation of the Advisory Agreement. On June 14, 2013, the Board, including the Independent Trustees, voting separately, unanimously approved the continuation of the Advisory Agreement for the Fund.
The Committee and the Board considered all information that they, their legal counsel, or the Investment Manager believed reasonably necessary to evaluate and to determine whether to approve the continuation of the Advisory Agreement. The information and factors considered by the Committee and the Board in recommending for approval or approving the continuation of the Advisory Agreement for the Fund included the following:
• Information on the investment performance of the Fund relative to the performance of a group of mutual funds determined to be comparable to the Fund by an independent third-party data provider, as well as performance relative to benchmarks;
• Information on the Fund's advisory fees and total expenses, including information comparing the Fund's expenses to those of a group of comparable mutual funds, as determined by the independent third-party data provider;
• The Investment Manager's agreement to contractually limit or cap total operating expenses for the Fund so that total operating expenses (excluding certain fees and expenses, such as transaction costs and certain other investment related expenses, interest, taxes, acquired fund fees and expenses, and extraordinary expenses) would not exceed the median expenses of a group of comparable funds (as determined from time to time, generally annually, by the independent third-party data provider);
• The terms and conditions of the Advisory Agreement;
• The terms and conditions of other agreements and arrangements with affiliates of the Investment Manager relating to the operations of the Fund, including the Administrative Services Agreement, the Distribution Agreement and the Transfer and Dividend Disbursing Agent Agreement;
• Descriptions of various functions performed by the Investment Manager under the Advisory Agreement, including portfolio management and portfolio trading practices;
• Information regarding the management fees and investment performance of comparable portfolios of other clients of the Investment Manager, including institutional separate accounts;
• Information regarding the reputation, regulatory history and resources of the Investment Manager, including information regarding senior management, portfolio managers and other personnel;
• Information regarding the capabilities of the Investment Manager with respect to compliance monitoring services, including an assessment of the Investment Manager's compliance system by the Fund's Chief Compliance Officer; and
• The profitability to the Investment Manager and its affiliates from their relationships with the Fund.
Annual Report 2013
36
Columbia International Bond Fund
Board Consideration and Approval of Advisory Agreement (continued)
Nature, Extent and Quality of Services Provided under the Advisory Agreement
The Committee and the Board considered the nature, extent and quality of services provided to the Fund by the Investment Manager and its affiliates under the Advisory Agreement and under separate agreements for the provision of transfer agency and administrative services, and the resources dedicated to the Fund and the other Columbia Funds by the Investment Manager and its affiliates. The Committee and the Board considered, among other things, the Investment Manager's ability to attract, motivate and retain highly qualified research, advisory and supervisory investment professionals (including personnel and other resources, compensation programs for personnel involved in fund management, reputation and other attributes), the portfolio management services provided by those investment professionals, and the quality of the Investment Manager's investment research capabilities and trade execution services. The Committee and the Board also considered the potential benefits to shareholders of investing in a mutual fund that is part of a fund complex offering exposure to a variety of asset classes and investment disciplines and providing a variety of fund and shareholder services.
The Committee and the Board also considered the professional experience and qualifications of the senior personnel of the Investment Manager, which included consideration of the Investment Manager's experience with similarly-structured funds. The Committee and the Board noted the compliance programs of and the compliance-related resources provided to the Fund by the Investment Manager and its affiliates, and considered the Investment Manager's ability to provide administrative services to the Fund pursuant to a separate Administrative Services Agreement, including the Investment Manager's ability to coordinate the activities of the Fund's other service providers. After reviewing these and related factors, the Committee and the Board concluded, within the context of their overall conclusions, that the nature, extent and quality of the services provided to the Fund under the Advisory Agreement supported the continuation of the Advisory Agreement.
Investment Performance
The Committee and the Board reviewed information about the performance of the Fund over various time periods, including performance information relative to benchmarks and information based on reports of the independent third-party data provider that compared the performance of the Fund to the performance of a group of comparable mutual funds. The Committee and the Board also reviewed a description of the third party's methodology for identifying the Fund's peer groups for purposes of performance and expense comparisons. Although the Fund's performance lagged that of a relevant peer group for certain (although not necessarily all) periods, the Committee and the Board concluded that other factors relevant to performance were sufficient, in light of other considerations, to warrant continuation of the Fund's Advisory Agreement. Those factors included one or more of the following: (i) that the Fund's performance, although lagging in certain recent periods, was stronger over the longer term; (ii) that the underperformance was attributable, to a significant extent, to investment decisions that were reasonable and consistent with the Fund's investment strategy and policies and that the Fund was performing within a reasonable range of expectations, given those investment decisions, market conditions and the Fund's investment strategy; (iii) that the Fund's performance was competitive when compared to other relevant performance benchmarks or peer groups; and (iv) that the Investment Manager had taken or was taking steps designed to help improve the Fund's investment performance, including, but not limited to, replacing portfolio managers, enhancing the resources supporting the portfolio managers, or modifying investment strategies.
The Committee and the Board noted that, through December 31, 2012, the Fund's performance was in the 38th and 58th percentile (where the best performance would be in the first percentile) of its category selected by the independent third-party data provider for the purposes of performance comparisons for the one- and three-year periods, respectively.
The Committee and the Board also considered the Investment Manager's performance and reputation generally, the Investment Manager's historical responsiveness to Board concerns about performance, and the Investment Manager's willingness to take steps intended to improve performance. After reviewing these and related factors, the Committee and the Board concluded, within the context of their overall conclusions, that the performance of the Fund and the Investment Manager was sufficient, in light of other considerations, to warrant the continuation of the Advisory Agreement.
Investment Advisory Fee Rates and Other Expenses
The Committee and the Board considered the advisory fees charged to the Fund under the Advisory Agreement as well as the total expenses incurred by the Fund. In assessing the reasonableness of the fees under the Advisory Agreement, the Committee and the Board considered, among other information, the Fund's advisory fee and its total expense ratio as a
Annual Report 2013
37
Columbia International Bond Fund
Board Consideration and Approval of Advisory Agreement (continued)
percentage of average daily net assets. The Committee and the Board noted that the Fund's actual management fee and net expense ratio are ranked in the first and third quintiles, respectively, (where the lowest fees and expenses would be in the first quintile) against the Fund's expense universe as determined by the independent third-party data provider for purposes of expense comparison. The Committee and the Board also took into account the fee waiver and expense limitation arrangements agreed to by the Investment Manager, as noted above.
The Committee and the Board also received and considered information about the advisory fees charged by the Investment Manager to institutional separate accounts. In considering the fees charged to those accounts, the Committee and the Board took into account, among other things, the Investment Manager's representations about the differences between managing mutual funds as compared to other types of accounts, including differences in the services provided, differences in the risk profile of such business for the Investment Manager and the additional resources required to manage mutual funds effectively. In evaluating the Fund's advisory fees, the Committee and the Board also took into account the demands, complexity and quality of the investment management of the Fund.
After reviewing these and related factors, the Committee and the Board concluded, within the context of their overall conclusions, that the advisory fee rates and expenses of the Fund supported the continuation of the Advisory Agreement.
Costs of Services Provided and Profitability
The Committee and the Board also took note of the costs of the services provided (both on an absolute and relative basis) and the profitability to the Investment Manager and its affiliates in connection with their relationships with the Fund. In evaluating these considerations, the Committee and the Board took note of the advisory fees charged by the Investment Manager to other clients, including fees charged by the Investment Manager to institutional separate account clients with similar investment strategies to those of the Fund.
The Committee and the Board also considered the compensation directly or indirectly received by the Investment Manager's affiliates in connection with their relationships with the Fund. The Committee and the Board reviewed information provided by management as to the profitability of the Investment Manager and its affiliates of their relationships with the Fund, information about the allocation of expenses used to calculate profitability, and comparisons of profitability levels realized in 2012 to profitability levels realized in 2011. When reviewing profitability, the Committee and the Board also considered court cases in which adviser profitability was an issue in whole or in part, the performance of the Fund, the expense ratio of the Fund, and the implementation of expense limitations with respect to the Fund. The Committee and the Board also considered information provided by the Investment Manager regarding its financial condition and comparing its profitability to that of other asset management firms that are, or are subsidiaries of, publicly traded companies.
After reviewing these and related factors, the Committee and the Board concluded, within the context of their overall conclusions, that the costs of services provided and the profitability to the Investment Manager and its affiliates from their relationships with the Fund supported the continuation of the Advisory Agreement.
Economies of Scale
The Committee and the Board considered the potential existence of economies of scale in the provision by the Investment Manager of services to the Fund, to groups of related funds, and to the Investment Manager's investment advisory clients as a whole, and whether those economies of scale were shared with the Fund through breakpoints in investment advisory fees or other means, such as expense limitation arrangements and additional investments by the Investment Manager in investment, trading and compliance resources. The Committee and the Board noted that the investment advisory fee schedules for the Fund contained breakpoints that would reduce the fee rate on assets above specified threshold levels.
In considering these matters, the Committee and the Board also considered the costs of the services provided and the profitability to the Investment Manager and its affiliates from their relationships with the Fund, as discussed above. After reviewing these and related factors, the Committee and the Board concluded, within the context of their overall conclusions, that the extent to which any economies of scale were expected to be shared with the Fund supported the continuation of the Advisory Agreement.
Annual Report 2013
38
Columbia International Bond Fund
Board Consideration and Approval of Advisory Agreement (continued)
Other Benefits to the Investment Manager
The Committee and the Board received and considered information regarding "fall-out" or ancillary benefits received by the Investment Manager and its affiliates as a result of their relationships with the Fund, such as the engagement of the Investment Manager to provide administrative services to the Fund and the engagement of the Investment Manager's affiliates to provide distribution and transfer agency services to the Fund. The Committee and the Board considered that the Fund's distributor retains a portion of the distribution fees from the Fund. The Committee and the Board also considered the benefits of research made available to the Investment Manager by reason of brokerage commissions generated by the Fund's securities transactions, and reviewed information about the Investment Manager's practices with respect to allocating portfolio transactions for brokerage and research services. The Committee and the Board considered the possible conflicts of interest associated with certain fall-out or other ancillary benefits and the reporting, disclosure and other processes that are in place to address such possible conflicts of interest. The Committee and the Board recognized that the Investment Manager's profitability would be somewhat lower without these benefits.
Conclusion
The Committee and the Board reviewed all of the above considerations in reaching their decisions to recommend or approve the continuation of the Advisory Agreement. In their deliberations, the Trustees did not identify any particular information that was all-important or controlling, and individual Trustees may have attributed different weights to the various factors. Based on their evaluation of all factors that they deemed to be material, including those factors described above, and assisted by the advice of independent legal counsel, the Board, including the Independent Trustees, voting separately, unanimously approved the continuation of the Advisory Agreement.
Annual Report 2013
39
This page intentionally left blank.
Annual Report 2013
40
Columbia International Bond Fund
Important Information About This Report
Each fund mails one shareholder report to each shareholder address. If you would like more than one report, please call shareholder services at 800.345.6611 and additional reports will be sent to you.
The policy of the Board is to vote the proxies of the companies in which each fund holds investments consistent with the procedures as stated in the Statement of Additional Information (SAI). You may obtain a copy of the SAI without charge by calling 800.345.6611; contacting your financial intermediary; visiting columbiamanagement.com; or searching the website of the Securities and Exchange Commission (SEC) at sec.gov. Information regarding how each fund voted proxies relating to portfolio securities is filed with the SEC by August 31 for the most recent 12-month period ending June 30 of that year, and is available without charge by visiting columbiamanagement.com; or searching the website of the SEC at sec.gov.
Each fund files a complete schedule of portfolio holdings with the SEC for the first and third quarters of each fiscal year on Form N-Q. Each fund's Form N-Q is available on the SEC's website at sec.gov and may be reviewed and copied at the SEC's Public Reference Room in Washington, D.C. Information on the operation of the Public Reference Room may be obtained by calling 800.SEC.0330. Each fund's complete schedule of portfolio holdings, as filed on Form N-Q, can also be obtained without charge, upon request, by calling 800.345.6611.
Annual Report 2013
41

Columbia International Bond Fund
P.O. Box 8081
Boston, MA 02266-8081
columbiamanagement.com
This information is for use with concurrent or prior delivery of a fund prospectus. Please read and consider the investment objectives, risks, charges and expenses for any fund carefully before investing. For a prospectus and, if available, a summary prospectus, which contains this and other important information about the Fund go to columbiamanagement.com. The Fund is distributed by Columbia Management Investment Distributors, Inc., member FINRA, and managed by Columbia Management Investment Advisers, LLC.
© 2013 Columbia Management Investment Advisers, LLC. All rights reserved.
ANN169_10_C01_(12/13)
Annual Report
October 31, 2013

Columbia New York Intermediate Municipal Bond Fund
Not FDIC insured • No bank guarantee • May lose value
 Dear Shareholders,
A market rally led by equities
Despite threats of military action in Syria, rumblings from Iran and an impending showdown over the debt ceiling here at home, the U.S. financial markets delivered positive results in the third quarter of 2013. Stocks outperformed bonds by a substantial margin. Still, robust growth continued to elude the U.S. economy, which merely plodded along. New job growth was solid but not spectacular. Consumer spending remained steady, but the only obvious beneficiary was the auto industry. Gains in the housing market met some headwinds, as mortgage rates rose and sales slipped somewhat. Nevertheless, the recovery in housing remained intact.
The Federal Reserve (the Fed) unsettled investors with a hint that it was ready to taper its purchase of U.S. Treasury and mortgage securities. However, its failure to take any action in a September meeting rallied stocks to new highs and brought bonds back into positive territory for the quarter. Small-cap stocks were the U.S. market leaders. Growth outperformed value in a quarter dominated by the materials, industrials and consumer discretionary sectors. Developed markets led the global rally, driven by strengthening economic conditions in the eurozone. Certain emerging stock markets, including China's, bounced back with returns in line with those of the United States. India and Indonesia were exceptions to that trend, as fears of the Fed's tapering efforts rattled investors in both countries.
Improved risk appetites boosted fixed income
Following a weak second quarter, the fixed-income markets made up some ground in the third quarter of 2013. As yields fell, bond prices rallied enough to push returns on non-Treasury sectors into positive territory. Risk appetites improved in response to continued liquidity from the Fed. Against this backdrop, U.S. high-yield and foreign bonds led the fixed-income markets, along with mortgage-backed securities and emerging market bonds. The U.S. municipal bond market was the exception, as it slipped into negative territory in the final week of the period, pressured by heightened concerns over Puerto Rico, potential municipal bankruptcies and continued fund redemptions.
Stay on track with Columbia Management
Backed by more than 100 years of experience, Columbia Management is one of the nation's largest asset managers. At the heart of our success and, most importantly, that of our investors, are highly talented industry professionals, brought together by a unique way of working. At Columbia Management, reaching our performance goals matters, and how we reach them matters just as much.
Visit columbiamanagement.com for:
> The Columbia Management Perspectives blog, offering insights on current market events and investment opportunities
> Detailed up-to-date fund performance and portfolio information
> Quarterly fund commentaries
> Columbia Management Investor, our award-winning quarterly newsletter for shareholders
Thank you for your continued support of the Columbia Funds. We look forward to serving your investment needs for many years to come.
Best Regards,

J. Kevin Connaughton
President, Columbia Funds
Investing involves risk including the risk of loss of principal.
Investors should consider the investment objectives, risks, charges and expenses of a mutual fund carefully before investing. For a free prospectus and, if available, a summary prospectus, which contains this and other important information about a fund, visit columbiamanagement.com. The prospectus should be read carefully before investing.
Columbia Funds are distributed by Columbia Management Investment Distributors, Inc., member FINRA, and managed by Columbia Management Investment Advisers, LLC.
© 2013 Columbia Management Investment Advisers, LLC. All rights reserved.
Columbia New York Intermediate Municipal Bond Fund
Performance Overview | | | 2 | | |
Manager Discussion of Fund Performance | | | 4 | | |
Understanding Your Fund's Expenses | | | 6 | | |
Portfolio of Investments | | | 7 | | |
Statement of Assets and Liabilities | | | 15 | | |
Statement of Operations | | | 17 | | |
Statement of Changes in Net Assets | | | 18 | | |
Financial Highlights | | | 20 | | |
Notes to Financial Statements | | | 26 | | |
Report of Independent Registered
Public Accounting Firm | | | 32 | | |
Federal Income Tax Information | | | 33 | | |
Trustees and Officers | | | 34 | | |
Board Consideration and Approval of Advisory Agreement | | | 37 | | |
Important Information About This Report | | | 41 | | |
Fund Investment Manager
Columbia Management Investment
Advisers, LLC
225 Franklin Street
Boston, MA 02110
Fund Distributor
Columbia Management Investment
Distributors, Inc.
225 Franklin Street
Boston, MA 02110
Fund Transfer Agent
Columbia Management Investment
Services Corp.
P.O. Box 8081
Boston, MA 02266-8081
For more information about any of the funds, please visit columbiamanagement.com or call 800.345.6611. Customer Service Representatives are available to answer your questions Monday through Friday from 8 a.m. to 8 p.m. Eastern time.
The views expressed in this report reflect the current views of the respective parties. These views are not guarantees of future performance and involve certain risks, uncertainties and assumptions that are difficult to predict, so actual outcomes and results may differ significantly from the views expressed. These views are subject to change at any time based upon economic, market or other conditions and the respective parties disclaim any responsibility to update such views. These views may not be relied on as investment advice and, because investment decisions for a Columbia Fund are based on numerous factors, may not be relied on as an indication of trading intent on behalf of any particular Columbia Fund. References to specific securities should not be construed as a recommendation or investment advice.
Columbia New York Intermediate Municipal Bond Fund
Performance Summary
> Columbia New York Intermediate Municipal Bond Fund (the Fund) Class A shares returned -1.49% excluding sales charges for the 12-month period that ended October 31, 2013. The Fund's Class Z shares returned -1.32% for the same time period.
> By comparison, the Barclays New York 3-15 Year Blend Municipal Bond Index and the Barclays 3-15 Year Blend Municipal Bond Index returned -0.41% and -0.53%, respectively, for the 12-month period.
> The Fund's exposure to issues backed by special non-property taxes and toll facilities-related credits detracted from performance relative to its benchmarks.
Average Annual Total Returns (%) (for period ended October 31, 2013)
| | Inception | | 1 Year | | 5 Years | | 10 Years | |
Class A | | 11/25/02 | | | | | | | | | | | | | |
Excluding sales charges | | | | | | | -1.49 | | | | 4.97 | | | | 3.42 | | |
Including sales charges | | | | | | | -4.68 | | | | 4.28 | | | | 2.92 | | |
Class B | | 11/25/02 | | | | | | | | | | | | | |
Excluding sales charges | | | | | | | -2.23 | | | | 4.19 | | | | 2.65 | | |
Including sales charges | | | | | | | -5.09 | | | | 4.19 | | | | 2.65 | | |
Class C | | 11/25/02 | | | | | | | | | | | | | |
Excluding sales charges | | | | | | | -1.88 | | | | 4.55 | | | | 3.01 | | |
Including sales charges | | | | | | | -2.84 | | | | 4.55 | | | | 3.01 | | |
Class R4* | | 03/19/13 | | | -1.25 | | | | 5.23 | | | | 3.68 | | |
Class T | | 12/31/91 | | | | | | | | | | | | | |
Excluding sales charges | | | | | | | -1.47 | | | | 5.06 | | | | 3.52 | | |
Including sales charges | | | | | | | -6.18 | | | | 4.04 | | | | 3.02 | | |
Class Z | | 12/31/91 | | | -1.32 | | | | 5.21 | | | | 3.68 | | |
Barclays New York 3-15 Year Blend Municipal Bond Index | | | | | | | -0.41 | | | | 5.72 | | | | 4.42 | | |
Barclays 3-15 Year Blend Municipal Bond Index | | | | | | | -0.53 | | | | 5.88 | | | | 4.47 | | |
Returns for Class A are shown with and without the maximum initial sales charge of 3.25% (for the one-year and five-year periods) and 4.75% (for the 10-year period). (Prior to August 22, 2005, new purchases of Class A shares had a maximum initial sales charge of 4.75%.) Returns for Class B are shown with and without the applicable contingent deferred sales charge (CDSC) of 3.00% in the first year, declining to 1.00% in the fourth year and eliminated thereafter. Returns for Class C are shown with and without the 1.00% CDSC for the first year only. Returns for Class T are shown with and without the maximum sales charge of 4.75%. The Fund's other classes are not subject to sales charges and have limited eligibility. Please see the Fund's prospectus for details. Performance for different share classes will vary based on differences in sales charges and fees associated with each class. All results shown assume reinvestment of distributions during the period. Returns do not reflect the deduction of taxes that a shareholder may pay on Fund distributions or on the redemption of Fund shares. Performance results reflect the effect of any fee waivers or reimbursements of Fund expenses by Columbia Management Investment Advisers, LLC and/or any of its affiliates. Absent these fee waivers or expense reimbursement arrangements, performance results would have been lower.
The performance information shown represents past performance and is not a guarantee of future results. The investment return and principal value of your investment will fluctuate so that your shares, when redeemed, may be worth more or less than their original cost. Current performance may be lower or higher than the performance information shown. You may obtain performance information current to the most recent month-end by contacting your financial intermediary, visiting columbiamanagement.com or calling 800.345.6611.
*The returns shown for periods prior to the share class inception date (including returns for the Life of the Fund, if shown, which are since Fund inception) include the returns of the Fund's oldest share class. Since the Fund launched more than one share class at its inception, Class Z shares were used. These returns are adjusted to reflect any higher class-related operating expenses of the newer share classes, as applicable. Please visit columbiamanagement.com/mutual-funds/appended-performance for more information.
The Barclays New York 3-15 Year Blend Municipal Bond Index is an unmanaged index that tracks investment grade bonds from the state of New York and its municipalities.
The Barclays 3-15 Year Blend Municipal Bond Index is an unmanaged index that tracks the performance of municipal bonds issued after December 31, 1990, with remaining maturities between 2 and 17 years and at least $7 million in principal amount outstanding.
Indices are not available for investment, are not professionally managed and do not reflect sales charges, fees, brokerage commissions, taxes or other expenses of investing. Securities in the Fund may not match those in an index.
Annual Report 2013
2
Columbia New York Intermediate Municipal Bond Fund
Performance Overview (continued)
Performance of a Hypothetical $10,000 Investment (November 1, 2003 – October 31, 2013)
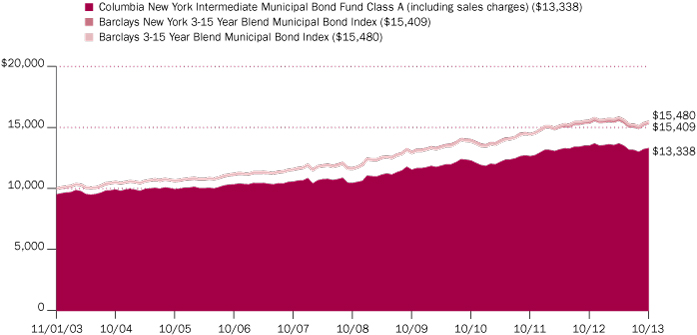
The chart above shows the change in value of a hypothetical $10,000 investment in Class A shares of Columbia New York Intermediate Municipal Bond Fund during the stated time period, and does not reflect the deduction of taxes that a shareholder may pay on Fund distributions or on the redemption of Fund shares. The performance of a $10,000 with sales charge for Class A shares is calculated with an initial sales charge of 4.75%, which was the effective sales charge prior to August 22, 2005.
Annual Report 2013
3
Columbia New York Intermediate Municipal Bond Fund
Manager Discussion of Fund Performance
For the 12-month period that ended October 31, 2013, the Fund's Class A shares returned -1.49% excluding sales charges. The Fund's Class Z shares returned -1.32% for the same time period. By comparison, the Barclays New York 3-15 Year Blend Municipal Bond Index (Barclays NY Index) returned -0.41% and the Barclays 3-15 Year Blend Municipal Bond Index, which is national in scope, returned -0.53% for the 12-month period. The Fund's exposure to issues backed by special non-property taxes and toll facilities-related credits detracted from performance relative to its benchmarks, while exposure to shorter-maturity state appropriated and pre-refunded bonds aided results.
Second Half Rate Rise Pressures Municipal Market
The first half of the Fund's fiscal year was relatively uneventful, with interest rates range bound from November 2012 through April 2013. However, the Federal Reserve's (the Fed's) May announcement that it might begin to taper its monthly securities purchase program, known popularly as QE3 (the QE for "quantitative easing"), drove a sharp sell-off in the municipal market from May through mid-September. During this period, 10-year AAA municipal yields rose to close to 3.00%, matching the yield on the 10-year Treasury. New issue supply was down versus 2012, as higher rates made refinancing less viable. In addition, two major credit events clouded the outlook for municipal bonds: the city of Detroit filed for bankruptcy and Puerto Rico fell sharply on negative economic news. Puerto Rico bonds are widely held in many mutual funds because they are triple tax-free.
Within the Barclays NY Index, returns were slightly positive on one, three and five-year municipal bonds. The worst returns were generated by bonds in the 12-17 year range. A rated bonds posted slightly better returns than higher quality AA and AAA rated bonds, due to the additional yield they generated. BBB rated bonds were the worst performers, dragged down by Puerto Rico exposure.
Duration Positioning Hampers Fund Results
Early in the period, we kept the Fund's duration (sensitivity to interest rates) moderately long relative to the Barclays NY Index, because we did not expect interest rates to rise significantly. However, after the Fed's announced plan to wind down its monthly asset purchases, which sent interest rates sharply higher and spurred outflows from municipal bond funds, we sold bonds purchased at lower yields and sub-5% coupon bonds, which we expected to remain out of favor. We also reduced the portfolio's duration to protect against a protracted rise in interest rates. As a result of these actions, we realized losses to offset gains from previous activity. This allowed us to manage the gain/loss position of the Fund and not distribute taxable capital gains. Selling bonds purchased in lower interest rate environments also improved the distribution yield of the Fund. The Fund currently has a yield above that of the Barclays NY Index, which was achieved by overweighting higher yielding A and BBB rated issues.
Contributors and Detractors
The Fund had more exposure than the Barclays NY Index to shorter maturity state-appropriated and pre-refunded bonds, which made positive contributions to performance in a period in which most areas of the market generated negative results. Pre-refunding bonds are issued to fund another callable bond, taking the proceeds from the lower yielding bond and investing it in Treasuries until the
Portfolio Management
Brian McGreevy
Paul Fuchs, CFA
Quality Breakdown (%)
(at October 31, 2013) | |
AAA rating | | | 4.6 | | |
AA rating | | | 37.7 | | |
A rating | | | 41.5 | | |
BBB rating | | | 14.2 | | |
Non-investment grade | | | 0.9 | | |
Not rated | | | 1.1 | | |
Total | | | 100.0 | | |
Percentages indicated are based upon total fixed income securities (excluding Money Market Funds).
Bond ratings apply to the underlying holdings of the Fund and not the Fund itself and are divided into categories ranging from AAA (highest) to D (lowest), and are subject to change. The ratings shown are determined by using the middle rating of Moody's, S&P, and Fitch after dropping the highest and lowest available ratings. When a rating from only two agencies is available, the lower rating is used. When a rating from only one agency is available, that rating is used. When a bond is not rated by one of these agencies, it is designated as Not rated. Credit ratings are subjective opinions and not statements of fact.
Investment Risks
There are risks associated with an investment in a municipal bond fund, including credit risk, interest rate risk, prepayment and extension risk, and geographic concentration risk. In general, bond prices rise when interest rates fall and vice versa. This effect is more pronounced for longer-term securities. Because the Fund concentrates its investments in municipal securities issued by a single state and its municipalities, specific events or factors affecting a particular state can cause more volatility in the Fund than a fund that is more geographically diversified. Non-investment grade securities, commonly called "high-yield" or "junk" bonds, have more volatile prices and carry more risk to principal and income than investment grade securities. Income from tax-exempt funds may be subject to state and local taxes and a portion of income may be subject to the federal and/or state alternative minimum tax for certain investors. Federal and state income tax rules will apply to any capital gain distributions and any gains or losses on sales. See the Fund's prospectus for information on these and other risks.
Annual Report 2013
4
Columbia New York Intermediate Municipal Bond Fund
Manager Discussion of Fund Performance (continued)
scheduled call date of the original bond occurs. Pre-refunding typically occurs when the issuer can issue a new bond at a lower rate. The Fund's exposure to special non-property and local general obligations-related credits detracted from performance, driven mainly by the timing of purchases and sales and were not driven by credit deterioration.
Slow Recovery for New York in Aftermath of Hurricane Sandy
Deep manufacturing cuts and a slower pace of rebuilding in the aftermath of Hurricane Sandy have resulted in a slower pace of growth for New York's economy since the first quarter of 2013. Employment is currently expanding at a pace that is slower than the national average — and has probably hit a peak. However, New York's unemployment rate is currently only slightly higher than the national rate, because the state rebounded from recession before its neighboring states. At present, we believe wage and output growth will likely be higher than the national average because the state has a highly educated and productive workforce. Yet, job growth may continue to lag the national average over the longer term, held back by the slow pace of population growth, even if the economy gets a boost from an expanding housing market.
Looking Ahead
We currently intend to continue seeking opportunities to add higher-yielding A and BBB rated issues when we can do so with issues that are attractively valued and offer sound fundamentals. We plan to maintain the Fund's neutral duration relative to the Barclays NY Index until there is more clarity around the Fed's intentions and the arrival of a new Fed chairman at the beginning of 2014. Purchases are currently targeted in the eight- to 12-year maturity range, where we see value because we believe the vast majority of yield available in the intermediate space can be captured in this maturity range.
Annual Report 2013
5
Columbia New York Intermediate Municipal Bond Fund
Understanding Your Fund's Expenses
(Unaudited)
As an investor, you incur two types of costs. There are transaction costs, which generally include sales charges on purchases and may include redemption fees. There are also ongoing costs, which generally include management fees, distribution and service (Rule 12b-1) fees, and other fund expenses. The following information is intended to help you understand your ongoing costs (in dollars) of investing in the Fund and to help you compare these costs with the ongoing costs of investing in other mutual funds.
Analyzing Your Fund's Expenses
To illustrate these ongoing costs, we have provided examples and calculated the expenses paid by investors in each share class of the Fund during the period. The actual and hypothetical information in the table is based on an initial investment of $1,000 at the beginning of the period indicated and held for the entire period. Expense information is calculated two ways and each method provides you with different information. The amount listed in the "Actual" column is calculated using the Fund's actual operating expenses and total return for the period. You may use the Actual information, together with the amount invested, to estimate the expenses that you paid over the period. Simply divide your account value by $1,000 (for example, an $8,600 account value divided by $1,000 = 8.6), then multiply the results by the expenses paid during the period under the Actual column. The amount listed in the "Hypothetical" column assumes a 5% annual rate of return before expenses (which is not the Fund's actual return) and then applies the Fund's actual expense ratio for the period to the hypothetical return. You should not use the hypothetical account values and expenses to estimate either your actual account balance at the end of the period or the expenses you paid during the period. See "Compare With Other Funds" below for details on how to use the hypothetical data.
Compare With Other Funds
Since all mutual funds are required to include the same hypothetical calculations about expenses in shareholder reports, you can use this information to compare the ongoing cost of investing in the Fund with other funds. To do so, compare the hypothetical example with the 5% hypothetical examples that appear in the shareholder reports of other funds. As you compare hypothetical examples of other funds, it is important to note that hypothetical examples are meant to highlight the ongoing costs of investing in a fund only and do not reflect any transaction costs, such as sales charges, or redemption or exchange fees. Therefore, the hypothetical calculations are useful in comparing ongoing costs only, and will not help you determine the relative total costs of owning different funds. If transaction costs were included in these calculations, your costs would be higher.
May 1, 2013 – October 31, 2013
| | Account Value at the Beginning
of the Period ($) | | Account Value at the End of the
Period ($) | | Expenses Paid During the
Period ($) | | Fund's Annualized
Expense Ratio (%) | |
| | Actual | | Hypothetical | | Actual | | Hypothetical | | Actual | | Hypothetical | | Actual | |
Class A | | | 1,000.00 | | | | 1,000.00 | | | | 973.40 | | | | 1,021.42 | | | | 3.73 | | | | 3.82 | | | | 0.75 | | |
Class B | | | 1,000.00 | | | | 1,000.00 | | | | 969.80 | | | | 1,017.64 | | | | 7.45 | | | | 7.63 | | | | 1.50 | | |
Class C | | | 1,000.00 | | | | 1,000.00 | | | | 972.30 | | | | 1,019.41 | | | | 5.72 | | | | 5.85 | | | | 1.15 | | |
Class R4 | | | 1,000.00 | | | | 1,000.00 | | | | 975.40 | | | | 1,022.68 | | | | 2.49 | | | | 2.55 | | | | 0.50 | | |
Class T | | | 1,000.00 | | | | 1,000.00 | | | | 973.90 | | | | 1,021.93 | | | | 3.23 | | | | 3.31 | | | | 0.65 | | |
Class Z | | | 1,000.00 | | | | 1,000.00 | | | | 974.60 | | | | 1,022.68 | | | | 2.49 | | | | 2.55 | | | | 0.50 | | |
Expenses paid during the period are equal to the annualized expense ratio for each class as indicated above, multiplied by the average account value over the period and then multiplied by the number of days in the Fund's most recent fiscal half year and divided by 365.
Expenses do not include fees and expenses incurred indirectly by the Fund from the underlying funds in which the Fund may invest (also referred to as "acquired funds"), including affiliated and non-affiliated pooled investment vehicles (including mutual funds and exchange-traded funds).
Had Columbia Management Investment Advisers, LLC and/or certain of its affiliates not waived/reimbursed certain fees and expenses, account value at the end of the period would have been reduced.
Annual Report 2013
6
Columbia New York Intermediate Municipal Bond Fund
Portfolio of Investments
October 31, 2013
(Percentages represent value of investments compared to net assets)
Municipal Bonds 97.7%
Issue
Description | | Coupon
Rate | | Principal
Amount ($) | |
Value ($) | |
Disposal 2.3% | |
Babylon Industrial Development Agency
Revenue Bonds
Covanta Babylon, Inc.
Series 2009A
01/01/18 | | | 5.000 | % | | | 3,500,000 | | | | 3,955,105 | | |
Oneida-Herkimer Solid Waste Management Authority
Revenue Bonds
Series 2011
04/01/19 | | | 5.000 | % | | | 830,000 | | | | 945,345 | | |
04/01/20 | | | 5.000 | % | | | 870,000 | | | | 988,251 | | |
Total | | | | | | | 5,888,701 | | |
Higher Education 10.9% | |
Dutchess County Local Development Corp.
Refunding Revenue Bonds
Marist College Project
Series 2012A
07/01/20 | | | 5.000 | % | | | 1,055,000 | | | | 1,230,109 | | |
Geneva Development Corp.
Refunding Revenue Bonds
Hobart & William Smith College
Series 2012
09/01/24 | | | 5.000 | % | | | 600,000 | | | | 674,310 | | |
09/01/25 | | | 5.000 | % | | | 300,000 | | | | 332,082 | | |
New York State Dormitory Authority
Revenue Bonds
Barnard College
Series 2007A (NPFGC)
07/01/18 | | | 5.000 | % | | | 1,745,000 | | | | 1,972,792 | | |
Cornell University
Series 2006A
07/01/21 | | | 5.000 | % | | | 2,350,000 | | | | 2,604,505 | | |
Series 2009A
07/01/25 | | | 5.000 | % | | | 1,000,000 | | | | 1,154,910 | | |
Culinary Institute of America
Series 2012
07/01/28 | | | 5.000 | % | | | 500,000 | | | | 516,295 | | |
Mount Sinai School of Medicine
Series 2009
07/01/27 | | | 5.500 | % | | | 4,000,000 | | | | 4,322,360 | | |
Series 2010A
07/01/21 | | | 5.000 | % | | | 1,000,000 | | | | 1,139,790 | | |
New York University
Series 1998A (NPFGC)
07/01/17 | | | 6.000 | % | | | 2,475,000 | | | | 2,943,121 | | |
07/01/20 | | | 5.750 | % | | | 2,000,000 | | | | 2,457,480 | | |
Series 2001-1 (AMBAC)
07/01/15 | | | 5.500 | % | | | 1,205,000 | | | | 1,303,810 | | |
Rochester Institute of Technology
Series 2010
07/01/21 | | | 5.000 | % | | | 1,000,000 | | | | 1,142,410 | | |
Municipal Bonds (continued)
Issue
Description | | Coupon
Rate | | Principal
Amount ($) | |
Value ($) | |
St. John's University
Series 2012A
07/01/27 | | | 5.000 | % | | | 470,000 | | | | 505,899 | | |
Teachers College
Series 2009
03/01/24 | | | 5.000 | % | | | 1,000,000 | | | | 1,089,800 | | |
Oneida County Industrial Development Agency(a)
Revenue Bonds
Hamilton College Project
Series 2007A (NPFGC)
07/01/18 | | | 0.000 | % | | | 1,000,000 | | | | 911,520 | | |
07/01/20 | | | 0.000 | % | | | 1,000,000 | | | | 813,730 | | |
St. Lawrence County Industrial Development Agency
Revenue Bonds
St. Lawrence University
Series 2009A
10/01/16 | | | 5.000 | % | | | 3,000,000 | | | | 3,329,640 | | |
Total | | | | | | | 28,444,563 | | |
Hospital 11.7% | |
Albany Industrial Development Agency
Revenue Bonds
St. Peters Hospital Project
Series 2008A
11/15/22 | | | 5.750 | % | | | 500,000 | | | | 556,965 | | |
11/15/27 | | | 5.250 | % | | | 1,000,000 | | | | 1,048,930 | | |
Series 2008E
11/15/22 | | | 5.250 | % | | | 500,000 | | | | 543,060 | | |
County of Saratoga
Revenue Bonds
Saratoga Hospital Project
Series 2013-A
12/01/24 | | | 5.000 | % | | | 1,085,000 | | | | 1,211,001 | | |
12/01/25 | | | 5.000 | % | | | 1,115,000 | | | | 1,229,288 | | |
12/01/27 | | | 5.000 | % | | | 1,225,000 | | | | 1,314,388 | | |
Monroe County Industrial Development Agency
Refunding Revenue Bonds
Highland Hospital of Rochester
Series 2005
08/01/22 | | | 5.000 | % | | | 700,000 | | | | 735,329 | | |
Nassau County Local Economic Assistance Corp.
Refunding Revenue Bonds
Catholic Health Services
Series 2011
07/01/19 | | | 5.000 | % | | | 1,840,000 | | | | 2,113,056 | | |
07/01/20 | | | 5.000 | % | | | 2,815,000 | | | | 3,229,734 | | |
New York State Dormitory Authority
Revenue Bonds
Long Island Jewish Obligated Group
Series 2006A
11/01/19 | | | 5.000 | % | | | 1,000,000 | | | | 1,081,660 | | |
The accompanying Notes to Financial Statements are an integral part of this statement.
Annual Report 2013
7
Columbia New York Intermediate Municipal Bond Fund
Portfolio of Investments (continued)
October 31, 2013
Municipal Bonds (continued)
Issue
Description | | Coupon
Rate | | Principal
Amount ($) | |
Value ($) | |
Memorial Sloan-Kettering Cancer Center
Series 2012
07/01/27 | | | 5.000 | % | | | 500,000 | | | | 548,755 | | |
Mount Sinai Hospital
Series 2010A
07/01/26 | | | 5.000 | % | | | 1,725,000 | | | | 1,852,132 | | |
Series 2011A
07/01/31 | | | 5.000 | % | | | 2,000,000 | | | | 2,038,120 | | |
New York Methodist Hospital
Series 2004
07/01/24 | | | 5.250 | % | | | 1,000,000 | | | | 1,011,450 | | |
New York University Hospital Center
Series 2006A
07/01/20 | | | 5.000 | % | | | 3,000,000 | | | | 3,253,590 | | |
Series 2011A
07/01/23 | | | 5.125 | % | | | 1,000,000 | | | | 1,103,650 | | |
North Shore-Long Island Jewish Obligation Group
Series 2009A
05/01/30 | | | 5.250 | % | | | 4,000,000 | | | | 4,166,480 | | |
Orange Regional Medical Center
Series 2008
12/01/29 | | | 6.125 | % | | | 1,350,000 | | | | 1,358,384 | | |
United Health Services Hospitals
Series 2009 (FHA)
08/01/18 | | | 4.500 | % | | | 1,000,000 | | | | 1,082,040 | | |
Saratoga County Industrial Development Agency
Revenue Bonds
Saratoga Hospital Project
Series 2007B
12/01/22 | | | 5.000 | % | | | 500,000 | | | | 526,845 | | |
12/01/27 | | | 5.125 | % | | | 500,000 | | | | 512,860 | | |
Total | | | | | | | 30,517,717 | | |
Investor Owned 1.1% | |
New York State Energy Research & Development
Authority
Revenue Bonds
Rochester Gas & Electric Corp.
Series 2004A (NPFGC)(b)
05/15/32 | | | 4.750 | % | | | 2,650,000 | | | | 2,857,654 | | |
Local Appropriation 1.1% | |
New York State Dormitory Authority
Revenue Bonds
Municipal Health Facilities
Subordinated Series 2001-2
01/15/21 | | | 5.000 | % | | | 2,500,000 | | | | 2,809,900 | | |
Local General Obligation 13.7% | |
City of New York
Unlimited General Obligation Bonds
Series 2005G
08/01/16 | | | 5.250 | % | | | 500,000 | | | | 564,805 | | |
Series 2007C
01/01/15 | | | 5.000 | % | | | 4,000,000 | | | | 4,221,680 | | |
Municipal Bonds (continued)
Issue
Description | | Coupon
Rate | | Principal
Amount ($) | |
Value ($) | |
Series 2007D-1
12/01/21 | | | 5.000 | % | | | 2,000,000 | | | | 2,283,900 | | |
Subordinated Series 2008I-1
02/01/23 | | | 5.000 | % | | | 2,000,000 | | | | 2,249,680 | | |
Unlimited General Obligation Refunding Bonds
Series 2007D
02/01/24 | | | 5.000 | % | | | 2,000,000 | | | | 2,232,020 | | |
City of Utica
Refunding Limited General Obligation Bonds
Public Improvement
Series 2013
04/01/18 | | | 4.000 | % | | | 1,515,000 | | | | 1,626,216 | | |
04/01/19 | | | 4.000 | % | | | 1,575,000 | | | | 1,683,911 | | |
City of Yonkers
Refunding Limited General Obligation Bonds
Series 2012-A
07/01/18 | | | 4.000 | % | | | 2,000,000 | | | | 2,178,320 | | |
Unrefunded Unlimited General Obligation Bonds
Series 2005B (NPFGC)
08/01/21 | | | 5.000 | % | | | 1,825,000 | | | | 1,885,864 | | |
08/01/22 | | | 5.000 | % | | | 1,920,000 | | | | 1,978,099 | | |
County of Albany
Unlimited General Obligation Bonds
Series 2006 (XLCA)
09/15/20 | | | 4.125 | % | | | 1,000,000 | | | | 1,069,360 | | |
County of Erie
Limited General Obligation Bonds
Public Improvement
Series 2012A
04/01/24 | | | 5.000 | % | | | 640,000 | | | | 721,133 | | |
04/01/25 | | | 5.000 | % | | | 500,000 | | | | 557,060 | | |
County of Monroe
Unlimited General Obligation Refunding & Public
Improvement Bonds
Series 1996 (NPFGC)
03/01/16 | | | 6.000 | % | | | 1,210,000 | | | | 1,335,308 | | |
County of Nassau
Unlimited General Obligation Improvement Bonds
Series 2010A
04/01/18 | | | 4.000 | % | | | 1,340,000 | | | | 1,487,226 | | |
County of Suffolk
Limited General Obligation Refunding Bonds
Series 2012A
04/01/20 | | | 5.000 | % | | | 1,680,000 | | | | 1,907,925 | | |
Newark Central School District
Unlimited General Obligation Refunding Bonds
Series 2012
06/15/18 | | | 5.000 | % | | | 2,100,000 | | | | 2,419,095 | | |
Ramapo Local Development Corp.
Refunding Revenue Bonds
Guaranteed
Series 2013
03/15/28 | | | 5.000 | % | | | 2,180,000 | | | | 2,306,941 | | |
The accompanying Notes to Financial Statements are an integral part of this statement.
Annual Report 2013
8
Columbia New York Intermediate Municipal Bond Fund
Portfolio of Investments (continued)
October 31, 2013
Municipal Bonds (continued)
Issue
Description | | Coupon
Rate | | Principal
Amount ($) | |
Value ($) | |
Sachem Central School District
Unlimited General Obligation Refunding Bonds
Series 2006 (NPFGC)
10/15/24 | | | 4.250 | % | | | 1,000,000 | | | | 1,034,380 | | |
Sullivan West Central School District
Unlimited General Obligation Refunding Bonds
Series 2012
04/15/23 | | | 5.000 | % | | | 565,000 | | | | 657,711 | | |
Three Village Central School District
Unlimited General Obligation Refunding Bonds
Series 2005 (NPFGC)
06/01/18 | | | 5.000 | % | | | 1,000,000 | | | | 1,174,440 | | |
Total | | | | | | | 35,575,074 | | |
Multi-Family 1.5% | |
New York State Dormitory Authority
Revenue Bonds
Residential Institution for Children
Series 2008-A1
06/01/33 | | | 5.000 | % | | | 1,700,000 | | | | 1,762,560 | | |
Tompkins County Development Corp.
Revenue Bonds
Tompkins Cortland Community College
Series 2013
07/01/17 | | | 5.000 | % | | | 1,005,000 | | | | 1,095,450 | | |
07/01/18 | | | 5.000 | % | | | 1,045,000 | | | | 1,149,719 | | |
Total | | | | | | | 4,007,729 | | |
Municipal Power 2.6% | |
Long Island Power Authority
Revenue Bonds
General
Series 2011A
05/01/21 | | | 5.000 | % | | | 1,000,000 | | | | 1,124,200 | | |
Series 2009A
04/01/21 | | | 5.250 | % | | | 1,000,000 | | | | 1,113,640 | | |
04/01/22 | | | 5.500 | % | | | 3,000,000 | | | | 3,371,820 | | |
Series 2012B
09/01/26 | | | 5.000 | % | | | 1,000,000 | | | | 1,075,020 | | |
Total | | | | | | | 6,684,680 | | |
Nursing Home 1.6% | |
Rensselaer Municipal Leasing Corp.
Revenue Bonds
Rensselaer County Nursing Home
Series 2009A
06/01/19 | | | 5.000 | % | | | 4,000,000 | | | | 4,063,040 | | |
Other Bond Issue 1.4% | |
New York City Industrial Development Agency
Revenue Bonds
United Jewish Appeal Federal Project
Series 2004A
07/01/27 | | | 5.000 | % | | | 625,000 | | | | 638,812 | | |
Municipal Bonds (continued)
Issue
Description | | Coupon
Rate | | Principal
Amount ($) | |
Value ($) | |
New York Liberty Development Corp.
Refunding Revenue Bonds
4 World Trade Center Project
Series 2011
11/15/31 | | | 5.000 | % | | | 2,350,000 | | | | 2,430,088 | | |
Westchester County Industrial Development Agency
Revenue Bonds
Guiding Eyes for the Blind
Series 2004
08/01/24 | | | 5.375 | % | | | 465,000 | | | | 477,695 | | |
Total | | | | | | | 3,546,595 | | |
Pool/Bond Bank 6.6% | |
New York Municipal Bond Bank Agency
Revenue Bonds
Subordinated Series 2009C-1
02/15/18 | | | 5.000 | % | | | 3,000,000 | | | | 3,444,990 | | |
New York State Dormitory Authority
Revenue Bonds
School Districts Financing Program
Series 2008A (AGM)
10/01/23 | | | 5.000 | % | | | 3,000,000 | | | | 3,412,020 | | |
Series 2009C (AGM)
10/01/22 | | | 5.000 | % | | | 3,000,000 | | | | 3,391,980 | | |
Series 2012B
10/01/26 | | | 5.000 | % | | | 3,000,000 | | | | 3,314,220 | | |
New York State Environmental Facilities Corp.
Revenue Bonds
Revolving Funds-Municipal Water
Series 2008B
06/15/21 | | | 5.000 | % | | | 3,000,000 | | | | 3,460,770 | | |
Total | | | | | | | 17,023,980 | | |
Ports 2.0% | |
Port Authority of New York & New Jersey
Revenue Bonds
Consolidated 135th
Series 2004 (XLCA)
09/15/28 | | | 5.000 | % | | | 1,500,000 | | | | 1,533,090 | | |
Consolidated 161st
Series 2009
10/15/31 | | | 5.000 | % | | | 3,390,000 | | | | 3,689,168 | | |
Total | | | | | | | 5,222,258 | | |
Prep School 0.4% | |
Build NYC Resource Corp.
Revenue Bonds
International Leadership Charter School
Series 2013
07/01/23 | | | 5.000 | % | | | 1,000,000 | | | | 948,450 | | |
The accompanying Notes to Financial Statements are an integral part of this statement.
Annual Report 2013
9
Columbia New York Intermediate Municipal Bond Fund
Portfolio of Investments (continued)
October 31, 2013
Municipal Bonds (continued)
Issue
Description | | Coupon
Rate | | Principal
Amount ($) | |
Value ($) | |
Recreation 3.5% | |
Build NYC Resource Corp.
Revenue Bonds
YMCA of Greater NY Project
Series 2012
08/01/32 | | | 5.000 | % | | | 500,000 | | | | 510,625 | | |
New York City Industrial Development Agency
Revenue Bonds
Pilot-Queens Baseball Stadium
Series 2006 (AMBAC)
01/01/19 | | | 5.000 | % | | | 850,000 | | | | 873,469 | | |
Pilot-Yankee Stadium
Series 2006 (NPFGC)
03/01/15 | | | 5.000 | % | | | 1,150,000 | | | | 1,207,960 | | |
YMCA of Greater New York Project
Series 2006
08/01/26 | | | 5.000 | % | | | 1,000,000 | | | | 1,026,480 | | |
New York City Trust for Cultural Resources
Refunding Revenue Bonds
Museum of Modern Art
Series 2008-1A
04/01/26 | | | 5.000 | % | | | 4,850,000 | | | | 5,434,473 | | |
Total | | | | | | | 9,053,007 | | |
Refunded/Escrowed 8.9% | |
City of New York
Prerefunded 12/01/14 Unlimited General Obligation
Bonds
Series 2004-G
12/01/19 | | | 5.000 | % | | | 1,145,000 | | | | 1,204,551 | | |
City of Yonkers
Prerefunded Unlimited General Obligation Bonds
Series 2005B (NPFGC)
08/01/21 | | | 5.000 | % | | | 600,000 | | | | 649,068 | | |
08/01/22 | | | 5.000 | % | | | 625,000 | | | | 676,113 | | |
Elizabeth Forward School District
Unlimited General Obligation Bonds
Capital Appreciation
Series 1994B Escrowed to Maturity (NPFGC)(a)
09/01/20 | | | 0.000 | % | | | 2,210,000 | | | | 1,904,755 | | |
Metropolitan Transportation Authority
Prerefunded 10/01/15 Revenue Bonds
Series 1998A (FGIC)
04/01/23 | | | 5.000 | % | | | 2,000,000 | | | | 2,178,700 | | |
Nassau County Interim Finance Authority
Prerefunded 11/15/14 Revenue Bonds
Sales Tax Secured
Series 2004H (AMBAC)
11/15/15 | | | 5.250 | % | | | 2,500,000 | | | | 2,631,300 | | |
Municipal Bonds (continued)
Issue
Description | | Coupon
Rate | | Principal
Amount ($) | |
Value ($) | |
New York State Dormitory Authority
Prerefunded 08/15/14 Revenue Bonds
Presbyterian Hospital
Series 2007 (AGM)
08/15/23 | | | 5.250 | % | | | 250,000 | | | | 259,998 | | |
New York State Dormitory Authority(a)
Revenue Bonds
Capital Appreciation-Memorial Sloan-Kettering Cancer Center
Series 2003-1 Escrowed to Maturity (NPFGC)
07/01/25 | | | 0.000 | % | | | 3,750,000 | | | | 2,614,725 | | |
Onondaga County Water Authority
Revenue Bonds
General
Series 2005A (AMBAC)
09/15/22 | | | 5.000 | % | | | 895,000 | | | | 972,605 | | |
09/15/23 | | | 5.000 | % | | | 940,000 | | | | 1,021,507 | | |
Puerto Rico Highways & Transportation Authority
Revenue Bonds
Series 2005BB (AGM) Escrowed to Maturity(c)
07/01/22 | | | 5.250 | % | | | 355,000 | | | | 437,335 | | |
Triborough Bridge & Tunnel Authority
Prerefunded 01/01/22 Revenue Bonds
General Purpose
Series 1999B
01/01/30 | | | 5.500 | % | | | 2,000,000 | | | | 2,489,140 | | |
Revenue Bonds
General Purpose
Series 1992Y Escrowed to Maturity
01/01/17 | | | 5.500 | % | | | 1,450,000 | | | | 1,569,799 | | |
Series 2006A
11/15/19 | | | 5.000 | % | | | 2,000,000 | | | | 2,267,040 | | |
Series 2008A
11/15/21 | | | 5.000 | % | | | 2,000,000 | | | | 2,355,980 | | |
Total | | | | | | | 23,232,616 | | |
Retirement Communities 0.7% | |
New York State Dormitory Authority
Revenue Bonds
Miriam Osborn Memorial Home Association
Series 2012
07/01/26 | | | 5.000 | % | | | 740,000 | | | | 774,861 | | |
07/01/27 | | | 5.000 | % | | | 700,000 | | | | 723,660 | | |
Suffolk County Industrial Development Agency
Refunding Revenue Bonds
Jeffersons Ferry Project
Series 2006
11/01/28 | | | 5.000 | % | | | 335,000 | | | | 341,724 | | |
Total | | | | | | | 1,840,245 | | |
The accompanying Notes to Financial Statements are an integral part of this statement.
Annual Report 2013
10
Columbia New York Intermediate Municipal Bond Fund
Portfolio of Investments (continued)
October 31, 2013
Municipal Bonds (continued)
Issue
Description | | Coupon
Rate | | Principal
Amount ($) | |
Value ($) | |
Special Non Property Tax 9.0% | |
Metropolitan Transportation Authority
Revenue Bonds
Series 2004A (NPFGC)
11/15/18 | | | 5.250 | % | | | 800,000 | | | | 952,472 | | |
New York City Transitional Finance Authority Building Aid
Revenue Bonds
Series 2007S-2 (NPFGC)
01/15/21 | | | 5.000 | % | | | 4,300,000 | | | | 4,786,545 | | |
New York City Transitional Finance Authority
Revenue Bonds
Future Tax Secured
Series 2009A-1
05/01/27 | | | 5.000 | % | | | 5,000,000 | | | | 5,605,900 | | |
New York State Dormitory Authority
Refunding Revenue Bonds
Education
Series 2005B (AMBAC)
03/15/26 | | | 5.500 | % | | | 1,000,000 | | | | 1,233,420 | | |
New York State Housing Finance Agency
Revenue Bonds
Series 2008A
09/15/19 | | | 5.000 | % | | | 1,400,000 | | | | 1,594,712 | | |
New York State Thruway Authority
Prerefunded 04/01/15 Revenue Bonds
Series 2005A (NPFGC)
04/01/22 | | | 5.000 | % | | | 500,000 | | | | 533,345 | | |
Revenue Bonds
Series 2008A
04/01/21 | | | 5.000 | % | | | 1,000,000 | | | | 1,145,530 | | |
Transportation
Series 2007A
03/15/22 | | | 5.000 | % | | | 1,000,000 | | | | 1,140,830 | | |
Puerto Rico Infrastructure Financing Authority
Refunding Revenue Bonds
Series 2005C (FGIC)(c)
07/01/22 | | | 5.500 | % | | | 2,250,000 | | | | 1,737,270 | | |
Virgin Islands Public Finance Authority(c)
Refunding Revenue Bonds
Series 2013B
10/01/24 | | | 5.000 | % | | | 1,740,000 | | | | 1,857,676 | | |
Revenue Bonds
Senior Lien-Matching Fund Loan Note
Series 2010A
10/01/25 | | | 5.000 | % | | | 2,755,000 | | | | 2,895,312 | | |
Total | | | | | | | 23,483,012 | | |
Municipal Bonds (continued)
Issue
Description | | Coupon
Rate | | Principal
Amount ($) | |
Value ($) | |
State Appropriated 8.4% | |
Erie County Industrial Development Agency (The)
Revenue Bonds
School District of Buffalo Project
Series 2008A (AGM)
05/01/18 | | | 5.000 | % | | | 1,000,000 | | | | 1,162,370 | | |
Series 2011A
05/01/30 | | | 5.250 | % | | | 1,440,000 | | | | 1,545,034 | | |
New York State Dormitory Authority
Refunding Revenue Bonds
Consolidated Service Contract
Series 2009A
07/01/24 | | | 5.000 | % | | | 3,000,000 | | | | 3,386,190 | | |
Revenue Bonds
Schools Program
Series 2000
07/01/20 | | | 6.250 | % | | | 1,385,000 | | | | 1,391,939 | | |
Series 2009
02/15/18 | | | 5.500 | % | | | 1,000,000 | | | | 1,180,950 | | |
State University Educational Facilities
3rd General Series 2005A (NPFGC)
05/15/21 | | | 5.500 | % | | | 1,000,000 | | | | 1,209,550 | | |
Series 1993A
05/15/15 | | | 5.250 | % | | | 2,000,000 | | | | 2,081,740 | | |
05/15/19 | | | 5.500 | % | | | 2,500,000 | | | | 2,898,225 | | |
Series 2000C (AGM)
05/15/17 | | | 5.750 | % | | | 1,250,000 | | | | 1,458,562 | | |
New York State Urban Development Corp.
Refunding Revenue Bonds
Service Contract
Series 2008B
01/01/26 | | | 5.000 | % | | | 3,125,000 | | | | 3,404,656 | | |
Series 2008C
01/01/22 | | | 5.000 | % | | | 2,000,000 | | | | 2,243,980 | | |
Total | | | | | | | 21,963,196 | | |
Transportation 5.9% | |
Metropolitan Transportation Authority
Revenue Bonds
Series 2005B (AMBAC)
11/15/24 | | | 5.250 | % | | | 750,000 | | | | 877,755 | | |
Series 2006 (CIFG/TCRS)
11/15/22 | | | 5.000 | % | | | 2,280,000 | | | | 2,539,008 | | |
Series 2006B
11/15/16 | | | 5.000 | % | | | 1,500,000 | | | | 1,691,850 | | |
Series 2007B
11/15/22 | | | 5.000 | % | | | 1,500,000 | | | | 1,687,425 | | |
Series 2008C
11/15/23 | | | 6.250 | % | | | 3,570,000 | | | | 4,223,881 | | |
Series 2010D
11/15/28 | | | 5.250 | % | | | 3,000,000 | | | | 3,247,140 | | |
The accompanying Notes to Financial Statements are an integral part of this statement.
Annual Report 2013
11
Columbia New York Intermediate Municipal Bond Fund
Portfolio of Investments (continued)
October 31, 2013
Municipal Bonds (continued)
Issue
Description | | Coupon
Rate | | Principal
Amount ($) | |
Value ($) | |
Metropolitan Transportation Authority(b)
Revenue Bonds
Mandatory Tender
Series 2008B
11/15/30 | | | 5.000 | % | | | 1,000,000 | | | | 1,046,890 | | |
Total | | | | | | | 15,313,949 | | |
Turnpike/Bridge/Toll Road 3.5% | |
New York State Thruway Authority
Revenue Bonds
General Revenue
Series 2012I
01/01/23 | | | 5.000 | % | | | 3,000,000 | | | | 3,492,990 | | |
Niagara Falls Bridge Commission
Revenue Bonds
Bridge System
Series 1993A (AGM)
10/01/19 | | | 4.000 | % | | | 2,000,000 | | | | 2,165,080 | | |
Triborough Bridge & Tunnel Authority
Refunding Revenue Bonds
General Purpose
Series 2011A
01/01/25 | | | 5.000 | % | | | 3,000,000 | | | | 3,422,280 | | |
Total | | | | | | | 9,080,350 | | |
Water & Sewer 0.9% | |
Rensselaer County Water Service & Sewer Authority
Revenue Bonds
Sewer Service
Series 2008
09/01/28 | | | 5.100 | % | | | 1,155,000 | | | | 1,223,168 | | |
Municipal Bonds (continued)
Issue
Description | | Coupon
Rate | | Principal
Amount ($) | |
Value ($) | |
Water Service
Series 2008
09/01/28 | | | 5.100 | % | | | 1,060,000 | | | | 1,109,301 | | |
Total | | | | | | | 2,332,469 | | |
Total Municipal Bonds
(Cost: $238,377,261) | | | | | | | 253,889,185 | | |
Money Market Funds 1.3% | |
| | | | | Shares | | Value ($) | |
Dreyfus New York AMT-Free
Municipal Money Market Fund,
0.000%(d) | | | | | 1,533,838 | | | | 1,533,838 | | |
JPMorgan Tax-Free Money Market Fund,
0.010%(d) | | | | | 1,933,404 | | | | 1,933,404 | | |
Total Money Market Funds
(Cost: $3,467,242) | | | | | | | 3,467,242 | | |
Total Investments
(Cost: $241,844,503) | | | | | | | 257,356,427 | | |
Other Assets & Liabilities, Net | | | | | | | 2,730,902 | | |
Net Assets | | | | | | | 260,087,329 | | |
Notes to Portfolio of Investments
(a) Zero coupon bond.
(b) Variable rate security.
(c) Municipal obligations include debt obligations issued by or on behalf of territories, possessions, or sovereign nations within the territorial boundaries of the United States. At October 31, 2013, the value of these securities amounted to $6,927,593 or 2.66% of net assets.
(d) The rate shown is the seven-day current annualized yield at October 31, 2013.
Abbreviation Legend
AGM Assured Guaranty Municipal Corporation
AMBAC Ambac Assurance Corporation
AMT Alternative Minimum Tax
CIFG IXIS Financial Guaranty
FGIC Financial Guaranty Insurance Company
FHA Federal Housing Authority
NPFGC National Public Finance Guarantee Corporation
TCRS Transferable Custodial Receipts
XLCA XL Capital Assurance
The accompanying Notes to Financial Statements are an integral part of this statement.
Annual Report 2013
12
Columbia New York Intermediate Municipal Bond Fund
Portfolio of Investments (continued)
October 31, 2013
Fair Value Measurements
Generally accepted accounting principles (GAAP) require disclosure regarding the inputs and valuation techniques used to measure fair value and any changes in valuation inputs or techniques. In addition, investments shall be disclosed by major category.
The Fund categorizes its fair value measurements according to a three-level hierarchy that maximizes the use of observable inputs and minimizes the use of unobservable inputs by prioritizing that the most observable input be used when available. Observable inputs are those that market participants would use in pricing an investment based on market data obtained from sources independent of the reporting entity. Unobservable inputs are those that reflect the Fund's assumptions about the information market participants would use in pricing an investment. An investment's level within the fair value hierarchy is based on the lowest level of any input that is deemed significant to the asset or liability's fair value measurement. The input levels are not necessarily an indication of the risk or liquidity associated with investments at that level. For example, certain U.S. government securities are generally high quality and liquid, however, they are reflected as Level 2 because the inputs used to determine fair value may not always be quoted prices in an active market.
Fair value inputs are summarized in the three broad levels listed below:
> Level 1 — Valuations based on quoted prices for investments in active markets that the Fund has the ability to access at the measurement date (including NAV for open-end mutual funds). Valuation adjustments are not applied to Level 1 investments.
> Level 2 — Valuations based on other significant observable inputs (including quoted prices for similar securities, interest rates, prepayment speeds, credit risks, etc.).
> Level 3 — Valuations based on significant unobservable inputs (including the Fund's own assumptions and judgment in determining the fair value of investments).
Inputs that are used in determining fair value of an investment may include price information, credit data, volatility statistics, and other factors. These inputs can be either observable or unobservable. The availability of observable inputs can vary between investments, and is affected by various factors such as the type of investment, and the volume and level of activity for that investment or similar investments in the marketplace. The inputs will be considered by the Investment Manager, along with any other relevant factors in the calculation of an investment's fair value. The Fund uses prices and inputs that are current as of the measurement date, which may include periods of market dislocations. During these periods, the availability of prices and inputs may be reduced for many investments. This condition could cause an investment to be reclassified between the various levels within the hierarchy.
Investments falling into the Level 3 category are primarily supported by quoted prices from brokers and dealers participating in the market for those investments. However, these may be classified as Level 3 investments due to lack of market transparency and corroboration to support these quoted prices. Additionally, valuation models may be used as the pricing source for any remaining investments classified as Level 3. These models may rely on one or more significant unobservable inputs and/or significant assumptions by the Investment Manager. Inputs used in valuations may include, but are not limited to, financial statement analysis, capital account balances, discount rates and estimated cash flows, and comparable company data.
Under the direction of the Fund's Board of Trustees (the Board), the Investment Manager's Valuation Committee (the Committee) is responsible for carrying out the valuation procedures approved by the Board. The Committee consists of voting and non-voting members from various groups within the Investment Manager's organization, including operations and accounting, trading and investments, compliance, risk management and legal.
The Committee meets at least monthly to review and approve valuation matters, which may include a description of specific valuation determinations, data regarding pricing information received from approved pricing vendors and brokers and the results of Board-approved valuation control policies and procedures (the Policies). The Policies address, among other things, instances when market quotations are or are not readily available, including recommendations of third party pricing vendors and a determination of appropriate pricing methodologies; events that require specific valuation determinations and assessment of fair value techniques; securities with a potential for stale pricing, including those that are illiquid, restricted, or in default; and the effectiveness of third-party pricing vendors, including periodic reviews of vendors. The Committee meets more frequently, as needed, to discuss additional valuation matters, which may include the need to review back-testing results, review time-sensitive information or approve related valuation actions. The Committee reports to the Board, with members of the Committee meeting with the Board at each of its regularly scheduled meetings to discuss valuation matters and actions during the period, similar to those described earlier.
For investments categorized as Level 3, the Committee monitors information similar to that described above, which may include: (i) data specific to the issuer or comparable issuers, (ii) general market or specific sector news and (iii) quoted prices and specific or similar security transactions. The Committee considers this data and any changes from prior periods in order to assess the reasonableness of observable and unobservable inputs, any assumptions or internal models used to value those securities and changes in fair value. This data is also used to corroborate, when available, information received from approved pricing vendors and brokers. Various factors impact the frequency of monitoring this information (which may occur as often as daily). However, the Committee may determine that changes to inputs, assumptions and models are not required as a result of the monitoring procedures performed.
The accompanying Notes to Financial Statements are an integral part of this statement.
Annual Report 2013
13
Columbia New York Intermediate Municipal Bond Fund
Portfolio of Investments (continued)
October 31, 2013
Fair Value Measurements (continued)
The following table is a summary of the inputs used to value the Fund's investments at October 31, 2013:
Description | | Level 1
Quoted Prices in Active
Markets for Identical
Assets ($) | | Level 2
Other Significant
Observable Inputs ($) | | Level 3
Significant
Unobservable Inputs ($) | | Total ($) | |
Bonds | |
Municipal Bonds | | | — | | | | 253,889,185 | | | | — | | | | 253,889,185 | | |
Total Bonds | | | — | | | | 253,889,185 | | | | — | | | | 253,889,185 | | |
Mutual Funds | |
Money Market Funds | | | 3,467,242 | | | | — | | | | — | | | | 3,467,242 | | |
Total Mutual Funds | | | 3,467,242 | | | | — | | | | — | | | | 3,467,242 | | |
Total | | | 3,467,242 | | | | 253,889,185 | | | | — | | | | 257,356,427 | | |
See the Portfolio of Investments for all investment classifications not indicated in the table.
The Fund's assets assigned to the Level 2 input category are generally valued using the market approach, in which a security's value is determined through reference to prices and information from market transactions for similar or identical assets.
There were no transfers of financial assets between Levels 1 and 2 during the period.
The accompanying Notes to Financial Statements are an integral part of this statement.
Annual Report 2013
14
Columbia New York Intermediate Municipal Bond Fund
Statement of Assets and Liabilities
October 31, 2013
Assets | |
Investments, at value | |
(identified cost $241,844,503) | | $ | 257,356,427 | | |
Receivable for: | |
Capital shares sold | | | 307,443 | | |
Interest | | | 3,419,151 | | |
Expense reimbursement due from Investment Manager | | | 1,068 | | |
Prepaid expenses | | | 2,821 | | |
Trustees' deferred compensation plan | | | 31,837 | | |
Other assets | | | 3,298 | | |
Total assets | | | 261,122,045 | | |
Liabilities | |
Payable for: | |
Capital shares purchased | | | 169,382 | | |
Dividend distributions to shareholders | | | 747,867 | | |
Investment management fees | | | 2,850 | | |
Distribution and/or service fees | | | 490 | | |
Transfer agent fees | | | 48,227 | | |
Administration fees | | | 497 | | |
Chief compliance officer expenses | | | 22 | | |
Other expenses | | | 33,544 | | |
Trustees' deferred compensation plan | | | 31,837 | | |
Total liabilities | | | 1,034,716 | | |
Net assets applicable to outstanding capital stock | | $ | 260,087,329 | | |
Represented by | |
Paid-in capital | | $ | 246,202,929 | | |
Undistributed net investment income | | | 200,086 | | |
Accumulated net realized loss | | | (1,827,610 | ) | |
Unrealized appreciation (depreciation) on: | |
Investments | | | 15,511,924 | | |
Total — representing net assets applicable to outstanding capital stock | | $ | 260,087,329 | | |
The accompanying Notes to Financial Statements are an integral part of this statement.
Annual Report 2013
15
Columbia New York Intermediate Municipal Bond Fund
Statement of Assets and Liabilities (continued)
October 31, 2013
Class A | |
Net assets | | $ | 18,083,573 | | |
Shares outstanding | | | 1,507,363 | | |
Net asset value per share | | $ | 12.00 | | |
Maximum offering price per share(a) | | $ | 12.40 | | |
Class B | |
Net assets | | $ | 119,090 | | |
Shares outstanding | | | 9,927 | | |
Net asset value per share | | $ | 12.00 | | |
Class C | |
Net assets | | $ | 18,497,927 | | |
Shares outstanding | | | 1,542,050 | | |
Net asset value per share | | $ | 12.00 | | |
Class R4 | |
Net assets | | $ | 44,290 | | |
Shares outstanding | | | 3,695 | | |
Net asset value per share | | $ | 11.99 | | |
Class T | |
Net assets | | $ | 8,318,581 | | |
Shares outstanding | | | 693,538 | | |
Net asset value per share | | $ | 11.99 | | |
Maximum offering price per share(a) | | $ | 12.59 | | |
Class Z | |
Net assets | | $ | 215,023,868 | | |
Shares outstanding | | | 17,927,082 | | |
Net asset value per share | | $ | 11.99 | | |
(a) The maximum offering price per share is calculated by dividing the net asset value per share by 1.0 minus the maximum sales charge of 3.25% for Class A and 4.75% for Class T.
The accompanying Notes to Financial Statements are an integral part of this statement.
Annual Report 2013
16
Columbia New York Intermediate Municipal Bond Fund
Statement of Operations
Year Ended October 31, 2013
Net investment income | |
Income: | |
Dividends | | $ | 209 | | |
Interest | | | 11,485,498 | | |
Total income | | | 11,485,707 | | |
Expenses: | |
Investment management fees | | | 1,233,273 | | |
Distribution and/or service fees | |
Class A | | | 56,141 | | |
Class B | | | 1,488 | | |
Class C | | | 215,466 | | |
Class T | | | 13,346 | | |
Transfer agent fees | |
Class A | | | 42,321 | | |
Class B | | | 280 | | |
Class C | | | 40,580 | | |
Class R4(a) | | | 28 | | |
Class T | | | 16,756 | | |
Class Z | | | 480,720 | | |
Administration fees | | | 212,901 | | |
Compensation of board members | | | 24,438 | | |
Custodian fees | | | 3,683 | | |
Printing and postage fees | | | 18,059 | | |
Registration fees | | | 38,040 | | |
Professional fees | | | 32,476 | | |
Chief compliance officer expenses | | | 205 | | |
Other | | | 10,445 | | |
Total expenses | | | 2,440,646 | | |
Fees waived or expenses reimbursed by Investment Manager and its affiliates | | | (611,524 | ) | |
Fees waived by Distributor — Class C | | | (75,465 | ) | |
Expense reductions | | | (220 | ) | |
Total net expenses | | | 1,753,437 | | |
Net investment income | | | 9,732,270 | | |
Realized and unrealized gain (loss) — net | |
Net realized gain (loss) on: | |
Investments | | | (880,694 | ) | |
Net realized loss | | | (880,694 | ) | |
Net change in unrealized appreciation (depreciation) on: | |
Investments | | | (13,472,817 | ) | |
Net change in unrealized appreciation (depreciation) | | | (13,472,817 | ) | |
Net realized and unrealized loss | | | (14,353,511 | ) | |
Net decrease in net assets from operations | | $ | (4,621,241 | ) | |
(a) For the period from March 19, 2013 (commencement of operations) to October 31, 2013.
The accompanying Notes to Financial Statements are an integral part of this statement.
Annual Report 2013
17
Columbia New York Intermediate Municipal Bond Fund
Statement of Changes in Net Assets
| | | Year Ended
October 31,
2013(a) | | Year Ended
October 31,
2012 | |
Operations | |
Net investment income | | $ | 9,732,270 | | | $ | 10,268,269 | | |
Net realized gain (loss) | | | (880,694 | ) | | | 70,301 | | |
Net change in unrealized appreciation (depreciation) | | | (13,472,817 | ) | | | 11,283,666 | | |
Net increase (decrease) in net assets resulting from operations | | | (4,621,241 | ) | | | 21,622,236 | | |
Distributions to shareholders | |
Net investment income | |
Class A | | | (667,992 | ) | | | (585,150 | ) | |
Class B | | | (3,285 | ) | | | (7,898 | ) | |
Class C | | | (554,310 | ) | | | (497,459 | ) | |
Class R4 | | | (516 | ) | | | — | | |
Class T | | | (273,862 | ) | | | (293,105 | ) | |
Class Z | | | (8,216,843 | ) | | | (8,868,243 | ) | |
Total distributions to shareholders | | | (9,716,808 | ) | | | (10,251,855 | ) | |
Increase (decrease) in net assets from capital stock activity | | | (63,809,691 | ) | | | 28,432,895 | | |
Total increase (decrease) in net assets | | | (78,147,740 | ) | | | 39,803,276 | | |
Net assets at beginning of year | | | 338,235,069 | | | | 298,431,793 | | |
Net assets at end of year | | $ | 260,087,329 | | | $ | 338,235,069 | | |
Undistributed net investment income | | $ | 200,086 | | | $ | 184,624 | | |
(a) Class R4 shares are for the period from March 19, 2013 (commencement of operations) to October 31, 2013.
The accompanying Notes to Financial Statements are an integral part of this statement.
Annual Report 2013
18
Columbia New York Intermediate Municipal Bond Fund
Statement of Changes in Net Assets (continued)
| | | Year Ended October 31, 2013(a) | | Year Ended October 31, 2012 | |
| | | Shares | | Dollars ($) | | Shares | | Dollars ($) | |
Capital stock activity | |
Class A shares | |
Subscriptions(b) | | | 692,122 | | | | 8,554,836 | | | | 819,600 | | | | 10,165,989 | | |
Distributions reinvested | | | 50,672 | | | | 621,116 | | | | 41,739 | | | | 519,633 | | |
Redemptions | | | (969,546 | ) | | | (11,777,896 | ) | | | (402,168 | ) | | | (4,999,941 | ) | |
Net increase (decrease) | | | (226,752 | ) | | | (2,601,944 | ) | | | 459,171 | | | | 5,685,681 | | |
Class B shares | |
Subscriptions | | | 64 | | | | 779 | | | | 6,839 | | | | 83,458 | | |
Distributions reinvested | | | 197 | | | | 2,426 | | | | 399 | | | | 4,955 | | |
Redemptions(b) | | | (9,526 | ) | | | (119,165 | ) | | | (26,003 | ) | | | (321,964 | ) | |
Net decrease | | | (9,265 | ) | | | (115,960 | ) | | | (18,765 | ) | | | (233,551 | ) | |
Class C shares | |
Subscriptions | | | 357,122 | | | | 4,399,629 | | | | 831,018 | | | | 10,306,930 | | |
Distributions reinvested | | | 23,476 | | | | 287,866 | | | | 21,313 | | | | 265,287 | | |
Redemptions | | | (671,942 | ) | | | (8,177,831 | ) | | | (205,083 | ) | | | (2,545,613 | ) | |
Net increase (decrease) | | | (291,344 | ) | | | (3,490,336 | ) | | | 647,248 | | | | 8,026,604 | | |
Class R4 shares | |
Subscriptions | | | 4,311 | | | | 51,883 | | | | — | | | | — | | |
Distributions reinvested | | | 38 | | | | 458 | | | | — | | | | — | | |
Redemptions | | | (654 | ) | | | (7,787 | ) | | | — | | | | — | | |
Net increase | | | 3,695 | | | | 44,554 | | | | — | | | | — | | |
Class T shares | |
Subscriptions | | | 4,793 | | | | 59,442 | | | | 11,199 | | | | 139,650 | | |
Distributions reinvested | | | 14,120 | | | | 172,955 | | | | 14,628 | | | | 181,968 | | |
Redemptions | | | (87,992 | ) | | | (1,080,988 | ) | | | (41,612 | ) | | | (517,853 | ) | |
Net decrease | | | (69,079 | ) | | | (848,591 | ) | | | (15,785 | ) | | | (196,235 | ) | |
Class Z shares | |
Subscriptions | | | 2,524,419 | | | | 31,200,266 | | | | 4,241,040 | | | | 52,669,245 | | |
Distributions reinvested | | | 99,309 | | | | 1,218,622 | | | | 95,680 | | | | 1,190,800 | | |
Redemptions | | | (7,301,211 | ) | | | (89,216,302 | ) | | | (3,114,369 | ) | | | (38,709,649 | ) | |
Net increase (decrease) | | | (4,677,483 | ) | | | (56,797,414 | ) | | | 1,222,351 | | | | 15,150,396 | | |
Total net increase (decrease) | | | (5,270,228 | ) | | | (63,809,691 | ) | | | 2,294,220 | | | | 28,432,895 | | |
(a) Class R4 shares are for the period from March 19, 2013 (commencement of operations) to October 31, 2013.
(b) Includes conversions of Class B shares to Class A shares, if any.
The accompanying Notes to Financial Statements are an integral part of this statement.
Annual Report 2013
19
Columbia New York Intermediate Municipal Bond Fund
The following tables are intended to help you understand the Fund's financial performance. Certain information reflects financial results for a single share of a class held for the periods shown. Per share net investment income (loss) amounts are calculated based on average shares outstanding during the period. Total return assumes reinvestment of all dividends and distributions, if any. Total return does not reflect payment of sales charges, if any, and is not annualized for periods of less than one year.
| | | Year Ended October 31, | |
Class A | | 2013 | | 2012 | | 2011 | | 2010 | | 2009 | |
Per share data | |
Net asset value, beginning of period | | $ | 12.55 | | | $ | 12.10 | | | $ | 12.14 | | | $ | 11.76 | | | $ | 11.03 | | |
Income from investment operations: | |
Net investment income | | | 0.37 | | | | 0.37 | | | | 0.39 | | | | 0.38 | | | | 0.39 | | |
Net realized and unrealized gain (loss) | | | (0.55 | ) | | | 0.45 | | | | (0.04 | ) | | | 0.38 | | | | 0.73 | | |
Total from investment operations | | | (0.18 | ) | | | 0.82 | | | | 0.35 | | | | 0.76 | | | | 1.12 | | |
Less distributions to shareholders: | |
Net investment income | | | (0.37 | ) | | | (0.37 | ) | | | (0.39 | ) | | | (0.38 | ) | | | (0.39 | ) | |
Total distributions to shareholders | | | (0.37 | ) | | | (0.37 | ) | | | (0.39 | ) | | | (0.38 | ) | | | (0.39 | ) | |
Net asset value, end of period | | $ | 12.00 | | | $ | 12.55 | | | $ | 12.10 | | | $ | 12.14 | | | $ | 11.76 | | |
Total return | | | (1.49 | %) | | | 6.84 | % | | | 2.99 | % | | | 6.59 | % | | | 10.30 | % | |
Ratios to average net assets(a) | |
Total gross expenses | | | 0.95 | % | | | 0.99 | % | | | 0.98 | % | | | 0.93 | % | | | 0.91 | % | |
Total net expenses(b) | | | 0.75 | %(c) | | | 0.75 | %(c) | | | 0.76 | %(c) | | | 0.80 | %(c) | | | 0.78 | %(c) | |
Net investment income | | | 2.98 | % | | | 2.97 | % | | | 3.30 | % | | | 3.20 | % | | | 3.39 | % | |
Supplemental data | |
Net assets, end of period (in thousands) | | $ | 18,084 | | | $ | 21,764 | | | $ | 15,431 | | | $ | 12,110 | | | $ | 8,452 | | |
Portfolio turnover | | | 13 | % | | | 7 | % | | | 8 | % | | | 10 | % | | | 20 | % | |
Notes to Financial Highlights
(a) In addition to the fees and expenses which the Fund bears directly, the Fund indirectly bears a pro rata share of the fees and expenses of the acquired funds in which it invests. Such indirect expenses are not included in the reported expense ratios.
(b) Total net expenses include the impact of certain waivers/reimbursements made by the Investment Manager and certain of its affiliates, if applicable.
(c) The benefits derived from expense reductions had an impact of less than 0.01%.
The accompanying Notes to Financial Statements are an integral part of this statement.
Annual Report 2013
20
Columbia New York Intermediate Municipal Bond Fund
Financial Highlights (continued)
| | | Year Ended October 31, | |
Class B | | 2013 | | 2012 | | 2011 | | 2010 | | 2009 | |
Per share data | |
Net asset value, beginning of period | | $ | 12.55 | | | $ | 12.10 | | | $ | 12.14 | | | $ | 11.76 | | | $ | 11.03 | | |
Income from investment operations: | |
Net investment income | | | 0.27 | | | | 0.28 | | | | 0.30 | | | | 0.30 | | | | 0.31 | | |
Net realized and unrealized gain (loss) | | | (0.55 | ) | | | 0.44 | | | | (0.04 | ) | | | 0.37 | | | | 0.73 | | |
Total from investment operations | | | (0.28 | ) | | | 0.72 | | | | 0.26 | | | | 0.67 | | | | 1.04 | | |
Less distributions to shareholders: | |
Net investment income | | | (0.27 | ) | | | (0.27 | ) | | | (0.30 | ) | | | (0.29 | ) | | | (0.31 | ) | |
Total distributions to shareholders | | | (0.27 | ) | | | (0.27 | ) | | | (0.30 | ) | | | (0.29 | ) | | | (0.31 | ) | |
Net asset value, end of period | | $ | 12.00 | | | $ | 12.55 | | | $ | 12.10 | | | $ | 12.14 | | | $ | 11.76 | | |
Total return | | | (2.23 | %) | | | 6.02 | % | | | 2.23 | % | | | 5.80 | % | | | 9.49 | % | |
Ratios to average net assets(a) | |
Total gross expenses | | | 1.70 | % | | | 1.74 | % | | | 1.75 | % | | | 1.68 | % | | | 1.66 | % | |
Total net expenses(b) | | | 1.50 | %(c) | | | 1.50 | %(c) | | | 1.52 | %(c) | | | 1.55 | %(c) | | | 1.53 | %(c) | |
Net investment income | | | 2.21 | % | | | 2.25 | % | | | 2.55 | % | | | 2.47 | % | | | 2.67 | % | |
Supplemental data | |
Net assets, end of period (in thousands) | | $ | 119 | | | $ | 241 | | | $ | 459 | | | $ | 1,016 | | | $ | 1,453 | | |
Portfolio turnover | | | 13 | % | | | 7 | % | | | 8 | % | | | 10 | % | | | 20 | % | |
Notes to Financial Highlights
(a) In addition to the fees and expenses which the Fund bears directly, the Fund indirectly bears a pro rata share of the fees and expenses of the acquired funds in which it invests. Such indirect expenses are not included in the reported expense ratios.
(b) Total net expenses include the impact of certain waivers/reimbursements made by the Investment Manager and certain of its affiliates, if applicable.
(c) The benefits derived from expense reductions had an impact of less than 0.01%.
The accompanying Notes to Financial Statements are an integral part of this statement.
Annual Report 2013
21
Columbia New York Intermediate Municipal Bond Fund
Financial Highlights (continued)
| | | Year Ended October 31, | |
Class C | | 2013 | | 2012 | | 2011 | | 2010 | | 2009 | |
Per share data | |
Net asset value, beginning of period | | $ | 12.55 | | | $ | 12.10 | | | $ | 12.14 | | | $ | 11.76 | | | $ | 11.03 | | |
Income from investment operations: | |
Net investment income | | | 0.32 | | | | 0.32 | | | | 0.34 | | | | 0.33 | | | | 0.34 | | |
Net realized and unrealized gain (loss) | | | (0.55 | ) | | | 0.45 | | | | (0.04 | ) | | | 0.39 | | | | 0.74 | | |
Total from investment operations | | | (0.23 | ) | | | 0.77 | | | | 0.30 | | | | 0.72 | | | | 1.08 | | |
Less distributions to shareholders: | |
Net investment income | | | (0.32 | ) | | | (0.32 | ) | | | (0.34 | ) | | | (0.34 | ) | | | (0.35 | ) | |
Total distributions to shareholders | | | (0.32 | ) | | | (0.32 | ) | | | (0.34 | ) | | | (0.34 | ) | | | (0.35 | ) | |
Net asset value, end of period | | $ | 12.00 | | | $ | 12.55 | | | $ | 12.10 | | | $ | 12.14 | | | $ | 11.76 | | |
Total return | | | (1.88 | %) | | | 6.41 | % | | | 2.57 | % | | | 6.16 | % | | | 9.87 | % | |
Ratios to average net assets(a) | |
Total gross expenses | | | 1.70 | % | | | 1.74 | % | | | 1.73 | % | | | 1.67 | % | | | 1.66 | % | |
Total net expenses(b) | | | 1.15 | %(c) | | | 1.15 | %(c) | | | 1.16 | %(c) | | | 1.20 | %(c) | | | 1.18 | %(c) | |
Net investment income | | | 2.58 | % | | | 2.57 | % | | | 2.89 | % | | | 2.77 | % | | | 2.96 | % | |
Supplemental data | |
Net assets, end of period (in thousands) | | $ | 18,498 | | | $ | 23,008 | | | $ | 14,355 | | | $ | 12,224 | | | $ | 5,861 | | |
Portfolio turnover | | | 13 | % | | | 7 | % | | | 8 | % | | | 10 | % | | | 20 | % | |
Notes to Financial Highlights
(a) In addition to the fees and expenses which the Fund bears directly, the Fund indirectly bears a pro rata share of the fees and expenses of the acquired funds in which it invests. Such indirect expenses are not included in the reported expense ratios.
(b) Total net expenses include the impact of certain waivers/reimbursements made by the Investment Manager and certain of its affiliates, if applicable.
(c) The benefits derived from expense reductions had an impact of less than 0.01%.
The accompanying Notes to Financial Statements are an integral part of this statement.
Annual Report 2013
22
Columbia New York Intermediate Municipal Bond Fund
Financial Highlights (continued)
Class R4 | | Year Ended
October 31,
2013(a) | |
Per share data | |
Net asset value, beginning of period | | $ | 12.42 | | |
Income from investment operations: | |
Net investment income | | | 0.25 | | |
Net realized and unrealized loss | | | (0.43 | ) | |
Total from investment operations | | | (0.18 | ) | |
Less distributions to shareholders: | |
Net investment income | | | (0.25 | ) | |
Total distributions to shareholders | | | (0.25 | ) | |
Net asset value, end of period | | $ | 11.99 | | |
Total return | | | (1.48 | %) | |
Ratios to average net assets(b) | |
Total gross expenses | | | 0.67 | %(c) | |
Total net expenses(d) | | | 0.50 | %(c)(e) | |
Net investment income | | | 3.43 | %(c) | |
Supplemental data | |
Net assets, end of period (in thousands) | | $ | 44 | | |
Portfolio turnover | | | 13 | % | |
Notes to Financial Highlights
(a) For the period from March 19, 2013 (commencement of operations) to October 31, 2013.
(b) In addition to the fees and expenses which the Fund bears directly, the Fund indirectly bears a pro rata share of the fees and expenses of the acquired funds in which it invests. Such indirect expenses are not included in the reported expense ratios.
(c) Annualized.
(d) Total net expenses include the impact of certain waivers/reimbursements made by the Investment Manager and certain of its affiliates, if applicable.
(e) The benefits derived from expense reductions had an impact of less than 0.01%.
The accompanying Notes to Financial Statements are an integral part of this statement.
Annual Report 2013
23
Columbia New York Intermediate Municipal Bond Fund
Financial Highlights (continued)
| | | Year Ended October 31, | |
Class T | | 2013 | | 2012 | | 2011 | | 2010 | | 2009 | |
Per share data | |
Net asset value, beginning of period | | $ | 12.55 | | | $ | 12.10 | | | $ | 12.14 | | | $ | 11.76 | | | $ | 11.03 | | |
Income from investment operations: | |
Net investment income | | | 0.38 | | | | 0.38 | | | | 0.40 | | | | 0.40 | | | | 0.41 | | |
Net realized and unrealized gain (loss) | | | (0.56 | ) | | | 0.45 | | | | (0.04 | ) | | | 0.38 | | | | 0.72 | | |
Total from investment operations | | | (0.18 | ) | | | 0.83 | | | | 0.36 | | | | 0.78 | | | | 1.13 | | |
Less distributions to shareholders: | |
Net investment income | | | (0.38 | ) | | | (0.38 | ) | | | (0.40 | ) | | | (0.40 | ) | | | (0.40 | ) | |
Total distributions to shareholders | | | (0.38 | ) | | | (0.38 | ) | | | (0.40 | ) | | | (0.40 | ) | | | (0.40 | ) | |
Net asset value, end of period | | $ | 11.99 | | | $ | 12.55 | | | $ | 12.10 | | | $ | 12.14 | | | $ | 11.76 | | |
Total return | | | (1.47 | %) | | | 6.95 | % | | | 3.09 | % | | | 6.69 | % | | | 10.42 | % | |
Ratios to average net assets(a) | |
Total gross expenses | | | 0.85 | % | | | 0.90 | % | | | 0.89 | % | | | 0.83 | % | | | 0.81 | % | |
Total net expenses(b) | | | 0.65 | %(c) | | | 0.65 | %(c) | | | 0.67 | %(c) | | | 0.70 | %(c) | | | 0.68 | %(c) | |
Net investment income | | | 3.08 | % | | | 3.08 | % | | | 3.40 | % | | | 3.31 | % | | | 3.52 | % | |
Supplemental data | |
Net assets, end of period (in thousands) | | $ | 8,319 | | | $ | 9,570 | | | $ | 9,420 | | | $ | 10,969 | | | $ | 11,667 | | |
Portfolio turnover | | | 13 | % | | | 7 | % | | | 8 | % | | | 10 | % | | | 20 | % | |
Notes to Financial Highlights
(a) In addition to the fees and expenses which the Fund bears directly, the Fund indirectly bears a pro rata share of the fees and expenses of the acquired funds in which it invests. Such indirect expenses are not included in the reported expense ratios.
(b) Total net expenses include the impact of certain waivers/reimbursements made by the Investment Manager and certain of its affiliates, if applicable.
(c) The benefits derived from expense reductions had an impact of less than 0.01%.
The accompanying Notes to Financial Statements are an integral part of this statement.
Annual Report 2013
24
Columbia New York Intermediate Municipal Bond Fund
Financial Highlights (continued)
| | | Year Ended October 31, | |
Class Z | | 2013 | | 2012 | | 2011 | | 2010 | | 2009 | |
Per share data | |
Net asset value, beginning of period | | $ | 12.55 | | | $ | 12.10 | | | $ | 12.14 | | | $ | 11.76 | | | $ | 11.03 | | |
Income from investment operations: | |
Net investment income | | | 0.40 | | | | 0.40 | | | | 0.42 | | | | 0.41 | | | | 0.42 | | |
Net realized and unrealized gain (loss) | | | (0.56 | ) | | | 0.45 | | | | (0.04 | ) | | | 0.38 | | | | 0.73 | | |
Total from investment operations | | | (0.16 | ) | | | 0.85 | | | | 0.38 | | | | 0.79 | | | | 1.15 | | |
Less distributions to shareholders: | |
Net investment income | | | (0.40 | ) | | | (0.40 | ) | | | (0.42 | ) | | | (0.41 | ) | | | (0.42 | ) | |
Total distributions to shareholders | | | (0.40 | ) | | | (0.40 | ) | | | (0.42 | ) | | | (0.41 | ) | | | (0.42 | ) | |
Net asset value, end of period | | $ | 11.99 | | | $ | 12.55 | | | $ | 12.10 | | | $ | 12.14 | | | $ | 11.76 | | |
Total return | | | (1.32 | %) | | | 7.11 | % | | | 3.24 | % | | | 6.85 | % | | | 10.58 | % | |
Ratios to average net assets(a) | |
Total gross expenses | | | 0.70 | % | | | 0.74 | % | | | 0.73 | % | | | 0.68 | % | | | 0.66 | % | |
Total net expenses(b) | | | 0.50 | %(c) | | | 0.50 | %(c) | | | 0.52 | %(c) | | | 0.55 | %(c) | | | 0.53 | %(c) | |
Net investment income | | | 3.22 | % | | | 3.23 | % | | | 3.55 | % | | | 3.46 | % | | | 3.66 | % | |
Supplemental data | |
Net assets, end of period (in thousands) | | $ | 215,024 | | | $ | 283,653 | | | $ | 258,766 | | | $ | 292,941 | | | $ | 293,160 | | |
Portfolio turnover | | | 13 | % | | | 7 | % | | | 8 | % | | | 10 | % | | | 20 | % | |
Notes to Financial Highlights
(a) In addition to the fees and expenses which the Fund bears directly, the Fund indirectly bears a pro rata share of the fees and expenses of the acquired funds in which it invests. Such indirect expenses are not included in the reported expense ratios.
(b) Total net expenses include the impact of certain waivers/reimbursements made by the Investment Manager and certain of its affiliates, if applicable.
(c) The benefits derived from expense reductions had an impact of less than 0.01%.
The accompanying Notes to Financial Statements are an integral part of this statement.
Annual Report 2013
25
Columbia New York Intermediate Municipal Bond Fund
Notes to Financial Statements
October 31, 2013
Note 1. Organization
Columbia New York Intermediate Municipal Bond Fund (the Fund), a series of Columbia Funds Series Trust I (the Trust), is a non-diversified fund. The Trust is registered under the Investment Company Act of 1940, as amended (the 1940 Act), as an open-end management investment company organized as a Massachusetts business trust.
Fund Shares
The Trust may issue an unlimited number of shares (without par value). The Fund offers Class A, Class B, Class C, Class R4, Class T and Class Z shares. Although all share classes generally have identical voting, dividend and liquidation rights, each share class votes separately when required by law. Different share classes pay different distribution amounts to the extent the expenses of such share classes differ, and distributions in liquidation will be proportional to the net asset value of each share class. Each share class has its own expense structure and sales charges, as applicable.
Class A shares are subject to a maximum front-end sales charge of 3.25% based on the initial investment amount. Class A shares purchased without an initial sales charge in accounts aggregating $1 million to $50 million at the time of purchase are subject to a contingent deferred sales charge (CDSC) if the shares are sold within 18 months of purchase, charged as follows: 1.00% CDSC if redeemed within 12 months of purchase, and 0.50% CDSC if redeemed more than 12, but less than 18, months after purchase.
Class B shares may be subject to a maximum CDSC of 3.00% based upon the holding period after purchase. Class B shares will generally convert to Class A shares eight years after purchase. The Fund no longer accepts investments by new or existing investors in the Fund's Class B shares, except in connection with the reinvestment of any dividend and/or capital gain distributions in Class B shares of the Fund and exchanges by existing Class B shareholders of certain other funds within the Columbia Family of Funds.
Class C shares are subject to a 1.00% CDSC on shares redeemed within one year of purchase.
Class R4 shares are not subject to sales charges and are only available to investors purchasing through authorized investment professionals. Class R4 shares commenced operations on March 19, 2013.
Class T shares are subject to a maximum front-end sales charge of 4.75% based on the investment amount. Class T shares purchased without an initial sales charge in accounts aggregating $1 million to $50 million at the time of purchase
are subject to a CDSC if the shares are sold within 18 months of purchase, charged as follows: 1.00% CDSC if redeemed within 12 months of purchase, and 0.50% CDSC if redeemed more than 12, but less than 18, months after purchase. Class T shares are available only to investors who received (and who have continuously held) Class T shares in connection with the merger of certain Galaxy Funds into various Columbia Funds (formerly named Liberty Funds).
Class Z shares are not subject to sales charges and are available only to certain eligible investors, which are subject to different investment minimums.
Note 2. Summary of Significant Accounting Policies
Use of Estimates
The preparation of financial statements in accordance with U.S. generally accepted accounting principles (GAAP) requires management to make certain estimates and assumptions that affect the reported amounts of assets and liabilities, the disclosure of contingent assets and liabilities at the date of the financial statements and the reported amounts of revenue and expenses during the reporting period. Actual results could differ from those estimates.
The following is a summary of significant accounting policies consistently followed by the Fund in the preparation of its financial statements.
Security Valuation
Debt securities generally are valued by pricing services approved by the Board of Trustees (the Board) based upon market transactions for normal, institutional-size trading units of similar securities. The services may use various pricing techniques which take into account appropriate factors such as yield, quality, coupon rate, maturity, type of issue, trading characteristics and other data, as well as broker quotes. Debt securities for which quotations are readily available may also be valued based upon an over-the-counter or exchange bid quotation.
Investments in open-end investment companies, including money market funds, are valued at net asset value.
Investments for which market quotations are not readily available, or that have quotations which management believes are not reliable, are valued at fair value as determined in good faith under consistently applied procedures established by and under the general supervision of the Board. If a security or class of securities (such as foreign securities) is valued at fair value, such value is likely to be different from the last quoted market price for the security.
Annual Report 2013
26
Columbia New York Intermediate Municipal Bond Fund
Notes to Financial Statements (continued)
October 31, 2013
The determination of fair value often requires significant judgment. To determine fair value, management may use assumptions including but not limited to future cash flows and estimated risk premiums. Multiple inputs from various sources may be used to determine fair value.
Security Transactions
Security transactions are accounted for on the trade date. Cost is determined and gains (losses) are based upon the specific identification method for both financial statement and federal income tax purposes.
Income Recognition
Interest income is recorded on an accrual basis. Market premiums and discounts, including original issue discounts, are amortized and accreted, respectively, over the expected life of the security on all debt securities, unless otherwise noted.
Dividend income is recorded on the ex-dividend date.
Expenses
General expenses of the Trust are allocated to the Fund and other funds of the Trust based upon relative net assets or other expense allocation methodologies determined by the nature of the expense. Expenses directly attributable to the Fund are charged to the Fund. Expenses directly attributable to a specific class of shares are charged to that share class.
Determination of Class Net Asset Value
All income, expenses (other than class-specific expenses, which are charged to that share class, as shown in the Statement of Operations) and realized and unrealized gains (losses) are allocated to each class of the Fund on a daily basis, based on the relative net assets of each class, for purposes of determining the net asset value of each class.
Federal Income Tax Status
The Fund intends to qualify each year as a regulated investment company under Subchapter M of the Internal Revenue Code, as amended, and will distribute substantially all of its tax exempt and taxable income (including net short-term capital gains), if any, for its tax year, and as such will not be subject to federal income taxes. In addition, the Fund intends to distribute in each calendar year substantially all of its net investment income, capital gains and certain other amounts, if any, such that the Fund should not be subject to federal excise tax. Therefore, no federal income or excise tax provision is recorded.
Distributions to Shareholders
Distributions from net investment income, if any, are declared daily and paid monthly. Net realized capital gains, if any, are
distributed at least annually. Income distributions and capital gain distributions are determined in accordance with federal income tax regulations, which may differ from GAAP.
Guarantees and Indemnifications
Under the Trust's organizational documents and, in some cases, by contract, its officers and trustees are indemnified against certain liabilities arising out of the performance of their duties to the Trust or its funds. In addition, certain of the Fund's contracts with its service providers contain general indemnification clauses. The Fund's maximum exposure under these arrangements is unknown since the amount of any future claims that may be made against the Fund cannot be determined, and the Fund has no historical basis for predicting the likelihood of any such claims.
Recent Accounting Pronouncement
Disclosures about Offsetting Assets and Liabilities
In December 2011, the Financial Accounting Standards Board (FASB) issued Accounting Standards Update (ASU) No. 2011-11, Disclosures about Offsetting Assets and Liabilities and in January 2013, ASU No. 2013-1, Clarifying the Scope of Disclosures about Offsetting Assets and Liabilities (collectively, the ASUs). Specifically, the ASUs require an entity to disclose both gross and net information for derivatives and other financial instruments that are subject to a master netting arrangement or similar agreement. The ASUs require disclosure of collateral received in connection with the master netting agreements or similar agreements. The disclosure requirements are effective for interim and annual periods beginning on or after January 1, 2013. At this time, management is evaluating the implications of this guidance and the impact it will have on the financial statement amounts and footnote disclosures, if any.
Note 3. Fees and Compensation Paid to Affiliates
Investment Management Fees
Under an Investment Management Services Agreement, Columbia Management Investment Advisers, LLC (the Investment Manager), a wholly-owned subsidiary of Ameriprise Financial, Inc. (Ameriprise Financial), determines which securities will be purchased, held or sold. The investment management fee is an annual fee that is equal to a percentage of the Fund's average daily net assets that declines from 0.40% to 0.27% as the Fund's net assets increase. The effective investment management fee rate for the year ended October 31, 2013 was 0.40% of the Fund's average daily net assets.
Annual Report 2013
27
Columbia New York Intermediate Municipal Bond Fund
Notes to Financial Statements (continued)
October 31, 2013
Administration Fees
Under an Administrative Services Agreement, the Investment Manager also serves as the Fund Administrator. The Fund pays the Fund Administrator an annual fee for administration and accounting services equal to a percentage of the Fund's average daily net assets that declines from 0.07% to 0.04% as the Fund's net assets increase. The effective administration fee rate for the year ended October 31, 2013 was 0.07% of the Fund's average daily net assets.
Compensation of Board Members
Board members are compensated for their services to the Fund as disclosed in the Statement of Operations. The Trust's eligible Trustees may participate in a Deferred Compensation Plan (the Plan) which may be terminated at any time. Obligations of the Plan will be paid solely out of the Fund's assets.
Compensation of Chief Compliance Officer
The Board has appointed a Chief Compliance Officer to the Fund in accordance with federal securities regulations. The Fund pays its pro-rata share of the expenses associated with the Chief Compliance Officer. The Fund's expenses for the Chief Compliance Officer will not exceed $15,000 per year.
Transfer Agent Fees
Under a Transfer and Dividend Disbursing Agent Agreement, Columbia Management Investment Services Corp. (the Transfer Agent), an affiliate of the Investment Manager and a wholly-owned subsidiary of Ameriprise Financial, is responsible for providing transfer agency services to the Fund. The Transfer Agent has contracted with Boston Financial Data Services (BFDS) to serve as sub-transfer agent.
The Transfer Agent receives monthly account-based service fees based on the number of open accounts and also receives sub-transfer agency fees based on a percentage of the average aggregate value of the Fund's shares maintained in omnibus accounts (other than omnibus accounts for which American Enterprise Investment Services Inc. is the broker of record or accounts where the beneficial shareholder is a customer of Ameriprise Financial Services, Inc., which are paid a per account fee). The Transfer Agent pays the fees of BFDS for services as sub-transfer agent and is not entitled to reimbursement for such fees from the Fund (with the exception of out-of-pocket fees).
The Transfer Agent also receives compensation from fees for various shareholder services and reimbursements for certain out-of-pocket fees.
For the year ended October 31, 2013, the Fund's effective transfer agent fee rates as a percentage of average daily net assets of each class were as follows:
Class A | | | 0.19 | % | |
Class B | | | 0.19 | | |
Class C | | | 0.19 | | |
Class R4 | | | 0.19 | * | |
Class T | | | 0.19 | | |
Class Z | | | 0.19 | | |
*Annualized.
An annual minimum account balance fee of $20 may apply to certain accounts with a value below the applicable share class' initial minimum investment requirements to reduce the impact of small accounts on transfer agent fees. These minimum account balance fees are recorded as part of expense reductions in the Statement of Operations. For the year ended October 31, 2013, these minimum account balance fees reduced total expenses by $220.
Distribution and Service Fees
The Fund has an agreement with Columbia Management Investment Distributors, Inc. (the Distributor), an affiliate of the Investment Manager and a wholly-owned subsidiary of Ameriprise Financial, for distribution and shareholder services. Pursuant to Rule 12b-1 under the 1940 Act, the Board has approved, and the Fund has adopted, distribution and shareholder service plans (the Plans) which set the distribution and service fees for the Fund. These fees are calculated daily and are intended to compensate the Distributor and/or eligible selling and/or servicing agents for selling shares of the Fund and providing services to investors.
Under the Plans, the Fund pays a monthly service fee to the Distributor at the maximum annual rate of 0.25% of the average daily net assets attributable to Class A, Class B and Class C shares of the Fund. Also under the Plans, the Fund pays a monthly distribution fee to the Distributor at the maximum annual rate of 0.75% of the average daily net assets attributable to Class B and Class C shares only.
The Distributor has voluntarily agreed to waive a portion of the distribution fee for Class C shares so that the distribution fee does not exceed 0.40% annually of the average daily net assets attributable to Class C shares. This arrangement may be modified or terminated by the Distributor at any time.
Shareholder Services Fees
The Fund has adopted a shareholder services plan that permits it to pay for certain services provided to Class T shareholders by their selling and/or servicing agents. The Fund may pay shareholder servicing fees up to an aggregate annual rate of
Annual Report 2013
28
Columbia New York Intermediate Municipal Bond Fund
Notes to Financial Statements (continued)
October 31, 2013
0.40% of the Fund's average daily net assets attributable to Class T shares (comprised of up to 0.20% for shareholder liaison services and up to 0.20% for administrative support services). These fees are currently limited to an aggregate annual rate of not more than 0.15% of the Fund's average daily net assets attributable to Class T shares. In addition, the servicing fee for Class T shares will be waived by selling and/or servicing agents to the extent necessary to prevent the net investment income for the Class T shares from falling below 0.00% on a daily basis. The shareholder services fee for the year ended October 31, 2013 was 0.15% of the Fund's average daily net assets attributable to Class T shares.
Sales Charges
Sales charges, including front-end charges and CDSCs, received by the Distributor for distributing Fund shares were $28,979 for Class A, $3,750 for Class C and $28 for Class T shares for the year ended October 31, 2013.
Expenses Waived/Reimbursed by the Investment Manager and its Affiliates
The Investment Manager and certain of its affiliates have contractually agreed to waive fees and/or reimburse expenses (excluding certain fees and expenses described below), for the period disclosed below, unless sooner terminated at the sole discretion of the Board, so that the Fund's net operating expenses, after giving effect to fees waived/expenses reimbursed and any balance credits and/or overdraft charges from the Fund's custodian, do not exceed the following annual rates as a percentage of the class' average daily net assets:
| | | Fee Rates Contractual
through
February 28, 2014 | |
Class A | | | 0.75 | % | |
Class B | | | 1.50 | | |
Class C | | | 1.50 | | |
Class R4 | | | 0.50 | | |
Class T | | | 0.65 | | |
Class Z | | | 0.50 | | |
Under the agreement governing these fee waivers and/or expense reimbursement arrangements, the following fees and expenses are excluded from the waiver/reimbursement commitment, and therefore will be paid by the Fund, if applicable: taxes (including foreign transaction taxes), expenses associated with investments in affiliated and non-affiliated pooled investment vehicles (including mutual funds and exchange traded funds), transaction costs and brokerage commissions, costs related to any securities lending program, dividend expenses associated with securities sold short, inverse floater program fees and expenses, transaction charges and interest on borrowed money, interest,
extraordinary expenses and any other expenses the exclusion of which is specifically approved by the Board. This agreement may be modified or amended only with approval from all parties. Class C distribution fees waived by the Distributor, as discussed above, are in addition to the waiver/reimbursement commitment under the agreement.
Note 4. Federal Tax Information
The timing and character of income and capital gain distributions are determined in accordance with income tax regulations, which may differ from GAAP because of temporary or permanent book to tax differences.
At October 31, 2013, these differences are primarily due to differing treatment for capital loss carryforwards, principal and/or interest of fixed income securities, Trustees' deferred compensation and distributions. To the extent these differences are permanent, reclassifications are made among the components of the Fund's net assets in the Statement of Assets and Liabilities. Temporary differences do not require reclassifications.
The Fund did not have any permanent differences; therefore, no reclassifications were made to the Statement of Assets and Liabilities.
The tax character of distributions paid during the years indicated was as follows:
Year Ended October 31, | | 2013 | | 2012 | |
Tax-exempt income | | $ | 9,710,345 | | | $ | 10,251,838 | | |
Ordinary income | | | 6,463 | | | | 17 | | |
Total | | $ | 9,716,808 | | | $ | 10,251,855 | | |
Short-term capital gain distributions, if any, are considered ordinary income distributions for tax purposes.
At October 31, 2013, the components of distributable earnings on a tax basis were as follows:
Undistributed tax-exempt income | | $ | 880,363 | | |
Unrealized appreciation | | | 15,608,444 | | |
At October 31, 2013, the cost of investments for federal income tax purposes was $241,747,983 and the aggregate gross unrealized appreciation and depreciation based on that cost was:
Unrealized appreciation | | $ | 16,768,702 | | |
Unrealized depreciation | | | (1,160,258 | ) | |
Net unrealized appreciation | | $ | 15,608,444 | | |
The following capital loss carryforward, determined at October 31, 2013, may be available to reduce taxable income
Annual Report 2013
29
Columbia New York Intermediate Municipal Bond Fund
Notes to Financial Statements (continued)
October 31, 2013
arising from future net realized gains on investments, if any, to the extent permitted by the Internal Revenue Code:
Year of Expiration | | Amount | |
2017 | | $ | 946,916 | | |
Unlimited short-term | | | 880,694 | | |
Total | | $ | 1,827,610 | | |
Unlimited capital loss carryforwards are required to be utilized prior to any capital losses which carry an expiration date. As a result of this ordering rule, capital loss carryforwards which carry an expiration date may be more likely to expire unused.
Management of the Fund has concluded that there are no significant uncertain tax positions that would require recognition in the financial statements. However, management's conclusion may be subject to review and adjustment at a later date based on factors including, but not limited to, new tax laws, regulations, and administrative interpretations (including relevant court decisions). Generally, the Fund's federal tax returns for the prior three fiscal years remain subject to examination by the Internal Revenue Service.
Note 5. Portfolio Information
The cost of purchases and proceeds from sales of securities, excluding short-term obligations, aggregated to $39,243,244 and $93,488,239, respectively, for the year ended October 31, 2013.
Note 6. Shareholder Concentration
At October 31, 2013, one unaffiliated shareholder account owned 71.5% of the outstanding shares of the Fund. The Fund has no knowledge about whether any portion of those shares was owned beneficially by such account. Subscription and redemption activity by concentrated accounts may have a significant effect on the operations of the Fund.
Note 7. Line of Credit
The Fund has entered into a revolving credit facility with a syndicate of banks led by JPMorgan Chase Bank N.A. (JPMorgan) whereby the Fund may borrow for the temporary funding of shareholder redemptions or for other temporary or emergency purposes. The credit facility agreement, as amended, which is a collective agreement between the Fund and certain other funds managed by the Investment Manager, severally and not jointly, permits collective borrowings up to $500 million. Interest is charged to each participating fund based on its borrowings at a rate equal to the higher of (i) the overnight federal funds rate plus 1.00% or (ii) the one-month LIBOR rate plus 1.00%. Each borrowing under the credit facility matures no later than 60 days after the date of
borrowing. The Fund also pays a commitment fee equal to its pro rata share of the amount of the credit facility at a rate of 0.08% per annum. The commitment fee is included in other expenses in the Statement of Operations.
Effective December 10, 2013, the Fund extended its revolving credit facility with JPMorgan. The credit facility agreement, as amended, continues to permit collective borrowings up to $500 million under the same terms and interest rates as described above. Effective December 10, 2013, the Fund pays a commitment fee equal to its pro rata share of the amount of the credit facility at a rate of 0.075% per annum.
The Fund had no borrowings during the year ended October 31, 2013.
Note 8. Significant Risks
Geographic Concentration Risk
Because state-specific tax-exempt funds invest primarily in the municipal securities issued by the state and political sub-divisions of the state, the Fund will be particularly affected by political and economic conditions and developments in the state in which it invests. The Fund may, therefore, have a greater risk than that of a municipal bond fund which is more geographically diversified. The value of the municipal securities owned by the Fund also may be adversely affected by future changes in federal or state income tax laws.
Non-Diversification Risk
A non-diversified fund is permitted to invest a greater percentage of its total assets in fewer issuers than a diversified fund. The Fund may, therefore, have a greater risk of loss from a few issuers than a similar fund that invests more broadly.
Note 9. Subsequent Events
Management has evaluated the events and transactions that have occurred through the date the financial statements were issued and noted no items requiring adjustment of the financial statements or additional disclosure.
Note 10. Information Regarding Pending and Settled Legal Proceedings
In December 2005, without admitting or denying the allegations, American Express Financial Corporation (AEFC, which is now known as Ameriprise Financial, Inc. (Ameriprise Financial)) entered into settlement agreements with the Securities and Exchange Commission (SEC) and Minnesota Department of Commerce (MDOC) related to market timing activities. As a result, AEFC was censured and ordered to cease and desist from committing or causing any violations of certain provisions of the Investment Advisers Act of 1940, the
Annual Report 2013
30
Columbia New York Intermediate Municipal Bond Fund
Notes to Financial Statements (continued)
October 31, 2013
Investment Company Act of 1940, and various Minnesota laws. AEFC agreed to pay disgorgement of $10 million and civil money penalties of $7 million. AEFC also agreed to retain an independent distribution consultant to assist in developing a plan for distribution of all disgorgement and civil penalties ordered by the SEC in accordance with various undertakings detailed at www.sec.gov/litigation/admin/ia-2451.pdf. Ameriprise Financial and its affiliates have cooperated with the SEC and the MDOC in these legal proceedings, and have made regular reports to the funds' Boards of Trustees.
Ameriprise Financial and certain of its affiliates have historically been involved in a number of legal, arbitration and regulatory proceedings, including routine litigation, class actions, and governmental actions, concerning matters arising in connection with the conduct of their business activities. Ameriprise Financial believes that the Funds are not currently the subject of, and that neither Ameriprise Financial nor any of its affiliates are the subject of, any pending legal, arbitration or regulatory proceedings that are likely to have a material adverse effect on the Funds or the ability of Ameriprise Financial or its affiliates to perform under their contracts with the Funds. Ameriprise Financial is required to make 10-Q, 10-K and, as necessary, 8-K filings with the Securities and Exchange Commission on legal and regulatory matters that relate to Ameriprise Financial and its affiliates. Copies of these filings may be obtained by accessing the SEC website at www.sec.gov.
There can be no assurance that these matters, or the adverse publicity associated with them, will not result in increased fund redemptions, reduced sale of fund shares or other adverse consequences to the Funds. Further, although we believe proceedings are not likely to have a material adverse effect on the Funds or the ability of Ameriprise Financial or its affiliates to perform under their contracts with the Funds, these proceedings are subject to uncertainties and, as such, we are unable to estimate the possible loss or range of loss that may result. An adverse outcome in one or more of these proceedings could result in adverse judgments, settlements, fines, penalties or other relief that could have a material adverse effect on the consolidated financial condition or results of operations of Ameriprise Financial.
Annual Report 2013
31
Columbia New York Intermediate Municipal Bond Fund
Report of Independent Registered Public Accounting Firm
To the Trustees of Columbia Funds Series Trust I and the Shareholders of
Columbia New York Intermediate Municipal Bond Fund
In our opinion, the accompanying statement of assets and liabilities, including the portfolio of investments, and the related statements of operations and of changes in net assets and the financial highlights present fairly, in all material respects, the financial position of Columbia New York Intermediate Municipal Bond Fund (the "Fund", a series of Columbia Funds Series Trust I) at October 31, 2013, and the results of its operations, the changes in its net assets and the financial highlights for each of the periods indicated, in conformity with accounting principles generally accepted in the United States of America. These financial statements and financial highlights (hereafter referred to as "financial statements") are the responsibility of the Fund's management; our responsibility is to express an opinion on these financial statements based on our audits. We conducted our audits of these financial statements in accordance with the standards of the Public Company Accounting Oversight Board (United States). Those standards require that we plan and perform the audit to obtain reasonable assurance about whether the financial statements are free of material misstatement. An audit includes examining, on a test basis, evidence supporting the amounts and disclosures in the financial statements, assessing the accounting principles used and significant estimates made by management, and evaluating the overall financial statement presentation. We believe that our audits, which included confirmation of securities at October 31, 2013 by correspondence with the custodian, brokers and transfer agent, provide a reasonable basis for the opinion expressed above.
PricewaterhouseCoopers LLP
Minneapolis, Minnesota
December 19, 2013
Annual Report 2013
32
Columbia New York Intermediate Municipal Bond Fund
Federal Income Tax Information
(Unaudited)
The Fund hereby designates the following tax attributes for the fiscal year ended October 31, 2013. Shareholders will be notified in early 2014 of the amounts for use in preparing 2013 income tax returns.
Tax Designations:
| Exempt-Interest Dividends | | | 99.93 | % | |
Exempt-Interest Dividends. The percentage of net investment income dividends paid during the fiscal year that qualifies as exempt-interest dividends for federal income tax purposes.
Annual Report 2013
33
Columbia New York Intermediate Municipal Bond Fund
The Trustees serve terms of indefinite duration. The names, addresses and birth years of the Trustees and Officers of the Funds in Columbia Funds Series Trust I, the year each was first elected or appointed to office, their principal business occupations during at least the last five years, the number of Funds overseen by each Trustee and other directorships they hold are shown below. Each officer listed below serves as an officer of each Fund in Columbia Funds Series Trust I.
Independent Trustees
Name, Address and Year of Birth,
Position with Funds, Year First
Elected or Appointed to Office | | Principal Occupation(s) During Past Five Years, Number of Funds in Columbia
Funds Complex Overseen by Trustee, Other Directorships Held | |
Rodman L. Drake (Born 1943)
c/o Columbia Management
Investment Advisers, LLC
225 Franklin Street
Boston, MA 02110
Trustee (since 1994) and
Chairman of the Board (since 2009) | | Independent consultant since 2010; Co-Founder of Baringo Capital LLC (private equity) from 1997 to 2008; Chairman (from 2003 to 2010) and CEO (from 2008 to 2010) of Crystal River Capital, Inc. (real estate investment trust); Oversees 52; Jackson Hewitt Tax Service Inc. (tax preparation services) from 2004 to 2011; Student Loan Corporation (student loan provider) from 2005 to 2010; Celgene Corporation (global biotechnology company); The Helios Funds and Brookfield Funds (closed-end funds); Chimerix, Inc. (biopharmaceutical company) since August 1, 2013; Crystal River Capital, Inc. from 2005 to 2010; Parsons Brinckerhoff from 1995 to 2008; and Apex Silver Mines Ltd. from 2007 to 2009 | |
Douglas A. Hacker (Born 1955)
c/o Columbia Management
Investment Advisers, LLC
225 Franklin Street
Boston, MA 02110
Trustee (since 1996) | | Independent business executive since May 2006; Executive Vice President — Strategy of United Airlines from December 2002 to May 2006; President of UAL Loyalty Services (airline marketing company) from September 2001 to December 2002; Executive Vice President and Chief Financial Officer of United Airlines from July 1999 to September 2001. Oversees 52; Nash Finch Company (food distributor); Aircastle Limited (aircraft leasing); and SeaCube Container Leasing Ltd. (container leasing) | |
Janet Langford Kelly (Born 1957)
c/o Columbia Management
Investment Advisers, LLC
225 Franklin Street
Boston, MA 02110
Trustee (since 1996) | | Senior Vice President, General Counsel and Corporate Secretary, ConocoPhillips (integrated energy company) since September 2007; Deputy General Counsel — Corporate Legal Services, ConocoPhillips from August 2006 to August 2007; Partner, Zelle, Hofmann, Voelbel, Mason & Gette LLP (law firm) from March 2005 to July 2006; Adjunct Professor of Law, Northwestern University from September 2004 to June 2006; Director, UAL Corporation (airline) from February 2006 to July 2006; Chief Administrative Officer and Senior Vice President, Kmart Holding Corporation (consumer goods) from September 2003 to March 2004. Oversees 52; None | |
Nancy T. Lukitsh (Born 1956)
c/o Columbia Management
Investment Advisers, LLC
225 Franklin Street
Boston, MA 02110
Trustee (since 2011) | | Senior Vice President, Partner and Director of Marketing, Wellington Management Company, LLP (investment adviser) from 1997 to 2010; Chair, Wellington Management Investment Portfolios (commingled non-U.S. investment pools) from 2007 to 2010; Director, Wellington Trust Company, NA and other Wellington affiliates from 1997 to 2010. Oversees 52; None | |
William E. Mayer (Born 1940)
c/o Columbia Management
Investment Advisers, LLC
225 Franklin Street
Boston, MA 02110
Trustee (since 1994) | | Partner, Park Avenue Equity Partners (private equity) since February 1999; Dean and Professor, College of Business and Management, University of Maryland from 1992 to 1996. Oversees 52; DynaVox Inc. (speech creation); Lee Enterprises (print media); WR Hambrecht + Co. (financial service provider) from 2000 to 2012; BlackRock Kelso Capital Corporation (investment company) | |
David M. Moffett (Born 1952)
c/o Columbia Management
Investment Advisers, LLC
225 Franklin Street
Boston, MA 02110
Trustee (since 2011) | | Retired. Chief Executive Officer, Federal Home Loan Mortgage Corporation, from 2008 to 2009; Senior Adviser, Global Financial Services Group, Carlyle Group, Inc., from 2007 to 2008; Vice Chairman and Chief Financial Officer, U.S. Bancorp, from 1993 to 2007. Oversees 52; CIT Group Inc. (commercial and consumer finance); eBay Inc. (online trading community); MBIA Inc. (financial service provider); E.W. Scripps Co. (print and television media), Building Materials Holding Corp. (building materials and construction services); Genworth Financial, Inc. (financial and insurance products and services); and University of Oklahoma Foundation | |
Charles R. Nelson (Born 1942)
c/o Columbia Management
Investment Advisers, LLC
225 Franklin Street
Boston, MA 02110
Trustee (since 1981) | | Retired. Professor Emeritus, University of Washington, since 2011; Professor of Economics, University of Washington from 1976 to 2011; Ford and Louisa Van Voorhis Professor of Political Economy, University of Washington from 1993 to 2011; Adjunct Professor of Statistics, University of Washington from 1980 to 2011; Associate Editor, Journal of Money, Credit and Banking from September 1993 to 2008; consultant on econometric and statistical matters. Oversees 52; None | |
John J. Neuhauser (Born 1943)
c/o Columbia Management
Investment Advisers, LLC
225 Franklin Street
Boston, MA 02110
Trustee (since 1984) | | President, Saint Michael's College, since August 2007; Director or Trustee of several non-profit organizations, including Fletcher Allen Health Care, Inc.; University Professor, Boston College from November 2005 to August 2007; Academic Vice President and Dean of Faculties, Boston College from August 1999 to October 2005. Oversees 52; Liberty All-Star Equity Fund and Liberty All-Star Growth Fund (closed-end funds) | |
Annual Report 2013
34
Columbia New York Intermediate Municipal Bond Fund
Trustees and Officers (continued)
Independent Trustees (continued)
Name, Address and Year of Birth,
Position with Funds, Year First
Elected or Appointed to Office | | Principal Occupation(s) During Past Five Years, Number of Funds in Columbia
Funds Complex Overseen by Trustee, Other Directorships Held | |
Patrick J. Simpson (Born 1944)
c/o Columbia Management
Investment Advisers, LLC
225 Franklin Street
Boston, MA 02110
Trustee (since 2000) | | Partner, Perkins Coie LLP (law firm). Oversees 52; None | |
Anne-Lee Verville (Born 1945)
c/o Columbia Management
Investment Advisers, LLC
225 Franklin Street
Boston, MA 02110
Trustee (since 1998) | | Retired. General Manager — Global Education Industry from 1994 to 1997, President — Application Systems Division from 1991 to 1994, Chief Financial Officer — US Marketing & Services from 1988 to 1991, and Chief Information Officer from 1987 to 1988, IBM Corporation (computer and technology). Oversees 52; Enesco Group, Inc. (producer of giftware and home and garden decor products) from 2001 to 2006 | |
Interested Trustee
Name, Address and Year of Birth,
Position with Funds, Year First
Elected or Appointed to Office | | Principal Occupation(s) During Past Five Years, Number of Funds in Columbia
Funds Complex Overseen by Trustee, Other Directorships Held | |
William F. Truscott (born 1960)
53600 Ameriprise Financial Center
Minneapolis, MN 55474
Senior Vice President (since 2012) | | Chairman of the Board and President, Columbia Management Investment Advisers, LLC since May 2010 and February 2012 (previously President and Chief Investment Officer, from 2001 to April 2010); Chief Executive Officer, Global Asset Management, Ameriprise Financial, Inc. since September 2012 (previously, Chief Executive Officer, U.S. Asset Management & President, Annuities, from May 2010 to September 2012 and President — U.S. Asset Management and Chief Investment Officer from 2005 to April 2010); Director and Chief Executive Officer, Columbia Management Investment Distributors, Inc. since May 2010 and February 2012, respectively (previously Chairman of the Board and Chief Executive Officer from 2006 to April 2010); Chairman of the Board and Chief Executive Officer, RiverSource Distributors, Inc. since 2006; President and Chief Executive Officer, Ameriprise Certificate Company, 2006 to August 2012; Oversees 184; Director, Ameriprise Certificate Company, 2006-January 2013 | |
The Statement of Additional Information includes additional information about the Trustees of the Funds and is available, without charge, upon request by calling 800.345.6611.
The Board has appointed officers who are responsible for day-to-day business decisions based on policies it has established. The officers serve at the pleasure of the Board. In addition to Mr. Truscott, who is Senior Vice President, the Funds' other officers are:
Officers
Name,
Address and
Year of Birth | | Position and Year
First Appointed to
Position for any Fund
in the Columbia
Funds Complex or a
Predecessor Thereof | | Principal Occupation(s) During Past Five Years | |
J. Kevin Connaughton
225 Franklin Street
Boston, MA 02110
Born 1964 | | President and Principal Executive Officer (2009) | | Senior Vice President and General Manager — Mutual Fund Products, Columbia Management Investment Advisers, LLC, since May 2010; and President, Columbia Funds since 2009; previously, Managing Director, Columbia Management Advisors, LLC, from December 2004 to April 2010; Senior Vice President and Chief Financial Officer, Columbia Funds, from June 2008 to January 2009; and senior officer of Columbia Funds and affiliated funds since 2003. | |
Michael G. Clarke
225 Franklin Street
Boston, MA 02110
Born 1969 | | Treasurer (2011) and Chief Financial Officer (2009) | | Vice President, Columbia Management Investment Advisers, LLC, since May 2010; previously, Managing Director of Fund Administration, Columbia Management Advisors, LLC, from September 2004 to April 2010; and senior officer of Columbia Funds and affiliated funds since 2002. | |
Annual Report 2013
35
Columbia New York Intermediate Municipal Bond Fund
Trustees and Officers (continued)
Officers (continued)
Name,
Address and
Year of Birth | | Position and Year
First Appointed to
Position for any Fund
in the Columbia
Funds Complex or a
Predecessor Thereof | | Principal Occupation(s) During Past Five Years | |
Scott R. Plummer
5228 Ameriprise
Financial Center
Minneapolis, MN 55474
Born 1959 | | Senior Vice President (2006), Chief Legal Officer (2006) and Assistant Secretary (2011) | | Senior Vice President, Chief Legal Officer and Assistant Secretary, Columbia Management Investment Advisers, LLC, since June 2005; Senior Vice President and Lead Chief Counsel — Asset Management, Ameriprise Financial, Inc., since May 2010 (previously, Vice President and Chief Counsel — Asset Management, from 2005 to April 2010); Vice President, Chief Counsel and Assistant Secretary, Columbia Management Investment Distributors, Inc., since 2008; Vice President, General Counsel and Secretary, Ameriprise Certificate Company, since 2005; Chief Counsel, RiverSource Distributors, Inc., since 2006; and senior officer of Columbia Funds and affiliated funds since 2006. | |
Thomas P. McGuire
225 Franklin Street
Boston, MA 02110
Born 1972 | | Chief Compliance Officer (2012) | | Vice President — Asset Management Compliance, Ameriprise Financial, Inc., since May 2010; Chief Compliance Officer, Ameriprise Certificate Company, since September 2010; Compliance Executive, Bank of America, from 2005 to April 2010. | |
Colin Moore
225 Franklin Street
Boston, MA 02110
Born 1958 | | Senior Vice President (2010) | | Executive Vice President and Global Chief Investment Officer, Ameriprise Financial, Inc., since July 2013; Director and Global Chief Investment Officer, Columbia Management Investment Advisers, LLC, since May 2010; previously, Manager, Managing Director and Chief Investment Officer, Columbia Management Advisors, LLC, from 2007 to April 2010. | |
Michael E. DeFao
225 Franklin Street
Boston, MA 02110
Born 1968 | | Vice President (2011) and Assistant Secretary (2010) | | Vice President and Chief Counsel, Ameriprise Financial, Inc., since May 2010; Associate General Counsel, Bank of America from 2005 to April 2010. | |
Joseph F. DiMaria
225 Franklin Street
Boston, MA 02110
Born 1968 | | Vice President (2011) and Chief Accounting Officer (2008) | | Vice President — Mutual Fund Administration, Columbia Management Investment Advisers, LLC, since May 2010; previously, Director of Fund Administration, Columbia Management Advisors, LLC, from 2006 to April 2010. | |
Paul B. Goucher
100 Park Avenue
New York, NY 10017
Born 1968 | | Vice President (2011) and Assistant Secretary (2008) | | Vice President and Lead Chief Counsel, Ameriprise Financial, Inc., since November 2008 and January 2013, respectively (previously, Chief Counsel, from January 2010 to January 2013, and Group Counsel from November 2008 to January 2010); previously, Director, Managing Director and General Counsel, J. & W. Seligman & Co. Incorporated, from July 2008 to November 2008. | |
Amy Johnson
5228 Ameriprise
Financial Center
Minneapolis, MN
Born 1965 | | Vice President (2006) | | Senior Vice President and Chief Operating Officer, Columbia Management Investment Advisers, LLC, since May 2010; previously, Chief Administrative Officer, from 2009 to April 2010, and Vice President — Asset Management and Trust Company Services, from 2006 to 2009. | |
Paul D. Pearson
5228 Ameriprise
Financial Center
Minneapolis, MN
Born 1956 | | Vice President (2011) and Assistant Treasurer (1999) | | Vice President — Investment Accounting, Columbia Management Investment Advisers, LLC, since May 2010; previously, Vice President — Managed Assets, Investment Accounting, Ameriprise Financial, Inc. from 1998 to April 2010. | |
Christopher O. Petersen
5228 Ameriprise
Financial Center
Minneapolis, MN 55474
Born 1970 | | Vice President and Secretary (2010) | | Vice President and Chief Counsel, Ameriprise Financial, Inc., since January 2010 (previously, Vice President and Group Counsel or Counsel from 2004 to January 2010); officer of Columbia Funds and affiliated funds since 2007. | |
Stephen T. Welsh
225 Franklin Street
Boston, MA 02110
Born 1957 | | Vice President (2006) | | President and Director, Columbia Management Investment Services Corp., since May 2010; previously, President and Director, Columbia Management Services, Inc., from 2004 to April 2010; and Managing Director, Columbia Management Distributors, Inc., from 2007 to April 2010. | |
Annual Report 2013
36
Columbia New York Intermediate Municipal Bond Fund
Board Consideration and Approval of Advisory Agreement
On June 14, 2013, the Board of Trustees (the "Board") and the Trustees who are not interested persons (as defined in the Investment Company Act of 1940) of the Trust (the "Independent Trustees") unanimously approved the continuation of the Investment Management Services Agreement (the "Advisory Agreement") with Columbia Management Investment Advisers, LLC (the "Investment Manager") with respect to Columbia New York Intermediate Municipal Bond Fund (the "Fund"), a series of the Trust. As detailed below, the Advisory Fees and Expenses Committee (the "Committee") and the Board met on multiple occasions to review and discuss, both among themselves and with the management team of the Investment Manager, materials provided by the Investment Manager before determining to approve the continuation of the Advisory Agreement.
In connection with their deliberations regarding the continuation of the Advisory Agreement, the Committee and the Board evaluated materials requested from the Investment Manager regarding the Fund and the Advisory Agreement, and discussed these materials with representatives of the Investment Manager at Committee meetings held on March 5, 2013, April 24, 2013 and June 13, 2013, and at the Board meeting held on June 14, 2013. In addition, the Board considers matters bearing on the Advisory Agreement at most of its other meetings throughout the year and meets regularly with senior management of the Funds and the Investment Manager. Through the Board's Investment Oversight Committees, Trustees also meet with selected Fund portfolio managers and other investment personnel at various times throughout the year. The Committee and the Board also consulted with Fund counsel and with the Independent Trustees' independent legal counsel, who advised on various matters with respect to the Committee's and the Board's considerations and otherwise assisted the Committee and the Board in their deliberations. On June 13, 2013, the Committee recommended that the Board approve the continuation of the Advisory Agreement. On June 14, 2013, the Board, including the Independent Trustees, voting separately, unanimously approved the continuation of the Advisory Agreement for the Fund.
The Committee and the Board considered all information that they, their legal counsel, or the Investment Manager believed reasonably necessary to evaluate and to determine whether to approve the continuation of the Advisory Agreement. The information and factors considered by the Committee and the Board in recommending for approval or approving the continuation of the Advisory Agreement for the Fund included the following:
• Information on the investment performance of the Fund relative to the performance of a group of mutual funds determined to be comparable to the Fund by an independent third-party data provider, as well as performance relative to benchmarks;
• Information on the Fund's advisory fees and total expenses, including information comparing the Fund's expenses to those of a group of comparable mutual funds, as determined by the independent third-party data provider;
• The Investment Manager's agreement to contractually limit or cap total operating expenses for the Fund so that total operating expenses (excluding certain fees and expenses, such as transaction costs and certain other investment related expenses, interest, taxes, acquired fund fees and expenses, and extraordinary expenses) would not exceed the median expenses of a group of comparable funds (as determined from time to time, generally annually, by the independent third-party data provider);
• The terms and conditions of the Advisory Agreement;
• The terms and conditions of other agreements and arrangements with affiliates of the Investment Manager relating to the operations of the Fund, including the Administrative Services Agreement, the Distribution Agreement and the Transfer and Dividend Disbursing Agent Agreement;
• Descriptions of various functions performed by the Investment Manager under the Advisory Agreement, including portfolio management and portfolio trading practices;
• Information regarding the management fees and investment performance of comparable portfolios of other clients of the Investment Manager, including institutional separate accounts;
• Information regarding the reputation, regulatory history and resources of the Investment Manager, including information regarding senior management, portfolio managers and other personnel;
• Information regarding the capabilities of the Investment Manager with respect to compliance monitoring services, including an assessment of the Investment Manager's compliance system by the Fund's Chief Compliance Officer; and
• The profitability to the Investment Manager and its affiliates from their relationships with the Fund.
Annual Report 2013
37
Columbia New York Intermediate Municipal Bond Fund
Board Consideration and Approval of Advisory Agreement (continued)
Nature, Extent and Quality of Services Provided under the Advisory Agreement
The Committee and the Board considered the nature, extent and quality of services provided to the Fund by the Investment Manager and its affiliates under the Advisory Agreement and under separate agreements for the provision of transfer agency and administrative services, and the resources dedicated to the Fund and the other Columbia Funds by the Investment Manager and its affiliates. The Committee and the Board considered, among other things, the Investment Manager's ability to attract, motivate and retain highly qualified research, advisory and supervisory investment professionals (including personnel and other resources, compensation programs for personnel involved in fund management, reputation and other attributes), the portfolio management services provided by those investment professionals, and the quality of the Investment Manager's investment research capabilities and trade execution services. The Committee and the Board also considered the potential benefits to shareholders of investing in a mutual fund that is part of a fund complex offering exposure to a variety of asset classes and investment disciplines and providing a variety of fund and shareholder services.
The Committee and the Board also considered the professional experience and qualifications of the senior personnel of the Investment Manager, which included consideration of the Investment Manager's experience with similarly-structured funds. The Committee and the Board noted the compliance programs of and the compliance-related resources provided to the Fund by the Investment Manager and its affiliates, and considered the Investment Manager's ability to provide administrative services to the Fund pursuant to a separate Administrative Services Agreement, including the Investment Manager's ability to coordinate the activities of the Fund's other service providers. After reviewing these and related factors, the Committee and the Board concluded, within the context of their overall conclusions, that the nature, extent and quality of the services provided to the Fund under the Advisory Agreement supported the continuation of the Advisory Agreement.
Investment Performance
The Committee and the Board reviewed information about the performance of the Fund over various time periods, including performance information relative to benchmarks and information based on reports of the independent third-party data provider that compared the performance of the Fund to the performance of a group of comparable mutual funds. The Committee and the Board also reviewed a description of the third party's methodology for identifying the Fund's peer groups for purposes of performance and expense comparisons.
The Committee and the Board noted that, through December 31, 2012, the Fund's performance was in the forty-sixth, thirty-seventh and thirty-seventh percentile (where the best performance would be in the first percentile) of its category selected by the independent third-party data provider for the purposes of performance comparisons for the one-, three- and five- year periods, respectively.
The Committee and the Board also considered the Investment Manager's performance and reputation generally, the Investment Manager's historical responsiveness to Board concerns about performance, and the Investment Manager's willingness to take steps intended to improve performance. After reviewing these and related factors, the Committee and the Board concluded, within the context of their overall conclusions, that the performance of the Fund supported the continuation of the Advisory Agreement.
Investment Advisory Fee Rates and Other Expenses
The Committee and the Board considered the advisory fees charged to the Fund under the Advisory Agreement as well as the total expenses incurred by the Fund. In assessing the reasonableness of the fees under the Advisory Agreement, the Committee and the Board considered, among other information, the Fund's advisory fee and its total expense ratio as a percentage of average daily net assets. The Committee and the Board noted that the Fund's actual management fee and net expense ratio are ranked in the first and second quintiles, respectively, (where the lowest fees and expenses would be in the first quintile) against the Fund's expense universe as determined by the independent third-party data provider for purposes of expense comparison. The Committee and the Board also took into account the fee waiver and expense limitation arrangements agreed to by the Investment Manager, as noted above.
The Committee and the Board also received and considered information about the advisory fees charged by the Investment Manager to institutional separate accounts. In considering the fees charged to those accounts, the Committee and the Board took into account, among other things, the Investment Manager's representations about the differences between managing mutual funds as compared to other types of accounts, including differences in the services provided, differences in the risk
Annual Report 2013
38
Columbia New York Intermediate Municipal Bond Fund
Board Consideration and Approval of Advisory Agreement (continued)
profile of such business for the Investment Manager and the additional resources required to manage mutual funds effectively. In evaluating the Fund's advisory fees, the Committee and the Board also took into account the demands, complexity and quality of the investment management of the Fund.
After reviewing these and related factors, the Committee and the Board concluded, within the context of their overall conclusions, that the advisory fee rates and expenses of the Fund supported the continuation of the Advisory Agreement.
Costs of Services Provided and Profitability
The Committee and the Board also took note of the costs of the services provided (both on an absolute and relative basis) and the profitability to the Investment Manager and its affiliates in connection with their relationships with the Fund. In evaluating these considerations, the Committee and the Board took note of the advisory fees charged by the Investment Manager to other clients, including fees charged by the Investment Manager to institutional separate account clients with similar investment strategies to those of the Fund.
The Committee and the Board also considered the compensation directly or indirectly received by the Investment Manager's affiliates in connection with their relationships with the Fund. The Committee and the Board reviewed information provided by management as to the profitability of the Investment Manager and its affiliates of their relationships with the Fund, information about the allocation of expenses used to calculate profitability, and comparisons of profitability levels realized in 2012 to profitability levels realized in 2011. When reviewing profitability, the Committee and the Board also considered court cases in which adviser profitability was an issue in whole or in part, the performance of the Fund, the expense ratio of the Fund, and the implementation of expense limitations with respect to the Fund. The Committee and the Board also considered information provided by the Investment Manager regarding its financial condition and comparing its profitability to that of other asset management firms that are, or are subsidiaries of, publicly traded companies.
After reviewing these and related factors, the Committee and the Board concluded, within the context of their overall conclusions, that the costs of services provided and the profitability to the Investment Manager and its affiliates from their relationships with the Fund supported the continuation of the Advisory Agreement.
Economies of Scale
The Committee and the Board considered the potential existence of economies of scale in the provision by the Investment Manager of services to the Fund, to groups of related funds, and to the Investment Manager's investment advisory clients as a whole, and whether those economies of scale were shared with the Fund through breakpoints in investment advisory fees or other means, such as expense limitation arrangements and additional investments by the Investment Manager in investment, trading and compliance resources. The Committee and the Board noted that the investment advisory fee schedules for the Fund contained breakpoints that would reduce the fee rate on assets above specified threshold levels.
In considering these matters, the Committee and the Board also considered the costs of the services provided and the profitability to the Investment Manager and its affiliates from their relationships with the Fund, as discussed above. After reviewing these and related factors, the Committee and the Board concluded, within the context of their overall conclusions, that the extent to which any economies of scale were expected to be shared with the Fund supported the continuation of the Advisory Agreement.
Other Benefits to the Investment Manager
The Committee and the Board received and considered information regarding "fall-out" or ancillary benefits received by the Investment Manager and its affiliates as a result of their relationships with the Fund, such as the engagement of the Investment Manager to provide administrative services to the Fund and the engagement of the Investment Manager's affiliates to provide distribution and transfer agency services to the Fund. The Committee and the Board considered that the Fund's distributor retains a portion of the distribution fees from the Fund. The Committee and the Board also considered the benefits of research made available to the Investment Manager by reason of brokerage commissions generated by the Fund's securities transactions, and reviewed information about the Investment Manager's practices with respect to allocating portfolio transactions for brokerage and research services. The Committee and the Board considered the possible conflicts of interest associated with certain fall-out or other ancillary benefits and the reporting, disclosure and other processes that are in place to address such possible conflicts of interest. The Committee and the Board recognized that the Investment Manager's profitability would be somewhat lower without these benefits.
Annual Report 2013
39
Columbia New York Intermediate Municipal Bond Fund
Board Consideration and Approval of Advisory Agreement (continued)
Conclusion
The Committee and the Board reviewed all of the above considerations in reaching their decisions to recommend or approve the continuation of the Advisory Agreement. In their deliberations, the Trustees did not identify any particular information that was all-important or controlling, and individual Trustees may have attributed different weights to the various factors. Based on their evaluation of all factors that they deemed to be material, including those factors described above, and assisted by the advice of independent legal counsel, the Board, including the Independent Trustees, voting separately, unanimously approved the continuation of the Advisory Agreement.
Annual Report 2013
40
Columbia New York Intermediate Municipal Bond Fund
Important Information About This Report
Each fund mails one shareholder report to each shareholder address. If you would like more than one report, please call shareholder services at 800.345.6611 and additional reports will be sent to you.
The policy of the Board is to vote the proxies of the companies in which each fund holds investments consistent with the procedures as stated in the Statement of Additional Information (SAI). You may obtain a copy of the SAI without charge by calling 800.345.6611; contacting your financial intermediary; visiting columbiamanagement.com; or searching the website of the Securities and Exchange Commission (SEC) at sec.gov. Information regarding how each fund voted proxies relating to portfolio securities is filed with the SEC by August 31 for the most recent 12-month period ending June 30 of that year, and is available without charge by visiting columbiamanagement.com; or searching the website of the SEC at sec.gov.
Each fund files a complete schedule of portfolio holdings with the SEC for the first and third quarters of each fiscal year on Form N-Q. Each fund's Form N-Q is available on the SEC's website at sec.gov and may be reviewed and copied at the SEC's Public Reference Room in Washington, D.C. Information on the operation of the Public Reference Room may be obtained by calling 800.SEC.0330. Each fund's complete schedule of portfolio holdings, as filed on Form N-Q, can also be obtained without charge, upon request, by calling 800.345.6611.
Annual Report 2013
41

Columbia New York Intermediate Municipal Bond Fund
P.O. Box 8081
Boston, MA 02266-8081
columbiamanagement.com
This information is for use with concurrent or prior delivery of a fund prospectus. Please read and consider the investment objectives, risks, charges and expenses for any fund carefully before investing. For a prospectus and, if available, a summary prospectus, which contains this and other important information about the Fund go to columbiamanagement.com. The Fund is distributed by Columbia Management Investment Distributors, Inc., member FINRA, and managed by Columbia Management Investment Advisers, LLC.
© 2013 Columbia Management Investment Advisers, LLC. All rights reserved.
ANN204_10_C01_(12/13)
Annual Report
October 31, 2013

Columbia Massachusetts Intermediate Municipal Bond Fund
Not FDIC insured • No bank guarantee • May lose value
 Dear Shareholders,
A market rally led by equities
Despite threats of military action in Syria, rumblings from Iran and an impending showdown over the debt ceiling here at home, the U.S. financial markets delivered positive results in the third quarter of 2013. Stocks outperformed bonds by a substantial margin. Still, robust growth continued to elude the U.S. economy, which merely plodded along. New job growth was solid but not spectacular. Consumer spending remained steady, but the only obvious beneficiary was the auto industry. Gains in the housing market met some headwinds, as mortgage rates rose and sales slipped somewhat. Nevertheless, the recovery in housing remained intact.
The Federal Reserve (the Fed) unsettled investors with a hint that it was ready to taper its purchase of U.S. Treasury and mortgage securities. However, its failure to take any action in a September meeting rallied stocks to new highs and brought bonds back into positive territory for the quarter. Small-cap stocks were the U.S. market leaders. Growth outperformed value in a quarter dominated by the materials, industrials and consumer discretionary sectors. Developed markets led the global rally, driven by strengthening economic conditions in the eurozone. Certain emerging stock markets, including China's, bounced back with returns in line with those of the United States. India and Indonesia were exceptions to that trend, as fears of the Fed's tapering efforts rattled investors in both countries.
Improved risk appetites boosted fixed income
Following a weak second quarter, the fixed-income markets made up some ground in the third quarter of 2013. As yields fell, bond prices rallied enough to push returns on non-Treasury sectors into positive territory. Risk appetites improved in response to continued liquidity from the Fed. Against this backdrop, U.S. high-yield and foreign bonds led the fixed-income markets, along with mortgage-backed securities and emerging market bonds. The U.S. municipal bond market was the exception, as it slipped into negative territory in the final week of the period, pressured by heightened concerns over Puerto Rico, potential municipal bankruptcies and continued fund redemptions.
Stay on track with Columbia Management
Backed by more than 100 years of experience, Columbia Management is one of the nation's largest asset managers. At the heart of our success and, most importantly, that of our investors, are highly talented industry professionals, brought together by a unique way of working. At Columbia Management, reaching our performance goals matters, and how we reach them matters just as much.
Visit columbiamanagement.com for:
> The Columbia Management Perspectives blog, offering insights on current market events and investment opportunities
> Detailed up-to-date fund performance and portfolio information
> Quarterly fund commentaries
> Columbia Management Investor, our award-winning quarterly newsletter for shareholders
Thank you for your continued support of the Columbia Funds. We look forward to serving your investment needs for many years to come.
Best Regards,

J. Kevin Connaughton
President, Columbia Funds
Investing involves risk including the risk of loss of principal.
Investors should consider the investment objectives, risks, charges and expenses of a mutual fund carefully before investing. For a free prospectus and, if available, a summary prospectus, which contains this and other important information about a fund, visit columbiamanagement.com. The prospectus should be read carefully before investing.
Columbia Funds are distributed by Columbia Management Investment Distributors, Inc., member FINRA, and managed by Columbia Management Investment Advisers, LLC.
© 2013 Columbia Management Investment Advisers, LLC. All rights reserved.
Columbia Massachusetts Intermediate Municipal Bond Fund
Performance Overview | | | 2 | | |
Manager Discussion of Fund Performance | | | 4 | | |
Understanding Your Fund's Expenses | | | 6 | | |
Portfolio of Investments | | | 7 | | |
Statement of Assets and Liabilities | | | 14 | | |
Statement of Operations | | | 16 | | |
Statement of Changes in Net Assets | | | 17 | | |
Financial Highlights | | | 19 | | |
Notes to Financial Statements | | | 25 | | |
Report of Independent Registered
Public Accounting Firm | | | 31 | | |
Federal Income Tax Information | | | 32 | | |
Trustees and Officers | | | 33 | | |
Board Consideration and Approval of Advisory Agreement | | | 36 | | |
Important Information About This Report | | | 41 | | |
Fund Investment Manager
Columbia Management Investment
Advisers, LLC
225 Franklin Street
Boston, MA 02110
Fund Distributor
Columbia Management Investment
Distributors, Inc.
225 Franklin Street
Boston, MA 02110
Fund Transfer Agent
Columbia Management Investment
Services Corp.
P.O. Box 8081
Boston, MA 02266-8081
For more information about any of the funds, please visit columbiamanagement.com or call 800.345.6611. Customer Service Representatives are available to answer your questions Monday through Friday from 8 a.m. to 8 p.m. Eastern time.
The views expressed in this report reflect the current views of the respective parties. These views are not guarantees of future performance and involve certain risks, uncertainties and assumptions that are difficult to predict, so actual outcomes and results may differ significantly from the views expressed. These views are subject to change at any time based upon economic, market or other conditions and the respective parties disclaim any responsibility to update such views. These views may not be relied on as investment advice and, because investment decisions for a Columbia Fund are based on numerous factors, may not be relied on as an indication of trading intent on behalf of any particular Columbia Fund. References to specific securities should not be construed as a recommendation or investment advice.
Columbia Massachusetts Intermediate Municipal Bond Fund
Performance Summary
> Columbia Massachusetts Intermediate Municipal Bond Fund (the Fund) Class A shares returned -1.58% excluding sales charges for the 12-month period that ended October 31, 2013. The Fund's Class Z shares returned -1.33% for the same time period.
> By comparison, the Fund's benchmark, the Barclays 3-15 Year Blend Municipal Bond Index, returned -0.53% for the 12-month period.
> The Fund's exposure to issues backed by special non-property taxes and local general obligations-related credits detracted from performance.
Average Annual Total Returns (%) (for period ended October 31, 2013)
| | Inception | | 1 Year | | 5 Years | | 10 Years | |
Class A | | 12/09/02 | | | | | | | | | | | | | |
Excluding sales charges | | | | | | | -1.58 | | | | 5.05 | | | | 3.45 | | |
Including sales charges | | | | | | | -4.77 | | | | 4.36 | | | | 2.95 | | |
Class B | | 12/09/02 | | | | | | | | | | | | | |
Excluding sales charges | | | | | | | -2.37 | | | | 4.25 | | | | 2.68 | | |
Including sales charges | | | | | | | -5.24 | | | | 4.25 | | | | 2.68 | | |
Class C | | 12/09/02 | | | | | | | | | | | | | |
Excluding sales charges | | | | | | | -1.97 | | | | 4.63 | | | | 3.04 | | |
Including sales charges | | | | | | | -2.92 | | | | 4.63 | | | | 3.04 | | |
Class R4* | | 03/19/13 | | | -1.33 | | | | 5.31 | | | | 3.71 | | |
Class T | | 06/26/00 | | | | | | | | | | | | | |
Excluding sales charges | | | | | | | -1.48 | | | | 5.15 | | | | 3.56 | | |
Including sales charges | | | | | | | -6.19 | | | | 4.14 | | | | 3.06 | | |
Class Z | | 06/14/93 | | | -1.33 | | | | 5.31 | | | | 3.71 | | |
Barclays 3-15 Year Blend Municipal Bond Index | | | | | | | -0.53 | | | | 5.88 | | | | 4.47 | | |
Returns for Class A are shown with and without the maximum initial sales charge of 3.25% (for the one-year and five-year periods) and 4.75% (for the 10-year period). (Prior to August 22, 2005, new purchases of Class A shares had a maximum initial sales charge of 4.75%.) Returns for Class B are shown with and without the applicable contingent deferred sales charge (CDSC) of 3.00% in the first year, declining to 1.00% in the fourth year and eliminated thereafter. Returns for Class C are shown with and without the 1.00% CDSC for the first year only. Returns for Class T are shown with and without the maximum sales charge of 4.75%. The Fund's other classes are not subject to sales charges and have limited eligibility. Please see the Fund's prospectus for details. Performance for different share classes will vary based on differences in sales charges and fees associated with each class. All results shown assume reinvestment of distributions during the period. Returns do not reflect the deduction of taxes that a shareholder may pay on Fund distributions or on the redemption of Fund shares. Performance results reflect the effect of any fee waivers or reimbursements of Fund expenses by Columbia Management Investment Advisers, LLC and/or any of its affiliates. Absent these fee waivers or expense reimbursement arrangements, performance results would have been lower.
The performance information shown represents past performance and is not a guarantee of future results. The investment return and principal value of your investment will fluctuate so that your shares, when redeemed, may be worth more or less than their original cost. Current performance may be lower or higher than the performance information shown. You may obtain performance information current to the most recent month-end by contacting your financial intermediary, visiting columbiamanagement.com or calling 800.345.6611.
*The returns shown for periods prior to the share class inception date (including returns for the Life of the Fund, if shown, which are since Fund inception) include the returns of the Fund's oldest share class. These returns are adjusted to reflect any higher class-related operating expenses of the newer share classes, as applicable. Please visit columbiamanagement.com/mutual-funds/appended-performance for more information.
The Barclays 3-15 Year Blend Municipal Bond Index is an unmanaged index that tracks the performance of municipal bonds issued after December 31, 1990, with remaining maturities between 2 and 17 years and at least $7 million in principal amount outstanding.
Indices are not available for investment, are not professionally managed and do not reflect sales charges, fees, brokerage commissions, taxes or other expenses of investing. Securities in the Fund may not match those in an index.
Annual Report 2013
2
Columbia Massachusetts Intermediate Municipal Bond Fund
Performance Overview (continued)
Performance of a Hypothetical $10,000 Investment (November 1, 2003 – October 31, 2013)

The chart above shows the change in value of a hypothetical $10,000 investment in Class A shares of Columbia Massachusetts Intermediate Municipal Bond Fund during the stated time period, and does not reflect the deduction of taxes that a shareholder may pay on Fund distributions or on the redemption of Fund shares. The performance of a $10,000 with sales charge for Class A shares is calculated with an initial sales charge of 4.75%, which was the effective sales charge prior to August 22, 2005.
Annual Report 2013
3
Columbia Massachusetts Intermediate Municipal Bond Fund
Manager Discussion of Fund Performance
For the 12-month period that ended October 31, 2013, the Fund's Class A shares returned -1.58% excluding sales charges. The Fund's Class Z shares returned -1.33% for the same time period. By comparison, the Fund's benchmark, the Barclays 3-15 Year Blend Municipal Bond Index, which is a national mix of municipal securities, returned -0.53% for the 12-month period. The Fund's exposure to issues backed by special non-property taxes and local general obligations-related credits detracted from performance, while shorter-maturity hospital and pre-refunded bonds aided performance during the period.
Second Half Rate Rise Pressures Municipal Market
The first half of the Fund's fiscal year was relatively uneventful, with interest rates range bound from November 2012 through April 2013. However, the Federal Reserve's (the Fed's) May announcement that it might begin to taper its monthly securities purchase program, known popularly as QE3 (the QE for "quantitative easing"), drove a sharp sell-off in the municipal market from May through mid-September. During this period 10-year AAA municipal yields rose to close to 3.00%, matching the yield on the 10-year Treasury. New issue supply was down versus 2012, as higher rates made refinancing less viable. In addition, two major credit events clouded the outlook for municipal bonds: the city of Detroit filed for bankruptcy and Puerto Rico bonds fell sharply on negative economic news. Puerto Rico bonds are widely held in many mutual funds because they are triple tax-free.
Within the benchmark, returns were slightly positive on one, three and five-year municipal bonds. The worst returns were generated by bonds in the 12-17 year range. A rated bonds posted slightly better returns than higher quality AA and AAA rated bonds, due to the additional yield they generated. BBB rated bonds were the worst performers, dragged down by Puerto Rico exposure.
Fund's Duration Positioning Hampered Results
Early in the period, we kept the Fund's duration (sensitivity to interest rates) moderately long relative to its benchmark, because we did not expect interest rates to rise significantly. However, after the Fed's announced plan to wind down its monthly asset purchases, which sent interest rates sharply higher and spurred outflows from municipal bond funds, we sold bonds purchased at lower yields and sub-5% coupon bonds, which we expected to remain out of favor. We also reduced the portfolio's duration to protect against a protracted rise in interest rates. As a result of these actions, we realized losses that offset gains from previous activity. This allowed us to manage the gain/loss position of the Fund and not distribute taxable capital gains. Selling bonds purchased in lower interest rate environments also improved the distribution yield of the Fund. However, the Fund's yield is lower than the benchmark's yield, generally because the Massachusetts municipal market is of higher quality (and lower yielding) than the national market. Even so, we seek opportunities to add incremental yield to the portfolio whenever possible.
Contributors and Detractors
The Fund had more exposure than the benchmark to shorter-maturity hospital bonds and pre-refunded bonds, which made positive contributions to performance in a period in which most areas of the market generated negative results. Pre-refunding bonds are issued to fund another callable bond, taking the
Portfolio Management
Brian McGreevy
Paul Fuchs, CFA
Quality Breakdown (%)
(at October 31, 2013) | |
AAA rating | | | 6.6 | | |
AA rating | | | 53.2 | | |
A rating | | | 26.7 | | |
BBB rating | | | 13.5 | | |
Total | | | 100.0 | | |
Percentages indicated are based upon total fixed income securities (excluding Money Market Funds).
Bond ratings apply to the underlying holdings of the Fund and not the Fund itself and are divided into categories ranging from AAA (highest) to D (lowest), and are subject to change. The ratings shown are determined by using the middle rating of Moody's, S&P, and Fitch after dropping the highest and lowest available ratings. When a rating from only two agencies is available, the lower rating is used. When a rating from only one agency is available, that rating is used. When a bond is not rated by one of these agencies, it is designated as Not rated. Credit ratings are subjective opinions and not statements of fact.
Investment Risks
There are risks associated with an investment in a municipal bond fund, including credit risk, interest rate risk, prepayment and extension risk, and geographic concentration risk. In general, bond prices rise when interest rates fall and vice versa. This effect is more pronounced for longer-term securities. Because the Fund concentrates its investments in municipal securities issued by a single state and its municipalities, specific events or factors affecting a particular state can cause more volatility in the Fund than a fund that is more geographically diversified. Non-investment grade securities, commonly called "high-yield" or "junk" bonds, have more volatile prices and carry more risk to principal and income than investment grade securities. Income from tax-exempt funds may be subject to state and local taxes and a portion of income may be subject to the federal and/or state alternative minimum tax for certain investors. Federal and state income tax rules will apply to any capital gain distributions and any gains or losses on sales. See the Fund's prospectus for information on these and other risks.
Annual Report 2013
4
Columbia Massachusetts Intermediate Municipal Bond Fund
Manager Discussion of Fund Performance (continued)
proceeds from the lower-yielding bond and investing it in U.S. Treasury bonds until the scheduled call date of the original bond occurs. Pre-refunding typically occurs when the issuer can issue a new bond at a lower rate. The Fund's exposure to special non-property and local general obligations-related credits detracted from performance, driven mainly by the timing of purchases and sales and not by credit deterioration.
Moderate Growth for Massachusetts
Employment is rising at a moderate pace, driven primarily by growth in the housing, technology and health care sectors. Within the public sector, state payrolls are expected to trend higher as the Commonwealth's fiscal situation improves. Early 2013 calendar year tax collections were sharply higher than one year earlier. Over the longer term, the Commonwealth stands to benefit from its research universities and highly skilled workforce. However, federal government payrolls fell more than the national average over the past year. Little population growth, high business costs and federal government austerity will likely weigh on the pace of growth going forward.
Looking Ahead
We currently intend to continue seeking opportunities to add higher yielding A and BBB rated issues when we can do so with issues that we believe are attractively valued and offer sound fundamentals. At present, we plan to maintain the Fund's neutral duration relative to the benchmark until there is more clarity around the Fed's intentions and the arrival of a new Fed chairman at the beginning of 2014. Purchases are currently targeted in the eight- to 12-year maturity range, where we see value because we believe the vast majority of yield available in the intermediate space can be captured in this maturity range
Annual Report 2013
5
Columbia Massachusetts Intermediate Municipal Bond Fund
Understanding Your Fund's Expenses
(Unaudited)
As an investor, you incur two types of costs. There are transaction costs, which generally include sales charges on purchases and may include redemption fees. There are also ongoing costs, which generally include management fees, distribution and service (Rule 12b-1) fees, and other fund expenses. The following information is intended to help you understand your ongoing costs (in dollars) of investing in the Fund and to help you compare these costs with the ongoing costs of investing in other mutual funds.
Analyzing Your Fund's Expenses
To illustrate these ongoing costs, we have provided examples and calculated the expenses paid by investors in each share class of the Fund during the period. The actual and hypothetical information in the table is based on an initial investment of $1,000 at the beginning of the period indicated and held for the entire period. Expense information is calculated two ways and each method provides you with different information. The amount listed in the "Actual" column is calculated using the Fund's actual operating expenses and total return for the period. You may use the Actual information, together with the amount invested, to estimate the expenses that you paid over the period. Simply divide your account value by $1,000 (for example, an $8,600 account value divided by $1,000 = 8.6), then multiply the results by the expenses paid during the period under the Actual column. The amount listed in the "Hypothetical" column assumes a 5% annual rate of return before expenses (which is not the Fund's actual return) and then applies the Fund's actual expense ratio for the period to the hypothetical return. You should not use the hypothetical account values and expenses to estimate either your actual account balance at the end of the period or the expenses you paid during the period. See "Compare With Other Funds" below for details on how to use the hypothetical data.
Compare With Other Funds
Since all mutual funds are required to include the same hypothetical calculations about expenses in shareholder reports, you can use this information to compare the ongoing cost of investing in the Fund with other funds. To do so, compare the hypothetical example with the 5% hypothetical examples that appear in the shareholder reports of other funds. As you compare hypothetical examples of other funds, it is important to note that hypothetical examples are meant to highlight the ongoing costs of investing in a fund only and do not reflect any transaction costs, such as sales charges, or redemption or exchange fees. Therefore, the hypothetical calculations are useful in comparing ongoing costs only, and will not help you determine the relative total costs of owning different funds. If transaction costs were included in these calculations, your costs would be higher.
May 1, 2013 – October 31, 2013
| | Account Value at the Beginning
of the Period ($) | | Account Value at the End of the
Period ($) | | Expenses Paid During the
Period ($) | | Fund's Annualized
Expense Ratio (%) | |
| | Actual | | Hypothetical | | Actual | | Hypothetical | | Actual | | Hypothetical | | Actual | |
Class A | | | 1,000.00 | | | | 1,000.00 | | | | 973.60 | | | | 1,021.12 | | | | 4.03 | | | | 4.13 | | | | 0.81 | | |
Class B | | | 1,000.00 | | | | 1,000.00 | | | | 969.30 | | | | 1,017.34 | | | | 7.74 | | | | 7.93 | | | | 1.56 | | |
Class C | | | 1,000.00 | | | | 1,000.00 | | | | 971.60 | | | | 1,019.11 | | | | 6.01 | | | | 6.16 | | | | 1.21 | | |
Class R4 | | | 1,000.00 | | | | 1,000.00 | | | | 974.80 | | | | 1,022.38 | | | | 2.79 | | | | 2.85 | | | | 0.56 | | |
Class T | | | 1,000.00 | | | | 1,000.00 | | | | 974.10 | | | | 1,021.63 | | | | 3.53 | | | | 3.62 | | | | 0.71 | | |
Class Z | | | 1,000.00 | | | | 1,000.00 | | | | 974.80 | | | | 1,022.38 | | | | 2.79 | | | | 2.85 | | | | 0.56 | | |
Expenses paid during the period are equal to the annualized expense ratio for each class as indicated above, multiplied by the average account value over the period and then multiplied by the number of days in the Fund's most recent fiscal half year and divided by 365.
Expenses do not include fees and expenses incurred indirectly by the Fund from the underlying funds in which the Fund may invest (also referred to as "acquired funds"), including affiliated and non-affiliated pooled investment vehicles (including mutual funds and exchange-traded funds).
Had Columbia Management Investment Advisers, LLC and/or certain of its affiliates not waived/reimbursed certain fees and expenses, account value at the end of the period would have been reduced.
Annual Report 2013
6
Columbia Massachusetts Intermediate Municipal Bond Fund
Portfolio of Investments
October 31, 2013
(Percentages represent value of investments compared to net assets)
Municipal Bonds 98.5%
Issue
Description | | Coupon
Rate | | Principal
Amount ($) | |
Value ($) | |
Airport 2.7% | |
Massachusetts Port Authority
Refunding Revenue Bonds
Passenger Facility Charge
Series 2007D (AGM)
07/01/17 | | | 5.000 | % | | | 3,000,000 | | | | 3,402,000 | | |
Revenue Bonds
Series 2005C (AMBAC)
07/01/15 | | | 5.000 | % | | | 1,500,000 | | | | 1,616,070 | | |
07/01/22 | | | 5.000 | % | | | 3,500,000 | | | | 3,742,585 | | |
Total | | | | | | | 8,760,655 | | |
Assisted Living 0.6% | |
Massachusetts Development Finance Agency
Refunding Revenue Bonds
1st Mortgage VOA Concord
Series 2007
11/01/17 | | | 5.000 | % | | | 435,000 | | | | 437,662 | | |
11/01/27 | | | 5.125 | % | | | 1,500,000 | | | | 1,348,605 | | |
Total | | | | | | | 1,786,267 | | |
Higher Education 19.8% | |
Massachusetts Development Finance Agency
Revenue Bonds
Boston College
Series 2007P
07/01/20 | | | 5.000 | % | | | 3,260,000 | | | | 3,687,484 | | |
Boston University
Series 2009V-2
10/01/14 | | | 2.875 | % | | | 3,000,000 | | | | 3,074,580 | | |
Brandeis University
Series 2010O-2
10/01/24 | | | 5.000 | % | | | 5,000,000 | | | | 5,605,500 | | |
Emerson College
Series 2006A
01/01/20 | | | 5.000 | % | | | 870,000 | | | | 934,693 | | |
01/01/21 | | | 5.000 | % | | | 2,500,000 | | | | 2,662,350 | | |
01/01/23 | | | 5.000 | % | | | 1,000,000 | | | | 1,053,450 | | |
Hampshire College
Series 2004
10/01/14 | | | 5.150 | % | | | 45,000 | | | | 45,927 | | |
Massachusetts College-Pharmacy & Allied Health
Series 2013
07/01/25 | | | 5.000 | % | | | 675,000 | | | | 769,898 | | |
Merrimack College
Series 2012A
07/01/27 | | | 5.000 | % | | | 1,075,000 | | | | 1,064,433 | | |
Mount Holyoke College
Series 2008
07/01/23 | | | 5.000 | % | | | 1,285,000 | | | | 1,455,777 | | |
Simmons College
Series 2013J
10/01/24 | | | 5.250 | % | | | 500,000 | | | | 557,885 | | |
10/01/25 | | | 5.500 | % | | | 450,000 | | | | 507,348 | | |
Municipal Bonds (continued)
Issue
Description | | Coupon
Rate | | Principal
Amount ($) | |
Value ($) | |
Wheelock College
Series 2007C
10/01/17 | | | 5.000 | % | | | 960,000 | | | | 1,060,704 | | |
Worcester Polytechnic Institute
Series 2007 (NPFGC)
09/01/22 | | | 5.000 | % | | | 1,710,000 | | | | 1,909,557 | | |
Massachusetts Health & Educational Facilities Authority
Revenue Bonds
Berklee College of Music
Series 2007A
10/01/32 | | | 5.000 | % | | | 2,440,000 | | | | 2,575,005 | | |
Boston College
Series 2008M-1
06/01/24 | | | 5.500 | % | | | 3,000,000 | | | | 3,626,220 | | |
Massachusetts Institute of Technology
Series 2002K
07/01/17 | | | 5.375 | % | | | 2,275,000 | | | | 2,660,294 | | |
07/01/22 | | | 5.500 | % | | | 1,000,000 | | | | 1,261,350 | | |
Series 2004M
07/01/19 | | | 5.250 | % | | | 610,000 | | | | 739,003 | | |
Northeastern University
Series 2008T-1
10/01/28 | | | 5.000 | % | | | 1,750,000 | | | | 1,874,687 | | |
Series 2008T-2
10/01/29 | | | 5.000 | % | | | 4,045,000 | | | | 4,271,156 | | |
Simmons College
Series 2009I
10/01/18 | | | 6.750 | % | | | 1,365,000 | | | | 1,638,437 | | |
Suffolk University
Series 2009A
07/01/24 | | | 6.000 | % | | | 2,100,000 | | | | 2,371,089 | | |
Tufts University
Series 2002J
08/15/16 | | | 5.500 | % | | | 1,500,000 | | | | 1,699,620 | | |
Series 2008
08/15/14 | | | 5.000 | % | | | 1,250,000 | | | | 1,296,763 | | |
08/15/17 | | | 5.000 | % | | | 1,145,000 | | | | 1,319,864 | | |
Massachusetts Health & Educational Facilities Authority(a)
Revenue Bonds
Northeastern University
Series 2008T-3
10/01/37 | | | 2.700 | % | | | 2,495,000 | | | | 2,511,816 | | |
Massachusetts State College Building Authority
Revenue Bonds
Series 2012A
05/01/29 | | | 5.000 | % | | | 3,000,000 | | | | 3,279,930 | | |
University of Massachusetts Building Authority
Revenue Bonds
Senior Series 2008-2 (AGM)
05/01/21 | | | 5.000 | % | | | 1,510,000 | | | | 1,706,028 | | |
Senior Series 2009-1
05/01/23 | | | 5.000 | % | | | 5,000,000 | | | | 5,705,500 | | |
Total | | | | | | | 62,926,348 | | |
The accompanying Notes to Financial Statements are an integral part of this statement.
Annual Report 2013
7
Columbia Massachusetts Intermediate Municipal Bond Fund
Portfolio of Investments (continued)
October 31, 2013
Municipal Bonds (continued)
Issue
Description | | Coupon
Rate | | Principal
Amount ($) | |
Value ($) | |
Hospital 9.8% | |
Massachusetts Development Finance Agency
Revenue Bonds
Berkshire Health System
Series 2012G
10/01/26 | | | 5.000 | % | | | 1,200,000 | | | | 1,266,528 | | |
Boston Medical Center
Series 2012C
07/01/27 | | | 5.250 | % | | | 3,695,000 | | | | 3,816,824 | | |
Southcoast Health System Obligation Group
Series 2013
07/01/27 | | | 5.000 | % | | | 765,000 | | | | 825,795 | | |
UMASS Memorial Issue
Series 2011H
07/01/26 | | | 5.125 | % | | | 2,000,000 | | | | 2,103,360 | | |
Massachusetts Health & Educational Facilities Authority
Revenue Bonds
Caregroup
Series 1998B-2 (NPFGC)
02/01/27 | | | 5.375 | % | | | 1,585,000 | | | | 1,718,869 | | |
Series 2004D (NPFGC)
07/01/22 | | | 5.250 | % | | | 1,000,000 | | | | 1,121,690 | | |
Series 2008E-2
07/01/19 | | | 5.375 | % | | | 4,675,000 | | | | 5,313,698 | | |
Massachusetts Eye & Ear Infirmary
Series 2010 C
07/01/17 | | | 5.000 | % | | | 1,425,000 | | | | 1,572,202 | | |
Milford Regional Medical
Series 2007E
07/15/17 | | | 5.000 | % | | | 1,050,000 | | | | 1,118,744 | | |
07/15/22 | | | 5.000 | % | | | 1,500,000 | | | | 1,540,815 | | |
Partners Healthcare
Series 2010J-2
07/01/22 | | | 5.000 | % | | | 5,000,000 | | | | 5,561,500 | | |
Partners Healthcare System
Series 2005F
07/01/17 | | | 5.000 | % | | | 2,000,000 | | | | 2,135,160 | | |
Series 2007G
07/01/18 | | | 5.000 | % | | | 2,575,000 | | | | 2,916,574 | | |
Total | | | | | | | 31,011,759 | | |
Human Service Provider 0.4% | |
Massachusetts Development Finance Agency
Revenue Bonds
Evergreen Center, Inc.
Series 2005
01/01/20 | | | 5.500 | % | | | 1,355,000 | | | | 1,374,607 | | |
Joint Power Authority 4.6% | |
Berkshire Wind Power Cooperative Corp.
Revenue Bonds
Series 2010-1
07/01/24 | | | 5.250 | % | | | 3,785,000 | | | | 4,103,508 | | |
07/01/25 | | | 5.000 | % | | | 2,000,000 | | | | 2,125,680 | | |
Municipal Bonds (continued)
Issue
Description | | Coupon
Rate | | Principal
Amount ($) | |
Value ($) | |
Massachusetts Clean Energy Cooperative Corp.
Revenue Bonds
Municipal Lighting Plan Cooperative
Series 2013
07/01/27 | | | 5.000 | % | | | 2,720,000 | | | | 3,016,725 | | |
Massachusetts Municipal Wholesale Electric Co.
Revenue Bonds
Project 6
Series 2012A
07/01/16 | | | 5.000 | % | | | 2,000,000 | | | | 2,221,460 | | |
Project No. 6
Series 2011
07/01/19 | | | 5.000 | % | | | 2,760,000 | | | | 3,199,916 | | |
Total | | | | | | | 14,667,289 | | |
Local General Obligation 2.9% | |
City of Boston
Unlimited General Obligation Bonds
Series 2012A
04/01/24 | | | 4.000 | % | | | 2,150,000 | | | | 2,358,292 | | |
City of Fall River
Limited General Obligation Refunding Bonds
State Qualified
Series 2012
03/01/21 | | | 4.000 | % | | | 335,000 | | | | 364,701 | | |
City of Lawrence
Limited General Obligation Refunding Bonds
State Qualified
Series 2006 (AGM)
02/01/18 | | | 5.000 | % | | | 1,500,000 | | | | 1,693,320 | | |
City of Springfield
Limited General Obligation Bonds
State Qualified Municipal Purpose Loan
Series 2003 (AGM)
08/01/21 | | | 4.500 | % | | | 2,000,000 | | | | 2,180,360 | | |
Dudley Charlton Regional School District
Unlimited General Obligation Bonds
Series 1999A (NPFGC)
06/15/14 | | | 5.125 | % | | | 2,305,000 | | | | 2,373,481 | | |
Puerto Rico Municipal Finance Agency
Unrefunded Revenue Bonds
Series 1997A (AGM)(b)
07/01/17 | | | 5.500 | % | | | 185,000 | | | | 185,004 | | |
Total | | | | | | | 9,155,158 | | |
Municipal Power 1.0% | |
Guam Power Authority
Refunding Revenue Bonds
Series 2012A (AGM)(b)
10/01/24 | | | 5.000 | % | | | 630,000 | | | | 703,099 | | |
The accompanying Notes to Financial Statements are an integral part of this statement.
Annual Report 2013
8
Columbia Massachusetts Intermediate Municipal Bond Fund
Portfolio of Investments (continued)
October 31, 2013
Municipal Bonds (continued)
Issue
Description | | Coupon
Rate | | Principal
Amount ($) | |
Value ($) | |
Puerto Rico Electric Power Authority
Revenue Bonds
Series 2002LL (NPFGC)(b)
07/01/17 | | | 5.500 | % | | | 2,400,000 | | | | 2,355,096 | | |
Total | | | | | | | 3,058,195 | | |
Other Bond Issue 2.8% | |
Boston Housing Authority
Revenue Bonds
Series 2008 (AGM)
04/01/20 | | | 5.000 | % | | | 2,135,000 | | | | 2,348,393 | | |
04/01/23 | | | 5.000 | % | | | 1,865,000 | | | | 1,999,243 | | |
04/01/24 | | | 5.000 | % | | | 3,260,000 | | | | 3,462,544 | | |
Massachusetts Development Finance Agency
Revenue Bonds
Broad Institute
Series 2011 A
04/01/23 | | | 5.250 | % | | | 1,000,000 | | | | 1,137,390 | | |
Total | | | | | | | 8,947,570 | | |
Pool/Bond Bank 5.0% | |
Massachusetts Water Pollution Abatement Trust (The)
Refunding Revenue Bonds
Pool Program
Series 2004A
08/01/15 | | | 5.250 | % | | | 3,000,000 | | | | 3,259,440 | | |
Series 2006
08/01/20 | | | 5.250 | % | | | 3,000,000 | | | | 3,654,450 | | |
Revenue Bonds
Pool Program
Series 2005-11
08/01/19 | | | 5.250 | % | | | 4,465,000 | | | | 5,400,507 | | |
State Revolving Fund
Series 2009-14
08/01/24 | | | 5.000 | % | | | 3,100,000 | | | | 3,574,610 | | |
Total | | | | | | | 15,889,007 | | |
Prep School 1.7% | |
Massachusetts Development Finance Agency
Revenue Bonds
Foxborough Regional Charter School
Series 2010A
07/01/30 | | | 6.375 | % | | | 3,055,000 | | | | 3,230,143 | | |
Noble & Greenough School
Series 2011
04/01/21 | | | 4.000 | % | | | 1,500,000 | | | | 1,666,515 | | |
Park School
Series 2012
09/01/20 | | | 5.000 | % | | | 150,000 | | | | 170,987 | | |
09/01/21 | | | 5.000 | % | | | 330,000 | | | | 373,537 | | |
Total | | | | | | | 5,441,182 | | |
Municipal Bonds (continued)
Issue
Description | | Coupon
Rate | | Principal
Amount ($) | |
Value ($) | |
Refunded/Escrowed 8.8% | |
Commonwealth of Massachusetts
Prerefunded 08/01/14 Limited General Obligation Bonds
Consolidated Loan
Series 2004B (AMBAC)
08/01/22 | | | 5.000 | % | | | 2,000,000 | | | | 2,072,500 | | |
Commonwealth of Massachusetts(c)
Revenue Bonds
Capital Appreciation-Federal Highway
Series 1998A Escrowed to Maturity
06/15/15 | | | 0.000 | % | | | 4,000,000 | | | | 3,972,960 | | |
Massachusetts Development Finance Agency(a)
Prerefunded 05/01/19 Revenue Bonds
Dominion Energy Brayton 1
Series 2009
12/01/42 | | | 5.750 | % | | | 3,460,000 | | | | 4,246,008 | | |
Prerefunded 09/01/16 Revenue Bonds
Dominion Energy Brayton
Series 2010A
12/01/41 | | | 2.250 | % | | | 2,260,000 | | | | 2,365,994 | | |
Massachusetts School Building Authority
Prerefunded 08/15/15 Revenue Bonds
Series 2005A (AGM)
08/15/26 | | | 5.000 | % | | | 5,000,000 | | | | 5,418,700 | | |
Massachusetts State College Building Authority
Revenue Bonds
Capital Appreciation
Senior Series 1999A Escrowed to Maturity (NPFGC)(c)
05/01/28 | | | 0.000 | % | | | 4,000,000 | | | | 2,347,320 | | |
Massachusetts Water Resources Authority
Refunding Revenue Bonds
General
Series 1998B Escrowed to Maturity (AGM/TCRS)
08/01/15 | | | 5.500 | % | | | 1,095,000 | | | | 1,194,338 | | |
Revenue Bonds
General
Series 2002J Escrowed to Maturity (AGM/TCRS)
08/01/15 | | | 5.250 | % | | | 3,000,000 | | | | 3,259,080 | | |
Puerto Rico Highways & Transportation Authority
Revenue Bonds
Series 2005BB (AGM) Escrowed to Maturity(b)
07/01/22 | | | 5.250 | % | | | 1,075,000 | | | | 1,324,325 | | |
Town of Sandwich
Prerefunded 07/15/15 Unlimited General Obligation
Bonds
Series 2005 (NPFGC)
07/15/18 | | | 5.000 | % | | | 1,575,000 | | | | 1,716,388 | | |
Total | | | | | | | 27,917,613 | | |
The accompanying Notes to Financial Statements are an integral part of this statement.
Annual Report 2013
9
Columbia Massachusetts Intermediate Municipal Bond Fund
Portfolio of Investments (continued)
October 31, 2013
Municipal Bonds (continued)
Issue
Description | | Coupon
Rate | | Principal
Amount ($) | |
Value ($) | |
Retirement Communities 0.4% | |
Massachusetts Development Finance Agency
Revenue Bonds
1st Mortgage-Orchard Cove
Series 2007
10/01/17 | | | 5.000 | % | | | 845,000 | | | | 856,348 | | |
10/01/18 | | | 5.000 | % | | | 515,000 | | | | 518,801 | | |
Total | | | | | | | 1,375,149 | | |
Special Non Property Tax 9.2% | |
Commonwealth of Massachusetts
Revenue Bonds
Series 2004 (NPFGC)
01/01/19 | | | 5.250 | % | | | 750,000 | | | | 876,285 | | |
Massachusetts Bay Transportation Authority
Revenue Bonds
Senior Series 2003A
07/01/17 | | | 5.250 | % | | | 1,000,000 | | | | 1,165,630 | | |
07/01/19 | | | 5.250 | % | | | 625,000 | | | | 754,525 | | |
Senior Series 2004C
07/01/18 | | | 5.250 | % | | | 1,000,000 | | | | 1,194,840 | | |
Senior Series 2005B (NPFGC)
07/01/23 | | | 5.500 | % | | | 2,890,000 | | | | 3,623,366 | | |
Senior Series 2006A
07/01/22 | | | 5.250 | % | | | 3,500,000 | | | | 4,285,540 | | |
Senior Series 2008B
07/01/23 | | | 5.000 | % | | | 910,000 | | | | 1,099,507 | | |
Massachusetts School Building Authority
Revenue Bonds
Series 2007A (AMBAC)
08/15/18 | | | 5.000 | % | | | 5,000,000 | | | | 5,721,350 | | |
Senior Revenue Bonds
Series 2011B
10/15/27 | | | 5.000 | % | | | 4,000,000 | | | | 4,474,200 | | |
Territory of Guam
Revenue Bonds
Series 2011A(b)
01/01/31 | | | 5.000 | % | | | 950,000 | | | | 977,522 | | |
Virgin Islands Public Finance Authority(b)
Refunding Revenue Bonds
Gross Receipts Taxes
Series 2012A
10/01/22 | | | 4.000 | % | | | 2,000,000 | | | | 2,060,000 | | |
Revenue Bonds
Senior Lien-Matching Fund Loan Note
Series 2010A
10/01/25 | | | 5.000 | % | | | 2,755,000 | | | | 2,895,312 | | |
Total | | | | | | | 29,128,077 | | |
Special Property Tax 1.4% | |
Metropolitan Boston Transit Parking Corp.
Revenue Bonds
Series 2011
07/01/25 | | | 5.000 | % | | | 3,210,000 | | | | 3,565,411 | | |
Municipal Bonds (continued)
Issue
Description | | Coupon
Rate | | Principal
Amount ($) | |
Value ($) | |
07/01/27 | | | 5.000 | % | | | 775,000 | | | | 838,992 | | |
Total | | | | | | | 4,404,403 | | |
State Appropriated 0.8% | |
Massachusetts Development Finance Agency
Revenue Bonds
Visual & Performing Arts Project
Series 2000
08/01/17 | | | 6.000 | % | | | 540,000 | | | | 635,758 | | |
08/01/21 | | | 6.000 | % | | | 1,750,000 | | | | 2,085,195 | | |
Total | | | | | | | 2,720,953 | | |
State General Obligation 15.3% | |
Commonwealth of Massachusetts
Limited General Obligation Bonds
Consolidated Loan
Series 2002D (AMBAC/TCRS/BNY)
08/01/18 | | | 5.500 | % | | | 3,500,000 | | | | 4,234,265 | | |
Series 2008A
08/01/16 | | | 5.000 | % | | | 2,000,000 | | | | 2,242,260 | | |
Limited General Obligation Refunding Bonds
Series 2003D
10/01/17 | | | 5.500 | % | | | 5,000,000 | | | | 5,899,550 | | |
Series 2003D (AMBAC)
10/01/19 | | | 5.500 | % | | | 5,000,000 | | | | 6,122,700 | | |
Series 2003D (NPFGC)
10/01/20 | | | 5.500 | % | | | 2,500,000 | | | | 3,085,250 | | |
Series 2004B
08/01/20 | | | 5.250 | % | | | 3,000,000 | | | | 3,646,830 | | |
Series 2006B (AGM)
09/01/22 | | | 5.250 | % | | | 4,000,000 | | | | 4,914,320 | | |
Unlimited General Obligation Refunding Bonds
Series 2003D (AGM)
10/01/19 | | | 5.500 | % | | | 3,500,000 | | | | 4,285,890 | | |
Series 2004C (AMBAC)
12/01/24 | | | 5.500 | % | | | 5,000,000 | | | | 6,260,450 | | |
Series 2004C (NPFGC)
12/01/19 | | | 5.500 | % | | | 3,795,000 | | | | 4,657,983 | | |
Series 2008A
09/01/15 | | | 5.000 | % | | | 3,000,000 | | | | 3,258,720 | | |
Total | | | | | | | 48,608,218 | | |
Student Loan 2.6% | |
Massachusetts Educational Financing Authority
Revenue Bonds
Issue I
Series 2010A
01/01/22 | | | 5.500 | % | | | 4,625,000 | | | | 5,202,061 | | |
Series 2009I
01/01/18 | | | 5.125 | % | | | 2,905,000 | | | | 3,140,944 | | |
Total | | | | | | | 8,343,005 | | |
The accompanying Notes to Financial Statements are an integral part of this statement.
Annual Report 2013
10
Columbia Massachusetts Intermediate Municipal Bond Fund
Portfolio of Investments (continued)
October 31, 2013
Municipal Bonds (continued)
Issue
Description | | Coupon
Rate | | Principal
Amount ($) | |
Value ($) | |
Transportation 0.3% | |
Woods Hole Martha's Vineyard & Nantucket Steamship
Authority
Revenue Bonds
Series 2004B
03/01/18 | | | 5.000 | % | | | 975,000 | | | | 1,032,086 | | |
Turnpike/Bridge/Toll Road 1.6% | |
Massachusetts Department of Transportation
Revenue Bonds
Senior Series 2010B
01/01/22 | | | 5.000 | % | | | 2,180,000 | | | | 2,464,316 | | |
01/01/32 | | | 5.000 | % | | | 2,400,000 | | | | 2,487,384 | | |
Total | | | | | | | 4,951,700 | | |
Water & Sewer 6.8% | |
Massachusetts Water Resources Authority
Refunding Revenue Bonds
General
Series 2005A (NPFGC/TCRS)
08/01/17 | | | 5.250 | % | | | 6,000,000 | | | | 6,988,860 | | |
Series 2007B (AGM/TCRS)
08/01/23 | | | 5.250 | % | | | 5,500,000 | | | | 6,745,750 | | |
Series 2012B
08/01/28 | | | 5.000 | % | | | 5,000,000 | | | | 5,588,800 | | |
Municipal Bonds (continued)
Issue
Description | | Coupon
Rate | | Principal
Amount ($) | |
Value ($) | |
Revenue Bonds
General
Series 2002J (AGM/TCRS)
08/01/18 | | | 5.250 | % | | | 1,000,000 | | | | 1,191,970 | | |
Puerto Rico Commonwealth Aqueduct & Sewer Authority
Revenue Bonds
Senior Lien
Series 2008A (AGM)(b)
07/01/16 | | | 5.000 | % | | | 1,000,000 | | | | 988,770 | | |
Total | | | | | | | 21,504,150 | | |
Total Municipal Bonds
(Cost: $291,591,230) | | | | | | | 313,003,391 | | |
Money Market Funds 0.6% | |
| | | | | Shares | | Value ($) | |
Dreyfus Tax-Exempt Cash Management Fund,
0.000%(d) | | | | | 1,327,254 | | | | 1,327,254 | | |
JPMorgan Tax-Free Money Market Fund,
0.010%(d) | | | | | 546,595 | | | | 546,595 | | |
Total Money Market Funds
(Cost: $1,873,849) | | | | | | | 1,873,849 | | |
Total Investments
(Cost: $293,465,079) | | | | | | | 314,877,240 | | |
Other Assets & Liabilities, Net | | | | | | | 2,882,684 | | |
Net Assets | | | | | | | 317,759,924 | | |
Notes to Portfolio of Investments
(a) Variable rate security.
(b) Municipal obligations include debt obligations issued by or on behalf of territories, possessions, or sovereign nations within the territorial boundaries of the United States. At October 31, 2013, the value of these securities amounted to $11,489,128 or 3.62% of net assets.
(c) Zero coupon bond.
(d) The rate shown is the seven-day current annualized yield at October 31, 2013.
Abbreviation Legend
AGM Assured Guaranty Municipal Corporation
AMBAC Ambac Assurance Corporation
BNY Bank of New York
NPFGC National Public Finance Guarantee Corporation
TCRS Transferable Custodial Receipts
The accompanying Notes to Financial Statements are an integral part of this statement.
Annual Report 2013
11
Columbia Massachusetts Intermediate Municipal Bond Fund
Portfolio of Investments (continued)
October 31, 2013
Fair Value Measurements
Generally accepted accounting principles (GAAP) require disclosure regarding the inputs and valuation techniques used to measure fair value and any changes in valuation inputs or techniques. In addition, investments shall be disclosed by major category.
The Fund categorizes its fair value measurements according to a three-level hierarchy that maximizes the use of observable inputs and minimizes the use of unobservable inputs by prioritizing that the most observable input be used when available. Observable inputs are those that market participants would use in pricing an investment based on market data obtained from sources independent of the reporting entity. Unobservable inputs are those that reflect the Fund's assumptions about the information market participants would use in pricing an investment. An investment's level within the fair value hierarchy is based on the lowest level of any input that is deemed significant to the asset or liability's fair value measurement. The input levels are not necessarily an indication of the risk or liquidity associated with investments at that level. For example, certain U.S. government securities are generally high quality and liquid, however, they are reflected as Level 2 because the inputs used to determine fair value may not always be quoted prices in an active market.
Fair value inputs are summarized in the three broad levels listed below:
> Level 1 — Valuations based on quoted prices for investments in active markets that the Fund has the ability to access at the measurement date (including NAV for open-end mutual funds). Valuation adjustments are not applied to Level 1 investments.
> Level 2 — Valuations based on other significant observable inputs (including quoted prices for similar securities, interest rates, prepayment speeds, credit risks, etc.).
> Level 3 — Valuations based on significant unobservable inputs (including the Fund's own assumptions and judgment in determining the fair value of investments).
Inputs that are used in determining fair value of an investment may include price information, credit data, volatility statistics, and other factors. These inputs can be either observable or unobservable. The availability of observable inputs can vary between investments, and is affected by various factors such as the type of investment, and the volume and level of activity for that investment or similar investments in the marketplace. The inputs will be considered by the Investment Manager, along with any other relevant factors in the calculation of an investment's fair value. The Fund uses prices and inputs that are current as of the measurement date, which may include periods of market dislocations. During these periods, the availability of prices and inputs may be reduced for many investments. This condition could cause an investment to be reclassified between the various levels within the hierarchy.
Investments falling into the Level 3 category are primarily supported by quoted prices from brokers and dealers participating in the market for those investments. However, these may be classified as Level 3 investments due to lack of market transparency and corroboration to support these quoted prices. Additionally, valuation models may be used as the pricing source for any remaining investments classified as Level 3. These models may rely on one or more significant unobservable inputs and/or significant assumptions by the Investment Manager. Inputs used in valuations may include, but are not limited to, financial statement analysis, capital account balances, discount rates and estimated cash flows, and comparable company data.
Under the direction of the Fund's Board of Trustees (the Board), the Investment Manager's Valuation Committee (the Committee) is responsible for carrying out the valuation procedures approved by the Board. The Committee consists of voting and non-voting members from various groups within the Investment Manager's organization, including operations and accounting, trading and investments, compliance, risk management and legal.
The Committee meets at least monthly to review and approve valuation matters, which may include a description of specific valuation determinations, data regarding pricing information received from approved pricing vendors and brokers and the results of Board-approved valuation control policies and procedures (the Policies). The Policies address, among other things, instances when market quotations are or are not readily available, including recommendations of third party pricing vendors and a determination of appropriate pricing methodologies; events that require specific valuation determinations and assessment of fair value techniques; securities with a potential for stale pricing, including those that are illiquid, restricted, or in default; and the effectiveness of third-party pricing vendors, including periodic reviews of vendors. The Committee meets more frequently, as needed, to discuss additional valuation matters, which may include the need to review back-testing results, review time-sensitive information or approve related valuation actions. The Committee reports to the Board, with members of the Committee meeting with the Board at each of its regularly scheduled meetings to discuss valuation matters and actions during the period, similar to those described earlier.
For investments categorized as Level 3, the Committee monitors information similar to that described above, which may include: (i) data specific to the issuer or comparable issuers, (ii) general market or specific sector news and (iii) quoted prices and specific or similar security transactions. The Committee considers this data and any changes from prior periods in order to assess the reasonableness of observable and unobservable inputs, any assumptions or internal models used to value those securities and changes in fair value. This data is also used to corroborate, when available, information received from approved pricing vendors and brokers. Various factors impact the frequency of monitoring this information (which may occur as often as daily). However, the Committee may determine that changes to inputs, assumptions and models are not required as a result of the monitoring procedures performed.
The accompanying Notes to Financial Statements are an integral part of this statement.
Annual Report 2013
12
Columbia Massachusetts Intermediate Municipal Bond Fund
Portfolio of Investments (continued)
October 31, 2013
Fair Value Measurements (continued)
The following table is a summary of the inputs used to value the Fund's investments at October 31, 2013:
Description | | Level 1
Quoted Prices in Active
Markets for Identical
Assets ($) | | Level 2
Other Significant
Observable Inputs ($) | | Level 3
Significant
Unobservable Inputs ($) | | Total ($) | |
Bonds | |
Municipal Bonds | | | — | | | | 313,003,391 | | | | — | | | | 313,003,391 | | |
Total Bonds | | | — | | | | 313,003,391 | | | | — | �� | | | 313,003,391 | | |
Mutual Funds | |
Money Market Funds | | | 1,873,849 | | | | — | | | | — | | | | 1,873,849 | | |
Total Mutual Funds | | | 1,873,849 | | | | — | | | | — | | | | 1,873,849 | | |
Total | | | 1,873,849 | | | | 313,003,391 | | | | — | | | | 314,877,240 | | |
See the Portfolio of Investments for all investment classifications not indicated in the table.
The Fund's assets assigned to the Level 2 input category are generally valued using the market approach, in which a security's value is determined through reference to prices and information from market transactions for similar or identical assets.
There were no transfers of financial assets between Levels 1 and 2 during the period.
The accompanying Notes to Financial Statements are an integral part of this statement.
Annual Report 2013
13
Columbia Massachusetts Intermediate Municipal Bond Fund
Statement of Assets and Liabilities
October 31, 2013
Assets | |
Investments, at value | |
(identified cost $293,465,079) | | $ | 314,877,240 | | |
Receivable for: | |
Investments sold | | | 107,625 | | |
Capital shares sold | | | 174,363 | | |
Interest | | | 3,642,135 | | |
Expense reimbursement due from Investment Manager | | | 752 | | |
Prepaid expenses | | | 3,275 | | |
Trustees' deferred compensation plan | | | 39,754 | | |
Other assets | | | 3,805 | | |
Total assets | | | 318,848,949 | | |
Liabilities | |
Payable for: | |
Capital shares purchased | | | 100,738 | | |
Dividend distributions to shareholders | | | 856,721 | | |
Investment management fees | | | 3,480 | | |
Distribution and/or service fees | | | 471 | | |
Transfer agent fees | | | 53,823 | | |
Administration fees | | | 600 | | |
Chief compliance officer expenses | | | 23 | | |
Other expenses | | | 33,415 | | |
Trustees' deferred compensation plan | | | 39,754 | | |
Total liabilities | | | 1,089,025 | | |
Net assets applicable to outstanding capital stock | | $ | 317,759,924 | | |
Represented by | |
Paid-in capital | | $ | 297,301,518 | | |
Excess of distributions over net investment income | | | (32,902 | ) | |
Accumulated net realized loss | | | (920,853 | ) | |
Unrealized appreciation (depreciation) on: | |
Investments | | | 21,412,161 | | |
Total — representing net assets applicable to outstanding capital stock | | $ | 317,759,924 | | |
The accompanying Notes to Financial Statements are an integral part of this statement.
Annual Report 2013
14
Columbia Massachusetts Intermediate Municipal Bond Fund
Statement of Assets and Liabilities (continued)
October 31, 2013
Class A | |
Net assets | | $ | 25,699,219 | | |
Shares outstanding | | | 2,370,808 | | |
Net asset value per share | | $ | 10.84 | | |
Maximum offering price per share(a) | | $ | 11.20 | | |
Class B | |
Net assets | | $ | 1,462 | | |
Shares outstanding | | | 135 | | |
Net asset value per share(b) | | $ | 10.84 | | |
Class C | |
Net assets | | $ | 11,243,961 | | |
Shares outstanding | | | 1,037,362 | | |
Net asset value per share | | $ | 10.84 | | |
Class R4 | |
Net assets | | $ | 60,397 | | |
Shares outstanding | | | 5,576 | | |
Net asset value per share | | $ | 10.83 | | |
Class T | |
Net assets | | $ | 23,130,949 | | |
Shares outstanding | | | 2,133,715 | | |
Net asset value per share | | $ | 10.84 | | |
Maximum offering price per share(a) | | $ | 11.38 | | |
Class Z | |
Net assets | | $ | 257,623,936 | | |
Shares outstanding | | | 23,764,821 | | |
Net asset value per share | | $ | 10.84 | | |
(a) The maximum offering price per share is calculated by dividing the net asset value per share by 1.0 minus the maximum sales charge of 3.25% for Class A and 4.75% for Class T.
(b) Net asset value per share rounds to this amount due to fractional shares outstanding.
The accompanying Notes to Financial Statements are an integral part of this statement.
Annual Report 2013
15
Columbia Massachusetts Intermediate Municipal Bond Fund
Statement of Operations
Year Ended October 31, 2013
Net investment income | |
Income: | |
Dividends | | $ | 248 | | |
Interest | | | 12,890,987 | | |
Total income | | | 12,891,235 | | |
Expenses: | |
Investment management fees | | | 1,414,463 | | |
Distribution and/or service fees | |
Class A | | | 75,422 | | |
Class B | | | 428 | | |
Class C | | | 122,841 | | |
Class T | | | 39,220 | | |
Transfer agent fees | |
Class A | | | 57,817 | | |
Class B | | | 82 | | |
Class C | | | 23,539 | | |
Class R4(a) | | | 58 | | |
Class T | | | 50,088 | | |
Class Z | | | 545,936 | | |
Administration fees | | | 242,345 | | |
Compensation of board members | | | 25,425 | | |
Custodian fees | | | 4,047 | | |
Printing and postage fees | | | 25,526 | | |
Registration fees | | | 24,125 | | |
Professional fees | | | 33,206 | | |
Chief compliance officer expenses | | | 226 | | |
Other | | | 14,824 | | |
Total expenses | | | 2,699,618 | | |
Fees waived or expenses reimbursed by Investment Manager and its affiliates | | | (553,959 | ) | |
Fees waived by Distributor — Class C | | | (43,021 | ) | |
Expense reductions | | | (140 | ) | |
Total net expenses | | | 2,102,498 | | |
Net investment income | | | 10,788,737 | | |
Realized and unrealized gain (loss) — net | |
Net realized gain (loss) on: | |
Investments | | | (920,854 | ) | |
Net realized loss | | | (920,854 | ) | |
Net change in unrealized appreciation (depreciation) on: | |
Investments | | | (15,498,721 | ) | |
Net change in unrealized appreciation (depreciation) | | | (15,498,721 | ) | |
Net realized and unrealized loss | | | (16,419,575 | ) | |
Net decrease in net assets from operations | | $ | (5,630,838 | ) | |
(a) For the period from March 19, 2013 (commencement of operations) to October 31, 2013.
The accompanying Notes to Financial Statements are an integral part of this statement.
Annual Report 2013
16
Columbia Massachusetts Intermediate Municipal Bond Fund
Statement of Changes in Net Assets
| | | Year Ended
October 31,
2013(a) | | Year Ended
October 31,
2012 | |
Operations | |
Net investment income | | $ | 10,788,737 | | | $ | 11,621,768 | | |
Net realized gain (loss) | | | (920,854 | ) | | | 235,614 | | |
Net change in unrealized appreciation (depreciation) | | | (15,498,721 | ) | | | 12,977,036 | | |
Net increase (decrease) in net assets resulting from operations | | | (5,630,838 | ) | | | 24,834,418 | | |
Distributions to shareholders | |
Net investment income | |
Class A | | | (861,094 | ) | | | (971,229 | ) | |
Class B | | | (885 | ) | | | (2,701 | ) | |
Class C | | | (301,560 | ) | | | (277,975 | ) | |
Class R4 | | | (971 | ) | | | — | | |
Class T | | | (772,676 | ) | | | (1,001,276 | ) | |
Class Z | | | (8,844,907 | ) | | | (9,362,111 | ) | |
Net realized gains | |
Class A | | | (20,015 | ) | | | (33,104 | ) | |
Class B | | | (52 | ) | | | (154 | ) | |
Class C | | | (7,543 | ) | | | (10,855 | ) | |
Class T | | | (18,418 | ) | | | (37,440 | ) | |
Class Z | | | (189,557 | ) | | | (303,309 | ) | |
Total distributions to shareholders | | | (11,017,678 | ) | | | (12,000,154 | ) | |
Increase (decrease) in net assets from capital stock activity | | | (45,286,824 | ) | | | 7,854,448 | | |
Total increase (decrease) in net assets | | | (61,935,340 | ) | | | 20,688,712 | | |
Net assets at beginning of year | | | 379,695,264 | | | | 359,006,552 | | |
Net assets at end of year | | $ | 317,759,924 | | | $ | 379,695,264 | | |
Excess of distributions over net investment income | | $ | (32,902 | ) | | $ | (9,434 | ) | |
(a) Class R4 shares are for the period from March 19, 2013 (commencement of operations) to October 31, 2013.
The accompanying Notes to Financial Statements are an integral part of this statement.
Annual Report 2013
17
Columbia Massachusetts Intermediate Municipal Bond Fund
Statement of Changes in Net Assets (continued)
| | | Year Ended October 31, 2013(a) | | Year Ended October 31, 2012 | |
| | | Shares | | Dollars ($) | | Shares | | Dollars ($) | |
Capital stock activity | |
Class A shares | |
Subscriptions(b) | | | 740,966 | | | | 8,279,822 | | | | 1,496,976 | | | | 16,795,784 | | |
Distributions reinvested | | | 58,311 | | | | 644,552 | | | | 47,187 | | | | 531,355 | | |
Redemptions | | | (1,285,182 | ) | | | (14,119,884 | ) | | | (1,412,576 | ) | | | (15,869,515 | ) | |
Net increase (decrease) | | | (485,905 | ) | | | (5,195,510 | ) | | | 131,587 | | | | 1,457,624 | | |
Class B shares | |
Subscriptions | | | 44 | | | | 493 | | | | 2,956 | | | | 33,415 | | |
Distributions reinvested | | | 34 | | | | 378 | | | | 63 | | | | 704 | | |
Redemptions(b) | | | (8,698 | ) | | | (96,556 | ) | | | (7,547 | ) | | | (85,026 | ) | |
Net decrease | | | (8,620 | ) | | | (95,685 | ) | | | (4,528 | ) | | | (50,907 | ) | |
Class C shares | |
Subscriptions | | | 259,514 | | | | 2,907,720 | | | | 251,681 | | | | 2,819,614 | | |
Distributions reinvested | | | 18,720 | | | | 206,855 | | | | 16,149 | | | | 181,711 | | |
Redemptions | | | (296,366 | ) | | | (3,250,413 | ) | | | (119,050 | ) | | | (1,336,435 | ) | |
Net increase (decrease) | | | (18,132 | ) | | | (135,838 | ) | | | 148,780 | | | | 1,664,890 | | |
Class R4 shares | |
Subscriptions | | | 5,490 | | | | 61,500 | | | | — | | | | — | | |
Distributions reinvested | | | 86 | | | | 930 | | | | — | | | | — | | |
Net increase | | | 5,576 | | | | 62,430 | | | | — | | | | — | | |
Class T shares | |
Subscriptions | | | 23,869 | | | | 262,719 | | | | 33,047 | | | | 371,567 | | |
Distributions reinvested | | | 31,104 | | | | 344,145 | | | | 36,159 | | | | 406,757 | | |
Redemptions | | | (567,006 | ) | | | (6,285,793 | ) | | | (614,463 | ) | | | (6,929,522 | ) | |
Net decrease | | | (512,033 | ) | | | (5,678,929 | ) | | | (545,257 | ) | | | (6,151,198 | ) | |
Class Z shares | |
Subscriptions | | | 2,503,155 | | | | 28,010,518 | | | | 3,611,918 | | | | 40,597,578 | | |
Distributions reinvested | | | 29,416 | | | | 325,449 | | | | 23,928 | | | | 269,674 | | |
Redemptions | | | (5,678,660 | ) | | | (62,579,259 | ) | | | (2,664,685 | ) | | | (29,933,213 | ) | |
Net increase (decrease) | | | (3,146,089 | ) | | | (34,243,292 | ) | | | 971,161 | | | | 10,934,039 | | |
Total net increase (decrease) | | | (4,165,203 | ) | | | (45,286,824 | ) | | | 701,743 | | | | 7,854,448 | | |
(a) Class R4 shares are for the period from March 19, 2013 (commencement of operations) to October 31, 2013.
(b) Includes conversions of Class B shares to Class A shares, if any.
The accompanying Notes to Financial Statements are an integral part of this statement.
Annual Report 2013
18
Columbia Massachusetts Intermediate Municipal Bond Fund
The following tables are intended to help you understand the Fund's financial performance. Certain information reflects financial results for a single share of a class held for the periods shown. Per share net investment income (loss) amounts are calculated based on average shares outstanding during the period. Total return assumes reinvestment of all dividends and distributions, if any. Total return does not reflect payment of sales charges, if any, and is not annualized for periods of less than one year.
| | | Year Ended October 31, | |
Class A | | 2013 | | 2012 | | 2011 | | 2010 | | 2009 | |
Per share data | |
Net asset value, beginning of period | | $ | 11.34 | | | $ | 10.95 | | | $ | 10.95 | | | $ | 10.61 | | | $ | 9.90 | | |
Income from investment operations: | |
Net investment income | | | 0.32 | | | | 0.32 | | | | 0.34 | | | | 0.34 | | | | 0.35 | | |
Net realized and unrealized gain (loss) | | | (0.50 | ) | | | 0.41 | | | | 0.00 | (a) | | | 0.34 | | | | 0.71 | | |
Total from investment operations | | | (0.18 | ) | | | 0.73 | | | | 0.34 | | | | 0.68 | | | | 1.06 | | |
Less distributions to shareholders: | |
Net investment income | | | (0.31 | ) | | | (0.33 | ) | | | (0.34 | ) | | | (0.34 | ) | | | (0.35 | ) | |
Net realized gains | | | (0.01 | ) | | | (0.01 | ) | | | (0.00 | )(a) | | | — | | | | — | | |
Total distributions to shareholders | | | (0.32 | ) | | | (0.34 | ) | | | (0.34 | ) | | | (0.34 | ) | | | (0.35 | ) | |
Net asset value, end of period | | $ | 10.84 | | | $ | 11.34 | | | $ | 10.95 | | | $ | 10.95 | | | $ | 10.61 | | |
Total return | | | (1.58 | %) | | | 6.69 | % | | | 3.24 | % | | | 6.51 | % | | | 10.78 | % | |
Ratios to average net assets(b) | |
Total gross expenses | | | 0.95 | % | | | 0.98 | % | | | 0.99 | % | | | 0.91 | % | | | 0.90 | % | |
Total net expenses(c) | | | 0.79 | %(d) | | | 0.75 | %(d) | | | 0.77 | %(d) | | | 0.80 | %(d) | | | 0.78 | %(d) | |
Net investment income | | | 2.86 | % | | | 2.88 | % | | | 3.16 | % | | | 3.12 | % | | | 3.30 | % | |
Supplemental data | |
Net assets, end of period (in thousands) | | $ | 25,699 | | | $ | 32,398 | | | $ | 29,849 | | | $ | 30,998 | | | $ | 16,049 | | |
Portfolio turnover | | | 7 | % | | | 11 | % | | | 10 | % | | | 9 | % | | | 8 | % | |
Notes to Financial Highlights
(a) Rounds to zero.
(b) In addition to the fees and expenses which the Fund bears directly, the Fund indirectly bears a pro rata share of the fees and expenses of the acquired funds in which it invests. Such indirect expenses are not included in the reported expense ratios.
(c) Total net expenses include the impact of certain waivers/reimbursements made by the Investment Manager and certain of its affiliates, if applicable.
(d) The benefits derived from expense reductions had an impact of less than 0.01%.
The accompanying Notes to Financial Statements are an integral part of this statement.
Annual Report 2013
19
Columbia Massachusetts Intermediate Municipal Bond Fund
Financial Highlights (continued)
| | | Year Ended October 31, | |
Class B | | 2013 | | 2012 | | 2011 | | 2010 | | 2009 | |
Per share data | |
Net asset value, beginning of period | | $ | 11.34 | | | $ | 10.95 | | | $ | 10.95 | | | $ | 10.61 | | | $ | 9.90 | | |
Income from investment operations: | |
Net investment income | | | 0.23 | | | | 0.24 | | | | 0.26 | | | | 0.26 | | | | 0.27 | | |
Net realized and unrealized gain (loss) | | | (0.50 | ) | | | 0.40 | | | | 0.00 | (a) | | | 0.34 | | | | 0.71 | | |
Total from investment operations | | | (0.27 | ) | | | 0.64 | | | | 0.26 | | | | 0.60 | | | | 0.98 | | |
Less distributions to shareholders: | |
Net investment income | | | (0.22 | ) | | | (0.24 | ) | | | (0.26 | ) | | | (0.26 | ) | | | (0.27 | ) | |
Net realized gains | | | (0.01 | ) | | | (0.01 | ) | | | (0.00 | )(a) | | | — | | | | — | | |
Total distributions to shareholders | | | (0.23 | ) | | | (0.25 | ) | | | (0.26 | ) | | | (0.26 | ) | | | (0.27 | ) | |
Net asset value, end of period | | $ | 10.84 | | | $ | 11.34 | | | $ | 10.95 | | | $ | 10.95 | | | $ | 10.61 | | |
Total return | | | (2.37 | %) | | | 5.89 | % | | | 2.48 | % | | | 5.72 | % | | | 9.96 | % | |
Ratios to average net assets(b) | |
Total gross expenses | | | 1.70 | % | | | 1.83 | % | | | 1.79 | % | | | 1.66 | % | | | 1.65 | % | |
Total net expenses(c) | | | 1.53 | %(d) | | | 1.50 | %(d) | | | 1.53 | %(d) | | | 1.55 | %(d) | | | 1.53 | %(d) | |
Net investment income | | | 2.07 | % | | | 2.13 | % | | | 2.44 | % | | | 2.42 | % | | | 2.59 | % | |
Supplemental data | |
Net assets, end of period (in thousands) | | $ | 1 | | | $ | 99 | | | $ | 145 | | | $ | 1,008 | | | $ | 1,222 | | |
Portfolio turnover | | | 7 | % | | | 11 | % | | | 10 | % | | | 9 | % | | | 8 | % | |
Notes to Financial Highlights
(a) Rounds to zero.
(b) In addition to the fees and expenses which the Fund bears directly, the Fund indirectly bears a pro rata share of the fees and expenses of the acquired funds in which it invests. Such indirect expenses are not included in the reported expense ratios.
(c) Total net expenses include the impact of certain waivers/reimbursements made by the Investment Manager and certain of its affiliates, if applicable.
(d) The benefits derived from expense reductions had an impact of less than 0.01%.
The accompanying Notes to Financial Statements are an integral part of this statement.
Annual Report 2013
20
Columbia Massachusetts Intermediate Municipal Bond Fund
Financial Highlights (continued)
| | | Year Ended October 31, | |
Class C | | 2013 | | 2012 | | 2011 | | 2010 | | 2009 | |
Per share data | |
Net asset value, beginning of period | | $ | 11.34 | | | $ | 10.95 | | | $ | 10.95 | | | $ | 10.61 | | | $ | 9.90 | | |
Income from investment operations: | |
Net investment income | | | 0.27 | | | | 0.28 | | | | 0.30 | | | | 0.30 | | | | 0.30 | | |
Net realized and unrealized gain (loss) | | | (0.49 | ) | | | 0.40 | | | | 0.00 | (a) | | | 0.34 | | | | 0.72 | | |
Total from investment operations | | | (0.22 | ) | | | 0.68 | | | | 0.30 | | | | 0.64 | | | | 1.02 | | |
Less distributions to shareholders: | |
Net investment income | | | (0.27 | ) | | | (0.28 | ) | | | (0.30 | ) | | | (0.30 | ) | | | (0.31 | ) | |
Net realized gains | | | (0.01 | ) | | | (0.01 | ) | | | (0.00 | )(a) | | | — | | | | — | | |
Total distributions to shareholders | | | (0.28 | ) | | | (0.29 | ) | | | (0.30 | ) | | | (0.30 | ) | | | (0.31 | ) | |
Net asset value, end of period | | $ | 10.84 | | | $ | 11.34 | | | $ | 10.95 | | | $ | 10.95 | | | $ | 10.61 | | |
Total return | | | (1.97 | %) | | | 6.27 | % | | | 2.83 | % | | | 6.09 | % | | | 10.34 | % | |
Ratios to average net assets(b) | |
Total gross expenses | | | 1.70 | % | | | 1.73 | % | | | 1.74 | % | | | 1.66 | % | | | 1.65 | % | |
Total net expenses(c) | | | 1.19 | %(d) | | | 1.15 | %(d) | | | 1.17 | %(d) | | | 1.20 | %(d) | | | 1.18 | %(d) | |
Net investment income | | | 2.46 | % | | | 2.48 | % | | | 2.75 | % | | | 2.75 | % | | | 2.88 | % | |
Supplemental data | |
Net assets, end of period (in thousands) | | $ | 11,244 | | | $ | 11,970 | | | $ | 9,931 | | | $ | 10,452 | | | $ | 8,859 | | |
Portfolio turnover | | | 7 | % | | | 11 | % | | | 10 | % | | | 9 | % | | | 8 | % | |
Notes to Financial Highlights
(a) Rounds to zero.
(b) In addition to the fees and expenses which the Fund bears directly, the Fund indirectly bears a pro rata share of the fees and expenses of the acquired funds in which it invests. Such indirect expenses are not included in the reported expense ratios.
(c) Total net expenses include the impact of certain waivers/reimbursements made by the Investment Manager and certain of its affiliates, if applicable.
(d) The benefits derived from expense reductions had an impact of less than 0.01%.
The accompanying Notes to Financial Statements are an integral part of this statement.
Annual Report 2013
21
Columbia Massachusetts Intermediate Municipal Bond Fund
Financial Highlights (continued)
Class R4 | | Year Ended
October 31,
2013(a) | |
Per share data | |
Net asset value, beginning of period | | $ | 11.19 | | |
Income from investment operations: | |
Net investment income | | | 0.21 | | |
Net realized and unrealized loss | | | (0.36 | ) | |
Total from investment operations | | | (0.15 | ) | |
Less distributions to shareholders: | |
Net investment income | | | (0.21 | ) | |
Total distributions to shareholders | | | (0.21 | ) | |
Net asset value, end of period | | $ | 10.83 | | |
Total return | | | (1.32 | %) | |
Ratios to average net assets(b) | |
Total gross expenses | | | 0.68 | %(c) | |
Total net expenses(d) | | | 0.56 | %(c)(e) | |
Net investment income | | | 3.19 | %(c) | |
Supplemental data | |
Net assets, end of period (in thousands) | | $ | 60 | | |
Portfolio turnover | | | 7 | % | |
Notes to Financial Highlights
(a) For the period from March 19, 2013 (commencement of operations) to October 31, 2013.
(b) In addition to the fees and expenses which the Fund bears directly, the Fund indirectly bears a pro rata share of the fees and expenses of the acquired funds in which it invests. Such indirect expenses are not included in the reported expense ratios.
(c) Annualized.
(d) Total net expenses include the impact of certain waivers/reimbursements made by the Investment Manager and certain of its affiliates, if applicable.
(e) The benefits derived from expense reductions had an impact of less than 0.01%.
The accompanying Notes to Financial Statements are an integral part of this statement.
Annual Report 2013
22
Columbia Massachusetts Intermediate Municipal Bond Fund
Financial Highlights (continued)
| | | Year Ended October 31, | |
Class T | | 2013 | | 2012 | | 2011 | | 2010 | | 2009 | |
Per share data | |
Net asset value, beginning of period | | $ | 11.34 | | | $ | 10.95 | | | $ | 10.95 | | | $ | 10.61 | | | $ | 9.90 | | |
Income from investment operations: | |
Net investment income | | | 0.33 | | | | 0.34 | | | | 0.35 | | | | 0.35 | | | | 0.36 | | |
Net realized and unrealized gain (loss) | | | (0.50 | ) | | | 0.40 | | | | 0.00 | (a) | | | 0.34 | | | | 0.71 | | |
Total from investment operations | | | (0.17 | ) | | | 0.74 | | | | 0.35 | | | | 0.69 | | | | 1.07 | | |
Less distributions to shareholders: | |
Net investment income | | | (0.32 | ) | | | (0.34 | ) | | | (0.35 | ) | | | (0.35 | ) | | | (0.36 | ) | |
Net realized gains | | | (0.01 | ) | | | (0.01 | ) | | | (0.00 | )(a) | | | — | | | | — | | |
Total distributions to shareholders | | | (0.33 | ) | | | (0.35 | ) | | | (0.35 | ) | | | (0.35 | ) | | | (0.36 | ) | |
Net asset value, end of period | | $ | 10.84 | | | $ | 11.34 | | | $ | 10.95 | | | $ | 10.95 | | | $ | 10.61 | | |
Total return | | | (1.48 | %) | | | 6.80 | % | | | 3.34 | % | | | 6.62 | % | | | 10.89 | % | |
Ratios to average net assets(b) | |
Total gross expenses | | | 0.85 | % | | | 0.88 | % | | | 0.89 | % | | | 0.81 | % | | | 0.80 | % | |
Total net expenses(c) | | | 0.69 | %(d) | | | 0.65 | %(d) | | | 0.67 | %(d) | | | 0.70 | %(d) | | | 0.68 | %(d) | |
Net investment income | | | 2.96 | % | | | 2.98 | % | | | 3.25 | % | | | 3.26 | % | | | 3.43 | % | |
Supplemental data | |
Net assets, end of period (in thousands) | | $ | 23,131 | | | $ | 30,008 | | | $ | 34,952 | | | $ | 39,300 | | | $ | 39,221 | | |
Portfolio turnover | | | 7 | % | | | 11 | % | | | 10 | % | | | 9 | % | | | 8 | % | |
Notes to Financial Highlights
(a) Rounds to zero.
(b) In addition to the fees and expenses which the Fund bears directly, the Fund indirectly bears a pro rata share of the fees and expenses of the acquired funds in which it invests. Such indirect expenses are not included in the reported expense ratios.
(c) Total net expenses include the impact of certain waivers/reimbursements made by the Investment Manager and certain of its affiliates, if applicable.
(d) The benefits derived from expense reductions had an impact of less than 0.01%.
The accompanying Notes to Financial Statements are an integral part of this statement.
Annual Report 2013
23
Columbia Massachusetts Intermediate Municipal Bond Fund
Financial Highlights (continued)
| | | Year Ended October 31, | |
Class Z | | 2013 | | 2012 | | 2011 | | 2010 | | 2009 | |
Per share data | |
Net asset value, beginning of period | | $ | 11.34 | | | $ | 10.95 | | | $ | 10.95 | | | $ | 10.61 | | | $ | 9.90 | | |
Income from investment operations: | |
Net investment income | | | 0.34 | | | | 0.35 | | | | 0.37 | | | | 0.37 | | | | 0.37 | | |
Net realized and unrealized gain (loss) | | | (0.49 | ) | | | 0.40 | | | | 0.00 | (a) | | | 0.34 | | | | 0.71 | | |
Total from investment operations | | | (0.15 | ) | | | 0.75 | | | | 0.37 | | | | 0.71 | | | | 1.08 | | |
Less distributions to shareholders: | |
Net investment income | | | (0.34 | ) | | | (0.35 | ) | | | (0.37 | ) | | | (0.37 | ) | | | (0.37 | ) | |
Net realized gains | | | (0.01 | ) | | | (0.01 | ) | | | (0.00 | )(a) | | | — | | | | — | | |
Total distributions to shareholders | | | (0.35 | ) | | | (0.36 | ) | | | (0.37 | ) | | | (0.37 | ) | | | (0.37 | ) | |
Net asset value, end of period | | $ | 10.84 | | | $ | 11.34 | | | $ | 10.95 | | | $ | 10.95 | | | $ | 10.61 | | |
Total return | | | (1.33 | %) | | | 6.96 | % | | | 3.49 | % | | | 6.77 | % | | | 11.06 | % | |
Ratios to average net assets(b) | |
Total gross expenses | | | 0.70 | % | | | 0.73 | % | | | 0.74 | % | | | 0.66 | % | | | 0.65 | % | |
Total net expenses(c) | | | 0.54 | %(d) | | | 0.50 | %(d) | | | 0.52 | %(d) | | | 0.55 | %(d) | | | 0.53 | %(d) | |
Net investment income | | | 3.10 | % | | | 3.13 | % | | | 3.40 | % | | | 3.41 | % | | | 3.58 | % | |
Supplemental data | |
Net assets, end of period (in thousands) | | $ | 257,624 | | | $ | 305,220 | | | $ | 284,128 | | | $ | 286,196 | | | $ | 282,469 | | |
Portfolio turnover | | | 7 | % | | | 11 | % | | | 10 | % | | | 9 | % | | | 8 | % | |
Notes to Financial Highlights
(a) Rounds to zero.
(b) In addition to the fees and expenses which the Fund bears directly, the Fund indirectly bears a pro rata share of the fees and expenses of the acquired funds in which it invests. Such indirect expenses are not included in the reported expense ratios.
(c) Total net expenses include the impact of certain waivers/reimbursements made by the Investment Manager and certain of its affiliates, if applicable.
(d) The benefits derived from expense reductions had an impact of less than 0.01%.
The accompanying Notes to Financial Statements are an integral part of this statement.
Annual Report 2013
24
Columbia Massachusetts Intermediate Municipal Bond Fund
Notes to Financial Statements
October 31, 2013
Note 1. Organization
Columbia Massachusetts Intermediate Municipal Bond Fund (the Fund), a series of Columbia Funds Series Trust I (the Trust), is a non-diversified fund. The Trust is registered under the Investment Company Act of 1940, as amended (the 1940 Act), as an open-end management investment company organized as a Massachusetts business trust.
Fund Shares
The Trust may issue an unlimited number of shares (without par value). The Fund offers Class A, Class B, Class C, Class R4, Class T and Class Z shares. Although all share classes generally have identical voting, dividend and liquidation rights, each share class votes separately when required by law. Different share classes pay different distribution amounts to the extent the expenses of such share classes differ, and distributions in liquidation will be proportional to the net asset value of each share class. Each share class has its own expense structure and sales charges, as applicable.
Class A shares are subject to a maximum front-end sales charge of 3.25% based on the initial investment amount. Class A shares purchased without an initial sales charge in accounts aggregating $1 million to $50 million at the time of purchase are subject to a contingent deferred sales charge (CDSC) if the shares are sold within 18 months of purchase, charged as follows: 1.00% CDSC if redeemed within 12 months of purchase, and 0.50% CDSC if redeemed more than 12, but less than 18, months after purchase.
Class B shares may be subject to a maximum CDSC of 3.00% based upon the holding period after purchase. Class B shares will generally convert to Class A shares eight years after purchase. The Fund no longer accepts investments by new or existing investors in the Fund's Class B shares, except in connection with the reinvestment of any dividend and/or capital gain distributions in Class B shares of the Fund and exchanges by existing Class B shareholders of certain other funds within the Columbia Family of Funds.
Class C shares are subject to a 1.00% CDSC on shares redeemed within one year of purchase.
Class R4 shares are not subject to sales charges and are only available to investors purchasing through authorized investment professionals. Class R4 shares commenced operations on March 19, 2013.
Class T shares are subject to a maximum front-end sales charge of 4.75% based on the investment amount. Class T shares purchased without an initial sales charge in accounts aggregating $1 million to $50 million at the time of purchase
are subject to a CDSC if the shares are sold within 18 months of purchase, charged as follows: 1.00% CDSC if redeemed within 12 months of purchase, and 0.50% CDSC if redeemed more than 12, but less than 18, months after purchase. Class T shares are available only to investors who received (and who have continuously held) Class T shares in connection with the merger of certain Galaxy Funds into various Columbia Funds (formerly named Liberty Funds).
Class Z shares are not subject to sales charges and are available only to certain eligible investors, which are subject to different investment minimums.
Note 2. Summary of Significant Accounting Policies
Use of Estimates
The preparation of financial statements in accordance with U.S. generally accepted accounting principles (GAAP) requires management to make certain estimates and assumptions that affect the reported amounts of assets and liabilities, the disclosure of contingent assets and liabilities at the date of the financial statements and the reported amounts of revenue and expenses during the reporting period. Actual results could differ from those estimates.
The following is a summary of significant accounting policies consistently followed by the Fund in the preparation of its financial statements.
Security Valuation
Debt securities generally are valued by pricing services approved by the Board of Trustees (the Board) based upon market transactions for normal, institutional-size trading units of similar securities. The services may use various pricing techniques which take into account appropriate factors such as yield, quality, coupon rate, maturity, type of issue, trading characteristics and other data, as well as broker quotes. Debt securities for which quotations are readily available may also be valued based upon an over-the-counter or exchange bid quotation.
Investments in open-end investment companies, including money market funds, are valued at net asset value.
Investments for which market quotations are not readily available, or that have quotations which management believes are not reliable, are valued at fair value as determined in good faith under consistently applied procedures established by and under the general supervision of the Board. If a security or class of securities (such as foreign securities) is valued at fair value, such value is likely to be different from the last quoted market price for the security.
Annual Report 2013
25
Columbia Massachusetts Intermediate Municipal Bond Fund
Notes to Financial Statements (continued)
October 31, 2013
The determination of fair value often requires significant judgment. To determine fair value, management may use assumptions including but not limited to future cash flows and estimated risk premiums. Multiple inputs from various sources may be used to determine fair value.
Security Transactions
Security transactions are accounted for on the trade date. Cost is determined and gains (losses) are based upon the specific identification method for both financial statement and federal income tax purposes.
Income Recognition
Interest income is recorded on an accrual basis. Market premiums and discounts, including original issue discounts, are amortized and accreted, respectively, over the expected life of the security on all debt securities, unless otherwise noted.
Dividend income is recorded on the ex-dividend date.
Expenses
General expenses of the Trust are allocated to the Fund and other funds of the Trust based upon relative net assets or other expense allocation methodologies determined by the nature of the expense. Expenses directly attributable to the Fund are charged to the Fund. Expenses directly attributable to a specific class of shares are charged to that share class.
Determination of Class Net Asset Value
All income, expenses (other than class-specific expenses, which are charged to that share class, as shown in the Statement of Operations) and realized and unrealized gains (losses) are allocated to each class of the Fund on a daily basis, based on the relative net assets of each class, for purposes of determining the net asset value of each class.
Federal Income Tax Status
The Fund intends to qualify each year as a regulated investment company under Subchapter M of the Internal Revenue Code, as amended, and will distribute substantially all of its tax exempt and taxable income (including net short-term capital gains), if any, for its tax year, and as such will not be subject to federal income taxes. In addition, the Fund intends to distribute in each calendar year substantially all of its net investment income, capital gains and certain other amounts, if any, such that the Fund should not be subject to federal excise tax. Therefore, no federal income or excise tax provision is recorded.
Distributions to Shareholders
Distributions from net investment income, if any, are declared daily and paid monthly. Net realized capital gains, if any, are
distributed at least annually. Income distributions and capital gain distributions are determined in accordance with federal income tax regulations, which may differ from GAAP.
Guarantees and Indemnifications
Under the Trust's organizational documents and, in some cases, by contract, its officers and trustees are indemnified against certain liabilities arising out of the performance of their duties to the Trust or its funds. In addition, certain of the Fund's contracts with its service providers contain general indemnification clauses. The Fund's maximum exposure under these arrangements is unknown since the amount of any future claims that may be made against the Fund cannot be determined, and the Fund has no historical basis for predicting the likelihood of any such claims.
Recent Accounting Pronouncement
Disclosures about Offsetting Assets and Liabilities
In December 2011, the Financial Accounting Standards Board (FASB) issued Accounting Standards Update (ASU) No. 2011-11, Disclosures about Offsetting Assets and Liabilities and in January 2013, ASU No. 2013-1, Clarifying the Scope of Disclosures about Offsetting Assets and Liabilities (collectively, the ASUs). Specifically, the ASUs require an entity to disclose both gross and net information for derivatives and other financial instruments that are subject to a master netting arrangement or similar agreement. The ASUs require disclosure of collateral received in connection with the master netting agreements or similar agreements. The disclosure requirements are effective for interim and annual periods beginning on or after January 1, 2013. At this time, management is evaluating the implications of this guidance and the impact it will have on the financial statement amounts and footnote disclosures, if any.
Note 3. Fees and Compensation Paid to Affiliates
Investment Management Fees
Under an Investment Management Services Agreement, Columbia Management Investment Advisers, LLC (the Investment Manager), a wholly-owned subsidiary of Ameriprise Financial, Inc. (Ameriprise Financial), determines which securities will be purchased, held or sold. The investment management fee is an annual fee that is equal to a percentage of the Fund's average daily net assets that declines from 0.40% to 0.27% as the Fund's net assets increase. The effective investment management fee rate for the year ended October 31, 2013 was 0.40% of the Fund's average daily net assets.
Annual Report 2013
26
Columbia Massachusetts Intermediate Municipal Bond Fund
Notes to Financial Statements (continued)
October 31, 2013
Administration Fees
Under an Administrative Services Agreement, the Investment Manager also serves as the Fund Administrator. The Fund pays the Fund Administrator an annual fee for administration and accounting services equal to a percentage of the Fund's average daily net assets that declines from 0.07% to 0.04% as the Fund's net assets increase. The effective administration fee rate for the year ended October 31, 2013 was 0.07% of the Fund's average daily net assets.
Compensation of Board Members
Board members are compensated for their services to the Fund as disclosed in the Statement of Operations. The Trust's eligible Trustees may participate in a Deferred Compensation Plan (the Plan) which may be terminated at any time. Obligations of the Plan will be paid solely out of the Fund's assets.
Compensation of Chief Compliance Officer
The Board has appointed a Chief Compliance Officer to the Fund in accordance with federal securities regulations. The Fund pays its pro-rata share of the expenses associated with the Chief Compliance Officer. The Fund's expenses for the Chief Compliance Officer will not exceed $15,000 per year.
Transfer Agent Fees
Under a Transfer and Dividend Disbursing Agent Agreement, Columbia Management Investment Services Corp. (the Transfer Agent), an affiliate of the Investment Manager and a wholly-owned subsidiary of Ameriprise Financial, is responsible for providing transfer agency services to the Fund. The Transfer Agent has contracted with Boston Financial Data Services (BFDS) to serve as sub-transfer agent.
The Transfer Agent receives monthly account-based service fees based on the number of open accounts and also receives sub-transfer agency fees based on a percentage of the average aggregate value of the Fund's shares maintained in omnibus accounts (other than omnibus accounts for which American Enterprise Investment Services Inc. is the broker of record or accounts where the beneficial shareholder is a customer of Ameriprise Financial Services, Inc., which are paid a per account fee). The Transfer Agent pays the fees of BFDS for services as sub-transfer agent and is not entitled to reimbursement for such fees from the Fund (with the exception of out-of-pocket fees).
The Transfer Agent also receives compensation from fees for various shareholder services and reimbursements for certain out-of-pocket fees.
For the year ended October 31, 2013, the Fund's effective transfer agent fee rates as a percentage of average daily net assets of each class were as follows:
Class A | | | 0.19 | % | |
Class B | | | 0.19 | | |
Class C | | | 0.19 | | |
Class R4 | | | 0.19 | * | |
Class T | | | 0.19 | | |
Class Z | | | 0.19 | | |
*Annualized.
An annual minimum account balance fee of $20 may apply to certain accounts with a value below the applicable share class' initial minimum investment requirements to reduce the impact of small accounts on transfer agent fees. These minimum account balance fees are recorded as part of expense reductions in the Statement of Operations. For the year ended October 31, 2013, these minimum account balance fees reduced total expenses by $140.
Distribution and Service Fees
The Fund has an agreement with Columbia Management Investment Distributors, Inc. (the Distributor), an affiliate of the Investment Manager and a wholly-owned subsidiary of Ameriprise Financial, for distribution and shareholder services. Pursuant to Rule 12b-1 under the 1940 Act, the Board has approved, and the Fund has adopted, distribution and shareholder service plans (the Plans) which set the distribution and service fees for the Fund. These fees are calculated daily and are intended to compensate the Distributor and/or eligible selling and/or servicing agents for selling shares of the Fund and providing services to investors.
Under the Plans, the Fund pays a monthly service fee to the Distributor at the maximum annual rate of 0.25% of the average daily net assets attributable to Class A, Class B and Class C shares of the Fund. Also under the Plans, the Fund pays a monthly distribution fee to the Distributor at the maximum annual rate of 0.75% of the average daily net assets attributable to Class B and Class C shares, only.
The Distributor has voluntarily agreed to waive a portion of the distribution fee for Class C shares so that the distribution fee does not exceed 0.40% annually of the average daily net assets attributable to Class C shares. This arrangement may be modified or terminated by the Distributor at any time.
Shareholder Services Fees
The Fund has adopted a shareholder services plan that permits it to pay for certain services provided to Class T shareholders by their selling and/or servicing agents. The Fund may pay
Annual Report 2013
27
Columbia Massachusetts Intermediate Municipal Bond Fund
Notes to Financial Statements (continued)
October 31, 2013
shareholder servicing fees up to an aggregate annual rate of 0.40% of the Fund's average daily net assets attributable to Class T shares (comprised of up to 0.20% for shareholder liaison services and up to 0.20% for administrative support services). These fees are currently limited to an aggregate annual rate of not more than 0.15% of the Fund's average daily net assets attributable to Class T shares. In addition, the servicing fee for Class T shares will be waived by selling and/or servicing agents to the extent necessary to prevent the net investment income for the Class T shares from falling below 0.00% on a daily basis. The shareholder services fee for the year ended October 31, 2013 was 0.15% of the Fund's average daily net assets attributable to Class T shares.
Sales Charges
Sales charges, including front-end charges and CDSCs, received by the Distributor for distributing Fund shares were $15,982 for Class A, $426 for Class C, and $237 for Class T shares for the year ended October 31, 2013.
Expenses Waived/Reimbursed by the Investment Manager and its Affiliates
The Investment Manager and certain of its affiliates have contractually agreed to waive fees and/or reimburse expenses (excluding certain fees and expenses described below) for the periods disclosed below, unless sooner terminated at the sole discretion of the Board, so that the Fund's net operating expenses, after giving effect to fees waived/expenses reimbursed and any balance credits and/or overdraft charges from the Fund's custodian, do not exceed the following annual rates as a percentage of the class' average daily net assets:
| | | March 1, 2013
through
February 28, 2014 | | Prior to
March 1, 2013 | |
Class A | | | 0.81 | % | | | 0.75 | % | |
Class B | | | 1.56 | | | | 1.50 | | |
Class C | | | 1.56 | | | | 1.50 | | |
Class R4 | | | 0.56 | * | | | — | | |
Class T | | | 0.71 | | | | 0.65 | | |
Class Z | | | 0.56 | | | | 0.50 | | |
*Annual rate is contractual from March 19, 2013 (the commencement of operations of Class R4 shares) through February 28, 2014.
Under the agreement governing these fee waivers and/or expense reimbursement arrangements, the following fees and expenses are excluded from the waiver/reimbursement commitment, and therefore will be paid by the Fund, if applicable: taxes (including foreign transaction taxes), expenses associated with investments in affiliated and non-affiliated pooled investment vehicles (including mutual
funds and exchange traded funds), transaction costs and brokerage commissions, costs related to any securities lending program, dividend expenses associated with securities sold short, inverse floater program fees and expenses, transaction charges and interest on borrowed money, interest, extraordinary expenses and any other expenses the exclusion of which is specifically approved by the Board. This agreement may be modified or amended only with approval from all parties. Class C distribution fees waived by the Distributor, as discussed above, are in addition to the waiver/reimbursement commitment under the agreement.
Note 4. Federal Tax Information
The timing and character of income and capital gain distributions are determined in accordance with income tax regulations, which may differ from GAAP because of temporary or permanent book to tax differences.
At October 31, 2013, these differences are primarily due to differing treatment for capital loss carryforwards, principal and/or interest of fixed income securities, Trustees' deferred compensation, distributions and distribution reclassifications. To the extent these differences are permanent, reclassifications are made among the components of the Fund's net assets in the Statement of Assets and Liabilities. Temporary differences do not require reclassifications. In the Statement of Assets and Liabilities the following reclassifications were made:
Excess of distributions over
net investment income | | $ | (30,112
| ) | |
Accumulated net realized loss | | | 30,112 | | |
Net investment income and net realized gains (losses), as disclosed in the Statement of Operations, and net assets were not affected by this reclassification.
The tax character of distributions paid during the years indicated was as follows:
Year Ended October 31, | | 2013 | | 2012 | |
Ordinary income | | $ | 4,241 | | | $ | 11,615,292 | | |
Long-term capital gains | | | 205,474 | | | | 384,862 | | |
Tax-exempt income | | | 10,807,963 | | | | — | | |
Total | | $ | 11,017,678 | | | $ | 12,000,154 | | |
Short-term capital gain distributions, if any, are considered ordinary income distributions for tax purposes.
At October 31, 2013, the components of distributable earnings on a tax basis were as follows:
Undistributed tax-exempt income | | $ | 835,608 | | |
Unrealized appreciation | | | 21,440,128 | | |
Annual Report 2013
28
Columbia Massachusetts Intermediate Municipal Bond Fund
Notes to Financial Statements (continued)
October 31, 2013
At October 31, 2013, the cost of investments for federal income tax purposes was $293,437,112 and the aggregate gross unrealized appreciation and depreciation based on that cost was:
Unrealized appreciation | | $ | 23,208,110 | | |
Unrealized depreciation | | | (1,767,982 | ) | |
Net unrealized appreciation | | $ | 21,440,128 | | |
The following capital loss carryforward, determined at October 31, 2013, may be available to reduce taxable income arising from future net realized gains on investments, if any, to the extent permitted by the Internal Revenue Code:
Year of Expiration | | Amount | |
Unlimited short-term | | $ | 920,854 | | |
Management of the Fund has concluded that there are no significant uncertain tax positions that would require recognition in the financial statements. However, management's conclusion may be subject to review and adjustment at a later date based on factors including, but not limited to, new tax laws, regulations, and administrative interpretations (including relevant court decisions). Generally, the Fund's federal tax returns for the prior three fiscal years remain subject to examination by the Internal Revenue Service.
Note 5. Portfolio Information
The cost of purchases and proceeds from sales of securities, excluding short-term obligations, aggregated to $23,822,069 and $61,651,936, respectively, for the year ended October 31, 2013.
Note 6. Shareholder Concentration
At October 31, 2013, one unaffiliated shareholder account owned 83.3% of the outstanding shares of the Fund. The Fund has no knowledge about whether any portion of those shares was owned beneficially by such account. Subscription and redemption activity by concentrated accounts may have a significant effect on the operations of the Fund.
Note 7. Line of Credit
The Fund has entered into a revolving credit facility with a syndicate of banks led by JPMorgan Chase Bank N.A. (JPMorgan) whereby the Fund may borrow for the temporary funding of shareholder redemptions or for other temporary or emergency purposes. The credit facility agreement, as amended, which is a collective agreement between the Fund and certain other funds managed by the Investment Manager, severally and not jointly, permits collective borrowings up to $500 million. Interest is charged to each participating fund based on its borrowings at a rate equal to the higher of (i) the overnight federal funds rate plus 1.00% or (ii) the one-month
LIBOR rate plus 1.00%. Each borrowing under the credit facility matures no later than 60 days after the date of borrowing. The Fund also pays a commitment fee equal to its pro rata share of the amount of the credit facility at a rate of 0.08% per annum. The commitment fee is included in other expenses in the Statement of Operations.
Effective December 10, 2013, the Fund extended its revolving credit facility with JPMorgan. The credit facility agreement, as amended, continues to permit collective borrowings up to $500 million under the same terms and interest rates as described above. Effective December 10, 2013, the Fund pays a commitment fee equal to its pro rata share of the amount of its credit facility at a rate of 0.075% per annum.
The Fund had no borrowings during the year ended October 31, 2013.
Note 8. Significant Risks
Geographic Concentration Risk
Because state-specific tax-exempt funds invest primarily in the municipal securities issued by the state and political sub-divisions of the state, the Fund will be particularly affected by political and economic conditions and developments in the state in which it invests. The Fund may, therefore, have a greater risk than that of a municipal bond fund which is more geographically diversified. The value of the municipal securities owned by the Fund also may be adversely affected by future changes in federal or state income tax laws.
Non-Diversification Risk
A non-diversified fund is permitted to invest a greater percentage of its total assets in fewer issuers than a diversified fund. The Fund may, therefore, have a greater risk of loss from a few issuers than a similar fund that invests more broadly.
Note 9. Subsequent Events
Management has evaluated the events and transactions that have occurred through the date the financial statements were issued and noted no items requiring adjustment of the financial statements or additional disclosure.
Note 10. Information Regarding Pending and Settled Legal Proceedings
In December 2005, without admitting or denying the allegations, American Express Financial Corporation (AEFC, which is now known as Ameriprise Financial, Inc. (Ameriprise Financial)) entered into settlement agreements with the Securities and Exchange Commission (SEC) and Minnesota Department of Commerce (MDOC) related to market timing activities. As a result, AEFC was censured and ordered to cease
Annual Report 2013
29
Columbia Massachusetts Intermediate Municipal Bond Fund
Notes to Financial Statements (continued)
October 31, 2013
and desist from committing or causing any violations of certain provisions of the Investment Advisers Act of 1940, the Investment Company Act of 1940, and various Minnesota laws. AEFC agreed to pay disgorgement of $10 million and civil money penalties of $7 million. AEFC also agreed to retain an independent distribution consultant to assist in developing a plan for distribution of all disgorgement and civil penalties ordered by the SEC in accordance with various undertakings detailed at www.sec.gov/litigation/admin/ia-2451.pdf. Ameriprise Financial and its affiliates have cooperated with the SEC and the MDOC in these legal proceedings, and have made regular reports to the funds' Boards of Trustees.
Ameriprise Financial and certain of its affiliates have historically been involved in a number of legal, arbitration and regulatory proceedings, including routine litigation, class actions, and governmental actions, concerning matters arising in connection with the conduct of their business activities. Ameriprise Financial believes that the Funds are not currently the subject of, and that neither Ameriprise Financial nor any of its affiliates are the subject of, any pending legal, arbitration or regulatory proceedings that are likely to have a material adverse effect on the Funds or the ability of Ameriprise Financial or its affiliates to perform under their contracts with the Funds. Ameriprise Financial is required to make 10-Q, 10-K and, as necessary, 8-K filings with the Securities and Exchange Commission on legal and regulatory matters that relate to Ameriprise Financial and its affiliates. Copies of these filings may be obtained by accessing the SEC website at www.sec.gov.
There can be no assurance that these matters, or the adverse publicity associated with them, will not result in increased fund redemptions, reduced sale of fund shares or other adverse consequences to the Funds. Further, although we believe proceedings are not likely to have a material adverse effect on the Funds or the ability of Ameriprise Financial or its affiliates to perform under their contracts with the Funds, these proceedings are subject to uncertainties and, as such, we are unable to estimate the possible loss or range of loss that may result. An adverse outcome in one or more of these proceedings could result in adverse judgments, settlements, fines, penalties or other relief that could have a material adverse effect on the consolidated financial condition or results of operations of Ameriprise Financial.
Annual Report 2013
30
Columbia Massachusetts Intermediate Municipal Bond Fund
Report of Independent Registered Public Accounting Firm
To the Trustees of Columbia Funds Series Trust I and the Shareholders of
Columbia Massachusetts Intermediate Municipal Bond Fund
In our opinion, the accompanying statement of assets and liabilities, including the portfolio of investments, and the related statements of operations and of changes in net assets and the financial highlights present fairly, in all material respects, the financial position of Columbia Massachusetts Intermediate Municipal Bond Fund (the "Fund", a series of Columbia Funds Series Trust I) at October 31, 2013, and the results of its operations, the changes in its net assets and the financial highlights for each of the periods indicated, in conformity with accounting principles generally accepted in the United States of America. These financial statements and financial highlights (hereafter referred to as "financial statements") are the responsibility of the Fund's management; our responsibility is to express an opinion on these financial statements based on our audits. We conducted our audits of these financial statements in accordance with the standards of the Public Company Accounting Oversight Board (United States). Those standards require that we plan and perform the audit to obtain reasonable assurance about whether the financial statements are free of material misstatement. An audit includes examining, on a test basis, evidence supporting the amounts and disclosures in the financial statements, assessing the accounting principles used and significant estimates made by management, and evaluating the overall financial statement presentation. We believe that our audits, which included confirmation of securities at October 31, 2013 by correspondence with the custodian, brokers and transfer agent, provide a reasonable basis for the opinion expressed above.
PricewaterhouseCoopers LLP
Minneapolis, Minnesota
December 19, 2013
Annual Report 2013
31
Columbia Massachusetts Intermediate Municipal Bond Fund
Federal Income Tax Information
(Unaudited)
The Fund hereby designates the following tax attributes for the fiscal year ended October 31, 2013. Shareholders will be notified in early 2014 of the amounts for use in preparing 2013 income tax returns.
Tax Designations:
Capital Gain Dividend | | $ | 10,807,963 | | |
| Exempt-Interest Dividends | | | 99.96 | % | |
Capital Gain Dividend. The Fund designates as a capital gain dividend the amount reflected above, or if subsequently determined to be different, the net capital gain of such fiscal period. The Fund also designates as capital gain dividends, to the extent necessary to fully distribute such capital gains, earnings and profits distributed to shareholders on the redemption of shares.
Exempt-Interest Dividends. The percentage of net investment income dividends paid during the fiscal year that qualifies as exempt-interest dividends for federal income tax purposes.
Annual Report 2013
32
Columbia Massachusetts Intermediate Municipal Bond Fund
The Trustees serve terms of indefinite duration. The names, addresses and birth years of the Trustees and Officers of the Funds in Columbia Funds Series Trust I, the year each was first elected or appointed to office, their principal business occupations during at least the last five years, the number of Funds overseen by each Trustee and other directorships they hold are shown below. Each officer listed below serves as an officer of each Fund in Columbia Funds Series Trust I.
Independent Trustees
Name, Address and Year of Birth,
Position with Funds, Year First
Elected or Appointed to Office | | Principal Occupation(s) During Past Five Years, Number of Funds in Columbia
Funds Complex Overseen by Trustee, Other Directorships Held | |
Rodman L. Drake (Born 1943)
c/o Columbia Management
Investment Advisers, LLC
225 Franklin Street
Boston, MA 02110
Trustee (since 1994) and
Chairman of the Board (since 2009) | | Independent consultant since 2010; Co-Founder of Baringo Capital LLC (private equity) from 1997 to 2008; Chairman (from 2003 to 2010) and CEO (from 2008 to 2010) of Crystal River Capital, Inc. (real estate investment trust); Oversees 52; Jackson Hewitt Tax Service Inc. (tax preparation services) from 2004 to 2011; Student Loan Corporation (student loan provider) from 2005 to 2010; Celgene Corporation (global biotechnology company); The Helios Funds and Brookfield Funds (closed-end funds); Chimerix, Inc. (biopharmaceutical company) since August 1, 2013; Crystal River Capital, Inc. from 2005 to 2010; Parsons Brinckerhoff from 1995 to 2008; and Apex Silver Mines Ltd. from 2007 to 2009 | |
Douglas A. Hacker (Born 1955)
c/o Columbia Management
Investment Advisers, LLC
225 Franklin Street
Boston, MA 02110
Trustee (since 1996) | | Independent business executive since May 2006; Executive Vice President — Strategy of United Airlines from December 2002 to May 2006; President of UAL Loyalty Services (airline marketing company) from September 2001 to December 2002; Executive Vice President and Chief Financial Officer of United Airlines from July 1999 to September 2001. Oversees 52; Nash Finch Company (food distributor); Aircastle Limited (aircraft leasing); and SeaCube Container Leasing Ltd. (container leasing) | |
Janet Langford Kelly (Born 1957)
c/o Columbia Management
Investment Advisers, LLC
225 Franklin Street
Boston, MA 02110
Trustee (since 1996) | | Senior Vice President, General Counsel and Corporate Secretary, ConocoPhillips (integrated energy company) since September 2007; Deputy General Counsel — Corporate Legal Services, ConocoPhillips from August 2006 to August 2007; Partner, Zelle, Hofmann, Voelbel, Mason & Gette LLP (law firm) from March 2005 to July 2006; Adjunct Professor of Law, Northwestern University from September 2004 to June 2006; Director, UAL Corporation (airline) from February 2006 to July 2006; Chief Administrative Officer and Senior Vice President, Kmart Holding Corporation (consumer goods) from September 2003 to March 2004. Oversees 52; None | |
Nancy T. Lukitsh (Born 1956)
c/o Columbia Management
Investment Advisers, LLC
225 Franklin Street
Boston, MA 02110
Trustee (since 2011) | | Senior Vice President, Partner and Director of Marketing, Wellington Management Company, LLP (investment adviser) from 1997 to 2010; Chair, Wellington Management Investment Portfolios (commingled non-U.S. investment pools) from 2007 to 2010; Director, Wellington Trust Company, NA and other Wellington affiliates from 1997 to 2010. Oversees 52; None | |
William E. Mayer (Born 1940)
c/o Columbia Management
Investment Advisers, LLC
225 Franklin Street
Boston, MA 02110
Trustee (since 1994) | | Partner, Park Avenue Equity Partners (private equity) since February 1999; Dean and Professor, College of Business and Management, University of Maryland from 1992 to 1996. Oversees 52; DynaVox Inc. (speech creation); Lee Enterprises (print media); WR Hambrecht + Co. (financial service provider) from 2000 to 2012; BlackRock Kelso Capital Corporation (investment company) | |
David M. Moffett (Born 1952)
c/o Columbia Management
Investment Advisers, LLC
225 Franklin Street
Boston, MA 02110
Trustee (since 2011) | | Retired. Chief Executive Officer, Federal Home Loan Mortgage Corporation, from 2008 to 2009; Senior Adviser, Global Financial Services Group, Carlyle Group, Inc., from 2007 to 2008; Vice Chairman and Chief Financial Officer, U.S. Bancorp, from 1993 to 2007. Oversees 52; CIT Group Inc. (commercial and consumer finance); eBay Inc. (online trading community); MBIA Inc. (financial service provider); E.W. Scripps Co. (print and television media), Building Materials Holding Corp. (building materials and construction services); Genworth Financial, Inc. (financial and insurance products and services); and University of Oklahoma Foundation | |
Charles R. Nelson (Born 1942)
c/o Columbia Management
Investment Advisers, LLC
225 Franklin Street
Boston, MA 02110
Trustee (since 1981) | | Retired. Professor Emeritus, University of Washington, since 2011; Professor of Economics, University of Washington from 1976 to 2011; Ford and Louisa Van Voorhis Professor of Political Economy, University of Washington from 1993 to 2011; Adjunct Professor of Statistics, University of Washington from 1980 to 2011; Associate Editor, Journal of Money, Credit and Banking from September 1993 to 2008; consultant on econometric and statistical matters. Oversees 52; None | |
John J. Neuhauser (Born 1943)
c/o Columbia Management
Investment Advisers, LLC
225 Franklin Street
Boston, MA 02110
Trustee (since 1984) | | President, Saint Michael's College, since August 2007; Director or Trustee of several non-profit organizations, including Fletcher Allen Health Care, Inc.; University Professor, Boston College from November 2005 to August 2007; Academic Vice President and Dean of Faculties, Boston College from August 1999 to October 2005. Oversees 52; Liberty All-Star Equity Fund and Liberty All-Star Growth Fund (closed-end funds) | |
Annual Report 2013
33
Columbia Massachusetts Intermediate Municipal Bond Fund
Trustees and Officers (continued)
Independent Trustees (continued)
Name, Address and Year of Birth,
Position with Funds, Year First
Elected or Appointed to Office | | Principal Occupation(s) During Past Five Years, Number of Funds in Columbia
Funds Complex Overseen by Trustee, Other Directorships Held | |
Patrick J. Simpson (Born 1944)
c/o Columbia Management
Investment Advisers, LLC
225 Franklin Street
Boston, MA 02110
Trustee (since 2000) | | Partner, Perkins Coie LLP (law firm). Oversees 52; None | |
Anne-Lee Verville (Born 1945)
c/o Columbia Management
Investment Advisers, LLC
225 Franklin Street
Boston, MA 02110
Trustee (since 1998) | | Retired. General Manager — Global Education Industry from 1994 to 1997, President — Application Systems Division from 1991 to 1994, Chief Financial Officer — US Marketing & Services from 1988 to 1991, and Chief Information Officer from 1987 to 1988, IBM Corporation (computer and technology). Oversees 52; Enesco Group, Inc. (producer of giftware and home and garden decor products) from 2001 to 2006 | |
Interested Trustee
Name, Address and Year of Birth,
Position with Funds, Year First
Elected or Appointed to Office | | Principal Occupation(s) During Past Five Years, Number of Funds in Columbia
Funds Complex Overseen by Trustee, Other Directorships Held | |
William F. Truscott (born 1960)
53600 Ameriprise Financial Center
Minneapolis, MN 55474
Senior Vice President (since 2012) | | Chairman of the Board and President, Columbia Management Investment Advisers, LLC since May 2010 and February 2012 (previously President and Chief Investment Officer, from 2001 to April 2010); Chief Executive Officer, Global Asset Management, Ameriprise Financial, Inc. since September 2012 (previously, Chief Executive Officer, U.S. Asset Management & President, Annuities, from May 2010 to September 2012 and President — U.S. Asset Management and Chief Investment Officer from 2005 to April 2010); Director and Chief Executive Officer, Columbia Management Investment Distributors, Inc. since May 2010 and February 2012, respectively (previously Chairman of the Board and Chief Executive Officer from 2006 to April 2010); Chairman of the Board and Chief Executive Officer, RiverSource Distributors, Inc. since 2006; President and Chief Executive Officer, Ameriprise Certificate Company, 2006 to August 2012; Oversees 184; Director, Ameriprise Certificate Company, 2006-January 2013 | |
The Statement of Additional Information includes additional information about the Trustees of the Funds and is available, without charge, upon request by calling 800.345.6611.
The Board has appointed officers who are responsible for day-to-day business decisions based on policies it has established. The officers serve at the pleasure of the Board. In addition to Mr. Truscott, who is Senior Vice President, the Funds' other officers are:
Officers
Name,
Address and
Year of Birth | | Position and Year
First Appointed to
Position for any Fund
in the Columbia
Funds Complex or a
Predecessor Thereof | | Principal Occupation(s) During Past Five Years | |
J. Kevin Connaughton
225 Franklin Street
Boston, MA 02110
Born 1964 | | President and Principal Executive Officer (2009) | | Senior Vice President and General Manager — Mutual Fund Products, Columbia Management Investment Advisers, LLC, since May 2010; and President, Columbia Funds since 2009; previously, Managing Director, Columbia Management Advisors, LLC, from December 2004 to April 2010; Senior Vice President and Chief Financial Officer, Columbia Funds, from June 2008 to January 2009; and senior officer of Columbia Funds and affiliated funds since 2003. | |
Michael G. Clarke
225 Franklin Street
Boston, MA 02110
Born 1969 | | Treasurer (2011) and Chief Financial Officer (2009) | | Vice President, Columbia Management Investment Advisers, LLC, since May 2010; previously, Managing Director of Fund Administration, Columbia Management Advisors, LLC, from September 2004 to April 2010; and senior officer of Columbia Funds and affiliated funds since 2002. | |
Annual Report 2013
34
Columbia Massachusetts Intermediate Municipal Bond Fund
Trustees and Officers (continued)
Officers (continued)
Name,
Address and
Year of Birth | | Position and Year
First Appointed to
Position for any Fund
in the Columbia
Funds Complex or a
Predecessor Thereof | | Principal Occupation(s) During Past Five Years | |
Scott R. Plummer
5228 Ameriprise
Financial Center
Minneapolis, MN 55474
Born 1959 | | Senior Vice President (2006), Chief Legal Officer (2006) and Assistant Secretary (2011) | | Senior Vice President, Chief Legal Officer and Assistant Secretary, Columbia Management Investment Advisers, LLC, since June 2005; Senior Vice President and Lead Chief Counsel — Asset Management, Ameriprise Financial, Inc., since May 2010 (previously, Vice President and Chief Counsel — Asset Management, from 2005 to April 2010); Vice President, Chief Counsel and Assistant Secretary, Columbia Management Investment Distributors, Inc., since 2008; Vice President, General Counsel and Secretary, Ameriprise Certificate Company, since 2005; Chief Counsel, RiverSource Distributors, Inc., since 2006; and senior officer of Columbia Funds and affiliated funds since 2006. | |
Thomas P. McGuire
225 Franklin Street
Boston, MA 02110
Born 1972 | | Chief Compliance Officer (2012) | | Vice President — Asset Management Compliance, Ameriprise Financial, Inc., since May 2010; Chief Compliance Officer, Ameriprise Certificate Company, since September 2010; Compliance Executive, Bank of America, from 2005 to April 2010. | |
Colin Moore
225 Franklin Street
Boston, MA 02110
Born 1958 | | Senior Vice President (2010) | | Executive Vice President and Global Chief Investment Officer, Ameriprise Financial, Inc., since July 2013; Director and Global Chief Investment Officer, Columbia Management Investment Advisers, LLC, since May 2010; previously, Manager, Managing Director and Chief Investment Officer, Columbia Management Advisors, LLC, from 2007 to April 2010. | |
Michael E. DeFao
225 Franklin Street
Boston, MA 02110
Born 1968 | | Vice President (2011) and Assistant Secretary (2010) | | Vice President and Chief Counsel, Ameriprise Financial, Inc., since May 2010; Associate General Counsel, Bank of America from 2005 to April 2010. | |
Joseph F. DiMaria
225 Franklin Street
Boston, MA 02110
Born 1968 | | Vice President (2011) and Chief Accounting Officer (2008) | | Vice President — Mutual Fund Administration, Columbia Management Investment Advisers, LLC, since May 2010; previously, Director of Fund Administration, Columbia Management Advisors, LLC, from 2006 to April 2010. | |
Paul B. Goucher
100 Park Avenue
New York, NY 10017
Born 1968 | | Vice President (2011) and Assistant Secretary (2008) | | Vice President and Lead Chief Counsel, Ameriprise Financial, Inc., since November 2008 and January 2013, respectively (previously, Chief Counsel, from January 2010 to January 2013, and Group Counsel from November 2008 to January 2010); previously, Director, Managing Director and General Counsel, J. & W. Seligman & Co. Incorporated, from July 2008 to November 2008. | |
Amy Johnson
5228 Ameriprise
Financial Center
Minneapolis, MN
Born 1965 | | Vice President (2006) | | Senior Vice President and Chief Operating Officer, Columbia Management Investment Advisers, LLC, since May 2010; previously, Chief Administrative Officer, from 2009 to April 2010, and Vice President — Asset Management and Trust Company Services, from 2006 to 2009. | |
Paul D. Pearson
5228 Ameriprise
Financial Center
Minneapolis, MN
Born 1956 | | Vice President (2011) and Assistant Treasurer (1999) | | Vice President — Investment Accounting, Columbia Management Investment Advisers, LLC, since May 2010; previously, Vice President — Managed Assets, Investment Accounting, Ameriprise Financial, Inc. from 1998 to April 2010. | |
Christopher O. Petersen
5228 Ameriprise
Financial Center
Minneapolis, MN 55474
Born 1970 | | Vice President and Secretary (2010) | | Vice President and Chief Counsel, Ameriprise Financial, Inc., since January 2010 (previously, Vice President and Group Counsel or Counsel from 2004 to January 2010); officer of Columbia Funds and affiliated funds since 2007. | |
Stephen T. Welsh
225 Franklin Street
Boston, MA 02110
Born 1957 | | Vice President (2006) | | President and Director, Columbia Management Investment Services Corp., since May 2010; previously, President and Director, Columbia Management Services, Inc., from 2004 to April 2010; and Managing Director, Columbia Management Distributors, Inc., from 2007 to April 2010. | |
Annual Report 2013
35
Columbia Massachusetts Intermediate Municipal Bond Fund
Board Consideration and Approval of Advisory Agreement
On June 14, 2013, the Board of Trustees (the "Board") and the Trustees who are not interested persons (as defined in the Investment Company Act of 1940) of the Trust (the "Independent Trustees") unanimously approved the continuation of the Investment Management Services Agreement (the "Advisory Agreement") with Columbia Management Investment Advisers, LLC (the "Investment Manager") with respect to Columbia Massachusetts Intermediate Municipal Bond Fund (the "Fund"), a series of the Trust. As detailed below, the Advisory Fees and Expenses Committee (the "Committee") and the Board met on multiple occasions to review and discuss, both among themselves and with the management team of the Investment Manager, materials provided by the Investment Manager before determining to approve the continuation of the Advisory Agreement.
In connection with their deliberations regarding the continuation of the Advisory Agreement, the Committee and the Board evaluated materials requested from the Investment Manager regarding the Fund and the Advisory Agreement, and discussed these materials with representatives of the Investment Manager at Committee meetings held on March 5, 2013, April 24, 2013 and June 13, 2013, and at the Board meeting held on June 14, 2013. In addition, the Board considers matters bearing on the Advisory Agreement at most of its other meetings throughout the year and meets regularly with senior management of the Funds and the Investment Manager. Through the Board's Investment Oversight Committees, Trustees also meet with selected Fund portfolio managers and other investment personnel at various times throughout the year. The Committee and the Board also consulted with Fund counsel and with the Independent Trustees' independent legal counsel, who advised on various matters with respect to the Committee's and the Board's considerations and otherwise assisted the Committee and the Board in their deliberations. On June 13, 2013, the Committee recommended that the Board approve the continuation of the Advisory Agreement. On June 14, 2013, the Board, including the Independent Trustees, voting separately, unanimously approved the continuation of the Advisory Agreement for the Fund.
The Committee and the Board considered all information that they, their legal counsel, or the Investment Manager believed reasonably necessary to evaluate and to determine whether to approve the continuation of the Advisory Agreement. The information and factors considered by the Committee and the Board in recommending for approval or approving the continuation of the Advisory Agreement for the Fund included the following:
• Information on the investment performance of the Fund relative to the performance of a group of mutual funds determined to be comparable to the Fund by an independent third-party data provider, as well as performance relative to benchmarks;
• Information on the Fund's advisory fees and total expenses, including information comparing the Fund's expenses to those of a group of comparable mutual funds, as determined by the independent third-party data provider;
• The Investment Manager's agreement to contractually limit or cap total operating expenses for the Fund so that total operating expenses (excluding certain fees and expenses, such as transaction costs and certain other investment related expenses, interest, taxes, acquired fund fees and expenses, and extraordinary expenses) would not exceed the median expenses of a group of comparable funds (as determined from time to time, generally annually, by the independent third-party data provider);
• The terms and conditions of the Advisory Agreement;
• The terms and conditions of other agreements and arrangements with affiliates of the Investment Manager relating to the operations of the Fund, including the Administrative Services Agreement, the Distribution Agreement and the Transfer and Dividend Disbursing Agent Agreement;
• Descriptions of various functions performed by the Investment Manager under the Advisory Agreement, including portfolio management and portfolio trading practices;
• Information regarding the management fees and investment performance of comparable portfolios of other clients of the Investment Manager, including institutional separate accounts;
• Information regarding the reputation, regulatory history and resources of the Investment Manager, including information regarding senior management, portfolio managers and other personnel;
• Information regarding the capabilities of the Investment Manager with respect to compliance monitoring services, including an assessment of the Investment Manager's compliance system by the Fund's Chief Compliance Officer; and
• The profitability to the Investment Manager and its affiliates from their relationships with the Fund.
Annual Report 2013
36
Columbia Massachusetts Intermediate Municipal Bond Fund
Board Consideration and Approval of Advisory Agreement (continued)
Nature, Extent and Quality of Services Provided under the Advisory Agreement
The Committee and the Board considered the nature, extent and quality of services provided to the Fund by the Investment Manager and its affiliates under the Advisory Agreement and under separate agreements for the provision of transfer agency and administrative services, and the resources dedicated to the Fund and the other Columbia Funds by the Investment Manager and its affiliates. The Committee and the Board considered, among other things, the Investment Manager's ability to attract, motivate and retain highly qualified research, advisory and supervisory investment professionals (including personnel and other resources, compensation programs for personnel involved in fund management, reputation and other attributes), the portfolio management services provided by those investment professionals, and the quality of the Investment Manager's investment research capabilities and trade execution services. The Committee and the Board also considered the potential benefits to shareholders of investing in a mutual fund that is part of a fund complex offering exposure to a variety of asset classes and investment disciplines and providing a variety of fund and shareholder services.
The Committee and the Board also considered the professional experience and qualifications of the senior personnel of the Investment Manager, which included consideration of the Investment Manager's experience with similarly-structured funds. The Committee and the Board noted the compliance programs of and the compliance-related resources provided to the Fund by the Investment Manager and its affiliates, and considered the Investment Manager's ability to provide administrative services to the Fund pursuant to a separate Administrative Services Agreement, including the Investment Manager's ability to coordinate the activities of the Fund's other service providers. After reviewing these and related factors, the Committee and the Board concluded, within the context of their overall conclusions, that the nature, extent and quality of the services provided to the Fund under the Advisory Agreement supported the continuation of the Advisory Agreement.
Investment Performance
The Committee and the Board reviewed information about the performance of the Fund over various time periods, including performance information relative to benchmarks and information based on reports of the independent third-party data provider that compared the performance of the Fund to the performance of a group of comparable mutual funds. The Committee and the Board also reviewed a description of the third party's methodology for identifying the Fund's peer groups for purposes of performance and expense comparisons. Although the Fund's performance lagged that of a relevant peer group for certain (although not necessarily all) periods, the Committee and the Board concluded that other factors relevant to performance were sufficient, in light of other considerations, to warrant continuation of the Fund's Advisory Agreement. Those factors included one or more of the following: (i) that the Fund's performance, although lagging in certain recent periods, was stronger over the longer term; (ii) that the underperformance was attributable, to a significant extent, to investment decisions that were reasonable and consistent with the Fund's investment strategy and policies and that the Fund was performing within a reasonable range of expectations, given those investment decisions, market conditions and the Fund's investment strategy; (iii) that the Fund's performance was competitive when compared to other relevant performance benchmarks or peer groups; and (iv) that the Investment Manager had taken or was taking steps designed to help improve the Fund's investment performance, including, but not limited to, replacing portfolio managers, enhancing the resources supporting the portfolio managers, or modifying investment strategies.
The Committee and the Board noted that, through December 31, 2012, the Fund's performance was in the sixtieth, thirty-third and twenty-eighth percentile (where the best performance would be in the first percentile) of its category selected by the independent third-party data provider for the purposes of performance comparisons for the one-, three- and five- year periods, respectively.
The Committee and the Board also considered the Investment Manager's performance and reputation generally, the Investment Manager's historical responsiveness to Board concerns about performance, and the Investment Manager's willingness to take steps intended to improve performance. After reviewing these and related factors, the Committee and the Board concluded, within the context of their overall conclusions, that the performance of the Fund and the Investment Manager was sufficient, in light of other considerations, to warrant the continuation of the Advisory Agreement.
Investment Advisory Fee Rates and Other Expenses
The Committee and the Board considered the advisory fees charged to the Fund under the Advisory Agreement as well as the total expenses incurred by the Fund. In assessing the reasonableness of the fees under the Advisory Agreement, the
Annual Report 2013
37
Columbia Massachusetts Intermediate Municipal Bond Fund
Board Consideration and Approval of Advisory Agreement (continued)
Committee and the Board considered, among other information, the Fund's advisory fee and its total expense ratio as a percentage of average daily net assets. The Committee and the Board noted that the Fund's actual management fee and net expense ratio are both ranked in the second quintile (where the lowest fees and expenses would be in the first quintile) against the Fund's expense universe as determined by the independent third-party data provider for purposes of expense comparison. The Committee and the Board also took into account the fee waiver and expense limitation arrangements agreed to by the Investment Manager, as noted above.
The Committee and the Board also received and considered information about the advisory fees charged by the Investment Manager to institutional separate accounts. In considering the fees charged to those accounts, the Committee and the Board took into account, among other things, the Investment Manager's representations about the differences between managing mutual funds as compared to other types of accounts, including differences in the services provided, differences in the risk profile of such business for the Investment Manager and the additional resources required to manage mutual funds effectively. In evaluating the Fund's advisory fees, the Committee and the Board also took into account the demands, complexity and quality of the investment management of the Fund.
After reviewing these and related factors, the Committee and the Board concluded, within the context of their overall conclusions, that the advisory fee rates and expenses of the Fund supported the continuation of the Advisory Agreement.
Costs of Services Provided and Profitability
The Committee and the Board also took note of the costs of the services provided (both on an absolute and relative basis) and the profitability to the Investment Manager and its affiliates in connection with their relationships with the Fund. In evaluating these considerations, the Committee and the Board took note of the advisory fees charged by the Investment Manager to other clients, including fees charged by the Investment Manager to institutional separate account clients with similar investment strategies to those of the Fund.
The Committee and the Board also considered the compensation directly or indirectly received by the Investment Manager's affiliates in connection with their relationships with the Fund. The Committee and the Board reviewed information provided by management as to the profitability of the Investment Manager and its affiliates of their relationships with the Fund, information about the allocation of expenses used to calculate profitability, and comparisons of profitability levels realized in 2012 to profitability levels realized in 2011. When reviewing profitability, the Committee and the Board also considered court cases in which adviser profitability was an issue in whole or in part, the performance of the Fund, the expense ratio of the Fund, and the implementation of expense limitations with respect to the Fund. The Committee and the Board also considered information provided by the Investment Manager regarding its financial condition and comparing its profitability to that of other asset management firms that are, or are subsidiaries of, publicly traded companies.
After reviewing these and related factors, the Committee and the Board concluded, within the context of their overall conclusions, that the costs of services provided and the profitability to the Investment Manager and its affiliates from their relationships with the Fund supported the continuation of the Advisory Agreement.
Economies of Scale
The Committee and the Board considered the potential existence of economies of scale in the provision by the Investment Manager of services to the Fund, to groups of related funds, and to the Investment Manager's investment advisory clients as a whole, and whether those economies of scale were shared with the Fund through breakpoints in investment advisory fees or other means, such as expense limitation arrangements and additional investments by the Investment Manager in investment, trading and compliance resources. The Committee and the Board noted that the investment advisory fee schedules for the Fund contained breakpoints that would reduce the fee rate on assets above specified threshold levels.
In considering these matters, the Committee and the Board also considered the costs of the services provided and the profitability to the Investment Manager and its affiliates from their relationships with the Fund, as discussed above. After reviewing these and related factors, the Committee and the Board concluded, within the context of their overall conclusions, that the extent to which any economies of scale were expected to be shared with the Fund supported the continuation of the Advisory Agreement.
Annual Report 2013
38
Columbia Massachusetts Intermediate Municipal Bond Fund
Board Consideration and Approval of Advisory Agreement (continued)
Other Benefits to the Investment Manager
The Committee and the Board received and considered information regarding "fall-out" or ancillary benefits received by the Investment Manager and its affiliates as a result of their relationships with the Fund, such as the engagement of the Investment Manager to provide administrative services to the Fund and the engagement of the Investment Manager's affiliates to provide distribution and transfer agency services to the Fund. The Committee and the Board considered that the Fund's distributor retains a portion of the distribution fees from the Fund. The Committee and the Board also considered the benefits of research made available to the Investment Manager by reason of brokerage commissions generated by the Fund's securities transactions, and reviewed information about the Investment Manager's practices with respect to allocating portfolio transactions for brokerage and research services. The Committee and the Board considered the possible conflicts of interest associated with certain fall-out or other ancillary benefits and the reporting, disclosure and other processes that are in place to address such possible conflicts of interest. The Committee and the Board recognized that the Investment Manager's profitability would be somewhat lower without these benefits.
Conclusion
The Committee and the Board reviewed all of the above considerations in reaching their decisions to recommend or approve the continuation of the Advisory Agreement. In their deliberations, the Trustees did not identify any particular information that was all-important or controlling, and individual Trustees may have attributed different weights to the various factors. Based on their evaluation of all factors that they deemed to be material, including those factors described above, and assisted by the advice of independent legal counsel, the Board, including the Independent Trustees, voting separately, unanimously approved the continuation of the Advisory Agreement.
Annual Report 2013
39
This page intentionally left blank.
Annual Report 2013
40
Columbia Massachusetts Intermediate Municipal Bond Fund
Important Information About This Report
Each fund mails one shareholder report to each shareholder address. If you would like more than one report, please call shareholder services at 800.345.6611 and additional reports will be sent to you.
The policy of the Board is to vote the proxies of the companies in which each fund holds investments consistent with the procedures as stated in the Statement of Additional Information (SAI). You may obtain a copy of the SAI without charge by calling 800.345.6611; contacting your financial intermediary; visiting columbiamanagement.com; or searching the website of the Securities and Exchange Commission (SEC) at sec.gov. Information regarding how each fund voted proxies relating to portfolio securities is filed with the SEC by August 31 for the most recent 12-month period ending June 30 of that year, and is available without charge by visiting columbiamanagement.com; or searching the website of the SEC at sec.gov.
Each fund files a complete schedule of portfolio holdings with the SEC for the first and third quarters of each fiscal year on Form N-Q. Each fund's Form N-Q is available on the SEC's website at sec.gov and may be reviewed and copied at the SEC's Public Reference Room in Washington, D.C. Information on the operation of the Public Reference Room may be obtained by calling 800.SEC.0330. Each fund's complete schedule of portfolio holdings, as filed on Form N-Q, can also be obtained without charge, upon request, by calling 800.345.6611.
Annual Report 2013
41

Columbia Massachusetts Intermediate Municipal Bond Fund
P.O. Box 8081
Boston, MA 02266-8081
columbiamanagement.com
This information is for use with concurrent or prior delivery of a fund prospectus. Please read and consider the investment objectives, risks, charges and expenses for any fund carefully before investing. For a prospectus and, if available, a summary prospectus, which contains this and other important information about the Fund go to columbiamanagement.com. The Fund is distributed by Columbia Management Investment Distributors, Inc., member FINRA, and managed by Columbia Management Investment Advisers, LLC.
© 2013 Columbia Management Investment Advisers, LLC. All rights reserved.
ANN191_10_C01_(12/13)
Annual Report
October 31, 2013

Columbia Strategic Income Fund
Not FDIC insured • No bank guarantee • May lose value
 Dear Shareholders,
A market rally led by equities
Despite threats of military action in Syria, rumblings from Iran and an impending showdown over the debt ceiling here at home, the U.S. financial markets delivered positive results in the third quarter of 2013. Stocks outperformed bonds by a substantial margin. Still, robust growth continued to elude the U.S. economy, which merely plodded along. New job growth was solid but not spectacular. Consumer spending remained steady, but the only obvious beneficiary was the auto industry. Gains in the housing market met some headwinds, as mortgage rates rose and sales slipped somewhat. Nevertheless, the recovery in housing remained intact.
The Federal Reserve (the Fed) unsettled investors with a hint that it was ready to taper its purchase of U.S. Treasury and mortgage securities. However, its failure to take any action in a September meeting rallied stocks to new highs and brought bonds back into positive territory for the quarter. Small-cap stocks were the U.S. market leaders. Growth outperformed value in a quarter dominated by the materials, industrials and consumer discretionary sectors. Developed markets led the global rally, driven by strengthening economic conditions in the eurozone. Certain emerging stock markets, including China's, bounced back with returns in line with those of the United States. India and Indonesia were exceptions to that trend, as fears of the Fed's tapering efforts rattled investors in both countries.
Improved risk appetites boosted fixed income
Following a weak second quarter, the fixed-income markets made up some ground in the third quarter of 2013. As yields fell, bond prices rallied enough to push returns on non-Treasury sectors into positive territory. Risk appetites improved in response to continued liquidity from the Fed. Against this backdrop, U.S. high-yield and foreign bonds led the fixed-income markets, along with mortgage-backed securities and emerging market bonds. The U.S. municipal bond market was the exception, as it slipped into negative territory in the final week of the period, pressured by heightened concerns over Puerto Rico, potential municipal bankruptcies and continued fund redemptions.
Stay on track with Columbia Management
Backed by more than 100 years of experience, Columbia Management is one of the nation's largest asset managers. At the heart of our success and, most importantly, that of our investors, are highly talented industry professionals, brought together by a unique way of working. At Columbia Management, reaching our performance goals matters, and how we reach them matters just as much.
Visit columbiamanagement.com for:
> The Columbia Management Perspectives blog, offering insights on current market events and investment opportunities
> Detailed up-to-date fund performance and portfolio information
> Quarterly fund commentaries
> Columbia Management Investor, our award-winning quarterly newsletter for shareholders
Thank you for your continued support of the Columbia Funds. We look forward to serving your investment needs for many years to come.
Best Regards,

J. Kevin Connaughton
President, Columbia Funds
Investing involves risk including the risk of loss of principal.
Investors should consider the investment objectives, risks, charges and expenses of a mutual fund carefully before investing. For a free prospectus and, if available, a summary prospectus, which contains this and other important information about a fund, visit columbiamanagement.com. The prospectus should be read carefully before investing.
Columbia Funds are distributed by Columbia Management Investment Distributors, Inc., member FINRA, and managed by Columbia Management Investment Advisers, LLC.
© 2013 Columbia Management Investment Advisers, LLC. All rights reserved.
Columbia Strategic Income Fund
Performance Overview | | | 2 | | |
Manager Discussion of Fund Performance | | | 4 | | |
Understanding Your Fund's Expenses | | | 6 | | |
Portfolio of Investments | | | 7 | | |
Statement of Assets and Liabilities | | | 38 | | |
Statement of Operations | | | 40 | | |
Statement of Changes in Net Assets | | | 41 | | |
Financial Highlights | | | 44 | | |
Notes to Financial Statements | | | 54 | | |
Report of Independent Registered
Public Accounting Firm | | | 67 | | |
Federal Income Tax Information | | | 68 | | |
Trustees and Officers | | | 69 | | |
Board Consideration and Approval of Advisory Agreement | | | 72 | | |
Important Information About This Report | | | 77 | | |
Fund Investment Manager
Columbia Management Investment
Advisers, LLC
225 Franklin Street
Boston, MA 02110
Fund Distributor
Columbia Management Investment
Distributors, Inc.
225 Franklin Street
Boston, MA 02110
Fund Transfer Agent
Columbia Management Investment
Services Corp.
P.O. Box 8081
Boston, MA 02266-8081
For more information about any of the funds, please visit columbiamanagement.com or call 800.345.6611. Customer Service Representatives are available to answer your questions Monday through Friday from 8 a.m. to 8 p.m. Eastern time.
The views expressed in this report reflect the current views of the respective parties. These views are not guarantees of future performance and involve certain risks, uncertainties and assumptions that are difficult to predict, so actual outcomes and results may differ significantly from the views expressed. These views are subject to change at any time based upon economic, market or other conditions and the respective parties disclaim any responsibility to update such views. These views may not be relied on as investment advice and, because investment decisions for a Columbia Fund are based on numerous factors, may not be relied on as an indication of trading intent on behalf of any particular Columbia Fund. References to specific securities should not be construed as a recommendation or investment advice.
Annual Report 2013
Columbia Strategic Income Fund
Performance Summary
> Columbia Strategic Income Fund (the Fund) Class A shares returned 2.01% excluding sales charges for the 12-month period that ended October 31, 2013.
> The Fund outperformed its Blended Benchmark, which returned 1.66% for the same 12 months.
> The Fund also outperformed the Barclays U.S. Government/Credit Bond Index, which returned -1.45% for the same 12-month period.
> Sector allocation overall contributed positively to the Fund's outperformance as did effective duration and yield curve positioning.
Average Annual Total Returns (%) (for period ended October 31, 2013)
| | Inception | | 1 Year | | 5 Years | | 10 Years | |
Class A | | 04/21/77 | | | | | | | | | | | | | |
Excluding sales charges | | | | | | | 2.01 | | | | 10.09 | | | | 6.69 | | |
Including sales charges | | | | | | | -2.84 | | | | 9.04 | | | | 6.18 | | |
Class B | | 05/15/92 | | | | | | | | | | | | | |
Excluding sales charges | | | | | | | 1.09 | | | | 9.28 | | | | 5.88 | | |
Including sales charges | | | | | | | -3.79 | | | | 9.00 | | | | 5.88 | | |
Class C | | 07/01/97 | | | | | | | | | | | | | |
Excluding sales charges | | | | | | | 1.40 | | | | 9.43 | | | | 6.05 | | |
Including sales charges | | | | | | | 0.42 | | | | 9.43 | | | | 6.05 | | |
Class K * | | 03/07/11 | | | 1.99 | | | | 10.12 | | | | 6.70 | | |
Class R * | | 09/27/10 | | | 1.74 | | | | 9.91 | | | | 6.47 | | |
Class R4 * | | 11/08/12 | | | 2.13 | | | | 10.11 | | | | 6.70 | | |
Class R5 * | | 03/07/11 | | | 2.39 | | | | 10.30 | | | | 6.79 | | |
Class W * | | 09/27/10 | | | 1.91 | | | | 10.08 | | | | 6.68 | | |
Class Y * | | 06/13/13 | | | 2.05 | | | | 10.09 | | | | 6.69 | | |
Class Z | | 01/29/99 | | | 2.13 | | | | 10.33 | | | | 6.95 | | |
Blended Benchmark | | | | | | | 1.66 | | | | 11.32 | | | | 6.94 | | |
Barclays U.S. Government/Credit Bond Index | | | | | | | -1.45 | | | | 6.43 | | | | 4.74 | | |
Returns for Class A are shown with and without the maximum initial sales charge of 4.75%. Returns for Class B are shown with and without the applicable contingent deferred sales charge (CDSC) of 5.00% in the first year, declining to 1.00% in the sixth year and eliminated thereafter. Returns for Class C are shown with and without the 1.00% CDSC for the first year only. The Fund's other classes are not subject to sales charges and have limited eligibility. Please see the Fund's prospectus for details. Performance for different share classes will vary based on differences in sales charges and fees associated with each class. All results shown assume reinvestment of distributions during the period. Returns do not reflect the deduction of taxes that a shareholder may pay on Fund distributions or on the redemption of Fund shares. Performance results reflect the effect of any fee waivers or reimbursements of Fund expenses by Columbia Management Investment Advisers, LLC and/or any of its affiliates. Absent these fee waivers or expense reimbursement arrangements, performance results would have been lower.
The performance information shown represents past performance and is not a guarantee of future results. The investment return and principal value of your investment will fluctuate so that your shares, when redeemed, may be worth more or less than their original cost. Current performance may be lower or higher than the performance information shown. You may obtain performance information current to the most recent month-end by contacting your financial intermediary, visiting columbiamanagement.com or calling 800.345.6611.
*The returns shown for periods prior to the share class inception date (including returns for the Life of the Fund, if shown, which are since Fund inception) include the returns of the Fund's oldest share class. These returns are adjusted to reflect any higher class-related operating expenses of the newer share classes, as applicable. Please visit columbiamanagement.com/mutual-funds/appended-performance for more information.
Annual Report 2013
2
Columbia Strategic Income Fund
Performance Overview (continued)
The Blended Benchmark consists of a 35% weighting of the Barclays U.S. Aggregate Bond Index, a 35% weighting of the Bank of America Merrill Lynch (BofAML) US High Yield Cash Pay Constrained Index, a 15% weighting of the Citigroup Non-U.S. World Government Bond (All Maturities) Index — Unhedged (Citigroup Non U.S. WGBI — Unhedged) and a 15% weighting of the JPMorgan Emerging Markets Bond Index (EMBI) — Global. The Barclays U.S. Aggregate Bond Index is a market value-weighted index that tracks the daily price, coupon, pay-downs and total return performance of fixed-rate, publicly placed, dollar-denominated and non-convertible investment grade debt issues with at least $250 million par amount outstanding and with at least one year to final maturity. The BofAML US High Yield Cash Pay Constrained Index tracks the performance of U.S. dollar-denominated below investment grade corporate debt, currently in a coupon paying period, that is publicly issued in the U.S. domestic market. The Citigroup Non-U.S. WGBI — Unhedged is calculated on a market-weighted basis and includes all fixed-rate bonds with a remaining maturity of one year or longer and with amounts outstanding of at least the equivalent of U.S. $25 million, while excluding floating or variable rate bonds. The JPMorgan EMBI — Global is based on U.S. dollar-denominated debt instruments issued by emerging market sovereign and quasi-sovereign entities, such as Brady bonds, Eurobonds and loans, and reflects reinvestment of all distributions and changes in market prices.
The Barclays U.S. Government/Credit Bond Index tracks the performance of U.S. government and corporate bonds rated investment grade or better, with maturities of at least one year.
Indices are not available for investment, are not professionally managed and do not reflect sales charges, fees, brokerage commissions, taxes or other expenses of investing. Securities in the Fund may not match those in an index.
Performance of a Hypothetical $10,000 Investment (November 1, 2003 – October 31, 2013)
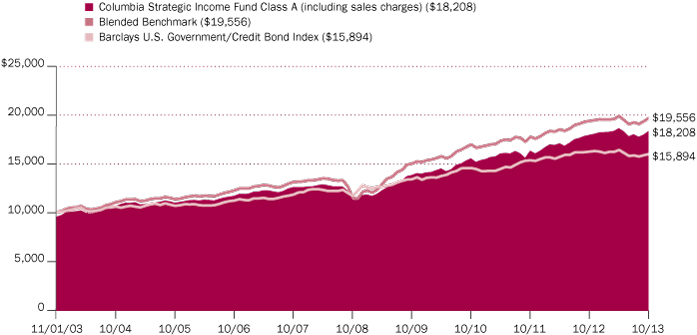
The chart above shows the change in value of a hypothetical $10,000 investment in Class A shares of Columbia Strategic Income Fund during the stated time period, and does not reflect the deduction of taxes that a shareholder may pay on Fund distributions or on the redemption of Fund shares.
Annual Report 2013
3
Columbia Strategic Income Fund
Manager Discussion of Fund Performance
For the 12-month period that ended October 31, 2013, the Fund's Class A shares returned 2.01% excluding sales charges. The Fund outperformed the Blended Benchmark, which returned 1.66%, as well as the Barclays U.S. Government/Credit Bond Index, which returned -1.45% for the same period. Sector allocation overall contributed positively to the Fund's outperformance as did effective duration and yield curve positioning.
Bond Markets Lackluster Amidst Anticipated Fed Tapering
Global bond markets posted lackluster performance during the period overall. Interest rates remained low through the first half of the period, as investors remained concerned about the impact of U.S. fiscal drag, including higher taxes and federal spending cuts, on already sluggish economic growth. However, the economy showed signs of resilience as the months progressed, with improving trends seen in the housing and labor markets. Interest rates began to move significantly higher when the U.S. Federal Reserve (the Fed) indicated in mid-May 2013 some inclination to start scaling back its large-scale asset purchases via its quantitative easing program in the near future. For the period overall, the yield on the bellwether 10-year U.S. Treasury note increased 86 basis points to end October 2013 at 2.56%. (A basis point is 1/100th of a percentage point.) The U.S. Treasury yield curve steepened, meaning yields on longer-term U.S. Treasuries rose more than those on shorter-term maturities. The yield on the two-year U.S. Treasury bill increased by only two basis points to end the period at 0.31%, as the Fed maintained overnight interest rates near zero, keeping the short-term end of the yield curve anchored at low levels.
U.S. investment grade bonds posted losses, with the Barclays Aggregate Bond Index returning -1.08% for the period. High yield corporate bonds were the best performing sector of the market, gaining 8.75%, as measured by the BofA Merrill Lynch U.S. High Yield Cash Pay Constrained Index. Internationally, developed market government bonds returned -3.75%, as measured by the Citigroup Non-U.S. World Government Bond Index — Unhedged, as international interest rates rose and the U.S. dollar strengthened relative to foreign currencies. Emerging market bonds, as measured by the JPMorgan EMBI Global Bond Index, returned -2.58%, driven by rising interest rates and outflows from the asset class.
Sector Allocation Overall Boosted Fund Results
Sector allocation overall contributed positively to the Fund's results during the period, driven by an overweighted position in high yield bank loans and an underweighted allocation to international developed market bonds. Security selection in the mortgage-backed securities sector helped as well.
Also contributing positively to the Fund's relative results was its duration and yield curve positioning. The Fund generally maintained a shorter duration than its Blended Benchmark, which helped performance as interest rates rose. Duration is a measure of the Fund's sensitivity to changes in interest rates. Yield curve positioning also boosted the Fund's results. We utilized U.S. Treasury futures and options to manage duration and yield curve exposure during the period. We favored shorter maturity instruments in the Fund, which proved beneficial as the yield curve steepened.
Portfolio Management
Colin Lundgren, CFA
Brian Lavin, CFA
Zach Pandl
Gene Tannuzzo, CFA
Portfolio Breakdown (%)
(at October 31, 2013) | |
Asset-Backed Securities —
Non-Agency | | | 0.2 | | |
Commercial Mortgage-Backed
Securities — Non-Agency | | | 0.6 | | |
Common Stocks | | | 0.0 | (a) | |
Consumer Discretionary | | | 0.0 | (a) | |
Information Technology | | | 0.0 | (a) | |
Materials | | | 0.0 | (a) | |
Telecommunication Services | | | 0.0 | (a) | |
Corporate Bonds & Notes | | | 49.1 | | |
Foreign Government Obligations | | | 22.4 | | |
Inflation-Indexed Bonds | | | 1.8 | | |
Money Market Funds | | | 3.5 | | |
Municipal Bonds | | | 0.1 | | |
Options Purchased Puts | | | 0.0 | (a) | |
Residential Mortgage-Backed Securities — Agency | | | 7.9 | | |
Residential Mortgage-Backed Securities — Non-Agency | | | 5.2 | | |
Senior Loans | | | 6.8 | | |
Treasury Bills | | | 0.4 | | |
U.S. Treasury Obligations | | | 2.0 | | |
Warrants | | | 0.0 | (a) | |
Total | | | 100.0 | | |
Percentages indicated are based upon total investments. The Fund's portfolio composition is subject to change.
(a) Rounds to zero.
Annual Report 2013
4
Columbia Strategic Income Fund
Manager Discussion of Fund Performance (continued)
Overweight to Emerging Market Bonds Hampered Performance
The Fund's overweighted position in emerging market bonds was a drag on its relative performance, as the sector was weak during the period. Security selection within both the international developed market bond and emerging market bond sectors also detracted.
Shifting Market Conditions Drove Portfolio Changes
During the period, we reduced the Fund's duration in an effort to protect against rising interest rates. We increased the Fund's exposure to emerging market bonds, purchasing on weakness as yields rose throughout the sector. We also increased the Fund's allocation to high yield bank loans, which offered what we considered to be compelling value relative to fixed rate corporate bonds. We used mortgage TBAs to add exposure to agency mortgage-backed securities (MBS). TBAs, which stands for "to be announced," are mortgage securities bought and sold for future settlement with an agreed upon price, coupon and face value, but without reference to the characteristics of the underlying pool of mortgages until 48 hours before delivery is taken. This feature gives TBA participants immediate exposure to agency MBS without having to value each individual security.
Looking Ahead
Investors may take clues about the fixed income market scenario ahead from the various approaches to monetary policy around the world. In the U.S., we believe monetary policy is at an inflection point. Although the Fed unexpectedly delayed beginning its asset purchase tapering process in September 2013, we believe the Fed is still likely to taper its asset purchases sooner than later, with short-term rate increases in the distant but visible future. With yields now higher across sectors, we think value exists in sectors most impacted by tapering fears this summer, specifically corporate bonds, both investment grade and high yield, and municipal bonds. In Europe and the U.K., central bankers have been using forward guidance to keep short-term rates low, as green shoots of economic rebound are beginning to come through. Japan is deploying the most aggressive policy stance amongst the major developed nations, leaving little yield for investors in its bond market. Broadly speaking, international developed market interest rates were much lower at the end of the period than in the U.S. and offered, we believe, little benefit for a diversified bond portfolio. Emerging market policies differ immensely, with some countries raising rates to defend their currencies, while others are cutting rates in response to slower economic growth. At the end of the period, emerging market bonds were generally attractive, in our view, but investors should be picky and focus on countries with stable balance of payments that are likely to benefit from improving economic growth in the U.S. and Europe in the year ahead.
All told, then, the monetary policy environment both here in the U.S. and globally remained highly accommodative at the end of the period. We expect rates on what are widely considered safe haven assets to remain low for the next several years, and thus we believe the global search for yield is not over. Importantly, the rise in yields over the last half of the period was driven more by technical (supply and demand) factors rather than economic fundamentals. In our current view, such a scenario creates un-tapered opportunities for fixed income investors in the months ahead.
Quality Breakdown (%)
(at October 31, 2013) | |
AAA rating | | | 13.7 | | |
AA rating | | | 2.2 | | |
A rating | | | 4.9 | | |
BBB rating | | | 22.9 | | |
BB rating | | | 15.8 | | |
B rating | | | 27.0 | | |
CCC rating | | | 7.9 | | |
CC rating | | | 0.1 | | |
D rating | | | 0.0 | (a) | |
Not rated | | | 5.5 | | |
Total | | | 100.0 | | |
Percentages indicated are based upon total fixed income securities (excluding Money Market Funds).
Bond ratings apply to the underlying holdings of the Fund and not the Fund itself and are divided into categories ranging from AAA (highest) to D (lowest), and are subject to change. The ratings shown are determined by using the middle rating of Moody's, S&P, and Fitch after dropping the highest and lowest available ratings. When a rating from only two agencies is available, the lower rating is used. When a rating from only one agency is available, that rating is used. When a bond is not rated by one of these agencies, it is designated as Not rated. Credit ratings are subjective opinions and not statements of fact.
(a) Rounds to zero.
Investment Risks
There are risks associated with an investment in this Fund, including credit risk, market risk, interest rate risk, and prepayment and extension risk. See the Fund's prospectus for information on these and other risks associated with the Fund. In general, bond prices rise when interest rates fail and vice versa. This effect is more pronounced for longer-term securities. Noninvestment grade securities, commonly called "high yield" or "junk" bonds, have more volatile prices and carry more risk to principal and income than investment grade securities.
Annual Report 2013
5
Columbia Strategic Income Fund
Understanding Your Fund's Expenses
(Unaudited)
As an investor, you incur two types of costs. There are transaction costs, which generally include sales charges on purchases and may include redemption fees. There are also ongoing costs, which generally include management fees, distribution and service (Rule 12b-1) fees, and other fund expenses. The following information is intended to help you understand your ongoing costs (in dollars) of investing in the Fund and to help you compare these costs with the ongoing costs of investing in other mutual funds.
Analyzing Your Fund's Expenses
To illustrate these ongoing costs, we have provided examples and calculated the expenses paid by investors in each share class of the Fund during the period. The actual and hypothetical information in the table is based on an initial investment of $1,000 at the beginning of the period indicated and held for the entire period. Expense information is calculated two ways and each method provides you with different information. The amount listed in the "Actual" column is calculated using the Fund's actual operating expenses and total return for the period. You may use the Actual information, together with the amount invested, to estimate the expenses that you paid over the period. Simply divide your account value by $1,000 (for example, an $8,600 account value divided by $1,000 = 8.6), then multiply the results by the expenses paid during the period under the Actual column. The amount listed in the "Hypothetical" column assumes a 5% annual rate of return before expenses (which is not the Fund's actual return) and then applies the Fund's actual expense ratio for the period to the hypothetical return. You should not use the hypothetical account values and expenses to estimate either your actual account balance at the end of the period or the expenses you paid during the period. See "Compare With Other Funds" below for details on how to use the hypothetical data.
Compare With Other Funds
Since all mutual funds are required to include the same hypothetical calculations about expenses in shareholder reports, you can use this information to compare the ongoing cost of investing in the Fund with other funds. To do so, compare the hypothetical example with the 5% hypothetical examples that appear in the shareholder reports of other funds. As you compare hypothetical examples of other funds, it is important to note that hypothetical examples are meant to highlight the ongoing costs of investing in a fund only and do not reflect any transaction costs, such as sales charges, or redemption or exchange fees. Therefore, the hypothetical calculations are useful in comparing ongoing costs only, and will not help you determine the relative total costs of owning different funds. If transaction costs were included in these calculations, your costs would be higher.
May 1, 2013 – October 31, 2013
| | | Account Value at the Beginning
of the Period ($) | | Account Value at the End of the
Period ($) | | Expenses Paid During the
Period ($) | | Fund's Annualized
Expense Ratio (%) | |
| | | Actual | | Hypothetical | | Actual | | Hypothetical | | Actual | | Hypothetical | | Actual | |
Class A | | | 1,000.00 | | | | 1,000.00 | | | | 983.90 | | | | 1,019.96 | | | | 5.20 | | | | 5.30 | | | | 1.04 | | |
Class B | | | 1,000.00 | | | | 1,000.00 | | | | 980.20 | | | | 1,016.18 | | | | 8.93 | | | | 9.10 | | | | 1.79 | | |
Class C | | | 1,000.00 | | | | 1,000.00 | | | | 981.00 | | | | 1,016.94 | | | | 8.19 | | | | 8.34 | | | | 1.64 | | |
Class K | | | 1,000.00 | | | | 1,000.00 | | | | 984.30 | | | | 1,020.57 | | | | 4.60 | | | | 4.69 | | | | 0.92 | | |
Class R | | | 1,000.00 | | | | 1,000.00 | | | | 982.70 | | | | 1,018.70 | | | | 6.45 | | | | 6.56 | | | | 1.29 | | |
Class R4 | | | 1,000.00 | | | | 1,000.00 | | | | 984.90 | | | | 1,021.22 | | | | 3.95 | | | | 4.02 | | | | 0.79 | | |
Class R5 | | | 1,000.00 | | | | 1,000.00 | | | | 985.40 | | | | 1,021.73 | | | | 3.45 | | | | 3.52 | | | | 0.69 | | |
Class W | | | 1,000.00 | | | | 1,000.00 | | | | 984.20 | | | | 1,020.27 | | | | 4.90 | | | | 4.99 | | | | 0.98 | | |
Class Y | | | 1,000.00 | | | | 1,000.00 | | | | 1,015.70 | * | | | 1,021.98 | | | | 2.46 | * | | | 3.26 | | | | 0.64 | * | |
Class Z | | | 1,000.00 | | | | 1,000.00 | | | | 984.90 | | | | 1,021.22 | | | | 3.95 | | | | 4.02 | | | | 0.79 | | |
*For the period June 13, 2013 through October 31, 2013. Class Y shares commenced operations on June 13, 2013.
Expenses paid during the period are equal to the annualized expense ratio for each class as indicated above, multiplied by the average account value over the period and then multiplied by the number of days in the Fund's most recent fiscal half year and divided by 365.
Expenses do not include fees and expenses incurred indirectly by the Fund from the underlying funds in which the Fund may invest (also referred to as "acquired funds"), including affiliated and non-affiliated pooled investment vehicles (including mutual funds and exchange-traded funds).
Had Columbia Management Investment Advisers, LLC and/or certain of its affiliates not waived/reimbursed certain fees and expenses, account value at the end of the period would have been reduced.
Annual Report 2013
6
Columbia Strategic Income Fund
Portfolio of Investments
October 31, 2013
(Percentages represent value of investments compared to net assets)
Corporate Bonds & Notes(a) 50.0%
Issuer | | Coupon
Rate | | Principal
Amount ($) | | Value ($) | |
Aerospace & Defense 1.3% | |
ADS Tactical, Inc.
Senior Secured(b)
04/01/18 | | | 11.000 | % | | | | | | | 6,354,000 | | | | 5,702,715 | | |
Bombardier, Inc.
Senior Notes(b)
01/15/23 | | | 6.125 | % | | | | | | | 3,399,000 | | | | 3,509,467 | | |
Kratos Defense & Security Solutions, Inc.
Senior Secured
06/01/17 | | | 10.000 | % | | | | | | | 7,967,000 | | | | 8,684,030 | | |
Northrop Grumman Corp.
Senior Unsecured
03/15/21 | | | 3.500 | % | | | | | | | 8,765,000 | | | | 8,911,042 | | |
TransDigm, Inc.
10/15/20 | | | 5.500 | % | | | | | | | 2,367,000 | | | | 2,384,753 | | |
07/15/21 | | | 7.500 | % | | | | | | | 546,000 | | | | 595,140 | | |
Total | | | | | | | | | 29,787,147 | | |
Automotive 0.8% | |
American Axle & Manufacturing, Inc.
03/15/21 | | | 6.250 | % | | | | | | | 1,620,000 | | | | 1,705,050 | | |
Chrysler Group LLC/Co-Issuer, Inc.
Secured
06/15/21 | | | 8.250 | % | | | | | | | 3,221,000 | | | | 3,643,756 | | |
General Motors Co.
Senior Unsecured(b)
10/02/23 | | | 4.875 | % | | | | | | | 2,000,000 | | | | 2,025,000 | | |
Jaguar Land Rover Automotive PLC(b)
02/01/23 | | | 5.625 | % | | | | | | | 2,309,000 | | | | 2,291,683 | | |
Titan International, Inc.
Senior Secured(b)
10/01/20 | | | 6.875 | % | | | | | | | 1,276,000 | | | | 1,314,280 | | |
Visteon Corp.
04/15/19 | | | 6.750 | % | | | | | | | 6,043,000 | | | | 6,450,902 | | |
Total | | | | | | | | | 17,430,671 | | |
Banking 1.2% | |
Ally Financial, Inc.
03/15/20 | | | 8.000 | % | | | | | | | 9,126,000 | | | | 10,837,125 | | |
09/15/20 | | | 7.500 | % | | | | | | | 7,069,000 | | | | 8,270,730 | | |
BES Investimento do Brasil SA
Senior Unsecured(b)
03/25/15 | | | 5.625 | % | | | | | | | 1,000,000 | | | | 1,000,000 | | |
BanColombia SA
Senior Unsecured
06/03/21 | | | 5.950 | % | | | | | | | 1,600,000 | | | | 1,689,600 | | |
Banco de Credito del Peru
Subordinated Notes(b)(c)(f)
10/15/22 | | | 7.170 | % | | PEN | | | | | 2,000,000 | | | | 730,617 | | |
Corporate Bonds & Notes(a) (continued)
Issuer | | Coupon
Rate | | Principal
Amount ($) | | Value ($) | |
Citigroup, Inc.
Senior Unsecured
01/15/15 | | | 6.010 | % | | | | | | | 15,000 | | | | 15,902 | | |
Grupo Aval Ltd.(b)
09/26/22 | | | 4.750 | % | | | | | | | 1,000,000 | | | | 938,750 | | |
Industrial Senior Trust(b)
11/01/22 | | | 5.500 | % | | | | | | | 1,000,000 | | | | 925,000 | | |
Lloyds Banking Group PLC(b)(c)
12/31/49 | | | 6.657 | % | | | | | | | 230,000 | | | | 218,500 | | |
Synovus Financial Corp.
Senior Unsecured
02/15/19 | | | 7.875 | % | | | | | | | 3,705,000 | | | | 4,177,387 | | |
Total | | | | | | | | | 28,803,611 | | |
Brokerage 0.3% | |
E*TRADE Financial Corp.
Senior Unsecured
11/15/19 | | | 6.375 | % | | | | | | | 2,708,000 | | | | 2,897,560 | | |
Nuveen Investments, Inc.
Senior Unsecured(b)
10/15/20 | | | 9.500 | % | | | | | | | 3,618,000 | | | | 3,446,145 | | |
Total | | | | | | | | | 6,343,705 | | |
Building Materials 0.8% | |
Allegion US Holding Co., Inc.(b)
10/01/21 | | | 5.750 | % | | | | | | | 1,646,000 | | | | 1,707,725 | | |
American Builders & Contractors Supply Co., Inc.
Senior Unsecured(b)
04/15/21 | | | 5.625 | % | | | | | | | 2,031,000 | | | | 2,061,465 | | |
Building Materials Corp. of America(b)
Senior Notes
05/01/21 | | | 6.750 | % | | | | | | | 2,517,000 | | | | 2,737,237 | | |
Senior Secured
02/15/20 | | | 7.000 | % | | | | | | | 945,000 | | | | 1,015,875 | | |
Gibraltar Industries, Inc.
02/01/21 | | | 6.250 | % | | | | | | | 723,000 | | | | 748,305 | | |
HD Supply, Inc.
07/15/20 | | | 11.500 | % | | | | | | | 1,340,000 | | | | 1,616,375 | | |
HD Supply, Inc.(b)
07/15/20 | | | 7.500 | % | | | | | | | 2,000,000 | | | | 2,110,000 | | |
Interface, Inc.
12/01/18 | | | 7.625 | % | | | | | | | 901,000 | | | | 979,838 | | |
Norcraft Companies LP/Finance Corp.
Secured
12/15/15 | | | 10.500 | % | | | | | | | 2,492,000 | | | | 2,572,990 | | |
Nortek, Inc.
04/15/21 | | | 8.500 | % | | | | | | | 1,307,000 | | | | 1,432,799 | | |
Turkiye Sise ve Cam Fabrikalari AS(b)
05/09/20 | | | 4.250 | % | | | | | | | 2,000,000 | | | | 1,795,616 | | |
The accompanying Notes to Financial Statements are an integral part of this statement.
Annual Report 2013
7
Columbia Strategic Income Fund
Portfolio of Investments (continued)
October 31, 2013
Corporate Bonds & Notes(a) (continued)
Issuer | | Coupon
Rate | | Principal
Amount ($) | | Value ($) | |
USG Corp.(b)
11/01/21 | | | 5.875 | % | | | | | | | 652,000 | | | | 663,410 | | |
Total | | | | | | | | | 19,441,635 | | |
Chemicals 1.6% | |
Celanese U.S. Holdings LLC
06/15/21 | | | 5.875 | % | | | | | | | 814,000 | | | | 870,980 | | |
11/15/22 | | | 4.625 | % | | | | | | | 1,837,000 | | | | 1,804,852 | | |
Chemtura Corp.
07/15/21 | | | 5.750 | % | | | | | | | 538,000 | | | | 544,725 | | |
Huntsman International LLC
11/15/20 | | | 4.875 | % | | | | | | | 2,071,000 | | | | 2,060,645 | | |
JM Huber Corp.
Senior Notes(b)
11/01/19 | | | 9.875 | % | | | | | | | 2,430,000 | | | | 2,770,200 | | |
LYB International Finance BV
07/15/23 | | | 4.000 | % | | | | | | | 1,360,000 | | | | 1,369,376 | | |
Momentive Performance Materials, Inc.
Senior Secured
10/15/20 | | | 8.875 | % | | | | | | | 4,458,000 | | | | 4,714,335 | | |
10/15/20 | | | 10.000 | % | | | | | | | 491,000 | | | | 515,550 | | |
NOVA Chemicals Corp.
Senior Unsecured(b)
08/01/23 | | | 5.250 | % | | | | | | | 1,337,000 | | | | 1,363,740 | | |
PQ Corp.
Secured(b)
05/01/18 | | | 8.750 | % | | | | | | | 11,024,000 | | | | 11,926,590 | | |
Polypore International, Inc.
11/15/17 | | | 7.500 | % | | | | | | | 2,710,000 | | | | 2,865,825 | | |
Rockwood Specialties Group, Inc.
10/15/20 | | | 4.625 | % | | | | | | | 1,027,000 | | | | 1,055,243 | | |
SPCM SA
Senior Unsecured(b)
01/15/22 | | | 6.000 | % | | | | | | | 426,000 | | | | 441,975 | | |
Sibur Securities Ltd.(b)
01/31/18 | | | 3.914 | % | | | | | | | 2,000,000 | | | | 1,956,551 | | |
U.S. Coatings Acquisition, Inc./Axalta Coating Systems
Dutch Holding B BV(b)
05/01/21 | | | 7.375 | % | | | | | | | 2,338,000 | | | | 2,489,970 | | |
Total | | | | | | | | | 36,750,557 | | |
Construction Machinery 0.9% | |
Ashtead Capital, Inc.
Secured(b)
07/15/22 | | | 6.500 | % | | | | | | | 681,000 | | | | 732,075 | | |
Case New Holland, Inc.
12/01/17 | | | 7.875 | % | | | | | | | 6,862,000 | | | | 8,122,892 | | |
Columbus McKinnon Corp.
02/01/19 | | | 7.875 | % | | | | | | | 950,000 | | | | 1,020,063 | | |
Corporate Bonds & Notes(a) (continued)
Issuer | | Coupon
Rate | | Principal
Amount ($) | | Value ($) | |
H&E Equipment Services, Inc.
09/01/22 | | | 7.000 | % | | | | | | | 2,665,000 | | | | 2,904,850 | | |
Neff Rental LLC/Finance Corp.
Secured(b)
05/15/16 | | | 9.625 | % | | | | | | | 4,296,000 | | | | 4,585,980 | | |
United Rentals North America, Inc.
05/15/20 | | | 7.375 | % | | | | | | | 1,015,000 | | | | 1,131,725 | | |
04/15/22 | | | 7.625 | % | | | | | | | 1,765,000 | | | | 1,976,800 | | |
Total | | | | | | | | | 20,474,385 | | |
Consumer Cyclical Services 0.8% | |
APX Group, Inc.
12/01/20 | | | 8.750 | % | | | | | | | 4,063,000 | | | | 4,164,575 | | |
Senior Secured
12/01/19 | | | 6.375 | % | | | | | | | 5,023,000 | | | | 5,004,164 | | |
Corrections Corp. of America
05/01/23 | | | 4.625 | % | | | | | | | 2,423,000 | | | | 2,320,022 | | |
Goodman Networks, Inc.(b)
Senior Secured
07/01/18 | | | 12.125 | % | | | | | | | 1,241,000 | | | | 1,313,909 | | |
07/01/18 | | | 13.125 | % | | | | | | | 2,593,000 | | | | 2,742,097 | | |
Monitronics International, Inc.
04/01/20 | | | 9.125 | % | | | | | | | 1,380,000 | | | | 1,462,800 | | |
Monitronics International, Inc.(b)
04/01/20 | | | 9.125 | % | | | | | | | 860,000 | | | | 911,600 | | |
Total | | | | | | | | | 17,919,167 | | |
Consumer Products 0.6% | |
Libbey Glass, Inc.
Senior Secured
05/15/20 | | | 6.875 | % | | | | | | | 876,000 | | | | 941,700 | | |
Serta Simmons Holdings LLC
Senior Unsecured(b)
10/01/20 | | | 8.125 | % | | | | | | | 4,275,000 | | | | 4,531,500 | | |
Spectrum Brands Escrow Corp.(b)
11/15/20 | | | 6.375 | % | | | | | | | 2,086,000 | | | | 2,216,375 | | |
11/15/22 | | | 6.625 | % | | | | | | | 725,000 | | | | 773,937 | | |
Spectrum Brands, Inc.
03/15/20 | | | 6.750 | % | | | | | | | 667,000 | | | | 717,025 | | |
Springs Window Fashions LLC
Senior Secured(b)
06/01/21 | | | 6.250 | % | | | | | | | 3,414,000 | | | | 3,431,070 | | |
Tempur Sealy International, Inc.
12/15/20 | | | 6.875 | % | | | | | | | 488,000 | | | | 520,940 | | |
Total | | | | | | | | | 13,132,547 | | |
Diversified Manufacturing 0.4% | |
Actuant Corp.
06/15/22 | | | 5.625 | % | | | | | | | 1,319,000 | | | | 1,322,298 | | |
The accompanying Notes to Financial Statements are an integral part of this statement.
Annual Report 2013
8
Columbia Strategic Income Fund
Portfolio of Investments (continued)
October 31, 2013
Corporate Bonds & Notes(a) (continued)
Issuer | | Coupon
Rate | | Principal
Amount ($) | | Value ($) | |
Amsted Industries, Inc.
Senior Notes(b)
03/15/18 | | | 8.125 | % | | | | | | | 2,182,000 | | | | 2,312,920 | | |
Apex Tool Group LLC(b)
02/01/21 | | | 7.000 | % | | | | | | | 698,000 | | | | 706,725 | | |
Gardner Denver, Inc.
Senior Unsecured(b)
08/15/21 | | | 6.875 | % | | | | | | | 2,897,000 | | | | 2,947,697 | | |
Hamilton Sundstrand Corp.
Senior Unsecured(b)
12/15/20 | | | 7.750 | % | | | | | | | 2,286,000 | | | | 2,394,585 | | |
Total | | | | | | | | | 9,684,225 | | |
Electric 2.8% | |
AES Corp. (The)
Senior Unsecured
07/01/21 | | | 7.375 | % | | | | | | | 2,496,000 | | | | 2,826,720 | | |
Appalachian Power Co.
Senior Unsecured
03/30/21 | | | 4.600 | % | | | | | | | 9,330,000 | | | | 10,156,853 | | |
CMS Energy Corp.
Senior Unsecured
03/31/43 | | | 4.700 | % | | | | | | | 1,835,000 | | | | 1,746,186 | | |
Calpine Corp.(b)
Senior Secured
02/15/21 | | | 7.500 | % | | | | | | | 2,210,000 | | | | 2,392,325 | | |
01/15/22 | | | 6.000 | % | | | | | | | 727,000 | | | | 754,262 | | |
Cleveland Electric Illuminating Co. (The)
1st Mortgage
11/15/18 | | | 8.875 | % | | | | | | | 500,000 | | | | 641,773 | | |
Companhia de Eletricidade do Estad
04/27/16 | | | 11.750 | % | | BRL | | | | | 2,313,000 | | | | 975,710 | | |
Dominion Resources, Inc.
Senior Unsecured
11/30/17 | | | 6.000 | % | | | | | | | 1,080,000 | | | | 1,250,718 | | |
08/15/19 | | | 5.200 | % | | | | | | | 3,904,000 | | | | 4,440,421 | | |
09/15/42 | | | 4.050 | % | | | | | | | 1,100,000 | | | | 961,503 | | |
Duke Energy Corp.
Senior Unsecured
09/15/19 | | | 5.050 | % | | | | | | | 2,715,000 | | | | 3,056,919 | | |
09/15/21 | | | 3.550 | % | | | | | | | 415,000 | | | | 423,758 | | |
08/15/22 | | | 3.050 | % | | | | | | | 5,280,000 | | | | 5,092,549 | | |
GenOn Energy, Inc.
Senior Unsecured
10/15/20 | | | 9.875 | % | | | | | | | 1,640,000 | | | | 1,836,800 | | |
Nevada Power Co.
01/15/15 | | | 5.875 | % | | | | | | | 1,815,000 | | | | 1,925,445 | | |
PPL Capital Funding, Inc.
06/01/23 | | | 3.400 | % | | | | | | | 12,315,000 | | | | 11,625,422 | | |
Corporate Bonds & Notes(a) (continued)
Issuer | | Coupon
Rate | | Principal
Amount ($) | | Value ($) | |
Progress Energy, Inc.
Senior Unsecured
12/01/19 | | | 4.875 | % | | | | | | | 3,862,000 | | | | 4,297,216 | | |
04/01/22 | | | 3.150 | % | | | | | | | 5,994,000 | | | | 5,857,936 | | |
Southern California Edison Co.
1st Refunding Mortgage
06/01/21 | | | 3.875 | % | | | | | | | 3,520,000 | | | | 3,758,358 | | |
Total | | | | | | | | | 64,020,874 | | |
Entertainment 0.6% | |
AMC Entertainment, Inc.
06/01/19 | | | 8.750 | % | | | | | | | 3,177,000 | | | | 3,419,246 | | |
12/01/20 | | | 9.750 | % | | | | | | | 1,965,000 | | | | 2,245,012 | | |
Activision Blizzard, Inc.(b)
09/15/21 | | | 5.625 | % | | | | | | | 5,679,000 | | | | 5,877,765 | | |
Six Flags, Inc.(b)(d)(e)(f)
06/01/14 | | | 9.625 | % | | | | | | | 1,557,000 | | | | — | | |
Time Warner, Inc.
03/29/41 | | | 6.250 | % | | | | | | | 2,800,000 | | | | 3,148,522 | | |
Total | | | | | | | | | 14,690,545 | | |
Environmental 0.3% | |
Waste Management, Inc.
06/30/20 | | | 4.750 | % | | | | | | | 6,163,000 | | | | 6,733,694 | | |
Food and Beverage 1.1% | |
ARAMARK Corp.(b)
03/15/20 | | | 5.750 | % | | | | | | | 2,800,000 | | | | 2,933,000 | | |
B&G Foods, Inc.
06/01/21 | | | 4.625 | % | | | | | | | 4,077,000 | | | | 3,980,171 | | |
ConAgra Foods, Inc.
Senior Unsecured
09/15/22 | | | 3.250 | % | | | | | | | 5,750,000 | | | | 5,524,974 | | |
Cosan Luxembourg SA(b)
03/14/23 | | | 5.000 | % | | | | | | | 491,000 | | | | 446,561 | | |
Heineken NV
Senior Unsecured(b)
04/01/22 | | | 3.400 | % | | | | | | | 4,300,000 | | | | 4,261,618 | | |
MHP SA(b)
04/02/20 | | | 8.250 | % | | | | | | | 5,000,000 | | | | 4,289,727 | | |
SABMiller Holdings, Inc.(b)
01/15/22 | | | 3.750 | % | | | | | | | 4,880,000 | | | | 5,003,435 | | |
Total | | | | | | | | | 26,439,486 | | |
Gaming 1.8% | |
Boyd Gaming Corp.
07/01/20 | | | 9.000 | % | | | | | | | 434,000 | | | | 468,720 | | |
The accompanying Notes to Financial Statements are an integral part of this statement.
Annual Report 2013
9
Columbia Strategic Income Fund
Portfolio of Investments (continued)
October 31, 2013
Corporate Bonds & Notes(a) (continued)
Issuer | | Coupon
Rate | | Principal
Amount ($) | | Value ($) | |
Caesars Entertainment Operating Co., Inc.
Senior Secured
02/15/20 | | | 8.500 | % | | | | | | | 2,915,000 | | | | 2,692,731 | | |
02/15/20 | | | 9.000 | % | | | | | | | 5,249,000 | | | | 4,920,937 | | |
MGM Resorts International
03/01/18 | | | 11.375 | % | | | | | | | 1,925,000 | | | | 2,468,813 | | |
10/01/20 | | | 6.750 | % | | | | | | | 444,000 | | | | 483,960 | | |
12/15/21 | | | 6.625 | % | | | | | | | 4,363,000 | | | | 4,662,956 | | |
PNK Finance Corp.(b)
08/01/21 | | | 6.375 | % | | | | | | | 3,647,000 | | | | 3,829,350 | | |
Penn National Gaming, Inc.
Senior Unsecured(b)
11/01/21 | | | 5.875 | % | | | | | | | 1,153,000 | | | | 1,155,883 | | |
Pinnacle Entertainment, Inc.
04/01/22 | | | 7.750 | % | | | | | | | 93,000 | | | | 101,719 | | |
ROC Finance LLC/Corp.
Secured(b)
09/01/18 | | | 12.125 | % | | | | | | | 2,198,000 | | | | 2,373,840 | | |
Seminole Tribe of Florida, Inc.(b)
Senior Secured
10/01/20 | | | 6.535 | % | | | | | | | 1,510,000 | | | | 1,623,250 | | |
Senior Unsecured
10/01/20 | | | 7.804 | % | | | | | | | 2,225,000 | | | | 2,381,818 | | |
Seneca Gaming Corp.(b)
12/01/18 | | | 8.250 | % | | | | | | | 2,909,000 | | | | 3,130,811 | | |
Studio City Finance Ltd.(b)
12/01/20 | | | 8.500 | % | | | | | | | 4,397,000 | | | | 4,880,670 | | |
SugarHouse HSP Gaming LP/Finance Corp.
Senior Secured(b)
06/01/21 | | | 6.375 | % | | | | | | | 3,303,000 | | | | 3,162,622 | | |
Tunica-Biloxi Gaming Authority
Senior Unsecured(b)
11/15/15 | | | 9.000 | % | | | | | | | 2,397,000 | | | | 2,175,278 | | |
Total | | | | | | | | | 40,513,358 | | |
Gas Pipelines 3.5% | |
Access Midstream Partners LP/Finance Corp.
04/15/21 | | | 5.875 | % | | | | | | | 1,574,000 | | | | 1,688,115 | | |
05/15/23 | | | 4.875 | % | | | | | | | 3,724,000 | | | | 3,705,380 | | |
Colorado Interstate Gas Co. LLC
Senior Unsecured
11/15/15 | | | 6.800 | % | | | | | | | 3,219,000 | | | | 3,589,581 | | |
Crestwood Midstream Partners LP/Corp.(b)(g)
03/01/22 | | | 6.125 | % | | | | | | | 987,000 | | | | 1,009,208 | | |
El Paso LLC
Senior Secured
09/15/20 | | | 6.500 | % | | | | | | | 6,549,000 | | | | 6,986,563 | | |
01/15/32 | | | 7.750 | % | | | | | | | 6,853,000 | | | | 7,113,140 | | |
Enterprise Products Operating LLC
03/15/23 | | | 3.350 | % | | | | | | | 1,830,000 | | | | 1,766,521 | | |
03/15/44 | | | 4.850 | % | | | | | | | 1,405,000 | | | | 1,347,572 | | |
Corporate Bonds & Notes(a) (continued)
Issuer | | Coupon
Rate | | Principal
Amount ($) | | Value ($) | |
Hiland Partners LP/Finance Corp.(b)
10/01/20 | | | 7.250 | % | | | | | | | 6,335,000 | | | | 6,746,775 | | |
Kinder Morgan Energy Partners LP
Senior Unsecured
09/01/22 | | | 3.950 | % | | | | | | | 9,000,000 | | | | 8,924,616 | | |
02/15/23 | | | 3.450 | % | | | | | | | 1,623,000 | | | | 1,539,388 | | |
MarkWest Energy Partners LP/Finance Corp.
06/15/22 | | | 6.250 | % | | | | | | | 2,942,000 | | | | 3,199,425 | | |
02/15/23 | | | 5.500 | % | | | | | | | 2,894,000 | | | | 2,995,290 | | |
07/15/23 | | | 4.500 | % | | | | | | | 2,658,000 | | | | 2,578,260 | | |
NiSource Finance Corp.
09/15/17 | | | 5.250 | % | | | | | | | 6,860,000 | | | | 7,659,217 | | |
02/15/23 | | | 3.850 | % | | | | | | | 2,195,000 | | | | 2,145,720 | | |
Northwest Pipeline LLC
Senior Unsecured
04/15/17 | | | 5.950 | % | | | | | | | 500,000 | | | | 568,050 | | |
Regency Energy Partners LP/Finance Corp.
09/01/20 | | | 5.750 | % | | | | | | | 1,682,000 | | | | 1,740,870 | | |
07/15/21 | | | 6.500 | % | | | | | | | 3,807,000 | | | | 4,083,007 | | |
Regency Energy Partners LP/Finance Corp.(b)
11/01/23 | | | 4.500 | % | | | | | | | 1,451,000 | | | | 1,342,175 | | |
Sabine Pass Liquefaction LLC(b)
Senior Secured
02/01/21 | | | 5.625 | % | | | | | | | 2,593,000 | | | | 2,618,930 | | |
04/15/23 | | | 5.625 | % | | | | | | | 1,484,000 | | | | 1,454,320 | | |
Southern Natural Gas Co. LLC
Senior Unsecured(b)
04/01/17 | | | 5.900 | % | | | | | | | 2,315,000 | | | | 2,627,865 | | |
TransCanada PipeLines Ltd.
Senior Unsecured
10/16/43 | | | 5.000 | % | | | | | | | 720,000 | | | | 725,974 | | |
Transcontinental Gas Pipe Line Co. LLC
Senior Unsecured
08/01/42 | | | 4.450 | % | | | | | | | 2,275,000 | | | | 2,079,876 | | |
Total | | | | | | | | | 80,235,838 | | |
Health Care 2.8% | |
Amsurg Corp.
11/30/20 | | | 5.625 | % | | | | | | | 1,096,000 | | | | 1,101,480 | | |
Biomet, Inc.
08/01/20 | | | 6.500 | % | | | | | | | 3,807,000 | | | | 4,044,937 | | |
10/01/20 | | | 6.500 | % | | | | | | | 1,385,000 | | | | 1,440,400 | | |
ConvaTec Finance International SA
Senior Unsecured PIK(b)
01/15/19 | | | 8.250 | % | | | | | | | 2,304,000 | | | | 2,376,000 | | |
ConvaTec Healthcare E SA
Senior Unsecured(b)
12/15/18 | | | 10.500 | % | | | | | | | 5,272,000 | | | | 5,970,540 | | |
DaVita HealthCare Partners, Inc.
08/15/22 | | | 5.750 | % | | | | | | | 3,428,000 | | | | 3,517,985 | | |
The accompanying Notes to Financial Statements are an integral part of this statement.
Annual Report 2013
10
Columbia Strategic Income Fund
Portfolio of Investments (continued)
October 31, 2013
Corporate Bonds & Notes(a) (continued)
Issuer | | Coupon
Rate | | Principal
Amount ($) | | Value ($) | |
Emdeon, Inc.
12/31/19 | | | 11.000 | % | | | | | | | 2,635,000 | | | | 3,030,250 | | |
Fresenius Medical Care U.S. Finance II, Inc.(b)
07/31/19 | | | 5.625 | % | | | | | | | 813,000 | | | | 869,910 | | |
01/31/22 | | | 5.875 | % | | | | | | | 1,960,000 | | | | 2,077,600 | | |
Fresenius Medical Care U.S. Finance, Inc.(b)
09/15/18 | | | 6.500 | % | | | | | | | 332,000 | | | | 372,670 | | |
HCA Holdings, Inc.
Senior Unsecured
02/15/21 | | | 6.250 | % | | | | | | | 408,000 | | | | 428,400 | | |
HCA, Inc.
02/15/22 | | | 7.500 | % | | | | | | | 5,736,000 | | | | 6,445,830 | | |
Senior Secured
02/15/20 | | | 6.500 | % | | | | | | | 3,788,000 | | | | 4,214,150 | | |
05/01/23 | | | 4.750 | % | | | | | | | 1,719,000 | | | | 1,656,686 | | |
Healthcare Technology Intermediate, Inc.
Senior Unsecured PIK(b)
09/01/18 | | | 7.375 | % | | | | | | | 298,000 | | | | 309,920 | | |
Hologic, Inc.
08/01/20 | | | 6.250 | % | | | | | | | 510,000 | | | | 541,875 | | |
IMS Health, Inc.
Senior Unsecured(b)
11/01/20 | | | 6.000 | % | | | | | | | 1,511,000 | | | | 1,571,440 | | |
Kinetic Concepts, Inc./KCI U.S.A., Inc.
Secured
11/01/18 | | | 10.500 | % | | | | | | | 1,262,000 | | | | 1,419,750 | | |
MPH Intermediate Holding Co. 2
Senior Unsecured PIK(b)
08/01/18 | | | 8.375 | % | | | | | | | 1,718,000 | | | | 1,784,573 | | |
Multiplan, Inc.(b)
09/01/18 | | | 9.875 | % | | | | | | | 5,520,000 | | | | 6,092,700 | | |
Physio-Control International, Inc.
Senior Secured(b)
01/15/19 | | | 9.875 | % | | | | | | | 2,011,000 | | | | 2,242,265 | | |
STHI Holding Corp.
Secured(b)
03/15/18 | | | 8.000 | % | | | | | | | 891,000 | | | | 960,053 | | |
Tenet Healthcare Corp.
Senior Secured
04/01/21 | | | 4.500 | % | | | | | | | 2,605,000 | | | | 2,526,850 | | |
Tenet Healthcare Corp.(b)
Senior Secured
10/01/20 | | | 6.000 | % | | | | | | | 1,506,000 | | | | 1,596,360 | | |
Senior Unsecured
04/01/22 | | | 8.125 | % | | | | | | | 4,599,000 | | | | 5,047,402 | | |
Truven Health Analytics, Inc.
06/01/20 | | | 10.625 | % | | | | | | | 1,268,000 | | | | 1,437,595 | | |
United Surgical Partners International, Inc.
04/01/20 | | | 9.000 | % | | | | | | | 1,472,000 | | | | 1,648,640 | | |
Corporate Bonds & Notes(a) (continued)
Issuer | | Coupon
Rate | | Principal
Amount ($) | | Value ($) | |
Universal Hospital Services, Inc.
Secured
08/15/20 | | | 7.625 | % | | | | | | | 122,000 | | | | 128,100 | | |
Total | | | | | | | | | 64,854,361 | | |
Home Construction 0.5% | |
Ashton Woods U.S.A. LLC/Finance Co.(b)
02/15/21 | | | 6.875 | % | | | | | | | 296,000 | | | | 293,040 | | |
Beazer Homes USA, Inc.
02/01/23 | | | 7.250 | % | | | | | | | 592,000 | | | | 571,280 | | |
Brookfield Residential Properties, Inc. /U.S. Corp.(b)
07/01/22 | | | 6.125 | % | | | | | | | 894,000 | | | | 887,295 | | |
KB Home
03/15/20 | | | 8.000 | % | | | | | | | 332,000 | | | | 365,200 | | |
09/15/22 | | | 7.500 | % | | | | | | | 845,000 | | | | 887,250 | | |
Meritage Homes Corp.
03/01/18 | | | 4.500 | % | | | | | | | 1,527,000 | | | | 1,515,548 | | |
04/01/22 | | | 7.000 | % | | | | | | | 1,000,000 | | | | 1,060,000 | | |
Shea Homes LP/Funding Corp.
Senior Secured
05/15/19 | | | 8.625 | % | | | | | | | 1,535,000 | | | | 1,700,012 | | |
Taylor Morrison Communities, Inc./Monarch, Inc.(b)
04/15/20 | | | 7.750 | % | | | | | | | 1,529,000 | | | | 1,689,545 | | |
04/15/20 | | | 7.750 | % | | | | | | | 474,000 | | | | 523,770 | | |
04/15/21 | | | 5.250 | % | | | | | | | 1,107,000 | | | | 1,079,325 | | |
Woodside Homes Co. LLC/Finance, Inc.
Senior Unsecured(b)
12/15/21 | | | 6.750 | % | | | | | | | 1,047,000 | | | | 1,036,530 | | |
Total | | | | | | | | | 11,608,795 | | |
Independent Energy 5.7% | |
Antero Resources Finance Corp.(b)(g)
11/01/21 | | | 5.375 | % | | | | | | | 1,300,000 | | | | 1,321,125 | | |
Athlon Holdings LP/Finance Corp.(b)
04/15/21 | | | 7.375 | % | | | | | | | 1,766,000 | | | | 1,845,470 | | |
Aurora U.S.A. Oil & Gas, Inc.(b)
04/01/20 | | | 7.500 | % | | | | | | | 4,646,000 | | | | 4,796,995 | | |
Canadian Oil Sands Ltd.
Senior Unsecured(b)
04/01/22 | | | 4.500 | % | | | | | | | 3,810,000 | | | | 3,875,707 | | |
Carrizo Oil & Gas, Inc.
10/15/18 | | | 8.625 | % | | | | | | | 1,747,000 | | | | 1,912,965 | | |
Chesapeake Energy Corp.
08/15/20 | | | 6.625 | % | | | | | | | 5,020,000 | | | | 5,660,050 | | |
02/15/21 | | | 6.125 | % | | | | | | | 5,751,000 | | | | 6,282,967 | | |
03/15/23 | | | 5.750 | % | | | | | | | 3,754,000 | | | | 3,979,240 | | |
Comstock Resources, Inc.
06/15/20 | | | 9.500 | % | | | | | | | 5,358,000 | | | | 5,947,380 | | |
The accompanying Notes to Financial Statements are an integral part of this statement.
Annual Report 2013
11
Columbia Strategic Income Fund
Portfolio of Investments (continued)
October 31, 2013
Corporate Bonds & Notes(a) (continued)
Issuer | | Coupon
Rate | | Principal
Amount ($) | | Value ($) | |
Concho Resources, Inc.
01/15/21 | | | 7.000 | % | | | | | | | 3,680,000 | | | | 4,103,200 | | |
01/15/22 | | | 6.500 | % | | | | | | | 1,059,000 | | | | 1,156,958 | | |
04/01/23 | | | 5.500 | % | | | | | | | 3,842,000 | | | | 3,986,075 | | |
Continental Resources, Inc.
04/01/21 | | | 7.125 | % | | | | | | | 3,095,000 | | | | 3,466,400 | | |
09/15/22 | | | 5.000 | % | | | | | | | 8,978,000 | | | | 9,348,342 | | |
04/15/23 | | | 4.500 | % | | | | | | | 6,809,000 | | | | 6,868,579 | | |
EP Energy LLC/Everest Acquisition Finance, Inc.
09/01/22 | | | 7.750 | % | | | | | | | 425,000 | | | | 478,125 | | |
EP Energy LLC/Finance, Inc.
Senior Unsecured
05/01/20 | | | 9.375 | % | | | | | | | 2,382,000 | | | | 2,751,210 | | |
Kodiak Oil & Gas Corp.
12/01/19 | | | 8.125 | % | | | | | | | 3,798,000 | | | | 4,215,780 | | |
Kodiak Oil & Gas Corp.(b)
01/15/21 | | | 5.500 | % | | | | | | | 5,078,000 | | | | 5,204,950 | | |
02/01/22 | | | 5.500 | % | | | | | | | 5,445,000 | | | | 5,553,900 | | |
Laredo Petroleum, Inc.
02/15/19 | | | 9.500 | % | | | | | | | 6,085,000 | | | | 6,799,987 | | |
05/01/22 | | | 7.375 | % | | | | | | | 2,869,000 | | | | 3,105,692 | | |
MEG Energy Corp.(b)
01/30/23 | | | 6.375 | % | | | | | | | 1,195,000 | | | | 1,202,469 | | |
03/31/24 | | | 7.000 | % | | | | | | | 1,891,000 | | | | 1,933,548 | | |
Novatek Finance Ltd.(b)
Senior Unsecured
02/21/17 | | | 7.750 | % | | RUB | | | | | 61,400,000 | | | | 1,910,075 | | |
02/03/21 | | | 6.604 | % | | | | | | | 300,000 | | | | 333,859 | | |
Oasis Petroleum, Inc.
02/01/19 | | | 7.250 | % | | | | | | | 3,349,000 | | | | 3,600,175 | | |
11/01/21 | | | 6.500 | % | | | | | | | 3,320,000 | | | | 3,593,900 | | |
01/15/23 | | | 6.875 | % | | | | | | | 2,463,000 | | | | 2,672,355 | | |
Oasis Petroleum, Inc.(b)
03/15/22 | | | 6.875 | % | | | | | | | 1,759,000 | | | | 1,899,720 | | |
QEP Resources, Inc.
Senior Unsecured
03/01/21 | | | 6.875 | % | | | | | | | 4,244,000 | | | | 4,541,080 | | |
10/01/22 | | | 5.375 | % | | | | | | | 5,098,000 | | | | 4,983,295 | | |
05/01/23 | | | 5.250 | % | | | | | | | 1,190,000 | | | | 1,145,375 | | |
SM Energy Co.
Senior Unsecured
11/15/21 | | | 6.500 | % | | | | | | | 1,297,000 | | | | 1,407,245 | | |
01/01/23 | | | 6.500 | % | | | | | | | 1,067,000 | | | | 1,141,690 | | |
SM Energy Co.(b)
Senior Unsecured
01/15/24 | | | 5.000 | % | | | | | | | 2,115,000 | | | | 2,067,413 | | |
Whiting Petroleum Corp.
10/01/18 | | | 6.500 | % | | | | | | | 156,000 | | | | 166,140 | | |
Whiting Petroleum Corp.(b)
03/15/21 | | | 5.750 | % | | | | | | | 2,546,000 | | | | 2,679,665 | | |
Corporate Bonds & Notes(a) (continued)
Issuer | | Coupon
Rate | | Principal
Amount ($) | | Value ($) | |
Zhaikmunai LLP
11/13/19 | | | 7.125 | % | | | | | | | 3,025,000 | | | | 3,221,625 | | |
Total | | | | | | | | | 131,160,726 | | |
Integrated Energy 0.1% | |
Lukoil International Finance BV(b)
11/09/20 | | | 6.125 | % | | | | | | | 2,300,000 | | | | 2,531,114 | | |
Rosneft Finance SA(b)
03/13/18 | | | 7.875 | % | | | | | | | 425,000 | | | | 495,177 | | |
Total | | | | | | | | | 3,026,291 | | |
Lodging 0.3% | |
Choice Hotels International, Inc.
07/01/22 | | | 5.750 | % | | | | | | | 1,055,000 | | | | 1,110,388 | | |
Hilton Worldwide Finance/Corp.(b)
10/15/21 | | | 5.625 | % | | | | | | | 2,472,000 | | | | 2,539,980 | | |
Playa Resorts Holding BV
Senior Unsecured(b)
08/15/20 | | | 8.000 | % | | | | | | | 2,855,000 | | | | 3,037,315 | | |
Total | | | | | | | | | 6,687,683 | | |
Media Cable 1.2% | |
CCO Holdings LLC/Capital Corp.
04/30/20 | | | 8.125 | % | | | | | | | 1,615,000 | | | | 1,768,425 | | |
CSC Holdings, Inc.
Senior Unsecured
11/15/21 | | | 6.750 | % | | | | | | | 5,826,000 | | | | 6,364,905 | | |
Cablevision Systems Corp.
Senior Unsecured
04/15/20 | | | 8.000 | % | | | | | | | 1,175,000 | | | | 1,333,625 | | |
09/15/22 | | | 5.875 | % | | | | | | | 1,330,000 | | | | 1,331,663 | | |
Cequel Communications Holdings I LLC/Capital Corp.
Senior Unsecured(b)
09/15/20 | | | 6.375 | % | | | | | | | 2,149,000 | | | | 2,229,588 | | |
DIRECTV Holdings LLC/Financing Co., Inc.
03/15/42 | | | 5.150 | % | | | | | | | 2,525,000 | | | | 2,266,733 | | |
DISH DBS Corp.
06/01/21 | | | 6.750 | % | | | | | | | 6,343,000 | | | | 6,866,297 | | |
07/15/22 | | | 5.875 | % | | | | | | | 3,042,000 | | | | 3,114,247 | | |
Quebecor Media, Inc.
Senior Unsecured
01/15/23 | | | 5.750 | % | | | | | | | 2,727,000 | | | | 2,638,372 | | |
Time Warner Cable, Inc.
09/15/42 | | | 4.500 | % | | | | | | | 425,000 | | | | 318,552 | | |
Videotron Ltd.
07/15/22 | | | 5.000 | % | | | | | | | 58,000 | | | | 56,985 | | |
WaveDivision Escrow LLC/Corp.
Senior Unsecured(b)
09/01/20 | | | 8.125 | % | | | | | | | 70,000 | | | | 73,500 | | |
Total | | | | | | | | | 28,362,892 | | |
The accompanying Notes to Financial Statements are an integral part of this statement.
Annual Report 2013
12
Columbia Strategic Income Fund
Portfolio of Investments (continued)
October 31, 2013
Corporate Bonds & Notes(a) (continued)
Issuer | | Coupon
Rate | | Principal
Amount ($) | | Value ($) | |
Media Non-Cable 4.3% | |
AMC Networks, Inc.
07/15/21 | | | 7.750 | % | | | | | | | 5,832,000 | | | | 6,561,000 | | |
12/15/22 | | | 4.750 | % | | | | | | | 3,947,000 | | | | 3,818,723 | | |
British Sky Broadcasting Group PLC(b)
11/26/22 | | | 3.125 | % | | | | | | | 7,345,000 | | | | 6,987,835 | | |
Clear Channel Communications, Inc.
Senior Secured
03/01/21 | | | 9.000 | % | | | | | | | 3,722,000 | | | | 3,749,915 | | |
Clear Channel Worldwide Holdings, Inc.
03/15/20 | | | 7.625 | % | | | | | | | 5,303,000 | | | | 5,660,952 | | |
11/15/22 | | | 6.500 | % | | | | | | | 4,779,000 | | | | 5,017,950 | | |
DigitalGlobe, Inc.(b)
02/01/21 | | | 5.250 | % | | | | | | | 746,000 | | | | 721,755 | | |
Hughes Satellite Systems Corp.
06/15/21 | | | 7.625 | % | | | | | | | 585,000 | | | | 640,575 | | |
Senior Secured
06/15/19 | | | 6.500 | % | | | | | | | 4,440,000 | | | | 4,761,900 | | |
Intelsat Jackson Holdings SA
04/01/19 | | | 7.250 | % | | | | | | | 395,000 | | | | 425,613 | | |
10/15/20 | | | 7.250 | % | | | | | | | 1,620,000 | | | | 1,757,700 | | |
Senior Unsecured
04/01/21 | | | 7.500 | % | | | | | | | 2,660,000 | | | | 2,899,400 | | |
Intelsat Luxembourg SA(b)
06/01/21 | | | 7.750 | % | | | | | | | 1,134,000 | | | | 1,196,370 | | |
06/01/23 | | | 8.125 | % | | | | | | | 3,210,000 | | | | 3,402,600 | | |
Lamar Media Corp.
05/01/23 | | | 5.000 | % | | | | | | | 3,588,000 | | | | 3,417,570 | | |
MDC Partners, Inc.(b)
04/01/20 | | | 6.750 | % | | | | | | | 2,824,000 | | | | 2,936,960 | | |
NBCUniversal Media LLC
04/01/21 | | | 4.375 | % | | | | | | | 2,660,000 | | | | 2,898,748 | | |
01/15/43 | | | 4.450 | % | | | | | | | 3,775,000 | | | | 3,570,554 | | |
News America, Inc.
09/15/22 | | | 3.000 | % | | | | | | | 6,840,000 | | | | 6,529,156 | | |
12/15/35 | | | 6.400 | % | | | | | | | 150,000 | | | | 171,409 | | |
Nielsen Finance Co. SARL (The)(b)
10/01/21 | | | 5.500 | % | | | | | | | 2,784,000 | | | | 2,867,520 | | |
Nielsen Finance LLC/Co.
10/01/20 | | | 4.500 | % | | | | | | | 5,697,000 | | | | 5,583,060 | | |
Reed Elsevier Capital, Inc.
10/15/22 | | | 3.125 | % | | | | | | | 2,455,000 | | | | 2,303,006 | | |
Starz LLC/Finance Corp.
09/15/19 | | | 5.000 | % | | | | | | | 597,000 | | | | 602,970 | | |
TCM Sub LLC(b)
01/15/15 | | | 3.550 | % | | | | | | | 5,510,000 | | | | 5,676,409 | | |
Univision Communications, Inc.(b)
05/15/21 | | | 8.500 | % | | | | | | | 2,106,000 | | | | 2,332,395 | | |
Corporate Bonds & Notes(a) (continued)
Issuer | | Coupon
Rate | | Principal
Amount ($) | | Value ($) | |
Senior Secured
11/01/20 | | | 7.875 | % | | | | | | | 5,533,000 | | | | 6,155,462 | | |
09/15/22 | | | 6.750 | % | | | | | | | 962,000 | | | | 1,048,580 | | |
05/15/23 | | | 5.125 | % | | | | | | | 4,852,000 | | | | 4,803,480 | | |
Total | | | | | | | | | 98,499,567 | | |
Metals 1.4% | |
Alpha Natural Resources, Inc.
04/15/18 | | | 9.750 | % | | | | | | | 1,366,000 | | | | 1,406,980 | | |
06/01/19 | | | 6.000 | % | | | | | | | 178,000 | | | | 152,635 | | |
06/01/21 | | | 6.250 | % | | | | | | | 178,000 | | | | 150,855 | | |
ArcelorMittal
Senior Unsecured
02/25/22 | | | 6.750 | % | | | | | | | 4,364,000 | | | | 4,746,591 | | |
Arch Coal, Inc.
06/15/19 | | | 9.875 | % | | | | | | | 3,003,000 | | | | 2,552,550 | | |
06/15/21 | | | 7.250 | % | | | | | | | 151,000 | | | | 115,137 | | |
CONSOL Energy, Inc.
03/01/21 | | | 6.375 | % | | | | | | | 140,000 | | | | 146,650 | | |
Calcipar SA
Senior Secured(b)
05/01/18 | | | 6.875 | % | | | | | | | 3,797,000 | | | | 3,986,850 | | |
FMG Resources August 2006 Proprietary Ltd.(b)
11/01/19 | | | 8.250 | % | | | | | | | 5,542,000 | | | | 6,144,692 | | |
FQM Akubra, Inc.(b)
06/01/20 | | | 8.750 | % | | | | | | | 4,985,000 | | | | 5,508,425 | | |
06/01/21 | | | 7.500 | % | | | | | | | 1,464,000 | | | | 1,551,840 | | |
JMC Steel Group, Inc.
Senior Notes(b)
03/15/18 | | | 8.250 | % | | | | | | | 2,108,000 | | | | 2,094,825 | | |
Peabody Energy Corp.
11/15/18 | | | 6.000 | % | | | | | | | 930,000 | | | | 981,150 | | |
Samarco Mineracao SA
Senior Unsecured(b)
10/24/23 | | | 5.750 | % | | | | | | | 500,000 | | | | 500,000 | | |
Vale Overseas Ltd.
01/11/22 | | | 4.375 | % | | | | | | | 2,600,000 | | | | 2,544,147 | | |
Total | | | | | | | | | 32,583,327 | | |
Non-Captive Consumer 0.4% | |
Provident Funding Associates LP/PFG Finance Corp.(b)
06/15/21 | | | 6.750 | % | | | | | | | 3,196,000 | | | | 3,267,910 | | |
Springleaf Finance Corp.
Senior Unsecured
12/15/17 | | | 6.900 | % | | | | | | | 2,264,000 | | | | 2,450,780 | | |
Springleaf Finance Corp.(b)
Senior Unsecured
10/01/21 | | | 7.750 | % | | | | | | | 1,220,000 | | | | 1,311,500 | | |
10/01/23 | | | 8.250 | % | | | | | | | 1,220,000 | | | | 1,326,750 | | |
Total | | | | | | | | | 8,356,940 | | |
The accompanying Notes to Financial Statements are an integral part of this statement.
Annual Report 2013
13
Columbia Strategic Income Fund
Portfolio of Investments (continued)
October 31, 2013
Corporate Bonds & Notes(a) (continued)
Issuer | | Coupon
Rate | | Principal
Amount ($) | | Value ($) | |
Non-Captive Diversified 1.4% | |
Air Lease Corp.
03/01/20 | | | 4.750 | % | | | | | | | 3,093,000 | | | | 3,131,663 | | |
CIT Group, Inc.(b)
Senior Secured
04/01/18 | | | 6.625 | % | | | | | | | 3,125,000 | | | | 3,546,875 | | |
Senior Unsecured
02/15/19 | | | 5.500 | % | | | | | | | 6,682,000 | | | | 7,216,560 | | |
General Electric Capital Corp.
Senior Unsecured
01/09/23 | | | 3.100 | % | | | | | | | 9,605,000 | | | | 9,258,941 | | |
International Lease Finance Corp.
Senior Unsecured
04/01/19 | | | 5.875 | % | | | | | | | 853,000 | | | | 917,959 | | |
05/15/19 | | | 6.250 | % | | | | | | | 1,589,000 | | | | 1,732,010 | | |
12/15/20 | | | 8.250 | % | | | | | | | 4,098,000 | | | | 4,840,763 | | |
01/15/22 | | | 8.625 | % | | | | | | | 2,266,000 | | | | 2,741,860 | | |
Total | | | | | | | | | 33,386,631 | | |
Oil Field Services 0.8% | |
Atwood Oceanics, Inc.
Senior Unsecured
02/01/20 | | | 6.500 | % | | | | | | | 7,458,000 | | | | 7,980,060 | | |
Green Field Energy Services, Inc.(b)(c)(e)(h)
Secured
11/15/16 | | | 13.000 | % | | | | | | | 93,000 | | | | 46,500 | | |
11/15/16 | | | 13.000 | % | | | | | | | 3,895,000 | | | | 1,947,500 | | |
Oil States International, Inc.
06/01/19 | | | 6.500 | % | | | | | | | 2,681,000 | | | | 2,855,265 | | |
Oil States International, Inc.(b)
01/15/23 | | | 5.125 | % | | | | | | | 1,771,000 | | | | 1,970,238 | | |
Pacific Drilling SA
Senior Secured(b)
06/01/20 | | | 5.375 | % | | | | | | | 4,183,000 | | | | 4,214,372 | | |
Total | | | | | | | | | 19,013,935 | | |
Other Financial Institutions 0.1% | |
FTI Consulting, Inc.
11/15/22 | | | 6.000 | % | | | | | | | 859,000 | | | | 876,180 | | |
Patriot Merger Corp.
Senior Unsecured(b)
07/15/21 | | | 9.000 | % | | | | | | | 980,000 | | | | 1,019,200 | | |
Total | | | | | | | | | 1,895,380 | | |
Other Industry 0.2% | |
Interline Brands, Inc.
11/15/18 | | | 7.500 | % | | | | | | | 3,498,000 | | | | 3,703,507 | | |
Unifrax I LLC/Holding Co.(b)
02/15/19 | | | 7.500 | % | | | | | | | 1,487,000 | | | | 1,505,588 | | |
Total | | | | | | | | | 5,209,095 | | |
Corporate Bonds & Notes(a) (continued)
Issuer | | Coupon
Rate | | Principal
Amount ($) | | Value ($) | |
Packaging 0.4% | |
Plastipak Holdings, Inc.
Senior Unsecured(b)
10/01/21 | | | 6.500 | % | | | | | | | 3,191,000 | | | | 3,318,640 | | |
Reynolds Group Issuer, Inc./LLC
08/15/19 | | | 9.875 | % | | | | | | | 4,344,000 | | | | 4,805,550 | | |
Senior Secured
08/15/19 | | | 7.875 | % | | | | | | | 2,069,000 | | | | 2,286,245 | | |
Total | | | | | | | | | 10,410,435 | | |
Pharmaceuticals 0.5% | |
Capsugel SA
Senior Unsecured PIK(b)(g)
05/15/19 | | | 7.000 | % | | | | | | | 788,000 | | | | 788,000 | | |
Jaguar Holding Co. II/Merger Sub, Inc.
Senior Unsecured(b)
12/01/19 | | | 9.500 | % | | | | | | | 912,000 | | | | 1,023,720 | | |
Valeant Pharmaceuticals International(b)
10/15/20 | | | 6.375 | % | | | | | | | 4,197,000 | | | | 4,469,805 | | |
Senior Unsecured
08/15/18 | | | 6.750 | % | | | | | | | 1,757,000 | | | | 1,923,915 | | |
07/15/21 | | | 7.500 | % | | | | | | | 3,913,000 | | | | 4,343,430 | | |
Total | | | | | | | | | 12,548,870 | | |
Property & Casualty 1.2% | |
Alleghany Corp.
Senior Unsecured
06/27/22 | | | 4.950 | % | | | | | | | 2,000,000 | | | | 2,146,180 | | |
CNA Financial Corp.
Senior Unsecured
08/15/20 | | | 5.875 | % | | | | | | | 2,000,000 | | | | 2,320,476 | | |
HUB International Ltd.
Senior Unsecured(b)
10/01/21 | | | 7.875 | % | | | | | | | 4,819,000 | | | | 4,975,618 | | |
Liberty Mutual Group, Inc.(b)
05/01/22 | | | 4.950 | % | | | | | | | 8,205,000 | | | | 8,674,605 | | |
06/15/23 | | | 4.250 | % | | | | | | | 5,935,000 | | | | 5,937,890 | | |
Loews Corp.
Senior Unsecured
05/15/23 | | | 2.625 | % | | | | | | | 3,910,000 | | | | 3,618,771 | | |
Total | | | | | | | | | 27,673,540 | | |
Railroads 0.4% | |
Burlington Northern Santa Fe LLC
Senior Unsecured
03/15/43 | | | 4.450 | % | | | | | | | 3,005,000 | | | | 2,788,325 | | |
09/01/43 | | | 5.150 | % | | | | | | | 1,035,000 | | | | 1,065,737 | | |
The accompanying Notes to Financial Statements are an integral part of this statement.
Annual Report 2013
14
Columbia Strategic Income Fund
Portfolio of Investments (continued)
October 31, 2013
Corporate Bonds & Notes(a) (continued)
Issuer | | Coupon
Rate | | Principal
Amount ($) | | Value ($) | |
CSX Corp.
Senior Unsecured
04/15/41 | | | 5.500 | % | | | | | | | 3,205,000 | | | | 3,434,625 | | |
03/15/44 | | | 4.100 | % | | | | | | | 1,100,000 | | | | 955,995 | | |
Total | | | | | | | | | 8,244,682 | | |
REITs 0.1% | |
CyrusOne LP/Finance Corp.
11/15/22 | | | 6.375 | % | | | | | | | 2,451,000 | | | | 2,469,383 | | |
Duke Realty LP
08/15/19 | | | 8.250 | % | | | | | | | 200 | | | | 251 | | |
Total | | | | | | | | | 2,469,634 | | |
Restaurants 0.4% | |
Yum! Brands, Inc.
Senior Unsecured
11/01/20 | | | 3.875 | % | | | | | | | 1,800,000 | | | | 1,859,204 | | |
11/01/21 | | | 3.750 | % | | | | | | | 3,050,000 | | | | 3,096,564 | | |
11/01/23 | | | 3.875 | % | | | | | | | 4,440,000 | | | | 4,426,032 | | |
Total | | | | | | | | | 9,381,800 | | |
Retailers 0.6% | |
AutoNation, Inc.
02/01/20 | | | 5.500 | % | | | | | | | 186,000 | | | | 198,090 | | |
Burlington Coat Factory Warehouse Corp.
02/15/19 | | | 10.000 | % | | | | | | | 2,466,000 | | | | 2,761,920 | | |
Claire's Stores, Inc.
Senior Secured(b)
03/15/20 | | | 6.125 | % | | | | | | | 1,662,000 | | | | 1,674,465 | | |
J. Crew Group, Inc.
Senior Unsecured PIK(b)(g)
05/01/19 | | | 7.750 | % | | | | | | | 1,375,000 | | | | 1,383,594 | | |
Neiman Marcus Group, Inc. (The) PIK(b)
10/15/21 | | | 8.750 | % | | | | | | | 711,000 | | | | 730,553 | | |
Neiman Marcus Group, Inc. (The)(b)
10/15/21 | | | 8.000 | % | | | | | | | 854,000 | | | | 874,282 | | |
Rite Aid Corp.
06/15/21 | | | 6.750 | % | | | | | | | 4,225,000 | | | | 4,467,937 | | |
Senior Unsecured
02/15/27 | | | 7.700 | % | | | | | | | 919,000 | | | | 941,975 | | |
Total | | | | | | | | | 13,032,816 | | |
Technology 2.2% | |
Alliance Data Systems Corp.(b)
12/01/17 | | | 5.250 | % | | | | | | | 2,329,000 | | | | 2,401,781 | | |
04/01/20 | | | 6.375 | % | | | | | | | 1,321,000 | | | | 1,387,050 | | |
Ancestry.com, Inc.
Senior Unsecured PIK(b)
10/15/18 | | | 9.625 | % | | | | | | | 1,495,000 | | | | 1,521,163 | | |
Anixter, Inc.
05/01/19 | | | 5.625 | % | | | | | | | 650,000 | | | | 682,500 | | |
Corporate Bonds & Notes(a) (continued)
Issuer | | Coupon
Rate | | Principal
Amount ($) | | Value ($) | |
Audatex North America, Inc.(b)(g)
06/15/21 | | | 6.000 | % | | | | | | | 956,000 | | | | 987,070 | | |
11/01/23 | | | 6.125 | % | | | | | | | 956,000 | | | | 970,340 | | |
Brocade Communications Systems, Inc.
Senior Secured
01/15/20 | | | 6.875 | % | | | | | | | 1,817,000 | | | | 1,957,817 | | |
CDW LLC/Finance Corp.
04/01/19 | | | 8.500 | % | | | | | | | 2,830,000 | | | | 3,134,225 | | |
Cardtronics, Inc.
09/01/18 | | | 8.250 | % | | | | | | | 2,916,000 | | | | 3,163,860 | | |
DuPont Fabros Technology LP
Senior Unsecured(b)
09/15/21 | | | 5.875 | % | | | | | | | 1,028,000 | | | | 1,053,700 | | |
Equinix, Inc.
Senior Unsecured
04/01/20 | | | 4.875 | % | | | | | | | 1,054,000 | | | | 1,057,953 | | |
07/15/21 | | | 7.000 | % | | | | | | | 1,055,000 | | | | 1,152,588 | | |
04/01/23 | | | 5.375 | % | | | | | | | 4,580,000 | | | | 4,545,650 | | |
First Data Corp.
01/15/21 | | | 12.625 | % | | | | | | | 4,884,000 | | | | 5,634,915 | | |
First Data Corp.(b)
08/15/21 | | | 11.750 | % | | | | | | | 980,000 | | | | 997,150 | | |
Secured
01/15/21 | | | 8.250 | % | | | | | | | 2,681,000 | | | | 2,855,265 | | |
Senior Secured
08/15/20 | | | 8.875 | % | | | | | | | 5,745,000 | | | | 6,405,675 | | |
First Data Corp.(b)(g)
08/15/21 | | | 11.750 | % | | | | | | | 1,205,000 | | | | 1,226,088 | | |
Freescale Semiconductor, Inc.
Senior Secured(b)(g)
01/15/22 | | | 6.000 | % | | | | | | | 3,310,000 | | | | 3,347,237 | | |
NCR Corp.
07/15/22 | | | 5.000 | % | | | | | | | 1,045,000 | | | | 1,029,325 | | |
Nuance Communications, Inc.(b)
08/15/20 | | | 5.375 | % | | | | | | | 4,623,000 | | | | 4,588,327 | | |
VeriSign, Inc.
05/01/23 | | | 4.625 | % | | | | | | | 1,734,000 | | | | 1,688,482 | | |
Total | | | | | | | | | 51,788,161 | | |
Textile —% | |
Quiksilver Inc./QS Wholesale Inc.(b)
08/01/20 | | | 10.000 | % | | | | | | | 457,000 | | | | 498,130 | | |
Senior Secured
08/01/18 | | | 7.875 | % | | | | | | | 331,000 | | | | 354,170 | | |
Total | | | | | | | | | 852,300 | | |
Transportation Services 0.6% | |
Avis Budget Car Rental LLC/Finance, Inc.
01/15/19 | | | 8.250 | % | | | | | | | 1,775,000 | | | | 1,934,750 | | |
03/15/20 | | | 9.750 | % | | | | | | | 1,330,000 | | | | 1,556,100 | | |
The accompanying Notes to Financial Statements are an integral part of this statement.
Annual Report 2013
15
Columbia Strategic Income Fund
Portfolio of Investments (continued)
October 31, 2013
Corporate Bonds & Notes(a) (continued)
Issuer | | Coupon
Rate | | Principal
Amount ($) | | Value ($) | |
ERAC U.S.A. Finance LLC(b)
10/01/20 | | | 5.250 | % | | | | | | | 1,150,000 | | | | 1,280,428 | | |
03/15/42 | | | 5.625 | % | | | | | | | 415,000 | | | | 427,451 | | |
Hertz Corp. (The)
04/15/19 | | | 6.750 | % | | | | | | | 1,200,000 | | | | 1,294,500 | | |
10/15/20 | | | 5.875 | % | | | | | | | 1,295,000 | | | | 1,362,988 | | |
01/15/21 | | | 7.375 | % | | | | | | | 2,028,000 | | | | 2,251,080 | | |
LBC Tank Terminals Holding Netherlands BV(b)
05/15/23 | | | 6.875 | % | | | | | | | 3,462,000 | | | | 3,626,445 | | |
Total | | | | | | | | | 13,733,742 | | |
Wireless 2.9% | |
Crown Castle International Corp.
Senior Unsecured
01/15/23 | | | 5.250 | % | | | | | | | 4,178,000 | | | | 4,136,220 | | |
MetroPCS Wireless, Inc.(b)
04/01/23 | | | 6.625 | % | | | | | | | 1,804,000 | | | | 1,885,180 | | |
NII Capital Corp.
04/01/21 | | | 7.625 | % | | | | | | | 2,145,000 | | | | 1,244,100 | | |
NII International Telecom SCA(b)
08/15/19 | | | 7.875 | % | | | | | | | 996,000 | | | | 866,520 | | |
08/15/19 | | | 11.375 | % | | | | | | | 10,848,000 | | | | 10,305,600 | | |
SBA Communications Corp.
Senior Unsecured
10/01/19 | | | 5.625 | % | | | | | | | 378,000 | | | | 388,395 | | |
SBA Telecommunications, Inc.
07/15/20 | | | 5.750 | % | | | | | | | 4,581,000 | | | | 4,764,240 | | |
Sprint Communications, Inc.
Senior Unsecured
08/15/20 | | | 7.000 | % | | | | | | | 290,000 | | | | 311,025 | | |
11/15/22 | | | 6.000 | % | | | | | | | 320,000 | | | | 315,200 | | |
Sprint Communications, Inc.(b)
11/15/18 | | | 9.000 | % | | | | | | | 6,868,000 | | | | 8,327,450 | | |
03/01/20 | | | 7.000 | % | | | | | | | 4,701,000 | | | | 5,218,110 | | |
Sprint Corp.(b)
09/15/21 | | | 7.250 | % | | | | | | | 4,464,000 | | | | 4,809,960 | | |
09/15/23 | | | 7.875 | % | | | | | | | 4,464,000 | | | | 4,843,440 | | |
T-Mobile USA, Inc.
04/28/20 | | | 6.542 | % | | | | | | | 783,000 | | | | 829,980 | | |
04/28/21 | | | 6.633 | % | | | | | | | 1,819,000 | | | | 1,923,593 | | |
04/28/22 | | | 6.731 | % | | | | | | | 2,148,000 | | | | 2,268,825 | | |
04/28/23 | | | 6.836 | % | | | | | | | 457,000 | | | | 483,278 | | |
United States Cellular Corp.
Senior Unsecured
12/15/33 | | | 6.700 | % | | | | | | | 2,005,000 | | | | 1,937,008 | | |
VimpelCom Holdings BV(b)
02/13/18 9.000% RUB 71,400,000 2,256,089
03/01/22 | | | 7.504 | % | | | | | | | 1,000,000 | | | | 1,072,500 | | |
Corporate Bonds & Notes(a) (continued)
Issuer | | Coupon
Rate | | Principal
Amount ($) | | Value ($) | |
Wind Acquisition Finance SA
Senior Secured(b)
04/30/20 | | | 6.500 | % | | | | | | | 7,994,000 | | | | 8,233,820 | | |
Total | | | | | | | | | 66,420,533 | | |
Wirelines 2.7% | |
AT&T, Inc.
Senior Unsecured
06/15/45 | | | 4.350 | % | | | | | | | 8,210,000 | | | | 6,784,596 | | |
CenturyLink, Inc.
Senior Unsecured
06/15/21 | | | 6.450 | % | | | | | | | 6,715,000 | | | | 6,983,600 | | |
EarthLink, Inc.
Senior Secured
06/01/20 | | | 7.375 | % | | | | | | | 1,832,000 | | | | 1,818,260 | | |
Frontier Communications Corp.
Senior Unsecured
10/01/18 | | | 8.125 | % | | | | | | | 935,000 | | | | 1,077,588 | | |
04/15/20 | | | 8.500 | % | | | | | | | 2,050,000 | | | | 2,342,125 | | |
07/01/21 | | | 9.250 | % | | | | | | | 2,622,000 | | | | 3,090,682 | | |
04/15/22 | | | 8.750 | % | | | | | | | 953,000 | | | | 1,088,803 | | |
04/15/24 | | | 7.625 | % | | | | | | | 978,000 | | | | 1,031,790 | | |
Level 3 Communications, Inc.
Senior Unsecured
02/01/19 | | | 11.875 | % | | | | | | | 2,857,000 | | | | 3,314,120 | | |
06/01/19 | | | 8.875 | % | | | | | | | 756,000 | | | | 824,985 | | |
Level 3 Financing, Inc.
04/01/19 | | | 9.375 | % | | | | | | | 2,778,000 | | | | 3,104,415 | | |
07/01/19 | | | 8.125 | % | | | | | | | 1,656,000 | | | | 1,825,740 | | |
06/01/20 | | | 7.000 | % | | | | | | | 1,828,000 | | | | 1,951,390 | | |
07/15/20 | | | 8.625 | % | | | | | | | 1,865,000 | | | | 2,112,112 | | |
Level 3 Financing, Inc.(b)(g)
01/15/21 | | | 6.125 | % | | | | | | | 1,312,000 | | | | 1,334,960 | | |
Qtel International Finance Ltd.(b)
06/10/19 | | | 7.875 | % | | | | | | | 600,000 | | | | 746,414 | | |
10/19/25 | | | 5.000 | % | | | | | | | 1,900,000 | | | | 1,944,074 | | |
Verizon Communications, Inc.
Senior Unsecured
09/15/23 | | | 5.150 | % | | | | | | | 1,210,000 | | | | 1,312,835 | | |
11/01/42 | | | 3.850 | % | | | | | | | 8,595,000 | | | | 7,026,659 | | |
09/15/43 | | | 6.550 | % | | | | | | | 6,145,000 | | | | 7,129,497 | | |
Windstream Corp.
09/01/18 | | | 8.125 | % | | | | | | | 1,485,000 | | | | 1,607,513 | | |
10/15/20 | | | 7.750 | % | | | | | | | 2,188,000 | | | | 2,346,630 | | |
Zayo Group LLC/Capital, Inc.
07/01/20 | | | 10.125 | % | | | | | | | 1,927,000 | | | | 2,225,685 | | |
Total | | | | | | | | | 63,024,473 | | |
Total Corporate Bonds & Notes
(Cost: $1,124,342,888) | | | | | | | | | 1,156,628,054 | | |
The accompanying Notes to Financial Statements are an integral part of this statement.
Annual Report 2013
16
Columbia Strategic Income Fund
Portfolio of Investments (continued)
October 31, 2013
Residential Mortgage-Backed Securities — Agency 8.0%
Issuer | | Coupon
Rate | | Principal
Amount ($) | | Value ($) | |
Federal Home Loan Mortgage Corp.(c)(i)(j)
CMO IO STRIPS Series 277 Class S6
09/15/42 | | | 5.876 | % | | | | | | | 9,397,874 | | | | 2,016,879 | | |
CMO IO STRIPS Series 281 Class S1
10/15/42 | | | 5.826 | % | | | | | | | 17,088,651 | | | | 3,842,663 | | |
CMO IO Series 2957 Class SW
04/15/35 | | | 5.826 | % | | | | | | | 7,505,258 | | | | 1,322,043 | | |
CMO IO Series 3122 Class IS
03/15/36 | | | 6.526 | % | | | | | | | 6,661,848 | | | | 941,711 | | |
CMO IO Series 3550 Class EI
07/15/39 | | | 6.226 | % | | | | | | | 9,296,583 | | | | 1,372,080 | | |
CMO IO Series 3761 Class KS
06/15/40 | | | 5.826 | % | | | | | | | 9,435,875 | | | | 1,258,815 | | |
CMO IO Series 4091 Class SH
08/15/42 | | | 6.376 | % | | | | | | | 13,695,974 | | | | 3,492,135 | | |
CMO IO Series 4093 Class SD
01/15/38 | | | 6.526 | % | | | | | | | 28,088,682 | | | | 6,496,511 | | |
Federal Home Loan Mortgage Corp.(i)
05/01/21 | | | 5.000 | % | | | | | | | 2,640,659 | | | | 2,808,369 | | |
01/01/20 | | | 10.500 | % | | | | | | | 3,283 | | | | 3,302 | | |
Federal Home Loan Mortgage Corp.(i)(j)
CMO IO Series 304 Class C69
12/15/42 | | | 4.000 | % | | | | | | | 19,360,648 | | | | 4,351,598 | | |
CMO IO Series 4120 Class AI
11/15/39 | | | 3.500 | % | | | | | | | 17,503,835 | | | | 3,140,577 | | |
CMO IO Series 4121 Class IA
01/15/41 | | | 3.500 | % | | | | | | | 15,503,700 | | | | 3,363,861 | | |
Federal National Mortgage Association(c)(i)(j)
CMO IO Series 2006-5 Class N1
08/25/34 | | | 2.111 | % | | | | | | | 26,214,555 | | | | 1,460,237 | | |
CMO IO Series 2006-5 Class N2
02/25/35 | | | 2.159 | % | | | | | | | 36,467,527 | | | | 2,535,036 | | |
CMO IO Series 2010-135 Class MS
12/25/40 | | | 5.780 | % | | | | | | | 6,123,159 | | | | 1,281,591 | | |
CMO IO Series 2012-80 Class AS
02/25/39 | | | 5.880 | % | | | | | | | 16,394,358 | | | | 3,113,807 | | |
CMO IO Series 2012-87 Class SQ
08/25/42 | | | 6.130 | % | | | | | | | 10,705,199 | | | | 2,646,843 | | |
Federal National Mortgage Association(g)(i)
11/01/28 | | | 3.000 | % | | | | | | | 19,000,000 | | | | 19,733,282 | | |
11/01/28-
11/01/43 | | | 3.500 | % | | | | | | | 38,000,000 | | | | 39,774,961 | | |
Federal National Mortgage Association(i)
05/01/41-
06/01/42 | | | 4.000 | % | | | | | | | 20,476,661 | | | | 21,534,004 | | |
12/01/20 | | | 4.500 | % | | | | | | | 121,541 | | | | 129,190 | | |
05/01/33-
06/01/34 | | | 5.000 | % | | | | | | | 3,940,297 | | | | 4,283,350 | | |
02/01/35 | | | 5.500 | % | | | | | | | 192,222 | | | | 209,930 | | |
04/01/34-
02/01/37 | | | 6.000 | % | | | | | | | 2,340,596 | | | | 2,565,715 | | |
12/01/31-
11/01/36 | | | 6.500 | % | | | | | | | 4,315,387 | | | | 4,818,213 | | |
10/01/37-
07/01/38 | | | 7.000 | % | | | | | | | 423,166 | | | | 483,683 | | |
04/01/14 | | | 10.000 | % | | | | | | | 1,507 | | | | 1,511 | | |
Residential Mortgage-Backed Securities — Agency (continued)
Issuer | | Coupon
Rate | | Principal
Amount ($) | | Value ($) | |
Federal National Mortgage Association(i)(j)
CMO IO Series 2012-118 Class BI
12/25/39 | | | 3.500 | % | | | | | | | 27,654,102 | | | | 4,870,540 | | |
CMO IO Series 2012-133 Class EI
07/25/31 | | | 3.500 | % | | | | | | | 10,323,013 | | | | 1,949,093 | | |
CMO IO Series 2012-139 Class IL
04/25/40 | | | 3.500 | % | | | | | | | 13,989,213 | | | | 2,680,281 | | |
CMO IO Series 2012-96 Class CI
04/25/39 | | | 3.500 | % | | | | | | | 23,047,740 | | | | 3,947,718 | | |
CMO IO Series 2013-1 Class AI
02/25/43 | | | 3.500 | % | | | | | | | 8,858,125 | | | | 2,039,480 | | |
Federal National Mortgage Association(i)(k)
07/01/40 | | | 4.500 | % | | | | | | | 9,102,517 | | | | 9,803,049 | | |
Government National Mortgage Association(c)(i)(j)
CMO IO Series 2012-41 Class SA
03/20/42 | | | 6.428 | % | | | | | | | 20,542,390 | | | | 4,980,494 | | |
CMO IO Series 2012-48 Class SA
04/16/42 | | | 6.475 | % | | | | | | | 4,050,067 | | | | 873,912 | | |
Government National Mortgage Association(g)(i)
11/01/43 | | | 3.000 | % | | | | | | | 11,000,000 | | | | 10,963,907 | | |
Government National Mortgage Association(i)(j)
CMO IO Series 2012-94 Class BI
05/20/37 | | | 4.000 | % | | | | | | | 25,881,378 | | | | 4,700,793 | | |
Total Residential Mortgage-Backed
Securities — Agency
(Cost: $182,892,677) | | | | | | | | | 185,791,164 | | |
Residential Mortgage-Backed Securities —
Non-Agency 5.3% | |
Apollo Residential Mortgage Securitization Trust
CMO Series 2013-1 Class A(b)(i)
05/25/47 | | | 4.000 | % | | | | | | | 8,625,889 | | | | 8,809,189 | | |
BCAP LLC Trust(b)(c)(i)
CMO Series 2010-RR7 Class 17A7
03/26/36 | | | 5.023 | % | | | | | | | 1,769,159 | | | | 1,530,827 | | |
CMO Series 2013-RR3 Class 6A5
03/26/36 | | | 2.856 | % | | | | | | | 5,625,863 | | | | 5,523,540 | | |
CMO Series 2013-RR5 Class 4A1
09/26/36 | | | 3.000 | % | | | | | | | 6,095,893 | | | | 6,076,872 | | |
Series 2013-RR1 Class 10A1
10/26/36 | | | 3.000 | % | | | | | | | 4,554,494 | | | | 4,471,766 | | |
BCAP LLC Trust(b)(i)
CMO Series 2010-RR7 Class 8A6
05/26/35 | | | 5.500 | % | | | | | | | 2,640,000 | | | | 2,608,111 | | |
Banc of America Funding Corp.
CMO Series 2012-R5 Class A(b)(c)(i)
10/03/39 | | | 0.439 | % | | | | | | | 6,484,180 | | | | 6,322,841 | | |
The accompanying Notes to Financial Statements are an integral part of this statement.
Annual Report 2013
17
Columbia Strategic Income Fund
Portfolio of Investments (continued)
October 31, 2013
Residential Mortgage-Backed Securities —
Non-Agency (continued)
Issuer | | Coupon
Rate | | Principal
Amount ($) | | Value ($) | |
Bayview Opportunity Master Fund Trust IIB LP(b)(c)(i)
CMO Series 2012-6NPL Class A
01/28/33 | | | 2.981 | % | | | | | | | 6,154,118 | | | | 6,123,348 | | |
Series 2012-4NPL Class A
07/28/32 | | | 3.475 | % | | | | | | | 3,223,058 | | | | 3,235,087 | | |
Series 2012-5NPL Class A
10/28/32 | | | 2.981 | % | | | | | | | 7,002,215 | | | | 7,039,469 | | |
Castle Peak Loan Trust
CMO Series 2012-1A Class A1(b)(i)
05/25/52 | | | 5.000 | % | | | | | | | 4,996,678 | | | | 4,996,678 | | |
Citigroup Mortgage Loan Trust, Inc.(b)(c)(i)
CMO Series 2009-3 Class 4A3
10/25/33 | | | 2.428 | % | | | | | | | 6,105,977 | | | | 5,489,976 | | |
CMO Series 2009-4 Class 9A2
03/25/36 | | | 2.618 | % | | | | | | | 3,040,248 | | | | 2,533,253 | | |
CMO Series 2010-6 Class 2A2
09/25/35 | | | 2.670 | % | | | | | | | 1,143,314 | | | | 1,040,590 | | |
CMO Series 2010-6 Class 3A2
07/25/36 | | | 2.614 | % | | | | | | | 4,920,000 | | | | 4,654,328 | | |
CMO Series 2010-7 Class 3A4
12/25/35 | | | 6.382 | % | | | | | | | 2,185,000 | | | | 2,208,531 | | |
CMO Series 2013-2 Class 1A1
11/25/37 | | | 5.934 | % | | | | | | | 5,200,897 | | | | 5,389,954 | | |
Citigroup Mortgage Loan Trust, Inc.(b)(i)
CMO Series 2012-A Class A
06/25/51 | | | 2.500 | % | | | | | | | 6,170,884 | | | | 6,016,612 | | |
Credit Suisse Mortgage Capital Certificates(b)(c)(i)
CMO Series 2011-4R Class 4A7
08/27/37 | | | 4.000 | % | | | | | | | 8,522,738 | | | | 8,466,600 | | |
CMO Series 2011-7R Class A1
08/28/47 | | | 1.429 | % | | | | | | | 1,999,202 | | | | 1,993,671 | | |
Series 2012-11 Class 3A2
06/29/47 | | | 1.179 | % | | | | | | | 8,599,883 | | | | 7,973,708 | | |
Credit Suisse Mortgage Capital Certificates(b)(i)
CMO Series 2010-9R Class 10A5
04/27/37 | | | 4.000 | % | | | | | | | 3,000,000 | | | | 2,941,455 | | |
CMO Series 2010-9R Class 7A5
05/27/37 | | | 4.000 | % | | | | | | | 4,000,000 | | | | 3,970,704 | | |
Deutsche Mortgage Securities, Inc.
CMO Series 2003-1 Class 1A7(i)
04/25/33 | | | 5.500 | % | | | | | | | 1,815,944 | | | | 1,844,269 | | |
JPMorgan Resecuritization Trust
CMO Series 2010-5 Class 1A6(b)(c)(i)
04/26/37 | | | 4.500 | % | | | | | | | 1,312,000 | | | | 1,323,409 | | |
PennyMac Loan Trust
Series 2012-NPL1 Class A(b)(c)(i)
05/28/52 | | | 3.422 | % | | | | | | | 4,381,674 | | | | 4,360,607 | | |
RBSSP Resecuritization Trust
CMO Series 2010-12 Class 3A4(b)(c)(i)
06/27/32 | | | 4.000 | % | | | | | | | 424,553 | | | | 425,067 | | |
Residential Mortgage-Backed Securities —
Non-Agency (continued)
Issuer | | Coupon
Rate | | Principal
Amount ($) | | Value ($) | |
Residential Mortgage Asset Trust
Series 2012-1A Class A1(b)(c)(i)
08/26/52 | | | 2.734 | % | | | | | | | 5,292,314 | | | | 5,328,633 | | |
Wells Fargo Mortgage-Backed Securities Trust
CMO Series 2005-18 Class 2A6(i)
01/25/36 | | | 5.500 | % | | | | | | | 171,176 | | | | 170,253 | | |
Total Residential Mortgage-Backed
Securities — Non-Agency
(Cost: $121,522,446) | | | | | | | | | 122,869,348 | | |
Commercial Mortgage-Backed Securities —
Non-Agency 0.6% | |
Bear Stearns Commercial Mortgage Securities
Series 2005-T18 Class A4(c)(i)
02/13/42 | | | 4.933 | % | | | | | | | 1,636,239 | | | | 1,700,985 | | |
ORES NPL LLC
Series 2013-LV2 Class A(b)(i)
09/25/25 | | | 3.081 | % | | | | | | | 5,718,693 | | | | 5,719,499 | | |
Rialto Real Estate Fund
Series 2013-LT2 Class A(b)(i)
05/22/28 | | | 2.833 | % | | | | | | | 5,592,756 | | | | 5,597,924 | | |
S2 Hospitality LLC
Series 2012-LV1 Class A(b)(i)
04/15/25 | | | 4.500 | % | | | | | | | 300,130 | | | | 300,130 | | |
TIAA Seasoned Commercial Mortgage Trust
Series 2007-C4 Class A3(c)(i)
08/15/39 | | | 5.560 | % | | | | | | | 26,175 | | | | 27,152 | | |
Total Commercial Mortgage-Backed
Securities — Non-Agency
(Cost: $13,232,735) | | | | | | | | | 13,345,690 | | |
Asset-Backed Securities — Non-Agency 0.2% | |
American Credit Acceptance Receivables Trust
Series 2012-3 Class A(b)
11/15/16 | | | 1.640 | % | | | | | | | 2,462,032 | | | | 2,462,058 | | |
GMAC Mortgage Corp Loan Trust
Series 2004-HE5 Class A5 (FGIC)(c)
09/25/34 | | | 5.865 | % | | | | | | | 1,640,400 | | | | 1,687,167 | | |
Total Asset-Backed Securities — Non-Agency
(Cost: $4,102,342) | | | | | | | | | 4,149,225 | | |
The accompanying Notes to Financial Statements are an integral part of this statement.
Annual Report 2013
18
Columbia Strategic Income Fund
Portfolio of Investments (continued)
October 31, 2013
Inflation-Indexed Bonds(a) 1.8%
Issuer | | Coupon
Rate | | Principal
Amount ($) | | Value ($) | |
United States 1.1% | |
U.S. Treasury Inflation-Indexed Bond
01/15/23 | | | 0.125 | % | | | | | | | 19,829,107 | | | | 19,379,858 | | |
02/15/43 | | | 0.625 | % | | | | | | | 7,822,652 | | | | 6,479,965 | | |
Total | | | | | | | | | 25,859,823 | | |
Uruguay 0.7% | |
Uruguay Government International Bond
04/05/27 | | | 4.250 | % | | UYU | | | | | 111,917,002 | | | | 5,564,425 | | |
Senior Unsecured
12/15/28 | | | 4.375 | % | | UYU | | | | | 213,969,197 | | | | 10,809,130 | | |
Total | | | | | | | | | 16,373,555 | | |
Total Inflation-Indexed Bonds
(Cost: $44,725,658) | | | | | | | | | 42,233,378 | | |
U.S. Treasury Obligations 2.1% | |
U.S. Treasury
02/28/15 | | | 0.250 | % | | | | | | | 14,417,000 | | | | 14,425,449 | | |
07/31/16 | | | 1.500 | % | | | | | | | 14,000,000 | | | | 14,376,250 | | |
05/15/23 | | | 1.750 | % | | | | | | | 1,040,000 | | | | 971,343 | | |
02/15/43 | | | 3.125 | % | | | | | | | 4,565,000 | | | | 4,134,178 | | |
05/15/43 | | | 2.875 | % | | | | | | | 16,070,000 | | | | 13,787,558 | | |
Total U.S. Treasury Obligations
(Cost: $47,180,593) | | | | | | | | | 47,694,778 | | |
Foreign Government Obligations(a)(r) 22.8%
Argentina 0.5% | |
Argentina Boden Bonds
10/03/15 | | | 7.000 | % | | | | | | | 2,275,000 | | | | 2,153,288 | | |
Argentina Bonar Bonds
04/17/17 | | | 7.000 | % | | | | | | | 4,637,000 | | | | 4,034,190 | | |
Provincia de Buenos Aires
Senior Unsecured(b)
01/26/21 | | | 10.875 | % | | | | | | | 2,490,000 | | | | 2,290,800 | | |
Provincia de Cordoba
Senior Unsecured(b)
08/17/17 | | | 12.375 | % | | | | | | | 2,570,000 | | | | 2,390,100 | | |
Total | | | | | | | | | 10,868,378 | | |
Australia 0.9% | |
Treasury Corp. of Victoria
Local Government Guaranteed
11/15/16 | | | 5.750 | % | | AUD | | | | | 12,750,000 | | | | 12,929,603 | | |
06/15/20 | | | 6.000 | % | | AUD | | | | | 8,300,000 | | | | 8,714,822 | | |
Total | | | | | | | | | 21,644,425 | | |
Foreign Government Obligations(a)(r) (continued)
Issuer | | Coupon
Rate | | Principal
Amount ($) | | Value ($) | |
Brazil 1.1% | |
Brazil Notas do Tesouro Nacional
Senior Notes
01/01/17 | | | 10.000 | % | | BRL | | | | | 7,339,000 | | | | 3,268,409 | | |
Brazilian Government International Bond
08/17/40 | | | 11.000 | % | | | | | | | 2,700,000 | | | | 3,149,550 | | |
Senior Unsecured
01/05/24 | | | 8.500 | % | | BRL | | | | | 6,700,000 | | | | 2,729,109 | | |
01/20/34 | | | 8.250 | % | | | | | | | 6,260,000 | | | | 8,357,100 | | |
Morgan Stanley
Senior Unsecured
10/22/20 | | | 11.500 | % | | BRL | | | | | 6,285,000 | | | | 2,763,065 | | |
Morgan Stanley(b)
Senior Unsecured
05/03/17 | | | 10.090 | % | | BRL | | | | | 1,855,000 | | | | 801,139 | | |
Petrobras Global Finance BV
05/20/23 | | | 4.375 | % | | | | | | | 1,000,000 | | | | 924,094 | | |
Petrobras International Finance Co.
01/27/21 | | | 5.375 | % | | | | | | | 2,900,000 | | | | 2,945,795 | | |
01/20/40 | | | 6.875 | % | | | | | | | 1,400,000 | | | | 1,401,284 | | |
Total | | | | | | | | | 26,339,545 | | |
Chile —% | |
Empresa Nacional del Petroleo
Senior Unsecured(b)
07/08/19 | | | 6.250 | % | | | | | | | 600,000 | | | | 658,663 | | |
Colombia 1.0% | |
Bogota Distrito Capital
Senior Unsecured(b)
07/26/28 | | | 9.750 | % | | COP | | | | | 200,000,000 | | | | 133,961 | | |
Colombia Government International Bond
Senior Unsecured
05/21/24 | | | 8.125 | % | | | | | | | 790,000 | | | | 1,046,750 | | |
06/28/27 | | | 9.850 | % | | COP | | | | | 300,000,000 | | | | 211,562 | | |
01/18/41 | | | 6.125 | % | | | | | | | 4,200,000 | | | | 4,714,368 | | |
Corporación Andina de Fomento
06/15/22 | | | 4.375 | % | | | | | | | 1,150,000 | | | | 1,165,759 | | |
Ecopetrol SA
Senior Unsecured
07/23/19 | | | 7.625 | % | | | | | | | 3,855,000 | | | | 4,645,275 | | |
Empresa de Energia de Bogota SA
Senior Unsecured(b)
11/10/21 | | | 6.125 | % | | | | | | | 1,524,000 | | | | 1,596,999 | | |
Empresas Publicas de Medellin ESP(b)
Senior Unsecured
07/29/19 | | | 7.625 | % | | | | | | | 100,000 | | | | 119,000 | | |
02/01/21 | | | 8.375 | % | | COP | | | | | 13,266,000,000 | | | | 7,301,260 | | |
Transportadora de Gas Internacional SA ESP
Senior Unsecured(b)
03/20/22 | | | 5.700 | % | | | | | | | 2,800,000 | | | | 2,929,859 | | |
Total | | | | | | | | | 23,864,793 | | |
The accompanying Notes to Financial Statements are an integral part of this statement.
Annual Report 2013
19
Columbia Strategic Income Fund
Portfolio of Investments (continued)
October 31, 2013
Foreign Government Obligations(a)(r) (continued)
Issuer | | Coupon
Rate | | Principal
Amount ($) | | Value ($) | |
Dominican Republic 0.5% | |
Banco de Reservas de La Republica Dominicana
Subordinated Notes(b)
02/01/23 | | | 7.000 | % | | | | | | | 2,750,000 | | | | 2,619,375 | | |
Dominican Republic International Bond(b)
07/05/19 | | | 15.000 | % | | DOP | | | | | 73,000,000 | | | | 1,831,434 | | |
Senior Unsecured
05/06/21 | | | 7.500 | % | | | | | | | 2,625,000 | | | | 2,916,711 | | |
04/18/24 | | | 5.875 | % | | | | | | | 1,800,000 | | | | 1,737,455 | | |
04/20/27 | | | 8.625 | % | | | | | | | 2,900,000 | | | | 3,252,350 | | |
Total | | | | | | | | | 12,357,325 | | |
El Salvador 0.1% | |
El Salvador Government International Bond(b)
Senior Unsecured
04/10/32 | | | 8.250 | % | | | | | | | 400,000 | | | | 456,000 | | |
06/15/35 | | | 7.650 | % | | | | | | | 490,000 | | | | 518,175 | | |
02/01/41 | | | 7.625 | % | | | | | | | 1,500,000 | | | | 1,576,500 | | |
Total | | | | | | | | | 2,550,675 | | |
Finland 0.1% | |
Finland Government Bond
Senior Unsecured
07/04/15 | | | 4.250 | % | | EUR | | | | | 1,920,000 | | | | 2,784,472 | | |
France 0.9% | |
France Government Bond OAT
04/25/17 | | | 3.750 | % | | EUR | | | | | 2,900,000 | | | | 4,363,901 | | |
10/25/18 | | | 4.250 | % | | EUR | | | | | 1,900,000 | | | | 2,989,786 | | |
04/25/22 | | | 3.000 | % | | EUR | | | | | 1,600,000 | | | | 2,357,487 | | |
04/25/29 | | | 5.500 | % | | EUR | | | | | 4,320,000 | | | | 7,810,235 | | |
French Treasury Note
07/12/15 | | | 2.000 | % | | EUR | | | | | 1,970,000 | | | | 2,754,100 | | |
Total | | | | | | | | | 20,275,509 | | |
Georgia 0.2% | |
Georgian Railway JSC
Senior Unsecured(b)
07/11/22 | | | 7.750 | % | | | | | | | 3,639,000 | | | | 3,839,623 | | |
Germany 0.3% | |
Bundesrepublik Deutschland
07/04/17 | | | 4.250 | % | | EUR | | | | | 1,350,000 | | | | 2,094,158 | | |
01/04/18 | | | 4.000 | % | | EUR | | | | | 880,000 | | | | 1,371,665 | | |
01/04/19 | | | 3.750 | % | | EUR | | | | | 1,300,000 | | | | 2,042,438 | | |
07/04/21 | | | 3.250 | % | | EUR | | | | | 680,000 | | | | 1,061,575 | | |
Total | | | | | | | | | 6,569,836 | | |
Foreign Government Obligations(a)(r) (continued)
Issuer | | Coupon
Rate | | Principal
Amount ($) | | Value ($) | |
Guatemala 0.5% | |
Guatemala Government Bond(b)
Senior Unsecured
06/06/22 | | | 5.750 | % | | | | | | | 4,500,000 | | | | 4,774,500 | | |
02/13/28 | | | 4.875 | % | | | | | | | 6,478,000 | | | | 6,089,320 | | |
Total | | | | | | | | | 10,863,820 | | |
Hungary 0.3% | |
Hungary Government International Bond
Senior Unsecured
02/19/18 | | | 4.125 | % | | | | | | | 2,000,000 | | | | 2,007,306 | | |
Magyar Export-Import Bank Zrt(b)
02/12/18 | | | 5.500 | % | | | | | | | 5,000,000 | | | | 5,138,005 | | |
Total | | | | | | | | | 7,145,311 | | |
Indonesia 1.9% | |
Indonesia Government International Bond(b)
Senior Unsecured
05/04/14 | | | 10.375 | % | | | | | | | 6,180,000 | | | | 6,442,650 | | |
04/20/15 | | | 7.250 | % | | | | | | | 1,300,000 | | | | 1,400,750 | | |
03/13/20 | | | 5.875 | % | | | | | | | 11,125,000 | | | | 12,265,312 | | |
Indonesia Treasury Bond
Senior Unsecured
06/15/15 | | | 9.500 | % | | IDR | | | | | 11,920,000,000 | | | | 1,109,255 | | |
07/15/17 | | | 10.000 | % | | IDR | | | | | 15,043,000,000 | | | | 1,457,259 | | |
09/15/19 | | | 11.500 | % | | IDR | | | | | 36,600,000,000 | | | | 3,896,208 | | |
11/15/20 | | | 11.000 | % | | IDR | | | | | 2,000,000,000 | | | | 212,734 | | |
06/15/21 | | | 12.800 | % | | IDR | | | | | 17,200,000,000 | | | | 1,991,218 | | |
09/15/25 | | | 11.000 | % | | IDR | | | | | 16,500,000,000 | | | | 1,818,696 | | |
05/15/27 | | | 7.000 | % | | IDR | | | | | 11,380,000,000 | | | | 938,707 | | |
Majapahit Holding BV(b)
06/28/17 | | | 7.250 | % | | | | | | | 562,000 | | | | 633,681 | | |
01/20/20 | | | 7.750 | % | | | | | | | 1,100,000 | | | | 1,265,369 | | |
06/29/37 | | | 7.875 | % | | | | | | | 2,780,000 | | | | 3,099,700 | | |
PT Pertamina Persero(b)
Senior Unsecured
05/03/22 | | | 4.875 | % | | | | | | | 1,600,000 | | | | 1,540,000 | | |
05/20/23 | | | 4.300 | % | | | | | | | 4,788,000 | | | | 4,369,050 | | |
PT Perusahaan Listrik Negara
Senior Unsecured(b)
11/22/21 | | | 5.500 | % | | | | | | | 1,678,000 | | | | 1,691,237 | | |
Perusahaan Penerbit SBSN
Senior Unsecured(b)
04/23/14 | | | 8.800 | % | | | | | | | 700,000 | | | | 721,875 | | |
Total | | | | | | | | | 44,853,701 | | |
Italy 0.1% | |
Italy Buoni Poliennali Del Tesoro
09/01/22 | | | 5.500 | % | | EUR | | | | | 1,000,000 | | | | 1,523,259 | | |
The accompanying Notes to Financial Statements are an integral part of this statement.
Annual Report 2013
20
Columbia Strategic Income Fund
Portfolio of Investments (continued)
October 31, 2013
Foreign Government Obligations(a)(r) (continued)
Issuer | | Coupon
Rate | | Principal
Amount ($) | | Value ($) | |
Kazakhstan 0.5% | |
KazMunayGas National Co. JSC(b)
Senior Unsecured
07/02/18 | | | 9.125 | % | | | | | | | 3,980,000 | | | | 4,875,898 | | |
05/05/20 | | | 7.000 | % | | | | | | | 400,000 | | | | 457,550 | | |
04/09/21 | | | 6.375 | % | | | | | | | 2,500,000 | | | | 2,782,413 | | |
04/30/23 | | | 4.400 | % | | | | | | | 4,287,000 | | | | 4,074,631 | | |
Total | | | | | | | | | 12,190,492 | | |
Latvia 0.1% | |
Republic of Latvia
Senior Unsecured(b)
06/16/21 | | | 5.250 | % | | | | | | | 1,250,000 | | | | 1,363,075 | | |
Lithuania 0.3% | |
Lithuania Government International Bond(b)
Senior Unsecured
09/14/17 | | | 5.125 | % | | | | | | | 2,150,000 | | | | 2,359,767 | | |
03/09/21 | | | 6.125 | % | | | | | | | 1,550,000 | | | | 1,779,388 | | |
02/01/22 | | | 6.625 | % | | | | | | | 2,550,000 | | | | 3,031,234 | | |
Total | | | | | | | | | 7,170,389 | | |
Mexico 2.3% | |
Mexican Bonos
12/17/15 | | | 8.000 | % | | MXN | | | | | 14,850,000 | | | | 1,230,472 | | |
06/16/16 | | | 6.250 | % | | MXN | | | | | 29,600,000 | | | | 2,379,927 | | |
12/15/16 | | | 7.250 | % | | MXN | | | | | 6,590,000 | | | | 545,773 | | |
12/14/17 | | | 7.750 | % | | MXN | | | | | 9,500,000 | | | | 805,731 | | |
12/13/18 | | | 8.500 | % | | MXN | | | | | 36,260,000 | | | | 3,195,671 | | |
06/11/20 | | | 8.000 | % | | MXN | | | | | 86,530,000 | | | | 7,561,504 | | |
06/10/21 | | | 6.500 | % | | MXN | | | | | 46,850,000 | | | | 3,761,042 | | |
06/09/22 | | | 6.500 | % | | MXN | | | | | 102,300,000 | | | | 8,146,277 | | |
06/03/27 | | | 7.500 | % | | MXN | | | | | 44,450,000 | | | | 3,720,380 | | |
Mexico Government International Bond
Senior Unsecured
01/11/40 | | | 6.050 | % | | | | | | | 2,350,000 | | | | 2,661,375 | | |
Pemex Finance Ltd.
Senior Unsecured
11/15/18 | | | 9.150 | % | | | | | | | 2,485,000 | | | | 2,961,057 | | |
Senior Unsecured (NPFGC)
08/15/17 | | | 10.610 | % | | | | | | | 1,650,000 | | | | 1,912,998 | | |
Pemex Project Funding Master Trust
03/01/18 | | | 5.750 | % | | | | | | | 2,870,000 | | | | 3,200,050 | | |
01/21/21 | | | 5.500 | % | | | | | | | 3,750,000 | | | | 4,087,500 | | |
06/15/35 | | | 6.625 | % | | | | | | | 870,000 | | | | 943,950 | | |
06/15/38 | | | 6.625 | % | | | | | | | 450,000 | | | | 486,000 | | |
Petroleos Mexicanos
05/03/19 | | | 8.000 | % | | | | | | | 600,000 | | | | 733,200 | | |
11/24/21 | | | 7.650 | % | | MXN | | | | | 26,200,000 | | | | 2,122,663 | | |
06/02/41 | | | 6.500 | % | | | | | | | 2,500,000 | | | | 2,662,500 | | |
Total | | | | | | | | | 53,118,070 | | |
Foreign Government Obligations(a)(r) (continued)
Issuer | | Coupon
Rate | | Principal
Amount ($) | | Value ($) | |
Morocco 0.1% | |
Morocco Government International Bond
Senior Unsecured(b)
12/11/22 | | | 4.250 | % | | | | | | | 2,317,000 | | | | 2,196,049 | | |
Netherlands 0.2% | |
Netherlands Government Bond(b)
07/15/16 | | | 4.000 | % | | EUR | | | | | 3,735,000 | | | | 5,563,779 | | |
New Zealand 0.4% | |
New Zealand Government Bond
Senior Unsecured
03/15/19 | | | 5.000 | % | | NZD | | | | | 5,000,000 | | | | 4,306,391 | | |
05/15/21 | | | 6.000 | % | | NZD | | | | | 6,100,000 | | | | 5,552,788 | | |
Total | | | | | | | | | 9,859,179 | | |
Norway 0.6% | |
Norway Government Bond
05/24/23 | | | 2.000 | % | | NOK | | | | | 81,000,000 | | | | 12,686,673 | | |
Panama 0.1% | |
Ena Norte Trust
Pass-Through Certificates(b)
04/25/23 | | | 4.950 | % | | | | | | | 1,236,346 | | | | 1,224,334 | | |
Peru 0.5% | |
Corporacion Financiera de Desarrollo SA
Senior Unsecured(b)
02/08/22 | | | 4.750 | % | | | | | | | 2,900,000 | | | | 2,934,472 | | |
Peru Enhanced Pass-Through Finance Ltd.
Pass-Through Certificates(b)(l)
05/31/18 | | | 0.000 | % | | | | | | | 1,859,602 | | | | 1,723,760 | | |
Peruvian Government International Bond
Senior Unsecured
11/21/33 | | | 8.750 | % | | | | | | | 4,508,000 | | | | 6,572,664 | | |
Peruvian Government International Bond(b)
Senior Unsecured
08/12/20 | | | 7.840 | % | | PEN | | | | | 3,100,000 | | | | 1,300,569 | | |
Total | | | | | | | | | 12,531,465 | | |
Philippines 0.3% | |
Philippine Government International Bond
Senior Unsecured
01/15/19 | | | 9.875 | % | | | | | | | 70,000 | | | | 94,063 | | |
03/30/26 | | | 5.500 | % | | | | | | | 3,825,000 | | | | 4,379,625 | | |
01/14/31 | | | 7.750 | % | | | | | | | 200,000 | | | | 269,000 | | |
Power Sector Assets & Liabilities Management Corp.
Government Guaranteed(b)
12/02/24 | | | 7.390 | % | | | | | | | 1,390,000 | | | | 1,738,021 | | |
Total | | | | | | | | | 6,480,709 | | |
The accompanying Notes to Financial Statements are an integral part of this statement.
Annual Report 2013
21
Columbia Strategic Income Fund
Portfolio of Investments (continued)
October 31, 2013
Foreign Government Obligations(a)(r) (continued)
Issuer | | Coupon
Rate | | Principal
Amount ($) | | Value ($) | |
Poland 0.6% | |
Poland Government Bond
10/25/19 | | | 5.500 | % | | PLN | | | | | 23,100,000 | | | | 8,210,742 | | |
Poland Government International Bond
Senior Unsecured
07/15/19 | | | 6.375 | % | | | | | | | 1,470,000 | | | | 1,733,130 | | |
04/21/21 | | | 5.125 | % | | | | | | | 1,000,000 | | | | 1,102,500 | | |
03/23/22 | | | 5.000 | % | | | | | | | 2,950,000 | | | | 3,226,562 | | |
Total | | | | | | | | | 14,272,934 | | |
Qatar 0.2% | |
Nakilat, Inc.
Senior Secured(b)
12/31/33 | | | 6.067 | % | | | | | | | 3,260,000 | | | | 3,504,500 | | |
Republic of Namibia 0.2% | |
Namibia International Bonds
Senior Unsecured(b)
11/03/21 | | | 5.500 | % | | | | | | | 4,100,000 | | | | 4,315,250 | | |
Republic of the Congo —% | |
Republic of Congo
Senior Unsecured(c)
06/30/29 | | | 3.500 | % | | | | | | | 465,500 | | | | 400,330 | | |
Romania 0.5% | |
Romanian Government International Bond(b)
Senior Unsecured
02/07/22 | | | 6.750 | % | | | | | | | 4,800,000 | | | | 5,558,027 | | |
08/22/23 | | | 4.375 | % | | | | | | | 5,312,000 | | | | 5,193,935 | | |
Total | | | | | | | | | 10,751,962 | | |
Russian Federation 2.6% | |
Gazprom Neft OAO Via GPN Capital SA
Senior Unsecured(b)
09/19/22 | | | 4.375 | % | | | | | | | 4,800,000 | | | | 4,507,054 | | |
Gazprom OAO Via Gaz Capital SA(b)
Senior Unsecured
11/22/16 | | | 6.212 | % | | | | | | | 400,000 | | | | 439,560 | | |
04/11/18 | | | 8.146 | % | | | | | | | 4,535,000 | | | | 5,339,962 | | |
01/23/21 | | | 5.999 | % | | | | | | | 4,000,000 | | | | 4,270,000 | | |
03/07/22 | | | 6.510 | % | | | | | | | 4,535,000 | | | | 4,977,162 | | |
08/16/37 | | | 7.288 | % | | | | | | | 300,000 | | | | 333,000 | | |
Rosneft International Finance Ltd.
Senior Unsecured(b)
03/06/22 | | | 4.199 | % | | | | | | | 900,000 | | | | 843,750 | | |
Russian Agricultural Bank OJSC Via RSHB Capital SA
Senior Unsecured(b)
12/27/17 | | | 5.298 | % | | | | | | | 1,700,000 | | | | 1,764,242 | | |
Foreign Government Obligations(a)(r) (continued)
Issuer | | Coupon
Rate | | Principal
Amount ($) | | Value ($) | |
Russian Foreign Bond — Eurobond(b)(c)
Senior Unsecured
03/31/30 | | | 7.500 | % | | | | | | | 1,347,775 | | | | 1,603,920 | | |
Russian Foreign Bond — Eurobond(c)
Senior Unsecured
03/31/30 | | | 7.500 | % | | | | | | | 13,735,150 | | | | 16,345,515 | | |
Russian Railways via RZD Capital PLC
Senior Unsecured
04/02/19 | | | 8.300 | % | | RUB | | | | | 153,700,000 | | | | 4,845,247 | | |
Sberbank of Russia Via SB Capital SA
Senior Unsecured(b)
02/07/22 | | | 6.125 | % | | | | | | | 6,900,000 | | | | 7,480,626 | | |
VTB Bank OJSC Via VTB Capital SA
Senior Unsecured(b)
04/12/17 | | | 6.000 | % | | | | | | | 1,400,000 | | | | 1,491,000 | | |
Vnesheconombank Via VEB Finance PLC
Senior Unsecured(b)
11/22/25 | | | 6.800 | % | | | | | | | 5,810,000 | | | | 6,332,900 | | |
Total | | | | | | | | | 60,573,938 | | |
Slovenia 0.1% | |
Slovenia Government Bond(b)
05/10/23 | | | 5.850 | % | | | | | | | 3,400,000 | | | | 3,315,852 | | |
South Africa 0.1% | |
South Africa Government International Bond
Senior Unsecured
01/17/24 | | | 4.665 | % | | | | | | | 1,800,000 | | | | 1,777,500 | | |
Transnet SOC Ltd.
Senior Unsecured(b)
07/26/22 | | | 4.000 | % | | | | | | | 1,100,000 | | | | 980,002 | | |
Total | | | | | | | | | 2,757,502 | | |
South Korea 0.2% | |
Export-Import Bank of Korea
Senior Unsecured
04/11/22 | | | 5.000 | % | | | | | | | 3,900,000 | | | | 4,350,072 | | |
Export-Import Bank of Korea(b)
02/15/15 | | | 5.000 | % | | IDR | | | | | 8,000,000,000 | | | | 671,443 | | |
Total | | | | | | | | | 5,021,515 | | |
Supra-National 0.2% | |
Eurasian Development Bank
Senior Unsecured
10/05/17 | | | 8.000 | % | | RUB | | | | | 176,500,000 | | | | 5,460,475 | | |
Trinidad and Tobago 0.3% | |
Petroleum Co. of Trinidad & Tobago Ltd.
Senior Unsecured(b)
08/14/19 | | | 9.750 | % | | | | | | | 5,033,000 | | | | 6,404,493 | | |
The accompanying Notes to Financial Statements are an integral part of this statement.
Annual Report 2013
22
Columbia Strategic Income Fund
Portfolio of Investments (continued)
October 31, 2013
Foreign Government Obligations(a)(r) (continued)
Issuer | | Coupon
Rate | | Principal
Amount ($) | | Value ($) | |
Turkey 1.2% | |
Export Credit Bank of Turkey
Senior Unsecured(b)
04/24/19 | | | 5.875 | % | | | | | | | 1,250,000 | | | | 1,308,111 | | |
Turkey Government International Bond
01/14/41 | | | 6.000 | % | | | | | | | 2,200,000 | | | | 2,211,000 | | |
Senior Unsecured
09/26/16 | | | 7.000 | % | | | | | | | 1,235,000 | | | | 1,376,037 | | |
06/05/20 | | | 7.000 | % | | | | | | | 850,000 | | | | 981,750 | | |
03/30/21 | | | 5.625 | % | | | | | | | 7,250,000 | | | | 7,739,375 | | |
09/26/22 | | | 6.250 | % | | | | | | | 550,000 | | | | 606,375 | | |
03/23/23 | | | 3.250 | % | | | | | | | 2,800,000 | | | | 2,471,000 | | |
02/05/25 | | | 7.375 | % | | | | | | | 8,680,000 | | | | 10,155,600 | | |
03/17/36 | | | 6.875 | % | | | | | | | 230,000 | | | | 254,150 | | |
05/30/40 | | | 6.750 | % | | | | | | | 1,500,000 | | | | 1,638,750 | | |
Total | | | | | | | | | 28,742,148 | | |
Ukraine —% | |
National JSC Naftogaz of Ukraine
Government Guaranteed
09/30/14 | | | 9.500 | % | | | | | | | 625,000 | | | | 590,625 | | |
United Arab Emirates 0.3% | |
Abu Dhabi National Energy Co.(b)
Senior Unsecured
12/13/21 | | | 5.875 | % | | | | | | | 1,300,000 | | | | 1,459,810 | | |
01/12/23 | | | 3.625 | % | | | | | | | 2,200,000 | | | | 2,068,000 | | |
Dolphin Energy Ltd.
Senior Secured(b)
12/15/21 | | | 5.500 | % | | | | | | | 3,050,000 | | | | 3,370,043 | | |
Total | | | | | | | | | 6,897,853 | | |
United Kingdom 0.4% | |
United Kingdom Gilt
09/07/21 | | | 3.750 | % | | GBP | | | | | 1,200,000 | | | | 2,134,747 | | |
03/07/25 | | | 5.000 | % | | GBP | | | | | 3,510,000 | | | | 6,870,297 | | |
Total | | | | | | | | | 9,005,044 | | |
Uruguay 0.2% | |
Uruguay Government International Bond
Senior Unsecured
03/21/36 | | | 7.625 | % | | | | | | | 725,000 | | | | 929,813 | | |
Senior Unsecured PIK
01/15/33 | | | 7.875 | % | | | | | | | 1,940,000 | | | | 2,538,490 | | |
Total | | | | | | | | | 3,468,303 | | |
Venezuela 1.9% | |
Petroleos de Venezuela SA
04/12/17 | | | 5.250 | % | | | | | | | 11,540,000 | | | | 9,260,850 | | |
11/02/17 | | | 8.500 | % | | | | | | | 7,012,800 | | | | 6,293,988 | | |
11/17/21 | | | 9.000 | % | | | | | | | 6,078,521 | | | | 4,984,387 | | |
Senior Unsecured
10/28/15 | | | 5.000 | % | | | | | | | 4,526,329 | | | | 3,926,590 | | |
10/28/16 | | | 5.125 | % | | | | | | | 1,799,000 | | | | 1,452,693 | | |
Foreign Government Obligations(a)(r) (continued)
Issuer | | Coupon
Rate | | Principal
Amount ($) | | Value ($) | |
Venezuela Government International Bond
Senior Unsecured
02/26/16 | | | 5.750 | % | | | | | | | 2,050,000 | | | | 1,824,500 | | |
08/23/22 | | | 12.750 | % | | | | | | | 3,006,000 | | | | 3,028,545 | | |
05/07/23 | | | 9.000 | % | | | | | | | 14,874,000 | | | | 12,085,125 | | |
Total | | | | | | | | | 42,856,678 | | |
Total Foreign Government Obligations
(Cost: $514,600,013) | | | | | | | | | 528,862,951 | | |
Municipal Bonds 0.1%
Issue
Description | | Coupon
Rate | | Principal
Amount ($) | | Value ($) | |
California 0.1% | |
Cabazon Band Mission Indians
Revenue Bonds
Series 2004(b)(e)(h)(m)
10/01/11 | | | 13.000 | % | | | | | | | 2,820,000 | | | | 1,296,833 | | |
Total Municipal Bonds
(Cost: $2,820,000) | | | | | | | | | 1,296,833 | | |
Senior Loans 6.9%
Borrower | | Weighted
Average
Coupon | | Principal
Amount ($) | | Value ($) | |
Aerospace & Defense 0.1% | |
Doncasters U.S. Finance LLC
Tranche B Term Loan(c)(n)
04/09/20 | | | 5.500 | % | | | | | | | 1,019,875 | | | | 1,027,524 | | |
TransDigm, Inc.
Tranche C Term Loan(c)(n)
02/28/20 | | | 3.750 | % | | | | | | | 742,503 | | | | 742,659 | | |
Total | | | | | | | | | 1,770,183 | | |
Airlines 0.1% | |
Continental Airlines, Inc.
Tranche B Term Loan(c)(n)
04/01/19 | | | 4.000 | % | | | | | | | 1,815,875 | | | | 1,824,500 | | |
Automotive 0.2% | |
Chrysler Group LLC
Tranche B Term Loan(c)(n)
05/24/17 | | | 4.250 | % | | | | | | | 809,392 | | | | 816,272 | | |
Federal-Mogul Corp.(c)(n)
Tranche B Term Loan
12/29/14 | | | 2.127 | % | | | | | | | 365,814 | | | | 362,090 | | |
Tranche C Term Loan
12/28/15 | | | 2.127 | % | | | | | | | 215,851 | | | | 213,654 | | |
The accompanying Notes to Financial Statements are an integral part of this statement.
Annual Report 2013
23
Columbia Strategic Income Fund
Portfolio of Investments (continued)
October 31, 2013
Senior Loans (continued)
Borrower | | Weighted
Average
Coupon | | Principal
Amount ($) | | Value ($) | |
Goodyear Tire & Rubber Co. (The)
2nd Lien Term Loan(c)(n)
04/30/19 | | | 4.750 | % | | | | | | | 625,000 | | | | 631,769 | | |
Ina Beteiligungsgesellschaft Mit Beschrankter Haftung
Tranche C Term Loan(c)(n)
01/27/17 | | | 4.250 | % | | | | | | | 675,000 | | | | 677,808 | | |
Navistar, Inc.
Tranche B Term Loan(c)(n)
08/17/17 | | | 5.750 | % | | | | | | | 348,750 | | | | 355,289 | | |
ThermaSys Corp.
Term Loan(c)(n)
05/03/19 | | | 5.250 | % | | | | | | | 894,375 | | | | 888,785 | | |
Total | | | | | | | | | 3,945,667 | | |
Brokerage 0.1% | |
Nuveen Investments, Inc.(c)(n)
1st Lien Tranche B Term Loan
05/13/17 | | | 4.182 | % | | | | | | | 1,375,000 | | | | 1,366,406 | | |
Tranche B 2nd Lien Term Loan
02/28/19 | | | 6.500 | % | | | | | | | 425,000 | | | | 416,500 | | |
Total | | | | | | | | | 1,782,906 | | |
Building Materials 0.1% | |
Contech Engineered Solutions LLC
Term Loan(c)(n)
04/29/19 | | | 6.250 | % | | | | | | | 374,062 | | | | 375,701 | | |
Roofing Supply Group LLC
Term Loan(c)(n)
05/31/19 | | | 5.000 | % | | | | | | | 592,020 | | | | 594,980 | | |
Wilsonart LLC
Term Loan(c)(n)
10/31/19 | | | 4.000 | % | | | | | | | 570,688 | | | | 564,387 | | |
Total | | | | | | | | | 1,535,068 | | |
Chemicals 0.6% | |
AZ Chem U.S., Inc.
Term Loan(c)(n)
12/22/17 | | | 5.250 | % | | | | | | | 258,618 | | | | 260,622 | | |
Allnex & Cy SCA
Tranche B1 Term Loan(c)(n)
10/04/19 | | | 4.500 | % | | | | | | | 344,792 | | | | 346,302 | | |
Allnex U.S.A, Inc.
Tranche B2 Term Loan(c)(n)
10/04/19 | | | 4.500 | % | | | | | | | 178,896 | | | | 179,679 | | |
Allnex U.S.A., Inc.
2nd Lien Term Loan(c)(n)
04/03/20 | | | 8.250 | % | | | | | | | 250,000 | | | | 256,875 | | |
Senior Loans (continued)
Borrower | | Weighted
Average
Coupon | | Principal
Amount ($) | | Value ($) | |
Ascend Performance Materials Operations LLC
Tranche B Term Loan(c)(n)
04/10/18 | | | 6.750 | % | | | | | | | 791,960 | | | | 750,382 | | |
Axalta Coating Systems Dutch Holding BBV/U.S. Holdings, Inc.
Tranche B Term Loan(c)(n)
02/01/20 | | | 4.750 | % | | | | | | | 2,014,875 | | | | 2,034,822 | | |
HII Holding Corp.
2nd Lien Term Loan(c)(n)
12/21/20 | | | 9.500 | % | | | | | | | 1,350,000 | | | | 1,350,000 | | |
INEOS U.S. Finance LLC
Term Loan(c)(n)
05/04/18 | | | 4.000 | % | | | | | | | 1,711,962 | | | | 1,716,892 | | |
MacDermid, Inc.
1st Lien Tranche B Term Loan(c)(n)
06/07/20 | | | 4.000 | % | | | | | | | 174,563 | | | | 175,109 | | |
Nexeo Solutions LLC
Term Loan(c)(n)
09/08/17 | | | 5.000 | % | | | | | | | 916,189 | | | | 903,024 | | |
Omnova Solutions, Inc.
Tranche B1 Term Loan(c)(n)
05/31/18 | | | 4.250 | % | | | | | | | 633,709 | | | | 636,485 | | |
Oxea Finance & Cy S.C.A
1st Lien Tranche B2 Term Loan(c)(n)
01/15/20 | | | 4.250 | % | | | | | | | 150,000 | | | | 150,187 | | |
Oxea Finance & Cy SCA
2nd Lien Term Loan(c)(n)
07/15/20 | | | 8.250 | % | | | | | | | 425,000 | | | | 430,049 | | |
PQ Corp.
Term Loan(c)(n)
08/07/17 | | | 4.500 | % | | | | | | | 1,463,937 | | | | 1,474,302 | | |
Tronox Pigments BV
Term Loan(c)(n)
03/19/20 | | | 4.500 | % | | | | | | | 433,449 | | | | 437,047 | | |
Univar, Inc.
Tranche B Term Loan(c)(n)
06/30/17 | | | 5.000 | % | | | | | | | 1,963,412 | | | | 1,930,290 | | |
Total | | | | | | | | | 13,032,067 | | |
Construction Machinery —% | |
Douglas Dynamics LLC
Term Loan(c)(n)
04/18/18 | | | 5.750 | % | | | | | | | 649,890 | | | | 649,890 | | |
Manitowoc Co., Inc. (The)
Tranche B Term Loan(c)(n)
11/13/17 | | | 4.250 | % | | | | | | | 107,928 | | | | 107,793 | | |
Total | | | | | | | | | 757,683 | | |
The accompanying Notes to Financial Statements are an integral part of this statement.
Annual Report 2013
24
Columbia Strategic Income Fund
Portfolio of Investments (continued)
October 31, 2013
Senior Loans (continued)
Borrower | | Weighted
Average
Coupon | | Principal
Amount ($) | | Value ($) | |
Consumer Cyclical Services 0.2% | |
Acosta, Inc.
Tranche B Term Loan(c)(n)
03/02/18 | | | 5.000 | % | | | | | | | 610,043 | | | | 611,758 | | |
IG Investments Holdings LLC
1st Lien Tranche B Term Loan(c)(n)
10/31/19 | | | 6.000 | % | | | | | | | 545,875 | | | | 545,875 | | |
Monitronics International, Inc.
Tranche B Term Loan(c)(n)
03/23/18 | | | 4.250 | % | | | | | | | 992,484 | | | | 999,511 | | |
Pre-Paid Legal Services, Inc.
Term Loan(c)(n)
07/01/19 | | | 6.250 | % | | | | | | | 413,710 | | | | 412,030 | | |
Sabre, Inc.(c)(n)
Tranche B Term Loan
02/19/19 | | | 4.500 | % | | | | | | | 100,000 | | | | 100,000 | | |
Tranche B Term Loan
02/19/19 | | | 5.250 | % | | | | | | | 631,720 | | | | 635,036 | | |
Tranche C Term Loan
02/19/18 | | | 4.000 | % | | | | | | | 266,250 | | | | 266,583 | | |
Weight Watchers International, Inc.
Tranche B2 Term Loan(c)(n)
04/02/20 | | | 3.750 | % | | | | | | | 1,393,000 | | | | 1,278,955 | | |
Total | | | | | | | | | 4,849,748 | | |
Consumer Products 0.1% | |
Affinion Group, Inc.
Tranche B Term Loan(c)(n)
10/09/16 | | | 6.500 | % | | | | | | | 1,671,176 | | | | 1,651,255 | | |
Fender Musical Instruments Corp.
Term Loan(c)(n)
04/03/19 | | | 5.750 | % | | | | | | | 408,000 | | | | 408,339 | | |
Total | | | | | | | | | 2,059,594 | | |
Diversified Manufacturing 0.3% | |
Accudyne Industries LLC
Term Loan(c)(n)
12/13/19 | | | 4.000 | % | | | | | | | 1,439,125 | | | | 1,437,585 | | |
Air Distribution Technologies, Inc.(c)(n)
1st Lien Term Loan
11/09/18 | | | 5.000 | % | | | | | | | 940,257 | | | | 940,548 | | |
2nd Lien Term Loan
05/11/20 | | | 9.250 | % | | | | | | | 850,000 | | | | 861,687 | | |
Allflex Holdings IiII, Inc.
1st Lien Term Loan(c)(n)
07/17/20 | | | 4.250 | % | | | | | | | 1,050,000 | | | | 1,055,691 | | |
Apex Tool Group LLC
Term Loan(c)(n)
01/31/20 | | | 4.500 | % | | | | | | | 1,393,000 | | | | 1,398,725 | | |
Senior Loans (continued)
Borrower | | Weighted
Average
Coupon | | Principal
Amount ($) | | Value ($) | |
IMG Worldwide, Inc.
Tranche B Term Loan(c)(n)
06/16/16 | | | 5.500 | % | | | | | | | 733,125 | | | | 733,125 | | |
Ranpak Corp.
2nd Lien Term Loan(c)(n)
04/23/20 | | | 8.500 | % | | | | | | | 225,000 | | | | 230,063 | | |
Total | | | | | | | | | 6,657,424 | | |
Electric 0.4% | |
Calpine Construction Finance Co. LP
Tranche B-1 Term Loan(c)(n)
05/03/20 | | | 3.000 | % | | | | | | | 548,625 | | | | 541,180 | | |
Calpine Corp.(c)(n)
Term Loan
04/01/18 | | | 4.000 | % | | | | | | | 634,911 | | | | 637,450 | | |
04/01/18 | | | 4.000 | % | | | | | | | 244,375 | | | | 245,353 | | |
Equipower Resources Holdings LLC(c)(n)
1st Lien Tranche B Term Loan
12/21/18 | | | 4.250 | % | | | | | | | 293,930 | | | | 295,217 | | |
1st Lien Tranche C Term Loan
12/31/19 | | | 4.250 | % | | | | | | | 822,937 | | | | 826,542 | | |
Essential Power LLC
Term Loan(c)(n)
08/08/19 | | | 4.250 | % | | | | | | | 453,466 | | | | 451,199 | | |
FREIF North American Power I LLC(c)(n)
Tranche B-1 Term Loan
03/29/19 | | | 4.750 | % | | | | | | | 857,118 | | | | 864,618 | | |
Tranche C-1 Term Loan
03/29/19 | | | 4.750 | % | | | | | | | 134,613 | | | | 135,791 | | |
LSP Madison Funding LLC
Term Loan(c)(n)
06/28/19 | | | 5.500 | % | | | | | | | 118,667 | | | | 119,445 | | |
NRG Energy, Inc.
Term Loan(c)(n)
07/01/18 | | | 2.750 | % | | | | | | | 635,432 | | | | 634,847 | | |
Star West Generation LLC
Tranche B Term Loan(c)(n)
03/13/20 | | | 4.250 | % | | | | | | | 1,044,750 | | | | 1,052,586 | | |
TPF Generation Holdings LLC
Term Loan(c)(n)
12/31/17 | | | 4.750 | % | | | | | | | 900,000 | | | | 905,067 | | |
Texas Competitive Electric Holdings Co. LLC
Term Loan(c)(n)
10/10/14 | | | 3.712 | % | | | | | | | 1,345,944 | | | | 905,430 | | |
Topaz Power Holdings LLC
Tranche B Term Loan(c)(n)
02/26/20 | | | 5.250 | % | | | | | | | 645,125 | | | | 646,467 | | |
Windsor Financing LLC
Tranche B Term Loan(c)(n)
12/05/17 | | | 6.250 | % | | | | | | | 333,182 | | | | 340,262 | | |
Total | | | | | | | | | 8,601,454 | | |
The accompanying Notes to Financial Statements are an integral part of this statement.
Annual Report 2013
25
Columbia Strategic Income Fund
Portfolio of Investments (continued)
October 31, 2013
Senior Loans (continued)
Borrower | | Weighted
Average
Coupon | | Principal
Amount ($) | | Value ($) | |
Entertainment 0.2% | |
24 Hour Fitness Worldwide, Inc.
Tranche B Term Loan(c)(n)
04/22/16 | | | 5.250 | % | | | | | | | 1,000,000 | | | | 1,007,140 | | |
Alpha Topco Ltd.
Tranche B Term Loan(c)(n)
04/30/19 | | | 4.500 | % | | | | | | | 985,075 | | | | 994,926 | | |
Cinemark USA, Inc.
Term Loan(c)(n)
12/18/19 | | | 3.190 | % | | | | | | | 843,625 | | | | 847,666 | | |
Merlin Entertainment Group Lux 2 Sarl
Term Loan(c)(n)
06/28/19 | | | 4.000 | % | | | | | | | 374,063 | | | | 374,623 | | |
Six Flags Theme Parks, Inc.
Tranche B Term Loan(c)(n)
12/20/18 | | | 4.001 | % | | | | | | | 184,768 | | | | 185,785 | | |
Zuffa LLC
Term Loan(c)(n)
02/25/20 | | | 4.500 | % | | | | | | | 1,761,687 | | | | 1,764,999 | | |
Total | | | | | | | | | 5,175,139 | | |
Environmental 0.1% | |
ADS Waste Holdings, Inc.
Tranche B Term Loan(c)(n)
10/09/19 | | | 4.250 | % | | | | | | | 942,875 | | | | 947,759 | | |
EnviroSolutions Real Property Holdings, Inc.
2nd Lien Term Loan(c)(n)
07/29/14 | | | 8.000 | % | | | | | | | 1,332,530 | | | | 1,329,199 | | |
Waste Industries U.S.A., Inc.
Tranche B Term Loan(c)(n)
03/17/17 | | | 4.000 | % | | | | | | | 645,125 | | | | 645,931 | | |
Total | | | | | | | | | 2,922,889 | | |
Food and Beverage 0.4% | |
AdvancePierre Foods, Inc.
1st Lien Term Loan(c)(n)
07/10/17 | | | 5.750 | % | | | | | | | 1,985,000 | | | | 1,998,657 | | |
Aramark Corp.(c)(n)
Tranche C Term Loan
07/26/16 | | | 3.776 | % | | | | | | | 1,250,000 | | | | 1,253,737 | | |
Tranche D Term Loan
09/09/19 | | | 4.000 | % | | | | | | | 500,000 | | | | 501,095 | | |
Arysta LifeScience SPC LLC(c)(n)
1st Lien Term Loan
05/29/20 | | | 4.500 | % | | | | | | | 174,563 | | | | 175,109 | | |
2nd Lien Term Loan
11/30/20 | | | 8.250 | % | | | | | | | 425,000 | | | | 426,772 | | |
CSM Bakery Supplies LLC
Term Loan(c)(n)
07/03/20 | | | 4.750 | % | | | | | | | 997,500 | | | | 998,328 | | |
Senior Loans (continued)
Borrower | | Weighted
Average
Coupon | | Principal
Amount ($) | | Value ($) | |
Del Monte Foods Co.
Term Loan(c)(n)
03/08/18 | | | 4.000 | % | | | | | | | 2,028,810 | | | | 2,028,810 | | |
Performance Food Group, Inc.
Term Loan(c)(n)
11/14/19 | | | 6.250 | % | | | | | | | 1,122,187 | | | | 1,118,451 | | |
Total | | | | | | | | | 8,500,959 | | |
Gaming 0.3% | |
Affinity Gaming LLC
Term Loan(c)(n)
11/09/17 | | | 5.500 | % | | | | | | | 215,699 | | | | 218,216 | | |
Caesars Entertainment Operating Co., Inc.(c)(n)
Tranche B4 Term Loan
10/31/16 | | | 9.500 | % | | | | | | | 769,008 | | | | 767,724 | | |
Tranche B6 Term Loan
01/28/18 | | | 5.434 | % | | | | | | | 558,872 | | | | 523,780 | | |
Cannery Casino Resorts LLC(c)(n)
1st Lien Term Loan
10/02/18 | | | 6.000 | % | | | | | | | 267,975 | | | | 267,723 | | |
2nd Lien Term Loan
10/02/19 | | | 10.000 | % | | | | | | | 250,000 | | | | 231,875 | | |
Golden Nugget, Inc.
2nd Lien Term Loan(c)(n)
11/03/14 | | | 3.440 | % | | | | | | | 50,000 | | | | 49,375 | | |
Peppermill Casinos, Inc.
Tranche B Term Loan(c)(n)
11/09/18 | | | 7.250 | % | | | | | | | 1,017,312 | | | | 1,033,844 | | |
ROC Finance LLC
Tranche B Term Loan(c)(n)
06/20/19 | | | 5.000 | % | | | | | | | 1,050,000 | | | | 1,026,375 | | |
Scientific Games International, Inc.
Term Loan(c)(n)
10/18/20 | | | 4.250 | % | | | | | | | 925,000 | | | | 925,000 | | |
Stockbridge/SBE Holdings
Tranche B Term Loan(c)(n)
05/02/17 | | | 13.000 | % | | | | | | | 250,000 | | | | 272,500 | | |
Twin River Management Group, Inc.
Term Loan(c)(n)
11/10/18 | | | 5.250 | % | | | | | | | 572,125 | | | | 577,274 | | |
Total | | | | | | | | | 5,893,686 | | |
Gas Pipelines —% | |
Philadelphia Energy Solutions Refining and Marketing LLC
Term Loan(c)(n)
04/04/18 | | | 6.250 | % | | | | | | | 621,875 | | | | 556,578 | | |
Health Care 0.4% | |
Alere, Inc.
Tranche B Term Loan(c)(n)
06/30/17 | | | 4.250 | % | | | | | | | 1,309,636 | | | | 1,317,821 | | |
The accompanying Notes to Financial Statements are an integral part of this statement.
Annual Report 2013
26
Columbia Strategic Income Fund
Portfolio of Investments (continued)
October 31, 2013
Senior Loans (continued)
Borrower | | Weighted
Average
Coupon | | Principal
Amount ($) | | Value ($) | |
Alliance HealthCare Services, Inc.
Term Loan(c)(n)
06/03/19 | | | 4.250 | % | | | | | | | 548,625 | | | | 543,139 | | |
Apria Healthcare Group, Inc.
Term Loan(c)(n)
04/06/20 | | | 6.750 | % | | | | | | | 473,813 | | | | 479,925 | | |
CHS/Community Health Systems, Inc.
Term Loan(c)(n)
01/25/17 | | | 3.761 | % | | | | | | | 2,224,790 | | | | 2,230,352 | | |
DaVita HealthCare Partners, Inc.
Tranche B Term Loan(c)(n)
10/20/16 | | | 4.500 | % | | | | | | | 656,437 | | | | 659,720 | | |
HCA, Inc.
Tranche B-5 Term Loan(c)(n)
03/31/17 | | | 3.026 | % | | | | | | | 725,000 | | | | 725,906 | | |
IASIS Healthcare LLC
Tranche B2 Term Loan(c)(n)
05/03/18 | | | 4.500 | % | | | | | | | 839,240 | | | �� | 844,485 | | |
Onex Carestream Finance LP
1st Lien Term Loan(c)(n)
06/07/19 | | | 5.000 | % | | | | | | | 642,495 | | | | 649,241 | | |
Quintiles Transnational Corp.
Tranche B2 Term Loan(c)(n)
06/08/18 | | | 4.000 | % | | | | | | | 945,236 | | | | 948,780 | | |
inVentiv Health, Inc.
Term Loan(c)(n)
08/04/16 | | | 7.500 | % | | | | | | | 292,210 | | | | 287,535 | | |
Total | | | | | | | | | 8,686,904 | | |
Independent Energy 0.1% | |
Samson Investment Co.
2nd Lien Term Loan(c)(n)
09/25/18 | | | 6.000 | % | | | | | | | 1,425,000 | | | | 1,435,246 | | |
Lodging —% | |
Seven Seas Cruises
Tranche B1 Term Loan(c)(n)
12/21/18 | | | 4.750 | % | | | | | | | 500,000 | | | | 504,375 | | |
Media Cable 0.2% | |
Encompass Digital Media, Inc.
Tranche B1 Term Loan(c)(n)
08/10/17 | | | 6.750 | % | | | | | | | 985,056 | | | | 986,908 | | |
MCC Iowa LLC
Tranche G Term Loan(c)(n)
01/20/20 | | | 4.000 | % | | | | | | | 1,064,250 | | | | 1,064,921 | | |
Mediacom Illinois LLC
Tranche E Term Loan(c)(n)
10/23/17 | | | 4.500 | % | | | | | | | 899,435 | | | | 900,181 | | |
Senior Loans (continued)
Borrower | | Weighted
Average
Coupon | | Principal
Amount ($) | | Value ($) | |
Revolution Studios Distribution Co. LLC
Tranche B Term Loan(c)(e)(n)
12/21/14 | | | 3.940 | % | | | | | | | 192,985 | | | | 169,184 | | |
TWCC Holding Corp.
2nd Lien Term Loan(c)(n)
06/26/20 | | | 7.000 | % | | | | | | | 625,000 | | | | 640,238 | | |
Total | | | | | | | | | 3,761,432 | | |
Media Non-Cable 0.5% | |
Cengage Learning Acquisitions, Inc.
Term Loan(c)(n)
07/03/14 | | | 4.750 | % | | | | | | | 530,440 | | | | 388,219 | | |
Clear Channel Communications, Inc.(c)(n)
Tranche B Term Loan
01/29/16 | | | 3.832 | % | | | | | | | 382,567 | | | | 370,818 | | |
Tranche D Term Loan
01/30/19 | | | 6.932 | % | | | | | | | 1,128,407 | | | | 1,072,133 | | |
Cumulus Media Holdings, Inc.(c)(n)
1st Lien Term Loan
09/17/18 | | | 4.500 | % | | | | | | | 1,019,439 | | | | 1,025,301 | | |
2nd Lien Term Loan
09/16/19 | | | 7.500 | % | | | | | | | 702,109 | | | | 717,029 | | |
FoxCo Acquisition Sub LLC
Term Loan(c)(n)
07/14/17 | | | 5.500 | % | | | | | | | 714,440 | | | | 715,633 | | |
Getty Images, Inc.
Term Loan(c)(n)
10/18/19 | | | 4.750 | % | | | | | | | 1,985,000 | | | | 1,742,671 | | |
Granite Broadcasting
1st Lien Tranche B Term Loan(c)(n)
05/23/18 | | | 6.750 | % | | | | | | | 630,193 | | | | 631,769 | | |
Radio One, Inc.
Term Loan(c)(n)
03/31/16 | | | 7.500 | % | | | | | | | 727,423 | | | | 743,339 | | |
RentPath, Inc.
Tranche B Term Loan(c)(n)
05/29/20 | | | 6.250 | % | | | | | | | 1,047,375 | | | | 1,027,297 | | |
Salem Communications Corp.
Term Loan(c)(n)
03/13/20 | | | 4.500 | % | | | | | | | 1,143,667 | | | | 1,147,006 | | |
Tribune Co.
Tranche B Term Loan(c)(n)
12/31/19 | | | 4.000 | % | | | | | | | 620,313 | | | | 619,928 | | |
Univision Communications, Inc.
Term Loan(c)(n)
03/01/20 | | | 4.000 | % | | | | | | | 1,094,500 | | | | 1,094,675 | | |
Van Wagner Communications LLC
Term Loan(c)(n)
08/03/18 | | | 6.250 | % | | | | | | | 394,020 | | | | 399,765 | | |
Total | | | | | | | | | 11,695,583 | | |
The accompanying Notes to Financial Statements are an integral part of this statement.
Annual Report 2013
27
Columbia Strategic Income Fund
Portfolio of Investments (continued)
October 31, 2013
Senior Loans (continued)
Borrower | | Weighted
Average
Coupon | | Principal
Amount ($) | | Value ($) | |
Metals 0.1% | |
Essar Steel Algoma, Inc.
Term Loan(c)(n)
09/19/14 | | | 8.750 | % | | | | | | | 321,750 | | | | 325,450 | | |
FMG Resources August 2006 Proprietary Ltd.
Term Loan(c)(n)
10/18/17 | | | 5.250 | % | | | | | | | 2,068,152 | | | | 2,071,131 | | |
Noranda Aluminum Acquisition Corp.
Tranche B Term Loan(c)(n)
02/28/19 | | | 5.750 | % | | | | | | | 298,485 | | | | 275,725 | | |
Total | | | | | | | | | 2,672,306 | | |
Non-Captive Consumer —% | |
Springleaf Financial Funding Co.
Term Loan(c)(n)
05/10/17 | | | 4.750 | % | | | | | | | 575,000 | | | | 580,509 | | |
Non-Captive Diversified —% | |
iStar Financial, Inc.
Term Loan(c)(n)
10/15/17 | | | 4.500 | % | | | | | | | 628,557 | | | | 631,228 | | |
Oil Field Services —% | |
FTS International, Inc.
Term Loan(c)(n)
05/06/16 | | | 8.500 | % | | | | | | | 680,076 | | | | 673,132 | | |
Other Financial Institutions 0.1% | |
AlixPartners LLP
1st Lien Tranche B2 Term Loan(c)(n)
07/10/20 | | | 5.000 | % | | | | | | | 1,712,888 | | | | 1,721,453 | | |
Moneygram International, Inc.
Term Loan(c)(n)
03/27/20 | | | 4.250 | % | | | | | | | 870,625 | | | | 873,019 | | |
Total | | | | | | | | | 2,594,472 | | |
Other Industry 0.1% | |
ATI Acquisition Co.
Tranche B Term Loan(c)(d)(e)(h)(n)
12/30/14 | | | 0.000 | % | | | | | | | 102,433 | | | | — | | |
Harland Clarke Holdings Corp.
Tranche B3 Term Loan(c)(n)
05/22/18 | | | 7.000 | % | | | | | | | 447,188 | | | | 448,641 | | |
Sensus U.S.A., Inc.(c)(g)(n)
2nd Lien Term Loan
05/09/18 | | | 4.750 | % | | | | | | | 1,000,000 | | | | 996,250 | | |
Sensus U.S.A., Inc.(c)(n)
2nd Lien Term Loan
05/09/18 | | | 8.500 | % | | | | | | | 725,000 | | | | 716,394 | | |
Senior Loans (continued)
Borrower | | Weighted
Average
Coupon | | Principal
Amount ($) | | Value ($) | |
TPF II LC LLC
Term Loan(c)(n)
08/21/19 | | | 6.500 | % | | | | | | | 648,375 | | | | 656,480 | | |
WireCo WorldGroup, Inc.
Term Loan(c)(n)
02/15/17 | | | 6.000 | % | | | | | | | 569,250 | | | | 569,250 | | |
Total | | | | | | | | | 3,387,015 | | |
Packaging 0.2% | |
BWAY Holding Co.
Term Loan(c)(n)
08/06/17 | | | 4.500 | % | | | | | | | 1,563,187 | | | | 1,571,488 | | |
Consolidated Container Co. LLC
Term Loan(c)(n)
07/03/19 | | | 5.000 | % | | | | | | | 1,089,000 | | | | 1,094,902 | | |
Reynolds Group Holdings, Inc.
Term Loan(c)(n)
09/28/18 | | | 4.750 | % | | | | | | | 1,633,369 | | | | 1,646,126 | | |
Total | | | | | | | | | 4,312,516 | | |
Paper —% | |
Caraustar Industries, Inc.
Term Loan(c)(n)
05/01/19 | | | 7.500 | % | | | | | | | 884,925 | | | | 899,305 | | |
Pharmaceuticals 0.3% | |
Aptalis Pharma, Inc.
Tranche B Term Loan(c)(n)
10/07/20 | | | 6.000 | % | | | | | | | 575,000 | | | | 577,518 | | |
Grifols, Inc.
Tranche B Term Loan(c)(n)
06/01/17 | | | 4.250 | % | | | | | | | 610,479 | | | | 614,233 | | |
Par Pharmaceutical Companies, Inc.
Tranche B1 Term Loan(c)(n)
09/30/19 | | | 4.250 | % | | | | | | | 1,336,525 | | | | 1,340,268 | | |
Patheon, Inc.
Term Loan(c)(n)
12/14/18 | | | 7.250 | % | | | | | | | 1,313,549 | | | | 1,333,252 | | |
Pharmaceutical Product Development, Inc.
Term Loan(c)(n)
12/05/18 | | | 4.250 | % | | | | | | | 967,688 | | | | 975,748 | | |
RPI Finance Trust
Term Loan(c)(n)
05/09/18 | | | 3.500 | % | | | | | | | 878,786 | | | | 886,476 | | |
Valeant Pharmaceutical International, Inc.(c)(n)
Tranche C-2 Term Loan
12/11/19 | | | 3.750 | % | | | | | | | 715,938 | �� | | | 722,202 | | |
Tranche D-2 Term Loan
02/13/19 | | | 3.750 | % | | | | | | | 368,831 | | | | 371,712 | | |
Total | | | | | | | | | 6,821,409 | | |
The accompanying Notes to Financial Statements are an integral part of this statement.
Annual Report 2013
28
Columbia Strategic Income Fund
Portfolio of Investments (continued)
October 31, 2013
Senior Loans (continued)
Borrower | | Weighted
Average
Coupon | | Principal
Amount ($) | | Value ($) | |
Property & Casualty 0.2% | |
Alliant Holdings I, Inc.
Term Loan(c)(n)
12/20/19 | | | 5.000 | % | | | | | | | 1,513,562 | | | | 1,518,103 | | |
Asurion LLC
Tranche B1 Term Loan(c)(n)
05/24/19 | | | 4.500 | % | | | | | | | 1,166,187 | | | | 1,165,861 | | |
Hub International Ltd.
Term Loan(c)(n)
06/13/17 | | | 4.750 | % | | | | | | | 775,000 | | | | 780,952 | | |
USI, Inc.
Term Loan(c)(n)
12/27/19 | | | 5.000 | % | | | | | | | 818,813 | | | | 823,251 | | |
Total | | | | | | | | | 4,288,167 | | |
Retailers 0.6% | |
Academy Ltd.
Term Loan(c)(n)
08/03/18 | | | 4.500 | % | | | | | | | 1,772,867 | | | | 1,783,663 | | |
BJ's Wholesale Club, Inc.
1st Lien Term Loan(c)(n)
09/26/19 | | | 4.250 | % | | | | | | | 1,188,022 | | | | 1,188,177 | | |
Bass Pro Group LLC
Term Loan(c)(n)
11/20/19 | | | 4.000 | % | | | | | | | 560,393 | | | | 563,307 | | |
Blue Buffalo Co., Ltd.
Tranche B2 Term Loan(c)(n)
08/08/19 | | | 4.750 | % | | | | | | | 717,764 | | | | 724,941 | | |
David's Bridal, Inc.
Term Loan(c)(n)
10/11/19 | | | 5.000 | % | | | | | | | 1,265,437 | | | | 1,267,399 | | |
J. Crew Group, Inc.
Tranche B1 Term Loan(c)(n)
03/07/18 | | | 4.000 | % | | | | | | | 1,495,784 | | | | 1,501,767 | | |
Jo-Ann Stores, Inc.
Tranche B Term Loan(c)(n)
03/16/18 | | | 4.000 | % | | | | | | | 978,554 | | | | 979,171 | | |
Neiman Marcus Group, Inc. (The)
Term Loan(c)(n)
05/16/18 | | | 5.000 | % | | | | | | | 450,000 | | | | 452,871 | | |
Orchard Supply Hardware LLC
Tranche B1 Term Loan(c)(h)(n)
12/21/13 | | | 5.000 | % | | | | | | | 232,163 | | | | 188,052 | | |
Party City Holdings, Inc.
Term Loan(c)(n)
07/27/19 | | | 4.250 | % | | | | | | | 1,435,527 | | | | 1,439,116 | | |
PetCo Animal Supplies, Inc.
Term Loan(c)(n)
11/24/17 | | | 4.000 | % | | | | | | | 1,367,967 | | | | 1,375,094 | | |
Senior Loans (continued)
Borrower | | Weighted
Average
Coupon | | Principal
Amount ($) | | Value ($) | |
Pilot Travel Centers LLC
Tranche B Term Loan(c)(n)
08/07/19 | | | 4.250 | % | | | | | | | 1,110,938 | | | | 1,115,104 | | |
Rite Aid Corp.(c)(n)
Tranche 1 2nd Lien Term Loan
08/21/20 | | | 5.750 | % | | | | | | | 750,000 | | | | 767,145 | | |
Tranche 2 Term Loan
06/21/21 | | | 4.875 | % | | | | | | | 200,000 | | | | 201,438 | | |
Tranche 6 Term Loan
02/21/20 | | | 4.000 | % | | | | | | | 422,875 | | | | 424,858 | | |
Total | | | | | | | | | 13,972,103 | | |
Supermarkets —% | |
Albertson's LLC(c)(n)
Tranche B-1 Term Loan
03/21/16 | | | 4.250 | % | | | | | | | 155,739 | | | | 156,258 | | |
Tranche B-2 Term Loan
03/21/19 | | | 4.750 | % | | | | | | | 242,261 | | | | 242,861 | | |
Sprouts Farmers Markets Holdings LLC
Term Loan(c)(n)
04/23/20 | | | 4.000 | % | | | | | | | 575,759 | | | | 576,237 | | |
Total | | | | | | | | | 975,356 | | |
Technology 0.7% | |
Aeroflex, Inc.
Tranche B-1 Term Loan(c)(n)
11/09/19 | | | 4.500 | % | | | | | | | 2,333,871 | | | | 2,349,928 | | |
Alcatel-Lucent U.S.A., Inc.
Term Loan(c)(n)
01/30/19 | | | 5.750 | % | | | | | | | 1,488,750 | | | | 1,509,533 | | |
Blue Coat Systems, Inc.(c)(n)
2nd Lien Term Loan
06/28/20 | | | 9.500 | % | | | | | | | 2,008,000 | | | | 2,023,060 | | |
Term Loan
05/31/19 | | | 4.500 | % | | | | | | | 872,812 | | | | 874,995 | | |
Edwards Ltd.
1st Lien Term Loan(c)(n)
03/26/20 | | | 4.750 | % | | | | | | | 770,434 | | | | 770,819 | | |
First Data Corp.(c)(n)
Term Loan
03/24/17 4.184% 375,000 375,311
03/23/18 | | | 4.184 | % | | | | | | | 848,315 | | | | 848,621 | | |
Freescale Semiconductor, Inc.
Tranche B4 Term Loan(c)(n)
02/28/20 | | | 5.000 | % | | | | | | | 917,587 | | | | 925,441 | | |
Greeneden U.S. Holdings II LLC
Term Loan(c)(n)
02/10/20 | | | 4.000 | % | | | | | | | 312,714 | | | | 310,760 | | |
Infogroup, Inc.
Tranche B Term Loan(c)(n)
05/26/18 | | | 8.000 | % | | | | | | | 675,000 | | | | 563,625 | | |
The accompanying Notes to Financial Statements are an integral part of this statement.
Annual Report 2013
29
Columbia Strategic Income Fund
Portfolio of Investments (continued)
October 31, 2013
Senior Loans (continued)
Borrower | | Weighted
Average
Coupon | | Principal
Amount ($) | | Value ($) | |
RP Crown Parent LLC
1st Lien Term Loan(c)(n)
12/21/18 | | | 6.750 | % | | | | | | | 794,000 | | | | 801,344 | | |
Riverbed Technology, Inc.
Term Loan(c)(n)
12/18/19 | | | 4.000 | % | | | | | | | 433,683 | | | | 435,851 | | |
Syniverse Holdings, Inc.
Term Loan(c)(n)
04/23/19 | | | 5.000 | % | | | | | | | 767,861 | | | | 769,397 | | |
Triple Point Group Holdings, Inc.(c)(n)
1st Lien Term Loan
07/10/20 | | | 5.250 | % | | | | | | | 2,082,000 | | | | 1,983,105 | | |
2nd Lien Term Loan
07/10/21 | | | 9.250 | % | | | | | | | 1,997,000 | | | | 1,863,860 | | |
Verint Systems, Inc.
Term Loan(c)(n)
09/06/19 | | | 4.000 | % | | | | | | | 191,040 | | | | 191,613 | | |
Total | | | | | | | | | 16,597,263 | | |
Transportation Services —% | |
Commercial Barge Line Co.
1st Lien Term Loan(c)(n)
09/22/19 | | | 7.500 | % | | | | | | | 472,625 | | | | 465,536 | | |
Hertz Corp. (The)
Letter of Credit(c)(n)
03/11/18 | | | 3.750 | % | | | | | | | 500,000 | | | | 495,000 | | |
Total | | | | | | | | | 960,536 | | |
Wireless 0.1% | |
Cricket Communications, Inc.(c)(n)
Term Loan
10/10/19 | | | 4.750 | % | | | | | | | 173,688 | | | | 174,339 | | |
Tranche C Term Loan
03/08/20 | | | 4.750 | % | | | | | | | 548,625 | | | | 550,979 | | |
Instant Web, Inc.(c)(n)
Delayed Draw Term Loan
08/07/14 | | | 3.558 | % | | | | | | | 25,223 | | | | 23,079 | | |
Term Loan
08/07/14 | | | 3.558 | % | | | | | | | 241,961 | | | | 221,395 | | |
Telesat Canada
Tranche B2 Term Loan(c)(n)
03/28/19 | | | 3.500 | % | | | | | | | 567,834 | | | | 570,321 | | |
Total | | | | | | | | | 1,540,113 | | |
Wirelines 0.1% | |
Alaska Communications Systems Holdings, Inc.
Term Loan(c)(n)
10/21/16 | | | 6.250 | % | | | | | | | 715,436 | | | | 708,060 | | |
Integra Telecom Holdings, Inc.
Tranche B Term Loan(c)(n)
02/22/19 | | | 5.250 | % | | | | | | | 646,750 | | | | 653,754 | | |
Senior Loans (continued)
Borrower | | Weighted
Average
Coupon | | Principal
Amount ($) | | Value ($) | |
Windstream Corp.
Tranche B3 Term Loan(c)(n)
08/08/19 | | | 4.000 | % | | | | | | | 617,188 | | | | 618,730 | | |
Zayo Group LLC
Term Loan(c)(n)
07/02/19 | | | 4.500 | % | | | | | | | 818,781 | | | | 822,368 | | |
Total | | | | | | | | | 2,802,912 | | |
Total Senior Loans
(Cost: $160,038,258) | | | | | | | | | 159,657,427 | | |
Common Stocks —%
Issuer | | | | Shares | | Value ($) | |
Consumer Discretionary —% | |
Auto Components —% | |
Delphi Automotive PLC | | | | | | | 1,315 | | | | 75,218 | | |
Hotels, Restaurants & Leisure —% | |
BLB Management Services, Inc.(o) | | | | | | | 5,526 | | | | 132,624 | | |
Media —% | |
Media News Group(o) | | | | | | | 2,495 | | | | 41,168 | | |
Tribune Co.(o) | | | | | | | 1,338 | | | | 89,579 | | |
Total | | | | | | | | | 130,747 | | |
Total Consumer Discretionary | | | | | | | 338,589 | | |
Information Technology —% | |
IT Services —% | |
Advanstar Communications, Inc.(o) | | | | | | | 705 | | | | 8,812 | | |
Total Information Technology | | | | | | | 8,812 | | |
Materials —% | |
Chemicals —% | |
LyondellBasell Industries NV, Class A | | | | | 3,806 | | | | 283,928 | | |
Metals & Mining —% | |
Aleris International, Inc.(o) | | | | | | | 3,767 | | | | 173,282 | | |
Total Materials | | | | | | | 457,210 | | |
Telecommunication Services —% | |
Diversified Telecommunication Services —% | |
Hawaiian Telcom Holdco, Inc.(o) | | | | | 478 | | | | 12,705 | | |
Total Common Stocks
(Cost: $575,123) | | | | | | | 817,316 | | |
The accompanying Notes to Financial Statements are an integral part of this statement.
Annual Report 2013
30
Columbia Strategic Income Fund
Portfolio of Investments (continued)
October 31, 2013
Warrants —%
Issuer | | Shares | | Value ($) | |
Energy —% | |
Energy Equipment & Services —% | |
Green Field Energy Services, Inc.(b)(e)(o) | | | 3,895 | | | | 3,934 | | |
Total Warrants
(Cost: $157,632) | | | | | 3,934 | | |
Options Purchased Puts —%
Issuer | | Contracts | | Exercise
Price | | Expiration
Date | | Value ($) | |
U.S. Treasury Bond
Futures | | | 2,950 | | | | 126.00 | | | 11/22/13 | | | 599,219 | | |
Total Options Purchased Puts
(Cost: $652,245) | | | | | | | | | 599,219 | | |
Treasury Bills(a) 0.4%
Issuer | | Effective
Yield | | Principal
Amount ($) | | Value ($) | |
Norway Treasury Bills
03/19/14 | | | 1.580 | % | | NOK | | | | | 8,527,288 | | | | 8,348,863 | | |
Total Treasury Bills
(Cost: $8,527,288) | | | | | | | | | 8,348,863 | | |
Money Market Funds 3.6%
| | | Shares | | Value ($) | |
Columbia Short-Term Cash Fund,
0.093%(p)(q) | | | 82,995,116 | | | | 82,995,116 | | |
Total Money Market Funds
(Cost: $82,995,116) | | | | | 82,995,116 | | |
Total Investments
(Cost: $2,308,365,014) | | | | | 2,355,293,296 | | |
Other Assets & Liabilities, Net | | | | | (41,518,462 | ) | |
Net Assets | | | | | 2,313,774,834 | | |
Investments in Derivatives
Forward Foreign Currency Exchange Contracts Open at October 31, 2013
Counterparty | |
Exchange Date | | Currency to
be Delivered | | Currency to
be Received | | Unrealized
Appreciation ($) | | Unrealized
Depreciation ($) | |
Credit Suisse
| | November 8, 2013
| | | 30,000,000
(CHF) | | | | 33,292,642
(USD) | | | | 228,257
| | | | —
| | |
Credit Suisse
| | November 8, 2013
| | | 1,905,000,000
(JPY) | | | | 19,577,013
(USD) | | | | 203,097
| | | | —
| | |
Barclays Bank PLC
| | November 12, 2013
| | | 74,474,000
(RUB) | | | | 2,285,951
(USD) | | | | —
| | | | (32,413
| ) | |
Citigroup Global Markets Inc.
| | December 4, 2013
| | | 25,972,000
(CHF) | | | | 29,054,802
(USD) | | | | 423,845
| | | | —
| | |
Goldman, Sachs & Co.
| | December 4, 2013
| | | 12,636,000
(EUR) | | | | 17,420,242
(USD) | | | | 262,581
| | | | —
| | |
State Street Bank & Trust
Company | | December 4, 2013
| | | 37,000,000
(EUR) | | | | 50,547,920
(USD) | | | | 307,854
| | | | —
| | |
Barclays Bank PLC
| | December 4, 2013
| | | 7,185,000
(GBP) | | | | 11,586,639
(USD) | | | | 68,801
| | | | —
| | |
Standard Chartered Bank
| | December 4, 2013
| | | 5,600,000
(GBP) | | | | 9,035,376
(USD) | | | | 58,356
| | | | —
| | |
HSBC Securities (USA), Inc.
| | December 4, 2013
| | | 11,602,189
(USD) | | | | 12,128,000
(CAD) | | | | 20,680
| | | | —
| | |
Morgan Stanley
| | December 4, 2013
| | | 29,004,954
(USD) | | | | 171,267,000
(NOK) | | | | —
| | | | (266,806
| ) | |
State Street Bank & Trust
Company | | December 4, 2013
| | | 17,379,055
(USD) | | | | 21,025,000
(NZD) | | | | —
| | | | (47,940
| ) | |
Citigroup Global Markets Inc.
| | December 6, 2013
| | | 15,008,968,000
(COP) | | | | 7,939,573
(USD) | | | | 31,377
| | | | —
| | |
Total | | | | | | | | | 1,604,848 | | | | (347,159 | ) | |
The accompanying Notes to Financial Statements are an integral part of this statement.
Annual Report 2013
31
Columbia Strategic Income Fund
Portfolio of Investments (continued)
October 31, 2013
Futures Contracts Outstanding at October 31, 2013
At October 31, 2013, securities totaling $2,668,286 were pledged as collateral to cover initial margin requirements on open futures contracts.
Contract Description | | Number of
Contracts
Long (Short) | | Trading
Currency | | Notional
Market
Value ($) | | Expiration
Date | | Unrealized
Appreciation ($) | | Unrealized
Depreciation ($) | |
U.S. Treasury Note, 2-year | | | 414 | | | USD | | | | | 91,254,658 | | | December 2013 | | | 301,693 | | | | — | | |
U.S. Treasury Note, 5-year | | | (445 | ) | | USD | | | | | (54,150,938 | ) | | December 2013 | | | 21,098 | | | | — | | |
U.S. Treasury Note, 10-year | | | (3,433 | ) | | USD | | | | | (437,224,752 | ) | | December 2013 | | | — | | | | (9,837,177 | ) | |
U.S. Treasury Long Bond, 20-year | | | 1,554 | | | USD | | | | | 209,498,625 | | | December 2013 | | | 5,375,946 | | | | — | | |
U.S. Treasury Ultra Bond, 30-year | | | 114 | | | USD | | | | | 16,426,688 | | | December 2013 | | | 409,610 | | | | — | | |
Total | | | | | | | | | | | 6,108,347 | | | | (9,837,177 | ) | |
Notes to Portfolio of Investments
(a) Principal amounts are denominated in United States Dollars unless otherwise noted.
(b) Security exempt from registration pursuant to Rule 144A under the Securities Act of 1933. This security may be resold in transactions exempt from registration, normally to qualified institutional buyers. At October 31, 2013, the value of these securities amounted to $782,279,711 or 33.81% of net assets.
(c) Variable rate security.
(d) Negligible market value.
(e) Identifies issues considered to be illiquid as to their marketability. The aggregate value of such securities at October 31, 2013 was $3,463,951, representing 0.15% of net assets. Information concerning such security holdings at October 31, 2013 is as follows:
Security Description | | Acquisition Dates | | Cost ($) | |
ATI Acquisition Co.
Tranche B Term Loan
12/30/14 0.000% | | 12/23/09 - 10/31/13 | | | 77,506 | | |
Cabazon Band Mission Indians
Revenue Bonds
Series 2004
10/01/11 13.000% | | 10/04/04 | | | 2,820,000 | | |
Green Field Energy Services Inc.
Secured
11/15/16 13.000% | | 11/09/11 - 12/14/11 | | | 3,773,637 | | |
Green Field Energy Services Inc.
Secured
11/15/16 13.000% | | 10/24/12 | | | 94,860 | | |
Green Field Energy Services Inc.
Warrants | | 11/09/11 - 12/14/11 | | | 157,632 | | |
Revolution Studios Distribution Co. LLC
Tranche B Term Loan
12/21/14 3.940% | | 10/15/08 | | | 182,986 | | |
Six Flags, Inc.
06/01/2014 9.625% | | 05/07/10 | | | — | | |
(f) Represents fair value as determined in good faith under procedures approved by the Board of Trustees. At October 31, 2013, the value of these securities amounted to $730,617, which represents 0.03% of net assets.
(g) Represents a security purchased on a when-issued or delayed delivery basis.
The accompanying Notes to Financial Statements are an integral part of this statement.
Annual Report 2013
32
Columbia Strategic Income Fund
Portfolio of Investments (continued)
October 31, 2013
Notes to Portfolio of Investments (continued)
(h) Represents securities that have defaulted on payment of interest. The Fund has stopped accruing interest on these securities. At October 31, 2013, the value of these securities amounted to $3,478,885, which represents 0.15% of net assets.
(i) The maturity dates shown represent the original maturity of the underlying obligation. Actual maturity may vary based upon prepayment activity on these obligations. Unless otherwise noted, the coupon rates presented are fixed rates.
(j) Interest Only (IO) security. The actual effective yield of this security is different than the stated coupon rate.
(k) This security, or a portion of this security, has been pledged as collateral in connection with open futures contracts. These values are denoted within the Investments in Derivatives section of the Portfolio of Investments.
(l) Zero coupon bond.
(m) Municipal obligations include debt obligations issued by or on behalf of territories, possessions, or sovereign nations within the territorial boundaries of the United States. At October 31, 2013, the value of these securities amounted to $1,296,833 or 0.06% of net assets.
(n) Senior loans have rates of interest that float periodically based primarily on the London Interbank Offered Rate ("LIBOR") and other short-term rates. The interest rate shown reflects the weighted average coupon as of October 31, 2013. The interest rate shown for senior loans purchased on a when-issued or delayed delivery basis, if any, reflects an estimated average coupon. Remaining maturities of senior loans may be less than the stated maturities shown as a result of contractual or optional prepayments by the borrower. Such prepayments cannot be predicted with certainty.
(o) Non-income producing.
(p) The rate shown is the seven-day current annualized yield at October 31, 2013.
(q) As defined in the Investment Company Act of 1940, an affiliated company is one in which the Fund owns 5% or more of its outstanding voting securities, or a company which is under common ownership or control with the Fund. Holdings and transactions in these affiliated companies during the year ended October 31, 2013, are as follows:
Issuer | | Beginning
Cost ($) | | Purchase
Cost ($) | | Proceeds
From Sales ($) | | Ending
Cost ($) | | Dividends or
Interest
Income ($) | | Value ($) | |
Columbia Short-Term Cash Fund | | | 140,193,065 | | | | 869,143,782 | | | | (926,341,731 | ) | | | 82,995,116 | | | | 123,673 | | | | 82,995,116 | | |
(r) Principal and interest may not be guaranteed by the government.
Abbreviation Legend
CMO Collateralized Mortgage Obligation
FGIC Financial Guaranty Insurance Company
NPFGC National Public Finance Guarantee Corporation
PIK Payment-in-Kind
STRIPS Separate Trading of Registered Interest and Principal Securities
Currency Legend
AUD Australian Dollar
BRL Brazilian Real
CAD Canadian Dollar
CHF Swiss Franc
COP Colombian Peso
DOP Dominican Republic Peso
EUR Euro
GBP British Pound
IDR Indonesian Rupiah
JPY Japanese Yen
MXN Mexican Peso
The accompanying Notes to Financial Statements are an integral part of this statement.
Annual Report 2013
33
Columbia Strategic Income Fund
Portfolio of Investments (continued)
October 31, 2013
Currency Legend (continued)
NOK Norwegian Krone
NZD New Zealand Dollar
PEN Peru Nuevos Soles
PLN Polish Zloty
RUB Russian Rouble
USD US Dollar
UYU Uruguay Pesos
Fair Value Measurements
Generally accepted accounting principles (GAAP) require disclosure regarding the inputs and valuation techniques used to measure fair value and any changes in valuation inputs or techniques. In addition, investments shall be disclosed by major category.
The Fund categorizes its fair value measurements according to a three-level hierarchy that maximizes the use of observable inputs and minimizes the use of unobservable inputs by prioritizing that the most observable input be used when available. Observable inputs are those that market participants would use in pricing an investment based on market data obtained from sources independent of the reporting entity. Unobservable inputs are those that reflect the Fund's assumptions about the information market participants would use in pricing an investment. An investment's level within the fair value hierarchy is based on the lowest level of any input that is deemed significant to the asset or liability's fair value measurement. The input levels are not necessarily an indication of the risk or liquidity associated with investments at that level. For example, certain U.S. government securities are generally high quality and liquid, however, they are reflected as Level 2 because the inputs used to determine fair value may not always be quoted prices in an active market.
Fair value inputs are summarized in the three broad levels listed below:
> Level 1 — Valuations based on quoted prices for investments in active markets that the Fund has the ability to access at the measurement date (including NAV for open-end mutual funds). Valuation adjustments are not applied to Level 1 investments.
> Level 2 — Valuations based on other significant observable inputs (including quoted prices for similar securities, interest rates, prepayment speeds, credit risks, etc.).
> Level 3 — Valuations based on significant unobservable inputs (including the Fund's own assumptions and judgment in determining the fair value of investments).
Inputs that are used in determining fair value of an investment may include price information, credit data, volatility statistics, and other factors. These inputs can be either observable or unobservable. The availability of observable inputs can vary between investments, and is affected by various factors such as the type of investment, and the volume and level of activity for that investment or similar investments in the marketplace. The inputs will be considered by the Investment Manager, along with any other relevant factors in the calculation of an investment's fair value. The Fund uses prices and inputs that are current as of the measurement date, which may include periods of market dislocations. During these periods, the availability of prices and inputs may be reduced for many investments. This condition could cause an investment to be reclassified between the various levels within the hierarchy.
Investments falling into the Level 3 category are primarily supported by quoted prices from brokers and dealers participating in the market for those investments. However, these may be classified as Level 3 investments due to lack of market transparency and corroboration to support these quoted prices. Additionally, valuation models may be used as the pricing source for any remaining investments classified as Level 3. These models may rely on one or more significant unobservable inputs and/or significant assumptions by the Investment Manager. Inputs used in valuations may include, but are not limited to, financial statement analysis, capital account balances, discount rates and estimated cash flows, and comparable company data.
Under the direction of the Fund's Board of Trustees (the Board), the Investment Manager's Valuation Committee (the Committee) is responsible for carrying out the valuation procedures approved by the Board. The Committee consists of voting and non-voting members from various groups within the Investment Manager's organization, including operations and accounting, trading and investments, compliance, risk management and legal.
The Committee meets at least monthly to review and approve valuation matters, which may include a description of specific valuation determinations, data regarding pricing information received from approved pricing vendors and brokers and the results of Board-approved valuation control policies and procedures (the Policies). The Policies address, among other things, instances when market quotations are or are not readily available, including recommendations of third party pricing vendors and a determination of appropriate pricing methodologies; events that require specific valuation determinations and assessment of fair value techniques; securities with a potential for stale pricing, including those that are illiquid, restricted, or in default; and the effectiveness of third-party pricing vendors, including periodic reviews of vendors. The Committee meets more frequently, as needed, to discuss additional valuation matters, which may include the need to review back-testing results, review time-sensitive information or approve related valuation actions. The Committee reports to the Board, with members of the Committee meeting with the Board at each of its regularly scheduled meetings to discuss valuation matters and actions during the period, similar to those described earlier.
The accompanying Notes to Financial Statements are an integral part of this statement.
Annual Report 2013
34
Columbia Strategic Income Fund
Portfolio of Investments (continued)
October 31, 2013
Fair Value Measurements (continued)
For investments categorized as Level 3, the Committee monitors information similar to that described above, which may include: (i) data specific to the issuer or comparable issuers, (ii) general market or specific sector news and (iii) quoted prices and specific or similar security transactions. The Committee considers this data and any changes from prior periods in order to assess the reasonableness of observable and unobservable inputs, any assumptions or internal models used to value those securities and changes in fair value. This data is also used to corroborate, when available, information received from approved pricing vendors and brokers. Various factors impact the frequency of monitoring this information (which may occur as often as daily). However, the Committee may determine that changes to inputs, assumptions and models are not required as a result of the monitoring procedures performed.
The following table is a summary of the inputs used to value the Fund's investments at October 31, 2013:
Description | | Level 1
Quoted Prices in Active
Markets for Identical
Assets ($) | | Level 2
Other Significant
Observable Inputs ($) | | Level 3
Significant
Unobservable Inputs ($) | | Total ($) | |
Bonds | |
Corporate Bonds & Notes | | | — | | | | 1,155,897,438 | | | | 730,616 | | | | 1,156,628,054 | | |
Residential Mortgage-Backed
Securities — Agency | | | — | | | | 185,791,164 | | | | — | | | | 185,791,164 | | |
Residential Mortgage-Backed
Securities — Non-Agency | | | — | | | | 88,949,813 | | | | 33,919,535 | | | | 122,869,348 | | |
Commercial Mortgage-Backed
Securities — Non-Agency | | | — | | | | 13,345,690 | | | | — | | | | 13,345,690 | | |
Asset-Backed Securities — Non-Agency | | | — | | | | 4,149,225 | | | | — | | | | 4,149,225 | | |
Inflation-Indexed Bonds | | | — | | | | 42,233,378 | | | | — | | | | 42,233,378 | | |
U.S. Treasury Obligations | | | 47,694,778 | | | | — | | | | — | | | | 47,694,778 | | |
Foreign Government Obligations | | | — | | | | 527,031,517 | | | | 1,831,434 | | | | 528,862,951 | | |
Municipal Bonds | | | — | | | | 1,296,833 | | | | — | | | | 1,296,833 | | |
Total Bonds | | | 47,694,778 | | | | 2,018,695,058 | | | | 36,481,585 | | | | 2,102,871,421 | | |
Senior Loans | |
Building Materials | | | — | | | | 1,535,068 | | | | — | | | | 1,535,068 | | |
Chemicals | | | — | | | | 12,775,192 | | | | 256,875 | | | | 13,032,067 | | |
Construction Machinery | | | — | | | | 107,793 | | | | 649,890 | | | | 757,683 | | |
Diversified Manufacturing | | | — | | | | 6,427,362 | | | | 230,062 | | | | 6,657,424 | | |
Electric | | | — | | | | 8,150,256 | | | | 451,198 | | | | 8,601,454 | | |
Gaming | | | — | | | | 5,621,186 | | | | 272,500 | | | | 5,893,686 | | |
Gas Pipelines | | | — | | | | — | | | | 556,578 | | | | 556,578 | | |
Lodging | | | — | | | | — | | | | 504,375 | | | | 504,375 | | |
Other Industry | | | — | | | | 2,817,765 | | | | 569,250 | | | | 3,387,015 | | |
Pharmaceuticals | | | — | | | | 5,488,157 | | | | 1,333,252 | | | | 6,821,409 | | |
Retailers | | | — | | | | 13,784,051 | | | | 188,052 | | | | 13,972,103 | | |
Transportation Services | | | — | | | | — | | | | 960,536 | | | | 960,536 | | |
Wireless | | | — | | | | 1,295,639 | | | | 244,474 | | | | 1,540,113 | | |
All Other Industries | | | — | | | | 95,437,916 | | | | — | | | | 95,437,916 | | |
Total Senior Loans | | | — | | | | 153,440,385 | | | | 6,217,042 | | | | 159,657,427 | | |
The accompanying Notes to Financial Statements are an integral part of this statement.
Annual Report 2013
35
Columbia Strategic Income Fund
Portfolio of Investments (continued)
October 31, 2013
Fair Value Measurements (continued)
Description | | Level 1
Quoted Prices in Active
Markets for Identical
Assets ($) | | Level 2
Other Significant
Observable Inputs ($) | | Level 3
Significant
Unobservable Inputs ($) | | Total ($) | |
Equity Securities | |
Common Stocks | |
Consumer Discretionary | | | 164,797 | | | | 41,168 | | | | 132,624 | | | | 338,589 | | |
Information Technology | | | — | | | | — | | | | 8,812 | | | | 8,812 | | |
Materials | | | 283,928 | | | | — | | | | 173,282 | | | | 457,210 | | |
Telecommunication Services | | | 12,705 | | | | — | | | | — | | | | 12,705 | | |
Warrants | |
Energy | | | — | | | | 3,934 | | | | — | | | | 3,934 | | |
Total Equity Securities | | | 461,430 | | | | 45,102 | | | | 314,718 | | | | 821,250 | | |
Short-Term Securities | |
Treasury Bills | | | — | | | | 8,348,863 | | | | — | | | | 8,348,863 | | |
Total Short-Term Securities | | | — | | | | 8,348,863 | | | | — | | | | 8,348,863 | | |
Other | |
Options Purchased Puts | | | 599,219 | | | | — | | | | — | | | | 599,219 | | |
Total Other | | | 599,219 | | | | — | | | | — | | | | 599,219 | | |
Mutual Funds | |
Money Market Funds | | | 82,995,116 | | | | — | | | | — | | | | 82,995,116 | | |
Total Mutual Funds | | | 82,995,116 | | | | — | | | | — | | | | 82,995,116 | | |
Investments in Securities | | | 131,750,543 | | | | 2,180,529,408 | | | | 43,013,345 | | | | 2,355,293,296 | | |
Derivatives | |
Assets | |
Forward Foreign Currency
Exchange Contracts | | | — | | | | 1,604,848 | | | | — | | | | 1,604,848 | | |
Futures Contracts | | | 6,108,347 | | | | — | | | | — | | | | 6,108,347 | | |
Liabilities | |
Forward Foreign Currency
Exchange Contracts | | | — | | | | (347,159 | ) | | | — | | | | (347,159 | ) | |
Futures Contracts | | | (9,837,177 | ) | | | — | | | | — | | | | (9,837,177 | ) | |
Total | | | 128,021,713 | | | | 2,181,787,097 | | | | 43,013,345 | | | | 2,352,822,155 | | |
See the Portfolio of Investments for all investment classifications not indicated in the table.
The Fund's assets assigned to the Level 2 input category are generally valued using the market approach, in which a security's value is determined through reference to prices and information from market transactions for similar or identical assets.
The Fund's assets assigned to the Level 3 category are valued utilizing the valuation technique deemed the most appropriate in the circumstances. Residential mortgage backed securities, corporate bonds, senior loans, foreign government obligations and common stock classified as Level 3 are valued using the market approach and utilize single market quotations from broker dealers which may have included, but not limited to, the distressed nature of the security and observable transactions for similar assets in the market. Significant increases (decreases) to any of these inputs would result in a significantly lower (higher) fair value measurement.
There were no transfers of financial assets between Levels 1 and 2 during the period.
Derivative instruments are valued at unrealized appreciation (depreciation).
The accompanying Notes to Financial Statements are an integral part of this statement.
Annual Report 2013
36
Columbia Strategic Income Fund
Portfolio of Investments (continued)
October 31, 2013
Fair Value Measurements (continued)
The following table is a reconciliation of Level 3 assets for which significant observable and/or unobservable inputs were used to determine fair value.
| | | Corporate
Bonds &
Notes ($) | | Residential
Mortgage-
Backed
Securities —
Agency ($) | | Residential
Mortgage-
Backed
Securities —
Non-Agency ($) | |
Foreign
Government
Obligations ($) | | Senior
Loans ($) | | Common
Stocks ($) | | Total ($) | |
Balance as of October 31, 2012 | | | 883,710 | | | | 4,815,000 | | | | 55,445,069 | | | | 2,008,370 | | | | 6,728,744 | | | | 176,965 | | | | 70,057,858 | | |
Accrued discounts/premiums | | | 745 | | | | — | | | | (1,612 | ) | | | (703 | ) | | | 33,509 | | | | — | | | | 31,939 | | |
Realized gain (loss) | | | — | | | | — | | | | 94,639 | | | | — | | | | 78,492 | | | | — | | | | 173,131 | | |
Change in unrealized appreciation
(depreciation)(a) | | | (150,700 | ) | | | — | | | | 93,320 | | | | 1,301 | | | | 86,772 | | | | 54,678 | | | | 85,371 | | |
Sales | | | — | | | | — | | | | (11,911,727 | ) | | | — | | | | (3,787,254 | ) | | | — | | | | (15,698,981 | ) | |
Purchases | | | — | | | | — | | | | 31,700,591 | | | | 1,830,836 | | | | 3,920,570 | | | | 4,673 | | | | 37,456,670 | | |
Transfers into Level 3 | | | — | | | | — | | | | — | | | | — | | | | 3,062,693 | | | | 78,402 | | | | 3,141,095 | | |
Transfers out of Level 3 | | | (3,139 | ) | | | (4,815,000 | ) | | | (41,500,745 | ) | | | (2,008,370 | ) | | | (3,906,484 | ) | | | — | | | | (52,233,738 | ) | |
Balance as of October 31, 2013 | | | 730,616 | | | | — | | | | 33,919,535 | | | | 1,831,434 | | | | 6,217,042 | | | | 314,718 | | | | 43,013,345 | | |
(a) Change in unrealized appreciation (depreciation) relating to securities held at October 31, 2013 was $131,894, which is comprised of Corporate Bonds & Notes of $(150,700), Residential Mortgage-Backed Securities — Non-Agency of $96,426, Foreign Government Obligations of $1,301, Senior Loans of $130,189 and Common Stock of $54,678.
The Fund does not hold any significant investments with unobservable inputs which are categorized as Level 3.
Financial Assets were transferred from Level 2 to Level 3 due to utilizing a single market quotation from a broker dealer. As a result, as of period end, management determined to value the security(s) under consistently applied procedures established by and under the general supervision of the Board of Trustees.
Financial assets were transferred from Level 3 to Level 2 as observable market inputs were utilized and management's determination that there was sufficient, reliable and observable market data to value these assets as of period end.
Transfers in and/or out of Level 3 are determined based on the fair value at the beginning of the period for security positions held throughout the period.
The accompanying Notes to Financial Statements are an integral part of this statement.
Annual Report 2013
37
Columbia Strategic Income Fund
Statement of Assets and Liabilities
October 31, 2013
The accompanying Notes to Financial Statements are an integral part of this statement.
Assets | |
Investments, at value | |
Unaffiliated issuers (identified cost $2,225,369,898) | | $ | 2,272,298,180 | | |
Affiliated issuers (identified cost $82,995,116) | | | 82,995,116 | | |
Total investments (identified cost $2,308,365,014) | | | 2,355,293,296 | | |
Cash | | | 582,374 | | |
Foreign currency (identified cost $2,243,272) | | | 2,109,158 | | |
Unrealized appreciation on forward foreign currency exchange contracts | | | 1,604,848 | | |
Receivable for: | |
Investments sold | | | 19,932,617 | | |
Capital shares sold | | | 2,534,761 | | |
Dividends | | | 7,270 | | |
Interest | | | 30,253,757 | | |
Reclaims | | | 172,969 | | |
Variation margin | | | 560,031 | | |
Expense reimbursement due from Investment Manager | | | 2 | | |
Prepaid expenses | | | 25,345 | | |
Trustees' deferred compensation plan | | | 176,545 | | |
Other assets | | | 8,933 | | |
Total assets | | | 2,413,261,906 | | |
Liabilities | |
Unrealized depreciation on forward foreign currency exchange contracts | | | 347,159 | | |
Payable for: | |
Investments purchased | | | 9,192,508 | | |
Investments purchased on a delayed delivery basis | | | 83,408,499 | | |
Capital shares purchased | | | 5,469,079 | | |
Variation margin | | | 246,288 | | |
Investment management fees | | | 32,887 | | |
Distribution and/or service fees | | | 14,859 | | |
Transfer agent fees | | | 379,113 | | |
Administration fees | | | 4,017 | | |
Plan administration fees | | | 1 | | |
Compensation of board members | | | 46,216 | | |
Chief compliance officer expenses | | | 185 | | |
Other expenses | | | 169,716 | | |
Trustees' deferred compensation plan | | | 176,545 | | |
Total liabilities | | | 99,487,072 | | |
Net assets applicable to outstanding capital stock | | $ | 2,313,774,834 | | |
Represented by | |
Paid-in capital | | $ | 2,198,892,971 | | |
Undistributed net investment income | | | 3,818,285 | | |
Accumulated net realized gain | | | 66,727,493 | | |
Unrealized appreciation (depreciation) on: | |
Investments | | | 46,928,282 | | |
Foreign currency translations | | | (121,056 | ) | |
Forward foreign currency exchange contracts | | | 1,257,689 | | |
Futures contracts | | | (3,728,830 | ) | |
Total — representing net assets applicable to outstanding capital stock | | $ | 2,313,774,834 | | |
Annual Report 2013
38
Columbia Strategic Income Fund
Statement of Assets and Liabilities (continued)
October 31, 2013
Class A | |
Net assets | | $ | 1,303,811,641 | | |
Shares outstanding | | | 208,110,137 | | |
Net asset value per share | | $ | 6.27 | | |
Maximum offering price per share(a) | | $ | 6.58 | | |
Class B | |
Net assets | | $ | 26,614,208 | | |
Shares outstanding | | | 4,250,548 | | |
Net asset value per share | | $ | 6.26 | | |
Class C | |
Net assets | | $ | 221,063,115 | | |
Shares outstanding | | | 35,270,114 | | |
Net asset value per share | | $ | 6.27 | | |
Class K | |
Net assets | | $ | 171,522 | | |
Shares outstanding | | | 27,744 | | |
Net asset value per share | | $ | 6.18 | | |
Class R | |
Net assets | | $ | 1,220,376 | | |
Shares outstanding | | | 193,769 | | |
Net asset value per share | | $ | 6.30 | | |
Class R4 | |
Net assets | | $ | 3,389,268 | | |
Shares outstanding | | | 548,624 | | |
Net asset value per share | | $ | 6.18 | | |
Class R5 | |
Net assets | | $ | 1,563,171 | | |
Shares outstanding | | | 252,644 | | |
Net asset value per share | | $ | 6.19 | | |
Class W | |
Net assets | | $ | 2,541 | | |
Shares outstanding | | | 406 | | |
Net asset value per share | | $ | 6.26 | | |
Class Y | |
Net assets | | $ | 19,170 | | |
Shares outstanding | | | 3,106 | | |
Net asset value per share | | $ | 6.17 | | |
Class Z | |
Net assets | | $ | 755,919,822 | | |
Shares outstanding | | | 122,281,640 | | |
Net asset value per share | | $ | 6.18 | | |
(a) The maximum offering price per share is calculated by dividing the net asset value per share by 1.0 minus the maximum sales charge of 4.75%.
The accompanying Notes to Financial Statements are an integral part of this statement.
Annual Report 2013
39
Columbia Strategic Income Fund
Statement of Operations
Year Ended October 31, 2013
Net investment income | |
Income: | |
Dividends — unaffiliated issuers | | $ | 23,821 | | |
Dividends — affiliated issuers | | | 123,673 | | |
Interest | | | 136,614,834 | | |
Income from securities lending — net | | | 30,351 | | |
Foreign taxes withheld | | | (124,821 | ) | |
Total income | | | 136,667,858 | | |
Expenses: | |
Investment management fees | | | 13,715,882 | | |
Distribution and/or service fees | |
Class A | | | 3,632,845 | | |
Class B | | | 381,530 | | |
Class C | | | 2,553,328 | | |
Class R | | | 4,262 | | |
Class W | | | 6 | | |
Transfer agent fees | |
Class A | | | 2,457,131 | | |
Class B | | | 64,291 | | |
Class C | | | 431,438 | | |
Class K | | | 87 | | |
Class R | | | 1,454 | | |
Class R4(a) | | | 3,541 | | |
Class R5 | | | 143 | | |
Class W | | | 4 | | |
Class Z | | | 1,545,566 | | |
Administration fees | | | 1,673,890 | | |
Plan administration fees | |
Class K | | | 436 | | |
Compensation of board members | | | 89,418 | | |
Custodian fees | | | 144,572 | | |
Printing and postage fees | | | 394,122 | | |
Registration fees | | | 142,821 | | |
Professional fees | | | 119,329 | | |
Chief compliance officer expenses | | | 1,784 | | |
Other | | | 74,557 | | |
Total expenses | | | 27,432,437 | | |
Fees waived or expenses reimbursed by Investment Manager and its affiliates | | | (159 | ) | |
Fees waived by Distributor — Class C | | | (383,776 | ) | |
Expense reductions | | | (7,807 | ) | |
Total net expenses | | | 27,040,695 | | |
Net investment income | | | 109,627,163 | | |
Realized and unrealized gain (loss) — net | |
Net realized gain (loss) on: | |
Investments | | | 62,541,452 | | |
Foreign currency translations | | | 138,468 | | |
Forward foreign currency exchange contracts | | | (12,882,242 | ) | |
Futures contracts | | | 12,750,838 | | |
Swap contracts | | | (227,466 | ) | |
Net realized gain | | | 62,321,050 | | |
Net change in unrealized appreciation (depreciation) on: | |
Investments | | | (125,686,658 | ) | |
Foreign currency translations | | | (169,215 | ) | |
Forward sale commitments | | | (32,812 | ) | |
Forward foreign currency exchange contracts | | | 1,502,158 | | |
Futures contracts | | | (2,916,514 | ) | |
Swap contracts | | | 195,078 | | |
Foreign capital gains tax | | | 183,022 | | |
Net change in unrealized appreciation (depreciation) | | | (126,924,941 | ) | |
Net realized and unrealized loss | | | (64,603,891 | ) | |
Net increase in net assets resulting from operations | | $ | 45,023,272 | | |
(a) Class R4 shares are for the period from November 8, 2012 (commencement of operations) to October 31, 2013.
The accompanying Notes to Financial Statements are an integral part of this statement.
Annual Report 2013
40
Columbia Strategic Income Fund
Statement of Changes in Net Assets
| | | Year Ended
October 31,
2013(a)(b) | | Year Ended
October 31,
2012(c) | | Year Ended
May 31,
2012 | |
Operations | |
Net investment income | | $ | 109,627,163 | | | $ | 45,566,824 | | | $ | 111,742,862 | | |
Net realized gain | | | 62,321,050 | | | | 36,668,469 | | | | 24,165,239 | | |
Net change in unrealized appreciation (depreciation) | | | (126,924,941 | ) | | | 86,592,961 | | | | (37,148,124 | ) | |
Net increase in net assets resulting from operations | | | 45,023,272 | | | | 168,828,254 | | | | 98,759,977 | | |
Distributions to shareholders | |
Net investment income | |
Class A | | | (56,573,902 | ) | | | (24,628,452 | ) | | | (66,539,026 | ) | |
Class B | | | (1,206,614 | ) | | | (727,074 | ) | | | (2,824,433 | ) | |
Class C | | | (8,408,652 | ) | | | (3,678,258 | ) | | | (9,849,005 | ) | |
Class K | | | (7,074 | ) | | | (3,520 | ) | | | (11,357 | ) | |
Class R | | | (30,212 | ) | | | (2,410 | ) | | | (1,222 | ) | |
Class R4 | | | (79,956 | ) | | | — | | | | — | | |
Class R5 | | | (12,980 | ) | | | (3,333 | ) | | | (15,349 | ) | |
Class W | | | (102 | ) | | | (44 | ) | | | (129 | ) | |
Class Y | | | (102 | ) | | | — | | | | — | | |
Class Z | | | (38,379,276 | ) | | | (16,713,389 | ) | | | (38,835,078 | ) | |
Net realized gains | |
Class A | | | (4,588,950 | ) | | | — | | | | — | | |
Class B | | | (142,982 | ) | | | — | | | | — | | |
Class C | | | (816,591 | ) | | | — | | | | — | | |
Class K | | | (567 | ) | | | — | | | | — | | |
Class R | | | (833 | ) | | | — | | | | — | | |
Class R4 | | | (8 | ) | | | — | | | | — | | |
Class R5 | | | (25 | ) | | | — | | | | — | | |
Class W | | | (8 | ) | | | — | | | | — | | |
Class Z | | | (3,024,482 | ) | | | — | | | | — | | |
Total distributions to shareholders | | | (113,273,316 | ) | | | (45,756,480 | ) | | | (118,075,599 | ) | |
Increase (decrease) in net assets from capital stock activity | | | (409,893,339 | ) | | | 199,890,800 | | | | 623,615,952 | | |
Total increase (decrease) in net assets | | | (478,143,383 | ) | | | 322,962,574 | | | | 604,300,330 | | |
Net assets at beginning of year | | | 2,791,918,217 | | | | 2,468,955,643 | | | | 1,864,655,313 | | |
Net assets at end of year | | $ | 2,313,774,834 | | | $ | 2,791,918,217 | | | $ | 2,468,955,643 | | |
Undistributed net investment income | | $ | 3,818,285 | | | $ | 5,510,922 | | | $ | 2,649,575 | | |
(a) Class R4 shares are for the period from November 8, 2012 (commencement of operations) to October 31, 2013.
(b) Class Y shares are for the period from June 13, 2013 (commencement of operations) to October 31, 2013.
(c) For the period from June 1, 2012 to October 31, 2012. During the period, the Fund's fiscal year end was changed from May 31 to October 31.
The accompanying Notes to Financial Statements are an integral part of this statement.
Annual Report 2013
41
Columbia Strategic Income Fund
Statement of Changes in Net Assets (continued)
| | | Year Ended October 31,
2013(a)(b) | | Year Ended October 31,
2012(c) | | Year Ended May 31,
2012 | |
| | | Shares | | Dollars ($) | | Shares | | Dollars ($) | | Shares | | Dollars ($) | |
Capital stock activity | |
Class A shares | |
Subscriptions(d) | | | 44,564,433 | | | | 283,968,679 | | | | 21,601,647 | | | | 136,516,417 | | | | 52,489,779 | | | | 320,916,293 | | |
Fund merger | | | — | | | | — | | | | — | | | | — | | | | 50,379,122 | | | | 310,385,658 | | |
Distributions reinvested | | | 8,634,390 | | | | 54,699,854 | | | | 3,438,283 | | | | 21,696,932 | | | | 8,155,920 | | | | 49,568,948 | | |
Redemptions | | | (77,906,720 | ) | | | (491,242,604 | ) | | | (15,660,207 | ) | | | (98,920,906 | ) | | | (42,689,073 | ) | | | (260,445,140 | ) | |
Net increase (decrease) | | | (24,707,897 | ) | | | (152,574,071 | ) | | | 9,379,723 | | | | 59,292,443 | | | | 68,335,748 | | | | 420,425,759 | | |
Class B shares | |
Subscriptions | | | 490,739 | | | | 3,134,223 | | | | 273,212 | | | | 1,721,309 | | | | 976,504 | | | | 5,951,250 | | |
Fund merger | | | — | | | | — | | | | — | | | | — | | | | 3,427,244 | | | | 21,120,603 | | |
Distributions reinvested | | | 166,727 | | | | 1,058,427 | | | | 89,638 | | | | 565,140 | | | | 327,055 | | | | 1,984,880 | | |
Redemptions(d) | | | (4,189,937 | ) | | | (26,566,953 | ) | | | (1,680,285 | ) | | | (10,576,032 | ) | | | (5,644,122 | ) | | | (34,428,362 | ) | |
Net decrease | | | (3,532,471 | ) | | | (22,374,303 | ) | | | (1,317,435 | ) | | | (8,289,583 | ) | | | (913,319 | ) | | | (5,371,629 | ) | |
Class C shares | |
Subscriptions | | | 7,260,562 | | | | 46,357,308 | | | | 5,053,632 | | | | 31,881,610 | | | | 10,704,507 | | | | 65,378,318 | | |
Fund merger | | | — | | | | — | | | | — | | | | — | | | | 3,538,608 | | | | 21,808,409 | | |
Distributions reinvested | | | 1,111,400 | | | | 7,049,760 | | | | 431,277 | | | | 2,724,318 | | | | 1,040,533 | | | | 6,326,289 | | |
Redemptions | | | (14,222,016 | ) | | | (89,600,590 | ) | | | (2,692,272 | ) | | | (16,999,819 | ) | | | (7,096,976 | ) | | | (43,274,133 | ) | |
Net increase (decrease) | | | (5,850,054 | ) | | | (36,193,522 | ) | | | 2,792,637 | | | | 17,606,109 | | | | 8,186,672 | | | | 50,238,883 | | |
Class K shares | |
Fund merger | | | — | | | | — | | | | — | | | | — | | | | 36,339 | | | | 221,227 | | |
Distributions reinvested | | | 1,165 | | | | 7,288 | | | | 543 | | | | 3,378 | | | | 1,778 | | | | 10,674 | | |
Redemptions | | | (2,237 | ) | | | (14,162 | ) | | | (8,074 | ) | | | (50,302 | ) | | | (2,186 | ) | | | (13,236 | ) | |
Net increase (decrease) | | | (1,072 | ) | | | (6,874 | ) | | | (7,531 | ) | | | (46,924 | ) | | | 35,931 | | | | 218,665 | | |
Class R shares | |
Subscriptions | | | 230,616 | | | | 1,477,279 | | | | 28,755 | | | | 182,539 | | | | 10,170 | | | | 62,779 | | |
Fund merger | | | — | | | | — | | | | — | | | | — | | | | 859 | | | | 5,322 | | |
Distributions reinvested | | | 3,875 | | | | 24,446 | | | | 343 | | | | 2,181 | | | | 111 | | | | 686 | | |
Redemptions | | | (74,642 | ) | | | (462,038 | ) | | | (6,719 | ) | | | (42,801 | ) | | | (5 | ) | | | (31 | ) | |
Net increase | | | 159,849 | | | | 1,039,687 | | | | 22,379 | | | | 141,919 | | | | 11,135 | | | | 68,756 | | |
Class R4 shares | |
Subscriptions | | | 1,087,673 | | | | 6,742,914 | | | | — | | | | — | | | | — | | | | — | | |
Distributions reinvested | | | 9,136 | | | | 56,085 | | | | — | | | | — | | | | — | | | | — | | |
Redemptions | | | (548,185 | ) | | | (3,359,793 | ) | | | — | | | | — | | | | — | | | | — | | |
Net increase | | | 548,624 | | | | 3,439,206 | | | | — | | | | — | | | | — | | | | — | | |
The accompanying Notes to Financial Statements are an integral part of this statement.
Annual Report 2013
42
Columbia Strategic Income Fund
Statement of Changes in Net Assets (continued)
| | | Year Ended October 31,
2013(a)(b) | | Year Ended October 31,
2012(c) | | Year Ended May 31,
2012 | |
| | | Shares | | Dollars ($) | | Shares | | Dollars ($) | | Shares | | Dollars ($) | |
Capital stock activity (continued) | |
Class R5 shares | |
Subscriptions | | | 256,331 | | | | 1,582,354 | | | | — | | | | — | | | | — | | | | — | | |
Fund merger | | | — | | | | — | | | | — | | | | — | | | | 45,399 | | | | 276,592 | | |
Distributions reinvested | | | 2,052 | | | | 12,633 | | | | — | | | | — | | | | — | | | | — | | |
Redemptions | | | (7,029 | ) | | | (43,284 | ) | | | (44,525 | ) | | | (279,263 | ) | | | — | | | | — | | |
Net increase (decrease) | | | 251,354 | | | | 1,551,703 | | | | (44,525 | ) | | | (279,263 | ) | | | 45,399 | | | | 276,592 | | |
Class Y shares | |
Subscriptions | | | 3,096 | | | | 18,936 | | | | — | | | | — | | | | — | | | | — | | |
Distributions reinvested | | | 10 | | | | 60 | | | | — | | | | — | | | | — | | | | — | | |
Net increase | | | 3,106 | | | | 18,996 | | | | — | | | | — | | | | — | | | | — | | |
Class Z shares | |
Subscriptions | | | 33,293,071 | | | | 209,276,647 | | | | 31,757,630 | | | | 198,575,251 | | | | 56,110,241 | | | | 339,467,116 | | |
Distributions reinvested | | | 1,427,227 | | | | 8,931,096 | | | | 534,916 | | | | 3,334,648 | | | | 1,329,496 | | | | 7,983,778 | | |
Redemptions | | | (68,101,604 | ) | | | (423,001,904 | ) | | | (11,302,670 | ) | | | (70,443,800 | ) | | | (31,284,926 | ) | | | (189,691,968 | ) | |
Net increase (decrease) | | | (33,381,306 | ) | | | (204,794,161 | ) | | | 20,989,876 | | | | 131,466,099 | | | | 26,154,811 | | | | 157,758,926 | | |
Total net increase (decrease) | | | (66,509,867 | ) | | | (409,893,339 | ) | | | 31,815,124 | | | | 199,890,800 | | | | 101,856,377 | | | | 623,615,952 | | |
(a) Class R4 shares are for the period from November 8, 2012 (commencement of operations) to October 31, 2013.
(b) Class Y shares are for the period from June 13, 2013 (commencement of operations) to October 31, 2013.
(c) For the period from June 1, 2012 to October 31, 2012. During the period, the Fund's fiscal year end was changed from May 31 to October 31.
(d) Includes conversions of Class B shares to Class A shares, if any.
The accompanying Notes to Financial Statements are an integral part of this statement.
Annual Report 2013
43
Columbia Strategic Income Fund
The following tables are intended to help you understand the Fund's financial performance. Certain information reflects financial results for a single share of a class held for the periods shown. Per share net investment income (loss) amounts are calculated based on average shares outstanding during the period. Total return assumes reinvestment of all dividends and distributions, if any. Total return does not reflect payment of sales charges, if any, and is not annualized for periods of less than one year.
| | | Year Ended October 31, | | Year Ended May 31, | |
Class A | | 2013 | | 2012(a) | | 2012 | | 2011 | | 2010 | | 2009 | |
Per share data | |
Net asset value, beginning of period | | $ | 6.41 | | | $ | 6.11 | | | $ | 6.16 | | | $ | 5.84 | | | $ | 5.40 | | | $ | 5.91 | | |
Income from investment operations: | |
Net investment income | | | 0.26 | | | | 0.11 | | | | 0.30 | | | | 0.32 | | | | 0.29 | | | | 0.29 | | |
Net realized and unrealized gain (loss) | | | (0.13 | ) | | | 0.30 | | | | (0.04 | ) | | | 0.43 | | | | 0.41 | | | | (0.41 | ) | |
Total from investment operations | | | 0.13 | | | | 0.41 | | | | 0.26 | | | | 0.75 | | | | 0.70 | | | | (0.12 | ) | |
Less distributions to shareholders: | |
Net investment income | | | (0.25 | ) | | | (0.11 | ) | | | (0.31 | ) | | | (0.43 | ) | | | (0.26 | ) | | | (0.38 | ) | |
Net realized gains | | | (0.02 | ) | | | — | | | | — | | | | — | | | | — | | | | — | | |
Tax return of capital | | | — | | | | — | | | | — | | | | — | | | | — | | | | (0.01 | ) | |
Total distributions to shareholders | | | (0.27 | ) | | | (0.11 | ) | | | (0.31 | ) | | | (0.43 | ) | | | (0.26 | ) | | | (0.39 | ) | |
Net asset value, end of period | | $ | 6.27 | | | $ | 6.41 | | | $ | 6.11 | | | $ | 6.16 | | | $ | 5.84 | | | $ | 5.40 | | |
Total return | | | 2.01 | % | | | 6.72 | % | | | 4.44 | % | | | 13.21 | % | | | 13.14 | % | | | (1.79 | %) | |
Ratios to average net assets(b) | |
Total gross expenses | | | 1.03 | % | | | 1.02 | %(c) | | | 1.03 | % | | | 1.01 | % | | | 0.99 | % | | | 0.98 | % | |
Total net expenses(d) | | | 1.03 | %(e) | | | 1.02 | %(c)(e) | | | 1.02 | %(e) | | | 1.00 | %(e) | | | 0.99 | %(e) | | | 0.98 | %(e) | |
Net investment income | | | 4.10 | % | | | 4.11 | %(c) | | | 4.89 | % | | | 5.22 | % | | | 5.09 | % | | | 5.46 | % | |
Supplemental data | |
Net assets, end of period (in thousands) | | $ | 1,303,812 | | | $ | 1,492,620 | | | $ | 1,365,605 | | | $ | 956,132 | | | $ | 1,013,941 | | | $ | 913,087 | | |
Portfolio turnover | | | 113 | %(f) | | | 48 | %(f) | | | 83 | %(f) | | | 128 | % | | | 50 | % | | | 43 | % | |
Notes to Financial Highlights
(a) For the period from June 1, 2012 to October 31, 2012. During the period, the Fund's fiscal year end was changed from May 31 to October 31.
(b) In addition to the fees and expenses which the Fund bears directly, the Fund indirectly bears a pro rata share of the fees and expenses of the acquired funds in which it invests. Such indirect expenses are not included in the reported expense ratios.
(c) Annualized.
(d) Total net expenses include the impact of certain waivers/reimbursements made by the Investment Manager and certain of its affiliates, if applicable.
(e) The benefits derived from expense reductions had an impact of less than 0.01%.
(f) Includes mortgage dollar rolls. If mortgage dollar roll transactions were excluded, the portfolio turnover would have been 71%, 25% and 63% for the years ended October 31, 2013 and 2012, and year ended May 31, 2012, respectively.
The accompanying Notes to Financial Statements are an integral part of this statement.
Annual Report 2013
44
Columbia Strategic Income Fund
Financial Highlights (continued)
| | | Year Ended October 31, | | Year Ended May 31, | |
Class B | | 2013 | | 2012(a) | | 2012 | | 2011 | | 2010 | | 2009 | |
Per share data | |
Net asset value, beginning of period | | $ | 6.41 | | | $ | 6.11 | | | $ | 6.16 | | | $ | 5.84 | | | $ | 5.40 | | | $ | 5.91 | | |
Income from investment operations: | |
Net investment income | | | 0.21 | | | | 0.09 | | | | 0.25 | | | | 0.27 | | | | 0.25 | | | | 0.25 | | |
Net realized and unrealized gain (loss) | | | (0.14 | ) | | | 0.30 | | | | (0.03 | ) | | | 0.43 | | | | 0.41 | | | | (0.41 | ) | |
Total from investment operations | | | 0.07 | | | | 0.39 | | | | 0.22 | | | | 0.70 | | | | 0.66 | | | | (0.16 | ) | |
Less distributions to shareholders: | |
Net investment income | | | (0.20 | ) | | | (0.09 | ) | | | (0.27 | ) | | | (0.38 | ) | | | (0.22 | ) | | | (0.34 | ) | |
Net realized gains | | | (0.02 | ) | | | — | | | | — | | | | — | | | | — | | | | — | | |
Tax return of capital | | | — | | | | — | | | | — | | | | — | | | | — | | | | (0.01 | ) | |
Total distributions to shareholders | | | (0.22 | ) | | | (0.09 | ) | | | (0.27 | ) | | | (0.38 | ) | | | (0.22 | ) | | | (0.35 | ) | |
Net asset value, end of period | | $ | 6.26 | | | $ | 6.41 | | | $ | 6.11 | | | $ | 6.16 | | | $ | 5.84 | | | $ | 5.40 | | |
Total return | | | 1.09 | % | | | 6.39 | % | | | 3.65 | % | | | 12.37 | % | | | 12.30 | % | | | (2.52 | %) | |
Ratios to average net assets(b) | |
Total gross expenses | | | 1.78 | % | | | 1.77 | %(c) | | | 1.78 | % | | | 1.76 | % | | | 1.74 | % | | | 1.73 | % | |
Total net expenses(d) | | | 1.78 | %(e) | | | 1.77 | %(c)(e) | | | 1.77 | %(e) | | | 1.75 | %(e) | | | 1.74 | %(e) | | | 1.73 | %(e) | |
Net investment income | | | 3.32 | % | | | 3.37 | %(c) | | | 4.15 | % | | | 4.47 | % | | | 4.43 | % | | | 4.71 | % | |
Supplemental data | |
Net assets, end of period (in thousands) | | $ | 26,614 | | | $ | 49,873 | | | $ | 55,594 | | | $ | 61,684 | | | $ | 91,784 | | | $ | 122,915 | | |
Portfolio turnover | | | 113 | %(f) | | | 48 | %(f) | | | 83 | %(f) | | | 128 | % | | | 50 | % | | | 43 | % | |
Notes to Financial Highlights
(a) For the period from June 1, 2012 to October 31, 2012. During the period, the Fund's fiscal year end was changed from May 31 to October 31.
(b) In addition to the fees and expenses which the Fund bears directly, the Fund indirectly bears a pro rata share of the fees and expenses of the acquired funds in which it invests. Such indirect expenses are not included in the reported expense ratios.
(c) Annualized.
(d) Total net expenses include the impact of certain waivers/reimbursements made by the Investment Manager and certain of its affiliates, if applicable.
(e) The benefits derived from expense reductions had an impact of less than 0.01%.
(f) Includes mortgage dollar rolls. If mortgage dollar roll transactions were excluded, the portfolio turnover would have been 71%, 25% and 63% for the years ended October 31, 2013 and 2012, and year ended May 31, 2012, respectively.
The accompanying Notes to Financial Statements are an integral part of this statement.
Annual Report 2013
45
Columbia Strategic Income Fund
Financial Highlights (continued)
| | | Year Ended October 31, | | Year Ended May 31, | |
Class C | | 2013 | | 2012(a) | | 2012 | | 2011 | | 2010 | | 2009 | |
Per share data | |
Net asset value, beginning of period | | $ | 6.41 | | | $ | 6.11 | | | $ | 6.17 | | | $ | 5.84 | | | $ | 5.41 | | | $ | 5.91 | | |
Income from investment operations: | |
Net investment income | | | 0.22 | | | | 0.09 | | | | 0.26 | | | | 0.28 | | | | 0.26 | | | | 0.26 | | |
Net realized and unrealized gain (loss) | | | (0.13 | ) | | | 0.30 | | | | (0.04 | ) | | | 0.44 | | | | 0.40 | | | | (0.41 | ) | |
Total from investment operations | | | 0.09 | | | | 0.39 | | | | 0.22 | | | | 0.72 | | | | 0.66 | | | | (0.15 | ) | |
Less distributions to shareholders: | |
Net investment income | | | (0.21 | ) | | | (0.09 | ) | | | (0.28 | ) | | | (0.39 | ) | | | (0.23 | ) | | | (0.34 | ) | |
Net realized gains | | | (0.02 | ) | | | — | | | | — | | | | — | | | | — | | | | — | | |
Tax return of capital | | | — | | | | — | | | | — | | | | — | | | | — | | | | (0.01 | ) | |
Total distributions to shareholders | | | (0.23 | ) | | | (0.09 | ) | | | (0.28 | ) | | | (0.39 | ) | | | (0.23 | ) | | | (0.35 | ) | |
Net asset value, end of period | | $ | 6.27 | | | $ | 6.41 | | | $ | 6.11 | | | $ | 6.17 | | | $ | 5.84 | | | $ | 5.41 | | |
Total return | | | 1.40 | % | | | 6.45 | % | | | 3.64 | % | | | 12.72 | % | | | 12.26 | % | | | (2.21 | %) | |
Ratios to average net assets(b) | |
Total gross expenses | | | 1.78 | % | | | 1.77 | %(c) | | | 1.78 | % | | | 1.76 | % | | | 1.74 | % | | | 1.73 | % | |
Total net expenses(d) | | | 1.63 | %(e) | | | 1.62 | %(c)(e) | | | 1.62 | %(e) | | | 1.60 | %(e) | | | 1.59 | %(e) | | | 1.58 | %(e) | |
Net investment income | | | 3.50 | % | | | 3.51 | %(c) | | | 4.28 | % | | | 4.62 | % | | | 4.47 | % | | | 4.85 | % | |
Supplemental data | |
Net assets, end of period (in thousands) | | $ | 221,063 | | | $ | 263,736 | | | $ | 234,351 | | | $ | 185,859 | | | $ | 196,319 | | | $ | 157,492 | | |
Portfolio turnover | | | 113 | %(f) | | | 48 | %(f) | | | 83 | %(f) | | | 128 | % | | | 50 | % | | | 43 | % | |
Notes to Financial Highlights
(a) For the period from June 1, 2012 to October 31, 2012. During the period, the Fund's fiscal year end was changed from May 31 to October 31.
(b) In addition to the fees and expenses which the Fund bears directly, the Fund indirectly bears a pro rata share of the fees and expenses of the acquired funds in which it invests. Such indirect expenses are not included in the reported expense ratios.
(c) Annualized.
(d) Total net expenses include the impact of certain waivers/reimbursements made by the Investment Manager and certain of its affiliates, if applicable.
(e) The benefits derived from expense reductions had an impact of less than 0.01%.
(f) Includes mortgage dollar rolls. If mortgage dollar roll transactions were excluded, the portfolio turnover would have been 71%, 25% and 63% for the years ended October 31, 2013 and 2012, and year ended May 31, 2012, respectively.
The accompanying Notes to Financial Statements are an integral part of this statement.
Annual Report 2013
46
Columbia Strategic Income Fund
Financial Highlights (continued)
| | | Year Ended October 31, | | Year Ended May 31, | |
Class K | | 2013 | | 2012(a) | | 2012 | | 2011(b) | |
Per share data | |
Net asset value, beginning of period | | $ | 6.33 | | | $ | 6.04 | | | $ | 6.09 | | | $ | 6.01 | | |
Income from investment operations: | |
Net investment income | | | 0.26 | | | | 0.11 | | | | 0.30 | | | | 0.07 | | |
Net realized and unrealized gain (loss) | | | (0.14 | ) | | | 0.29 | | | | (0.03 | ) | | | 0.09 | | |
Total from investment operations | | | 0.12 | | | | 0.40 | | | | 0.27 | | | | 0.16 | | |
Less distributions to shareholders: | |
Net investment income | | | (0.25 | ) | | | (0.11 | ) | | | (0.32 | ) | | | (0.08 | ) | |
Net realized gains | | | (0.02 | ) | | | — | | | | — | | | | — | | |
Total distributions to shareholders | | | (0.27 | ) | | | (0.11 | ) | | | (0.32 | ) | | | (0.08 | ) | |
Net asset value, end of period | | $ | 6.18 | | | $ | 6.33 | | | $ | 6.04 | | | $ | 6.09 | | |
Total return | | | 1.99 | % | | | 6.68 | % | | | 4.59 | % | | | 2.62 | % | |
Ratios to average net assets(c) | |
Total gross expenses | | | 0.91 | % | | | 0.91 | %(d) | | | 0.90 | % | | | 0.89 | %(d) | |
Total net expenses(e) | | | 0.91 | % | | | 0.91 | %(d)(f) | | | 0.90 | %(f) | | | 0.89 | %(d)(f) | |
Net investment income | | | 4.22 | % | | | 4.22 | %(d) | | | 5.00 | % | | | 5.19 | %(d) | |
Supplemental data | |
Net assets, end of period (in thousands) | | $ | 172 | | | $ | 182 | | | $ | 219 | | | $ | 3 | | |
Portfolio turnover | | | 113 | %(g) | | | 48 | %(g) | | | 83 | %(g) | | | 128 | % | |
Notes to Financial Highlights
(a) For the period from June 1, 2012 to October 31, 2012. During the period, the Fund's fiscal year end was changed from May 31 to October 31.
(b) For the period from March 7, 2011 (commencement of operations) to May 31, 2011.
(c) In addition to the fees and expenses which the Fund bears directly, the Fund indirectly bears a pro rata share of the fees and expenses of the acquired funds in which it invests. Such indirect expenses are not included in the reported expense ratios.
(d) Annualized.
(e) Total net expenses include the impact of certain waivers/reimbursements made by the Investment Manager and certain of its affiliates, if applicable.
(f) The benefits derived from expense reductions had an impact of less than 0.01%.
(g) Includes mortgage dollar rolls. If mortgage dollar roll transactions were excluded, the portfolio turnover would have been 71%, 25% and 63% for the years ended October 31, 2013 and 2012, and year ended May 31, 2012, respectively.
The accompanying Notes to Financial Statements are an integral part of this statement.
Annual Report 2013
47
Columbia Strategic Income Fund
Financial Highlights (continued)
| | | Year Ended October 31, | | Year Ended May 31, | |
Class R | | 2013 | | 2012(a) | | 2012 | | 2011(b) | |
Per share data | |
Net asset value, beginning of period | | $ | 6.44 | | | $ | 6.14 | | | $ | 6.19 | | | $ | 6.16 | | |
Income from investment operations: | |
Net investment income | | | 0.25 | | | | 0.10 | | | | 0.27 | | | | 0.22 | | |
Net realized and unrealized gain (loss) | | | (0.14 | ) | | | 0.30 | | | | (0.02 | ) | | | 0.13 | | |
Total from investment operations | | | 0.11 | | | | 0.40 | | | | 0.25 | | | | 0.35 | | |
Less distributions to shareholders: | |
Net investment income | | | (0.23 | ) | | | (0.10 | ) | | | (0.30 | ) | | | (0.32 | ) | |
Net realized gains | | | (0.02 | ) | | | — | | | | — | | | | — | | |
Total distributions to shareholders | | | (0.25 | ) | | | (0.10 | ) | | | (0.30 | ) | | | (0.32 | ) | |
Net asset value, end of period | | $ | 6.30 | | | $ | 6.44 | | | $ | 6.14 | | | $ | 6.19 | | |
Total return | | | 1.74 | % | | | 6.58 | % | | | 4.20 | % | | | 5.86 | % | |
Ratios to average net assets(c) | |
Total gross expenses | | | 1.29 | % | | | 1.27 | %(d) | | | 1.29 | % | | | 1.36 | %(d) | |
Total net expenses(e) | | | 1.29 | %(f) | | | 1.27 | %(d)(f) | | | 1.27 | %(f) | | | 1.25 | %(d)(f) | |
Net investment income | | | 3.92 | % | | | 3.82 | %(d) | | | 4.44 | % | | | 5.31 | %(d) | |
Supplemental data | |
Net assets, end of period (in thousands) | | $ | 1,220 | | | $ | 218 | | | $ | 71 | | | $ | 3 | | |
Portfolio turnover | | | 113 | %(g) | | | 48 | %(g) | | | 83 | %(g) | | | 128 | % | |
Notes to Financial Highlights
(a) For the period from June 1, 2012 to October 31, 2012. During the period, the Fund's fiscal year end was changed from May 31 to October 31.
(b) For the period from September 27, 2010 (commencement of operations) to May 31, 2011.
(c) In addition to the fees and expenses which the Fund bears directly, the Fund indirectly bears a pro rata share of the fees and expenses of the acquired funds in which it invests. Such indirect expenses are not included in the reported expense ratios.
(d) Annualized.
(e) Total net expenses include the impact of certain waivers/reimbursements made by the Investment Manager and certain of its affiliates, if applicable.
(f) The benefits derived from expense reductions had an impact of less than 0.01%.
(g) Includes mortgage dollar rolls. If mortgage dollar roll transactions were excluded, the portfolio turnover would have been 71%, 25% and 63% for the years ended October 31, 2013 and 2012, and year ended May 31, 2012, respectively.
The accompanying Notes to Financial Statements are an integral part of this statement.
Annual Report 2013
48
Columbia Strategic Income Fund
Financial Highlights (continued)
Class R4 | | Year Ended
October 31,
2013(a) | |
Per share data | |
Net asset value, beginning of period | | $ | 6.34 | | |
Income from investment operations: | |
Net investment income | | | 0.27 | | |
Net realized and unrealized loss | | | (0.15 | ) | |
Total from investment operations | | | 0.12 | | |
Less distributions to shareholders: | |
Net investment income | | | (0.26 | ) | |
Net realized gains | | | (0.02 | ) | |
Total distributions to shareholders | | | (0.28 | ) | |
Net asset value, end of period | | $ | 6.18 | | |
Total return | | | 1.97 | % | |
Ratios to average net assets(b) | |
Total gross expenses | | | 0.80 | %(c) | |
Total net expenses(d) | | | 0.79 | %(c)(e) | |
Net investment income | | | 4.54 | %(c) | |
Supplemental data | |
Net assets, end of period (in thousands) | | $ | 3,389 | | |
Portfolio turnover | | | 113 | %(f) | |
Notes to Financial Highlights
(a) For the period from November 8, 2012 (commencement of operations) to October 31, 2013.
(b) In addition to the fees and expenses which the Fund bears directly, the Fund indirectly bears a pro rata share of the fees and expenses of the acquired funds in which it invests. Such indirect expenses are not included in the reported expense ratios.
(c) Annualized.
(d) Total net expenses include the impact of certain waivers/reimbursements made by the Investment Manager and certain of its affiliates, if applicable.
(e) The benefits derived from expense reductions had an impact of less than 0.01%.
(f) Includes mortgage dollar rolls. If mortgage dollar roll transactions were excluded, the portfolio turnover would have been 71% for the year ended October 31, 2013.
The accompanying Notes to Financial Statements are an integral part of this statement.
Annual Report 2013
49
Columbia Strategic Income Fund
Financial Highlights (continued)
| | | Year Ended October 31, | | Year Ended May 31, | |
Class R5 | | 2013 | | 2012(a) | | 2012 | | 2011(b) | |
Per share data | |
Net asset value, beginning of period | | $ | 6.33 | | | $ | 6.04 | | | $ | 6.09 | | | $ | 6.01 | | |
Income from investment operations: | |
Net investment income | | | 0.29 | | | | 0.12 | | | | 0.32 | | | | 0.08 | | |
Net realized and unrealized gain (loss) | | | (0.14 | ) | | | 0.29 | | | | (0.03 | ) | | | 0.08 | | |
Total from investment operations | | | 0.15 | | | | 0.41 | | | | 0.29 | | | | 0.16 | | |
Less distributions to shareholders: | |
Net investment income | | | (0.27 | ) | | | (0.12 | ) | | | (0.34 | ) | | | (0.08 | ) | |
Net realized gains | | | (0.02 | ) | | | — | | | | — | | | | — | | |
Total distributions to shareholders | | | (0.29 | ) | | | (0.12 | ) | | | (0.34 | ) | | | (0.08 | ) | |
Net asset value, end of period | | $ | 6.19 | | | $ | 6.33 | | | $ | 6.04 | | | $ | 6.09 | | |
Total return | | | 2.39 | % | | | 6.79 | % | | | 4.86 | % | | | 2.68 | % | |
Ratios to average net assets(c) | |
Total gross expenses | | | 0.69 | % | | | 0.66 | %(d) | | | 0.65 | % | | | 0.63 | %(d) | |
Total net expenses(e) | | | 0.69 | % | | | 0.66 | %(d)(f) | | | 0.65 | %(f) | | | 0.63 | %(d)(f) | |
Net investment income | | | 4.73 | % | | | 4.50 | %(d) | | | 5.26 | % | | | 5.45 | %(d) | |
Supplemental data | |
Net assets, end of period (in thousands) | | $ | 1,563 | | | $ | 8 | | | $ | 277 | | | $ | 3 | | |
Portfolio turnover | | | 113 | %(g) | | | 48 | %(g) | | | 83 | %(g) | | | 128 | % | |
Notes to Financial Highlights
(a) For the period from June 1, 2012 to October 31, 2012. During the period, the Fund's fiscal year end was changed from May 31 to October 31.
(b) For the period from March 7, 2011 (commencement of operations) to May 31, 2011.
(c) In addition to the fees and expenses which the Fund bears directly, the Fund indirectly bears a pro rata share of the fees and expenses of the acquired funds in which it invests. Such indirect expenses are not included in the reported expense ratios.
(d) Annualized.
(e) Total net expenses include the impact of certain waivers/reimbursements made by the Investment Manager and certain of its affiliates, if applicable.
(f) The benefits derived from expense reductions had an impact of less than 0.01%.
(g) Includes mortgage dollar rolls. If mortgage dollar roll transactions were excluded, the portfolio turnover would have been 71%, 25% and 63% for the years ended October 31, 2013 and 2012, and year ended May 31, 2012, respectively.
The accompanying Notes to Financial Statements are an integral part of this statement.
Annual Report 2013
50
Columbia Strategic Income Fund
Financial Highlights (continued)
| | | Year Ended October 31, | | Year Ended May 31, | |
Class W | | 2013 | | 2012(a) | | 2012 | | 2011(b) | |
Per share data | |
Net asset value, beginning of period | | $ | 6.41 | | | $ | 6.10 | | | $ | 6.16 | | | $ | 6.16 | | |
Income from investment operations: | |
Net investment income | | | 0.27 | | | | 0.11 | | | | 0.30 | | | | 0.21 | | |
Net realized and unrealized gain (loss) | | | (0.15 | ) | | | 0.31 | | | | (0.04 | ) | | | 0.12 | | |
Total from investment operations | | | 0.12 | | | | 0.42 | | | | 0.26 | | | | 0.33 | | |
Less distributions to shareholders: | |
Net investment income | | | (0.25 | ) | | | (0.11 | ) | | | (0.32 | ) | | | (0.33 | ) | |
Net realized gains | | | (0.02 | ) | | | — | | | | — | | | | — | | |
Total distributions to shareholders | | | (0.27 | ) | | | (0.11 | ) | | | (0.32 | ) | | | (0.33 | ) | |
Net asset value, end of period | | $ | 6.26 | | | $ | 6.41 | | | $ | 6.10 | | | $ | 6.16 | | |
Total return | | | 1.91 | % | | | 6.90 | % | | | 4.34 | % | | | 5.53 | % | |
Ratios to average net assets(c) | |
Total gross expenses | | | 0.97 | % | | | 1.00 | %(d) | | | 1.03 | % | | | 0.89 | %(d) | |
Total net expenses(e) | | | 0.97 | %(f) | | | 1.00 | %(d)(f) | | | 1.02 | %(f) | | | 0.89 | %(d)(f) | |
Net investment income | | | 4.21 | % | | | 4.19 | %(d) | | | 4.89 | % | | | 5.10 | %(d) | |
Supplemental data | |
Net assets, end of period (in thousands) | | $ | 3 | | | $ | 3 | | | $ | 2 | | | $ | 3 | | |
Portfolio turnover | | | 113 | %(g) | | | 48 | %(g) | | | 83 | %(g) | | | 128 | % | |
Notes to Financial Highlights
(a) For the period from June 1, 2012 to October 31, 2012. During the period, the Fund's fiscal year end was changed from May 31 to October 31.
(b) For the period from September 27, 2010 (commencement of operations) to May 31, 2011.
(c) In addition to the fees and expenses which the Fund bears directly, the Fund indirectly bears a pro rata share of the fees and expenses of the acquired funds in which it invests. Such indirect expenses are not included in the reported expense ratios.
(d) Annualized.
(e) Total net expenses include the impact of certain waivers/reimbursements made by the Investment Manager and certain of its affiliates, if applicable.
(f) The benefits derived from expense reductions had an impact of less than 0.01%.
(g) Includes mortgage dollar rolls. If mortgage dollar roll transactions were excluded, the portfolio turnover would have been 71%, 25% and 63% for the years ended October 31, 2013 and 2012, and year ended May 31, 2012, respectively.
The accompanying Notes to Financial Statements are an integral part of this statement.
Annual Report 2013
51
Columbia Strategic Income Fund
Financial Highlights (continued)
Class Y | | Year Ended
October 31,
2013(a) | |
Per share data | |
Net asset value, beginning of period | | $ | 6.18 | | |
Income from investment operations: | |
Net investment income | | | 0.11 | | |
Net realized and unrealized loss | | | (0.02 | ) | |
Total from investment operations | | | 0.09 | | |
Less distributions to shareholders: | |
Net investment income | | | (0.10 | ) | |
Total distributions to shareholders | | | (0.10 | ) | |
Net asset value, end of period | | $ | 6.17 | | |
Total return | | | 1.57 | % | |
Ratios to average net assets(b) | |
Total gross expenses | | | 0.64 | %(c) | |
Total net expenses(d) | | | 0.64 | %(c) | |
Net investment income | | | 4.94 | %(c) | |
Supplemental data | |
Net assets, end of period (in thousands) | | $ | 19 | | |
Portfolio turnover | | | 113 | %(e) | |
Notes to Financial Highlights
(a) For the period from June 13, 2013 (commencement of operations) to October 31, 2013.
(b) In addition to the fees and expenses which the Fund bears directly, the Fund indirectly bears a pro rata share of the fees and expenses of the acquired funds in which it invests. Such indirect expenses are not included in the reported expense ratios.
(c) Annualized.
(d) Total net expenses include the impact of certain waivers/reimbursements made by the Investment Manager and certain of its affiliates, if applicable.
(e) Includes mortgage dollar rolls. If mortgage dollar roll transactions were excluded, the portfolio turnover would have been 71% for the year ended October 31, 2013.
The accompanying Notes to Financial Statements are an integral part of this statement.
Annual Report 2013
52
Columbia Strategic Income Fund
Financial Highlights (continued)
| | | Year Ended October 31, | | Year Ended May 31, | |
Class Z | | 2013 | | 2012(a) | | 2012 | | 2011 | | 2010 | | 2009 | |
Per share data | |
Net asset value, beginning of period | | $ | 6.33 | | | $ | 6.04 | | | $ | 6.09 | | | $ | 5.78 | | | $ | 5.35 | | | $ | 5.85 | | |
Income from investment operations: | |
Net investment income | | | 0.27 | | | | 0.11 | | | | 0.31 | | | | 0.33 | | | | 0.31 | | | | 0.30 | | |
Net realized and unrealized gain (loss) | | | (0.14 | ) | | | 0.29 | | | | (0.03 | ) | | | 0.42 | | | | 0.39 | | | | (0.40 | ) | |
Total from investment operations | | | 0.13 | | | | 0.40 | | | | 0.28 | | | | 0.75 | | | | 0.70 | | | | (0.10 | ) | |
Less distributions to shareholders: | |
Net investment income | | | (0.26 | ) | | | (0.11 | ) | | | (0.33 | ) | | | (0.44 | ) | | | (0.27 | ) | | | (0.39 | ) | |
Net realized gains | | | (0.02 | ) | | | — | | | | — | | | | — | | | | — | | | | — | | |
Tax return of capital | | | — | | | | — | | | | — | | | | — | | | | — | | | | (0.01 | ) | |
Total distributions to shareholders | | | (0.28 | ) | | | (0.11 | ) | | | (0.33 | ) | | | (0.44 | ) | | | (0.27 | ) | | | (0.40 | ) | |
Net asset value, end of period | | $ | 6.18 | | | $ | 6.33 | | | $ | 6.04 | | | $ | 6.09 | | | $ | 5.78 | | | $ | 5.35 | | |
Total return | | | 2.13 | % | | | 6.74 | % | | | 4.75 | % | | | 13.46 | % | | | 13.36 | % | | | (1.38 | %) | |
Ratios to average net assets(b) | |
Total gross expenses | | | 0.78 | % | | | 0.77 | %(c) | | | 0.78 | % | | | 0.76 | % | | | 0.74 | % | | | 0.73 | % | |
Total net expenses(d) | | | 0.78 | %(e) | | | 0.77 | %(c)(e) | | | 0.77 | %(e) | | | 0.75 | %(e) | | | 0.74 | %(e) | | | 0.73 | %(e) | |
Net investment income | | | 4.34 | % | | | 4.37 | %(c) | | | 5.13 | % | | | 5.47 | % | | | 5.35 | % | | | 5.71 | % | |
Supplemental data | |
Net assets, end of period (in thousands) | | $ | 755,920 | | | $ | 985,278 | | | $ | 812,836 | | | $ | 660,970 | | | $ | 714,358 | | | $ | 704,118 | | |
Portfolio turnover | | | 113 | %(f) | | | 48 | %(f) | | | 83 | %(f) | | | 128 | % | | | 50 | % | | | 43 | % | |
Notes to Financial Highlights
(a) For the period from June 1, 2012 to October 31, 2012. During the period, the Fund's fiscal year end was changed from May 31 to October 31.
(b) In addition to the fees and expenses which the Fund bears directly, the Fund indirectly bears a pro rata share of the fees and expenses of the acquired funds in which it invests. Such indirect expenses are not included in the reported expense ratios.
(c) Annualized.
(d) Total net expenses include the impact of certain waivers/reimbursements made by the Investment Manager and certain of its affiliates, if applicable.
(e) The benefits derived from expense reductions had an impact of less than 0.01%.
(f) Includes mortgage dollar rolls. If mortgage dollar roll transactions were excluded, the portfolio turnover would have been 71%, 25% and 63% for the years ended October 31, 2013 and 2012, and year ended May 31, 2012, respectively.
The accompanying Notes to Financial Statements are an integral part of this statement.
Annual Report 2013
53
Columbia Strategic Income Fund
Notes to Financial Statements
October 31, 2013
Note 1. Organization
Columbia Strategic Income Fund (the Fund), a series of Columbia Funds Series Trust I (the Trust), is a diversified fund. The Trust is registered under the Investment Company Act of 1940, as amended (the 1940 Act), as an open-end management investment company organized as a Massachusetts business trust.
Fund Shares
The Trust may issue an unlimited number of shares (without par value). The Fund offers Class A, Class B, Class C, Class K, Class R, Class R4, Class R5, Class W, Class Y and Class Z shares. Although all share classes generally have identical voting, dividend and liquidation rights, each share class votes separately when required by law. Different share classes pay different distribution amounts to the extent the expenses of such share classes differ, and distributions in liquidation will be proportional to the net asset value of each share class. Each share class has its own expense structure and sales charges, as applicable.
Class A shares are subject to a maximum front-end sales charge of 4.75% based on the initial investment amount. Class A shares purchased without an initial sales charge in accounts aggregating $1 million to $50 million at the time of purchase are subject to a contingent deferred sales charge (CDSC) if the shares are sold within 18 months of purchase, charged as follows: 1.00% CDSC if redeemed within 12 months of purchase, and 0.50% CDSC if redeemed more than 12, but less than 18, months after purchase.
Class B shares may be subject to a maximum CDSC of 5.00% based upon the holding period after purchase. Class B shares will generally convert to Class A shares eight years after purchase. The Fund no longer accepts investments by new or existing investors in the Fund's Class B shares, except in connection with the reinvestment of any dividend and/or capital gain distributions in Class B shares of the Fund and exchanges by existing Class B shareholders of certain other funds within the Columbia Family of Funds.
Class C shares are subject to a 1.00% CDSC on shares redeemed within one year of purchase.
Class K shares are not subject to sales charges, however this share class is closed to new investors.
Class R shares are not subject to sales charges and are generally available only to certain retirement plans and other eligible investors.
Class R4 shares are not subject to sales charges and are generally available only to omnibus retirement plans and certain other eligible investors. Class R4 shares commenced operations on November 8, 2012.
Class R5 shares are not subject to sales charges. Effective November 8, 2012, Class R5 shares are generally available only to investors purchasing through authorized investment professionals and omnibus retirement plans. Prior to November 8, 2012, Class R5 shares were closed to new investors.
Class W shares are not subject to sales charges and are available only to investors purchasing through authorized investment programs managed by investment professionals, including discretionary managed account programs.
Class Y shares are not subject to sales charges and are generally available only to certain retirement plans. Class Y shares commenced operations on June 13, 2013.
Class Z shares are not subject to sales charges and are available only to certain eligible investors, which are subject to different investment minimums.
Note 2. Summary of Significant Accounting Policies
Use of Estimates
The preparation of financial statements in accordance with U.S. generally accepted accounting principles (GAAP) requires management to make certain estimates and assumptions that affect the reported amounts of assets and liabilities, the disclosure of contingent assets and liabilities at the date of the financial statements and the reported amounts of revenue and expenses during the reporting period. Actual results could differ from those estimates.
The following is a summary of significant accounting policies consistently followed by the Fund in the preparation of its financial statements.
Security Valuation
Debt securities generally are valued by pricing services approved by the Board of Trustees (the Board) based upon market transactions for normal, institutional-size trading units of similar securities. The services may use various pricing techniques which take into account appropriate factors such as yield, quality, coupon rate, maturity, type of issue, trading characteristics and other data, as well as broker quotes. Debt securities for which quotations are readily available may also be valued based upon an over-the-counter or exchange bid quotation.
All equity securities are valued at the close of business of the New York Stock Exchange (NYSE). Equity securities are valued at the last quoted sales price on the principal exchange or market on which they trade, except for securities traded on the NASDAQ Stock Market, which are valued at the NASDAQ official close price. Unlisted securities or listed securities for
Annual Report 2013
54
Columbia Strategic Income Fund
Notes to Financial Statements (continued)
October 31, 2013
which there were no sales during the day are valued at the mean of the latest quoted bid and ask prices on such exchanges or markets.
Asset and mortgage-backed securities are generally valued by pricing services, which utilize pricing models that incorporate the securities' cash flow and loan performance data. These models also take into account available market data, including trades, market quotations, and benchmark yield curves for identical or similar securities. Factors used to identify similar securities may include, but are not limited to, issuer, collateral type, vintage, prepayment speeds, collateral performance, credit ratings, credit enhancement and expected life. Asset-backed securities for which quotations are readily available may also be valued based upon an over-the-counter or exchange bid quotation.
Foreign equity securities are valued based on quotations from the principal market in which such securities are normally traded. If any foreign share prices are not readily available as a result of limited share activity the securities are valued at the mean of the latest quoted bid and ask prices on such exchanges or markets. Foreign currency exchange rates are generally determined at 4:00 p.m. Eastern (U.S.) time. However, many securities markets and exchanges outside the U.S. close prior to the close of the NYSE; therefore, the closing prices for securities in such markets or on such exchanges may not fully reflect events that occur after such close but before the close of the NYSE. In those situations, foreign securities will be fair valued pursuant to the policy adopted by the Board, including utilizing a third party pricing service to determine these fair values. The third party pricing service takes into account multiple factors, including, but not limited to, movements in the U.S. securities markets, certain depositary receipts, futures contracts and foreign exchange rates that have occurred subsequent to the close of the foreign exchange or market, to determine a good faith estimate that reasonably reflects the current market conditions as of the close of the NYSE. The fair value of a security is likely to be different from the quoted or published price, if available.
Investments in open-end investment companies, including money market funds, are valued at net asset value.
Short-term securities purchased within 60 days to maturity are valued at amortized cost, which approximates market value. The value of short-term securities originally purchased with maturities greater than 60 days is determined based on an amortized value to par upon reaching 60 days to maturity. Short-term securities maturing in more than 60 days from the valuation date are valued at the market price or approximate market value based on current interest rates.
Forward foreign currency exchange contracts are marked-to-market based upon foreign currency exchange rates provided by a pricing service.
Futures and options on futures contracts are valued based upon the settlement price established each day by the board of trade or exchange on which they are traded.
Option contracts are valued at the mean of the latest quoted bid and asked prices on their primary exchanges. Option contracts, including over-the-counter option contracts, with no readily available market value are valued using quotations obtained from independent brokers as of the close of the NYSE.
Swap transactions are valued through an independent pricing service or broker, or if neither is available, through an internal model based upon observable inputs.
Investments for which market quotations are not readily available, or that have quotations which management believes are not reliable, are valued at fair value as determined in good faith under consistently applied procedures established by and under the general supervision of the Board. If a security or class of securities (such as foreign securities) is valued at fair value, such value is likely to be different from the last quoted market price for the security.
The determination of fair value often requires significant judgment. To determine fair value, management may use assumptions including but not limited to future cash flows and estimated risk premiums. Multiple inputs from various sources may be used to determine fair value.
Foreign Currency Transactions and Translations
The values of all assets and liabilities denominated in foreign currencies are translated into U.S. dollars at that day's exchange rates. Net realized and unrealized gains (losses) on foreign currency transactions and translations include gains (losses) arising from the fluctuation in exchange rates between trade and settlement dates on securities transactions, gains (losses) arising from the disposition of foreign currency and currency gains (losses) between the accrual and payment dates on dividends, interest income and foreign withholding taxes.
For financial statement purposes, the Fund does not distinguish that portion of gains (losses) on investments which is due to changes in foreign exchange rates from that which is due to changes in market prices of the investments. Such fluctuations are included with the net realized and unrealized gains (losses) on investments in the Statement of Operations.
Derivative Instruments
The Fund invests in certain derivative instruments, as detailed below, to meet its investment objectives. Derivatives are instruments whose values depend on, or are derived from, in
Annual Report 2013
55
Columbia Strategic Income Fund
Notes to Financial Statements (continued)
October 31, 2013
whole or in part, the value of one or more other assets, such as securities, currencies, commodities or indices. Derivative instruments may be used to maintain cash reserves while maintaining exposure to certain other assets, to offset anticipated declines in values of investments, to facilitate trading, to reduce transaction costs and to pursue higher investment returns. The Fund may also use derivative instruments to mitigate certain investment risks, such as foreign currency exchange rate risk, interest rate risk and credit risk. Derivatives may involve various risks, including the potential inability of the counterparty to fulfill its obligation under the terms of the contract, the potential for an illiquid secondary market (making it difficult for the Fund to sell, including at favorable prices) and the potential for market movements which may expose the Fund to gains or losses in excess of the amount shown in the Statement of Assets and Liabilities. The notional amounts of derivative instruments, if applicable, are not recorded in the financial statements.
A derivative instrument may suffer a mark to market loss if the value of the contract decreases due to an unfavorable change in the market rates or values of the underlying instrument. Losses can also occur if the counterparty does not perform under the contract. A Fund's risk of loss from counterparty credit risk on over-the-counter derivatives is generally limited to the aggregate unrealized gain netted against any collateral held by the Fund and the amount of any initial margin held by the counterparty. With exchange traded or centrally cleared derivatives, there is minimal counterparty credit risk to the Fund since the exchange's clearinghouse, as counterparty to such instruments, guarantees against a possible default. The clearinghouse stands between the buyer and the seller of the contract; therefore, the counterparty credit risk is limited to failure of the clearinghouse. However, credit risk still exists in exchange traded or centrally cleared derivatives with respect to initial and variation margin that is held in a broker's customer accounts. While brokers are required to segregate customer margin from their own assets, in the event that a broker becomes insolvent or goes into bankruptcy and at that time there is a shortfall in the aggregate amount of margin held by the broker for all its clients, U.S. bankruptcy laws will typically allocate that shortfall on a pro-rata basis across all the broker's customers, potentially resulting in losses to the Fund.
In order to better define its contractual rights and to secure rights that will help the Fund mitigate its counterparty risk, the Fund may enter into an International Swaps and Derivatives Association, Inc. Master Agreement (ISDA Master Agreement) or similar agreement with its derivative contract counterparties. An ISDA Master Agreement is an agreement between a Fund and a counterparty that governs over-the-counter derivatives and forward foreign currency exchange contracts and typically
contains, among other things, collateral posting terms and netting provisions in the event of a default and/or termination event. Under an ISDA Master Agreement, the Fund may, under certain circumstances, offset with the counterparty certain derivative instrument's payables and/or receivables with collateral held and/or posted and create one single net payment. The provisions of the ISDA Master Agreement typically permit a single net payment in the event of default (close-out netting) including the bankruptcy or insolvency of the counterparty. Note, however, that bankruptcy or insolvency laws of a particular jurisdiction may impose restrictions on or prohibitions against the right of offset in bankruptcy, insolvency or other events.
Collateral (margin) requirements differ by type of derivative. Margin requirements are established by the exchange or clearinghouse for exchange traded and centrally cleared derivatives. Brokers can ask for margin in excess of the minimum in certain circumstances. Collateral terms are contract specific for over-the-counter derivatives. For over-the-counter derivatives traded under an ISDA Master Agreement, the collateral requirements are typically calculated by netting the mark to market amount for each transaction under such agreement and comparing that amount to the value of any variation margin currently pledged by the Fund and/or the counterparty. Generally, the amount of collateral due from or to a party has to exceed a minimum transfer amount threshold (e.g. $500,000) before a transfer has to be made. To the extent amounts due to the Fund from its counterparties are not fully collateralized, contractually or otherwise, the Fund bears the risk of loss from counterparty nonperformance. The Fund attempts to mitigate counterparty risk by only entering into agreements with counterparties that it believes have the financial resources to honor their obligations and by monitoring the financial stability of those counterparties.
Certain ISDA Master Agreements allow counterparties to over-the-counter derivatives to terminate derivative contracts prior to maturity in the event the Fund's net assets decline by a stated percentage over a specified time period or the Fund fails to meet the terms of the ISDA Master Agreement, which would cause the Fund to accelerate payment of any net liability owed to the counterparty. The Fund also has termination rights if the counterparty fails to meet the terms of the ISDA Master Agreement. In addition to considering counterparty credit risk, the Fund would consider terminating the derivative contracts based on whether termination would result in a net liability owed from the counterparty.
For financial reporting purposes, the Fund does not offset derivative assets and derivative liabilities that are subject to netting arrangements in the Statement of Assets and Liabilities.
Annual Report 2013
56
Columbia Strategic Income Fund
Notes to Financial Statements (continued)
October 31, 2013
Forward Foreign Currency Exchange Contracts
Forward foreign currency exchange contracts are over-the-counter agreements between two parties to buy and sell a currency at a set price on a future date. These contracts are typically intended to be used to minimize the exposure to foreign exchange rate fluctuations during the period between the trade and settlement dates of the contract. The Fund utilized forward foreign currency exchange contracts to hedge the currency exposure associated with some or all of the Fund's securities, to shift foreign currency exposure back to U.S. dollars and to shift investment exposure from one currency to another. These instruments may be used for other purposes in future periods.
The values of forward foreign currency exchange contracts fluctuate with changes in foreign currency exchange rates. The Fund will record a realized gain or loss when the forward foreign currency exchange contract expires or is closed.
The use of forward foreign currency exchange contracts does not eliminate fluctuations in the prices of the Fund's portfolio securities. The risks of forward foreign currency exchange contracts include movement in the values of the foreign currencies relative to the U.S. dollar (or other foreign currencies) and the possibility that counterparties will not complete their contractual obligations, which may be in excess of the amount reflected, if any, in the Statement of Assets and Liabilities.
Futures Contracts
Futures contracts are exchange traded and represent commitments for the future purchase or sale of an asset at a specified price on a specified date. The Fund bought and sold futures contracts to manage the duration and yield curve exposure of the Fund versus the benchmark. These instruments may be used for other purposes in future periods. Upon entering into futures contracts, the Fund bears risks that it may not achieve the anticipated benefits of the futures contracts and may realize a loss. Additional risks include counterparty credit risk, the possibility of an illiquid market, and that a change in the value of the contract or option may not correlate with changes in the value of the underlying asset.
Upon entering into a futures contract, the Fund pledges cash or securities with the broker in an amount sufficient to meet the initial margin requirement. The initial margin deposit must be maintained at an established level over the life of the contract. Cash deposited as initial margin is recorded in the Statement of Assets and Liabilities as margin deposits. Securities deposited as initial margin are designated in the Portfolio of Investments. Subsequent payments (variation margin) are made or received by the Fund each day. The
variation margin payments are equal to the daily change in the contract value and are recorded as variation margin receivable or payable and are offset in unrealized gains or losses. The Fund recognizes a realized gain or loss when the contract is closed or expires. Futures contracts involve, to varying degrees, risk of loss in excess of the variation margin disclosed in the Statement of Assets and Liabilities.
Options Contracts
Options are contracts which entitle the holder to purchase or sell securities or other identified assets at a specified price, or in the case of index option contracts, to receive or pay the difference between the index value and the strike price of the index option contract. Option contracts can be either exchange traded or over-the-counter. The Fund purchased and wrote option contracts to manage the duration and yield curve exposure of the fund. These instruments may be used for other purposes in future periods. Completion of transactions for option contracts traded in the over-the-counter market depends upon the performance of the other party. Cash collateral may be collected or posted by the Fund to secure certain over-the-counter option contract trades. Cash collateral held or posted by the Fund for such option contract trades must be returned to the counterparty or the Fund upon closure, exercise or expiration of the contract.
Options contracts purchased are recorded as investments. When the Fund writes an options contract, the premium received is recorded as an asset and an amount equivalent to the premium is recorded as a liability in the Statement of Assets and Liabilities and is subsequently adjusted to reflect the current fair value of the option written. The Fund will realize a gain or loss when the option contract is closed or expires. When option contracts are exercised, the proceeds on sales for a written call or purchased put option contract, or the purchase cost for a written put or purchased call option contract, is adjusted by the amount of premium received or paid.
For over-the-counter options purchased, the Fund bears the risk of loss of the amount of the premiums paid plus the positive change in market values net of any collateral held by the Fund should the counterparty fail to perform under the contracts. The Fund also has the additional risk of being unable to enter into a closing transaction if a liquid secondary market does not exist. The risk in writing a call option contract is that the Fund gives up the opportunity for profit if the market price of the security increases above the strike price. The risk in writing a put option contract is that the Fund may incur a loss if the market price of the security decreases below the strike price and the option contract is exercised. The Fund's maximum payout in the case of written put option
Annual Report 2013
57
Columbia Strategic Income Fund
Notes to Financial Statements (continued)
October 31, 2013
contracts represents the maximum potential amount of future payments (undiscounted) that the Fund could be required to make under the contract. For over-the-counter options contracts, the transaction is also subject to counterparty credit risk. Option contracts written by the Fund do not typically give rise to counterparty credit risk, as options written generally obligate the Fund and not the counterparty to perform. The maximum payout amount may be offset by the subsequent sale, if any, of assets obtained upon the exercise of the put option contracts by holders of the option contracts or proceeds received upon entering into the contracts.
Credit Default Swap Contracts
The Fund entered into credit default swap contracts to increase or decrease its credit exposure to a single issuer of debt securities. Credit default swap contracts are agreements in which one party pays fixed periodic payments to a counterparty in consideration for a guarantee from the counterparty to make a specific payment should a specified credit event(s) take place. Although specified events are contract specific, credit events are generally defined as bankruptcy, failure to pay, restructuring, obligation acceleration, obligation default, or repudiation/moratorium.
As the purchaser of a credit default swap contract, the Fund purchases protection by paying a periodic interest rate on the notional amount to the counterparty. The interest amount is accrued daily as a component of unrealized appreciation (depreciation) and is recorded as a realized loss upon payment. If a credit event as specified in the contract occurs, the Fund may have the option either to deliver the reference obligation to the seller in exchange for a cash payment of its par amount, or to receive a net cash settlement equal to the par amount less an agreed-upon value of the reference obligation as of the date of the credit event. Credit events are contact specific but may include bankruptcy, failure to pay, restructuring and obligation acceleration. The difference between the value of the obligation or cash delivered and the notional amount received will be recorded as a realized gain (loss).
Effects of Derivative Transactions in the Financial Statements
The following tables are intended to provide additional information about the effect of derivatives on the financial statements of the Fund, including: the fair value of derivatives by risk category and the location of those fair values in the Statement of Assets and Liabilities; the impact of derivative transactions over the period in the Statement of Operations including realized gains or losses and unrealized gains or losses. The derivative schedules following the Portfolio of Investments present additional information regarding derivative instruments outstanding at the end of the period, if any.
The following table is a summary of the fair value of derivative instruments at October 31, 2013:
Asset Derivatives | |
Risk Exposure
Category | | Statement of Assets and
Liabilities Location | | Fair Value ($) | |
Foreign exchange
risk | | Unrealized appreciation on
forward foreign currency
exchange contracts | | | 1,604,848
| | |
Interest rate
risk | | Net assets — unrealized
appreciation on futures
contracts | | | 6,108,347
| * | |
Interest rate
risk | | Investments at value —
unaffiliated issuers
(for purchased options) | | | 599,219
| | |
Total | | | | | 8,312,414 | | |
Liability Derivatives | |
Risk Exposure
Category | | Statement of Assets and
Liabilities Location | |
Fair Value ($) | |
Foreign exchange
risk
| | Unrealized depreciation on
forward foreign currency
exchange contracts | | | 347,159
| | |
Interest rate
risk
| | Net assets — unrealized
depreciation on futures
contracts | | | 9,837,177
| * | |
Total | | | | | 10,184,336 | | |
*Includes cumulative appreciation (depreciation) of futures contracts as reported in the Futures Contracts Outstanding table following the Portfolio of Investments. Only the current day's variation margin is reported in receivables or payables in the Statement of Assets and Liabilities.
The following table indicates the effect of derivative instruments in the Statement of Operations for the year ended October 31, 2013:
Amount of Realized Gain (Loss) on Derivatives Recognized in Income | |
| Risk Exposure Category | | Forward Foreign
Currency Exchange
Contracts ($) | | Futures
Contracts ($) | | Options Contracts
Written and
Purchased ($) | | Swap
Contracts ($) | | Total ($) | |
Credit risk | | | — | | | | — | | | | — | | | | (227,466 | ) | | | (227,466 | ) | |
Foreign exchange risk | | | (12,882,242 | ) | | | — | | | | — | | | | — | | | | (12,882,242 | ) | |
Interest rate risk | | | — | | | | 12,750,838 | | | | (1,132,135 | ) | | | — | | | | 11,618,703 | | |
Total | | | (12,882,242 | ) | | | 12,750,838 | | | | (1,132,135 | ) | | | (227,466 | ) | | | (1,491,005 | ) | |
Annual Report 2013
58
Columbia Strategic Income Fund
Notes to Financial Statements (continued)
October 31, 2013
Change in Unrealized Appreciation (Depreciation) on Derivatives Recognized in Income | |
| Risk Exposure Category | | Forward Foreign
Currency Exchange
Contracts ($) | | Futures
Contracts ($) | | Options Contracts
Written and
Purchased ($) | | Swap
Contracts ($) | | Total ($) | |
Credit risk | | | — | | | | — | | | | — | | | | 195,078 | | | | 195,078 | | |
Foreign exchange risk | | | 1,502,158 | | | | — | | | | — | | | | — | | | | 1,502,158 | | |
Interest rate risk | | | — | | | | (2,916,514 | ) | | | (53,026 | ) | | | — | | | | (2,969,540 | ) | |
Total | | | 1,502,158 | | | | (2,916,514 | ) | | | (53,026 | ) | | | 195,078 | | | | (1,272,304 | ) | |
The following table is a summary of the volume of derivative instruments for the year ended October 31, 2013:
Derivative Instrument | | Contracts Opened | |
Forward foreign currency exchange contracts | | | 568 | | |
Futures contracts | | | 45,118 | | |
Options contracts | | | 6,250 | | |
Delayed Delivery Securities
The Fund may trade securities on other than normal settlement terms, including securities purchased or sold on a "when-issued" basis. This may increase risk since the other party to the transaction may fail to deliver which could cause the Fund to subsequently invest at less advantageous prices. The Fund designates cash or liquid securities in an amount equal to the delayed delivery commitment.
Mortgage Dollar Roll Transactions
The Fund may enter into mortgage "dollar rolls" in which the Fund sells securities for delivery in the current month and simultaneously contracts with the same counterparty to repurchase similar but not identical securities (same type, coupon and maturity) on a specified future date. During the roll period, the Fund loses the right to receive principal and interest paid on the securities sold. However, the Fund will benefit because it receives negotiated amounts in the form of reductions of the purchase price for the future purchase plus the interest earned on the cash proceeds of the securities sold until the settlement date of the forward purchase. The Fund records the incremental difference between the forward purchase and sale of each forward roll as a realized gain or loss. Unless any realized gains exceed the income, capital appreciation, and gain or loss due to mortgage prepayments that would have been realized on the securities sold as part of the mortgage dollar roll, the use of this technique will diminish the investment performance of the Fund compared to what the performance would have been without the use of mortgage dollar rolls. All cash proceeds will be invested in instruments that are permissible investments for the Fund. The Fund identifies cash or liquid securities in an amount equal to the forward purchase price.
For financial reporting and tax purposes, the Fund treats "to be announced" mortgage dollar rolls as two separate transactions, one involving the purchase of a security and a separate transaction involving a sale. These transactions may increase the Fund's portfolio turnover rate. The Fund does not currently enter into mortgage dollar rolls that are accounted for as financing transactions.
Mortgage dollar rolls involve the risk that the market value of the securities the Fund is obligated to repurchase may decline below the repurchase price, or that the counterparty may default on its obligations.
Treasury Inflation Protected Securities
The Fund may invest in treasury inflation protected securities (TIPS). The principal amount of TIPS is adjusted periodically and is increased for inflation or decreased for deflation based on a monthly published index. Interest payments are based on the adjusted principal at the time the interest is paid. These adjustments are recorded as interest income in the Statement of Operations.
Investments in Loans
The Fund may invest in loan participations and assignments of all or a portion of a loan. When the Fund purchases loan participation, the Fund typically enters into a contractual relationship with the lender or third party selling such participations (Selling Participant), but not the borrower, and assumes the credit risk of the borrower, Selling Participant and any other persons interpositioned between the Fund and the borrower. In addition, the Fund may not directly benefit from the collateral supporting the loan that it has purchased from the Selling Participant. In contrast, when the Fund purchases an assignment of a loan, the Fund typically has direct rights against the borrower; provided, however, that the Fund's rights may be more limited than the lender from which it acquired the assignment and the Fund may be able to enforce their rights only through an administrative agent. Although certain loan participations or assignments are secured by collateral, the Fund could experience delays or limitations in realizing such collateral or have their interest subordinated to other indebtedness of the obligor. In the event that the administrator or collateral agent of a loan becomes insolvent, enters into
Annual Report 2013
59
Columbia Strategic Income Fund
Notes to Financial Statements (continued)
October 31, 2013
receivership or bankruptcy, the Fund may incur costs and delays in realizing payment or may suffer a loss of principal and/or interest. The risk of loss is greater for unsecured or subordinated loans. In addition, loan participations and assignments are vulnerable to market conditions such that economic conditions or other events may reduce the demand for loan participations and assignments and certain loan participations and assignments which were liquid, when purchased, may become illiquid.
Stripped Securities
The Fund may invest in Interest Only (IO) and Principal Only (PO) stripped mortgage-backed securities. These securities are derivative multi-class mortgage securities structured so that one class receives most, if not all, of the principal from the underlying mortgage assets, while the other class receives most, if not all, of the interest and the remainder of the principal. If the underlying mortgage assets experience greater than anticipated prepayments of principal, the Fund may fail to fully recoup its initial investment in an IO security, therefore the daily interest accrual factor is adjusted each month to reflect the paydown of principal. The market value of these securities can be extremely volatile in response to changes in interest rates. Credit risk reflects the risk that the Fund may not receive all or part of its principal because the issuer or credit enhancer has defaulted on its obligation.
Security Transactions
Security transactions are accounted for on the trade date. Cost is determined and gains (losses) are based upon the specific identification method for both financial statement and federal income tax purposes.
Income Recognition
Interest income is recorded on an accrual basis. Market premiums and discounts, including original issue discounts, are amortized and accreted, respectively, over the expected life of the security on all debt securities, unless otherwise noted. The Fund classifies gains and losses realized on prepayments received on mortgage-backed securities as adjustments to interest income.
Corporate actions and dividend income are generally recorded net of any non-reclaimable tax withholdings, on the ex-dividend date or upon receipt of ex-dividend notification in the case of certain foreign securities.
The value of additional securities received as an income payment is recorded as income and increases the cost basis of such securities.
Expenses
General expenses of the Trust are allocated to the Fund and other funds of the Trust based upon relative net assets or other expense allocation methodologies determined by the nature of the expense. Expenses directly attributable to the Fund are charged to the Fund. Expenses directly attributable to a specific class of shares are charged to that share class.
Determination of Class Net Asset Value
All income, expenses (other than class-specific expenses, which are charged to that share class, as shown in the Statement of Operations) and realized and unrealized gains (losses) are allocated to each class of the Fund on a daily basis, based on the relative net assets of each class, for purposes of determining the net asset value of each class.
Federal Income Tax Status
The Fund intends to qualify each year as a regulated investment company under Subchapter M of the Internal Revenue Code, as amended, and will distribute substantially all of its taxable income (including net short-term capital gains), if any, for its tax year, and as such will not be subject to federal income taxes. In addition, the Fund intends to distribute in each calendar year substantially all of its net investment income, capital gains and certain other amounts, if any, such that the Fund should not be subject to federal excise tax. Therefore, no federal income or excise tax provision is recorded.
Foreign Taxes
The Fund may be subject to foreign taxes on income, gains on investments or currency repatriation, a portion of which may be recoverable. The Fund will accrue such taxes and recoveries, as applicable, based upon its current interpretation of tax rules and regulations that exist in the markets in which it invests.
Realized gains in certain countries may be subject to foreign taxes at the Fund level, based on statutory rates. The Fund accrues for such foreign taxes on realized and unrealized gains at the appropriate rate for each jurisdiction, as applicable. The amount, if any, is disclosed as a liability on the Statement of Assets and Liabilities.
Distributions to Shareholders
Distributions from net investment income, if any, are declared and paid monthly. Net realized capital gains, if any, are distributed at least annually. Income distributions and capital gain distributions are determined in accordance with federal income tax regulations, which may differ from GAAP.
Annual Report 2013
60
Columbia Strategic Income Fund
Notes to Financial Statements (continued)
October 31, 2013
Guarantees and Indemnifications
Under the Trust's organizational documents and, in some cases, by contract, its officers and trustees are indemnified against certain liabilities arising out of the performance of their duties to the Trust or its funds. In addition, certain of the Fund's contracts with its service providers contain general indemnification clauses. The Fund's maximum exposure under these arrangements is unknown since the amount of any future claims that may be made against the Fund cannot be determined, and the Fund has no historical basis for predicting the likelihood of any such claims.
Recent Accounting Pronouncement
Disclosures about Offsetting Assets and Liabilities
In December 2011, the Financial Accounting Standards Board (FASB) issued Accounting Standards Update (ASU) No. 2011-11, Disclosures about Offsetting Assets and Liabilities and in January 2013, ASU No. 2013-1, Clarifying the Scope of Disclosures about Offsetting Assets and Liabilities (collectively, the ASUs). Specifically, the ASUs require an entity to disclose both gross and net information for derivatives and other financial instruments that are subject to a master netting arrangement or similar agreement. The ASUs require disclosure of collateral received in connection with the master netting agreements or similar agreements. The disclosure requirements are effective for interim and annual periods beginning on or after January 1, 2013. At this time, management is evaluating the implications of this guidance and the impact it will have on the financial statement amounts and footnote disclosures, if any.
Note 3. Fees and Compensation Paid to Affiliates
Investment Management Fees
Under an Investment Management Services Agreement, Columbia Management Investment Advisers, LLC (the Investment Manager), a wholly-owned subsidiary of Ameriprise Financial, Inc. (Ameriprise Financial), determines which securities will be purchased, held or sold. The investment management fee is an annual fee that is equal to a percentage of the Fund's average daily net assets that declines from 0.530% to 0.353% as the Fund's net assets increase. The effective investment management fee rate for the year ended October 31, 2013 was 0.51% of the Fund's average daily net assets.
The Investment Manager has entered into a personnel-sharing arrangement with its affiliate, Threadneedle Investments (Threadneedle). Threadneedle, like the Investment Manager, is a wholly-owned subsidiary of Ameriprise Financial and is an
SEC-registered investment adviser. Pursuant to this arrangement, certain employees of Threadneedle serve as "associated persons" of the Investment Manager and, in this capacity, subject to the oversight and supervision of the Investment Manager and consistent with the investment objectives, policies and limitations set forth in the Fund's prospectus and Statement of Additional Information (SAI), may provide research and related services, and discretionary investment management services (including acting as portfolio managers) to the Fund on behalf of the Investment Manager.
Administration Fees
Under an Administrative Services Agreement, the Investment Manager also serves as the Fund Administrator. The Fund pays the Fund Administrator an annual fee for administration and accounting services equal to a percentage of the Fund's average daily net assets that declines from 0.07% to 0.04% as the Fund's net assets increase. The effective administration fee rate for the year ended October 31, 2013 was 0.06% of the Fund's average daily net assets.
Compensation of Board Members
Board members are compensated for their services to the Fund as disclosed in the Statement of Operations. The Trust's eligible Trustees may participate in a Deferred Compensation Plan (the Plan) which may be terminated at any time. Obligations of the Plan will be paid solely out of the Fund's assets.
Compensation of Chief Compliance Officer
The Board has appointed a Chief Compliance Officer to the Fund in accordance with federal securities regulations. The Fund pays its pro-rata share of the expenses associated with the Chief Compliance Officer. The Fund's expenses for the Chief Compliance Officer will not exceed $15,000 per year.
Transfer Agent Fees
Under a Transfer and Dividend Disbursing Agent Agreement, Columbia Management Investment Services Corp. (the Transfer Agent), an affiliate of the Investment Manager and a wholly-owned subsidiary of Ameriprise Financial, is responsible for providing transfer agency services to the Fund. The Transfer Agent has contracted with Boston Financial Data Services (BFDS) to serve as sub-transfer agent.
The Transfer Agent receives monthly account-based service fees based on the number of open accounts and also receives sub-transfer agency fees based on a percentage of the average aggregate value of the Fund's shares maintained in omnibus accounts (other than omnibus accounts for which American Enterprise Investment Services Inc. is the broker of record or accounts where the beneficial shareholder is a customer of
Annual Report 2013
61
Columbia Strategic Income Fund
Notes to Financial Statements (continued)
October 31, 2013
Ameriprise Financial Services, Inc., which are paid a per account fee). The Transfer Agent pays the fees of BFDS for services as sub-transfer agent and is not entitled to reimbursement for such fees from the Fund (with the exception of out-of-pocket fees).
The Transfer Agent also receives compensation from fees for various shareholder services and reimbursements for certain out-of-pocket fees. Total transfer agent fees for Class K and Class R5 shares are subject to an annual limitation of not more than 0.05% of the average daily net assets attributable to each share class. Beginning June 13, 2013, Class Y shares are not subject to transfer agent fees until April 30, 2014.
For the year ended October 31, 2013, the Fund's effective transfer agent fee rates as a percentage of average daily net assets of each class were as follows:
Class A | | | 0.17 | % | |
Class B | | | 0.17 | | |
Class C | | | 0.17 | | |
Class K | | | 0.05 | | |
Class R | | | 0.17 | | |
Class R4 | | | 0.17 | * | |
Class R5 | | | 0.05 | | |
Class W | | | 0.14 | | |
Class Z | | | 0.17 | | |
*Annualized.
An annual minimum account balance fee of $20 may apply to certain accounts with a value below the applicable share class' initial minimum investment requirements to reduce the impact of small accounts on transfer agent fees. These minimum account balance fees are recorded as part of expense reductions in the Statement of Operations. For the year ended October 31, 2013, these minimum account balance fees reduced total expenses by $7,807.
Plan Administration Fees
Under a Plan Administration Services Agreement with the Transfer Agent, the Fund pays an annual fee at a rate of 0.25% of the Fund's average daily net assets attributable to Class K shares for the provision of various administrative, recordkeeping, communication and educational services.
Distribution and Service Fees
The Fund has an agreement with Columbia Management Investment Distributors, Inc. (the Distributor), an affiliate of the Investment Manager and a wholly-owned subsidiary of Ameriprise Financial, for distribution and shareholder services. Pursuant to Rule 12b-1 under the 1940 Act, the
Board has approved, and the Fund has adopted, distribution and shareholder service plans (the Plans) which set the distribution and service fees for the Fund. These fees are calculated daily and are intended to compensate the Distributor and/or eligible selling and/or servicing agents for selling shares of the Fund and providing services to investors.
Effective July 1, 2011, under the Plans, the Fund pays a monthly service fee to the Distributor equal to 0.25% annually of the average daily net assets attributable to Class A, Class B, Class C and Class W shares of the Fund. Prior to July 1, 2011, the Fund paid a monthly service fee which was equal to 0.15% annually of the average daily net assets attributable to outstanding Class A and Class B shares of the Fund issued prior to January 1, 1993 and 0.25% annually of the average daily net assets attributable to outstanding Class A, Class B, Class C and Class W shares issued thereafter. The arrangement resulted in an annual rate of service fee for shares that was a blend between the 0.15% and 0.25% rates. For the year ended October 31, 2013, the Fund's effective service fee rate was 0.25% of the Fund's average daily net assets attributable to Class A, Class B, Class C, and Class W shares.
Also under the Plans, the Fund pays a monthly distribution fee to the Distributor at the maximum annual rates of 0.75%, 0.75%, 0.50% and 0.25% of the average daily net assets attributable to Class B, Class C, Class R and Class W shares, respectively.
The Distributor has voluntarily agreed to waive a portion of the distribution fee for Class C shares so that the distribution fee does not exceed 0.60% annually of the average daily net assets attributable to Class C shares. This arrangement may be modified or terminated by the Distributor at any time.
The Fund may pay a distribution fee up to 0.25% of the Fund's average daily net assets attributable to Class W shares and a service fee of up to 0.25% of the Fund's average daily net assets attributable to Class W shares, provided, however, that the aggregate fee shall not exceed 0.25% of the Fund's average daily net assets attributable to Class W shares.
Sales Charges
Sales charges, including front-end charges and CDSCs, received by the Distributor for distributing Fund shares were $1,265,554 for Class A, $50,889 for Class B and $31,082 for Class C shares for the year ended October 31, 2013.
Expenses Waived/Reimbursed by the Investment Manager and its Affiliates
The Investment Manager and certain of its affiliates have contractually agreed to waive fees and/or reimburse expenses (excluding certain fees and expenses described below), for the
Annual Report 2013
62
Columbia Strategic Income Fund
Notes to Financial Statements (continued)
October 31, 2013
period disclosed below, unless sooner terminated at the sole discretion of the Board, so that the Fund's net operating expenses, after giving effect to fees waived/expenses reimbursed and any balance credits and/or overdraft charges from the Fund's custodian, do not exceed the following annual rates as a percentage of the class' average daily net assets:
| | | Fee Rates Contractual
through
February 28, 2014 | |
Class A | | | 1.04 | % | |
Class B | | | 1.79 | | |
Class C | | | 1.79 | | |
Class K | | | 0.97 | | |
Class R | | | 1.29 | | |
Class R4 | | | 0.79 | | |
Class R5 | | | 0.72 | | |
Class W | | | 1.04 | | |
Class Y | | | 0.67 | | |
Class Z | | | 0.79 | | |
Under the agreement governing these fee waivers and/or expense reimbursement arrangements, the following fees and expenses are excluded from the waiver/reimbursement commitment, and therefore will be paid by the Fund, if applicable: taxes (including foreign transaction taxes), expenses associated with investments in affiliated and non-affiliated pooled investment vehicles (including mutual funds and exchange traded funds), transaction costs and brokerage commissions, costs related to any securities lending program, dividend expenses associated with securities sold short, inverse floater program fees and expenses, transaction charges and interest on borrowed money, interest, extraordinary expenses and any other expenses the exclusion of which is specifically approved by the Board. This agreement may be modified or amended only with approval from all parties. Class C distribution fees waived by the Distributor, as discussed above, are in addition to the waiver/reimbursement commitment under the agreement.
Note 4. Federal Tax Information
The timing and character of income and capital gain distributions are determined in accordance with income tax regulations, which may differ from GAAP because of temporary or permanent book to tax differences.
At October 31, 2013, these differences are primarily due to differing treatment for principal and/or interest of fixed income securities, deferral/reversal of wash sales losses, Trustees' deferred compensation, foreign currency transactions, derivative investments and tax straddles. To the extent these differences are permanent, reclassifications are made among the components of the Fund's net assets in the
Statement of Assets and Liabilities. Temporary differences do not require reclassifications. In the Statement of Assets and Liabilities the following reclassifications were made:
Undistributed net investment income | | $ | (6,620,930 | ) | |
Accumulated net realized gain | | | 6,614,363 | | |
Paid-in capital | | | 6,567 | | |
Net investment income and net realized gains (losses), as disclosed in the Statement of Operations, and net assets were not affected by this reclassification.
The tax character of distributions paid during the periods indicated was as follows:
| | Year Ended
October 31,
2013 | | Period Ended
October 31,
2012 | | Year Ended
May 31,
2012 | |
Ordinary income | | $ | 104,698,869 | | | $ | 45,756,480 | | | $ | 118,075,599 | | |
Long-term
capital gains | | | 8,574,446 | | | | — | | | | — | | |
Total | | | 113,273,315 | | | | 45,756,480 | | | | 118,075,599 | | |
Short-term capital gain distributions, if any, are considered ordinary income distributions for tax purposes.
At October 31, 2013, the components of distributable earnings on a tax basis were as follows:
Undistributed ordinary income | | $ | 8,518,686 | | |
Undistributed accumulated long-term gain | | | 60,530,981 | | |
Unrealized appreciation | | | 46,892,644 | | |
At October 31, 2013, the cost of investments for federal income tax purposes was $2,308,400,652 and the aggregate gross unrealized appreciation and depreciation based on that cost was:
Unrealized appreciation | | $ | 85,666,730 | | |
Unrealized depreciation | | | (38,774,086 | ) | |
Net unrealized appreciation | | | 46,892,644 | | |
Management of the Fund has concluded that there are no significant uncertain tax positions that would require recognition in the financial statements. However, management's conclusion may be subject to review and adjustment at a later date based on factors including, but not limited to, new tax laws, regulations, and administrative interpretations (including relevant court decisions). Generally, the Fund's federal tax returns for the prior three fiscal years remain subject to examination by the Internal Revenue Service.
Note 5. Portfolio Information
The cost of purchases and proceeds from sales of securities, excluding short-term obligations, aggregated to $2,955,434,677 and $3,324,074,417, respectively, for the year ended
Annual Report 2013
63
Columbia Strategic Income Fund
Notes to Financial Statements (continued)
October 31, 2013
October 31, 2013, of which $1,399,982,724 and $1,854,401,929, respectively, were U.S. government securities.
Note 6. Lending of Portfolio Securities
Effective December 19, 2012, the Fund no longer participates in securities lending activity. Prior to that date, the Fund participated, or was eligible to participate, in securities lending activity pursuant to a Master Securities Lending Agreement (the Agreement) with JPMorgan Chase Bank, N.A. (JPMorgan). The Agreement authorized JPMorgan as lending agent to lend securities to authorized borrowers in order to generate additional income on behalf of the Fund. Pursuant to the Agreement, the securities loaned were secured by cash or securities that either were issued or guaranteed as to principal and interest by the U.S. government, its agencies, authorities or instrumentalities with value equal to at least 100% of the market value of the loaned securities. Any additional collateral required to maintain those levels due to market fluctuations of the loaned securities was requested to be delivered the following business day. Cash collateral received was invested by the lending agent on behalf of the Fund into authorized investments pursuant to the Agreement.
Pursuant to the Agreement, the Fund received income for lending its securities either in the form of fees or by earning interest on invested cash collateral, net of negotiated rebates paid to borrowers and fees paid to the lending agent for services provided and any other securities lending expenses. Net income earned from securities lending for the year ended October 31, 2013 is disclosed in the Statement of Operations. The Fund continued to earn and accrue interest and dividends on the securities loaned.
Note 7. Affiliated Money Market Fund
The Fund invests its daily cash balances in Columbia Short-Term Cash Fund, an affiliated money market fund established for the exclusive use by the Fund and other affiliated funds. The income earned by the Fund from such investments is included as "Dividends — affiliated issuers" in the Statement of Operations. As an investing fund, the Fund indirectly bears its proportionate share of the expenses of Columbia Short-Term Cash Fund.
Note 8. Shareholder Concentration
At October 31, 2013, one unaffiliated shareholder account owned an aggregate of 32.1% of the outstanding shares of the Fund. The Fund has no knowledge about whether any portion of those shares was owned beneficially by such accounts. Affiliated shareholder accounts owned 21.1% of the outstanding shares of the Fund. Subscription and redemption activity by concentrated accounts may have a significant effect on the operations of the Fund.
Note 9. Line of Credit
The Fund has entered into a revolving credit facility with a syndicate of banks led by JPMorgan whereby the Fund may borrow for the temporary funding of shareholder redemptions or for other temporary or emergency purposes. The credit facility agreement, as amended, which is a collective agreement between the Fund and certain other funds managed by the Investment Manager, severally and not jointly, permits collective borrowings up to $500 million. Interest is charged to each participating fund based on its borrowings at a rate equal to the higher of (i) the overnight federal funds rate plus 1.00% or (ii) the one-month LIBOR rate plus 1.00%. Each borrowing under the credit facility matures no later than 60 days after the date of borrowing. The Fund also pays a commitment fee equal to its pro rata share of the amount of the credit facility at a rate of 0.08% per annum. The commitment fee is included in other expenses in the Statement of Operations.
The Fund had no borrowings during the year ended October 31, 2013.
Note 10. Fund Merger
At the close of business on June 3, 2011, the Fund acquired the assets and assumed the identified liabilities of RiverSource Strategic Income Allocation Fund, a series of RiverSource Strategic Allocation Series, Inc. The reorganization was completed after shareholders of RiverSource Strategic Income Allocation Fund approved the plan on February 15, 2011. The purpose of the transaction was to combine two funds managed by the Investment Manager with comparable investment objectives and strategies.
The aggregate net assets of the Fund immediately before the acquisition were $1,863,662,877 and the combined net assets immediately after the acquisition were $2,217,480,688.
The merger was accomplished by a tax-free exchange of 35,698,301 shares of RiverSource Strategic Income Allocation Fund valued at $353,817,811 (including $21,440,497 of unrealized appreciation).
In exchange for RiverSource Strategic Income Allocation Fund shares, the Fund issued the following number of shares:
| | | Shares | |
Class A | | | 50,379,122 | | |
Class B | | | 3,427,244 | | |
Class C | | | 3,538,608 | | |
Class R | | | 859 | | |
Class R4 | | | 36,339 | | |
Class R5 | | | 45,399 | | |
Annual Report 2013
64
Columbia Strategic Income Fund
Notes to Financial Statements (continued)
October 31, 2013
For financial reporting purposes, net assets received and shares issued by the Fund were recorded at fair value; however, RiverSource Strategic Income Allocation Fund's cost of investments was carried forward
The financial statements reflect the operations of the Fund for the period prior to the merger and the combined fund for the period subsequent to the merger. Because the combined investment portfolios have been managed as a single integrated portfolio since the merger was completed, it is not practicable to separate the amounts of revenue and earnings of RiverSource Strategic Income Allocation Fund that have been included in the combined Fund's Statement of Operations since the merger was completed.
Assuming the merger had been completed on June 1, 2011, the Fund 's pro-forma net investment income, net gain on investments, net change in unrealized depreciation and net increase in net assets from operations for the year ended May 31, 2012 would have been approximately $111.5 million, $24.3 million, $(37.4 million and $98.3 million, respectively.
Note 11. Significant Risks
Derivatives Risk
Losses involving derivative instruments may be substantial, because a relatively small price movement in the underlying security(ies) instrument, commodity, currency or index may result in a substantial loss for the Fund. In addition to the potential for increased losses, the use of derivative instruments may lead to increased volatility within the Fund. Derivatives will typically increase the Fund's exposure to principal risks to which it is otherwise exposed, and may expose the Fund to additional risks, including correlation risk, counterparty risk, hedging risk, leverage risk and liquidity risk.
Foreign Securities Risk
Investing in foreign securities may include certain risks and considerations not typically associated with investing in U.S. securities, such as fluctuating currency values and changing local and regional economic, political and social conditions, which may result in greater market volatility. In addition, certain foreign securities may not be as liquid as U.S. securities. Investing in emerging markets may accentuate these risks.
Investments in emerging market countries are subject to additional risk. The risk of foreign investments is typically increased in less developed countries. These countries are also more likely to experience high levels of inflation, deflation or currency devaluation which could hurt their economies and securities markets.
Low and Below Investment Grade (High-Yield) Securities Risk
Securities with the lowest investment grade rating, securities rated below investment grade (commonly called "high-yield" or "junk" bonds) and unrated securities of comparable quality expose the Fund to a greater risk of loss of principal and income than a fund that invests solely or primarily in investment grade securities. In addition, these investments have greater price fluctuations, are less liquid and are more likely to experience a default than higher-rated securities. High-yield securities are considered to be predominantly speculative with respect to the issuer's capacity to pay interest and repay principal.
Note 12. Subsequent Events
Management has evaluated the events and transactions that have occurred through the date the financial statements were issued and noted no items requiring adjustment of the financial statements or additional disclosure.
Note 13. Information Regarding Pending and Settled Legal Proceedings
In December 2005, without admitting or denying the allegations, American Express Financial Corporation (AEFC, which is now known as Ameriprise Financial, Inc. (Ameriprise Financial)) entered into settlement agreements with the Securities and Exchange Commission (SEC) and Minnesota Department of Commerce (MDOC) related to market timing activities. As a result, AEFC was censured and ordered to cease and desist from committing or causing any violations of certain provisions of the Investment Advisers Act of 1940, the Investment Company Act of 1940, and various Minnesota laws. AEFC agreed to pay disgorgement of $10 million and civil money penalties of $7 million. AEFC also agreed to retain an independent distribution consultant to assist in developing a plan for distribution of all disgorgement and civil penalties ordered by the SEC in accordance with various undertakings detailed at www.sec.gov/litigation/admin/ia-2451.pdf. Ameriprise Financial and its affiliates have cooperated with the SEC and the MDOC in these legal proceedings, and have made regular reports to the funds' Boards of Trustees.
Ameriprise Financial and certain of its affiliates have historically been involved in a number of legal, arbitration and regulatory proceedings, including routine litigation, class actions, and governmental actions, concerning matters arising in connection with the conduct of their business activities. Ameriprise Financial believes that the Funds are not currently the subject of, and that neither Ameriprise Financial nor any of its affiliates are the subject of, any pending legal, arbitration or regulatory proceedings that are likely to have a material
Annual Report 2013
65
Columbia Strategic Income Fund
Notes to Financial Statements (continued)
October 31, 2013
adverse effect on the Funds or the ability of Ameriprise Financial or its affiliates to perform under their contracts with the Funds. Ameriprise Financial is required to make 10-Q, 10-K and, as necessary, 8-K filings with the Securities and Exchange Commission on legal and regulatory matters that relate to Ameriprise Financial and its affiliates. Copies of these filings may be obtained by accessing the SEC website at www.sec.gov.
There can be no assurance that these matters, or the adverse publicity associated with them, will not result in increased fund redemptions, reduced sale of fund shares or other adverse consequences to the Funds. Further, although we believe proceedings are not likely to have a material adverse effect on the Funds or the ability of Ameriprise Financial or its affiliates to perform under their contracts with the Funds, these proceedings are subject to uncertainties and, as such, we are unable to estimate the possible loss or range of loss that may result. An adverse outcome in one or more of these proceedings could result in adverse judgments, settlements, fines, penalties or other relief that could have a material adverse effect on the consolidated financial condition or results of operations of Ameriprise Financial.
Annual Report 2013
66
Columbia Strategic Income Fund
Report of Independent Registered Public Accounting Firm
To the Trustees of Columbia Funds Series Trust I and the Shareholders of
Columbia Strategic Income Fund
In our opinion, the accompanying statement of assets and liabilities, including the portfolio of investments, and the related statements of operations and of changes in net assets and the financial highlights present fairly, in all material respects, the financial position of Columbia Strategic Income Fund (the "Fund", a series of Columbia Funds Series Trust I) at October 31, 2013, and the results of its operations, the changes in its net assets and the financial highlights for each of the periods indicated, in conformity with accounting principles generally accepted in the United States of America. These financial statements and financial highlights (hereafter referred to as "financial statements") are the responsibility of the Fund's management; our responsibility is to express an opinion on these financial statements based on our audits. We conducted our audits of these financial statements in accordance with the standards of the Public Company Accounting Oversight Board (United States). Those standards require that we plan and perform the audit to obtain reasonable assurance about whether the financial statements are free of material misstatement. An audit includes examining, on a test basis, evidence supporting the amounts and disclosures in the financial statements, assessing the accounting principles used and significant estimates made by management, and evaluating the overall financial statement presentation. We believe that our audits, which included confirmation of securities at October 31, 2013 by correspondence with the custodian, brokers, agent banks and transfer agent, and the application of alternative auditing procedures where securities purchased and investment portfolio position confirmations had not been received, provide a reasonable basis for the opinion expressed above.
PricewaterhouseCoopers LLP
Minneapolis, Minnesota
December 19, 2013
Annual Report 2013
67
Columbia Strategic Income Fund
Federal Income Tax Information
(Unaudited)
The Fund hereby designates the following tax attributes for the fiscal year ended October 31, 2013. Shareholders will be notified in early 2014 of the amounts for use in preparing 2013 income tax returns.
Tax Designations:
Capital Gain Dividend | | $ | 64,627,246 | | |
Capital Gain Dividend. The Fund designates as a capital gain dividend the amount reflected above, or if subsequently determined to be different, the net capital gain of such fiscal period. The Fund also designates as capital gain dividends, to the extent necessary to fully distribute such capital gains, earnings and profits distributed to shareholders on the redemption of shares.
Annual Report 2013
68
Columbia Strategic Income Fund
The Trustees serve terms of indefinite duration. The names, addresses and birth years of the Trustees and Officers of the Funds in Columbia Funds Series Trust I, the year each was first elected or appointed to office, their principal business occupations during at least the last five years, the number of Funds overseen by each Trustee and other directorships they hold are shown below. Each officer listed below serves as an officer of each Fund in Columbia Funds Series Trust I.
Independent Trustees
Name, Address and Year of Birth,
Position with Funds, Year First
Elected or Appointed to Office | | Principal Occupation(s) During Past Five Years, Number of Funds in Columbia
Funds Complex Overseen by Trustee, Other Directorships Held | |
Rodman L. Drake (Born 1943)
c/o Columbia Management
Investment Advisers, LLC
225 Franklin Street
Boston, MA 02110
Trustee (since 1994) and
Chairman of the Board (since 2009) | | Independent consultant since 2010; Co-Founder of Baringo Capital LLC (private equity) from 1997 to 2008; Chairman (from 2003 to 2010) and CEO (from 2008 to 2010) of Crystal River Capital, Inc. (real estate investment trust); Oversees 52; Jackson Hewitt Tax Service Inc. (tax preparation services) from 2004 to 2011; Student Loan Corporation (student loan provider) from 2005 to 2010; Celgene Corporation (global biotechnology company); The Helios Funds and Brookfield Funds (closed-end funds); Chimerix, Inc. (biopharmaceutical company) since August 1, 2013; Crystal River Capital, Inc. from 2005 to 2010; Parsons Brinckerhoff from 1995 to 2008; and Apex Silver Mines Ltd. from 2007 to 2009 | |
Douglas A. Hacker (Born 1955)
c/o Columbia Management
Investment Advisers, LLC
225 Franklin Street
Boston, MA 02110
Trustee (since 1996) | | Independent business executive since May 2006; Executive Vice President — Strategy of United Airlines from December 2002 to May 2006; President of UAL Loyalty Services (airline marketing company) from September 2001 to December 2002; Executive Vice President and Chief Financial Officer of United Airlines from July 1999 to September 2001. Oversees 52; Nash Finch Company (food distributor); Aircastle Limited (aircraft leasing); and SeaCube Container Leasing Ltd. (container leasing) | |
Janet Langford Kelly (Born 1957)
c/o Columbia Management
Investment Advisers, LLC
225 Franklin Street
Boston, MA 02110
Trustee (since 1996) | | Senior Vice President, General Counsel and Corporate Secretary, ConocoPhillips (integrated energy company) since September 2007; Deputy General Counsel — Corporate Legal Services, ConocoPhillips from August 2006 to August 2007; Partner, Zelle, Hofmann, Voelbel, Mason & Gette LLP (law firm) from March 2005 to July 2006; Adjunct Professor of Law, Northwestern University from September 2004 to June 2006; Director, UAL Corporation (airline) from February 2006 to July 2006; Chief Administrative Officer and Senior Vice President, Kmart Holding Corporation (consumer goods) from September 2003 to March 2004. Oversees 52; None | |
Nancy T. Lukitsh (Born 1956)
c/o Columbia Management
Investment Advisers, LLC
225 Franklin Street
Boston, MA 02110
Trustee (since 2011) | | Senior Vice President, Partner and Director of Marketing, Wellington Management Company, LLP (investment adviser) from 1997 to 2010; Chair, Wellington Management Investment Portfolios (commingled non-U.S. investment pools) from 2007 to 2010; Director, Wellington Trust Company, NA and other Wellington affiliates from 1997 to 2010. Oversees 52; None | |
William E. Mayer (Born 1940)
c/o Columbia Management
Investment Advisers, LLC
225 Franklin Street
Boston, MA 02110
Trustee (since 1994) | | Partner, Park Avenue Equity Partners (private equity) since February 1999; Dean and Professor, College of Business and Management, University of Maryland from 1992 to 1996. Oversees 52; DynaVox Inc. (speech creation); Lee Enterprises (print media); WR Hambrecht + Co. (financial service provider) from 2000 to 2012; BlackRock Kelso Capital Corporation (investment company) | |
David M. Moffett (Born 1952)
c/o Columbia Management
Investment Advisers, LLC
225 Franklin Street
Boston, MA 02110
Trustee (since 2011) | | Retired. Chief Executive Officer, Federal Home Loan Mortgage Corporation, from 2008 to 2009; Senior Adviser, Global Financial Services Group, Carlyle Group, Inc., from 2007 to 2008; Vice Chairman and Chief Financial Officer, U.S. Bancorp, from 1993 to 2007. Oversees 52; CIT Group Inc. (commercial and consumer finance); eBay Inc. (online trading community); MBIA Inc. (financial service provider); E.W. Scripps Co. (print and television media), Building Materials Holding Corp. (building materials and construction services); Genworth Financial, Inc. (financial and insurance products and services); and University of Oklahoma Foundation | |
Charles R. Nelson (Born 1942)
c/o Columbia Management
Investment Advisers, LLC
225 Franklin Street
Boston, MA 02110
Trustee (since 1981) | | Retired. Professor Emeritus, University of Washington, since 2011; Professor of Economics, University of Washington from 1976 to 2011; Ford and Louisa Van Voorhis Professor of Political Economy, University of Washington from 1993 to 2011; Adjunct Professor of Statistics, University of Washington from 1980 to 2011; Associate Editor, Journal of Money, Credit and Banking from September 1993 to 2008; consultant on econometric and statistical matters. Oversees 52; None | |
John J. Neuhauser (Born 1943)
c/o Columbia Management
Investment Advisers, LLC
225 Franklin Street
Boston, MA 02110
Trustee (since 1984) | | President, Saint Michael's College, since August 2007; Director or Trustee of several non-profit organizations, including Fletcher Allen Health Care, Inc.; University Professor, Boston College from November 2005 to August 2007; Academic Vice President and Dean of Faculties, Boston College from August 1999 to October 2005. Oversees 52; Liberty All-Star Equity Fund and Liberty All-Star Growth Fund (closed-end funds) | |
Annual Report 2013
69
Columbia Strategic Income Fund
Trustees and Officers (continued)
Independent Trustees (continued)
Name, Address and Year of Birth,
Position with Funds, Year First
Elected or Appointed to Office | | Principal Occupation(s) During Past Five Years, Number of Funds in Columbia
Funds Complex Overseen by Trustee, Other Directorships Held | |
Patrick J. Simpson (Born 1944)
c/o Columbia Management
Investment Advisers, LLC
225 Franklin Street
Boston, MA 02110
Trustee (since 2000) | | Partner, Perkins Coie LLP (law firm). Oversees 52; None | |
Anne-Lee Verville (Born 1945)
c/o Columbia Management
Investment Advisers, LLC
225 Franklin Street
Boston, MA 02110
Trustee (since 1998) | | Retired. General Manager — Global Education Industry from 1994 to 1997, President — Application Systems Division from 1991 to 1994, Chief Financial Officer — US Marketing & Services from 1988 to 1991, and Chief Information Officer from 1987 to 1988, IBM Corporation (computer and technology). Oversees 52; Enesco Group, Inc. (producer of giftware and home and garden decor products) from 2001 to 2006 | |
Interested Trustee
Name, Address and Year of Birth,
Position with Funds, Year First
Elected or Appointed to Office | | Principal Occupation(s) During Past Five Years, Number of Funds in Columbia
Funds Complex Overseen by Trustee, Other Directorships Held | |
William F. Truscott (born 1960)
53600 Ameriprise Financial Center
Minneapolis, MN 55474
Senior Vice President (since 2012) | | Chairman of the Board and President, Columbia Management Investment Advisers, LLC since May 2010 and February 2012 (previously President and Chief Investment Officer, from 2001 to April 2010); Chief Executive Officer, Global Asset Management, Ameriprise Financial, Inc. since September 2012 (previously, Chief Executive Officer, U.S. Asset Management & President, Annuities, from May 2010 to September 2012 and President — U.S. Asset Management and Chief Investment Officer from 2005 to April 2010); Director and Chief Executive Officer, Columbia Management Investment Distributors, Inc. since May 2010 and February 2012, respectively (previously Chairman of the Board and Chief Executive Officer from 2006 to April 2010); Chairman of the Board and Chief Executive Officer, RiverSource Distributors, Inc. since 2006; President and Chief Executive Officer, Ameriprise Certificate Company, 2006 to August 2012; Oversees 184; Director, Ameriprise Certificate Company, 2006-January 2013 | |
The Statement of Additional Information includes additional information about the Trustees of the Funds and is available, without charge, upon request by calling 800.345.6611.
The Board has appointed officers who are responsible for day-to-day business decisions based on policies it has established. The officers serve at the pleasure of the Board. In addition to Mr. Truscott, who is Senior Vice President, the Funds' other officers are:
Officers
Name,
Address and
Year of Birth | | Position and Year
First Appointed to
Position for any Fund
in the Columbia
Funds Complex or a
Predecessor Thereof | | Principal Occupation(s) During Past Five Years | |
J. Kevin Connaughton
225 Franklin Street
Boston, MA 02110
Born 1964 | | President and Principal Executive Officer (2009) | | Senior Vice President and General Manager — Mutual Fund Products, Columbia Management Investment Advisers, LLC, since May 2010; and President, Columbia Funds since 2009; previously, Managing Director, Columbia Management Advisors, LLC, from December 2004 to April 2010; Senior Vice President and Chief Financial Officer, Columbia Funds, from June 2008 to January 2009; and senior officer of Columbia Funds and affiliated funds since 2003. | |
Michael G. Clarke
225 Franklin Street
Boston, MA 02110
Born 1969 | | Treasurer (2011) and Chief Financial Officer (2009) | | Vice President, Columbia Management Investment Advisers, LLC, since May 2010; previously, Managing Director of Fund Administration, Columbia Management Advisors, LLC, from September 2004 to April 2010; and senior officer of Columbia Funds and affiliated funds since 2002. | |
Annual Report 2013
70
Columbia Strategic Income Fund
Trustees and Officers (continued)
Officers (continued)
Name,
Address and
Year of Birth | | Position and Year
First Appointed to
Position for any Fund
in the Columbia
Funds Complex or a
Predecessor Thereof | | Principal Occupation(s) During Past Five Years | |
Scott R. Plummer
5228 Ameriprise
Financial Center
Minneapolis, MN 55474
Born 1959 | | Senior Vice President (2006), Chief Legal Officer (2006) and Assistant Secretary (2011) | | Senior Vice President, Chief Legal Officer and Assistant Secretary, Columbia Management Investment Advisers, LLC, since June 2005; Senior Vice President and Lead Chief Counsel — Asset Management, Ameriprise Financial, Inc., since May 2010 (previously, Vice President and Chief Counsel — Asset Management, from 2005 to April 2010); Vice President, Chief Counsel and Assistant Secretary, Columbia Management Investment Distributors, Inc., since 2008; Vice President, General Counsel and Secretary, Ameriprise Certificate Company, since 2005; Chief Counsel, RiverSource Distributors, Inc., since 2006; and senior officer of Columbia Funds and affiliated funds since 2006. | |
Thomas P. McGuire
225 Franklin Street
Boston, MA 02110
Born 1972 | | Chief Compliance Officer (2012) | | Vice President — Asset Management Compliance, Ameriprise Financial, Inc., since May 2010; Chief Compliance Officer, Ameriprise Certificate Company, since September 2010; Compliance Executive, Bank of America, from 2005 to April 2010. | |
Colin Moore
225 Franklin Street
Boston, MA 02110
Born 1958 | | Senior Vice President (2010) | | Executive Vice President and Global Chief Investment Officer, Ameriprise Financial, Inc., since July 2013; Director and Global Chief Investment Officer, Columbia Management Investment Advisers, LLC, since May 2010; previously, Manager, Managing Director and Chief Investment Officer, Columbia Management Advisors, LLC, from 2007 to April 2010. | |
Michael E. DeFao
225 Franklin Street
Boston, MA 02110
Born 1968 | | Vice President (2011) and Assistant Secretary (2010) | | Vice President and Chief Counsel, Ameriprise Financial, Inc., since May 2010; Associate General Counsel, Bank of America from 2005 to April 2010. | |
Joseph F. DiMaria
225 Franklin Street
Boston, MA 02110
Born 1968 | | Vice President (2011) and Chief Accounting Officer (2008) | | Vice President — Mutual Fund Administration, Columbia Management Investment Advisers, LLC, since May 2010; previously, Director of Fund Administration, Columbia Management Advisors, LLC, from 2006 to April 2010. | |
Paul B. Goucher
100 Park Avenue
New York, NY 10017
Born 1968 | | Vice President (2011) and Assistant Secretary (2008) | | Vice President and Lead Chief Counsel, Ameriprise Financial, Inc., since November 2008 and January 2013, respectively (previously, Chief Counsel, from January 2010 to January 2013, and Group Counsel from November 2008 to January 2010); previously, Director, Managing Director and General Counsel, J. & W. Seligman & Co. Incorporated, from July 2008 to November 2008. | |
Amy Johnson
5228 Ameriprise
Financial Center
Minneapolis, MN
Born 1965 | | Vice President (2006) | | Senior Vice President and Chief Operating Officer, Columbia Management Investment Advisers, LLC, since May 2010; previously, Chief Administrative Officer, from 2009 to April 2010, and Vice President — Asset Management and Trust Company Services, from 2006 to 2009. | |
Paul D. Pearson
5228 Ameriprise
Financial Center
Minneapolis, MN
Born 1956 | | Vice President (2011) and Assistant Treasurer (1999) | | Vice President — Investment Accounting, Columbia Management Investment Advisers, LLC, since May 2010; previously, Vice President — Managed Assets, Investment Accounting, Ameriprise Financial, Inc. from 1998 to April 2010. | |
Christopher O. Petersen
5228 Ameriprise
Financial Center
Minneapolis, MN 55474
Born 1970 | | Vice President and Secretary (2010) | | Vice President and Chief Counsel, Ameriprise Financial, Inc., since January 2010 (previously, Vice President and Group Counsel or Counsel from 2004 to January 2010); officer of Columbia Funds and affiliated funds since 2007. | |
Stephen T. Welsh
225 Franklin Street
Boston, MA 02110
Born 1957 | | Vice President (2006) | | President and Director, Columbia Management Investment Services Corp., since May 2010; previously, President and Director, Columbia Management Services, Inc., from 2004 to April 2010; and Managing Director, Columbia Management Distributors, Inc., from 2007 to April 2010. | |
Annual Report 2013
71
Columbia Strategic Income Fund
Board Consideration and Approval of Advisory Agreement
On June 14, 2013, the Board of Trustees (the "Board") and the Trustees who are not interested persons (as defined in the Investment Company Act of 1940) of the Trust (the "Independent Trustees") unanimously approved the continuation of the Investment Management Services Agreement (the "Advisory Agreement") with Columbia Management Investment Advisers, LLC (the "Investment Manager") with respect to Columbia Strategic Income Fund (the "Fund"), a series of the Trust. As detailed below, the Advisory Fees and Expenses Committee (the "Committee") and the Board met on multiple occasions to review and discuss, both among themselves and with the management team of the Investment Manager, materials provided by the Investment Manager before determining to approve the continuation of the Advisory Agreement.
In connection with their deliberations regarding the continuation of the Advisory Agreement, the Committee and the Board evaluated materials requested from the Investment Manager regarding the Fund and the Advisory Agreement, and discussed these materials with representatives of the Investment Manager at Committee meetings held on March 5, 2013, April 24, 2013 and June 13, 2013, and at the Board meeting held on June 14, 2013. In addition, the Board considers matters bearing on the Advisory Agreement at most of its other meetings throughout the year and meets regularly with senior management of the Funds and the Investment Manager. Through the Board's Investment Oversight Committees, Trustees also meet with selected Fund portfolio managers and other investment personnel at various times throughout the year. The Committee and the Board also consulted with Fund counsel and with the Independent Trustees' independent legal counsel, who advised on various matters with respect to the Committee's and the Board's considerations and otherwise assisted the Committee and the Board in their deliberations. On June 13, 2013, the Committee recommended that the Board approve the continuation of the Advisory Agreement. On June 14, 2013, the Board, including the Independent Trustees, voting separately, unanimously approved the continuation of the Advisory Agreement for the Fund.
The Committee and the Board considered all information that they, their legal counsel, or the Investment Manager believed reasonably necessary to evaluate and to determine whether to approve the continuation of the Advisory Agreement. The information and factors considered by the Committee and the Board in recommending for approval or approving the continuation of the Advisory Agreement for the Fund included the following:
• Information on the investment performance of the Fund relative to the performance of a group of mutual funds determined to be comparable to the Fund by an independent third-party data provider, as well as performance relative to benchmarks;
• Information on the Fund's advisory fees and total expenses, including information comparing the Fund's expenses to those of a group of comparable mutual funds, as determined by the independent third-party data provider;
• The Investment Manager's agreement to contractually limit or cap total operating expenses for the Fund so that total operating expenses (excluding certain fees and expenses, such as transaction costs and certain other investment related expenses, interest, taxes, acquired fund fees and expenses, and extraordinary expenses) would not exceed the median expenses of a group of comparable funds (as determined from time to time, generally annually, by the independent third-party data provider);
• The terms and conditions of the Advisory Agreement;
• The terms and conditions of other agreements and arrangements with affiliates of the Investment Manager relating to the operations of the Fund, including the Administrative Services Agreement, the Distribution Agreement and the Transfer and Dividend Disbursing Agent Agreement;
• Descriptions of various functions performed by the Investment Manager under the Advisory Agreement, including portfolio management and portfolio trading practices;
• Information regarding the management fees and investment performance of comparable portfolios of other clients of the Investment Manager, including institutional separate accounts;
• Information regarding the reputation, regulatory history and resources of the Investment Manager, including information regarding senior management, portfolio managers and other personnel;
• Information regarding the capabilities of the Investment Manager with respect to compliance monitoring services, including an assessment of the Investment Manager's compliance system by the Fund's Chief Compliance Officer; and
• The profitability to the Investment Manager and its affiliates from their relationships with the Fund.
Annual Report 2013
72
Columbia Strategic Income Fund
Board Consideration and Approval of Advisory Agreement (continued)
Nature, Extent and Quality of Services Provided under the Advisory Agreement
The Committee and the Board considered the nature, extent and quality of services provided to the Fund by the Investment Manager and its affiliates under the Advisory Agreement and under separate agreements for the provision of transfer agency and administrative services, and the resources dedicated to the Fund and the other Columbia Funds by the Investment Manager and its affiliates. The Committee and the Board considered, among other things, the Investment Manager's ability to attract, motivate and retain highly qualified research, advisory and supervisory investment professionals (including personnel and other resources, compensation programs for personnel involved in fund management, reputation and other attributes), the portfolio management services provided by those investment professionals, and the quality of the Investment Manager's investment research capabilities and trade execution services. The Committee and the Board also considered the potential benefits to shareholders of investing in a mutual fund that is part of a fund complex offering exposure to a variety of asset classes and investment disciplines and providing a variety of fund and shareholder services.
The Committee and the Board also considered the professional experience and qualifications of the senior personnel of the Investment Manager, which included consideration of the Investment Manager's experience with similarly-structured funds. The Committee and the Board noted the compliance programs of and the compliance-related resources provided to the Fund by the Investment Manager and its affiliates, and considered the Investment Manager's ability to provide administrative services to the Fund pursuant to a separate Administrative Services Agreement, including the Investment Manager's ability to coordinate the activities of the Fund's other service providers. After reviewing these and related factors, the Committee and the Board concluded, within the context of their overall conclusions, that the nature, extent and quality of the services provided to the Fund under the Advisory Agreement supported the continuation of the Advisory Agreement.
Investment Performance
The Committee and the Board reviewed information about the performance of the Fund over various time periods, including performance information relative to benchmarks and information based on reports of the independent third-party data provider that compared the performance of the Fund to the performance of a group of comparable mutual funds. The Committee and the Board also reviewed a description of the third party's methodology for identifying the Fund's peer groups for purposes of performance and expense comparisons.
The Committee and the Board noted that, through December 31, 2012, the Fund's performance was in the forty-fourth, thirtieth and forty-ninth percentile (where the best performance would be in the first percentile) of its category selected by the independent third-party data provider for the purposes of performance comparisons for the one-, three- and five- year periods, respectively.
The Committee and the Board also considered the Investment Manager's performance and reputation generally, the Investment Manager's historical responsiveness to Board concerns about performance, and the Investment Manager's willingness to take steps intended to improve performance. After reviewing these and related factors, the Committee and the Board concluded, within the context of their overall conclusions, that the performance of the Fund supported the continuation of the Advisory Agreement.
Investment Advisory Fee Rates and Other Expenses
The Committee and the Board considered the advisory fees charged to the Fund under the Advisory Agreement as well as the total expenses incurred by the Fund. In assessing the reasonableness of the fees under the Advisory Agreement, the Committee and the Board considered, among other information, the Fund's advisory fee and its total expense ratio as a percentage of average daily net assets. The Committee and the Board noted that the Fund's actual management fee and total expense ratio are both ranked in the third quintile (where the lowest fees and expenses would be in the first quintile) against the Fund's expense universe as determined by the independent third-party data provider for purposes of expense comparison. The Committee and the Board also took into account the fee waiver and expense limitation arrangements agreed to by the Investment Manager, as noted above.
The Committee and the Board also received and considered information about the advisory fees charged by the Investment Manager to institutional separate accounts. In considering the fees charged to those accounts, the Committee and the Board took into account, among other things, the Investment Manager's representations about the differences between managing mutual funds as compared to other types of accounts, including differences in the services provided, differences in the risk
Annual Report 2013
73
Columbia Strategic Income Fund
Board Consideration and Approval of Advisory Agreement (continued)
profile of such business for the Investment Manager and the additional resources required to manage mutual funds effectively. In evaluating the Fund's advisory fees, the Committee and the Board also took into account the demands, complexity and quality of the investment management of the Fund.
After reviewing these and related factors, the Committee and the Board concluded, within the context of their overall conclusions, that the advisory fee rates and expenses of the Fund supported the continuation of the Advisory Agreement.
Costs of Services Provided and Profitability
The Committee and the Board also took note of the costs of the services provided (both on an absolute and relative basis) and the profitability to the Investment Manager and its affiliates in connection with their relationships with the Fund. In evaluating these considerations, the Committee and the Board took note of the advisory fees charged by the Investment Manager to other clients, including fees charged by the Investment Manager to institutional separate account clients with similar investment strategies to those of the Fund.
The Committee and the Board also considered the compensation directly or indirectly received by the Investment Manager's affiliates in connection with their relationships with the Fund. The Committee and the Board reviewed information provided by management as to the profitability of the Investment Manager and its affiliates of their relationships with the Fund, information about the allocation of expenses used to calculate profitability, and comparisons of profitability levels realized in 2012 to profitability levels realized in 2011. When reviewing profitability, the Committee and the Board also considered court cases in which adviser profitability was an issue in whole or in part, the performance of the Fund, the expense ratio of the Fund, and the implementation of expense limitations with respect to the Fund. The Committee and the Board also considered information provided by the Investment Manager regarding its financial condition and comparing its profitability to that of other asset management firms that are, or are subsidiaries of, publicly traded companies.
After reviewing these and related factors, the Committee and the Board concluded, within the context of their overall conclusions, that the costs of services provided and the profitability to the Investment Manager and its affiliates from their relationships with the Fund supported the continuation of the Advisory Agreement.
Economies of Scale
The Committee and the Board considered the potential existence of economies of scale in the provision by the Investment Manager of services to the Fund, to groups of related funds, and to the Investment Manager's investment advisory clients as a whole, and whether those economies of scale were shared with the Fund through breakpoints in investment advisory fees or other means, such as expense limitation arrangements and additional investments by the Investment Manager in investment, trading and compliance resources. The Committee and the Board noted that the investment advisory fee schedules for the Fund contained breakpoints that would reduce the fee rate on assets above specified threshold levels.
In considering these matters, the Committee and the Board also considered the costs of the services provided and the profitability to the Investment Manager and its affiliates from their relationships with the Fund, as discussed above. After reviewing these and related factors, the Committee and the Board concluded, within the context of their overall conclusions, that the extent to which any economies of scale were expected to be shared with the Fund supported the continuation of the Advisory Agreement.
Other Benefits to the Investment Manager
The Committee and the Board received and considered information regarding "fall-out" or ancillary benefits received by the Investment Manager and its affiliates as a result of their relationships with the Fund, such as the engagement of the Investment Manager to provide administrative services to the Fund and the engagement of the Investment Manager's affiliates to provide distribution and transfer agency services to the Fund. The Committee and the Board considered that the Fund's distributor retains a portion of the distribution fees from the Fund. The Committee and the Board also considered the benefits of research made available to the Investment Manager by reason of brokerage commissions generated by the Fund's securities transactions, and reviewed information about the Investment Manager's practices with respect to allocating portfolio transactions for brokerage and research services. The Committee and the Board considered the possible conflicts of interest associated with certain fall-out or other ancillary benefits and the reporting, disclosure and other processes that are in place to address such possible conflicts of interest. The Committee and the Board recognized that the Investment Manager's profitability would be somewhat lower without these benefits.
Annual Report 2013
74
Columbia Strategic Income Fund
Board Consideration and Approval of Advisory Agreement (continued)
Conclusion
The Committee and the Board reviewed all of the above considerations in reaching their decisions to recommend or approve the continuation of the Advisory Agreement. In their deliberations, the Trustees did not identify any particular information that was all-important or controlling, and individual Trustees may have attributed different weights to the various factors. Based on their evaluation of all factors that they deemed to be material, including those factors described above, and assisted by the advice of independent legal counsel, the Board, including the Independent Trustees, voting separately, unanimously approved the continuation of the Advisory Agreement.
Annual Report 2013
75
This page intentionally left blank.
Annual Report 2013
76
Columbia Strategic Income Fund
Important Information About This Report
Each fund mails one shareholder report to each shareholder address. If you would like more than one report, please call shareholder services at 800.345.6611 and additional reports will be sent to you.
The policy of the Board is to vote the proxies of the companies in which each fund holds investments consistent with the procedures as stated in the Statement of Additional Information (SAI). You may obtain a copy of the SAI without charge by calling 800.345.6611; contacting your financial intermediary; visiting columbiamanagement.com; or searching the website of the Securities and Exchange Commission (SEC) at sec.gov. Information regarding how each fund voted proxies relating to portfolio securities is filed with the SEC by August 31 for the most recent 12-month period ending June 30 of that year, and is available without charge by visiting columbiamanagement.com; or searching the website of the SEC at sec.gov.
Each fund files a complete schedule of portfolio holdings with the SEC for the first and third quarters of each fiscal year on Form N-Q. Each fund's Form N-Q is available on the SEC's website at sec.gov and may be reviewed and copied at the SEC's Public Reference Room in Washington, D.C. Information on the operation of the Public Reference Room may be obtained by calling 800.SEC.0330. Each fund's complete schedule of portfolio holdings, as filed on Form N-Q, can also be obtained without charge, upon request, by calling 800.345.6611.
Annual Report 2013
77

Columbia Strategic Income Fund
P.O. Box 8081
Boston, MA 02266-8081
columbiamanagement.com
This information is for use with concurrent or prior delivery of a fund prospectus. Please read and consider the investment objectives, risks, charges and expenses for any fund carefully before investing. For a prospectus and, if available, a summary prospectus, which contains this and other important information about the Fund go to columbiamanagement.com. The Fund is distributed by Columbia Management Investment Distributors, Inc., member FINRA, and managed by Columbia Management Investment Advisers, LLC.
© 2013 Columbia Management Investment Advisers, LLC. All rights reserved.
ANN232_10_C01_(12/13)
Item 2. Code of Ethics.
(a) The registrant has adopted a code of ethics that applies to the registrant’s principal executive officer, principal financial officer, principal accounting officer or controller, or persons performing similar functions, regardless of whether these individuals are employed by the registrant or a third party.
(b) During the period covered by this report, there were not any amendments to a provision of the code of ethics adopted in 2(a) above.
(c) During the period covered by this report, there were no waivers, including any implicit waivers, from a provision of the code of ethics described in 2(a) above that relates to one or more of the items set forth in paragraph (b) of this item’s instructions.
Item 3. Audit Committee Financial Expert.
The registrant’s Board of Trustees has determined that Douglas A. Hacker, David M. Moffett and Anne-Lee Verville, each of whom are members of the registrant’s Board of Trustees and Audit Committee, each qualify as an audit committee financial expert. Mr. Hacker, Mr. Moffett and Ms. Verville are each independent trustees, as defined in paragraph (a)(2) of this item’s instructions.
Item 4. Principal Accountant Fees and Services.
Fee information below is disclosed for the eight series of the registrant whose reports to stockholders are included in this annual filing. In addition, two series merged away on April 26, 2013 and the fees incurred by those series through its merger date are included in the response to this Item.
(a) Audit Fees. Aggregate Audit Fees billed by the principal accountant for professional services rendered during the fiscal years ended October 31, 2013 and October 31, 2012 are approximately as follows:
2013 | | 2012 | |
$ | 196,900 | | $ | 211,200 | |
| | | | | |
Audit Fees include amounts related to the audit of the registrant’s annual financial statements or services that are normally provided by the accountant in connection with statutory and regulatory filings or engagements for those fiscal years. Fiscal years 2013 also includes audit fees for the review and provision of consent in connection with filing Form N-14 for fund mergers.
(b) Audit-Related Fees. Aggregate Audit-Related Fees billed to the registrant by the principal accountant for professional services rendered during the fiscal years ended October 31, 2013 and October 31, 2012 are approximately as follows:
Audit-Related Fees include amounts for assurance and related services by the principal accountant that are reasonably related to the performance of the audit of the registrant’s financial statements and are not reported in Audit Fees above. In fiscal years 2013 and 2012, Audit-Related Fees consist of agreed-upon procedures performed for semi-annual shareholder reports.
During the fiscal years ended October 31, 2013 and October 31, 2012, there were no Audit-Related Fees billed by the registrant’s principal accountant to the registrant’s investment adviser (not including any sub-adviser whose role is primarily portfolio management and is subcontracted with or overseen by another investment adviser) and any entity controlling, controlled by, or under common control with the adviser that provides ongoing services to the registrant for an engagement that related directly to the operations and financial reporting of the registrant.
(c) Tax Fees. Aggregate Tax Fees billed by the principal accountant to the registrant for professional services rendered during the fiscal years ended October 31, 2013 and October 31, 2012 are approximately as follows:
2013 | | 2012 | |
$ | 52,700 | | $ | 31,700 | |
| | | | | |
Tax Fees include amounts for the review of annual tax returns, the review of required shareholder distribution calculations and typically include amounts for professional services by the principal accountant for tax compliance, tax advice and tax planning. Fiscal year 2013 also includes Tax Fees for agreed-upon procedures for fund mergers and the review of final tax returns.
During the fiscal years ended October 31, 2013 and October 31, 2012, there were no Tax Fees billed by the registrant’s principal accountant to the registrant’s investment adviser (not including any sub-adviser whose role is primarily portfolio management and is subcontracted with or overseen by another investment adviser) and any entity controlling, controlled by, or under common control with the adviser that provides ongoing services
to the registrant for an engagement that related directly to the operations and financial reporting of the registrant.
(d) All Other Fees. Aggregate All Other Fees billed by the principal accountant to the registrant for professional services rendered during the fiscal years ended October 31, 2013 and October 31, 2012 are approximately as follows:
All Other Fees include amounts for products and services provided by the principal accountant, other than the services reported in paragraphs (a) through (c) above.
Aggregate All Other Fees billed by the registrant’s principal accountant to the registrant’s investment adviser (not including any sub-adviser whose role is primarily portfolio management and is subcontracted with or overseen by another investment adviser) and any entity controlling, controlled by, or under common control with the adviser that provides ongoing services to the registrant for an engagement that related directly to the operations and financial reporting of the registrant during the fiscal years ended October 31, 2013 and October 31, 2012 are approximately as follows:
2013 | | 2012 | |
$ | 275,400 | | $ | 455,800 | |
| | | | | |
In fiscal years 2013 and 2012, All Other Fees consist of fees billed for internal control examinations of the registrant’s transfer agent and investment adviser. Fiscal year 2013 also includes fees billed for the review and provision of consent in connection with filing Form N-14 for fund mergers.
(e)(1) Audit Committee Pre-Approval Policies and Procedures
The registrant’s Audit Committee is required to pre-approve the engagement of the registrant’s independent auditors to provide audit and non-audit services to the registrant and non-audit services to its investment adviser (excluding any sub-adviser whose role is primarily portfolio management and is sub-contracted or overseen by another investment adviser (the “Adviser”) or any entity controlling, controlled by or under common control with the Adviser that provides ongoing services to the Fund (a “Control Affiliate”) if the engagement relates directly to the operations and financial reporting of the registrant.
The Audit Committee has adopted a Policy for Engagement of Independent Auditors for Audit and Non-Audit Services (the “Policy”). The Policy sets forth the understanding of the Audit Committee regarding the engagement of the registrant’s independent accountants to provide (i) audit and permissible audit-related, tax and other services to the registrant (“Fund Services”); (ii) non-audit services to the registrant’s Adviser and any Control Affiliates, that relates directly to the operations and financial reporting of a Fund (“Fund-related Adviser Services”); and (iii) certain other audit and non-audit
services to the registrant’s Adviser and its Control Affiliates. A service will require specific pre-approval by the Audit Committee if it is to be provided by the Fund’s independent auditor; provided, however, that pre-approval of non-audit services to the Fund, the Adviser or Control Affiliates may be waived if certain de minimis requirements set forth in the SEC’s rules are met.
Under the Policy, the Audit Committee may delegate pre-approval authority to any pre-designated member or members who are independent board members. The member(s) to whom such authority is delegated must report, for informational purposes only, any pre-approval decisions to the Audit Committee at its next regular meeting. The Audit Committee’s responsibilities with respect to the pre-approval of services performed by the independent auditor may not be delegated to management.
On an annual basis, at a regularly scheduled Audit Committee meeting, the Fund’s Treasurer or other Fund officer shall submit to the Audit Committee a schedule of the types of Fund Services and Fund-related Adviser Services that are subject to specific pre-approval. This schedule will provide a description of each type of service that is subject to specific pre-approval, along with total projected fees for each service. The pre-approval will generally cover a one-year period. The Audit Committee will review and approve the types of services and the projected fees for the next one-year period and may add to, or subtract from, the list of pre-approved services from time to time, based on subsequent determinations. This specific approval acknowledges that the Audit Committee is in agreement with the specific types of services that the independent auditor will be permitted to perform and the projected fees for each service.
The Fund’s Treasurer or other Fund officer shall report to the Audit Committee at each of its regular meetings regarding all Fund Services or Fund-related Adviser Services provided since the last such report was rendered, including a description of the services, by category, with forecasted fees for the annual reporting period, proposed changes requiring specific pre-approval and a description of services provided by the independent auditor, by category, with actual fees during the current reporting period.
*****
(e)(2) 100% of the services performed for items (b) through (d) above during 2013 and 2012 were pre-approved by the registrant’s Audit Committee.
(f) Not applicable.
(g) The aggregate non-audit fees billed by the registrant’s accountant for services rendered to the registrant, and rendered to the registrant’s investment adviser (not including any sub-adviser whose role is primarily portfolio management and is subcontracted with or overseen by another investment adviser), and any entity controlling, controlled by, or under common control with the adviser that provides ongoing services to the registrant during the fiscal years ended October 31, 2013 and October 31, 2012 are approximately as follows:
2013 | | 2012 | |
$ | 331,300 | | $ | 490,700 | |
| | | | | |
(h) The registrant’s Audit Committee of the Board of Directors has considered whether the provision of non-audit services that were rendered to the registrant’s adviser (not including any sub-adviser whose role is primarily portfolio management and is subcontracted with or overseen by another investment adviser), and any entity controlling, controlled by, or under common control with the investment adviser that provides ongoing services to the registrant that were not pre-approved pursuant to paragraph (c)(7)(ii) of Rule 2-01 of Regulation S-X, is compatible with maintaining the principal accountant’s independence.
Item 5. Audit Committee of Listed Registrants.
Not applicable.
Item 6. Investments
(a) The registrant’s “Schedule I — Investments in securities of unaffiliated issuers” (as set forth in 17 CFR 210.12-12) is included in Item 1 of this Form N-CSR.
(b) Not applicable.
Item 7. Disclosure of Proxy Voting Policies and Procedures for Closed-End Management Investment Companies.
Not applicable.
Item 8. Portfolio Managers of Closed-End Management Investment Companies.
Not applicable.
Item 9. Purchases of Equity Securities by Closed-End Management Investment Company and Affiliated Purchasers.
Not applicable.
Item 10. Submission of Matters to a Vote of Security Holders.
There were no material changes to the procedures by which shareholders may recommend nominees to the registrant’s board of directors.
Item 11. Controls and Procedures.
(a) The registrant’s principal executive officer and principal financial officers, based on their evaluation of the registrant’s disclosure controls and procedures as of a date within 90 days of the filing of this report, have concluded that such controls and procedures are adequately designed to ensure that material information required to be disclosed by the registrant in Form N-CSR is accumulated and communicated to the registrant’s management, including the principal executive officer and principal financial officer, or persons performing similar functions, as appropriate to allow timely decisions regarding required disclosure.
(b) There was no change in the registrant’s internal control over financial reporting that occurred during the registrant’s second fiscal quarter of the period covered by this report that has materially affected, or is reasonably likely to materially affect, the registrant’s internal control over financial reporting.
Item 12. Exhibits.
(a)(1) Code of ethics required to be disclosed under Item 2 of Form N-CSR attached hereto as Exhibit 99.CODE ETH.
(a)(2) Certifications pursuant to Rule 30a-2(a) under the Investment Company Act of 1940 (17 CFR 270.30a-2(a)) attached hereto as Exhibit 99.CERT.
(a)(3) Not applicable.
(b) Certification pursuant to Rule 30a-2(b) under the Investment Company Act of 1940 (17 CFR 270.30a-2(b)) attached hereto as Exhibit 99.906CERT.
SIGNATURES
Pursuant to the requirements of the Securities Exchange Act of 1934 and the Investment Company Act of 1940, the registrant has duly caused this report to be signed on its behalf by the undersigned, thereunto duly authorized.
(registrant) | | | Columbia Funds Series Trust I | |
| | |
| | |
By (Signature and Title) | | | /s/ J. Kevin Connaughton | |
| | J. Kevin Connaughton, President and Principal Executive Officer |
| | |
| | |
Date | | | December 19, 2013 | |
| | |
| | |
Pursuant to the requirements of the Securities Exchange Act of 1934 and the Investment Company Act of 1940, this report has been signed below by the following persons on behalf of the registrant and in the capacities and on the dates indicated. |
| | |
| | |
By (Signature and Title) | | | /s/ J. Kevin Connaughton | |
| | J. Kevin Connaughton, President and Principal Executive Officer |
| | |
| | |
Date | | | December 19, 2013 | |
| | |
| | |
By (Signature and Title) | | | /s/ Michael G. Clarke | |
| | Michael G. Clarke, Treasurer and Chief Financial Officer |
| | |
| | |
Date | | | December 19, 2013 | |
| | | | | | |