UNITED STATES
SECURITIES AND EXCHANGE COMMISSION
Washington, D.C. 20549
FORM N-CSR
CERTIFIED SHAREHOLDER REPORT OF REGISTERED
MANAGEMENT INVESTMENT COMPANIES
Investment Company Act file number | 811-04367 |
|
Columbia Funds Series Trust I |
(Exact name of registrant as specified in charter) |
|
225 Franklin Street, Boston, MA | | 02110 |
(Address of principal executive offices) | | (Zip code) |
|
Christopher O. Petersen, Esq.
c/o Columbia Management Investment Advisers, LLC
225 Franklin Street
Boston, MA 02110 |
(Name and address of agent for service) |
|
Registrant’s telephone number, including area code: | (800) 345-6611 | |
|
Date of fiscal year end: | April 30 | |
|
Date of reporting period: | April 30, 2014 | |
| | | | | | | | |
Form N-CSR is to be used by management investment companies to file reports with the Commission not later than 10 days after the transmission to stockholders of any report that is required to be transmitted to stockholders under Rule 30e-1 under the Investment Company Act of 1940 (17 CFR 270.30e-1). The Commission may use the information provided on Form N-CSR in its regulatory, disclosure review, inspection, and policymaking roles.
A registrant is required to disclose the information specified by Form N-CSR, and the Commission will make this information public. A registrant is not required to respond to the collection of information contained in Form N-CSR unless the Form displays a currently valid Office of Management and Budget (“OMB”) control number. Please direct comments concerning the accuracy of the information collection burden estimate and any suggestions for reducing the burden to Secretary, Securities and Exchange Commission, 450 Fifth Street, NW, Washington, DC 20549-0609. The OMB has reviewed this collection of information under the clearance requirements of 44 U.S.C. § 3507.
Item 1. Reports to Stockholders.
Annual Report
April 30, 2014

Columbia Small Cap Value Fund I
Not FDIC insured • No bank guarantee • May lose value
 Dear Shareholders,
Continued Economic Recovery
The U.S. economy continued to recover at a slow but steady pace during the first quarter of 2014, supported by solid manufacturing activity, reasonable job growth and continued gains for the housing market. Industrial production was robust, buoyed by strong demand for autos and related parts. After a disappointing January, job growth picked up, which helped boost consumer confidence. Housing data was somewhat mixed, as harsh weather and higher mortgage rates put a damper on sales, while lower inventories helped prices trend higher. The Federal Reserve (the Fed) announced further reductions to its monthly asset purchases and reassured the markets that it would not make any significant changes to monetary policy until it was satisfied that the labor market was on solid ground. Despite mostly good news on the economic front, the broad financial markets recorded only modest gains, as bitter winter weather at home and mounting tensions between Russia and Western allies prompted investor caution.
Investors braced for higher interest rates, but long-term yields declined and the fixed-income markets were surprisingly resilient in the face of stable-to-improving economic data. Risk-on trading continued during the quarter as the higher yielding sectors of the fixed-income markets generally fared well. Emerging-market bonds, long-term U.S. Treasuries and sovereign debt were among the strongest performers, as were Treasury Inflation Protected Securities. Municipal bonds delivered solid gains, especially high-yield municipals, which benefited from continued improvement in state finances.
Against this backdrop, the broad bond market, as measured by the Barclays U.S. Aggregate Bond Index, edged out the broad stock market, as measured by the Standard & Poor's 500 Index, with gains of 1.84% vs. 1.81%, respectively. As indicated late last year, the Fed began tapering its monthly asset purchase program and announced further reductions. New Fed chair Janet Yellen reassured investors the Fed was committed to keeping short-term borrowing rates low into 2015.
Stay on Track with Columbia Management
Backed by more than 100 years of experience, Columbia Management is one of the nation's largest asset managers. At the heart of our success and, most importantly, that of our investors, are highly talented industry professionals, brought together by a unique way of working. At Columbia Management, reaching our performance goals matters, and how we reach them matters just as much.
Visit columbiamanagement.com for:
> The Columbia Management Perspectives blog, offering insights on current market events and investment opportunities
> Detailed up-to-date fund performance and portfolio information
> Quarterly fund commentaries
> Columbia Management investor, our award-winning quarterly newsletter for shareholders
Thank you for your continued support of the Columbia Funds. We look forward to serving your investment needs for many years to come.
Best Regards,

J. Kevin Connaughton
President, Columbia Funds
Investing involves risk including the risk of loss of principal.
The Barclays U.S. Aggregate Bond Index is a broad-based benchmark that measures the investment grade, U.S. dollar denominated, fixed-rate taxable bond market, including Treasuries, government-related and corporate securities, mortgage-backed securities (agency fixed-rate and hybrid adjustable-rate mortgage passthroughs), asset-backed securities, and commercial mortgage-backed securities. The S&P 500 Index, an unmanaged index, measures the performance of 500 widely held, large-capitalization U.S. stocks and is frequently used as a general measure of market performance. Indices are not available for investment, are not professionally managed and do not reflect sales charges, fees, brokerage commissions, taxes or other expenses of investing.
Investors should consider the investment objectives, risks, charges and expenses of a mutual fund carefully before investing. For a free prospectus and, if available, a summary prospectus, which contains this and other important information about a fund, visit columbiamanagement.com. The prospectus should be read carefully before investing.
Columbia Funds are distributed by Columbia Management Investment Distributors, Inc., member FINRA, and managed by Columbia Management Investment Advisers, LLC.
© 2014 Columbia Management Investment Advisers, LLC. All rights reserved.
Columbia Small Cap Value Fund I
Performance Overview | | | 2 | | |
Manager Discussion of Fund Performance | | | 4 | | |
Understanding Your Fund's Expenses | | | 6 | | |
Portfolio of Investments | | | 7 | | |
Statement of Assets and Liabilities | | | 14 | | |
Statement of Operations | | | 16 | | |
Statement of Changes in Net Assets | | | 17 | | |
Financial Highlights | | | 20 | | |
Notes to Financial Statements | | | 29 | | |
Report of Independent Registered
Public Accounting Firm | | | 35 | | |
Federal Income Tax Information | | | 36 | | |
Trustees and Officers | | | 37 | | |
Important Information About This Report | | | 41 | | |
Fund Investment Manager
Columbia Management Investment
Advisers, LLC
225 Franklin Street
Boston, MA 02110
Fund Distributor
Columbia Management Investment
Distributors, Inc.
225 Franklin Street
Boston, MA 02110
Fund Transfer Agent
Columbia Management Investment
Services Corp.
P.O. Box 8081
Boston, MA 02266-8081
For more information about any of the funds, please visit columbiamanagement.com or call 800.345.6611. Customer Service Representatives are available to answer your questions Monday through Friday from 8 a.m. to 7 p.m. Eastern time.
The views expressed in this report reflect the current views of the respective parties. These views are not guarantees of future performance and involve certain risks, uncertainties and assumptions that are difficult to predict, so actual outcomes and results may differ significantly from the views expressed. These views are subject to change at any time based upon economic, market or other conditions and the respective parties disclaim any responsibility to update such views. These views may not be relied on as investment advice and, because investment decisions for a Columbia Fund are based on numerous factors, may not be relied on as an indication of trading intent on behalf of any particular Columbia Fund. References to specific securities should not be construed as a recommendation or investment advice.
Columbia Small Cap Value Fund I
Performance Summary
> Columbia Small Cap Value Fund I (the Fund) Class A shares returned 22.95% excluding sales charges for the 12-month period that ended April 30, 2014.
> The Fund outperformed its benchmark, the Russell 2000 Value Index, which returned 19.61% for the same time period.
> Security selection, especially in the financial services sector, aided the Fund's performance advantage over its benchmark.
Average Annual Total Returns (%) (for period ended April 30, 2014)
| | | Inception | | 1 Year | | 5 Years | | 10 Years | |
Class A | | 07/25/86 | | | | | | | | | | | | | |
Excluding sales charges | | | | | | | 22.95 | | | | 17.44 | | | | 8.71 | | |
Including sales charges | | | | | | | 15.87 | | | | 16.06 | | | | 8.07 | | |
Class B | | 11/09/92 | | | | | | | | | | | | | |
Excluding sales charges | | | | | | | 22.02 | | | | 16.56 | | | | 7.90 | | |
Including sales charges | | | | | | | 17.02 | | | | 16.34 | | | | 7.90 | | |
Class C | | 01/15/96 | | | | | | | | | | | | | |
Excluding sales charges | | | | | | | 22.03 | | | | 16.55 | | | | 7.90 | | |
Including sales charges | | | | | | | 21.03 | | | | 16.55 | | | | 7.90 | | |
Class I* | | 09/27/10 | | | 23.51 | | | | 17.82 | | | | 8.89 | | |
Class R* | | 09/27/10 | | | 22.65 | | | | 17.16 | | | | 8.45 | | |
Class R4* | | 11/08/12 | | | 23.26 | | | | 17.54 | | | | 8.76 | | |
Class R5* | | 11/08/12 | | | 23.44 | | | | 17.58 | | | | 8.78 | | |
Class Y* | | 07/15/09 | | | 23.50 | | | | 17.93 | | | | 8.94 | | |
Class Z | | 07/31/95 | | | 23.24 | | | | 17.73 | | | | 8.99 | | |
Russell 2000 Value Index | | | | | | | 19.61 | | | | 19.13 | | | | 8.37 | | |
Returns for Class A are shown with and without the maximum initial sales charge of 5.75%. Returns for Class B are shown with and without the applicable contingent deferred sales charge (CDSC) of 5.00% in the first year, declining to 1.00% in the sixth year and eliminated thereafter. Returns for Class C are shown with and without the 1.00% CDSC for the first year only. The Fund's other classes are not subject to sales charges and have limited eligibility. Please see the Fund's prospectus for details. Performance for different share classes will vary based on differences in sales charges and fees associated with each class. All results shown assume reinvestment of distributions during the period. Returns do not reflect the deduction of taxes that a shareholder may pay on Fund distributions or on the redemption of Fund shares. Performance results reflect the effect of any fee waivers or reimbursements of Fund expenses by Columbia Management Investment Advisers, LLC and/or any of its affiliates. Absent these fee waivers or expense reimbursement arrangements, performance results would have been lower.
The performance information shown represents past performance and is not a guarantee of future results. The investment return and principal value of your investment will fluctuate so that your shares, when redeemed, may be worth more or less than their original cost. Current performance may be lower or higher than the performance information shown. You may obtain performance information current to the most recent month-end by contacting your financial intermediary, visiting columbiamanagement.com or calling 800.345.6611.
*The returns shown for periods prior to the share class inception date (including returns for the Life of the Fund, if shown, which are since Fund inception) include the returns of the Fund's oldest share class. These returns are adjusted to reflect any higher class-related operating expenses of the newer share classes, as applicable. Please visit columbiamanagement.com/mutual-funds/appended-performance for more information.
The Russell 2000 Value Index, an unmanaged index, tracks the performance of those Russell 2000 Index companies with lower price-to-book ratios and lower forecasted growth values.
Indices are not available for investment, are not professionally managed and do not reflect sales charges, fees, brokerage commissions, taxes or other expenses of investing. Securities in the Fund may not match those in an index.
Annual Report 2014
2
Columbia Small Cap Value Fund I
Performance Overview (continued)
Performance of a Hypothetical $10,000 Investment (May 1, 2004 – April 30, 2014)
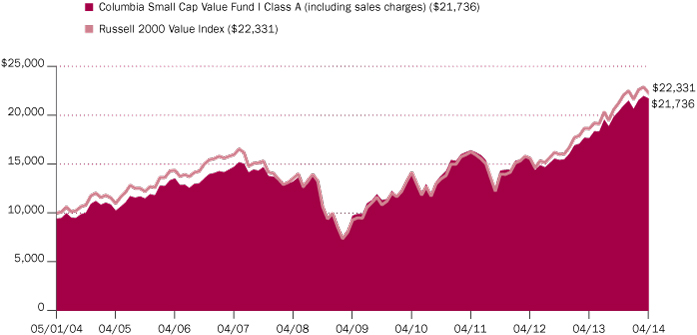
The chart above shows the change in value of a hypothetical $10,000 investment in Class A shares of Columbia Small Cap Value Fund I during the stated time period, and does not reflect the deduction of taxes that a shareholder may pay on Fund distributions or on the redemption of Fund shares.
Annual Report 2014
3
Columbia Small Cap Value Fund I
Manager Discussion of Fund Performance
For the 12-month period that ended April 30, 2014, the Fund's Class A shares returned 22.95% excluding sales charges. The Fund outperformed its benchmark, the Russell 2000 Value Index, which returned 19.61% for the same time period. Security selection that focused on reasonably priced small-cap companies with good earnings growth prospects, solid balance sheets and strong cash flows drove the Fund's performance advantage over its benchmark.
Stocks Climbed Amid Largely Favorable Market Environment
U.S. stocks set new records over the 12 months ended April 30, 2014, supported by evidence of economic recovery that included continued job gains, a pickup in manufacturing and an improving housing market. Stocks pushed past declines last spring when the U.S. Federal Reserve (the Fed) appeared ready to taper its bond buying, last fall during the budget stalemate and government shutdown in Washington and over the winter as harsh weather hit the country. Stocks rebooted each time, first when the Fed's tapering plans were pushed out, later when Congress reached a bipartisan budget agreement and then in February when new Fed chair Janet Yellen indicated that monetary policy was still tied to the economy's progress. Although unrest in the Ukraine and the potential for first-quarter earnings shortfalls kept a lid on returns late in the period, stocks across all market capitalization ranges finished the year with strong gains. Within the Russell 2000 Value Index, the energy, health care, industrials and information technology sectors did especially well, each returning 25% or more.
Higher-Quality Stocks Moved Back Into Favor
The Fund's higher quality bias benefited performance, as the prospect of Fed tapering caused investors to shift away from lower quality issues. A value tilt also helped, as worries over rising interest rates led investors to sell high-priced growth stocks late in the period. Stock selection in the financial services sector (which averaged approximately 35% of assets during the period) was particularly strong. We favored segments that we believed were poised to benefit from improved economic growth and higher interest rates, including banks and insurance companies. Top individual contributors included Glacier Bancorp, a bank holding company with excess capital, whose stock rallied sharply as the company grew its franchise in the Rocky Mountain region, funded strategic acquisitions and generated a high dividend yield. Underweights in the weaker-performing real estate investment trust and business development corporation segments also contributed to the Fund's strong results.
Outperformance from Multiple Sectors
Security selection in materials, health care, industrials and telecommunications services drove most of the rest of the Fund's outperformance. Standouts included U.S. Silica Holdings, a materials company that supplies crush-resistant quartz (or "frac") sand used in oil and gas wells. The company benefited from increased demand for its product. In health care, shares of biopharmaceutical company Questcor Pharmaceuticals rallied, as an attractive valuation and growing sales of its anti-inflammatory drug Acthar drove the stock sharply higher. We took profits and sold U.S. Silica and Questcor before period-end. In industrials, the Fund benefited as its focus on solid businesses providing essential services led to an overweight in the strong-performing aerospace and defense segment. Elsewhere,
Portfolio Management
Jeremy Javidi, CFA
John Barrett, CFA
Morningstar Style BoxTM
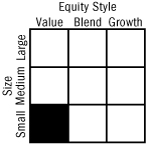
The Morningstar Style BoxTM is based on a fund's portfolio holdings. For equity funds, the vertical axis shows the market capitalization of the stocks owned, and the horizontal axis shows investment style (value, blend, or growth). Information shown is based on the most recent data provided by Morningstar.
© 2014 Morningstar, Inc. All rights reserved. The Morningstar information contained herein: (1) is proprietary to Morningstar and/or its content providers; (2) may not be copied or distributed; and (3) is not warranted to be accurate, complete or timely. Neither Morningstar nor its content providers are responsible for any damages or losses arising from any use of this information.
Top Ten Holdings (%)
(at April 30, 2014) | |
Greif, Inc., Class A | | | 1.3 | | |
Esterline Technologies Corp. | | | 1.1 | | |
Dana Holding Corp. | | | 1.1 | | |
Stone Energy Corp. | | | 1.0 | | |
Highwoods Properties, Inc. | | | 1.0 | | |
IDACORP, Inc. | | | 0.9 | | |
Southwest Gas Corp. | | | 0.9 | | |
Hancock Holding Co. | | | 0.9 | | |
EPL Oil & Gas, Inc. | | | 0.9 | | |
Symetra Financial Corp. | | | 0.8 | | |
Percentages indicated are based upon total investments (excluding Money Market Funds).
For further detail about these holdings, please refer to the section entitled "Portfolio of Investments."
Fund holdings are as of the date given, are subject to change at any time, and are not recommendations to buy or sell any security.
Annual Report 2014
4
Columbia Small Cap Value Fund I
Manager Discussion of Fund Performance (continued)
top contributors included Gentherm, a consumer discretionary company that develops and markets thermal technologies for heating and cooling systems. Its share price rose, thanks to more automakers adopting its climate control systems for car seats, a strategic acquisition, and expansion into new markets, including mattresses. Shares of diversified oil-and-gas company Stone Energy also climbed, buoyed by successful deep-water explorations, growing reserves and solid earnings growth.
Relative Disappointment in Information Technology
Stock picks in information technology generated a strong return, but trailed the sector's return in the benchmark. Detractors here included Conversant (formerly ValueClick), an advertising software company whose move to mobile has been bumpy, causing it to lose favor with retail customers. Other individual disappointments were scattered. They included independent exploration-and-production company Forest Oil, whose return was hampered by poor rock quality in a target drilling area; home goods retailer Pier 1 Imports, which saw the tough winter pressure sales; and mining and agricultural tire manufacturer Titan International, whose share price fell as declining commodity prices slowed demand. Conversant and Forest Oil were sold from the portfolio by the end of the reporting period.
Looking Ahead
Barring geopolitical shocks, we believe the U.S. economy seems likely to continue expanding at a slow and steady pace. Going forward, we expect stock selection to be a key component of performance, particularly because there is so little valuation differential between sectors at present. We intend to remain focused on higher quality small-cap stocks with stable or positive earnings growth and attractive or reasonable valuations that we think can perform well over a full economic cycle.
Portfolio Breakdown (%)
(at April 30, 2014) | |
Common Stocks | | | 99.5 | | |
Consumer Discretionary | | | 9.8 | | |
Consumer Staples | | | 3.2 | | |
Energy | | | 8.6 | | |
Financials | | | 34.7 | | |
Health Care | | | 5.1 | | |
Industrials | | | 13.8 | | |
Information Technology | | | 11.1 | | |
Materials | | | 5.6 | | |
Telecommunication Services | | | 0.7 | | |
Utilities | | | 6.9 | | |
Money Market Funds | | | 0.5 | | |
Total | | | 100.0 | | |
Percentages indicated are based upon total investments. The Fund's portfolio composition is subject to change.
Investment Risks
Risks include general stock market fluctuations due to business and economic developments. Investments in small-cap companies may be subject to greater volatility and price fluctuations because they may be thinly traded and less liquid. Value stocks may also be subject to specific business risks that have caused the stocks to be out of favor. See the Fund's prospectus for more information on these and other risks.
Annual Report 2014
5
Columbia Small Cap Value Fund I
Understanding Your Fund's Expenses
(Unaudited)
As an investor, you incur two types of costs. There are transaction costs, which generally include sales charges on purchases and may include redemption fees. There are also ongoing costs, which generally include management fees, distribution and/or service fees, and other fund expenses. The following information is intended to help you understand your ongoing costs (in dollars) of investing in the Fund and to help you compare these costs with the ongoing costs of investing in other mutual funds.
Analyzing Your Fund's Expenses
To illustrate these ongoing costs, we have provided examples and calculated the expenses paid by investors in each share class of the Fund during the period. The actual and hypothetical information in the table is based on an initial investment of $1,000 at the beginning of the period indicated and held for the entire period. Expense information is calculated two ways and each method provides you with different information. The amount listed in the "Actual" column is calculated using the Fund's actual operating expenses and total return for the period. You may use the Actual information, together with the amount invested, to estimate the expenses that you paid over the period. Simply divide your account value by $1,000 (for example, an $8,600 account value divided by $1,000 = 8.6), then multiply the results by the expenses paid during the period under the "Actual" column. The amount listed in the "Hypothetical" column assumes a 5% annual rate of return before expenses (which is not the Fund's actual return) and then applies the Fund's actual expense ratio for the period to the hypothetical return. You should not use the hypothetical account values and expenses to estimate either your actual account balance at the end of the period or the expenses you paid during the period. See "Compare With Other Funds" below for details on how to use the hypothetical data.
Compare With Other Funds
Since all mutual funds are required to include the same hypothetical calculations about expenses in shareholder reports, you can use this information to compare the ongoing cost of investing in the Fund with other funds. To do so, compare the hypothetical example with the 5% hypothetical examples that appear in the shareholder reports of other funds. As you compare hypothetical examples of other funds, it is important to note that hypothetical examples are meant to highlight the ongoing costs of investing in a fund only and do not reflect any transaction costs, such as sales charges, or redemption or exchange fees. Therefore, the hypothetical calculations are useful in comparing ongoing costs only, and will not help you determine the relative total costs of owning different funds. If transaction costs were included in these calculations, your costs would be higher.
November 1, 2013 – April 30, 2014
| | | Account Value at the Beginning
of the Period ($) | | Account Value at the End
of the Period ($) | | Expenses Paid During
the Period ($) | | Fund's Annualized
Expense Ratio (%) | |
| | | Actual | | Hypothetical | | Actual | | Hypothetical | | Actual | | Hypothetical | | Actual | |
Class A | | | 1,000.00 | | | | 1,000.00 | | | | 1,064.40 | | | | 1,018.30 | | | | 6.71 | | | | 6.56 | | | | 1.31 | | |
Class B | | | 1,000.00 | | | | 1,000.00 | | | | 1,060.40 | | | | 1,014.58 | | | | 10.52 | | | | 10.29 | | | | 2.06 | | |
Class C | | | 1,000.00 | | | | 1,000.00 | | | | 1,060.50 | | | | 1,014.58 | | | | 10.52 | | | | 10.29 | | | | 2.06 | | |
Class I | | | 1,000.00 | | | | 1,000.00 | | | | 1,066.80 | | | | 1,020.53 | | | | 4.41 | | | | 4.31 | | | | 0.86 | | |
Class R | | | 1,000.00 | | | | 1,000.00 | | | | 1,063.20 | | | | 1,017.06 | | | | 7.98 | | | | 7.80 | | | | 1.56 | | |
Class R4 | | | 1,000.00 | | | | 1,000.00 | | | | 1,065.80 | | | | 1,019.54 | | | | 5.43 | | | | 5.31 | | | | 1.06 | | |
Class R5 | | | 1,000.00 | | | | 1,000.00 | | | | 1,066.50 | | | | 1,020.28 | | | | 4.66 | | | | 4.56 | | | | 0.91 | | |
Class Y | | | 1,000.00 | | | | 1,000.00 | | | | 1,066.60 | | | | 1,020.53 | | | | 4.41 | | | | 4.31 | | | | 0.86 | | |
Class Z | | | 1,000.00 | | | | 1,000.00 | | | | 1,065.60 | | | | 1,019.54 | | | | 5.43 | | | | 5.31 | | | | 1.06 | | |
Expenses paid during the period are equal to the annualized expense ratio for each class as indicated above, multiplied by the average account value over the period and then multiplied by the number of days in the Fund's most recent fiscal half year and divided by 365.
Expenses do not include fees and expenses incurred indirectly by the Fund from the underlying funds in which the Fund may invest (also referred to as "acquired funds"), including affiliated and non-affiliated pooled investment vehicles (including mutual funds and exchange-traded funds).
Annual Report 2014
6
Columbia Small Cap Value Fund I
Portfolio of Investments
April 30, 2014
(Percentages represent value of investments compared to net assets)
Common Stocks 99.7%
Issuer | | Shares | | Value ($) | |
Consumer Discretionary 9.8% | |
Auto Components 2.1% | |
Dana Holding Corp. | | | 671,258 | | | | 14,210,532 | | |
Fuel Systems Solutions, Inc.(a) | | | 270,901 | | | | 2,839,042 | | |
Gentherm, Inc.(a) | | | 179,406 | | | | 6,521,408 | | |
Remy International, Inc. | | | 167,307 | | | | 4,436,982 | | |
Total | | | | | 28,007,964 | | |
Distributors 0.2% | |
VOXX International Corp.(a) | | | 211,761 | | | | 2,488,192 | | |
Diversified Consumer Services 0.5% | |
K12, Inc.(a) | | | 147,500 | | | | 3,492,800 | | |
Steiner Leisure Ltd.(a) | | | 17,442 | | | | 752,971 | | |
Universal Technical Institute, Inc. | | | 244,707 | | | | 2,938,931 | | |
Total | | | | | 7,184,702 | | |
Hotels, Restaurants & Leisure 0.5% | |
Life Time Fitness, Inc.(a) | | | 151,051 | | | | 7,250,448 | | |
Household Durables 0.5% | |
Cavco Industries, Inc.(a) | | | 50,867 | | | | 3,965,083 | | |
UCP Inc., Class A(a) | | | 253,883 | | | | 3,592,444 | | |
Total | | | | | 7,557,527 | | |
Internet & Catalog Retail 0.2% | |
PetMed Express, Inc. | | | 168,665 | | | | 2,207,825 | | |
Leisure Products 0.6% | |
Malibu Boats, Inc., Class A(a) | | | 106,284 | | | | 2,365,882 | | |
Smith & Wesson Holding Corp.(a) | | | 357,580 | | | | 5,488,853 | | |
Total | | | | | 7,854,735 | | |
Multiline Retail 0.3% | |
Tuesday Morning Corp.(a) | | | 278,692 | | | | 3,896,114 | | |
Specialty Retail 2.5% | |
Children's Place Retail Stores, Inc. (The) | | | 120,350 | | | | 5,776,800 | | |
Citi Trends, Inc.(a) | | | 232,117 | | | | 3,943,668 | | |
Destination Maternity Corp. | | | 156,200 | | | | 3,851,892 | | |
Finish Line, Inc., Class A (The) | | | 298,147 | | | | 8,207,987 | | |
Haverty Furniture Companies, Inc. | | | 166,277 | | | | 4,246,715 | | |
Pier 1 Imports, Inc. | | | 259,140 | | | | 4,731,896 | | |
Shoe Carnival, Inc. | | | 124,066 | | | | 2,833,667 | | |
Total | | | | | 33,592,625 | | |
Common Stocks (continued)
Issuer | | Shares | | Value ($) | |
Textiles, Apparel & Luxury Goods 2.4% | |
Columbia Sportswear Co. | | | 93,962 | | | | 8,078,853 | | |
Crocs, Inc.(a) | | | 65,830 | | | | 996,008 | | |
Deckers Outdoor Corp.(a) | | | 92,450 | | | | 7,298,928 | | |
G-III Apparel Group Ltd.(a) | | | 83,020 | | | | 5,958,345 | | |
Steven Madden Ltd.(a) | | | 293,340 | | | | 10,445,837 | | |
Total | | | | | 32,777,971 | | |
Total Consumer Discretionary | | | | | 132,818,103 | | |
Consumer Staples 3.2% | |
Food & Staples Retailing 0.6% | |
Andersons, Inc. (The) | | | 133,942 | | | | 8,343,247 | | |
Food Products 2.1% | |
Chiquita Brands International, Inc.(a) | | | 380,977 | | | | 4,373,616 | | |
Darling International, Inc.(a) | | | 542,410 | | | | 10,853,624 | | |
Fresh Del Monte Produce, Inc. | | | 389,530 | | | | 11,253,522 | | |
John B. Sanfilippo & Son, Inc. | | | 89,364 | | | | 2,059,840 | | |
Total | | | | | 28,540,602 | | |
Personal Products 0.5% | |
Inter Parfums, Inc. | | | 164,992 | | | | 6,037,057 | | |
Total Consumer Staples | | | | | 42,920,906 | | |
Energy 8.6% | |
Energy Equipment & Services 2.3% | |
Dawson Geophysical Co. | | | 152,651 | | | | 4,313,917 | | |
Gulf Island Fabrication, Inc. | | | 190,984 | | | | 3,831,139 | | |
Newpark Resources, Inc.(a) | | | 563,579 | | | | 6,785,491 | | |
Tesco Corp.(a) | | | 304,238 | | | | 6,084,760 | | |
TGC Industries, Inc.(a) | | | 215,313 | | | | 1,089,484 | | |
Tidewater, Inc. | | | 191,791 | | | | 9,767,916 | | |
Total | | | | | 31,872,707 | | |
Oil, Gas & Consumable Fuels 6.3% | |
Alpha Natural Resources, Inc.(a) | | | 789,660 | | | | 3,395,538 | | |
Arch Coal, Inc. | | | 1,156,478 | | | | 5,296,669 | | |
Bill Barrett Corp.(a) | | | 270,310 | | | | 6,400,941 | | |
Comstock Resources, Inc. | | | 356,300 | | | | 9,905,140 | | |
Energy XXI Bermuda Ltd. | | | 53,750 | | | | 1,286,238 | | |
EPL Oil & Gas, Inc.(a) | | | 294,410 | | | | 11,523,207 | | |
The accompanying Notes to Financial Statements are an integral part of this statement.
Annual Report 2014
7
Columbia Small Cap Value Fund I
Portfolio of Investments (continued)
April 30, 2014
Common Stocks (continued)
Issuer | | Shares | | Value ($) | |
Goodrich Petroleum Corp.(a) | | | 398,790 | | | | 10,029,568 | | |
Rex Energy Corp.(a) | | | 293,412 | | | | 6,179,257 | | |
Stone Energy Corp.(a) | | | 285,946 | | | | 14,025,651 | | |
VAALCO Energy, Inc.(a) | | | 501,017 | | | | 4,619,377 | | |
Western Refining, Inc. | | | 177,980 | | | | 7,742,130 | | |
World Fuel Services Corp. | | | 94,970 | | | | 4,324,934 | | |
Total | | | | | 84,728,650 | | |
Total Energy | | | | | 116,601,357 | | |
Financials 34.7% | |
Banks 12.6% | |
Ameris Bancorp(a) | | | 337,492 | | | | 7,178,455 | | |
BancFirst Corp. | | | 109,175 | | | | 6,355,077 | | |
BankUnited, Inc. | | | 260,439 | | | | 8,591,883 | | |
Banner Corp. | | | 68,968 | | | | 2,726,995 | | |
Bridge Bancorp, Inc. | | | 78,860 | | | | 1,917,875 | | |
Bryn Mawr Bank Corp. | | | 245,108 | | | | 6,686,546 | | |
Capital City Bank Group, Inc. | | | 303,017 | | | | 4,211,936 | | |
Chemical Financial Corp. | | | 264,562 | | | | 7,426,255 | | |
Columbia Banking System, Inc. | | | 283,503 | | | | 7,036,544 | | |
Community Trust Bancorp, Inc. | | | 161,549 | | | | 5,956,312 | | |
First Citizens BancShares Inc., Class A | | | 29,241 | | | | 6,576,008 | | |
First Commonwealth Financial Corp. | | | 946,367 | | | | 8,129,293 | | |
First Financial Corp. | | | 280,816 | | | | 8,988,920 | | |
First NBC Bank Holding Co.(a) | | | 118,154 | | | | 3,674,589 | | |
FirstMerit Corp. | | | 279,020 | | | | 5,410,198 | | |
Glacier Bancorp, Inc. | | | 121,338 | | | | 3,113,533 | | |
Hancock Holding Co. | | | 346,773 | | | | 11,696,653 | | |
Home Federal Bancorp, Inc. | | | 581,079 | | | | 8,745,239 | | |
Hudson Valley Holding Corp. | | | 163,052 | | | | 2,993,635 | | |
Investors Bancorp, Inc. | | | 352,886 | | | | 9,432,643 | | |
Merchants Bancshares, Inc. | | | 201,572 | | | | 5,859,698 | | |
Northrim BanCorp, Inc. | | | 276,183 | | | | 6,625,630 | | |
Sterling Bancorp | | | 400,612 | | | | 4,791,319 | | |
Synovus Financial Corp. | | | 1,650,789 | | | | 5,299,033 | | |
TowneBank | | | 145,271 | | | | 2,241,532 | | |
Union Bankshares Corp. | | | 209,174 | | | | 5,352,763 | | |
Washington Banking Co. | | | 107,026 | | | | 1,840,847 | | |
Wintrust Financial Corp. | | | 241,875 | | | | 10,840,837 | | |
Total | | | | | 169,700,248 | | |
Common Stocks (continued)
Issuer | | Shares | | Value ($) | |
Capital Markets 0.7% | |
GFI Group, Inc. | | | 724,669 | | | | 2,695,769 | | |
INTL FCStone, Inc.(a) | | | 343,085 | | | | 6,491,168 | | |
Total | | | | | 9,186,937 | | |
Consumer Finance 0.6% | |
Cash America International, Inc. | | | 194,838 | | | | 8,485,195 | | |
Diversified Financial Services 0.8% | |
Interactive Brokers Group, Inc., Class A | | | 264,877 | | | | 6,330,560 | | |
Pico Holdings, Inc.(a) | | | 189,166 | | | | 4,398,110 | | |
Total | | | | | 10,728,670 | | |
Insurance 7.5% | |
American Equity Investment Life
Holding Co. | | | 420,302 | | | | 9,801,443 | | |
Argo Group International Holdings Ltd. | | | 196,164 | | | | 8,713,605 | | |
Baldwin & Lyons, Inc., Class B | | | 190,811 | | | | 4,962,994 | | |
EMC Insurance Group, Inc. | | | 149,668 | | | | 4,937,547 | | |
Endurance Specialty Holdings Ltd. | | | 154,030 | | | | 7,827,805 | | |
FBL Financial Group, Inc., Class A | | | 122,356 | | | | 5,470,537 | | |
Hanover Insurance Group, Inc. (The) | | | 155,060 | | | | 9,063,257 | | |
Horace Mann Educators Corp. | | | 255,178 | | | | 7,673,202 | | |
Kemper Corp. | | | 196,245 | | | | 7,734,015 | | |
National Western Life Insurance Co.,
Class A | | | 32,055 | | | | 7,476,829 | | |
Navigators Group, Inc. (The)(a) | | | 82,555 | | | | 4,703,158 | | |
Safety Insurance Group, Inc. | | | 109,551 | | | | 5,883,984 | | |
Symetra Financial Corp. | | | 555,414 | | | | 11,474,853 | | |
United Fire Group, Inc. | | | 229,535 | | | | 6,385,664 | | |
Total | | | | | 102,108,893 | | |
Real Estate Investment Trusts (REITs) 10.1% | |
AG Mortgage Investment Trust, Inc. | | | 341,146 | | | | 6,034,873 | | |
Apollo Residential Mortgage, Inc. | | | 335,371 | | | | 5,416,242 | | |
Associated Estates Realty Corp. | | | 355,187 | | | | 5,960,038 | | |
Brandywine Realty Trust | | | 653,520 | | | | 9,508,716 | | |
Campus Crest Communities, Inc. | | | 629,646 | | | | 5,421,252 | | |
Chesapeake Lodging Trust | | | 337,575 | | | | 9,111,149 | | |
Cousins Properties, Inc. | | | 829,394 | | | | 9,645,852 | | |
CYS Investments, Inc. | | | 1,017,760 | | | | 8,752,736 | | |
Highwoods Properties, Inc. | | | 343,720 | | | | 13,869,102 | | |
LaSalle Hotel Properties | | | 304,030 | | | | 10,057,312 | | |
National Health Investors, Inc. | | | 123,550 | | | | 7,621,800 | | |
The accompanying Notes to Financial Statements are an integral part of this statement.
Annual Report 2014
8
Columbia Small Cap Value Fund I
Portfolio of Investments (continued)
April 30, 2014
Common Stocks (continued)
Issuer | | Shares | | Value ($) | |
Post Properties, Inc. | | | 174,300 | | | | 8,751,603 | | |
Potlatch Corp. | | | 213,155 | | | | 8,148,916 | | |
Rexford Industrial Realty, Inc. | | | 242,236 | | | | 3,444,596 | | |
Sabra Health Care REIT, Inc. | | | 265,623 | | | | 7,960,721 | | |
Sunstone Hotel Investors, Inc. | | | 615,479 | | | | 8,807,504 | | |
Terreno Realty Corp. | | | 418,773 | | | | 7,650,983 | | |
Total | | | | | 136,163,395 | | |
Thrifts & Mortgage Finance 2.4% | |
Bank Mutual Corp. | | | 855,454 | | | | 5,149,833 | | |
BankFinancial Corp. | | | 430,200 | | | | 4,233,168 | | |
Brookline Bancorp, Inc. | | | 578,640 | | | | 5,254,051 | | |
MGIC Investment Corp.(a) | | | 434,457 | | | | 3,736,330 | | |
Washington Federal, Inc. | | | 448,673 | | | | 9,682,364 | | |
WSFS Financial Corp. | | | 60,884 | | | | 4,116,976 | | |
Total | | | | | 32,172,722 | | |
Total Financials | | | | | 468,546,060 | | |
Health Care 5.1% | |
Biotechnology 0.4% | |
Ariad Pharmaceuticals, Inc.(a) | | | 677,520 | | | | 4,925,570 | | |
Health Care Equipment & Supplies 0.3% | |
Masimo Corp.(a) | | | 178,560 | | | | 4,778,266 | | |
Health Care Providers & Services 3.3% | |
Centene Corp.(a) | | | 97,080 | | | | 6,446,112 | | |
Chemed Corp. | | | 96,955 | | | | 8,073,443 | | |
Ensign Group, Inc. (The) | | | 79,375 | | | | 3,373,437 | | |
Magellan Health Services, Inc.(a) | | | 161,044 | | | | 9,295,460 | | |
Molina Healthcare, Inc.(a) | | | 220,020 | | | | 8,228,748 | | |
Owens & Minor, Inc. | | | 258,070 | | | | 8,655,668 | | |
Total | | | | | 44,072,868 | | |
Pharmaceuticals 1.1% | |
Impax Laboratories, Inc.(a) | | | 418,474 | | | | 10,943,095 | | |
Supernus Pharmaceuticals, Inc.(a) | | | 461,006 | | | | 3,784,859 | | |
Total | | | | | 14,727,954 | | |
Total Health Care | | | | | 68,504,658 | | |
Industrials 13.8% | |
Aerospace & Defense 2.0% | |
Esterline Technologies Corp.(a) | | | 132,250 | | | | 14,417,895 | | |
Common Stocks (continued)
Issuer | | Shares | | Value ($) | |
KEYW Holding Corp. (The)(a) | | | 261,357 | | | | 3,358,438 | | |
Orbital Sciences Corp.(a) | | | 304,453 | | | | 8,950,918 | | |
Total | | | | | 26,727,251 | | |
Airlines 0.4% | |
Skywest, Inc. | | | 471,794 | | | | 5,472,810 | | |
Building Products 0.5% | |
Universal Forest Products, Inc. | | | 132,134 | | | | 6,671,446 | | |
Commercial Services & Supplies 1.9% | |
EnerNOC, Inc.(a) | | | 275,963 | | | | 6,512,727 | | |
Ennis, Inc. | | | 225,223 | | | | 3,369,336 | | |
Steelcase, Inc., Class A | | | 589,720 | | | | 9,718,585 | | |
Unifirst Corp. | | | 67,270 | | | | 6,474,065 | | |
Total | | | | | 26,074,713 | | |
Construction & Engineering 0.2% | |
Layne Christensen Co.(a) | | | 187,946 | | | | 3,274,019 | | |
Electrical Equipment 1.3% | |
General Cable Corp. | | | 357,860 | | | | 9,168,373 | | |
GrafTech International Ltd.(a) | | | 712,854 | | | | 7,991,094 | | |
Total | | | | | 17,159,467 | | |
Machinery 6.2% | |
Albany International Corp., Class A | | | 118,411 | | | | 4,260,428 | | |
Altra Industrial Motion Corp. | | | 207,506 | | | | 7,088,405 | | |
Briggs & Stratton Corp. | | | 335,729 | | | | 7,174,529 | | |
CIRCOR International, Inc. | | | 85,060 | | | | 6,907,723 | | |
Dynamic Materials Corp. | | | 203,657 | | | | 4,113,871 | | |
EnPro Industries, Inc.(a) | | | 97,046 | | | | 6,910,646 | | |
FreightCar America, Inc. | | | 157,179 | | | | 4,127,521 | | |
Gorman-Rupp Co. | | | 111,765 | | | | 3,470,303 | | |
Hardinge, Inc. | | | 115,840 | | | | 1,547,622 | | |
Kadant, Inc. | | | 133,798 | | | | 4,649,480 | | |
LB Foster Co., Class A | | | 155,940 | | | | 7,383,759 | | |
Lydall, Inc.(a) | | | 78,738 | | | | 1,843,257 | | |
Mueller Industries, Inc. | | | 316,562 | | | | 9,161,304 | | |
Standex International Corp. | | | 124,325 | | | | 7,381,175 | | |
Titan International, Inc. | | | 237,500 | | | | 4,158,625 | | |
Twin Disc, Inc. | | | 122,545 | | | | 3,545,227 | | |
Total | | | | | 83,723,875 | | |
The accompanying Notes to Financial Statements are an integral part of this statement.
Annual Report 2014
9
Columbia Small Cap Value Fund I
Portfolio of Investments (continued)
April 30, 2014
Common Stocks (continued)
Issuer | | Shares | | Value ($) | |
Road & Rail 1.1% | |
Heartland Express, Inc. | | | 293,356 | | | | 6,383,427 | | |
Werner Enterprises, Inc. | | | 325,239 | | | | 8,326,118 | | |
Total | | | | | 14,709,545 | | |
Trading Companies & Distributors 0.2% | |
Houston Wire & Cable Co. | | | 175,040 | | | | 2,180,998 | | |
Total Industrials | | | | | 185,994,124 | | |
Information Technology 11.2% | |
Communications Equipment 0.9% | |
Digi International, Inc.(a) | | | 276,801 | | | | 2,452,457 | | |
Harmonic, Inc.(a) | | | 663,160 | | | | 4,662,015 | | |
Polycom, Inc.(a) | | | 394,580 | | | | 4,853,334 | | |
Total | | | | | 11,967,806 | | |
Electronic Equipment, Instruments & Components 1.5% | |
Audience, Inc.(a) | | | 144,664 | | | | 1,663,636 | | |
GSI Group, Inc.(a) | | | 395,055 | | | | 4,795,968 | | |
Measurement Specialties, Inc.(a) | | | 92,369 | | | | 5,943,945 | | |
MTS Systems Corp. | | | 60,587 | | | | 3,906,044 | | |
OSI Systems, Inc.(a) | | | 70,450 | | | | 3,931,814 | | |
Total | | | | | 20,241,407 | | |
Internet Software & Services 0.5% | |
j2 Global, Inc. | | | 139,065 | | | | 6,447,053 | | |
IT Services 1.1% | |
Global Cash Access Holdings, Inc.(a) | | | 519,219 | | | | 3,426,845 | | |
MoneyGram International, Inc.(a) | | | 379,980 | | | | 5,015,736 | | |
TeleTech Holdings, Inc.(a) | | | 257,027 | | | | 6,202,062 | | |
Total | | | | | 14,644,643 | | |
Semiconductors & Semiconductor Equipment 5.3% | |
Entegris, Inc.(a) | | | 712,392 | | | | 7,900,427 | | |
Integrated Device Technology, Inc.(a) | | | 658,889 | | | | 7,689,235 | | |
International Rectifier Corp.(a) | | | 205,410 | | | | 5,348,876 | | |
IXYS Corp. | | | 276,595 | | | | 2,984,460 | | |
M/A-COM Technology Solutions
Holdings, Inc.(a) | | | 239,822 | | | | 4,199,283 | | |
Microsemi Corp.(a) | | | 225,720 | | | | 5,308,934 | | |
MKS Instruments, Inc. | | | 241,481 | | | | 6,797,690 | | |
OmniVision Technologies, Inc.(a) | | | 414,054 | | | | 8,086,475 | | |
RF Micro Devices, Inc.(a) | | | 1,250,660 | | | | 10,555,571 | | |
Silicon Image, Inc.(a) | | | 803,523 | | | | 4,507,764 | | |
Common Stocks (continued)
Issuer | | Shares | | Value ($) | |
Spansion, Inc., Class A(a) | | | 252,320 | | | | 4,498,866 | | |
Teradyne, Inc.(a) | | | 178,020 | | | | 3,145,613 | | |
Total | | | | | 71,023,194 | | |
Software 1.9% | |
ePlus, Inc.(a) | | | 54,990 | | | | 2,751,700 | | |
Mentor Graphics Corp. | | | 535,220 | | | | 11,079,054 | | |
Netscout Systems, Inc.(a) | | | 148,070 | | | | 5,768,807 | | |
Progress Software Corp.(a) | | | 68,507 | | | | 1,470,160 | | |
Silver Spring Networks, Inc.(a) | | | 120,193 | | | | 1,800,491 | | |
Tangoe, Inc.(a) | | | 231,116 | | | | 3,475,985 | | |
Total | | | | | 26,346,197 | | |
Total Information Technology | | | | | 150,670,300 | | |
Materials 5.6% | |
Chemicals 3.3% | |
A. Schulman, Inc. | | | 202,348 | | | | 7,268,340 | | |
Kraton Performance Polymers, Inc.(a) | | | 275,449 | | | | 7,175,447 | | |
LSB Industries, Inc.(a) | | | 152,010 | | | | 5,805,262 | | |
Olin Corp. | | | 259,934 | | | | 7,304,145 | | |
OM Group, Inc. | | | 266,986 | | | | 7,820,020 | | |
Tronox Ltd., Class A | | | 365,656 | | | | 8,958,572 | | |
Total | | | | | 44,331,786 | | |
Containers & Packaging 1.2% | |
Greif, Inc., Class A | | | 314,477 | | | | 17,041,509 | | |
Metals & Mining 1.1% | |
Hecla Mining Co. | | | 1,503,360 | | | | 4,615,315 | | |
Olympic Steel, Inc. | | | 198,491 | | | | 5,232,223 | | |
Stillwater Mining Co.(a) | | | 317,870 | | | | 5,015,988 | | |
Total | | | | | 14,863,526 | | |
Total Materials | | | | | 76,236,821 | | |
Telecommunication Services 0.7% | |
Diversified Telecommunication Services 0.4% | |
Cbeyond, Inc.(a) | | | 189,482 | | | | 1,873,977 | | |
magicJack VocalTec Ltd.(a) | | | 202,790 | | | | 3,585,327 | | |
Total | | | | | 5,459,304 | | |
Wireless Telecommunication Services 0.3% | |
Shenandoah Telecommunications Co. | | | 155,912 | | | | 4,370,214 | | |
Total Telecommunication Services | | | | | 9,829,518 | | |
The accompanying Notes to Financial Statements are an integral part of this statement.
Annual Report 2014
10
Columbia Small Cap Value Fund I
Portfolio of Investments (continued)
April 30, 2014
Common Stocks (continued)
Issuer | | Shares | | Value ($) | |
Utilities 7.0% | |
Electric Utilities 3.3% | |
Allete, Inc. | | | 126,800 | | | | 6,563,168 | | |
El Paso Electric Co. | | | 253,948 | | | | 9,604,314 | | |
IDACORP, Inc. | | | 224,154 | | | | 12,584,006 | | |
MGE Energy, Inc. | | | 146,742 | | | | 5,608,479 | | |
Portland General Electric Co. | | | 313,479 | | | | 10,492,142 | | |
Total | | | | | 44,852,109 | | |
Gas Utilities 2.2% | |
Laclede Group, Inc. (The) | | | 219,199 | | | | 10,392,225 | | |
Southwest Gas Corp. | | | 225,135 | | | | 12,384,676 | | |
WGL Holdings, Inc. | | | 172,270 | | | | 6,854,623 | | |
Total | | | | | 29,631,524 | | |
Multi-Utilities 1.5% | |
Avista Corp. | | | 289,499 | | | | 9,307,393 | | |
Vectren Corp. | | | 250,216 | | | | 10,151,263 | | |
Total | | | | | 19,458,656 | | |
Total Utilities | | | | | 93,942,289 | | |
Total Common Stocks
(Cost: $973,986,252) | | | | | 1,346,064,136 | | |
Money Market Funds 0.5%
| | | Shares | | Value ($) | |
Columbia Short-Term Cash Fund,
0.092%(b)(c) | | | 6,749,263 | | | | 6,749,263 | | |
Total Money Market Funds
(Cost: $6,749,263) | | | | | 6,749,263 | | |
Total Investments
(Cost: $980,735,515) | | | | | 1,352,813,399 | | |
Other Assets & Liabilities, Net | | | | | (2,499,952 | ) | |
Net Assets | | | | | 1,350,313,447 | | |
Notes to Portfolio of Investments
(a) Non-income producing.
(b) As defined in the Investment Company Act of 1940, an affiliated company is one in which the Fund owns 5% or more of its outstanding voting securities, or a company which is under common ownership or control with the Fund. Holdings and transactions in these affiliated companies during the year ended April 30, 2014, are as follows:
| Issuer | | Beginning
Cost ($) | | Purchase
Cost ($) | | Proceeds
from Sales ($) | | Realized
Gain (Loss) ($) | | Ending
Cost ($) | | Dividends —
Affiliated
Issuers ($) | | Value ($) | |
Alteva, Inc. | | | 4,300,945 | | | | — | | | | (2,537,172 | ) | | | (1,763,773 | ) | | | — | | | | 93,099 | | | | — | * | |
Columbia Short-Term
Cash Fund | | | 15,318,686 | | | | 390,386,675 | | | | (398,956,098 | ) | | | — | | | | 6,749,263 | | | | 28,382 | | | | 6,749,263 | | |
Total | | | 19,619,631 | | | | 390,386,675 | | | | (401,493,270 | ) | | | (1,763,773 | ) | | | 6,749,263 | | | | 121,481 | | | | 6,749,263 | | |
*Issuer was not an affiliate for the entire period ended April 30, 2014.
(c) The rate shown is the seven-day current annualized yield at April 30, 2014.
The accompanying Notes to Financial Statements are an integral part of this statement.
Annual Report 2014
11
Columbia Small Cap Value Fund I
Portfolio of Investments (continued)
April 30, 2014
Fair Value Measurements
Generally accepted accounting principles (GAAP) require disclosure regarding the inputs and valuation techniques used to measure fair value and any changes in valuation inputs or techniques. In addition, investments shall be disclosed by major category.
The Fund categorizes its fair value measurements according to a three-level hierarchy that maximizes the use of observable inputs and minimizes the use of unobservable inputs by prioritizing that the most observable input be used when available. Observable inputs are those that market participants would use in pricing an investment based on market data obtained from sources independent of the reporting entity. Unobservable inputs are those that reflect the Fund's assumptions about the information market participants would use in pricing an investment. An investment's level within the fair value hierarchy is based on the lowest level of any input that is deemed significant to the asset or liability's fair value measurement. The input levels are not necessarily an indication of the risk or liquidity associated with investments at that level. For example, certain U.S. government securities are generally high quality and liquid, however, they are reflected as Level 2 because the inputs used to determine fair value may not always be quoted prices in an active market.
Fair value inputs are summarized in the three broad levels listed below:
> Level 1 — Valuations based on quoted prices for investments in active markets that the Fund has the ability to access at the measurement date (including NAV for open-end mutual funds). Valuation adjustments are not applied to Level 1 investments.
> Level 2 — Valuations based on other significant observable inputs (including quoted prices for similar securities, interest rates, prepayment speeds, credit risks, etc.).
> Level 3 — Valuations based on significant unobservable inputs (including the Fund's own assumptions and judgment in determining the fair value of investments).
Inputs that are used in determining fair value of an investment may include price information, credit data, volatility statistics, and other factors. These inputs can be either observable or unobservable. The availability of observable inputs can vary between investments, and is affected by various factors such as the type of investment, and the volume and level of activity for that investment or similar investments in the marketplace. The inputs will be considered by the Investment Manager, along with any other relevant factors in the calculation of an investment's fair value. The Fund uses prices and inputs that are current as of the measurement date, which may include periods of market dislocations. During these periods, the availability of prices and inputs may be reduced for many investments. This condition could cause an investment to be reclassified between the various levels within the hierarchy.
Investments falling into the Level 3 category are primarily supported by quoted prices from brokers and dealers participating in the market for those investments. However, these may be classified as Level 3 investments due to lack of market transparency and corroboration to support these quoted prices. Additionally, valuation models may be used as the pricing source for any remaining investments classified as Level 3. These models may rely on one or more significant unobservable inputs and/or significant assumptions by the Investment Manager. Inputs used in valuations may include, but are not limited to, financial statement analysis, capital account balances, discount rates and estimated cash flows, and comparable company data.
Under the direction of the Fund's Board of Trustees (the Board), the Investment Manager's Valuation Committee (the Committee) is responsible for overseeing the valuation procedures approved by the Board. The Committee consists of voting and non-voting members from various groups within the Investment Manager's organization, including operations and accounting, trading and investments, compliance, risk management and legal.
The Committee meets at least monthly to review and approve valuation matters, which may include a description of specific valuation determinations, data regarding pricing information received from approved pricing vendors and brokers and the results of Board-approved valuation control policies and procedures (the Policies). The Policies address, among other things, instances when market quotations are or are not readily available, including recommendations of third party pricing vendors and a determination of appropriate pricing methodologies; events that require specific valuation determinations and assessment of fair value techniques; securities with a potential for stale pricing, including those that are illiquid, restricted, or in default; and the effectiveness of third party pricing vendors, including periodic reviews of vendors. The Committee meets more frequently, as needed, to discuss additional valuation matters, which may include the need to review back-testing results, review time-sensitive information or approve related valuation actions. The Committee reports to the Board, with members of the Committee meeting with the Board at each of its regularly scheduled meetings to discuss valuation matters and actions during the period, similar to those described earlier.
For investments categorized as Level 3, the Committee monitors information similar to that described above, which may include: (i) data specific to the issuer or comparable issuers, (ii) general market or specific sector news and (iii) quoted prices and specific or similar security transactions. The Committee considers this data and any changes from prior periods in order to assess the reasonableness of observable and unobservable inputs, any assumptions or internal models used to value those securities and changes in fair value. This data is also used to corroborate, when available, information received from approved pricing vendors and brokers. Various factors impact the frequency of monitoring this information (which may occur as often as daily). However, the Committee may determine that changes to inputs, assumptions and models are not required as a result of the monitoring procedures performed.
The accompanying Notes to Financial Statements are an integral part of this statement.
Annual Report 2014
12
Columbia Small Cap Value Fund I
Portfolio of Investments (continued)
April 30, 2014
Fair Value Measurements (continued)
The following table is a summary of the inputs used to value the Fund's investments at April 30, 2014:
Description | | Level 1
Quoted Prices in Active
Markets for Identical
Assets ($) | |
Level 2
Other Significant
Observable Inputs ($) | |
Level 3
Significant
Unobservable Inputs ($) | |
Total ($) | |
Equity Securities | |
Common Stocks | |
Consumer Discretionary | | | 132,818,103 | | | | — | | | | — | | | | 132,818,103 | | |
Consumer Staples | | | 42,920,906 | | | | — | | | | — | | | | 42,920,906 | | |
Energy | | | 116,601,357 | | | | — | | | | — | | | | 116,601,357 | | |
Financials | | | 468,546,060 | | | | — | | | | — | | | | 468,546,060 | | |
Health Care | | | 68,504,658 | | | | — | | | | — | | | | 68,504,658 | | |
Industrials | | | 185,994,124 | | | | — | | | | — | | | | 185,994,124 | | |
Information Technology | | | 150,670,300 | | | | — | | | | — | | | | 150,670,300 | | |
Materials | | | 76,236,821 | | | | — | | | | — | | | | 76,236,821 | | |
Telecommunication Services | | | 9,829,518 | | | | — | | | | — | | | | 9,829,518 | | |
Utilities | | | 93,942,289 | | | | — | | | | — | | | | 93,942,289 | | |
Total Equity Securities | | | 1,346,064,136 | | | | — | | | | — | | | | 1,346,064,136 | | |
Mutual Funds | |
Money Market Funds | | | 6,749,263 | | | | — | | | | — | | | | 6,749,263 | | |
Total | | | 1,352,813,399 | | | | — | | | | — | | | | 1,352,813,399 | | |
See the Portfolio of Investments for all investment classifications not indicated in the table.
There were no transfers of financial assets between levels during the period.
The accompanying Notes to Financial Statements are an integral part of this statement.
Annual Report 2014
13
Columbia Small Cap Value Fund I
Statement of Assets and Liabilities
April 30, 2014
Assets | |
Investments, at value | |
Unaffiliated issuers (identified cost $973,986,252) | | $ | 1,346,064,136 | | |
Affiliated issuers (identified cost $6,749,263) | | | 6,749,263 | | |
Total investments (identified cost $980,735,515) | | | 1,352,813,399 | | |
Receivable for: | |
Investments sold | | | 477,521 | | |
Capital shares sold | | | 1,122,721 | | |
Dividends | | | 550,496 | | |
Reclaims | | | 4,511 | | |
Prepaid expenses | | | 3,541 | | |
Trustees' deferred compensation plan | | | 102,902 | | |
Total assets | | | 1,355,075,091 | | |
Liabilities | |
Payable for: | |
Investments purchased | | | 835,232 | | |
Capital shares purchased | | | 3,298,473 | | |
Investment management fees | | | 27,715 | | |
Distribution and/or service fees | | | 4,017 | | |
Transfer agent fees | | | 362,434 | | |
Administration fees | | | 2,792 | | |
Compensation of board members | | | 513 | | |
Chief compliance officer expenses | | | 83 | | |
Other expenses | | | 126,643 | | |
Trustees' deferred compensation plan | | | 102,902 | | |
Other liabilities | | | 840 | | |
Total liabilities | | | 4,761,644 | | |
Net assets applicable to outstanding capital stock | | $ | 1,350,313,447 | | |
Represented by | |
Paid-in capital | | $ | 867,933,269 | | |
Excess of distributions over net investment income | | | (103,415 | ) | |
Accumulated net realized gain | | | 110,405,428 | | |
Unrealized appreciation (depreciation) on: | |
Investments — unaffiliated issuers | | | 372,077,884 | | |
Foreign currency translations | | | 281 | | |
Total — representing net assets applicable to outstanding capital stock | | $ | 1,350,313,447 | | |
The accompanying Notes to Financial Statements are an integral part of this statement.
Annual Report 2014
14
Columbia Small Cap Value Fund I
Statement of Assets and Liabilities (continued)
April 30, 2014
Class A | |
Net assets | | $ | 411,968,373 | | |
Shares outstanding | | | 8,541,532 | | |
Net asset value per share | | $ | 48.23 | | |
Maximum offering price per share(a) | | $ | 51.17 | | |
Class B | |
Net assets | | $ | 3,982,043 | | |
Shares outstanding | | | 109,665 | | |
Net asset value per share | | $ | 36.31 | | |
Class C | |
Net assets | | $ | 37,568,349 | | |
Shares outstanding | | | 957,289 | | |
Net asset value per share | | $ | 39.24 | | |
Class I | |
Net assets | | $ | 51,811,805 | | |
Shares outstanding | | | 1,007,363 | | |
Net asset value per share | | $ | 51.43 | | |
Class R | |
Net assets | | $ | 3,360,277 | | |
Shares outstanding | | | 69,601 | | |
Net asset value per share | | $ | 48.28 | | |
Class R4 | |
Net assets | | $ | 9,619,904 | | |
Shares outstanding | | | 183,900 | | |
Net asset value per share | | $ | 52.31 | | |
Class R5 | |
Net assets | | $ | 2,493,741 | | |
Shares outstanding | | | 47,710 | | |
Net asset value per share | | $ | 52.27 | | |
Class Y | |
Net assets | | $ | 10,234,323 | | |
Shares outstanding | | | 198,869 | | |
Net asset value per share | | $ | 51.46 | | |
Class Z | |
Net assets | | $ | 819,274,632 | | |
Shares outstanding | | | 15,947,266 | | |
Net asset value per share | | $ | 51.37 | | |
(a) The maximum offering price per share is calculated by dividing the net asset value per share by 1.0 minus the maximum sales charge of 5.75%.
The accompanying Notes to Financial Statements are an integral part of this statement.
Annual Report 2014
15
Columbia Small Cap Value Fund I
Statement of Operations
Year Ended April 30, 2014
Net investment income | |
Income: | |
Dividends — unaffiliated issuers | | $ | 23,113,453 | | |
Dividends — affiliated issuers | | | 121,481 | | |
Foreign taxes withheld | | | (5,599 | ) | |
Total income | | | 23,229,335 | | |
Expenses: | |
Investment management fees | | | 10,928,618 | | |
Distribution and/or service fees | |
Class A | | | 1,175,314 | | |
Class B | | | 47,976 | | |
Class C | | | 376,856 | | |
Class R | | | 13,789 | | |
Transfer agent fees | |
Class A | | | 938,787 | | |
Class B | | | 9,592 | | |
Class C | | | 75,188 | | |
Class R | | | 5,493 | | |
Class R4 | | | 8,363 | | |
Class R5 | | | 699 | | |
Class Z | | | 1,755,891 | | |
Administration fees | | | 1,100,362 | | |
Compensation of board members | | | 53,470 | | |
Custodian fees | | | 25,785 | | |
Printing and postage fees | | | 238,757 | | |
Registration fees | | | 134,166 | | |
Professional fees | | | 75,170 | | |
Line of credit interest expense | | | 479 | | |
Chief compliance officer expenses | | | 749 | | |
Other | | | 35,662 | | |
Total expenses | | | 17,001,166 | | |
Expense reductions | | | (6,462 | ) | |
Total net expenses | | | 16,994,704 | | |
Net investment income | | | 6,234,631 | | |
Realized and unrealized gain (loss) — net | |
Net realized gain (loss) on: | |
Investments — unaffiliated issuers | | | 248,884,381 | | |
Investments — affiliated issuers | | | (1,763,773 | ) | |
Foreign currency translations | | | (374 | ) | |
Net realized gain | | | 247,120,234 | | |
Net change in unrealized appreciation (depreciation) on: | |
Investments — unaffiliated issuers | | | 57,014,960 | | |
Investments — affiliated issuers | | | (1,546,781 | ) | |
Foreign currency translations | | | 272 | | |
Net change in unrealized appreciation (depreciation) | | | 55,468,451 | | |
Net realized and unrealized gain | | | 302,588,685 | | |
Net increase in net assets resulting from operations | | $ | 308,823,316 | | |
The accompanying Notes to Financial Statements are an integral part of this statement.
Annual Report 2014
16
Columbia Small Cap Value Fund I
Statement of Changes in Net Assets
| | | Year ended
April 30,
2014 | | Year ended
April 30,
2013(a) | |
Operations | |
Net investment income | | $ | 6,234,631 | | | $ | 13,140,390 | | |
Net realized gain | | | 247,120,234 | | | | 161,450,234 | | |
Net change in unrealized appreciation (depreciation) | | | 55,468,451 | | | | 33,944,196 | | |
Net increase in net assets resulting from operations | | | 308,823,316 | | | | 208,534,820 | | |
Distributions to shareholders | |
Net investment income | |
Class A | | | (2,639,782 | ) | | | (2,900,099 | ) | |
Class C | | | — | | | | (6 | ) | |
Class I | | | (353,741 | ) | | | (547,980 | ) | |
Class R | | | (9,230 | ) | | | (6,051 | ) | |
Class R4 | | | (50,230 | ) | | | (20 | ) | |
Class R5 | | | (16,502 | ) | | | (23 | ) | |
Class Y | | | (195,444 | ) | | | (10,555 | ) | |
Class Z | | | (6,486,939 | ) | | | (6,869,290 | ) | |
Net realized gains | |
Class A | | | (63,381,884 | ) | | | (20,086,386 | ) | |
Class B | | | (802,807 | ) | | | (343,993 | ) | |
Class C | | | (6,192,777 | ) | | | (1,632,162 | ) | |
Class I | | | (4,842,442 | ) | | | (1,989,451 | ) | |
Class R | | | (375,503 | ) | | | (73,833 | ) | |
Class R4 | | | (875,849 | ) | | | (95 | ) | |
Class R5 | | | (239,324 | ) | | | (95 | ) | |
Class Y | | | (2,779,387 | ) | | | (39,569 | ) | |
Class Z | | | (110,482,687 | ) | | | (33,024,775 | ) | |
Total distributions to shareholders | | | (199,724,528 | ) | | | (67,524,383 | ) | |
Increase (decrease) in net assets from capital stock activity | | | (310,730,846 | ) | | | (337,505,049 | ) | |
Total decrease in net assets | | | (201,632,058 | ) | | | (196,494,612 | ) | |
Net assets at beginning of year | | | 1,551,945,505 | | | | 1,748,440,117 | | |
Net assets at end of year | | $ | 1,350,313,447 | | | $ | 1,551,945,505 | | |
Undistributed (excess of distributions over) net investment income | | $ | (103,415 | ) | | $ | 1,607,504 | | |
(a) Class R4 and Class R5 shares are for the period from November 8, 2012 (commencement of operations) to April 30, 2013.
The accompanying Notes to Financial Statements are an integral part of this statement.
Annual Report 2014
17
Columbia Small Cap Value Fund I
Statement of Changes in Net Assets (continued)
| | | Year ended April 30, 2014 | | Year ended April 30, 2013(a) | |
| | | Shares | | Dollars ($) | | Shares | | Dollars ($) | |
Capital stock activity | |
Class A shares | |
Subscriptions(b) | | | 1,275,127 | | | | 62,229,964 | | | | 1,908,137 | | | | 79,899,792 | | |
Distributions reinvested | | | 1,335,341 | | | | 61,345,576 | | | | 531,717 | | | | 21,461,317 | | |
Redemptions | | | (5,434,138 | ) | | | (263,135,965 | ) | | | (5,170,170 | ) | | | (217,896,943 | ) | |
Net decrease | | | (2,823,670 | ) | | | (139,560,425 | ) | | | (2,730,316 | ) | | | (116,535,834 | ) | |
Class B shares | |
Subscriptions | | | 1,461 | | | | 51,382 | | | | 1,494 | | | | 48,717 | | |
Distributions reinvested | | | 21,098 | | | | 731,877 | | | | 9,703 | | | | 308,353 | | |
Redemptions(b) | | | (64,889 | ) | | | (2,464,264 | ) | | | (173,042 | ) | | | (5,727,907 | ) | |
Net decrease | | | (42,330 | ) | | | (1,681,005 | ) | | | (161,845 | ) | | | (5,370,837 | ) | |
Class C shares | |
Subscriptions | | | 47,059 | | | | 1,842,174 | | | | 39,486 | | | | 1,388,004 | | |
Distributions reinvested | | | 134,904 | | | | 5,057,561 | | | | 38,620 | | | | 1,309,608 | | |
Redemptions | | | (163,252 | ) | | | (6,595,486 | ) | | | (330,817 | ) | | | (11,645,024 | ) | |
Net increase (decrease) | | | 18,711 | | | | 304,249 | | | | (252,711 | ) | | | (8,947,412 | ) | |
Class I shares | |
Subscriptions | | | 272,428 | | | | 13,086,199 | | | | 459,264 | | | | 19,998,024 | | |
Distributions reinvested | | | 106,220 | | | | 5,194,179 | | | | 59,583 | | | | 2,536,896 | | |
Redemptions | | | (608,271 | ) | | | (33,196,017 | ) | | | (518,321 | ) | | | (24,069,407 | ) | |
Net increase (decrease) | | | (229,623 | ) | | | (14,915,639 | ) | | | 526 | | | | (1,534,487 | ) | |
Class R shares | |
Subscriptions | | | 21,950 | | | | 1,073,658 | | | | 7,824 | | | | 329,466 | | |
Distributions reinvested | | | 8,333 | | | | 383,555 | | | | 1,969 | | | | 79,603 | | |
Redemptions | | | (9,692 | ) | | | (471,602 | ) | | | (5,601 | ) | | | (231,921 | ) | |
Net increase | | | 20,591 | | | | 985,611 | | | | 4,192 | | | | 177,148 | | |
Class R4 shares | |
Subscriptions | | | 190,091 | | | | 10,229,710 | | | | 58 | | | | 2,500 | | |
Distributions reinvested | | | 18,598 | | | | 925,638 | | | | — | | | | — | | |
Redemptions | | | (24,847 | ) | | | (1,293,213 | ) | | | — | | | | — | | |
Net increase | | | 183,842 | | | | 9,862,135 | | | | 58 | | | | 2,500 | | |
Class R5 shares | |
Subscriptions | | | 52,532 | | | | 2,825,415 | | | | 58 | | | | 2,500 | | |
Distributions reinvested | | | 5,137 | | | | 255,380 | | | | — | | | | — | | |
Redemptions | | | (10,017 | ) | | | (527,654 | ) | | | — | | | | — | | |
Net increase | | | 47,652 | | | | 2,553,141 | | | | 58 | | | | 2,500 | | |
The accompanying Notes to Financial Statements are an integral part of this statement.
Annual Report 2014
18
Columbia Small Cap Value Fund I
Statement of Changes in Net Assets (continued)
| | | Year ended April 30, 2014 | | Year ended April 30, 2013(a) | |
| | | Shares | | Dollars ($) | | Shares | | Dollars ($) | |
Capital stock activity (continued) | |
Class Y shares | |
Subscriptions | | | 567,044 | | | | 29,222,645 | | | | 3,556 | | | | 152,548 | | |
Distributions reinvested | | | 57,237 | | | | 2,800,622 | | | | — | | | | — | | |
Redemptions | | | (450,869 | ) | | | (21,796,878 | ) | | | (2,134 | ) | | | (100,045 | ) | |
Net increase | | | 173,412 | | | | 10,226,389 | | | | 1,422 | | | | 52,503 | | |
Class Z shares | |
Subscriptions | | | 2,658,242 | | | | 137,515,061 | | | | 4,093,384 | | | | 180,407,360 | | |
Distributions reinvested | | | 1,942,659 | | | | 94,957,189 | | | | 755,073 | | | | 32,137,789 | | |
Redemptions | | | (7,909,637 | ) | | | (410,977,552 | ) | | | (9,548,544 | ) | | | (417,896,279 | ) | |
Net decrease | | | (3,308,736 | ) | | | (178,505,302 | ) | | | (4,700,087 | ) | | | (205,351,130 | ) | |
Total net decrease | | | (5,960,151 | ) | | | (310,730,846 | ) | | | (7,838,703 | ) | | | (337,505,049 | ) | |
(a) Class R4 and Class R5 shares are for the period from November 8, 2012 (commencement of operations) to April 30, 2013.
(b) Includes conversions of Class B shares to Class A shares, if any.
The accompanying Notes to Financial Statements are an integral part of this statement.
Annual Report 2014
19
Columbia Small Cap Value Fund I
The following tables are intended to help you understand the Fund's financial performance. Certain information reflects financial results for a single share of a class held for the periods shown. Per share net investment income (loss) amounts are calculated based on average shares outstanding during the period. Total return assumes reinvestment of all dividends and distributions, if any. Total return does not reflect payment of sales charges, if any, and is not annualized for periods of less than one year.
| | | Year ended April 30, | | Year ended June 30, | |
Class A | | 2014 | | 2013 | | 2012(a) | | 2011 | | 2010 | | 2009 | |
Per share data | |
Net asset value, beginning of period | | $ | 45.66 | | | $ | 41.67 | | | $ | 46.21 | | | $ | 35.84 | | | $ | 29.29 | | | $ | 39.50 | | |
Income from investment operations: | |
Net investment income | | | 0.14 | | | | 0.29 | | | | 0.14 | | | | 0.16 | | | | 0.15 | | | | 0.23 | (b) | |
Net realized and unrealized gain (loss) | | | 9.96 | | | | 5.58 | | | | (1.81 | ) | | | 10.80 | | | | 6.58 | | | | (8.50 | ) | |
Total from investment operations | | | 10.10 | | | | 5.87 | | | | (1.67 | ) | | | 10.96 | | | | 6.73 | | | | (8.27 | ) | |
Less distributions to shareholders: | |
Net investment income | | | (0.30 | ) | | | (0.24 | ) | | | (0.16 | ) | | | (0.44 | ) | | | (0.18 | ) | | | (0.01 | ) | |
Net realized gains | | | (7.23 | ) | | | (1.64 | ) | | | (2.72 | ) | | | (0.15 | ) | | | — | | | | (1.93 | ) | |
Total distributions to shareholders | | | (7.53 | ) | | | (1.88 | ) | | | (2.88 | ) | | | (0.59 | ) | | | (0.18 | ) | | | (1.94 | ) | |
Proceeds from regulatory settlements | | | — | | | | — | | | | 0.01 | | | | — | | | | 0.00 | (c) | | | 0.00 | (c) | |
Net asset value, end of period | | $ | 48.23 | | | $ | 45.66 | | | $ | 41.67 | | | $ | 46.21 | | | $ | 35.84 | | | $ | 29.29 | | |
Total return | | | 22.95 | % | | | 14.68 | % | | | (3.21 | %)(d) | | | 30.67 | % | | | 22.99 | % | | | (20.73 | %) | |
Ratios to average net assets(e) | |
Total gross expenses | | | 1.31 | %(f) | | | 1.32 | % | | | 1.31 | %(g) | | | 1.25 | %(f) | | | 1.27 | %(f) | | | 1.38 | %(f) | |
Total net expenses(h) | | | 1.31 | %(f)(i) | | | 1.32 | %(i) | | | 1.31 | %(g)(i) | | | 1.25 | %(f)(i) | | | 1.27 | %(f)(i) | | | 1.38 | %(f)(i) | |
Net investment income | | | 0.28 | % | | | 0.70 | % | | | 0.41 | %(g) | | | 0.37 | % | | | 0.43 | % | | | 0.74 | % | |
Supplemental data | |
Net assets, end of period (in thousands) | | $ | 411,968 | | | $ | 518,968 | | | $ | 587,332 | | | $ | 704,167 | | | $ | 593,209 | | | $ | 443,154 | | |
Portfolio turnover | | | 38 | % | | | 42 | % | | | 23 | % | | | 31 | % | | | 30 | % | | | 50 | % | |
Notes to Financial Highlights
(a) For the period from July 1, 2011 to April 30, 2012. During the period, the Fund's fiscal year end was changed from June 30 to April 30.
(b) Net investment income per share reflects special dividends. The effect of these dividends amounted to $0.03 per share.
(c) Rounds to zero.
(d) The Fund received proceeds from regulatory settlements. Had the Fund not received these proceeds, the total return would have been lower by 0.02%.
(e) In addition to the fees and expenses which the Fund bears directly, the Fund indirectly bears a pro rata share of the fees and expenses of the acquired funds in which it invests. Such indirect expenses are not included in the reported expense ratios.
(f) Ratios include line of credit interest expense which rounds to less than 0.01%.
(g) Annualized.
(h) Total net expenses include the impact of certain waivers/reimbursements made by the Investment Manager and certain of its affiliates, if applicable.
(i) The benefits derived from expense reductions had an impact of less than 0.01%.
The accompanying Notes to Financial Statements are an integral part of this statement.
Annual Report 2014
20
Columbia Small Cap Value Fund I
Financial Highlights (continued)
| | | Year ended April 30, | | Year ended June 30, | |
Class B | | 2014 | | 2013 | | 2012(a) | | 2011 | | 2010 | | 2009 | |
Per share data | |
Net asset value, beginning of period | | $ | 35.96 | | | $ | 33.22 | | | $ | 37.54 | | | $ | 29.17 | | | $ | 23.96 | | | $ | 33.00 | | |
Income from investment operations: | |
Net investment income (loss) | | | (0.18 | ) | | | 0.04 | | | | (0.10 | ) | | | (0.13 | ) | | | (0.10 | ) | | | (0.01 | )(b) | |
Net realized and unrealized gain (loss) | | | 7.76 | | | | 4.34 | | | | (1.50 | ) | | | 8.80 | | | | 5.38 | | | | (7.10 | ) | |
Total from investment operations | | | 7.58 | | | | 4.38 | | | | (1.60 | ) | | | 8.67 | | | | 5.28 | | | | (7.11 | ) | |
Less distributions to shareholders: | |
Net investment income | | | — | | | | — | | | | — | | | | (0.15 | ) | | | (0.07 | ) | | | — | | |
Net realized gains | | | (7.23 | ) | | | (1.64 | ) | | | (2.72 | ) | | | (0.15 | ) | | | — | | | | (1.93 | ) | |
Total distributions to shareholders | | | (7.23 | ) | | | (1.64 | ) | | | (2.72 | ) | | | (0.30 | ) | | | (0.07 | ) | | | (1.93 | ) | |
Proceeds from regulatory settlements | | | — | | | | — | | | | 0.00 | (c) | | | — | | | | 0.00 | (c) | | | 0.00 | (c) | |
Net asset value, end of period | | $ | 36.31 | | | $ | 35.96 | | | $ | 33.22 | | | $ | 37.54 | | | $ | 29.17 | | | $ | 23.96 | | |
Total return | | | 22.02 | % | | | 13.84 | % | | | (3.85 | %)(d) | | | 29.76 | % | | | 22.02 | % | | | (21.31 | %) | |
Ratios to average net assets(e) | |
Total gross expenses | | | 2.06 | %(f) | | | 2.06 | % | | | 2.07 | %(g) | | | 2.00 | %(f) | | | 2.02 | %(f) | | | 2.13 | %(f) | |
Total net expenses(h) | | | 2.06 | %(f)(i) | | | 2.06 | %(i) | | | 2.07 | %(g)(i) | | | 2.00 | %(f)(i) | | | 2.02 | %(f)(i) | | | 2.13 | %(f)(i) | |
Net investment income (loss) | | | (0.46 | %) | | | 0.11 | % | | | (0.37 | %)(g) | | | (0.38 | %) | | | (0.33 | %) | | | (0.02 | %) | |
Supplemental data | |
Net assets, end of period (in thousands) | | $ | 3,982 | | | $ | 5,466 | | | $ | 10,427 | | | $ | 17,908 | | | $ | 22,775 | | | $ | 28,977 | | |
Portfolio turnover | | | 38 | % | | | 42 | % | | | 23 | % | | | 31 | % | | | 30 | % | | | 50 | % | |
Notes to Financial Highlights
(a) For the period from July 1, 2011 to April 30, 2012. During the period, the Fund's fiscal year end was changed from June 30 to April 30.
(b) Net investment income per share reflects special dividends. The effect of these dividends amounted to $0.03 per share.
(c) Rounds to zero.
(d) The Fund received proceeds from regulatory settlements. Had the Fund not received these proceeds, the total return would have been lower by 0.02%.
(e) In addition to the fees and expenses which the Fund bears directly, the Fund indirectly bears a pro rata share of the fees and expenses of the acquired funds in which it invests. Such indirect expenses are not included in the reported expense ratios.
(f) Ratios include line of credit interest expense which rounds to less than 0.01%.
(g) Annualized.
(h) Total net expenses include the impact of certain waivers/reimbursements made by the Investment Manager and certain of its affiliates, if applicable.
(i) The benefits derived from expense reductions had an impact of less than 0.01%.
The accompanying Notes to Financial Statements are an integral part of this statement.
Annual Report 2014
21
Columbia Small Cap Value Fund I
Financial Highlights (continued)
| | | Year ended April 30, | | Year ended June 30, | |
Class C | | 2014 | | 2013 | | 2012(a) | | 2011 | | 2010 | | 2009 | |
Per share data | |
Net asset value, beginning of period | | $ | 38.36 | | | $ | 35.33 | | | $ | 39.73 | | | $ | 30.87 | | | $ | 25.35 | | | $ | 34.76 | | |
Income from investment operations: | |
Net investment loss | | | (0.19 | ) | | | (0.01 | ) | | | (0.10 | ) | | | (0.14 | ) | | | (0.10 | ) | | | (0.00 | )(b)(c) | |
Net realized and unrealized gain (loss) | | | 8.30 | | | | 4.68 | | | | (1.58 | ) | | | 9.30 | | | | 5.69 | | | | (7.48 | ) | |
Total from investment operations | | | 8.11 | | | | 4.67 | | | | (1.68 | ) | | | 9.16 | | | | 5.59 | | | | (7.48 | ) | |
Less distributions to shareholders: | |
Net investment income | | | — | | | | — | | | | — | | | | (0.15 | ) | | | (0.07 | ) | | | — | | |
Net realized gains | | | (7.23 | ) | | | (1.64 | ) | | | (2.72 | ) | | | (0.15 | ) | | | — | | | | (1.93 | ) | |
Total distributions to shareholders | | | (7.23 | ) | | | (1.64 | ) | | | (2.72 | ) | | | (0.30 | ) | | | (0.07 | ) | | | (1.93 | ) | |
Proceeds from regulatory settlements | | | — | | | | — | | | | 0.00 | (b) | | | — | | | | 0.00 | (b) | | | 0.00 | (b) | |
Net asset value, end of period | | $ | 39.24 | | | $ | 38.36 | | | $ | 35.33 | | | $ | 39.73 | | | $ | 30.87 | | | $ | 25.35 | | |
Total return | | | 22.03 | % | | | 13.83 | % | | | (3.84 | %)(d) | | | 29.71 | % | | | 22.04 | % | | | (21.30 | %) | |
Ratios to average net assets(e) | |
Total gross expenses | | | 2.06 | %(f) | | | 2.07 | % | | | 2.06 | %(g) | | | 2.00 | %(f) | | | 2.02 | %(f) | | | 2.13 | %(f) | |
Total net expenses(h) | | | 2.06 | %(f)(i) | | | 2.07 | %(i) | | | 2.06 | %(g)(i) | | | 2.00 | %(f)(i) | | | 2.02 | %(f)(i) | | | 2.13 | %(f)(i) | |
Net investment loss | | | (0.48 | %) | | | (0.04 | %) | | | (0.34 | %)(g) | | | (0.38 | %) | | | (0.33 | %) | | | (0.01 | %) | |
Supplemental data | |
Net assets, end of period (in thousands) | | $ | 37,568 | | | $ | 36,007 | | | $ | 42,092 | | | $ | 52,248 | | | $ | 49,888 | | | $ | 44,377 | | |
Portfolio turnover | | | 38 | % | | | 42 | % | | | 23 | % | | | 31 | % | | | 30 | % | | | 50 | % | |
Notes to Financial Highlights
(a) For the period from July 1, 2011 to April 30, 2012. During the period, the Fund's fiscal year end was changed from June 30 to April 30.
(b) Rounds to zero.
(c) Net investment income per share reflects special dividends. The effect of these dividends amounted to $0.03 per share.
(d) The Fund received proceeds from regulatory settlements. Had the Fund not received these proceeds, the total return would have been lower by 0.02%.
(e) In addition to the fees and expenses which the Fund bears directly, the Fund indirectly bears a pro rata share of the fees and expenses of the acquired funds in which it invests. Such indirect expenses are not included in the reported expense ratios.
(f) Ratios include line of credit interest expense which rounds to less than 0.01%.
(g) Annualized.
(h) Total net expenses include the impact of certain waivers/reimbursements made by the Investment Manager and certain of its affiliates, if applicable.
(i) The benefits derived from expense reductions had an impact of less than 0.01%.
The accompanying Notes to Financial Statements are an integral part of this statement.
Annual Report 2014
22
Columbia Small Cap Value Fund I
Financial Highlights (continued)
| | | Year ended April 30, | | Year ended
June 30, | |
Class I | | 2014 | | 2013 | | 2012(a) | | 2011(b) | |
Per share data | |
Net asset value, beginning of period | | $ | 48.25 | | | $ | 43.93 | | | $ | 48.60 | | | $ | 40.40 | | |
Income from investment operations: | |
Net investment income | | | 0.39 | | | | 0.52 | | | | 0.31 | | | | 0.30 | | |
Net realized and unrealized gain (loss) | | | 10.55 | | | | 5.87 | | | | (1.90 | ) | | | 8.66 | | |
Total from investment operations | | | 10.94 | | | | 6.39 | | | | (1.59 | ) | | | 8.96 | | |
Less distributions to shareholders: | |
Net investment income | | | (0.53 | ) | | | (0.43 | ) | | | (0.37 | ) | | | (0.61 | ) | |
Net realized gains | | | (7.23 | ) | | | (1.64 | ) | | | (2.72 | ) | | | (0.15 | ) | |
Total distributions to shareholders | | | (7.76 | ) | | | (2.07 | ) | | | (3.09 | ) | | | (0.76 | ) | |
Proceeds from regulatory settlements | | | — | | | | — | | | | 0.01 | | | | — | | |
Net asset value, end of period | | $ | 51.43 | | | $ | 48.25 | | | $ | 43.93 | | | $ | 48.60 | | |
Total return | | | 23.51 | % | | | 15.19 | % | | | (2.85 | %)(c) | | | 22.29 | % | |
Ratios to average net assets(d) | |
Total gross expenses | | | 0.86 | %(e) | | | 0.87 | % | | | 0.86 | %(f) | | | 0.83 | %(f)(e) | |
Total net expenses(g) | | | 0.86 | %(e) | | | 0.87 | % | | | 0.86 | %(f) | | | 0.83 | %(f)(e)(h) | |
Net investment income | | | 0.74 | % | | | 1.17 | % | | | 0.85 | %(f) | | | 0.84 | %(f) | |
Supplemental data | |
Net assets, end of period (in thousands) | | $ | 51,812 | | | $ | 59,690 | | | $ | 54,312 | | | $ | 75,716 | | |
Portfolio turnover | | | 38 | % | | | 42 | % | | | 23 | % | | | 31 | % | |
Notes to Financial Highlights
(a) For the period from July 1, 2011 to April 30, 2012. During the period, the Fund's fiscal year end was changed from June 30 to April 30.
(b) For the period from September 27, 2010 (commencement of operations) to June 30, 2011.
(c) The Fund received proceeds from regulatory settlements. Had the Fund not received these proceeds, the total return would have been lower by 0.02%.
(d) In addition to the fees and expenses which the Fund bears directly, the Fund indirectly bears a pro rata share of the fees and expenses of the acquired funds in which it invests. Such indirect expenses are not included in the reported expense ratios.
(e) Ratios include line of credit interest expense which rounds to less than 0.01%.
(f) Annualized.
(g) Total net expenses include the impact of certain waivers/reimbursements made by the Investment Manager and certain of its affiliates, if applicable.
(h) The benefits derived from expense reductions had an impact of less than 0.01%.
The accompanying Notes to Financial Statements are an integral part of this statement.
Annual Report 2014
23
Columbia Small Cap Value Fund I
Financial Highlights (continued)
| | | Year ended April 30, | | Year ended
June 30, | |
Class R | | 2014 | | 2013 | | 2012(a) | | 2011(b) | |
Per share data | |
Net asset value, beginning of period | | $ | 45.70 | | | $ | 41.70 | | | $ | 46.23 | | | $ | 38.43 | | |
Income from investment operations: | |
Net investment income | | | 0.01 | | | | 0.14 | | | | 0.12 | | | | 0.09 | | |
Net realized and unrealized gain (loss) | | | 9.98 | | | | 5.63 | | | | (1.86 | ) | | | 8.22 | | |
Total from investment operations | | | 9.99 | | | | 5.77 | | | | (1.74 | ) | | | 8.31 | | |
Less distributions to shareholders: | |
Net investment income | | | (0.18 | ) | | | (0.13 | ) | | | (0.08 | ) | | | (0.36 | ) | |
Net realized gains | | | (7.23 | ) | | | (1.64 | ) | | | (2.72 | ) | | | (0.15 | ) | |
Total distributions to shareholders | | | (7.41 | ) | | | (1.77 | ) | | | (2.80 | ) | | | (0.51 | ) | |
Proceeds from regulatory settlements | | | — | | | | — | | | | 0.01 | | | | — | | |
Net asset value, end of period | | $ | 48.28 | | | $ | 45.70 | | | $ | 41.70 | | | $ | 46.23 | | |
Total return | | | 22.65 | % | | | 14.40 | % | | | (3.37 | %)(c) | | | 21.68 | % | |
Ratios to average net assets(d) | |
Total gross expenses | | | 1.56 | %(e) | | | 1.57 | % | | | 1.53 | %(f) | | | 1.50 | %(e)(f) | |
Total net expenses(g) | | | 1.56 | %(e)(h) | | | 1.57 | %(h) | | | 1.53 | %(f)(h) | | | 1.50 | %(e)(f)(h) | |
Net investment income | | | 0.01 | % | | | 0.33 | % | | | 0.34 | %(f) | | | 0.27 | %(f) | |
Supplemental data | |
Net assets, end of period (in thousands) | | $ | 3,360 | | | $ | 2,240 | | | $ | 1,869 | | | $ | 21 | | |
Portfolio turnover | | | 38 | % | | | 42 | % | | | 23 | % | | | 31 | % | |
Notes to Financial Highlights
(a) For the period from July 1, 2011 to April 30, 2012. During the period, the Fund's fiscal year end was changed from June 30 to April 30.
(b) For the period from September 27, 2010 (commencement of operations) to June 30, 2011.
(c) The Fund received proceeds from regulatory settlements. Had the Fund not received these proceeds, the total return would have been lower by 0.02%.
(d) In addition to the fees and expenses which the Fund bears directly, the Fund indirectly bears a pro rata share of the fees and expenses of the acquired funds in which it invests. Such indirect expenses are not included in the reported expense ratios.
(e) Ratios include line of credit interest expense which rounds to less than 0.01%.
(f) Annualized.
(g) Total net expenses include the impact of certain waivers/reimbursements made by the Investment Manager and certain of its affiliates, if applicable.
(h) The benefits derived from expense reductions had an impact of less than 0.01%.
The accompanying Notes to Financial Statements are an integral part of this statement.
Annual Report 2014
24
Columbia Small Cap Value Fund I
Financial Highlights (continued)
| | | Year ended April 30, | |
Class R4 | | 2014 | | 2013(a) | |
Per share data | |
Net asset value, beginning of period | | $ | 48.96 | | | $ | 43.31 | | |
Income from investment operations: | |
Net investment income | | | 0.27 | | | | 0.22 | | |
Net realized and unrealized gain | | | 10.73 | | | | 7.42 | | |
Total from investment operations | | | 11.00 | | | | 7.64 | | |
Less distributions to shareholders: | |
Net investment income | | | (0.42 | ) | | | (0.35 | ) | |
Net realized gains | | | (7.23 | ) | | | (1.64 | ) | |
Total distributions to shareholders | | | (7.65 | ) | | | (1.99 | ) | |
Net asset value, end of period | | $ | 52.31 | | | $ | 48.96 | | |
Total return | | | 23.26 | % | | | 18.27 | % | |
Ratios to average net assets(b) | |
Total gross expenses | | | 1.06 | %(c) | | | 0.99 | %(d) | |
Total net expenses(e) | | | 1.06 | %(c)(f) | | | 0.99 | %(d) | |
Net investment income | | | 0.51 | % | | | 1.00 | %(d) | |
Supplemental data | |
Net assets, end of period (in thousands) | | $ | 9,620 | | | $ | 3 | | |
Portfolio turnover | | | 38 | % | | | 42 | % | |
Notes to Financial Highlights
(a) For the period from November 8, 2012 (commencement of operations) to April 30, 2013.
(b) In addition to the fees and expenses which the Fund bears directly, the Fund indirectly bears a pro rata share of the fees and expenses of the acquired funds in which it invests. Such indirect expenses are not included in the reported expense ratios.
(c) Ratios include line of credit interest expense which rounds to less than 0.01%.
(d) Annualized.
(e) Total net expenses include the impact of certain waivers/reimbursements made by the Investment Manager and certain of its affiliates, if applicable.
(f) The benefits derived from expense reductions had an impact of less than 0.01%.
The accompanying Notes to Financial Statements are an integral part of this statement.
Annual Report 2014
25
Columbia Small Cap Value Fund I
Financial Highlights (continued)
| | | Year ended April 30, | |
Class R5 | | 2014 | | 2013(a) | |
Per share data | |
Net asset value, beginning of period | | $ | 48.93 | | | $ | 43.31 | | |
Income from investment operations: | |
Net investment income | | | 0.32 | | | | 0.24 | | |
Net realized and unrealized gain | | | 10.75 | | | | 7.41 | | |
Total from investment operations | | | 11.07 | | | | 7.65 | | |
Less distributions to shareholders: | |
Net investment income | | | (0.50 | ) | | | (0.39 | ) | |
Net realized gains | | | (7.23 | ) | | | (1.64 | ) | |
Total distributions to shareholders | | | (7.73 | ) | | | (2.03 | ) | |
Net asset value, end of period | | $ | 52.27 | | | $ | 48.93 | | |
Total return | | | 23.44 | % | | | 18.31 | % | |
Ratios to average net assets(b) | |
Total gross expenses | | | 0.91 | %(c) | | | 0.89 | %(d) | |
Total net expenses(e) | | | 0.91 | %(c) | | | 0.89 | %(d) | |
Net investment income | | | 0.61 | % | | | 1.10 | %(d) | |
Supplemental data | |
Net assets, end of period (in thousands) | | $ | 2,494 | | | $ | 3 | | |
Portfolio turnover | | | 38 | % | | | 42 | % | |
Notes to Financial Highlights
(a) For the period from November 8, 2012 (commencement of operations) to April 30, 2013.
(b) In addition to the fees and expenses which the Fund bears directly, the Fund indirectly bears a pro rata share of the fees and expenses of the acquired funds in which it invests. Such indirect expenses are not included in the reported expense ratios.
(c) Ratios include line of credit interest expense which rounds to less than 0.01%.
(d) Annualized.
(e) Total net expenses include the impact of certain waivers/reimbursements made by the Investment Manager and certain of its affiliates, if applicable.
The accompanying Notes to Financial Statements are an integral part of this statement.
Annual Report 2014
26
Columbia Small Cap Value Fund I
Financial Highlights (continued)
| | | Year ended April 30, | | Year ended June 30, | |
Class Y | | 2014 | | 2013 | | 2012(a) | | 2011 | | 2010(b) | |
Per share data | |
Net asset value, beginning of period | | $ | 48.26 | | | $ | 43.93 | | | $ | 48.60 | | | $ | 37.63 | | | $ | 31.68 | | |
Income from investment operations | |
Net investment income | | | 0.31 | | | | 0.50 | | | | 0.31 | | | | 0.37 | | | | 0.31 | | |
Net realized and unrealized gain (loss) | | | 10.63 | | | | 5.90 | | | | (1.90 | ) | | | 11.36 | | | | 5.88 | | |
Total from investment operations | | | 10.94 | | | | 6.40 | | | | (1.59 | ) | | | 11.73 | | | | 6.19 | | |
Less distributions to shareholders: | |
Net investment income | | | (0.51 | ) | | | (0.43 | ) | | | (0.37 | ) | | | (0.61 | ) | | | (0.24 | ) | |
Net realized gains | | | (7.23 | ) | | | (1.64 | ) | | | (2.72 | ) | | | (0.15 | ) | | | — | | |
Total distributions to shareholders | | | (7.74 | ) | | | (2.07 | ) | | | (3.09 | ) | | | (0.76 | ) | | | (0.24 | ) | |
Proceeds from regulatory settlements | | | — | | | | — | | | | 0.01 | | | | — | | | | 0.00 | (c) | |
Net asset value, end of period | | $ | 51.46 | | | $ | 48.26 | | | $ | 43.93 | | | $ | 48.60 | | | $ | 37.63 | | |
Total return | | | 23.50 | % | | | 15.20 | % | | | (2.86 | %)(d) | | | 31.27 | % | | | 19.57 | % | |
Ratios to average net assets(e) | |
Total gross expenses | | | 0.87 | %(f) | | | 0.87 | % | | | 0.86 | %(g) | | | 0.81 | %(f) | | | 0.85 | %(f)(g) | |
Total net expenses(h) | | | 0.87 | %(f) | | | 0.87 | % | | | 0.86 | %(g) | | | 0.81 | %(f)(i) | | | 0.85 | %(f)(g)(i) | |
Net investment income | | | 0.61 | % | | | 1.14 | % | | | 0.85 | %(g) | | | 0.82 | % | | | 0.85 | %(g) | |
Supplemental data | |
Net assets, end of period (in thousands) | | $ | 10,234 | | | $ | 1,229 | | | $ | 1,056 | | | $ | 1,323 | | | $ | 1,111 | | |
Portfolio turnover | | | 38 | % | | | 42 | % | | | 23 | % | | | 31 | % | | | 30 | % | |
Notes to Financial Highlights
(a) For the period from July 1, 2011 to April 30, 2012. During the period, the Fund's fiscal year end was changed from June 30 to April 30.
(b) For the period from July 15, 2009 (commencement of operations) to June 30, 2010.
(c) Rounds to zero.
(d) The Fund received proceeds from regulatory settlements. Had the Fund not received these proceeds, the total return would have been lower by 0.02%.
(e) In addition to the fees and expenses which the Fund bears directly, the Fund indirectly bears a pro rata share of the fees and expenses of the acquired funds in which it invests. Such indirect expenses are not included in the reported expense ratios.
(f) Ratios include line of credit interest expense which rounds to less than 0.01%.
(g) Annualized.
(h) Total net expenses include the impact of certain waivers/reimbursements made by the Investment Manager and certain of its affiliates, if applicable.
(i) The benefits derived from expense reductions had an impact of less than 0.01%.
The accompanying Notes to Financial Statements are an integral part of this statement.
Annual Report 2014
27
Columbia Small Cap Value Fund I
Financial Highlights (continued)
| | | Year ended April 30, | | Year ended June 30, | |
Class Z | | 2014 | | 2013 | | 2012(a) | | 2011 | | 2010 | | 2009 | |
Per share data | |
Net asset value, beginning of period | | $ | 48.21 | | | $ | 43.89 | | | $ | 48.53 | | | $ | 37.60 | | | $ | 30.68 | | | $ | 41.22 | | |
Income from investment operations: | |
Net investment income | | | 0.27 | | | | 0.41 | | | | 0.24 | | | | 0.28 | | | | 0.26 | | | | 0.32 | (b) | |
Net realized and unrealized gain (loss) | | | 10.55 | | | | 5.89 | | | | (1.89 | ) | | | 11.34 | | | | 6.88 | | | | (8.87 | ) | |
Total from investment operations | | | 10.82 | | | | 6.30 | | | | (1.65 | ) | | | 11.62 | | | | 7.14 | | | | (8.55 | ) | |
Less distributions to shareholders: | |
Net investment income | | | (0.43 | ) | | | (0.34 | ) | | | (0.28 | ) | | | (0.54 | ) | | | (0.22 | ) | | | (0.06 | ) | |
Net realized gains | | | (7.23 | ) | | | (1.64 | ) | | | (2.72 | ) | | | (0.15 | ) | | | — | | | | (1.93 | ) | |
Total distributions to shareholders | | | (7.66 | ) | | | (1.98 | ) | | | (3.00 | ) | | | (0.69 | ) | | | (0.22 | ) | | | (1.99 | ) | |
Proceeds from regulatory settlements | | | — | | | | — | | | | 0.01 | | | | — | | | | 0.00 | (c) | | | 0.00 | (c) | |
Net asset value, end of period | | $ | 51.37 | | | $ | 48.21 | | | $ | 43.89 | | | $ | 48.53 | | | $ | 37.60 | | | $ | 30.68 | | |
Total return | | | 23.24 | % | | | 14.97 | % | | | (3.00 | %)(d) | | | 31.00 | % | | | 23.28 | % | | | (20.53 | %) | |
Ratios to average net assets(e) | |
Total gross expenses | | | 1.06 | %(f) | | | 1.07 | % | | | 1.06 | %(g) | | | 1.00 | %(f) | | | 1.02 | %(f) | | | 1.13 | %(f) | |
Total net expenses(h) | | | 1.06 | %(f)(i) | | | 1.07 | %(i) | | | 1.06 | %(g)(i) | | | 1.00 | %(f)(i) | | | 1.02 | %(f)(i) | | | 1.13 | %(f)(i) | |
Net investment income | | | 0.53 | % | | | 0.93 | % | | | 0.67 | %(g) | | | 0.62 | % | | | 0.69 | % | | | 1.00 | % | |
Supplemental data | |
Net assets, end of period (in thousands) | | $ | 819,275 | | | $ | 928,340 | | | $ | 1,051,352 | | | $ | 1,109,078 | | | $ | 774,590 | | | $ | 364,071 | | |
Portfolio turnover | | | 38 | % | | | 42 | % | | | 23 | % | | | 31 | % | | | 30 | % | | | 50 | % | |
Notes to Financial Highlights
(a) For the period from July 1, 2011 to April 30, 2012. During the period, the Fund's fiscal year end was changed from June 30 to April 30.
(b) Net investment income per share reflects special dividends. The effect of these dividends amounted to $0.03 per share.
(c) Rounds to zero.
(d) The Fund received proceeds from regulatory settlements. Had the Fund not received these proceeds, the total return would have been lower by 0.02%.
(e) In addition to the fees and expenses which the Fund bears directly, the Fund indirectly bears a pro rata share of the fees and expenses of the acquired funds in which it invests. Such indirect expenses are not included in the reported expense ratios.
(f) Ratios include line of credit interest expense which rounds to less than 0.01%.
(g) Annualized.
(h) Total net expenses include the impact of certain waivers/reimbursements made by the Investment Manager and certain of its affiliates, if applicable.
(i) The benefits derived from expense reductions had an impact of less than 0.01%.
The accompanying Notes to Financial Statements are an integral part of this statement.
Annual Report 2014
28
Columbia Small Cap Value Fund I
Notes to Financial Statements
April 30, 2014
Note 1. Organization
Columbia Small Cap Value Fund I (the Fund), a series of Columbia Funds Series Trust I (the Trust), is a diversified fund. The Trust is registered under the Investment Company Act of 1940, as amended (the 1940 Act), as an open-end management investment company organized as a Massachusetts business trust.
Fund Shares
The Trust may issue an unlimited number of shares (without par value). The Fund offers Class A, Class B, Class C, Class I, Class R, Class R4, Class R5, Class Y and Class Z shares. Although all share classes generally have identical voting, dividend and liquidation rights, each share class votes separately when required by law. Different share classes pay different distribution amounts to the extent the expenses of such share classes differ, and distributions in liquidation will be proportional to the net asset value of each share class. Each share class has its own expense structure and sales charges, as applicable.
Class A shares are subject to a maximum front-end sales charge of 5.75% based on the initial investment amount. Class A shares purchased without an initial sales charge in accounts aggregating $1 million to $50 million at the time of purchase are subject to a contingent deferred sales charge (CDSC) if the shares are sold within 18 months of purchase, charged as follows: 1.00% CDSC if redeemed within 12 months of purchase, and 0.50% CDSC if redeemed more than 12, but less than 18, months after purchase.
Class B shares may be subject to a maximum CDSC of 5.00% based upon the holding period after purchase. Class B shares will generally convert to Class A shares eight years after purchase. The Fund no longer accepts investments by new or existing investors in the Fund's Class B shares, except in connection with the reinvestment of any dividend and/or capital gain distributions in Class B shares of the Fund and exchanges by existing Class B shareholders of certain other funds within the Columbia Family of Funds.
Class C shares are subject to a 1.00% CDSC on shares redeemed within one year of purchase.
Class I shares are not subject to sales charges and are available only to the Columbia Family of Funds.
Class R shares are not subject to sales charges and are generally available only to certain retirement plans and other eligible investors.
Class R4 shares are not subject to sales charges and are generally available only to omnibus retirement plans and certain other eligible investors.
Class R5 shares are not subject to sales charges and are generally available only to investors purchasing through authorized investment professionals and omnibus retirement plans.
Class Y shares are not subject to sales charges and are generally available only to certain retirement plans.
Class Z shares are not subject to sales charges and are available only to certain eligible investors, which are subject to different investment minimums.
Note 2. Summary of Significant Accounting Policies
Use of Estimates
The preparation of financial statements in accordance with U.S. generally accepted accounting principles (GAAP) requires management to make certain estimates and assumptions that affect the reported amounts of assets and liabilities, the disclosure of contingent assets and liabilities at the date of the financial statements and the reported amounts of revenue and expenses during the reporting period. Actual results could differ from those estimates.
The following is a summary of significant accounting policies consistently followed by the Fund in the preparation of its financial statements.
Security Valuation
All equity securities are valued at the close of business of the New York Stock Exchange (NYSE). Equity securities are valued at the last quoted sales price on the principal exchange or market on which they trade, except for securities traded on the NASDAQ Stock Market, which are valued at the NASDAQ official close price. Unlisted securities or listed securities for which there were no sales during the day are valued at the mean of the latest quoted bid and ask prices on such exchanges or markets.
Foreign equity securities are valued based on quotations from the principal market in which such securities are normally traded. If any foreign share prices are not readily available as a result of limited share activity the securities are valued at the mean of the latest quoted bid and ask prices on such exchanges or markets. Foreign currency exchange rates are generally determined at 4:00 p.m. Eastern (U.S.) time. However, many securities markets and exchanges outside the U.S. close prior to the close of the NYSE; therefore, the closing prices for securities in such markets or on such exchanges may not fully reflect events that occur after such close but before the close of the NYSE. In those situations, foreign securities will be fair valued pursuant to the policy adopted by the Board of Trustees (the Board), including
Annual Report 2014
29
Columbia Small Cap Value Fund I
Notes to Financial Statements (continued)
April 30, 2014
utilizing a third party pricing service to determine these fair values. The third party pricing service takes into account multiple factors, including, but not limited to, movements in the U.S. securities markets, certain depositary receipts, futures contracts and foreign exchange rates that have occurred subsequent to the close of the foreign exchange or market, to determine a good faith estimate that reasonably reflects the current market conditions as of the close of the NYSE. The fair value of a security is likely to be different from the quoted or published price, if available.
Investments in open-end investment companies, including money market funds, are valued at net asset value.
Investments for which market quotations are not readily available, or that have quotations which management believes are not reliable, are valued at fair value as determined in good faith under consistently applied procedures established by and under the general supervision of the Board. If a security or class of securities (such as foreign securities) is valued at fair value, such value is likely to be different from the last quoted market price for the security.
The determination of fair value often requires significant judgment. To determine fair value, management may use assumptions including but not limited to future cash flows and estimated risk premiums. Multiple inputs from various sources may be used to determine fair value.
Foreign Currency Transactions and Translations
The values of all assets and liabilities denominated in foreign currencies are translated into U.S. dollars at that day's exchange rates. Net realized and unrealized gains (losses) on foreign currency transactions and translations include gains (losses) arising from the fluctuation in exchange rates between trade and settlement dates on securities transactions, gains (losses) arising from the disposition of foreign currency and currency gains (losses) between the accrual and payment dates on dividends, interest income and foreign withholding taxes.
For financial statement purposes, the Fund does not distinguish that portion of gains (losses) on investments which is due to changes in foreign exchange rates from that which is due to changes in market prices of the investments. Such fluctuations are included with the net realized and unrealized gains (losses) on investments in the Statement of Operations.
Security Transactions
Security transactions are accounted for on the trade date. Cost is determined and gains (losses) are based upon the specific identification method for both financial statement and federal income tax purposes.
Income Recognition
Corporate actions and dividend income are generally recorded net of any non-reclaimable tax withholdings, on the ex-dividend date or upon receipt of ex-dividend notification in the case of certain foreign securities.
The Fund may receive distributions from holdings in business development companies (BDCs), exchange-traded funds (ETFs) and real estate investment trusts (REITs), which report information on the character of their distributions annually. These distributions are allocated to dividend income, capital gain and return of capital based on estimates made by the Fund's management if actual information has not yet been reported. Return of capital is recorded as a reduction of the cost basis of securities held. If the Fund no longer owns the applicable securities, return of capital is recorded as a realized gain. Management's estimates are subsequently adjusted when the actual character of the distributions is disclosed by the BDCs, ETFs and REITs, which could result in a proportionate change in return of capital to shareholders.
Awards from class action litigation are recorded as a reduction of cost basis if the Fund still owns the applicable securities on the payment date. If the Fund no longer owns the applicable securities, the proceeds are recorded as realized gains.
Expenses
General expenses of the Trust are allocated to the Fund and other funds of the Trust based upon relative net assets or other expense allocation methodologies determined by the nature of the expense. Expenses directly attributable to the Fund are charged to the Fund. Expenses directly attributable to a specific class of shares are charged to that share class.
Determination of Class Net Asset Value
All income, expenses (other than class-specific expenses, which are charged to that share class, as shown in the Statement of Operations) and realized and unrealized gains (losses) are allocated to each class of the Fund on a daily basis, based on the relative net assets of each class, for purposes of determining the net asset value of each class.
Federal Income Tax Status
The Fund intends to qualify each year as a regulated investment company under Subchapter M of the Internal Revenue Code, as amended, and will distribute substantially all of its taxable income (including net short-term capital gains), if any, for its tax year, and as such will not be subject to federal income taxes. In addition, the Fund intends to distribute in each calendar year substantially all of its net investment income, capital gains and certain other amounts, if any, such that the Fund should not be subject to federal excise
Annual Report 2014
30
Columbia Small Cap Value Fund I
Notes to Financial Statements (continued)
April 30, 2014
tax. Therefore, no federal income or excise tax provision is recorded.
Foreign Taxes
The Fund may be subject to foreign taxes on income, gains on investments or currency repatriation, a portion of which may be recoverable. The Fund will accrue such taxes and recoveries, as applicable, based upon its current interpretation of tax rules and regulations that exist in the markets in which it invests.
Realized gains in certain countries may be subject to foreign taxes at the Fund level, based on statutory rates. The Fund accrues for such foreign taxes on realized and unrealized gains at the appropriate rate for each jurisdiction, as applicable. The amount, if any, is disclosed as a liability on the Statement of Assets and Liabilities.
Distributions to Shareholders
Distributions from net investment income, if any, are declared and paid annually. Net realized capital gains, if any, are distributed along with the income distribution. Income distributions and capital gain distributions are determined in accordance with federal income tax regulations, which may differ from GAAP.
Guarantees and Indemnifications
Under the Trust's organizational documents and, in some cases, by contract, its officers and trustees are indemnified against certain liabilities arising out of the performance of their duties to the Trust or its funds. In addition, certain of the Fund's contracts with its service providers contain general indemnification clauses. The Fund's maximum exposure under these arrangements is unknown since the amount of any future claims that may be made against the Fund cannot be determined, and the Fund has no historical basis for predicting the likelihood of any such claims.
Note 3. Fees and Compensation Paid to Affiliates
Investment Management Fees
Under an Investment Management Services Agreement, Columbia Management Investment Advisers, LLC (the Investment Manager), a wholly-owned subsidiary of Ameriprise Financial, Inc. (Ameriprise Financial), determines which securities will be purchased, held or sold. The investment management fee is an annual fee that is equal to a percentage of the Fund's average daily net assets that declines from 0.79% to 0.70% as the Fund's net assets increase. The effective investment management fee rate for the year ended
April 30, 2014 was 0.75% of the Fund's average daily net assets.
Administration Fees
Under an Administrative Services Agreement, the Investment Manager also serves as the Fund Administrator. The Fund pays the Fund Administrator an annual fee for administration and accounting services equal to a percentage of the Fund's average daily net assets that declines from 0.08% to 0.05% as the Fund's net assets increase. The effective administration fee rate for the year ended April 30, 2014 was 0.08% of the Fund's average daily net assets.
Compensation of Board Members
Board members are compensated for their services to the Fund as disclosed in the Statement of Operations. The Trust's eligible Trustees may participate in a Deferred Compensation Plan (the Plan) which may be terminated at any time. Obligations of the Plan will be paid solely out of the Fund's assets.
Compensation of Chief Compliance Officer
The Board has appointed a Chief Compliance Officer to the Fund in accordance with federal securities regulations. The Fund pays its pro-rata share of the expenses associated with the Chief Compliance Officer. The Fund's expenses for the Chief Compliance Officer will not exceed $15,000 per year.
Transfer Agent Fees
Under a Transfer and Dividend Disbursing Agent Agreement, Columbia Management Investment Services Corp. (the Transfer Agent), an affiliate of the Investment Manager and a wholly-owned subsidiary of Ameriprise Financial, is responsible for providing transfer agency services to the Fund. The Transfer Agent has contracted with Boston Financial Data Services (BFDS) to serve as sub-transfer agent.
The Transfer Agent receives monthly account-based service fees based on the number of open accounts and also receives sub-transfer agency fees based on a percentage of the average aggregate value of the Fund's shares maintained in omnibus accounts (other than omnibus accounts for which American Enterprise Investment Services Inc. is the broker of record or accounts where the beneficial shareholder is a customer of Ameriprise Financial Services, Inc., which are paid a per account fee). The Transfer Agent pays the fees of BFDS for services as sub-transfer agent and is not entitled to reimbursement for such fees from the Fund (with the exception of out-of-pocket fees).
The Transfer Agent also receives compensation from fees for various shareholder services and reimbursements for certain out-of-pocket fees. Total transfer agent fees for Class R5
Annual Report 2014
31
Columbia Small Cap Value Fund I
Notes to Financial Statements (continued)
April 30, 2014
shares are subject to an annual limitation of not more than 0.05% of the average daily net assets attributable to Class R5 shares. Class I and Class Y shares are not subject to transfer agent fees.
For the year ended April 30, 2014, the Fund's effective transfer agent fee rates as a percentage of average daily net assets of each class were as follows:
Class A | | | 0.20 | % | |
Class B | | | 0.20 | | |
Class C | | | 0.20 | | |
Class R | | | 0.20 | | |
Class R4 | | | 0.20 | | |
Class R5 | | | 0.05 | | |
Class Z | | | 0.20 | | |
An annual minimum account balance fee of $20 may apply to certain accounts with a value below the applicable share class's initial minimum investment requirements to reduce the impact of small accounts on transfer agent fees. These minimum account balance fees are recorded as part of expense reductions in the Statement of Operations. For the year ended April 30, 2014, these minimum account balance fees reduced total expenses by $6,462.
Distribution and Service Fees
The Fund has an agreement with Columbia Management Investment Distributors, Inc. (the Distributor), an affiliate of the Investment Manager and a wholly-owned subsidiary of Ameriprise Financial, for distribution and shareholder services. The Board has approved, and the Fund has adopted, distribution and shareholder service plans (the Plans) applicable to certain share classes, which set the distribution and service fees for the Fund. These fees are calculated daily and are intended to compensate the Distributor and/or eligible selling and/or servicing agents for selling shares of the Fund and providing services to investors.
Under the Plans, the Fund pays a monthly service fee to the Distributor at the maximum annual rate of 0.25% of the average daily net assets attributable to Class A, Class B and Class C shares of the Fund. Also under the Plans, the Fund pays a monthly distribution fee to the Distributor at the maximum annual rates of 0.75%, 0.75% and 0.50% of the average daily net assets attributable to Class B, Class C and Class R shares, respectively.
Sales Charges
Sales charges, including front-end charges and CDSCs, received by the Distributor for distributing Fund shares were $42,006 for Class A, $1,106 for Class B and $187 for Class C, shares for the year ended April 30, 2014.
Expenses Waived/Reimbursed by the Investment Manager and its Affiliates
The Investment Manager and certain of its affiliates have contractually agreed to waive fees and/or reimburse expenses (excluding certain fees and expenses described below) for the periods disclosed below, unless sooner terminated at the sole discretion of the Board, so that the Fund's net operating expenses, after giving effect to fees waived/expenses reimbursed and any balance credits and/or overdraft charges from the Fund's custodian, do not exceed the following annual rates as a percentage of the class' average daily net assets:
| | | September 1, 2013
through
August 31, 2014 | | Prior to
September 1, 2013 | |
Class A | | | 1.40 | % | | | 1.40 | % | |
Class B | | | 2.15 | | | | 2.15 | | |
Class C | | | 2.15 | | | | 2.15 | | |
Class I | | | 1.00 | | | | 0.99 | | |
Class R | | | 1.65 | | | | 1.65 | | |
Class R4 | | | 1.15 | | | | 1.15 | | |
Class R5 | | | 1.05 | | | | 1.04 | | |
Class Y | | | 1.00 | | | | 0.99 | | |
Class Z | | | 1.15 | | | | 1.15 | | |
Under the agreement governing these fee waivers and/or expense reimbursement arrangements, the following fees and expenses are excluded from the waiver/reimbursement commitment, and therefore will be paid by the Fund, if applicable: taxes (including foreign transaction taxes), expenses associated with investments in affiliated and non-affiliated pooled investment vehicles (including mutual funds and exchange-traded funds), transaction costs and brokerage commissions, costs related to any securities lending program, dividend expenses associated with securities sold short, inverse floater program fees and expenses, transaction charges and interest on borrowed money, interest, extraordinary expenses and any other expenses the exclusion of which is specifically approved by the Board. This agreement may be modified or amended only with approval from all parties.
Note 4. Federal Tax Information
The timing and character of income and capital gain distributions are determined in accordance with income tax regulations, which may differ from GAAP because of temporary or permanent book to tax differences.
At April 30, 2014, these differences are primarily due to differing treatment for deferral/reversal of wash sales losses, Trustees' deferred compensation, distribution reclassifications, foreign currency transactions, passive
Annual Report 2014
32
Columbia Small Cap Value Fund I
Notes to Financial Statements (continued)
April 30, 2014
foreign investment company (PFIC) holdings, re-characterization of distributions for investments and earnings and profits distributed to shareholders on the redemption of shares. To the extent these differences are permanent, reclassifications are made among the components of the Fund's net assets in the Statement of Assets and Liabilities. Temporary differences do not require reclassifications. In the Statement of Assets and Liabilities the following reclassifications were made:
Excess of distributions over net investment income | | $ | 1,806,318 | | |
Accumulated net realized gain | | | (32,709,948 | ) | |
Paid-in capital | | | 30,903,630 | | |
Net investment income and net realized gains (losses), as disclosed in the Statement of Operations, and net assets were not affected by this reclassification.
The tax character of distributions paid during the years indicated was as follows:
Year Ended April 30, | | 2014 | | 2013 | |
Ordinary income | | $ | 61,111,159 | | | $ | 11,885,761 | | |
Long-term capital gains | | | 138,613,369 | | | | 55,638,622 | | |
Total | | $ | 199,724,528 | | | $ | 67,524,383 | | |
Short-term capital gain distributions, if any, are considered ordinary income distributions for tax purposes.
At April 30, 2014, the components of distributable earnings on a tax basis were as follows:
Undistributed ordinary income | | $ | 10,173,249 | | |
Undistributed long-term capital gains | | | 103,338,967 | | |
Net unrealized appreciation | | | 368,971,096 | | |
At April 30, 2014, the cost of investments for federal income tax purposes was $983,842,303 and the aggregate gross unrealized appreciation and depreciation based on that cost was:
Unrealized appreciation | | $ | 383,480,709 | | |
Unrealized depreciation | | | (14,509,613 | ) | |
Net unrealized appreciation | | $ | 368,971,096 | | |
Management of the Fund has concluded that there are no significant uncertain tax positions that would require recognition in the financial statements. However, management's conclusion may be subject to review and adjustment at a later date based on factors including, but not limited to, new tax laws, regulations, and administrative interpretations (including relevant court decisions). Generally, the Fund's federal tax returns for the prior three fiscal years remain subject to examination by the Internal Revenue Service.
Note 5. Portfolio Information
The cost of purchases and proceeds from sales of securities, excluding short-term obligations, aggregated to $551,264,015 and $1,041,773,158, respectively, for the year ended April 30, 2014.
Note 6. Affiliated Money Market Fund
The Fund invests its daily cash balances in Columbia Short-Term Cash Fund, an affiliated money market fund established for the exclusive use by the Fund and other affiliated funds. The income earned by the Fund from such investments is included as "Dividends — affiliated issuers" in the Statement of Operations. As an investing fund, the Fund indirectly bears its proportionate share of the expenses of Columbia Short-Term Cash Fund.
Note 7. Shareholder Concentration
At April 30, 2014, two unaffiliated shareholders of record owned 35.5% of the outstanding shares of the Fund in one or more accounts. The Fund has no knowledge about whether any portion of those shares was owned beneficially. Subscription and redemption activity by concentrated accounts may have a significant effect on the operations of the fund.
Note 8. Line of Credit
The Fund has entered into a revolving credit facility with a syndicate of banks led by JPMorgan Chase Bank N.A. whereby the Fund may borrow for the temporary funding of shareholder redemptions or for other temporary or emergency purposes. The credit facility agreement, as amended, which is a collective agreement between the Fund and certain other funds managed by the Investment Manager, severally and not jointly, permits collective borrowings up to $500 million. Interest is charged to each participating fund based on its borrowings at a rate equal to the higher of (i) the overnight federal funds rate plus 1.00% or (ii) the one-month LIBOR rate plus 1.00%. Each borrowing under the credit facility matures no later than 60 days after the date of borrowing. Effective December 10, 2013, the Fund also pays a commitment fee equal to its pro rata share of the amount of the credit facility at a rate of 0.075% per annum. Prior to December 10, 2013, the commitment fee was charged at the annual rate of 0.08% per annum. The commitment fee is included in other expenses in the Statement of Operations.
For the year ended April 30, 2014, the average daily loan balance outstanding on days when borrowing existed was $14,400,000 at a weighted average interest rate of 1.20%. Interest expense incurred by the Fund is recorded as line of credit interest expense in the Statement of Operations.
Annual Report 2014
33
Columbia Small Cap Value Fund I
Notes to Financial Statements (continued)
April 30, 2014
Note 9. Significant Risks
Financial Sector Risk
Sector risk occurs when a fund invests a significant portion of its assets in securities of companies conducting business in a related group of industries within an economic sector. Companies in the same economic sector may be similarly affected by economic, regulatory, political or market events or conditions, making a fund more vulnerable to unfavorable developments in that economic sector than funds that invest more broadly. The Fund may be more susceptible to the particular risks that may affect companies in the financial sector than if it were invested in a wider variety of companies in unrelated sectors.
Note 10. Subsequent Events
Management has evaluated the events and transactions that have occurred through the date the financial statements were issued and noted no items requiring adjustment of the financial statements or additional disclosure.
Note 11. Information Regarding Pending and Settled Legal Proceedings
In December 2005, without admitting or denying the allegations, American Express Financial Corporation (AEFC, which is now known as Ameriprise Financial, Inc. (Ameriprise Financial)) entered into settlement agreements with the Securities and Exchange Commission (SEC) and Minnesota Department of Commerce (MDOC) related to market timing activities. As a result, AEFC was censured and ordered to cease and desist from committing or causing any violations of certain provisions of the Investment Advisers Act of 1940, the Investment Company Act of 1940, and various Minnesota laws. AEFC agreed to pay disgorgement of $10 million and civil money penalties of $7 million. AEFC also agreed to retain an independent distribution consultant to assist in developing a plan for distribution of all disgorgement and civil penalties ordered by the SEC in accordance with various undertakings detailed at www.sec.gov/litigation/admin/ia-2451.pdf. Ameriprise Financial and its affiliates have cooperated with the SEC and the MDOC in these legal proceedings, and have made regular reports to the Funds' Boards of Trustees.
Ameriprise Financial and certain of its affiliates have historically been involved in a number of legal, arbitration and regulatory proceedings, including routine litigation, class actions, and governmental actions, concerning matters arising in connection with the conduct of their business activities. Ameriprise Financial believes that the Funds are not currently the subject of, and that neither Ameriprise Financial nor any of its affiliates are the subject of, any pending legal, arbitration or
regulatory proceedings that are likely to have a material adverse effect on the Funds or the ability of Ameriprise Financial or its affiliates to perform under their contracts with the Funds. Ameriprise Financial is required to make 10-Q, 10-K and, as necessary, 8-K filings with the Securities and Exchange Commission on legal and regulatory matters that relate to Ameriprise Financial and its affiliates. Copies of these filings may be obtained by accessing the SEC website at www.sec.gov.
There can be no assurance that these matters, or the adverse publicity associated with them, will not result in increased fund redemptions, reduced sale of fund shares or other adverse consequences to the Funds. Further, although we believe proceedings are not likely to have a material adverse effect on the Funds or the ability of Ameriprise Financial or its affiliates to perform under their contracts with the Funds, these proceedings are subject to uncertainties and, as such, we are unable to estimate the possible loss or range of loss that may result. An adverse outcome in one or more of these proceedings could result in adverse judgments, settlements, fines, penalties or other relief that could have a material adverse effect on the consolidated financial condition or results of operations of Ameriprise Financial.
Annual Report 2014
34
Columbia Small Cap Value Fund I
Report of Independent Registered Public Accounting Firm
To the Trustees of Columbia Funds Series Trust I and the Shareholders of
Columbia Small Cap Value Fund I
In our opinion, the accompanying statement of assets and liabilities, including the portfolio of investments, and the related statements of operations and of changes in net assets and the financial highlights present fairly, in all material respects, the financial position of Columbia Small Cap Value Fund I (the "Fund", a series of Columbia Funds Series Trust I) at April 30, 2014, and the results of its operations, the changes in its net assets and the financial highlights for each of the periods indicated, in conformity with accounting principles generally accepted in the United States of America. These financial statements and financial highlights (hereafter referred to as "financial statements") are the responsibility of the Fund's management; our responsibility is to express an opinion on these financial statements based on our audits. We conducted our audits of these financial statements in accordance with the standards of the Public Company Accounting Oversight Board (United States). Those standards require that we plan and perform the audit to obtain reasonable assurance about whether the financial statements are free of material misstatement. An audit includes examining, on a test basis, evidence supporting the amounts and disclosures in the financial statements, assessing the accounting principles used and significant estimates made by management, and evaluating the overall financial statement presentation. We believe that our audits, which included confirmation of securities at April 30, 2014 by correspondence with the custodian, brokers and transfer agent, provide a reasonable basis for our opinion.
PricewaterhouseCoopers LLP
Minneapolis, Minnesota
June 20, 2014
Annual Report 2014
35
Columbia Small Cap Value Fund I
Federal Income Tax Information
(Unaudited)
The Fund hereby designates the following tax attributes for the fiscal year ended April 30, 2014. Shareholders will be notified in early 2015 of the amounts for use in preparing 2014 income tax returns.
Tax Designations
| Qualified Dividend Income | | | 45.34 | % | |
| Dividends Received Deduction | | | 44.10 | % | |
Capital Gain Dividend | | $ | 213,928,376 | | |
Qualified Dividend Income. For taxable, non-corporate shareholders, the percentage of ordinary income dividends paid during the fiscal year that represents qualified dividend income subject to reduced tax rates.
Dividends Received Deduction. The percentage of ordinary income dividends paid during the fiscal year that qualifies for the corporate dividends received deduction.
Capital Gain Dividend. The Fund designates as a capital gain dividend the amount reflected above, or if subsequently determined to be different, the net capital gain of such fiscal period. The Fund also designates as capital gain dividends, to the extent necessary to fully distribute such capital gains, earnings and profits distributed to shareholders on the redemption of shares.
Annual Report 2014
36
Columbia Small Cap Value Fund I
The Trustees serve terms of indefinite duration. The names, addresses and birth years of the Trustees and Officers of the Funds in Columbia Funds Series Trust I, the year each was first elected or appointed to office, their principal business occupations during at least the last five years, the number of Funds overseen by each Trustee and other directorships they hold are shown below. Each officer listed below serves as an officer of each Fund in Columbia Funds Series Trust I.
Independent Trustees
Name, Address and Year of Birth,
Position with Funds, Year First
Elected or Appointed to Office | | Principal Occupation(s) During Past Five Years, Number of Funds in Columbia
Funds Complex Overseen by Trustee, Other Directorships Held | |
Rodman L. Drake (Born 1943)
c/o Columbia Management
Investment Advisers, LLC
225 Franklin Street
Boston, MA 02110
Trustee (since 1994) and
Chairman of the Board (since 2009) | | Independent consultant since 2010; Co-Founder of Baringo Capital LLC (private equity) from 1997 to 2008; Chairman (from 2003 to 2010) and CEO (from 2008 to 2010) of Crystal River Capital, Inc. (real estate investment trust); Oversees 54; Jackson Hewitt Tax Service Inc. (tax preparation services) from 2004 to 2011; Student Loan Corporation (student loan provider) from 2005 to 2010; Celgene Corporation (global biotechnology company); The Helios Funds and Brookfield Funds (closed-end funds); Chimerix, Inc. (biopharmaceutical company) since August 1, 2013; Crystal River Capital, Inc. from 2005 to 2010; Parsons Brinckerhoff from 1995 to 2008; and Apex Silver Mines Ltd. from 2007 to 2009 | |
Douglas A. Hacker (Born 1955)
c/o Columbia Management
Investment Advisers, LLC
225 Franklin Street
Boston, MA 02110
Trustee (since 1996) | | Independent business executive since May 2006; Executive Vice President — Strategy of United Airlines from December 2002 to May 2006; President of UAL Loyalty Services (airline marketing company) from September 2001 to December 2002; Executive Vice President and Chief Financial Officer of United Airlines from July 1999 to September 2001. Oversees 54; Nash Finch Company (food distributor); Aircastle Limited (aircraft leasing); and SeaCube Container Leasing Ltd. (container leasing) | |
Janet Langford Kelly (Born 1957)
c/o Columbia Management
Investment Advisers, LLC
225 Franklin Street
Boston, MA 02110
Trustee (since 1996) | | Senior Vice President, General Counsel and Corporate Secretary, ConocoPhillips (integrated energy company) since September 2007; Deputy General Counsel — Corporate Legal Services, ConocoPhillips from August 2006 to August 2007; Partner, Zelle, Hofmann, Voelbel, Mason & Gette LLP (law firm) from March 2005 to July 2006; Adjunct Professor of Law, Northwestern University from September 2004 to June 2006; Director, UAL Corporation (airline) from February 2006 to July 2006; Chief Administrative Officer and Senior Vice President, Kmart Holding Corporation (consumer goods) from September 2003 to March 2004. Oversees 54; None | |
Nancy T. Lukitsh (Born 1956)
c/o Columbia Management
Investment Advisers, LLC
225 Franklin Street
Boston, MA 02110
Trustee (since 2011) | | Senior Vice President, Partner and Director of Marketing, Wellington Management Company, LLP (investment adviser) from 1997 to 2010; Chair, Wellington Management Investment Portfolios (commingled non-U.S. investment pools) from 2007 to 2010; Director, Wellington Trust Company, NA and other Wellington affiliates from 1997 to 2010. Oversees 54; None | |
William E. Mayer (Born 1940)
c/o Columbia Management
Investment Advisers, LLC
225 Franklin Street
Boston, MA 02110
Trustee (since 1994) | | Partner, Park Avenue Equity Partners (private equity) since February 1999; Dean and Professor, College of Business and Management, University of Maryland from 1992 to 1996. Oversees 54; DynaVox Inc. (speech creation); Lee Enterprises (print media); WR Hambrecht + Co. (financial service provider) from 2000 to 2012; BlackRock Kelso Capital Corporation (investment company) | |
David M. Moffett (Born 1952)
c/o Columbia Management
Investment Advisers, LLC
225 Franklin Street
Boston, MA 02110
Trustee (since 2011) | | Retired. Chief Executive Officer, Federal Home Loan Mortgage Corporation, from 2008 to 2009; Senior Adviser, Global Financial Services Group, Carlyle Group, Inc., from 2007 to 2008; Vice Chairman and Chief Financial Officer, U.S. Bancorp, from 1993 to 2007. Oversees 54; CIT Group Inc. (commercial and consumer finance); eBay Inc. (online trading community); MBIA Inc. (financial service provider); E.W. Scripps Co. (print and television media), Building Materials Holding Corp. (building materials and construction services); Genworth Financial, Inc. (financial and insurance products and services); and University of Oklahoma Foundation | |
Charles R. Nelson (Born 1942)
c/o Columbia Management
Investment Advisers, LLC
225 Franklin Street
Boston, MA 02110
Trustee (since 1981) | | Retired. Professor Emeritus, University of Washington, since 2011; Professor of Economics, University of Washington from 1976 to 2011; Ford and Louisa Van Voorhis Professor of Political Economy, University of Washington from 1993 to 2011; Adjunct Professor of Statistics, University of Washington from 1980 to 2011; Associate Editor, Journal of Money, Credit and Banking from September 1993 to 2008; consultant on econometric and statistical matters. Oversees 54; None | |
John J. Neuhauser (Born 1943)
c/o Columbia Management
Investment Advisers, LLC
225 Franklin Street
Boston, MA 02110
Trustee (since 1984) | | President, Saint Michael's College, since August 2007; Director or Trustee of several non-profit organizations, including Fletcher Allen Health Care, Inc.; University Professor, Boston College from November 2005 to August 2007; Academic Vice President and Dean of Faculties, Boston College from August 1999 to October 2005. Oversees 54; Liberty All-Star Equity Fund and Liberty All-Star Growth Fund (closed-end funds) | |
Annual Report 2014
37
Columbia Small Cap Value Fund I
Trustees and Officers (continued)
Independent Trustees (continued)
Name, Address and Year of Birth,
Position with Funds, Year First
Elected or Appointed to Office | | Principal Occupation(s) During Past Five Years, Number of Funds in Columbia
Funds Complex Overseen by Trustee, Other Directorships Held | |
Patrick J. Simpson (Born 1944)
c/o Columbia Management
Investment Advisers, LLC
225 Franklin Street
Boston, MA 02110
Trustee (since 2000) | | Partner, Perkins Coie LLP (law firm). Oversees 54; None | |
Anne-Lee Verville (Born 1945)
c/o Columbia Management
Investment Advisers, LLC
225 Franklin Street
Boston, MA 02110
Trustee (since 1998) | | Retired. General Manager — Global Education Industry from 1994 to 1997, President — Application Systems Division from 1991 to 1994, Chief Financial Officer — US Marketing & Services from 1988 to 1991, and Chief Information Officer from 1987 to 1988, IBM Corporation (computer and technology). Oversees 54; Enesco Group, Inc. (producer of giftware and home and garden decor products) from 2001 to 2006 | |
Interested Trustee
Name, Address and Year of Birth,
Position with Funds, Year First
Elected or Appointed to Office | | Principal Occupation(s) During Past Five Years, Number of Funds in Columbia
Funds Complex Overseen by Trustee, Other Directorships Held | |
William F. Truscott (born 1960)
53600 Ameriprise Financial Center
Minneapolis, MN 55474
Senior Vice President (since 2012) | | Chairman of the Board and President, Columbia Management Investment Advisers, LLC since May 2010 and February 2012 (previously President and Chief Investment Officer, from 2001 to April 2010); Chief Executive Officer, Global Asset Management, Ameriprise Financial, Inc. since September 2012 (previously, Chief Executive Officer, U.S. Asset Management & President, Annuities, from May 2010 to September 2012 and President — U.S. Asset Management and Chief Investment Officer from 2005 to April 2010); Director and Chief Executive Officer, Columbia Management Investment Distributors, Inc. since May 2010 and February 2012, respectively (previously Chairman of the Board and Chief Executive Officer from 2006 to April 2010); Chairman of the Board and Chief Executive Officer, RiverSource Distributors, Inc. since 2006; President and Chief Executive Officer, Ameriprise Certificate Company, 2006 to August 2012; Oversees 186; Director, Ameriprise Certificate Company, 2006-January 2013 | |
The Statement of Additional Information has additional information about the Fund's Board members and is available, without charge, upon request by calling 800.345.6611; contacting your financial intermediary; or visiting columbiamanagement.com.
The Board has appointed officers who are responsible for day-to-day business decisions based on policies it has established. The officers serve at the pleasure of the Board. In addition to Mr. Truscott, who is Senior Vice President, the Funds' other officers are:
Officers
Name,
Address and
Year of Birth | | Position and Year
First Appointed to
Position for any Fund
in the Columbia
Funds Complex or a
Predecessor Thereof | | Principal Occupation(s) During Past Five Years | |
J. Kevin Connaughton
225 Franklin Street
Boston, MA 02110
Born 1964 | | President and Principal Executive Officer (2009) | | Senior Vice President and General Manager — Mutual Fund Products, Columbia Management Investment Advisers, LLC, since May 2010; and President, Columbia Funds since 2009; previously, Managing Director, Columbia Management Advisors, LLC, from December 2004 to April 2010; Senior Vice President and Chief Financial Officer, Columbia Funds, from June 2008 to January 2009; and senior officer of Columbia Funds and affiliated funds since 2003. | |
Michael G. Clarke
225 Franklin Street
Boston, MA 02110
Born 1969 | | Treasurer (2011) and Chief Financial Officer (2009) | | Vice President, Columbia Management Investment Advisers, LLC, since May 2010; previously, Managing Director of Fund Administration, Columbia Management Advisors, LLC, from September 2004 to April 2010; and senior officer of Columbia Funds and affiliated funds since 2002. | |
Annual Report 2014
38
Columbia Small Cap Value Fund I
Trustees and Officers (continued)
Officers (continued)
Name,
Address and
Year of Birth | | Position and Year
First Appointed to
Position for any Fund
in the Columbia
Funds Complex or a
Predecessor Thereof | | Principal Occupation(s) During Past Five Years | |
Scott R. Plummer
5228 Ameriprise
Financial Center
Minneapolis, MN 55474
Born 1959 | | Senior Vice President (2006), Chief Legal Officer (2006) and Assistant Secretary (2011) | | Senior Vice President, Chief Legal Officer and Assistant Secretary, Columbia Management Investment Advisers, LLC, since June 2005; Senior Vice President and Lead Chief Counsel — Asset Management, Ameriprise Financial, Inc., since May 2010 (previously, Vice President and Chief Counsel — Asset Management, from 2005 to April 2010); Vice President, Chief Counsel and Assistant Secretary, Columbia Management Investment Distributors, Inc., since 2008; Vice President, General Counsel and Secretary, Ameriprise Certificate Company, since 2005; Chief Counsel, RiverSource Distributors, Inc., since 2006; and senior officer of Columbia Funds and affiliated funds since 2006. | |
Thomas P. McGuire
225 Franklin Street
Boston, MA 02110
Born 1972 | | Chief Compliance Officer (2012) | | Vice President — Asset Management Compliance, Ameriprise Financial, Inc., since May 2010; Chief Compliance Officer, Ameriprise Certificate Company, since September 2010; Compliance Executive, Bank of America, from 2005 to April 2010. | |
Colin Moore
225 Franklin Street
Boston, MA 02110
Born 1958 | | Senior Vice President (2010) | | Executive Vice President and Global Chief Investment Officer, Ameriprise Financial, Inc., since July 2013; Director and Global Chief Investment Officer, Columbia Management Investment Advisers, LLC, since May 2010; previously, Manager, Managing Director and Chief Investment Officer, Columbia Management Advisors, LLC, from 2007 to April 2010. | |
Michael E. DeFao
225 Franklin Street
Boston, MA 02110
Born 1968 | | Vice President (2011) and Assistant Secretary (2010) | | Vice President and Chief Counsel, Ameriprise Financial, Inc., since May 2010; Associate General Counsel, Bank of America from 2005 to April 2010. | |
Joseph F. DiMaria
225 Franklin Street
Boston, MA 02110
Born 1968 | | Vice President (2011) and Chief Accounting Officer (2008) | | Vice President — Mutual Fund Administration, Columbia Management Investment Advisers, LLC, since May 2010; previously, Director of Fund Administration, Columbia Management Advisors, LLC, from 2006 to April 2010. | |
Paul B. Goucher
100 Park Avenue
New York, NY 10017
Born 1968 | | Vice President (2011) and Assistant Secretary (2008) | | Vice President and Lead Chief Counsel, Ameriprise Financial, Inc., since November 2008 and January 2013, respectively (previously, Chief Counsel, from January 2010 to January 2013, and Group Counsel from November 2008 to January 2010); previously, Director, Managing Director and General Counsel, J. & W. Seligman & Co. Incorporated, from July 2008 to November 2008. | |
Amy Johnson
5228 Ameriprise
Financial Center
Minneapolis, MN
Born 1965 | | Vice President (2006) | | Senior Vice President and Chief Operating Officer, Columbia Management Investment Advisers, LLC, since May 2010; previously, Chief Administrative Officer, from 2009 to April 2010, and Vice President — Asset Management and Trust Company Services, from 2006 to 2009. | |
Paul D. Pearson
5228 Ameriprise
Financial Center
Minneapolis, MN
Born 1956 | | Vice President (2011) and Assistant Treasurer (1999) | | Vice President — Investment Accounting, Columbia Management Investment Advisers, LLC, since May 2010; previously, Vice President — Managed Assets, Investment Accounting, Ameriprise Financial, Inc. from 1998 to April 2010. | |
Christopher O. Petersen
5228 Ameriprise
Financial Center
Minneapolis, MN 55474
Born 1970 | | Vice President and Secretary (2010) | | Vice President and Chief Counsel, Ameriprise Financial, Inc., since January 2010 (previously, Vice President and Group Counsel or Counsel from 2004 to January 2010); officer of Columbia Funds and affiliated funds since 2007. | |
Stephen T. Welsh
225 Franklin Street
Boston, MA 02110
Born 1957 | | Vice President (2006) | | President and Director, Columbia Management Investment Services Corp., since May 2010; previously, President and Director, Columbia Management Services, Inc., from 2004 to April 2010; and Managing Director, Columbia Management Distributors, Inc., from 2007 to April 2010. | |
Annual Report 2014
39
This page intentionally left blank.
Annual Report 2014
40
Columbia Small Cap Value Fund I
Important Information About This Report
Each fund mails one shareholder report to each shareholder address. If you would like more than one report, please call shareholder services at 800.345.6611 and additional reports will be sent to you.
The policy of the Board is to vote the proxies of the companies in which each fund holds investments consistent with the procedures as stated in the Statement of Additional Information (SAI). You may obtain a copy of the SAI without charge by calling 800.345.6611; contacting your financial intermediary; visiting columbiamanagement.com; or searching the website of the Securities and Exchange Commission (SEC) at sec.gov. Information regarding how each fund voted proxies relating to portfolio securities is filed with the SEC by August 31 for the most recent 12-month period ending June 30 of that year, and is available without charge by visiting columbiamanagement.com; or searching the website of the SEC at sec.gov.
Each fund files a complete schedule of portfolio holdings with the SEC for the first and third quarters of each fiscal year on Form N-Q. Each fund's Form N-Q is available on the SEC's website at sec.gov and may be reviewed and copied at the SEC's Public Reference Room in Washington, D.C. Information on the operation of the Public Reference Room may be obtained by calling 800.SEC.0330. Each fund's complete schedule of portfolio holdings, as filed on Form N-Q, can also be obtained without charge, upon request, by calling 800.345.6611.
Annual Report 2014
41

Columbia Small Cap Value Fund I
P.O. Box 8081
Boston, MA 02266-8081
columbiamanagement.com
This information is for use with concurrent or prior delivery of a fund prospectus. Please read and consider the investment objectives, risks, charges and expenses for any fund carefully before investing. For a prospectus and, if available, a summary prospectus, which contains this and other important information about the Fund go to columbiamanagement.com. The Fund is distributed by Columbia Management Investment Distributors, Inc., member FINRA, and managed by Columbia Management Investment Advisers, LLC.
© 2014 Columbia Management Investment Advisers, LLC. All rights reserved.
ANN229_04_D01_(06/14)
Annual Report
April 30, 2014

Columbia Corporate Income Fund
Not FDIC insured • No bank guarantee • May lose value
 Dear Shareholders,
Continued Economic Recovery
The U.S. economy continued to recover at a slow but steady pace during the first quarter of 2014, supported by solid manufacturing activity, reasonable job growth and continued gains for the housing market. Industrial production was robust, buoyed by strong demand for autos and related parts. After a disappointing January, job growth picked up, which helped boost consumer confidence. Housing data was somewhat mixed, as harsh weather and higher mortgage rates put a damper on sales, while lower inventories helped prices trend higher. The Federal Reserve (the Fed) announced further reductions to its monthly asset purchases and reassured the markets that it would not make any significant changes to monetary policy until it was satisfied that the labor market was on solid ground. Despite mostly good news on the economic front, the broad financial markets recorded only modest gains, as bitter winter weather at home and mounting tensions between Russia and Western allies prompted investor caution.
Investors braced for higher interest rates, but long-term yields declined and the fixed-income markets were surprisingly resilient in the face of stable-to-improving economic data. Risk-on trading continued during the quarter as the higher yielding sectors of the fixed-income markets generally fared well. Emerging-market bonds, long-term U.S. Treasuries and sovereign debt were among the strongest performers, as were Treasury Inflation Protected Securities. Municipal bonds delivered solid gains, especially high-yield municipals, which benefited from continued improvement in state finances.
Against this backdrop, the broad bond market, as measured by the Barclays U.S. Aggregate Bond Index, edged out the broad stock market, as measured by the Standard & Poor's 500 Index, with gains of 1.84% vs. 1.81%, respectively. As indicated late last year, the Fed began tapering its monthly asset purchase program and announced further reductions. New Fed chair Janet Yellen reassured investors the Fed was committed to keeping short-term borrowing rates low into 2015.
Stay on Track with Columbia Management
Backed by more than 100 years of experience, Columbia Management is one of the nation's largest asset managers. At the heart of our success and, most importantly, that of our investors, are highly talented industry professionals, brought together by a unique way of working. At Columbia Management, reaching our performance goals matters, and how we reach them matters just as much.
Visit columbiamanagement.com for:
> The Columbia Management Perspectives blog, offering insights on current market events and investment opportunities
> Detailed up-to-date fund performance and portfolio information
> Quarterly fund commentaries
> Columbia Management investor, our award-winning quarterly newsletter for shareholders
Thank you for your continued support of the Columbia Funds. We look forward to serving your investment needs for many years to come.
Best Regards,

J. Kevin Connaughton
President, Columbia Funds
Investing involves risk including the risk of loss of principal.
The Barclays U.S. Aggregate Bond Index is a broad-based benchmark that measures the investment grade, U.S. dollar denominated, fixed-rate taxable bond market, including Treasuries, government-related and corporate securities, mortgage-backed securities (agency fixed-rate and hybrid adjustable-rate mortgage passthroughs), asset-backed securities, and commercial mortgage-backed securities. The S&P 500 Index, an unmanaged index, measures the performance of 500 widely held, large-capitalization U.S. stocks and is frequently used as a general measure of market performance. Indices are not available for investment, are not professionally managed and do not reflect sales charges, fees, brokerage commissions, taxes or other expenses of investing.
Investors should consider the investment objectives, risks, charges and expenses of a mutual fund carefully before investing. For a free prospectus and, if available, a summary prospectus, which contains this and other important information about a fund, visit columbiamanagement.com. The prospectus should be read carefully before investing.
Columbia Funds are distributed by Columbia Management Investment Distributors, Inc., member FINRA, and managed by Columbia Management Investment Advisers, LLC.
© 2014 Columbia Management Investment Advisers, LLC. All rights reserved.
Columbia Corporate Income Fund
Performance Overview | | | 2 | | |
Manager Discussion of Fund Performance | | | 4 | | |
Understanding Your Fund's Expenses | | | 6 | | |
Portfolio of Investments | | | 7 | | |
Statement of Assets and Liabilities | | | 24 | | |
Statement of Operations | | | 26 | | |
Statement of Changes in Net Assets | | | 27 | | |
Financial Highlights | | | 30 | | |
Notes to Financial Statements | | | 39 | | |
Report of Independent Registered
Public Accounting Firm | | | 47 | | |
Federal Income Tax Information | | | 48 | | |
Trustees and Officers | | | 49 | | |
Important Information About This Report | | | 53 | | |
Fund Investment Manager
Columbia Management Investment
Advisers, LLC
225 Franklin Street
Boston, MA 02110
Fund Distributor
Columbia Management Investment
Distributors, Inc.
225 Franklin Street
Boston, MA 02110
Fund Transfer Agent
Columbia Management Investment
Services Corp.
P.O. Box 8081
Boston, MA 02266-8081
For more information about any of the funds, please visit columbiamanagement.com or call 800.345.6611. Customer Service Representatives are available to answer your questions Monday through Friday from 8 a.m. to 7 p.m. Eastern time.
The views expressed in this report reflect the current views of the respective parties. These views are not guarantees of future performance and involve certain risks, uncertainties and assumptions that are difficult to predict, so actual outcomes and results may differ significantly from the views expressed. These views are subject to change at any time based upon economic, market or other conditions and the respective parties disclaim any responsibility to update such views. These views may not be relied on as investment advice and, because investment decisions for a Columbia Fund are based on numerous factors, may not be relied on as an indication of trading intent on behalf of any particular Columbia Fund. References to specific securities should not be construed as a recommendation or investment advice.
Columbia Corporate Income Fund
Performance Summary
> Columbia Corporate Income Fund (the Fund) Class A shares returned 1.60% excluding sales charges for the 12-month period that ended April 30, 2014.
> During the same 12-month period, the Fund underperformed its Blended Benchmark, which returned 1.64%, and outperformed the Barclays U.S. Corporate Index, which returned 0.84%.
> The Fund benefited from security selection and exposure to corporate spreads (securities that offered yields higher than U.S. Treasuries), which partially offset the price impact of rising interest rates.
Average Annual Total Returns (%) (for period ended April 30, 2014)
| | Inception | | 1 Year | | 5 Years | | 10 Years | |
Class A | | 07/31/00 | | | | | | | | | | | | | |
Excluding sales charges | | | | | | | 1.60 | | | | 10.94 | | | | 5.73 | | |
Including sales charges | | | | | | | -3.21 | | | | 9.87 | | | | 5.21 | | |
Class B | | 07/15/02 | | | | | | | | | | | | | |
Excluding sales charges | | | | | | | 0.84 | | | | 10.12 | | | | 4.94 | | |
Including sales charges | | | | | | | -3.94 | | | | 9.84 | | | | 4.94 | | |
Class C | | 07/15/02 | | | | | | | | | | | | | |
Excluding sales charges | | | | | | | 0.99 | | | | 10.28 | | | | 5.10 | | |
Including sales charges | | | | | | | 0.03 | | | | 10.28 | | | | 5.10 | | |
Class I* | | 09/27/10 | | | 2.04 | | | | 11.34 | | | | 6.05 | | |
Class R4* | | 11/08/12 | | | 1.95 | | | | 11.24 | | | | 6.01 | | |
Class R5* | | 11/08/12 | | | 2.09 | | | | 11.28 | | | | 6.03 | | |
Class W* | | 09/27/10 | | | 1.60 | | | | 10.94 | | | | 5.74 | | |
Class Y* | | 11/08/12 | | | 2.14 | | | | 11.29 | | �� | | 6.03 | | |
Class Z | | 03/05/86 | | | 1.85 | | | | 11.22 | | | | 5.99 | | |
Blended Benchmark | | | | | | | 1.64 | | | | 10.16 | | | | 6.22 | | |
Barclays U.S. Corporate Index | | | | | | | 0.84 | | | | 9.20 | | | | 5.76 | | |
Returns for Class A are shown with and without the maximum initial sales charge of 4.75%. Returns for Class B are shown with and without the applicable contingent deferred sales charge (CDSC) of 5.00% in the first year, declining to 1.00% in the sixth year and eliminated thereafter. Returns for Class C are shown with and without the 1.00% CDSC for the first year only. The Fund's other classes are not subject to sales charges and have limited eligibility. Please see the Fund's prospectus for details. Performance for different share classes will vary based on differences in sales charges and fees associated with each class. All results shown assume reinvestment of distributions during the period. Returns do not reflect the deduction of taxes that a shareholder may pay on Fund distributions or on the redemption of Fund shares. Performance results reflect the effect of any fee waivers or reimbursements of Fund expenses by Columbia Management Investment Advisers, LLC and/or any of its affiliates. Absent these fee waivers or expense reimbursement arrangements, performance results would have been lower.
The performance information shown represents past performance and is not a guarantee of future results. The investment return and principal value of your investment will fluctuate so that your shares, when redeemed, may be worth more or less than their original cost. Current performance may be lower or higher than the performance information shown. You may obtain performance information current to the most recent month-end by contacting your financial intermediary, visiting columbiamanagement.com or calling 800.345.6611.
*The returns shown for periods prior to the share class inception date (including returns for the Life of the Fund, if shown, which are since Fund inception) include the returns of the Fund's oldest share class. These returns are adjusted to reflect any higher class-related operating expenses of the newer share classes, as applicable. Please visit columbiamanagement.com/mutual-funds/appended-performance for more information.
The Blended Benchmark is a weighted custom benchmark, established by the Investment Manager, consisting of an 85% weighting in the Barclays U.S. Corporate Index and a 15% weighting in the Bank of America Merrill Lynch U.S. High Yield Cash Pay Constrained Index. The Bank of America Merrill Lynch U.S. High Yield Cash Pay Constrained Index tracks the performance of U.S. dollar-denominated corporate debt that is below investment grade, currently in a coupon paying period, and is publicly issued in the U.S. domestic market.
The Barclays U.S. Corporate Index measures the investment grade, fixed-rate, taxable, corporate bond market.
Indices are not available for investment, are not professionally managed and do not reflect sales charges, fees, brokerage commissions, taxes or other expenses of investing. Securities in the Fund may not match those in an index.
Annual Report 2014
2
Columbia Corporate Income Fund
Performance Overview (continued)
Performance of a Hypothetical $10,000 Investment (May 1, 2004 – April 30, 2014)
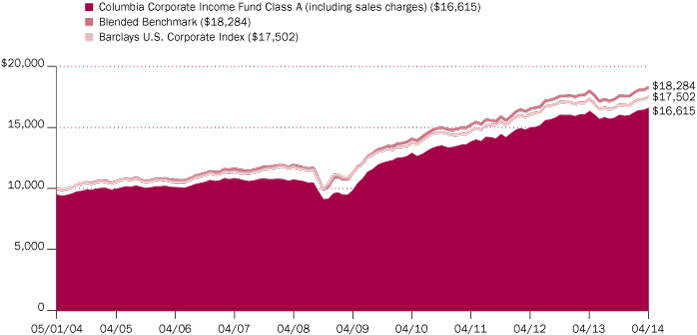
The chart above shows the change in value of a hypothetical $10,000 investment in Class A shares of Columbia Corporate Income Fund during the stated time period, and does not reflect the deduction of taxes that a shareholder may pay on Fund distributions or on the redemption of Fund shares.
Annual Report 2014
3
Columbia Corporate Income Fund
Manager Discussion of Fund Performance
For the 12-month period that ended April 30, 2014, the Fund's Class A shares returned 1.60% excluding sales charges. During the same 12-month period, the Fund underperformed its Blended Benchmark, which returned 1.64%, and outperformed the Barclays U.S. Corporate Index, which returned 0.84%. The Fund benefited from security selection and exposure to corporate spreads (securities that offered yields higher than U.S. Treasuries), which partially offset the price impact of rising interest rates.
Stable Economic Growth
Early in the period, economic data indicated a pickup in growth and included a strong positive surprise in the April 2013 employment numbers. These developments prompted then Federal Reserve (Fed) chief Ben Bernanke to signal a potential end to its monthly bond-buying program, known as quantitative easing. Interest rates rose sharply in response, sending bond prices lower. The most credit-sensitive sectors of the fixed-income markets outperformed in the second half of the calendar year, supported by continuing evidence of steady economic growth and a revival in risk appetite among investors. Early in 2014, geopolitical tensions between Russia and Ukraine and weakness in the U.S. economy resulting from severe winter weather drove investors to seek shelter in the U.S. Treasury market. Against this backdrop, higher quality, longer duration non-Treasury securities led performance. At the end of April 2014, the yield on the 10-year Treasury sat almost a full percentage point higher than at the beginning of the 12-month period and the yield premium offered on non-Treasury sectors was at its lowest since the 2008 financial crisis.
Contributors and Detractors
Having anticipated the probability of the above mentioned rate volatility, we entered the period with the Fund positioned with shorter duration than the benchmark. Duration is a measure of interest rate sensitivity. This position benefited relative returns during 2013 but detracted modestly from results as interest rates rallied in the first four months of 2014.
We maintained a preference for asset-rich companies with the ability to generate strong cash flow, which translated into overweights in the industrial and utility sectors. Security selection within pipelines, utilities, and media/telecom companies contributed most significantly to Fund results.
We reduced the Fund's exposure to below investment grade securities, as we chose to sacrifice a moderate amount of yield in exchange for increased net asset value stability in the wake of persistent high yield spread compression. High-yield exposure accounted for approximately 15% of net assets when the period began, but had been reduced to just below 10% by April of 2014. In addition, the Fund's overweight to six- to nine-year maturities contributed to results as credit spreads tightened and the yield curve steepened.
The Fund uses highly-liquid, widely-traded Treasury futures contracts to help manage portfolio duration and yield curve exposure. This strategy lowered the Fund's duration vs. that of the benchmark, which positively impacted relative performance as interest rates rose sharply over the period.
Looking Ahead
It is worth noting that interest rates have never been so low for so long, making it especially difficult to predict how the market will react when short-term rates
Portfolio Management
Tom Murphy, CFA
Tim Doubek, CFA
Brian Lavin, CFA
Portfolio Breakdown (%)
(at April 30, 2014) | |
Common Stocks | | | 0.0 | (a) | |
Financials | | | 0.0 | (a) | |
Corporate Bonds & Notes | | | 88.3 | | |
Foreign Government
Obligations | | | 0.4 | | |
Money Market Funds | | | 7.0 | | |
Residential Mortgage-Backed Securities — Agency | | | 0.0 | (a) | |
Senior Loans | | | 0.7 | | |
U.S. Treasury Obligations | | | 3.6 | | |
Total | | | 100.0 | | |
Percentages indicated are based upon total investments. The Fund's portfolio composition is subject to change.
(a) Rounds to zero.
Quality Breakdown (%)
(at April 30, 2014) | |
AAA rating | | | 3.9 | | |
AA rating | | | 1.0 | | |
A rating | | | 20.8 | | |
BBB rating | | | 62.2 | | |
BB rating | | | 5.4 | | |
B rating | | | 4.7 | | |
CCC rating | | | 2.0 | | |
Not rated | | | 0.0 | (a) | |
Total | | | 100.0 | | |
(a) Rounds to zero.
Percentages indicated are based upon total fixed income securities (excluding Money Market Funds).
Bond ratings apply to the underlying holdings of the Fund and not the Fund itself and are divided into categories ranging from AAA (highest) to D (lowest), and are subject to change. The ratings shown are determined by using the middle rating of Moody's, S&P, and Fitch after dropping the highest and lowest available ratings. When a rating from only two agencies is available, the lower rating is used. When a rating from only one agency is available, that rating is used. When a bond is not rated by one of these agencies, it is designated as Not rated. Credit ratings are subjective opinions and not statements of fact.
Annual Report 2014
4
Columbia Corporate Income Fund
Manager Discussion of Fund Performance (continued)
make their inevitable move higher. Complacency on the part of fixed-income investors may translate into additional volatility should rates continue to rise, although the timing of such an event remains to be seen. We believe that steadfastly maintaining a longer term perspective enables us to see the asymmetric risk/reward tradeoff from extending duration or reaching for yield. As such, we currently have no plans to make immediate changes to the Fund's conservative duration positioning, even if it results in short-term give-ups in relative performance. We believe working with our partners in credit research will help us to identify opportunities with which to build a diversified portfolio designed to perform well across a myriad of market outcomes.
Investment Risks
There are risks associated with an investment in this Fund, including credit risk, market risk, interest rate risk and prepayment and extension risk. In general, bond prices rise when interest rates fall and vice versa. This effect is more pronounced for longer-term securities. Noninvestment grade securities, commonly called "high-yield" or "junk" bonds, have more volatile prices and carry more risk to principal and income than investment grade securities. See the Fund's prospectus for more information on these and other risks.
Annual Report 2014
5
Columbia Corporate Income Fund
Understanding Your Fund's Expenses
(Unaudited)
As an investor, you incur two types of costs. There are transaction costs, which generally include sales charges on purchases and may include redemption fees. There are also ongoing costs, which generally include management fees, distribution and/or service fees, and other fund expenses. The following information is intended to help you understand your ongoing costs (in dollars) of investing in the Fund and to help you compare these costs with the ongoing costs of investing in other mutual funds.
Analyzing Your Fund's Expenses
To illustrate these ongoing costs, we have provided examples and calculated the expenses paid by investors in each share class of the Fund during the period. The actual and hypothetical information in the table is based on an initial investment of $1,000 at the beginning of the period indicated and held for the entire period. Expense information is calculated two ways and each method provides you with different information. The amount listed in the "Actual" column is calculated using the Fund's actual operating expenses and total return for the period. You may use the Actual information, together with the amount invested, to estimate the expenses that you paid over the period. Simply divide your account value by $1,000 (for example, an $8,600 account value divided by $1,000 = 8.6), then multiply the results by the expenses paid during the period under the "Actual" column. The amount listed in the "Hypothetical" column assumes a 5% annual rate of return before expenses (which is not the Fund's actual return) and then applies the Fund's actual expense ratio for the period to the hypothetical return. You should not use the hypothetical account values and expenses to estimate either your actual account balance at the end of the period or the expenses you paid during the period. See "Compare With Other Funds" below for details on how to use the hypothetical data.
Compare With Other Funds
Since all mutual funds are required to include the same hypothetical calculations about expenses in shareholder reports, you can use this information to compare the ongoing cost of investing in the Fund with other funds. To do so, compare the hypothetical example with the 5% hypothetical examples that appear in the shareholder reports of other funds. As you compare hypothetical examples of other funds, it is important to note that hypothetical examples are meant to highlight the ongoing costs of investing in a fund only and do not reflect any transaction costs, such as sales charges, or redemption or exchange fees. Therefore, the hypothetical calculations are useful in comparing ongoing costs only, and will not help you determine the relative total costs of owning different funds. If transaction costs were included in these calculations, your costs would be higher.
November 1, 2013 – April 30, 2014
| | Account Value at the Beginning
of the Period ($) | | Account Value at the End
of the Period ($) | | Expenses Paid During
the Period ($) | | Fund's Annualized
Expense Ratio (%) | |
| | Actual | | Hypothetical | | Actual | | Hypothetical | | Actual | | Hypothetical | | Actual | |
Class A | | | 1,000.00 | | | | 1,000.00 | | | | 1,036.80 | | | | 1,020.03 | | | | 4.85 | | | | 4.81 | | | | 0.96 | | |
Class B | | | 1,000.00 | | | | 1,000.00 | | | | 1,033.00 | | | | 1,016.31 | | | | 8.62 | | | | 8.55 | | | | 1.71 | | |
Class C | | | 1,000.00 | | | | 1,000.00 | | | | 1,033.80 | | | | 1,017.06 | | | | 7.87 | | | | 7.80 | | | | 1.56 | | |
Class I | | | 1,000.00 | | | | 1,000.00 | | | | 1,039.10 | | | | 1,022.22 | | | | 2.63 | | | | 2.61 | | | | 0.52 | | |
Class R4 | | | 1,000.00 | | | | 1,000.00 | | | | 1,039.20 | | | | 1,021.27 | | | | 3.59 | | | | 3.56 | | | | 0.71 | | |
Class R5 | | | 1,000.00 | | | | 1,000.00 | | | | 1,039.90 | | | | 1,021.97 | | | | 2.88 | | | | 2.86 | | | | 0.57 | | |
Class W | | | 1,000.00 | | | | 1,000.00 | | | | 1,036.80 | | | | 1,020.03 | | | | 4.85 | | | | 4.81 | | | | 0.96 | | |
Class Y | | | 1,000.00 | | | | 1,000.00 | | | | 1,039.10 | | | | 1,022.22 | | | | 2.63 | | | | 2.61 | | | | 0.52 | | |
Class Z | | | 1,000.00 | | | | 1,000.00 | | | | 1,038.10 | | | | 1,021.27 | | | | 3.59 | | | | 3.56 | | | | 0.71 | | |
Expenses paid during the period are equal to the annualized expense ratio for each class as indicated above, multiplied by the average account value over the period and then multiplied by the number of days in the Fund's most recent fiscal half year and divided by 365.
Expenses do not include fees and expenses incurred indirectly by the Fund from the underlying funds in which the Fund may invest (also referred to as "acquired funds"), including affiliated and non-affiliated pooled investment vehicles (including mutual funds and exchange-traded funds).
Had Columbia Management Investment Advisers, LLC and/or certain of its affiliates not waived/reimbursed certain fees and expenses, account value at the end of the period would have been reduced.
Annual Report 2014
6
Columbia Corporate Income Fund
Portfolio of Investments
April 30, 2014
(Percentages represent value of investments compared to net assets)
Corporate Bonds & Notes 86.7%
Issuer | | Coupon
Rate | | Principal
Amount ($) | | Value ($) | |
Aerospace & Defense 1.4% | |
ADS Tactical, Inc.
Senior Secured(a)
04/01/18 | | | 11.000 | % | | | 219,000 | | | | 215,715 | | |
Bombardier, Inc.(a)
Senior Unsecured
05/01/14 | | | 6.300 | % | | | 105,000 | | | | 105,013 | | |
04/15/19 | | | 4.750 | % | | | 256,000 | | | | 260,480 | | |
03/15/20 | | | 7.750 | % | | | 188,000 | | | | 214,320 | | |
10/15/22 | | | 6.000 | % | | | 295,000 | | | | 300,163 | | |
Northrop Grumman Corp.
Senior Unsecured
03/15/21 | | | 3.500 | % | | | 10,389,000 | | | | 10,673,430 | | |
08/01/23 | | | 3.250 | % | | | 7,425,000 | | | | 7,251,886 | | |
TransDigm, Inc.
10/15/20 | | | 5.500 | % | | | 31,000 | | | | 31,310 | | |
07/15/21 | | | 7.500 | % | | | 278,000 | | | | 305,800 | | |
Total | | | | | | | 19,358,117 | | |
Airlines —% | |
Continental Airlines Pass-Through Trust
Series 1997-1 Class A
04/01/15 | | | 7.461 | % | | | 80,985 | | | | 82,604 | | |
Automotive 0.3% | |
Allison Transmission, Inc.(a)
05/15/19 | | | 7.125 | % | | | 330,000 | | | | 356,400 | | |
American Axle & Manufacturing, Inc.
02/15/19 | | | 5.125 | % | | | 211,000 | | | | 221,022 | | |
03/15/21 | | | 6.250 | % | | | 376,000 | | | | 397,620 | | |
Chrysler Group LLC/Co-Issuer, Inc.
Secured
06/15/19 | | | 8.000 | % | | | 317,000 | | | | 347,115 | | |
06/15/21 | | | 8.250 | % | | | 235,000 | | | | 264,081 | | |
Chrysler Group LLC/Co-Issuer, Inc.(a)
Secured
06/15/19 | | | 8.000 | % | | | 274,000 | | | | 300,030 | | |
Dana Holding Corp.
Senior Unsecured
02/15/19 | | | 6.500 | % | | | 65,000 | | | | 69,144 | | |
General Motors Co.
Senior Unsecured(a)
10/02/23 | | | 4.875 | % | | | 400,000 | | | | 413,500 | | |
Jaguar Land Rover Automotive PLC(a)
12/15/18 | | | 4.125 | % | | | 240,000 | | | | 247,800 | | |
02/01/23 | | | 5.625 | % | | | 144,000 | | | | 150,300 | | |
Visteon Corp.
04/15/19 | | | 6.750 | % | | | 663,000 | | | | 697,019 | | |
Total | | | | | | | 3,464,031 | | |
Corporate Bonds & Notes (continued)
Issuer | | Coupon
Rate | | Principal
Amount ($) | | Value ($) | |
Banking 4.4% | |
Ally Financial, Inc.
02/15/17 | | | 5.500 | % | | | 633,000 | | | | 688,387 | | |
03/15/20 | | | 8.000 | % | | | 668,000 | | | | 807,445 | | |
Bank of America Corp.
Senior Unsecured
07/24/23 | | | 4.100 | % | | | 12,650,000 | | | | 12,924,720 | | |
Citigroup, Inc.
Senior Unsecured
10/25/23 | | | 3.875 | % | | | 19,025,000 | | | | 19,020,738 | | |
Goldman Sachs Group, Inc. (The)
Senior Unsecured
03/03/24 | | | 4.000 | % | | | 23,150,000 | | | | 23,228,039 | | |
HSBC Holdings PLC
Senior Unsecured
03/30/22 | | | 4.000 | % | | | 4,580,000 | | | | 4,815,078 | | |
Synovus Financial Corp.
Senior Unsecured
02/15/19 | | | 7.875 | % | | | 912,000 | | | | 1,041,960 | | |
Washington Mutual Bank
Subordinated Notes(b)(c)(d)
01/15/15 | | | 5.125 | % | | | 6,350,000 | | | | 9,525 | | |
Total | | | | | | | 62,535,892 | | |
Brokerage 0.1% | |
E*TRADE Financial Corp.
Senior Unsecured
11/15/19 | | | 6.375 | % | | | 466,000 | | | | 506,192 | | |
Nuveen Investments, Inc.(a)
Senior Unsecured
10/15/17 | | | 9.125 | % | | | 156,000 | | | | 170,820 | | |
10/15/20 | | | 9.500 | % | | | 366,000 | | | | 436,455 | | |
Total | | | | | | | 1,113,467 | | |
Building Materials 0.2% | |
Allegion US Holding Co., Inc.(a)
10/01/21 | | | 5.750 | % | | | 327,000 | | | | 346,620 | | |
American Builders & Contractors Supply Co., Inc.
Senior Unsecured(a)
04/15/21 | | | 5.625 | % | | | 627,000 | | | | 648,945 | | |
Gibraltar Industries, Inc.
02/01/21 | | | 6.250 | % | | | 181,000 | | | | 191,860 | | |
HD Supply, Inc.
07/15/20 | | | 7.500 | % | | | 390,000 | | | | 422,175 | | |
Secured
04/15/20 | | | 11.000 | % | | | 315,000 | | | | 371,700 | | |
The accompanying Notes to Financial Statements are an integral part of this statement.
Annual Report 2014
7
Columbia Corporate Income Fund
Portfolio of Investments (continued)
April 30, 2014
Corporate Bonds & Notes (continued)
Issuer | | Coupon
Rate | | Principal
Amount ($) | | Value ($) | |
Nortek, Inc.
12/01/18 | | | 10.000 | % | | | 45,000 | | | | 49,050 | | |
04/15/21 | | | 8.500 | % | | | 747,000 | | | | 823,567 | | |
USG Corp.(a)
11/01/21 | | | 5.875 | % | | | 117,000 | | | | 124,313 | | |
Total | | | | | | | 2,978,230 | | |
Chemicals 1.1% | |
Axalta Coating Systems U.S. Holdings,
Inc/Dutch Holding B BV(a)
05/01/21 | | | 7.375 | % | | | 290,000 | | | | 318,638 | | |
Celanese U.S. Holdings LLC
06/15/21 | | | 5.875 | % | | | 293,000 | | | | 320,835 | | |
Dow Chemical Co. (The)
Senior Unsecured
11/15/22 | | | 3.000 | % | | | 1,061,000 | | | | 1,020,825 | | |
Huntsman International LLC
11/15/20 | | | 4.875 | % | | | 264,000 | | | | 267,300 | | |
03/15/21 | | | 8.625 | % | | | 73,000 | | | | 81,395 | | |
INEOS Group Holdings SA(a)
02/15/19 | | | 5.875 | % | | | 363,000 | | | | 370,260 | | |
JM Huber Corp.
Senior Notes(a)
11/01/19 | | | 9.875 | % | | | 520,000 | | | | 596,700 | | |
LYB International Finance BV
07/15/23 | | | 4.000 | % | | | 3,020,000 | | | | 3,128,639 | | |
LyondellBasell Industries NV
Senior Unsecured
04/15/19 | | | 5.000 | % | | | 6,455,000 | | | | 7,235,990 | | |
NOVA Chemicals Corp.
Senior Unsecured(a)
08/01/23 | | | 5.250 | % | | | 379,000 | | | | 405,530 | | |
PQ Corp.
Secured(a)
05/01/18 | | | 8.750 | % | | | 1,101,000 | | | | 1,200,090 | | |
Total | | | | | | | 14,946,202 | | |
Construction Machinery 0.6% | |
Ashtead Capital, Inc.
Secured(a)
07/15/22 | | | 6.500 | % | | | 175,000 | | | | 190,313 | | |
CNH Industrial Capital LLC
04/15/18 | | | 3.625 | % | | | 4,120,000 | | | | 4,197,250 | | |
Case New Holland Industrial, Inc.
12/01/17 | | | 7.875 | % | | | 1,716,000 | | | | 2,016,300 | | |
Columbus McKinnon Corp.
02/01/19 | | | 7.875 | % | | | 559,000 | | | | 600,925 | | |
Corporate Bonds & Notes (continued)
Issuer | | Coupon
Rate | | Principal
Amount ($) | | Value ($) | |
Neff Rental LLC/Finance Corp.
Secured(a)
05/15/16 | | | 9.625 | % | | | 408,000 | | | | 424,320 | | |
United Rentals North America, Inc.
05/15/20 | | | 7.375 | % | | | 867,000 | | | | 960,202 | | |
04/15/22 | | | 7.625 | % | | | 175,000 | | | | 196,875 | | |
06/15/23 | | | 6.125 | % | | | 43,000 | | | | 46,225 | | |
11/15/24 | | | 5.750 | % | | | 38,000 | | | | 39,425 | | |
Secured
07/15/18 | | | 5.750 | % | | | 109,000 | | | | 116,630 | | |
Senior Unsecured
02/01/21 | | | 8.250 | % | | | 120,000 | | | | 134,250 | | |
Total | | | | | | | 8,922,715 | | |
Consumer Cyclical Services 0.1% | |
ADT Corp. (The)
Senior Unsecured
07/15/22 | | | 3.500 | % | | | 273,000 | | | | 240,923 | | |
APX Group, Inc.
12/01/20 | | | 8.750 | % | | | 278,000 | | | | 283,560 | | |
Senior Secured
12/01/19 | | | 6.375 | % | | | 629,000 | | | | 640,007 | | |
Monitronics International, Inc.
04/01/20 | | | 9.125 | % | | | 517,000 | | | | 550,605 | | |
Service Corp. International
Senior Unsecured
01/15/22 | | | 5.375 | % | | | 177,000 | | | | 180,540 | | |
Total | | | | | | | 1,895,635 | | |
Consumer Products 0.5% | |
Alphabet Holding Co., Inc.
Senior Unsecured PIK
11/01/17 | | | 7.750 | % | | | 210,000 | | | | 217,350 | | |
Clorox Co. (The)
Senior Unsecured
09/15/22 | | | 3.050 | % | | | 5,185,000 | | | | 5,073,097 | | |
Libbey Glass, Inc.
Senior Secured
05/15/20 | | | 6.875 | % | | | 23,000 | | | | 23,706 | | |
Serta Simmons Holdings LLC
Senior Unsecured(a)
10/01/20 | | | 8.125 | % | | | 369,000 | | | | 405,439 | | |
Spectrum Brands, Inc.
11/15/20 | | | 6.375 | % | | | 720,000 | | | | 779,400 | | |
Springs Window Fashions LLC
Senior Secured(a)
06/01/21 | | | 6.250 | % | | | 275,000 | | | | 286,000 | | |
Tempur Sealy International, Inc.
12/15/20 | | | 6.875 | % | | | 497,000 | | | | 541,730 | | |
Total | | | | | | | 7,326,722 | | |
The accompanying Notes to Financial Statements are an integral part of this statement.
Annual Report 2014
8
Columbia Corporate Income Fund
Portfolio of Investments (continued)
April 30, 2014
Corporate Bonds & Notes (continued)
Issuer | | Coupon
Rate | | Principal
Amount ($) | | Value ($) | |
Diversified Manufacturing 0.7% | |
Amsted Industries, Inc.(a)
03/15/22 | | | 5.000 | % | | | 300,000 | | | | 299,250 | | |
Entegris, Inc.(a)
04/01/22 | | | 6.000 | % | | | 202,000 | | | | 204,525 | | |
Gardner Denver, Inc.
Senior Unsecured(a)
08/15/21 | | | 6.875 | % | | | 691,000 | | | | 709,139 | | |
General Electric Co.
Senior Unsecured
03/11/44 | | | 4.500 | % | | | 7,395,000 | | | | 7,615,866 | | |
Hamilton Sundstrand Corp.
Senior Unsecured(a)
12/15/20 | | | 7.750 | % | | | 653,000 | | | | 708,505 | | |
Total | | | | | | | 9,537,285 | | |
Electric 18.1% | |
AES Corp. (The)
Senior Unsecured
07/01/21 | | | 7.375 | % | | | 204,000 | | | | 233,580 | | |
Appalachian Power Co.
Senior Unsecured
03/30/21 | | | 4.600 | % | | | 8,345,000 | | | | 9,162,026 | | |
Berkshire Hathaway Energy Co.
Senior Unsecured(a)
11/15/43 | | | 5.150 | % | | | 11,900,000 | | | | 13,028,081 | | |
CMS Energy Corp.
Senior Unsecured
09/30/15 | | | 4.250 | % | | | 995,000 | | | | 1,039,907 | | |
02/01/20 | | | 6.250 | % | | | 2,205,000 | | | | 2,605,214 | | |
03/15/22 | | | 5.050 | % | | | 3,150,000 | | | | 3,545,618 | | |
03/31/43 | | | 4.700 | % | | | 2,435,000 | | | | 2,461,641 | | |
03/01/44 | | | 4.875 | % | | | 3,975,000 | | | | 4,124,325 | | |
Calpine Corp.
Senior Secured(a)
01/15/22 | | | 6.000 | % | | | 321,000 | | | | 340,260 | | |
CenterPoint Energy Houston Electric LLC
08/01/42 | | | 3.550 | % | | | 10,000,000 | | | | 8,929,420 | | |
04/01/44 | | | 4.500 | % | | | 3,000,000 | | | | 3,151,908 | | |
Connecticut Light & Power Co. (The)
1st Refunding Mortgage
01/15/23 | | | 2.500 | % | | | 1,873,000 | | | | 1,774,443 | | |
DTE Energy Co.
Senior Unsecured
06/01/16 | | | 6.350 | % | | | 14,800,000 | | | | 16,413,851 | | |
12/01/23 | | | 3.850 | % | | | 9,645,000 | | | | 9,903,341 | | |
Dominion Resources, Inc.
Senior Unsecured
03/15/21 | | | 4.450 | % | | | 1,080,000 | | | | 1,173,788 | | |
09/15/22 | | | 2.750 | % | | | 18,627,000 | | | | 17,926,010 | | |
09/15/42 | | | 4.050 | % | | | 7,799,000 | | | | 7,145,202 | | |
Corporate Bonds & Notes (continued)
Issuer | | Coupon
Rate | | Principal
Amount ($) | | Value ($) | |
Duke Energy Corp.
Senior Unsecured
09/15/21 | | | 3.550 | % | | | 17,925,000 | | | | 18,574,100 | | |
10/15/23 | | | 3.950 | % | | | 4,890,000 | | | | 5,074,480 | | |
04/15/24 | | | 3.750 | % | | | 2,445,000 | | | | 2,479,902 | | |
Indiana Michigan Power Co.
Senior Unsecured
12/01/15 | | | 5.650 | % | | | 1,500,000 | | | | 1,586,262 | | |
03/15/23 | | | 3.200 | % | | | 13,250,000 | | | | 12,951,279 | | |
Ipalco Enterprises, Inc.
Senior Secured(a)
04/01/16 | | | 7.250 | % | | | 330,000 | | | | 362,588 | | |
NRG Energy, Inc.(a)
07/15/22 | �� | | 6.250 | % | | | 790,000 | | | | 815,675 | | |
Oncor Electric Delivery Co. LLC
Senior Secured
09/30/17 | | | 5.000 | % | | | 4,000,000 | | | | 4,441,080 | | |
06/01/42 | | | 5.300 | % | | | 5,465,000 | | | | 6,185,555 | | |
PPL Capital Funding, Inc.
06/01/23 | | | 3.400 | % | | | 20,430,000 | | | | 20,088,206 | | |
03/15/24 | | | 3.950 | % | | | 1,565,000 | | | | 1,602,516 | | |
PSEG Power LLC
11/15/18 | | | 2.450 | % | | | 1,295,000 | | | | 1,304,935 | | |
PacifiCorp
1st Mortgage
06/01/23 | | | 2.950 | % | | | 8,525,000 | | | | 8,326,819 | | |
Pacific Gas & Electric Co.
Senior Unsecured
10/01/20 | | | 3.500 | % | | | 6,619,000 | | | | 6,896,495 | | |
02/15/24 | | | 3.750 | % | | | 4,385,000 | | | | 4,457,594 | | |
11/15/43 | | | 5.125 | % | | | 6,255,000 | | | | 6,823,705 | | |
02/15/44 | | | 4.750 | % | | | 1,770,000 | | | | 1,841,413 | | |
Progress Energy, Inc.
Senior Unsecured
04/01/22 | | | 3.150 | % | | | 16,250,000 | | | | 16,162,185 | | |
Southern California Edison Co.
1st Refunding Mortgage
06/01/21 | | | 3.875 | % | | | 13,024,000 | | | | 13,944,319 | | |
10/01/43 | | | 4.650 | % | | | 2,410,000 | | | | 2,570,588 | | |
TransAlta Corp.
Senior Unsecured
01/15/15 | | | 4.750 | % | | | 9,315,000 | | | | 9,570,891 | | |
Xcel Energy, Inc.
Senior Unsecured
05/15/20 | | | 4.700 | % | | | 7,145,000 | | | | 7,907,814 | | |
Total | | | | | | | 256,927,016 | | |
Entertainment 0.6% | |
AMC Entertainment, Inc.
12/01/20 | | | 9.750 | % | | | 51,000 | | | | 58,650 | | |
The accompanying Notes to Financial Statements are an integral part of this statement.
Annual Report 2014
9
Columbia Corporate Income Fund
Portfolio of Investments (continued)
April 30, 2014
Corporate Bonds & Notes (continued)
Issuer | | Coupon
Rate | | Principal
Amount ($) | | Value ($) | |
Activision Blizzard, Inc.(a)
09/15/21 | | | 5.625 | % | | | 1,040,000 | | | | 1,108,900 | | |
Six Flags, Inc.(a)(b)(d)(e)(f)
06/01/44 | | | 9.625 | % | | | 259,000 | | | | — | | |
Time Warner, Inc.
03/29/41 | | | 6.250 | % | | | 6,360,000 | | | | 7,613,079 | | |
Total | | | | | | | 8,780,629 | | |
Environmental 1.0% | |
Waste Management, Inc.
06/30/20 | | | 4.750 | % | | | 8,000,000 | | | | 8,861,208 | | |
09/15/22 | | | 2.900 | % | | | 5,835,000 | | | | 5,629,147 | | |
Total | | | | | | | 14,490,355 | | |
Food and Beverage 6.3% | |
ConAgra Foods, Inc.
Senior Unsecured
06/15/17 | | | 5.819 | % | | | 4,925,000 | | | | 5,549,308 | | |
09/15/22 | | | 3.250 | % | | | 13,103,000 | | | | 12,776,146 | | |
01/25/23 | | | 3.200 | % | | | 2,005,000 | | | | 1,934,011 | | |
Darling International, Inc.(a)
01/15/22 | | | 5.375 | % | | | 425,000 | | | | 436,687 | | |
Diageo Capital PLC
07/15/20 | | | 4.828 | % | | | 1,970,000 | | | | 2,211,089 | | |
04/29/23 | | | 2.625 | % | | | 10,003,000 | | | | 9,427,627 | | |
Diamond Foods, Inc.(a)
03/15/19 | | | 7.000 | % | | | 94,000 | | | | 97,290 | | |
Heineken NV(a)
Senior Unsecured
04/01/22 | | | 3.400 | % | | | 13,875,000 | | | | 14,020,979 | | |
04/01/23 | | | 2.750 | % | | | 4,884,000 | | | | 4,613,715 | | |
PepsiCo, Inc.
Senior Unsecured
03/01/23 | | | 2.750 | % | | | 10,785,000 | | | | 10,287,833 | | |
SABMiller Holdings, Inc.(a)
01/15/22 | | | 3.750 | % | | | 26,980,000 | | | | 27,857,983 | | |
TreeHouse Foods, Inc.
03/15/22 | | | 4.875 | % | | | 91,000 | | | | 92,137 | | |
Total | | | | | | | 89,304,805 | | |
Gaming 0.3% | |
Boyd Gaming Corp.
07/01/20 | | | 9.000 | % | | | 72,000 | | | | 79,380 | | |
GLP Capital LP/Financing II Inc.(a)
11/01/23 | | | 5.375 | % | | | 355,000 | | | | 365,650 | | |
MGM Resorts International
03/01/18 | | | 11.375 | % | | | 233,000 | | | | 302,318 | | |
10/01/20 | | | 6.750 | % | | | 616,000 | | | | 680,742 | | |
Corporate Bonds & Notes (continued)
Issuer | | Coupon
Rate | | Principal
Amount ($) | | Value ($) | |
PNK Finance Corp.(a)
08/01/21 | | | 6.375 | % | | | 666,000 | | | | 699,300 | | |
Penn National Gaming, Inc.
Senior Unsecured(a)
11/01/21 | | | 5.875 | % | | | 241,000 | | | | 232,565 | | |
Seminole Tribe of Florida, Inc.(a)
Senior Secured
10/01/20 | | | 6.535 | % | | | 251,000 | | | | 278,610 | | |
Senior Unsecured
10/01/20 | | | 7.804 | % | | | 390,000 | | | | 428,356 | | |
Seneca Gaming Corp.(a)
12/01/18 | | | 8.250 | % | | | 633,000 | | | | 677,310 | | |
Tunica-Biloxi Gaming Authority
Senior Unsecured(a)
11/15/15 | | | 9.000 | % | | | 203,000 | | | | 168,236 | | |
Wynn Macau Ltd.
Senior Unsecured(a)
10/15/21 | | | 5.250 | % | | | 542,000 | | | | 550,130 | | |
Total | | | | | | | 4,462,597 | | |
Gas Distributors 1.5% | |
Sempra Energy
Senior Unsecured
12/01/23 | | | 4.050 | % | | | 20,017,000 | | | | 20,694,936 | | |
Gas Pipelines 9.9% | |
Access Midstream Partners LP/Finance Corp.
05/15/23 | | | 4.875 | % | | | 752,000 | | | | 761,400 | | |
03/15/24 | | | 4.875 | % | | | 233,000 | | | | 231,835 | | |
CenterPoint Energy Resources Corp.
Senior Unsecured
11/01/17 | | | 6.125 | % | | | 7,966,000 | | | | 9,090,130 | | |
Crestwood Midstream Partners LP/Corp.(a)
03/01/22 | | | 6.125 | % | | | 206,000 | | | | 215,270 | | |
El Paso LLC
Senior Secured
09/15/20 | | | 6.500 | % | | | 1,139,000 | | | | 1,256,900 | | |
El Paso Pipeline Partners Operating Co. LLC(g)
05/01/24 | | | 4.300 | % | | | 6,395,000 | | | | 6,411,537 | | |
Energy Transfer Partners LP
Senior Unsecured
02/01/43 | | | 5.150 | % | | | 2,715,000 | | | | 2,686,376 | | |
Enterprise Products Operating LLC
03/15/23 | | | 3.350 | % | | | 4,410,000 | | | | 4,344,066 | | |
02/15/45 | | | 5.100 | % | | | 4,400,000 | | | | 4,645,106 | | |
Hiland Partners LP/Finance Corp.(a)
10/01/20 | | | 7.250 | % | | | 1,316,000 | | | | 1,434,440 | | |
Kinder Morgan Energy Partners LP
Senior Unsecured
03/01/21 | | | 3.500 | % | | | 2,270,000 | | | | 2,272,946 | | |
The accompanying Notes to Financial Statements are an integral part of this statement.
Annual Report 2014
10
Columbia Corporate Income Fund
Portfolio of Investments (continued)
April 30, 2014
Corporate Bonds & Notes (continued)
Issuer | | Coupon
Rate | | Principal
Amount ($) | | Value ($) | |
09/01/22 | | | 3.950 | % | | | 10,032,000 | | | | 10,088,681 | | |
02/15/23 | | | 3.450 | % | | | 13,410,000 | | | | 12,850,951 | | |
MarkWest Energy Partners LP/Finance Corp.
06/15/22 | | | 6.250 | % | | | 496,000 | | | | 534,440 | | |
02/15/23 | | | 5.500 | % | | | 753,000 | | | | 781,237 | | |
07/15/23 | | | 4.500 | % | | | 231,000 | | | | 225,225 | | |
Midcontinent Express Pipeline LLC
Senior Unsecured(a)
09/15/14 | | | 5.450 | % | | | 9,295,000 | | | | 9,395,274 | | |
NiSource Finance Corp.
02/15/23 | | | 3.850 | % | | | 1,453,000 | | | | 1,469,041 | | |
Northwest Pipeline LLC
Senior Unsecured
04/15/17 | | | 5.950 | % | | | 8,479,000 | | | | 9,490,468 | | |
Plains All American Pipeline LP/Finance Corp.
Senior Unsecured
06/01/22 | | | 3.650 | % | | | 4,513,000 | | | | 4,612,494 | | |
01/31/23 | | | 2.850 | % | | | 12,050,000 | | | | 11,448,958 | | |
Regency Energy Partners LP/Finance Corp.
07/15/21 | | | 6.500 | % | | | 812,000 | | | | 872,900 | | |
03/01/22 | | | 5.875 | % | | | 213,000 | | | | 223,118 | | |
11/01/23 | | | 4.500 | % | | | 320,000 | | | | 301,600 | | |
Rockies Express Pipeline LLC
Senior Unsecured(a)
04/15/15 | | | 3.900 | % | | | 12,795,000 | | | | 13,002,919 | | |
Sabine Pass Liquefaction LLC
Senior Secured(a)
03/15/22 | | | 6.250 | % | | | 343,000 | | | | 359,721 | | |
Southern Natural Gas Co. LLC
Senior Unsecured(a)
04/01/17 | | | 5.900 | % | | | 16,345,000 | | | | 18,380,247 | | |
Southern Star Central Corp.
Senior Unsecured
03/01/16 | | | 6.750 | % | | | 65,000 | | | | 65,081 | | |
Southern Star Central Corp.(a)
Senior Unsecured
03/01/16 | | | 6.750 | % | | | 375,000 | | | | 375,000 | | |
TransCanada PipeLines Ltd.
Senior Unsecured
10/16/23 | | | 3.750 | % | | | 2,865,000 | | | | 2,922,678 | | |
Transcontinental Gas Pipe Line Co. LLC
Senior Unsecured
04/15/16 | | | 6.400 | % | | | 8,983,000 | | | | 9,893,005 | | |
08/01/42 | | | 4.450 | % | | | 263,000 | | | | 256,754 | | |
Total | | | | | | | 140,899,798 | | |
Health Care 1.8% | |
Amsurg Corp.
11/30/20 | | | 5.625 | % | | | 276,000 | | | | 284,970 | | |
Corporate Bonds & Notes (continued)
Issuer | | Coupon
Rate | | Principal
Amount ($) | | Value ($) | |
Biomet, Inc.
08/01/20 | | | 6.500 | % | | | 96,000 | | | | 105,000 | | |
CHS/Community Health Systems, Inc.
Senior Secured
08/15/18 | | | 5.125 | % | | | 825,000 | | | | 867,281 | | |
CHS/Community Health Systems, Inc.(a)
02/01/22 | | | 6.875 | % | | | 565,000 | | | | 585,481 | | |
Senior Secured
08/01/21 | | | 5.125 | % | | | 103,000 | | | | 105,060 | | |
Cardinal Health, Inc.
Senior Unsecured
03/15/23 | | | 3.200 | % | | | 6,404,000 | | | | 6,283,579 | | |
Catamaran Corp.
03/15/21 | | | 4.750 | % | | | 104,000 | | | | 104,780 | | |
ConvaTec Finance International SA
Senior Unsecured PIK(a)
01/15/19 | | | 8.250 | % | | | 207,000 | | | | 211,658 | | |
ConvaTec Healthcare E SA
Senior Unsecured(a)
12/15/18 | | | 10.500 | % | | | 882,000 | | | | 970,200 | | |
DaVita HealthCare Partners, Inc.
08/15/22 | | | 5.750 | % | | | 795,000 | | | | 841,706 | | |
Emdeon, Inc.
12/31/19 | | | 11.000 | % | | | 392,000 | | | | 453,740 | | |
Fresenius Medical Care U.S. Finance II, Inc.(a)
07/31/19 | | | 5.625 | % | | | 192,000 | | | | 208,800 | | |
Fresenius Medical Care U.S. Finance, Inc.(a)
09/15/18 | | | 6.500 | % | | | 383,000 | | | | 429,917 | | |
HCA, Inc.
Senior Secured
03/15/19 | | | 3.750 | % | | | 490,000 | | | | 493,675 | | |
02/15/20 | | | 6.500 | % | | | 1,171,000 | | | | 1,305,665 | | |
IMS Health, Inc.
Senior Unsecured(a)
11/01/20 | | | 6.000 | % | | | 352,000 | | | | 371,360 | | |
Kinetic Concepts, Inc./KCI U.S.A., Inc.
Secured
11/01/18 | | | 10.500 | % | | | 263,000 | | | | 300,478 | | |
LifePoint Hospitals, Inc.(a)
12/01/21 | | | 5.500 | % | | | 299,000 | | | | 310,960 | | |
MPH Acquisition Holdings LLC(a)
04/01/22 | | | 6.625 | % | | | 380,000 | | | | 392,350 | | |
McKesson Corp.
Senior Unsecured
03/15/23 | | | 2.850 | % | | | 6,845,000 | | | | 6,524,620 | | |
03/15/44 | | | 4.883 | % | | | 1,145,000 | | | | 1,194,814 | | |
Physio-Control International, Inc.
Senior Secured(a)
01/15/19 | | | 9.875 | % | | | 227,000 | | | | 252,538 | | |
The accompanying Notes to Financial Statements are an integral part of this statement.
Annual Report 2014
11
Columbia Corporate Income Fund
Portfolio of Investments (continued)
April 30, 2014
Corporate Bonds & Notes (continued)
Issuer | | Coupon
Rate | | Principal
Amount ($) | | Value ($) | |
STHI Holding Corp.
Secured(a)
03/15/18 | | | 8.000 | % | | | 243,000 | | | | 257,580 | | |
Tenet Healthcare Corp.
Senior Secured
06/01/20 | | | 4.750 | % | | | 638,000 | | | | 641,190 | | |
Senior Unsecured
04/01/22 | | | 8.125 | % | | | 914,000 | | | | 1,014,540 | | |
Tenet Healthcare Corp.(a)
Senior Secured
10/01/20 | | | 6.000 | % | | | 264,000 | | | | 277,860 | | |
United Surgical Partners International, Inc.
04/01/20 | | | 9.000 | % | | | 362,000 | | | | 404,083 | | |
Total | | | | | | | 25,193,885 | | |
Healthcare Insurance —% | |
Centene Corp.
Senior Unsecured
05/15/22 | | | 4.750 | % | | | 157,000 | | | | 157,785 | | |
Centene Corp.(g)
Senior Unsecured
05/15/22 | | | 4.750 | % | | | 20,000 | | | | 20,100 | | |
Total | | | | | | | 177,885 | | |
Home Construction 0.2% | |
Brookfield Residential Properties, Inc./U.S. Corp.(a)
07/01/22 | | | 6.125 | % | | | 147,000 | | | | 150,308 | | |
KB Home
05/15/19 | | | 4.750 | % | | | 202,000 | | | | 201,495 | | |
Meritage Homes Corp.
03/01/18 | | | 4.500 | % | | | 360,000 | | | | 368,100 | | |
04/15/20 | | | 7.150 | % | | | 78,000 | | | | 86,580 | | |
04/01/22 | | | 7.000 | % | | | 174,000 | | | | 190,747 | | |
Shea Homes LP/Funding Corp.
Senior Secured
05/15/19 | | | 8.625 | % | | | 278,000 | | | | 305,105 | | |
Standard Pacific Corp.
12/15/21 | | | 6.250 | % | | | 271,000 | | | | 289,970 | | |
Taylor Morrison Communities, Inc./Monarch, Inc.(a)
04/15/20 | | | 7.750 | % | | | 383,000 | | | | 420,342 | | |
04/15/20 | | | 7.750 | % | | | 132,000 | | | | 144,870 | | |
Total | | | | | | | 2,157,517 | | |
Independent Energy 3.6% | |
Antero Resources Corp.(a)(g)
12/01/22 | | | 5.125 | % | | | 272,000 | | | | 274,380 | | |
Antero Resources Finance Corp.
08/01/19 | | | 7.250 | % | | | 98,000 | | | | 104,782 | | |
Antero Resources Finance Corp.(a)
11/01/21 | | | 5.375 | % | | | 273,000 | | | | 279,142 | | |
Corporate Bonds & Notes (continued)
Issuer | | Coupon
Rate | | Principal
Amount ($) | | Value ($) | |
Apache Corp.
Senior Unsecured
01/15/44 | | | 4.250 | % | | | 2,335,000 | | | | 2,246,903 | | |
Athlon Holdings LP/Finance Corp.(a)
04/15/21 | | | 7.375 | % | | | 779,000 | | | | 841,320 | | |
Athlon Holdings LP/Finance Corp.(a)(g)
05/01/22 | | | 6.000 | % | | | 179,000 | | | | 181,237 | | |
Aurora U.S.A. Oil & Gas, Inc.(a)
04/01/20 | | | 7.500 | % | | | 779,000 | | | | 886,891 | | |
Canadian Natural Resources Ltd.
Senior Unsecured
04/15/24 | | | 3.800 | % | | | 4,345,000 | | | | 4,428,698 | | |
Canadian Oil Sands Ltd.(a)
04/01/22 | | | 4.500 | % | | | 3,780,000 | | | | 3,951,820 | | |
Senior Unsecured
04/01/42 | | | 6.000 | % | | | 2,165,000 | | | | 2,452,982 | | |
Carrizo Oil & Gas, Inc.
10/15/18 | | | 8.625 | % | | | 434,000 | | | | 464,380 | | |
Chesapeake Energy Corp.
08/15/20 | | | 6.625 | % | | | 1,003,000 | | | | 1,125,617 | | |
02/15/21 | | | 6.125 | % | | | 539,000 | | | | 590,205 | | |
03/15/23 | | | 5.750 | % | | | 794,000 | | | | 843,625 | | |
Comstock Resources, Inc.
06/15/20 | | | 9.500 | % | | | 786,000 | | | | 898,005 | | |
Concho Resources, Inc.
01/15/21 | | | 7.000 | % | | | 1,254,000 | | | | 1,391,940 | | |
01/15/22 | | | 6.500 | % | | | 174,000 | | | | 190,530 | | |
04/01/23 | | | 5.500 | % | | | 88,000 | | | | 91,630 | | |
Continental Resources, Inc.
10/01/19 | | | 8.250 | % | | | 240,000 | | | | 257,400 | | |
09/15/22 | | | 5.000 | % | | | 5,976,000 | | | | 6,319,620 | | |
EP Energy LLC/Everest Acquisition Finance, Inc.
09/01/22 | | | 7.750 | % | | | 130,000 | | | | 144,788 | | |
EP Energy LLC/Finance, Inc.
Senior Unsecured
05/01/20 | | | 9.375 | % | | | 531,000 | | | | 613,305 | | |
EXCO Resources, Inc.
04/15/22 | | | 8.500 | % | | | 206,000 | | | | 211,665 | | |
Halcon Resources Corp.
07/15/20 | | | 9.750 | % | | | 28,000 | | | | 29,960 | | |
05/15/21 | | | 8.875 | % | | | 155,000 | | | | 160,619 | | |
Halcon Resources Corp.(a)
07/15/20 | | | 9.750 | % | | | 142,000 | | | | 151,762 | | |
Hess Corp.
Senior Unsecured
02/15/41 | | | 5.600 | % | | | 4,170,000 | | | | 4,715,724 | | |
Kodiak Oil & Gas Corp.
01/15/21 | | | 5.500 | % | | | 449,000 | | | | 462,470 | | |
02/01/22 | | | 5.500 | % | | | 1,124,000 | | | | 1,152,100 | | |
The accompanying Notes to Financial Statements are an integral part of this statement.
Annual Report 2014
12
Columbia Corporate Income Fund
Portfolio of Investments (continued)
April 30, 2014
Corporate Bonds & Notes (continued)
Issuer | | Coupon
Rate | | Principal
Amount ($) | | Value ($) | |
Laredo Petroleum, Inc.
05/01/22 | | | 7.375 | % | | | 297,000 | | | | 327,442 | | |
Laredo Petroleum, Inc.(a)
01/15/22 | | | 5.625 | % | | | 362,000 | | | | 368,335 | | |
MEG Energy Corp.(a)
03/31/24 | | | 7.000 | % | | | 260,000 | | | | 275,600 | | |
Noble Energy, Inc.
Senior Unsecured
11/15/43 | | | 5.250 | % | | | 3,915,000 | | | | 4,256,408 | | |
Oasis Petroleum, Inc.
11/01/21 | | | 6.500 | % | | | 834,000 | | | | 892,380 | | |
01/15/23 | | | 6.875 | % | | | 860,000 | | | | 930,950 | | |
Oasis Petroleum, Inc.(a)
03/15/22 | | | 6.875 | % | | | 344,000 | | | | 373,240 | | |
Parsley Energy LLC/Finance Corp.
Senior Unsecured(a)
02/15/22 | | | 7.500 | % | | | 616,000 | | | | 643,720 | | |
QEP Resources, Inc.
Senior Unsecured
03/01/21 | | | 6.875 | % | | | 397,000 | | | | 438,685 | | |
RKI Exploration & Production LLC/Finance Corp.(a)
08/01/21 | | | 8.500 | % | | | 81,000 | | | | 87,885 | | |
Range Resources Corp.
06/01/21 | | | 5.750 | % | | | 705,000 | | | | 754,350 | | |
Rice Energy, Inc.(a)
05/01/22 | | | 6.250 | % | | | 241,000 | | | | 241,301 | | |
SM Energy Co.
Senior Unsecured
11/15/21 | | | 6.500 | % | | | 294,000 | | | | 316,050 | | |
SandRidge Energy, Inc.
10/15/22 | | | 8.125 | % | | | 198,000 | | | | 214,335 | | |
02/15/23 | | | 7.500 | % | | | 67,000 | | | | 70,853 | | |
Whiting Petroleum Corp.
10/01/18 | | | 6.500 | % | | | 35,000 | | | | 36,925 | | |
03/15/21 | | | 5.750 | % | | | 672,000 | | | | 720,720 | | |
Woodside Finance Ltd.(a)
05/10/21 | | | 4.600 | % | | | 4,295,000 | | | | 4,634,305 | | |
Total | | | | | | | 51,046,984 | | |
Integrated Energy 1.3% | |
Cenovus Energy, Inc.
Senior Unsecured
09/15/23 | | | 3.800 | % | | | 17,495,000 | | | | 17,759,647 | | |
Life Insurance 3.2% | |
Five Corners Funding Trust(a)
11/15/23 | | | 4.419 | % | | | 24,925,000 | | | | 26,011,137 | | |
Corporate Bonds & Notes (continued)
Issuer | | Coupon
Rate | | Principal
Amount ($) | | Value ($) | |
MetLife, Inc.
Senior Unsecured
09/15/23 | | | 4.368 | % | | | 11,950,000 | | | | 12,836,451 | | |
Prudential Covered Trust
Secured(a)
09/30/15 | | | 2.997 | % | | | 2,376,000 | | | | 2,441,977 | | |
Prudential Financial, Inc.
Senior Unsecured
05/12/41 | | | 5.625 | % | | | 3,590,000 | | | | 4,149,265 | | |
Total | | | | | | | 45,438,830 | | |
Lodging 0.1% | |
Hilton Worldwide Finance/Corp.(a)
10/15/21 | | | 5.625 | % | | | 714,000 | | | | 746,130 | | |
Playa Resorts Holding BV
Senior Unsecured(a)
08/15/20 | | | 8.000 | % | | | 629,000 | | | | 682,529 | | |
Total | | | | | | | 1,428,659 | | |
Media Cable 3.8% | |
CCO Holdings LLC/Capital Corp.
01/15/19 | | | 7.000 | % | | | 162,000 | | | | 171,113 | | |
03/15/21 | | | 5.250 | % | | | 479,000 | | | | 487,981 | | |
04/30/21 | | | 6.500 | % | | | 178,000 | | | | 190,015 | | |
09/30/22 | | | 5.250 | % | | | 41,000 | | | | 41,000 | | |
CSC Holdings LLC
Senior Unsecured
02/15/19 | | | 8.625 | % | | | 425,000 | | | | 506,812 | | |
CSC Holdings, Inc.
Senior Unsecured
11/15/21 | | | 6.750 | % | | | 176,000 | | | | 195,800 | | |
Cablevision Systems Corp.
Senior Unsecured
04/15/20 | | | 8.000 | % | | | 290,000 | | | | 334,950 | | |
Cequel Communications Holdings I LLC/Capital Corp.
Senior Unsecured(a)
09/15/20 | | | 6.375 | % | | | 595,000 | | | | 623,262 | | |
DIRECTV Holdings LLC/Financing Co., Inc.
03/15/22 | | | 3.800 | % | | | 7,265,000 | | | | 7,270,754 | | |
DISH DBS Corp.
09/01/19 | | | 7.875 | % | | | 840,000 | | | | 996,450 | | |
Mediacom Broadband LLC/Corp.
Senior Unsecured(a)
04/15/21 | | | 5.500 | % | | | 52,000 | | | | 51,870 | | |
NBCUniversal Media LLC
04/01/21 | | | 4.375 | % | | | 21,040,000 | | | | 22,972,145 | | |
01/15/43 | | | 4.450 | % | | | 7,790,000 | | | | 7,713,884 | | |
Numericable Group SA(a)(g)
Senior Secured
05/15/19 | | | 4.875 | % | | | 332,000 | | | | 335,320 | | |
The accompanying Notes to Financial Statements are an integral part of this statement.
Annual Report 2014
13
Columbia Corporate Income Fund
Portfolio of Investments (continued)
April 30, 2014
Corporate Bonds & Notes (continued)
Issuer | | Coupon
Rate | | Principal
Amount ($) | | Value ($) | |
05/15/22 | | | 6.000 | % | | | 613,000 | | | | 627,559 | | |
05/15/24 | | | 6.250 | % | | | 226,000 | | | | 231,368 | | |
Time Warner Cable, Inc.
09/15/42 | | | 4.500 | % | | | 11,680,000 | | | | 11,296,487 | | |
Videotron Ltd.
07/15/22 | | | 5.000 | % | | | 286,000 | | | | 288,145 | | |
Videotron Ltd.(a)
06/15/24 | | | 5.375 | % | | | 139,000 | | | | 140,043 | | |
WaveDivision Escrow LLC/Corp.
Senior Unsecured(a)
09/01/20 | | | 8.125 | % | | | 19,000 | | | | 20,330 | | |
Total | | | | | | | 54,495,288 | | |
Media Non-Cable 2.8% | |
21st Century Fox America, Inc.
10/01/43 | | | 5.400 | % | | | 7,120,000 | | | | 7,836,101 | | |
AMC Networks, Inc.
12/15/22 | | | 4.750 | % | | | 935,000 | | | | 932,662 | | |
BSKYB Finance UK PLC(a)
10/15/15 | | | 5.625 | % | | | 2,050,000 | | | | 2,186,897 | | |
British Sky Broadcasting Group PLC(a)
11/26/22 | | | 3.125 | % | | | 12,460,000 | | | | 12,056,059 | | |
CBS Outdoor Americas Capital LLC/Corp.(a)
02/15/22 | | | 5.250 | % | | | 73,000 | | | | 74,825 | | |
02/15/24 | | | 5.625 | % | | | 73,000 | | | | 75,008 | | |
Clear Channel Communications, Inc. PIK
02/01/21 | | | 14.000 | % | | | 286,000 | | | | 293,150 | | |
Clear Channel Communications, Inc.
Senior Secured
03/01/21 | | | 9.000 | % | | | 858,000 | | | | 911,625 | | |
Clear Channel Worldwide Holdings, Inc.
03/15/20 | | | 7.625 | % | | | 297,000 | | | | 320,018 | | |
11/15/22 | | | 6.500 | % | | | 455,000 | | | | 484,575 | | |
11/15/22 | | | 6.500 | % | | | 455,000 | | | | 486,850 | | |
Hughes Satellite Systems Corp.
06/15/21 | | | 7.625 | % | | | 340,000 | | | | 383,350 | | |
Intelsat Jackson Holdings SA
04/01/19 | | | 7.250 | % | | | 355,000 | | | | 380,294 | | |
10/15/20 | | | 7.250 | % | | | 690,000 | | | | 745,200 | | |
Intelsat Luxembourg SA
06/01/21 | | | 7.750 | % | | | 251,000 | | | | 261,668 | | |
06/01/23 | | | 8.125 | % | | | 525,000 | | | | 551,250 | | |
Lamar Media Corp.(a)
01/15/24 | | | 5.375 | % | | | 101,000 | | | | 104,661 | | |
MDC Partners, Inc.(a)
04/01/20 | | | 6.750 | % | | | 744,000 | | | | 786,780 | | |
Nielsen Finance Co. SARL (The)(a)
10/01/21 | | | 5.500 | % | | | 566,000 | | | | 589,347 | | |
Corporate Bonds & Notes (continued)
Issuer | | Coupon
Rate | | Principal
Amount ($) | | Value ($) | |
Nielsen Finance LLC/Co.
10/01/20 | | | 4.500 | % | | | 682,000 | | | | 687,115 | | |
Nielsen Finance LLC/Co.(a)
04/15/22 | | | 5.000 | % | | | 124,000 | | | | 124,310 | | |
Thomson Reuters Corp.
Senior Unsecured
05/23/43 | | | 4.500 | % | | | 8,829,000 | | | | 8,180,784 | | |
Univision Communications, Inc.(a)
05/15/21 8.500% 351,000 386,100
Senior Secured
11/01/20 | | | 7.875 | % | | | 295,000 | | | | 324,131 | | |
09/15/22 | | | 6.750 | % | | | 463,000 | | | | 509,300 | | |
05/15/23 | | | 5.125 | % | | | 209,000 | | | | 213,180 | | |
Total | | | | | | | 39,885,240 | | |
Metals 1.2% | |
ArcelorMittal
Senior Unsecured
02/25/22 | | | 6.750 | % | | | 573,000 | | | | 635,621 | | |
Arch Coal, Inc.
Secured(a)
01/15/19 | | | 8.000 | % | | | 247,000 | | | | 246,383 | | |
BHP Billiton Finance USA Ltd.
09/30/43 | | | 5.000 | % | | | 2,185,000 | | | | 2,361,821 | | |
CONSOL Energy, Inc.
03/01/21 | | | 6.375 | % | | | 25,000 | | | | 26,344 | | |
CONSOL Energy, Inc.(a)
04/15/22 | | | 5.875 | % | | | 206,000 | | | | 212,180 | | |
Calcipar SA
Senior Secured(a)
05/01/18 | | | 6.875 | % | | | 359,000 | | | | 379,643 | | |
Constellium NV
Senior Unsecured(a)(g)
05/15/24 | | | 5.750 | % | | | 105,000 | | | | 107,363 | | |
FMG Resources August 2006 Proprietary Ltd.(a)
11/01/19 | | | 8.250 | % | | | 265,000 | | | | 291,500 | | |
Newmont Mining Corp.
03/15/42 | | | 4.875 | % | | | 2,975,000 | | | | 2,570,870 | | |
Peabody Energy Corp.
11/15/18 | | | 6.000 | % | | | 617,000 | | | | 655,562 | | |
Rio Tinto Finance USA PLC
08/21/42 | | | 4.125 | % | | | 3,045,000 | | | | 2,821,460 | | |
Teck Resources Ltd.
03/01/42 | | | 5.200 | % | | | 1,880,000 | | | | 1,734,548 | | |
Vale SA
Senior Unsecured
09/11/42 | | | 5.625 | % | | | 5,470,000 | | | | 5,292,334 | | |
Total | | | | | | | 17,335,629 | | |
The accompanying Notes to Financial Statements are an integral part of this statement.
Annual Report 2014
14
Columbia Corporate Income Fund
Portfolio of Investments (continued)
April 30, 2014
Corporate Bonds & Notes (continued)
Issuer | | Coupon
Rate | | Principal
Amount ($) | | Value ($) | |
Non-Captive Consumer 0.1% | |
Provident Funding Associates LP/Finance Corp.
Senior Notes(a)
02/15/19 | | | 10.125 | % | | | 86,000 | | | | 94,170 | | |
Provident Funding Associates LP/PFG Finance Corp.(a)
06/15/21 | | | 6.750 | % | | | 607,000 | | | | 620,657 | | |
Springleaf Finance Corp.
06/01/20 | | | 6.000 | % | | | 185,000 | | | | 187,313 | | |
10/01/21 | | | 7.750 | % | | | 301,000 | | | | 332,981 | | |
10/01/23 | | | 8.250 | % | | | 226,000 | | | | 251,990 | | |
Total | | | | | | | 1,487,111 | | |
Non-Captive Diversified 1.9% | |
Air Lease Corp.
Senior Unsecured
03/01/20 | | | 4.750 | % | | | 711,000 | | | | 757,215 | | |
Aircastle Ltd.
Senior Unsecured
03/15/21 | | | 5.125 | % | | | 198,000 | | | | 198,990 | | |
CIT Group, Inc.
Senior Unsecured
03/15/18 | | | 5.250 | % | | | 420,000 | | | | 450,450 | | |
CIT Group, Inc.(a)
Senior Secured
04/01/18 6.625% 705,000 784,312
Senior Unsecured
02/15/19 | | | 5.500 | % | | | 201,000 | | | | 216,075 | | |
General Electric Capital Corp.
Senior Unsecured
01/09/23 | | | 3.100 | % | | | 22,680,000 | | | | 22,444,695 | | |
International Lease Finance Corp.
Senior Unsecured
09/01/17 | | | 8.875 | % | | | 595,000 | | | | 708,050 | | |
05/15/19 | | | 6.250 | % | | | 907,000 | | | | 1,001,101 | | |
12/15/20 | | | 8.250 | % | | | 186,000 | | | | 224,363 | | |
Total | | | | | | | 26,785,251 | | |
Oil Field Services 1.1% | |
Atwood Oceanics, Inc.
Senior Unsecured
02/01/20 | | | 6.500 | % | | | 655,000 | | | | 697,575 | | |
Noble Holding International Ltd.
03/15/22 | | | 3.950 | % | | | 12,879,000 | | | | 12,915,061 | | |
Oil States International, Inc.
01/15/23 | | | 5.125 | % | | | 343,000 | | | | 384,160 | | |
Pacific Drilling SA
Senior Secured(a)
06/01/20 | | | 5.375 | % | | | 357,000 | | | | 347,183 | | |
Weatherford International Ltd.
03/15/38 | | | 7.000 | % | | | 1,520,000 | | | | 1,872,065 | | |
Total | | | | | | | 16,216,044 | | |
Corporate Bonds & Notes (continued)
Issuer | | Coupon
Rate | | Principal
Amount ($) | | Value ($) | |
Other Financial Institutions —% | |
Icahn Enterprises LP/Finance Corp.(a)
02/01/22 | | | 5.875 | % | | | 401,000 | | | | 407,015 | | |
National Financial Partners Corp.
Senior Unsecured(a)
07/15/21 | | | 9.000 | % | | | 159,000 | | | | 171,323 | | |
Total | | | | | | | 578,338 | | |
Other Industry —% | |
Unifrax I LLC/Holding Co.(a)
02/15/19 | | | 7.500 | % | | | 159,000 | | | | 168,143 | | |
Packaging 0.2% | |
Ardagh Packaging Finance PLC/Holdings USA, Inc.(a)
01/31/19 | | | 6.250 | % | | | 215,000 | | | | 224,138 | | |
Beverage Packaging Holdings (Luxembourg) II SA(a)
12/15/16 | | | 5.625 | % | | | 114,000 | | | | 116,423 | | |
06/15/17 | | | 6.000 | % | | | 52,000 | | | | 53,560 | | |
Plastipak Holdings, Inc.
Senior Unsecured(a)
10/01/21 | | | 6.500 | % | | | 579,000 | | | | 602,160 | | |
Reynolds Group Issuer, Inc. LLC
Senior Secured
10/15/20 | | | 5.750 | % | | | 208,000 | | | | 216,320 | | |
Reynolds Group Issuer, Inc./LLC
04/15/19 | | | 9.000 | % | | | 166,000 | | | | 177,205 | | |
08/15/19 | | | 9.875 | % | | | 225,000 | | | | 249,750 | | |
02/15/21 8.250% 254,000 274,637
Senior Secured
08/15/19 | | | 7.875 | % | | | 281,000 | | | | 308,397 | | |
Signode Industrial Group Luxembourg SA/US, Inc.
Senior Unsecured(a)
05/01/22 | | | 6.375 | % | | | 437,000 | | | | 441,370 | | |
Total | | | | | | | 2,663,960 | | |
Pharmaceuticals 1.0% | |
Amgen, Inc.
Senior Unsecured
05/15/43 | | | 5.375 | % | | | 10,745,000 | | | | 11,715,832 | | |
Capsugel SA
Senior Unsecured PIK(a)
05/15/19 | | | 7.000 | % | | | 65,000 | | | | 67,356 | | |
Grifols Worldwide Operations Ltd.
Senior Unsecured(a)
04/01/22 | | | 5.250 | % | | | 445,000 | | | | 451,675 | | |
Jaguar Holding Co. II/Merger Sub, Inc.
Senior Unsecured(a)
12/01/19 | | | 9.500 | % | | | 206,000 | | | | 227,630 | | |
Valeant Pharmaceuticals International, Inc.(a)
08/15/18 | | | 6.750 | % | | | 243,000 | | | | 263,048 | | |
The accompanying Notes to Financial Statements are an integral part of this statement.
Annual Report 2014
15
Columbia Corporate Income Fund
Portfolio of Investments (continued)
April 30, 2014
Corporate Bonds & Notes (continued)
Issuer | | Coupon
Rate | | Principal
Amount ($) | | Value ($) | |
12/01/21 | | | 5.625 | % | | | 203,000 | | | | 211,120 | | |
Valeant Pharmaceuticals International(a)
10/15/20 | | | 6.375 | % | | | 1,452,000 | | | | 1,560,900 | | |
Total | | | | | | | 14,497,561 | | |
Property & Casualty 3.2% | |
Alleghany Corp.
Senior Unsecured
06/27/22 | | | 4.950 | % | | | 9,878,000 | | | | 10,740,636 | | |
CNA Financial Corp.
Senior Unsecured
08/15/20 | | | 5.875 | % | | | 11,651,000 | | | | 13,546,420 | | |
HUB International Ltd.
Senior Unsecured(a)
10/01/21 | | | 7.875 | % | | | 919,000 | | | | 981,032 | | |
Liberty Mutual Group, Inc.(a)
05/01/22 | | | 4.950 | % | | | 13,686,000 | | | | 14,763,882 | | |
Loews Corp.
Senior Unsecured
05/15/23 | | | 2.625 | % | | | 5,460,000 | | | | 5,109,965 | | |
Total | | | | | | | 45,141,935 | | |
Railroads 1.5% | |
Burlington Northern Santa Fe LLC
Senior Unsecured
03/15/43 | | | 4.450 | % | | | 3,010,000 | | | | 2,956,681 | | |
09/01/43 | | | 5.150 | % | | | 895,000 | | | | 979,064 | | |
04/01/44 | | | 4.900 | % | | | 1,265,000 | | | | 1,344,767 | | |
CSX Corp.
Senior Unsecured
03/15/44 | | | 4.100 | % | | | 7,190,000 | | | | 6,730,235 | | |
Canadian Pacific Railway Co.
Senior Unsecured
03/15/23 | | | 4.450 | % | | | 7,939,000 | | | | 8,448,192 | | |
Florida East Coast Holdings Corp.(a)
05/01/20 | | | 9.750 | % | | | 293,000 | | | | 301,790 | | |
Senior Secured
05/01/19 | | | 6.750 | % | | | 410,000 | | | | 421,275 | | |
Total | | | | | | | 21,182,004 | | |
Restaurants 0.7% | |
Yum! Brands, Inc.
Senior Unsecured
11/01/20 | | | 3.875 | % | | | 2,000,000 | | | | 2,084,415 | | |
11/01/21 | | | 3.750 | % | | | 7,615,000 | | | | 7,771,367 | | |
Total | | | | | | | 9,855,782 | | |
Corporate Bonds & Notes (continued)
Issuer | | Coupon
Rate | | Principal
Amount ($) | | Value ($) | |
Retailers 0.6% | |
AutoNation, Inc.
02/01/20 | | | 5.500 | % | | | 249,000 | | | | 270,788 | | |
Burlington Coat Factory Warehouse Corp.
02/15/19 | | | 10.000 | % | | | 352,000 | | | | 388,960 | | |
J. Crew Group, Inc.
Senior Unsecured PIK(a)
05/01/19 | | | 7.750 | % | | | 245,000 | | | | 253,575 | | |
Jo-Ann Stores, Inc.
Senior Unsecured(a)
03/15/19 | | | 8.125 | % | | | 284,000 | | | | 295,005 | | |
L Brands, Inc.
05/01/20 | | | 7.000 | % | | | 500,000 | | | | 570,000 | | |
Michaels Stores, Inc.(a)
12/15/20 | | | 5.875 | % | | | 129,000 | | | | 130,935 | | |
Rite Aid Corp.
06/15/21 | | | 6.750 | % | | | 315,000 | | | | 342,562 | | |
Senior Unsecured
02/15/27 | | | 7.700 | % | | | 198,000 | | | | 217,800 | | |
Sally Holdings LLC/Capital, Inc.
11/15/19 | | | 6.875 | % | | | 828,000 | | | | 905,625 | | |
Target Corp.
Senior Unsecured
07/01/42 | | | 4.000 | % | | | 5,350,000 | | | | 5,038,598 | | |
Total | | | | | | | 8,413,848 | | |
Technology 1.9% | |
Alliance Data Systems Corp.(a)
12/01/17 | | | 5.250 | % | | | 624,000 | | | | 658,320 | | |
04/01/20 | | | 6.375 | % | | | 15,000 | | | | 15,975 | | |
Ancestry.com, Inc.
Senior Unsecured PIK(a)
10/15/18 | | | 9.625 | % | | | 350,000 | | | | 366,625 | | |
Audatex North America, Inc.(a)
06/15/21 | | | 6.000 | % | | | 294,000 | | | | 315,315 | | |
11/01/23 | | | 6.125 | % | | | 199,000 | | | | 212,681 | | |
Brocade Communications Systems, Inc.
Senior Secured
01/15/20 | | | 6.875 | % | | | 175,000 | | | | 187,250 | | |
CDW LLC/Finance Corp.
04/01/19 | | | 8.500 | % | | | 427,000 | | | | 467,565 | | |
Cardtronics, Inc.
09/01/18 | | | 8.250 | % | | | 620,000 | | | | 658,750 | | |
Corning, Inc.
Senior Unsecured
11/15/23 | | | 3.700 | % | | | 4,785,000 | | | | 4,876,441 | | |
Equinix, Inc.
Senior Unsecured
04/01/20 | | | 4.875 | % | | | 558,000 | | | | 569,160 | | |
The accompanying Notes to Financial Statements are an integral part of this statement.
Annual Report 2014
16
Columbia Corporate Income Fund
Portfolio of Investments (continued)
April 30, 2014
Corporate Bonds & Notes (continued)
Issuer | | Coupon
Rate | | Principal
Amount ($) | | Value ($) | |
First Data Corp.
01/15/21 | | | 12.625 | % | | | 415,000 | | | | 498,000 | | |
08/15/21 | | | 11.750 | % | | | 27,000 | | | | 28,755 | | |
First Data Corp.(a)
Secured
01/15/21 | | | 8.250 | % | | | 888,000 | | | | 956,820 | | |
Senior Secured
08/15/20 | | | 8.875 | % | | | 520,000 | | | | 576,550 | | |
11/01/20 | | | 6.750 | % | | | 615,000 | | | | 662,662 | | |
Goodman Networks, Inc.
Senior Secured
07/01/18 | | | 12.125 | % | | | 47,000 | | | | 51,935 | | |
Goodman Networks, Inc.(a)
Senior Secured
07/01/18 | | | 12.375 | % | | | 209,000 | | | | 230,423 | | |
Iron Mountain, Inc.
08/15/23 | | | 6.000 | % | | | 210,000 | | | | 223,125 | | |
NCR Corp.(a)
Senior Unsecured
12/15/21 | | | 5.875 | % | | | 113,000 | | | | 119,498 | | |
12/15/23 | | | 6.375 | % | | | 588,000 | | | | 627,690 | | |
NXP BV/Funding LLC(a)
02/15/21 | | | 5.750 | % | | | 303,000 | | | | 320,422 | | |
Nuance Communications, Inc.(a)
08/15/20 | | | 5.375 | % | | | 572,000 | | | | 574,860 | | |
Oracle Corp.
Senior Unsecured
10/15/22 | | | 2.500 | % | | | 13,585,000 | | | | 12,966,054 | | |
VeriSign, Inc.
05/01/23 | | | 4.625 | % | | | 382,000 | | | | 365,765 | | |
Total | | | | | | | 26,530,641 | | |
Transportation Services 1.4% | |
ERAC U.S.A. Finance LLC(a)
03/15/42 | | | 5.625 | % | | | 7,005,000 | | | | 7,828,571 | | |
FedEx Corp.
01/15/24 | | | 4.000 | % | | | 11,295,000 | | | | 11,654,237 | | |
Hertz Corp. (The)
10/15/18 | | | 7.500 | % | | | 675,000 | | | | 715,500 | | |
LBC Tank Terminals Holding Netherlands BV(a)
05/15/23 | | | 6.875 | % | | | 211,000 | | | | 223,660 | | |
Total | | | | | | | 20,421,968 | | |
Wireless 2.4% | |
Altice SA(a)(g)
05/15/22 | | | 7.750 | % | | | 437,000 | | | | 455,573 | | |
America Movil SAB de CV
Senior Unsecured
07/16/42 | | | 4.375 | % | | | 770,000 | | | | 697,540 | | |
Corporate Bonds & Notes (continued)
Issuer | | Coupon
Rate | | Principal
Amount ($) | | Value ($) | |
CC Holdings GS V LLC/Crown Castle GS III Corp.
Senior Secured
12/15/17 | | | 2.381 | % | | | 980,000 | | | | 991,104 | | |
Crown Castle International Corp.
Senior Unsecured
01/15/23 | | | 5.250 | % | | | 1,083,000 | | | | 1,112,782 | | |
Rogers Communications, Inc.
03/15/23 | | | 3.000 | % | | | 22,045,000 | | | | 21,068,362 | | |
SBA Communications Corp.
Senior Unsecured
10/01/19 | | | 5.625 | % | | | 17,000 | | | | 17,829 | | |
SBA Telecommunications, Inc.
08/15/19 | | | 8.250 | % | | | 582,000 | | | | 614,592 | | |
07/15/20 | | | 5.750 | % | | | 365,000 | | | | 383,250 | | |
Sprint Communications, Inc.
Senior Unsecured
08/15/17 | | | 8.375 | % | | | 127,000 | | | | 149,225 | | |
11/15/22 | | | 6.000 | % | | | 518,000 | | | | 521,885 | | |
Sprint Communications, Inc.(a)
11/15/18 | | | 9.000 | % | | | 1,214,000 | | | | 1,484,115 | | |
03/01/20 | | | 7.000 | % | | | 465,000 | | | | 536,494 | | |
Sprint Corp.(a)
09/15/21 | | | 7.250 | % | | | 679,000 | | | | 740,110 | | |
T-Mobile USA, Inc.
04/28/20 | | | 6.542 | % | | | 156,000 | | | | 167,700 | | |
04/28/21 | | | 6.633 | % | | | 457,000 | | | | 493,560 | | |
01/15/22 | | | 6.125 | % | | | 192,000 | | | | 201,840 | | |
04/28/22 | | | 6.731 | % | | | 299,000 | | | | 322,546 | | |
04/01/23 | | | 6.625 | % | | | 110,000 | | | | 117,700 | | |
04/28/23 | | | 6.836 | % | | | 151,000 | | | | 162,514 | | |
01/15/24 | | | 6.500 | % | | | 192,000 | | | | 201,360 | | |
Vodafone Group PLC
Senior Unsecured
02/19/43 | | | 4.375 | % | | | 2,838,000 | | | | 2,621,268 | | |
Wind Acquisition Finance SA(a)
04/23/21 7.375% 518,000 532,245
Senior Secured
04/30/20 | | | 6.500 | % | | | 778,000 | | | | 834,405 | | |
Total | | | | | | | 34,427,999 | | |
Wirelines 5.6% | |
AT&T, Inc.
Senior Unsecured
06/15/45 | | | 4.350 | % | | | 29,810,000 | | | | 26,850,821 | | |
CenturyLink, Inc.
Senior Unsecured
12/01/23 | | | 6.750 | % | | | 400,000 | | | | 429,000 | | |
Frontier Communications Corp.
Senior Unsecured
07/01/21 | | | 9.250 | % | | | 497,000 | | | | 587,702 | | |
The accompanying Notes to Financial Statements are an integral part of this statement.
Annual Report 2014
17
Columbia Corporate Income Fund
Portfolio of Investments (continued)
April 30, 2014
Corporate Bonds & Notes (continued)
Issuer | | Coupon
Rate | | Principal
Amount ($) | | Value ($) | |
Level 3 Communications, Inc.
Senior Unsecured
02/01/19 | | | 11.875 | % | | | 681,000 | | | | 767,827 | | |
Level 3 Financing, Inc.
07/01/19 | | | 8.125 | % | | | 233,000 | | | | 254,844 | | |
06/01/20 | | | 7.000 | % | | | 176,000 | | | | 189,640 | | |
07/15/20 | | | 8.625 | % | | | 150,000 | | | | 168,000 | | |
Level 3 Financing, Inc.(a)
01/15/21 | | | 6.125 | % | | | 233,000 | | | | 244,650 | | |
Level 3 Financing, Inc.(a)(h)
01/15/18 | | | 3.846 | % | | | 111,000 | | | | 112,665 | | |
Verizon Communications, Inc.
Senior Unsecured
11/01/21 | | | 3.500 | % | | | 7,700,000 | | | | 7,828,197 | | |
03/15/24 | | | 4.150 | % | | | 12,000,000 | | | | 12,294,900 | | |
11/01/42 | | | 3.850 | % | | | 21,733,000 | | | | 18,780,412 | | |
09/15/43 | | | 6.550 | % | | | 8,485,000 | | | | 10,466,197 | | |
Windstream Corp.
10/15/20 | | | 7.750 | % | | | 288,000 | | | | 311,040 | | |
Zayo Group LLC/Capital, Inc.
07/01/20 | | | 10.125 | % | | | 244,000 | | | | 282,430 | | |
Senior Secured
01/01/20 | | | 8.125 | % | | | 572,000 | | | | 627,770 | | |
Total | | | | | | | 80,196,095 | | |
Total Corporate Bonds & Notes
(Cost: $1,202,256,308) | | | | | | | 1,231,207,280 | | |
Residential Mortgage-Backed Securities — Agency —%
Government National Mortgage Association(i)
01/15/19 | | | 10.000 | % | | | 16 | | | | 16 | | |
Total Residential Mortgage-Backed Securities — Agency
(Cost: $16) | | | | | | | 16 | | |
U.S. Treasury Obligations 3.5%
U.S. Treasury
01/31/19 | | | 1.500 | % | | | 2,220,000 | | | | 2,208,032 | | |
11/15/23 | | | 2.750 | % | | | 14,095,000 | | | | 14,246,962 | | |
02/15/24 | | | 2.750 | % | | | 33,295,000 | | | | 33,586,331 | | |
Total U.S. Treasury Obligations
(Cost: $49,634,335) | | | | | | | 50,041,325 | | |
Foreign Government Obligations(j) 0.4%
Issuer | | Coupon
Rate | | Principal
Amount ($) | | Value ($) | |
Mexico 0.1% | |
Petroleos Mexicanos
06/27/44 | | | 5.500 | % | | | 2,000,000 | | | | 1,960,000 | | |
Netherlands 0.3% | |
Petrobras Global Finance BV
05/20/43 | | | 5.625 | % | | | 4,275,000 | | | | 3,758,678 | | |
Total Foreign Government Obligations
(Cost: $5,304,249) | | | | | | | 5,718,678 | | |
Senior Loans 0.6%
Borrower | | Weighted
Average
Coupon | | Principal
Amount ($) | | Value ($) | |
Brokerage 0.1% | |
Nuveen Investments, Inc.
2nd Lien Tranche B Term Loan(h)(k)
02/28/19 | | | 6.500 | % | | | 595,966 | | | | 600,251 | | |
Chemicals —% | |
Axalta Coating Systems Dutch Holding B BV/U.S.
Holdings, Inc.
Tranche B Term Loan(h)(k)
02/01/20 | | | 4.000 | % | | | 302,712 | | | | 301,617 | | |
Construction Machinery —% | |
CPM Acquisition Corp.
1st Lien Term Loan(h)(k)
08/29/17 | | | 6.250 | % | | | 514,230 | | | | 516,158 | | |
Diversified Manufacturing —% | |
Gardner Denver, Inc.
Term Loan(h)(k)
07/30/20 | | | 4.250 | % | | | 208,906 | | | | 208,493 | | |
Entertainment —% | |
Time, Inc.
Tranche B Term Loan(h)(k)
04/04/21 | | | 4.250 | % | | | 282,000 | | | | 281,177 | | |
Food and Beverage —% | |
Diamond Foods, Inc.
Term Loan(h)(k)
08/20/18 | | | 4.250 | % | | | 70,823 | | | | 70,645 | | |
The accompanying Notes to Financial Statements are an integral part of this statement.
Annual Report 2014
18
Columbia Corporate Income Fund
Portfolio of Investments (continued)
April 30, 2014
Senior Loans (continued)
Borrower | | Weighted
Average
Coupon | | Principal
Amount ($) | | Value ($) | |
Health Care 0.1% | |
American Renal Holdings, Inc.
2nd Lien Term Loan(h)(k)
03/20/20 | | | 8.500 | % | | | 302,000 | | | | 301,245 | | |
CHS/Community Health Systems, Inc.
Tranche D Term Loan(h)(k)
01/27/21 | | | 4.250 | % | | | 139,650 | | | | 140,129 | | |
US Renal Care, Inc.
1st Lien Tranche B-2 Term Loan(h)(k)
07/03/19 | | | 4.250 | % | | | 743,275 | | | | 742,034 | | |
United Surgical Partners International, Inc.
Tranche B Term Loan(h)(k)
04/03/19 | | | 4.750 | % | | | 366,999 | | | | 367,303 | | |
Total | | | | | | | 1,550,711 | | |
Lodging —% | |
Four Seasons Holdings, Inc.
2nd Lien Term Loan(h)(k)
12/28/20 | | | 6.250 | % | | | 105,000 | | | | 106,312 | | |
Playa Resorts Holding
Term Loan(h)(k)
08/09/19 | | | 4.000 | % | | | 168,155 | | | | 167,841 | | |
Total | | | | | | | 274,153 | | |
Metals —% | |
Arch Coal, Inc.
Term Loan(h)(k)
05/16/18 | | | 6.250 | % | | | 483,545 | | | | 469,643 | | |
Other Industry —% | |
Interline Brands, Inc.
1st Lien Term Loan(g)(h)(k)
03/17/21 | | | 4.000 | % | | | 141,000 | | | | 139,855 | | |
Property & Casualty 0.1% | |
Asurion LLC(h)(k)
2nd Lien Term Loan
03/03/21 | | | 8.500 | % | | | 654,000 | | | | 671,167 | | |
Senior Loans (continued)
Borrower | | Weighted
Average
Coupon | | Principal
Amount ($) | | Value ($) | |
Tranche B-1 Term Loan
05/24/19 | | | 5.000 | % | | | 667,796 | | | | 668,170 | | |
Total | | | | | | | 1,339,337 | | |
Retailers 0.1% | |
Men's Wearhouse, Inc.
Tranche B Term Loan(h)(k)
04/16/21 | | | 4.500 | % | | | 202,000 | | | | 201,747 | | |
Neiman Marcus Group, Inc. (The)
Term Loan(h)(k)
10/25/20 | | | 4.250 | % | | | 458,850 | | | | 457,304 | | |
Rite Aid Corp.
2nd Lien Tranche 1 Term Loan(h)(k)
08/21/20 | | | 5.750 | % | | | 426,000 | | | | 433,455 | | |
Total | | | | | | | 1,092,506 | | |
Technology 0.2% | |
Applied Systems, Inc.(h)(k)
1st Lien Term Loan
01/25/21 | | | 4.250 | % | | | 41,895 | | | | 41,813 | | |
2nd Lien Term Loan
01/24/22 | | | 7.500 | % | | | 49,000 | | | | 49,490 | | |
Avago Technologies Ltd.
Tranche B Term Loan(g)(h)(k)
12/16/20 | | | 3.750 | % | | | 432,000 | | | | 433,140 | | |
Blue Coat Systems, Inc.
2nd Lien Term Loan(h)(k)
06/26/20 | | | 9.500 | % | | | 529,000 | | | | 531,645 | | |
ION Trading Technologies SARL
2nd Lien Term Loan(h)(k)
05/22/21 | | | 8.250 | % | | | 716,693 | | | | 718,485 | | |
Interactive Data Corp.
Tranche B Term Loan(g)(h)(k)
04/07/21 | | | 4.750 | % | | | 277,000 | | | | 276,078 | | |
Triple Point Group Holdings, Inc.
2nd Lien Term Loan(h)(k)
07/10/21 | | | 9.250 | % | | | 134,000 | | | | 120,600 | | |
Total | | | | | | | 2,171,251 | | |
Total Senior Loans
(Cost: $8,960,558) | | | | | | | 9,015,797 | | |
The accompanying Notes to Financial Statements are an integral part of this statement.
Annual Report 2014
19
Columbia Corporate Income Fund
Portfolio of Investments (continued)
April 30, 2014
Common Stocks —%
Issuer | | Shares | | Value ($) | |
Financials —% | |
Insurance —% | |
Washington Funding Trust LII D
Escrow(b)(d)(e)(f) | | | 1,075 | | | | — | | |
WMI Holdings Corp.(f) | | | 21,286 | | | | 63,752 | | |
Total | | | | | 63,752 | | |
Total Financials | | | | | 63,752 | | |
Total Common Stocks
(Cost: $1,077,709) | | | | | 63,752 | | |
Money Market Funds 6.9%
| | | Shares | | Value ($) | |
Columbia Short-Term Cash Fund,
0.092%(l)(m) | | | 98,299,930 | | | | 98,299,930 | | |
Total Money Market Funds
(Cost: $98,299,930) | | | | | 98,299,930 | | |
Total Investments
(Cost: $1,365,533,105) | | | | | 1,394,346,778 | | |
Other Assets & Liabilities, Net | | | | | 26,747,824 | | |
Net Assets | | | | | 1,421,094,602 | | |
Investments in Derivatives
Futures Contracts Outstanding at April 30, 2014
At April 30, 2014, cash totaling $4,574,000 was pledged as collateral to cover initial margin requirements on open futures contracts.
Contract Description | | Number of
Contracts
Long (Short) | |
Trading
Currency | | Notional
Market
Value ($) | |
Expiration
Date | |
Unrealized
Appreciation ($) | |
Unrealized
Depreciation ($) | |
US 10yr Note | | | (1,485 | ) | | USD | | | | | (184,766,492 | ) | | 06/2014 | | | — | | | | (235,681 | ) | |
US 5yr Note | | | (26 | ) | | USD | | | | | (3,105,781 | ) | | 06/2014 | | | 11,048 | | | | — | | |
US Long Bond | | | (1,109 | ) | | USD | | | | | (149,645,688 | ) | | 06/2014 | | | — | | | | (3,086,070 | ) | |
US Ultra T-Bond | | | (91 | ) | | USD | | | | | (13,402,594 | ) | | 06/2014 | | | — | | | | (407,254 | ) | |
Total | | | | | | | | | | | 11,048 | | | | (3,729,005 | ) | |
Notes to Portfolio of Investments
(a) Security exempt from registration pursuant to Rule 144A under the Securities Act of 1933. This security may be resold in transactions exempt from registration, normally to qualified institutional buyers. At April 30, 2014, the value of these securities amounted to $233,773,246 or 16.45% of net assets.
(b) Identifies issues considered by the Investment Manager to be illiquid as to their marketability. The aggregate value of such securities at April 30, 2014 was $9,525, representing less than 0.01% of net assets. Information concerning such security holdings at April 30, 2014 is as follows:
Security Description | | Acquisition Dates | | Cost ($) | |
Six Flags, Inc.
06/01/44 9.625% | | 05/07/2010 | | | — | | |
Washington Funding Trust LII D Escrow | | 03/05/2007 | | | — | | |
Washington Mutual Bank Subordinated Notes
01/15/15 5.125% | | 03/10/2006 - 05/14/2008 | | | 5,688,448 | | |
(c) Represents securities that have defaulted on payment of interest. The Fund has stopped accruing interest on these securities. At April 30, 2014, the value of these securities amounted to $9,525, which represents less than 0.01% of net assets.
(d) Represents fair value as determined in good faith under procedures approved by the Board of Trustees. At April 30, 2014, the value of these securities amounted to $9,525, which represents less than 0.01% of net assets.
(e) Negligible market value.
(f) Non-income producing.
The accompanying Notes to Financial Statements are an integral part of this statement.
Annual Report 2014
20
Columbia Corporate Income Fund
Portfolio of Investments (continued)
April 30, 2014
Notes to Portfolio of Investments (continued)
(g) Represents a security purchased on a when-issued or delayed delivery basis.
(h) Variable rate security.
(i) The maturity dates shown represent the original maturity of the underlying obligation. Actual maturity may vary based upon prepayment activity on these obligations. Unless otherwise noted, the coupon rates presented are fixed rates.
(j) Principal and interest may not be guaranteed by the government.
(k) Senior loans have rates of interest that float periodically based primarily on the London Interbank Offered Rate ("LIBOR") and other short-term rates. The interest rate shown reflects the weighted average coupon as of April 30, 2014. The interest rate shown for senior loans purchased on a when-issued or delayed delivery basis, if any, reflects an estimated average coupon. Remaining maturities of senior loans may be less than the stated maturities shown as a result of contractual or optional prepayments by the borrower. Such prepayments cannot be predicted with certainty.
(l) The rate shown is the seven-day current annualized yield at April 30, 2014.
(m) As defined in the Investment Company Act of 1940, an affiliated company is one in which the Fund owns 5% or more of its outstanding voting securities, or a company which is under common ownership or control with the Fund. Holdings and transactions in these affiliated companies during the year ended April 30, 2014, are as follows:
Issuer | | Beginning
Cost ($) | | Purchase
Cost ($) | | Proceeds
From Sales ($) | | Ending
Cost ($) | | Dividends —
Affiliated
Issuers ($) | | Value ($) | |
Columbia Short-Term Cash Fund | | | 93,058,854 | | | | 732,418,187 | | | | (727,177,111 | ) | | | 98,299,930 | | | | 69,620 | | | | 98,299,930 | | |
Abbreviation Legend
PIK Payment-in-Kind
Currency Legend
USD US Dollar
Fair Value Measurements
Generally accepted accounting principles (GAAP) require disclosure regarding the inputs and valuation techniques used to measure fair value and any changes in valuation inputs or techniques. In addition, investments shall be disclosed by major category.
The Fund categorizes its fair value measurements according to a three-level hierarchy that maximizes the use of observable inputs and minimizes the use of unobservable inputs by prioritizing that the most observable input be used when available. Observable inputs are those that market participants would use in pricing an investment based on market data obtained from sources independent of the reporting entity. Unobservable inputs are those that reflect the Fund's assumptions about the information market participants would use in pricing an investment. An investment's level within the fair value hierarchy is based on the lowest level of any input that is deemed significant to the asset or liability's fair value measurement. The input levels are not necessarily an indication of the risk or liquidity associated with investments at that level. For example, certain U.S. government securities are generally high quality and liquid, however, they are reflected as Level 2 because the inputs used to determine fair value may not always be quoted prices in an active market.
Fair value inputs are summarized in the three broad levels listed below:
> Level 1 — Valuations based on quoted prices for investments in active markets that the Fund has the ability to access at the measurement date (including NAV for open-end mutual funds). Valuation adjustments are not applied to Level 1 investments.
> Level 2 — Valuations based on other significant observable inputs (including quoted prices for similar securities, interest rates, prepayment speeds, credit risks, etc.).
> Level 3 — Valuations based on significant unobservable inputs (including the Fund's own assumptions and judgment in determining the fair value of investments).
Inputs that are used in determining fair value of an investment may include price information, credit data, volatility statistics, and other factors. These inputs can be either observable or unobservable. The availability of observable inputs can vary between investments, and is affected by various factors such as the type of investment, and the volume and level of activity for that investment or similar investments in the marketplace. The inputs will be considered by the Investment Manager, along with any other relevant factors in the calculation of an
The accompanying Notes to Financial Statements are an integral part of this statement.
Annual Report 2014
21
Columbia Corporate Income Fund
Portfolio of Investments (continued)
April 30, 2014
Fair Value Measurements (continued)
investment's fair value. The Fund uses prices and inputs that are current as of the measurement date, which may include periods of market dislocations. During these periods, the availability of prices and inputs may be reduced for many investments. This condition could cause an investment to be reclassified between the various levels within the hierarchy.
Investments falling into the Level 3 category are primarily supported by quoted prices from brokers and dealers participating in the market for those investments. However, these may be classified as Level 3 investments due to lack of market transparency and corroboration to support these quoted prices. Additionally, valuation models may be used as the pricing source for any remaining investments classified as Level 3. These models may rely on one or more significant unobservable inputs and/or significant assumptions by the Investment Manager. Inputs used in valuations may include, but are not limited to, financial statement analysis, capital account balances, discount rates and estimated cash flows, and comparable company data.
Under the direction of the Fund's Board of Trustees (the Board), the Investment Manager's Valuation Committee (the Committee) is responsible for overseeing the valuation procedures approved by the Board. The Committee consists of voting and non-voting members from various groups within the Investment Manager's organization, including operations and accounting, trading and investments, compliance, risk management and legal.
The Committee meets at least monthly to review and approve valuation matters, which may include a description of specific valuation determinations, data regarding pricing information received from approved pricing vendors and brokers and the results of Board-approved valuation control policies and procedures (the Policies). The Policies address, among other things, instances when market quotations are or are not readily available, including recommendations of third party pricing vendors and a determination of appropriate pricing methodologies; events that require specific valuation determinations and assessment of fair value techniques; securities with a potential for stale pricing, including those that are illiquid, restricted, or in default; and the effectiveness of third party pricing vendors, including periodic reviews of vendors. The Committee meets more frequently, as needed, to discuss additional valuation matters, which may include the need to review back-testing results, review time-sensitive information or approve related valuation actions. The Committee reports to the Board, with members of the Committee meeting with the Board at each of its regularly scheduled meetings to discuss valuation matters and actions during the period, similar to those described earlier.
For investments categorized as Level 3, the Committee monitors information similar to that described above, which may include: (i) data specific to the issuer or comparable issuers, (ii) general market or specific sector news and (iii) quoted prices and specific or similar security transactions. The Committee considers this data and any changes from prior periods in order to assess the reasonableness of observable and unobservable inputs, any assumptions or internal models used to value those securities and changes in fair value. This data is also used to corroborate, when available, information received from approved pricing vendors and brokers. Various factors impact the frequency of monitoring this information (which may occur as often as daily). However, the Committee may determine that changes to inputs, assumptions and models are not required as a result of the monitoring procedures performed.
The following table is a summary of the inputs used to value the Fund's investments at April 30, 2014:
Description | | Level 1
Quoted Prices in Active
Markets for Identical
Assets ($) | | Level 2
Other Significant
Observable Inputs ($) | | Level 3
Significant
Unobservable Inputs ($) | | Total ($) | |
Bonds | |
Corporate Bonds & Notes | |
Banking | | | — | | | | 62,526,367 | | | | 9,525 | | | | 62,535,892 | | |
All Other Industries | | | — | | | | 1,168,671,388 | | | | — | | | | 1,168,671,388 | | |
Residential Mortgage-Backed
Securities — Agency | | | — | | | | 16 | | | | — | | | | 16 | | |
U.S. Treasury Obligations | | | 50,041,325 | | | | — | | | | — | | | | 50,041,325 | | |
Foreign Government Obligations | | | — | | | | 5,718,678 | | | | — | | | | 5,718,678 | | |
Total Bonds | | | 50,041,325 | | | | 1,236,916,449 | | | | 9,525 | | | | 1,286,967,299 | | |
Other | |
Senior Loans | |
Lodging | | | — | | | | 167,841 | | | | 106,312 | | | | 274,153 | | |
All Other Industries | | | — | | | | 8,741,644 | | | | — | | | | 8,741,644 | | |
Total Other | | | — | | | | 8,909,485 | | | | 106,312 | | | | 9,015,797 | | |
The accompanying Notes to Financial Statements are an integral part of this statement.
Annual Report 2014
22
Columbia Corporate Income Fund
Portfolio of Investments (continued)
April 30, 2014
Fair Value Measurements (continued)
Description | | Level 1
Quoted Prices in Active
Markets for Identical
Assets ($) | | Level 2
Other Significant
Observable Inputs ($) | | Level 3
Significant
Unobservable Inputs ($) | | Total ($) | |
Equity Securities | |
Common Stocks | |
Financials | | | 63,752 | | | | — | | | | — | | | | 63,752 | | |
Total Equity Securities | | | 63,752 | | | | — | | | | — | | | | 63,752 | | |
Mutual Funds | |
Money Market Funds | | | 98,299,930 | | | | — | | | | — | | | | 98,299,930 | | |
Total Mutual Funds | | | 98,299,930 | | | | — | | | | — | | | | 98,299,930 | | |
Investments in Securities | | | 148,405,007 | | | | 1,245,825,934 | | | | 115,837 | | | | 1,394,346,778 | | |
Derivatives | |
Assets | |
Futures Contracts | | | 11,048 | | | | — | | | | — | | | | 11,048 | | |
Liabilities | |
Futures Contracts | | | (3,729,005 | ) | | | — | | | | — | | | | (3,729,005 | ) | |
Total | | | 144,687,050 | | | | 1,245,825,934 | | | | 115,837 | | | | 1,390,628,821 | | |
See the Portfolio of Investments for all investment classifications not indicated in the table.
The Fund's assets assigned to the Level 2 input category are generally valued using the market approach, in which a security's value is determined through reference to prices and information from market transactions for similar or identical assets.
There were no transfers of financial assets between levels during the period.
Derivative instruments are valued at unrealized appreciation (depreciation).
The Fund does not hold any significant investments with unobservable inputs which are categorized as Level 3.
The Fund's assets assigned to the Level 3 category are valued utilizing the valuation technique deemed the most appropriate in the circumstances.
Certain corporate bonds classified as Level 3 are valued using an income approach. To determine fair value for these securities, management considered estimates of future distributions from the liquidation of company assets or potential actions related to the respective company's bankruptcy filing. Significant increases (decreases) to any of these inputs would result in a significantly lower (higher) fair value measurement. Generally, a change in the bankruptcy filings would result in a directionally similar change to estimates of future distributions.
Certain senior loans classified as Level 3 securities are valued using the market approach and utilize single market quotations from broker dealers which may have included, but not limited to, the distressed nature of the security and observable transactions for similar assets in the market. Significant increases (decreases) to any of these inputs would result in a significantly lower (higher) fair value measurement.
The accompanying Notes to Financial Statements are an integral part of this statement.
Annual Report 2014
23
Columbia Corporate Income Fund
Statement of Assets and Liabilities
April 30, 2014
Assets | |
Investments, at value | |
Unaffiliated issuers (identified cost $1,267,233,175) | | $ | 1,296,046,848 | | |
Affiliated issuers (identified cost $98,299,930) | | | 98,299,930 | | |
Total investments (identified cost $1,365,533,105) | | | 1,394,346,778 | | |
Margin deposits | | | 4,574,000 | | |
Receivable for: | |
Investments sold | | | 25,935,313 | | |
Capital shares sold | | | 3,530,529 | | |
Dividends | | | 7,286 | | |
Interest | | | 13,304,504 | | |
Reclaims | | | 1,763 | | |
Expense reimbursement due from Investment Manager | | | 305 | | |
Prepaid expenses | | | 3,410 | | |
Trustees' deferred compensation plan | | | 73,134 | | |
Other assets | | | 81,718 | | |
Total assets | | | 1,441,858,740 | | |
Liabilities | |
Disbursements in excess of cash | | | 6,489 | | |
Payable for: | |
Investments purchased | | | 5,503,296 | | |
Investments purchased on a delayed delivery basis | | | 9,429,285 | | |
Capital shares purchased | | | 685,922 | | |
Dividend distributions to shareholders | | | 3,509,252 | | |
Variation margin | | | 1,337,851 | | |
Investment management fees | | | 16,558 | | |
Distribution and/or service fees | | | 2,123 | | |
Transfer agent fees | | | 132,067 | | |
Administration fees | | | 2,532 | | |
Chief compliance officer expenses | | | 68 | | |
Other expenses | | | 65,561 | | |
Trustees' deferred compensation plan | | | 73,134 | | |
Total liabilities | | | 20,764,138 | | |
Net assets applicable to outstanding capital stock | | $ | 1,421,094,602 | | |
Represented by | |
Paid-in capital | | $ | 1,399,891,075 | | |
Excess of distributions over net investment income | | | (631,685 | ) | |
Accumulated net realized loss | | | (2,835,681 | ) | |
Unrealized appreciation (depreciation) on: | |
Investments | | | 28,813,673 | | |
Futures contracts | | | (3,717,957 | ) | |
Swap contracts | | | (424,823 | ) | |
Total — representing net assets applicable to outstanding capital stock | | $ | 1,421,094,602 | | |
The accompanying Notes to Financial Statements are an integral part of this statement.
Annual Report 2014
24
Columbia Corporate Income Fund
Statement of Assets and Liabilities (continued)
April 30, 2014
Class A | |
Net assets | | $ | 120,602,887 | | |
Shares outstanding | | | 11,820,445 | | |
Net asset value per share | | $ | 10.20 | | |
Maximum offering price per share(a) | | $ | 10.71 | | |
Class B | |
Net assets | | $ | 1,259,478 | | |
Shares outstanding | | | 123,459 | | |
Net asset value per share | | $ | 10.20 | | |
Class C | |
Net assets | | $ | 15,586,939 | | |
Shares outstanding | | | 1,527,811 | | |
Net asset value per share | | $ | 10.20 | | |
Class I | |
Net assets | | $ | 676,152,572 | | |
Shares outstanding | | | 66,261,822 | | |
Net asset value per share | | $ | 10.20 | | |
Class R4 | |
Net assets | | $ | 11,454,402 | | |
Shares outstanding | | | 1,124,085 | | |
Net asset value per share | | $ | 10.19 | | |
Class R5 | |
Net assets | | $ | 1,629,748 | | |
Shares outstanding | | | 159,992 | | |
Net asset value per share | | $ | 10.19 | | |
Class W | |
Net assets | | $ | 132,165,730 | | |
Shares outstanding | | | 12,953,476 | | |
Net asset value per share | | $ | 10.20 | | |
Class Y | |
Net assets | | $ | 28,137 | | |
Shares outstanding | | | 2,758 | | |
Net asset value per share | | $ | 10.20 | | |
Class Z | |
Net assets | | $ | 462,214,709 | | |
Shares outstanding | | | 45,306,704 | | |
Net asset value per share | | $ | 10.20 | | |
(a) The maximum offering price per share is calculated by dividing the net asset value per share by 1.0 minus the maximum sales charge of 4.75%.
The accompanying Notes to Financial Statements are an integral part of this statement.
Annual Report 2014
25
Columbia Corporate Income Fund
Statement of Operations
Year Ended April 30, 2014
Net investment income | |
Income: | |
Dividends — affiliated issuers | | $ | 69,620 | | |
Interest | | | 53,224,208 | | |
Foreign taxes withheld | | | (479 | ) | |
Total income | | | 53,293,349 | | |
Expenses: | |
Investment management fees | | | 6,040,737 | | |
Distribution and/or service fees | |
Class A | | | 307,340 | | |
Class B | | | 17,739 | | |
Class C | | | 189,348 | | |
Class W | | | 364,794 | | |
Transfer agent fees | |
Class A | | | 235,582 | | |
Class B | | | 3,373 | | |
Class C | | | 36,120 | | |
Class R4 | | | 10,021 | | |
Class R5 | | | 1,158 | | |
Class W | | | 278,684 | | |
Class Z | | | 915,263 | | |
Administration fees | | | 923,677 | | |
Compensation of board members | | | 51,263 | | |
Custodian fees | | | 21,056 | | |
Printing and postage fees | | | 78,025 | | |
Registration fees | | | 114,744 | | |
Professional fees | | | 74,322 | | |
Chief compliance officer expenses | | | 681 | | |
Other | | | 34,845 | | |
Total expenses | | | 9,698,772 | | |
Fees waived or expenses reimbursed by Investment Manager and its affiliates | | | (1,218 | ) | |
Fees waived by Distributor — Class C | | | (28,402 | ) | |
Expense reductions | | | (2,217 | ) | |
Total net expenses | | | 9,666,935 | | |
Net investment income | | | 43,626,414 | | |
Realized and unrealized gain (loss) — net | |
Net realized gain (loss) on: | |
Investments | | | (10,456,127 | ) | |
Futures contracts | | | 11,673,992 | | |
Net realized gain | | | 1,217,865 | | |
Net change in unrealized appreciation (depreciation) on: | |
Investments | | | (22,293,701 | ) | |
Futures contracts | | | 2,092,577 | | |
Net change in unrealized appreciation (depreciation) | | | (20,201,124 | ) | |
Net realized and unrealized loss | | | (18,983,259 | ) | |
Net increase in net assets resulting from operations | | $ | 24,643,155 | | |
The accompanying Notes to Financial Statements are an integral part of this statement.
Annual Report 2014
26
Columbia Corporate Income Fund
Statement of Changes in Net Assets
| | | Year Ended
April 30,
2014 | | Year Ended
April 30,
2013(a) | |
Operations | |
Net investment income | | $ | 43,626,414 | | | $ | 48,346,706 | | |
Net realized gain | | | 1,217,865 | | | | 73,062,428 | | |
Net change in unrealized appreciation (depreciation) | | | (20,201,124 | ) | | | 7,447,880 | | |
Net increase in net assets resulting from operations | | | 24,643,155 | | | | 128,857,014 | | |
Distributions to shareholders | |
Net investment income | |
Class A | | | (3,442,273 | ) | | | (4,247,746 | ) | |
Class B | | | (36,184 | ) | | | (67,627 | ) | |
Class C | | | (415,438 | ) | | | (533,389 | ) | |
Class I | | | (20,805,824 | ) | | | (20,380,660 | ) | |
Class R4 | | | (156,773 | ) | | | (1,549 | ) | |
Class R5 | | | (73,344 | ) | | | (177 | ) | |
Class W | | | (4,095,727 | ) | | | (4,782,370 | ) | |
Class Y | | | (284 | ) | | | (37 | ) | |
Class Z | | | (14,566,339 | ) | | | (18,333,520 | ) | |
Net realized gains | |
Class A | | | (3,796,109 | ) | | | (2,972,562 | ) | |
Class B | | | (52,362 | ) | | | (60,172 | ) | |
Class C | | | (574,543 | ) | | | (470,063 | ) | |
Class I | | | (22,405,768 | ) | | | (11,858,459 | ) | |
Class R4 | | | (128,815 | ) | | | (50 | ) | |
Class R5 | | | (24,050 | ) | | | (50 | ) | |
Class W | | | (4,326,368 | ) | | | (2,952,768 | ) | |
Class Y | | | (76 | ) | | | (50 | ) | |
Class Z | | | (15,076,305 | ) | | | (12,593,986 | ) | |
Total distributions to shareholders | | | (89,976,582 | ) | | | (79,255,235 | ) | |
Increase (decrease) in net assets from capital stock activity | | | 11,964,890 | | | | 17,040,442 | | |
Total increase (decrease) in net assets | | | (53,368,537 | ) | | | 66,642,221 | | |
Net assets at beginning of year | | | 1,474,463,139 | | | | 1,407,820,918 | | |
Net assets at end of year | | $ | 1,421,094,602 | | | $ | 1,474,463,139 | | |
Excess of distributions over net investment income | | $ | (631,685 | ) | | $ | (650,351 | ) | |
(a) Class R4, Class R5 and Class Y shares are for the period from November 8, 2012 (commencement of operations) to April 30, 2013.
The accompanying Notes to Financial Statements are an integral part of this statement.
Annual Report 2014
27
Columbia Corporate Income Fund
Statement of Changes in Net Assets (continued)
| | | Year Ended April 30, 2014 | | Year Ended April 30, 2013(a) | |
| | | Shares | | Dollars ($) | | Shares | | Dollars ($) | |
Capital stock activity | |
Class A shares | |
Subscriptions(b) | | | 3,258,187 | | | | 33,246,804 | | | | 4,628,237 | | | | 48,804,482 | | |
Distributions reinvested | | | 641,459 | | | | 6,433,644 | | | | 597,175 | | | | 6,305,905 | | |
Redemptions | | | (5,230,527 | ) | | | (53,241,562 | ) | | | (4,113,395 | ) | | | (43,323,508 | ) | |
Net increase (decrease) | | | (1,330,881 | ) | | | (13,561,114 | ) | | | 1,112,017 | | | | 11,786,879 | | |
Class B shares | |
Subscriptions | | | 10,570 | | | | 108,811 | | | | 48,341 | | | | 509,739 | | |
Distributions reinvested | | | 6,482 | | | | 64,896 | | | | 8,222 | | | | 86,790 | | |
Redemptions(b) | | | (123,653 | ) | | | (1,258,672 | ) | | | (130,349 | ) | | | (1,370,185 | ) | |
Net decrease | | | (106,601 | ) | | | (1,084,965 | ) | | | (73,786 | ) | | | (773,656 | ) | |
Class C shares | |
Subscriptions | | | 226,891 | | | | 2,321,624 | | | | 1,170,822 | | | | 12,344,941 | | |
Distributions reinvested | | | 83,757 | | | | 838,991 | | | | 79,202 | | | | 836,527 | | |
Redemptions | | | (1,109,311 | ) | | | (11,303,100 | ) | | | (580,590 | ) | | | (6,116,863 | ) | |
Net increase (decrease) | | | (798,663 | ) | | | (8,142,485 | ) | | | 669,434 | | | | 7,064,605 | | |
Class I shares | |
Subscriptions | | | 13,440,286 | | | | 137,793,223 | | | | 3,787,177 | | | | 40,244,010 | | |
Distributions reinvested | | | 4,309,020 | | | | 43,211,399 | | | | 3,053,663 | | | | 32,238,969 | | |
Redemptions | | | (8,539,593 | ) | | | (86,312,320 | ) | | | (5,758,306 | ) | | | (60,629,655 | ) | |
Net increase | | | 9,209,713 | | | | 94,692,302 | | | | 1,082,534 | | | | 11,853,324 | | |
Class R4 shares | |
Subscriptions | | | 1,101,060 | | | | 11,092,780 | | | | 81,233 | | | | 859,913 | | |
Distributions reinvested | | | 28,495 | | | | 285,371 | | | | 143 | | | | 1,519 | | |
Redemptions | | | (86,688 | ) | | | (868,215 | ) | | | (158 | ) | | | (1,673 | ) | |
Net increase | | | 1,042,867 | | | | 10,509,936 | | | | 81,218 | | | | 859,759 | | |
Class R5 shares | |
Subscriptions | | | 990,899 | | | | 10,019,149 | | | | 10,974 | | | | 116,293 | | |
Distributions reinvested | | | 9,629 | | | | 97,219 | | | | 14 | | | | 146 | | |
Redemptions | | | (851,524 | ) | | | (8,557,883 | ) | | | — | | | | — | | |
Net increase | | | 149,004 | | | | 1,558,485 | | | | 10,988 | | | | 116,439 | | |
Class W shares | |
Subscriptions | | | 3,476,907 | | | | 35,522,137 | | | | 4,879,966 | | | | 51,449,757 | | |
Distributions reinvested | | | 839,277 | | | | 8,421,917 | | | | 732,702 | | | | 7,734,957 | | |
Redemptions | | | (6,281,368 | ) | | | (64,187,468 | ) | | | (6,500,130 | ) | | | (68,750,110 | ) | |
Net decrease | | | (1,965,184 | ) | | | (20,243,414 | ) | | | (887,462 | ) | | | (9,565,396 | ) | |
The accompanying Notes to Financial Statements are an integral part of this statement.
Annual Report 2014
28
Columbia Corporate Income Fund
Statement of Changes in Net Assets (continued)
| | | Year Ended April 30, 2014 | | Year Ended April 30, 2013(a) | |
| | | Shares | | Dollars ($) | | Shares | | Dollars ($) | |
Capital stock activity (continued) | |
Class Y shares | |
Subscriptions | | | 2,524 | | | | 25,221 | | | | 231 | | | | 2,500 | | |
Distributions reinvested | | | 18 | | | | 184 | | | | 1 | | | | 6 | | |
Redemptions | | | (16 | ) | | | (158 | ) | | | — | | | | — | | |
Net increase | | | 2,526 | | | | 25,247 | | | | 232 | | | | 2,506 | | |
Class Z shares | |
Subscriptions | | | 9,999,802 | | | | 101,808,827 | | | | 18,655,505 | | | | 197,776,815 | | |
Distributions reinvested | | | 1,232,786 | | | | 12,363,980 | | | | 977,555 | | | | 10,324,033 | | |
Redemptions | | | (16,340,042 | ) | | | (165,961,909 | ) | | | (20,149,210 | ) | | | (212,404,866 | ) | |
Net decrease | | | (5,107,454 | ) | | | (51,789,102 | ) | | | (516,150 | ) | | | (4,304,018 | ) | |
Total net increase | | | 1,095,327 | | | | 11,964,890 | | | | 1,479,025 | | | | 17,040,442 | | |
(a) Class R4, Class R5 and Class Y shares are for the period from November 8, 2012 (commencement of operations) to April 30, 2013.
(b) Includes conversions of Class B shares to Class A shares, if any.
The accompanying Notes to Financial Statements are an integral part of this statement.
Annual Report 2014
29
Columbia Corporate Income Fund
The following tables are intended to help you understand the Fund's financial performance. Certain information reflects financial results for a single share of a class held for the periods shown. Per share net investment income (loss) amounts are calculated based on average shares outstanding during the period. Total return assumes reinvestment of all dividends and distributions, if any. Total return does not reflect payment of sales charges, if any, and is not annualized for periods of less than one year.
| | | Year Ended April 30, | | Year Ended March 31, | |
Class A | | 2014 | | 2013 | | 2012(a) | | 2012 | | 2011 | | 2010 | |
Per share data | |
Net asset value, beginning of period | | $ | 10.67 | | | $ | 10.30 | | | $ | 10.19 | | | $ | 9.71 | | | $ | 9.53 | | | $ | 7.61 | | |
Income from investment operations: | |
Net investment income | | | 0.29 | | | | 0.32 | | | | 0.03 | | | | 0.35 | | | | 0.50 | | | | 0.54 | | |
Net realized and unrealized gain (loss) | | | (0.14 | ) | | | 0.59 | | | | 0.11 | | | | 0.49 | | | | 0.19 | | | | 1.95 | | |
Total from investment operations | | | 0.15 | | | | 0.91 | | | | 0.14 | | | | 0.84 | | | | 0.69 | | | | 2.49 | | |
Less distributions to shareholders: | |
Net investment income | | | (0.29 | ) | | | (0.32 | ) | | | (0.03 | ) | | | (0.36 | ) | | | (0.51 | ) | | | (0.57 | ) | |
Net realized gains | | | (0.33 | ) | | | (0.22 | ) | | | — | | | | — | | | | — | | | | — | | |
Total distributions to shareholders | | | (0.62 | ) | | | (0.54 | ) | | | (0.03 | ) | | | (0.36 | ) | | | (0.51 | ) | | | (0.57 | ) | |
Proceeds from regulatory settlements | | | — | | | | — | | | | — | | | | — | | | | — | | | | 0.00 | (b) | |
Net asset value, end of period | | $ | 10.20 | | | $ | 10.67 | | | $ | 10.30 | | | $ | 10.19 | | | $ | 9.71 | | | $ | 9.53 | | |
Total return | | | 1.60 | % | | | 8.97 | % | | | 1.35 | % | | | 8.83 | % | | | 7.43 | % | | | 33.42 | % | |
Ratios to average net assets(c) | |
Total gross expenses | | | 0.96 | % | | | 0.96 | % | | | 0.97 | %(d) | | | 0.98 | %(e) | | | 1.03 | %(f) | | | 0.95 | %(e) | |
Total net expenses(g) | | | 0.96 | %(h) | | | 0.95 | %(h) | | | 0.92 | %(d) | | | 0.93 | %(e)(h) | | | 0.96 | %(f)(h) | | | 0.95 | %(e)(h) | |
Net investment income | | | 2.80 | % | | | 3.04 | % | | | 3.30 | %(d) | | | 3.54 | % | | | 5.14 | % | | | 6.04 | % | |
Supplemental data | |
Net assets, end of period (in thousands) | | $ | 120,603 | | | $ | 140,322 | | | $ | 123,974 | | | $ | 119,473 | | | $ | 81,879 | | | $ | 85,361 | | |
Portfolio turnover | | | 105 | % | | | 109 | % | | | 6 | % | | | 183 | % | | | 108 | % | | | 131 | % | |
Notes to Financial Highlights
(a) For the period from April 1, 2012 to April 30, 2012. During the period, the Fund's fiscal year end was changed from March 31 to April 30.
(b) Rounds to zero.
(c) In addition to the fees and expenses which the Fund bears directly, the Fund indirectly bears a pro rata share of the fees and expenses of the acquired funds in which it invests. Such indirect expenses are not included in the reported expense ratios.
(d) Annualized.
(e) Ratios include line of credit interest expense which rounds to less than 0.01%.
(f) Ratios include line of credit interest expense. If line of credit interest expense had been excluded, expenses would have been lower by 0.01%.
(g) Total net expenses include the impact of certain waivers/reimbursements made by the Investment Manager and certain of its affiliates, if applicable.
(h) The benefits derived from expense reductions had an impact of less than 0.01%.
The accompanying Notes to Financial Statements are an integral part of this statement.
Annual Report 2014
30
Columbia Corporate Income Fund
Financial Highlights (continued)
| | | Year Ended April 30, | | Year Ended March 31, | |
Class B | | 2014 | | 2013 | | 2012(a) | | 2012 | | 2011 | | 2010 | |
Per share data | |
Net asset value, beginning of period | | $ | 10.67 | | | $ | 10.30 | | | $ | 10.19 | | | $ | 9.71 | | | $ | 9.53 | | | $ | 7.61 | | |
Income from investment operations: | |
Net investment income | | | 0.21 | | | | 0.24 | | | | 0.02 | | | | 0.28 | | | | 0.43 | | | | 0.48 | | |
Net realized and unrealized gain (loss) | | | (0.14 | ) | | | 0.59 | | | | 0.11 | | | | 0.49 | | | | 0.19 | | | | 1.95 | | |
Total from investment operations | | | 0.07 | | | | 0.83 | | | | 0.13 | | | | 0.77 | | | | 0.62 | | | | 2.43 | | |
Less distributions to shareholders: | |
Net investment income | | | (0.21 | ) | | | (0.24 | ) | | | (0.02 | ) | | | (0.29 | ) | | | (0.44 | ) | | | (0.51 | ) | |
Net realized gains | | | (0.33 | ) | | | (0.22 | ) | | | — | | | | — | | | | — | | | | — | | |
Total distributions to shareholders | | | (0.54 | ) | | | (0.46 | ) | | | (0.02 | ) | | | (0.29 | ) | | | (0.44 | ) | | | (0.51 | ) | |
Proceeds from regulatory settlements | | | — | | | | — | | | | — | | | | — | | | | — | | | | 0.00 | (b) | |
Net asset value, end of period | | $ | 10.20 | | | $ | 10.67 | | | $ | 10.30 | | | $ | 10.19 | | | $ | 9.71 | | | $ | 9.53 | | |
Total return | | | 0.84 | % | | | 8.16 | % | | | 1.29 | % | | | 8.02 | % | | | 6.64 | % | | | 32.44 | % | |
Ratios to average net assets(c) | |
Total gross expenses | | | 1.71 | % | | | 1.71 | % | | | 1.72 | %(d) | | | 1.75 | %(e) | | | 1.78 | %(f) | | | 1.70 | %(e) | |
Total net expenses(g) | | | 1.71 | %(h) | | | 1.70 | %(h) | | | 1.67 | %(d) | | | 1.68 | %(e)(h) | | | 1.71 | %(f)(h) | | | 1.70 | %(e)(h) | |
Net investment income | | | 2.04 | % | | | 2.32 | % | | | 2.55 | %(d) | | | 2.84 | % | | | 4.42 | % | | | 5.33 | % | |
Supplemental data | |
Net assets, end of period (in thousands) | | $ | 1,259 | | | $ | 2,455 | | | $ | 3,129 | | | $ | 3,173 | | | $ | 4,344 | | | $ | 6,583 | | |
Portfolio turnover | | | 105 | % | | | 109 | % | | | 6 | % | | | 183 | % | | | 108 | % | | | 131 | % | |
Notes to Financial Highlights
(a) For the period from April 1, 2012 to April 30, 2012. During the period, the Fund's fiscal year end was changed from March 31 to April 30.
(b) Rounds to zero.
(c) In addition to the fees and expenses which the Fund bears directly, the Fund indirectly bears a pro rata share of the fees and expenses of the acquired funds in which it invests. Such indirect expenses are not included in the reported expense ratios.
(d) Annualized.
(e) Ratios include line of credit interest expense which rounds to less than 0.01%.
(f) Ratios include line of credit interest expense. If line of credit interest expense had been excluded, expenses would have been lower by 0.01%.
(g) Total net expenses include the impact of certain waivers/reimbursements made by the Investment Manager and certain of its affiliates, if applicable.
(h) The benefits derived from expense reductions had an impact of less than 0.01%.
The accompanying Notes to Financial Statements are an integral part of this statement.
Annual Report 2014
31
Columbia Corporate Income Fund
Financial Highlights (continued)
| | | Year Ended April 30, | | Year Ended March 31, | |
Class C | | 2014 | | 2013 | | 2012(a) | | 2012 | | 2011 | | 2010 | |
Per share data | |
Net asset value, beginning of period | | $ | 10.67 | | | $ | 10.30 | | | $ | 10.19 | | | $ | 9.71 | | | $ | 9.53 | | | $ | 7.61 | | |
Income from investment operations: | |
Net investment income | | | 0.22 | | | | 0.26 | | | | 0.02 | | | | 0.29 | | | | 0.44 | | | | 0.49 | | |
Net realized and unrealized gain (loss) | | | (0.13 | ) | | | 0.58 | | | | 0.11 | | | | 0.49 | | | | 0.20 | | | | 1.95 | | |
Total from investment operations | | | 0.09 | | | | 0.84 | | | | 0.13 | | | | 0.78 | | | | 0.64 | | | | 2.44 | | |
Less distributions to shareholders: | |
Net investment income | | | (0.23 | ) | | | (0.25 | ) | | | (0.02 | ) | | | (0.30 | ) | | | (0.46 | ) | | | (0.52 | ) | |
Net realized gains | | | (0.33 | ) | | | (0.22 | ) | | | — | | | | — | | | | — | | | | — | | |
Total distributions to shareholders | | | (0.56 | ) | | | (0.47 | ) | | | (0.02 | ) | | | (0.30 | ) | | | (0.46 | ) | | | (0.52 | ) | |
Proceeds from regulatory settlements | | | — | | | | — | | | | — | | | | — | | | | — | | | | 0.00 | (b) | |
Net asset value, end of period | | $ | 10.20 | | | $ | 10.67 | | | $ | 10.30 | | | $ | 10.19 | | | $ | 9.71 | | | $ | 9.53 | | |
Total return | | | 0.99 | % | | | 8.32 | % | | | 1.30 | % | | | 8.18 | % | | | 6.79 | % | | | 32.63 | % | |
Ratios to average net assets(c) | |
Total gross expenses | | | 1.71 | % | | | 1.71 | % | | | 1.72 | %(d) | | | 1.73 | %(e) | | | 1.78 | %(f) | | | 1.70 | %(e) | |
Total net expenses(g) | | | 1.56 | %(h) | | | 1.55 | %(h) | | | 1.52 | %(d) | | | 1.53 | %(e)(h) | | | 1.56 | %(f)(h) | | | 1.55 | %(e)(h) | |
Net investment income | | | 2.20 | % | | | 2.42 | % | | | 2.69 | %(d) | | | 2.93 | % | | | 4.55 | % | | | 5.45 | % | |
Supplemental data | |
Net assets, end of period (in thousands) | | $ | 15,587 | | | $ | 24,821 | | | $ | 17,062 | | | $ | 16,074 | | | $ | 9,952 | | | $ | 11,265 | | |
Portfolio turnover | | | 105 | % | | | 109 | % | | | 6 | % | | | 183 | % | | | 108 | % | | | 131 | % | |
Notes to Financial Highlights
(a) For the period from April 1, 2012 to April 30, 2012. During the period, the Fund's fiscal year end was changed from March 31 to April 30.
(b) Rounds to zero.
(c) In addition to the fees and expenses which the Fund bears directly, the Fund indirectly bears a pro rata share of the fees and expenses of the acquired funds in which it invests. Such indirect expenses are not included in the reported expense ratios.
(d) Annualized.
(e) Ratios include line of credit interest expense which rounds to less than 0.01%.
(f) Ratios include line of credit interest expense. If line of credit interest expense had been excluded, expenses would have been lower by 0.01%.
(g) Total net expenses include the impact of certain waivers/reimbursements made by the Investment Manager and certain of its affiliates, if applicable.
(h) The benefits derived from expense reductions had an impact of less than 0.01%.
The accompanying Notes to Financial Statements are an integral part of this statement.
Annual Report 2014
32
Columbia Corporate Income Fund
Financial Highlights (continued)
| | | Year Ended April 30, | | Year Ended March 31, | |
Class I | | 2014 | | 2013 | | 2012(a) | | 2012 | | 2011(b) | |
Per share data | |
Net asset value, beginning of period | | $ | 10.67 | | | $ | 10.30 | | | $ | 10.19 | | | $ | 9.71 | | | $ | 9.84 | | |
Income from investment operations: | |
Net investment income | | | 0.33 | | | | 0.37 | | | | 0.03 | | | | 0.38 | | | | 0.25 | | |
Net realized and unrealized gain (loss) | | | (0.14 | ) | | | 0.58 | | | | 0.11 | | | | 0.50 | | | | (0.11 | ) | |
Total from investment operations | | | 0.19 | | | | 0.95 | | | | 0.14 | | | | 0.88 | | | | 0.14 | | |
Less distributions to shareholders: | |
Net investment income | | | (0.33 | ) | | | (0.36 | ) | | | (0.03 | ) | | | (0.40 | ) | | | (0.27 | ) | |
Net realized gains | | | (0.33 | ) | | | (0.22 | ) | | | — | | | | — | | | | — | | |
Total distributions to shareholders | | | (0.66 | ) | | | (0.58 | ) | | | (0.03 | ) | | | (0.40 | ) | | | (0.27 | ) | |
Net asset value, end of period | | $ | 10.20 | | | $ | 10.67 | | | $ | 10.30 | | | $ | 10.19 | | | $ | 9.71 | | |
Total return | | | 2.04 | % | | | 9.43 | % | | | 1.38 | % | | | 9.23 | % | | | 1.50 | % | |
Ratios to average net assets(c) | |
Total gross expenses | | | 0.52 | % | | | 0.53 | % | | | 0.55 | %(d) | | | 0.54 | %(e) | | | 0.65 | %(d)(e) | |
Total net expenses(f) | | | 0.52 | % | | | 0.53 | % | | | 0.55 | %(d) | | | 0.54 | %(e)(g) | | | 0.65 | %(d)(e)(g) | |
Net investment income | | | 3.25 | % | | | 3.47 | % | | | 3.68 | %(d) | | | 3.81 | % | | | 5.15 | %(d) | |
Supplemental data | |
Net assets, end of period (in thousands) | | $ | 676,153 | | | $ | 608,842 | | | $ | 576,449 | | | $ | 560,564 | | | $ | 98,729 | | |
Portfolio turnover | | | 105 | % | | | 109 | % | | | 6 | % | | | 183 | % | | | 108 | % | |
Notes to Financial Highlights
(a) For the period from April 1, 2012 to April 30, 2012. During the period, the Fund's fiscal year end was changed from March 31 to April 30.
(b) For the period from September 27, 2010 (commencement of operations) to March 31, 2011.
(c) In addition to the fees and expenses which the Fund bears directly, the Fund indirectly bears a pro rata share of the fees and expenses of the acquired funds in which it invests. Such indirect expenses are not included in the reported expense ratios.
(d) Annualized.
(e) Ratios include line of credit interest expense which rounds to less than 0.01%.
(f) Total net expenses include the impact of certain waivers/reimbursements made by the Investment Manager and certain of its affiliates, if applicable.
(g) The benefits derived from expense reductions had an impact of less than 0.01%.
The accompanying Notes to Financial Statements are an integral part of this statement.
Annual Report 2014
33
Columbia Corporate Income Fund
Financial Highlights (continued)
| | | Year Ended April 30, | |
Class R4 | | 2014 | | 2013(a) | |
Per share data | |
Net asset value, beginning of period | | $ | 10.65 | | | $ | 10.81 | | |
Income from investment operations: | |
Net investment income | | | 0.31 | | | | 0.14 | | |
Net realized and unrealized gain (loss) | | | (0.13 | ) | | | 0.07 | | |
Total from investment operations | | | 0.18 | | | | 0.21 | | |
Less distributions to shareholders: | |
Net investment income | | | (0.31 | ) | | | (0.15 | ) | |
Net realized gains | | | (0.33 | ) | | | (0.22 | ) | |
Total distributions to shareholders | | | (0.64 | ) | | | (0.37 | ) | |
Net asset value, end of period | | $ | 10.19 | | | $ | 10.65 | | |
Total return | | | 1.95 | % | | | 2.03 | % | |
Ratios to average net assets(b) | |
Total gross expenses | | | 0.72 | % | | | 0.74 | %(c) | |
Total net expenses(d) | | | 0.71 | %(e) | | | 0.71 | %(c) | |
Net investment income | | | 3.13 | % | | | 2.97 | %(c) | |
Supplemental data | |
Net assets, end of period (in thousands) | | $ | 11,454 | | | $ | 865 | | |
Portfolio turnover | | | 105 | % | | | 109 | % | |
Notes to Financial Highlights
(a) For the period from November 8, 2012 (commencement of operations) to April 30, 2013.
(b) In addition to the fees and expenses which the Fund bears directly, the Fund indirectly bears a pro rata share of the fees and expenses of the acquired funds in which it invests. Such indirect expenses are not included in the reported expense ratios.
(c) Annualized.
(d) Total net expenses include the impact of certain waivers/reimbursements made by the Investment Manager and certain of its affiliates, if applicable.
(e) The benefits derived from expense reductions had an impact of less than 0.01%.
The accompanying Notes to Financial Statements are an integral part of this statement.
Annual Report 2014
34
Columbia Corporate Income Fund
Financial Highlights (continued)
| | | Year Ended April 30, | |
Class R5 | | 2014 | | 2013(a) | |
Per share data | |
Net asset value, beginning of period | | $ | 10.65 | | | $ | 10.81 | | |
Income from investment operations: | |
Net investment income | | | 0.33 | | | | 0.14 | | |
Net realized and unrealized gain (loss) | | | (0.13 | ) | | | 0.08 | | |
Total from investment operations | | | 0.20 | | | | 0.22 | | |
Less distributions to shareholders: | |
Net investment income | | | (0.33 | ) | | | (0.16 | ) | |
Net realized gains | | | (0.33 | ) | | | (0.22 | ) | |
Total distributions to shareholders | | | (0.66 | ) | | | (0.38 | ) | |
Net asset value, end of period | | $ | 10.19 | | | $ | 10.65 | | |
Total return | | | 2.09 | % | | | 2.08 | % | |
Ratios to average net assets(b) | |
Total gross expenses | | | 0.57 | % | | | 0.58 | %(c) | |
Total net expenses(d) | | | 0.57 | % | | | 0.58 | %(c) | |
Net investment income | | | 3.17 | % | | | 3.05 | %(c) | |
Supplemental data | |
Net assets, end of period (in thousands) | | $ | 1,630 | | | $ | 117 | | |
Portfolio turnover | | | 105 | % | | | 109 | % | |
Notes to Financial Highlights
(a) For the period from November 8, 2012 (commencement of operations) to April 30, 2013.
(b) In addition to the fees and expenses which the Fund bears directly, the Fund indirectly bears a pro rata share of the fees and expenses of the acquired funds in which it invests. Such indirect expenses are not included in the reported expense ratios.
(c) Annualized.
(d) Total net expenses include the impact of certain waivers/reimbursements made by the Investment Manager and certain of its affiliates, if applicable.
The accompanying Notes to Financial Statements are an integral part of this statement.
Annual Report 2014
35
Columbia Corporate Income Fund
Financial Highlights (continued)
| | | Year Ended April 30, | | Year Ended March 31, | |
Class W | | 2014 | | 2013 | | 2012(a) | | 2012 | | 2011(b) | |
Per share data | |
Net asset value, beginning of period | | $ | 10.67 | | | $ | 10.30 | | | $ | 10.19 | | | $ | 9.71 | | | $ | 9.84 | | |
Income from investment operations: | |
Net investment income | | | 0.29 | | | | 0.32 | | | | 0.03 | | | | 0.35 | | | | 0.23 | | |
Net realized and unrealized gain (loss) | | | (0.14 | ) | | | 0.59 | | | | 0.11 | | | | 0.49 | | | | (0.10 | ) | |
Total from investment operations | | | 0.15 | | | | 0.91 | | | | 0.14 | | | | 0.84 | | | | 0.13 | | |
Less distributions to shareholders: | |
Net investment income | | | (0.29 | ) | | | (0.32 | ) | | | (0.03 | ) | | | (0.36 | ) | | | (0.26 | ) | |
Net realized gains | | | (0.33 | ) | | | (0.22 | ) | | | — | | | | — | | | | — | | |
Total distributions to shareholders | | | (0.62 | ) | | | (0.54 | ) | | | (0.03 | ) | | | (0.36 | ) | | | (0.26 | ) | |
Net asset value, end of period | | $ | 10.20 | | | $ | 10.67 | | | $ | 10.30 | | | $ | 10.19 | | | $ | 9.71 | | |
Total return | | | 1.60 | % | | | 8.97 | % | | | 1.35 | % | | | 8.83 | % | | | 1.31 | % | |
Ratios to average net assets(c) | |
Total gross expenses | | | 0.96 | % | | | 0.96 | % | | | 0.97 | %(d) | | | 0.98 | %(e) | | | 1.06 | %(d)(e) | |
Total net expenses(f) | | | 0.96 | %(g) | | | 0.95 | %(g) | | | 0.92 | %(d) | | | 0.93 | %(e)(g) | | | 0.95 | %(d)(e)(g) | |
Net investment income | | | 2.81 | % | | | 3.06 | % | | | 3.30 | %(d) | | | 3.50 | % | | | 4.70 | %(d) | |
Supplemental data | |
Net assets, end of period (in thousands) | | $ | 132,166 | | | $ | 159,179 | | | $ | 162,775 | | | $ | 159,553 | | | $ | 104,340 | | |
Portfolio turnover | | | 105 | % | | | 109 | % | | | 6 | % | | | 183 | % | | | 108 | % | |
Notes to Financial Highlights
(a) For the period from April 1, 2012 to April 30, 2012. During the period, the Fund's fiscal year end was changed from March 31 to April 30.
(b) For the period from September 27, 2010 (commencement of operations) to March 31, 2011.
(c) In addition to the fees and expenses which the Fund bears directly, the Fund indirectly bears a pro rata share of the fees and expenses of the acquired funds in which it invests. Such indirect expenses are not included in the reported expense ratios.
(d) Annualized.
(e) Ratios include line of credit interest expense which rounds to less than 0.01%.
(f) Total net expenses include the impact of certain waivers/reimbursements made by the Investment Manager and certain of its affiliates, if applicable.
(g) The benefits derived from expense reductions had an impact of less than 0.01%.
The accompanying Notes to Financial Statements are an integral part of this statement.
Annual Report 2014
36
Columbia Corporate Income Fund
Financial Highlights (continued)
| | | Year Ended April 30, | |
Class Y | | 2014 | | 2013(a) | |
Per share data | |
Net asset value, beginning of period | | $ | 10.66 | | | $ | 10.82 | | |
Income from investment operations | |
Net investment income | | | 0.33 | | | | 0.17 | | |
Net realized and unrealized gain (loss) | | | (0.13 | ) | | | 0.05 | | |
Total from investment operations | | | 0.20 | | | | 0.22 | | |
Less distributions to shareholders: | |
Net investment income | | | (0.33 | ) | | | (0.16 | ) | |
Net realized gains | | | (0.33 | ) | | | (0.22 | ) | |
Total distributions to shareholders | | | (0.66 | ) | | | (0.38 | ) | |
Net asset value, end of period | | $ | 10.20 | | | $ | 10.66 | | |
Total return | | | 2.14 | % | | | 2.09 | % | |
Ratios to average net assets(b) | |
Total gross expenses | | | 0.51 | % | | | 0.45 | %(c) | |
Total net expenses(d) | | | 0.51 | % | | | 0.45 | %(c) | |
Net investment income | | | 3.30 | % | | | 3.35 | %(c) | |
Supplemental data | |
Net assets, end of period (in thousands) | | $ | 28 | | | $ | 2 | | |
Portfolio turnover | | | 105 | % | | | 109 | % | |
Notes to Financial Highlights
(a) For the period from November 8, 2012 (commencement of operations) to April 30, 2013.
(b) In addition to the fees and expenses which the Fund bears directly, the Fund indirectly bears a pro rata share of the fees and expenses of the acquired funds in which it invests. Such indirect expenses are not included in the reported expense ratios.
(c) Annualized.
(d) Total net expenses include the impact of certain waivers/reimbursements made by the Investment Manager and certain of its affiliates, if applicable.
The accompanying Notes to Financial Statements are an integral part of this statement.
Annual Report 2014
37
Columbia Corporate Income Fund
Financial Highlights (continued)
| | | Year Ended April 30, | | Year Ended March 31, | |
Class Z | | 2014 | | 2013 | | 2012(a) | | 2012 | | 2011 | | 2010 | |
Per share data | |
Net asset value, beginning of period | | $ | 10.67 | | | $ | 10.30 | | | $ | 10.19 | | | $ | 9.71 | | | $ | 9.53 | | | $ | 7.61 | | |
Income from investment operations: | |
Net investment income | | | 0.31 | | | | 0.35 | | | | 0.03 | | | | 0.38 | | | | 0.52 | | | | 0.56 | | |
Net realized and unrealized gain (loss) | | | (0.14 | ) | | | 0.58 | | | | 0.11 | | | | 0.49 | | | | 0.20 | | | | 1.96 | | |
Total from investment operations | | | 0.17 | | | | 0.93 | | | | 0.14 | | | | 0.87 | | | | 0.72 | | | | 2.52 | | |
Less distributions to shareholders: | |
Net investment income | | | (0.31 | ) | | | (0.34 | ) | | | (0.03 | ) | | | (0.39 | ) | | | (0.54 | ) | | | (0.60 | ) | |
Net realized gains | | | (0.33 | ) | | | (0.22 | ) | | | — | | | | — | | | | — | | | | — | | |
Total distributions to shareholders | | | (0.64 | ) | | | (0.56 | ) | | | (0.03 | ) | | | (0.39 | ) | | | (0.54 | ) | | | (0.60 | ) | |
Proceeds from regulatory settlements | | | — | | | | — | | | | — | | | | — | | | | — | | | | 0.00 | (b) | |
Net asset value, end of period | | $ | 10.20 | | | $ | 10.67 | | | $ | 10.30 | | | $ | 10.19 | | | $ | 9.71 | | | $ | 9.53 | | |
Total return | | | 1.85 | % | | | 9.24 | % | | | 1.37 | % | | | 9.10 | % | | | 7.70 | % | | | 33.74 | % | |
Ratios to average net assets(c) | |
Total gross expenses | | | 0.71 | % | | | 0.71 | % | | | 0.72 | %(d) | | | 0.73 | %(e) | | | 0.78 | %(f) | | | 0.70 | %(e) | |
Total net expenses(g) | | | 0.71 | %(h) | | | 0.70 | %(h) | | | 0.67 | %(d) | | | 0.68 | %(e)(h) | | | 0.71 | %(f)(h) | | | 0.70 | %(e)(h) | |
Net investment income | | | 3.05 | % | | | 3.30 | % | | | 3.55 | %(d) | | | 3.80 | % | | | 5.37 | % | | | 6.29 | % | |
Supplemental data | |
Net assets, end of period (in thousands) | | $ | 462,215 | | | $ | 537,860 | | | $ | 524,432 | | | $ | 515,700 | | | $ | 396,952 | | | $ | 451,195 | | |
Portfolio turnover | | | 105 | % | | | 109 | % | | | 6 | % | | | 183 | % | | | 108 | % | | | 131 | % | |
Notes to Financial Highlights
(a) For the period from April 1, 2012 to April 30, 2012. During the period, the Fund's fiscal year end was changed from March 31 to April 30.
(b) Rounds to zero.
(c) In addition to the fees and expenses which the Fund bears directly, the Fund indirectly bears a pro rata share of the fees and expenses of the acquired funds in which it invests. Such indirect expenses are not included in the reported expense ratios.
(d) Annualized.
(e) Ratios include line of credit interest expense which rounds to less than 0.01%.
(f) Ratios include line of credit interest expense. If line of credit interest expense had been excluded, expenses would have been lower by 0.01%.
(g) Total net expenses include the impact of certain waivers/reimbursements made by the Investment Manager and certain of its affiliates, if applicable.
(h) The benefits derived from expense reductions had an impact of less than 0.01%.
The accompanying Notes to Financial Statements are an integral part of this statement.
Annual Report 2014
38
Columbia Corporate Income Fund
Notes to Financial Statements
April 30, 2014
Note 1. Organization
Columbia Corporate Income Fund (the Fund), a series of Columbia Funds Series Trust I (the Trust), is a diversified fund. The Trust is registered under the Investment Company Act of 1940, as amended (the 1940 Act), as an open-end management investment company organized as a Massachusetts business trust.
Fund Shares
The Trust may issue an unlimited number of shares (without par value). The Fund offers Class A, Class B, Class C, Class I, Class R4, Class R5, Class W, Class Y and Class Z shares. Although all share classes generally have identical voting, dividend and liquidation rights, each share class votes separately when required by law. Different share classes pay different distribution amounts to the extent the expenses of such share classes differ, and distributions in liquidation will be proportional to the net asset value of each share class. Each share class has its own expense structure and sales charges, as applicable.
Class A shares are subject to a maximum front-end sales charge of 4.75% based on the initial investment amount. Class A shares purchased without an initial sales charge in accounts aggregating $1 million to $50 million at the time of purchase are subject to a contingent deferred sales charge (CDSC) if the shares are sold within 18 months of purchase, charged as follows: 1.00% CDSC if redeemed within 12 months of purchase, and 0.50% CDSC if redeemed more than 12, but less than 18, months after purchase.
Class B shares may be subject to a maximum CDSC of 5.00% based upon the holding period after purchase. Class B shares will generally convert to Class A shares eight years after purchase. The Fund no longer accepts investments by new or existing investors in the Fund's Class B shares, except in connection with the reinvestment of any dividend and/or capital gain distributions in Class B shares of the Fund and exchanges by existing Class B shareholders of certain other funds within the Columbia Family of Funds.
Class C shares are subject to a 1.00% CDSC on shares redeemed within one year of purchase.
Class I shares are not subject to sales charges and are available only to the Columbia Family of Funds.
Class R4 shares are not subject to sales charges and are generally available only to omnibus retirement plans and certain other eligible investors.
Class R5 shares are not subject to sales charges and are generally available only to investors purchasing through authorized investment professionals and omnibus retirement plans.
Class W shares are not subject to sales charges and are available only to investors purchasing through authorized investment programs managed by investment professionals, including discretionary managed account programs.
Class Y shares are not subject to sales charges and are generally available only to certain retirement plans.
Class Z shares are not subject to sales charges and are available only to certain eligible investors, which are subject to different investment minimums.
Note 2. Summary of Significant Accounting Policies
Use of Estimates
The preparation of financial statements in accordance with U.S. generally accepted accounting principles (GAAP) requires management to make certain estimates and assumptions that affect the reported amounts of assets and liabilities, the disclosure of contingent assets and liabilities at the date of the financial statements and the reported amounts of revenue and expenses during the reporting period. Actual results could differ from those estimates.
The following is a summary of significant accounting policies consistently followed by the Fund in the preparation of its financial statements.
Security Valuation
Debt securities generally are valued by pricing services approved by the Board of Trustees (the Board) based upon market transactions for normal, institutional-size trading units of similar securities. The services may use various pricing techniques which take into account appropriate factors such as yield, quality, coupon rate, maturity, type of issue, trading characteristics and other data, as well as broker quotes. Debt securities for which quotations are readily available may also be valued based upon an over-the-counter or exchange bid quotation.
All equity securities are valued at the close of business of the New York Stock Exchange (NYSE). Equity securities are valued at the last quoted sales price on the principal exchange or market on which they trade, except for securities traded on the NASDAQ Stock Market, which are valued at the NASDAQ official close price. Unlisted securities or listed securities for which there were no sales during the day are valued at the mean of the latest quoted bid and ask prices on such exchanges or markets.
Asset and mortgage-backed securities are generally valued by pricing services, which utilize pricing models that incorporate the securities' cash flow and loan performance data. These models also take into account available market data, including
Annual Report 2014
39
Columbia Corporate Income Fund
Notes to Financial Statements (continued)
April 30, 2014
trades, market quotations, and benchmark yield curves for identical or similar securities. Factors used to identify similar securities may include, but are not limited to, issuer, collateral type, vintage, prepayment speeds, collateral performance, credit ratings, credit enhancement and expected life. Asset-backed securities for which quotations are readily available may also be valued based upon an over-the-counter or exchange bid quotation.
Investments in open-end investment companies, including money market funds, are valued at net asset value.
Futures and options on futures contracts are valued based upon the settlement price established each day by the board of trade or exchange on which they are traded.
Investments for which market quotations are not readily available, or that have quotations which management believes are not reliable, are valued at fair value as determined in good faith under consistently applied procedures established by and under the general supervision of the Board. If a security or class of securities (such as foreign securities) is valued at fair value, such value is likely to be different from the last quoted market price for the security.
The determination of fair value often requires significant judgment. To determine fair value, management may use assumptions including but not limited to future cash flows and estimated risk premiums. Multiple inputs from various sources may be used to determine fair value.
Derivative Instruments
The Fund invests in certain derivative instruments, as detailed below, to meet its investment objectives. Derivatives are instruments whose values depend on, or are derived from, in whole or in part, the value of one or more other assets, such as securities, currencies, commodities or indices. Derivative instruments may be used to maintain cash reserves while maintaining exposure to certain other assets, to offset anticipated declines in values of investments, to facilitate trading, to reduce transaction costs and to pursue higher investment returns. The Fund may also use derivative instruments to mitigate certain investment risks, such as foreign currency exchange rate risk, interest rate risk and credit risk. Derivatives may involve various risks, including the potential inability of the counterparty to fulfill its obligation under the terms of the contract, the potential for an illiquid secondary market (making it difficult for the Fund to sell, including at favorable prices) and the potential for market movements which may expose the Fund to gains or losses in excess of the amount shown in the Statement of Assets and Liabilities. The notional amounts of derivative instruments, if applicable, are not recorded in the financial statements.
A derivative instrument may suffer a mark to market loss if the value of the contract decreases due to an unfavorable change in
the market rates or values of the underlying instrument. Losses can also occur if the counterparty does not perform under the contract. The Fund's risk of loss from counterparty credit risk on over-the-counter derivatives is generally limited to the aggregate unrealized gain netted against any collateral held by the Fund and the amount of any variation margin held by the counterparty. With exchange-traded or centrally cleared derivatives, there is minimal counterparty credit risk to the Fund since the exchange's clearinghouse, as counterparty to such instruments, guarantees against a possible default. The clearinghouse stands between the buyer and the seller of the contract; therefore, the counterparty credit risk is limited to failure of the clearinghouse. However, credit risk still exists in exchange-traded or centrally cleared derivatives with respect to initial and variation margin that is held in a broker's customer account. While brokers are required to segregate customer margin from their own assets, in the event that a broker becomes insolvent or goes into bankruptcy and at that time there is a shortfall in the aggregate amount of margin held by the broker for all its clients, U.S. bankruptcy laws will typically allocate that shortfall on a pro-rata basis across all the broker's customers, potentially resulting in losses to the Fund.
In order to better define its contractual rights and to secure rights that will help the Fund mitigate its counterparty risk, the Fund may enter into an International Swaps and Derivatives Association, Inc. Master Agreement (ISDA Master Agreement) or similar agreement with its derivative contract counterparties. An ISDA Master Agreement is an agreement between the Fund and a counterparty that governs over-the-counter derivatives and forward foreign currency exchange contracts and typically contains, among other things, collateral posting terms and netting provisions in the event of a default and/or termination event. Under an ISDA Master Agreement, the Fund may, under certain circumstances, offset with the counterparty certain derivative instrument's payables and/or receivables with collateral held and/or posted and create one single net payment. The provisions of the ISDA Master Agreement typically permit a single net payment in the event of default (close-out netting) including the bankruptcy or insolvency of the counterparty. Note, however, that bankruptcy or insolvency laws of a particular jurisdiction may impose restrictions on or prohibitions against the right of offset in bankruptcy, insolvency or other events.
Collateral (margin) requirements differ by type of derivative. Margin requirements are established by the exchange or clearinghouse for exchange-traded and centrally cleared derivatives. Brokers can ask for margin in excess of the minimum in certain circumstances. Collateral terms are contract specific for over-the-counter derivatives. For over-the-counter derivatives traded under an ISDA Master Agreement, the collateral requirements are typically calculated by netting the
Annual Report 2014
40
Columbia Corporate Income Fund
Notes to Financial Statements (continued)
April 30, 2014
mark-to-market amount for each transaction under such agreement and comparing that amount to the value of any variation margin currently pledged by the Fund and/or the counterparty. Generally, the amount of collateral due from or to a party has to exceed a minimum transfer amount threshold (e.g., $500,000) before a transfer has to be made. To the extent amounts due to the Fund from its counterparties are not fully collateralized, contractually or otherwise, the Fund bears the risk of loss from counterparty nonperformance. The Fund attempts to mitigate counterparty risk by only entering into agreements with counterparties that it believes have the financial resources to honor their obligations and by monitoring the financial stability of those counterparties.
Certain ISDA Master Agreements allow counterparties to over-the-counter derivatives to terminate derivative contracts prior to maturity in the event the Fund's net assets decline by a stated percentage over a specified time period or the Fund fails to meet the terms of the ISDA Master Agreement, which would cause the Fund to accelerate payment of any net liability owed to the counterparty. The Fund also has termination rights if the counterparty fails to meet the terms of the ISDA Master Agreement. In addition to considering counterparty credit risk, the Fund would consider terminating the derivative contracts based on whether termination would result in a net liability owed from the counterparty.
For financial reporting purposes, the Fund does not offset derivative assets and derivative liabilities that are subject to netting arrangements in the Statement of Assets and Liabilities.
Futures Contracts
Futures contracts are exchange traded and represent commitments for the future purchase or sale of an asset at a specified price on a specified date. The Fund bought and sold futures contracts to manage the duration and yield curve exposure of the Fund versus the benchmark and manage exposure to movements in interest rates. These instruments may be used for other purposes in future periods. Upon entering into futures contracts, the Fund bears risks that it may not achieve the anticipated benefits of the futures contracts and may realize a loss. Additional risks include counterparty credit risk, the possibility of an illiquid market, and that a change in the value of the contract or option may not correlate with changes in the value of the underlying asset.
Upon entering into a futures contract, the Fund pledges cash or securities with the broker in an amount sufficient to meet the initial margin requirement. The initial margin deposit must be maintained at an established level over the life of the contract. Cash deposited as initial margin is recorded in the Statement of Assets and Liabilities as margin deposits. Securities deposited as initial margin are designated in the
Portfolio of Investments. Subsequent payments (variation margin) are made or received by the Fund each day. The variation margin payments are equal to the daily change in the contract value and are recorded as variation margin receivable or payable and are offset in unrealized gains or losses. The Fund recognizes a realized gain or loss when the contract is closed or expires. Futures contracts involve, to varying degrees, risk of loss in excess of the variation margin disclosed in the Statement of Assets and Liabilities.
Effects of Derivative Transactions in the Financial Statements
The following tables are intended to provide additional information about the effect of derivatives on the financial statements of the Fund, including: the fair value of derivatives by risk category and the location of those fair values in the Statement of Assets and Liabilities; and the impact of derivative transactions over the period in the Statement of Operations including realized gains or losses and unrealized gains or losses. The derivative schedules following the Portfolio of Investments present additional information regarding derivative instruments outstanding at the end of the period, if any.
The following table is a summary of the fair value of derivative instruments at April 30, 2014:
Asset Derivatives | |
Risk Exposure
Category | | Statement of Assets and
Liabilities Location | | Fair Value ($) | |
Interest rate risk
| | Net assets — unrealized
appreciation on futures
contracts | | | 11,048
| * | |
Liability Derivatives | |
Risk Exposure
Category | | Statement of Assets and
Liabilities Location | |
Fair Value ($) | |
Interest rate risk
| | Net assets — unrealized
depreciation on futures
contracts | | | 3,729,005
| * | |
*Includes cumulative appreciation (depreciation) as reported in the tables following the Portfolio of Investments. Only the current day's variation margin is reported in receivables or payables in the Statement of Assets and Liabilities.
The following table indicates the effect of derivative instruments in the Statement of Operations for the year ended April 30, 2014:
Amount of Realized Gain (Loss) on Derivatives Recognized in Income | |
Risk Exposure Category | | Futures Contracts ($) | |
Interest rate risk | | | 11,673,992 | | |
Change in Unrealized Appreciation (Depreciation) on
Derivatives Recognized in Income | |
Risk Exposure Category | | Futures Contracts ($) | |
Interest rate risk | | | 2,092,577 | | |
Annual Report 2014
41
Columbia Corporate Income Fund
Notes to Financial Statements (continued)
April 30, 2014
The following table is a summary of the average outstanding volume by derivative instrument for the year ended April 30, 2014.
Derivative Instrument | | Average Notional Amounts ($)* | |
Futures contracts — Short | | | 326,969,358 | | |
*Based on ending quarterly outstanding amounts for the year ending April 30, 2014.
Delayed Delivery Securities
The Fund may trade securities on other than normal settlement terms, including securities purchased or sold on a "when-issued" basis. This may increase risk since the other party to the transaction may fail to deliver which could cause the Fund to subsequently invest at less advantageous prices. The Fund designates cash or liquid securities in an amount equal to the delayed delivery commitment.
Investments in Loans
The Fund may invest in loan participations and assignments of all or a portion of a loan. When the Fund purchases a loan participation, the Fund typically enters into a contractual relationship with the lender or third party selling such participations (Selling Participant), but not the borrower, and assumes the credit risk of the borrower, Selling Participant and any other persons interpositioned between the Fund and the borrower. In addition, the Fund may not directly benefit from the collateral supporting the loan that it has purchased from the Selling Participant. In contrast, when the Fund purchases an assignment of a loan, the Fund typically has direct rights against the borrower; provided, however, that the Fund's rights may be more limited than the lender from which it acquired the assignment and the Fund may be able to enforce their rights only through an administrative agent. Although certain loan participations or assignments are secured by collateral, the Fund could experience delays or limitations in realizing such collateral or have their interest subordinated to other indebtedness of the obligor. In the event that the administrator or collateral agent of a loan becomes insolvent, enters into receivership or bankruptcy, the Fund may incur costs and delays in realizing payment or may suffer a loss of principal and/or interest. The risk of loss is greater for unsecured or subordinated loans. In addition, loan participations and assignments are vulnerable to market conditions such that economic conditions or other events may reduce the demand for loan participations and assignments and certain loan participations and assignments which were liquid, when purchased, may become illiquid.
Security Transactions
Security transactions are accounted for on the trade date. Cost is determined and gains (losses) are based upon the specific identification method for both financial statement and federal income tax purposes.
Income Recognition
Interest income is recorded on an accrual basis. Market premiums and discounts, including original issue discounts, are amortized and accreted, respectively, over the expected life of the security on all debt securities, unless otherwise noted. The Fund classifies gains and losses realized on prepayments received on mortgage-backed securities as adjustments to interest income.
Dividend income is recorded on the ex-dividend date.
The value of additional securities received as an income payment is recorded as income and increases the cost basis of such securities.
Expenses
General expenses of the Trust are allocated to the Fund and other funds of the Trust based upon relative net assets or other expense allocation methodologies determined by the nature of the expense. Expenses directly attributable to the Fund are charged to the Fund. Expenses directly attributable to a specific class of shares are charged to that share class.
Determination of Class Net Asset Value
All income, expenses (other than class-specific expenses, which are charged to that share class, as shown in the Statement of Operations) and realized and unrealized gains (losses) are allocated to each class of the Fund on a daily basis, based on the relative net assets of each class, for purposes of determining the net asset value of each class.
Federal Income Tax Status
The Fund intends to qualify each year as a regulated investment company under Subchapter M of the Internal Revenue Code, as amended, and will distribute substantially all of its taxable income (including net short-term capital gains), if any, for its tax year, and as such will not be subject to federal income taxes. In addition, the Fund intends to distribute in each calendar year substantially all of its net investment income, capital gains and certain other amounts, if any, such that the Fund should not be subject to federal excise tax. Therefore, no federal income or excise tax provision is recorded.
Annual Report 2014
42
Columbia Corporate Income Fund
Notes to Financial Statements (continued)
April 30, 2014
Foreign Taxes
The Fund may be subject to foreign taxes on income, gains on investments or currency repatriation, a portion of which may be recoverable. The Fund will accrue such taxes and recoveries, as applicable, based upon its current interpretation of tax rules and regulations that exist in the markets in which it invests.
Realized gains in certain countries may be subject to foreign taxes at the Fund level, based on statutory rates. The Fund accrues for such foreign taxes on realized and unrealized gains at the appropriate rate for each jurisdiction, as applicable. The amount, if any, is disclosed as a liability on the Statement of Assets and Liabilities.
Distributions to Shareholders
Distributions from net investment income, if any, are declared daily and paid monthly. Net realized capital gains, if any, are distributed at least annually. Income distributions and capital gain distributions are determined in accordance with federal income tax regulations, which may differ from GAAP.
Guarantees and Indemnifications
Under the Trust's organizational documents and, in some cases, by contract, its officers and trustees are indemnified against certain liabilities arising out of the performance of their duties to the Trust or its funds. In addition, certain of the Fund's contracts with its service providers contain general indemnification clauses. The Fund's maximum exposure under these arrangements is unknown since the amount of any future claims that may be made against the Fund cannot be determined, and the Fund has no historical basis for predicting the likelihood of any such claims.
Note 3. Fees and Compensation Paid to Affiliates
Investment Management Fees
Under an Investment Management Services Agreement, Columbia Management Investment Advisers, LLC (the Investment Manager), a wholly-owned subsidiary of Ameriprise Financial, Inc. (Ameriprise Financial), determines which securities will be purchased, held or sold. The investment management fee is an annual fee that is equal to a percentage of the Fund's average daily net assets that declines from 0.43% to 0.30% as the Fund's net assets increase. The effective investment management fee rate for the year ended April 30, 2014 was 0.43% of the Fund's average daily net assets.
Administration Fees
Under an Administrative Services Agreement, the Investment Manager also serves as the Fund Administrator. The Fund pays the Fund Administrator an annual fee for administration and accounting services equal to a percentage of the Fund's average daily net assets that declines from 0.07% to 0.04% as the Fund's net assets increase. The effective administration fee rate for the year ended April 30, 2014 was 0.07% of the Fund's average daily net assets.
Compensation of Board Members
Board members are compensated for their services to the Fund as disclosed in the Statement of Operations. The Trust's eligible Trustees may participate in a Deferred Compensation Plan (the Plan) which may be terminated at any time. Obligations of the Plan will be paid solely out of the Fund's assets.
Compensation of Chief Compliance Officer
The Board has appointed a Chief Compliance Officer to the Fund in accordance with federal securities regulations. The Fund pays its pro-rata share of the expenses associated with the Chief Compliance Officer. The Fund's expenses for the Chief Compliance Officer will not exceed $15,000 per year.
Transfer Agent Fees
Under a Transfer and Dividend Disbursing Agent Agreement, Columbia Management Investment Services Corp. (the Transfer Agent), an affiliate of the Investment Manager and a wholly-owned subsidiary of Ameriprise Financial, is responsible for providing transfer agency services to the Fund. The Transfer Agent has contracted with Boston Financial Data Services (BFDS) to serve as sub-transfer agent.
The Transfer Agent receives monthly account-based service fees based on the number of open accounts and also receives sub-transfer agency fees based on a percentage of the average aggregate value of the Fund's shares maintained in omnibus accounts (other than omnibus accounts for which American Enterprise Investment Services Inc. is the broker of record or accounts where the beneficial shareholder is a customer of Ameriprise Financial Services, Inc., which are paid a per account fee). The Transfer Agent pays the fees of BFDS for services as sub-transfer agent and is not entitled to reimbursement for such fees from the Fund (with the exception of out-of-pocket fees).
The Transfer Agent also receives compensation from fees for various shareholder services and reimbursements for certain out-of-pocket fees. Total transfer agent fees for Class R5 shares are subject to an annual limitation of not more than 0.05% of the average daily net assets attributable to Class R5 shares. Class I and Class Y shares are not subject to transfer agent fees.
Annual Report 2014
43
Columbia Corporate Income Fund
Notes to Financial Statements (continued)
April 30, 2014
For the year ended April 30, 2014, the Fund's effective transfer agent fee rates as a percentage of average daily net assets of each class were as follows:
Class A | | | 0.19 | % | |
Class B | | | 0.19 | | |
Class C | | | 0.19 | | |
Class R4 | | | 0.20 | | |
Class R5 | | | 0.05 | | |
Class W | | | 0.19 | | |
Class Z | | | 0.19 | | |
An annual minimum account balance fee of $20 may apply to certain accounts with a value below the applicable share class's initial minimum investment requirements to reduce the impact of small accounts on transfer agent fees. These minimum account balance fees are recorded as part of expense reductions in the Statement of Operations. For the year ended April 30, 2014, these minimum account balance fees reduced total expenses by $2,217.
Distribution and Service Fees
The Fund has an agreement with Columbia Management Investment Distributors, Inc. (the Distributor), an affiliate of the Investment Manager and a wholly-owned subsidiary of Ameriprise Financial, for distribution and shareholder services. The Board has approved, and the Fund has adopted, distribution and shareholder service plans (the Plans) applicable to certain share classes, which set the distribution and service fees for the Fund. These fees are calculated daily and are intended to compensate the Distributor and/or eligible selling and/or servicing agents for selling shares of the Fund and providing services to investors.
Under the Plans, the Fund pays a monthly service fee to the Distributor at the maximum annual rate of 0.25% of the average daily net assets attributable to Class A, Class B, Class C and Class W shares of the Fund. Also under the Plans, the Fund pays a monthly distribution fee to the Distributor at the maximum annual rates of 0.75%, 0.75% and 0.25% of the average daily net assets attributable to Class B, Class C and Class W shares, respectively.
The Distributor has voluntarily agreed to waive a portion of the distribution fee for Class C shares so that the distribution fee does not exceed 0.60% annually of the average daily net assets attributable to Class C shares. This arrangement may be modified or terminated by the Distributor at any time.
Although the Fund may pay a distribution fee up to 0.25% of the Fund's average daily net assets attributable to Class W shares and a service fee of up to 0.25% of the Fund's average daily net assets attributable to Class W shares, the aggregate
fee shall not exceed 0.25% of the Fund's average daily net assets attributable to Class W shares.
Sales Charges
Sales charges, including front-end charges and CDSCs, received by the Distributor for distributing Fund shares were $136,295 for Class A, $916 for Class B and $4,582 for Class C shares for the year ended April 30, 2014.
Expenses Waived/Reimbursed by the Investment Manager and its Affiliates
The Investment Manager and certain of its affiliates have contractually agreed to waive fees and/or reimburse expenses (excluding certain fees and expenses described below) for the period disclosed below, unless sooner terminated at the sole discretion of the Board, so that the Fund's net operating expenses, after giving effect to fees waived/expenses reimbursed and any balance credits and/or overdraft charges from the Fund's custodian, do not exceed the following annual rates as a percentage of the class' average daily net assets:
| | | Fee Rates Contractual
through
August 31, 2014 | |
Class A | | | 0.96 | % | |
Class B | | | 1.71 | | |
Class C | | | 1.71 | | |
Class I | | | 0.58 | | |
Class R4 | | | 0.71 | | |
Class R5 | | | 0.63 | | |
Class W | | | 0.96 | | |
Class Y | | | 0.58 | | |
Class Z | | | 0.71 | | |
Under the agreement governing these fee waivers and/or expense reimbursement arrangements, the following fees and expenses are excluded from the waiver/reimbursement commitment, and therefore will be paid by the Fund, if applicable: taxes (including foreign transaction taxes), expenses associated with investments in affiliated and non-affiliated pooled investment vehicles (including mutual funds and exchange-traded funds), transaction costs and brokerage commissions, costs related to any securities lending program, dividend expenses associated with securities sold short, inverse floater program fees and expenses, transaction charges and interest on borrowed money, interest, extraordinary expenses and any other expenses the exclusion of which is specifically approved by the Board. This agreement may be modified or amended only with approval from all parties. Class C distribution fees waived by the Distributor, as discussed above, are in addition to the waiver/reimbursement commitment under the agreement.
Annual Report 2014
44
Columbia Corporate Income Fund
Notes to Financial Statements (continued)
April 30, 2014
Note 4. Federal Tax Information
The timing and character of income and capital gain distributions are determined in accordance with income tax regulations, which may differ from GAAP because of temporary or permanent book to tax differences.
At April 30, 2014, these differences are primarily due to differing treatment for principal and/or interest of fixed income securities, deferral/reversal of wash sales losses, Trustees' deferred compensation, distribution reclassifications, post-October capital losses, derivative investments and tax straddles. To the extent these differences are permanent, reclassifications are made among the components of the Fund's net assets in the Statement of Assets and Liabilities. Temporary differences do not require reclassifications. In the Statement of Assets and Liabilities the following reclassifications were made:
Excess of distributions over net investment income | | $ | (15,562 | ) | |
Accumulated net realized loss | | | 15,562 | | |
Net investment income and net realized gains (losses), as disclosed in the Statement of Operations, and net assets were not affected by this reclassification.
The tax character of distributions paid during the years indicated was as follows:
Year Ended April 30, | | 2014 | | 2013 | |
Ordinary income | | $ | 55,554,846 | | | $ | 69,520,539 | �� | |
Long-term capital gains | | | 34,421,736 | | | | 9,734,696 | | |
Total | | $ | 89,976,582 | | | $ | 79,255,235 | | |
Short-term capital gain distributions, if any, are considered ordinary income distributions for tax purposes.
At April 30, 2014, the components of distributable earnings on a tax basis were as follows:
Undistributed ordinary income | | $ | 3,487,304 | | |
Undistributed long-term capital gains | | | 3,429 | | |
Net unrealized appreciation | | $ | 27,941,366 | | |
At April 30, 2014, the cost of investments for federal income tax purposes was $1,366,405,412 and the aggregate gross unrealized appreciation and depreciation based on that cost was:
Unrealized appreciation | | $ | 39,002,769 | | |
Unrealized depreciation | | | (11,061,403 | ) | |
Net unrealized appreciation/depreciation | | $ | 27,941,366 | | |
Under current tax rules, regulated investment companies can elect to treat certain late-year ordinary losses incurred and post-October capital losses (capital losses realized after October 31) as arising on the first day of the following taxable
year. As of April 30, 2014, the Fund will elect to treat post-October capital losses of $5,672,670 as arising on May 1, 2014.
Management of the Fund has concluded that there are no significant uncertain tax positions that would require recognition in the financial statements. However, management's conclusion may be subject to review and adjustment at a later date based on factors including, but not limited to, new tax laws, regulations, and administrative interpretations (including relevant court decisions). Generally, the Fund's federal tax returns for the prior three fiscal years remain subject to examination by the Internal Revenue Service.
Note 5. Portfolio Information
The cost of purchases and proceeds from sales of securities, excluding short-term obligations, aggregated to $1,407,560,889 and $1,430,664,043, respectively, for the year ended April 30, 2014, of which $234,898,369 and $197,959,776, respectively, were U.S. government securities.
Note 6. Affiliated Money Market Fund
The Fund invests its daily cash balances in Columbia Short-Term Cash Fund, an affiliated money market fund established for the exclusive use by the Fund and other affiliated funds. The income earned by the Fund from such investments is included as "Dividends — affiliated issuers" in the Statement of Operations. As an investing fund, the Fund indirectly bears its proportionate share of the expenses of Columbia Short-Term Cash Fund.
Note 7. Shareholder Concentration
At April 30, 2014, one unaffiliated shareholder of record owned 17.0% of the outstanding shares of the Fund in one or more accounts. The Fund has no knowledge about whether any portion of those shares was owned beneficially. Affiliated shareholders of record owned 65.2% of the outstanding shares of the Fund in one or more accounts. Subscription and redemption activity by concentrated accounts may have a significant effect on the operations of the Fund.
Note 8. Line of Credit
The Fund has entered into a revolving credit facility with a syndicate of banks led by JPMorgan Chase Bank N.A. whereby the Fund may borrow for the temporary funding of shareholder redemptions or for other temporary or emergency purposes. The credit facility agreement, as amended, which is a collective agreement between the Fund and certain other funds managed by the Investment Manager, severally and not jointly, permits collective borrowings up to $500 million. Interest is charged to each participating fund based on its
Annual Report 2014
45
Columbia Corporate Income Fund
Notes to Financial Statements (continued)
April 30, 2014
borrowings at a rate equal to the higher of (i) the overnight federal funds rate plus 1.00% or (ii) the one-month LIBOR rate plus 1.00%. Each borrowing under the credit facility matures no later than 60 days after the date of borrowing. Effective December 10, 2013, the Fund also pays a commitment fee equal to its pro rata share of the amount of the credit facility at a rate of 0.075% per annum. Prior to December 10, 2013, the commitment fee was charged at the annual rate of 0.08% per annum. The commitment fee is included in other expenses in the Statement of Operations.
The Fund had no borrowings during the year ended April 30, 2014.
Note 9. Subsequent Events
Management has evaluated the events and transactions that have occurred through the date the financial statements were issued and noted no items requiring adjustment of the financial statements or additional disclosure.
Note 10. Information Regarding Pending and Settled Legal Proceedings
In December 2005, without admitting or denying the allegations, American Express Financial Corporation (AEFC, which is now known as Ameriprise Financial, Inc. (Ameriprise Financial)) entered into settlement agreements with the Securities and Exchange Commission (SEC) and Minnesota Department of Commerce (MDOC) related to market timing activities. As a result, AEFC was censured and ordered to cease and desist from committing or causing any violations of certain provisions of the Investment Advisers Act of 1940, the Investment Company Act of 1940, and various Minnesota laws. AEFC agreed to pay disgorgement of $10 million and civil money penalties of $7 million. AEFC also agreed to retain an independent distribution consultant to assist in developing a plan for distribution of all disgorgement and civil penalties ordered by the SEC in accordance with various undertakings detailed at www.sec.gov/litigation/admin/ia-2451.pdf. Ameriprise Financial and its affiliates have cooperated with the SEC and the MDOC in these legal proceedings, and have made regular reports to the Funds' Boards of Trustees.
Ameriprise Financial and certain of its affiliates have historically been involved in a number of legal, arbitration and regulatory proceedings, including routine litigation, class actions, and governmental actions, concerning matters arising in connection with the conduct of their business activities. Ameriprise Financial believes that the Funds are not currently the subject of, and that neither Ameriprise Financial nor any of its affiliates are the subject of, any pending legal, arbitration or regulatory proceedings that are likely to have a material adverse effect on the Funds or the ability of Ameriprise
Financial or its affiliates to perform under their contracts with the Funds. Ameriprise Financial is required to make 10-Q, 10-K and, as necessary, 8-K filings with the Securities and Exchange Commission on legal and regulatory matters that relate to Ameriprise Financial and its affiliates. Copies of these filings may be obtained by accessing the SEC website at www.sec.gov.
There can be no assurance that these matters, or the adverse publicity associated with them, will not result in increased fund redemptions, reduced sale of fund shares or other adverse consequences to the Funds. Further, although we believe proceedings are not likely to have a material adverse effect on the Funds or the ability of Ameriprise Financial or its affiliates to perform under their contracts with the Funds, these proceedings are subject to uncertainties and, as such, we are unable to estimate the possible loss or range of loss that may result. An adverse outcome in one or more of these proceedings could result in adverse judgments, settlements, fines, penalties or other relief that could have a material adverse effect on the consolidated financial condition or results of operations of Ameriprise Financial.
Annual Report 2014
46
Columbia Corporate Income Fund
Report of Independent Registered Public Accounting Firm
To the Trustees of Columbia Funds Series Trust I and the Shareholders of
Columbia Corporate Income Fund
In our opinion, the accompanying statement of assets and liabilities, including the portfolio of investments, and the related statements of operations and of changes in net assets and the financial highlights present fairly, in all material respects, the financial position of Columbia Corporate Income Fund (the "Fund", a series of Columbia Funds Series Trust I) at April 30, 2014, and the results of its operations, the changes in its net assets and the financial highlights for each of the periods indicated, in conformity with accounting principles generally accepted in the United States of America. These financial statements and financial highlights (hereafter referred to as "financial statements") are the responsibility of the Fund's management; our responsibility is to express an opinion on these financial statements based on our audits. We conducted our audits of these financial statements in accordance with the standards of the Public Company Accounting Oversight Board (United States). Those standards require that we plan and perform the audit to obtain reasonable assurance about whether the financial statements are free of material misstatement. An audit includes examining, on a test basis, evidence supporting the amounts and disclosures in the financial statements, assessing the accounting principles used and significant estimates made by management, and evaluating the overall financial statement presentation. We believe that our audits, which included confirmation of securities at April 30, 2014 by correspondence with the custodian, brokers, agent banks, and transfer agent, and the application of alternative auditing procedures where such confirmations had not been received, provide a reasonable basis for our opinion.
PricewaterhouseCoopers LLP
Minneapolis, Minnesota
June 20, 2014
Annual Report 2014
47
Columbia Corporate Income Fund
Federal Income Tax Information
(Unaudited)
The Fund hereby designates the following tax attributes for the fiscal year ended April 30, 2014. Shareholders will be notified in early 2015 of the amounts for use in preparing 2014 income tax returns.
Tax Designations:
Capital Gain Dividend | | $ | 10,271,371 | | |
Capital Gain Dividend. The Fund designates as a capital gain dividend the amount reflected above, or if subsequently determined to be different, the net capital gain of such fiscal period. The Fund also designates as capital gain dividends, to the extent necessary to fully distribute such capital gains, earnings and profits distributed to shareholders on the redemption of shares.
Annual Report 2014
48
Columbia Corporate Income Fund
The Trustees serve terms of indefinite duration. The names, addresses and birth years of the Trustees and Officers of the Funds in Columbia Funds Series Trust I, the year each was first elected or appointed to office, their principal business occupations during at least the last five years, the number of Funds overseen by each Trustee and other directorships they hold are shown below. Each officer listed below serves as an officer of each Fund in Columbia Funds Series Trust I.
Independent Trustees
Name, Address and Year of Birth,
Position with Funds, Year First
Elected or Appointed to Office | | Principal Occupation(s) During Past Five Years, Number of Funds in Columbia
Funds Complex Overseen by Trustee, Other Directorships Held | |
Rodman L. Drake (Born 1943)
c/o Columbia Management
Investment Advisers, LLC
225 Franklin Street
Boston, MA 02110
Trustee (since 1994) and
Chairman of the Board (since 2009) | | Independent consultant since 2010; Co-Founder of Baringo Capital LLC (private equity) from 1997 to 2008; Chairman (from 2003 to 2010) and CEO (from 2008 to 2010) of Crystal River Capital, Inc. (real estate investment trust); Oversees 54; Jackson Hewitt Tax Service Inc. (tax preparation services) from 2004 to 2011; Student Loan Corporation (student loan provider) from 2005 to 2010; Celgene Corporation (global biotechnology company); The Helios Funds and Brookfield Funds (closed-end funds); Chimerix, Inc. (biopharmaceutical company) since August 1, 2013; Crystal River Capital, Inc. from 2005 to 2010; Parsons Brinckerhoff from 1995 to 2008; and Apex Silver Mines Ltd. from 2007 to 2009 | |
Douglas A. Hacker (Born 1955)
c/o Columbia Management
Investment Advisers, LLC
225 Franklin Street
Boston, MA 02110
Trustee (since 1996) | | Independent business executive since May 2006; Executive Vice President — Strategy of United Airlines from December 2002 to May 2006; President of UAL Loyalty Services (airline marketing company) from September 2001 to December 2002; Executive Vice President and Chief Financial Officer of United Airlines from July 1999 to September 2001. Oversees 54; Nash Finch Company (food distributor); Aircastle Limited (aircraft leasing); and SeaCube Container Leasing Ltd. (container leasing) | |
Janet Langford Kelly (Born 1957)
c/o Columbia Management
Investment Advisers, LLC
225 Franklin Street
Boston, MA 02110
Trustee (since 1996) | | Senior Vice President, General Counsel and Corporate Secretary, ConocoPhillips (integrated energy company) since September 2007; Deputy General Counsel — Corporate Legal Services, ConocoPhillips from August 2006 to August 2007; Partner, Zelle, Hofmann, Voelbel, Mason & Gette LLP (law firm) from March 2005 to July 2006; Adjunct Professor of Law, Northwestern University from September 2004 to June 2006; Director, UAL Corporation (airline) from February 2006 to July 2006; Chief Administrative Officer and Senior Vice President, Kmart Holding Corporation (consumer goods) from September 2003 to March 2004. Oversees 54; None | |
Nancy T. Lukitsh (Born 1956)
c/o Columbia Management
Investment Advisers, LLC
225 Franklin Street
Boston, MA 02110
Trustee (since 2011) | | Senior Vice President, Partner and Director of Marketing, Wellington Management Company, LLP (investment adviser) from 1997 to 2010; Chair, Wellington Management Investment Portfolios (commingled non-U.S. investment pools) from 2007 to 2010; Director, Wellington Trust Company, NA and other Wellington affiliates from 1997 to 2010. Oversees 54; None | |
William E. Mayer (Born 1940)
c/o Columbia Management
Investment Advisers, LLC
225 Franklin Street
Boston, MA 02110
Trustee (since 1994) | | Partner, Park Avenue Equity Partners (private equity) since February 1999; Dean and Professor, College of Business and Management, University of Maryland from 1992 to 1996. Oversees 54; DynaVox Inc. (speech creation); Lee Enterprises (print media); WR Hambrecht + Co. (financial service provider) from 2000 to 2012; BlackRock Kelso Capital Corporation (investment company) | |
David M. Moffett (Born 1952)
c/o Columbia Management
Investment Advisers, LLC
225 Franklin Street
Boston, MA 02110
Trustee (since 2011) | | Retired. Chief Executive Officer, Federal Home Loan Mortgage Corporation, from 2008 to 2009; Senior Adviser, Global Financial Services Group, Carlyle Group, Inc., from 2007 to 2008; Vice Chairman and Chief Financial Officer, U.S. Bancorp, from 1993 to 2007. Oversees 54; CIT Group Inc. (commercial and consumer finance); eBay Inc. (online trading community); MBIA Inc. (financial service provider); E.W. Scripps Co. (print and television media), Building Materials Holding Corp. (building materials and construction services); Genworth Financial, Inc. (financial and insurance products and services); and University of Oklahoma Foundation | |
Charles R. Nelson (Born 1942)
c/o Columbia Management
Investment Advisers, LLC
225 Franklin Street
Boston, MA 02110
Trustee (since 1981) | | Retired. Professor Emeritus, University of Washington, since 2011; Professor of Economics, University of Washington from 1976 to 2011; Ford and Louisa Van Voorhis Professor of Political Economy, University of Washington from 1993 to 2011; Adjunct Professor of Statistics, University of Washington from 1980 to 2011; Associate Editor, Journal of Money, Credit and Banking from September 1993 to 2008; consultant on econometric and statistical matters. Oversees 54; None | |
John J. Neuhauser (Born 1943)
c/o Columbia Management
Investment Advisers, LLC
225 Franklin Street
Boston, MA 02110
Trustee (since 1984) | | President, Saint Michael's College, since August 2007; Director or Trustee of several non-profit organizations, including Fletcher Allen Health Care, Inc.; University Professor, Boston College from November 2005 to August 2007; Academic Vice President and Dean of Faculties, Boston College from August 1999 to October 2005. Oversees 54; Liberty All-Star Equity Fund and Liberty All-Star Growth Fund (closed-end funds) | |
Annual Report 2014
49
Columbia Corporate Income Fund
Trustees and Officers (continued)
Independent Trustees (continued)
Name, Address and Year of Birth,
Position with Funds, Year First
Elected or Appointed to Office | | Principal Occupation(s) During Past Five Years, Number of Funds in Columbia
Funds Complex Overseen by Trustee, Other Directorships Held | |
Patrick J. Simpson (Born 1944)
c/o Columbia Management
Investment Advisers, LLC
225 Franklin Street
Boston, MA 02110
Trustee (since 2000) | | Partner, Perkins Coie LLP (law firm). Oversees 54; None | |
Anne-Lee Verville (Born 1945)
c/o Columbia Management
Investment Advisers, LLC
225 Franklin Street
Boston, MA 02110
Trustee (since 1998) | | Retired. General Manager — Global Education Industry from 1994 to 1997, President — Application Systems Division from 1991 to 1994, Chief Financial Officer — US Marketing & Services from 1988 to 1991, and Chief Information Officer from 1987 to 1988, IBM Corporation (computer and technology). Oversees 54; Enesco Group, Inc. (producer of giftware and home and garden decor products) from 2001 to 2006 | |
Interested Trustee
Name, Address and Year of Birth,
Position with Funds, Year First
Elected or Appointed to Office | | Principal Occupation(s) During Past Five Years, Number of Funds in Columbia
Funds Complex Overseen by Trustee, Other Directorships Held | |
William F. Truscott (born 1960)
53600 Ameriprise Financial Center
Minneapolis, MN 55474
Senior Vice President (since 2012) | | Chairman of the Board and President, Columbia Management Investment Advisers, LLC since May 2010 and February 2012 (previously President and Chief Investment Officer, from 2001 to April 2010); Chief Executive Officer, Global Asset Management, Ameriprise Financial, Inc. since September 2012 (previously, Chief Executive Officer, U.S. Asset Management & President, Annuities, from May 2010 to September 2012 and President — U.S. Asset Management and Chief Investment Officer from 2005 to April 2010); Director and Chief Executive Officer, Columbia Management Investment Distributors, Inc. since May 2010 and February 2012, respectively (previously Chairman of the Board and Chief Executive Officer from 2006 to April 2010); Chairman of the Board and Chief Executive Officer, RiverSource Distributors, Inc. since 2006; President and Chief Executive Officer, Ameriprise Certificate Company, 2006 to August 2012; Oversees 186; Director, Ameriprise Certificate Company, 2006-January 2013 | |
The Statement of Additional Information has additional information about the Fund's Board members and is available, without charge, upon request by calling 800.345.6611; contacting your financial intermediary; or visiting columbiamanagement.com.
The Board has appointed officers who are responsible for day-to-day business decisions based on policies it has established. The officers serve at the pleasure of the Board. In addition to Mr. Truscott, who is Senior Vice President, the Funds' other officers are:
Officers
Name,
Address and
Year of Birth | | Position and Year
First Appointed to
Position for any Fund
in the Columbia
Funds Complex or a
Predecessor Thereof | | Principal Occupation(s) During Past Five Years | |
J. Kevin Connaughton
225 Franklin Street
Boston, MA 02110
Born 1964 | | President and Principal Executive Officer (2009) | | Senior Vice President and General Manager — Mutual Fund Products, Columbia Management Investment Advisers, LLC, since May 2010; and President, Columbia Funds since 2009; previously, Managing Director, Columbia Management Advisors, LLC, from December 2004 to April 2010; Senior Vice President and Chief Financial Officer, Columbia Funds, from June 2008 to January 2009; and senior officer of Columbia Funds and affiliated funds since 2003. | |
Michael G. Clarke
225 Franklin Street
Boston, MA 02110
Born 1969 | | Treasurer (2011) and Chief Financial Officer (2009) | | Vice President, Columbia Management Investment Advisers, LLC, since May 2010; previously, Managing Director of Fund Administration, Columbia Management Advisors, LLC, from September 2004 to April 2010; and senior officer of Columbia Funds and affiliated funds since 2002. | |
Annual Report 2014
50
Columbia Corporate Income Fund
Trustees and Officers (continued)
Officers (continued)
Name,
Address and
Year of Birth | | Position and Year
First Appointed to
Position for any Fund
in the Columbia
Funds Complex or a
Predecessor Thereof | | Principal Occupation(s) During Past Five Years | |
Scott R. Plummer
5228 Ameriprise
Financial Center
Minneapolis, MN 55474
Born 1959 | | Senior Vice President (2006), Chief Legal Officer (2006) and Assistant Secretary (2011) | | Senior Vice President, Chief Legal Officer and Assistant Secretary, Columbia Management Investment Advisers, LLC, since June 2005; Senior Vice President and Lead Chief Counsel — Asset Management, Ameriprise Financial, Inc., since May 2010 (previously, Vice President and Chief Counsel — Asset Management, from 2005 to April 2010); Vice President, Chief Counsel and Assistant Secretary, Columbia Management Investment Distributors, Inc., since 2008; Vice President, General Counsel and Secretary, Ameriprise Certificate Company, since 2005; Chief Counsel, RiverSource Distributors, Inc., since 2006; and senior officer of Columbia Funds and affiliated funds since 2006. | |
Thomas P. McGuire
225 Franklin Street
Boston, MA 02110
Born 1972 | | Chief Compliance Officer (2012) | | Vice President — Asset Management Compliance, Ameriprise Financial, Inc., since May 2010; Chief Compliance Officer, Ameriprise Certificate Company, since September 2010; Compliance Executive, Bank of America, from 2005 to April 2010. | |
Colin Moore
225 Franklin Street
Boston, MA 02110
Born 1958 | | Senior Vice President (2010) | | Executive Vice President and Global Chief Investment Officer, Ameriprise Financial, Inc., since July 2013; Director and Global Chief Investment Officer, Columbia Management Investment Advisers, LLC, since May 2010; previously, Manager, Managing Director and Chief Investment Officer, Columbia Management Advisors, LLC, from 2007 to April 2010. | |
Michael E. DeFao
225 Franklin Street
Boston, MA 02110
Born 1968 | | Vice President (2011) and Assistant Secretary (2010) | | Vice President and Chief Counsel, Ameriprise Financial, Inc., since May 2010; Associate General Counsel, Bank of America from 2005 to April 2010. | |
Joseph F. DiMaria
225 Franklin Street
Boston, MA 02110
Born 1968 | | Vice President (2011) and Chief Accounting Officer (2008) | | Vice President — Mutual Fund Administration, Columbia Management Investment Advisers, LLC, since May 2010; previously, Director of Fund Administration, Columbia Management Advisors, LLC, from 2006 to April 2010. | |
Paul B. Goucher
100 Park Avenue
New York, NY 10017
Born 1968 | | Vice President (2011) and Assistant Secretary (2008) | | Vice President and Lead Chief Counsel, Ameriprise Financial, Inc., since November 2008 and January 2013, respectively (previously, Chief Counsel, from January 2010 to January 2013, and Group Counsel from November 2008 to January 2010); previously, Director, Managing Director and General Counsel, J. & W. Seligman & Co. Incorporated, from July 2008 to November 2008. | |
Amy Johnson
5228 Ameriprise
Financial Center
Minneapolis, MN
Born 1965 | | Vice President (2006) | | Senior Vice President and Chief Operating Officer, Columbia Management Investment Advisers, LLC, since May 2010; previously, Chief Administrative Officer, from 2009 to April 2010, and Vice President — Asset Management and Trust Company Services, from 2006 to 2009. | |
Paul D. Pearson
5228 Ameriprise
Financial Center
Minneapolis, MN
Born 1956 | | Vice President (2011) and Assistant Treasurer (1999) | | Vice President — Investment Accounting, Columbia Management Investment Advisers, LLC, since May 2010; previously, Vice President — Managed Assets, Investment Accounting, Ameriprise Financial, Inc. from 1998 to April 2010. | |
Christopher O. Petersen
5228 Ameriprise
Financial Center
Minneapolis, MN 55474
Born 1970 | | Vice President and Secretary (2010) | | Vice President and Chief Counsel, Ameriprise Financial, Inc., since January 2010 (previously, Vice President and Group Counsel or Counsel from 2004 to January 2010); officer of Columbia Funds and affiliated funds since 2007. | |
Stephen T. Welsh
225 Franklin Street
Boston, MA 02110
Born 1957 | | Vice President (2006) | | President and Director, Columbia Management Investment Services Corp., since May 2010; previously, President and Director, Columbia Management Services, Inc., from 2004 to April 2010; and Managing Director, Columbia Management Distributors, Inc., from 2007 to April 2010. | |
Annual Report 2014
51
This page intentionally left blank.
Annual Report 2014
52
Columbia Corporate Income Fund
Important Information About This Report
Each fund mails one shareholder report to each shareholder address. If you would like more than one report, please call shareholder services at 800.345.6611 and additional reports will be sent to you.
The policy of the Board is to vote the proxies of the companies in which each fund holds investments consistent with the procedures as stated in the Statement of Additional Information (SAI). You may obtain a copy of the SAI without charge by calling 800.345.6611; contacting your financial intermediary; visiting columbiamanagement.com; or searching the website of the Securities and Exchange Commission (SEC) at sec.gov. Information regarding how each fund voted proxies relating to portfolio securities is filed with the SEC by August 31 for the most recent 12-month period ending June 30 of that year, and is available without charge by visiting columbiamanagement.com; or searching the website of the SEC at sec.gov.
Each fund files a complete schedule of portfolio holdings with the SEC for the first and third quarters of each fiscal year on Form N-Q. Each fund's Form N-Q is available on the SEC's website at sec.gov and may be reviewed and copied at the SEC's Public Reference Room in Washington, D.C. Information on the operation of the Public Reference Room may be obtained by calling 800.SEC.0330. Each fund's complete schedule of portfolio holdings, as filed on Form N-Q, can also be obtained without charge, upon request, by calling 800.345.6611.
Annual Report 2014
53

Columbia Corporate Income Fund
P.O. Box 8081
Boston, MA 02266-8081
columbiamanagement.com
This information is for use with concurrent or prior delivery of a fund prospectus. Please read and consider the investment objectives, risks, charges and expenses for any fund carefully before investing. For a prospectus and, if available, a summary prospectus, which contains this and other important information about the Fund go to columbiamanagement.com. The Fund is distributed by Columbia Management Investment Distributors, Inc., member FINRA, and managed by Columbia Management Investment Advisers, LLC.
© 2014 Columbia Management Investment Advisers, LLC. All rights reserved.
ANN136_04_D01_(06/14)
Annual Report
April 30, 2014

Not FDIC insured • No bank guarantee • May lose value
 Dear Shareholders,
Continued Economic Recovery
The U.S. economy continued to recover at a slow but steady pace during the first quarter of 2014, supported by solid manufacturing activity, reasonable job growth and continued gains for the housing market. Industrial production was robust, buoyed by strong demand for autos and related parts. After a disappointing January, job growth picked up, which helped boost consumer confidence. Housing data was somewhat mixed, as harsh weather and higher mortgage rates put a damper on sales, while lower inventories helped prices trend higher. The Federal Reserve (the Fed) announced further reductions to its monthly asset purchases and reassured the markets that it would not make any significant changes to monetary policy until it was satisfied that the labor market was on solid ground. Despite mostly good news on the economic front, the broad financial markets recorded only modest gains, as bitter winter weather at home and mounting tensions between Russia and Western allies prompted investor caution.
Investors braced for higher interest rates, but long-term yields declined and the fixed-income markets were surprisingly resilient in the face of stable-to-improving economic data. Risk-on trading continued during the quarter as the higher yielding sectors of the fixed-income markets generally fared well. Emerging-market bonds, long-term U.S. Treasuries and sovereign debt were among the strongest performers, as were Treasury Inflation Protected Securities. Municipal bonds delivered solid gains, especially high-yield municipals, which benefited from continued improvement in state finances.
Against this backdrop, the broad bond market, as measured by the Barclays U.S. Aggregate Bond Index, edged out the broad stock market, as measured by the Standard & Poor's 500 Index, with gains of 1.84% vs. 1.81%, respectively. As indicated late last year, the Fed began tapering its monthly asset purchase program and announced further reductions. New Fed chair Janet Yellen reassured investors the Fed was committed to keeping short-term borrowing rates low into 2015.
Stay on Track with Columbia Management
Backed by more than 100 years of experience, Columbia Management is one of the nation's largest asset managers. At the heart of our success and, most importantly, that of our investors, are highly talented industry professionals, brought together by a unique way of working. At Columbia Management, reaching our performance goals matters, and how we reach them matters just as much.
Visit columbiamanagement.com for:
> The Columbia Management Perspectives blog, offering insights on current market events and investment opportunities
> Detailed up-to-date fund performance and portfolio information
> Quarterly fund commentaries
> Columbia Management investor, our award-winning quarterly newsletter for shareholders
Thank you for your continued support of the Columbia Funds. We look forward to serving your investment needs for many years to come.
Best Regards,

J. Kevin Connaughton
President, Columbia Funds
Investing involves risk including the risk of loss of principal.
The Barclays U.S. Aggregate Bond Index is a broad-based benchmark that measures the investment grade, U.S. dollar denominated, fixed-rate taxable bond market, including Treasuries, government-related and corporate securities, mortgage-backed securities (agency fixed-rate and hybrid adjustable-rate mortgage passthroughs), asset-backed securities, and commercial mortgage-backed securities. The S&P 500 Index, an unmanaged index, measures the performance of 500 widely held, large-capitalization U.S. stocks and is frequently used as a general measure of market performance. Indices are not available for investment, are not professionally managed and do not reflect sales charges, fees, brokerage commissions, taxes or other expenses of investing.
Investors should consider the investment objectives, risks, charges and expenses of a mutual fund carefully before investing. For a free prospectus and, if available, a summary prospectus, which contains this and other important information about a fund, visit columbiamanagement.com. The prospectus should be read carefully before investing.
Columbia Funds are distributed by Columbia Management Investment Distributors, Inc., member FINRA, and managed by Columbia Management Investment Advisers, LLC.
© 2014 Columbia Management Investment Advisers, LLC. All rights reserved.
Performance Overview | | | 2 | | |
Manager Discussion of Fund Performance | | | 4 | | |
Understanding Your Fund's Expenses | | | 6 | | |
Portfolio of Investments | | | 7 | | |
Statement of Assets and Liabilities | | | 22 | | |
Statement of Operations | | | 24 | | |
Statement of Changes in Net Assets | | | 25 | | |
Financial Highlights | | | 28 | | |
Notes to Financial Statements | | | 39 | | |
Report of Independent Registered
Public Accounting Firm | | | 51 | | |
Federal Income Tax Information | | | 52 | | |
Trustees and Officers | | | 53 | | |
Important Information About This Report | | | 57 | | |
Fund Investment Manager
Columbia Management Investment
Advisers, LLC
225 Franklin Street
Boston, MA 02110
Fund Distributor
Columbia Management Investment
Distributors, Inc.
225 Franklin Street
Boston, MA 02110
Fund Transfer Agent
Columbia Management Investment
Services Corp.
P.O. Box 8081
Boston, MA 02266-8081
For more information about any of the funds, please visit columbiamanagement.com or call 800.345.6611. Customer Service Representatives are available to answer your questions Monday through Friday from 8 a.m. to 7 p.m. Eastern time.
The views expressed in this report reflect the current views of the respective parties. These views are not guarantees of future performance and involve certain risks, uncertainties and assumptions that are difficult to predict, so actual outcomes and results may differ significantly from the views expressed. These views are subject to change at any time based upon economic, market or other conditions and the respective parties disclaim any responsibility to update such views. These views may not be relied on as investment advice and, because investment decisions for a Columbia Fund are based on numerous factors, may not be relied on as an indication of trading intent on behalf of any particular Columbia Fund. References to specific securities should not be construed as a recommendation or investment advice.
Performance Summary
> Columbia Bond Fund (the Fund) Class A shares returned -1.42% excluding sales charges for 12-month period that ended April 30, 2014.
> The Fund underperformed its benchmark, the Barclays U.S. Aggregate Bond Index, which returned -0.26% for the same time period.
> An overweight in 10-year bonds and the Fund's position in mortgage securities detracted from results during the period.
Average Annual Total Returns (%) (for period ended April 30, 2014)
| | Inception | | 1 Year | | 5 Years | | 10 Years | |
Class A* | | 03/31/08 | | | | | | | | | | | | | |
Excluding sales charges | | | | | | | -1.42 | | | | 4.99 | | | | 4.39 | | |
Including sales charges | | | | | | | -6.08 | | | | 3.98 | | | | 3.88 | | |
Class B* | | 03/07/11 | | | | | | | | | | | | | |
Excluding sales charges | | | | | | | -2.15 | | | | 4.19 | | | | 3.62 | | |
Including sales charges | | | | | | | -6.83 | | | | 3.85 | | | | 3.62 | | |
Class C* | | 03/31/08 | | | | | | | | | | | | | |
Excluding sales charges | | | | | | | -2.01 | | | | 4.29 | | | | 3.68 | | |
Including sales charges | | | | | | | -2.94 | | | | 4.29 | | | | 3.68 | | |
Class I* | | 09/27/10 | | | -0.98 | | | | 5.34 | | | | 4.71 | | |
Class R* | | 11/16/11 | | | -1.66 | | | | 4.62 | | | | 4.00 | | |
Class R4* | | 11/08/12 | | | -1.18 | | | | 5.23 | | | | 4.66 | | |
Class R5* | | 11/08/12 | | | -1.10 | | | | 5.26 | | | | 4.67 | | |
Class T* | | 03/07/11 | | | | | | | | | | | | | |
Excluding sales charges | | | | | | | -1.32 | | | | 5.08 | | | | 4.51 | | |
Including sales charges | | | | | | | -5.99 | | | | 4.06 | | | | 4.00 | | |
Class W* | | 09/27/10 | | | -1.40 | | | | 5.00 | | | | 4.42 | | |
Class Y* | | 07/15/09 | | | -0.99 | | | | 5.33 | | | | 4.71 | | |
Class Z | | 01/09/86 | | | -1.17 | | | | 5.23 | | | | 4.66 | | |
Barclays U.S. Aggregate Bond Index | | | | | | | -0.26 | | | | 4.88 | | | | 4.83 | | |
Returns for Class A and Class T are shown with and without the maximum initial sales charge of 4.75%. Returns for Class B are shown with and without the applicable contingent deferred sales charge (CDSC) of 5.00% in the first year, declining to 1.00% in the sixth year and eliminated thereafter. Returns for Class C are shown with and without the 1.00% CDSC for the first year only. The Fund's other classes are not subject to sales charges and have limited eligibility. Please see the Fund's prospectus for details. Performance for different share classes will vary based on differences in sales charges and fees associated with each class. All results shown assume reinvestment of distributions during the period. Returns do not reflect the deduction of taxes that a shareholder may pay on Fund distributions or on the redemption of Fund shares. Performance results reflect the effect of any fee waivers or reimbursements of Fund expenses by Columbia Management Investment Advisers, LLC and/or any of its affiliates. Absent these fee waivers or expense reimbursement arrangements, performance results would have been lower.
The performance information shown represents past performance and is not a guarantee of future results. The investment return and principal value of your investment will fluctuate so that your shares, when redeemed, may be worth more or less than their original cost. Current performance may be lower or higher than the performance information shown. You may obtain performance information current to the most recent month-end by contacting your financial intermediary, visiting columbiamanagement.com or calling 800.345.6611.
*The returns shown for periods prior to the share class inception date (including returns for the Life of the Fund, if shown, which are since Fund inception) include the returns of the Fund's oldest share class. These returns are adjusted to reflect any higher class-related operating expenses of the newer share classes, as applicable. Please visit columbiamanagement.com/mutual-funds/appended-performance for more information.
The Barclays U.S. Aggregate Bond Index is a broad-based benchmark that measures the investment grade, U.S. dollar denominated, fixed-rate taxable bond market, including Treasuries, government-related and corporate securities, mortgage-backed securities (agency fixed-rate and hybrid adjustable-rate mortgage passthroughs), asset-backed securities, and commercial mortgage-backed securities.
Indices are not available for investment, are not professionally managed and do not reflect sales charges, fees, brokerage commissions, taxes or other expenses of investing. Securities in the Fund may not match those in an index.
Annual Report 2014
2
Performance Overview (continued)
Performance of a Hypothetical $10,000 Investment (May 1, 2004 – April 30, 2014)
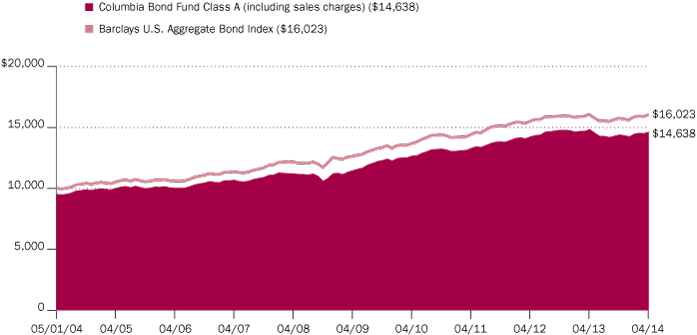
The chart above shows the change in value of a hypothetical $10,000 investment in Class A shares of Columbia Bond Fund during the stated time period, and does not reflect the deduction of taxes that a shareholder may pay on Fund distributions or on the redemption of Fund shares.
Annual Report 2014
3
Manager Discussion of Fund Performance
For the 12-month period that ended April 30, 2014, the Fund's Class A shares returned -1.42% excluding sales charges. The Fund's benchmark, the Barclays U.S. Aggregate Bond Index, returned -0.26% for the same period. An overweight in 10-year bonds and the Fund's position in mortgage securities detracted from results during the period.
Stable Economic Growth
Even though a difficult winter weighed on the U.S. economy early in 2014, it was not enough to derail the steady, growth that marked the 12-month period. Solid new job growth drove the unemployment rate down to 6.3%. Robust manufacturing activity boosted the nation's capacity utilization rate to a recovery high of 79.2%. Personal income edged higher, borrowing increased and the savings rate declined. Consumer confidence generally rose during the 12-month period, reflecting consumer expectations that the economy was on solid ground. The housing market lost some momentum, the victim of bad winter weather, tighter borrowing standards, rising prices and higher mortgage rates. However, higher pending home sales near the end of the period was a positive data point.
Early in the period, then-Federal Reserve chairman Ben Bernanke rattled the fixed-income markets when he indicated that the Fed was preparing to taper its monthly bond purchases, their longstanding program known as quantitative easing. The bond market declined sharply following Bernanke's announcement, and long-term interest rates rose. Once Fed tapering commenced in January 2014, longer-term interest rates declined over the last four months of the period. However, short-term rates remained at historically low levels. In this environment, returns from many fixed-income sectors were low to slightly negative.
Contributors and Detractors
The Fund's performance relative to the benchmark was aided by its positions in corporate bonds. An overweight in financials aided results as did an emphasis on preferred securities within the sector. The Fund also maintained a relatively short duration, which helped reduce risk as interest rates rose. Duration is a measure of interest rate sensitivity. However, an overweight in 10-year bonds detracted from results, because it was especially hard hit when rates rose in the spring of 2013. The Fund's position in mortgage securities also detracted from relative return. The Fund had emphasized securitized pools in which the underlying mortgages carried small balances, thus reducing overall prepayment risk. These securities had performed well for the Fund as interest rates declined, but the value of prepayment protection evaporated when rates reversed course in 2013 and these mortgage securities underperformed.
During the period, we added to positions in Small Business Administration (SBA) securities, which are guaranteed by the U.S. government, and RefCorp securities, which are not explicitly guaranteed but nonetheless receive government backing. Together these positions accounted for approximately 4% of the portfolio's net assets. The Fund also bolstered its credit quality during the course of the year, a reflection of the decline in the yield advantage enjoyed by the riskier sectors of the market.
Portfolio Management
Carl Pappo, CFA
Michael Zazzarino
Portfolio Breakdown (%)
(at April 30, 2014) | |
Asset-Backed Securities —
Agency | | | 3.2 | | |
Asset-Backed Securities —
Non-Agency | | | 11.1 | | |
Commercial Mortgage-Backed
Securities — Non-Agency | | | 5.9 | | |
Common Stocks | | | 0.0 | (a) | |
Consumer Staples | | | 0.0 | (a) | |
Financials | | | 0.0 | (a) | |
Corporate Bonds & Notes | | | 22.4 | | |
Foreign Government
Obligations | | | 1.6 | | |
Money Market Funds | | | 0.1 | | |
Municipal Bonds | | | 1.6 | | |
Preferred Debt | | | 1.6 | | |
Residential Mortgage-Backed
Securities — Agency | | | 24.5 | | |
Residential Mortgage-Backed
Securities — Non-Agency | | | 1.2 | | |
Treasury Bills | | | 8.8 | | |
U.S. Government & Agency
Obligations | | | 6.7 | | |
U.S. Treasury Obligations | | | 11.3 | | |
Total | | | 100.0 | | |
Percentages indicated are based upon total investments. The Fund's portfolio composition is subject to change.
(a) Rounds to zero.
Investment Risks
There are risks associated with an investment in this Fund, including credit risk, market risk, interest rate risk and prepayment and extension risk. In general, bond prices rise when interest rates fall and vice versa. This effect is more pronounced for longer-term securities. Noninvestment grade securities, commonly called "high-yield" or "junk" bonds, have more volatile prices and carry more risk to principal and income than investment grade securities. Investing in derivatives is a specialized activity that involves special risks, which may result in significant losses. See the Fund's prospectus for information on these and other risks associated with the Fund.
Annual Report 2014
4
Manager Discussion of Fund Performance (continued)
Three types of derivatives were employed in the Fund's management during the period. We invested in highly-liquid, widely-traded Treasury futures and interest rate swap contracts to help manage portfolio duration. These enable us to efficiently implement our yield curve opinions and offset unintended yield curve impacts from other investments in the portfolio. We also invested in credit default swaps to manage exposure to overall credit risk and individual issuer risk. Credit and yield curve positioning, overall, contributed positively to Fund performance during the period. On a standalone basis, however, various derivative positions used to hedge these positions did detract from performance.
Looking Ahead
At this time, we expect the economy to continue to grow at a moderate pace. As a result, we currently plan to maintain modest overweight positions in corporate bonds, mortgages and other non-Treasury assets. We believe the valuations in these sectors are not as attractive as they had been in prior periods, but they still presently have the potential for incrementally positive returns. Because we currently anticipate that interest rates will rise in the period ahead, the Fund's duration position is shorter than the benchmark at this time. Should rates in fact rise, we believe that the two-to-five year segment of the maturity spectrum may be the most vulnerable, and we have positioned the portfolio accordingly.
Quality Breakdown (%)
(at April 30, 2014) | |
AAA rating | | | 65.6 | | |
AA rating | | | 4.5 | | |
A rating | | | 10.6 | | |
BBB rating | | | 18.1 | | |
Non-investment grade | | | 0.5 | | |
Not rated | | | 0.7 | | |
Total | | | 100.0 | | |
Percentages indicated are based upon total fixed income securities (excluding Money Market Funds).
Bond ratings apply to the underlying holdings of the Fund and not the Fund itself and are divided into categories ranging from AAA (highest) to D (lowest), and are subject to change. The ratings shown are determined by using the middle rating of Moody's, S&P, and Fitch after dropping the highest and lowest available ratings. When a rating from only two agencies is available, the lower rating is used. When a rating from only one agency is available, that rating is used. When a bond is not rated by one of these agencies, it is designated as Not rated. Credit ratings are subjective opinions and not statements of fact.
Annual Report 2014
5
Understanding Your Fund's Expenses
(Unaudited)
As an investor, you incur two types of costs. There are transaction costs, which generally include sales charges on purchases and may include redemption fees. There are also ongoing costs, which generally include management fees, distribution and/or service fees, and other fund expenses. The following information is intended to help you understand your ongoing costs (in dollars) of investing in the Fund and to help you compare these costs with the ongoing costs of investing in other mutual funds.
Analyzing Your Fund's Expenses
To illustrate these ongoing costs, we have provided examples and calculated the expenses paid by investors in each share class of the Fund during the period. The actual and hypothetical information in the table is based on an initial investment of $1,000 at the beginning of the period indicated and held for the entire period. Expense information is calculated two ways and each method provides you with different information. The amount listed in the "Actual" column is calculated using the Fund's actual operating expenses and total return for the period. You may use the Actual information, together with the amount invested, to estimate the expenses that you paid over the period. Simply divide your account value by $1,000 (for example, an $8,600 account value divided by $1,000 = 8.6), then multiply the results by the expenses paid during the period under the "Actual" column. The amount listed in the "Hypothetical" column assumes a 5% annual rate of return before expenses (which is not the Fund's actual return) and then applies the Fund's actual expense ratio for the period to the hypothetical return. You should not use the hypothetical account values and expenses to estimate either your actual account balance at the end of the period or the expenses you paid during the period. See "Compare With Other Funds" below for details on how to use the hypothetical data.
Compare With Other Funds
Since all mutual funds are required to include the same hypothetical calculations about expenses in shareholder reports, you can use this information to compare the ongoing cost of investing in the Fund with other funds. To do so, compare the hypothetical example with the 5% hypothetical examples that appear in the shareholder reports of other funds. As you compare hypothetical examples of other funds, it is important to note that hypothetical examples are meant to highlight the ongoing costs of investing in a fund only and do not reflect any transaction costs, such as sales charges, or redemption or exchange fees. Therefore, the hypothetical calculations are useful in comparing ongoing costs only, and will not help you determine the relative total costs of owning different funds. If transaction costs were included in these calculations, your costs would be higher.
November 1, 2013 – April 30, 2014
| | Account Value at the Beginning
of the Period ($) | | Account Value at the End of the
Period ($) | | Expenses Paid During the
Period ($) | | Fund's Annualized
Expense Ratio (%) | |
| | Actual | | Hypothetical | | Actual | | Hypothetical | | Actual | | Hypothetical | | Actual | |
Class A | | | 1,000.00 | | | | 1,000.00 | | | | 1,016.50 | | | | 1,019.98 | | | | 4.85 | | | | 4.86 | | | | 0.97 | | |
Class B | | | 1,000.00 | | | | 1,000.00 | | | | 1,012.80 | | | | 1,016.27 | | | | 8.58 | | | | 8.60 | | | | 1.72 | | |
Class C | | | 1,000.00 | | | | 1,000.00 | | | | 1,013.50 | | | | 1,017.01 | | | | 7.84 | | | | 7.85 | | | | 1.57 | | |
Class I | | | 1,000.00 | | | | 1,000.00 | | | | 1,018.70 | | | | 1,022.27 | | | | 2.55 | | | | 2.56 | | | | 0.51 | | |
Class R | | | 1,000.00 | | | | 1,000.00 | | | | 1,015.20 | | | | 1,018.74 | | | | 6.10 | | | | 6.11 | | | | 1.22 | | |
Class R4 | | | 1,000.00 | | | | 1,000.00 | | | | 1,017.80 | | | | 1,021.22 | | | | 3.60 | | | | 3.61 | | | | 0.72 | | |
Class R5 | | | 1,000.00 | | | | 1,000.00 | | | | 1,017.60 | | | | 1,022.07 | | | | 2.75 | | | | 2.76 | | | | 0.55 | | |
Class T | | | 1,000.00 | | | | 1,000.00 | | | | 1,017.00 | | | | 1,020.48 | | | | 4.35 | | | | 4.36 | | | | 0.87 | | |
Class W | | | 1,000.00 | | | | 1,000.00 | | | | 1,016.50 | | | | 1,020.18 | | | | 4.65 | | | | 4.66 | | | | 0.93 | | |
Class Y | | | 1,000.00 | | | | 1,000.00 | | | | 1,018.70 | | | | 1,022.12 | | | | 2.70 | | | | 2.71 | | | | 0.54 | | |
Class Z | | | 1,000.00 | | | | 1,000.00 | | | | 1,017.80 | | | | 1,021.22 | | | | 3.60 | | | | 3.61 | | | | 0.72 | | |
Expenses paid during the period are equal to the annualized expense ratio for each class as indicated above, multiplied by the average account value over the period and then multiplied by the number of days in the Fund's most recent fiscal half year and divided by 365.
Expenses do not include fees and expenses incurred indirectly by the Fund from the underlying funds in which the Fund may invest (also referred to as "acquired funds"), including affiliated and non-affiliated pooled investment vehicles (including mutual funds and exchange-traded funds).
Had Columbia Management Investment Advisers, LLC and/or certain of its affiliates not waived/reimbursed certain fees and expenses, account value at the end of the period would have been reduced.
Annual Report 2014
6
Portfolio of Investments
April 30, 2014
(Percentages represent value of investments compared to net assets)
Corporate Bonds & Notes 25.6%
Issuer | | Coupon
Rate | | Principal
Amount ($) | | Value ($) | |
Aerospace & Defense 0.3% | |
L-3 Communications Corp.
02/15/21 | | | 4.950 | % | | | 1,725,000 | | | | 1,879,265 | | |
Lockheed Martin Corp.
Senior Unsecured
09/15/21 | | | 3.350 | % | | | 695,000 | | | | 715,221 | | |
Total | | | | | | | 2,594,486 | | |
Automotive 1.0% | |
Ford Motor Credit Co. LLC
Senior Unsecured
06/15/16 | | | 3.984 | % | | | 3,474,000 | | | | 3,684,108 | | |
01/17/17 | | | 1.500 | % | | | 3,364,000 | | | | 3,376,975 | | |
01/15/20 | | | 8.125 | % | | | 520,000 | | | | 661,306 | | |
Total | | | | | | | 7,722,389 | | |
Banking 4.7% | |
BNP Paribas SA(a)(b)
06/29/49 | | | 5.186 | % | | | 1,798,000 | | | | 1,845,197 | | |
Bank of America Corp.
Senior Unsecured
01/11/23 | | | 3.300 | % | | | 1,995,000 | | | | 1,936,455 | | |
Subordinated Notes
05/02/17 | | | 5.700 | % | | | 1,465,000 | | | | 1,621,487 | | |
Bank of Montreal
Senior Unsecured
01/25/19 | | | 2.375 | % | | | 566,000 | | | | 571,919 | | |
Bank of New York Mellon Corp. (The)(a)
12/29/49 | | | 4.500 | % | | | 1,555,000 | | | | 1,422,825 | | |
Barclays Bank PLC(a)(b)
09/29/49 | | | 7.434 | % | | | 1,133,000 | | | | 1,266,127 | | |
Discover Financial Services
Senior Unsecured
04/27/22 | | | 5.200 | % | | | 260,000 | | | | 282,651 | | |
11/21/22 | | | 3.850 | % | | | 1,508,000 | | | | 1,514,778 | | |
HSBC Holdings PLC
Senior Unsecured
01/14/22 | | | 4.875 | % | | | 515,000 | | | | 571,982 | | |
HSBC USA, Inc.
Subordinated Notes
09/27/20 | | | 5.000 | % | | | 2,065,000 | | | | 2,270,738 | | |
ING Bank NV
Senior Unsecured(b)
03/15/16 | | | 4.000 | % | | | 2,685,000 | | | | 2,837,317 | | |
JPMorgan Chase Capital XXI(a)
02/02/37 | | | 1.173 | % | | | 615,000 | | | | 495,075 | | |
JPMorgan Chase Capital XXIII(a)
05/15/47 | | | 1.236 | % | | | 5,275,000 | | | | 4,114,500 | | |
Corporate Bonds & Notes (continued)
Issuer | | Coupon
Rate | | Principal
Amount ($) | | Value ($) | |
KeyCorp
Senior Unsecured
03/24/21 | | | 5.100 | % | | | 2,560,000 | | | | 2,894,226 | | |
M&T Bank Corp.
12/31/49 | | | 6.875 | % | | | 946,000 | | | | 951,508 | | |
Royal Bank of Scotland Group PLC
Senior Unsecured
09/18/15 | | | 2.550 | % | | | 1,785,000 | | | | 1,823,062 | | |
State Street Corp.
03/15/18 | | | 4.956 | % | | | 3,130,000 | | | | 3,425,594 | | |
U.S. Bancorp
Subordinated Notes
07/15/22 | | | 2.950 | % | | | 4,807,000 | | | | 4,654,041 | | |
Wells Fargo & Co.(a)
12/31/49 | | | 5.900 | % | | | 2,120,000 | | | | 2,158,160 | | |
Total | | | | | | | 36,657,642 | | |
Chemicals 0.4% | |
LYB International Finance BV
03/15/44 | | | 4.875 | % | | | 1,055,000 | | | | 1,082,538 | | |
LyondellBasell Industries NV
Senior Unsecured
04/15/19 | | | 5.000 | % | | | 1,507,000 | | | | 1,689,332 | | |
Total | | | | | | | 2,771,870 | | |
Diversified Manufacturing 0.4% | |
General Electric Co.
Senior Unsecured
10/09/42 | | | 4.125 | % | | | 2,271,000 | | | | 2,220,434 | | |
03/11/44 | | | 4.500 | % | | | 590,000 | | | | 607,621 | | |
Total | | | | | | | 2,828,055 | | |
Electric 4.0% | |
Alabama Power Co.
Senior Unsecured
03/15/41 | | | 5.500 | % | | | 904,000 | | | | 1,059,630 | | |
Commonwealth Edison Co.
1st Mortgage
08/01/20 | | | 4.000 | % | | | 2,210,000 | | | | 2,386,975 | | |
DTE Electric Co.
Senior Secured
10/01/20 | | | 3.450 | % | | | 1,985,000 | | | | 2,080,268 | | |
Duke Energy Carolinas LLC
1st Mortgage
10/01/15 | | | 5.300 | % | | | 295,000 | | | | 314,987 | | |
Duke Energy Ohio, Inc.
1st Mortgage
09/01/23 | | | 3.800 | % | | | 5,226,000 | | | | 5,456,367 | | |
The accompanying Notes to Financial Statements are an integral part of this statement.
Annual Report 2014
7
Portfolio of Investments (continued)
April 30, 2014
Corporate Bonds & Notes (continued)
Issuer | | Coupon
Rate | | Principal
Amount ($) | | Value ($) | |
Duke Energy Progress, Inc.
1st Mortgage
03/30/44 | | | 4.375 | % | | | 560,000 | | | | 574,555 | | |
FPL Energy National Wind LLC
Senior Secured(b)
03/10/24 | | | 5.608 | % | | | 191,741 | | | | 188,184 | | |
FirstEnergy Corp.
Senior Unsecured
03/15/23 | | | 4.250 | % | | | 760,000 | | | | 746,874 | | |
Georgia Power Co.
Senior Unsecured
06/01/17 | | | 5.700 | % | | | 990,000 | | | | 1,118,089 | | |
09/01/40 | | | 4.750 | % | | | 330,000 | | | | 347,846 | | |
MidAmerican Energy Co.
1st Mortgage
10/15/24 | | | 3.500 | % | | | 665,000 | | | | 672,671 | | |
10/15/44 | | | 4.400 | % | | | 1,265,000 | | | | 1,290,486 | | |
Nevada Power Co.
09/15/40 | | | 5.375 | % | | | 1,270,000 | | | | 1,465,854 | | |
Niagara Mohawk Power Corp.
Senior Unsecured(b)
08/15/19 | | | 4.881 | % | | | 1,615,000 | | | | 1,805,606 | | |
Oncor Electric Delivery Co. LLC
Senior Secured
06/01/22 | | | 4.100 | % | | | 574,000 | | | | 608,482 | | |
12/01/41 | | | 4.550 | % | | | 1,655,000 | | | | 1,686,205 | | |
PPL Capital Funding, Inc.
06/01/18 | | | 1.900 | % | | | 810,000 | | | | 798,691 | | |
06/01/23 | | | 3.400 | % | | | 3,484,000 | | | | 3,425,713 | | |
Pacific Gas & Electric Co.
Senior Unsecured
06/15/23 | | | 3.250 | % | | | 1,603,000 | | | | 1,580,829 | | |
01/15/40 | | | 5.400 | % | | | 420,000 | | | | 466,872 | | |
Peco Energy Co.
1st Mortgage
03/01/18 | | | 5.350 | % | | | 1,640,000 | | | | 1,846,911 | | |
Southern California Edison Co.
1st Refunding Mortgage
09/01/40 | | | 4.500 | % | | | 880,000 | | | | 914,509 | | |
Total | | | | | | | 30,836,604 | | |
Entertainment 0.2% | |
Time Warner, Inc.
11/15/36 | | | 6.500 | % | | | 960,000 | | | | 1,168,013 | | |
Food and Beverage 0.6% | |
Heineken NV
Senior Unsecured(b)
10/01/17 | | | 1.400 | % | | | 3,505,000 | | | | 3,492,985 | | |
Corporate Bonds & Notes (continued)
Issuer | | Coupon
Rate | | Principal
Amount ($) | | Value ($) | |
PepsiCo, Inc.
Senior Unsecured
03/01/23 | | | 2.750 | % | | | 1,290,000 | | | | 1,230,533 | | |
Total | | | | | | | 4,723,518 | | |
Gas Distributors 0.3% | |
Sempra Energy
Senior Unsecured
06/01/16 | | | 6.500 | % | | | 1,805,000 | | | | 2,001,445 | | |
12/01/23 | | | 4.050 | % | | | 480,000 | | | | 496,257 | | |
Total | | | | | | | 2,497,702 | | |
Gas Pipelines 2.5% | |
El Paso Pipeline Partners Operating Co. LLC
10/01/21 | | | 5.000 | % | | | 2,940,000 | | | | 3,159,691 | | |
Enterprise Products Operating LLC
08/13/15 | | | 1.250 | % | | | 2,953,000 | | | | 2,971,716 | | |
03/15/23 | | | 3.350 | % | | | 1,340,000 | | | | 1,319,966 | | |
Kinder Morgan Energy Partners LP
Senior Unsecured
03/01/21 | | | 3.500 | % | | | 1,334,000 | | | | 1,335,731 | | |
NiSource Finance Corp.
09/15/17 | | | 5.250 | % | | | 605,000 | | | | 673,949 | | |
02/15/23 | | | 3.850 | % | | | 1,750,000 | | | | 1,769,320 | | |
12/15/40 | | | 6.250 | % | | | 435,000 | | | | 508,036 | | |
Southern Natural Gas Co. LLC/Issuing Corp.
Senior Unsecured
06/15/21 | | | 4.400 | % | | | 1,075,000 | | | | 1,140,454 | | |
Southern Natural Gas Co. LLC
Senior Unsecured
03/01/32 | | | 8.000 | % | | | 1,505,000 | | | | 2,011,672 | | |
TransCanada PipeLines Ltd.(a)
05/15/67 | | | 6.350 | % | | | 2,680,000 | | | | 2,783,850 | | |
Williams Partners LP
Senior Unsecured
04/15/40 | | | 6.300 | % | | | 1,290,000 | | | | 1,500,858 | | |
Total | | | | | | | 19,175,243 | | |
Healthcare Insurance 0.1% | |
WellPoint, Inc.
Senior Unsecured
01/15/23 | | | 3.300 | % | | | 645,000 | | | | 630,749 | | |
Independent Energy 0.9% | |
Canadian Natural Resources Ltd.
Senior Unsecured
03/15/38 | | | 6.250 | % | | | 1,140,000 | | | | 1,397,291 | | |
Continental Resources, Inc.
09/15/22 | | | 5.000 | % | | | 1,755,000 | | | | 1,855,912 | | |
04/15/23 | | | 4.500 | % | | | 1,057,000 | | | | 1,110,750 | | |
The accompanying Notes to Financial Statements are an integral part of this statement.
Annual Report 2014
8
Portfolio of Investments (continued)
April 30, 2014
Corporate Bonds & Notes (continued)
Issuer | | Coupon
Rate | | Principal
Amount ($) | | Value ($) | |
Hess Corp.
Senior Unsecured
08/15/31 | | | 7.300 | % | | | 2,161,000 | | | | 2,775,230 | | |
Total | | | | | | | 7,139,183 | | |
Integrated Energy 1.0% | |
BP Capital Markets PLC
02/10/24 | | | 3.814 | % | | | 1,560,000 | | | | 1,592,670 | | |
Chevron Corp.
Senior Unsecured
12/05/22 | | | 2.355 | % | | | 1,090,000 | | | | 1,030,960 | | |
06/24/23 | | | 3.191 | % | | | 900,000 | | | | 899,501 | | |
Shell International Finance BV
08/21/22 | | | 2.375 | % | | | 4,505,000 | | | | 4,287,449 | | |
Total | | | | | | | 7,810,580 | | |
Life Insurance 1.0% | |
MetLife Capital Trust X(b)
04/08/38 | | | 9.250 | % | | | 1,682,000 | | | | 2,262,290 | | |
Prudential Financial, Inc.(a)
06/15/38 | | | 8.875 | % | | | 4,640,000 | | | | 5,672,400 | | |
Total | | | | | | | 7,934,690 | | |
Media Cable 0.3% | |
Time Warner Cable, Inc.
05/01/37 | | | 6.550 | % | | | 770,000 | | | | 943,992 | | |
09/01/41 | | | 5.500 | % | | | 1,070,000 | | | | 1,181,406 | | |
Total | | | | | | | 2,125,398 | | |
Media Non-Cable 0.3% | |
21st Century Fox America, Inc.
12/15/35 | | | 6.400 | % | | | 1,070,000 | | | | 1,298,525 | | |
Reed Elsevier Capital, Inc.
10/15/22 | | | 3.125 | % | | | 1,460,000 | | | | 1,415,285 | | |
Total | | | | | | | 2,713,810 | | |
Metals 0.4% | |
Nucor Corp.
Senior Unsecured
08/01/23 | | | 4.000 | % | | | 1,730,000 | | | | 1,753,780 | | |
Vale Overseas Ltd.
11/21/36 | | | 6.875 | % | | | 1,150,000 | | | | 1,273,325 | | |
Total | | | | | | | 3,027,105 | | |
Non-Captive Diversified 0.5% | |
GE Capital Trust I(a)
11/15/67 | | | 6.375 | % | | | 757,000 | | | | 838,377 | | |
Corporate Bonds & Notes (continued)
Issuer | | Coupon
Rate | | Principal
Amount ($) | | Value ($) | |
General Electric Capital Corp.
Senior Unsecured
09/07/22 | | | 3.150 | % | | | 1,150,000 | | | | 1,150,160 | | |
01/14/38 | | | 5.875 | % | | | 1,840,000 | | | | 2,202,957 | | |
Total | | | | | | | 4,191,494 | | |
Oil Field Services 0.3% | |
Halliburton Co.
Senior Unsecured
09/15/18 | | | 5.900 | % | | | 1,130,000 | | | | 1,310,034 | | |
Weatherford International Ltd.
03/15/38 | | | 7.000 | % | | | 785,000 | | | | 966,823 | | |
Total | | | | | | | 2,276,857 | | |
Other Industry 0.6% | |
Board of Trustees of the Leland Stanford Junior
University (The)
Senior Unsecured(c)
05/01/54 | | | 4.249 | % | | | 475,000 | | | | 474,915 | | |
President and Fellows of Harvard College
10/01/37 | | | 3.619 | % | | | 315,000 | | | | 291,627 | | |
Senior Notes
10/15/40 | | | 4.875 | % | | | 1,930,000 | | | | 2,128,006 | | |
President and Fellows of Harvard College(b)
01/15/39 | | | 6.500 | % | | | 1,460,000 | | | | 1,959,032 | | |
Total | | | | | | | 4,853,580 | | |
Pharmaceuticals 0.8% | |
Johnson & Johnson
Senior Unsecured
12/05/33 | | | 4.375 | % | | | 1,115,000 | | | | 1,188,788 | | |
05/15/41 | | | 4.850 | % | | | 3,289,000 | | | | 3,683,542 | | |
Novartis Capital Corp.
05/06/24 | | | 3.400 | % | | | 1,000,000 | | | | 1,007,805 | | |
Total | | | | | | | 5,880,135 | | |
Property & Casualty 0.2% | |
Transatlantic Holdings, Inc.
Senior Unsecured
11/30/39 | | | 8.000 | % | | | 1,085,000 | | | | 1,464,093 | | |
Railroads 0.7% | |
BNSF Funding Trust I(a)
12/15/55 | | | 6.613 | % | | | 1,410,000 | | | | 1,558,050 | | |
Burlington Northern Santa Fe LLC
Senior Unsecured
08/15/30 | | | 7.950 | % | | | 915,000 | | | | 1,269,818 | | |
CSX Corp.
Senior Unsecured
05/30/42 | | | 4.750 | % | | | 415,000 | | | | 429,234 | | |
The accompanying Notes to Financial Statements are an integral part of this statement.
Annual Report 2014
9
Portfolio of Investments (continued)
April 30, 2014
Corporate Bonds & Notes (continued)
Issuer | | Coupon
Rate | | Principal
Amount ($) | | Value ($) | |
Union Pacific Corp.
Senior Unsecured
08/15/18 | | | 5.700 | % | | | 1,010,000 | | | | 1,155,725 | | |
02/15/19 | | | 2.250 | % | | | 1,195,000 | | | | 1,203,583 | | |
Total | | | | | | | 5,616,410 | | |
REITs 0.3% | |
Duke Realty LP
08/15/19 | | | 8.250 | % | | | 1,944,600 | | | | 2,421,004 | | |
Restaurants 0.6% | |
McDonald's Corp.
Senior Unsecured
02/01/39 | | | 5.700 | % | | | 805,000 | | | | 961,650 | | |
07/15/40 | | | 4.875 | % | | | 1,050,000 | | | | 1,138,947 | | |
05/01/43 | | | 3.625 | % | | | 1,643,000 | | | | 1,454,662 | | |
Yum! Brands, Inc.
Senior Unsecured
11/01/23 | | | 3.875 | % | | | 721,000 | | | | 727,569 | | |
11/01/43 | | | 5.350 | % | | | 45,000 | | | | 48,257 | | |
Total | | | | | | | 4,331,085 | | |
Retailers 0.2% | |
Wal-Mart Stores, Inc.
Senior Unsecured
04/22/24 | | | 3.300 | % | | | 1,269,000 | | | | 1,266,025 | | |
Supranational 0.3% | |
European Investment Bank
Senior Unsecured
05/30/17 | | | 5.125 | % | | | 2,245,000 | | | | 2,521,606 | | |
Technology 0.6% | |
Corning, Inc.
Senior Unsecured
03/15/42 | | | 4.750 | % | | | 1,185,000 | | | | 1,231,586 | | |
Oracle Corp.
Senior Unsecured
10/15/22 | | | 2.500 | % | | | 3,720,000 | | | | 3,550,513 | | |
Total | | | | | | | 4,782,099 | | |
Wireless 0.2% | |
Rogers Communications, Inc.
03/15/44 | | | 5.000 | % | | | 1,189,000 | | | | 1,216,767 | | |
Wirelines 1.9% | |
AT&T, Inc.
Senior Unsecured
06/15/16 | | | 5.625 | % | | | 1,070,000 | | | | 1,173,862 | | |
12/15/42 | | | 4.300 | % | | | 2,670,000 | | | | 2,409,336 | | |
Telefonica Emisiones SAU
04/27/18 | | | 3.192 | % | | | 469,000 | | | | 486,070 | | |
Corporate Bonds & Notes (continued)
Issuer | | Coupon
Rate | | Principal
Amount ($) | | Value ($) | |
Verizon Communications, Inc.
Senior Unsecured
09/14/18 | | | 3.650 | % | | | 3,458,000 | | | | 3,691,868 | | |
04/01/21 | | | 4.600 | % | | | 1,575,000 | | | | 1,721,043 | | |
11/01/22 | | | 2.450 | % | | | 2,160,000 | | | | 2,001,048 | | |
03/15/24 | | | 4.150 | % | | | 560,000 | | | | 573,762 | | |
Verizon New England, Inc.
11/15/29 | | | 7.875 | % | | | 555,000 | | | | 698,302 | | |
Verizon New York, Inc.
04/01/32 | | | 7.375 | % | | | 1,461,000 | | | | 1,789,294 | | |
Total | | | | | | | 14,544,585 | | |
Total Corporate Bonds & Notes
(Cost: $187,555,548) | | | | | | | 197,722,777 | | |
Residential Mortgage-Backed Securities — Agency 28.1%
Federal Home Loan Mortgage Corp.(d)
06/01/43 | | | 3.500 | % | | | 3,148,078 | | | | 3,199,579 | | |
05/01/41 | | | 4.500 | % | | | 15,274,611 | | | | 16,526,887 | | |
03/01/21 -
05/01/41 | | | 5.000 | % | | | 2,104,569 | | | | 2,327,251 | | |
12/01/14 -
12/01/35 | | | 7.000 | % | | | 388,325 | | | | 423,118 | | |
09/01/25 -
10/01/29 | | | 7.500 | % | | | 58,625 | | | | 67,101 | | |
06/01/26 | | | 8.000 | % | | | 873 | | | | 1,034 | | |
09/01/16 | | | 9.500 | % | | | 196 | | | | 208 | | |
Federal National Mortgage Association(c)(d)
05/14/29 | | | 2.500 | % | | | 13,850,000 | | | | 13,936,562 | | |
05/14/29 -
05/12/44 | | | 3.000 | % | | | 36,430,000 | | | | 36,014,684 | | |
05/14/29 | | | 3.500 | % | | | 9,250,000 | | | | 9,741,406 | | |
05/12/44 | | | 4.000 | % | | | 10,500,000 | | | | 11,000,801 | | |
05/12/44 | | | 4.500 | % | | | 13,500,000 | | | | 14,493,516 | | |
Federal National Mortgage Association(d)
09/01/28 -
11/01/42 | | | 3.000 | % | | | 8,904,978 | | | | 8,794,440 | | |
05/01/43 -
08/01/43 | | | 3.500 | % | | | 19,855,381 | | | | 20,191,977 | | |
04/01/41 | | | 4.000 | % | | | 10,484,000 | | | | 11,017,371 | | |
05/01/41 | | | 4.500 | % | | | 3,271,404 | | | | 3,538,068 | | |
09/01/40 | | | 5.000 | % | | | 3,863,807 | | | | 4,233,591 | | |
01/01/40 | | | 5.500 | % | | | 6,902,642 | | | | 7,634,829 | | |
07/01/38 | | | 6.000 | % | | | 5,275,983 | | | | 5,895,302 | | |
06/01/32 | | | 7.000 | % | | | 11,204 | | | | 11,986 | | |
10/01/15 -
10/01/29 | | | 7.500 | % | | | 25,764 | | | | 30,195 | | |
12/01/29 -
05/01/30 | | | 8.000 | % | | | 175,291 | | | | 196,441 | | |
08/01/17 | | | 8.500 | % | | | 26 | | | | 26 | | |
10/01/20 -
12/01/20 | | | 10.000 | % | | | 72,467 | | | | 78,684 | | |
The accompanying Notes to Financial Statements are an integral part of this statement.
Annual Report 2014
10
Portfolio of Investments (continued)
April 30, 2014
Residential Mortgage-Backed Securities — Agency (continued)
Issuer | | Coupon
Rate | | Principal
Amount ($) | | Value ($) | |
CMO Series 2013-121 Class KD
08/25/41 | | | 3.500 | % | | | 8,871,752 | | | | 9,274,849 | | |
Government National Mortgage Association(a)(d) | |
04/20/22 -
06/20/28 | | | 1.625 | % | | | 183,738 | | | | 191,241 | | |
07/20/21 | | | 2.000 | % | | | 19,362 | | | | 20,318 | | |
Government National Mortgage Association(c)(d)
05/20/44 | | | 3.000 | % | | | 11,970,000 | | | | 11,900,799 | | |
05/20/44 | | | 3.500 | % | | | 9,000,000 | | | | 9,253,125 | | |
05/20/44 | | | 4.000 | % | | | 6,000,000 | | | | 6,350,156 | | |
Government National Mortgage Association(d)
03/15/41 | | | 4.500 | % | | | 1,351,594 | | | | 1,470,688 | | |
03/20/28 | | | 6.000 | % | | | 71,603 | | | | 80,292 | | |
05/15/23 -
12/15/31 | | | 6.500 | % | | | 123,460 | | | | 139,539 | | |
11/15/22 -
02/15/30 | | | 7.000 | % | | | 166,713 | | | | 184,248 | | |
04/15/26 -
03/15/30 | | | 7.500 | % | | | 213,908 | | | | 232,436 | | |
06/15/25 -
01/15/30 | | | 8.000 | % | | | 178,953 | | | | 201,440 | | |
01/15/17 -
12/15/17 | | | 8.500 | % | | | 162,289 | | | | 174,800 | | |
11/15/17 -
06/15/30 | | | 9.000 | % | | | 117,847 | | | | 127,941 | | |
11/15/17 -
08/15/20 | | | 9.500 | % | | | 106,079 | | | | 115,698 | | |
05/15/16 | | | 10.000 | % | | | 1,006 | | | | 1,012 | | |
Government National Mortgage Association(d)(e)
06/15/39 | | | 4.500 | % | | | 7,230,055 | | | | 7,847,185 | | |
Vendee Mortgage Trust(a)(d)(f)
CMO IO Series 1998-1 Class 2IO
03/15/28 | | | 0.374 | % | | | 3,144,219 | | | | 27,264 | | |
CMO IO Series 1998-3 Class IO
03/15/29 | | | 0.158 | % | | | 4,098,174 | | | | 8,696 | | |
Total Residential Mortgage-Backed
Securities — Agency
(Cost: $213,972,344) | | | | | | | 216,956,784 | | |
Residential Mortgage-Backed Securities — Non-Agency 1.4%
American Mortgage Trust
Series 2093-3 Class 3A(a)(d)(g)(h)
07/27/23 | | | 8.188 | % | | | 5,451 | | | | 3,305 | | |
BCAP LLC Trust
CMO Series 2012-RR10 Class 9A1(a)(b)(d)
10/26/35 | | | 2.654 | % | | | 4,054,817 | | | | 4,153,949 | | |
Residential Mortgage-Backed Securities — Non-Agency (continued)
Issuer | | Coupon
Rate | | Principal
Amount ($) | | Value ($) | |
Credit Suisse Mortgage Capital Certificates(a)(b)(d)
CMO Series 2011-16R Class 7A3
12/27/36 | | | 3.500 | % | | | 769,801 | | | | 781,632 | | |
CMO Series 2011-17R Class 2A1
12/27/37 | | | 3.400 | % | | | 800,993 | | | | 812,890 | | |
Springleaf Mortgage Loan Trust
CMO Series 2012-1A Class A(a)(b)(d)
09/25/57 | | | 2.667 | % | | | 883,654 | | | | 901,161 | | |
WaMu Mortgage Pass-Through Certificates
CMO Series 2003-AR8 Class A(a)(d)
08/25/33 | | | 2.410 | % | | | 3,983,912 | | | | 4,039,325 | | |
Total Residential Mortgage-Backed
Securities — Non-Agency
(Cost: $10,665,255) | | | | | | | 10,692,262 | | |
Commercial Mortgage-Backed Securities — Non-Agency 6.7%
Aventura Mall Trust
Series 2013-AVM Class A(a)(b)(d)
12/05/32 | | | 3.867 | % | | | 4,605,000 | | | | 4,817,444 | | |
COBALT CMBS Commercial Mortgage Trust
Series 2007-C3 Class A4(a)(d)
05/15/46 | | | 5.963 | % | | | 3,104,731 | | | | 3,442,550 | | |
Credit Suisse Commercial Mortgage Trust
Series 2007-C3 Class A4(a)(d)
06/15/39 | | | 5.866 | % | | | 3,050,242 | | | | 3,319,355 | | |
DBRR Trust
Series 2012-EZ1 Class A(b)(d)
09/25/45 | | | 0.946 | % | | | 397,877 | | | | 398,541 | | |
GS Mortgage Securities Trust
Series 2007-GG10 Class A4(a)(d)
08/10/45 | | | 5.997 | % | | | 2,722,829 | | | | 3,023,600 | | |
Greenwich Capital Commercial Funding Corp.(d)
Series 2007-GG11 Class A4
12/10/49 | | | 5.736 | % | | | 3,450,000 | | | | 3,844,032 | | |
Series 2007-GG9 Class A4
03/10/39 | | | 5.444 | % | | | 3,195,000 | | | | 3,495,685 | | |
JPMorgan Chase Commercial Mortgage Securities Corp.
Series 2012-LC9 Class A5(d)
12/15/47 | | | 2.840 | % | | | 2,054,000 | | | | 1,995,767 | | |
JPMorgan Chase Commercial Mortgage Securities Trust
Series 2006-CB15 Class ASB(a)(d)
06/12/43 | | | 5.790 | % | | | 875,045 | | | | 903,069 | | |
LB-UBS Commercial Mortgage Trust
Series 2007-C2 Class A3(d)
02/15/40 | | | 5.430 | % | | | 5,022,889 | | | | 5,529,267 | | |
The accompanying Notes to Financial Statements are an integral part of this statement.
Annual Report 2014
11
Portfolio of Investments (continued)
April 30, 2014
Commercial Mortgage-Backed Securities — Non-Agency (continued)
Issuer | | Coupon
Rate | | Principal
Amount ($) | | Value ($) | |
Merrill Lynch Mortgage Investors Trust
CMO IO Series 1998-C3 Class IO(a)(d)(f)
12/15/30 | | | 1.067 | % | | | 442,701 | | | | 10,380 | | |
Merrill Lynch/Countrywide Commercial Mortgage Trust(a)(d)
Series 2007-6 Class A4
03/12/51 | | | 5.485 | % | | | 3,875,000 | | | | 4,259,950 | | |
Series 2007-8 Class A3
08/12/49 | | | 6.091 | % | | | 3,800,000 | | | | 4,238,429 | | |
Morgan Stanley Capital I Trust
Series 2007-IQ15 Class A4(a)(d)
06/11/49 | | | 6.105 | % | | | 6,956,248 | | | | 7,731,801 | | |
Morgan Stanley Re-Remic Trust(a)(b)(d)
Series 2010-GG10 Class A4A
08/15/45 | | | 5.997 | % | | | 2,117,422 | | | | 2,344,452 | | |
Series 2010-GG10 Class A4B
08/12/45 | | | 5.997 | % | | | 715,000 | | | | 786,456 | | |
WF-RBS Commercial Mortgage Trust
Series 2012-C9 Class A3(d)
11/15/45 | | | 2.870 | % | | | 1,825,000 | | | | 1,771,092 | | |
Total Commercial Mortgage-Backed
Securities — Non-Agency
(Cost: $51,731,709) | | | | | | | 51,911,870 | | |
Asset-Backed Securities — Agency 3.7%
Small Business Administration Participation Certificates
Series 2012-20G Class 1
07/01/32 | | | 2.380 | % | | | 398,721 | | | | 385,543 | | |
Series 2012-20J Class 1
10/01/32 | | | 2.180 | % | | | 741,606 | | | | 705,752 | | |
Series 2012-20L Class 1
12/01/32 | | | 1.930 | % | | | 413,354 | | | | 385,092 | | |
Series 2013-20B Class 1
02/01/33 | | | 2.210 | % | | | 2,823,676 | | | | 2,668,400 | | |
Series 2013-20C Class 1
03/01/33 | | | 2.220 | % | | | 1,473,345 | | | | 1,390,952 | | |
Series 2013-20D Class 1
04/01/33 | | | 2.080 | % | | | 4,319,064 | | | | 4,078,555 | | |
Series 2013-20F Class 1
06/01/33 | | | 2.450 | % | | | 2,613,953 | | | | 2,508,306 | | |
Series 2013-20G Class 1
07/01/33 | | | 3.150 | % | | | 960,353 | | | | 959,004 | | |
Series 2013-20H Class 1
08/01/33 | | | 3.160 | % | | | 4,158,415 | | | | 4,172,728 | | |
Series 2013-20I Class 1
09/01/33 | | | 3.620 | % | | | 2,272,822 | | | | 2,334,067 | | |
Series 2013-20K Class 1
11/01/33 | | | 3.380 | % | | | 1,215,000 | | | | 1,234,941 | | |
Series 2013-20L Class 1
12/01/33 | | | 3.380 | % | | | 3,085,000 | | | | 3,161,967 | | |
Series 2014-20A Class 1
01/01/34 | | | 3.460 | % | | | 640,000 | | | | 651,481 | | |
Asset-Backed Securities — Agency (continued)
Issuer | | Coupon
Rate | | Principal
Amount ($) | | Value ($) | |
Series 2014-20B Class 1
02/01/34 | | | 3.230 | % | | | 700,000 | | | | 701,383 | | |
Series 2014-20C Class 1
03/01/34 | | | 3.210 | % | | | 1,400,000 | | | | 1,397,193 | | |
Series 2014-20D Class 1
04/01/34 | | | 3.110 | % | | | 1,700,000 | | | | 1,706,222 | | |
Total Asset-Backed Securities — Agency
(Cost: $28,858,119) | | | | | | | 28,441,586 | | |
Asset-Backed Securities — Non-Agency 12.7%
ARI Fleet Lease Trust(a)(b)
Series 2012-A Class A
03/15/20 | | | 0.702 | % | | | 1,785,208 | | | | 1,788,203 | | |
ARI Fleet Lease Trust(b)
Series 2014-A Class A2
11/15/22 | | | 0.810 | % | | | 795,000 | | | | 794,980 | | |
Ally Auto Receivables Trust
Series 2013-2 Class A3
01/15/18 | | | 0.790 | % | | | 5,530,000 | | | | 5,538,520 | | |
Ally Master Owner Trust
Series 2012-5 Class A
09/15/19 | | | 1.540 | % | | | 1,120,000 | | | | 1,118,740 | | |
Ally Master Owner Trust(a)
Series 2014-2 Class A
01/16/18 | | | 0.522 | % | | | 2,345,000 | | | | 2,345,145 | | |
American Express Credit Account Master Trust
Series 2013-3 Class A
05/15/19 | | | 0.980 | % | | | 2,030,000 | | | | 2,031,182 | | |
BMW Vehicle Lease Trust
Series 2013-1 Class A3
09/21/15 | | | 0.540 | % | | | 2,525,000 | | | | 2,526,550 | | |
BMW Vehicle Owner Trust
Series 2011-A Class A3
08/25/15 | | | 0.760 | % | | | 358,133 | | | | 358,397 | | |
Series 2013-A Class A3
11/27/17 | | | 0.670 | % | | | 3,915,000 | | | | 3,918,006 | | |
CNH Equipment Trust
Series 2011-B Class A3
08/15/16 | | | 0.910 | % | | | 343,295 | | | | 343,666 | | |
Cabela's Master Credit Card Trust
Series 2014-1 Class A(a)
03/16/20 | | | 0.504 | % | | | 715,000 | | | | 715,000 | | |
Capital Auto Receivables Asset Trust/Ally
Series 2013-1 Class A2
07/20/16 | | | 0.620 | % | | | 3,200,000 | | | | 3,200,467 | | |
Capital One Multi-Asset Execution Trust
Series 2013-A3 Class A3
09/16/19 | | | 0.960 | % | | | 6,045,000 | | | | 6,040,089 | | |
The accompanying Notes to Financial Statements are an integral part of this statement.
Annual Report 2014
12
Portfolio of Investments (continued)
April 30, 2014
Asset-Backed Securities — Non-Agency (continued)
Issuer | | Coupon
Rate | | Principal
Amount ($) | | Value ($) | |
Chase Issuance Trust
Series 2013-A8 Class A8
10/15/18 | | | 1.010 | % | | | 6,080,000 | | | | 6,087,946 | | |
Chase Issuance Trust(a)
Series 2014-A3 Class A3
05/15/18 | | | 0.353 | % | | | 3,445,000 | | | | 3,445,000 | | |
Series 2014-A4 Class A4
04/16/18 | | | 0.359 | % | | | 3,820,000 | | | | 3,820,000 | | |
Citigroup Mortgage Loan Trust, Inc.
Series 2005-WF2 Class MF1(a)
08/25/35 | | | 5.517 | % | | | 1,649,564 | | | | 93,418 | | |
Conseco Financial Corp.
Series 1996-5 Class A7(a)
07/15/27 | | | 8.250 | % | | | 14,407 | | | | 14,436 | | |
Equity One Mortgage Pass-Through Trust
Series 2004-3 Class AV2(a)
07/25/34 | | | 0.494 | % | | | 355,412 | | | | 176,723 | | |
Ford Credit Auto Lease Trust
Series 2014-A Class A2B(a)
10/15/16 | | | 0.332 | % | | | 2,625,000 | | | | 2,624,259 | | |
Ford Credit Auto Owner Trust
Series 2013-D Class A3
04/15/18 | | | 0.670 | % | | | 7,970,000 | | | | 7,968,988 | | |
Ford Credit Floorplan Master Owner Trust
Series 2013-1 Class A1
01/15/18 | | | 0.850 | % | | | 1,900,000 | | | | 1,903,871 | | |
GE Equipment Small Ticket LLC
Series 2014-1A Class A2(b)
08/24/16 | | | 0.590 | % | | | 1,400,000 | | | | 1,400,000 | | |
HLSS Servicer Advance Receivables Backed Notes
Series 2013-T2 Class A2(b)
05/16/44 | | | 1.147 | % | | | 1,405,000 | | | | 1,405,042 | | |
Hertz Fleet Lease Funding LP
Series 2014-1 Class A(a)(b)
04/10/28 | | | 0.572 | % | | | 1,500,000 | | | | 1,500,000 | | |
Mercedes-Benz Auto Lease Trust
Series 2013-B Class A3
07/15/16 | | | 0.620 | % | | | 4,455,000 | | | | 4,460,580 | | |
Mercedes-Benz Auto Lease Trust(a)
Series 2014-A Class A2B
06/15/16 | | | 0.340 | % | | | 3,275,000 | | | | 3,271,282 | | |
Nissan Auto Lease Trust
Series 2013-B Class A3
06/15/16 | | | 0.750 | % | | | 2,705,000 | | | | 2,711,595 | | |
Nissan Auto Lease
Series 2013-A Class A3
04/15/16 | | | 0.610 | % | | | 3,200,000 | | | | 3,204,174 | | |
PFS Tax Lien Trust
Series 2014-1 Class NOTE(b)(c)
05/15/29 | | | 1.440 | % | | | 1,370,000 | | | | 1,369,932 | | |
Asset-Backed Securities — Non-Agency (continued)
Issuer | | Coupon
Rate | | Principal
Amount ($) | | Value ($) | |
Porsche Innovative Lease Owner Trust
Series 2013-1 Class A3(b)
08/22/16 | | | 0.700 | % | | | 2,900,000 | | | | 2,905,254 | | |
SLM Student Loan Trust
Series 2014-2 Class A1(a)
07/25/19 | | | 0.443 | % | | | 3,100,000 | | | | 3,100,155 | | |
SMART Trust
Series 2013-1US Class A3A
09/14/16 | | | 0.840 | % | | | 1,738,000 | | | | 1,742,248 | | |
SMART Trust(b)
Series 2012-1USA Class A4A
12/14/17 | | | 2.010 | % | | | 1,725,000 | | | | 1,757,635 | | |
Santander Drive Auto Receivables Trust
Series 2014-2 Class A2B(a)
08/15/17 | | | 0.472 | % | | | 2,765,000 | | | | 2,765,000 | | |
Volkswagen Auto Loan Enhanced Trust
Series 2013-2 Class A3
04/20/18 | | | 0.700 | % | | | 5,240,000 | | | | 5,241,657 | | |
World Financial Network Credit Card Master Trust
Series 2013-B Class A
03/16/20 | | | 0.910 | % | | | 1,940,000 | | | | 1,939,147 | | |
World Financial Network Credit Card Master Trust(a)
Series 2014-A Class A
12/15/19 | | | 0.532 | % | | | 2,385,000 | | | | 2,385,000 | | |
Total Asset-Backed Securities — Non-Agency
(Cost: $99,655,569) | | | | | | | 98,012,287 | | |
U.S. Treasury Obligations 12.9%
U.S. Treasury
02/29/16 | | | 0.250 | % | | | 8,069,000 | | | | 8,055,131 | | |
01/15/17 | | | 0.750 | % | | | 27,700,300 | | | | 27,700,300 | | |
03/31/19 | | | 1.625 | % | | | 16,480,000 | | | | 16,449,100 | | |
04/30/19 | | | 1.625 | % | | | 239,000 | | | | 238,365 | | |
02/28/21 | | | 2.000 | % | | | 3,105,000 | | | | 3,064,005 | | |
02/15/24 | | | 2.750 | % | | | 21,931,000 | | | | 22,122,896 | | |
U.S. Treasury(e)
11/15/43 | | | 3.750 | % | | | 4,388,700 | | | | 4,630,763 | | |
U.S. Treasury(i)
STRIPS
11/15/18 | | | 0.000 | % | | | 7,057,000 | | | | 6,562,375 | | |
11/15/19 | | | 0.000 | % | | | 4,135,000 | | | | 3,712,804 | | |
02/15/40 | | | 0.000 | % | | | 14,141,000 | | | | 5,693,421 | | |
11/15/41 | | | 0.000 | % | | | 5,013,000 | | | | 1,871,273 | | |
Total U.S. Treasury Obligations
(Cost: $98,708,078) | | | | | | | 100,100,433 | | |
The accompanying Notes to Financial Statements are an integral part of this statement.
Annual Report 2014
13
Portfolio of Investments (continued)
April 30, 2014
U.S. Government & Agency Obligations 7.7%
Issuer | | Coupon
Rate | | Principal
Amount ($) | | Value ($) | |
Federal National Mortgage Association
05/27/15 | | | 0.500 | % | | | 500,000 | | | | 501,798 | | |
Residual Funding Corp.(i)
STRIPS
10/15/19 | | | 0.000 | % | | | 11,775,000 | | | | 10,504,160 | | |
10/15/20 | | | 0.000 | % | | | 18,760,000 | | | | 16,021,622 | | |
01/15/21 | | | 0.000 | % | | | 26,765,000 | | | | 22,622,260 | | |
01/15/30 | | | 0.000 | % | | | 14,000,000 | | | | 7,977,662 | | |
STRIPS Senior Unsecured
07/15/20 | | | 0.000 | % | | | 2,114,000 | | | | 1,824,553 | | |
Total U.S. Government & Agency Obligations
(Cost: $53,274,380) | | | | | | | 59,452,055 | | |
Foreign Government Obligations(j) 1.8%
Brazil 0.2% | |
Brazilian Government International Bond
Senior Unsecured
01/20/34 | | | 8.250 | % | | | 345,000 | | | | 465,750 | | |
01/07/41 | | | 5.625 | % | | | 789,000 | | | | 825,002 | | |
Total | | | | | | | 1,290,752 | | |
Chile 0.1% | |
Chile Government International Bond
Senior Unsecured
10/30/22 | | | 2.250 | % | | | 430,000 | | | | 397,213 | | |
Colombia 0.2% | |
Colombia Government International Bond
Senior Unsecured
01/18/41 | | | 6.125 | % | | | 1,096,000 | | | | 1,259,591 | | |
France —% | |
Electricite de France SA(a)(b)
12/31/49 | | | 5.625 | % | | | 364,000 | | | | 373,555 | | |
Italy 0.1% | |
Republic of Italy
Senior Unsecured
09/27/23 | | | 6.875 | % | | | 760,000 | | | | 938,884 | | |
Mexico 0.6% | |
Mexico Government International Bond
Senior Unsecured
03/15/22 | | | 3.625 | % | | | 1,839,000 | | | | 1,863,827 | | |
Petroleos Mexicanos
03/01/18 | | | 5.750 | % | | | 2,650,000 | | | | 2,944,812 | | |
Total | | | | | | | 4,808,639 | | |
Foreign Government Obligations(j) (continued)
Issuer | | Coupon
Rate | | Principal
Amount ($) | | Value ($) | |
Poland 0.1% | |
Poland Government International Bond
Senior Unsecured
03/23/22 | | | 5.000 | % | | | 830,000 | | | | 903,662 | | |
Qatar 0.4% | |
Nakilat, Inc.
Senior Secured(b)
12/31/33 | | | 6.067 | % | | | 2,615,000 | | | | 2,758,825 | | |
Ras Laffan Liquefied Natural Gas Co., Ltd. III
Senior Secured(b)
09/30/16 | | | 5.832 | % | | | 730,240 | | | | 775,880 | | |
Total | | | | | | | 3,534,705 | | |
Turkey 0.1% | |
Turkey Government International Bond
01/14/41 | | | 6.000 | % | | | 425,000 | | | | 439,663 | | |
Total Foreign Government Obligations
(Cost: $13,043,851) | | | | | | | 13,946,664 | | |
Municipal Bonds 1.8%
Issue
Description | | Coupon
Rate | | Principal
Amount ($) | | Value ($) | |
California 0.8% | |
Los Angeles Unified School District
Unlimited General Obligation Bonds
Build America Bonds
Series 2009
07/01/34 | | | 5.750 | % | | | 2,485,000 | | | | 2,963,785 | | |
State of California
Unlimited General Obligation Bonds
Taxable
Series 2010
11/01/15 | | | 3.950 | % | | | 835,000 | | | | 879,230 | | |
Taxable Build America Bonds
Series 2009
04/01/39 | | | 7.550 | % | | | 1,720,000 | | | | 2,448,145 | | |
Total | | | | | | | 6,291,160 | | |
Georgia 0.1% | |
State of Georgia
Unlimited General Obligation Refunding Bonds
Series 2013-C
10/01/23 | | | 4.000 | % | | | 535,000 | | | | 606,000 | | |
The accompanying Notes to Financial Statements are an integral part of this statement.
Annual Report 2014
14
Portfolio of Investments (continued)
April 30, 2014
Municipal Bonds (continued)
Issue
Description | | Coupon
Rate | | Principal
Amount ($) | | Value ($) | |
Illinois 0.5% | |
City of Chicago Waterworks
Refunding Revenue Bonds
2nd Lien
Series 2012
11/01/42 | | | 5.000 | % | | | 635,000 | | | | 655,415 | | |
Revenue Bonds
Build America Bonds
Series 2010
11/01/40 | | | 6.742 | % | | | 865,000 | | | | 1,021,461 | | |
State of Illinois
Unlimited General Obligation Bonds
Series 2011
03/01/16 | | | 4.961 | % | | | 2,080,000 | | | | 2,227,139 | | |
Total | | | | | | | 3,904,015 | | |
Kentucky 0.2% | |
Kentucky Asset Liability Commission
Revenue Bonds
Taxable
Series 2010
04/01/18 | | | 3.165 | % | | | 1,929,613 | | | | 2,007,723 | | |
Ohio 0.2% | |
JobsOhio Beverage System
Taxable Revenue Bonds
Series 2013-B
01/01/35 | | | 4.532 | % | | | 1,310,000 | | | | 1,305,507 | | |
Total Municipal Bonds
(Cost: $12,482,921) | | | | | | | 14,114,405 | | |
Preferred Debt 1.9%
Issuer | | Coupon
Rate | | Principal
Amount ($) | | Value ($) | |
Banking 1.6% | |
Citigroup Capital XIII(a)
10/30/40 | | | 7.875 | % | | | 125,065 | | | | 3,409,272 | | |
PNC Financial Services Group, Inc. (The)(a)
12/31/49 | | | 6.125 | % | | | 147,050 | | | | 3,949,763 | | |
State Street Corp.(a)
12/31/49 | | | 5.900 | % | | | 20,000 | | | | 519,200 | | |
U.S. Bancorp(a)
12/31/49 | | | 6.500 | % | | | 113,575 | | | | 3,276,639 | | |
Wells Fargo & Co.(a)
12/31/49 | | | 5.850 | % | | | 45,000 | | | | 1,140,750 | | |
Total | | | | | | | 12,295,624 | | |
Preferred Debt (continued)
Issuer | | Coupon
Rate | | Principal
Amount ($) | | Value ($) | |
Property & Casualty 0.3% | |
Allstate Corp. (The)(a)
01/15/53 | | | 5.100 | % | | | 85,000 | | | | 2,135,200 | | |
Total Preferred Debt
(Cost: $13,828,443) | | | | | | | 14,430,824 | | |
Common Stocks —%
Issuer | | Shares | | Value ($) | |
Consumer Staples —% | |
Beverages —% | |
Crimson Wine Group Ltd.(k) | | | 3 | | | | 27 | | |
Total Consumer Staples | | | | | 27 | | |
Financials —% | |
Diversified Financial Services —% | |
Leucadia National Corp. | | | 39 | | | | 995 | | |
Total Financials | | | | | 995 | | |
Total Common Stocks
(Cost: $—) | | | | | 1,022 | | |
Treasury Bills 10.0%
Issuer | | Effective
Yield | | Principal
Amount ($) | | Value ($) | |
United States 10.0% | |
U.S. Treasury Bill
08/21/14 | | | 0.030 | % | | | 77,765,000 | | | | 77,757,768 | | |
Total Treasury Bills
(Cost: $77,757,518) | | | | | | | 77,757,768 | | |
Money Market Funds 0.1%
| | | Shares | | Value ($) | |
Columbia Short-Term Cash Fund,
0.092%(l)(m) | | | 853,254 | | | | 853,254 | | |
Total Money Market Funds
(Cost: $853,254) | | | | | 853,254 | | |
Total Investments
(Cost: $862,386,989) | | | | | 884,393,991 | | |
Other Assets & Liabilities, Net | | | | | (111,228,581 | ) | |
Net Assets | | | | | 773,165,410 | | |
The accompanying Notes to Financial Statements are an integral part of this statement.
Annual Report 2014
15
Portfolio of Investments (continued)
April 30, 2014
Investments in Derivatives
Futures Contracts Outstanding at April 30, 2014
At April 30, 2014, securities totaling $1,727,694 were pledged as collateral to cover initial margin requirements on open futures contracts.
Contract Description | | Number of
Contracts Long
(Short) | | Trading
Currency | | Notional
Market
Value ($) | | Expiration
Date | | Unrealized
Appreciation ($) | | Unrealized
Depreciation ($) | |
US 2YR NOTE | | | 99 | | | USD | | | | | 21,767,625 | | | 06/2014 | | | 35,114 | | | | — | | |
US 5YR NOTE | | | 117 | | | USD | | | | | 13,976,016 | | | 06/2014 | | | 67,006 | | | | — | | |
US 10YR NOTE | | | (312 | ) | | USD | | | | | (38,819,627 | ) | | 06/2014 | | | — | | | | (43,714 | ) | |
US LONG BOND | | | (284 | ) | | USD | | | | | (38,322,250 | ) | | 06/2014 | | | — | | | | (938,688 | ) | |
US ULTRA T-BOND | | | (51 | ) | | USD | | | | | (7,511,344 | ) | | 06/2014 | | | — | | | | (200,907 | ) | |
Total | | | | | | | | | | | 102,120 | | | | (1,183,309 | ) | |
Credit Default Swap Contracts Outstanding at April 30, 2014
At April 30, 2014, securities totaling $920,450 were pledged as collateral to cover open centrally cleared credit default swap contracts.
Buy Protection
Counterparty | | Reference
Entity | | Expiration
Date | | Pay
Fixed
Rate (%) | | Notional
Amount
($) | | Market
Value
($) | | Unamortized
Premium
(Paid)
Received
($) | | Periodic
Payments
Receivable
(Payable)
($) | | Unrealized
Appreciation
($) | | Unrealized
Depreciation
($) | |
Citibank | | Nucor Corp. | | 9/20/18 | | | 1.00 | | | | 2,270,000 | | | | (50,904 | ) | | | 14,240 | | | | (2,648 | ) | | | — | | | | (39,312 | ) | |
Goldman Sachs
International | | Nucor Corp.
| | 9/20/18
| | | 1.00
| | | | 900,000
| | | | (20,182
| ) | | | 6,778
| | | | (1,050
| ) | | | —
| | | | (14,454
| ) | |
Barclays | | Telecom Italia SPA | | 9/20/18 | | | 1.00 | | | | 1,060,000 | | | | 29,041 | | | | (91,346 | ) | | | (1,237 | ) | | | — | | | | (63,542 | ) | |
Goldman Sachs
International | | Bank of
America Corp. | | 12/20/18
| | | 1.00
| | | | 4,125,000
| | | | (67,295
| ) | | | 25,592
| | | | (4,813
| ) | | | —
| | | | (46,516
| ) | |
Morgan Stanley*
| | CDX North
America
Investment
Grade 21-V1 | | 12/20/18
| | | 1.00
| | | | 42,505,000
| | | | (339,575
| ) | | | —
| | | | (49,589
| ) | | | —
| | | | (389,164
| ) | |
Goldman Sachs
International | | Barclays Bank, PLC
| | 6/20/19
| | | 1.00
| | | | 2,225,000
| | | | (31,498
| ) | | | 24,970
| | | | (2,596
| ) | | | —
| | | | (9,124
| ) | |
Citibank | | McDonald's Corp. | | 6/20/19 | | | 1.00 | | | | 1,815,000 | | | | (75,577 | ) | | | 74,438 | | | | (2,118 | ) | | | — | | | | (3,257 | ) | |
Total | | | | | | | | | | | | | | | | | — | | | | (565,369 | ) | |
*Centrally cleared swap contract
The accompanying Notes to Financial Statements are an integral part of this statement.
Annual Report 2014
16
Portfolio of Investments (continued)
April 30, 2014
Interest Rate Swap Contracts Outstanding at April 30, 2014
At April 30, 2014, securities totaling $300,016 were pledged as collateral to cover open centrally cleared interest rate swap contracts.
Counterparty | | Floating Rate
Index | | Fund
Pay/Receive
Floating Rate | | Fixed
Rate (%) | | Expiration
Date | | Notional
Currency | | Notional
Amount ($) | | Unamortized
Premium
(Paid)
Received
($) | | Unrealized
Appreciation
($) | | Unrealized
Depreciation
($) | |
Morgan Stanley*
| | 3-Month
USD LIBOR-BBA | | Receive
| | | 0.825
| | | 3/4/17
| | USD |
| | | | 13,705,000
| | | | (50
| ) | | | 18,123
| | | | —
| | |
Morgan Stanley*
| | 3-Month
USD LIBOR-BBA | | Receive
| | | 0.834
| | | 3/7/17
| | USD |
| | | | 41,200,000
| | | | (335
| ) | | | 47,370
| | | | —
| | |
Morgan Stanley*
| | 3-Month
USD LIBOR-BBA | | Pay
| | | 1.632
| | | 3/7/19
| | USD |
| | | | 25,100,000
| | | | (352
| ) | | | —
| | | | (44,712
| ) | |
Total | | | | | | | | | | | | | | | | | 65,493 | | | | (44,712 | ) | |
*Centrally cleared swap contract
Notes to Portfolio of Investments
(a) Variable rate security.
(b) Security exempt from registration pursuant to Rule 144A under the Securities Act of 1933. This security may be resold in transactions exempt from registration, normally to qualified institutional buyers. At April 30, 2014, the value of these securities amounted to $47,482,569 or 6.14% of net assets.
(c) Represents a security purchased on a when-issued or delayed delivery basis.
(d) The maturity dates shown represent the original maturity of the underlying obligation. Actual maturity may vary based upon prepayment activity on these obligations. Unless otherwise noted, the coupon rates presented are fixed rates.
(e) This security, or a portion of this security, has been pledged as collateral in connection with open futures contracts and swap contracts. These values are denoted within the Investments in Derivatives section of the Portfolio of Investments.
(f) Interest Only (IO) security. The actual effective yield of this security is different than the stated coupon rate.
(g) Identifies issues considered by the Investment Manager to be illiquid as to their marketability. The aggregate value of such securities at April 30, 2014 was $3,305, representing less than 0.01% of net assets. Information concerning such security holdings at April 30, 2014 is as follows:
Security Description | | Acquisition Dates | | Cost ($) | |
American Mortgage Trust
Series 2093-3 Class 3A
07/27/23 8.188% | | 10/22/10 - 10/12/11 | | | 3,664 | | |
(h) Represents fair value as determined in good faith under procedures approved by the Board of Trustees. At April 30, 2014, the value of these securities amounted to $3,305, which represents less than 0.01% of net assets.
(i) Zero coupon bond.
(j) Principal and interest may not be guaranteed by the government.
(k) Non-income producing.
(l) The rate shown is the seven-day current annualized yield at April 30, 2014.
The accompanying Notes to Financial Statements are an integral part of this statement.
Annual Report 2014
17
Portfolio of Investments (continued)
April 30, 2014
Notes to Portfolio of Investments (continued)
(m) As defined in the Investment Company Act of 1940, an affiliated company is one in which the Fund owns 5% or more of its outstanding voting securities, or a company which is under common ownership or control with the Fund. Holdings and transactions in these affiliated companies during the year ended April 30, 2014, are as follows:
Issuer | | Beginning
Cost ($) | | Purchase
Cost ($) | | Proceeds
From Sales ($) | | Ending
Cost ($) | | Dividends —
Affiliated
Issuers ($) | | Value ($) | |
Columbia Short-Term Cash Fund | | | 5,431,696 | | | | 647,635,153 | | | | (652,213,595 | ) | | | 853,254 | | | | 23,075 | | | | 853,254 | | |
Abbreviation Legend
CMO Collateralized Mortgage Obligation
STRIPS Separate Trading of Registered Interest and Principal Securities
Currency Legend
USD US Dollar
Fair Value Measurements
Generally accepted accounting principles (GAAP) require disclosure regarding the inputs and valuation techniques used to measure fair value and any changes in valuation inputs or techniques. In addition, investments shall be disclosed by major category.
The Fund categorizes its fair value measurements according to a three-level hierarchy that maximizes the use of observable inputs and minimizes the use of unobservable inputs by prioritizing that the most observable input be used when available. Observable inputs are those that market participants would use in pricing an investment based on market data obtained from sources independent of the reporting entity. Unobservable inputs are those that reflect the Fund's assumptions about the information market participants would use in pricing an investment. An investment's level within the fair value hierarchy is based on the lowest level of any input that is deemed significant to the asset or liability's fair value measurement. The input levels are not necessarily an indication of the risk or liquidity associated with investments at that level. For example, certain U.S. government securities are generally high quality and liquid, however, they are reflected as Level 2 because the inputs used to determine fair value may not always be quoted prices in an active market.
Fair value inputs are summarized in the three broad levels listed below:
> Level 1 — Valuations based on quoted prices for investments in active markets that the Fund has the ability to access at the measurement date (including NAV for open-end mutual funds). Valuation adjustments are not applied to Level 1 investments.
> Level 2 — Valuations based on other significant observable inputs (including quoted prices for similar securities, interest rates, prepayment speeds, credit risks, etc.).
> Level 3 — Valuations based on significant unobservable inputs (including the Fund's own assumptions and judgment in determining the fair value of investments).
Inputs that are used in determining fair value of an investment may include price information, credit data, volatility statistics, and other factors. These inputs can be either observable or unobservable. The availability of observable inputs can vary between investments, and is affected by various factors such as the type of investment, and the volume and level of activity for that investment or similar investments in the marketplace. The inputs will be considered by the Investment Manager, along with any other relevant factors in the calculation of an investment's fair value. The Fund uses prices and inputs that are current as of the measurement date, which may include periods of market dislocations. During these periods, the availability of prices and inputs may be reduced for many investments. This condition could cause an investment to be reclassified between the various levels within the hierarchy.
Investments falling into the Level 3 category are primarily supported by quoted prices from brokers and dealers participating in the market for those investments. However, these may be classified as Level 3 investments due to lack of market transparency and corroboration to support these quoted prices. Additionally, valuation models may be used as the pricing source for any remaining investments classified as Level 3. These models may rely on one or more significant unobservable inputs and/or significant assumptions by the Investment Manager. Inputs used in valuations may include, but are not limited to, financial statement analysis, capital account balances, discount rates and estimated cash flows, and comparable company data.
The accompanying Notes to Financial Statements are an integral part of this statement.
Annual Report 2014
18
Portfolio of Investments (continued)
April 30, 2014
Fair Value Measurements (continued)
Under the direction of the Fund's Board of Trustees (the Board), the Investment Manager's Valuation Committee (the Committee) is responsible for overseeing the valuation procedures approved by the Board. The Committee consists of voting and non-voting members from various groups within the Investment Manager's organization, including operations and accounting, trading and investments, compliance, risk management and legal.
The Committee meets at least monthly to review and approve valuation matters, which may include a description of specific valuation determinations, data regarding pricing information received from approved pricing vendors and brokers and the results of Board-approved valuation control policies and procedures (the Policies). The Policies address, among other things, instances when market quotations are or are not readily available, including recommendations of third party pricing vendors and a determination of appropriate pricing methodologies; events that require specific valuation determinations and assessment of fair value techniques; securities with a potential for stale pricing, including those that are illiquid, restricted, or in default; and the effectiveness of third party pricing vendors, including periodic reviews of vendors. The Committee meets more frequently, as needed, to discuss additional valuation matters, which may include the need to review back-testing results, review time-sensitive information or approve related valuation actions. The Committee reports to the Board, with members of the Committee meeting with the Board at each of its regularly scheduled meetings to discuss valuation matters and actions during the period, similar to those described earlier.
For investments categorized as Level 3, the Committee monitors information similar to that described above, which may include: (i) data specific to the issuer or comparable issuers, (ii) general market or specific sector news and (iii) quoted prices and specific or similar security transactions. The Committee considers this data and any changes from prior periods in order to assess the reasonableness of observable and unobservable inputs, any assumptions or internal models used to value those securities and changes in fair value. This data is also used to corroborate, when available, information received from approved pricing vendors and brokers. Various factors impact the frequency of monitoring this information (which may occur as often as daily). However, the Committee may determine that changes to inputs, assumptions and models are not required as a result of the monitoring procedures performed.
The accompanying Notes to Financial Statements are an integral part of this statement.
Annual Report 2014
19
Portfolio of Investments (continued)
April 30, 2014
Fair Value Measurements (continued)
The following table is a summary of the inputs used to value the Fund's investments at April 30, 2014:
Description | | Level 1
Quoted Prices in Active
Markets for Identical
Assets ($) | | Level 2
Other Significant
Observable Inputs ($) | | Level 3
Significant
Unobservable Inputs ($) | | Total ($) | |
Bonds | |
Corporate Bonds & Notes | | | — | | | | 197,722,777 | | | | — | | | | 197,722,777 | | |
Residential Mortgage-Backed
Securities — Agency | | | — | | | | 216,956,784 | | | | — | | | | 216,956,784 | | |
Residential Mortgage-Backed
Securities — Non-Agency | | | — | | | | 10,688,957 | | | | 3,305 | | | | 10,692,262 | | |
Commercial Mortgage-Backed
Securities — Non-Agency | | | — | | | | 51,911,870 | | | | — | | | | 51,911,870 | | |
Asset-Backed Securities — Agency | | | — | | | | 28,441,586 | | | | — | | | | 28,441,586 | | |
Asset-Backed Securities — Non-Agency | | | — | | | | 96,642,355 | | | | 1,369,932 | | | | 98,012,287 | | |
U.S. Treasury Obligations | | | 82,260,560 | | | | 17,839,873 | | | | — | | | | 100,100,433 | | |
U.S. Government & Agency Obligations | | | — | | | | 59,452,055 | | | | — | | | | 59,452,055 | | |
Foreign Government Obligations | | | — | | | | 13,946,664 | | | | — | | | | 13,946,664 | | |
Municipal Bonds | | | — | | | | 14,114,405 | | | | — | | | | 14,114,405 | | |
Preferred Debt | | | 14,430,824 | | | | — | | | | — | | | | 14,430,824 | | |
Total Bonds | | | 96,691,384 | | | | 707,717,326 | | | | 1,373,237 | | | | 805,781,947 | | |
Equity Securities | |
Common Stocks | |
Consumer Staples | | | 27 | | | | — | | | | — | | | | 27 | | |
Financials | | | 995 | | | | — | | | | — | | | | 995 | | |
Total Equity Securities | | | 1,022 | | | | — | | | | — | | | | 1,022 | | |
Short-Term Securities | |
Treasury Bills | | | 77,757,768 | | | | — | | | | — | | | | 77,757,768 | | |
Total Short-Term Securities | | | 77,757,768 | | | | — | | | | — | | | | 77,757,768 | | |
Mutual Funds | |
Money Market Funds | | | 853,254 | | | | — | | | | — | | | | 853,254 | | |
Total Mutual Funds | | | 853,254 | | | | — | | | | — | | | | 853,254 | | |
Investments in Securities | | | 175,303,428 | | | | 707,717,326 | | | | 1,373,237 | | | | 884,393,991 | | |
Derivatives | |
Assets | |
Futures Contracts | | | 102,120 | | | | — | | | | — | | | | 102,120 | | |
Swap Contracts | | | — | | | | 65,493 | | | | — | | | | 65,493 | | |
Liabilities | |
Futures Contracts | | | (1,183,309 | ) | | | — | | | | — | | | | (1,183,309 | ) | |
Swap Contracts | | | — | | | | (610,081 | ) | | | — | | | | (610,081 | ) | |
Total | | | 174,222,239 | | | | 707,172,738 | | | | 1,373,237 | | | | 882,768,214 | | |
See the Portfolio of Investments for all investment classifications not indicated in the table.
The accompanying Notes to Financial Statements are an integral part of this statement.
Annual Report 2014
20
Portfolio of Investments (continued)
April 30, 2014
Fair Value Measurements (continued)
The Fund's assets assigned to the Level 2 input category are generally valued using the market approach, in which a security's value is determined through reference to prices and information from market transactions for similar or identical assets.
There were no transfers of financial assets between Levels 1 and 2 during the period.
Derivative instruments are valued at unrealized appreciation (depreciation).
The Fund does not hold any significant investments with unobservable inputs which are categorized as Level 3.
The Fund's assets assigned to the Level 3 category are valued utilizing the valuation technique deemed the most appropriate in the circumstances.
Certain asset backed securities classified as Level 3 are valued using the market approach and utilize single market quotations from broker dealers which may have included, but not limited to, the distressed nature of the security and observable transactions for similar assets in the market. Significant increases (decreases) to any of these inputs would result in a significantly lower (higher) fair value measurement.
Certain residential mortgage backed securities classified as Level 3 securities are valued using the market approach. To determine fair value for these securities, management considered various factors which may have included, but were not limited to, estimated cash flows of the securities, discount rates observed in the market for similar assets as well as observed yields on securities management deemed comparable. Significant increases (decreases) to any of these inputs would result in a significantly lower (higher) fair value measurement. Generally, a change in observable yields on comparable securities would result in a directionally similar change to discount rates.
Financial assets were transferred from Level 3 to Level 2 as observable market inputs were utilized and management's determination that there was sufficient, reliable and observable market data to value these assets as of period end.
Transfers In | | Transfers Out | |
Level 2 ($) | | Level 3 ($) | | Level 2 ($) | | Level 3 ($) | |
| | 2,385,226 | | | | — | | | | — | | | | 2,385,226 | | |
Transfers in and/or out of Level 3 are determined based on the fair value at the beginning of the period for security positions held throughout the period.
The accompanying Notes to Financial Statements are an integral part of this statement.
Annual Report 2014
21
Statement of Assets and Liabilities
April 30, 2014
Assets | |
Investments, at value | |
Unaffiliated issuers (identified cost $861,533,735) | | $ | 883,540,737 | | |
Affiliated issuers (identified cost $853,254) | | | 853,254 | | |
Total investments (identified cost $862,386,989) | | | 884,393,991 | | |
Premiums paid on outstanding swap contracts | | | 92,083 | | |
Receivable for: | |
Investments sold | | | 8,947,971 | | |
Capital shares sold | | | 1,039,958 | | |
Dividends | | | 56,751 | | |
Interest | | | 3,628,921 | | |
Variation margin | | | 101,850 | | |
Prepaid expenses | | | 2,646 | | |
Trustees' deferred compensation plan | | | 164,192 | | |
Other assets | | | 3,240 | | |
Total assets | | | 898,431,603 | | |
Liabilities | |
Unrealized depreciation on swap contracts | | | 176,205 | | |
Premiums received on outstanding swap contracts | | | 146,018 | | |
Payable for: | |
Investments purchased | | | 8,363,689 | | |
Investments purchased on a delayed delivery basis | | | 113,831,107 | | |
Capital shares purchased | | | 559,424 | | |
Dividend distributions to shareholders | | | 1,355,299 | | |
Variation margin | | | 414,057 | | |
Investment management fees | | | 9,090 | | |
Distribution and/or service fees | | | 785 | | |
Transfer agent fees | | | 136,312 | | |
Administration fees | | | 1,443 | | |
Compensation of board members | | | 46,226 | | |
Chief compliance officer expenses | | | 61 | | |
Expense reimbursement due to Investment Manager | | | 117 | | |
Other expenses | | | 62,168 | | |
Trustees' deferred compensation plan | | | 164,192 | | |
Total liabilities | | | 125,266,193 | | |
Net assets applicable to outstanding capital stock | | $ | 773,165,410 | | |
Represented by | |
Paid-in capital | | $ | 746,951,443 | | |
Undistributed net investment income | | | 1,972,268 | | |
Accumulated net realized gain | | | 3,869,460 | | |
Unrealized appreciation (depreciation) on: | |
Investments | | | 22,007,002 | | |
Futures contracts | | | (1,081,189 | ) | |
Swap contracts | | | (553,574 | ) | |
Total — representing net assets applicable to outstanding capital stock | | $ | 773,165,410 | | |
The accompanying Notes to Financial Statements are an integral part of this statement.
Annual Report 2014
22
Statement of Assets and Liabilities (continued)
April 30, 2014
Class A | |
Net assets | | $ | 61,158,633 | | |
Shares outstanding | | | 6,904,593 | | |
Net asset value per share | | $ | 8.86 | | |
Maximum offering price per share(a) | | $ | 9.30 | | |
Class B | |
Net assets | | $ | 1,036,724 | | |
Shares outstanding | | | 117,053 | | |
Net asset value per share | | $ | 8.86 | | |
Class C | |
Net assets | | $ | 10,917,312 | | |
Shares outstanding | | | 1,233,734 | | |
Net asset value per share | | $ | 8.85 | | |
Class I | |
Net assets | | $ | 10,091 | | |
Shares outstanding | | | 1,136 | | |
Net asset value per share | | $ | 8.88 | | |
Class R | |
Net assets | | $ | 2,498,304 | | |
Shares outstanding | | | 282,003 | | |
Net asset value per share | | $ | 8.86 | | |
Class R4 | |
Net assets | | $ | 28,241 | | |
Shares outstanding | | | 3,190 | | |
Net asset value per share | | $ | 8.85 | | |
Class R5 | |
Net assets | | $ | 471,066 | | |
Shares outstanding | | | 53,308 | | |
Net asset value per share | | $ | 8.84 | | |
Class T | |
Net assets | | $ | 12,350,535 | | |
Shares outstanding | | | 1,396,310 | | |
Net asset value per share | | $ | 8.85 | | |
Maximum offering price per share(a) | | $ | 9.29 | | |
Class W | |
Net assets | | $ | 10,091 | | |
Shares outstanding | | | 1,138 | | |
Net asset value per share | | $ | 8.87 | | |
Class Y | |
Net assets | | $ | 25,146,641 | | |
Shares outstanding | | | 2,834,737 | | |
Net asset value per share | | $ | 8.87 | | |
Class Z | |
Net assets | | $ | 659,537,772 | | |
Shares outstanding | | | 74,457,104 | | |
Net asset value per share | | $ | 8.86 | | |
(a) The maximum offering price per share is calculated by dividing the net asset value per share by 1.0 minus the maximum sales charge of 4.75%.
The accompanying Notes to Financial Statements are an integral part of this statement.
Annual Report 2014
23
Statement of Operations
Year Ended April 30, 2014
Net investment income | |
Income: | |
Dividends — unaffiliated issuers | | $ | 907,560 | | |
Dividends — affiliated issuers | | | 23,075 | | |
Interest | | | 25,856,015 | | |
Total income | | | 26,786,650 | | |
Expenses: | |
Investment management fees | | | 4,135,423 | | |
Distribution and/or service fees | |
Class A | | | 167,084 | | |
Class B | | | 14,935 | | |
Class C | | | 124,734 | | |
Class R | | | 12,602 | | |
Class T | | | 19,545 | | |
Class W | | | 7 | | |
Transfer agent fees | |
Class A | | | 134,354 | | |
Class B | | | 3,012 | | |
Class C | | | 25,084 | | |
Class R | | | 5,056 | | |
Class R4 | | | 86 | | |
Class R5 | | | 5,762 | | |
Class T | | | 26,174 | | |
Class W | | | 5 | | |
Class Z | | | 1,671,611 | | |
Administration fees | | | 648,503 | | |
Compensation of board members | | | 49,343 | | |
Custodian fees | | | 36,905 | | |
Printing and postage fees | | | 32,168 | | |
Registration fees | | | 132,784 | | |
Professional fees | | | 62,529 | | |
Chief compliance officer expenses | | | 439 | | |
Other | | | 31,333 | | |
Total expenses | | | 7,339,478 | | |
Fees waived or expenses reimbursed by Investment Manager and its affiliates | | | (238,061 | ) | |
Fees waived by Distributor — Class C | | | (18,710 | ) | |
Expense reductions | | | (2,411 | ) | |
Total net expenses | | | 7,080,296 | | |
Net investment income | | | 19,706,354 | | |
Realized and unrealized gain (loss) — net | |
Net realized gain (loss) on: | |
Investments | | | 5,460,682 | | |
Futures contracts | | | 4,590,401 | | |
Swap contracts | | | (1,350,113 | ) | |
Net realized gain | | | 8,700,970 | | |
Net change in unrealized appreciation (depreciation) on: | |
Investments | | | (54,468,473 | ) | |
Forward sale commitments | | | 22,168 | | |
Futures contracts | | | 1,199,935 | | |
Swap contracts | | | (176,333 | ) | |
Net change in unrealized appreciation (depreciation) | | | (53,422,703 | ) | |
Net realized and unrealized loss | | | (44,721,733 | ) | |
Net decrease in net assets from operations | | $ | (25,015,379 | ) | |
The accompanying Notes to Financial Statements are an integral part of this statement.
Annual Report 2014
24
Statement of Changes in Net Assets
| | | Year Ended
April 30,
2014 | | Year Ended
April 30,
2013(a) | |
Operations | |
Net investment income | | $ | 19,706,354 | | | $ | 38,847,481 | | |
Net realized gain | | | 8,700,970 | | | | 56,558,264 | | |
Net change in unrealized appreciation (depreciation) | | | (53,422,703 | ) | | | (29,956,493 | ) | |
Net increase (decrease) in net assets resulting from operations | | | (25,015,379 | ) | | | 65,449,252 | | |
Distributions to shareholders | |
Net investment income | |
Class A | | | (1,259,057 | ) | | | (1,979,344 | ) | |
Class B | | | (16,798 | ) | | | (42,867 | ) | |
Class C | | | (159,757 | ) | | | (305,715 | ) | |
Class I | | | (68 | ) | | | (48,501 | ) | |
Class R | | | (41,327 | ) | | | (51,359 | ) | |
Class R4 | | | (861 | ) | | | (93 | ) | |
Class R5 | | | (281,346 | ) | | | (32,233 | ) | |
Class T | | | (258,778 | ) | | | (375,064 | ) | |
Class W | | | (56 | ) | | | (60 | ) | |
Class Y | | | (546,427 | ) | | | (621,782 | ) | |
Class Z | | | (17,646,221 | ) | | | (34,718,187 | ) | |
Net realized gains | |
Class A | | | (1,951,137 | ) | | | (2,538,005 | ) | |
Class B | | | (44,693 | ) | | | (79,696 | ) | |
Class C | | | (366,449 | ) | | | (534,003 | ) | |
Class I | | | (76 | ) | | | (21,441 | ) | |
Class R | | | (80,586 | ) | | | (71,336 | ) | |
Class R4 | | | (405 | ) | | | (54 | ) | |
Class R5 | | | (15,028 | ) | | | (54 | ) | |
Class T | | | (412,706 | ) | | | (459,053 | ) | |
Class W | | | (76 | ) | | | (76 | ) | |
Class Y | | | (738,633 | ) | | | (670,742 | ) | |
Class Z | | | (25,393,842 | ) | | | (39,173,518 | ) | |
Total distributions to shareholders | | | (49,214,327 | ) | | | (81,723,183 | ) | |
Increase (decrease) in net assets from capital stock activity | | | (405,009,509 | ) | | | (489,968,623 | ) | |
Total decrease in net assets | | | (479,239,215 | ) | | | (506,242,554 | ) | |
Net assets at beginning of year | | | 1,252,404,625 | | | | 1,758,647,179 | | |
Net assets at end of year | | $ | 773,165,410 | | | $ | 1,252,404,625 | | |
Undistributed net investment income | | $ | 1,972,268 | | | $ | 1,264,866 | | |
(a) Class R4 and Class R5 shares are for the period from November 8, 2012 (commencement of operations) to April 30, 2013.
The accompanying Notes to Financial Statements are an integral part of this statement.
Annual Report 2014
25
Statement of Changes in Net Assets (continued)
| | | Year Ended April 30, 2014 | | Year Ended April 30, 2013(a) | |
| | | Shares | | Dollars ($) | | Shares | | Dollars ($) | |
Capital stock activity | |
Class A shares | |
Subscriptions(b) | | | 1,642,904 | | | | 14,653,752 | | | | 2,152,271 | | | | 20,595,774 | | |
Distributions reinvested | | | 257,870 | | | | 2,276,844 | | | | 343,791 | | | | 3,277,855 | | |
Redemptions | | | (3,742,161 | ) | | | (33,627,879 | ) | | | (2,407,125 | ) | | | (22,970,503 | ) | |
Net increase (decrease) | | | (1,841,387 | ) | | | (16,697,283 | ) | | | 88,937 | | | | 903,126 | | |
Class B shares | |
Subscriptions | | | 8,642 | | | | 76,708 | | | | 39,826 | | | | 381,108 | | |
Distributions reinvested | | | 3,945 | | | | 34,699 | | | | 6,894 | | | | 65,740 | | |
Redemptions(b) | | | (118,561 | ) | | | (1,063,144 | ) | | | (123,518 | ) | | | (1,177,009 | ) | |
Net decrease | | | (105,974 | ) | | | (951,737 | ) | | | (76,798 | ) | | | (730,161 | ) | |
Class C shares | |
Subscriptions | | | 226,424 | | | | 2,008,240 | | | | 434,515 | | | | 4,166,558 | | |
Distributions reinvested | | | 49,204 | | | | 432,885 | | | | 65,030 | | | | 619,245 | | |
Redemptions | | | (714,867 | ) | | | (6,415,375 | ) | | | (616,256 | ) | | | (5,857,847 | ) | |
Net decrease | | | (439,239 | ) | | | (3,974,250 | ) | | | (116,711 | ) | | | (1,072,044 | ) | |
Class I shares | |
Subscriptions | | | 874 | | | | 7,700 | | | | 2,332 | | | | 22,455 | | |
Distributions reinvested | | | — | | | | — | | | | 6,884 | | | | 66,163 | | |
Redemptions | | | (1 | ) | | | (5 | ) | | | (1,630,109 | ) | | | (15,670,953 | ) | |
Net increase (decrease) | | | 873 | | | | 7,695 | | | | (1,620,893 | ) | | | (15,582,335 | ) | |
Class R shares | |
Subscriptions | | | 93,367 | | | | 822,533 | | | | 61,487 | | | | 584,096 | | |
Distributions reinvested | | | 13,784 | | | | 121,463 | | | | 12,841 | | | | 122,422 | | |
Redemptions | | | (95,487 | ) | | | (841,503 | ) | | | (70,488 | ) | | | (674,974 | ) | |
Net increase | | | 11,664 | | | | 102,493 | | | | 3,840 | | | | 31,544 | | |
Class R4 shares | |
Subscriptions | | | 7,632 | | | | 70,227 | | | | 5,825 | | | | 55,000 | | |
Distributions reinvested | | | 122 | | | | 1,088 | | | | 7 | | | | 71 | | |
Redemptions | | | (10,396 | ) | | | (93,388 | ) | | | — | | | | — | | |
Net increase (decrease) | | | (2,642 | ) | | | (22,073 | ) | | | 5,832 | | | | 55,071 | | |
Class R5 shares | |
Subscriptions | | | 67,046 | | | | 614,432 | | | | 3,512,463 | | | | 33,153,336 | | |
Distributions reinvested | | | 31,881 | | | | 288,951 | | | | 3,410 | | | | 32,210 | | |
Redemptions | | | (3,561,254 | ) | | | (32,085,041 | ) | | | (238 | ) | | | (2,239 | ) | |
Net increase (decrease) | | | (3,462,327 | ) | | | (31,181,658 | ) | | | 3,515,635 | | | | 33,183,307 | | |
The accompanying Notes to Financial Statements are an integral part of this statement.
Annual Report 2014
26
Statement of Changes in Net Assets (continued)
| | | Year Ended April 30, 2014 | | Year Ended April 30, 2013(a) | |
| | | Shares | | Dollars ($) | | Shares | | Dollars ($) | |
Capital stock activity (continued) | |
Class T shares | |
Subscriptions | | | 6,196 | | | | 55,341 | | | | 19,829 | | | | 190,071 | | |
Distributions reinvested | | | 53,551 | | | | 471,538 | | | | 59,921 | | | | 570,695 | | |
Redemptions | | | (188,873 | ) | | | (1,685,979 | ) | | | (188,081 | ) | | | (1,791,898 | ) | |
Net decrease | | | (129,126 | ) | | | (1,159,100 | ) | | | (108,331 | ) | | | (1,031,132 | ) | |
Class W shares | |
Subscriptions | | | 875 | | | | 7,696 | | | | — | | | | — | | |
Distributions reinvested | | | — | | | | — | | | | — | | | | — | | |
Net increase | | | 875 | | | | 7,696 | | | | — | | | | — | | |
Class Y shares | |
Subscriptions | | | 317,727 | | | | 2,810,782 | | | | 356,993 | | | | 3,394,135 | | |
Distributions reinvested | | | — | | | | — | | | | 1 | | | | 5 | | |
Redemptions | | | (55,045 | ) | | | (491,005 | ) | | | (153,129 | ) | | | (1,475,447 | ) | |
Net increase | | | 262,682 | | | | 2,319,777 | | | | 203,865 | | | | 1,918,693 | | |
Class Z shares | |
Subscriptions | | | 4,248,082 | | | | 38,043,278 | | | | 11,092,312 | | | | 106,212,720 | | |
Distributions reinvested | | | 774,486 | | | | 6,844,689 | | | | 1,492,429 | | | | 14,234,311 | | |
Redemptions | | | (44,420,035 | ) | | | (398,349,036 | ) | | | (65,672,511 | ) | | | (628,091,723 | ) | |
Net decrease | | | (39,397,467 | ) | | | (353,461,069 | ) | | | (53,087,770 | ) | | | (507,644,692 | ) | |
Total net decrease | | | (45,102,068 | ) | | | (405,009,509 | ) | | | (51,192,394 | ) | | | (489,968,623 | ) | |
(a) Class R4 and Class R5 shares are for the period from November 8, 2012 (commencement of operations) to April 30, 2013.
(b) Includes conversions of Class B shares to Class A shares, if any.
The accompanying Notes to Financial Statements are an integral part of this statement.
Annual Report 2014
27
The following tables are intended to help you understand the Fund's financial performance. Certain information reflects financial results for a single share of a class held for the periods shown. Per share net investment income (loss) amounts are calculated based on average shares outstanding during the period. Total return assumes reinvestment of all dividends and distributions, if any. Total return does not reflect payment of sales charges, if any, and is not annualized for periods of less than one year.
| | | Year Ended April 30, | | Year Ended March 31, | |
Class A | | 2014 | | 2013 | | 2012(a) | | 2012 | | 2011 | | 2010 | |
Per share data | |
Net asset value, beginning of period | | $ | 9.46 | | | $ | 9.58 | | | $ | 9.50 | | | $ | 9.24 | | | $ | 9.28 | | | $ | 8.79 | | |
Income from investment operations: | |
Net investment income | | | 0.16 | | | | 0.23 | | | | 0.02 | | | | 0.29 | | | | 0.27 | | | | 0.31 | | |
Net realized and unrealized gain (loss) | | | (0.30 | ) | | | 0.17 | | | | 0.08 | | | | 0.38 | | | | 0.17 | | | | 0.59 | | |
Total from investment operations | | | (0.14 | ) | | | 0.40 | | | | 0.10 | | | | 0.67 | | | | 0.44 | | | | 0.90 | | |
Less distributions to shareholders: | |
Net investment income | | | (0.17 | ) | | | (0.23 | ) | | | (0.02 | ) | | | (0.29 | ) | | | (0.29 | ) | | | (0.33 | ) | |
Net realized gains | | | (0.29 | ) | | | (0.29 | ) | | | — | | | | (0.12 | ) | | | (0.19 | ) | | | (0.08 | ) | |
Total distributions to shareholders | | | (0.46 | ) | | | (0.52 | ) | | | (0.02 | ) | | | (0.41 | ) | | | (0.48 | ) | | | (0.41 | ) | |
Proceeds from regulatory settlements | | | — | | | | — | | | | — | | | | — | | | | — | | | | 0.00 | (b) | |
Net asset value, end of period | | $ | 8.86 | | | $ | 9.46 | | | $ | 9.58 | | | $ | 9.50 | | | $ | 9.24 | | | $ | 9.28 | | |
Total return | | | (1.42 | %) | | | 4.21 | % | | | 1.08 | % | | | 7.35 | % | | | 4.83 | % | | | 10.39 | %(c) | |
Ratios to average net assets(d) | |
Total gross expenses | | | 0.98 | % | | | 0.98 | % | | | 1.01 | %(e) | | | 0.99 | %(f) | | | 1.09 | % | | | 1.12 | % | |
Total net expenses(g) | | | 0.96 | %(h) | | | 0.90 | %(h) | | | 0.80 | %(e) | | | 0.80 | %(f)(h) | | | 0.80 | %(h) | | | 0.82 | %(h) | |
Net investment income | | | 1.83 | % | | | 2.43 | % | | | 2.94 | %(e) | | | 3.07 | % | | | 2.97 | % | | | 3.43 | % | |
Supplemental data | |
Net assets, end of period (in thousands) | | $ | 61,159 | | | $ | 82,739 | | | $ | 82,929 | | | $ | 82,041 | | | $ | 75,770 | | | $ | 15,362 | | |
Portfolio turnover | | | 360 | %(i) | | | 221 | %(i) | | | 10 | %(i) | | | 136 | %(i) | | | 178 | % | | | 256 | % | |
Notes to Financial Highlights
(a) For the period from April 1, 2012 to April 30, 2012. During the period, the Fund's fiscal year end was changed from March 31 to April 30.
(b) Rounds to zero.
(c) Total return includes a reimbursement of a loss experienced by the Fund due to a compliance violation. The reimbursement had an impact of less than 0.01% on total return.
(d) In addition to the fees and expenses which the Fund bears directly, the Fund indirectly bears a pro rata share of the fees and expenses of the acquired funds in which it invests. Such indirect expenses are not included in the reported expense ratios.
(e) Annualized.
(f) Ratios include line of credit interest expense which rounds to less than 0.01%.
(g) Total net expenses include the impact of certain waivers/reimbursements made by the Investment Manager and certain of its affiliates, if applicable.
(h) The benefits derived from expense reductions had an impact of less than 0.01%.
(i) Includes mortgage dollar rolls. If mortgage dollar roll transactions were excluded, the portfolio turnover would have been 234% and 119% for the years ended April 30, 2014 and 2013, respectively, and unchanged for the period ended April 30, 2012 and the year ended March 31, 2012.
The accompanying Notes to Financial Statements are an integral part of this statement.
Annual Report 2014
28
Financial Highlights (continued)
| | | Year Ended April 30, | | Year Ended March 31, | |
Class B | | 2014 | | 2013 | | 2012(a) | | 2012 | | 2011(b) | |
Per share data | |
Net asset value, beginning of period | | $ | 9.46 | | | $ | 9.58 | | | $ | 9.50 | | | $ | 9.24 | | | $ | 9.24 | | |
Income from investment operations: | |
Net investment income (loss) | | | 0.10 | | | | 0.16 | | | | 0.02 | | | | 0.22 | | | | (0.00 | )(c) | |
Net realized and unrealized gain (loss) | | | (0.31 | ) | | | 0.17 | | | | 0.08 | | | | 0.38 | | | | 0.01 | | |
Total from investment operations | | | (0.21 | ) | | | 0.33 | | | | 0.10 | | | | 0.60 | | | | 0.01 | | |
Less distributions to shareholders: | |
Net investment income | | | (0.10 | ) | | | (0.16 | ) | | | (0.02 | ) | | | (0.22 | ) | | | (0.01 | ) | |
Net realized gains | | | (0.29 | ) | | | (0.29 | ) | | | — | | | | (0.12 | ) | | | — | | |
Total distributions to shareholders | | | (0.39 | ) | | | (0.45 | ) | | | (0.02 | ) | | | (0.34 | ) | | | (0.01 | ) | |
Net asset value, end of period | | $ | 8.86 | | | $ | 9.46 | | | $ | 9.58 | | | $ | 9.50 | | | $ | 9.24 | | |
Total return | | | (2.15 | %) | | | 3.43 | % | | | 1.02 | % | | | 6.55 | % | | | 0.15 | % | |
Ratios to average net assets(d) | |
Total gross expenses | | | 1.73 | % | | | 1.73 | % | | | 1.76 | %(e) | | | 1.74 | %(f) | | | 1.86 | %(e) | |
Total net expenses(g) | | | 1.71 | %(h) | | | 1.65 | %(h) | | | 1.55 | %(e) | | | 1.55 | %(f)(h) | | | 1.55 | %(e)(h) | |
Net investment income (loss) | | | 1.07 | % | | | 1.70 | % | | | 2.18 | %(e) | | | 2.35 | % | | | (0.95 | %)(e) | |
Supplemental data | |
Net assets, end of period (in thousands) | | $ | 1,037 | | | $ | 2,110 | | | $ | 2,872 | | | $ | 2,969 | | | $ | 5,347 | | |
Portfolio turnover | | | 360 | %(i) | | | 221 | %(i) | | | 10 | %(i) | | | 136 | %(i) | | | 178 | % | |
Notes to Financial Highlights
(a) For the period from April 1, 2012 to April 30, 2012. During the period, the Fund's fiscal year end was changed from March 31 to April 30.
(b) For the period from March 7, 2011 (commencement of operations) to March 31, 2011.
(c) Rounds to zero.
(d) In addition to the fees and expenses which the Fund bears directly, the Fund indirectly bears a pro rata share of the fees and expenses of the acquired funds in which it invests. Such indirect expenses are not included in the reported expense ratios.
(e) Annualized.
(f) Ratios include line of credit interest expense which rounds to less than 0.01%.
(g) Total net expenses include the impact of certain waivers/reimbursements made by the Investment Manager and certain of its affiliates, if applicable.
(h) The benefits derived from expense reductions had an impact of less than 0.01%.
(i) Includes mortgage dollar rolls. If mortgage dollar roll transactions were excluded, the portfolio turnover would have been 234% and 119% for the years ended April 30, 2014 and 2013, respectively, and unchanged for the period ended April 30, 2012 and the year ended March 31, 2012.
The accompanying Notes to Financial Statements are an integral part of this statement.
Annual Report 2014
29
Financial Highlights (continued)
| | | Year Ended April 30, | | Year Ended March 31, | |
Class C | | 2014 | | 2013 | | 2012(a) | | 2012 | | 2011 | | 2010 | |
Per share data | |
Net asset value, beginning of period | | $ | 9.45 | | | $ | 9.57 | | | $ | 9.49 | | | $ | 9.24 | | | $ | 9.29 | | | $ | 8.80 | | |
Income from investment operations: | |
Net investment income | | | 0.11 | | | | 0.17 | | | | 0.02 | | | | 0.23 | | | | 0.21 | | | | 0.25 | | |
Net realized and unrealized gain (loss) | | | (0.31 | ) | | | 0.17 | | | | 0.08 | | | | 0.38 | | | | 0.15 | | | | 0.58 | | |
Total from investment operations | | | (0.20 | ) | | | 0.34 | | | | 0.10 | | | | 0.61 | | | | 0.36 | | | | 0.83 | | |
Less distributions to shareholders: | |
Net investment income | | | (0.11 | ) | | | (0.17 | ) | | | (0.02 | ) | | | (0.24 | ) | | | (0.22 | ) | | | (0.26 | ) | |
Net realized gains | | | (0.29 | ) | | | (0.29 | ) | | | — | | | | (0.12 | ) | | | (0.19 | ) | | | (0.08 | ) | |
Total distributions to shareholders | | | (0.40 | ) | | | (0.46 | ) | | | (0.02 | ) | | | (0.36 | ) | | | (0.41 | ) | | | (0.34 | ) | |
Proceeds from regulatory settlements | | | — | | | | — | | | | — | | | | — | | | | — | | | | 0.00 | (b) | |
Net asset value, end of period | | $ | 8.85 | | | $ | 9.45 | | | $ | 9.57 | | | $ | 9.49 | | | $ | 9.24 | | | $ | 9.29 | | |
Total return | | | (2.01 | %) | | | 3.59 | % | | | 1.03 | % | | | 6.72 | % | | | 3.94 | % | | | 9.56 | %(c) | |
Ratios to average net assets(d) | |
Total gross expenses | | | 1.73 | % | | | 1.73 | % | | | 1.75 | %(e) | | | 1.74 | %(f) | | | 1.84 | % | | | 1.87 | % | |
Total net expenses(g) | | | 1.56 | %(h) | | | 1.50 | %(h) | | | 1.40 | %(e) | | | 1.40 | %(f)(h) | | | 1.51 | %(h) | | | 1.57 | %(h) | |
Net investment income | | | 1.23 | % | | | 1.83 | % | | | 2.35 | %(e) | | | 2.46 | % | | | 2.26 | % | | | 2.71 | % | |
Supplemental data | |
Net assets, end of period (in thousands) | | $ | 10,917 | | | $ | 15,812 | | | $ | 17,129 | | | $ | 16,872 | | | $ | 13,398 | | | $ | 2,226 | | |
Portfolio turnover | | | 360 | %(i) | | | 221 | %(i) | | | 10 | %(i) | | | 136 | %(i) | | | 178 | % | | | 256 | % | |
Notes to Financial Highlights
(a) For the period from April 1, 2012 to April 30, 2012. During the period, the Fund's fiscal year end was changed from March 31 to April 30.
(b) Rounds to zero.
(c) Total return includes a reimbursement of a loss experienced by the Fund due to a compliance violation. The reimbursement had an impact of less than 0.01% on total return.
(d) In addition to the fees and expenses which the Fund bears directly, the Fund indirectly bears a pro rata share of the fees and expenses of the acquired funds in which it invests. Such indirect expenses are not included in the reported expense ratios.
(e) Annualized.
(f) Ratios include line of credit interest expense which rounds to less than 0.01%.
(g) Total net expenses include the impact of certain waivers/reimbursements made by the Investment Manager and certain of its affiliates, if applicable.
(h) The benefits derived from expense reductions had an impact of less than 0.01%.
(i) Includes mortgage dollar rolls. If mortgage dollar roll transactions were excluded, the portfolio turnover would have been 234% and 119% for the years ended April 30, 2014 and 2013, respectively, and unchanged for the period ended April 30, 2012 and the year ended March 31, 2012.
The accompanying Notes to Financial Statements are an integral part of this statement.
Annual Report 2014
30
Financial Highlights (continued)
| | | Year Ended April 30, | | Year Ended March 31, | |
Class I | | 2014 | | 2013 | | 2012(a) | | 2012 | | 2011(b) | |
Per share data | |
Net asset value, beginning of period | | $ | 9.48 | | | $ | 9.59 | | | $ | 9.50 | | | $ | 9.25 | | | $ | 9.58 | | |
Income from investment operations: | |
Net investment income | | | 0.21 | | | | 0.30 | | | | 0.03 | | | | 0.33 | | | | 0.14 | | |
Net realized and unrealized gain (loss) | | | (0.31 | ) | | | 0.14 | | | | 0.09 | | | | 0.36 | | | | (0.18 | ) | |
Total from investment operations | | | (0.10 | ) | | | 0.44 | | | | 0.12 | | | | 0.69 | | | | (0.04 | ) | |
Less distributions to shareholders: | |
Net investment income | | | (0.21 | ) | | | (0.26 | ) | | | (0.03 | ) | | | (0.32 | ) | | | (0.16 | ) | |
Net realized gains | | | (0.29 | ) | | | (0.29 | ) | | | — | | | | (0.12 | ) | | | (0.13 | ) | |
Total distributions to shareholders | | | (0.50 | ) | | | (0.55 | ) | | | (0.03 | ) | | | (0.44 | ) | | | (0.29 | ) | |
Net asset value, end of period | | $ | 8.88 | | | $ | 9.48 | | | $ | 9.59 | | | $ | 9.50 | | | $ | 9.25 | | |
Total return | | | (0.98 | %) | | | 4.71 | % | | | 1.21 | % | | | 7.55 | % | | | (0.44 | %) | |
Ratios to average net assets(c) | |
Total gross expenses | | | 0.49 | % | | | 0.52 | % | | | 0.56 | %(d) | | | 0.51 | %(e) | | | 0.62 | %(d) | |
Total net expenses(f) | | | 0.49 | % | | | 0.51 | % | | | 0.51 | %(d) | | | 0.51 | %(e)(g) | | | 0.51 | %(d)(g) | |
Net investment income | | | 2.33 | % | | | 2.99 | % | | | 3.22 | %(d) | | | 3.51 | % | | | 2.89 | %(d) | |
Supplemental data | |
Net assets, end of period (in thousands) | | $ | 10 | | | $ | 2 | | | $ | 15,545 | | | $ | 15,931 | | | $ | 284,143 | | |
Portfolio turnover | | | 360 | %(h) | | | 221 | %(h) | | | 10 | %(h) | | | 136 | %(h) | | | 178 | % | |
Notes to Financial Highlights
(a) For the period from April 1, 2012 to April 30, 2012. During the period, the Fund's fiscal year end was changed from March 31 to April 30.
(b) For the period from September 27, 2010 (commencement of operations) to March 31, 2011.
(c) In addition to the fees and expenses which the Fund bears directly, the Fund indirectly bears a pro rata share of the fees and expenses of the acquired funds in which it invests. Such indirect expenses are not included in the reported expense ratios.
(d) Annualized.
(e) Ratios include line of credit interest expense which rounds to less than 0.01%.
(f) Total net expenses include the impact of certain waivers/reimbursements made by the Investment Manager and certain of its affiliates, if applicable.
(g) The benefits derived from expense reductions had an impact of less than 0.01%.
(h) Includes mortgage dollar rolls. If mortgage dollar roll transactions were excluded, the portfolio turnover would have been 234% and 119% for the years ended April 30, 2014 and 2013, respectively, and unchanged for the period ended April 30, 2012 and the year ended March 31, 2012.
The accompanying Notes to Financial Statements are an integral part of this statement.
Annual Report 2014
31
Financial Highlights (continued)
| | | Year Ended April 30, | | Year Ended
March 31, | |
Class R | | 2014 | | 2013 | | 2012(a) | | 2012(b) | |
Per share data | |
Net asset value, beginning of period | | $ | 9.46 | | | $ | 9.58 | | | $ | 9.50 | | | $ | 9.51 | | |
Income from investment operations: | |
Net investment income | | | 0.14 | | | | 0.21 | | | | 0.02 | | | | 0.09 | | |
Net realized and unrealized gain (loss) | | | (0.31 | ) | | | 0.16 | | | | 0.08 | | | | 0.07 | | |
Total from investment operations | | | (0.17 | ) | | | 0.37 | | | | 0.10 | | | | 0.16 | | |
Less distributions to shareholders: | |
Net investment income | | | (0.14 | ) | | | (0.20 | ) | | | (0.02 | ) | | | (0.09 | ) | |
Net realized gains | | | (0.29 | ) | | | (0.29 | ) | | | — | | | | (0.08 | ) | |
Total distributions to shareholders | | | (0.43 | ) | | | (0.49 | ) | | | (0.02 | ) | | | (0.17 | ) | |
Net asset value, end of period | | $ | 8.86 | | | $ | 9.46 | | | $ | 9.58 | | | $ | 9.50 | | |
Total return | | | (1.66 | %) | | | 3.95 | % | | | 1.06 | % | | | 1.75 | % | |
Ratios to average net assets(c) | |
Total gross expenses | | | 1.23 | % | | | 1.23 | % | | | 1.26 | %(d) | | | 1.40 | %(d)(e) | |
Total net expenses(f) | | | 1.21 | %(g) | | | 1.15 | %(g) | | | 1.05 | %(d) | | | 1.03 | %(d)(e) | |
Net investment income | | | 1.59 | % | | | 2.16 | % | | | 2.69 | %(d) | | | 2.69 | %(d) | |
Supplemental data | |
Net assets, end of period (in thousands) | | $ | 2,498 | | | $ | 2,558 | | | $ | 2,553 | | | $ | 2,506 | | |
Portfolio turnover | | | 360 | %(h) | | | 221 | %(h) | | | 10 | %(h) | | | 136 | %(h) | |
Notes to Financial Highlights
(a) For the period from April 1, 2012 to April 30, 2012. During the period, the Fund's fiscal year end was changed from March 31 to April 30.
(b) For the period from November 16, 2011 (commencement of operations) to March 31, 2012.
(c) In addition to the fees and expenses which the Fund bears directly, the Fund indirectly bears a pro rata share of the fees and expenses of the acquired funds in which it invests. Such indirect expenses are not included in the reported expense ratios.
(d) Annualized.
(e) Ratios include line of credit interest expense which rounds to less than 0.01%.
(f) Total net expenses include the impact of certain waivers/reimbursements made by the Investment Manager and certain of its affiliates, if applicable.
(g) The benefits derived from expense reductions had an impact of less than 0.01%.
(h) Includes mortgage dollar rolls. If mortgage dollar roll transactions were excluded, the portfolio turnover would have been 234% and 119% for the years ended April 30, 2014 and 2013, respectively, and unchanged for the period ended April 30, 2012 and the year ended March 31, 2012.
The accompanying Notes to Financial Statements are an integral part of this statement.
Annual Report 2014
32
Financial Highlights (continued)
| | | Year Ended April 30, | |
Class R4 | | 2014 | | 2013(a) | |
Per share data | |
Net asset value, beginning of period | | $ | 9.45 | | | $ | 9.73 | | |
Income from investment operations: | |
Net investment income | | | 0.18 | | | | 0.10 | | |
Net realized and unrealized loss | | | (0.30 | ) | | | (0.07 | )(b) | |
Total from investment operations | | | (0.12 | ) | | | 0.03 | | |
Less distributions to shareholders: | |
Net investment income | | | (0.19 | ) | | | (0.10 | ) | |
Net realized gains | | | (0.29 | ) | | | (0.21 | ) | |
Total distributions to shareholders | | | (0.48 | ) | | | (0.31 | ) | |
Net asset value, end of period | | $ | 8.85 | | | $ | 9.45 | | |
Total return | | | (1.18 | %) | | | 0.36 | % | |
Ratios to average net assets(c) | |
Total gross expenses | | | 0.74 | % | | | 0.69 | %(d) | |
Total net expenses(e) | | | 0.70 | %(f) | | | 0.69 | %(d) | |
Net investment income | | | 1.99 | % | | | 2.38 | %(d) | |
Supplemental data | |
Net assets, end of period (in thousands) | | $ | 28 | | | $ | 55 | | |
Portfolio turnover | | | 360 | %(g) | | | 221 | %(g) | |
Notes to Financial Highlights
(a) For the period from November 8, 2012 (commencement of operations) to April 30, 2013.
(b) Calculation of the net gain (loss) per share (both realized and unrealized) does not correlate to the aggregate realized and unrealized gain (loss) presented in the Statement of Operations due to the timing of sales and repurchases of Fund shares in relation to fluctuations in the market value of the portfolio.
(c) In addition to the fees and expenses which the Fund bears directly, the Fund indirectly bears a pro rata share of the fees and expenses of the acquired funds in which it invests. Such indirect expenses are not included in the reported expense ratios.
(d) Annualized.
(e) Total net expenses include the impact of certain waivers/reimbursements made by the Investment Manager and certain of its affiliates, if applicable.
(f) The benefits derived from expense reductions had an impact of less than 0.01%.
(g) Includes mortgage dollar rolls. If mortgage dollar roll transactions were excluded, the portfolio turnover would have been 234% for the year ended April 30, 2014 and 119% for the period ended April 30, 2013.
The accompanying Notes to Financial Statements are an integral part of this statement.
Annual Report 2014
33
Financial Highlights (continued)
| | | Year Ended April 30, | |
Class R5 | | 2014 | | 2013(a) | |
Per share data | |
Net asset value, beginning of period | | $ | 9.45 | | | $ | 9.73 | | |
Income from investment operations: | |
Net investment income | | | 0.19 | | | | 0.11 | | |
Net realized and unrealized loss | | | (0.31 | ) | | | (0.07 | )(b) | |
Total from investment operations | | | (0.12 | ) | | | 0.04 | | |
Less distributions to shareholders: | |
Net investment income | | | (0.20 | ) | | | (0.11 | ) | |
Net realized gains | | | (0.29 | ) | | | (0.21 | ) | |
Total distributions to shareholders | | | (0.49 | ) | | | (0.32 | ) | |
Net asset value, end of period | | $ | 8.84 | | | $ | 9.45 | | |
Total return | | | (1.10 | %) | | | 0.42 | % | |
Ratios to average net assets(c) | |
Total gross expenses | | | 0.57 | % | | | 0.55 | %(d) | |
Total net expenses(e) | | | 0.57 | % | | | 0.55 | %(d) | |
Net investment income | | | 2.09 | % | | | 2.71 | %(d) | |
Supplemental data | |
Net assets, end of period (in thousands) | | $ | 471 | | | $ | 33,221 | | |
Portfolio turnover | | | 360 | %(f) | | | 221 | %(f) | |
Notes to Financial Highlights
(a) For the period from November 8, 2012 (commencement of operations) to April 30, 2013.
(b) Calculation of the net gain (loss) per share (both realized and unrealized) does not correlate to the aggregate realized and unrealized gain (loss) presented in the Statement of Operations due to the timing of sales and repurchases of Fund shares in relation to fluctuations in the market value of the portfolio.
(c) In addition to the fees and expenses which the Fund bears directly, the Fund indirectly bears a pro rata share of the fees and expenses of the acquired funds in which it invests. Such indirect expenses are not included in the reported expense ratios.
(d) Annualized.
(e) Total net expenses include the impact of certain waivers/reimbursements made by the Investment Manager and certain of its affiliates, if applicable.
(f) Includes mortgage dollar rolls. If mortgage dollar roll transactions were excluded, the portfolio turnover would have been 234% for the year ended April 30, 2014 and 119% for the period ended April 30, 2013.
The accompanying Notes to Financial Statements are an integral part of this statement.
Annual Report 2014
34
Financial Highlights (continued)
| | | Year Ended April 30, | | Year Ended March 31, | |
Class T | | 2014 | | 2013 | | 2012(a) | | 2012 | | 2011(b) | |
Per share data | |
Net asset value, beginning of period | | $ | 9.45 | | | $ | 9.57 | | | $ | 9.48 | | | $ | 9.23 | | | $ | 9.23 | | |
Income from investment operations: | |
Net investment income (loss) | | | 0.17 | | | | 0.24 | | | | 0.02 | | | | 0.30 | | | | (0.00 | )(c) | |
Net realized and unrealized gain (loss) | | | (0.30 | ) | | | 0.17 | | | | 0.09 | | | | 0.37 | | | | 0.02 | | |
Total from investment operations | | | (0.13 | ) | | | 0.41 | | | | 0.11 | | | | 0.67 | | | | 0.02 | | |
Less distributions to shareholders: | |
Net investment income | | | (0.18 | ) | | | (0.24 | ) | | | (0.02 | ) | | | (0.30 | ) | | | (0.02 | ) | |
Net realized gains | | | (0.29 | ) | | | (0.29 | ) | | | — | | | | (0.12 | ) | | | — | | |
Total distributions to shareholders | | | (0.47 | ) | | | (0.53 | ) | | | (0.02 | ) | | | (0.42 | ) | | | (0.02 | ) | |
Net asset value, end of period | | $ | 8.85 | | | $ | 9.45 | | | $ | 9.57 | | | $ | 9.48 | | | $ | 9.23 | | |
Total return | | | (1.32 | %) | | | 4.32 | % | | | 1.20 | % | | | 7.36 | % | | | 0.21 | % | |
Ratios to average net assets(d) | |
Total gross expenses | | | 0.88 | % | | | 0.88 | % | | | 0.91 | %(e) | | | 0.89 | %(f) | | | 1.01 | %(e) | |
Total net expenses(g) | | | 0.86 | %(h) | | | 0.80 | %(h) | | | 0.70 | %(e) | | | 0.70 | %(f)(h) | | | 0.70 | %(e)(h) | |
Net investment income | | | 1.94 | % | | | 2.53 | % | | | 3.04 | %(e) | | | 3.17 | % | | | (0.07 | %)(e) | |
Supplemental data | |
Net assets, end of period (in thousands) | | $ | 12,351 | | | $ | 14,412 | | | $ | 15,630 | | | $ | 15,577 | | | $ | 16,251 | | |
Portfolio turnover | | | 360 | %(i) | | | 221 | %(i) | | | 10 | %(i) | | | 136 | %(i) | | | 178 | % | |
Notes to Financial Highlights
(a) For the period from April 1, 2012 to April 30, 2012. During the period, the Fund's fiscal year end was changed from March 31 to April 30.
(b) For the period from March 7, 2011 (commencement of operations) to March 31, 2011.
(c) Rounds to zero.
(d) In addition to the fees and expenses which the Fund bears directly, the Fund indirectly bears a pro rata share of the fees and expenses of the acquired funds in which it invests. Such indirect expenses are not included in the reported expense ratios.
(e) Annualized.
(f) Ratios include line of credit interest expense which rounds to less than 0.01%.
(g) Total net expenses include the impact of certain waivers/reimbursements made by the Investment Manager and certain of its affiliates, if applicable.
(h) The benefits derived from expense reductions had an impact of less than 0.01%.
(i) Includes mortgage dollar rolls. If mortgage dollar roll transactions were excluded, the portfolio turnover would have been 234% and 119% for the years ended April 30, 2014 and 2013, respectively, and unchanged for the period ended April 30, 2012 and the year ended March 31, 2012.
The accompanying Notes to Financial Statements are an integral part of this statement.
Annual Report 2014
35
Financial Highlights (continued)
| | | Year Ended April 30, | | Year Ended March 31, | |
Class W | | 2014 | | 2013 | | 2012(a) | | 2012 | | 2011(b) | |
Per share data | |
Net asset value, beginning of period | | $ | 9.47 | | | $ | 9.58 | | | $ | 9.50 | | | $ | 9.24 | | | $ | 9.57 | | |
Income from investment operations: | |
Net investment income | | | 0.17 | | | | 0.24 | | | | 0.02 | | | | 0.29 | | | | 0.12 | | |
Net realized and unrealized gain (loss) | | | (0.31 | ) | | | 0.17 | | | | 0.08 | | | | 0.38 | | | | (0.18 | ) | |
Total from investment operations | | | (0.14 | ) | | | 0.41 | | | | 0.10 | | | | 0.67 | | | | (0.06 | ) | |
Less distributions to shareholders: | |
Net investment income | | | (0.17 | ) | | | (0.23 | ) | | | (0.02 | ) | | | (0.29 | ) | | | (0.14 | ) | |
Net realized gains | | | (0.29 | ) | | | (0.29 | ) | | | — | | | | (0.12 | ) | | | (0.13 | ) | |
Total distributions to shareholders | | | (0.46 | ) | | | (0.52 | ) | | | (0.02 | ) | | | (0.41 | ) | | | (0.27 | ) | |
Net asset value, end of period | | $ | 8.87 | | | $ | 9.47 | | | $ | 9.58 | | | $ | 9.50 | | | $ | 9.24 | | |
Total return | | | (1.40 | %) | | | 4.32 | % | | | 1.09 | % | | | 7.38 | % | | | (0.60 | %) | |
Ratios to average net assets(c) | |
Total gross expenses | | | 0.90 | % | | | 0.90 | % | | | 0.90 | %(d) | | | 0.95 | %(e) | | | 1.08 | %(d) | |
Total net expenses(f) | | | 0.90 | %(g) | | | 0.88 | %(g) | | | 0.75 | %(d) | | | 0.79 | %(e) | | | 0.80 | %(d)(g) | |
Net investment income | | | 1.92 | % | | | 2.46 | % | | | 3.04 | %(d) | | | 3.08 | % | | | 2.63 | %(d) | |
Supplemental data | |
Net assets, end of period (in thousands) | | $ | 10 | | | $ | 2 | | | $ | 3 | | | $ | 2 | | | $ | 2 | | |
Portfolio turnover | | | 360 | %(h) | | | 221 | %(h) | | | 10 | %(h) | | | 136 | %(h) | | | 178 | % | |
Notes to Financial Highlights
(a) For the period from April 1, 2012 to April 30, 2012. During the period, the Fund's fiscal year end was changed from March 31 to April 30.
(b) For the period from September 27, 2010 (commencement of operations) to March 31, 2011.
(c) In addition to the fees and expenses which the Fund bears directly, the Fund indirectly bears a pro rata share of the fees and expenses of the acquired funds in which it invests. Such indirect expenses are not included in the reported expense ratios.
(d) Annualized.
(e) Ratios include line of credit interest expense which rounds to less than 0.01%.
(f) Total net expenses include the impact of certain waivers/reimbursements made by the Investment Manager and certain of its affiliates, if applicable.
(g) The benefits derived from expense reductions had an impact of less than 0.01%.
(h) Includes mortgage dollar rolls. If mortgage dollar roll transactions were excluded, the portfolio turnover would have been 234% and 119% for the years ended April 30, 2014 and 2013, respectively, and unchanged for the period ended April 30, 2012 and the year ended March 31, 2012.
The accompanying Notes to Financial Statements are an integral part of this statement.
Annual Report 2014
36
Financial Highlights (continued)
| | | Year Ended April 30, | | Year Ended March 31, | |
Class Y | | 2014 | | 2013 | | 2012(a) | | 2012 | | 2011 | | 2010(b) | |
Per share data | |
Net asset value, beginning of period | | $ | 9.47 | | | $ | 9.59 | | | $ | 9.51 | | | $ | 9.25 | | | $ | 9.30 | | | $ | 8.93 | | |
Income from investment operations: | |
Net investment income | | | 0.20 | | | | 0.27 | | | | 0.03 | | | | 0.32 | | | | 0.30 | | | | 0.24 | | |
Net realized and unrealized gain (loss) | | | (0.30 | ) | | | 0.16 | | | | 0.08 | | | | 0.38 | | | | 0.16 | | | | 0.38 | | |
Total from investment operations | | | (0.10 | ) | | | 0.43 | | | | 0.11 | | | | 0.70 | | | | 0.46 | | | | 0.62 | | |
Less distributions to shareholders: | |
Net investment income | | | (0.21 | ) | | | (0.26 | ) | | | (0.03 | ) | | | (0.32 | ) | | | (0.32 | ) | | | (0.25 | ) | |
Net realized gains | | | (0.29 | ) | | | (0.29 | ) | | | — | | | | (0.12 | ) | | | (0.19 | ) | | | — | | |
Total distributions to shareholders | | | (0.50 | ) | | | (0.55 | ) | | | (0.03 | ) | | | (0.44 | ) | | | (0.51 | ) | | | (0.25 | ) | |
Net asset value, end of period | | $ | 8.87 | | | $ | 9.47 | | | $ | 9.59 | | | $ | 9.51 | | | $ | 9.25 | | | $ | 9.30 | | |
Total return | | | (0.99 | %) | | | 4.60 | % | | | 1.11 | % | | | 7.66 | % | | | 5.01 | % | | | 7.00 | % | |
Ratios to average net assets(c) | |
Total gross expenses | | | 0.53 | % | | | 0.53 | % | | | 0.56 | %(d) | | | 0.53 | %(e) | | | 0.76 | % | | | 0.81 | %(d) | |
Total net expenses(f) | | | 0.53 | % | | | 0.52 | % | | | 0.51 | %(d) | | | 0.51 | %(e) | | | 0.53 | %(g) | | | 0.55 | %(d)(g) | |
Net investment income | | | 2.27 | % | | | 2.80 | % | | | 3.23 | %(d) | | | 3.38 | % | | | 3.21 | % | | | 3.58 | %(d) | |
Supplemental data | |
Net assets, end of period (in thousands) | | $ | 25,147 | | | $ | 24,368 | | | $ | 22,718 | | | $ | 22,474 | | | $ | 24,717 | | | $ | 14,913 | | |
Portfolio turnover | | | 360 | %(h) | | | 221 | %(h) | | | 10 | %(h) | | | 136 | %(h) | | | 178 | % | | | 256 | % | |
Notes to Financial Highlights
(a) For the period from April 1, 2012 to April 30, 2012. During the period, the Fund's fiscal year end was changed from March 31 to April 30.
(b) For the period from July 15, 2009 (commencement of operations) to March 31, 2010.
(c) In addition to the fees and expenses which the Fund bears directly, the Fund indirectly bears a pro rata share of the fees and expenses of the acquired funds in which it invests. Such indirect expenses are not included in the reported expense ratios.
(d) Annualized.
(e) Ratios include line of credit interest expense which rounds to less than 0.01%.
(f) Total net expenses include the impact of certain waivers/reimbursements made by the Investment Manager and certain of its affiliates, if applicable.
(g) The benefits derived from expense reductions had an impact of less than 0.01%.
(h) Includes mortgage dollar rolls. If mortgage dollar roll transactions were excluded, the portfolio turnover would have been 234% and 119% for the years ended April 30, 2014 and 2013, respectively, and unchanged for the period ended April 30, 2012 and the year ended March 31, 2012.
The accompanying Notes to Financial Statements are an integral part of this statement.
Annual Report 2014
37
Financial Highlights (continued)
| | | Year Ended April 30, | | Year Ended March 31, | |
Class Z | | 2014 | | 2013 | | 2012(a) | | 2012 | | 2011 | | 2010 | |
Per share data | |
Net asset value, beginning of period | | $ | 9.46 | | | $ | 9.58 | | | $ | 9.50 | | | $ | 9.24 | | | $ | 9.29 | | | $ | 8.80 | | |
Income from investment operations: | |
Net investment income | | | 0.19 | | | | 0.26 | | | | 0.03 | | | | 0.31 | | | | 0.29 | | | | 0.34 | | |
Net realized and unrealized gain (loss) | | | (0.31 | ) | | | 0.16 | | | | 0.07 | | | | 0.38 | | | | 0.17 | | | | 0.58 | | |
Total from investment operations | | | (0.12 | ) | | | 0.42 | | | | 0.10 | | | | 0.69 | | | | 0.46 | | | | 0.92 | | |
Less distributions to shareholders: | |
Net investment income | | | (0.19 | ) | | | (0.25 | ) | | | (0.02 | ) | | | (0.31 | ) | | | (0.32 | ) | | | (0.35 | ) | |
Net realized gains | | | (0.29 | ) | | | (0.29 | ) | | | — | | | | (0.12 | ) | | | (0.19 | ) | | | (0.08 | ) | |
Total distributions to shareholders | | | (0.48 | ) | | | (0.54 | ) | | | (0.02 | ) | | | (0.43 | ) | | | (0.51 | ) | | | (0.43 | ) | |
Proceeds from regulatory settlements | | | — | | | | — | | | | — | | | | — | | | | — | | | | 0.00 | (b) | |
Net asset value, end of period | | $ | 8.86 | | | $ | 9.46 | | | $ | 9.58 | | | $ | 9.50 | | | $ | 9.24 | | | $ | 9.29 | | |
Total return | | | (1.17 | %) | | | 4.47 | % | | | 1.10 | % | | | 7.63 | % | | | 4.98 | % | | | 10.66 | %(c) | |
Ratios to average net assets(d) | |
Total gross expenses | | | 0.73 | % | | | 0.73 | % | | | 0.75 | %(e) | | | 0.73 | %(f) | | | 0.84 | % | | | 0.87 | % | |
Total net expenses(g) | | | 0.71 | %(h) | | | 0.65 | %(h) | | | 0.55 | %(e) | | | 0.55 | %(f)(h) | | | 0.55 | %(h) | | | 0.57 | %(h) | |
Net investment income | | | 2.07 | % | | | 2.69 | % | | | 3.14 | %(e) | | | 3.33 | % | | | 3.21 | % | | | 3.72 | % | |
Supplemental data | |
Net assets, end of period (in thousands) | | $ | 659,538 | | | $ | 1,077,125 | | | $ | 1,599,267 | | | $ | 1,733,175 | | | $ | 2,120,951 | | | $ | 581,596 | | |
Portfolio turnover | | | 360 | %(i) | | | 221 | %(i) | | | 10 | %(i) | | | 136 | %(i) | | | 178 | % | | | 256 | % | |
Notes to Financial Highlights
(a) For the period from April 1, 2012 to April 30, 2012. During the period, the Fund's fiscal year end was changed from March 31 to April 30.
(b) Rounds to zero.
(c) Total return includes a reimbursement of a loss experienced by the Fund due to a compliance violation. The reimbursement had an impact of less than 0.01% on total return.
(d) In addition to the fees and expenses which the Fund bears directly, the Fund indirectly bears a pro rata share of the fees and expenses of the acquired funds in which it invests. Such indirect expenses are not included in the reported expense ratios.
(e) Annualized.
(f) Ratios include line of credit interest expense which rounds to less than 0.01%.
(g) Total net expenses include the impact of certain waivers/reimbursements made by the Investment Manager and certain of its affiliates, if applicable.
(h) The benefits derived from expense reductions had an impact of less than 0.01%.
(i) Includes mortgage dollar rolls. If mortgage dollar roll transactions were excluded, the portfolio turnover would have been 234% and 119% for the years ended April 30, 2014 and 2013, respectively, and unchanged for the period ended April 30, 2012 and the year ended March 31, 2012.
The accompanying Notes to Financial Statements are an integral part of this statement.
Annual Report 2014
38
Notes to Financial Statements
April 30, 2014
Note 1. Organization
Columbia Bond Fund (the Fund), a series of Columbia Funds Series Trust I (the Trust), is a diversified fund. The Trust is registered under the Investment Company Act of 1940, as amended (the 1940 Act), as an open-end management investment company organized as a Massachusetts business trust.
Fund Shares
The Trust may issue an unlimited number of shares (without par value). The Fund offers Class A, Class B, Class C, Class I, Class R, Class R4, Class R5, Class T, Class W, Class Y and Class Z shares. Although all share classes generally have identical voting, dividend and liquidation rights, each share class votes separately when required by law. Different share classes pay different distribution amounts to the extent the expenses of such share classes differ, and distributions in liquidation will be proportional to the net asset value of each share class. Each share class has its own expense structure and sales charges, as applicable.
Class A shares are subject to a maximum front-end sales charge of 4.75% based on the initial investment amount. Class A shares purchased without an initial sales charge in accounts aggregating $1 million to $50 million at the time of purchase are subject to a contingent deferred sales charge (CDSC) if the shares are sold within 18 months of purchase, charged as follows: 1.00% CDSC if redeemed within 12 months of purchase, and 0.50% CDSC if redeemed more than 12, but less than 18, months after purchase.
Class B shares may be subject to a maximum CDSC of 5.00% based upon the holding period after purchase. Class B shares will generally convert to Class A shares eight years after purchase. The Fund no longer accepts investments by new or existing investors in the Fund's Class B shares, except in connection with the reinvestment of any dividend and/or capital gain distributions in Class B shares of the Fund and exchanges by existing Class B shareholders of certain other funds within the Columbia Family of Funds.
Class C shares are subject to a 1.00% CDSC on shares redeemed within one year of purchase.
Class I shares are not subject to sales charges and are available only to the Columbia Family of Funds.
Class R shares are not subject to sales charges and are generally available only to certain retirement plans and other eligible investors.
Class R4 shares are not subject to sales charges and are generally available only to omnibus retirement plans and certain other eligible investors.
Class R5 shares are not subject to sales charges and are generally available only to investors purchasing through authorized investment professionals and omnibus retirement plans.
Class T shares are subject to a maximum front-end sales charge of 4.75% based on the investment amount. Class T shares purchased without an initial sales charge in accounts aggregating $1 million to $50 million at the time of purchase are subject to a CDSC if the shares are sold within 18 months of purchase, charged as follows: 1.00% CDSC if redeemed within 12 months of purchase, and 0.50% CDSC if redeemed more than 12, but less than 18, months after purchase. Class T shares are available only to investors who received (and who have continuously held) Class T shares in connection with the merger of certain Galaxy Funds into various Columbia Funds (formerly named Liberty Funds).
Class W shares are not subject to sales charges and are available only to investors purchasing through authorized investment programs managed by investment professionals, including discretionary managed account programs.
Class Y shares are not subject to sales charges and are generally available only to certain retirement plans.
Class Z shares are not subject to sales charges and are available only to certain eligible investors, which are subject to different investment minimums.
Note 2. Summary of Significant Accounting Policies
Use of Estimates
The preparation of financial statements in accordance with U.S. generally accepted accounting principles (GAAP) requires management to make certain estimates and assumptions that affect the reported amounts of assets and liabilities, the disclosure of contingent assets and liabilities at the date of the financial statements and the reported amounts of revenue and expenses during the reporting period. Actual results could differ from those estimates.
The following is a summary of significant accounting policies consistently followed by the Fund in the preparation of its financial statements.
Security Valuation
Debt securities generally are valued by pricing services approved by the Board of Trustees (the Board) based upon market transactions for normal, institutional-size trading units of similar securities. The services may use various pricing techniques which take into account appropriate factors such as yield, quality, coupon rate, maturity, type of issue, trading
Annual Report 2014
39
Notes to Financial Statements (continued)
April 30, 2014
characteristics and other data, as well as broker quotes. Debt securities for which quotations are readily available may also be valued based upon an over-the-counter or exchange bid quotation.
Asset and mortgage-backed securities are generally valued by pricing services, which utilize pricing models that incorporate the securities' cash flow and loan performance data. These models also take into account available market data, including trades, market quotations, and benchmark yield curves for identical or similar securities. Factors used to identify similar securities may include, but are not limited to, issuer, collateral type, vintage, prepayment speeds, collateral performance, credit ratings, credit enhancement and expected life. Asset-backed securities for which quotations are readily available may also be valued based upon an over-the-counter or exchange bid quotation.
All equity securities are valued at the close of business of the New York Stock Exchange (NYSE). Equity securities are valued at the last quoted sales price on the principal exchange or market on which they trade, except for securities traded on the NASDAQ Stock Market, which are valued at the NASDAQ official close price. Unlisted securities or listed securities for which there were no sales during the day are valued at the mean of the latest quoted bid and ask prices on such exchanges or markets.
Short-term securities purchased within 60 days to maturity are valued at amortized cost, which approximates market value. The value of short-term securities originally purchased with maturities greater than 60 days is determined based on an amortized value to par upon reaching 60 days to maturity. Short-term securities maturing in more than 60 days from the valuation date are valued at the market price or approximate market value based on current interest rates.
Investments in open-end investment companies, including money market funds, are valued at net asset value.
Futures and options on futures contracts are valued based upon the settlement price established each day by the board of trade or exchange on which they are traded.
Swap transactions are valued through an independent pricing service or broker, or if neither is available, through an internal model based upon observable inputs.
Investments for which market quotations are not readily available, or that have quotations which management believes are not reliable, are valued at fair value as determined in good faith under consistently applied procedures established by and under the general supervision of the Board. If a security or class of securities (such as foreign securities) is valued at fair value, such value is likely to be different from the last quoted market price for the security.
The determination of fair value often requires significant judgment. To determine fair value, management may use assumptions including but not limited to future cash flows and estimated risk premiums. Multiple inputs from various sources may be used to determine fair value.
Derivative Instruments
The Fund invests in certain derivative instruments, as detailed below, to meet its investment objectives. Derivatives are instruments whose values depend on, or are derived from, in whole or in part, the value of one or more other assets, such as securities, currencies, commodities or indices. Derivative instruments may be used to maintain cash reserves while maintaining exposure to certain other assets, to offset anticipated declines in values of investments, to facilitate trading, to reduce transaction costs and to pursue higher investment returns. The Fund may also use derivative instruments to mitigate certain investment risks, such as foreign currency exchange rate risk, interest rate risk and credit risk. Derivatives may involve various risks, including the potential inability of the counterparty to fulfill its obligation under the terms of the contract, the potential for an illiquid secondary market (making it difficult for the Fund to sell, including at favorable prices) and the potential for market movements which may expose the Fund to gains or losses in excess of the amount shown in the Statement of Assets and Liabilities. The notional amounts of derivative instruments, if applicable, are not recorded in the financial statements.
A derivative instrument may suffer a mark to market loss if the value of the contract decreases due to an unfavorable change in the market rates or values of the underlying instrument. Losses can also occur if the counterparty does not perform under the contract. The Fund's risk of loss from counterparty credit risk on over-the-counter derivatives is generally limited to the aggregate unrealized gain netted against any collateral held by the Fund and the amount of any variation margin held by the counterparty. With exchange-traded or centrally cleared derivatives, there is minimal counterparty credit risk to the Fund since the exchange's clearinghouse, as counterparty to such instruments, guarantees against a possible default. The clearinghouse stands between the buyer and the seller of the contract; therefore, the counterparty credit risk is limited to failure of the clearinghouse. However, credit risk still exists in exchange-traded or centrally cleared derivatives with respect to initial and variation margin that is held in a broker's customer account. While brokers are required to segregate customer margin from their own assets, in the event that a broker becomes insolvent or goes into bankruptcy and at that time there is a shortfall in the aggregate amount of margin held by the broker for all its clients, U.S. bankruptcy laws will typically allocate that shortfall on a pro-rata basis across all
Annual Report 2014
40
Notes to Financial Statements (continued)
April 30, 2014
the broker's customers, potentially resulting in losses to the Fund.
In order to better define its contractual rights and to secure rights that will help the Fund mitigate its counterparty risk, the Fund may enter into an International Swaps and Derivatives Association, Inc. Master Agreement (ISDA Master Agreement) or similar agreement with its derivative contract counterparties. An ISDA Master Agreement is an agreement between the Fund and a counterparty that governs over-the-counter derivatives and forward foreign currency exchange contracts and typically contains, among other things, collateral posting terms and netting provisions in the event of a default and/or termination event. Under an ISDA Master Agreement, the Fund may, under certain circumstances, offset with the counterparty certain derivative instrument's payables and/or receivables with collateral held and/or posted and create one single net payment. The provisions of the ISDA Master Agreement typically permit a single net payment in the event of default (close-out netting) including the bankruptcy or insolvency of the counterparty. Note, however, that bankruptcy or insolvency laws of a particular jurisdiction may impose restrictions on or prohibitions against the right of offset in bankruptcy, insolvency or other events.
Collateral (margin) requirements differ by type of derivative. Margin requirements are established by the exchange or clearinghouse for exchange-traded and centrally cleared derivatives. Brokers can ask for margin in excess of the minimum in certain circumstances. Collateral terms are contract specific for over-the-counter derivatives. For over-the-counter derivatives traded under an ISDA Master Agreement, the collateral requirements are typically calculated by netting the mark-to-market amount for each transaction under such agreement and comparing that amount to the value of any variation margin currently pledged by the Fund and/or the counterparty. Generally, the amount of collateral due from or to a party has to exceed a minimum transfer amount threshold (e.g., $500,000) before a transfer has to be made. To the extent amounts due to the Fund from its counterparties are not fully collateralized, contractually or otherwise, the Fund bears the risk of loss from counterparty nonperformance. The Fund attempts to mitigate counterparty risk by only entering into agreements with counterparties that it believes have the financial resources to honor their obligations and by monitoring the financial stability of those counterparties.
Certain ISDA Master Agreements allow counterparties to over-the-counter derivatives to terminate derivative contracts prior to maturity in the event the Fund's net assets decline by a stated percentage over a specified time period or the Fund fails to meet the terms of the ISDA Master Agreement, which
would cause the Fund to accelerate payment of any net liability owed to the counterparty. The Fund also has termination rights if the counterparty fails to meet the terms of the ISDA Master Agreement. In addition to considering counterparty credit risk, the Fund would consider terminating the derivative contracts based on whether termination would result in a net liability owed from the counterparty.
For financial reporting purposes, the Fund does not offset derivative assets and derivative liabilities that are subject to netting arrangements in the Statement of Assets and Liabilities.
Futures Contracts
Futures contracts are exchange traded and represent commitments for the future purchase or sale of an asset at a specified price on a specified date. The Fund bought and sold futures contracts to manage the duration and yield curve exposure of the Fund versus the benchmark and manage exposure to movements in interest rates. These instruments may be used for other purposes in future periods. Upon entering into futures contracts, the Fund bears risks that it may not achieve the anticipated benefits of the futures contracts and may realize a loss. Additional risks include counterparty credit risk, the possibility of an illiquid market, and that a change in the value of the contract or option may not correlate with changes in the value of the underlying asset.
Upon entering into a futures contract, the Fund pledges cash or securities with the broker in an amount sufficient to meet the initial margin requirement. The initial margin deposit must be maintained at an established level over the life of the contract. Cash deposited as initial margin is recorded in the Statement of Assets and Liabilities as margin deposits. Securities deposited as initial margin are designated in the Portfolio of Investments. Subsequent payments (variation margin) are made or received by the Fund each day. The variation margin payments are equal to the daily change in the contract value and are recorded as variation margin receivable or payable and are offset in unrealized gains or losses. The Fund recognizes a realized gain or loss when the contract is closed or expires. Futures contracts involve, to varying degrees, risk of loss in excess of the variation margin disclosed in the Statement of Assets and Liabilities.
Swap Contracts
Swap contracts are privately negotiated in the over-the-counter market and may be entered into as a bilateral contract or centrally cleared (centrally cleared swap contract). In a centrally cleared swap contract, immediately following execution of the swap contract, the swap contract is novated to a central counterparty (the CCP) and the Fund faces the CCP
Annual Report 2014
41
Notes to Financial Statements (continued)
April 30, 2014
through a broker. Upon entering into a centrally cleared swap contract, the Fund is required to deposit initial margin with the broker in the form of cash or securities in an amount that varies depending on the size and risk profile of the particular swap contract. Securities deposited as initial margin are designated in the Portfolio of Investments and cash deposited is recorded in the Statement of Assets and Liabilities as margin deposits. Unlike a bilateral swap contract, for centrally cleared swap contacts, the Fund has minimal credit exposure to the counterparty as the CCP stands between the Fund and the counterparty. Swap contracts are marked-to-market daily and changes in value are recorded as unrealized appreciation (depreciation). The daily change in valuation of centrally cleared swap contracts, if any, is recorded as a receivable or payable for variation margin in the Statements of Assets and Liabilities.
Credit Default Swap Contracts
The Fund entered into credit default swap contracts to increase or decrease its credit exposure to an index, increase or decrease its credit exposure to a single issuer of debt securities and as a protection buyer to reduce overall credit exposure. Additionally, credit default swap contracts were used to hedge the Fund's exposure on a debt security that it owns or in lieu of selling such debt security. Credit default swap contracts are agreements in which one party pays fixed periodic payments to a counterparty in consideration for a guarantee from the counterparty to make a specific payment should a specified credit event(s) take place. Although specified events are contract specific, credit events are generally defined as bankruptcy, failure to pay, restructuring, obligation acceleration, obligation default, or repudiation/moratorium.
As the purchaser of a credit default swap contract, the Fund purchases protection by paying a periodic interest rate on the notional amount to the counterparty. The interest amount is accrued daily as a component of unrealized appreciation (depreciation) and is recorded as a realized loss upon payment. If a credit event as specified in the contract occurs, the Fund may have the option either to deliver the reference obligation to the seller in exchange for a cash payment of its par amount, or to receive a net cash settlement equal to the par amount less an agreed-upon value of the reference obligation as of the date of the credit event. Credit events are contract specific but may include bankruptcy, failure to pay, restructuring and obligation acceleration. The difference between the value of the obligation or cash delivered and the notional amount received will be recorded as a realized gain (loss).
Any premium paid or received by the Fund upon entering into a credit default swap contract is recorded as an asset or liability, respectively, and amortized daily as a component of
realized gain (loss) in the Statement of Operations. Credit default swap contracts are valued daily, and the change in value is recorded as unrealized appreciation (depreciation) until the termination of the swap, at which time a realized gain (loss) is recorded.
Credit default swap contracts can involve greater risks than if a fund had invested in the reference obligation directly since, in addition to general market risks, credit default swaps are subject to counterparty credit risk, leverage risk, hedging risk, correlation risk and liquidity risk. The Fund will enter into credit default swap transactions only with counterparties that meet certain standards of creditworthiness.
Interest Rate Swap Contracts
The Fund entered into interest rate swap transactions to gain exposure to or protect itself from market rate changes. These instruments may be used for other purposes in future periods. Interest rate swaps are agreements between two parties that involve the exchange of one type of interest rate for another type of interest rate cash flow on specified dates in the future, based on a predetermined, specified notional amount. Certain interest rate swaps are considered forward-starting, whereby the accrual for the exchange of cash flows does not begin until a specified date in the future (the effective date). The net cash flow for a standard interest rate swap transaction is generally the difference between a floating market interest rate versus a fixed interest rate.
Interest rate swaps are valued daily and unrealized appreciation (depreciation) is recorded. Certain interest rate swaps may accrue periodic interest on a daily basis as a component of unrealized appreciation (depreciation); the Fund will realize a gain or loss upon the payment or receipt of accrued interest. The Fund will realize a gain or a loss when the interest rate swap is terminated.
Risks of entering into interest rate swaps include a lack of correlation between the swaps and the portfolio of bonds the swaps are designed to hedge or replicate. A lack of correlation may cause the interest rate swaps to experience adverse changes in value relative to expectations. In addition, interest rate swaps are subject to the risk of default of a counterparty, and the risk of adverse movements in market interest rates relative to the interest rate swap positions taken. The Fund's maximum risk of loss from counterparty credit risk is the discounted net value of the cash flows to be received from/paid to the counterparty over the contract's remaining life to the extent that such amount is positive, plus the cost of entering into a similar transaction with another counterparty.
The Fund attempts to mitigate counterparty credit risk by entering into interest rate swap transactions only with
Annual Report 2014
42
Notes to Financial Statements (continued)
April 30, 2014
counterparties that meet prescribed levels of creditworthiness, as determined by the Investment Manager. The Fund and any counterparty are required to maintain an agreement that requires the Fund and that counterparty to monitor (on a daily basis) the net market value of all derivative transactions entered into pursuant to the contract between the Fund and such counterparty. If the net market value of such derivatives
transactions between the Fund and that counterparty exceeds a certain threshold (as defined in the agreement), the Fund or the counterparty is required to post cash and/or securities as collateral. Market values of derivatives transactions presented in the financial statements are not netted with the market values of other derivatives transactions or with any collateral amounts posted by the Fund or any counterparty.
Offsetting of Derivative Assets and Derivative Liabilities
The following tables present the Fund's gross and net amount of assets and liabilities available for offset under netting arrangements as well as any related collateral received or pledged by the Fund as of April 30, 2014:
| | | | | | | Net Amounts of | | Gross Amounts Not Offset in
the Statement of Assets and Liabilities | |
| |
| | Gross
Amounts of
Recognized
Assets ($) | | Gross Amounts
Offset in the
Statement of
Assets and
Liabilities ($) | | Assets
Presented in the
Statement of
Assets and
Liabilities ($) | | Financial
Instruments ($)(a) | | Cash
Collateral
Received ($) | | Securities
Collateral
Received ($) | | Net
Amount ($)(b) | |
Asset Derivatives: | |
Over-the-Counter Swap
Contracts(c) | | | 27,804 | | | | — | | | | 27,804 | | | | — | | | | — | | | | — | | | | 27,804 | | |
Centrally Cleared Swap
Contracts(d) | | | 56,920 | | | | — | | | | 56,920 | | | | 56,920 | | | | — | | | | — | | | | — | | |
Total | | | 84,724 | | | | — | | | | 84,724 | | | | 56,920 | | | | — | | | | — | | | | 27,804 | | |
| | | | | | Net Amounts of | | Gross Amounts Not Offset in
the Statement of Assets and Liabilities | | | |
| | Gross
Amounts of
Recognized
Liabilities ($) | | Gross Amounts
Offset in the
Statement of
Assets and
Liabilities ($) | | Liabilities
Presented in the
Statement of
Assets and
Liabilities ($) | | Financial
Instruments ($)(e) | | Cash
Collateral
Pledged ($) | | Securities
Collateral
Pledged ($) | | Net
Amount ($)(f) | |
Liability Derivatives: | |
Over-the-Counter Swap
Contracts(c) | | | 258,681 | | | | — | | | | 258,681 | | | | — | | | | — | | | | — | | | | 258,681 | | |
Centrally Cleared Swap
Contracts(g) | | | 78,056 | | | | — | | | | 78,056 | | | | 56,920 | | | | — | | | | 21,136 | | | | — | | |
Total | | | 336,737 | | | | — | | | | 336,737 | | | | 56,920 | | | | — | | | | 21,136 | | | | 258,681 | | |
(a) Represents the amount of assets that could be offset by liabilities with the same counterparty under master netting or similar agreements that management elects not to offset on the Statement of Assets and Liabilities.
(b) Represents the net amount due from counterparties in the event of default.
(c) Over-the-Counter Swap Contracts are presented at market value plus periodic payments receivable (payable), which is comprised of unrealized appreciation, unrealized depreciation, premiums paid and premiums received.
(d) Centrally cleared swaps are included within receivable for variation margin on the Statement of Assets and Liabilities.
(e) Represents the amount of liabilities that could be offset by assets with the same counterparty under master netting or similar agreements that management elects not to offset on the Statement of Assets and Liabilities.
(f) Represents the net amount due to counterparties in the event of default.
(g) Centrally cleared swaps are included within payable for variation margin on the Statement of Assets and Liabilities.
Annual Report 2014
43
Notes to Financial Statements (continued)
April 30, 2014
Effects of Derivative Transactions in the Financial Statements
The following tables are intended to provide additional information about the effect of derivatives on the financial statements of the Fund, including: the fair value of derivatives by risk category and the location of those fair values in the Statement of Assets and Liabilities; the impact of derivative transactions over the period in the Statement of Operations including realized gains or losses and unrealized gains or losses. The derivative schedules following the Portfolio of Investments present additional information regarding derivative instruments outstanding at the end of the period, if any.
The following table is a summary of the fair value of derivative instruments at April 30, 2014:
Asset Derivatives | |
Risk Exposure
Category | | Statement of Assets and
Liabilities Location | | Fair Value ($) | |
Credit risk
| | Premiums paid on
outstanding swap
contracts | | | 91,346
| | |
Interest rate risk
| | Premiums paid on
outstanding swap
contracts | | | 737
| | |
Interest rate risk
| | Net assets — unrealized
appreciation on futures
contracts | | | 102,120
| * | |
Interest rate risk
| | Net assets — unrealized
appreciation on swap
contracts | | | 65,493
| * | |
Total | | | | | 259,696 | | |
Liability Derivatives | |
Risk Exposure
Category | | Statement of Assets and
Liabilities Location | | Fair Value ($) | |
Credit risk
| | Net assets — unrealized
depreciation on swap
contracts | | | 565,369
| * | |
Credit risk
| | Premiums received on
outstanding swap
contracts | | | 146,018
| | |
Interest rate risk
| | Net assets — unrealized
depreciation on futures
contracts | | | 1,183,309
| * | |
Interest rate risk
| | Net assets — unrealized
depreciation on swap
contracts | | | 44,712
| * | |
Total | | | | | 1,939,408 | | |
*Includes cumulative appreciation (depreciation) as reported in the tables following the Portfolio of Investments. Only the current day's variation margin is reported in receivables or payables in the Statement of Assets and Liabilities.
The following table indicates the effect of derivative instruments in the Statement of Operations for the year ended April 30, 2014:
Amount of Realized Gain (Loss) on Derivatives Recognized in Income | |
Risk Exposure
Category | | Futures
Contracts ($) | | Swap
Contracts ($) | | Total ($) | |
Credit risk | | | — | | | | (1,227,156 | ) | | | (1,227,156 | ) | |
Interest rate risk | | | 4,590,401 | | | | (122,957 | ) | | | 4,467,444 | | |
Total | | | 4,590,401 | | | | (1,350,113 | ) | | | 3,240,288 | | |
Change in Unrealized Appreciation (Depreciation) on
Derivatives Recognized in Income | |
Risk Exposure
Category | | Futures
Contracts ($) | | Swap
Contracts ($) | | Total ($) | |
Credit risk | | | — | | | | (197,113 | ) | | | (197,113 | ) | |
Interest rate risk | | | 1,199,935 | | | | 20,780 | | | | 1,220,715 | | |
Total | | | 1,199,935 | | | | (176,333 | ) | | | 1,023,602 | | |
The following table is a summary of the average outstanding volume by derivative instrument for the year ended April 30, 2014.
Derivative Instrument | | Average Notional Amounts* | |
Futures contracts — Long | | $ | 30,337,985 | | |
Futures contracts — Short | | | 115,079,179 | | |
Credit default Swap
Contracts — buy protection | | | 61,088,750
| | |
Derivate Instrument | | Average Unrealized
Appreciation* | | Average Unrealized
Depreciation* | |
Interest rate swaps | | $ | 88,530 | | | $ | (64,878 | ) | |
*Based on ending quarterly outstanding amounts for the year ended April 30, 2014.
Delayed Delivery Securities
The Fund may trade securities on other than normal settlement terms, including securities purchased or sold on a "when-issued" basis. This may increase risk since the other party to the transaction may fail to deliver which could cause the Fund to subsequently invest at less advantageous prices. The Fund designates cash or liquid securities in an amount equal to the delayed delivery commitment.
Forward Sale Commitments
The Fund may enter into forward sale commitments to hedge its portfolio positions or to sell mortgage-backed securities it owns under delayed delivery arrangements. Proceeds of forward sale commitments are not received until the contractual settlement date. While a forward sale commitment is outstanding, equivalent deliverable securities or an offsetting forward purchase commitment deliverable on or before the sale commitment date, are used to satisfy the commitment.
Annual Report 2014
44
Notes to Financial Statements (continued)
April 30, 2014
Unsettled forward sale commitments are valued at the current market value of the underlying securities, generally according to the procedures described under "Security Valuation" above. The forward sale commitment is "marked-to-market" daily and the change in market value is recorded by the Fund as an unrealized gain or loss. If the forward sale commitment is closed through the acquisition of an offsetting purchase commitment, the Fund realizes a gain or loss. If the Fund delivers securities under the commitment, the Fund realizes a gain or a loss from the sale of the securities based upon the market price established at the date the commitment was entered into.
Mortgage Dollar Roll Transactions
The Fund may enter into mortgage "dollar rolls" in which the Fund sells securities for delivery in the current month and simultaneously contracts with the same counterparty to repurchase similar but not identical securities (same type, coupon and maturity) on a specified future date. During the roll period, the Fund loses the right to receive principal and interest paid on the securities sold. However, the Fund will benefit because it receives negotiated amounts in the form of reductions of the purchase price for the future purchase plus the interest earned on the cash proceeds of the securities sold until the settlement date of the forward purchase. The Fund records the incremental difference between the forward purchase and sale of each forward roll as a realized gain or loss. Unless any realized gains exceed the income, capital appreciation, and gain or loss due to mortgage prepayments that would have been realized on the securities sold as part of the mortgage dollar roll, the use of this technique will diminish the investment performance of the Fund compared to what the performance would have been without the use of mortgage dollar rolls. All cash proceeds will be invested in instruments that are permissible investments for the Fund. The Fund identifies cash or liquid securities in an amount equal to the forward purchase price.
For financial reporting and tax purposes, the Fund treats "to be announced" mortgage dollar rolls as two separate transactions, one involving the purchase of a security and a separate transaction involving a sale. These transactions may increase the Fund's portfolio turnover rate. The Fund does not currently enter into mortgage dollar rolls that are accounted for as financing transactions.
Mortgage dollar rolls involve the risk that the market value of the securities the Fund is obligated to repurchase may decline below the repurchase price, or that the counterparty may default on its obligations.
Interest Only Securities
The Fund may invest in Interest Only Securities (IOs). IOs are stripped securities entitled to receive all of the security's interest, but none of its principal. The Fund may also invest in stripped mortgage-backed securities. If the underlying obligations experience greater than anticipated prepayments of principal, the Fund may fail to fully recoup its initial investment in an IO. As a result of the prepayments the daily interest accrual factor is adjusted periodically (typically, each month) to reflect the paydown of principal. IOs are particularly sensitive to changes in interest rates and therefore subject to greater fluctuations in price than typical interest bearing debt securities. IOs are also subject to credit risk because the Fund may not receive all or part of the interest payments if the issuer or credit enhanced defaults on its obligation.
Security Transactions
Security transactions are accounted for on the trade date. Cost is determined and gains (losses) are based upon the specific identification method for both financial statement and federal income tax purposes.
Income Recognition
Interest income is recorded on an accrual basis. Market premiums and discounts, including original issue discounts, are amortized and accreted, respectively, over the expected life of the security on all debt securities, unless otherwise noted. The Fund classifies gains and losses realized on prepayments received on mortgage-backed securities as adjustments to interest income.
Corporate actions and dividend income are recorded on the ex-dividend date.
Awards from class action litigation are recorded as a reduction of cost basis if the Fund still owns the applicable securities on the payment date. If the Fund no longer owns the applicable securities, the proceeds are recorded as realized gains.
Expenses
General expenses of the Trust are allocated to the Fund and other funds of the Trust based upon relative net assets or other expense allocation methodologies determined by the nature of the expense. Expenses directly attributable to the Fund are charged to the Fund. Expenses directly attributable to a specific class of shares are charged to that share class.
Determination of Class Net Asset Value
All income, expenses (other than class-specific expenses, which are charged to that share class, as shown in the Statement of Operations) and realized and unrealized gains
Annual Report 2014
45
Notes to Financial Statements (continued)
April 30, 2014
(losses) are allocated to each class of the Fund on a daily basis, based on the relative net assets of each class, for purposes of determining the net asset value of each class.
Federal Income Tax Status
The Fund intends to qualify each year as a regulated investment company under Subchapter M of the Internal Revenue Code, as amended, and will distribute substantially all of its taxable income (including net short-term capital gains), if any, for its tax year, and as such will not be subject to federal income taxes. In addition, the Fund intends to distribute in each calendar year substantially all of its net investment income, capital gains and certain other amounts, if any, such that the Fund should not be subject to federal excise tax. Therefore, no federal income or excise tax provision is recorded.
Distributions to Shareholders
Distributions from net investment income, if any, are declared daily and paid monthly. Net realized capital gains, if any, are distributed at least annually. Income distributions and capital gain distributions are determined in accordance with federal income tax regulations, which may differ from GAAP.
Guarantees and Indemnifications
Under the Trust's organizational documents and, in some cases, by contract, its officers and trustees are indemnified against certain liabilities arising out of the performance of their duties to the Trust or its funds. In addition, certain of the Fund's contracts with its service providers contain general indemnification clauses. The Fund's maximum exposure under these arrangements is unknown since the amount of any future claims that may be made against the Fund cannot be determined, and the Fund has no historical basis for predicting the likelihood of any such claims.
Note 3. Fees and Compensation Paid to Affiliates
Investment Management Fees
Under an Investment Management Services Agreement, Columbia Management Investment Advisers, LLC (the Investment Manager), a wholly-owned subsidiary of Ameriprise Financial, Inc. (Ameriprise Financial), determines which securities will be purchased, held or sold. The investment management fee is an annual fee that is equal to a percentage of the Fund's average daily net assets that declines from 0.43% to 0.30% as the Fund's net assets increase. The effective investment management fee rate for the year ended April 30, 2014 was 0.43% of the Fund's average daily net assets.
Administration Fees
Under an Administrative Services Agreement, the Investment Manager also serves as the Fund Administrator. The Fund pays the Fund Administrator an annual fee for administration and accounting services equal to a percentage of the Fund's average daily net assets that declines from 0.07% to 0.04% as the Fund's net assets increase. The effective administration fee rate for the year ended April 30, 2014 was 0.07% of the Fund's average daily net assets.
Compensation of Board Members
Board members are compensated for their services to the Fund as disclosed in the Statement of Operations. The Trust's eligible Trustees may participate in a Deferred Compensation Plan (the Plan) which may be terminated at any time. Obligations of the Plan will be paid solely out of the Fund's assets.
Compensation of Chief Compliance Officer
The Board has appointed a Chief Compliance Officer to the Fund in accordance with federal securities regulations. The Fund pays its pro-rata share of the expenses associated with the Chief Compliance Officer. The Fund's expenses for the Chief Compliance Officer will not exceed $15,000 per year.
Transfer Agent Fees
Under a Transfer and Dividend Disbursing Agent Agreement, Columbia Management Investment Services Corp. (the Transfer Agent), an affiliate of the Investment Manager and a wholly-owned subsidiary of Ameriprise Financial, is responsible for providing transfer agency services to the Fund. The Transfer Agent has contracted with Boston Financial Data Services (BFDS) to serve as sub-transfer agent.
The Transfer Agent receives monthly account-based service fees based on the number of open accounts and also receives sub-transfer agency fees based on a percentage of the average aggregate value of the Fund's shares maintained in omnibus accounts (other than omnibus accounts for which American Enterprise Investment Services Inc. is the broker of record or accounts where the beneficial shareholder is a customer of Ameriprise Financial Services, Inc., which are paid a per account fee). The Transfer Agent pays the fees of BFDS for services as sub-transfer agent and is not entitled to reimbursement for such fees from the Fund (with the exception of out-of-pocket fees).
The Transfer Agent also receives compensation from fees for various shareholder services and reimbursements for certain out-of-pocket fees. Total transfer agent fees for Class R5 shares are subject to an annual limitation of not more than
Annual Report 2014
46
Notes to Financial Statements (continued)
April 30, 2014
0.05% of the average daily net assets attributable to Class R5 shares. Class I and Class Y shares are not subject to transfer agent fees.
For the year ended April 30, 2014, the Fund's effective transfer agent fee rates as a percentage of average daily net assets of each class were as follows:
Class A | | | 0.20 | % | |
Class B | | | 0.20 | | |
Class C | | | 0.20 | | |
Class R | | | 0.20 | | |
Class R4 | | | 0.20 | | |
Class R5 | | | 0.05 | | |
Class T | | | 0.20 | | |
Class W | | | 0.16 | | |
Class Z | | | 0.20 | | |
An annual minimum account balance fee of $20 may apply to certain accounts with a value below the applicable share class's initial minimum investment requirements to reduce the impact of small accounts on transfer agent fees. These minimum account balance fees are recorded as part of expense reductions in the Statement of Operations. For the year ended April 30, 2014, these minimum account balance fees reduced total expenses by $2,411.
Distribution and Service Fees
The Fund has an agreement with Columbia Management Investment Distributors, Inc. (the Distributor), an affiliate of the Investment Manager and a wholly-owned subsidiary of Ameriprise Financial, for distribution and shareholder services. The Board has approved, and the Fund has adopted, distribution and shareholder service plans (the Plans) applicable to certain share classes, which set the distribution and service fees for the Fund. These fees are calculated daily and are intended to compensate the Distributor and/or eligible selling and/or servicing agents for selling shares of the Fund and providing services to investors.
Under the Plans, the Fund pays a monthly service fee to the Distributor at the maximum annual rate of 0.25% of the average daily net assets attributable to Class A, Class B, Class C and Class W shares of the Fund. Also under the Plans, the Fund pays a monthly distribution fee to the Distributor at the maximum annual rates of 0.75%, 0.75%, 0.50% and 0.25% of the average daily net assets attributable to Class B, Class C, Class R and Class W shares, respectively.
The Distributor has voluntarily agreed to waive a portion of the distribution fee for Class C shares so that the distribution fee does not exceed 0.60% annually of the average daily net assets attributable to Class C shares. This arrangement may be modified or terminated by the Distributor at any time.
Although the Fund may pay a distribution fee up to 0.25% of the Fund's average daily net assets attributable to Class W shares and a service fee of up to 0.25% of the Fund's average daily net assets attributable to Class W shares, the aggregate fee shall not exceed 0.25% of the Fund's average daily net assets attributable to Class W shares.
Shareholder Services Fees
The Fund has adopted a shareholder services plan that permits it to pay for certain services provided to Class T shareholders by their selling and/or servicing agents. The Fund may pay shareholder servicing fees up to an aggregate annual rate of 0.40% of the Fund's average daily net assets attributable to Class T shares (comprised of up to 0.20% for shareholder liaison services and up to 0.20% for administrative support services). These fees are currently limited to an aggregate annual rate of not more than 0.15% of the Fund's average daily net assets attributable to Class T shares. In addition, the shareholder servicing fee shall be waived by the selling and/or servicing agents to the extent necessary to prevent net investment income from falling below 0.00% on a daily basis. The effective shareholder services fee rate for the year ended April 30, 2014 was 0.15% of the Fund's average daily net assets attributable to Class T shares.
Sales Charges
Sales charges, including front-end charges and CDSCs, received by the Distributor for distributing Fund shares were $38,214 for Class A, $809 for Class B, $702 for Class C and $246 for Class T shares for the year ended April 30, 2014.
Expenses Waived/Reimbursed by the Investment Manager and its Affiliates
The Investment Manager and certain of its affiliates have contractually agreed to waive fees and/or reimburse expenses (excluding certain fees and expenses described below) for the periods disclosed below, unless sooner terminated at the sole discretion of the Board, so that the Fund's net operating expenses, after giving effect to fees waived/expenses reimbursed and any balance credits and/or overdraft charges
Annual Report 2014
47
Notes to Financial Statements (continued)
April 30, 2014
from the Fund's custodian, do not exceed the following annual rates as a percentage of the class' average daily net assets:
| | | September 1, 2013
through
August 31, 2014 | | Prior to
September 1, 2013 | |
Class A | | | 0.97 | % | | | 0.94 | % | |
Class B | | | 1.72 | | | | 1.69 | | |
Class C | | | 1.72 | | | | 1.69 | | |
Class I | | | 0.57 | | | | 0.53 | | |
Class R | | | 1.22 | | | | 1.19 | | |
Class R4 | | | 0.72 | | | | 0.69 | | |
Class R5 | | | 0.62 | | | | 0.58 | | |
Class T | | | 0.87 | | | | 0.84 | | |
Class W | | | 0.97 | | | | 0.94 | | |
Class Y | | | 0.57 | | | | 0.53 | | |
Class Z | | | 0.72 | | | | 0.69 | | |
Under the agreement governing these fee waivers and/or expense reimbursement arrangements, the following fees and expenses are excluded from the waiver/reimbursement commitment, and therefore will be paid by the Fund, if applicable: taxes (including foreign transaction taxes), expenses associated with investments in affiliated and non-affiliated pooled investment vehicles (including mutual funds and exchange-traded funds), transaction costs and brokerage commissions, costs related to any securities lending program, dividend expenses associated with securities sold short, inverse floater program fees and expenses, transaction charges and interest on borrowed money, interest, extraordinary expenses and any other expenses the exclusion of which is specifically approved by the Board. This agreement may be modified or amended only with approval from all parties. Class C distribution fees waived by the Distributor, as discussed above, are in addition to the waiver/reimbursement commitment under the agreement.
Note 4. Federal Tax Information
The timing and character of income and capital gain distributions are determined in accordance with income tax regulations, which may differ from GAAP because of temporary or permanent book to tax differences.
At April 30, 2014, these differences are primarily due to differing treatment for principal and/or interest of fixed income securities, deferral/reversal of wash sales losses, Trustees' deferred compensation, distribution reclassifications, derivative investments and tax straddles. To the extent these differences are permanent, reclassifications are made among the components of the Fund's net assets in the Statement of Assets and Liabilities. Temporary differences
do not require reclassifications. In the Statement of Assets and Liabilities the following reclassifications were made:
Undistributed net investment income | | $ | 1,211,744 | | |
Accumulated net realized gain | | | (1,211,746 | ) | |
Paid-in capital | | | 2 | | |
Net investment income and net realized gains (losses), as disclosed in the Statement of Operations, and net assets were not affected by this reclassification.
The tax character of distributions paid during the years indicated was as follows:
Year Ended April 30, | | 2014 | | 2013 | |
Ordinary income | | $ | 19,032,410 | | | $ | 48,223,096 | | |
Long-term capital gains | | | 30,181,917 | | | | 33,500,087 | | |
Total | | $ | 49,214,327 | | | $ | 81,723,183 | | |
Short-term capital gain distributions, if any, are considered ordinary income distributions for tax purposes.
At April 30, 2014, the components of distributable earnings on a tax basis were as follows:
Undistributed accumulated long-term gains | | $ | 3,398,524 | | |
Net unrealized appreciation | | | 24,957,729 | | |
At April 30, 2014, the cost of investments for federal income tax purposes was $859,436,262 and the aggregate gross unrealized appreciation and depreciation based on that cost was:
Unrealized appreciation | | $ | 30,643,027 | | |
Unrealized depreciation | | | (5,685,298 | ) | |
Net unrealized appreciation | | $ | 24,957,729 | | |
Management of the Fund has concluded that there are no significant uncertain tax positions that would require recognition in the financial statements. However, management's conclusion may be subject to review and adjustment at a later date based on factors including, but not limited to, new tax laws, regulations, and administrative interpretations (including relevant court decisions). Generally, the Fund's federal tax returns for the prior three fiscal years remain subject to examination by the Internal Revenue Service.
Note 5. Portfolio Information
The cost of purchases and proceeds from sales of securities, excluding short-term obligations, aggregated to $3,483,544,289 and $3,862,720,572, respectively, for the year ended April 30, 2014, of which $3,115,925,884 and $3,342,521,975, respectively, were U.S. government securities.
Annual Report 2014
48
Notes to Financial Statements (continued)
April 30, 2014
Note 6. Affiliated Money Market Fund
The Fund invests its daily cash balances in Columbia Short-Term Cash Fund, an affiliated money market fund established for the exclusive use by the Fund and other affiliated funds. The income earned by the Fund from such investments is included as "Dividends — affiliated issuers" in the Statement of Operations. As an investing fund, the Fund indirectly bears its proportionate share of the expenses of Columbia Short-Term Cash Fund.
Note 7. Shareholder Concentration
At April 30, 2014, one unaffiliated shareholder of record owned 77.6% of the outstanding shares of the Fund in one or more accounts. The Fund has no knowledge about whether any portion of those shares was owned beneficially. Subscription and redemption activity by concentrated accounts may have a significant effect on the operations of the Fund.
Note 8. Line of Credit
The Fund has entered into a revolving credit facility with a syndicate of banks led by JPMorgan Chase Bank N.A. whereby the Fund may borrow for the temporary funding of shareholder redemptions or for other temporary or emergency purposes. The credit facility agreement, as amended, which is a collective agreement between the Fund and certain other funds managed by the Investment Manager, severally and not jointly, permits collective borrowings up to $500 million. Interest is charged to each participating fund based on its borrowings at a rate equal to the higher of (i) the overnight federal funds rate plus 1.00% or (ii) the one-month LIBOR rate plus 1.00%. Each borrowing under the credit facility matures no later than 60 days after the date of borrowing. Effective December 10, 2013, the Fund also pays a commitment fee equal to its pro rata share of the amount of the credit facility at a rate of 0.075% per annum. Prior to December 10, 2013, the commitment fee was charged at the annual rate of 0.08% per annum. The commitment fee is included in other expenses in the Statement of Operations.
The Fund had no borrowings during the year ended April 30, 2014.
Note 9. Significant Risks
Asset-Backed Securities Risk
The value of asset-backed securities may be affected by, among other factors, changes in interest rates, the market's assessment of the quality of underlying assets, the creditworthiness of the servicer for the underlying assets, factors concerning the interests in and structure of the issuer or the originator of the underlying assets, or the creditworthiness or rating of the entities that provide any supporting letters of credit, surety
bonds, derivative instruments, or other credit enhancement. The value of asset-backed securities also will be affected by the exhaustion, termination or expiration of any credit enhancement. Most asset-backed securities are subject to prepayment risk, which is the possibility that the underlying debt may be refinanced or prepaid prior to maturity during periods of declining or low interest rates, causing the Fund to have to reinvest the money received in securities that have lower yields. In addition, the impact of prepayments on the value of asset-backed securities may be difficult to predict and may result in greater volatility.
Mortgage-Backed Securities Risk
The value of mortgage-backed securities may be affected by, among other things, changes in interest rates, factors concerning the interests in and structure of the issuer or the originator of the mortgages, the creditworthiness of the entities that provide any supporting letters of credit, surety bonds or other credit enhancements or the quality of underlying assets or the market's assessment thereof. Mortgage-backed securities are subject to prepayment risk, which is the possibility that the underlying mortgage may be refinanced or prepaid prior to maturity during periods of declining or low interest rates, causing the Fund to have to reinvest the money received in securities that have lower yields. In addition, the impact of prepayments on the value of mortgage-backed securities may be difficult to predict and may result in greater volatility.
Note 10. Subsequent Events
Management has evaluated the events and transactions that have occurred through the date the financial statements were issued and noted no items requiring adjustment of the financial statements or additional disclosure.
Note 11. Information Regarding Pending and Settled Legal Proceedings
In December 2005, without admitting or denying the allegations, American Express Financial Corporation (AEFC, which is now known as Ameriprise Financial, Inc. (Ameriprise Financial)) entered into settlement agreements with the Securities and Exchange Commission (SEC) and Minnesota Department of Commerce (MDOC) related to market timing activities. As a result, AEFC was censured and ordered to cease and desist from committing or causing any violations of certain provisions of the Investment Advisers Act of 1940, the Investment Company Act of 1940, and various Minnesota laws. AEFC agreed to pay disgorgement of $10 million and civil money penalties of $7 million. AEFC also agreed to retain an independent distribution consultant to assist in developing a plan for distribution of all disgorgement and civil penalties
Annual Report 2014
49
Notes to Financial Statements (continued)
April 30, 2014
ordered by the SEC in accordance with various undertakings detailed at www.sec.gov/litigation/admin/ia-2451.pdf. Ameriprise Financial and its affiliates have cooperated with the SEC and the MDOC in these legal proceedings, and have made regular reports to the Funds' Boards of Trustees.
Ameriprise Financial and certain of its affiliates have historically been involved in a number of legal, arbitration and regulatory proceedings, including routine litigation, class actions, and governmental actions, concerning matters arising in connection with the conduct of their business activities. Ameriprise Financial believes that the Funds are not currently the subject of, and that neither Ameriprise Financial nor any of its affiliates are the subject of, any pending legal, arbitration or regulatory proceedings that are likely to have a material adverse effect on the Funds or the ability of Ameriprise Financial or its affiliates to perform under their contracts with the Funds. Ameriprise Financial is required to make 10-Q, 10-K and, as necessary, 8-K filings with the Securities and Exchange Commission on legal and regulatory matters that relate to Ameriprise Financial and its affiliates. Copies of these filings may be obtained by accessing the SEC website at www.sec.gov.
There can be no assurance that these matters, or the adverse publicity associated with them, will not result in increased fund redemptions, reduced sale of fund shares or other adverse consequences to the Funds. Further, although we believe proceedings are not likely to have a material adverse effect on the Funds or the ability of Ameriprise Financial or its affiliates to perform under their contracts with the Funds, these proceedings are subject to uncertainties and, as such, we are unable to estimate the possible loss or range of loss that may result. An adverse outcome in one or more of these proceedings could result in adverse judgments, settlements, fines, penalties or other relief that could have a material adverse effect on the consolidated financial condition or results of operations of Ameriprise Financial.
Annual Report 2014
50
Report of Independent Registered Public Accounting Firm
To the Trustees of Columbia Funds Series Trust I and the Shareholders of
Columbia Bond Fund
In our opinion, the accompanying statement of assets and liabilities, including the portfolio of investments, and the related statements of operations and of changes in net assets and the financial highlights present fairly, in all material respects, the financial position of Columbia Bond Fund (the "Fund", a series of Columbia Funds Series Trust I) at April 30, 2014, and the results of its operations, the changes in its net assets and the financial highlights for each of the periods indicated, in conformity with accounting principles generally accepted in the United States of America. These financial statements and financial highlights (hereafter referred to as "financial statements") are the responsibility of the Fund's management; our responsibility is to express an opinion on these financial statements based on our audits. We conducted our audits of these financial statements in accordance with the standards of the Public Company Accounting Oversight Board (United States). Those standards require that we plan and perform the audit to obtain reasonable assurance about whether the financial statements are free of material misstatement. An audit includes examining, on a test basis, evidence supporting the amounts and disclosures in the financial statements, assessing the accounting principles used and significant estimates made by management, and evaluating the overall financial statement presentation. We believe that our audits, which included confirmation of securities at April 30, 2014 by correspondence with the custodian, brokers and transfer agent, and the application of alternative auditing procedures where such confirmations had not been received, provide a reasonable basis for our opinion.
PricewaterhouseCoopers LLP
Minneapolis, Minnesota
June 20, 2014
Annual Report 2014
51
Federal Income Tax Information
(Unaudited)
The Fund hereby designates the following tax attributes for the fiscal year ended April 30, 2014. Shareholders will be notified in early 2015 of the amounts for use in preparing 2014 income tax returns.
Tax Designations:
Capital Gain Dividend | | $ | 9,235,287 | | |
Capital Gain Dividend. The Fund designates as a capital gain dividend the amount reflected above, or if subsequently determined to be different, the net capital gain of such fiscal period. The Fund also designates as capital gain dividends, to the extent necessary to fully distribute such capital gains, earnings and profits distributed to shareholders on the redemption of shares.
Annual Report 2014
52
The Trustees serve terms of indefinite duration. The names, addresses and birth years of the Trustees and Officers of the Funds in Columbia Funds Series Trust I, the year each was first elected or appointed to office, their principal business occupations during at least the last five years, the number of Funds overseen by each Trustee and other directorships they hold are shown below. Each officer listed below serves as an officer of each Fund in Columbia Funds Series Trust I.
Independent Trustees
Name, Address and Year of Birth,
Position with Funds, Year First
Elected or Appointed to Office | | Principal Occupation(s) During Past Five Years, Number of Funds in Columbia
Funds Complex Overseen by Trustee, Other Directorships Held | |
Rodman L. Drake (Born 1943)
c/o Columbia Management
Investment Advisers, LLC
225 Franklin Street
Boston, MA 02110
Trustee (since 1994) and
Chairman of the Board (since 2009) | | Independent consultant since 2010; Co-Founder of Baringo Capital LLC (private equity) from 1997 to 2008; Chairman (from 2003 to 2010) and CEO (from 2008 to 2010) of Crystal River Capital, Inc. (real estate investment trust); Oversees 54; Jackson Hewitt Tax Service Inc. (tax preparation services) from 2004 to 2011; Student Loan Corporation (student loan provider) from 2005 to 2010; Celgene Corporation (global biotechnology company); The Helios Funds and Brookfield Funds (closed-end funds); Chimerix, Inc. (biopharmaceutical company) since August 1, 2013; Crystal River Capital, Inc. from 2005 to 2010; Parsons Brinckerhoff from 1995 to 2008; and Apex Silver Mines Ltd. from 2007 to 2009 | |
Douglas A. Hacker (Born 1955)
c/o Columbia Management
Investment Advisers, LLC
225 Franklin Street
Boston, MA 02110
Trustee (since 1996) | | Independent business executive since May 2006; Executive Vice President — Strategy of United Airlines from December 2002 to May 2006; President of UAL Loyalty Services (airline marketing company) from September 2001 to December 2002; Executive Vice President and Chief Financial Officer of United Airlines from July 1999 to September 2001. Oversees 54; Nash Finch Company (food distributor); Aircastle Limited (aircraft leasing); and SeaCube Container Leasing Ltd. (container leasing) | |
Janet Langford Kelly (Born 1957)
c/o Columbia Management
Investment Advisers, LLC
225 Franklin Street
Boston, MA 02110
Trustee (since 1996) | | Senior Vice President, General Counsel and Corporate Secretary, ConocoPhillips (integrated energy company) since September 2007; Deputy General Counsel — Corporate Legal Services, ConocoPhillips from August 2006 to August 2007; Partner, Zelle, Hofmann, Voelbel, Mason & Gette LLP (law firm) from March 2005 to July 2006; Adjunct Professor of Law, Northwestern University from September 2004 to June 2006; Director, UAL Corporation (airline) from February 2006 to July 2006; Chief Administrative Officer and Senior Vice President, Kmart Holding Corporation (consumer goods) from September 2003 to March 2004. Oversees 54; None | |
Nancy T. Lukitsh (Born 1956)
c/o Columbia Management
Investment Advisers, LLC
225 Franklin Street
Boston, MA 02110
Trustee (since 2011) | | Senior Vice President, Partner and Director of Marketing, Wellington Management Company, LLP (investment adviser) from 1997 to 2010; Chair, Wellington Management Investment Portfolios (commingled non-U.S. investment pools) from 2007 to 2010; Director, Wellington Trust Company, NA and other Wellington affiliates from 1997 to 2010. Oversees 54; None | |
William E. Mayer (Born 1940)
c/o Columbia Management
Investment Advisers, LLC
225 Franklin Street
Boston, MA 02110
Trustee (since 1994) | | Partner, Park Avenue Equity Partners (private equity) since February 1999; Dean and Professor, College of Business and Management, University of Maryland from 1992 to 1996. Oversees 54; DynaVox Inc. (speech creation); Lee Enterprises (print media); WR Hambrecht + Co. (financial service provider) from 2000 to 2012; BlackRock Kelso Capital Corporation (investment company) | |
David M. Moffett (Born 1952)
c/o Columbia Management
Investment Advisers, LLC
225 Franklin Street
Boston, MA 02110
Trustee (since 2011) | | Retired. Chief Executive Officer, Federal Home Loan Mortgage Corporation, from 2008 to 2009; Senior Adviser, Global Financial Services Group, Carlyle Group, Inc., from 2007 to 2008; Vice Chairman and Chief Financial Officer, U.S. Bancorp, from 1993 to 2007. Oversees 54; CIT Group Inc. (commercial and consumer finance); eBay Inc. (online trading community); MBIA Inc. (financial service provider); E.W. Scripps Co. (print and television media), Building Materials Holding Corp. (building materials and construction services); Genworth Financial, Inc. (financial and insurance products and services); and University of Oklahoma Foundation | |
Charles R. Nelson (Born 1942)
c/o Columbia Management
Investment Advisers, LLC
225 Franklin Street
Boston, MA 02110
Trustee (since 1981) | | Retired. Professor Emeritus, University of Washington, since 2011; Professor of Economics, University of Washington from 1976 to 2011; Ford and Louisa Van Voorhis Professor of Political Economy, University of Washington from 1993 to 2011; Adjunct Professor of Statistics, University of Washington from 1980 to 2011; Associate Editor, Journal of Money, Credit and Banking from September 1993 to 2008; consultant on econometric and statistical matters. Oversees 54; None | |
John J. Neuhauser (Born 1943)
c/o Columbia Management
Investment Advisers, LLC
225 Franklin Street
Boston, MA 02110
Trustee (since 1984) | | President, Saint Michael's College, since August 2007; Director or Trustee of several non-profit organizations, including Fletcher Allen Health Care, Inc.; University Professor, Boston College from November 2005 to August 2007; Academic Vice President and Dean of Faculties, Boston College from August 1999 to October 2005. Oversees 54; Liberty All-Star Equity Fund and Liberty All-Star Growth Fund (closed-end funds) | |
Annual Report 2014
53
Trustees and Officers (continued)
Independent Trustees (continued)
Name, Address and Year of Birth,
Position with Funds, Year First
Elected or Appointed to Office | | Principal Occupation(s) During Past Five Years, Number of Funds in Columbia
Funds Complex Overseen by Trustee, Other Directorships Held | |
Patrick J. Simpson (Born 1944)
c/o Columbia Management
Investment Advisers, LLC
225 Franklin Street
Boston, MA 02110
Trustee (since 2000) | | Partner, Perkins Coie LLP (law firm). Oversees 54; None | |
Anne-Lee Verville (Born 1945)
c/o Columbia Management
Investment Advisers, LLC
225 Franklin Street
Boston, MA 02110
Trustee (since 1998) | | Retired. General Manager — Global Education Industry from 1994 to 1997, President — Application Systems Division from 1991 to 1994, Chief Financial Officer — US Marketing & Services from 1988 to 1991, and Chief Information Officer from 1987 to 1988, IBM Corporation (computer and technology). Oversees 54; Enesco Group, Inc. (producer of giftware and home and garden decor products) from 2001 to 2006 | |
Interested Trustee
Name, Address and Year of Birth,
Position with Funds, Year First
Elected or Appointed to Office | | Principal Occupation(s) During Past Five Years, Number of Funds in Columbia
Funds Complex Overseen by Trustee, Other Directorships Held | |
William F. Truscott (born 1960)
53600 Ameriprise Financial Center
Minneapolis, MN 55474
Senior Vice President (since 2012) | | Chairman of the Board and President, Columbia Management Investment Advisers, LLC since May 2010 and February 2012 (previously President and Chief Investment Officer, from 2001 to April 2010); Chief Executive Officer, Global Asset Management, Ameriprise Financial, Inc. since September 2012 (previously, Chief Executive Officer, U.S. Asset Management & President, Annuities, from May 2010 to September 2012 and President — U.S. Asset Management and Chief Investment Officer from 2005 to April 2010); Director and Chief Executive Officer, Columbia Management Investment Distributors, Inc. since May 2010 and February 2012, respectively (previously Chairman of the Board and Chief Executive Officer from 2006 to April 2010); Chairman of the Board and Chief Executive Officer, RiverSource Distributors, Inc. since 2006; President and Chief Executive Officer, Ameriprise Certificate Company, 2006 to August 2012; Oversees 186; Director, Ameriprise Certificate Company, 2006-January 2013 | |
The Statement of Additional Information has additional information about the Fund's Board members and is available, without charge, upon request by calling 800.345.6611; contacting your financial intermediary; or visiting columbiamanagement.com.
The Board has appointed officers who are responsible for day-to-day business decisions based on policies it has established. The officers serve at the pleasure of the Board. In addition to Mr. Truscott, who is Senior Vice President, the Funds' other officers are:
Officers
Name,
Address and
Year of Birth | | Position and Year
First Appointed to
Position for any Fund
in the Columbia
Funds Complex or a
Predecessor Thereof | | Principal Occupation(s) During Past Five Years | |
J. Kevin Connaughton
225 Franklin Street
Boston, MA 02110
Born 1964 | | President and Principal Executive Officer (2009) | | Senior Vice President and General Manager — Mutual Fund Products, Columbia Management Investment Advisers, LLC, since May 2010; and President, Columbia Funds since 2009; previously, Managing Director, Columbia Management Advisors, LLC, from December 2004 to April 2010; Senior Vice President and Chief Financial Officer, Columbia Funds, from June 2008 to January 2009; and senior officer of Columbia Funds and affiliated funds since 2003. | |
Michael G. Clarke
225 Franklin Street
Boston, MA 02110
Born 1969 | | Treasurer (2011) and Chief Financial Officer (2009) | | Vice President, Columbia Management Investment Advisers, LLC, since May 2010; previously, Managing Director of Fund Administration, Columbia Management Advisors, LLC, from September 2004 to April 2010; and senior officer of Columbia Funds and affiliated funds since 2002. | |
Annual Report 2014
54
Trustees and Officers (continued)
Officers (continued)
Name,
Address and
Year of Birth | | Position and Year
First Appointed to
Position for any Fund
in the Columbia
Funds Complex or a
Predecessor Thereof | | Principal Occupation(s) During Past Five Years | |
Scott R. Plummer
5228 Ameriprise
Financial Center
Minneapolis, MN 55474
Born 1959 | | Senior Vice President (2006), Chief Legal Officer (2006) and Assistant Secretary (2011) | | Senior Vice President, Chief Legal Officer and Assistant Secretary, Columbia Management Investment Advisers, LLC, since June 2005; Senior Vice President and Lead Chief Counsel — Asset Management, Ameriprise Financial, Inc., since May 2010 (previously, Vice President and Chief Counsel — Asset Management, from 2005 to April 2010); Vice President, Chief Counsel and Assistant Secretary, Columbia Management Investment Distributors, Inc., since 2008; Vice President, General Counsel and Secretary, Ameriprise Certificate Company, since 2005; Chief Counsel, RiverSource Distributors, Inc., since 2006; and senior officer of Columbia Funds and affiliated funds since 2006. | |
Thomas P. McGuire
225 Franklin Street
Boston, MA 02110
Born 1972 | | Chief Compliance Officer (2012) | | Vice President — Asset Management Compliance, Ameriprise Financial, Inc., since May 2010; Chief Compliance Officer, Ameriprise Certificate Company, since September 2010; Compliance Executive, Bank of America, from 2005 to April 2010. | |
Colin Moore
225 Franklin Street
Boston, MA 02110
Born 1958 | | Senior Vice President (2010) | | Executive Vice President and Global Chief Investment Officer, Ameriprise Financial, Inc., since July 2013; Director and Global Chief Investment Officer, Columbia Management Investment Advisers, LLC, since May 2010; previously, Manager, Managing Director and Chief Investment Officer, Columbia Management Advisors, LLC, from 2007 to April 2010. | |
Michael E. DeFao
225 Franklin Street
Boston, MA 02110
Born 1968 | | Vice President (2011) and Assistant Secretary (2010) | | Vice President and Chief Counsel, Ameriprise Financial, Inc., since May 2010; Associate General Counsel, Bank of America from 2005 to April 2010. | |
Joseph F. DiMaria
225 Franklin Street
Boston, MA 02110
Born 1968 | | Vice President (2011) and Chief Accounting Officer (2008) | | Vice President — Mutual Fund Administration, Columbia Management Investment Advisers, LLC, since May 2010; previously, Director of Fund Administration, Columbia Management Advisors, LLC, from 2006 to April 2010. | |
Paul B. Goucher
100 Park Avenue
New York, NY 10017
Born 1968 | | Vice President (2011) and Assistant Secretary (2008) | | Vice President and Lead Chief Counsel, Ameriprise Financial, Inc., since November 2008 and January 2013, respectively (previously, Chief Counsel, from January 2010 to January 2013, and Group Counsel from November 2008 to January 2010); previously, Director, Managing Director and General Counsel, J. & W. Seligman & Co. Incorporated, from July 2008 to November 2008. | |
Amy Johnson
5228 Ameriprise
Financial Center
Minneapolis, MN
Born 1965 | | Vice President (2006) | | Senior Vice President and Chief Operating Officer, Columbia Management Investment Advisers, LLC, since May 2010; previously, Chief Administrative Officer, from 2009 to April 2010, and Vice President — Asset Management and Trust Company Services, from 2006 to 2009. | |
Paul D. Pearson
5228 Ameriprise
Financial Center
Minneapolis, MN
Born 1956 | | Vice President (2011) and Assistant Treasurer (1999) | | Vice President — Investment Accounting, Columbia Management Investment Advisers, LLC, since May 2010; previously, Vice President — Managed Assets, Investment Accounting, Ameriprise Financial, Inc. from 1998 to April 2010. | |
Christopher O. Petersen
5228 Ameriprise
Financial Center
Minneapolis, MN 55474
Born 1970 | | Vice President and Secretary (2010) | | Vice President and Chief Counsel, Ameriprise Financial, Inc., since January 2010 (previously, Vice President and Group Counsel or Counsel from 2004 to January 2010); officer of Columbia Funds and affiliated funds since 2007. | |
Stephen T. Welsh
225 Franklin Street
Boston, MA 02110
Born 1957 | | Vice President (2006) | | President and Director, Columbia Management Investment Services Corp., since May 2010; previously, President and Director, Columbia Management Services, Inc., from 2004 to April 2010; and Managing Director, Columbia Management Distributors, Inc., from 2007 to April 2010. | |
Annual Report 2014
55
This page intentionally left blank.
Annual Report 2014
56
Important Information About This Report
Each fund mails one shareholder report to each shareholder address. If you would like more than one report, please call shareholder services at 800.345.6611 and additional reports will be sent to you.
The policy of the Board is to vote the proxies of the companies in which each fund holds investments consistent with the procedures as stated in the Statement of Additional Information (SAI). You may obtain a copy of the SAI without charge by calling 800.345.6611; contacting your financial intermediary; visiting columbiamanagement.com; or searching the website of the Securities and Exchange Commission (SEC) at sec.gov. Information regarding how each fund voted proxies relating to portfolio securities is filed with the SEC by August 31 for the most recent 12-month period ending June 30 of that year, and is available without charge by visiting columbiamanagement.com; or searching the website of the SEC at sec.gov.
Each fund files a complete schedule of portfolio holdings with the SEC for the first and third quarters of each fiscal year on Form N-Q. Each fund's Form N-Q is available on the SEC's website at sec.gov and may be reviewed and copied at the SEC's Public Reference Room in Washington, D.C. Information on the operation of the Public Reference Room may be obtained by calling 800.SEC.0330. Each fund's complete schedule of portfolio holdings, as filed on Form N-Q, can also be obtained without charge, upon request, by calling 800.345.6611.
Annual Report 2014
57

Columbia Bond Fund
P.O. Box 8081
Boston, MA 02266-8081
columbiamanagement.com
This information is for use with concurrent or prior delivery of a fund prospectus. Please read and consider the investment objectives, risks, charges and expenses for any fund carefully before investing. For a prospectus and, if available, a summary prospectus, which contains this and other important information about the Fund go to columbiamanagement.com. The Fund is distributed by Columbia Management Investment Distributors, Inc., member FINRA, and managed by Columbia Management Investment Advisers, LLC.
© 2014 Columbia Management Investment Advisers, LLC. All rights reserved.
ANN121_04_D01_(06/14)
Annual Report
April 30, 2014

Columbia Intermediate Bond Fund
Not FDIC insured • No bank guarantee • May lose value
 Dear Shareholders,
Continued Economic Recovery
The U.S. economy continued to recover at a slow but steady pace during the first quarter of 2014, supported by solid manufacturing activity, reasonable job growth and continued gains for the housing market. Industrial production was robust, buoyed by strong demand for autos and related parts. After a disappointing January, job growth picked up, which helped boost consumer confidence. Housing data was somewhat mixed, as harsh weather and higher mortgage rates put a damper on sales, while lower inventories helped prices trend higher. The Federal Reserve (the Fed) announced further reductions to its monthly asset purchases and reassured the markets that it would not make any significant changes to monetary policy until it was satisfied that the labor market was on solid ground. Despite mostly good news on the economic front, the broad financial markets recorded only modest gains, as bitter winter weather at home and mounting tensions between Russia and Western allies prompted investor caution.
Investors braced for higher interest rates, but long-term yields declined and the fixed-income markets were surprisingly resilient in the face of stable-to-improving economic data. Risk-on trading continued during the quarter as the higher yielding sectors of the fixed-income markets generally fared well. Emerging-market bonds, long-term U.S. Treasuries and sovereign debt were among the strongest performers, as were Treasury Inflation Protected Securities. Municipal bonds delivered solid gains, especially high-yield municipals, which benefited from continued improvement in state finances.
Against this backdrop, the broad bond market, as measured by the Barclays U.S. Aggregate Bond Index, edged out the broad stock market, as measured by the Standard & Poor's 500 Index, with gains of 1.84% vs. 1.81%, respectively. As indicated late last year, the Fed began tapering its monthly asset purchase program and announced further reductions. New Fed chair Janet Yellen reassured investors the Fed was committed to keeping short-term borrowing rates low into 2015.
Stay on Track with Columbia Management
Backed by more than 100 years of experience, Columbia Management is one of the nation's largest asset managers. At the heart of our success and, most importantly, that of our investors, are highly talented industry professionals, brought together by a unique way of working. At Columbia Management, reaching our performance goals matters, and how we reach them matters just as much.
Visit columbiamanagement.com for:
> The Columbia Management Perspectives blog, offering insights on current market events and investment opportunities
> Detailed up-to-date fund performance and portfolio information
> Quarterly fund commentaries
> Columbia Management investor, our award-winning quarterly newsletter for shareholders
Thank you for your continued support of the Columbia Funds. We look forward to serving your investment needs for many years to come.
Best Regards,

J. Kevin Connaughton
President, Columbia Funds
Investing involves risk including the risk of loss of principal.
The Barclays U.S. Aggregate Bond Index is a broad-based benchmark that measures the investment grade, U.S. dollar denominated, fixed-rate taxable bond market, including Treasuries, government-related and corporate securities, mortgage-backed securities (agency fixed-rate and hybrid adjustable-rate mortgage passthroughs), asset-backed securities, and commercial mortgage-backed securities. The S&P 500 Index, an unmanaged index, measures the performance of 500 widely held, large-capitalization U.S. stocks and is frequently used as a general measure of market performance. Indices are not available for investment, are not professionally managed and do not reflect sales charges, fees, brokerage commissions, taxes or other expenses of investing.
Investors should consider the investment objectives, risks, charges and expenses of a mutual fund carefully before investing. For a free prospectus and, if available, a summary prospectus, which contains this and other important information about a fund, visit columbiamanagement.com. The prospectus should be read carefully before investing.
Columbia Funds are distributed by Columbia Management Investment Distributors, Inc., member FINRA, and managed by Columbia Management Investment Advisers, LLC.
© 2014 Columbia Management Investment Advisers, LLC. All rights reserved.
Columbia Intermediate Bond Fund
Performance Overview | | | 2 | | |
Manager Discussion of Fund Performance | | | 4 | | |
Understanding Your Fund's Expenses | | | 6 | | |
Portfolio of Investments | | | 7 | | |
Statement of Assets and Liabilities | | | 36 | | |
Statement of Operations | | | 38 | | |
Statement of Changes in Net Assets | | | 39 | | |
Financial Highlights | | | 42 | | |
Notes to Financial Statements | | | 53 | | |
Report of Independent Registered
Public Accounting Firm | | | 66 | | |
Trustees and Officers | | | 67 | | |
Important Information About This Report | | | 73 | | |
Fund Investment Manager
Columbia Management Investment
Advisers, LLC
225 Franklin Street
Boston, MA 02110
Fund Distributor
Columbia Management Investment
Distributors, Inc.
225 Franklin Street
Boston, MA 02110
Fund Transfer Agent
Columbia Management Investment
Services Corp.
P.O. Box 8081
Boston, MA 02266-8081
For more information about any of the funds, please visit columbiamanagement.com or call 800.345.6611. Customer Service Representatives are available to answer your questions Monday through Friday from 8 a.m. to 7 p.m. Eastern time.
The views expressed in this report reflect the current views of the respective parties. These views are not guarantees of future performance and involve certain risks, uncertainties and assumptions that are difficult to predict, so actual outcomes and results may differ significantly from the views expressed. These views are subject to change at any time based upon economic, market or other conditions and the respective parties disclaim any responsibility to update such views. These views may not be relied on as investment advice and, because investment decisions for a Columbia Fund are based on numerous factors, may not be relied on as an indication of trading intent on behalf of any particular Columbia Fund. References to specific securities should not be construed as a recommendation or investment advice.
Columbia Intermediate Bond Fund
Performance Summary
> Columbia Intermediate Bond Fund (the Fund) Class A shares returned -0.62% excluding sales charges for the 12-month period that ended April 30, 2014.
> The Fund's benchmark, the Barclays U.S. Aggregate Bond Index, returned -0.26% for the same period.
> An overweight in 10-year bonds and the Fund's position in mortgage securities detracted from results during the period.
Average Annual Total Returns (%) (for period ended April 30, 2014)
| | Inception | | 1 Year | | 5 Years | | 10 Years | |
Class A | | 07/31/00 | | | | | | | |
Excluding sales charges | | | | | -0.62 | | | | 7.39 | | | | 4.78 | | |
Including sales charges | | | | | -3.86 | | | | 6.70 | | | | 4.27 | | |
Class B | | 02/01/02 | | | | | | | |
Excluding sales charges | | | | | -1.36 | | | | 6.59 | | | | 4.00 | | |
Including sales charges | | | | | -4.25 | | | | 6.59 | | | | 4.00 | | |
Class C | | 02/01/02 | | | | | | | |
Excluding sales charges | | | | | -1.21 | | | | 6.76 | | | | 4.16 | | |
Including sales charges | | | | | -2.17 | | | | 6.76 | | | | 4.16 | | |
Class I* | | 09/27/10 | | | -0.27 | | | | 7.77 | | | | 5.10 | | |
Class K* | | 02/28/13 | | | -0.53 | | | | 7.47 | | | | 4.84 | | |
Class R* | | 01/23/06 | | | -0.87 | | | | 7.13 | | | | 4.52 | | |
Class R4* | | 11/08/12 | | | -0.38 | | | | 7.66 | | | | 5.04 | | |
Class R5* | | 11/08/12 | | | -0.28 | | | | 7.69 | | | | 5.05 | | |
Class W* | | 09/27/10 | | | -0.62 | | | | 7.44 | | | | 4.83 | | |
Class Y* | | 11/08/12 | | | -0.17 | | | | 7.71 | | | | 5.07 | | |
Class Z | | 12/05/78 | | | -0.37 | | | | 7.66 | | | | 5.04 | | |
Barclays U.S. Aggregate Bond Index | | | | | -0.26 | | | | 4.88 | | | | 4.83 | | |
Returns for Class A are shown with and without the maximum initial sales charge of 3.25% (for the one-year and five-year periods) and 4.75% (for the ten-year period). (Prior to August 22, 2005, new purchases of Class A shares had a maximum initial sales charge of 4.75%.) Returns for Class B are shown with and without the applicable contingent deferred sales charge (CDSC) of 3.00% in the first year, declining to 1.00% in the fourth year and eliminated thereafter. Returns for Class C are shown with and without the 1.00% CDSC for the first year only. The Fund's other classes are not subject to sales charges and have limited eligibility. Please see the Fund's prospectus for details. Performance for different share classes will vary based on differences in sales charges and fees associated with each class. All results shown assume reinvestment of distributions during the period. Returns do not reflect the deduction of taxes that a shareholder may pay on Fund distributions or on the redemption of Fund shares. Performance results reflect the effect of any fee waivers or reimbursements of Fund expenses by Columbia Management Investment Advisers, LLC and/or any of its affiliates. Absent these fee waivers or expense reimbursement arrangements, performance results would have been lower.
The performance information shown represents past performance and is not a guarantee of future results. The investment return and principal value of your investment will fluctuate so that your shares, when redeemed, may be worth more or less than their original cost. Current performance may be lower or higher than the performance information shown. You may obtain performance information current to the most recent month-end by contacting your financial intermediary, visiting columbiamanagement.com or calling 800.345.6611.
*The returns shown for periods prior to the share class inception date (including returns for the Life of the Fund, if shown, which are since Fund inception) include the returns of the Fund's oldest share class. These returns are adjusted to reflect any higher class-related operating expenses of the newer share classes, as applicable. Please visit columbiamanagement.com/mutual-funds/appended-performance for more information.
The Barclays U.S. Aggregate Bond Index is a broad-based benchmark that measures the investment grade, U.S. dollar denominated, fixed-rate taxable bond market, including Treasuries, government-related and corporate securities, mortgage-backed securities (agency fixed-rate and hybrid adjustable-rate mortgage passthroughs), asset-backed securities, and commercial mortgage-backed securities.
Indices are not available for investment, are not professionally managed and do not reflect sales charges, fees, brokerage commissions, taxes or other expenses of investing. Securities in the Fund may not match those in an index.
Annual Report 2014
2
Columbia Intermediate Bond Fund
Performance Overview (continued)
Performance of a Hypothetical $10,000 Investment (May 1, 2004 – April 30, 2014)
The chart above shows the change in value of a hypothetical $10,000 investment in Class A shares of Columbia Intermediate Bond Fund during the stated time period, and does not reflect the deduction of taxes that a shareholder may pay on Fund distributions or on the redemption of Fund shares.
Annual Report 2014
3
Columbia Intermediate Bond Fund
Manager Discussion of Fund Performance
For the 12-month period that ended April 30, 2014, the Fund's Class A shares returned -0.62% excluding sales charges. The Fund's benchmark, the Barclays U.S. Aggregate Bond Index, returned -0.26% for the same period. An overweight in 10-year bonds and the Fund's position in mortgage securities detracted from results during the period.
Stable Economic Growth
Even though a difficult winter weighed on the U.S. economy early in 2014, it was not enough to derail the steady growth that marked the 12-month period. Solid new job growth drove the unemployment rate down to 6.3%. Robust manufacturing activity boosted the nation's capacity utilization rate to a recovery high of 79.2%. Personal income edged higher, borrowing increased and the savings rate declined. Consumer confidence generally rose during the 12-month period, reflecting consumer expectations that the economy was on solid ground. The housing market lost some momentum, the victim of bad winter weather, tighter borrowing standards, rising prices and higher mortgage rates. However, higher pending home sales near the end of the period was a positive data point.
Early in the period, then-Federal Reserve chairman Ben Bernanke rattled the fixed-income markets when he indicated that the Fed was preparing to taper its monthly bond purchases, their longstanding program known as quantitative easing. The bond market declined sharply following Bernanke's announcement, and long-term interest rates rose. Once Fed tapering commenced in January 2014, longer-term interest rates declined over the last four months of the period. However, short-term rates remained at historically low levels. In this environment, returns from many fixed-income sectors were low to slightly negative.
Contributors and Detractors
In a challenging environment, positions in high-yield and non-agency mortgage bonds bolstered return, as did an overweight position in commercial mortgage-backed securities. Within corporate bonds, an emphasis on preferred securities within the financial sector also aided performance relative to the benchmark. In addition, the Fund maintained a relatively short duration, which helped reduce risk at a time when interest rates were rising. Duration is a measure of interest rate sensitivity. However, an overweight in 10-year bonds detracted from results, because it was especially hard hit when rates rose in the spring of 2013. The Fund's position in mortgage securities also detracted from relative return. The Fund had emphasized securitized pools in which the underlying mortgages carried small balances, thus reducing overall prepayment risk. These securities had performed well for the Fund as interest rates declined, but the value of prepayment protection evaporated when rates reversed course in 2013 and these mortgage securities underperformed.
During the period, we added to positions in Small Business Administration (SBA) securities, which are guaranteed by the U.S. government, and RefCorp securities, which are not explicitly guaranteed but nonetheless receive government backing. Together these positions accounted for approximately 4% of the portfolio's net assets. The Fund also bolstered its credit quality during the course of the year, a reflection of the decline in the yield advantage enjoyed by the riskier sectors of the market.
Portfolio Management
Carl Pappo, CFA
Brian Lavin, CFA
Michael Zazzarino
Portfolio Breakdown (%)
(at April 30, 2014) | |
Asset-Backed Securities —
Agency | | | 3.6 | | |
Asset-Backed Securities —
Non-Agency | | | 10.2 | | |
Commercial Mortgage-Backed
Securities — Non-Agency | | | 6.6 | | |
Common Stocks | | | 0.0 | (a) | |
Financials | | | 0.0 | (a) | |
Industrials | | | 0.0 | (a) | |
Corporate Bonds & Notes | | | 39.6 | | |
Foreign Government
Obligations | | | 1.6 | | |
Money Market Funds | | | 1.1 | | |
Municipal Bonds | | | 1.5 | | |
Preferred Debt | | | 3.2 | | |
Residential Mortgage-Backed
Securities — Agency | | | 14.9 | | |
Residential Mortgage-Backed
Securities — Non-Agency | | | 4.5 | | |
Senior Loans | | | 1.2 | | |
Treasury Bills | | | 4.1 | | |
U.S. Government & Agency
Obligations | | | 2.0 | | |
U.S. Treasury Obligations | | | 5.9 | | |
Total | | | 100.0 | | |
Percentages indicated are based upon total investments. The Fund's portfolio composition is subject to change.
(a) Rounds to zero.
Annual Report 2014
4
Columbia Intermediate Bond Fund
Manager Discussion of Fund Performance (continued)
Three types of derivatives were employed in the Fund's management during the period. We invested in highly-liquid, widely-traded Treasury futures and interest rate swap contracts to help manage portfolio duration. These enable us to efficiently implement our yield curve opinions and offset unintended yield curve impacts from other investments in the portfolio. We also invested in credit default swaps to manage exposure to overall credit risk and individual issuer risk. Credit and yield curve positioning, overall, contributed positively to Fund performance during the period. On a standalone basis, however, various derivative positions used to hedge these positions did detract from performance.
Looking Ahead
At this time, we expect the economy to continue to grow at a moderate pace. As a result, we currently plan to maintain modest overweight positions in corporate bonds, mortgages and other non-Treasury assets. We believe the valuations in these sectors are not as attractive as they had been in prior periods, but they still presently have the potential for incrementally positive returns. Because we currently anticipate that interest rates will rise in the period ahead, the Fund's duration position is shorter than the benchmark at this time. Should rates in fact rise, we believe that the two-to-five year segment of the maturity spectrum may be the most vulnerable, and we have positioned the portfolio accordingly.
Quality Breakdown (%)
(at April 30, 2014) | |
AAA rating | | | 40.1 | | |
AA rating | | | 6.0 | | |
A rating | | | 8.6 | | |
BBB rating | | | 29.8 | | |
BB rating | | | 8.4 | | |
B rating | | | 1.9 | | |
CCC rating | | | 0.7 | | |
CC rating | | | 0.0 | (a) | |
C rating | | | 0.0 | (a) | |
D rating | | | 0.0 | (a) | |
Not rated | | | 4.5 | | |
Total | | | 100.0 | | |
Percentages indicated are based upon total fixed income securities (excluding Money Market Funds).
Bond ratings apply to the underlying holdings of the Fund and not the Fund itself and are divided into categories ranging from AAA (highest) to D (lowest), and are subject to change. The ratings shown are determined by using the middle rating of Moody's, S&P, and Fitch after dropping the highest and lowest available ratings. When a rating from only two agencies is available, the lower rating is used. When a rating from only one agency is available, that rating is used. When a bond is not rated by one of these agencies, it is designated as Not rated. Credit ratings are subjective opinions and not statements of fact.
(a) Rounds to zero.
Investment Risks
There are risks associated with an investment in this Fund, including credit risk, market risk, interest rate risk and prepayment and extension risk. In general, bond prices rise when interest rates fall and vice versa. This effect is more pronounced for longer-term securities. Noninvestment grade securities, commonly called "high-yield" or "junk" bonds, have more volatile prices and carry more risk to principal and income than investment grade securities. Investing in derivatives is a specialized activity that involves special risks, which may result in significant losses. See the Fund's prospectus for more information on these and other risks.
Annual Report 2014
5
Columbia Intermediate Bond Fund
Understanding Your Fund's Expenses
(Unaudited)
As an investor, you incur two types of costs. There are transaction costs, which generally include sales charges on purchases and may include redemption fees. There are also ongoing costs, which generally include management fees, distribution and/or service fees, and other fund expenses. The following information is intended to help you understand your ongoing costs (in dollars) of investing in the Fund and to help you compare these costs with the ongoing costs of investing in other mutual funds.
Analyzing Your Fund's Expenses
To illustrate these ongoing costs, we have provided examples and calculated the expenses paid by investors in each share class of the Fund during the period. The actual and hypothetical information in the table is based on an initial investment of $1,000 at the beginning of the period indicated and held for the entire period. Expense information is calculated two ways and each method provides you with different information. The amount listed in the "Actual" column is calculated using the Fund's actual operating expenses and total return for the period. You may use the Actual information, together with the amount invested, to estimate the expenses that you paid over the period. Simply divide your account value by $1,000 (for example, an $8,600 account value divided by $1,000 = 8.6), then multiply the results by the expenses paid during the period under the "Actual" column. The amount listed in the "Hypothetical" column assumes a 5% annual rate of return before expenses (which is not the Fund's actual return) and then applies the Fund's actual expense ratio for the period to the hypothetical return. You should not use the hypothetical account values and expenses to estimate either your actual account balance at the end of the period or the expenses you paid during the period. See "Compare With Other Funds" below for details on how to use the hypothetical data.
Compare With Other Funds
Since all mutual funds are required to include the same hypothetical calculations about expenses in shareholder reports, you can use this information to compare the ongoing cost of investing in the Fund with other funds. To do so, compare the hypothetical example with the 5% hypothetical examples that appear in the shareholder reports of other funds. As you compare hypothetical examples of other funds, it is important to note that hypothetical examples are meant to highlight the ongoing costs of investing in a fund only and do not reflect any transaction costs, such as sales charges, or redemption or exchange fees. Therefore, the hypothetical calculations are useful in comparing ongoing costs only, and will not help you determine the relative total costs of owning different funds. If transaction costs were included in these calculations, your costs would be higher.
November 1, 2013 – April 30, 2014
| | Account Value at the Beginning
of the Period ($) | | Account Value at the End
of the Period ($) | | Expenses Paid During
the Period ($) | | Fund's Annualized
Expense Ratio (%) | |
| | Actual | | Hypothetical | | Actual | | Hypothetical | | Actual | | Hypothetical | | Actual | |
Class A | | | 1,000.00 | | | | 1,000.00 | | | | 1,023.30 | | | | 1,020.58 | | | | 4.26 | | | | 4.26 | | | | 0.85 | | |
Class B | | | 1,000.00 | | | | 1,000.00 | | | | 1,019.50 | | | | 1,016.86 | | | | 8.01 | | | | 8.00 | | | | 1.60 | | |
Class C | | | 1,000.00 | | | | 1,000.00 | | | | 1,020.30 | | | | 1,017.60 | | | | 7.26 | | | | 7.25 | | | | 1.45 | | |
Class I | | | 1,000.00 | | | | 1,000.00 | | | | 1,025.00 | | | | 1,022.32 | | | | 2.51 | | | | 2.51 | | | | 0.50 | | |
Class K | | | 1,000.00 | | | | 1,000.00 | | | | 1,023.70 | | | | 1,021.03 | | | | 3.81 | | | | 3.81 | | | | 0.76 | | |
Class R | | | 1,000.00 | | | | 1,000.00 | | | | 1,022.00 | | | | 1,019.34 | | | | 5.51 | | | | 5.51 | | | | 1.10 | | |
Class R4 | | | 1,000.00 | | | | 1,000.00 | | | | 1,024.50 | | | | 1,021.82 | | | | 3.01 | | | | 3.01 | | | | 0.60 | | |
Class R5 | | | 1,000.00 | | | | 1,000.00 | | | | 1,025.00 | | | | 1,022.32 | | | | 2.51 | | | | 2.51 | | | | 0.50 | | |
Class W | | | 1,000.00 | | | | 1,000.00 | | | | 1,023.30 | | | | 1,020.58 | | | | 4.26 | | | | 4.26 | | | | 0.85 | | |
Class Y | | | 1,000.00 | | | | 1,000.00 | | | | 1,025.00 | | | | 1,022.32 | | | | 2.51 | | | | 2.51 | | | | 0.50 | | |
Class Z | | | 1,000.00 | | | | 1,000.00 | | | | 1,023.40 | | | | 1,021.82 | | | | 3.01 | | | | 3.01 | | | | 0.60 | | |
Expenses paid during the period are equal to the annualized expense ratio for each class as indicated above, multiplied by the average account value over the period and then multiplied by the number of days in the Fund's most recent fiscal half year and divided by 365.
Expenses do not include fees and expenses incurred indirectly by the Fund from the underlying funds in which the Fund may invest (also referred to as "acquired funds"), including affiliated and non-affiliated pooled investment vehicles (including mutual funds and exchange-traded funds).
Had Columbia Management Investment Advisers, LLC and/or certain of its affiliates not waived/reimbursed certain fees and expenses, account value at the end of the period would have been reduced.
Annual Report 2014
6
Columbia Intermediate Bond Fund
Portfolio of Investments
April 30, 2014
(Percentages represent value of investments compared to net assets)
Corporate Bonds & Notes 41.5%
Issuer | | Coupon
Rate | | Principal
Amount ($) | | Value ($) | |
Aerospace & Defense 0.4% | |
ADS Tactical, Inc.
Senior Secured(a)
04/01/18 | | | 11.000 | % | | | 520,000 | | | | 512,200 | | |
Bombardier, Inc.(a)
Senior Unsecured
04/15/19 | | | 4.750 | % | | | 278,000 | | | | 282,865 | | |
03/15/20 | | | 7.750 | % | | | 234,000 | | | | 266,760 | | |
10/15/22 | | | 6.000 | % | | | 319,000 | | | | 324,582 | | |
Huntington Ingalls Industries, Inc.
03/15/18 | | | 6.875 | % | | | 490,000 | | | | 524,300 | | |
L-3 Communications Corp.
02/15/21 | | | 4.950 | % | | | 8,235,000 | | | | 8,971,448 | | |
Lockheed Martin Corp.
Senior Unsecured
09/15/21 | | | 3.350 | % | | | 3,775,000 | | | | 3,884,834 | | |
TransDigm, Inc.
12/15/18 | | | 7.750 | % | | | 128,000 | | | | 136,320 | | |
10/15/20 | | | 5.500 | % | | | 39,000 | | | | 39,390 | | |
07/15/21 | | | 7.500 | % | | | 142,000 | | | | 156,200 | | |
Total | | | | | | | 15,098,899 | | |
Automotive 2.0% | |
American Axle & Manufacturing, Inc.
02/15/19 | | | 5.125 | % | | | 217,000 | | | | 227,308 | | |
Chrysler Group LLC/Co-Issuer, Inc.
Secured
06/15/19 | | | 8.000 | % | | | 684,000 | | | | 748,980 | | |
Dana Holding Corp.
Senior Unsecured
02/15/21 | | | 6.750 | % | | | 356,000 | | | | 387,150 | | |
Ford Motor Co.
Senior Unsecured
02/01/29 | | | 6.375 | % | | | 5,390,000 | | | | 6,336,942 | | |
07/16/31 | | | 7.450 | % | | | 5,690,000 | | | | 7,424,892 | | |
11/01/46 | | | 7.400 | % | | | 3,500,000 | | | | 4,653,089 | | |
Ford Motor Credit Co. LLC
Senior Unsecured
06/15/16 | | | 3.984 | % | | | 10,795,000 | | | | 11,447,882 | | |
01/17/17 | | | 1.500 | % | | | 18,943,000 | | | | 19,016,063 | | |
01/15/20 | | | 8.125 | % | | | 3,220,000 | | | | 4,095,012 | | |
General Motors Co.(a)
Senior Unsecured
10/02/18 | | | 3.500 | % | | | 22,865,000 | | | | 23,293,719 | | |
10/02/23 | | | 4.875 | % | | | 420,000 | | | | 434,175 | | |
Jaguar Land Rover Automotive PLC(a)
12/15/18 | | | 4.125 | % | | | 241,000 | | | | 248,832 | | |
02/01/23 | | | 5.625 | % | | | 140,000 | | | | 146,125 | | |
Schaeffler Finance BV
Senior Secured(a)
02/15/19 | | | 8.500 | % | | | 482,000 | | | | 542,250 | | |
Corporate Bonds & Notes (continued)
Issuer | | Coupon
Rate | | Principal
Amount ($) | | Value ($) | |
Visteon Corp.
04/15/19 | | | 6.750 | % | | | 406,000 | | | | 426,832 | | |
Total | | | | | | | 79,429,251 | | |
Banking 10.7% | |
Ally Financial, Inc.
02/15/17 | | | 5.500 | % | | | 314,000 | | | | 341,475 | | |
03/15/20 | | | 8.000 | % | | | 1,220,000 | | | | 1,474,675 | | |
BNP Paribas SA(a)(b)
06/29/49 | | | 5.186 | % | | | 13,535,000 | | | | 13,890,294 | | |
Bank of America Corp.
Senior Unsecured
01/11/23 | | | 3.300 | % | | | 7,386,000 | | | | 7,169,250 | | |
Subordinated Notes
05/02/17 | | | 5.700 | % | | | 7,605,000 | | | | 8,417,343 | | |
Bank of Montreal
Senior Unsecured
01/25/19 | | | 2.375 | % | | | 13,498,000 | | | | 13,639,149 | | |
Bank of New York Mellon Corp. (The)
Senior Unsecured
05/15/19 | | | 5.450 | % | | | 3,325,000 | | | | 3,810,972 | | |
Bank of New York Mellon Corp. (The)(b)
12/29/49 | | | 4.500 | % | | | 8,788,000 | | | | 8,041,020 | | |
Barclays Bank PLC(a)(b)
09/29/49 | | | 7.434 | % | | | 18,121,000 | | | | 20,250,217 | | |
Barclays Bank PLC(b)
12/15/49 | | | 6.278 | % | | | 6,605,000 | | | | 6,654,538 | | |
Subordinated Notes
04/10/23 | | | 7.750 | % | | | 5,995,000 | | | | 6,654,450 | | |
Citigroup, Inc.
Subordinated Notes
09/13/25 | | | 5.500 | % | | | 6,686,000 | | | | 7,251,609 | | |
08/25/36 | | | 6.125 | % | | | 4,960,000 | | | | 5,539,521 | | |
Citigroup, Inc.(b)
04/29/49 | | | 5.350 | % | | | 18,265,000 | | | | 17,032,112 | | |
Citigroup, Inc.(c)
Subordinated Notes
05/06/44 | | | 5.300 | % | | | 7,302,000 | | | | 7,333,033 | | |
Cooperatieve Centrale Raiffeisen-Boerenleenbank BA(a)(b)
12/31/49 | | | 11.000 | % | | | 5,759,000 | | | | 7,673,867 | | |
Credit Agricole SA(a)(b)
12/31/49 | | | 8.375 | % | | | 5,636,000 | | | | 6,537,760 | | |
Discover Financial Services
Senior Unsecured
04/27/22 | | | 5.200 | % | | | 5,282,000 | | | | 5,742,163 | | |
11/21/22 | | | 3.850 | % | | | 5,485,000 | | | | 5,509,655 | | |
HBOS PLC
Subordinated Notes(a)
05/21/18 | | | 6.750 | % | | | 16,277,000 | | | | 18,538,201 | | |
The accompanying Notes to Financial Statements are an integral part of this statement.
Annual Report 2014
7
Columbia Intermediate Bond Fund
Portfolio of Investments (continued)
April 30, 2014
Corporate Bonds & Notes (continued)
Issuer | | Coupon
Rate | | Principal
Amount ($) | | Value ($) | |
HSBC USA, Inc.
Subordinated Notes
09/27/20 | | | 5.000 | % | | | 6,724,000 | | | | 7,393,919 | | |
JPMorgan Chase & Co.
Senior Unsecured
01/25/23 | | | 3.200 | % | | | 6,255,000 | | | | 6,102,028 | | |
JPMorgan Chase & Co.(b)
12/29/49 | | | 5.150 | % | | | 17,888,000 | | | | 16,926,520 | | |
JPMorgan Chase Capital XXI(b)
02/02/37 | | | 1.173 | % | | | 30,402,000 | | | | 24,473,610 | | |
JPMorgan Chase Capital XXIII(b)
05/15/47 | | | 1.236 | % | | | 16,490,000 | | | | 12,862,200 | | |
Lloyds Banking Group PLC(a)(b)
11/29/49 | | | 6.267 | % | | | 3,136,000 | | | | 3,151,680 | | |
12/31/49 | | | 6.413 | % | | | 6,842,000 | | | | 7,201,205 | | |
12/31/49 | | | 6.657 | % | | | 10,897,000 | | | | 11,605,305 | | |
M&T Bank Corp.
12/31/49 | | | 6.875 | % | | | 16,939,000 | | | | 17,037,619 | | |
Mellon Capital IV(b)
06/29/49 | | | 4.000 | % | | | 1,035,000 | | | | 888,806 | | |
Natixis(a)(b)
12/31/49 | | | 10.000 | % | | | 6,890,000 | | | | 8,216,325 | | |
PNC Financial Services Group, Inc. (The)(b)
05/29/49 | | | 4.454 | % | | | 17,261,000 | | | | 17,261,000 | | |
Rabobank Capital Funding Trust III(a)(b)
12/31/49 | | | 5.254 | % | | | 6,566,000 | | | | 6,927,130 | | |
Royal Bank of Scotland PLC (The)
Subordinated Notes(b)
03/16/22 | | | 9.500 | % | | | 7,670,000 | | | | 8,973,900 | | |
Santander Holdings USA, Inc.
Senior Unsecured
08/27/18 | | | 3.450 | % | | | 15,697,000 | | | | 16,393,649 | | |
State Street Capital Trust IV(b)
06/01/67 | | | 1.233 | % | | | 7,416,000 | | | | 6,173,820 | | |
State Street Corp.
03/15/18 | | | 4.956 | % | | | 18,974,000 | | | | 20,765,886 | | |
Synovus Financial Corp.
Senior Unsecured
02/15/19 | | | 7.875 | % | | | 1,041,000 | | | | 1,189,343 | | |
U.S. Bancorp
Subordinated Notes
07/15/22 | | | 2.950 | % | | | 5,991,000 | | | | 5,800,366 | | |
UBS Preferred Funding Trust V(b)
05/29/49 | | | 6.243 | % | | | 5,710,000 | | | | 6,060,023 | | |
Wachovia Capital Trust III(b)
03/29/49 | | | 5.570 | % | | | 14,020,000 | | | | 13,494,250 | | |
Washington Mutual Bank
Subordinated Notes(d)(e)(f)
01/15/15 | | | 5.125 | % | | | 27,379,000 | | | | 41,069 | | |
Corporate Bonds & Notes (continued)
Issuer | | Coupon
Rate | | Principal
Amount ($) | | Value ($) | |
Wells Fargo & Co.(b)
12/31/49 | | | 5.900 | % | | | 26,214,000 | | | | 26,685,852 | | |
Wells Fargo Capital X
12/15/36 | | | 5.950 | % | | | 9,225,000 | | | | 9,248,062 | | |
Total | | | | | | | 426,374,871 | | |
Brokerage —% | |
E*TRADE Financial Corp.
Senior Unsecured
11/15/19 | | | 6.375 | % | | | 682,000 | | | | 740,822 | | |
Nuveen Investments, Inc.
Senior Unsecured(a)
10/15/20 | | | 9.500 | % | | | 599,000 | | | | 714,308 | | |
Total | | | | | | | 1,455,130 | | |
Building Materials 0.1% | |
Allegion US Holding Co., Inc.(a)
10/01/21 | | | 5.750 | % | | | 358,000 | | | | 379,480 | | |
American Builders & Contractors Supply Co., Inc.
Senior Unsecured(a)
04/15/21 | | | 5.625 | % | | | 513,000 | | | | 530,955 | | |
Gibraltar Industries, Inc.
02/01/21 | | | 6.250 | % | | | 209,000 | | | | 221,540 | | |
HD Supply, Inc.
07/15/20 | | | 7.500 | % | | | 390,000 | | | | 422,175 | | |
Nortek, Inc.
12/01/18 | | | 10.000 | % | | | 127,000 | | | | 138,430 | | |
04/15/21 | | | 8.500 | % | | | 592,000 | | | | 652,680 | | |
USG Corp.(a)
11/01/21 | | | 5.875 | % | | | 122,000 | | | | 129,625 | | |
Total | | | | | | | 2,474,885 | | |
Chemicals 0.5% | |
Axalta Coating Systems U.S. Holdings, Inc/Dutch Holding B BV(a)
05/01/21 | | | 7.375 | % | | | 365,000 | | | | 401,044 | | |
Celanese U.S. Holdings LLC
06/15/21 | | | 5.875 | % | | | 301,000 | | | | 329,595 | | |
Huntsman International LLC
11/15/20 | | | 4.875 | % | | | 300,000 | | | | 303,750 | | |
INEOS Group Holdings SA(a)
02/15/19 | | | 5.875 | % | | | 365,000 | | | | 372,300 | | |
JM Huber Corp.
Senior Notes(a)
11/01/19 | | | 9.875 | % | | | 827,000 | | | | 948,982 | | |
LYB International Finance BV
03/15/44 | | | 4.875 | % | | | 4,425,000 | | | | 4,540,501 | | |
LyondellBasell Industries NV
Senior Unsecured
04/15/19 | | | 5.000 | % | | | 11,433,000 | | | | 12,816,279 | | |
The accompanying Notes to Financial Statements are an integral part of this statement.
Annual Report 2014
8
Columbia Intermediate Bond Fund
Portfolio of Investments (continued)
April 30, 2014
Corporate Bonds & Notes (continued)
Issuer | | Coupon
Rate | | Principal
Amount ($) | | Value ($) | |
NOVA Chemicals Corp.
Senior Unsecured(a)
08/01/23 | | | 5.250 | % | | | 299,000 | | | | 319,930 | | |
PQ Corp.
Secured(a)
05/01/18 | | | 8.750 | % | | | 1,144,000 | | | | 1,246,960 | | |
Total | | | | | | | 21,279,341 | | |
Construction Machinery 0.3% | |
Ashtead Capital, Inc.
Secured(a)
07/15/22 | | | 6.500 | % | | | 176,000 | | | | 191,400 | | |
Case New Holland Industrial, Inc.
12/01/17 | | | 7.875 | % | | | 986,000 | | | | 1,158,550 | | |
Caterpillar, Inc.
Senior Unsecured
06/26/22 | | | 2.600 | % | | | 6,610,000 | | | | 6,370,090 | | |
Columbus McKinnon Corp.
02/01/19 | | | 7.875 | % | | | 452,000 | | | | 485,900 | | |
Neff Rental LLC/Finance Corp.
Secured(a)
05/15/16 | | | 9.625 | % | | | 888,000 | | | | 923,520 | | |
United Rentals North America, Inc.
04/15/22 | | | 7.625 | % | | | 426,000 | | | | 479,250 | | |
06/15/23 | | | 6.125 | % | | | 284,000 | | | | 305,300 | | |
11/15/24 | | | 5.750 | % | | | 252,000 | | | | 261,450 | | |
Total | | | | | | | 10,175,460 | | |
Consumer Cyclical Services 0.2% | |
ADT Corp. (The)
Senior Unsecured
07/15/22 | | | 3.500 | % | | | 276,000 | | | | 243,570 | | |
APX Group, Inc.
12/01/20 | | | 8.750 | % | | | 276,000 | | | | 281,520 | | |
Senior Secured
12/01/19 | | | 6.375 | % | | | 634,000 | | | | 645,095 | | |
Amazon.com, Inc.
Senior Unsecured
11/29/22 | | | 2.500 | % | | | 7,945,000 | | | | 7,418,628 | | |
Monitronics International, Inc.
04/01/20 | | | 9.125 | % | | | 531,000 | | | | 565,515 | | |
Service Corp. International
Senior Unsecured
01/15/22 | | | 5.375 | % | | | 249,000 | | | | 253,980 | | |
Total | | | | | | | 9,408,308 | | |
Consumer Products 0.1% | |
Alphabet Holding Co., Inc.
Senior Unsecured PIK
11/01/17 | | | 7.750 | % | | | 210,000 | | | | 217,350 | | |
Corporate Bonds & Notes (continued)
Issuer | | Coupon
Rate | | Principal
Amount ($) | | Value ($) | |
Serta Simmons Holdings LLC
Senior Unsecured(a)
10/01/20 | | | 8.125 | % | | | 379,000 | | | | 416,426 | | |
Spectrum Brands, Inc.
03/15/20 | | | 6.750 | % | | | 398,000 | | | | 429,342 | | |
11/15/20 | | | 6.375 | % | | | 374,000 | | | | 404,855 | | |
11/15/22 | | | 6.625 | % | | | 305,000 | | | | 333,213 | | |
Springs Window Fashions LLC
Senior Secured(a)
06/01/21 | | | 6.250 | % | | | 661,000 | | | | 687,440 | | |
Tempur Sealy International, Inc.
12/15/20 | | | 6.875 | % | | | 175,000 | | | | 190,750 | | |
Total | | | | | | | 2,679,376 | | |
Diversified Manufacturing 0.4% | |
Amsted Industries, Inc.(a)
03/15/22 | | | 5.000 | % | | | 302,000 | | | | 301,245 | | |
Entegris, Inc.(a)
04/01/22 | | | 6.000 | % | | | 204,000 | | | | 206,550 | | |
Gardner Denver, Inc.
Senior Unsecured(a)
08/15/21 | | | 6.875 | % | | | 635,000 | | | | 651,669 | | |
General Electric Co.
Senior Unsecured
10/09/42 | | | 4.125 | % | | | 11,852,000 | | | | 11,588,103 | | |
03/11/44 | | | 4.500 | % | | | 3,925,000 | | | | 4,042,228 | | |
Hamilton Sundstrand Corp.
Senior Unsecured(a)
12/15/20 | | | 7.750 | % | | | 663,000 | | | | 719,355 | | |
Total | | | | | | | 17,509,150 | | |
Electric 3.6% | |
AES Corp. (The)
Senior Unsecured
07/01/21 | | | 7.375 | % | | | 206,000 | | | | 235,870 | | |
Alabama Power Co.
Senior Unsecured
03/15/41 | | | 5.500 | % | | | 5,690,000 | | | | 6,669,573 | | |
01/15/42 | | | 4.100 | % | | | 3,678,000 | | | | 3,593,965 | | |
CMS Energy Corp.
Senior Unsecured
09/30/15 | | | 4.250 | % | | | 3,690,000 | | | | 3,856,538 | | |
02/15/18 | | | 5.050 | % | | | 13,126,000 | | | | 14,600,308 | | |
Calpine Corp.
Senior Secured(a)
01/15/22 | | | 6.000 | % | | | 319,000 | | | | 338,140 | | |
Commonwealth Edison Co.
1st Mortgage
03/15/36 | | | 5.900 | % | | | 4,050,000 | | | | 4,988,037 | | |
Senior Unsecured
07/15/18 | | | 6.950 | % | | | 4,500,000 | | | | 5,266,903 | | |
The accompanying Notes to Financial Statements are an integral part of this statement.
Annual Report 2014
9
Columbia Intermediate Bond Fund
Portfolio of Investments (continued)
April 30, 2014
Corporate Bonds & Notes (continued)
Issuer | | Coupon
Rate | | Principal
Amount ($) | | Value ($) | |
Duke Energy Carolinas LLC
1st Refunding Mortgage
09/30/42 | | | 4.000 | % | | | 4,821,000 | | | | 4,653,485 | | |
Duke Energy Ohio, Inc.
1st Mortgage
09/01/23 | | | 3.800 | % | | | 50,000 | | | | 52,204 | | |
Duke Energy Progress, Inc.
1st Mortgage
03/30/44 | | | 4.375 | % | | | 3,680,000 | | | | 3,775,651 | | |
FPL Energy National Wind LLC
Senior Secured(a)
03/10/24 | | | 5.608 | % | | | 275,339 | | | | 270,233 | | |
FirstEnergy Corp.
Senior Unsecured
03/15/18 | | | 2.750 | % | | | 13,625,000 | | | | 13,714,039 | | |
03/15/23 | | | 4.250 | % | | | 7,640,000 | | | | 7,508,050 | | |
Georgia Power Co.
Senior Unsecured
09/01/40 | | | 4.750 | % | | | 1,687,000 | | | | 1,778,231 | | |
MidAmerican Energy Co.
1st Mortgage
10/15/24 | | | 3.500 | % | | | 5,320,000 | | | | 5,381,366 | | |
10/15/44 | | | 4.400 | % | | | 8,195,000 | | | | 8,360,105 | | |
NRG Energy, Inc.(a)
07/15/22 | | | 6.250 | % | | | 797,000 | | | | 822,902 | | |
Nevada Power Co.
05/15/18 | | | 6.500 | % | | | 2,173,000 | | | | 2,557,827 | | |
08/01/18 | | | 6.500 | % | | | 3,000 | | | | 3,557 | | |
09/15/40 | | | 5.375 | % | | | 1,733,000 | | | | 2,000,256 | | |
Niagara Mohawk Power Corp.
Senior Unsecured(a)
08/15/19 | | | 4.881 | % | | | 9,111,000 | | | | 10,186,298 | | |
Oncor Electric Delivery Co. LLC
Senior Secured
09/30/40 | | | 5.250 | % | | | 4,156,000 | | | | 4,675,716 | | |
PPL Capital Funding, Inc.
06/01/18 | | | 1.900 | % | | | 6,725,000 | | | | 6,631,106 | | |
06/15/22 | | | 4.200 | % | | | 5,575,000 | | | | 5,865,352 | | |
06/01/23 | | | 3.400 | % | | | 7,647,000 | | | | 7,519,066 | | |
Pacific Gas & Electric Co.
Senior Unsecured
06/15/23 | | | 3.250 | % | | | 7,442,000 | | | | 7,339,070 | | |
01/15/40 | | | 5.400 | % | | | 2,246,000 | | | | 2,496,656 | | |
Southern California Edison Co.
1st Refunding Mortgage
09/01/40 | | | 4.500 | % | | | 3,685,000 | | | | 3,829,507 | | |
Toledo Edison Co. (The)
Senior Secured
05/15/37 | | | 6.150 | % | | | 3,543,000 | | | | 4,215,844 | | |
Total | | | | | | | 143,185,855 | | |
Corporate Bonds & Notes (continued)
Issuer | | Coupon
Rate | | Principal
Amount ($) | | Value ($) | |
Entertainment 0.1% | |
AMC Entertainment, Inc.
12/01/20 | | | 9.750 | % | | | 46,000 | | | | 52,900 | | |
Activision Blizzard, Inc.(a)
09/15/21 | | | 5.625 | % | | | 1,188,000 | | | | 1,266,705 | | |
09/15/23 | | | 6.125 | % | | | 86,000 | | | | 93,525 | | |
Cedar Fair LP/Canada's Wonderland Co./Magnum
Management Corp.
03/15/21 | | | 5.250 | % | | | 443,000 | | | | 449,645 | | |
Cinemark USA, Inc.
12/15/22 | | | 5.125 | % | | | 302,000 | | | | 302,000 | | |
Six Flags, Inc.(a)(d)(f)(g)
06/01/44 | | | 9.625 | % | | | 458,000 | | | | — | | |
United Artists Theatre Circuit, Inc.
1995-A Pass-Through Certificates(d)(f)
07/01/15 | | | 9.300 | % | | | 1,369,318 | | | | 1,369,318 | | |
Total | | | | | | | 3,534,093 | | |
Food and Beverage 1.0% | |
ARAMARK Corp.
03/15/20 | | | 5.750 | % | | | 471,000 | | | | 493,961 | | |
Campbell Soup Co.
Senior Unsecured
08/02/22 | | | 2.500 | % | | | 6,538,000 | | | | 6,078,705 | | |
08/02/42 | | | 3.800 | % | | | 5,142,000 | | | | 4,378,860 | | |
Coca-Cola Co. (The)
Senior Unsecured
11/01/23 | | | 3.200 | % | | | 7,670,000 | | | | 7,646,507 | | |
ConAgra Foods, Inc.
Senior Unsecured
01/25/18 | | | 1.900 | % | | | 4,208,000 | | | | 4,194,332 | | |
01/25/23 | | | 3.200 | % | | | 2,650,000 | | | | 2,556,174 | | |
10/01/28 | | | 7.000 | % | | | 5,666,000 | | | | 6,932,770 | | |
Darling International, Inc.(a)
01/15/22 | | | 5.375 | % | | | 437,000 | | | | 449,018 | | |
Diamond Foods, Inc.(a)
03/15/19 | | | 7.000 | % | | | 95,000 | | | | 98,325 | | |
Heineken NV
Senior Unsecured(a)
10/01/42 | | | 4.000 | % | | | 2,620,000 | | | | 2,391,177 | | |
Pinnacle Foods Finance LLC/Corp.
05/01/21 | | | 4.875 | % | | | 383,000 | | | | 372,468 | | |
TreeHouse Foods, Inc.
03/15/22 | | | 4.875 | % | | | 91,000 | | | | 92,138 | | |
Wm. Wrigley Jr., Co.(a)
Senior Unsecured
10/21/16 | | | 1.400 | % | | | 3,555,000 | | | | 3,581,837 | | |
10/21/18 | | | 2.400 | % | | | 2,238,000 | | | | 2,267,768 | | |
Total | | | | | | | 41,534,040 | | |
The accompanying Notes to Financial Statements are an integral part of this statement.
Annual Report 2014
10
Columbia Intermediate Bond Fund
Portfolio of Investments (continued)
April 30, 2014
Corporate Bonds & Notes (continued)
Issuer | | Coupon
Rate | | Principal
Amount ($) | | Value ($) | |
Gaming 0.1% | |
Boyd Gaming Corp.
07/01/20 | | | 9.000 | % | | | 98,000 | | | | 108,045 | | |
GLP Capital LP/Financing II Inc.(a)
11/01/23 | | | 5.375 | % | | | 360,000 | | | | 370,800 | | |
MGM Resorts International
03/01/18 | | | 11.375 | % | | | 529,000 | | | | 686,377 | | |
10/01/20 | | | 6.750 | % | | | 109,000 | | | | 120,456 | | |
PNK Finance Corp.(a)
08/01/21 | | | 6.375 | % | | | 843,000 | | | | 885,150 | | |
Penn National Gaming, Inc.
Senior Unsecured(a)
11/01/21 | | | 5.875 | % | | | 257,000 | | | | 248,005 | | |
Seminole Tribe of Florida, Inc.
Senior Unsecured(a)
10/01/20 | | | 7.804 | % | | | 625,000 | | | | 686,469 | | |
Seneca Gaming Corp.(a)
12/01/18 | | | 8.250 | % | | | 473,000 | | | | 506,110 | | |
Tunica-Biloxi Gaming Authority
Senior Unsecured(a)
11/15/15 | | | 9.000 | % | | | 577,000 | | | | 478,189 | | |
Wynn Macau Ltd.
Senior Unsecured(a)
10/15/21 | | | 5.250 | % | | | 546,000 | | | | 554,190 | | |
Total | | | | | | | 4,643,791 | | |
Gas Distributors 0.2% | |
Sempra Energy
Senior Unsecured
06/01/16 | | | 6.500 | % | | | 5,060,000 | | | | 5,610,700 | | |
12/01/23 | | | 4.050 | % | | | 3,745,000 | | | | 3,871,836 | | |
Total | | | | | | | 9,482,536 | | |
Gas Pipelines 2.5% | |
Access Midstream Partners LP/Finance Corp.
05/15/23 | | | 4.875 | % | | | 872,000 | | | | 882,900 | | |
03/15/24 | | | 4.875 | % | | | 150,000 | | | | 149,250 | | |
Crestwood Midstream Partners LP/Corp.(a)
03/01/22 | | | 6.125 | % | | | 220,000 | | | | 229,900 | | |
DCP Midstream LLC(a)(b)
05/21/43 | | | 5.850 | % | | | 9,895,000 | | | | 9,350,775 | | |
El Paso LLC
Senior Secured
09/15/20 | | | 6.500 | % | | | 609,000 | | | | 672,038 | | |
El Paso Pipeline Partners Operating Co. LLC
10/01/21 | | | 5.000 | % | | | 11,229,000 | | | | 12,068,087 | | |
Enterprise Products Operating LLC
03/15/23 | | | 3.350 | % | | | 7,180,000 | | | | 7,072,652 | | |
Corporate Bonds & Notes (continued)
Issuer | | Coupon
Rate | | Principal
Amount ($) | | Value ($) | |
02/01/41 | | | 5.950 | % | | | 4,008,000 | | | | 4,731,155 | | |
02/15/42 | | | 5.700 | % | | | 3,559,000 | | | | 4,046,918 | | |
Hiland Partners LP/Finance Corp.(a)
10/01/20 | | | 7.250 | % | | | 1,324,000 | | | | 1,443,160 | | |
Kinder Morgan Energy Partners LP
Senior Unsecured
03/01/21 | | | 3.500 | % | | | 7,413,000 | | | | 7,422,622 | | |
01/15/38 | | | 6.950 | % | | | 3,975,000 | | | | 4,822,681 | | |
09/01/39 | | | 6.500 | % | | | 3,739,000 | | | | 4,342,362 | | |
MarkWest Energy Partners LP/Finance Corp.
06/15/22 | | | 6.250 | % | | | 603,000 | | | | 649,733 | | |
02/15/23 | | | 5.500 | % | | | 658,000 | | | | 682,675 | | |
07/15/23 | | | 4.500 | % | | | 157,000 | | | | 153,075 | | |
NiSource Finance Corp.
02/15/23 | | | 3.850 | % | | | 5,220,000 | | | | 5,277,629 | | |
12/15/40 | | | 6.250 | % | | | 4,125,000 | | | | 4,817,583 | | |
Regency Energy Partners LP/Finance Corp.
07/15/21 | | | 6.500 | % | | | 896,000 | | | | 963,200 | | |
03/01/22 | | | 5.875 | % | | | 358,000 | | | | 375,005 | | |
Sabine Pass Liquefaction LLC
Senior Secured
02/01/21 | | | 5.625 | % | | | 430,000 | | | | 443,975 | | |
Southern Natural Gas Co. LLC/Issuing Corp.
Senior Unsecured
06/15/21 | | | 4.400 | % | | | 5,175,000 | | | | 5,490,090 | | |
Southern Natural Gas Co. LLC
Senior Unsecured
03/01/32 | | | 8.000 | % | | | 4,305,000 | | | | 5,754,317 | | |
TransCanada PipeLines Ltd.(b)
05/15/67 | | | 6.350 | % | | | 9,278,000 | | | | 9,637,523 | | |
Transcontinental Gas Pipe Line Co. LLC
Senior Unsecured
08/01/42 | | | 4.450 | % | | | 5,400,000 | | | | 5,271,755 | | |
Williams Partners LP
Senior Unsecured
04/15/40 | | | 6.300 | % | | | 3,725,000 | | | | 4,333,874 | | |
Total | | | | | | | 101,084,934 | | |
Health Care 0.5% | |
Biomet, Inc.
08/01/20 | | | 6.500 | % | | | 115,000 | | | | 125,781 | | |
CHS/Community Health Systems, Inc.
11/15/19 | | | 8.000 | % | | | 290,000 | | | | 317,188 | | |
Senior Secured
08/15/18 | | | 5.125 | % | | | 474,000 | | | | 498,292 | | |
CHS/Community Health Systems, Inc.(a)
02/01/22 | | | 6.875 | % | | | 569,000 | | | | 589,626 | | |
Senior Secured
08/01/21 | | | 5.125 | % | | | 104,000 | | | | 106,080 | | |
Catamaran Corp.
03/15/21 | | | 4.750 | % | | | 104,000 | | | | 104,780 | | |
The accompanying Notes to Financial Statements are an integral part of this statement.
Annual Report 2014
11
Columbia Intermediate Bond Fund
Portfolio of Investments (continued)
April 30, 2014
Corporate Bonds & Notes (continued)
Issuer | | Coupon
Rate | | Principal
Amount ($) | | Value ($) | |
ConvaTec Finance International SA
Senior Unsecured PIK(a)
01/15/19 | | | 8.250 | % | | | 214,000 | | | | 218,815 | | |
ConvaTec Healthcare E SA
Senior Unsecured(a)
12/15/18 | | | 10.500 | % | | | 430,000 | | | | 473,000 | | |
DaVita HealthCare Partners, Inc.
08/15/22 | | | 5.750 | % | | | 568,000 | | | | 601,370 | | |
Emdeon, Inc.
12/31/19 | | | 11.000 | % | | | 557,000 | | | | 644,727 | | |
Fresenius Medical Care U.S. Finance II, Inc.(a)
07/31/19 | | | 5.625 | % | | | 335,000 | | | | 364,313 | | |
Fresenius Medical Care U.S. Finance, Inc.(a)
09/15/18 | | | 6.500 | % | | | 454,000 | | | | 509,615 | | |
HCA, Inc.
02/15/22 | | | 7.500 | % | | | 415,000 | | | | 473,307 | | |
Senior Secured
03/15/19 | | | 3.750 | % | | | 405,000 | | | | 408,038 | | |
02/15/20 | | | 6.500 | % | | | 889,000 | | | | 991,235 | | |
IMS Health, Inc.
Senior Unsecured(a)
11/01/20 | | | 6.000 | % | | | 427,000 | | | | 450,485 | | |
Kinetic Concepts, Inc./KCI U.S.A., Inc.
Secured
11/01/18 | | | 10.500 | % | | | 266,000 | | | | 303,905 | | |
LifePoint Hospitals, Inc.(a)
12/01/21 | | | 5.500 | % | | | 302,000 | | | | 314,080 | | |
MPH Acquisition Holdings LLC(a)
04/01/22 | | | 6.625 | % | | | 391,000 | | | | 403,708 | | |
McKesson Corp.
Senior Unsecured
12/15/22 | | | 2.700 | % | | | 9,240,000 | | | | 8,742,084 | | |
Physio-Control International, Inc.
Senior Secured(a)
01/15/19 | | | 9.875 | % | | | 343,000 | | | | 381,588 | | |
Tenet Healthcare Corp.
Senior Secured
04/01/21 | | | 4.500 | % | | | 509,000 | | | | 493,984 | | |
Senior Unsecured
04/01/22 | | | 8.125 | % | | | 920,000 | | | | 1,021,200 | | |
Tenet Healthcare Corp.(a)
Senior Secured
10/01/20 | | | 6.000 | % | | | 325,000 | | | | 342,063 | | |
Total | | | | | | | 18,879,264 | | |
Healthcare Insurance 0.1% | |
Centene Corp.
Senior Unsecured
05/15/22 | | | 4.750 | % | | | 157,000 | | | | 157,785 | | |
Corporate Bonds & Notes (continued)
Issuer | | Coupon
Rate | | Principal
Amount ($) | | Value ($) | |
Centene Corp.(c)
Senior Unsecured
05/15/22 | | | 4.750 | % | | | 20,000 | | | | 20,100 | | |
WellPoint, Inc.
Senior Unsecured
01/15/23 | | | 3.300 | % | | | 5,035,000 | | | | 4,923,757 | | |
Total | | | | | | | 5,101,642 | | |
Home Construction 0.1% | |
KB Home
05/15/19 | | | 4.750 | % | | | 202,000 | | | | 201,495 | | |
Meritage Homes Corp.
03/01/18 | | | 4.500 | % | | | 377,000 | | | | 385,483 | | |
04/15/20 | | | 7.150 | % | | | 117,000 | | | | 129,870 | | |
04/01/22 | | | 7.000 | % | | | 72,000 | | | | 78,930 | | |
Shea Homes LP/Funding Corp.
Senior Secured
05/15/19 | | | 8.625 | % | | | 282,000 | | | | 309,495 | | |
Standard Pacific Corp.
12/15/21 | | | 6.250 | % | | | 290,000 | | | | 310,300 | | |
Taylor Morrison Communities, Inc./Monarch, Inc.(a)
04/15/20 | | | 7.750 | % | | | 441,000 | | | | 483,997 | | |
04/15/21 | | | 5.250 | % | | | 15,000 | | | | 15,150 | | |
03/01/24 | | | 5.625 | % | | | 154,000 | | | | 151,305 | | |
Total | | | | | | | 2,066,025 | | |
Independent Energy 2.5% | |
Anadarko Petroleum Corp.
Senior Unsecured
09/15/17 | | | 6.375 | % | | | 5,310,000 | | | | 6,139,473 | | |
03/15/40 | | | 6.200 | % | | | 3,445,000 | | | | 4,195,407 | | |
Antero Resources Corp.(a)(c)
12/01/22 | | | 5.125 | % | | | 272,000 | | | | 274,380 | | |
Antero Resources Finance Corp.
08/01/19 | | | 7.250 | % | | | 142,000 | | | | 151,826 | | |
Antero Resources Finance Corp.(a)
11/01/21 | | | 5.375 | % | | | 312,000 | | | | 319,020 | | |
Athlon Holdings LP/Finance Corp.(a)
04/15/21 | | | 7.375 | % | | | 797,000 | | | | 860,760 | | |
Athlon Holdings LP/Finance Corp.(a)(c)
05/01/22 | | | 6.000 | % | | | 168,000 | | | | 170,100 | | |
Aurora U.S.A. Oil & Gas, Inc.(a)
04/01/20 | | | 7.500 | % | | | 782,000 | | | | 890,307 | | |
CNOOC Nexen Finance ULC
04/30/24 | | | 4.250 | % | | | 3,305,000 | | | | 3,271,129 | | |
Carrizo Oil & Gas, Inc.
10/15/18 | | | 8.625 | % | | | 458,000 | | | | 490,060 | | |
The accompanying Notes to Financial Statements are an integral part of this statement.
Annual Report 2014
12
Columbia Intermediate Bond Fund
Portfolio of Investments (continued)
April 30, 2014
Corporate Bonds & Notes (continued)
Issuer | | Coupon
Rate | | Principal
Amount ($) | | Value ($) | |
Chesapeake Energy Corp.
08/15/20 | | | 6.625 | % | | | 494,000 | | | | 554,391 | | |
02/15/21 | | | 6.125 | % | | | 1,185,000 | | | | 1,297,575 | | |
03/15/23 | | | 5.750 | % | | | 667,000 | | | | 708,687 | | |
Comstock Resources, Inc.
06/15/20 | | | 9.500 | % | | | 773,000 | | | | 883,152 | | |
Concho Resources, Inc.
01/15/21 | | | 7.000 | % | | | 1,762,000 | | | | 1,955,820 | | |
04/01/23 | | | 5.500 | % | | | 8,800,000 | | | | 9,163,000 | | |
Continental Resources, Inc.
04/01/21 | | | 7.125 | % | | | 1,068,000 | | | | 1,209,510 | | |
09/15/22 | | | 5.000 | % | | | 18,490,000 | | | | 19,553,175 | | |
04/15/23 | | | 4.500 | % | | | 5,063,000 | | | | 5,320,459 | | |
EP Energy LLC/Everest Acquisition Finance, Inc.
09/01/22 | | | 7.750 | % | | | 130,000 | | | | 144,788 | | |
EP Energy LLC/Finance, Inc.
Senior Unsecured
05/01/20 | | | 9.375 | % | | | 424,000 | | | | 489,720 | | |
EXCO Resources, Inc.
04/15/22 | | | 8.500 | % | | | 206,000 | | | | 211,665 | | |
EnCana Corp.
Senior Unsecured
11/15/21 | | | 3.900 | % | | | 4,515,000 | | | | 4,682,723 | | |
Halcon Resources Corp.
07/15/20 | | | 9.750 | % | | | 28,000 | | | | 29,960 | | |
05/15/21 | | | 8.875 | % | | | 160,000 | | | | 165,800 | | |
Halcon Resources Corp.(a)
07/15/20 | | | 9.750 | % | | | 142,000 | | | | 151,763 | | |
Hess Corp.
Senior Unsecured
02/15/19 | | | 8.125 | % | | | 2,925,000 | | | | 3,689,970 | | |
10/01/29 | | | 7.875 | % | | | 4,005,000 | | | | 5,383,525 | | |
08/15/31 | | | 7.300 | % | | | 2,143,000 | | | | 2,752,113 | | |
Kodiak Oil & Gas Corp.
12/01/19 | | | 8.125 | % | | | 374,000 | | | | 415,140 | | |
01/15/21 | | | 5.500 | % | | | 776,000 | | | | 799,280 | | |
02/01/22 | | | 5.500 | % | | | 870,000 | | | | 891,750 | | |
Laredo Petroleum, Inc.
02/15/19 | | | 9.500 | % | | | 728,000 | | | | 800,800 | | |
05/01/22 | | | 7.375 | % | | | 479,000 | | | | 528,097 | | |
Laredo Petroleum, Inc.(a)
01/15/22 | | | 5.625 | % | | | 335,000 | | | | 340,863 | | |
MEG Energy Corp.(a)
03/31/24 | | | 7.000 | % | | | 264,000 | | | | 279,840 | | |
Oasis Petroleum, Inc.
11/01/21 | | | 6.500 | % | | | 1,341,000 | | | | 1,434,870 | | |
01/15/23 | | | 6.875 | % | | | 293,000 | | | | 317,173 | | |
Oasis Petroleum, Inc.(a)
03/15/22 | | | 6.875 | % | | | 146,000 | | | | 158,410 | | |
Corporate Bonds & Notes (continued)
Issuer | | Coupon
Rate | | Principal
Amount ($) | | Value ($) | |
Parsley Energy LLC/Finance Corp.
Senior Unsecured(a)
02/15/22 | | | 7.500 | % | | | 623,000 | | | | 651,035 | | |
Plains Exploration & Production Co.
02/15/23 | | | 6.875 | % | | | 731,000 | | | | 818,720 | | |
QEP Resources, Inc.
Senior Unsecured
03/01/21 | | | 6.875 | % | | | 402,000 | | | | 444,210 | | |
RKI Exploration & Production LLC/Finance Corp.(a)
08/01/21 | | | 8.500 | % | | | 82,000 | | | | 88,970 | | |
Range Resources Corp.
08/01/20 | | | 6.750 | % | | | 415,000 | | | | 448,200 | | |
Ras Laffan Liquefied Natural Gas Co., Ltd. II
Senior Secured(a)
09/30/20 | | | 5.298 | % | | | 4,320,474 | | | | 4,666,112 | | |
Rice Energy, Inc.(a)
05/01/22 | | | 6.250 | % | | | 242,000 | | | | 242,303 | | |
SM Energy Co.
Senior Unsecured
11/15/21 | | | 6.500 | % | | | 447,000 | | | | 480,525 | | |
SandRidge Energy, Inc.
10/15/22 | | | 8.125 | % | | | 214,000 | | | | 231,655 | | |
02/15/23 | | | 7.500 | % | | | 68,000 | | | | 71,910 | | |
Whiting Petroleum Corp.
10/01/18 | | | 6.500 | % | | | 53,000 | | | | 55,915 | | |
03/15/21 | | | 5.750 | % | | | 658,000 | | | | 705,705 | | |
Woodside Finance Ltd.(a)
05/10/21 | | | 4.600 | % | | | 10,320,000 | | | | 11,135,280 | | |
Total | | | | | | | 101,117,021 | | |
Integrated Energy 0.8% | |
BP Capital Markets PLC
02/10/24 | | | 3.814 | % | | | 7,560,000 | | | | 7,718,322 | | |
Chevron Corp.
Senior Unsecured
12/05/22 | | | 2.355 | % | | | 8,155,000 | | | | 7,713,285 | | |
06/24/23 | | | 3.191 | % | | | 6,965,000 | | | | 6,961,141 | | |
Shell International Finance BV
08/21/22 | | | 2.375 | % | | | 6,295,000 | | | | 5,991,008 | | |
03/25/40 | | | 5.500 | % | | | 3,736,000 | | | | 4,444,521 | | |
Total | | | | | | | 32,828,277 | | |
Life Insurance 1.2% | |
ING Capital Funding Trust III(b)
12/31/49 | | | 3.834 | % | | | 3,825,000 | | | | 3,815,438 | | |
MetLife Capital Trust X(a)
04/08/38 | | | 9.250 | % | | | 11,393,000 | | | | 15,323,585 | | |
The accompanying Notes to Financial Statements are an integral part of this statement.
Annual Report 2014
13
Columbia Intermediate Bond Fund
Portfolio of Investments (continued)
April 30, 2014
Corporate Bonds & Notes (continued)
Issuer | | Coupon
Rate | | Principal
Amount ($) | | Value ($) | |
Prudential Financial, Inc.
Senior Unsecured
12/01/17 | | | 6.000 | % | | | 431,000 | | | | 496,526 | | |
Prudential Financial, Inc.(b)
06/15/38 | | | 8.875 | % | | | 4,502,000 | | | | 5,503,695 | | |
09/15/42 | | | 5.875 | % | | | 7,640,000 | | | | 8,041,100 | | |
Voya Financial, Inc.
07/15/22 | | | 5.500 | % | | | 3,680,000 | | | | 4,170,007 | | |
Voya Financial, Inc.(b)
05/15/53 | | | 5.650 | % | | | 8,395,000 | | | | 8,394,160 | | |
Total | | | | | | | 45,744,511 | | |
Lodging —% | |
Hilton Worldwide Finance/Corp.(a)
10/15/21 | | | 5.625 | % | | | 715,000 | | | | 747,175 | | |
Playa Resorts Holding BV
Senior Unsecured(a)
08/15/20 | | | 8.000 | % | | | 354,000 | | | | 384,126 | | |
Total | | | | | | | 1,131,301 | | |
Media Cable 0.9% | |
CCO Holdings LLC/Capital Corp.
03/15/21 | | | 5.250 | % | | | 270,000 | | | | 275,062 | | |
04/30/21 | | | 6.500 | % | | | 176,000 | | | | 187,880 | | |
01/31/22 | | | 6.625 | % | | | 404,000 | | | | 435,310 | | |
CSC Holdings LLC
Senior Unsecured
02/15/19 | | | 8.625 | % | | | 87,000 | | | | 103,748 | | |
CSC Holdings, Inc.
Senior Unsecured
11/15/21 | | | 6.750 | % | | | 442,000 | | | | 491,725 | | |
Cablevision Systems Corp.
Senior Unsecured
09/15/22 | | | 5.875 | % | | | 251,000 | | | | 254,137 | | |
Cequel Communications Holdings I LLC/Capital Corp.
Senior Unsecured(a)
09/15/20 | | | 6.375 | % | | | 727,000 | | | | 761,532 | | |
Cogeco Cable, Inc.(a)
05/01/20 | | | 4.875 | % | | | 167,000 | | | | 167,835 | | |
DIRECTV Holdings LLC/Financing Co., Inc.
03/01/21 | | | 5.000 | % | | | 4,642,000 | | | | 5,029,533 | | |
DISH DBS Corp.
06/01/21 | | | 6.750 | % | | | 1,028,000 | | | | 1,161,640 | | |
Mediacom Broadband LLC/Corp.
Senior Unsecured(a)
04/15/21 | | | 5.500 | % | | | 52,000 | | | | 51,870 | | |
NBCUniversal Enterprise, Inc.(a)
04/15/19 | | | 1.974 | % | | | 8,990,000 | | | | 8,820,378 | | |
Corporate Bonds & Notes (continued)
Issuer | | Coupon
Rate | | Principal
Amount ($) | | Value ($) | |
Numericable Group SA(a)(c)
Senior Secured
05/15/19 | | | 4.875 | % | | | 332,000 | | | | 335,320 | | |
05/15/22 | | | 6.000 | % | | | 614,000 | | | | 628,582 | | |
05/15/24 | | | 6.250 | % | | | 226,000 | | | | 231,368 | | |
Quebecor Media, Inc.
Senior Unsecured
01/15/23 | | | 5.750 | % | | | 351,000 | | | | 352,755 | | |
Time Warner Cable, Inc.
05/01/37 | | | 6.550 | % | | | 5,875,000 | | | | 7,202,533 | | |
09/01/41 | | | 5.500 | % | | | 6,225,000 | | | | 6,873,135 | | |
Videotron Ltd.
07/15/22 | | | 5.000 | % | | | 411,000 | | | | 414,082 | | |
Videotron Ltd.(a)
06/15/24 | | | 5.375 | % | | | 23,000 | | | | 23,173 | | |
WaveDivision Escrow LLC/Corp.
Senior Unsecured(a)
09/01/20 | | | 8.125 | % | | | 24,000 | | | | 25,680 | | |
Total | | | | | | | 33,827,278 | | |
Media Non-Cable 0.7% | |
21st Century Fox America, Inc.
12/15/35 | | | 6.400 | % | | | 3,710,000 | | | | 4,502,363 | | |
AMC Networks, Inc.
07/15/21 | | | 7.750 | % | | | 491,000 | | | | 549,306 | | |
12/15/22 | | | 4.750 | % | | | 70,000 | | | | 69,825 | | |
CBS Outdoor Americas Capital LLC/Corp.(a)
02/15/22 | | | 5.250 | % | | | 73,000 | | | | 74,825 | | |
02/15/24 | | | 5.625 | % | | | 73,000 | | | | 75,008 | | |
Clear Channel Communications, Inc. PIK
02/01/21 | | | 14.000 | % | | | 291,000 | | | | 298,275 | | |
Clear Channel Communications, Inc.
Senior Secured
03/01/21 | | | 9.000 | % | | | 868,000 | | | | 922,250 | | |
Clear Channel Worldwide Holdings, Inc.
03/15/20 | | | 7.625 | % | | | 301,000 | | | | 324,327 | | |
11/15/22 | | | 6.500 | % | | | 780,000 | | | | 834,600 | | |
Hughes Satellite Systems Corp.
06/15/21 | | | 7.625 | % | | | 275,000 | | | | 310,063 | | |
Intelsat Jackson Holdings SA
10/15/20 | | | 7.250 | % | | | 1,048,000 | | | | 1,131,840 | | |
Intelsat Luxembourg SA
06/01/21 | | | 7.750 | % | | | 276,000 | | | | 287,730 | | |
06/01/23 | | | 8.125 | % | | | 345,000 | | | | 362,250 | | |
Lamar Media Corp.(a)
01/15/24 | | | 5.375 | % | | | 99,000 | | | | 102,589 | | |
MDC Partners, Inc.(a)
04/01/20 | | | 6.750 | % | | | 771,000 | | | | 815,332 | | |
The accompanying Notes to Financial Statements are an integral part of this statement.
Annual Report 2014
14
Columbia Intermediate Bond Fund
Portfolio of Investments (continued)
April 30, 2014
Corporate Bonds & Notes (continued)
Issuer | | Coupon
Rate | | Principal
Amount ($) | | Value ($) | |
Nielsen Finance Co. SARL (The)(a)
10/01/21 | | | 5.500 | % | | | 483,000 | | | | 502,924 | | |
Reed Elsevier Capital, Inc.
10/15/22 | | | 3.125 | % | | | 8,550,000 | | | | 8,288,139 | | |
Thomson Reuters Corp.
Senior Unsecured
11/23/23 | | | 4.300 | % | | | 6,530,000 | | | | 6,764,048 | | |
Univision Communications, Inc.(a)
05/15/21 | | | 8.500 | % | | | 425,000 | | | | 467,500 | | |
Senior Secured
09/15/22 | | | 6.750 | % | | | 498,000 | | | | 547,800 | | |
05/15/23 | | | 5.125 | % | | | 309,000 | | | | 315,180 | | |
Total | | | | | | | 27,546,174 | | |
Metals 1.1% | |
ArcelorMittal
Senior Unsecured
02/25/15 | | | 4.250 | % | | | 12,317,000 | | | | 12,563,340 | | |
08/05/15 | | | 4.250 | % | | | 14,468,000 | | | | 14,865,870 | | |
02/25/22 | | | 6.750 | % | | | 432,000 | | | | 479,212 | | |
10/15/39 | | | 7.500 | % | | | 1,154,000 | | | | 1,208,815 | | |
03/01/41 | | | 7.250 | % | | | 4,352,000 | | | | 4,428,160 | | |
Arch Coal, Inc.
Secured(a)
01/15/19 | | | 8.000 | % | | | 247,000 | | | | 246,382 | | |
CONSOL Energy, Inc.
03/01/21 | | | 6.375 | % | | | 32,000 | | | | 33,720 | | |
CONSOL Energy, Inc.(a)
04/15/22 | | | 5.875 | % | | | 209,000 | | | | 215,270 | | |
Calcipar SA
Senior Secured(a)
05/01/18 | | | 6.875 | % | | | 470,000 | | | | 497,025 | | |
Constellium NV
Senior Unsecured(a)(c)
05/15/24 | | | 5.750 | % | | | 105,000 | | | | 107,363 | | |
FMG Resources August 2006 Proprietary Ltd.(a)
11/01/19 | | | 8.250 | % | | | 543,000 | | | | 597,300 | | |
Nucor Corp.
Senior Unsecured
08/01/23 | | | 4.000 | % | | | 9,440,000 | | | | 9,569,762 | | |
Peabody Energy Corp.
11/15/21 | | | 6.250 | % | | | 592,000 | | | | 600,880 | | |
Total | | | | | | | 45,413,099 | | |
Non-Captive Consumer 0.6% | |
HSBC Finance Capital Trust IX(b)
11/30/35 | | | 5.911 | % | | | 11,313,000 | | | | 11,737,237 | | |
HSBC Finance Corp.
Subordinated Notes
01/15/21 | | | 6.676 | % | | | 10,285,000 | | | | 12,166,425 | | |
Corporate Bonds & Notes (continued)
Issuer | | Coupon
Rate | | Principal
Amount ($) | | Value ($) | |
Provident Funding Associates LP/Finance Corp.
Senior Notes(a)
02/15/19 | | | 10.125 | % | | | 88,000 | | | | 96,360 | | |
Provident Funding Associates LP/PFG Finance Corp.(a)
06/15/21 | | | 6.750 | % | | | 702,000 | | | | 717,795 | | |
Springleaf Finance Corp.
06/01/20 | | | 6.000 | % | | | 175,000 | | | | 177,188 | | |
10/01/21 | | | 7.750 | % | | | 313,000 | | | | 346,256 | | |
10/01/23 | | | 8.250 | % | | | 238,000 | | | | 265,370 | | |
Total | | | | | | | 25,506,631 | | |
Non-Captive Diversified 0.6% | |
Air Lease Corp.
Senior Unsecured
03/01/20 | | | 4.750 | % | | | 697,000 | | | | 742,305 | | |
Aircastle Ltd.
Senior Unsecured
03/15/21 | | | 5.125 | % | | | 198,000 | | | | 198,990 | | |
CIT Group, Inc.
Senior Unsecured(a)
02/15/19 | | | 5.500 | % | | | 1,306,000 | | | | 1,403,950 | | |
GE Capital Trust I(b)
11/15/67 | | | 6.375 | % | | | 10,245,000 | | | | 11,346,338 | | |
General Electric Capital Corp.
Senior Unsecured
09/07/22 | | | 3.150 | % | | | 7,043,000 | | | | 7,043,979 | | |
01/14/38 | | | 5.875 | % | | | 1,505,000 | | | | 1,801,875 | | |
International Lease Finance Corp.
Senior Unsecured
04/15/18 | | | 3.875 | % | | | 92,000 | | | | 93,380 | | |
12/15/20 | | | 8.250 | % | | | 1,181,000 | | | | 1,424,581 | | |
Total | | | | | | | 24,055,398 | | |
Oil Field Services 0.2% | |
Atwood Oceanics, Inc.
Senior Unsecured
02/01/20 | | | 6.500 | % | | | 651,000 | | | | 693,315 | | |
Oil States International, Inc.
01/15/23 | | | 5.125 | % | | | 408,000 | | | | 456,960 | | |
Pacific Drilling SA
Senior Secured(a)
06/01/20 | | | 5.375 | % | | | 360,000 | | | | 350,100 | | |
Weatherford International Ltd.
03/15/38 | | | 7.000 | % | | | 4,720,000 | | | | 5,813,256 | | |
Total | | | | | | | 7,313,631 | | |
Other Financial Institutions —% | |
Icahn Enterprises LP/Finance Corp.(a)
02/01/22 | | | 5.875 | % | | | 404,000 | | | | 410,060 | | |
The accompanying Notes to Financial Statements are an integral part of this statement.
Annual Report 2014
15
Columbia Intermediate Bond Fund
Portfolio of Investments (continued)
April 30, 2014
Corporate Bonds & Notes (continued)
Issuer | | Coupon
Rate | | Principal
Amount ($) | | Value ($) | |
National Financial Partners Corp.
Senior Unsecured(a)
07/15/21 | | | 9.000 | % | | | 226,000 | | | | 243,515 | | |
Total | | | | | | | 653,575 | | |
Other Industry 1.2% | |
Massachusetts Institute of Technology
07/01/14 | | | 4.678 | % | | | 8,730,000 | | | | 9,007,733 | | |
Memorial Sloan-Kettering Cancer Center
Senior Unsecured
07/01/52 | | | 4.125 | % | | | 16,955,000 | | | | 15,369,318 | | |
President and Fellows of Harvard College
Senior Notes
10/15/40 | | | 4.875 | % | | | 8,205,000 | | | | 9,046,780 | | |
President and Fellows of Harvard College(a)
01/15/39 | | | 6.500 | % | | | 9,860,000 | | | | 13,230,178 | | |
Unifrax I LLC/Holding Co.(a)
02/15/19 | | | 7.500 | % | | | 183,000 | | | | 193,522 | | |
Total | | | | | | | 46,847,531 | | |
Packaging 0.1% | |
Ardagh Packaging Finance PLC/Holdings USA, Inc.(a)
01/31/19 | | | 6.250 | % | | | 215,000 | | | | 224,138 | | |
Beverage Packaging Holdings (Luxembourg) II SA(a)
12/15/16 | | | 5.625 | % | | | 116,000 | | | | 118,465 | | |
06/15/17 | | | 6.000 | % | | | 35,000 | | | | 36,050 | | |
Plastipak Holdings, Inc.
Senior Unsecured(a)
10/01/21 | | | 6.500 | % | | | 564,000 | | | | 586,560 | | |
Reynolds Group Issuer, Inc. LLC
Senior Secured
10/15/20 | | | 5.750 | % | | | 621,000 | | | | 645,840 | | |
Reynolds Group Issuer, Inc./LLC
08/15/19 | | | 9.875 | % | | | 702,000 | | | | 779,220 | | |
Senior Secured
08/15/19 | | | 7.875 | % | | | 576,000 | | | | 632,160 | | |
Signode Industrial Group Luxembourg SA/US, Inc.
Senior Unsecured(a)
05/01/22 | | | 6.375 | % | | | 470,000 | | | | 474,700 | | |
Total | | | | | | | 3,497,133 | | |
Pharmaceuticals 0.9% | |
Capsugel SA
Senior Unsecured PIK(a)
05/15/19 | | | 7.000 | % | | | 68,000 | | | | 70,465 | | |
Grifols Worldwide Operations Ltd.
Senior Unsecured(a)
04/01/22 | | | 5.250 | % | | | 445,000 | | | | 451,675 | | |
Corporate Bonds & Notes (continued)
Issuer | | Coupon
Rate | | Principal
Amount ($) | | Value ($) | |
Jaguar Holding Co. II/Merger Sub, Inc.
Senior Unsecured(a)
12/01/19 | | | 9.500 | % | | | 312,000 | | | | 344,760 | | |
Johnson & Johnson
Senior Unsecured
12/05/33 | | | 4.375 | % | | | 7,198,000 | | | | 7,674,349 | | |
05/15/41 | | | 4.850 | % | | | 7,528,000 | | | | 8,431,044 | | |
Merck & Co., Inc.
Senior Unsecured
09/15/22 | | | 2.400 | % | | | 4,515,000 | | | | 4,271,623 | | |
Novartis Capital Corp.
05/06/24 | | | 3.400 | % | | | 12,160,000 | | | | 12,254,903 | | |
Valeant Pharmaceuticals International, Inc.(a)
08/15/18 | | | 6.750 | % | | | 437,000 | | | | 473,053 | | |
10/15/20 | | | 6.375 | % | | | 1,136,000 | | | | 1,221,200 | | |
12/01/21 | | | 5.625 | % | | | 312,000 | | | | 324,480 | | |
Total | | | | | | | 35,517,552 | | |
Property & Casualty 0.6% | |
Alliant Holdings, Inc.
Senior Unsecured(a)
12/15/20 | | | 7.875 | % | | | 295,000 | | | | 312,700 | | |
HUB International Ltd.
Senior Unsecured(a)
10/01/21 | | | 7.875 | % | | | 1,015,000 | | | | 1,083,513 | | |
Liberty Mutual Group, Inc.(a)
05/01/22 | | | 4.950 | % | | | 6,775,000 | | | | 7,308,586 | | |
05/01/42 | | | 6.500 | % | | | 1,955,000 | | | | 2,377,096 | | |
Senior Unsecured
03/15/35 | | | 6.500 | % | | | 6,030,000 | | | | 7,148,589 | | |
Transatlantic Holdings, Inc.
Senior Unsecured
11/30/39 | | | 8.000 | % | | | 4,760,000 | | | | 6,423,115 | | |
Total | | | | | | | 24,653,599 | | |
Railroads 0.8% | |
BNSF Funding Trust I(b)
12/15/55 | | | 6.613 | % | | | 12,396,000 | | | | 13,697,580 | | |
CSX Corp.
Senior Unsecured
05/30/42 | | | 4.750 | % | | | 4,265,000 | | | | 4,411,285 | | |
Florida East Coast Holdings Corp.(a)
05/01/20 | | | 9.750 | % | | | 296,000 | | | | 304,880 | | |
Senior Secured
05/01/19 | | | 6.750 | % | | | 411,000 | | | | 422,303 | | |
Union Pacific Corp.
Senior Unsecured
08/15/18 | | | 5.700 | % | | | 5,897,000 | | | | 6,747,831 | | |
02/15/19 | | | 2.250 | % | | | 5,990,000 | | | | 6,033,026 | | |
Total | | | | | | | 31,616,905 | | |
The accompanying Notes to Financial Statements are an integral part of this statement.
Annual Report 2014
16
Columbia Intermediate Bond Fund
Portfolio of Investments (continued)
April 30, 2014
Corporate Bonds & Notes (continued)
Issuer | | Coupon
Rate | | Principal
Amount ($) | | Value ($) | |
Refining 0.1% | |
Marathon Petroleum Corp.
Senior Unsecured
03/01/41 | | | 6.500 | % | | | 3,535,000 | | | | 4,373,481 | | |
REITs 1.1% | |
Boston Properties LP
Senior Unsecured
05/15/21 | | | 4.125 | % | | | 9,457,000 | | | | 10,041,688 | | |
CyrusOne LP/Finance Corp.
11/15/22 | | | 6.375 | % | | | 691,000 | | | | 734,187 | | |
DuPont Fabros Technology LP
09/15/21 | | | 5.875 | % | | | 218,000 | | | | 227,265 | | |
Duke Realty LP
02/15/15 | | | 7.375 | % | | | 4,125,000 | | | | 4,334,509 | | |
08/15/19 | | | 8.250 | % | | | 8,165,200 | | | | 10,165,576 | | |
06/15/22 | | | 4.375 | % | | | 7,440,000 | | | | 7,703,964 | | |
Simon Property Group LP
Senior Unsecured
02/01/23 | | | 2.750 | % | | | 8,770,000 | | | | 8,401,169 | | |
Total | | | | | | | 41,608,358 | | |
Restaurants 0.5% | |
McDonald's Corp.
Senior Unsecured
05/01/43 | | | 3.625 | % | | | 6,000,000 | | | | 5,312,216 | | |
Yum! Brands, Inc.
Senior Unsecured
11/01/23 | | | 3.875 | % | | | 14,918,000 | | | | 15,053,918 | | |
11/01/43 | | | 5.350 | % | | | 325,000 | | | | 348,526 | | |
Total | | | | | | | 20,714,660 | | |
Retailers 0.8% | |
Burlington Coat Factory Warehouse Corp.
02/15/19 | | | 10.000 | % | | | 288,000 | | | | 318,240 | | |
Burlington Holdings LLC/Finance, Inc.
Senior Unsecured PIK(a)
02/15/18 | | | 9.000 | % | | | 118,000 | | | | 120,804 | | |
J. Crew Group, Inc.
Senior Unsecured PIK(a)
05/01/19 | | | 7.750 | % | | | 253,000 | | | | 261,855 | | |
Jo-Ann Stores, Inc.
Senior Unsecured(a)
03/15/19 | | | 8.125 | % | | | 152,000 | | | | 157,890 | | |
L Brands, Inc.
04/01/21 | | | 6.625 | % | | | 659,000 | | | | 737,256 | | |
Macy's Retail Holdings, Inc.
07/15/27 | | | 6.790 | % | | | 18,115,000 | | | | 21,591,794 | | |
Corporate Bonds & Notes (continued)
Issuer | | Coupon
Rate | | Principal
Amount ($) | | Value ($) | |
Michaels Stores, Inc.(a)
12/15/20 | | | 5.875 | % | | | 129,000 | | | | 130,935 | | |
Rite Aid Corp.
06/15/21 | | | 6.750 | % | | | 80,000 | | | | 87,000 | | |
Senior Unsecured
02/15/27 | | | 7.700 | % | | | 234,000 | | | | 257,400 | | |
Sally Holdings LLC/Capital, Inc.
06/01/22 | | | 5.750 | % | | | 396,000 | | | | 420,750 | | |
Wal-Mart Stores, Inc.
Senior Unsecured
04/22/24 | | | 3.300 | % | | | 8,888,000 | | | | 8,867,166 | | |
Total | | | | | | | 32,951,090 | | |
Supermarkets 0.9% | |
Kroger Co. (The)
12/15/18 | | | 6.800 | % | | | 6,482,000 | | | | 7,688,384 | | |
06/01/29 | | | 7.700 | % | | | 5,489,000 | | | | 7,059,858 | | |
Safeway, Inc.
Senior Unsecured
02/01/31 | | | 7.250 | % | | | 19,287,000 | | | | 19,487,971 | | |
Total | | | | | | | 34,236,213 | | |
Technology 0.5% | |
Alliance Data Systems Corp.(a)
12/01/17 | | | 5.250 | % | | | 546,000 | | | | 576,030 | | |
04/01/20 | | | 6.375 | % | | | 15,000 | | | | 15,975 | | |
Audatex North America, Inc.(a)
06/15/21 | | | 6.000 | % | | | 282,000 | | | | 302,445 | | |
11/01/23 | | | 6.125 | % | | | 212,000 | | | | 226,575 | | |
Brocade Communications Systems, Inc.
Senior Secured
01/15/20 | | | 6.875 | % | | | 249,000 | | | | 266,430 | | |
CDW LLC/Finance Corp.
04/01/19 | | | 8.500 | % | | | 344,000 | | | | 376,680 | | |
Equinix, Inc.
Senior Unsecured
04/01/20 | | | 4.875 | % | | | 260,000 | | | | 265,200 | | |
07/15/21 | | | 7.000 | % | | | 290,000 | | | | 323,713 | | |
First Data Corp.
01/15/21 | | | 11.250 | % | | | 75,000 | | | | 85,688 | | |
01/15/21 | | | 12.625 | % | | | 530,000 | | | | 636,000 | | |
First Data Corp.(a)
Secured
01/15/21 | | | 8.250 | % | | | 558,000 | | | | 601,245 | | |
Senior Secured
08/15/20 | | | 8.875 | % | | | 538,000 | | | | 596,507 | | |
11/01/20 | | | 6.750 | % | | | 717,000 | | | | 772,567 | | |
Goodman Networks, Inc.
Senior Secured
07/01/18 | | | 12.125 | % | | | 107,000 | | | | 118,235 | | |
The accompanying Notes to Financial Statements are an integral part of this statement.
Annual Report 2014
17
Columbia Intermediate Bond Fund
Portfolio of Investments (continued)
April 30, 2014
Corporate Bonds & Notes (continued)
Issuer | | Coupon
Rate | | Principal
Amount ($) | | Value ($) | |
Goodman Networks, Inc.(a)
Senior Secured
07/01/18 | | | 12.375 | % | | | 290,000 | | | | 319,725 | | |
Iron Mountain, Inc.
08/15/23 | | | 6.000 | % | | | 210,000 | | | | 223,125 | | |
NCR Corp.(a)
Senior Unsecured
12/15/21 | | | 5.875 | % | | | 113,000 | | | | 119,498 | | |
12/15/23 | | | 6.375 | % | | | 593,000 | | | | 633,027 | | |
NXP BV/Funding LLC(a)
02/15/21 | | | 5.750 | % | | | 315,000 | | | | 333,112 | | |
Nuance Communications, Inc.(a)
08/15/20 | | | 5.375 | % | | | 414,000 | | | | 416,070 | | |
Oracle Corp.
Senior Unsecured
10/15/22 | | | 2.500 | % | | | 13,683,000 | | | | 13,059,589 | | |
VeriSign, Inc.
05/01/23 | | | 4.625 | % | | | 440,000 | | | | 421,300 | | |
Total | | | | | | | 20,688,736 | | |
Transportation Services 0.3% | |
ERAC U.S.A. Finance LLC(a)
10/01/20 | | | 5.250 | % | | | 4,550,000 | | | | 5,096,068 | | |
10/15/37 | | | 7.000 | % | | | 3,569,000 | | | | 4,618,240 | | |
Hertz Corp. (The)
10/15/18 | | | 7.500 | % | | | 451,000 | | | | 478,060 | | |
01/15/21 | | | 7.375 | % | | | 303,000 | | | | 333,679 | | |
LBC Tank Terminals Holding Netherlands BV(a)
05/15/23 | | | 6.875 | % | | | 226,000 | | | | 239,560 | | |
Total | | | | | | | 10,765,607 | | |
Wireless 0.4% | |
Altice SA(a)(c)
05/15/22 | | | 7.750 | % | | | 437,000 | | | | 455,573 | | |
Crown Castle International Corp.
Senior Unsecured
04/15/22 | | | 4.875 | % | | | 186,000 | | | | 188,790 | | |
01/15/23 | | | 5.250 | % | | | 834,000 | | | | 856,935 | | |
Rogers Communications, Inc.
03/15/44 | | | 5.000 | % | | | 7,814,000 | | | | 7,996,480 | | |
SBA Communications Corp.
Senior Unsecured
10/01/19 | | | 5.625 | % | | | 7,000 | | | | 7,341 | | |
SBA Telecommunications, Inc.
07/15/20 | | | 5.750 | % | | | 945,000 | | | | 992,250 | | |
Sprint Communications, Inc.
Senior Unsecured
08/15/20 | | | 7.000 | % | | | 464,000 | | | | 504,600 | | |
11/15/22 | | | 6.000 | % | | | 321,000 | | | | 323,408 | | |
Corporate Bonds & Notes (continued)
Issuer | | Coupon
Rate | | Principal
Amount ($) | | Value ($) | |
Sprint Communications, Inc.(a)
11/15/18 | | | 9.000 | % | | | 1,362,000 | | | | 1,665,045 | | |
03/01/20 | | | 7.000 | % | | | 220,000 | | | | 253,825 | | |
Sprint Corp.(a)
09/15/21 | | | 7.250 | % | | | 559,000 | | | | 609,310 | | |
T-Mobile USA, Inc.
04/28/20 | | | 6.542 | % | | | 167,000 | | | | 179,525 | | |
04/28/21 | | | 6.633 | % | | | 486,000 | | | | 524,880 | | |
01/15/22 | | | 6.125 | % | | | 128,000 | | | | 134,560 | | |
04/28/22 | | | 6.731 | % | | | 276,000 | | | | 297,735 | | |
04/01/23 | | | 6.625 | % | | | 244,000 | | | | 261,080 | | |
04/28/23 | | | 6.836 | % | | | 133,000 | | | | 143,141 | | |
01/15/24 | | | 6.500 | % | | | 128,000 | | | | 134,240 | | |
Wind Acquisition Finance SA(a)
04/23/21 | | | 7.375 | % | | | 524,000 | | | | 538,410 | | |
Senior Secured
04/30/20 | | | 6.500 | % | | | 645,000 | | | | 691,762 | | |
Total | | | | | | | 16,758,890 | | |
Wirelines 1.8% | |
CenturyLink, Inc.
Senior Unsecured
06/15/21 | | | 6.450 | % | | | 3,242,000 | | | | 3,493,255 | | |
Embarq Corp.
Senior Unsecured
06/01/36 | | | 7.995 | % | | | 3,707,000 | | | | 3,961,337 | | |
Frontier Communications Corp.
Senior Unsecured
04/15/22 | | | 8.750 | % | | | 547,000 | | | | 623,580 | | |
01/15/23 | | | 7.125 | % | | | 232,000 | | | | 239,540 | | |
Level 3 Communications, Inc.
Senior Unsecured
02/01/19 | | | 11.875 | % | | | 612,000 | | | | 690,030 | | |
Level 3 Financing, Inc.
04/01/19 | | | 9.375 | % | | | 419,000 | | | | 462,995 | | |
06/01/20 | | | 7.000 | % | | | 70,000 | | | | 75,425 | | |
07/15/20 | | | 8.625 | % | | | 220,000 | | | | 246,400 | | |
Level 3 Financing, Inc.(a)
01/15/21 | | | 6.125 | % | | | 243,000 | | | | 255,150 | | |
Level 3 Financing, Inc.(a)(b)
01/15/18 | | | 3.846 | % | | | 111,000 | | | | 112,665 | | |
Telecom Italia Capital SA
06/04/18 | | | 6.999 | % | | | 8,150,000 | | | | 9,321,563 | | |
Telefonica Emisiones SAU
04/27/18 | | | 3.192 | % | | | 6,379,000 | | | | 6,611,170 | | |
02/16/21 | | | 5.462 | % | | | 1,575,000 | | | | 1,775,420 | | |
Verizon Communications, Inc.
Senior Unsecured
09/14/18 | | | 3.650 | % | | | 1,806,000 | | | | 1,928,142 | | |
04/01/21 | | | 4.600 | % | | | 4,950,000 | | | | 5,408,994 | | |
The accompanying Notes to Financial Statements are an integral part of this statement.
Annual Report 2014
18
Columbia Intermediate Bond Fund
Portfolio of Investments (continued)
April 30, 2014
Corporate Bonds & Notes (continued)
Issuer | | Coupon
Rate | | Principal
Amount ($) | | Value ($) | |
11/01/22 | | | 2.450 | % | | | 12,455,000 | | | | 11,538,449 | | |
03/15/24 | | | 4.150 | % | | | 4,390,000 | | | | 4,497,884 | | |
Verizon New England, Inc.
11/15/29 | | | 7.875 | % | | | 3,893,000 | | | | 4,898,184 | | |
Verizon New York, Inc.
04/01/32 | | | 7.375 | % | | | 7,358,000 | | | | 9,011,379 | | |
Verizon Virginia LLC
10/01/29 | | | 8.375 | % | | | 4,655,000 | | | | 5,949,355 | | |
Zayo Group LLC/Capital, Inc.
07/01/20 | | | 10.125 | % | | | 203,000 | | | | 234,973 | | |
Total | | | | | | | 71,335,890 | | |
Total Corporate Bonds & Notes
(Cost: $1,608,217,826) | | | | | | | 1,656,099,392 | | |
Residential Mortgage-Backed Securities — Agency 15.7% | |
Federal Home Loan Mortgage Corp.(h)
06/01/43 | | | 3.500 | % | | | 12,107,991 | | | | 12,306,067 | | |
06/01/41 | | | 4.500 | % | | | 19,324,256 | | | | 20,908,274 | | |
04/01/33-
06/01/33 | | | 5.500 | % | | | 2,799,673 | | | | 3,133,036 | | |
10/01/31-
07/01/37 | | | 6.000 | % | | | 3,806,985 | | | | 4,391,488 | | |
10/01/28-
07/01/32 | | | 7.000 | % | | | 1,237,447 | | | | 1,431,173 | | |
01/01/17-
02/01/25 | | | 8.000 | % | | | 112,556 | | | | 129,151 | | |
03/01/17-
11/01/26 | | | 8.500 | % | | | 110,208 | | | | 125,656 | | |
04/01/21 | | | 9.000 | % | | | 4,119 | | | | 4,340 | | |
07/01/20 | | | 12.000 | % | | | 1,966 | | | | 1,979 | | |
Federal National Mortgage Association(b)(h)
06/01/32 | | | 1.790 | % | | | 4,175 | | | | 4,389 | | |
07/01/37 | | | 5.991 | % | | | 130,951 | | | | 138,619 | | |
Federal National Mortgage Association(c)(h)
05/14/29 | | | 2.500 | % | | | 30,500,000 | | | | 30,690,625 | | |
05/14/29-
05/12/44 | | | 3.000 | % | | | 123,410,000 | | | | 121,736,588 | | |
05/14/29-
05/12/44 | | | 3.500 | % | | | 40,750,000 | | | | 42,131,680 | | |
05/12/44 | | | 4.000 | % | | | 18,000,000 | | | | 18,858,515 | | |
05/12/44 | | | 4.500 | % | | | 9,000,000 | | | | 9,662,344 | | |
Federal National Mortgage Association(h)
09/01/28 | | | 3.000 | % | | | 5,828,896 | | | | 6,017,781 | | |
03/01/43-
08/01/43 | | | 3.500 | % | | | 38,091,550 | | | | 38,740,749 | | |
11/01/41-
03/01/42 | | | 4.000 | % | | | 49,122,927 | | | | 51,614,556 | | |
Residential Mortgage-Backed Securities — Agency (continued)
Issuer | | Coupon
Rate | | Principal
Amount ($) | | Value ($) | |
05/01/39-
07/01/41 | | | 4.500 | % | | | 39,220,048 | | | | 42,326,835 | | |
08/01/40-
05/01/41 | | | 5.000 | % | | | 26,106,237 | | | | 28,708,486 | | |
03/01/33-
01/01/40 | | | 5.500 | % | | | 19,021,763 | | | | 21,152,956 | | |
05/01/29-
08/01/38 | | | 6.000 | % | | | 25,874,800 | | | | 29,192,121 | | |
03/01/26-
07/01/38 | | | 7.000 | % | | | 3,717,735 | | | | 4,287,575 | | |
04/01/27-
06/01/32 | | | 7.500 | % | | | 327,927 | | | | 371,061 | | |
02/01/25-
08/01/27 | | | 8.000 | % | | | 178,324 | | | | 209,470 | | |
04/01/23 | | | 8.500 | % | | | 33,131 | | | | 35,720 | | |
06/01/24 | | | 9.000 | % | | | 40,283 | | | | 44,726 | | |
09/01/18 | | | 10.000 | % | | | 16,065 | | | | 17,824 | | |
CMO Series 1988-4 Class Z
03/25/18 | | | 9.250 | % | | | 18,393 | | | | 20,046 | | |
CMO Series 2013-121 Class KD
08/25/41 | | | 3.500 | % | | | 7,993,895 | | | | 8,357,106 | | |
Federal National Mortgage Association(h)(j)
CMO PO STRIPS Series 43 Class 1
09/01/18 | | | 0.000 | % | | | 2,207 | | | | 2,192 | | |
Federal National Mortgage Association(h)(k)
09/01/41 | | | 4.000 | % | | | 26,381,184 | | | | 27,719,972 | | |
Federal National Mortgage Association(h)(l)
CMO IO Series 2003-71 Class IM
12/25/31 | | | 5.500 | % | | | 210,981 | | | | 5,862 | | |
Government National Mortgage Association(b)(h)
07/20/25 | | | 1.625 | % | | | 32,450 | | | | 33,681 | | |
Government National Mortgage Association(c)(h)
05/20/44 | | | 3.000 | % | | | 20,925,000 | | | | 20,804,028 | | |
05/20/44 | | | 3.500 | % | | | 25,750,000 | | | | 26,474,219 | | |
05/20/44 | | | 4.000 | % | | | 15,000,000 | | | | 15,875,391 | | |
Government National Mortgage Association(h)
05/15/42 | | | 3.000 | % | | | 16,469,966 | | | | 16,403,076 | | |
06/15/41 | | | 4.500 | % | | | 17,912,438 | | | | 19,491,853 | | |
01/15/30 | | | 7.000 | % | | | 347,528 | | | | 411,010 | | |
12/15/23-
07/20/28 | | | 7.500 | % | | | 415,035 | | | | 479,174 | | |
05/15/17 | | | 8.000 | % | | | 2,055 | | | | 2,167 | | |
02/15/25 | | | 8.500 | % | | | 35,833 | | | | 43,110 | | |
06/15/16-
10/15/16 | | | 9.000 | % | | | 1,421 | | | | 1,464 | | |
Total Residential Mortgage-Backed
Securities — Agency
(Cost: $613,815,673) | | | | | | | 624,498,135 | | |
The accompanying Notes to Financial Statements are an integral part of this statement.
Annual Report 2014
19
Columbia Intermediate Bond Fund
Portfolio of Investments (continued)
April 30, 2014
Residential Mortgage-Backed Securities —
Non-Agency 4.8%
Issuer | | Coupon
Rate | | Principal
Amount ($) | | Value ($) | |
American General Mortgage Loan Trust
CMO Series 2009-1 Class A7(a)(b)(h)
09/25/48 | | | 5.750 | % | | | 8,955,752 | | | | 9,039,095 | | |
American Mortgage Trust
Series 2093-3 Class 3A(b)(d)(f)(h)
07/27/23 | | | 8.188 | % | | | 3,517 | | | | 2,132 | | |
BCAP LLC Trust(a)(b)(h)
08/26/36 | | | 0.274 | % | | | 5,451,612 | | | | 5,329,311 | | |
01/26/37 | | | 0.324 | % | | | 7,754,934 | | | | 7,594,065 | | |
05/26/47 | | | 0.362 | % | | | 6,097,573 | | | | 5,594,524 | | |
09/26/36 | | | 3.500 | % | | | 12,525,280 | | | | 12,512,482 | | |
CMO Series 2012-RR10 Class 5A5
04/26/36 | | | 0.419 | % | | | 13,459,901 | | | | 13,045,686 | | |
CMO Series 2012-RR10 Class 9A1
10/26/35 | | | 2.654 | % | | | 2,198,137 | | | | 2,251,878 | | |
CMO Series 2013-RR3 Class 2A1
02/26/37 | | | 2.371 | % | | | 4,435,711 | | | | 4,396,109 | | |
CMO Series 2013-RR5 Class 1A1
10/26/36 | | | 3.500 | % | | | 10,138,013 | | | | 10,352,762 | | |
BCAP LLC
Series 2013-RR2 Class 7A1(a)(b)(h)
07/26/36 | | | 3.000 | % | | | 6,283,035 | | | | 6,247,850 | | |
Banc of America Funding Trust
CMO Series 2012-R5 Class A(a)(b)(h)
10/03/39 | | | 0.412 | % | | | 7,363,058 | | | | 7,271,745 | | |
Bayview Opportunity Master Fund Trust IIB LP
CMO Series 2012-6NPL Class A(a)(b)(h)
01/28/33 | | | 2.981 | % | | | 1,863,080 | | | | 1,858,422 | | |
CAM Mortgage Trust
CMO Series 2014-1 Class A(a)(b)(h)
12/15/53 | | | 3.352 | % | | | 908,229 | | | | 900,390 | | |
Citigroup Mortgage Loan Trust, Inc.(a)(b)(h)
CMO Series 2012-7 Class 12A1
03/25/36 | | | 2.613 | % | | | 3,366,680 | | | | 3,414,301 | | |
CMO Series 2012-9 Class 1A1
02/20/36 | | | 5.068 | % | | | 6,530,073 | | | | 6,648,993 | | |
CMO Series 2013-2 Class 1A1
11/25/37 | | | 5.958 | % | | | 5,921,353 | | | | 6,096,093 | | |
Citigroup Mortgage Loan Trust, Inc.(a)(h)
CMO Series 2012-A Class A
06/25/51 | | | 2.500 | % | | | 6,180,576 | | | | 5,968,432 | | |
Credit Suisse First Boston Mortgage Securities Corp.
CMO Series 2004-AR6 Class 2A1(b)(h)
10/25/34 | | | 2.700 | % | | | 5,775,098 | | | | 5,838,353 | | |
Credit Suisse Mortgage Capital Certificates(a)(b)(h)
CMO Series 2011-16R Class 7A3
12/27/36 | | | 3.500 | % | | | 2,401,710 | | | | 2,438,620 | | |
CMO Series 2011-17R Class 3A1
10/27/35 | | | 2.353 | % | | | 6,962,216 | | | | 6,974,573 | | |
Residential Mortgage-Backed Securities —
Non-Agency (continued)
Issuer | | Coupon
Rate | | Principal
Amount ($) | | Value ($) | |
CMO Series 2012-4R Class 8A1
06/27/47 | | | 2.768 | % | | | 4,444,389 | | | | 4,445,298 | | |
GCAT
Series 2013-RP1 Class A1(a)(b)(h)
06/25/18 | | | 3.500 | % | | | 7,624,638 | | | | 7,640,431 | | |
Jefferies Resecuritization Trust
CMO Series 2010-R7 Class 7A4(a)(b)(h)
10/26/36 | | | 3.250 | % | | | 1,431,209 | | | | 1,424,631 | | |
Morgan Stanley Re-Remic Trust(a)(b)(h)
CMO Series 2013-R1 Class 4A
12/26/36 | | | 2.056 | % | | | 6,413,165 | | | | 6,492,169 | | |
CMO Series 2013-R2 Class 1A
10/26/36 | | | 2.011 | % | | | 12,312,348 | | | | 12,435,102 | | |
Morgan Stanley Resecuritization Trust(a)(b)(h)
CMO Series 2013-R9 Class 3A
05/26/36 | | | 2.409 | % | | | 10,112,371 | | | | 10,204,161 | | |
Series 2014-R1 Class A
08/26/36 | | | 2.412 | % | | | 6,366,744 | | | | 6,380,788 | | |
Nomura Asset Acceptance Corp. Alternative Loan Trust(b)(h)
CMO Series 2007-1 Class 1A3 (AGM)
03/25/47 | | | 5.957 | % | | | 471,094 | | | | 480,007 | | |
CMO Series 2007-1 Class 1A4 (AGM)
03/25/47 | | | 6.138 | % | | | 2,984,777 | | | | 3,040,503 | | |
Nomura Resecuritization Trust
CMO Series 2012-3R Class 1A1(a)(b)(h)
01/26/37 | | | 0.327 | % | | | 5,695,124 | | | | 5,446,618 | | |
Residential Mortgage Asset Trust
Series 2012-1A Class A1(a)(b)(h)
08/26/52 | | | 2.734 | % | | | 1,839,161 | | | | 1,847,522 | | |
Sequoia Mortgage Trust
CMO Series 2004-6 Class B2(b)(h)
07/20/34 | | | 1.472 | % | | | 1,512,194 | | | | 702,110 | | |
Structured Asset Securities Corp. Mortgage
Pass-Through Certificates
CMO Series 2004-21XS Class 2A6A(b)(h)
12/25/34 | | | 4.740 | % | | | 413,029 | | | | 422,596 | | |
US Residential Opportunity Fund Trust
Series 2014-1A Class NOTE(a)(b)(h)
03/25/34 | | | 3.466 | % | | | 2,994,699 | | | | 3,012,667 | | |
VOLT NPL X LLC
CMO Series 2013-NPL4 Class A1(a)(b)(h)
11/25/53 | | | 3.960 | % | | | 1,973,656 | | | | 1,985,301 | | |
Total Residential Mortgage-Backed
Securities — Non-Agency
(Cost: $190,000,803) | | | | | | | 189,735,720 | | |
The accompanying Notes to Financial Statements are an integral part of this statement.
Annual Report 2014
20
Columbia Intermediate Bond Fund
Portfolio of Investments (continued)
April 30, 2014
Commercial Mortgage-Backed Securities —
Non-Agency 7.0%
Issuer | | Coupon
Rate | | Principal
Amount ($) | | Value ($) | |
Aventura Mall Trust
Series 2013-AVM Class D(a)(b)(h)
12/05/32 | | | 3.867 | % | | | 2,785,000 | | | | 2,741,442 | | |
Bear Stearns Commercial Mortgage Securities Trust
Series 2006-PW12 Class AAB(b)(h)
09/11/38 | | | 5.873 | % | | | 89,186 | | | | 89,219 | | |
COBALT CMBS Commercial Mortgage Trust
Series 2007-C3 Class A4(b)(h)
05/15/46 | | | 5.963 | % | | | 16,315,529 | | | | 18,090,789 | | |
Capmark Mortgage Securities, Inc.
CMO IO Series 1997-C1 Class X(b)(h)(l)
07/15/29 | | | 1.451 | % | | | 3,383,389 | | | | 79,648 | | |
Citigroup Commercial Mortgage Trust
Series 2006-C5 Class A4(h)
10/15/49 | | | 5.431 | % | | | 5,083,000 | | | | 5,531,031 | | |
Citigroup/Deutsche Bank Commercial Mortgage Trust
Series 2005-CD1 Class A4(b)(h)
07/15/44 | | | 5.402 | % | | | 2,488,753 | | | | 2,602,270 | | |
Credit Suisse Commercial Mortgage Trust
Series 2007-C3 Class A4(b)(h)
06/15/39 | | | 5.866 | % | | | 6,338,164 | | | | 6,897,362 | | |
Credit Suisse Mortgage Capital Certificates
Series 2010-RR4 Class 2A(a)(b)(h)
09/18/39 | | | 5.467 | % | | | 5,786,878 | | | | 6,245,522 | | |
DBRR Trust(a)(h)
Series 2012-EZ1 Class A
09/25/45 | | | 0.946 | % | | | 579,245 | | | | 580,212 | | |
09/25/45 | | | 1.393 | % | | | 2,238,000 | | | | 2,235,121 | | |
09/25/45 | | | 2.062 | % | | | 9,895,675 | | | | 9,909,635 | | |
GE Capital Commercial Mortgage Corp.
Series 2005-C1 Class A5(b)(h)
06/10/48 | | | 4.772 | % | | | 1,278,000 | | | | 1,305,457 | | |
GS Mortgage Securities Trust(b)(h)
Series 2007-GG10 Class A4
08/10/45 | | | 5.997 | % | | | 8,084,678 | | | | 8,977,736 | | |
Series 2007-GG10 Class AM
08/10/45 | | | 5.997 | % | | | 5,030,000 | | | | 5,229,515 | | |
General Electric Capital Assurance Co.(a)(b)(h)
Series 2003-1 Class A4
05/12/35 | | | 5.254 | % | | | 1,306,124 | | | | 1,349,104 | | |
Series 2003-1 Class A5
05/12/35 | | | 5.743 | % | | | 3,346,000 | | | | 3,792,467 | | |
Greenwich Capital Commercial Funding Corp.(b)(h)
Series 2005-GG5 Class AM
04/10/37 | | | 5.277 | % | | | 10,575,000 | | | | 11,170,436 | | |
Series 2006-GG7 Class AM
07/10/38 | | | 6.015 | % | | | 7,760,000 | | | | 8,456,569 | | |
Greenwich Capital Commercial Funding Corp.(h)
Series 2007-GG11 Class A4
12/10/49 | | | 5.736 | % | | | 10,540,000 | | | | 11,743,795 | | |
Commercial Mortgage-Backed Securities —
Non-Agency (continued)
Issuer | | Coupon
Rate | | Principal
Amount ($) | | Value ($) | |
Series 2007-GG9 Class A4
03/10/39 | | | 5.444 | % | | | 16,330,000 | | | | 17,866,833 | | |
JPMorgan Chase Commercial Mortgage Securities Trust(b)(h)
Series 2005-LDP3 Class ASB
08/15/42 | | | 4.893 | % | | | 1,891,528 | | | | 1,930,554 | | |
Series 2006-LDP6 Class ASB
04/15/43 | | | 5.490 | % | | | 2,485,701 | | | | 2,536,789 | | |
JPMorgan Chase Commercial Mortgage Securities Trust(h)
Series 2005-LDP2 Class A3
07/15/42 | | | 4.697 | % | | | 954,696 | | | | 963,966 | | |
LB-UBS Commercial Mortgage Trust(b)(h)
Series 2006-C4 Class AM
06/15/38 | | | 6.051 | % | | | 2,585,000 | | | | 2,817,154 | | |
LB-UBS Commercial Mortgage Trust(h)
Series 2007-C2 Class A3
02/15/40 | | | 5.430 | % | | | 21,717,822 | | | | 23,907,282 | | |
Merrill Lynch Mortgage Investors Trust
CMO IO Series 1998-C3 Class IO(b)(h)(l)
12/15/30 | | | 1.067 | % | | | 2,895,342 | | | | 67,887 | | |
Merrill Lynch/Countrywide Commercial Mortgage Trust(b)(h)
Series 2007-6 Class A4
03/12/51 | | | 5.485 | % | | | 13,415,000 | | | | 14,747,673 | | |
Series 2007-8 Class A3
08/12/49 | | | 6.091 | % | | | 18,000,000 | | | | 20,076,768 | | |
Morgan Stanley Capital I Trust(b)(h)
Series 2007-IQ15 Class A4
06/11/49 | | | 6.105 | % | | | 20,406,634 | | | | 22,681,770 | | |
Morgan Stanley Capital I Trust(h)
Series 2007-IQ16 Class A4
12/12/49 | | | 5.809 | % | | | 2,164,000 | | | | 2,409,307 | | |
Morgan Stanley Re-Remic Trust(a)(b)(h)
Series 2009-GG10 Class A4B
08/12/45 | | | 5.997 | % | | | 8,685,000 | | | | 9,552,962 | | |
Series 2010-GG10 Class A4A
08/15/45 | | | 5.997 | % | | | 15,474,951 | | | | 17,134,175 | | |
Series 2010-GG10 Class A4B
08/12/45 | | | 5.997 | % | | | 2,665,000 | | | | 2,931,335 | | |
ORES LLC
Series 2014-LV3 Class A(a)(h)
03/27/24 | | | 3.000 | % | | | 9,680,665 | | | | 9,681,584 | | |
RIAL(a)(c)(h)
Series 2014-LT5 Class A
05/15/24 | | | 2.850 | % | | | 4,950,000 | | | | 4,950,000 | | |
RIAL(a)(h)
06/20/28 | | | 2.500 | % | | | 2,054,165 | | | | 2,054,165 | | |
Rialto Real Estate Fund
Series 2013-LT2 Class A(a)(h)
05/22/28 | | | 2.833 | % | | | 2,195,353 | | | | 2,193,952 | | |
The accompanying Notes to Financial Statements are an integral part of this statement.
Annual Report 2014
21
Columbia Intermediate Bond Fund
Portfolio of Investments (continued)
April 30, 2014
Commercial Mortgage-Backed Securities —
Non-Agency (continued)
Issuer | | Coupon
Rate | | Principal
Amount ($) | | Value ($) | |
SMA Issuer I LLC
Series 2012-LV1 Class A(a)(h)
08/20/25 | | | 3.500 | % | | | 329,256 | | | | 329,306 | | |
TIAA Seasoned Commercial Mortgage Trust
Series 2007-C4 Class A3(b)(h)
08/15/39 | | | 5.549 | % | | | 613,157 | | | | 626,075 | | |
Wachovia Bank Commercial Mortgage Trust(b)(h)
Series 2006-C24 Class A3
03/15/45 | | | 5.558 | % | | | 5,003,000 | | | | 5,347,296 | | |
Series 2006-C27 Class AM
07/15/45 | | | 5.795 | % | | | 5,935,000 | | | | 6,464,954 | | |
Total Commercial Mortgage-Backed
Securities — Non-Agency
(Cost: $278,479,955) | | | | | | | 278,299,117 | | |
Asset-Backed Securities — Agency 3.7% | |
Small Business Administration Participation Certificates
Series 2012-20C Class 1
03/01/32 | | | 2.510 | % | | | 1,183,345 | | | | 1,148,607 | | |
Series 2012-20G Class 1
07/01/32 | | | 2.380 | % | | | 1,877,696 | | | | 1,815,641 | | |
Series 2012-20L Class 1
12/01/32 | | | 1.930 | % | | | 1,947,991 | | | | 1,814,800 | | |
Series 2013-20A Class 1
01/01/33 | | | 2.130 | % | | | 4,950,516 | | | | 4,659,024 | | |
Series 2013-20B Class 1
02/01/33 | | | 2.210 | % | | | 21,685,496 | | | | 20,492,991 | | |
Series 2013-20C Class 1
03/01/33 | | | 2.220 | % | | | 16,541,821 | | | | 15,616,764 | | |
Series 2013-20D Class 1
04/01/33 | | | 2.080 | % | | | 18,648,981 | | | | 17,610,507 | | |
Series 2013-20F Class 1
06/01/33 | | | 2.450 | % | | | 9,283,198 | | | | 8,908,002 | | |
Series 2013-20G Class 1
07/01/33 | | | 3.150 | % | | | 4,566,578 | | | | 4,560,160 | | |
Series 2013-20H Class 1
08/01/33 | | | 3.160 | % | | | 19,123,816 | | | | 19,189,638 | | |
Series 2013-20I Class 1
09/01/33 | | | 3.620 | % | | | 10,313,606 | | | | 10,591,525 | | |
Series 2013-20K Class 1
11/01/33 | | | 3.380 | % | | | 5,585,000 | | | | 5,676,663 | | |
Series 2013-20L Class 1
12/01/33 | | | 3.380 | % | | | 14,845,000 | | | | 15,215,365 | | |
Series 2014-20B Class 1
02/01/34 | | | 3.230 | % | | | 1,560,000 | | | | 1,563,083 | | |
Series 2014-20C Class 1
03/01/34 | | | 3.210 | % | | | 7,370,000 | | | | 7,355,221 | | |
Series 2014-20D Class 1
04/01/34 | | | 3.110 | % | | | 12,475,000 | | | | 12,520,659 | | |
Total Asset-Backed Securities — Agency
(Cost: $151,897,566) | | | | | | | 148,738,650 | | |
Asset-Backed Securities — Non-Agency 10.7%
Issuer | | Coupon
Rate | | Principal
Amount ($) | | Value ($) | |
ARES XXVI CLO Ltd.
Series 2013-1A Class A(a)(b)
04/15/25 | | | 1.326 | % | | | 8,985,000 | | | | 8,860,594 | | |
ARI Fleet Lease Trust(a)
Series 2014-A Class A2
11/15/22 | | | 0.810 | % | | | 2,125,000 | | | | 2,124,947 | | |
ARI Fleet Lease Trust(a)(b)
Series 2012-A Class A
03/15/20 | | | 0.702 | % | | | 4,531,912 | | | | 4,539,516 | | |
Ally Auto Receivables Trust
Series 2013-2 Class A3
01/15/18 | | | 0.790 | % | | | 13,205,000 | | | | 13,225,345 | | |
Ally Master Owner Trust
Series 2012-5 Class A
09/15/19 | | | 1.540 | % | | | 4,435,000 | | | | 4,430,011 | | |
Ally Master Owner Trust(b)
Series 2014-2 Class A
01/16/18 | | | 0.522 | % | | | 6,115,000 | | | | 6,115,379 | | |
American Express Credit Account Master Trust
Series 2013-3 Class A
05/15/19 | | | 0.980 | % | | | 9,675,000 | | | | 9,680,634 | | |
Atrium X(a)(b)
Series 10A Class A
07/16/25 | | | 1.349 | % | | | 7,150,000 | | | | 7,057,836 | | |
Series 10A Class B1
07/16/25 | | | 1.879 | % | | | 3,955,000 | | | | 3,879,875 | | |
BMW Vehicle Owner Trust
Series 2013-A Class A3
11/27/17 | | | 0.670 | % | | | 9,310,000 | | | | 9,317,149 | | |
Cabela's Master Credit Card Trust
Series 2014-1 Class A(b)
03/16/20 | | | 0.504 | % | | | 1,820,000 | | | | 1,820,000 | | |
Capital One Multi-Asset Execution Trust
Series 2013-A3 Class A3
09/16/19 | | | 0.960 | % | | | 23,900,000 | | | | 23,880,584 | | |
Carlyle Global Market Strategies CLO
Series 2013-2A Class A1(a)(b)
04/18/25 | | | 1.378 | % | | | 5,645,000 | | | | 5,582,657 | | |
Chase Issuance Trust
Series 2013-A8 Class A8
10/15/18 | | | 1.010 | % | | | 24,170,000 | | | | 24,201,588 | | |
Chase Issuance Trust(b)
Series 2014-A3 Class A3
05/15/18 | | | 0.353 | % | | | 8,980,000 | | | | 8,980,000 | | |
Series 2014-A4 Class A4
04/16/18 | | | 0.359 | % | | | 9,405,000 | | | | 9,405,000 | | |
Citibank Credit Card Issuance Trust
Series 2013-A6 Class A6
09/07/18 | | | 1.320 | % | | | 31,270,000 | | | | 31,560,436 | | |
The accompanying Notes to Financial Statements are an integral part of this statement.
Annual Report 2014
22
Columbia Intermediate Bond Fund
Portfolio of Investments (continued)
April 30, 2014
Asset-Backed Securities — Non-Agency (continued)
Issuer | | Coupon
Rate | | Principal
Amount ($) | | Value ($) | |
Citicorp Residential Mortgage Securities Trust
Series 2007-2 Class A3(b)
06/25/37 | | | 5.797 | % | | | 1,102,504 | | | | 1,104,439 | | |
Citigroup Mortgage Loan Trust, Inc.
Series 2005-WF2 Class MF1(b)
08/25/35 | | | 5.517 | % | | | 2,223,966 | | | | 125,948 | | |
Conseco Financial Corp.
Series 1997-6 Class A10
01/15/29 | | | 6.870 | % | | | 355,612 | | | | 372,283 | | |
Contimortgage Home Equity Loan Trust
Series 1996-4 Class A9 (NPFGC)
01/15/28 | | | 6.880 | % | | | 33,348 | | | | 33,198 | | |
Countrywide Home Equity Loan Trust
Series 2007-S2 Class A6 (NPFGC)(b)
05/25/37 | | | 5.779 | % | | | 4,180,753 | | | | 4,140,041 | | |
Countrywiide Home Equity Loan Trust
Series 2007-S2 Class A3 (NPFGC)(b)
05/25/37 | | | 5.813 | % | | | 2,427,971 | | | | 2,326,237 | | |
Dryden Senior Loan Fund
Series 2014-33A Class B(a)(b)(c)(f)
07/15/26 | | | 2.227 | % | | | 10,000,000 | | | | 9,850,000 | | |
First Alliance Mortgage Loan Trust
Series 1994-2 Class A1 (NPFGC)
07/25/25 | | | 7.625 | % | | | 239,099 | | | | 245,205 | | |
Ford Credit Auto Lease Trust
Series 2014-A Class A2B(b)
10/15/16 | | | 0.332 | % | | | 6,665,000 | | | | 6,663,118 | | |
Ford Credit Auto Owner Trust
Series 2010-A Class D
10/15/16 | | | 4.050 | % | | | 7,000,000 | | | | 7,090,209 | | |
Series 2013-D Class A3
04/15/18 | | | 0.670 | % | | | 8,935,000 | | | | 8,933,865 | | |
GE Equipment Small Ticket LLC
Series 2014-1A Class A2(a)
08/24/16 | | | 0.590 | % | | | 3,720,000 | | | | 3,720,000 | | |
HLSS Servicer Advance Receivables Backed Notes
Series 2013-T2 Class A2(a)
05/16/44 | | | 1.147 | % | | | 3,565,000 | | | | 3,565,107 | | |
Hertz Fleet Lease Funding LP
Series 2014-1 Class A(a)(b)
04/10/28 | | | 0.572 | % | | | 3,905,000 | | | | 3,905,000 | | |
ING Investment Management CLO V Ltd.
Series 2007-5A Class A1A(a)(b)
05/01/22 | | | 0.455 | % | | | 24,593,000 | | | | 24,147,399 | | |
MAPS CLO Fund II, Ltd.
Series 2007-2A Class A1(a)(b)
07/20/22 | | | 0.468 | % | | | 10,030,000 | | | | 9,726,954 | | |
Mercedes-Benz Auto Lease Trust
Series 2013-B Class A3
07/15/16 | | | 0.620 | % | | | 10,595,000 | | | | 10,608,271 | | |
Asset-Backed Securities — Non-Agency (continued)
Issuer | | Coupon
Rate | | Principal
Amount ($) | | Value ($) | |
Mercedes-Benz Auto Lease Trust(b)
Series 2014-A Class A2B
06/15/16 | | | 0.340 | % | | | 8,715,000 | | | | 8,705,106 | | |
Mountain View CLO III Ltd.(a)(b)
Series 2007-3A Class A1
04/16/21 | | | 0.444 | % | | | 23,659,002 | | | | 23,483,074 | | |
Series 2007-3A Class A2
04/16/21 | | | 0.569 | % | | | 1,045,000 | | | | 1,010,806 | | |
Nissan Auto Lease Trust
Series 2013-B Class A3
06/15/16 | | | 0.750 | % | | | 6,130,000 | | | | 6,144,945 | | |
Nissan Auto Receivables Owner Trust
Series 2013-C Class A3
08/15/18 | | | 0.670 | % | | | 19,209,000 | | | | 19,203,915 | | |
Nomad CLO Ltd.
Series 2013-1A Class A1(a)(b)
01/15/25 | | | 1.426 | % | | | 8,825,000 | | | | 8,732,849 | | |
OHA Credit Partners VIII Ltd.(a)(b)
Series 2013-8A Class A
04/20/25 | | | 1.348 | % | | | 4,800,000 | | | | 4,737,562 | | |
Series 2013-8A Class B
04/20/25 | | | 1.878 | % | | | 7,587,000 | | | | 7,421,527 | | |
Porsche Innovative Lease Owner Trust
Series 2013-1 Class A3(a)
08/22/16 | | | 0.700 | % | | | 9,300,000 | | | | 9,316,849 | | |
Race Point VIII CLO Ltd.
Series 2013-8A Class A(a)(b)
02/20/25 | | | 1.485 | % | | | 8,870,000 | | | | 8,806,189 | | |
Renaissance Home Equity Loan Trust
Series 2005-3 Class M2(b)
11/25/35 | | | 5.355 | % | | | 4,750,000 | | | | 881,220 | | |
SLM Student Loan Trust
Series 2014-2 Class A1(b)
07/25/19 | | | 0.443 | % | | | 7,880,000 | | | | 7,880,394 | | |
SMART Trust
Series 2012-1USA Class A4A(a)
12/14/17 | | | 2.010 | % | | | 5,376,000 | | | | 5,477,707 | | |
SVO VOI Mortgage LLC
Series 2012-AA Class A(a)
09/20/29 | | | 2.000 | % | | | 5,110,438 | | | | 5,091,986 | | |
Santander Drive Auto Receivables Trust
Series 2014-2 Class A2B(b)
08/15/17 | | | 0.472 | % | | | 6,790,000 | | | | 6,790,000 | | |
Symphony CLO V Ltd.
Series 2007-5A Class A1(a)(b)
01/15/24 | | | 0.976 | % | | | 12,055,292 | | | | 11,835,126 | | |
Volkswagen Auto Loan Enhanced Trust
Series 2013-2 Class A3
04/20/18 | | | 0.700 | % | | | 12,490,000 | | | | 12,493,949 | | |
The accompanying Notes to Financial Statements are an integral part of this statement.
Annual Report 2014
23
Columbia Intermediate Bond Fund
Portfolio of Investments (continued)
April 30, 2014
Asset-Backed Securities — Non-Agency (continued)
Issuer | | Coupon
Rate | | Principal
Amount ($) | | Value ($) | |
World Financial Network Credit Card Master Trust
Series 2014-A Class A(b)
12/15/19 | | | 0.532 | % | | | 6,040,000 | | | | 6,040,000 | | |
Total Asset-Backed Securities — Non-Agency
(Cost: $430,230,083) | | | | | | | 425,272,029 | | |
U.S. Treasury Obligations 6.1% | |
U.S. Treasury
02/29/16 | | | 0.250 | % | | | 7,661,000 | | | | 7,647,833 | | |
01/15/17 | | | 0.750 | % | | | 72,381,000 | | | | 72,381,000 | | |
03/31/19 | | | 1.625 | % | | | 39,529,000 | | | | 39,454,883 | | |
04/30/19 | | | 1.625 | % | | | 8,301,000 | | | | 8,278,953 | | |
02/28/21 | | | 2.000 | % | | | 4,187,000 | | | | 4,131,719 | | |
02/15/24 | | | 2.750 | % | | | 44,421,300 | | | | 44,809,986 | | |
U.S. Treasury(c)
04/30/19 | | | 1.625 | % | | | 1,675,000 | | | | 1,670,551 | | |
U.S. Treasury(k)
11/15/43 | | | 3.750 | % | | | 63,219,000 | | | | 66,705,907 | | |
Total U.S. Treasury Obligations
(Cost: $242,740,913) | | | | | | | 245,080,832 | | |
U.S. Government & Agency Obligations 2.1% | |
Residual Funding Corp.(i)
STRIPS
10/15/19 | | | 0.000 | % | | | 76,367,000 | | | | 68,124,939 | | |
10/15/20 | | | 0.000 | % | | | 18,445,000 | | | | 15,752,602 | | |
Total U.S. Government & Agency Obligations
(Cost: $84,276,158) | | | | | | | 83,877,541 | | |
Foreign Government Obligations(m) 1.7% | |
Brazil 0.2% | |
Brazilian Government International Bond
Senior Unsecured
01/20/34 | | | 8.250 | % | | | 2,647,000 | | | | 3,573,450 | | |
01/07/41 | | | 5.625 | % | | | 5,261,000 | | | | 5,501,059 | | |
Total | | | | | | | 9,074,509 | | |
Chile 0.1% | |
Chile Government International Bond
Senior Unsecured
10/30/22 | | | 2.250 | % | | | 2,900,000 | | | | 2,678,875 | | |
Colombia 0.2% | |
Colombia Government International Bond
Senior Unsecured
01/18/41 | | | 6.125 | % | | | 5,742,000 | | | | 6,599,062 | | |
Foreign Government Obligations(m) (continued)
Issuer | | Coupon
Rate | | Principal
Amount ($) | | Value ($) | |
France 0.1% | |
Electricite de France SA(a)(b)
12/31/49 | | | 5.625 | % | | | 2,870,000 | | | | 2,945,338 | | |
Italy 0.1% | |
Republic of Italy
Senior Unsecured
09/27/23 | | | 6.875 | % | | | 5,040,000 | | | | 6,226,285 | | |
Mexico 0.2% | |
Mexico Government International Bond
Senior Unsecured
03/15/22 | | | 3.625 | % | | | 5,950,000 | | | | 6,030,325 | | |
03/08/44 | | | 4.750 | % | | | 2,530,000 | | | | 2,441,450 | | |
Total | | | | | | | 8,471,775 | | |
Poland 0.2% | |
Poland Government International Bond
Senior Unsecured
03/23/22 | | | 5.000 | % | | | 5,750,000 | | | | 6,260,312 | | |
Qatar 0.1% | |
Nakilat, Inc.
Senior Secured(a)
12/31/33 | | | 6.067 | % | | | 5,834,000 | | | | 6,154,870 | | |
Turkey 0.1% | |
Turkey Government International Bond
01/14/41 | | | 6.000 | % | | | 3,380,000 | | | | 3,496,610 | | |
United Kingdom 0.4% | |
Lloyds Banking Group PLC(b)
12/31/49 | | | 7.500 | % | | | 16,170,000 | | | | 16,897,650 | | |
Total Foreign Government Obligations
(Cost: $67,480,989) | | | | | | | 68,805,286 | | |
Municipal Bonds 1.6% | |
Issue
Description | | Coupon
Rate | | Principal
Amount ($) | | Value ($) | |
California 0.3% | |
Los Angeles Unified School District
Unlimited General Obligation Bonds
Build America Bonds
Series 2009
07/01/34 | | | 5.750 | % | | | 11,150,000 | | | | 13,298,270 | | |
Georgia 0.2% | |
State of Georgia
Unlimited General Obligation Refunding Bonds
Series 2013-C
10/01/23 | | | 4.000 | % | | | 7,035,000 | | | | 7,968,615 | | |
The accompanying Notes to Financial Statements are an integral part of this statement.
Annual Report 2014
24
Columbia Intermediate Bond Fund
Portfolio of Investments (continued)
April 30, 2014
Municipal Bonds (continued)
Issue
Description | | Coupon
Rate | | Principal
Amount ($) | | Value ($) | |
Illinois 0.1% | |
City of Chicago Waterworks
Revenue Bonds
Build America Bonds
Series 2010
11/01/40 | | | 6.742 | % | | | 1,520,000 | | | | 1,794,938 | | |
Kentucky 0.6% | |
Kentucky Asset Liability Commission
Revenue Bonds
Taxable
Series 2010
04/01/18 | | | 3.165 | % | | | 21,737,283 | | | | 22,617,208 | | |
Ohio 0.2% | |
JobsOhio Beverage System
Taxable Revenue Bonds
Series 2013-B
01/01/35 | | | 4.532 | % | | | 8,565,000 | | | | 8,535,622 | | |
Puerto Rico 0.2% | |
Commonwealth of Puerto Rico
Unlimited General Obligation Bonds
Series 2014A(n)
07/01/35 | | | 8.000 | % | | | 2,970,000 | | | | 2,747,309 | | |
Puerto Rico Sales Tax Financing Corp.(n)
1st Subordinated Revenue Bonds
Series 2010C
08/01/41 | | | 5.250 | % | | | 3,050,000 | | | | 2,176,419 | | |
Revenue Bonds
First Subordinated Series 2009A-1
08/01/43 | | | 5.250 | % | | | 2,565,000 | | | | 1,815,533 | | |
First Subordinated Series 2009B
08/01/44 | | | 6.500 | % | | | 1,020,000 | | | | 856,423 | | |
Total | | | | | | | 7,595,684 | | |
Total Municipal Bonds
(Cost: $58,685,864) | | | | | | | 61,810,337 | | |
Preferred Debt 3.4% | |
Issuer | | Coupon
Rate | | Principal
Amount ($) | | Value ($) | |
Banking 2.9% | |
Citigroup Capital XIII(b)
10/30/40 | | | 7.875 | % | | | 1,476,449 | | | | 40,247,999 | | |
HSBC Holdings PLC
12/31/49 | | | 8.000 | % | | | 506,100 | | | | 13,664,700 | | |
M&T Bank Corp.(b)
12/31/49 | | | 6.375 | % | | | 13,370 | | | | 13,196,591 | | |
12/31/49 | | | 6.375 | % | | | 1,660 | | | | 1,666,690 | | |
Preferred Debt (continued)
Issuer | | Coupon
Rate | | Principal
Amount ($) | | Value ($) | |
PNC Financial Services Group, Inc. (The)(b)
12/31/49 | | | 6.125 | % | | | 400,980 | | | | 10,770,323 | | |
State Street Corp.(b)
12/31/49 | | | 5.900 | % | | | 355,000 | | | | 9,215,800 | | |
U.S. Bancorp(b)
12/31/49 | | | 6.500 | % | | | 616,667 | | | | 17,790,843 | | |
Wells Fargo & Co.(b)
12/31/49 | | | 5.850 | % | | | 429,000 | | | | 10,875,150 | | |
Total | | | | | | | 117,428,096 | | |
Building Materials 0.2% | |
Stanley Black & Decker, Inc.
07/25/52 | | | 5.750 | % | | | 233,050 | | | | 5,786,632 | | |
Property & Casualty 0.3% | |
Allstate Corp. (The)
12/31/49 | | | 6.625 | % | | | 100,000 | | | | 2,581,000 | | |
Allstate Corp. (The)(b)
01/15/53 | | | 5.100 | % | | | 324,450 | | | | 8,150,184 | | |
Total | | | | | | | 10,731,184 | | |
Total Preferred Debt
(Cost: $130,792,407) | | | | | | | 133,945,912 | | |
Senior Loans 1.3% | |
Borrower | | Weighted
Average
Coupon | | Principal
Amount ($) | | Value ($) | |
Brokerage —% | |
Nuveen Investments, Inc.
2nd Lien Tranche B Term Loan(b)(o)
02/28/19 | | | 6.500 | % | | | 578,858 | | | | 583,020 | | |
Chemicals —% | |
Axalta Coating Systems Dutch Holding B BV/U.S. Holdings, Inc.
Tranche B Term Loan(b)(o)
02/01/20 | | | 4.000 | % | | | 346,383 | | | | 345,129 | | |
Construction Machinery —% | |
CPM Acquisition Corp.
1st Lien Term Loan(b)(o)
08/29/17 | | | 6.250 | % | | | 686,170 | | | | 688,744 | | |
Diversified Manufacturing —% | |
Gardner Denver, Inc.
Term Loan(b)(o)
07/30/20 | | | 4.250 | % | | | 210,485 | | | | 210,068 | | |
The accompanying Notes to Financial Statements are an integral part of this statement.
Annual Report 2014
25
Columbia Intermediate Bond Fund
Portfolio of Investments (continued)
April 30, 2014
Senior Loans (continued)
Borrower | | Weighted
Average
Coupon | | Principal
Amount ($) | | Value ($) | |
Entertainment —% | |
Time, Inc.
Tranche B Term Loan(b)(o)
04/04/21 | | | 4.250 | % | | | 282,000 | | | | 281,176 | | |
Food and Beverage 1.0% | |
Diamond Foods, Inc.
Term Loan(b)(o)
08/20/18 | | | 4.250 | % | | | 70,822 | | | | 70,645 | | |
HJ Heinz Co.(b)(c)(o)
Tranche B2 Term Loan
06/05/20 | | | 3.500 | % | | | 9,928,333 | | | | 9,941,836 | | |
HJ Heinz Co.(b)(o)
Tranche B2 Term Loan
06/05/20 | | | 3.500 | % | | | 6,129,123 | | | | 6,137,458 | | |
Tranche B1 Term Loan
06/07/19 | | | 3.250 | % | | | 22,789,489 | | | | 22,777,639 | | |
Total | | | | | | | 38,927,578 | | |
Health Care 0.1% | |
American Renal Holdings, Inc.
2nd Lien Term Loan(b)(o)
03/20/20 | | | 8.500 | % | | | 304,000 | | | | 303,240 | | |
CHS/Community Health Systems, Inc.
Tranche D Term Loan(b)(o)
01/27/21 | | | 4.250 | % | | | 141,645 | | | | 142,131 | | |
ConvaTec, Inc.
Term Loan(b)(o)
12/22/16 | | | 4.000 | % | | | 147,379 | | | | 147,471 | | |
U.S. Renal Care, Inc.
2nd Lien Term Loan(b)(o)
01/03/20 | | | 10.250 | % | | | 595,000 | | | | 602,437 | | |
US Renal Care, Inc.
1st Lien Tranche B-2 Term Loan(b)(o)
07/03/19 | | | 4.250 | % | | | 944,575 | | | | 942,998 | | |
United Surgical Partners International, Inc.
Tranche B Term Loan(b)(o)
04/03/19 | | | 4.750 | % | | | 305,955 | | | | 306,209 | | |
Total | | | | | | | 2,444,486 | | |
Lodging —% | |
Four Seasons Holdings, Inc.
2nd Lien Term Loan(b)(o)
12/28/20 | | | 6.250 | % | | | 148,000 | | | | 149,850 | | |
Playa Resorts Holding
Term Loan(b)(o)
08/09/19 | | | 4.000 | % | | | 212,930 | | | | 212,532 | | |
Total | | | | | | | 362,382 | | |
Senior Loans (continued)
Borrower | | Weighted
Average
Coupon | | Principal
Amount ($) | | Value ($) | |
Metals —% | |
Arch Coal, Inc.
Term Loan(b)(o)
05/16/18 | | | 6.250 | % | | | 486,530 | | | | 472,542 | | |
Other Industry —% | |
Interline Brands, Inc.
1st Lien Term Loan(b)(c)(o)
03/17/21 | | | 4.000 | % | | | 141,000 | | | | 139,855 | | |
Property & Casualty 0.1% | |
Asurion LLC(b)(o)
2nd Lien Term Loan
03/03/21 | | | 8.500 | % | | | 660,000 | | | | 677,325 | | |
Tranche B-1 Term Loan
05/24/19 | | | 5.000 | % | | | 1,067,469 | | | | 1,068,067 | | |
Total | | | | | | | 1,745,392 | | |
Retailers —% | |
Men's Wearhouse, Inc.
Tranche B Term Loan(b)(o)
04/16/21 | | | 4.500 | % | | | 202,000 | | | | 201,748 | | |
Neiman Marcus Group, Inc. (The)
Term Loan(b)(o)
10/25/20 | | | 4.250 | % | | | 484,785 | | | | 483,151 | | |
Rite Aid Corp.
2nd Lien Tranche 1 Term Loan(b)(o)
08/21/20 | | | 5.750 | % | | | 548,000 | | | | 557,590 | | |
Total | | | | | | | 1,242,489 | | |
Technology 0.1% | |
Applied Systems, Inc.(b)(o)
1st Lien Term Loan
01/25/21 | | | 4.250 | % | | | 41,895 | | | | 41,813 | | |
2nd Lien Term Loan
01/24/22 | | | 7.500 | % | | | 49,000 | | | | 49,490 | | |
Avago Technologies Ltd.
Tranche B Term Loan(b)(c)(o)
12/16/20 | | | 3.750 | % | | | 434,000 | | | | 435,146 | | |
Blue Coat Systems, Inc.
2nd Lien Term Loan(b)(o)
06/26/20 | | | 9.500 | % | | | 669,000 | | | | 672,345 | | |
ION Trading Technologies SARL
2nd Lien Term Loan(b)(o)
05/22/21 | | | 8.250 | % | | | 894,413 | | | | 896,649 | | |
Interactive Data Corp.
Tranche B Term Loan(b)(c)(o)
04/07/21 | | | 4.750 | % | | | 278,000 | | | | 277,074 | | |
The accompanying Notes to Financial Statements are an integral part of this statement.
Annual Report 2014
26
Columbia Intermediate Bond Fund
Portfolio of Investments (continued)
April 30, 2014
Senior Loans (continued)
Borrower | | Weighted
Average
Coupon | | Principal
Amount ($) | | Value ($) | |
Triple Point Group Holdings, Inc.
2nd Lien Term Loan(b)(o)
07/10/21 | | | 9.250 | % | | | 178,000 | | | | 160,200 | | |
Total | | | | | | | 2,532,717 | | |
Total Senior Loans
(Cost: $50,113,540) | | | | | | | 49,975,578 | | |
Common Stocks —% | |
Issuer | | | | Shares | | Value ($) | |
Financials —% | |
Insurance —% | |
Washington Funding
Trust LII D Escrow(d)(f)(g)(p) | | | | | | | 2,725 | | | | — | | |
WMI Holdings Corp.(p) | | | | | | | 53,957 | | | | 161,601 | | |
Total | | | | | | | 161,601 | | |
Total Financials | | | | | | | 161,601 | | |
Industrials —% | |
Airlines —% | |
United Continental Holdings, Inc.(p) | | | | | | | 1,493 | | | | 61,019 | | |
Total Industrials | | | | | | | 61,019 | | |
Total Common Stocks
(Cost: $1,511,115) | | | | | | | 222,620 | | |
Treasury Bills 4.3%
Issuer | | Effective
Yield | | Principal
Amount ($) | | Value ($) | |
United States 4.3% | |
U.S. Treasury Bill
08/21/14 | | | 0.030 | % | | | 173,190,000 | | | | 173,173,893 | | |
Total Treasury Bills
(Cost: $173,171,402) | | | | | | | 173,173,893 | | |
Money Market Funds 1.1% | |
| | | | | Shares | | Value ($) | |
Columbia Short-Term Cash Fund,
0.092%(q)(r) | | | | | | | 45,506,877 | | | | 45,506,877 | | |
Total Money Market Funds
(Cost: $45,506,877) | | | | | | | 45,506,877 | | |
Total Investments
(Cost: $4,126,921,171) | | | | | | | 4,185,041,919 | | |
Other Assets & Liabilities, Net | | | | | | | (197,579,985 | ) | |
Net Assets | | | | | | | 3,987,461,934 | | |
Investments in Derivatives
Futures Contracts Outstanding at April 30, 2014
At April 30, 2014, securities totaling $11,062,821 were pledged as collateral to cover initial margin requirements on open futures contracts.
Contract Description | | Number of
Contracts
Long (Short) | | Trading
Currency | | Notional
Market
Value ($) | | Expiration
Date | | Unrealized
Appreciation ($) | | Unrealized
Depreciation ($) | |
US 2YR NOTE | | | 1,250 | | | USD | | | | | 274,843,750 | | | 06/2014 | | | 16,780 | | | | — | | |
US 5YR NOTE | | | 661 | | | USD | | | | | 78,958,519 | | | 06/2014 | | | 447,940 | | | | — | | |
US 10YR NOTE | | | (413 | ) | | USD | | | | | (51,386,236 | ) | | 06/2014 | | | — | | | | (173,827 | ) | |
US LONG BOND | | | (1,309 | ) | | USD | | | | | (176,633,188 | ) | | 06/2014 | | | — | | | | (4,482,217 | ) | |
US ULTRA T-BOND | | | (388 | ) | | USD | | | | | (57,145,125 | ) | | 06/2014 | | | — | | | | (1,477,481 | ) | |
Total | | | | | | | | | | | 464,720 | | | | (6,133,525 | ) | |
The accompanying Notes to Financial Statements are an integral part of this statement.
Annual Report 2014
27
Columbia Intermediate Bond Fund
Portfolio of Investments (continued)
April 30, 2014
Credit Default Swap Contracts Outstanding at April 30, 2014
At April 30, 2014, securities totaling $5,763,000 were pledged as collateral to cover open credit default swap contracts.
In addition, securities totaling $1,396,000 were received from broker as collateral to cover open credit default swap contracts.
At April 30, 2014, securities totaling $14,154,156 were pledged as collateral to cover open centrally cleared credit default swap contracts.
Buy Protection
Counterparty | | Reference
Entity | | Expiration
Date | | Pay Fixed
Rate (%) | | Notional
Amount ($) | | Market
Value ($) | | Unamortized
Premium
(Paid)
Received ($) | | Periodic
Payments
Receivable
(Payable) ($) | | Unrealized
Appreciation ($) | | Unrealized
Depreciation ($) | |
JPMorgan | | Barclays Bank, PLC | | 9/20/18 | | | 1.000 | | | | 14,460,000 | | | | (237,618 | ) | | | (288,851 | ) | | | (16,870 | ) | | | — | | | | (543,339 | ) | |
Citibank | | H.J. Heinz Company | | 9/20/18 | | | 1.000 | | | | 15,255,000 | | | | 85,321 | | | | (425,456 | ) | | | (17,798 | ) | | | — | | | | (357,933 | ) | |
Goldman Sachs
International | | Home Depot, Inc.
| | 9/20/18
| | | 1.000
| | | | 25,730,000
| | | | (880,014
| ) | | | 665,350
| | | | (30,018
| ) | | | —
| | | | (244,682
| ) | |
Barclays | | Morgan Stanley | | 9/20/18 | | | 1.000 | | | | 11,015,000 | | | | (158,632 | ) | | | (365,978 | ) | | | (12,850 | ) | | | — | | | | (537,460 | ) | |
Citibank | | Morgan Stanley | | 9/20/18 | | | 1.000 | | | | 16,525,000 | | | | (237,984 | ) | | | (574,531 | ) | | | (19,279 | ) | | | — | | | | (831,794 | ) | |
Citibank | | Nucor Corp. | | 9/20/18 | | | 1.000 | | | | 10,305,000 | | | | (231,084 | ) | | | 64,644 | | | | (12,021 | ) | | | — | | | | (178,461 | ) | |
Goldman Sachs
International | | Nucor Corp.
| | 9/20/18
| | | 1.000
| | | | 4,115,000
| | | | (92,276
| ) | | | 30,986
| | | | (4,800
| ) | | | —
| | | | (66,090
| ) | |
Barclays | | Telecom Italia SPA | | 9/20/18 | | | 1.000 | | | | 4,600,000 | | | | 126,029 | | | | (396,407 | ) | | | (5,367 | ) | | | — | | | | (275,745 | ) | |
Goldman Sachs
International | | Bank of America
Corp. | | 12/20/18
| | | 1.000
| | | | 40,520,000
| | | | (661,050
| ) | | | 251,392
| | | | (47,273
| ) | | | —
| | | | (456,931
| ) | |
Citibank
| | CDX Emerging
Markets Index 20-V1 | | 12/20/18
| | | 5.000
| | | | 12,540,000
| | | | (1,179,517
| ) | | | 781,247
| | | | (73,150
| ) | | | —
| | | | (471,420
| ) | |
Goldman Sachs
International | | CDX Emerging
Markets Index 20-V1 | | 12/20/18
| | | 5.000
| | | | 23,120,000
| | | | (2,174,676
| ) | | | 1,664,029
| | | | (134,867
| ) | | | —
| | | | (645,514
| ) | |
Morgan Stanley*
| | CDX North America
Investment
Grade 21-V1 | | 12/20/18
| | | 1.000
| | | | 28,380,000
| | | | (209,650
| ) | | | —
| | | | (33,110
| ) | | | —
| | | | (242,760
| ) | |
Morgan Stanley*
| | CDX North America
Investment
Grade 21-V1 | | 12/20/18
| | | 5.000
| | | | 218,335,000
| | | | (2,537,012
| ) | | | —
| | | | (1,273,621
| ) | | | —
| | | | (3,810,633
| ) | |
Goldman Sachs
International | | Citigroup, Inc.
| | 12/20/18
| | | 1.000
| | | | 17,650,000
| | | | (268,693
| ) | | | 133,135
| | | | (20,592
| ) | | | —
| | | | (156,150
| ) | |
Barclays | | D.R. Horton, Inc. | | 12/20/18 | | | 1.000 | | | | 27,060,000 | | | | 684,203 | | | | (1,143,785 | ) | | | (31,570 | ) | | | | | | | (491,152 | ) | |
JPMorgan | | D.R. Horton, Inc. | | 12/20/18 | | | 1.000 | | | | 14,295,000 | | | | 361,444 | | | | (592,862 | ) | | | (16,677 | ) | | | — | | | | (248,095 | ) | |
Morgan Stanley
| | Goldman Sachs
Group, Inc. | | 12/20/18
| | | 1.000
| | | | 24,300,000
| | | | (222,456
| ) | | | —
| | | | (28,350
| ) | | | —
| | | | (250,806
| ) | |
Goldman Sachs
International | | H.J. Heinz Company
| | 12/20/18
| | | 1.000
| | | | 14,475,000
| | | | 154,604
| | | | (361,135
| ) | | | (16,888
| ) | | | —
| | | | (223,419
| ) | |
Barclays | | Limited Brands, Inc. | | 12/20/18 | | | 1.000 | | | | 21,295,000 | | | | 485,537 | | | | (689,660 | ) | | | (24,844 | ) | | | — | | | | (228,967 | ) | |
Barclays | | Toll Brothers, Inc. | | 12/20/18 | | | 1.000 | | | | 9,540,000 | | | | 209,486 | | | | (336,886 | ) | | | (11,130 | ) | | | — | | | | (138,530 | ) | |
Goldman Sachs
International | | Toll Brothers, Inc.
| | 12/20/18
| | | 1.000
| | | | 38,095,000
| | | | 836,517
| | | | (1,575,138
| ) | | | (44,444
| ) | | | —
| | | | (783,065
| ) | |
Goldman Sachs
International | | Citigroup, Inc.
| | 3/20/19
| | | 1.000
| | | | 25,205,000
| | | | (362,468
| ) | | | 211,417
| | | | (29,406
| ) | | | —
| | | | (180,457
| ) | |
Goldman Sachs
International | | Home Depot, Inc.
| | 3/20/19
| | | 1.000
| | | | 30,265,000
| | | | (1,097,194
| ) | | | 1,008,314
| | | | (35,309
| ) | | | —
| | | | (124,189
| ) | |
Barclays
| | Marriott
International, Inc. | | 3/20/19
| | | 1.000
| | | | 14,025,000
| | | | (375,834
| ) | | | 330,286
| | | | (16,363
| ) | | | —
| | | | (61,911
| ) | |
Barclays | | Safeway, Inc. | | 3/20/19 | | | 1.000 | | | | 2,495,000 | | | | 213,394 | | | | (274,802 | ) | | | (2,911 | ) | | | — | | | | (64,319 | ) | |
The accompanying Notes to Financial Statements are an integral part of this statement.
Annual Report 2014
28
Columbia Intermediate Bond Fund
Portfolio of Investments (continued)
April 30, 2014
Credit Default Swap Contracts Outstanding at April 30, 2014 (continued)
Buy Protection
Counterparty | | Reference
Entity | | Expiration
Date | | Pay Fixed
Rate (%) | | Notional
Amount ($) | | Market
Value ($) | | Unamortized
Premium
(Paid)
Received ($) | | Periodic
Payments
Receivable
(Payable) ($) | | Unrealized
Appreciation ($) | | Unrealized
Depreciation ($) | |
Citibank | | Safeway, Inc. | | 3/20/19 | | | 1.000 | | | | 2,495,000 | | | | 213,394 | | | | (274,802 | ) | | | (2,911 | ) | | | — | | | | (64,319 | ) | |
Goldman Sachs
International | | Safeway, Inc.
| | 3/20/19
| | | 1.000
| | | | 4,995,000
| | | | 427,217
| | | | (492,618
| ) | | | (5,828
| ) | | | —
| | | | (71,229
| ) | |
Morgan Stanley | | Safeway, Inc. | | 3/20/19 | | | 1.000 | | | | 2,495,000 | | | | 213,394 | | | | (274,802 | ) | | | (2,911 | ) | | | — | | | | (64,319 | ) | |
Goldman Sachs
International | | Textron, Inc.
| | 3/20/19
| | | 1.000
| | | | 20,890,000
| | | | (197,874
| ) | | | (153,011
| ) | | | (24,371
| ) | | | —
| | | | (375,256
| ) | |
Goldman Sachs
International | | Barclays Bank, PLC
| | 6/20/19
| | | 1.000
| | | | 12,245,000
| | | | (173,347
| ) | | | 137,421
| | | | (14,285
| ) | | | —
| | | | (50,211
| ) | |
Morgan Stanley*
| | CDX North America
High Yield 22-V1 | | 6/20/19
| | | 5.000
| | | | 20,000,000
| | | | (16,554
| ) | | | —
| | | | (116,666
| ) | | | —
| | | | (133,220
| ) | |
Citibank
| | Marriott
International, Inc. | | 6/20/19
| | | 1.000
| | | | 4,080,000
| | | | (109,398
| ) | | | 104,799
| | | | (4,760
| ) | | | —
| | | | (9,359
| ) | |
Citibank | | McDonald's Corp. | | 6/20/19 | | | 1.000 | | | | 9,485,000 | | | | (394,956 | ) | | | 389,002 | | | | (11,066 | ) | | | — | | | | (17,020 | ) | |
Goldman Sachs
International | | Safeway, Inc.
| | 6/20/19
| | | 1.000
| | | | 7,500,000
| | | | 728,800
| | | | (691,058
| ) | | | (8,750
| ) | | | 28,992
| | | | —
| | |
Total | | | | | | | | | | | | | | | | | 28,992 | | | | (12,398,755 | ) | |
*Centrally cleared swap contract
Interest Rate Swap Contracts Outstanding at April 30, 2014
At April 30, 2014, securities totaling $949,756 were pledged as collateral to cover open centrally cleared interest rate swap contracts.
| Counterparty | | Floating
Rate
Index | | Fund Pay/
Receive
Floating
Rate | | Fixed
Rate
(%) | | Expiration
Date | | Notional
Currency | | Notional
Amount | | Unamortized
Premium
(Paid)
Received
($) | | Unrealized
Appreciation
($) | | Unrealized
Depreciation
($) | |
Morgan
Stanley* | | 3-Month
USD LIBOR-BBA | | Receive
| | | 0.825
| | | 3/4/17
| | USD | | | | | 69,685,000 | | | | (254 | ) | | | 92,150 | | | | — | | |
Morgan
Stanley* | | 3-Month
USD LIBOR-BBA | | Receive | | | 0.834 | | | 3/7/17
| | USD | | | | | 209,600,000 | | | | (735 | ) | | | 241,956 | | | | — | | |
Morgan
Stanley* | | 3-Month
USD LIBOR-BBA | | Pay | | | 1.631 | | | 3/7/19
| | USD | | | | | 127,680,000 | | | | (799 | ) | | | — | | | | (231,837 | ) | |
Total | | | | | | | | | | | | | | | | | 334,106 | | | | (231,837 | ) | |
*Centrally cleared swap contract
Notes to Portfolio of Investments
(a) Security exempt from registration pursuant to Rule 144A under the Securities Act of 1933. This security may be resold in transactions exempt from registration, normally to qualified institutional buyers. At April 30, 2014, the value of these securities amounted to $729,754,777 or 18.30% of net assets.
(b) Variable rate security.
(c) Represents a security purchased on a when-issued or delayed delivery basis.
The accompanying Notes to Financial Statements are an integral part of this statement.
Annual Report 2014
29
Columbia Intermediate Bond Fund
Portfolio of Investments (continued)
April 30, 2014
Notes to Portfolio of Investments (continued)
(d) Identifies issues considered by the Investment Manager to be illiquid as to their marketability. The aggregate value of such securities at April 30, 2014 was $1,412,519, representing 0.04% of net assets. Information concerning such security holdings at April 30, 2014 is as follows:
Security Description | | Acquisition Dates | | Cost ($) | |
American Mortgage Trust
Series 2093-3 Class 3A
07/27/23 8.188% | | 04/27/95 | | | 3,367 | | |
Six Flags, Inc.
06/01/44 9.625% | | 05/07/10 | | | — | | |
United Artists Theatre Circuit, Inc.
1995-A Pass-Through Certificates
07/01/15 9.300% | | 08/12/96 | | | 1,344,288 | | |
Washington Funding Trust LII D Escrow | | 03/28/08 | | | — | | |
Washington Mutual Bank
Subordinated Notes
01/15/15 5.125% | | 09/25/07 - 05/14/08 | | | 24,052,072 | | |
(e) Represents securities that have defaulted on payment of interest. The Fund has stopped accruing interest on these securities. At April 30, 2014, the value of these securities amounted to $41,069, which represents less than 0.01% of net assets.
(f) Represents fair value as determined in good faith under procedures approved by the Board of Trustees. At April 30, 2014, the value of these securities amounted to $11,262,519, which represents 0.28% of net assets.
(g) Negligible market value.
(h) The maturity dates shown represent the original maturity of the underlying obligation. Actual maturity may vary based upon prepayment activity on these obligations. Unless otherwise noted, the coupon rates presented are fixed rates.
(i) Zero coupon bond.
(j) Principal Only (PO) security issued with a zero coupon. Income is recognized through the accretion of discount.
(k) This security, or a portion of this security, has been pledged as collateral in connection with open futures contracts and swap contracts. These values are denoted within the Investments in Derivatives section of the Portfolio of Investments.
(l) Interest Only (IO) security. The actual effective yield of this security is different than the stated coupon rate.
(m) Principal and interest may not be guaranteed by the government.
(n) Municipal obligations include debt obligations issued by or on behalf of territories, possessions, or sovereign nations within the territorial boundaries of the United States. At April 30, 2014, the value of these securities amounted to $7,595,684 or 0.19% of net assets.
(o) Senior loans have rates of interest that float periodically based primarily on the London Interbank Offered Rate ("LIBOR") and other short-term rates. The interest rate shown reflects the weighted average coupon as of April 30, 2014. The interest rate shown for senior loans purchased on a when-issued or delayed delivery basis, if any, reflects an estimated average coupon. Remaining maturities of senior loans may be less than the stated maturities shown as a result of contractual or optional prepayments by the borrower. Such prepayments cannot be predicted with certainty.
(p) Non-income producing.
(q) The rate shown is the seven-day current annualized yield at April 30, 2014.
(r) As defined in the Investment Company Act of 1940, an affiliated company is one in which the Fund owns 5% or more of its outstanding voting securities, or a company which is under common ownership or control with the Fund. Holdings and transactions in these affiliated companies during the year ended April 30, 2014, are as follows:
Issuer | | Beginning
Cost ($) | | Purchase
Cost ($) | | Proceeds
From Sales ($) | | Ending
Cost ($) | | Dividends —
Affiliated
Issuers ($) | | Value ($) | |
Columbia Short-Term Cash Fund | | | 7,211,825 | | | | 1,765,497,396 | | | | (1,727,202,344 | ) | | | 45,506,877 | | | | 70,115 | | | | 45,506,877 | | |
The accompanying Notes to Financial Statements are an integral part of this statement.
Annual Report 2014
30
Columbia Intermediate Bond Fund
Portfolio of Investments (continued)
April 30, 2014
Abbreviation Legend
AGM Assured Guaranty Municipal Corporation
CMO Collateralized Mortgage Obligation
NPFGC National Public Finance Guarantee Corporation
PIK Payment-in-Kind
STRIPS Separate Trading of Registered Interest and Principal Securities
Currency Legend
USD US Dollar
The accompanying Notes to Financial Statements are an integral part of this statement.
Annual Report 2014
31
Columbia Intermediate Bond Fund
Portfolio of Investments (continued)
April 30, 2014
Fair Value Measurements
Generally accepted accounting principles (GAAP) require disclosure regarding the inputs and valuation techniques used to measure fair value and any changes in valuation inputs or techniques. In addition, investments shall be disclosed by major category.
The Fund categorizes its fair value measurements according to a three-level hierarchy that maximizes the use of observable inputs and minimizes the use of unobservable inputs by prioritizing that the most observable input be used when available. Observable inputs are those that market participants would use in pricing an investment based on market data obtained from sources independent of the reporting entity. Unobservable inputs are those that reflect the Fund's assumptions about the information market participants would use in pricing an investment. An investment's level within the fair value hierarchy is based on the lowest level of any input that is deemed significant to the asset or liability's fair value measurement. The input levels are not necessarily an indication of the risk or liquidity associated with investments at that level. For example, certain U.S. government securities are generally high quality and liquid, however, they are reflected as Level 2 because the inputs used to determine fair value may not always be quoted prices in an active market.
Fair value inputs are summarized in the three broad levels listed below:
> Level 1 — Valuations based on quoted prices for investments in active markets that the Fund has the ability to access at the measurement date (including NAV for open-end mutual funds). Valuation adjustments are not applied to Level 1 investments.
> Level 2 — Valuations based on other significant observable inputs (including quoted prices for similar securities, interest rates, prepayment speeds, credit risks, etc.).
> Level 3 — Valuations based on significant unobservable inputs (including the Fund's own assumptions and judgment in determining the fair value of investments).
Inputs that are used in determining fair value of an investment may include price information, credit data, volatility statistics, and other factors. These inputs can be either observable or unobservable. The availability of observable inputs can vary between investments, and is affected by various factors such as the type of investment, and the volume and level of activity for that investment or similar investments in the marketplace. The inputs will be considered by the Investment Manager, along with any other relevant factors in the calculation of an investment's fair value. The Fund uses prices and inputs that are current as of the measurement date, which may include periods of market dislocations. During these periods, the availability of prices and inputs may be reduced for many investments. This condition could cause an investment to be reclassified between the various levels within the hierarchy.
Investments falling into the Level 3 category are primarily supported by quoted prices from brokers and dealers participating in the market for those investments. However, these may be classified as Level 3 investments due to lack of market transparency and corroboration to support these quoted prices. Additionally, valuation models may be used as the pricing source for any remaining investments classified as Level 3. These models may rely on one or more significant unobservable inputs and/or significant assumptions by the Investment Manager. Inputs used in valuations may include, but are not limited to, financial statement analysis, capital account balances, discount rates and estimated cash flows, and comparable company data.
Under the direction of the Fund's Board of Trustees (the Board), the Investment Manager's Valuation Committee (the Committee) is responsible for overseeing the valuation procedures approved by the Board. The Committee consists of voting and non-voting members from various groups within the Investment Manager's organization, including operations and accounting, trading and investments, compliance, risk management and legal.
The Committee meets at least monthly to review and approve valuation matters, which may include a description of specific valuation determinations, data regarding pricing information received from approved pricing vendors and brokers and the results of Board-approved valuation control policies and procedures (the Policies). The Policies address, among other things, instances when market quotations are or are not readily available, including recommendations of third party pricing vendors and a determination of appropriate pricing methodologies; events that require specific valuation determinations and assessment of fair value techniques; securities with a potential for stale pricing, including those that are illiquid, restricted, or in default; and the effectiveness of third party pricing vendors, including periodic reviews of vendors. The Committee meets more frequently, as needed, to discuss additional valuation matters, which may include the need to review back-testing results, review time-sensitive information or approve related valuation actions. The Committee reports to the Board, with members of the Committee meeting with the Board at each of its regularly scheduled meetings to discuss valuation matters and actions during the period, similar to those described earlier.
For investments categorized as Level 3, the Committee monitors information similar to that described above, which may include: (i) data specific to the issuer or comparable issuers, (ii) general market or specific sector news and (iii) quoted prices and specific or similar security transactions. The Committee considers this data and any changes from prior periods in order to assess the reasonableness of observable and unobservable inputs, any assumptions or internal models used to value those securities and changes in fair value. This data is also used to corroborate, when available, information received from approved pricing vendors and brokers. Various factors impact the frequency of monitoring this information (which may occur as often as daily). However, the Committee may determine that changes to inputs, assumptions and models are not required as a result of the monitoring procedures performed.
The accompanying Notes to Financial Statements are an integral part of this statement.
Annual Report 2014
32
Columbia Intermediate Bond Fund
Portfolio of Investments (continued)
April 30, 2014
Fair Value Measurements (continued)
The following table is a summary of the inputs used to value the Fund's investments at April 30, 2014:
Description | | Level 1
Quoted Prices in Active
Markets for Identical
Assets ($) | | Level 2
Other Significant
Observable Inputs ($) | | Level 3
Significant
Unobservable Inputs ($) | | Total ($) | |
Bonds | |
Corporate Bonds & Notes | |
Banking | | | — | | | | 426,333,802 | | | | 41,069 | | | | 426,374,871 | | |
Entertainment | | | — | | | | 2,164,775 | | | | 1,369,318 | | | | 3,534,093 | | |
All Other Industries | | | — | | | | 1,226,190,428 | | | | — | | | | 1,226,190,428 | | |
Residential Mortgage-Backed
Securities — Agency | | | — | | | | 624,498,135 | | | | — | | | | 624,498,135 | | |
Residential Mortgage-Backed
Securities — Non-Agency | | | — | | | | 160,585,023 | | | | 29,150,697 | | | | 189,735,720 | | |
Commercial Mortgage-Backed
Securities — Non-Agency | | | — | | | | 259,150,196 | | | | 19,148,921 | | | | 278,299,117 | | |
Asset-Backed Securities — Agency | | | — | | | | 148,738,650 | | | | — | | | | 148,738,650 | | |
Asset-Backed Securities — Non-Agency | | | — | | | | 425,272,029 | | | | — | | | | 425,272,029 | | |
U.S. Treasury Obligations | | | 245,080,832 | | | | — | | | | — | | | | 245,080,832 | | |
U.S. Government & Agency Obligations | | | — | | | | 83,877,541 | | | | — | | | | 83,877,541 | | |
Foreign Government Obligations | | | — | | | | 68,805,286 | | | | — | | | | 68,805,286 | | |
Municipal Bonds | | | — | | | | 61,810,337 | | | | — | | | | 61,810,337 | | |
Preferred Debt | | | 133,945,912 | | | | — | | | | — | | | | 133,945,912 | | |
Total Bonds | | | 379,026,744 | | | | 3,487,426,202 | | | | 49,710,005 | | | | 3,916,162,951 | | |
Equity Securities | |
Common Stocks | |
Financials | | | 161,601 | | | | — | | | | — | | | | 161,601 | | |
Industrials | | | 61,019 | | | | — | | | | — | | | | 61,019 | | |
Total Equity Securities | | | 222,620 | | | | — | | | | — | | | | 222,620 | | |
Short-Term Securities | |
Treasury Bills | | | 173,173,893 | | | | — | | | | — | | | | 173,173,893 | | |
Total Short-Term Securities | | | 173,173,893 | | | | — | | | | — | | | | 173,173,893 | | |
Other | |
Senior Loans | |
Health Care | | | — | | | | 1,842,049 | | | | 602,437 | | | | 2,444,486 | | |
Lodging | | | — | | | | 212,532 | | | | 149,850 | | | | 362,382 | | |
All Other Industries | | | — | | | | 47,168,710 | | | | — | | | | 47,168,710 | | |
Total Other | | | — | | | | 49,223,291 | | | | 752,287 | | | | 49,975,578 | | |
Mutual Funds | |
Money Market Funds | | | 45,506,877 | | | | — | | | | — | | | | 45,506,877 | | |
Total Mutual Funds | | | 45,506,877 | | | | — | | | | — | | | | 45,506,877 | | |
The accompanying Notes to Financial Statements are an integral part of this statement.
Annual Report 2014
33
Columbia Intermediate Bond Fund
Portfolio of Investments (continued)
April 30, 2014
Fair Value Measurements (continued)
Description | | Level 1
Quoted Prices in Active
Markets for Identical
Assets ($) | | Level 2
Other Significant
Observable Inputs ($) | | Level 3
Significant
Unobservable Inputs ($) | | Total ($) | |
Investments in Securities | | | 597,930,134 | | | | 3,536,649,493 | | | | 50,462,292 | | | | 4,185,041,919 | | |
Derivatives | |
Assets | |
Futures Contracts | | | 464,720 | | | | — | | | | — | | | | 464,720 | | |
Swap Contracts | | | — | | | | 363,098 | | | | — | | | | 363,098 | | |
Liabilities | |
Futures Contracts | | | (6,133,525 | ) | | | — | | | | — | | | | (6,133,525 | ) | |
Swap Contracts | | | — | | | | (12,630,592 | ) | | | — | | | | (12,630,592 | ) | |
Total | | | 592,261,329 | | | | 3,524,381,999 | | | | 50,462,292 | | | | 4,167,105,620 | | |
See the Portfolio of Investments for all investment classifications not indicated in the table.
The Fund's assets assigned to the Level 2 input category are generally valued using the market approach, in which a security's value is determined through reference to prices and information from market transactions for similar or identical assets.
There were no transfers of financial assets between Levels 1 and 2 during the period.
Derivative instruments are valued at unrealized appreciation (depreciation).
The following table is a reconciliation of Level 3 assets for which significant observable and/or unobservable inputs were used to determine fair value.
| | | Corporate
Bonds &
Notes ($) | | Residential
Mortgage-
Backed
Securities —
Non-Agency ($) | | Commercial
Mortgage-
Backed
Securities —
Non-Agency ($) | | Asset-Backed
Securities —
Non-Agency ($) | | Senior
Loans ($) | | Total ($) | |
Balance as of April 30, 2013 | | | 2,224,862 | | | | 75,218,231 | | | | 21,938,320 | | | | 184,702,709 | | | | 476,370 | | | | 284,560,492 | | |
Accrued discounts/premiums | | | — | | | | 21,844 | | | | — | | | | — | | | | 1,396 | | | | 23,240 | | |
Realized gain (loss) | | | 14,888 | | | | 70,704 | | | | — | | | | — | | | | 7,456 | | | | 93,048 | | |
Change in unrealized
appreciation (depreciation)(a) | | | (14,888 | ) | | | 82,477 | | | | (32,725 | ) | | | — | | | | (11,611 | ) | | | 23,253 | | |
Sales | | | (814,475 | ) | | | (15,062,361 | ) | | | (2,470,835 | ) | | | — | | | | (474,000 | ) | | | (18,821,671 | ) | |
Purchases | | | — | | | | 4,385,663 | | | | 9,475,000 | | | | — | | | | 146,520 | | | | 14,007,183 | | |
Transfers into Level 3 | | | — | | | | — | | | | — | | | | — | | | | 606,156 | | | | 606,156 | | |
Transfers out of Level 3 | | | — | | | | (35,565,861 | ) | | | (9,760,839 | ) | | | (184,702,709 | ) | | | — | | | | (230,029,409 | ) | |
Balance as of April 30, 2014 | | | 1,410,387 | | | | 29,150,697 | | | | 19,148,921 | | | | — | | | | 752,287 | | | | 50,462,292 | | |
(a) Change in unrealized appreciation (depreciation) relating to securities held at April 30, 2014 was $99,723, which is comprised of Corporate Bonds & Notes of $(14,888), Residential Mortgage-Backed Securities — Non-Agency of $148,253, Commercial Mortgage-Backed Securities — Non-Agency of $(32,725) and Senior Loans of $(917).
The Fund's assets assigned to the Level 3 category are valued utilizing the valuation technique deemed the most appropriate in the circumstances.
Certain corporate bonds classified as Level 3 are valued using a market approach. To determine fair value for these securities, management considered various factors which may have included, but were not limited to, trades of similar securities, estimated earnings of the respective company, market multiples derived from a set of comparable companies, and the position of the security within the respective company's capital structure. Significant increases (decreases) to any of these inputs would result in a significantly lower (higher) fair value measurement. Generally, a change estimated earnings of the respective company might result in change to the comparable companies and market multiples.
The accompanying Notes to Financial Statements are an integral part of this statement.
Annual Report 2014
34
Columbia Intermediate Bond Fund
Portfolio of Investments (continued)
April 30, 2014
Fair Value Measurements (continued)
Certain residential and commercial backed securities as well as senior loans classified as Level 3 securities are valued using the market approach and utilize single market quotations from broker dealers which may have included, but not limited to, the distressed nature of the security and observable transactions for similar assets in the market. Significant increases (decreases) to any of these inputs would result in a significantly lower (higher) fair value measurement.
Other residential mortgage backed securities classified as Level 3 are valued using a market approach. To determine fair value for these securities, management considered various factors which may have included, but were not limited to, estimated cash flows of the securities and observed yields on securities management deemed comparable. Significant increases (decreases) to any of these inputs would result in a significantly lower (higher) fair value measurement. Generally, a change in observable yields on comparable securities would result in a directionally similar change to discount rates.
Financial assets were transferred from Level 3 to Level 2 as observable market inputs were utilized and management's determination that there was sufficient, reliable and observable market data to value these assets as of period end.
Financial Assets were transferred from Level 2 to Level 3 due to utilizing a single market quotation from a broker dealer. As a result, as of period end, management determined to value the security(s) under consistently applied procedures established by and under the general supervision of the Board of Trustees.
Transfers in and/or out of Level 3 are determined based on the fair value at the beginning of the period for security positions held throughout the period.
The accompanying Notes to Financial Statements are an integral part of this statement.
Annual Report 2014
35
Columbia Intermediate Bond Fund
Statement of Assets and Liabilities
April 30, 2014
Assets | |
Investments, at value | |
Unaffiliated issuers (identified cost $4,081,414,294) | | $ | 4,139,535,042 | | |
Affiliated issuers (identified cost $45,506,877) | | | 45,506,877 | | |
Total investments (identified cost $4,126,921,171) | | | 4,185,041,919 | | |
Foreign currency (identified cost $157,957) | | | 152,540 | | |
Unrealized appreciation on swap contracts | | | 28,992 | | |
Premiums paid on outstanding swap contracts | | | 8,913,570 | | |
Receivable for: | |
Investments sold | | | 194,747,568 | | |
Investments sold on a delayed delivery basis | | | 14,604,442 | | |
Capital shares sold | | | 8,296,494 | | |
Dividends | | | 416,218 | | |
Interest | | | 28,184,205 | | |
Reclaims | | | 1,264 | | |
Variation margin | | | 609,958 | | |
Expense reimbursement due from Investment Manager | | | 5,760 | | |
Prepaid expenses | | | 13,026 | | |
Trustees' deferred compensation plan | | | 159,075 | | |
Other assets | | | 313,469 | | |
Total assets | | | 4,441,488,500 | | |
Liabilities | |
Disbursements in excess of cash | | | 58,628 | | |
Unrealized depreciation on swap contracts | | | 8,212,142 | | |
Premiums received on outstanding swap contracts | | | 5,772,022 | | |
Payable for: | |
Investments purchased | | | 87,756,349 | | |
Investments purchased on a delayed delivery basis | | | 335,638,577 | | |
Capital shares purchased | | | 5,462,520 | | |
Dividend distributions to shareholders | | | 8,378,498 | | |
Variation margin | | | 1,679,299 | | |
Investment management fees | | | 44,972 | | |
Distribution and/or service fees | | | 15,608 | | |
Transfer agent fees | | | 459,525 | | |
Administration fees | | | 6,478 | | |
Plan administration fees | | | 97 | | |
Compensation of board members | | | 149,156 | | |
Chief compliance officer expenses | | | 264 | | |
Other expenses | | | 233,356 | | |
Trustees' deferred compensation plan | | | 159,075 | | |
Total liabilities | | | 454,026,566 | | |
Net assets applicable to outstanding capital stock | | $ | 3,987,461,934 | | |
Represented by | |
Paid-in capital | | $ | 3,970,713,537 | | |
Undistributed net investment income | | | 9,215,512 | | |
Accumulated net realized loss | | | (31,041,622 | ) | |
Unrealized appreciation (depreciation) on: | |
Investments | | | 58,120,748 | | |
Foreign currency translations | | | (5,417 | ) | |
Futures contracts | | | (5,668,805 | ) | |
Swap contracts | | | (13,872,019 | ) | |
Total — representing net assets applicable to outstanding capital stock | | $ | 3,987,461,934 | | |
The accompanying Notes to Financial Statements are an integral part of this statement.
Annual Report 2014
36
Columbia Intermediate Bond Fund
Statement of Assets and Liabilities (continued)
April 30, 2014
Class A | |
Net assets | | $ | 1,473,961,370 | | |
Shares outstanding | | | 161,072,264 | | |
Net asset value per share | | $ | 9.15 | | |
Maximum offering price per share(a) | | $ | 9.46 | | |
Class B | |
Net assets | | $ | 18,975,559 | | |
Shares outstanding | | | 2,073,521 | | |
Net asset value per share | | $ | 9.15 | | |
Class C | |
Net assets | | $ | 64,738,648 | | |
Shares outstanding | | | 7,074,844 | | |
Net asset value per share | | $ | 9.15 | | |
Class I | |
Net assets | | $ | 576,729,103 | | |
Shares outstanding | | | 62,948,608 | | |
Net asset value per share | | $ | 9.16 | | |
Class K | |
Net assets | | $ | 14,167,597 | | |
Shares outstanding | | | 1,548,789 | | |
Net asset value per share | | $ | 9.15 | | |
Class R | |
Net assets | | $ | 2,750,099 | | |
Shares outstanding | | | 300,467 | | |
Net asset value per share | | $ | 9.15 | | |
Class R4 | |
Net assets | | $ | 7,477,235 | | |
Shares outstanding | | | 818,246 | | |
Net asset value per share | | $ | 9.14 | | |
Class R5 | |
Net assets | | $ | 15,980,217 | | |
Shares outstanding | | | 1,748,193 | | |
Net asset value per share | | $ | 9.14 | | |
Class W | |
Net assets | | $ | 507,418,803 | | |
Shares outstanding | | | 55,394,723 | | |
Net asset value per share | | $ | 9.16 | | |
Class Y | |
Net assets | | $ | 15,642,063 | | |
Shares outstanding | | | 1,708,139 | | |
Net asset value per share | | $ | 9.16 | | |
Class Z | |
Net assets | | $ | 1,289,621,240 | | |
Shares outstanding | | | 140,887,261 | | |
Net asset value per share | | $ | 9.15 | | |
(a) The maximum offering price per share is calculated by dividing the net asset value per share by 1.0 minus the maximum sales charge of 3.25%.
The accompanying Notes to Financial Statements are an integral part of this statement.
Annual Report 2014
37
Columbia Intermediate Bond Fund
Statement of Operations
Year Ended April 30, 2014
Net investment income | |
Income: | |
Dividends — unaffiliated issuers | | $ | 8,226,436 | | |
Dividends — affiliated issuers | | | 70,115 | | |
Interest | | | 153,579,471 | | |
Total income | | | 161,876,022 | | |
Expenses: | |
Investment management fees | | | 18,867,679 | | |
Distribution and/or service fees | |
Class A | | | 4,330,030 | | |
Class B | | | 279,304 | | |
Class C | | | 764,331 | | |
Class R | | | 13,927 | | |
Class W | | | 1,629,174 | | |
Transfer agent fees | |
Class A | | | 2,809,456 | | |
Class B | | | 45,367 | | |
Class C | | | 123,991 | | |
Class K | | | 118 | | |
Class R | | | 4,517 | | |
Class R4 | | | 5,134 | | |
Class R5 | | | 29 | | |
Class W | | | 1,055,836 | | |
Class Z | | | 2,430,520 | | |
Administration fees | | | 2,670,960 | | |
Plan administration fees | |
Class K | | | 88,871 | | |
Compensation of board members | | | 148,330 | | |
Custodian fees | | | 122,227 | | |
Printing and postage fees | | | 507,831 | | |
Registration fees | | | 311,053 | | |
Professional fees | | | 190,878 | | |
Chief compliance officer expenses | | | 2,640 | | |
Other | | | 62,341 | | |
Total expenses | | | 36,464,544 | | |
Fees waived or expenses reimbursed by Investment Manager and its affiliates | | | (2,408,094 | ) | |
Fees waived by Distributor — Class C | | | (114,650 | ) | |
Expense reductions | | | (4,119 | ) | |
Total net expenses | | | 33,937,681 | | |
Net investment income | | | 127,938,341 | | |
Realized and unrealized gain (loss) — net | |
Net realized gain (loss) on: | |
Investments | | | (9,239,809 | ) | |
Futures contracts | | | 15,642,341 | | |
Swap contracts | | | (32,283,523 | ) | |
Net realized loss | | | (25,880,991 | ) | |
Net change in unrealized appreciation (depreciation) on: | |
Investments | | | (177,736,226 | ) | |
Foreign currency translations | | | (11,815 | ) | |
Futures contracts | | | 13,795,707 | | |
Swap contracts | | | (2,410,477 | ) | |
Net change in unrealized appreciation (depreciation) | | | (166,362,811 | ) | |
Net realized and unrealized loss | | | (192,243,802 | ) | |
Net decrease in net assets from operations | | $ | (64,305,461 | ) | |
The accompanying Notes to Financial Statements are an integral part of this statement.
Annual Report 2014
38
Columbia Intermediate Bond Fund
Statement of Changes in Net Assets
| | | Year Ended
April 30,
2014 | | Year Ended
April 30,
2013(a)(b) | |
Operations | |
Net investment income | | $ | 127,938,341 | | | $ | 102,122,344 | | |
Net realized gain (loss) | | | (25,880,991 | ) | | | 78,594,468 | | |
Net change in unrealized appreciation (depreciation) | | | (166,362,811 | ) | | | 21,638,692 | | |
Net increase (decrease) in net assets resulting from operations | | | (64,305,461 | ) | | | 202,355,504 | | |
Distributions to shareholders | |
Net investment income | |
Class A | | | (40,739,484 | ) | | | (16,679,237 | ) | |
Class B | | | (445,171 | ) | | | (193,638 | ) | |
Class C | | | (1,342,583 | ) | | | (944,798 | ) | |
Class I | | | (15,068,564 | ) | | | (5,713,462 | ) | |
Class K | | | (842,602 | ) | | | (253,776 | ) | |
Class R | | | (58,721 | ) | | | (68,280 | ) | |
Class R4 | | | (85,389 | ) | | | (113 | ) | |
Class R5 | | | (144,327 | ) | | | (785 | ) | |
Class W | | | (15,347,641 | ) | | | (2,433,731 | ) | |
Class Y | | | (125,763 | ) | | | (33 | ) | |
Class Z | | | (38,899,879 | ) | | | (68,260,950 | ) | |
Net realized gains | |
Class A | | | (11,017,282 | ) | | | (6,509,133 | ) | |
Class B | | | (164,295 | ) | | | (77,797 | ) | |
Class C | | | (477,323 | ) | | | (589,734 | ) | |
Class I | | | (3,995,804 | ) | | | (3,021,955 | ) | |
Class K | | | (99,875 | ) | | | — | | |
Class R | | | (17,357 | ) | | | (41,497 | ) | |
Class R4 | | | (35,378 | ) | | | (39 | ) | |
Class R5 | | | (14,933 | ) | | | (39 | ) | |
Class W | | | (4,003,950 | ) | | | (41 | ) | |
Class Y | | | (8,375 | ) | | | (39 | ) | |
Class Z | | | (9,359,385 | ) | | | (34,488,627 | ) | |
Total distributions to shareholders | | | (142,294,081 | ) | | | (139,277,704 | ) | |
Increase (decrease) in net assets from capital stock activity | | | (1,319,230,161 | ) | | | 2,081,434,307 | | |
Total increase (decrease) in net assets | | | (1,525,829,703 | ) | | | 2,144,512,107 | | |
Net assets at beginning of year | | | 5,513,291,637 | | | | 3,368,779,530 | | |
Net assets at end of year | | $ | 3,987,461,934 | | | $ | 5,513,291,637 | | |
Undistributed net investment income | | $ | 9,215,512 | | | $ | 10,372,424 | | |
(a) Class R4, Class R5 and Class Y shares are for the period from November 8, 2012 (commencement of operations) to April 30, 2013.
(b) Class K shares are for the period from February 28, 2013 (commencement of operations) to April 30, 2013.
The accompanying Notes to Financial Statements are an integral part of this statement.
Annual Report 2014
39
Columbia Intermediate Bond Fund
Statement of Changes in Net Assets (continued)
| | | Year Ended April 30, 2014 | | Year Ended April 30, 2013(a)(b) | |
| | | Shares | | Dollars ($) | | Shares | | Dollars ($) | |
Capital stock activity | |
Class A shares | |
Subscriptions(c) | | | 17,375,229 | | | | 158,612,227 | | | | 24,283,504 | | | | 230,763,450 | | |
Fund merger | | | — | | | | — | | | | 198,219,171 | | | | 1,862,923,968 | | |
Distributions reinvested | | | 5,187,074 | | | | 47,080,179 | | | | 2,261,290 | | | | 21,439,614 | | |
Redemptions | | | (89,952,046 | ) | | | (820,216,743 | ) | | | (33,830,244 | ) | | | (320,361,795 | ) | |
Net increase (decrease) | | | (67,389,743 | ) | | | (614,524,337 | ) | | | 190,933,721 | | | | 1,794,765,237 | | |
Class B shares | |
Subscriptions | | | 63,827 | | | | 584,800 | | | | 54,844 | | | | 521,307 | | |
Fund merger | | | — | | | | — | | | | 4,174,593 | | | | 39,221,455 | | |
Distributions reinvested | | | 61,452 | | | | 557,755 | | | | 18,059 | | | | 171,101 | | |
Redemptions(c) | | | (2,472,423 | ) | | | (22,491,264 | ) | | | (474,566 | ) | | | (4,494,681 | ) | |
Net increase (decrease) | | | (2,347,144 | ) | | | (21,348,709 | ) | | | 3,772,930 | | | | 35,419,182 | | |
Class C shares | |
Subscriptions | | | 531,941 | | | | 4,853,124 | | | | 913,847 | | | | 8,674,820 | | |
Fund merger | | | — | | | | — | | | | 6,533,646 | | | | 61,397,806 | | |
Distributions reinvested | | | 168,764 | | | | 1,530,941 | | | | 117,809 | | | | 1,117,090 | | |
Redemptions | | | (3,715,115 | ) | | | (33,798,697 | ) | | | (1,266,074 | ) | | | (11,981,160 | ) | |
Net increase (decrease) | | | (3,014,410 | ) | | | (27,414,632 | ) | | | 6,299,228 | | | | 59,208,556 | | |
Class I shares | |
Subscriptions | | | 28,692,029 | | | | 263,749,900 | | | | 30,024,422 | | | | 285,095,553 | | |
Fund merger | | | — | | | | — | | | | 24,395,358 | | | | 229,375,037 | | |
Distributions reinvested | | | 2,098,890 | | | | 19,064,084 | | | | 919,952 | | | | 8,735,796 | | |
Redemptions | | | (16,256,795 | ) | | | (147,289,164 | ) | | | (16,541,570 | ) | | | (157,602,196 | ) | |
Net increase | | | 14,534,124 | | | | 135,524,820 | | | | 38,798,162 | | | | 365,604,190 | | |
Class K shares | |
Subscriptions | | | 1,007,369 | | | | 9,206,796 | | | | 256,909 | | | | 2,425,527 | | |
Fund merger | | | — | | | | — | | | | 8,041,771 | | | | 75,638,161 | | |
Distributions reinvested | | | 103,467 | | | | 942,132 | | | | 26,819 | | | | 253,757 | | |
Redemptions | | | (7,546,039 | ) | | | (68,053,036 | ) | | | (341,507 | ) | | | (3,225,675 | ) | |
Net increase (decrease) | | | (6,435,203 | ) | | | (57,904,108 | ) | | | 7,983,992 | | | | 75,091,770 | | |
Class R shares | |
Subscriptions | | | 85,928 | | | | 786,327 | | | | 96,458 | | | | 912,848 | | |
Fund merger | | | — | | | | — | | | | 22,650 | | | | 212,706 | | |
Distributions reinvested | | | 7,454 | | | | 67,653 | | | | 10,356 | | | | 98,218 | | |
Redemptions | | | (114,434 | ) | | | (1,037,804 | ) | | | (88,162 | ) | | | (833,337 | ) | |
Net increase (decrease) | | | (21,052 | ) | | | (183,824 | ) | | | 41,302 | | | | 390,435 | | |
The accompanying Notes to Financial Statements are an integral part of this statement.
Annual Report 2014
40
Columbia Intermediate Bond Fund
Statement of Changes in Net Assets (continued)
| | | Year Ended April 30, 2014 | | Year Ended April 30, 2013(a)(b) | |
| | | Shares | | Dollars ($) | | Shares | | Dollars ($) | |
Capital stock activity (continued) | |
Class R4 shares | |
Subscriptions | | | 943,748 | | | | 8,593,631 | | | | 4,681 | | | | 44,354 | | |
Fund merger | | | — | | | | — | | | | 1,369 | | | | 12,868 | | |
Distributions reinvested | | | 12,681 | | | | 114,647 | | | | 5 | | | | 44 | | |
Redemptions | | | (144,238 | ) | | | (1,305,075 | ) | | | — | | | | — | | |
Net increase | | | 812,191 | | | | 7,403,203 | | | | 6,055 | | | | 57,266 | | |
Class R5 shares | |
Subscriptions | | | 1,729,684 | | | | 15,615,329 | | | | 15,035 | | | | 142,470 | | |
Fund merger | | | — | | | | — | | | | 18,399 | | | | 172,776 | | |
Distributions reinvested | | | 17,493 | | | | 158,806 | | | | 76 | | | | 715 | | |
Redemptions | | | (32,481 | ) | | | (294,654 | ) | | | (13 | ) | | | (116 | ) | |
Net increase | | | 1,714,696 | | | | 15,479,481 | | | | 33,497 | | | | 315,845 | | |
Class W shares | |
Subscriptions | | | 17,583,240 | | | | 160,554,849 | | | | 2,414,231 | | | | 22,831,790 | | |
Fund merger | | | — | | | | — | | | | 78,413,367 | | | | 737,730,049 | | |
Distributions reinvested | | | 2,129,690 | | | | 19,351,220 | | | | 256,929 | | | | 2,433,607 | | |
Redemptions | | | (43,566,322 | ) | | | (396,212,322 | ) | | | (1,836,686 | ) | | | (17,370,540 | ) | |
Net increase (decrease) | | | (23,853,392 | ) | | | (216,306,253 | ) | | | 79,247,841 | | | | 745,624,906 | | |
Class Y shares | |
Subscriptions | | | 1,972,134 | | | | 17,785,353 | | | | 258 | | | | 2,500 | | |
Distributions reinvested | | | 14,729 | | | | 134,037 | | | | 1 | | | | 6 | | |
Redemptions | | | (278,983 | ) | | | (2,533,789 | ) | | | — | | | | — | | |
Net increase | | | 1,707,880 | | | | 15,385,601 | | | | 259 | | | | 2,506 | | |
Class Z shares | |
Subscriptions | | | 11,023,731 | | | | 100,585,369 | | | | 42,069,487 | | | | 398,912,686 | | |
Fund merger | | | — | | | | — | | | | 443,605 | | | | 4,172,784 | | |
Distributions reinvested | | | 2,027,629 | | | | 18,410,964 | | | | 3,513,181 | | | | 33,328,559 | | |
Redemptions | | | (73,950,227 | ) | | | (674,337,736 | ) | | | (151,186,189 | ) | | | (1,431,459,615 | ) | |
Net decrease | | | (60,898,867 | ) | | | (555,341,403 | ) | | | (105,159,916 | ) | | | (995,045,586 | ) | |
Total net increase (decrease) | | | (145,190,920 | ) | | | (1,319,230,161 | ) | | | 221,957,071 | | | | 2,081,434,307 | | |
(a) Class R4, Class R5 and Class Y shares are for the period from November 8, 2012 (commencement of operations) to April 30, 2013.
(b) Class K shares are for the period from February 28, 2013 (commencement of operations) to April 30, 2013.
(c) Includes conversions of Class B shares to Class A shares, if any.
The accompanying Notes to Financial Statements are an integral part of this statement.
Annual Report 2014
41
Columbia Intermediate Bond Fund
The following tables are intended to help you understand the Fund's financial performance. Certain information reflects financial results for a single share of a class held for the periods shown. Per share net investment income (loss) amounts are calculated based on average shares outstanding during the period. Total return assumes reinvestment of all dividends and distributions, if any. Total return does not reflect payment of sales charges, if any, and is not annualized for periods of less than one year.
| | | Year Ended April 30, | | Year Ended March 31, | |
Class A | | 2014 | | 2013 | | 2012(a) | | 2012 | | 2011 | | 2010 | |
Per share data | |
Net asset value, beginning of period | | $ | 9.49 | | | $ | 9.39 | | | $ | 9.33 | | | $ | 9.08 | | | $ | 8.95 | | | $ | 7.72 | | |
Income from investment operations: | |
Net investment income | | | 0.24 | | | | 0.28 | | | | 0.03 | | | | 0.33 | | | | 0.36 | | | | 0.43 | | |
Net realized and unrealized gain (loss) | | | (0.31 | ) | | | 0.23 | | | | 0.05 | | | | 0.28 | | | | 0.15 | | | | 1.26 | | |
Total from investment operations | | | (0.07 | ) | | | 0.51 | | | | 0.08 | | | | 0.61 | | | | 0.51 | | | | 1.69 | | |
Less distributions to shareholders: | |
Net investment income | | | (0.21 | ) | | | (0.26 | ) | | | (0.02 | ) | | | (0.36 | ) | | | (0.38 | ) | | | (0.46 | ) | |
Net realized gains | | | (0.06 | ) | | | (0.15 | ) | | | — | | | | — | | | | — | | | | — | | |
Total distributions to shareholders | | | (0.27 | ) | | | (0.41 | ) | | | (0.02 | ) | | | (0.36 | ) | | | (0.38 | ) | | | (0.46 | ) | |
Proceeds from regulatory settlements | | | — | | | | — | | | | — | | | | 0.00 | (b) | | | — | | | | 0.00 | (b) | |
Net asset value, end of period | | $ | 9.15 | | | $ | 9.49 | | | $ | 9.39 | | | $ | 9.33 | | | $ | 9.08 | | | $ | 8.95 | | |
Total return | | | (0.62 | %) | | | 5.52 | % | | | 0.91 | % | | | 6.82 | % | | | 5.80 | % | | | 22.31 | % | |
Ratios to average net assets(c) | |
Total gross expenses | | | 0.91 | % | | | 0.94 | % | | | 0.96 | %(d) | | | 0.95 | %(e) | | | 0.97 | %(e) | | | 1.00 | %(e) | |
Total net expenses(f) | | | 0.85 | %(g) | | | 0.86 | %(g) | | | 0.84 | %(d) | | | 0.84 | %(e)(g) | | | 0.92 | %(e)(g) | | | 0.90 | %(e)(g) | |
Net investment income | | | 2.67 | % | | | 2.94 | % | | | 3.35 | %(d) | | | 3.62 | % | | | 4.02 | % | | | 5.01 | % | |
Supplemental data | |
Net assets, end of period (in thousands) | | $ | 1,473,961 | | | $ | 2,168,079 | | | $ | 352,338 | | | $ | 338,578 | | | $ | 201,506 | | | $ | 163,333 | | |
Portfolio turnover | | | 274 | %(h) | | | 239 | %(h) | | | 10 | %(h) | | | 170 | %(h) | | | 177 | % | | | 160 | % | |
Notes to Financial Highlights
(a) For the period from April 1, 2012 to April 30, 2012. During the period, the Fund's fiscal year end was changed from March 31 to April 30.
(b) Rounds to zero.
(c) In addition to the fees and expenses which the Fund bears directly, the Fund indirectly bears a pro rata share of the fees and expenses of the acquired funds in which it invests. Such indirect expenses are not included in the reported expense ratios.
(d) Annualized.
(e) Ratios include line of credit interest expense which rounds to less than 0.01%.
(f) Total net expenses include the impact of certain waivers/reimbursements made by the Investment Manager and certain of its affiliates, if applicable.
(g) The benefits derived from expense reductions had an impact of less than 0.01%.
(h) Includes mortgage dollar rolls. If mortgage dollar roll transactions were excluded, the portfolio turnover would have been 191%, 205%, 9% and 157% for the years ended April 30, 2014, 2013, 2012 and March 31, 2012, respectively.
The accompanying Notes to Financial Statements are an integral part of this statement.
Annual Report 2014
42
Columbia Intermediate Bond Fund
Financial Highlights (continued)
| | | Year Ended April 30, | | Year Ended March 31, | |
Class B | | 2014 | | 2013 | | 2012(a) | | 2012 | | 2011 | | 2010 | |
Per share data | |
Net asset value, beginning of period | | $ | 9.49 | | | $ | 9.39 | | | $ | 9.33 | | | $ | 9.08 | | | $ | 8.95 | | | $ | 7.72 | | |
Income from investment operations: | |
Net investment income | | | 0.17 | | | | 0.21 | | | | 0.02 | | | | 0.27 | | | | 0.30 | | | | 0.37 | | |
Net realized and unrealized gain (loss) | | | (0.30 | ) | | | 0.23 | | | | 0.06 | | | | 0.27 | | | | 0.15 | | | | 1.26 | | |
Total from investment operations | | | (0.13 | ) | | | 0.44 | | | | 0.08 | | | | 0.54 | | | | 0.45 | | | | 1.63 | | |
Less distributions to shareholders: | |
Net investment income | | | (0.15 | ) | | | (0.19 | ) | | | (0.02 | ) | | | (0.29 | ) | | | (0.32 | ) | | | (0.40 | ) | |
Net realized gains | | | (0.06 | ) | | | (0.15 | ) | | | — | | | | — | | | | — | | | | — | | |
Total distributions to shareholders | | | (0.21 | ) | | | (0.34 | ) | | | (0.02 | ) | | | (0.29 | ) | | | (0.32 | ) | | | (0.40 | ) | |
Proceeds from regulatory settlements | | | — | | | | — | | | | — | | | | 0.00 | (b) | | | — | | | | 0.00 | (b) | |
Net asset value, end of period | | $ | 9.15 | | | $ | 9.49 | | | $ | 9.39 | | | $ | 9.33 | | | $ | 9.08 | | | $ | 8.95 | | |
Total return | | | (1.36 | %) | | | 4.74 | % | | | 0.85 | % | | | 6.01 | % | | | 5.03 | % | | | 21.41 | % | |
Ratios to average net assets(c) | |
Total gross expenses | | | 1.66 | % | | | 1.69 | % | | | 1.71 | %(d) | | | 1.72 | %(e) | | | 1.68 | %(e) | | | 1.65 | %(e) | |
Total net expenses(f) | | | 1.60 | %(g) | | | 1.61 | %(g) | | | 1.59 | %(d) | | | 1.59 | %(e)(g) | | | 1.67 | %(e)(g) | | | 1.65 | %(e)(g) | |
Net investment income | | | 1.90 | % | | | 2.20 | % | | | 2.59 | %(d) | | | 2.93 | % | | | 3.32 | % | | | 4.29 | % | |
Supplemental data | |
Net assets, end of period (in thousands) | | $ | 18,976 | | | $ | 41,955 | | | $ | 6,081 | | | $ | 6,253 | | | $ | 14,779 | | | $ | 31,476 | | |
Portfolio turnover | | | 274 | %(h) | | | 239 | %(h) | | | 10 | %(h) | | | 170 | %(h) | | | 177 | % | | | 160 | % | |
Notes to Financial Highlights
(a) For the period from April 1, 2012 to April 30, 2012. During the period, the Fund's fiscal year end was changed from March 31 to April 30.
(b) Rounds to zero.
(c) In addition to the fees and expenses which the Fund bears directly, the Fund indirectly bears a pro rata share of the fees and expenses of the acquired funds in which it invests. Such indirect expenses are not included in the reported expense ratios.
(d) Annualized.
(e) Ratios include line of credit interest expense which rounds to less than 0.01%.
(f) Total net expenses include the impact of certain waivers/reimbursements made by the Investment Manager and certain of its affiliates, if applicable.
(g) The benefits derived from expense reductions had an impact of less than 0.01%.
(h) Includes mortgage dollar rolls. If mortgage dollar roll transactions were excluded, the portfolio turnover would have been 191%, 205%, 9% and 157% for the years ended April 30, 2014, 2013, 2012 and March 31, 2012, respectively.
The accompanying Notes to Financial Statements are an integral part of this statement.
Annual Report 2014
43
Columbia Intermediate Bond Fund
Financial Highlights (continued)
| | | Year Ended April 30, | | Year Ended March 31, | |
Class C | | 2014 | | 2013 | | 2012(a) | | 2012 | | 2011 | | 2010 | |
Per share data | |
Net asset value, beginning of period | | $ | 9.49 | | | $ | 9.39 | | | $ | 9.33 | | | $ | 9.08 | | | $ | 8.95 | | | $ | 7.72 | | |
Income from investment operations: | |
Net investment income | | | 0.19 | | | | 0.22 | | | | 0.02 | | | | 0.28 | | | | 0.31 | | | | 0.38 | | |
Net realized and unrealized gain (loss) | | | (0.31 | ) | | | 0.23 | | | | 0.06 | | | | 0.28 | | | | 0.15 | | | | 1.26 | | |
Total from investment operations | | | (0.12 | ) | | | 0.45 | | | | 0.08 | | | | 0.56 | | | | 0.46 | | | | 1.64 | | |
Less distributions to shareholders: | |
Net investment income | | | (0.16 | ) | | | (0.20 | ) | | | (0.02 | ) | | | (0.31 | ) | | | (0.33 | ) | | | (0.41 | ) | |
Net realized gains | | | (0.06 | ) | | | (0.15 | ) | | | — | | | | — | | | | — | | | | — | | |
Total distributions to shareholders | | | (0.22 | ) | | | (0.35 | ) | | | (0.02 | ) | | | (0.31 | ) | | | (0.33 | ) | | | (0.41 | ) | |
Proceeds from regulatory settlements | | | — | | | | — | | | | — | | | | 0.00 | (b) | | | — | | | | 0.00 | (b) | |
Net asset value, end of period | | $ | 9.15 | | | $ | 9.49 | | | $ | 9.39 | | | $ | 9.33 | | | $ | 9.08 | | | $ | 8.95 | | |
Total return | | | (1.21 | %) | | | 4.90 | % | | | 0.86 | % | | | 6.20 | % | | | 5.17 | % | | | 21.59 | % | |
Ratios to average net assets(c) | |
Total gross expenses | | | 1.66 | % | | | 1.69 | % | | | 1.71 | %(d) | | | 1.70 | %(e) | | | 1.68 | %(e) | | | 1.65 | %(e) | |
Total net expenses(f) | | | 1.45 | %(g) | | | 1.46 | %(g) | | | 1.44 | %(d) | | | 1.44 | %(e)(g) | | | 1.52 | %(e)(g) | | | 1.50 | %(e)(g) | |
Net investment income | | | 2.07 | % | | | 2.37 | % | | | 2.75 | %(d) | | | 3.04 | % | | | 3.42 | % | | | 4.43 | % | |
Supplemental data | |
Net assets, end of period (in thousands) | | $ | 64,739 | | | $ | 95,745 | | | $ | 35,579 | | | $ | 35,304 | | | $ | 33,885 | | | $ | 30,731 | | |
Portfolio turnover | | | 274 | %(h) | | | 239 | %(h) | | | 10 | %(h) | | | 170 | %(h) | | | 177 | % | | | 160 | % | |
Notes to Financial Highlights
(a) For the period from April 1, 2012 to April 30, 2012. During the period, the Fund's fiscal year end was changed from March 31 to April 30.
(b) Rounds to zero.
(c) In addition to the fees and expenses which the Fund bears directly, the Fund indirectly bears a pro rata share of the fees and expenses of the acquired funds in which it invests. Such indirect expenses are not included in the reported expense ratios.
(d) Annualized.
(e) Ratios include line of credit interest expense which rounds to less than 0.01%.
(f) Total net expenses include the impact of certain waivers/reimbursements made by the Investment Manager and certain of its affiliates, if applicable.
(g) The benefits derived from expense reductions had an impact of less than 0.01%.
(h) Includes mortgage dollar rolls. If mortgage dollar roll transactions were excluded, the portfolio turnover would have been 191%, 205%, 9% and 157% for the years ended April 30, 2014, 2013, 2012 and March 31, 2012, respectively.
The accompanying Notes to Financial Statements are an integral part of this statement.
Annual Report 2014
44
Columbia Intermediate Bond Fund
Financial Highlights (continued)
| | | Year Ended April 30, | | Year Ended March 31, | |
Class I | | 2014 | | 2013 | | 2012(a) | | 2012 | | 2011(b) | |
Per share data | |
Net asset value, beginning of period | | $ | 9.50 | | | $ | 9.39 | | | $ | 9.33 | | | $ | 9.08 | | | $ | 9.21 | | |
Income from investment operations: | |
Net investment income | | | 0.28 | | | | 0.31 | | | | 0.03 | | | | 0.37 | | | | 0.19 | | |
Net realized and unrealized gain (loss) | | | (0.31 | ) | | | 0.24 | | | | 0.06 | | | | 0.27 | | | | (0.11 | ) | |
Total from investment operations | | | (0.03 | ) | | | 0.55 | | | | 0.09 | | | | 0.64 | | | | 0.08 | | |
Less distributions to shareholders: | |
Net investment income | | | (0.25 | ) | | | (0.29 | ) | | | (0.03 | ) | | | (0.39 | ) | | | (0.21 | ) | |
Net realized gains | | | (0.06 | ) | | | (0.15 | ) | | | — | | | | — | | | | — | | |
Total distributions to shareholders | | | (0.31 | ) | | | (0.44 | ) | | | (0.03 | ) | | | (0.39 | ) | | | (0.21 | ) | |
Proceeds from regulatory settlements | | | — | | | | — | | | | — | | | | 0.00 | (c) | | | — | | |
Net asset value, end of period | | $ | 9.16 | | | $ | 9.50 | | | $ | 9.39 | | | $ | 9.33 | | | $ | 9.08 | | |
Total return | | | (0.27 | %) | | | 6.00 | % | | | 0.94 | % | | | 7.17 | % | | | 0.87 | % | |
Ratios to average net assets(d) | |
Total gross expenses | | | 0.50 | % | | | 0.50 | % | | | 0.52 | %(e) | | | 0.51 | %(f) | | | 0.53 | %(e)(f) | |
Total net expenses(g) | | | 0.50 | % | | | 0.50 | % | | | 0.52 | %(e) | | | 0.51 | %(f)(h) | | | 0.52 | %(e)(f)(h) | |
Net investment income | | | 3.05 | % | | | 3.31 | % | | | 3.68 | %(e) | | | 4.01 | % | | | 4.05 | %(e) | |
Supplemental data | |
Net assets, end of period (in thousands) | | $ | 576,729 | | | $ | 459,989 | | | $ | 90,345 | | | $ | 86,768 | | | $ | 26,866 | | |
Portfolio turnover | | | 274 | %(i) | | | 239 | %(i) | | | 10 | %(i) | | | 170 | %(i) | | | 177 | % | |
Notes to Financial Highlights
(a) For the period from April 1, 2012 to April 30, 2012. During the period, the Fund's fiscal year end was changed from March 31 to April 30.
(b) For the period from September 27, 2010 (commencement of operations) to March 31, 2011.
(c) Rounds to zero.
(d) In addition to the fees and expenses which the Fund bears directly, the Fund indirectly bears a pro rata share of the fees and expenses of the acquired funds in which it invests. Such indirect expenses are not included in the reported expense ratios.
(e) Annualized.
(f) Ratios include line of credit interest expense which rounds to less than 0.01%.
(g) Total net expenses include the impact of certain waivers/reimbursements made by the Investment Manager and certain of its affiliates, if applicable.
(h) The benefits derived from expense reductions had an impact of less than 0.01%.
(i) Includes mortgage dollar rolls. If mortgage dollar roll transactions were excluded, the portfolio turnover would have been 191%, 205%, 9% and 157% for the years ended April 30, 2014, 2013, 2012 and March 31, 2012, respectively.
The accompanying Notes to Financial Statements are an integral part of this statement.
Annual Report 2014
45
Columbia Intermediate Bond Fund
Financial Highlights (continued)
| | | Year Ended April 30, | |
Class K | | 2014 | | 2013(a) | |
Per share data | |
Net asset value, beginning of period | | $ | 9.49 | | | $ | 9.42 | | |
Income from investment operations: | |
Net investment income | | | 0.25 | | | | 0.05 | | |
Net realized and unrealized gain (loss) | | | (0.31 | ) | | | 0.06 | | |
Total from investment operations | | | (0.06 | ) | | | 0.11 | | |
Less distributions to shareholders: | |
Net investment income | | | (0.22 | ) | | | (0.04 | ) | |
Net realized gains | | | (0.06 | ) | | | — | | |
Total distributions to shareholders | | | (0.28 | ) | | | (0.04 | ) | |
Net asset value, end of period | | $ | 9.15 | | | $ | 9.49 | | |
Total return | | | (0.53 | %) | | | 1.19 | % | |
Ratios to average net assets(b) | |
Total gross expenses | | | 0.74 | % | | | 0.79 | %(c) | |
Total net expenses(d) | | | 0.74 | % | | | 0.79 | %(c) | |
Net investment income | | | 2.67 | % | | | 2.97 | %(c) | |
Supplemental data | |
Net assets, end of period (in thousands) | | $ | 14,168 | | | $ | 75,741 | | |
Portfolio turnover | | | 274 | %(e) | | | 239 | %(e) | |
Notes to Financial Highlights
(a) For the period from February 28, 2013 (commencement of operations) to April 30, 2013.
(b) In addition to the fees and expenses which the Fund bears directly, the Fund indirectly bears a pro rata share of the fees and expenses of the acquired funds in which it invests. Such indirect expenses are not included in the reported expense ratios.
(c) Annualized.
(d) Total net expenses include the impact of certain waivers/reimbursements made by the Investment Manager and certain of its affiliates, if applicable.
(e) Includes mortgage dollar rolls. If mortgage dollar roll transactions were excluded, the portfolio turnover would have been 191% and 205% for the years ended April 30, 2014 and 2013, respectively.
The accompanying Notes to Financial Statements are an integral part of this statement.
Annual Report 2014
46
Columbia Intermediate Bond Fund
Financial Highlights (continued)
| | | Year Ended April 30, | | Year Ended March 31, | |
Class R | | 2014 | | 2013 | | 2012(a) | | 2012 | | 2011 | | 2010 | |
Per share data | |
Net asset value, beginning of period | | $ | 9.49 | | | $ | 9.39 | | | $ | 9.33 | | | $ | 9.08 | | | $ | 8.95 | | | $ | 7.72 | | |
Income from investment operations: | |
Net investment income | | | 0.22 | | | | 0.26 | | | | 0.02 | | | | 0.31 | | | | 0.34 | | | | 0.41 | | |
Net realized and unrealized gain (loss) | | | (0.31 | ) | | | 0.23 | | | | 0.06 | | | | 0.28 | | | | 0.15 | | | | 1.26 | | |
Total from investment operations | | | (0.09 | ) | | | 0.49 | | | | 0.08 | | | | 0.59 | | | | 0.49 | | | | 1.67 | | |
Less distributions to shareholders: | |
Net investment income | | | (0.19 | ) | | | (0.24 | ) | | | (0.02 | ) | | | (0.34 | ) | | | (0.36 | ) | | | (0.44 | ) | |
Net realized gains | | | (0.06 | ) | | | (0.15 | ) | | | — | | | | — | | | | — | | | | — | | |
Total distributions to shareholders | | | (0.25 | ) | | | (0.39 | ) | | | (0.02 | ) | | | (0.34 | ) | | | (0.36 | ) | | | (0.44 | ) | |
Proceeds from regulatory settlements | | | — | | | | — | | | | — | | | | 0.00 | (b) | | | — | | | | 0.00 | (b) | |
Net asset value, end of period | | $ | 9.15 | | | $ | 9.49 | | | $ | 9.39 | | | $ | 9.33 | | | $ | 9.08 | | | $ | 8.95 | | |
Total return | | | (0.87 | %) | | | 5.26 | % | | | 0.89 | % | | | 6.55 | % | | | 5.54 | % | | | 22.01 | % | |
Ratios to average net assets(c) | |
Total gross expenses | | | 1.16 | % | | | 1.20 | % | | | 1.21 | %(d) | | | 1.20 | %(e) | | | 1.18 | %(e) | | | 1.15 | %(e) | |
Total net expenses(f) | | | 1.10 | %(g) | | | 1.12 | %(g) | | | 1.09 | %(d) | | | 1.09 | %(e)(g) | | | 1.17 | %(e)(g) | | | 1.15 | %(e)(g) | |
Net investment income | | | 2.43 | % | | | 2.73 | % | | | 3.08 | %(d) | | | 3.39 | % | | | 3.75 | % | | | 4.78 | % | |
Supplemental data | |
Net assets, end of period (in thousands) | | $ | 2,750 | | | $ | 3,052 | | | $ | 2,631 | | | $ | 2,786 | | | $ | 2,969 | | | $ | 1,694 | | |
Portfolio turnover | | | 274 | %(h) | | | 239 | %(h) | | | 10 | %(h) | | | 170 | %(h) | | | 177 | % | | | 160 | % | |
Notes to Financial Highlights
(a) For the period from April 1, 2012 to April 30, 2012. During the period, the Fund's fiscal year end was changed from March 31 to April 30.
(b) Rounds to zero.
(c) In addition to the fees and expenses which the Fund bears directly, the Fund indirectly bears a pro rata share of the fees and expenses of the acquired funds in which it invests. Such indirect expenses are not included in the reported expense ratios.
(d) Annualized.
(e) Ratios include line of credit interest expense which rounds to less than 0.01%.
(f) Total net expenses include the impact of certain waivers/reimbursements made by the Investment Manager and certain of its affiliates, if applicable.
(g) The benefits derived from expense reductions had an impact of less than 0.01%.
(h) Includes mortgage dollar rolls. If mortgage dollar roll transactions were excluded, the portfolio turnover would have been 191%, 205%, 9% and 157% for the years ended April 30, 2014, 2013, 2012 and March 31, 2012, respectively.
The accompanying Notes to Financial Statements are an integral part of this statement.
Annual Report 2014
47
Columbia Intermediate Bond Fund
Financial Highlights (continued)
| | | Year Ended April 30, | |
Class R4 | | 2014 | | 2013(a) | |
Per share data | |
Net asset value, beginning of period | | $ | 9.48 | | | $ | 9.66 | | |
Income from investment operations: | |
Net investment income | | | 0.27 | | | | 0.14 | | |
Net realized and unrealized loss | | | (0.31 | ) | | | (0.05 | )(b) | |
Total from investment operations | | | (0.04 | ) | | | 0.09 | | |
Less distributions to shareholders: | |
Net investment income | | | (0.24 | ) | | | (0.12 | ) | |
Net realized gains | | | (0.06 | ) | | | (0.15 | ) | |
Total distributions to shareholders | | | (0.30 | ) | | | (0.27 | ) | |
Net asset value, end of period | | $ | 9.14 | | | $ | 9.48 | | |
Total return | | | (0.38 | %) | | | 0.99 | % | |
Ratios to average net assets(c) | |
Total gross expenses | | | 0.67 | % | | | 0.67 | %(d) | |
Total net expenses(e) | | | 0.60 | %(f) | | | 0.60 | %(d) | |
Net investment income | | | 3.02 | % | | | 3.26 | %(d) | |
Supplemental data | |
Net assets, end of period (in thousands) | | $ | 7,477 | | | $ | 57 | | |
Portfolio turnover | | | 274 | %(g) | | | 239 | %(g) | |
Notes to Financial Highlights
(a) For the period from November 8, 2012 (commencement of operations) to April 30, 2013.
(b) Calculation of the net gain (loss) per share (both realized and unrealized) does not correlate to the aggregate realized and unrealized gain (loss) presented in the Statement of Operations due to the timing of sales and repurchases of Fund shares in relation to fluctuations in the market value of the portfolio.
(c) In addition to the fees and expenses which the Fund bears directly, the Fund indirectly bears a pro rata share of the fees and expenses of the acquired funds in which it invests. Such indirect expenses are not included in the reported expense ratios.
(d) Annualized.
(e) Total net expenses include the impact of certain waivers/reimbursements made by the Investment Manager and certain of its affiliates, if applicable.
(f) The benefits derived from expense reductions had an impact of less than 0.01%.
(g) Includes mortgage dollar rolls. If mortgage dollar roll transactions were excluded, the portfolio turnover would have been 191% and 205% for the years ended April 30, 2014 and 2013, respectively.
The accompanying Notes to Financial Statements are an integral part of this statement.
Annual Report 2014
48
Columbia Intermediate Bond Fund
Financial Highlights (continued)
| | | Year Ended April 30, | |
Class R5 | | 2014 | | 2013(a) | |
Per share data | |
Net asset value, beginning of period | | $ | 9.48 | | | $ | 9.66 | | |
Income from investment operations: | |
Net investment income | | | 0.28 | | | | 0.15 | | |
Net realized and unrealized loss | | | (0.31 | ) | | | (0.05 | )(b) | |
Total from investment operations | | | (0.03 | ) | | | 0.10 | | |
Less distributions to shareholders: | |
Net investment income | | | (0.25 | ) | | | (0.13 | ) | |
Net realized gains | | | (0.06 | ) | | | (0.15 | ) | |
Total distributions to shareholders | | | (0.31 | ) | | | (0.28 | ) | |
Net asset value, end of period | | $ | 9.14 | | | $ | 9.48 | | |
Total return | | | (0.28 | %) | | | 1.03 | % | |
Ratios to average net assets(c) | |
Total gross expenses | | | 0.51 | % | | | 0.54 | %(d) | |
Total net expenses(e) | | | 0.50 | % | | | 0.54 | %(d) | |
Net investment income | | | 3.15 | % | | | 3.30 | %(d) | |
Supplemental data | |
Net assets, end of period (in thousands) | | $ | 15,980 | | | $ | 318 | | |
Portfolio turnover | | | 274 | %(f) | | | 239 | %(f) | |
Notes to Financial Highlights
(a) For the period from November 8, 2012 (commencement of operations) to April 30, 2013.
(b) Calculation of the net gain (loss) per share (both realized and unrealized) does not correlate to the aggregate realized and unrealized gain (loss) presented in the Statement of Operations due to the timing of sales and repurchases of Fund shares in relation to fluctuations in the market value of the portfolio.
(c) In addition to the fees and expenses which the Fund bears directly, the Fund indirectly bears a pro rata share of the fees and expenses of the acquired funds in which it invests. Such indirect expenses are not included in the reported expense ratios.
(d) Annualized.
(e) Total net expenses include the impact of certain waivers/reimbursements made by the Investment Manager and certain of its affiliates, if applicable.
(f) Includes mortgage dollar rolls. If mortgage dollar roll transactions were excluded, the portfolio turnover would have been 191% and 205% for the years ended April 30, 2014 and 2013, respectively.
The accompanying Notes to Financial Statements are an integral part of this statement.
Annual Report 2014
49
Columbia Intermediate Bond Fund
Financial Highlights (continued)
| | | Year Ended April 30, | | Year Ended March 31, | |
Class W | | 2014 | | 2013 | | 2012(a) | | 2012 | | 2011(b) | |
Per share data | |
Net asset value, beginning of period | | $ | 9.50 | | | $ | 9.39 | | | $ | 9.33 | | | $ | 9.08 | | | $ | 9.21 | | |
Income from investment operations: | |
Net investment income | | | 0.24 | | | | 0.27 | | | | 0.03 | | | | 0.34 | | | | 0.17 | | |
Net realized and unrealized gain (loss) | | | (0.30 | ) | | | 0.25 | | | | 0.05 | | | | 0.27 | | | | (0.11 | ) | |
Total from investment operations | | | (0.06 | ) | | | 0.52 | | | | 0.08 | | | | 0.61 | | | | 0.06 | | |
Less distributions to shareholders: | |
Net investment income | | | (0.22 | ) | | | (0.26 | ) | | | (0.02 | ) | | | (0.36 | ) | | | (0.19 | ) | |
Net realized gains | | | (0.06 | ) | | | (0.15 | ) | | | — | | | | — | | | | — | | |
Total distributions to shareholders | | | (0.28 | ) | | | (0.41 | ) | | | (0.02 | ) | | | (0.36 | ) | | | (0.19 | ) | |
Proceeds from regulatory settlements | | | — | | | | — | | | | — | | | | 0.00 | (c) | | | — | | |
Net asset value, end of period | | $ | 9.16 | | | $ | 9.50 | | | $ | 9.39 | | | $ | 9.33 | | | $ | 9.08 | | |
Total return | | | (0.62 | %) | | | 5.59 | % | | | 0.91 | % | | | 6.84 | % | | | 0.69 | % | |
Ratios to average net assets(d) | |
Total gross expenses | | | 0.91 | % | | | 0.92 | % | | | 0.94 | %(e) | | | 0.94 | %(f) | | | 0.89 | %(e)(f) | |
Total net expenses(g) | | | 0.85 | %(h) | | | 0.85 | %(h) | | | 0.82 | %(e) | | | 0.83 | %(f)(h) | | | 0.87 | %(e)(f)(h) | |
Net investment income | | | 2.68 | % | | | 2.91 | % | | | 3.38 | %(e) | | | 3.64 | % | | | 3.62 | %(e) | |
Supplemental data | |
Net assets, end of period (in thousands) | | $ | 507,419 | | | $ | 752,819 | | | $ | 3 | | | $ | 3 | | | $ | 2 | | |
Portfolio turnover | | | 274 | %(i) | | | 239 | %(i) | | | 10 | %(i) | | | 170 | %(i) | | | 177 | % | |
Notes to Financial Highlights
(a) For the period from April 1, 2012 to April 30, 2012. During the period, the Fund's fiscal year end was changed from March 31 to April 30.
(b) For the period from September 27, 2010 (commencement of operations) to March 31, 2011.
(c) Rounds to zero.
(d) In addition to the fees and expenses which the Fund bears directly, the Fund indirectly bears a pro rata share of the fees and expenses of the acquired funds in which it invests. Such indirect expenses are not included in the reported expense ratios.
(e) Annualized.
(f) Ratios include line of credit interest expense which rounds to less than 0.01%.
(g) Total net expenses include the impact of certain waivers/reimbursements made by the Investment Manager and certain of its affiliates, if applicable.
(h) The benefits derived from expense reductions had an impact of less than 0.01%.
(i) Includes mortgage dollar rolls. If mortgage dollar roll transactions were excluded, the portfolio turnover would have been 191%, 205%, 9% and 157% for the years ended April 30, 2014, 2013, 2012 and March 31, 2012, respectively.
The accompanying Notes to Financial Statements are an integral part of this statement.
Annual Report 2014
50
Columbia Intermediate Bond Fund
Financial Highlights (continued)
| | | Year Ended April 30, | |
Class Y | | 2014 | | 2013(a) | |
Per share data | |
Net asset value, beginning of period | | $ | 9.49 | | | $ | 9.67 | | |
Income from investment operations: | |
Net investment income | | | 0.29 | | | | 0.14 | | |
Net realized and unrealized loss | | | (0.31 | ) | | | (0.04 | )(b) | |
Total from investment operations | | | (0.02 | ) | | | 0.10 | | |
Less distributions to shareholders: | |
Net investment income | | | (0.25 | ) | | | (0.13 | ) | |
Net realized gains | | | (0.06 | ) | | | (0.15 | ) | |
Total distributions to shareholders | | | (0.31 | ) | | | (0.28 | ) | |
Net asset value, end of period | | $ | 9.16 | | | $ | 9.49 | | |
Total return | | | (0.17 | %) | | | 1.05 | % | |
Ratios to average net assets(c) | |
Total gross expenses | | | 0.51 | % | | | 0.45 | %(d) | |
Total net expenses(e) | | | 0.50 | % | | | 0.45 | %(d) | |
Net investment income | | | 3.21 | % | | | 3.18 | %(d) | |
Supplemental data | |
Net assets, end of period (in thousands) | | $ | 15,642 | | | $ | 2 | | |
Portfolio turnover | | | 274 | %(f) | | | 239 | %(f) | |
Notes to Financial Highlights
(a) For the period from November 8, 2012 (commencement of operations) to April 30, 2013.
(b) Calculation of the net gain (loss) per share (both realized and unrealized) does not correlate to the aggregate realized and unrealized gain (loss) presented in the Statement of Operations due to the timing of sales and repurchases of Fund shares in relation to fluctuations in the market value of the portfolio.
(c) In addition to the fees and expenses which the Fund bears directly, the Fund indirectly bears a pro rata share of the fees and expenses of the acquired funds in which it invests. Such indirect expenses are not included in the reported expense ratios.
(d) Annualized.
(e) Total net expenses include the impact of certain waivers/reimbursements made by the Investment Manager and certain of its affiliates, if applicable.
(f) Includes mortgage dollar rolls. If mortgage dollar roll transactions were excluded, the portfolio turnover would have been 191% and 205% for the years ended April 30, 2014 and 2013, respectively.
The accompanying Notes to Financial Statements are an integral part of this statement.
Annual Report 2014
51
Columbia Intermediate Bond Fund
Financial Highlights (continued)
| | | Year Ended April 30, | | Year Ended March 31, | |
Class Z | | 2014 | | 2013 | | 2012(a) | | 2012 | | 2011 | | 2010 | |
Per share data | |
Net asset value, beginning of period | | $ | 9.49 | | | $ | 9.39 | | | $ | 9.33 | | | $ | 9.08 | | | $ | 8.95 | | | $ | 7.72 | | |
Income from investment operations: | |
Net investment income | | | 0.27 | | | | 0.31 | | | | 0.03 | | | | 0.36 | | | | 0.39 | | | | 0.45 | | |
Net realized and unrealized gain (loss) | | | (0.31 | ) | | | 0.23 | | | | 0.06 | | | | 0.27 | | | | 0.15 | | | | 1.26 | | |
Total from investment operations | | | (0.04 | ) | | | 0.54 | | | | 0.09 | | | | 0.63 | | | | 0.54 | | | | 1.71 | | |
Less distributions to shareholders: | |
Net investment income | | | (0.24 | ) | | | (0.29 | ) | | | (0.03 | ) | | | (0.38 | ) | | | (0.41 | ) | | | (0.48 | ) | |
Net realized gains | | | (0.06 | ) | | | (0.15 | ) | | | — | | | | — | | | | — | | | | — | | |
Total distributions to shareholders | | | (0.30 | ) | | | (0.44 | ) | | | (0.03 | ) | | | (0.38 | ) | | | (0.41 | ) | | | (0.48 | ) | |
Proceeds from regulatory settlements | | | — | | | | — | | | | — | | | | 0.00 | (b) | | | — | | | | 0.00 | (b) | |
Net asset value, end of period | | $ | 9.15 | | | $ | 9.49 | | | $ | 9.39 | | | $ | 9.33 | | | $ | 9.08 | | | $ | 8.95 | | |
Total return | | | (0.37 | %) | | | 5.79 | % | | | 0.93 | % | | | 7.08 | % | | | 6.07 | % | | | 22.62 | % | |
Ratios to average net assets(c) | |
Total gross expenses | | | 0.66 | % | | | 0.70 | % | | | 0.71 | %(d) | | | 0.70 | %(e) | | | 0.68 | %(e) | | | 0.65 | %(e) | |
Total net expenses(f) | | | 0.60 | %(g) | | | 0.62 | %(g) | | | 0.59 | %(d) | | | 0.59 | %(e)(g) | | | 0.67 | %(e)(g) | | | 0.65 | %(e)(g) | |
Net investment income | | | 2.92 | % | | | 3.23 | % | | | 3.60 | %(d) | | | 3.89 | % | | | 4.28 | % | | | 5.26 | % | |
Supplemental data | |
Net assets, end of period (in thousands) | | $ | 1,289,621 | | | $ | 1,915,534 | | | $ | 2,881,803 | | | $ | 2,853,669 | | | $ | 2,835,104 | | | $ | 1,973,020 | | |
Portfolio turnover | | | 274 | %(h) | | | 239 | %(h) | | | 10 | %(h) | | | 170 | %(h) | | | 177 | % | | | 160 | % | |
Notes to Financial Highlights
(a) For the period from April 1, 2012 to April 30, 2012. During the period, the Fund's fiscal year end was changed from March 31 to April 30.
(b) Rounds to zero.
(c) In addition to the fees and expenses which the Fund bears directly, the Fund indirectly bears a pro rata share of the fees and expenses of the acquired funds in which it invests. Such indirect expenses are not included in the reported expense ratios.
(d) Annualized.
(e) Ratios include line of credit interest expense which rounds to less than 0.01%.
(f) Total net expenses include the impact of certain waivers/reimbursements made by the Investment Manager and certain of its affiliates, if applicable.
(g) The benefits derived from expense reductions had an impact of less than 0.01%.
(h) Includes mortgage dollar rolls. If mortgage dollar roll transactions were excluded, the portfolio turnover would have been 191%, 205%, 9% and 157% for the years ended April 30, 2014, 2013, 2012 and March 31, 2012, respectively.
The accompanying Notes to Financial Statements are an integral part of this statement.
Annual Report 2014
52
Columbia Intermediate Bond Fund
Notes to Financial Statements
April 30, 2014
Note 1. Organization
Columbia Intermediate Bond Fund (the Fund), a series of Columbia Funds Series Trust I (the Trust), is a diversified fund. The Trust is registered under the Investment Company Act of 1940, as amended (the 1940 Act), as an open-end management investment company organized as a Massachusetts business trust.
Fund Shares
The Trust may issue an unlimited number of shares (without par value). The Fund offers Class A, Class B, Class C, Class I, Class K, Class R, Class R4, Class R5, Class W, Class Y and Class Z shares. Although all share classes generally have identical voting, dividend and liquidation rights, each share class votes separately when required by law. Different share classes pay different distribution amounts to the extent the expenses of such share classes differ, and distributions in liquidation will be proportional to the net asset value of each share class. Each share class has its own expense structure and sales charges, as applicable.
Class A shares are subject to a maximum front-end sales charge of 3.25% based on the initial investment amount. Class A shares purchased without an initial sales charge in accounts aggregating $1 million to $50 million at the time of purchase are subject to a contingent deferred sales charge (CDSC) if the shares are sold within 18 months of purchase, charged as follows: 1.00% CDSC if redeemed within 12 months of purchase, and 0.50% CDSC if redeemed more than 12, but less than 18, months after purchase.
Class B shares may be subject to a maximum CDSC of 3.00% based upon the holding period after purchase. Class B shares will generally convert to Class A shares eight years after purchase. The Fund no longer accepts investments by new or existing investors in the Fund's Class B shares, except in connection with the reinvestment of any dividend and/or capital gain distributions in Class B shares of the Fund and exchanges by existing Class B shareholders of certain other funds within the Columbia Family of Funds.
Class C shares are subject to a 1.00% CDSC on shares redeemed within one year of purchase.
Class I shares are not subject to sales charges and are available only to the Columbia Family of Funds.
Class K shares are not subject to sales charges, however this share class is closed to new investors.
Class R shares are not subject to sales charges and are generally available only to certain retirement plans and other eligible investors.
Class R4 shares are not subject to sales charges and are generally available only to omnibus retirement plans and certain other eligible investors.
Class R5 shares are not subject to sales charges and are generally available only to investors purchasing through authorized investment professionals and omnibus retirement plans.
Class W shares are not subject to sales charges and are available only to investors purchasing through authorized investment programs managed by investment professionals, including discretionary managed account programs.
Class Y shares are not subject to sales charges and are generally available only to certain retirement plans.
Class Z shares are not subject to sales charges and are available only to certain eligible investors, which are subject to different investment minimums.
Note 2. Summary of Significant Accounting Policies
Use of Estimates
The preparation of financial statements in accordance with U.S. generally accepted accounting principles (GAAP) requires management to make certain estimates and assumptions that affect the reported amounts of assets and liabilities, the disclosure of contingent assets and liabilities at the date of the financial statements and the reported amounts of revenue and expenses during the reporting period. Actual results could differ from those estimates.
The following is a summary of significant accounting policies consistently followed by the Fund in the preparation of its financial statements.
Security Valuation
Debt securities generally are valued by pricing services approved by the Board of Trustees (the Board) based upon market transactions for normal, institutional-size trading units of similar securities. The services may use various pricing techniques which take into account appropriate factors such as yield, quality, coupon rate, maturity, type of issue, trading characteristics and other data, as well as broker quotes. Debt securities for which quotations are readily available may also be valued based upon an over-the-counter or exchange bid quotation.
Asset and mortgage-backed securities are generally valued by pricing services, which utilize pricing models that incorporate the securities' cash flow and loan performance data. These models also take into account available market data, including trades, market quotations, and benchmark yield curves for identical or similar securities. Factors used to identify similar
Annual Report 2014
53
Columbia Intermediate Bond Fund
Notes to Financial Statements (continued)
April 30, 2014
securities may include, but are not limited to, issuer, collateral type, vintage, prepayment speeds, collateral performance, credit ratings, credit enhancement and expected life. Asset-backed securities for which quotations are readily available may also be valued based upon an over-the-counter or exchange bid quotation.
All equity securities are valued at the close of business of the New York Stock Exchange (NYSE). Equity securities are valued at the last quoted sales price on the principal exchange or market on which they trade, except for securities traded on the NASDAQ Stock Market, which are valued at the NASDAQ official close price. Unlisted securities or listed securities for which there were no sales during the day are valued at the mean of the latest quoted bid and ask prices on such exchanges or markets.
Investments in open-end investment companies, including money market funds, are valued at net asset value.
Short-term securities purchased within 60 days to maturity are valued at amortized cost, which approximates market value. The value of short-term securities originally purchased with maturities greater than 60 days is determined based on an amortized value to par upon reaching 60 days to maturity. Short-term securities maturing in more than 60 days from the valuation date are valued at the market price or approximate market value based on current interest rates.
Futures and options on futures contracts are valued based upon the settlement price established each day by the board of trade or exchange on which they are traded.
Swap transactions are valued through an independent pricing service or broker, or if neither is available, through an internal model based upon observable inputs.
Investments for which market quotations are not readily available, or that have quotations which management believes are not reliable, are valued at fair value as determined in good faith under consistently applied procedures established by and under the general supervision of the Board. If a security or class of securities (such as foreign securities) is valued at fair value, such value is likely to be different from the last quoted market price for the security.
The determination of fair value often requires significant judgment. To determine fair value, management may use assumptions including but not limited to future cash flows and estimated risk premiums. Multiple inputs from various sources may be used to determine fair value.
Foreign Currency Transactions and Translations
The values of all assets and liabilities denominated in foreign currencies are translated into U.S. dollars at that day's exchange rates. Net realized and unrealized gains (losses) on
foreign currency transactions and translations include gains (losses) arising from the fluctuation in exchange rates between trade and settlement dates on securities transactions, gains (losses) arising from the disposition of foreign currency and currency gains (losses) between the accrual and payment dates on dividends, interest income and foreign withholding taxes.
For financial statement purposes, the Fund does not distinguish that portion of gains (losses) on investments which is due to changes in foreign exchange rates from that which is due to changes in market prices of the investments. Such fluctuations are included with the net realized and unrealized gains (losses) on investments in the Statement of Operations.
Derivative Instruments
The Fund invests in certain derivative instruments, as detailed below, to meet its investment objectives. Derivatives are instruments whose values depend on, or are derived from, in whole or in part, the value of one or more other assets, such as securities, currencies, commodities or indices. Derivative instruments may be used to maintain cash reserves while maintaining exposure to certain other assets, to offset anticipated declines in values of investments, to facilitate trading, to reduce transaction costs and to pursue higher investment returns. The Fund may also use derivative instruments to mitigate certain investment risks, such as foreign currency exchange rate risk, interest rate risk and credit risk. Derivatives may involve various risks, including the potential inability of the counterparty to fulfill its obligation under the terms of the contract, the potential for an illiquid secondary market (making it difficult for the Fund to sell, including at favorable prices) and the potential for market movements which may expose the Fund to gains or losses in excess of the amount shown in the Statement of Assets and Liabilities. The notional amounts of derivative instruments, if applicable, are not recorded in the financial statements.
A derivative instrument may suffer a mark to market loss if the value of the contract decreases due to an unfavorable change in the market rates or values of the underlying instrument. Losses can also occur if the counterparty does not perform under the contract. The Fund's risk of loss from counterparty credit risk on over-the-counter derivatives is generally limited to the aggregate unrealized gain netted against any collateral held by the Fund and the amount of any variation margin held by the counterparty. With exchange-traded or centrally cleared derivatives, there is minimal counterparty credit risk to the Fund since the exchange's clearinghouse, as counterparty to such instruments, guarantees against a possible default. The clearinghouse stands between the buyer and the seller of the contract; therefore, the counterparty credit risk is limited to failure of the clearinghouse. However, credit risk still exists in exchange-traded or centrally cleared derivatives with respect
Annual Report 2014
54
Columbia Intermediate Bond Fund
Notes to Financial Statements (continued)
April 30, 2014
to initial and variation margin that is held in a broker's customer account. While brokers are required to segregate customer margin from their own assets, in the event that a broker becomes insolvent or goes into bankruptcy and at that time there is a shortfall in the aggregate amount of margin held by the broker for all its clients, U.S. bankruptcy laws will typically allocate that shortfall on a pro-rata basis across all the broker's customers, potentially resulting in losses to the Fund.
In order to better define its contractual rights and to secure rights that will help the Fund mitigate its counterparty risk, the Fund may enter into an International Swaps and Derivatives Association, Inc. Master Agreement (ISDA Master Agreement) or similar agreement with its derivative contract counterparties. An ISDA Master Agreement is an agreement between the Fund and a counterparty that governs over-the-counter derivatives and forward foreign currency exchange contracts and typically contains, among other things, collateral posting terms and netting provisions in the event of a default and/or termination event. Under an ISDA Master Agreement, the Fund may, under certain circumstances, offset with the counterparty certain derivative instrument's payables and/or receivables with collateral held and/or posted and create one single net payment. The provisions of the ISDA Master Agreement typically permit a single net payment in the event of default (close-out netting) including the bankruptcy or insolvency of the counterparty. Note, however, that bankruptcy or insolvency laws of a particular jurisdiction may impose restrictions on or prohibitions against the right of offset in bankruptcy, insolvency or other events.
Collateral (margin) requirements differ by type of derivative. Margin requirements are established by the exchange or clearinghouse for exchange-traded and centrally cleared derivatives. Brokers can ask for margin in excess of the minimum in certain circumstances. Collateral terms are contract specific for over-the-counter derivatives. For over-the-counter derivatives traded under an ISDA Master Agreement, the collateral requirements are typically calculated by netting the mark-to-market amount for each transaction under such agreement and comparing that amount to the value of any variation margin currently pledged by the Fund and/or the counterparty. Generally, the amount of collateral due from or to a party has to exceed a minimum transfer amount threshold (e.g., $500,000) before a transfer has to be made. To the extent amounts due to the Fund from its counterparties are not fully collateralized, contractually or otherwise, the Fund bears the risk of loss from counterparty nonperformance. The Fund attempts to mitigate counterparty risk by only entering into agreements with counterparties that it believes have the financial resources to honor their obligations and by monitoring the financial stability of those counterparties.
Certain ISDA Master Agreements allow counterparties to over-the-counter derivatives to terminate derivative contracts prior to maturity in the event the Fund's net assets decline by a stated percentage over a specified time period or the Fund fails to meet the terms of the ISDA Master Agreement, which would cause the Fund to accelerate payment of any net liability owed to the counterparty. The Fund also has termination rights if the counterparty fails to meet the terms of the ISDA Master Agreement. In addition to considering counterparty credit risk, the Fund would consider terminating the derivative contracts based on whether termination would result in a net liability owed from the counterparty.
For financial reporting purposes, the Fund does not offset derivative assets and derivative liabilities that are subject to netting arrangements in the Statement of Assets and Liabilities.
Futures Contracts
Futures contracts are exchange traded and represent commitments for the future purchase or sale of an asset at a specified price on a specified date. The Fund bought and sold futures contracts to manage the duration and yield curve exposure of the Fund versus the benchmark and to manage exposure to movements in interest rates. These instruments may be used for other purposes in future periods. Upon entering into futures contracts, the Fund bears risks that it may not achieve the anticipated benefits of the futures contracts and may realize a loss. Additional risks include counterparty credit risk, the possibility of an illiquid market, and that a change in the value of the contract or option may not correlate with changes in the value of the underlying asset.
Upon entering into a futures contract, the Fund pledges cash or securities with the broker in an amount sufficient to meet the initial margin requirement. The initial margin deposit must be maintained at an established level over the life of the contract. Cash deposited as initial margin is recorded in the Statement of Assets and Liabilities as margin deposits. Securities deposited as initial margin are designated in the Portfolio of Investments. Subsequent payments (variation margin) are made or received by the Fund each day. The variation margin payments are equal to the daily change in the contract value and are recorded as variation margin receivable or payable and are offset in unrealized gains or losses. The Fund recognizes a realized gain or loss when the contract is closed or expires. Futures contracts involve, to varying degrees, risk of loss in excess of the variation margin disclosed in the Statement of Assets and Liabilities.
Swap Contracts
Swap contracts are privately negotiated in the over-the-counter market and may be entered into as a bilateral contract or
Annual Report 2014
55
Columbia Intermediate Bond Fund
Notes to Financial Statements (continued)
April 30, 2014
centrally cleared (centrally cleared swap contract). In a centrally cleared swap contract, immediately following execution of the swap contract, the swap contract is novated to a central counterparty (the CCP) and the Fund faces the CCP through a broker. Upon entering into a centrally cleared swap contract, the Fund is required to deposit initial margin with the broker in the form of cash or securities in an amount that varies depending on the size and risk profile of the particular swap contract. Securities deposited as initial margin are designated in the Portfolio of Investments and cash deposited is recorded in the Statement of Assets and Liabilities as margin deposits. Unlike a bilateral swap contract, for centrally cleared swap contacts, the Fund has minimal credit exposure to the counterparty as the CCP stands between the Fund and the counterparty. Swap contracts are marked-to-market daily and changes in value are recorded as unrealized appreciation (depreciation). The daily change in valuation of centrally cleared swap contracts, if any, is recorded as a receivable or payable for variation margin in the Statements of Assets and Liabilities.
Credit Default Swap Contracts
The Fund entered into credit default swap contracts to increase or decrease its credit exposure to an index, increase or decrease its credit exposure to a single issuer of debt securities, and increase or decrease its credit exposure to a specific debt security or a basket of debt securities. Additionally, credit default swap contracts were used to hedge the Fund's exposure on a debt security that it owns or in lieu of selling such debt security. Credit default swap contracts are agreements in which one party pays fixed periodic payments to a counterparty in consideration for a guarantee from the counterparty to make a specific payment should a specified credit event(s) take place. Although specified events are contract specific, credit events are generally defined as bankruptcy, failure to pay, restructuring, obligation acceleration, obligation default, or repudiation/moratorium.
As the purchaser of a credit default swap contract, the Fund purchases protection by paying a periodic interest rate on the notional amount to the counterparty. The interest amount is accrued daily as a component of unrealized appreciation (depreciation) and is recorded as a realized loss upon payment. If a credit event as specified in the contract occurs, the Fund may have the option either to deliver the reference obligation to the seller in exchange for a cash payment of its par amount, or to receive a net cash settlement equal to the par amount less an agreed-upon value of the reference obligation as of the date of the credit event. Credit events are contract specific but may include bankruptcy, failure to pay, restructuring and obligation acceleration. The difference between the value of the obligation or cash delivered and the notional amount received will be recorded as a realized gain (loss).
Any premium paid or received by the Fund upon entering into a credit default swap contract is recorded as an asset or liability, respectively, and amortized daily as a component of realized gain (loss) in the Statement of Operations. Credit default swap contracts are valued daily, and the change in value is recorded as unrealized appreciation (depreciation) until the termination of the swap, at which time a realized gain (loss) is recorded.
Credit default swap contracts can involve greater risks than if a fund had invested in the reference obligation directly since, in addition to general market risks, credit default swaps are subject to counterparty credit risk, leverage risk, hedging risk, correlation risk and liquidity risk. The Fund will enter into credit default swap transactions only with counterparties that meet certain standards of creditworthiness.
Interest Rate Swap Contracts
The Fund entered into interest rate swap transactions to gain exposure to or protect itself from market rate changes. These instruments may be used for other purposes in future periods. Interest rate swaps are agreements between two parties that involve the exchange of one type of interest rate for another type of interest rate cash flow on specified dates in the future, based on a predetermined, specified notional amount. Certain interest rate swaps are considered forward-starting, whereby the accrual for the exchange of cash flows does not begin until a specified date in the future (the effective date). The net cash flow for a standard interest rate swap transaction is generally the difference between a floating market interest rate versus a fixed interest rate.
Interest rate swaps are valued daily and unrealized appreciation (depreciation) is recorded. Certain interest rate swaps may accrue periodic interest on a daily basis as a component of unrealized appreciation (depreciation); the Fund will realize a gain or loss upon the payment or receipt of accrued interest. The Fund will realize a gain or a loss when the interest rate swap is terminated.
Risks of entering into interest rate swaps include a lack of correlation between the swaps and the portfolio of bonds the swaps are designed to hedge or replicate. A lack of correlation may cause the interest rate swaps to experience adverse changes in value relative to expectations. In addition, interest rate swaps are subject to the risk of default of a counterparty, and the risk of adverse movements in market interest rates relative to the interest rate swap positions taken. The Fund's maximum risk of loss from counterparty credit risk is the discounted net value of the cash flows to be received from/paid to the counterparty over the contract's remaining life to the extent that such amount is positive, plus the cost of entering into a similar transaction with another counterparty.
Annual Report 2014
56
Columbia Intermediate Bond Fund
Notes to Financial Statements (continued)
April 30, 2014
The Fund attempts to mitigate counterparty credit risk by entering into interest rate swap transactions only with counterparties that meet prescribed levels of creditworthiness, as determined by the Investment Manager. The Fund and any counterparty are required to maintain an agreement that requires the Fund and that counterparty to monitor (on a daily basis) the net market value of all derivative transactions entered into pursuant to the contract between the Fund and
such counterparty. If the net market value of such derivatives transactions between the Fund and that counterparty exceeds a certain threshold (as defined in the agreement), the Fund or the counterparty is required to post cash and/or securities as collateral. Market values of derivatives transactions presented in the financial statements are not netted with the market values of other derivatives transactions or with any collateral amounts posted by the Fund or any counterparty.
Offsetting of Derivative Assets and Derivative Liabilities
The following tables present the Fund's gross and net amount of assets and liabilities available for offset under netting arrangements as well as any related collateral received or pledged by the Fund as of April 30, 2014:
| | | | | | | Net Amounts of | | Gross Amounts Not Offset in
the Statement of Assets and Liabilities | |
| |
| | Gross
Amounts of
Recognized
Assets ($) | | Gross Amounts
Offset in the
Statement of
Assets and
Liabilities ($) | | Assets
Presented in the
Statement of
Assets and
Liabilities ($) | | Financial
Instruments ($)(a) | | Cash
Collateral
Received ($) | | Securities
Collateral
Received ($) | | Net
Amount ($)(b) | |
Asset Derivatives: | |
Over-the-Counter
Swap Contracts(c) | | | 4,547,311 | | | | — | | | | 4,547,311 | | | | 3,377,884 | | | | — | | | | 1,169,427 | | | | — | | |
Centrally Cleared
Swap Contracts(d) | | | 291,370 | | | | — | | | | 291,370 | | | | 291,370 | | | | — | | | | — | | | | — | | |
Total | | | 4,838,681 | | | | — | | | | 4,838,681 | | | | 3,669,254 | | | | — | | | | 1,169,427 | | | | — | | |
| | | | | | Net Amounts of | | Gross Amounts Not Offset in
the Statement of Assets and Liabilities | | | |
| | Gross
Amounts of
Recognized
Liabilities ($) | | Gross Amounts
Offset in the
Statement of
Assets and
Liabilities ($) | | Liabilities
Presented in the
Statement of
Assets and
Liabilities ($) | | Financial
Instruments ($)(e) | | Cash
Collateral
Pledged ($) | | Securities
Collateral
Pledged ($) | | Net
Amount ($)(f) | |
Liability Derivatives: | |
Over-the-Counter
Swap Contracts(c) | | | 9,590,701 | | | | — | | | | 9,590,701 | | | | 3,377,884 | | | | — | | | | 5,763,000 | | | | 449,817 | | |
Centrally Cleared
Swap Contracts(g) | | | 429,250 | | | | — | | | | 429,250 | | | | 291,370 | | | | — | | | | 137,880 | | | | — | | |
Total | | | 10,019,951 | | | | — | | | | 10,019,951 | | | | 3,669,254 | | | | — | | | | 5,900,880 | | | | 449,817 | | |
(a) Represents the amount of assets that could be offset by liabilities with the same counterparty under master netting or similar agreements that management elects not to offset on the Statement of Assets and Liabilities.
(b) Represents the net amount due from counterparties in the event of default.
(c) Over-the-Counter Swap Contracts are presented at market value plus periodic payments receivable (payable), which is comprised of unrealized appreciation, unrealized depreciation, premiums paid and premiums received.
(d) Centrally cleared swaps are included within receivable for variation margin on the Statement of Assets and Liabilities.
(e) Represents the amount of liabilities that could be offset by assets with the same counterparty under master netting or similar agreements that management elects not to offset on the Statement of Assets and Liabilities.
(f) Represents the net amount due to counterparties in the event of default.
(g) Centrally cleared swaps are included within payable for variation margin on the Statement of Assets and Liabilities.
Annual Report 2014
57
Columbia Intermediate Bond Fund
Notes to Financial Statements (continued)
April 30, 2014
Effects of Derivative Transactions in the Financial Statements
The following tables are intended to provide additional information about the effect of derivatives on the financial statements of the Fund, including: the fair value of derivatives by risk category and the location of those fair values in the Statement of Assets and Liabilities; the impact of derivative transactions over the period in the Statement of Operations including realized gains or losses and unrealized gains or losses. The derivative schedules following the Portfolio of Investments present additional information regarding derivative instruments outstanding at the end of the period, if any.
The following table is a summary of the fair value of derivative instruments at April 30, 2014:
Asset Derivatives | |
Risk Exposure
Category | | Statement of Assets and
Liabilities Location | |
Fair Value ($) | |
Credit risk
| | Net assets — unrealized
appreciation on swap
contracts | | | 28,992
| * | |
Credit risk
| | Premiums paid on
outstanding swap
contracts | | | 8,911,782
| | |
Interest rate risk
| | Net assets — unrealized
appreciation on futures
contracts | | | 464,720
| * | |
Interest rate risk
| | Net assets — unrealized
appreciation on swap
contracts | | | 334,106
| * | |
Interest rate risk
| | Premiums paid on
outstanding swap
contracts | | | 1,788
| | |
Total | | | | | 9,741,388 | | |
Liability Derivatives | |
Risk Exposure
Category | | Statement of Assets and
Liabilities Location | |
Fair Value ($) | |
Credit risk
| | Net assets — unrealized
depreciation on swap
contracts | | | 12,398,755
| * | |
Credit risk
| | Premiums received on
outstanding swap
contracts | | | 5,772,022
| | |
Interest rate risk
| | Net assets — unrealized
depreciation on
futures contracts | | | 6,133,525
| * | |
Interest rate risk
| | Net assets — unrealized
depreciation on swap
contracts | | | 231,837
| * | |
Total | | | | | 24,536,139 | | |
*Includes cumulative appreciation (depreciation) as reported in the tables following the Portfolio of Investments. Only the current day's variation margin is reported in receivables or payables in the Statement of Assets and Liabilities.
The following table indicates the effect of derivative instruments in the Statement of Operations for the year ended April 30, 2014:
Amount of Realized Gain (Loss) on Derivatives Recognized in Income | |
Risk Exposure
Category | | Futures
Contracts ($) | | Swap
Contracts ($) | | Total ($) | |
Credit risk | | | — | | | | (32,280,595 | ) | | | (32,280,595 | ) | |
Interest rate risk | | | 15,642,341 | | | | (2,928 | ) | | | 15,639,413 | | |
Total | | | 15,642,341 | | | | (32,283,523 | ) | | | (16,641,182 | ) | |
Change in Unrealized Appreciation (Depreciation) on
Derivatives Recognized in Income | |
Risk Exposure
Category | | Futures
Contracts ($) | | Swap
Contracts ($) | | Total ($) | |
Credit risk | | | — | | | | (2,512,746 | ) | | | (2,512,746 | ) | |
Interest rate risk | | | 13,795,707 | | | | 102,269 | | | | 13,897,976 | | |
Total | | | 13,795,707 | | | | (2,410,477 | ) | | | 11,385,230 | | |
The following table is a summary of the average outstanding volume by derivative instrument for the year ended April 30, 2014.
Derivative Instrument | | Average Notional Amounts ($)* | |
Futures contracts — Long | | | 358,836,114 | | |
Futures contracts — Short | | | 381,635,456 | | |
Credit default Swap
Contracts — buy protection | | | 815,510,000 | | |
Derivate Instrument | | Average Unrealized
Appreciation ($)* | | Average Unrealized
Depreciation ($)* | |
Interest rate swaps | | | 83,527 | | | | (59,126 | ) | |
*Based on ending quarterly outstanding amounts for the year ended April 30, 2014.
Investments in Loans
The Fund may invest in loan participations and assignments of all or a portion of a loan. When the Fund purchases a loan participation, the Fund typically enters into a contractual relationship with the lender or third party selling such participations (Selling Participant), but not the borrower, and assumes the credit risk of the borrower, Selling Participant and any other persons interpositioned between the Fund and the borrower. In addition, the Fund may not directly benefit from the collateral supporting the loan that it has purchased from the Selling Participant. In contrast, when the Fund purchases an assignment of a loan, the Fund typically has direct rights against the borrower; provided, however, that the Fund's rights may be more limited than the lender from which it acquired the assignment and the Fund may be able to enforce their rights only through an administrative agent. Although certain loan participations or assignments are secured by collateral, the Fund could experience delays or limitations in realizing such collateral or have their interest subordinated to other
Annual Report 2014
58
Columbia Intermediate Bond Fund
Notes to Financial Statements (continued)
April 30, 2014
indebtedness of the obligor. In the event that the administrator or collateral agent of a loan becomes insolvent, enters into receivership or bankruptcy, the Fund may incur costs and delays in realizing payment or may suffer a loss of principal and/or interest. The risk of loss is greater for unsecured or subordinated loans. In addition, loan participations and assignments are vulnerable to market conditions such that economic conditions or other events may reduce the demand for loan participations and assignments and certain loan participations and assignments which were liquid, when purchased, may become illiquid.
Delayed Delivery Securities
The Fund may trade securities on other than normal settlement terms, including securities purchased or sold on a "when-issued" basis. This may increase risk since the other party to the transaction may fail to deliver which could cause the Fund to subsequently invest at less advantageous prices. The Fund designates cash or liquid securities in an amount equal to the delayed delivery commitment.
Mortgage Dollar Roll Transactions
The Fund may enter into mortgage "dollar rolls" in which the Fund sells securities for delivery in the current month and simultaneously contracts with the same counterparty to repurchase similar but not identical securities (same type, coupon and maturity) on a specified future date. During the roll period, the Fund loses the right to receive principal and interest paid on the securities sold. However, the Fund will benefit because it receives negotiated amounts in the form of reductions of the purchase price for the future purchase plus the interest earned on the cash proceeds of the securities sold until the settlement date of the forward purchase. The Fund records the incremental difference between the forward purchase and sale of each forward roll as a realized gain or loss. Unless any realized gains exceed the income, capital appreciation, and gain or loss due to mortgage prepayments that would have been realized on the securities sold as part of the mortgage dollar roll, the use of this technique will diminish the investment performance of the Fund compared to what the performance would have been without the use of mortgage dollar rolls. All cash proceeds will be invested in instruments that are permissible investments for the Fund. The Fund identifies cash or liquid securities in an amount equal to the forward purchase price.
For financial reporting and tax purposes, the Fund treats "to be announced" mortgage dollar rolls as two separate transactions, one involving the purchase of a security and a separate transaction involving a sale. These transactions may increase the Fund's portfolio turnover rate. The Fund does not
currently enter into mortgage dollar rolls that are accounted for as financing transactions.
Mortgage dollar rolls involve the risk that the market value of the securities the Fund is obligated to repurchase may decline below the repurchase price, or that the counterparty may default on its obligations.
Interest Only Securities
The Fund may invest in Interest Only Securities (IOs). IOs are stripped securities entitled to receive all of the security's interest, but none of its principal. The Fund may also invest in stripped mortgage-backed securities. If the underlying obligations experience greater than anticipated prepayments of principal, the Fund may fail to fully recoup its initial investment in an IO. As a result of the prepayments the daily interest accrual factor is adjusted periodically (typically, each month) to reflect the paydown of principal. IOs are particularly sensitive to changes in interest rates and therefore subject to greater fluctuations in price than typical interest bearing debt securities. IOs are also subject to credit risk because the Fund may not receive all or part of the interest payments if the issuer or credit enhanced defaults on its obligation.
Principal Only Securities
The Fund may invest in Principal Only Securities (POs). POs are stripped securities entitled to receive most, if not all, of the principal from the underlying obligation, but not the interest. The Fund may also invest in stripped mortgage-backed securities. POs are particularly sensitive to changes in interest rates and therefore are subject to fluctuations in price. POs are also subject to credit risk because the Fund may not receive all or part of its principal if the issuer or credit enhancer defaults on its obligation.
Stripped Securities
The Fund may invest in Interest Only (IO) and Principal Only (PO) stripped mortgage-backed securities. These securities are derivative multi-class mortgage securities structured so that one class receives most, if not all, of the principal from the underlying mortgage assets, while the other class receives most, if not all, of the interest and the remainder of the principal. If the underlying mortgage assets experience greater than anticipated prepayments of principal, the Fund may fail to fully recoup its initial investment in an IO security, therefore the daily interest accrual factor is adjusted each month to reflect the paydown of principal. The market value of these securities can be extremely volatile in response to changes in interest rates. Credit risk reflects the risk that the Fund may not receive all or part of its principal because the issuer or credit enhancer has defaulted on its obligation.
Annual Report 2014
59
Columbia Intermediate Bond Fund
Notes to Financial Statements (continued)
April 30, 2014
Security Transactions
Security transactions are accounted for on the trade date. Cost is determined and gains (losses) are based upon the specific identification method for both financial statement and federal income tax purposes.
Income Recognition
Interest income is recorded on an accrual basis. Market premiums and discounts, including original issue discounts, are amortized and accreted, respectively, over the expected life of the security on all debt securities, unless otherwise noted. The Fund classifies gains and losses realized on prepayments received on mortgage-backed securities as adjustments to interest income.
Corporate actions and dividend income are recorded on the ex-dividend date.
The value of additional securities received as an income payment is recorded as income and increases the cost basis of such securities.
Expenses
General expenses of the Trust are allocated to the Fund and other funds of the Trust based upon relative net assets or other expense allocation methodologies determined by the nature of the expense. Expenses directly attributable to the Fund are charged to the Fund. Expenses directly attributable to a specific class of shares are charged to that share class.
Determination of Class Net Asset Value
All income, expenses (other than class-specific expenses, which are charged to that share class, as shown in the Statement of Operations) and realized and unrealized gains (losses) are allocated to each class of the Fund on a daily basis, based on the relative net assets of each class, for purposes of determining the net asset value of each class.
Federal Income Tax Status
The Fund intends to qualify each year as a regulated investment company under Subchapter M of the Internal Revenue Code, as amended, and will distribute substantially all of its taxable income (including net short-term capital gains), if any, for its tax year, and as such will not be subject to federal income taxes. In addition, the Fund intends to distribute in each calendar year substantially all of its net investment income, capital gains and certain other amounts, if any, such that the Fund should not be subject to federal excise tax. Therefore, no federal income or excise tax provision is recorded.
Distributions to Shareholders
Distributions from net investment income, if any, are declared daily and paid monthly. Net realized capital gains, if any, are distributed at least annually. Income distributions and capital gain distributions are determined in accordance with federal income tax regulations, which may differ from GAAP.
Guarantees and Indemnifications
Under the Trust's organizational documents and, in some cases, by contract, its officers and trustees are indemnified against certain liabilities arising out of the performance of their duties to the Trust or its funds. In addition, certain of the Fund's contracts with its service providers contain general indemnification clauses. The Fund's maximum exposure under these arrangements is unknown since the amount of any future claims that may be made against the Fund cannot be determined, and the Fund has no historical basis for predicting the likelihood of any such claims.
Note 3. Fees and Compensation Paid to Affiliates
Investment Management Fees
Under an Investment Management Services Agreement, Columbia Management Investment Advisers, LLC (the Investment Manager), a wholly-owned subsidiary of Ameriprise Financial, Inc. (Ameriprise Financial), determines which securities will be purchased, held or sold. The investment management fee is an annual fee that is equal to a percentage of the Fund's average daily net assets that declines from 0.43% to 0.30% as the Fund's net assets increase. The effective investment management fee rate for the year ended April 30, 2014 was 0.41% of the Fund's average daily net assets.
Administration Fees
Under an Administrative Services Agreement, the Investment Manager also serves as the Fund Administrator. The Fund pays the Fund Administrator an annual fee for administration and accounting services equal to a percentage of the Fund's average daily net assets that declines from 0.07% to 0.04% as the Fund's net assets increase. The effective administration fee rate for the year ended April 30, 2014 was 0.06% of the Fund's average daily net assets.
Compensation of Board Members
Board members are compensated for their services to the Fund as disclosed in the Statement of Operations. The Trust's eligible Trustees may participate in a Deferred Compensation Plan (the Plan) which may be terminated at any time. Obligations of the Plan will be paid solely out of the Fund's assets.
Annual Report 2014
60
Columbia Intermediate Bond Fund
Notes to Financial Statements (continued)
April 30, 2014
Compensation of Chief Compliance Officer
The Board has appointed a Chief Compliance Officer to the Fund in accordance with federal securities regulations. The Fund pays its pro-rata share of the expenses associated with the Chief Compliance Officer. The Fund's expenses for the Chief Compliance Officer will not exceed $15,000 per year.
Transfer Agent Fees
Under a Transfer and Dividend Disbursing Agent Agreement, Columbia Management Investment Services Corp. (the Transfer Agent), an affiliate of the Investment Manager and a wholly-owned subsidiary of Ameriprise Financial, is responsible for providing transfer agency services to the Fund. The Transfer Agent has contracted with Boston Financial Data Services (BFDS) to serve as sub-transfer agent.
The Transfer Agent receives monthly account-based service fees based on the number of open accounts and also receives sub-transfer agency fees based on a percentage of the average aggregate value of the Fund's shares maintained in omnibus accounts (other than omnibus accounts for which American Enterprise Investment Services Inc. is the broker of record or accounts where the beneficial shareholder is a customer of Ameriprise Financial Services, Inc., which are paid a per account fee). The Transfer Agent pays the fees of BFDS for services as sub-transfer agent and is not entitled to reimbursement for such fees from the Fund (with the exception of out-of-pocket fees).
The Transfer Agent also receives compensation from fees for various shareholder services and reimbursements for certain out-of-pocket fees. Total transfer agent fees for Class K and Class R5 shares are subject to an annual limitation of not more than 0.05% of the average daily net assets attributable to each share class. Class I and Class Y shares are not subject to transfer agent fees.
For the year ended April 30, 2014, the Fund's effective transfer agent fee rates as a percentage of average daily net assets of each class were as follows:
Class A | | | 0.16 | % | |
Class B | | | 0.16 | | |
Class C | | | 0.16 | | |
Class K | | | 0.00 | * | |
Class R | | | 0.16 | | |
Class R4 | | | 0.16 | | |
Class R5 | | | 0.00 | * | |
Class W | | | 0.16 | | |
Class Z | | | 0.16 | | |
*Rounds to zero.
The Fund and certain other associated investment companies, have severally, but not jointly, guaranteed the performance and observance of all the terms and conditions of a lease entered into by Seligman Data Corp. (SDC), the former transfer agent, including the payment of rent by SDC (the Guaranty). SDC was the legacy Seligman funds' former transfer agent.
The lease and the Guaranty expire in January 2019. At April 30, 2014, the Fund's total potential future obligation over the life of the Guaranty is $14,977. The liability remaining at April 30, 2014 for non-recurring charges associated with the lease amounted to $10,667 and is recorded as a part of the payable for other expenses in the Statement of Assets and Liabilities.
An annual minimum account balance fee of $20 may apply to certain accounts with a value below the applicable share class's initial minimum investment requirements to reduce the impact of small accounts on transfer agent fees. These minimum account balance fees are recorded as part of expense reductions in the Statement of Operations. For the year ended April 30, 2014, these minimum account balance fees reduced total expenses by $4,119.
Plan Administration Fees
Under a Plan Administration Services Agreement with the Transfer Agent, the Fund pays an annual fee at a rate of 0.25% of the Fund's average daily net assets attributable to Class K shares for the provision of various administrative, recordkeeping, communication and educational services.
Distribution and Service Fees
The Fund has an agreement with Columbia Management Investment Distributors, Inc. (the Distributor), an affiliate of the Investment Manager and a wholly-owned subsidiary of Ameriprise Financial, for distribution and shareholder services. The Board has approved, and the Fund has adopted, distribution and shareholder service plans (the Plans) applicable to certain share classes, which set the distribution and service fees for the Fund. These fees are calculated daily and are intended to compensate the Distributor and/or eligible selling and/or servicing agents for selling shares of the Fund and providing services to investors.
Under the Plans, the Fund pays a monthly service fee to the Distributor at the maximum annual rate of 0.25% of the average daily net assets attributable to Class A, Class B, Class C and Class W shares of the Fund. Also under the Plans, the Fund pays a monthly distribution fee to the Distributor at the maximum annual rates of 0.10%, 0.75%, 0.75%, 0.50% and 0.25% of the average daily net assets attributable to Class A, Class B, Class C, Class R and Class W shares, respectively.
Annual Report 2014
61
Columbia Intermediate Bond Fund
Notes to Financial Statements (continued)
April 30, 2014
Although the Fund may pay distribution and service fees up to a maximum annual rate of 0.35% of the Fund's average daily net assets attributable to Class A shares (comprised of up to 0.10% for distribution services and up to 0.25% for shareholder liaison services), the Fund currently limits such fees to an aggregate fee of not more than 0.25% of the Fund's average daily net assets attributable to Class A shares.
The Distributor has voluntarily agreed to waive a portion of the distribution fee for Class C shares so that the distribution fee does not exceed 0.60% annually of the average daily net assets attributable to Class C shares. This arrangement may be modified or terminated by the Distributor at any time.
Although the Fund may pay a distribution fee up to 0.25% of the Fund's average daily net assets attributable to Class W shares and a service fee of up to 0.25% of the Fund's average daily net assets attributable to Class W shares, the aggregate fee shall not exceed 0.25% of the Fund's average daily net assets attributable to Class W shares.
Sales Charges
Sales charges, including front-end charges and CDSCs, received by the Distributor for distributing Fund shares were $247,662 for Class A, $11,388 for Class B and $3,016 for Class C, shares for the year ended April 30, 2014.
Expenses Waived/Reimbursed by the Investment Manager and its Affiliates
The Investment Manager and certain of its affiliates have contractually agreed to waive fees and/or reimburse expenses (excluding certain fees and expenses described below) for the period disclosed below, unless sooner terminated at the sole discretion of the Board, so that the Fund's net operating expenses, after giving effect to fees waived/expenses reimbursed and any balance credits and/or overdraft charges from the Fund's custodian, do not exceed the following annual rates as a percentage of the class' average daily net assets:
| | | Fee Rates Contractual
through
December 31, 2014 | |
Class A | | | 0.85 | % | |
Class B | | | 1.60 | | |
Class C | | | 1.60 | | |
Class I | | | 0.50 | | |
Class K | | | 0.80 | | |
Class R | | | 1.10 | | |
Class R4 | | | 0.60 | | |
Class R5 | | | 0.55 | | |
Class W | | | 0.85 | | |
Class Y | | | 0.50 | | |
Class Z | | | 0.60 | | |
Under the agreement governing these fee waivers and/or expense reimbursement arrangements, the following fees and expenses are excluded from the waiver/reimbursement commitment, and therefore will be paid by the Fund, if applicable: taxes (including foreign transaction taxes), expenses associated with investments in affiliated and non-affiliated pooled investment vehicles (including mutual funds and exchange-traded funds), transaction costs and brokerage commissions, costs related to any securities lending program, dividend expenses associated with securities sold short, inverse floater program fees and expenses, transaction charges and interest on borrowed money, interest, extraordinary expenses and any other expenses the exclusion of which is specifically approved by the Board. This agreement may be modified or amended only with approval from all parties. Class C distribution fees waived by the Distributor, as discussed above, are in addition to the waiver/reimbursement commitment under the agreement.
Note 4. Federal Tax Information
The timing and character of income and capital gain distributions are determined in accordance with income tax regulations, which may differ from GAAP because of temporary or permanent book to tax differences.
At April 30, 2014, these differences are primarily due to differing treatment for capital loss carryforwards, principal and/or interest of fixed income securities, deferral/reversal of wash sales losses, Trustees' deferred compensation, distribution reclassifications, derivative investments and tax straddles. To the extent these differences are permanent, reclassifications are made among the components of the Fund's net assets in the Statement of Assets and Liabilities. Temporary differences do not require reclassifications. In the Statement of Assets and Liabilities the following reclassifications were made:
Undistributed net investment income | | $ | (15,995,129 | ) | |
Accumulated net realized loss | | | 15,968,905 | | |
Paid-in capital | | | 26,224 | | |
Net investment income and net realized gains (losses), as disclosed in the Statement of Operations, and net assets were not affected by this reclassification.
The tax character of distributions paid during the years indicated was as follows:
Year Ended April 30, | | 2014 | | 2013 | |
Ordinary income | | $ | 113,543,064 | | | $ | 118,759,067 | | |
Long-term capital gains | | | 28,751,017 | | | | 20,518,637 | | |
Total | | $ | 142,294,081 | | | $ | 139,277,704 | | |
Short-term capital gain distributions, if any, are considered ordinary income distributions for tax purposes.
Annual Report 2014
62
Columbia Intermediate Bond Fund
Notes to Financial Statements (continued)
April 30, 2014
At April 30, 2014, the components of distributable earnings on a tax basis were as follows:
Undistributed ordinary income | | $ | 8,305,778 | | |
Capital loss carryforwards | | | (23,304,264 | ) | |
Net unrealized appreciation | | | 45,661,759 | | |
At April 30, 2014, the cost of investments for federal income tax purposes was $4,139,380,160 and the aggregate gross unrealized appreciation and depreciation based on that cost was:
Unrealized appreciation | | $ | 104,065,043 | | |
Unrealized depreciation | | | (58,403,284 | ) | |
Net unrealized appreciation | | $ | 45,661,759 | | |
The following capital loss carryforwards, determined at April 30, 2014, may be available to reduce taxable income arising from future net realized gains on investments, if any, to the extent permitted by the Internal Revenue Code:
Year of Expiration | | Amount | |
Unlimited short-term | | $ | 23,304,264 | | |
Management of the Fund has concluded that there are no significant uncertain tax positions that would require recognition in the financial statements. However, management's conclusion may be subject to review and adjustment at a later date based on factors including, but not limited to, new tax laws, regulations, and administrative interpretations (including relevant court decisions). Generally, the Fund's federal tax returns for the prior three fiscal years remain subject to examination by the Internal Revenue Service.
Note 5. Portfolio Information
The cost of purchases and proceeds from sales of securities, excluding short-term obligations, aggregated to $12,753,746,181 and $14,161,132,974, respectively, for the year ended April 30, 2014, of which $9,837,486,231 and $10,130,973,989, respectively, were U.S. government securities.
Note 6. Affiliated Money Market Fund
The Fund invests its daily cash balances in Columbia Short-Term Cash Fund, an affiliated money market fund established for the exclusive use by the Fund and other affiliated funds. The income earned by the Fund from such investments is included as "Dividends — affiliated issuers" in the Statement of Operations. As an investing fund, the Fund indirectly bears its proportionate share of the expenses of Columbia Short-Term Cash Fund.
Note 7. Shareholder Concentration
At April 30, 2014, one unaffiliated shareholder of record owned 18.9% of the outstanding shares of the Fund in one or more accounts. The Fund has no knowledge about whether any portion of those shares was owned beneficially. Affiliated shareholders of record owned 38.9% of the outstanding shares of the Fund in one or more accounts. Subscription and redemption activity by concentrated accounts may have a significant effect on the operations of the Fund.
Note 8. Line of Credit
The Fund has entered into a revolving credit facility with a syndicate of banks led by JPMorgan Chase Bank N.A. whereby the Fund may borrow for the temporary funding of shareholder redemptions or for other temporary or emergency purposes. The credit facility agreement, as amended, which is a collective agreement between the Fund and certain other funds managed by the Investment Manager, severally and not jointly, permits collective borrowings up to $500 million. Interest is charged to each participating fund based on its borrowings at a rate equal to the higher of (i) the overnight federal funds rate plus 1.00% or (ii) the one-month LIBOR rate plus 1.00%. Each borrowing under the credit facility matures no later than 60 days after the date of borrowing. Effective December 10, 2013, the Fund also pays a commitment fee equal to its pro rata share of the amount of the credit facility at a rate of 0.075% per annum. Prior to December 10, 2013, the commitment fee was charged at the annual rate of 0.08% per annum. The commitment fee is included in other expenses in the Statement of Operations.
The Fund had no borrowings during the year ended April 30, 2014.
Note 9. Fund Merger
At the close of business on March 15, 2013, the Fund acquired the assets and assumed the identified liabilities of Columbia Diversified Bond Fund, a series of Columbia Funds Series Trust II (the acquired fund). The reorganization was completed after shareholders of the acquired fund approved a plan of reorganization on February 27, 2013. The purpose of the transaction was to combine two funds managed by the Investment Manager with comparable investment objectives and strategies.
The aggregate net assets of the Fund immediately before the acquisition were $2,558,418,370 and the combined net assets immediately after the acquisition were $5,569,275,980.
The merger was accomplished by a tax-free exchange of 607,096,686 shares of the acquired fund valued at
Annual Report 2014
63
Columbia Intermediate Bond Fund
Notes to Financial Statements (continued)
April 30, 2014
$3,010,857,610 (including $80,476,192 of unrealized appreciation).
In exchange for the acquired fund's shares, the Fund issued the following number of shares:
| | | Shares | |
Class A | | | 198,219,171 | | |
Class B | | | 4,174,593 | | |
Class C | | | 6,533,646 | | |
Class I | | | 24,395,358 | | |
Class K | | | 8,041,771 | | |
Class R | | | 22,650 | | |
Class R4 | | | 1,369 | | |
Class R5 | | | 18,399 | | |
Class W | | | 78,413,367 | | |
Class Z | | | 443,605 | | |
For financial reporting purposes, net assets received and shares issued by the Fund were recorded at fair value; however, the acquired fund's cost of investments was carried forward.
The financial statements reflect the operations of the Fund for the period prior to the merger and the combined fund for the period subsequent to the merger. Because the combined investment portfolios have been managed as a single integrated portfolio since the merger was completed, it is not practicable to separate the amounts of revenue and earnings of the acquired fund that have been included in the combined Fund's Statement of Operations since the merger was completed.
Assuming the merger had been completed on May 1, 2012 the Fund's pro-forma net investment income, net gain on investments, net change in unrealized depreciation and net increase in net assets from operations for the year ended April 30, 2013 would have been approximately $174.8 million, $167.8 million, $(5.4) million and $337.4 million, respectively.
Note 10. Significant Risks
Asset-Backed Securities Risk
The value of asset-backed securities may be affected by, among other factors, changes in interest rates, the market's assessment of the quality of underlying assets, the creditworthiness of the servicer for the underlying assets, factors concerning the interests in and structure of the issuer or the originator of the underlying assets, or the creditworthiness or rating of the entities that provide any supporting letters of credit, surety bonds, derivative instruments, or other credit enhancement. The value of asset-backed securities also will be affected by the exhaustion, termination or expiration of any credit enhancement. Most
asset-backed securities are subject to prepayment risk, which is the possibility that the underlying debt may be refinanced or prepaid prior to maturity during periods of declining or low interest rates, causing the Fund to have to reinvest the money received in securities that have lower yields. In addition, the impact of prepayments on the value of asset-backed securities may be difficult to predict and may result in greater volatility.
Mortgage-Backed Securities Risk
The value of mortgage-backed securities may be affected by, among other things, changes in interest rates, factors concerning the interests in and structure of the issuer or the originator of the mortgages, the creditworthiness of the entities that provide any supporting letters of credit, surety bonds or other credit enhancements or the quality of underlying assets or the market's assessment thereof. Mortgage-backed securities are subject to prepayment risk, which is the possibility that the underlying mortgage may be refinanced or prepaid prior to maturity during periods of declining or low interest rates, causing the Fund to have to reinvest the money received in securities that have lower yields. In addition, the impact of prepayments on the value of mortgage-backed securities may be difficult to predict and may result in greater volatility.
Note 11. Subsequent Events
Management has evaluated the events and transactions that have occurred through the date the financial statements were issued and noted no items requiring adjustment of the financial statements or additional disclosure.
Note 12. Information Regarding Pending and Settled Legal Proceedings
In December 2005, without admitting or denying the allegations, American Express Financial Corporation (AEFC, which is now known as Ameriprise Financial, Inc. (Ameriprise Financial)) entered into settlement agreements with the Securities and Exchange Commission (SEC) and Minnesota Department of Commerce (MDOC) related to market timing activities. As a result, AEFC was censured and ordered to cease and desist from committing or causing any violations of certain provisions of the Investment Advisers Act of 1940, the Investment Company Act of 1940, and various Minnesota laws. AEFC agreed to pay disgorgement of $10 million and civil money penalties of $7 million. AEFC also agreed to retain an independent distribution consultant to assist in developing a plan for distribution of all disgorgement and civil penalties ordered by the SEC in accordance with various undertakings detailed at www.sec.gov/litigation/admin/ia-2451.pdf. Ameriprise Financial and its affiliates have cooperated with the
Annual Report 2014
64
Columbia Intermediate Bond Fund
Notes to Financial Statements (continued)
April 30, 2014
SEC and the MDOC in these legal proceedings, and have made regular reports to the Funds' Boards of Trustees.
Ameriprise Financial and certain of its affiliates have historically been involved in a number of legal, arbitration and regulatory proceedings, including routine litigation, class actions, and governmental actions, concerning matters arising in connection with the conduct of their business activities. Ameriprise Financial believes that the Funds are not currently the subject of, and that neither Ameriprise Financial nor any of its affiliates are the subject of, any pending legal, arbitration or regulatory proceedings that are likely to have a material adverse effect on the Funds or the ability of Ameriprise Financial or its affiliates to perform under their contracts with the Funds. Ameriprise Financial is required to make 10-Q, 10-K and, as necessary, 8-K filings with the Securities and Exchange Commission on legal and regulatory matters that relate to Ameriprise Financial and its affiliates. Copies of these filings may be obtained by accessing the SEC website at www.sec.gov.
There can be no assurance that these matters, or the adverse publicity associated with them, will not result in increased fund redemptions, reduced sale of fund shares or other adverse consequences to the Funds. Further, although we believe proceedings are not likely to have a material adverse effect on the Funds or the ability of Ameriprise Financial or its affiliates to perform under their contracts with the Funds, these proceedings are subject to uncertainties and, as such, we are unable to estimate the possible loss or range of loss that may result. An adverse outcome in one or more of these proceedings could result in adverse judgments, settlements, fines, penalties or other relief that could have a material adverse effect on the consolidated financial condition or results of operations of Ameriprise Financial.
Annual Report 2014
65
Columbia Intermediate Bond Fund
Report of Independent Registered Public Accounting Firm
To the Trustees of Columbia Funds Series Trust I and the Shareholders of
Columbia Intermediate Bond Fund
In our opinion, the accompanying statement of assets and liabilities, including the portfolio of investments, and the related statements of operations and of changes in net assets and the financial highlights present fairly, in all material respects, the financial position of Columbia Intermediate Bond Fund (the "Fund", a series of Columbia Funds Series Trust I) at April 30, 2014, and the results of its operations, the changes in its net assets and the financial highlights for each of the periods indicated, in conformity with accounting principles generally accepted in the United States of America. These financial statements and financial highlights (hereafter referred to as "financial statements") are the responsibility of the Fund's management; our responsibility is to express an opinion on these financial statements based on our audits. We conducted our audits of these financial statements in accordance with the standards of the Public Company Accounting Oversight Board (United States). Those standards require that we plan and perform the audit to obtain reasonable assurance about whether the financial statements are free of material misstatement. An audit includes examining, on a test basis, evidence supporting the amounts and disclosures in the financial statements, assessing the accounting principles used and significant estimates made by management, and evaluating the overall financial statement presentation. We believe that our audits, which included confirmation of securities at April 30, 2014 by correspondence with the custodian, brokers, agent banks, and transfer agent, and the application of alternative auditing procedures where such confirmations had not been received, provide a reasonable basis for our opinion.
PricewaterhouseCoopers LLP
Minneapolis, Minnesota
June 20, 2014
Annual Report 2014
66
Columbia Intermediate Bond Fund
The Trustees serve terms of indefinite duration. The names, addresses and birth years of the Trustees and Officers of the Funds in Columbia Funds Series Trust I, the year each was first elected or appointed to office, their principal business occupations during at least the last five years, the number of Funds overseen by each Trustee and other directorships they hold are shown below. Each officer listed below serves as an officer of each Fund in Columbia Funds Series Trust I.
Independent Trustees
Name, Address and Year of Birth,
Position with Funds, Year First
Elected or Appointed to Office | | Principal Occupation(s) During Past Five Years, Number of Funds in Columbia
Funds Complex Overseen by Trustee, Other Directorships Held | |
Rodman L. Drake (Born 1943)
c/o Columbia Management
Investment Advisers, LLC
225 Franklin Street
Boston, MA 02110
Trustee (since 1994) and
Chairman of the Board (since 2009) | | Independent consultant since 2010; Co-Founder of Baringo Capital LLC (private equity) from 1997 to 2008; Chairman (from 2003 to 2010) and CEO (from 2008 to 2010) of Crystal River Capital, Inc. (real estate investment trust); Oversees 54; Jackson Hewitt Tax Service Inc. (tax preparation services) from 2004 to 2011; Student Loan Corporation (student loan provider) from 2005 to 2010; Celgene Corporation (global biotechnology company); The Helios Funds and Brookfield Funds (closed-end funds); Chimerix, Inc. (biopharmaceutical company) since August 1, 2013; Crystal River Capital, Inc. from 2005 to 2010; Parsons Brinckerhoff from 1995 to 2008; and Apex Silver Mines Ltd. from 2007 to 2009 | |
Douglas A. Hacker (Born 1955)
c/o Columbia Management
Investment Advisers, LLC
225 Franklin Street
Boston, MA 02110
Trustee (since 1996) | | Independent business executive since May 2006; Executive Vice President — Strategy of United Airlines from December 2002 to May 2006; President of UAL Loyalty Services (airline marketing company) from September 2001 to December 2002; Executive Vice President and Chief Financial Officer of United Airlines from July 1999 to September 2001. Oversees 54; Nash Finch Company (food distributor); Aircastle Limited (aircraft leasing); and SeaCube Container Leasing Ltd. (container leasing) | |
Janet Langford Kelly (Born 1957)
c/o Columbia Management
Investment Advisers, LLC
225 Franklin Street
Boston, MA 02110
Trustee (since 1996) | | Senior Vice President, General Counsel and Corporate Secretary, ConocoPhillips (integrated energy company) since September 2007; Deputy General Counsel — Corporate Legal Services, ConocoPhillips from August 2006 to August 2007; Partner, Zelle, Hofmann, Voelbel, Mason & Gette LLP (law firm) from March 2005 to July 2006; Adjunct Professor of Law, Northwestern University from September 2004 to June 2006; Director, UAL Corporation (airline) from February 2006 to July 2006; Chief Administrative Officer and Senior Vice President, Kmart Holding Corporation (consumer goods) from September 2003 to March 2004. Oversees 54; None | |
Nancy T. Lukitsh (Born 1956)
c/o Columbia Management
Investment Advisers, LLC
225 Franklin Street
Boston, MA 02110
Trustee (since 2011) | | Senior Vice President, Partner and Director of Marketing, Wellington Management Company, LLP (investment adviser) from 1997 to 2010; Chair, Wellington Management Investment Portfolios (commingled non-U.S. investment pools) from 2007 to 2010; Director, Wellington Trust Company, NA and other Wellington affiliates from 1997 to 2010. Oversees 54; None | |
William E. Mayer (Born 1940)
c/o Columbia Management
Investment Advisers, LLC
225 Franklin Street
Boston, MA 02110
Trustee (since 1994) | | Partner, Park Avenue Equity Partners (private equity) since February 1999; Dean and Professor, College of Business and Management, University of Maryland from 1992 to 1996. Oversees 54; DynaVox Inc. (speech creation); Lee Enterprises (print media); WR Hambrecht + Co. (financial service provider) from 2000 to 2012; BlackRock Kelso Capital Corporation (investment company) | |
David M. Moffett (Born 1952)
c/o Columbia Management
Investment Advisers, LLC
225 Franklin Street
Boston, MA 02110
Trustee (since 2011) | | Retired. Chief Executive Officer, Federal Home Loan Mortgage Corporation, from 2008 to 2009; Senior Adviser, Global Financial Services Group, Carlyle Group, Inc., from 2007 to 2008; Vice Chairman and Chief Financial Officer, U.S. Bancorp, from 1993 to 2007. Oversees 54; CIT Group Inc. (commercial and consumer finance); eBay Inc. (online trading community); MBIA Inc. (financial service provider); E.W. Scripps Co. (print and television media), Building Materials Holding Corp. (building materials and construction services); Genworth Financial, Inc. (financial and insurance products and services); and University of Oklahoma Foundation | |
Charles R. Nelson (Born 1942)
c/o Columbia Management
Investment Advisers, LLC
225 Franklin Street
Boston, MA 02110
Trustee (since 1981) | | Retired. Professor Emeritus, University of Washington, since 2011; Professor of Economics, University of Washington from 1976 to 2011; Ford and Louisa Van Voorhis Professor of Political Economy, University of Washington from 1993 to 2011; Adjunct Professor of Statistics, University of Washington from 1980 to 2011; Associate Editor, Journal of Money, Credit and Banking from September 1993 to 2008; consultant on econometric and statistical matters. Oversees 54; None | |
John J. Neuhauser (Born 1943)
c/o Columbia Management
Investment Advisers, LLC
225 Franklin Street
Boston, MA 02110
Trustee (since 1984) | | President, Saint Michael's College, since August 2007; Director or Trustee of several non-profit organizations, including Fletcher Allen Health Care, Inc.; University Professor, Boston College from November 2005 to August 2007; Academic Vice President and Dean of Faculties, Boston College from August 1999 to October 2005. Oversees 54; Liberty All-Star Equity Fund and Liberty All-Star Growth Fund (closed-end funds) | |
Annual Report 2014
67
Columbia Intermediate Bond Fund
Trustees and Officers (continued)
Independent Trustees (continued)
Name, Address and Year of Birth,
Position with Funds, Year First
Elected or Appointed to Office | | Principal Occupation(s) During Past Five Years, Number of Funds in Columbia
Funds Complex Overseen by Trustee, Other Directorships Held | |
Patrick J. Simpson (Born 1944)
c/o Columbia Management
Investment Advisers, LLC
225 Franklin Street
Boston, MA 02110
Trustee (since 2000) | | Partner, Perkins Coie LLP (law firm). Oversees 54; None | |
Anne-Lee Verville (Born 1945)
c/o Columbia Management
Investment Advisers, LLC
225 Franklin Street
Boston, MA 02110
Trustee (since 1998) | | Retired. General Manager — Global Education Industry from 1994 to 1997, President — Application Systems Division from 1991 to 1994, Chief Financial Officer — US Marketing & Services from 1988 to 1991, and Chief Information Officer from 1987 to 1988, IBM Corporation (computer and technology). Oversees 54; Enesco Group, Inc. (producer of giftware and home and garden decor products) from 2001 to 2006 | |
Interested Trustee
Name, Address and Year of Birth,
Position with Funds, Year First
Elected or Appointed to Office | | Principal Occupation(s) During Past Five Years, Number of Funds in Columbia
Funds Complex Overseen by Trustee, Other Directorships Held | |
William F. Truscott (born 1960)
53600 Ameriprise Financial Center
Minneapolis, MN 55474
Senior Vice President (since 2012) | | Chairman of the Board and President, Columbia Management Investment Advisers, LLC since May 2010 and February 2012 (previously President and Chief Investment Officer, from 2001 to April 2010); Chief Executive Officer, Global Asset Management, Ameriprise Financial, Inc. since September 2012 (previously, Chief Executive Officer, U.S. Asset Management & President, Annuities, from May 2010 to September 2012 and President — U.S. Asset Management and Chief Investment Officer from 2005 to April 2010); Director and Chief Executive Officer, Columbia Management Investment Distributors, Inc. since May 2010 and February 2012, respectively (previously Chairman of the Board and Chief Executive Officer from 2006 to April 2010); Chairman of the Board and Chief Executive Officer, RiverSource Distributors, Inc. since 2006; President and Chief Executive Officer, Ameriprise Certificate Company, 2006 to August 2012; Oversees 186; Director, Ameriprise Certificate Company, 2006-January 2013 | |
The Statement of Additional Information has additional information about the Fund's Board members and is available, without charge, upon request by calling 800.345.6611; contacting your financial intermediary; or visiting columbiamanagement.com.
The Board has appointed officers who are responsible for day-to-day business decisions based on policies it has established. The officers serve at the pleasure of the Board. In addition to Mr. Truscott, who is Senior Vice President, the Funds' other officers are:
Officers
Name,
Address and
Year of Birth | | Position and Year
First Appointed to
Position for any Fund
in the Columbia
Funds Complex or a
Predecessor Thereof | | Principal Occupation(s) During Past Five Years | |
J. Kevin Connaughton
225 Franklin Street
Boston, MA 02110
Born 1964 | | President and Principal Executive Officer (2009) | | Senior Vice President and General Manager — Mutual Fund Products, Columbia Management Investment Advisers, LLC, since May 2010; and President, Columbia Funds since 2009; previously, Managing Director, Columbia Management Advisors, LLC, from December 2004 to April 2010; Senior Vice President and Chief Financial Officer, Columbia Funds, from June 2008 to January 2009; and senior officer of Columbia Funds and affiliated funds since 2003. | |
Michael G. Clarke
225 Franklin Street
Boston, MA 02110
Born 1969 | | Treasurer (2011) and Chief Financial Officer (2009) | | Vice President, Columbia Management Investment Advisers, LLC, since May 2010; previously, Managing Director of Fund Administration, Columbia Management Advisors, LLC, from September 2004 to April 2010; and senior officer of Columbia Funds and affiliated funds since 2002. | |
Annual Report 2014
68
Columbia Intermediate Bond Fund
Trustees and Officers (continued)
Officers (continued)
Name,
Address and
Year of Birth | | Position and Year
First Appointed to
Position for any Fund
in the Columbia
Funds Complex or a
Predecessor Thereof | | Principal Occupation(s) During Past Five Years | |
Scott R. Plummer
5228 Ameriprise
Financial Center
Minneapolis, MN 55474
Born 1959 | | Senior Vice President (2006), Chief Legal Officer (2006) and Assistant Secretary (2011) | | Senior Vice President, Chief Legal Officer and Assistant Secretary, Columbia Management Investment Advisers, LLC, since June 2005; Senior Vice President and Lead Chief Counsel — Asset Management, Ameriprise Financial, Inc., since May 2010 (previously, Vice President and Chief Counsel — Asset Management, from 2005 to April 2010); Vice President, Chief Counsel and Assistant Secretary, Columbia Management Investment Distributors, Inc., since 2008; Vice President, General Counsel and Secretary, Ameriprise Certificate Company, since 2005; Chief Counsel, RiverSource Distributors, Inc., since 2006; and senior officer of Columbia Funds and affiliated funds since 2006. | |
Thomas P. McGuire
225 Franklin Street
Boston, MA 02110
Born 1972 | | Chief Compliance Officer (2012) | | Vice President — Asset Management Compliance, Ameriprise Financial, Inc., since May 2010; Chief Compliance Officer, Ameriprise Certificate Company, since September 2010; Compliance Executive, Bank of America, from 2005 to April 2010. | |
Colin Moore
225 Franklin Street
Boston, MA 02110
Born 1958 | | Senior Vice President (2010) | | Executive Vice President and Global Chief Investment Officer, Ameriprise Financial, Inc., since July 2013; Director and Global Chief Investment Officer, Columbia Management Investment Advisers, LLC, since May 2010; previously, Manager, Managing Director and Chief Investment Officer, Columbia Management Advisors, LLC, from 2007 to April 2010. | |
Michael E. DeFao
225 Franklin Street
Boston, MA 02110
Born 1968 | | Vice President (2011) and Assistant Secretary (2010) | | Vice President and Chief Counsel, Ameriprise Financial, Inc., since May 2010; Associate General Counsel, Bank of America from 2005 to April 2010. | |
Joseph F. DiMaria
225 Franklin Street
Boston, MA 02110
Born 1968 | | Vice President (2011) and Chief Accounting Officer (2008) | | Vice President — Mutual Fund Administration, Columbia Management Investment Advisers, LLC, since May 2010; previously, Director of Fund Administration, Columbia Management Advisors, LLC, from 2006 to April 2010. | |
Paul B. Goucher
100 Park Avenue
New York, NY 10017
Born 1968 | | Vice President (2011) and Assistant Secretary (2008) | | Vice President and Lead Chief Counsel, Ameriprise Financial, Inc., since November 2008 and January 2013, respectively (previously, Chief Counsel, from January 2010 to January 2013, and Group Counsel from November 2008 to January 2010); previously, Director, Managing Director and General Counsel, J. & W. Seligman & Co. Incorporated, from July 2008 to November 2008. | |
Amy Johnson
5228 Ameriprise
Financial Center
Minneapolis, MN
Born 1965 | | Vice President (2006) | | Senior Vice President and Chief Operating Officer, Columbia Management Investment Advisers, LLC, since May 2010; previously, Chief Administrative Officer, from 2009 to April 2010, and Vice President — Asset Management and Trust Company Services, from 2006 to 2009. | |
Paul D. Pearson
5228 Ameriprise
Financial Center
Minneapolis, MN
Born 1956 | | Vice President (2011) and Assistant Treasurer (1999) | | Vice President — Investment Accounting, Columbia Management Investment Advisers, LLC, since May 2010; previously, Vice President — Managed Assets, Investment Accounting, Ameriprise Financial, Inc. from 1998 to April 2010. | |
Christopher O. Petersen
5228 Ameriprise
Financial Center
Minneapolis, MN 55474
Born 1970 | | Vice President and Secretary (2010) | | Vice President and Chief Counsel, Ameriprise Financial, Inc., since January 2010 (previously, Vice President and Group Counsel or Counsel from 2004 to January 2010); officer of Columbia Funds and affiliated funds since 2007. | |
Stephen T. Welsh
225 Franklin Street
Boston, MA 02110
Born 1957 | | Vice President (2006) | | President and Director, Columbia Management Investment Services Corp., since May 2010; previously, President and Director, Columbia Management Services, Inc., from 2004 to April 2010; and Managing Director, Columbia Management Distributors, Inc., from 2007 to April 2010. | |
Annual Report 2014
69
This page intentionally left blank.
Annual Report 2014
70
This page intentionally left blank.
Annual Report 2014
71
This page intentionally left blank.
Annual Report 2014
72
Columbia Intermediate Bond Fund
Important Information About This Report
Each fund mails one shareholder report to each shareholder address. If you would like more than one report, please call shareholder services at 800.345.6611 and additional reports will be sent to you.
The policy of the Board is to vote the proxies of the companies in which each fund holds investments consistent with the procedures as stated in the Statement of Additional Information (SAI). You may obtain a copy of the SAI without charge by calling 800.345.6611; contacting your financial intermediary; visiting columbiamanagement.com; or searching the website of the Securities and Exchange Commission (SEC) at sec.gov. Information regarding how each fund voted proxies relating to portfolio securities is filed with the SEC by August 31 for the most recent 12-month period ending June 30 of that year, and is available without charge by visiting columbiamanagement.com; or searching the website of the SEC at sec.gov.
Each fund files a complete schedule of portfolio holdings with the SEC for the first and third quarters of each fiscal year on Form N-Q. Each fund's Form N-Q is available on the SEC's website at sec.gov and may be reviewed and copied at the SEC's Public Reference Room in Washington, D.C. Information on the operation of the Public Reference Room may be obtained by calling 800.SEC.0330. Each fund's complete schedule of portfolio holdings, as filed on Form N-Q, can also be obtained without charge, upon request, by calling 800.345.6611.
Annual Report 2014
73

Columbia Intermediate Bond Fund
P.O. Box 8081
Boston, MA 02266-8081
columbiamanagement.com
This information is for use with concurrent or prior delivery of a fund prospectus. Please read and consider the investment objectives, risks, charges and expenses for any fund carefully before investing. For a prospectus and, if available, a summary prospectus, which contains this and other important information about the Fund go to columbiamanagement.com. The Fund is distributed by Columbia Management Investment Distributors, Inc., member FINRA, and managed by Columbia Management Investment Advisers, LLC.
© 2014 Columbia Management Investment Advisers, LLC. All rights reserved.
ANN166_04_D01_(06/14)
Annual Report
April 30, 2014

Columbia U.S. Treasury Index Fund
Not FDIC insured • No bank guarantee • May lose value
 Dear Shareholders,
Continued Economic Recovery
The U.S. economy continued to recover at a slow but steady pace during the first quarter of 2014, supported by solid manufacturing activity, reasonable job growth and continued gains for the housing market. Industrial production was robust, buoyed by strong demand for autos and related parts. After a disappointing January, job growth picked up, which helped boost consumer confidence. Housing data was somewhat mixed, as harsh weather and higher mortgage rates put a damper on sales, while lower inventories helped prices trend higher. The Federal Reserve (the Fed) announced further reductions to its monthly asset purchases and reassured the markets that it would not make any significant changes to monetary policy until it was satisfied that the labor market was on solid ground. Despite mostly good news on the economic front, the broad financial markets recorded only modest gains, as bitter winter weather at home and mounting tensions between Russia and Western allies prompted investor caution.
Investors braced for higher interest rates, but long-term yields declined and the fixed-income markets were surprisingly resilient in the face of stable-to-improving economic data. Risk-on trading continued during the quarter as the higher yielding sectors of the fixed-income markets generally fared well. Emerging-market bonds, long-term U.S. Treasuries and sovereign debt were among the strongest performers, as were Treasury Inflation Protected Securities. Municipal bonds delivered solid gains, especially high-yield municipals, which benefited from continued improvement in state finances.
Against this backdrop, the broad bond market, as measured by the Barclays U.S. Aggregate Bond Index, edged out the broad stock market, as measured by the Standard & Poor's 500 Index, with gains of 1.84% vs. 1.81%, respectively. As indicated late last year, the Fed began tapering its monthly asset purchase program and announced further reductions. New Fed chair Janet Yellen reassured investors the Fed was committed to keeping short-term borrowing rates low into 2015.
Stay on Track with Columbia Management
Backed by more than 100 years of experience, Columbia Management is one of the nation's largest asset managers. At the heart of our success and, most importantly, that of our investors, are highly talented industry professionals, brought together by a unique way of working. At Columbia Management, reaching our performance goals matters, and how we reach them matters just as much.
Visit columbiamanagement.com for:
> The Columbia Management Perspectives blog, offering insights on current market events and investment opportunities
> Detailed up-to-date fund performance and portfolio information
> Quarterly fund commentaries
> Columbia Management investor, our award-winning quarterly newsletter for shareholders
Thank you for your continued support of the Columbia Funds. We look forward to serving your investment needs for many years to come.
Best Regards,

J. Kevin Connaughton
President, Columbia Funds
Investing involves risk including the risk of loss of principal.
The Barclays U.S. Aggregate Bond Index is a broad-based benchmark that measures the investment grade, U.S. dollar denominated, fixed-rate taxable bond market, including Treasuries, government-related and corporate securities, mortgage-backed securities (agency fixed-rate and hybrid adjustable-rate mortgage passthroughs), asset-backed securities, and commercial mortgage-backed securities. The S&P 500 Index, an unmanaged index, measures the performance of 500 widely held, large-capitalization U.S. stocks and is frequently used as a general measure of market performance. Indices are not available for investment, are not professionally managed and do not reflect sales charges, fees, brokerage commissions, taxes or other expenses of investing.
Investors should consider the investment objectives, risks, charges and expenses of a mutual fund carefully before investing. For a free prospectus and, if available, a summary prospectus, which contains this and other important information about a fund, visit columbiamanagement.com. The prospectus should be read carefully before investing.
Columbia Funds are distributed by Columbia Management Investment Distributors, Inc., member FINRA, and managed by Columbia Management Investment Advisers, LLC.
© 2014 Columbia Management Investment Advisers, LLC. All rights reserved.
Columbia U.S. Treasury Index Fund
Performance Overview | | | 2 | | |
Manager Discussion of Fund Performance | | | 4 | | |
Understanding Your Fund's Expenses | | | 5 | | |
Portfolio of Investments | | | 6 | | |
Statement of Assets and Liabilities | | | 9 | | |
Statement of Operations | | | 11 | | |
Statement of Changes in Net Assets | | | 12 | | |
Financial Highlights | | | 14 | | |
Notes to Financial Statements | | | 21 | | |
Report of Independent Registered
Public Accounting Firm | | | 26 | | |
Trustees and Officers | | | 27 | | |
Important Information About This Report | | | 33 | | |
Fund Investment Manager
Columbia Management Investment
Advisers, LLC
225 Franklin Street
Boston, MA 02110
Fund Distributor
Columbia Management Investment
Distributors, Inc.
225 Franklin Street
Boston, MA 02110
Fund Transfer Agent
Columbia Management Investment
Services Corp.
P.O. Box 8081
Boston, MA 02266-8081
For more information about any of the funds, please visit columbiamanagement.com or call 800.345.6611. Customer Service Representatives are available to answer your questions Monday through Friday from 8 a.m. to 7 p.m. Eastern time.
The views expressed in this report reflect the current views of the respective parties. These views are not guarantees of future performance and involve certain risks, uncertainties and assumptions that are difficult to predict, so actual outcomes and results may differ significantly from the views expressed. These views are subject to change at any time based upon economic, market or other conditions and the respective parties disclaim any responsibility to update such views. These views may not be relied on as investment advice and, because investment decisions for a Columbia Fund are based on numerous factors, may not be relied on as an indication of trading intent on behalf of any particular Columbia Fund. References to specific securities should not be construed as a recommendation or investment advice.
Columbia U.S. Treasury Index Fund
Performance Summary
> Columbia U.S. Treasury Index Fund (the Fund) Class A shares returned -1.92% excluding sales charges for the 12-month period that ended April 30, 2014.
> The Fund underperformed its benchmark, the Citigroup Bond U.S. Treasury Index, which returned -1.54% over the same period.
> The Fund generally tracked the benchmark in a period challenged by rising interest rates. Fees, which the Fund incurs but the benchmark does not, generally accounted for the slight difference in returns.
Average Annual Total Returns (%) (for period ended April 30, 2014)
| | Inception | | 1 Year | | 5 Years | | 10 Years | |
Class A | | 11/25/02 | | | | | | | |
Excluding sales charges | | | | | -1.92 | | | | 2.73 | | | | 3.98 | | |
Including sales charges | | | | | -6.54 | | | | 1.73 | | | | 3.47 | | |
Class B | | 11/25/02 | | | | | | | |
Excluding sales charges | | | | | -2.74 | | | | 1.94 | | | | 3.19 | | |
Including sales charges | | | | | -7.52 | | | | 1.58 | | | | 3.19 | | |
Class C | | 11/25/02 | | | | | | | |
Excluding sales charges | | | | | -2.59 | | | | 2.10 | | | | 3.35 | | |
Including sales charges | | | | | -3.55 | | | | 2.10 | | | | 3.35 | | |
Class I* | | 09/27/10 | | | -1.76 | | | | 2.96 | | | | 4.22 | | |
Class R5* | | 11/08/12 | | | -1.76 | | | | 2.98 | | | | 4.23 | | |
Class W* | | 06/18/12 | | | -2.00 | | | | 2.57 | | | | 3.79 | | |
Class Z | | 06/04/91 | | | -1.76 | | | | 2.96 | | | | 4.22 | | |
Citigroup Bond U.S. Treasury Index | | | | | -1.54 | | | | 3.14 | | | | 4.43 | | |
Returns for Class A are shown with and without the maximum initial sales charge of 4.75%. Returns for Class B are shown with and without the applicable contingent deferred sales charge (CDSC) of 5.00% in the first year, declining to 1.00% in the sixth year and eliminated thereafter. Returns for Class C are shown with and without the 1.00% CDSC for the first year only. The Fund's other classes are not subject to sales charges and have limited eligibility. Please see the Fund's prospectus for details. Performance for different share classes will vary based on differences in sales charges and fees associated with each class. All results shown assume reinvestment of distributions during the period. Returns do not reflect the deduction of taxes that a shareholder may pay on Fund distributions or on the redemption of Fund shares. Performance results reflect the effect of any fee waivers or reimbursements of Fund expenses by Columbia Management Investment Advisers, LLC and/or any of its affiliates. Absent these fee waivers or expense reimbursement arrangements, performance results would have been lower.
The performance information shown represents past performance and is not a guarantee of future results. The investment return and principal value of your investment will fluctuate so that your shares, when redeemed, may be worth more or less than their original cost. Current performance may be lower or higher than the performance information shown. You may obtain performance information current to the most recent month-end by contacting your financial intermediary, visiting columbiamanagement.com or calling 800.345.6611.
*The returns shown for periods prior to the share class inception date (including returns for the Life of the Fund, if shown, which are since Fund inception) include the returns of the Fund's oldest share class. These returns are adjusted to reflect any higher class-related operating expenses of the newer share classes, as applicable. Please visit columbiamanagement.com/mutual-funds/appended-performance for more information.
The Citigroup Bond U.S. Treasury Index, an index composed of all U.S. Treasury notes and bonds with remaining maturities of at least one year and outstanding principal of at least $25 million that are included in the Citigroup Broad Investment-Grade Bond Index.
Indices are not available for investment, are not professionally managed and do not reflect sales charges, fees, brokerage commissions, taxes or other expenses of investing. Securities in the Fund may not match those in an index.
Annual Report 2014
2
Columbia U.S. Treasury Index Fund
Performance Overview (continued)
Performance of a Hypothetical $10,000 Investment (May 1, 2004 – April 30, 2014)
The chart above shows the change in value of a hypothetical $10,000 investment in Class A shares of Columbia U.S. Treasury Index Fund during the stated time period, and does not reflect the deduction of taxes that a shareholder may pay on Fund distributions or on the redemption of Fund shares.
Annual Report 2014
3
Columbia U.S. Treasury Index Fund
Manager Discussion of Fund Performance
For the 12-month period that ended April 30, 2014, the Fund's Class A shares returned -1.92% excluding sales charges. The Citigroup Bond U.S. Treasury Index returned -1.54% over the same period. The Fund generally tracked the benchmark in a period challenged by rising interest rates. Fees, which the Fund incurs but the benchmark does not, generally accounted for the slight difference in returns.
Stable Economic Growth
Even though a difficult winter weighed on the U.S. economy early in 2014, it was not enough to derail the steady growth that marked the 12-month period. Solid new job growth drove the unemployment rate down to 6.3%. Robust manufacturing activity boosted the nation's capacity utilization rate to a recovery high of 79.2%. Personal income edged higher, borrowing increased and the savings rate declined. Consumer confidence generally rose during the 12-month period, reflecting consumer expectations that the economy appeared to be on solid ground. The housing market lost some momentum, the victim of bad winter weather, tighter borrowing standards, rising prices and higher mortgage rates. However, higher pending home sales near the end of the period was a positive data point.
Against this backdrop, the U.S. Treasury market generated negative returns over the 12-month period, an unusual result for the highest quality sector of the fixed income markets. The Federal Reserve (Fed) drove the Treasury market along the entire spectrum of the yield curve (a chart of Treasury yields from short to long) during the period. At the short end of the curve, yields remained at the historically low levels set several years ago as part of the Fed's effort to stimulate the economy. At the long end of the curve, yields rose in response to then-chairman Ben Bernanke's announcement in the spring of 2013 that the Fed would begin to taper its longstanding program of monthly bond purchases, known as quantitative easing, and they remained in the red for the twelve-month period, despite a rally in early 2014.
In retrospect, Bernanke's move in the spring of 2013 may have been something of a trial balloon, testing the market's response to the inevitable reduction in the Fed's role as a buyer of Treasury securities. And, as so often happens in financial markets, when tapering actually commenced in January 2014 the market was considerably more restrained in its response. Investors recognized that new Fed chairman Janet Yellen would retain the caution of her predecessor, and the market rallied both prior to and after her assumption of the reins in February. For the period as a whole, the five- to 30-year segment of the yield curve flattened during the twelve months. Yields on five-year securities increased a full percentage point, from 0.68% to 1.68%, while 30-year yields rose from 2.88% to 3.46%.
Looking Ahead
At present, we believe the dynamics of the U.S. Treasury market remain solid, even though the Fed will be less of a buyer than it has been in recent years. The economy currently appears to be moving ahead, but at a slower pace than had been projected a year ago. Fed chair Yellen has voiced concern about the sluggishness of the housing and labor markets, and has also noted the absence of inflation in the financial system. Low inflation has been one of the reasons why domestic interest rates have remained low relative to the rest of the world. We would not be surprised to see rates move gradually higher in the next six to 12 months, assuming that economic growth stays at a relatively muted pace.
Portfolio Management
Orhan Imer, Ph.D., CFA
William Finan
Portfolio Breakdown (%)
(at April 30, 2014) | |
Money Market Funds | | | 0.5 | | |
U.S. Treasury Obligations | | | 99.5 | | |
Total | | | 100.0 | | |
Percentages indicated are based upon total investments. The Fund's portfolio composition is subject to change.
Quality Breakdown (%)
(at April 30, 2014) | |
AAA rating | | | 100.0 | | |
Total | | | 100.0 | | |
Percentages indicated are based upon total fixed income securities (excluding Money Market Funds).
Bond ratings apply to the underlying holdings of the Fund and not the Fund itself and are divided into categories ranging from AAA (highest) to D (lowest), and are subject to change. The ratings shown are determined by using the middle rating of Moody's, S&P, and Fitch after dropping the highest and lowest available ratings. When a rating from only two agencies is available, the lower rating is used. When a rating from only one agency is available, that rating is used. When a bond is not rated by one of these agencies, it is designated as Not rated. Credit ratings are subjective opinions and not statements of fact.
Investment Risks
There are risks associated with an investment in this Fund, including credit risk, market risk, interest rate risk and prepayment and extension risk. In general, bond prices rise when interest rates fall and vice versa. This effect is more pronounced for longer-term securities. See the Fund's prospectus for more information on these and other risks.
Annual Report 2014
4
Columbia U.S. Treasury Index Fund
Understanding Your Fund's Expenses
(Unaudited)
As an investor, you incur two types of costs. There are transaction costs, which generally include sales charges on purchases and may include redemption fees. There are also ongoing costs, which generally include management fees, distribution and/or service fees, and other fund expenses. The following information is intended to help you understand your ongoing costs (in dollars) of investing in the Fund and to help you compare these costs with the ongoing costs of investing in other mutual funds.
Analyzing Your Fund's Expenses
To illustrate these ongoing costs, we have provided examples and calculated the expenses paid by investors in each share class of the Fund during the period. The actual and hypothetical information in the table is based on an initial investment of $1,000 at the beginning of the period indicated and held for the entire period. Expense information is calculated two ways and each method provides you with different information. The amount listed in the "Actual" column is calculated using the Fund's actual operating expenses and total return for the period. You may use the Actual information, together with the amount invested, to estimate the expenses that you paid over the period. Simply divide your account value by $1,000 (for example, an $8,600 account value divided by $1,000 = 8.6), then multiply the results by the expenses paid during the period under the "Actual" column. The amount listed in the "Hypothetical" column assumes a 5% annual rate of return before expenses (which is not the Fund's actual return) and then applies the Fund's actual expense ratio for the period to the hypothetical return. You should not use the hypothetical account values and expenses to estimate either your actual account balance at the end of the period or the expenses you paid during the period. See "Compare With Other Funds" below for details on how to use the hypothetical data.
Compare With Other Funds
Since all mutual funds are required to include the same hypothetical calculations about expenses in shareholder reports, you can use this information to compare the ongoing cost of investing in the Fund with other funds. To do so, compare the hypothetical example with the 5% hypothetical examples that appear in the shareholder reports of other funds. As you compare hypothetical examples of other funds, it is important to note that hypothetical examples are meant to highlight the ongoing costs of investing in a fund only and do not reflect any transaction costs, such as sales charges, or redemption or exchange fees. Therefore, the hypothetical calculations are useful in comparing ongoing costs only, and will not help you determine the relative total costs of owning different funds. If transaction costs were included in these calculations, your costs would be higher.
November 1, 2013 – April 30, 2014
| | Account Value at the Beginning
of the Period ($) | | Account Value at the End
of the Period ($) | | Expenses Paid During
the Period ($) | | Fund's Annualized
Expense Ratio (%) | |
| | Actual | | Hypothetical | | Actual | | Hypothetical | | Actual | | Hypothetical | | Actual | |
Class A | | | 1,000.00 | | | | 1,000.00 | | | | 1,004.70 | | | | 1,022.56 | | | | 2.24 | | | | 2.26 | | | | 0.45 | | |
Class B | | | 1,000.00 | | | | 1,000.00 | | | | 1,000.00 | | | | 1,018.84 | | | | 5.95 | | | | 6.01 | | | | 1.20 | | |
Class C | | | 1,000.00 | | | | 1,000.00 | | | | 1,000.80 | | | | 1,019.59 | | | | 5.21 | | | | 5.26 | | | | 1.05 | | |
Class I | | | 1,000.00 | | | | 1,000.00 | | | | 1,005.00 | | | | 1,023.80 | | | | 0.99 | | | | 1.00 | | | | 0.20 | | |
Class R5 | | | 1,000.00 | | | | 1,000.00 | | | | 1,005.90 | | | | 1,023.80 | | | | 0.99 | | | | 1.00 | | | | 0.20 | | |
Class W | | | 1,000.00 | | | | 1,000.00 | | | | 1,004.70 | | | | 1,022.56 | | | | 2.24 | | | | 2.26 | | | | 0.45 | | |
Class Z | | | 1,000.00 | | | | 1,000.00 | | | | 1,005.00 | | | | 1,023.80 | | | | 0.99 | | | | 1.00 | | | | 0.20 | | |
Expenses paid during the period are equal to the annualized expense ratio for each class as indicated above, multiplied by the average account value over the period and then multiplied by the number of days in the Fund's most recent fiscal half year and divided by 365.
Expenses do not include fees and expenses incurred indirectly by the Fund from the underlying funds in which the Fund may invest (also referred to as "acquired funds"), including affiliated and non-affiliated pooled investment vehicles (including mutual funds and exchange-traded funds).
Had Columbia Management Investment Advisers, LLC and/or certain of its affiliates not waived/reimbursed certain fees and expenses, account value at the end of the period would have been reduced.
Annual Report 2014
5
Columbia U.S. Treasury Index Fund
Portfolio of Investments
April 30, 2014
(Percentages represent value of investments compared to net assets)
U.S. Treasury Obligations 99.1%
Issuer | | Coupon
Rate | | Principal
Amount ($) | | Value ($) | |
U.S. Treasury
02/15/15 | | | 11.250 | % | | | 2,950,000 | | | | 3,209,969 | | |
06/30/15 | | | 0.375 | % | | | 3,210,000 | | | | 3,219,028 | | |
07/15/15 | | | 0.250 | % | | | 5,395,000 | | | | 5,401,533 | | |
08/15/15 | | | 0.250 | % | | | 7,860,000 | | | | 7,868,292 | | |
08/31/15 | | | 0.375 | % | | | 2,930,000 | | | | 2,937,783 | | |
10/15/15 | | | 0.250 | % | | | 4,750,000 | | | | 4,752,598 | | |
10/31/15 | | | 0.250 | % | | | 2,455,000 | | | | 2,455,960 | | |
11/30/15 | | | 0.250 | % | | | 1,585,000 | | | | 1,584,938 | | |
11/30/15 | | | 1.375 | % | | | 9,545,000 | | | | 9,714,643 | | |
12/15/15 | | | 0.250 | % | | | 7,415,000 | | | | 7,412,390 | | |
12/31/15 | | | 0.250 | % | | | 2,335,000 | | | | 2,333,905 | | |
01/31/16 | | | 0.375 | % | | | 2,570,000 | | | | 2,572,811 | | |
01/31/16 | | | 2.000 | % | | | 14,850,000 | | | | 15,287,377 | | |
02/29/16 | | | 0.250 | % | | | 1,385,000 | | | | 1,382,620 | | |
03/15/16 | | | 0.375 | % | | | 5,880,000 | | | | 5,880,919 | | |
03/31/16 | | | 0.375 | % | | | 2,430,000 | | | | 2,429,620 | | |
04/15/16 | | | 0.250 | % | | | 6,020,000 | | | | 6,002,361 | | |
04/30/16 | | | 0.375 | % | | | 900,000 | | | | 899,227 | | |
04/30/16 | | | 2.000 | % | | | 1,140,000 | | | | 1,175,714 | | |
06/15/16 | | | 0.500 | % | | | 3,265,000 | | | | 3,266,786 | | |
08/15/16 | | | 0.625 | % | | | 3,355,000 | | | | 3,360,242 | | |
09/15/16 | | | 0.875 | % | | | 2,370,000 | | | | 2,385,739 | | |
09/30/16 | | | 1.000 | % | | | 4,600,000 | | | | 4,643,125 | | |
10/15/16 | | | 0.625 | % | | | 3,650,000 | | | | 3,648,859 | | |
11/15/16 | | | 7.500 | % | | | 4,275,000 | | | | 5,010,099 | | |
12/15/16 | | | 0.625 | % | | | 3,570,000 | | | | 3,562,189 | | |
02/15/17 | | | 0.625 | % | | | 3,505,000 | | | | 3,489,666 | | |
04/15/17 | | | 0.875 | % | | | 1,390,000 | | | | 1,390,869 | | |
04/30/17 | | | 3.125 | % | | | 6,635,000 | | | | 7,076,121 | | |
05/31/17 | | | 0.625 | % | | | 5,370,000 | | | | 5,321,337 | | |
08/31/17 | | | 0.625 | % | | | 5,275,000 | | | | 5,201,234 | | |
08/31/17 | | | 1.875 | % | | | 6,915,000 | | | | 7,104,084 | | |
10/31/17 | | | 0.750 | % | | | 3,200,000 | | | | 3,158,906 | | |
10/31/17 | | | 1.875 | % | | | 7,445,000 | | | | 7,638,689 | | |
12/31/17 | | | 0.750 | % | | | 760,000 | | | | 747,709 | | |
02/15/18 | | | 3.500 | % | | | 10,790,000 | | | | 11,690,296 | | |
04/30/18 | | | 0.625 | % | | | 4,650,000 | | | | 4,522,488 | | |
05/15/18 | | | 3.875 | % | | | 5,755,000 | | | | 6,333,648 | | |
06/30/18 | | | 2.375 | % | | | 2,820,000 | | | | 2,933,680 | | |
08/31/18 | | | 1.500 | % | | | 4,065,000 | | | | 4,069,764 | | |
09/30/18 | | | 1.375 | % | | | 1,595,000 | | | | 1,586,277 | | |
10/31/18 | | | 1.250 | % | | | 1,645,000 | | | | 1,624,822 | | |
11/30/18 | | | 1.250 | % | | | 1,790,000 | | | | 1,764,829 | | |
12/31/18 | | | 1.500 | % | | | 1,840,000 | | | | 1,832,381 | | |
01/31/19 | | | 1.500 | % | | | 1,725,000 | | | | 1,715,701 | | |
02/28/19 | | | 1.500 | % | | | 1,850,000 | | | | 1,838,149 | | |
03/31/19 | | | 1.500 | % | | | 1,870,000 | | | | 1,855,975 | | |
03/31/19 | | | 1.625 | % | | | 1,720,000 | | | | 1,716,775 | | |
06/30/19 | | | 1.000 | % | | | 560,000 | | | | 539,131 | | |
07/31/19 | | | 0.875 | % | | | 1,640,000 | | | | 1,565,303 | | |
11/15/19 | | | 3.375 | % | | | 11,925,000 | | | | 12,901,359 | | |
12/31/19 | | | 1.125 | % | | | 1,785,000 | | | | 1,710,114 | | |
03/31/20 | | | 1.125 | % | | | 2,380,000 | | | | 2,267,507 | | |
05/15/20 | | | 3.500 | % | | | 2,350,000 | | | | 2,555,625 | | |
05/31/20 | | | 1.375 | % | | | 2,700,000 | | | | 2,601,493 | | |
07/31/20 | | | 2.000 | % | | | 1,015,000 | | | | 1,012,383 | | |
U.S. Treasury Obligations (continued)
Issuer | | Coupon
Rate | | Principal
Amount ($) | | Value ($) | |
08/15/20 | | | 2.625 | % | | | 5,305,000 | | | | 5,482,389 | | |
08/31/20 | | | 2.125 | % | | | 1,495,000 | | | | 1,498,737 | | |
09/30/20 | | | 2.000 | % | | | 2,580,000 | | | | 2,563,674 | | |
10/31/20 | | | 1.750 | % | | | 1,830,000 | | | | 1,787,253 | | |
11/30/20 | | | 2.000 | % | | | 1,270,000 | | | | 1,257,995 | | |
12/31/20 | | | 2.375 | % | | | 1,390,000 | | | | 1,408,352 | | |
01/31/21 | | | 2.125 | % | | | 1,225,000 | | | | 1,220,024 | | |
02/15/21 | | | 3.625 | % | | | 7,430,000 | | | | 8,120,760 | | |
02/28/21 | | | 2.000 | % | | | 1,540,000 | | | | 1,519,667 | | |
03/31/21 | | | 2.250 | % | | | 1,525,000 | | | | 1,527,978 | | |
05/15/21 | | | 3.125 | % | | | 3,085,000 | | | | 3,266,725 | | |
02/15/22 | | | 2.000 | % | | | 230,000 | | | | 223,747 | | |
11/15/22 | | | 1.625 | % | | | 1,010,000 | | | | 941,036 | | |
02/15/23 | | | 2.000 | % | | | 2,630,000 | | | | 2,517,197 | | |
05/15/23 | | | 1.750 | % | | | 2,245,000 | | | | 2,094,163 | | |
08/15/23 | | | 2.500 | % | | | 2,540,000 | | | | 2,520,158 | | |
11/15/23 | | | 2.750 | % | | | 3,130,000 | | | | 3,163,745 | | |
02/15/24 | | | 2.750 | % | | | 3,195,000 | | | | 3,222,956 | | |
02/15/26 | | | 6.000 | % | | | 4,390,000 | | | | 5,810,578 | | |
11/15/28 | | | 5.250 | % | | | 685,000 | | | | 864,706 | | |
02/15/29 | | | 5.250 | % | | | 360,000 | | | | 454,725 | | |
08/15/39 | | | 4.500 | % | | | 725,000 | | | | 866,601 | | |
02/15/40 | | | 4.625 | % | | | 4,120,000 | | | | 5,022,535 | | |
05/15/40 | | | 4.375 | % | | | 2,075,000 | | | | 2,437,478 | | |
11/15/40 | | | 4.250 | % | | | 4,135,000 | | | | 4,768,172 | | |
02/15/41 | | | 4.750 | % | | | 3,910,000 | | | | 4,867,950 | | |
11/15/42 | | | 2.750 | % | | | 1,365,000 | | | | 1,188,190 | | |
02/15/43 | | | 3.125 | % | | | 1,935,000 | | | | 1,818,598 | | |
05/15/43 | | | 2.875 | % | | | 2,355,000 | | | | 2,098,526 | | |
08/15/43 | | | 3.625 | % | | | 2,060,000 | | | | 2,125,662 | | |
11/15/43 | | | 3.750 | % | | | 2,180,000 | | | | 2,300,240 | | |
02/15/44 | | | 3.625 | % | | | 2,165,000 | | | | 2,231,981 | | |
Total U.S. Treasury Obligations
(Cost: $297,032,519) | | | | | | | 303,357,540 | | |
Money Market Funds 0.4%
| | | Shares | | Value ($) | |
Columbia Short-Term Cash Fund,
0.092%(a)(b) | | | 1,373,046 | | | | 1,373,046 | | |
Total Money Market Funds
(Cost: $1,373,046) | | | | | 1,373,046 | | |
Total Investments
(Cost: $298,405,565) | | | | | 304,730,586 | | |
Other Assets & Liabilities, Net | | | | | 1,486,371 | | |
Net Assets | | | | | 306,216,957 | | |
The accompanying Notes to Financial Statements are an integral part of this statement.
Annual Report 2014
6
Columbia U.S. Treasury Index Fund
Portfolio of Investments (continued)
April 30, 2014
Notes to Portfolio of Investments
(a) The rate shown is the seven-day current annualized yield at April 30, 2014.
(b) As defined in the Investment Company Act of 1940, an affiliated company is one in which the Fund owns 5% or more of its outstanding voting securities, or a company which is under common ownership or control with the Fund. Holdings and transactions in these affiliated companies during the year ended April 30, 2014, are as follows:
Issuer | | Beginning
Cost ($) | | Purchase
Cost ($) | | Proceeds
From Sales ($) | | Ending
Cost ($) | | Dividends —
Affiliated
Issuers ($) | | Value ($) | |
Columbia Short-Term Cash Fund | | | 1,514,519 | | | | 51,167,171 | | | | (51,308,644 | ) | | | 1,373,046 | | | | 817 | | | | 1,373,046 | | |
Fair Value Measurements
Generally accepted accounting principles (GAAP) require disclosure regarding the inputs and valuation techniques used to measure fair value and any changes in valuation inputs or techniques. In addition, investments shall be disclosed by major category.
The Fund categorizes its fair value measurements according to a three-level hierarchy that maximizes the use of observable inputs and minimizes the use of unobservable inputs by prioritizing that the most observable input be used when available. Observable inputs are those that market participants would use in pricing an investment based on market data obtained from sources independent of the reporting entity. Unobservable inputs are those that reflect the Fund's assumptions about the information market participants would use in pricing an investment. An investment's level within the fair value hierarchy is based on the lowest level of any input that is deemed significant to the asset or liability's fair value measurement. The input levels are not necessarily an indication of the risk or liquidity associated with investments at that level. For example, certain U.S. government securities are generally high quality and liquid, however, they are reflected as Level 2 because the inputs used to determine fair value may not always be quoted prices in an active market.
Fair value inputs are summarized in the three broad levels listed below:
> Level 1 — Valuations based on quoted prices for investments in active markets that the Fund has the ability to access at the measurement date (including NAV for open-end mutual funds). Valuation adjustments are not applied to Level 1 investments.
> Level 2 — Valuations based on other significant observable inputs (including quoted prices for similar securities, interest rates, prepayment speeds, credit risks, etc.).
> Level 3 — Valuations based on significant unobservable inputs (including the Fund's own assumptions and judgment in determining the fair value of investments).
Inputs that are used in determining fair value of an investment may include price information, credit data, volatility statistics, and other factors. These inputs can be either observable or unobservable. The availability of observable inputs can vary between investments, and is affected by various factors such as the type of investment, and the volume and level of activity for that investment or similar investments in the marketplace. The inputs will be considered by the Investment Manager, along with any other relevant factors in the calculation of an investment's fair value. The Fund uses prices and inputs that are current as of the measurement date, which may include periods of market dislocations. During these periods, the availability of prices and inputs may be reduced for many investments. This condition could cause an investment to be reclassified between the various levels within the hierarchy.
Investments falling into the Level 3 category are primarily supported by quoted prices from brokers and dealers participating in the market for those investments. However, these may be classified as Level 3 investments due to lack of market transparency and corroboration to support these quoted prices. Additionally, valuation models may be used as the pricing source for any remaining investments classified as Level 3. These models may rely on one or more significant unobservable inputs and/or significant assumptions by the Investment Manager. Inputs used in valuations may include, but are not limited to, financial statement analysis, capital account balances, discount rates and estimated cash flows, and comparable company data.
Under the direction of the Fund's Board of Trustees (the Board), the Investment Manager's Valuation Committee (the Committee) is responsible for overseeing the valuation procedures approved by the Board. The Committee consists of voting and non-voting members from various groups within the Investment Manager's organization, including operations and accounting, trading and investments, compliance, risk management and legal.
The Committee meets at least monthly to review and approve valuation matters, which may include a description of specific valuation determinations, data regarding pricing information received from approved pricing vendors and brokers and the results of Board-approved valuation control policies and procedures (the Policies). The Policies address, among other things, instances when market quotations are or are not readily available, including recommendations of third party pricing vendors and a determination of appropriate pricing methodologies; events that require specific valuation determinations and assessment of fair value techniques; securities with a potential for stale pricing, including those that are illiquid, restricted, or in default; and the effectiveness of third party pricing vendors, including periodic reviews of vendors. The Committee meets more frequently, as needed, to discuss additional valuation matters, which may include the need to review back-testing results, review time-sensitive information or approve related valuation actions. The Committee reports to the Board, with members of the Committee meeting with the Board at each of its regularly scheduled meetings to discuss valuation matters and actions during the period, similar to those described earlier.
The accompanying Notes to Financial Statements are an integral part of this statement.
Annual Report 2014
7
Columbia U.S. Treasury Index Fund
Portfolio of Investments (continued)
April 30, 2014
Fair Value Measurements (continued)
For investments categorized as Level 3, the Committee monitors information similar to that described above, which may include: (i) data specific to the issuer or comparable issuers, (ii) general market or specific sector news and (iii) quoted prices and specific or similar security transactions. The Committee considers this data and any changes from prior periods in order to assess the reasonableness of observable and unobservable inputs, any assumptions or internal models used to value those securities and changes in fair value. This data is also used to corroborate, when available, information received from approved pricing vendors and brokers. Various factors impact the frequency of monitoring this information (which may occur as often as daily). However, the Committee may determine that changes to inputs, assumptions and models are not required as a result of the monitoring procedures performed.
The following table is a summary of the inputs used to value the Fund's investments at April 30, 2014:
Description | | Level 1
Quoted Prices in Active
Markets for Identical
Assets ($) | | Level 2
Other Significant
Observable Inputs ($) | | Level 3
Significant
Unobservable Inputs ($) | | Total ($) | |
Bonds | |
U.S. Treasury Obligations | | | 303,357,540 | | | | — | | | | — | | | | 303,357,540 | | |
Total Bonds | | | 303,357,540 | | | | — | | | | — | | | | 303,357,540 | | |
Mutual Funds | |
Money Market Funds | | | 1,373,046 | | | | — | | | | — | | | | 1,373,046 | | |
Total Mutual Funds | | | 1,373,046 | | | | — | | | | — | | | | 1,373,046 | | |
Total | | | 304,730,586 | | | | — | | | | — | | | | 304,730,586 | | |
See the Portfolio of Investments for all investment classifications not indicated in the table.
There were no transfers of financial assets between levels during the period.
The accompanying Notes to Financial Statements are an integral part of this statement.
Annual Report 2014
8
Columbia U.S. Treasury Index Fund
Statement of Assets and Liabilities
April 30, 2014
Assets | |
Investments, at value | |
Unaffiliated issuers (identified cost $297,032,519) | | $ | 303,357,540 | | |
Affiliated issuers (identified cost $1,373,046) | | | 1,373,046 | | |
Total investments (identified cost $298,405,565) | | | 304,730,586 | | |
Receivable for: | |
Investments sold | | | 9,341,779 | | |
Capital shares sold | | | 916,687 | | |
Dividends | | | 66 | | |
Interest | | | 1,690,379 | | |
Expense reimbursement due from Investment Manager | | | 1,741 | | |
Trustees' deferred compensation plan | | | 39,572 | | |
Other assets | | | 1,973 | | |
Total assets | | | 316,722,783 | | |
Liabilities | |
Payable for: | |
Investments purchased | | | 9,785,929 | | |
Capital shares purchased | | | 327,845 | | |
Dividend distributions to shareholders | | | 348,683 | | |
Investment management fees | | | 836 | | |
Distribution and/or service fees | | | 421 | | |
Administration fees | | | 2,507 | | |
Other expenses | | | 33 | | |
Trustees' deferred compensation plan | | | 39,572 | | |
Total liabilities | | | 10,505,826 | | |
Net assets applicable to outstanding capital stock | | $ | 306,216,957 | | |
Represented by | |
Paid-in capital | | $ | 301,519,079 | | |
Excess of distributions over net investment income | | | (83,149 | ) | |
Accumulated net realized loss | | | (1,543,994 | ) | |
Unrealized appreciation (depreciation) on: | |
Investments | | | 6,325,021 | | |
Total — representing net assets applicable to outstanding capital stock | | $ | 306,216,957 | | |
The accompanying Notes to Financial Statements are an integral part of this statement.
Annual Report 2014
9
Columbia U.S. Treasury Index Fund
Statement of Assets and Liabilities (continued)
April 30, 2014
Class A | |
Net assets | | $ | 22,163,229 | | |
Shares outstanding | | | 2,009,783 | | |
Net asset value per share | | $ | 11.03 | | |
Maximum offering price per share(a) | | $ | 11.58 | | |
Class B | |
Net assets | | $ | 1,488,690 | | |
Shares outstanding | | | 135,034 | | |
Net asset value per share | | $ | 11.02 | | |
Class C | |
Net assets | | $ | 6,417,038 | | |
Shares outstanding | | | 582,084 | | |
Net asset value per share | | $ | 11.02 | | |
Class I | |
Net assets | | $ | 68,253,918 | | |
Shares outstanding | | | 6,191,027 | | |
Net asset value per share | | $ | 11.02 | | |
Class R5 | |
Net assets | | $ | 1,430,571 | | |
Shares outstanding | | | 129,948 | | |
Net asset value per share | | $ | 11.01 | | |
Class W | |
Net assets | | $ | 12,166,668 | | |
Shares outstanding | | | 1,104,312 | | |
Net asset value per share | | $ | 11.02 | | |
Class Z | |
Net assets | | $ | 194,296,843 | | |
Shares outstanding | | | 17,623,736 | | |
Net asset value per share | | $ | 11.02 | | |
(a) The maximum offering price per share is calculated by dividing the net asset value per share by 1.0 minus the maximum sales charge of 4.75%.
The accompanying Notes to Financial Statements are an integral part of this statement.
Annual Report 2014
10
Columbia U.S. Treasury Index Fund
Statement of Operations
Year Ended April 30, 2014
Net investment income | |
Income: | |
Dividends — affiliated issuers | | $ | 817 | | |
Interest | | | 5,328,155 | | |
Total income | | | 5,328,972 | | |
Expenses: | |
Investment management fees | | | 315,583 | | |
Distribution and/or service fees | |
Class A | | | 64,096 | | |
Class B | | | 17,575 | | |
Class C | | | 76,119 | | |
Class W | | | 50,099 | | |
Administration fees | | | 946,749 | | |
Compensation of board members | | | 26,140 | | |
Other | | | 638 | | |
Total expenses | | | 1,496,999 | | |
Fees waived or expenses reimbursed by Investment Manager and its affiliates | | | (657,944 | ) | |
Fees waived by Distributor — Class C | | | (11,418 | ) | |
Expense reductions | | | (1,500 | ) | |
Total net expenses | | | 826,137 | | |
Net investment income | | | 4,502,835 | | |
Realized and unrealized gain (loss) — net | |
Net realized gain (loss) on: | |
Investments | | | (1,223,653 | ) | |
Net realized loss | | | (1,223,653 | ) | |
Net change in unrealized appreciation (depreciation) on: | |
Investments | | | (10,085,898 | ) | |
Net change in unrealized appreciation (depreciation) | | | (10,085,898 | ) | |
Net realized and unrealized loss | | | (11,309,551 | ) | |
Net decrease in net assets resulting from operations | | $ | (6,806,716 | ) | |
The accompanying Notes to Financial Statements are an integral part of this statement.
Annual Report 2014
11
Columbia U.S. Treasury Index Fund
Statement of Changes in Net Assets
| | | Year Ended
April 30,
2014 | | Year Ended
April 30,
2013(a)(b) | |
Operations | |
Net investment income | | $ | 4,502,835 | | | $ | 5,334,771 | | |
Net realized gain (loss) | | | (1,223,653 | ) | | | 8,349,708 | | |
Net change in unrealized appreciation (depreciation) | | | (10,085,898 | ) | | | (4,436,046 | ) | |
Net increase (decrease) in net assets resulting from operations | | | (6,806,716 | ) | | | 9,248,433 | | |
Distributions to shareholders | |
Net investment income | |
Class A | | | (333,673 | ) | | | (450,163 | ) | |
Class B | | | (9,781 | ) | | | (9,733 | ) | |
Class C | | | (53,673 | ) | | | (58,753 | ) | |
Class I | | | (855,897 | ) | | | (1,209,465 | ) | |
Class R5 | | | (16,622 | ) | | | (15 | ) | |
Class W | | | (255,575 | ) | | | (181,755 | ) | |
Class Z | | | (3,193,686 | ) | | | (3,279,988 | ) | |
Net realized gains | |
Class A | | | (257,886 | ) | | | (1,430,431 | ) | |
Class B | | | (18,327 | ) | | | (78,182 | ) | |
Class C | | | (78,423 | ) | | | (332,285 | ) | |
Class I | | | (587,116 | ) | | | (3,114,383 | ) | |
Class R5 | | | (21,912 | ) | | | (29 | ) | |
Class W | | | (148,597 | ) | | | (353,950 | ) | |
Class Z | | | (2,175,967 | ) | | | (6,874,241 | ) | |
Total distributions to shareholders | | | (8,007,135 | ) | | | (17,373,373 | ) | |
Increase (decrease) in net assets from capital stock activity | | | (31,190,969 | ) | | | (60,029,268 | ) | |
Total decrease in net assets | | | (46,004,820 | ) | | | (68,154,208 | ) | |
Net assets at beginning of year | | | 352,221,777 | | | | 420,375,985 | | |
Net assets at end of year | | $ | 306,216,957 | | | $ | 352,221,777 | | |
Undistributed (excess of distributions over) net investment income | | $ | (83,149 | ) | | $ | 84,709 | | |
(a) Class R5 shares are for the period from November 8, 2012 (commencement of operations) to April 30, 2013.
(b) Class W shares are for the period from June 18, 2012 (commencement of operations) to April 30, 2013.
The accompanying Notes to Financial Statements are an integral part of this statement.
Annual Report 2014
12
Columbia U.S. Treasury Index Fund
Statement of Changes in Net Assets (continued)
| | | Year Ended April 30, 2014 | | Year Ended April 30, 2013(a)(b) | |
| | | Shares | | Dollars ($) | | Shares | | Dollars ($) | |
Capital stock activity | |
Class A shares | |
Subscriptions(c) | | | 3,089,364 | | | | 34,469,246 | | | | 3,077,815 | | | | 36,242,825 | | |
Distributions reinvested | | | 47,396 | | | | 523,674 | | | | 138,066 | | | | 1,606,026 | | |
Redemptions | | | (3,568,295 | ) | | | (39,553,756 | ) | | | (4,412,358 | ) | | | (51,348,149 | ) | |
Net decrease | | | (431,535 | ) | | | (4,560,836 | ) | | | (1,196,477 | ) | | | (13,499,298 | ) | |
Class B shares | |
Subscriptions | | | 877 | | | | 9,660 | | | | 3,356 | | | | 39,207 | | |
Distributions reinvested | | | 1,533 | | | | 16,886 | | | | 4,611 | | | | 53,620 | | |
Redemptions(c) | | | (54,986 | ) | | | (610,402 | ) | | | (84,690 | ) | | | (984,814 | ) | |
Net decrease | | | (52,576 | ) | | | (583,856 | ) | | | (76,723 | ) | | | (891,987 | ) | |
Class C shares | |
Subscriptions | | | 67,813 | | | | 752,416 | | | | 178,307 | | | | 2,086,582 | | |
Distributions reinvested | | | 11,673 | | | | 128,643 | | | | 31,299 | | | | 363,785 | | |
Redemptions | | | (374,983 | ) | | | (4,184,965 | ) | | | (322,802 | ) | | | (3,737,826 | ) | |
Net decrease | | | (295,497 | ) | | | (3,303,906 | ) | | | (113,196 | ) | | | (1,287,459 | ) | |
Class I shares | |
Subscriptions | | | 1,806,924 | | | | 19,904,153 | | | | 6,609,188 | | | | 77,298,675 | | |
Distributions reinvested | | | 130,700 | | | | 1,442,939 | | | | 369,314 | | | | 4,293,816 | | |
Redemptions | | | (516,420 | ) | | | (5,734,581 | ) | | | (9,969,808 | ) | | | (115,772,087 | ) | |
Net increase (decrease) | | | 1,421,204 | | | | 15,612,511 | | | | (2,991,306 | ) | | | (34,179,596 | ) | |
Class R5 shares | |
Subscriptions | | | 236,269 | | | | 2,612,661 | | | | 214 | | | | 2,503 | | |
Distributions reinvested | | | 3,498 | | | | 38,414 | | | | — | | | | — | | |
Redemptions | | | (110,033 | ) | | | (1,209,299 | ) | | | — | | | | — | | |
Net increase | | | 129,734 | | | | 1,441,776 | | | | 214 | | | | 2,503 | | |
Class W shares | |
Subscriptions | | | 325,889 | | | | 3,635,261 | | | | 3,028,239 | | | | 35,099,009 | | |
Distributions reinvested | | | 36,538 | | | | 404,116 | | | | 46,425 | | | | 535,613 | | |
Redemptions | | | (1,791,262 | ) | | | (19,964,892 | ) | | | (541,517 | ) | | | (6,198,078 | ) | |
Net increase (decrease) | | | (1,428,835 | ) | | | (15,925,515 | ) | | | 2,533,147 | | | | 29,436,544 | | |
Class Z shares | |
Subscriptions | | | 3,960,069 | | | | 43,966,964 | | | | 7,165,709 | | | | 83,606,335 | | |
Distributions reinvested | | | 335,254 | | | | 3,701,838 | | | | 491,477 | | | | 5,707,459 | | |
Redemptions | | | (6,431,875 | ) | | | (71,539,945 | ) | | | (11,057,539 | ) | | | (128,923,769 | ) | |
Net decrease | | | (2,136,552 | ) | | | (23,871,143 | ) | | | (3,400,353 | ) | | | (39,609,975 | ) | |
Total net decrease | | | (2,794,057 | ) | | | (31,190,969 | ) | | | (5,244,694 | ) | | | (60,029,268 | ) | |
(a) Class R5 shares are for the period from November 8, 2012 (commencement of operations) to April 30, 2013.
(b) Class W shares are for the period from June 18, 2012 (commencement of operations) to April 30, 2013.
(c) Includes conversions of Class B shares to Class A shares, if any.
The accompanying Notes to Financial Statements are an integral part of this statement.
Annual Report 2014
13
Columbia U.S. Treasury Index Fund
The following tables are intended to help you understand the Fund's financial performance. Certain information reflects financial results for a single share of a class held for the periods shown. Per share net investment income (loss) amounts are calculated based on average shares outstanding during the period. Total return assumes reinvestment of all dividends and distributions, if any. Total return does not reflect payment of sales charges, if any, and is not annualized for periods of less than one year.
| | | Year Ended April 30, | | Year Ended March 31, | |
Class A | | 2014 | | 2013 | | 2012(a) | | 2012 | | 2011 | | 2010 | |
Per share data | |
Net asset value, beginning of period | | $ | 11.52 | | | $ | 11.74 | | | $ | 11.59 | | | $ | 11.03 | | | $ | 11.12 | | | $ | 11.64 | | |
Income from investment operations: | |
Net investment income | | | 0.14 | | | | 0.13 | | | | 0.01 | | | | 0.18 | | | | 0.23 | | | | 0.27 | | |
Net realized and unrealized gain (loss) | | | (0.36 | ) | | | 0.11 | | | | 0.15 | | | | 0.70 | | | | 0.22 | | | | (0.45 | ) | |
Total from investment operations | | | (0.22 | ) | | | 0.24 | | | | 0.16 | | | | 0.88 | | | | 0.45 | | | | (0.18 | ) | |
Less distributions to shareholders: | |
Net investment income | | | (0.15 | ) | | | (0.13 | ) | | | (0.01 | ) | | | (0.19 | ) | | | (0.27 | ) | | | (0.34 | ) | |
Net realized gains | | | (0.12 | ) | | | (0.33 | ) | | | — | | | | (0.13 | ) | | | (0.27 | ) | | | (0.00 | )(b) | |
Total distributions to shareholders | | | (0.27 | ) | | | (0.46 | ) | | | (0.01 | ) | | | (0.32 | ) | | | (0.54 | ) | | | (0.34 | ) | |
Net asset value, end of period | | $ | 11.03 | | | $ | 11.52 | | | $ | 11.74 | | | $ | 11.59 | | | $ | 11.03 | | | $ | 11.12 | | |
Total return | | | (1.92 | %) | | | 2.06 | % | | | 1.40 | % | | | 8.01 | % | | | 4.04 | % | | | (1.53 | %) | |
Ratios to average net assets(c) | |
Total gross expenses | | | 0.66 | % | | | 0.66 | % | | | 0.66 | %(d) | | | 0.66 | %(e) | | | 0.66 | %(e) | | | 0.66 | %(e) | |
Total net expenses(f) | | | 0.45 | %(g) | | | 0.45 | %(g) | | | 0.45 | %(d) | | | 0.45 | %(e)(g) | | | 0.45 | %(e) | | | 0.48 | %(e) | |
Net investment income | | | 1.24 | % | | | 1.15 | % | | | 1.30 | %(d) | | | 1.55 | % | | | 2.04 | % | | | 2.44 | % | |
Supplemental data | |
Net assets, end of period (in thousands) | | $ | 22,163 | | | $ | 28,129 | | | $ | 42,700 | | | $ | 43,818 | | | $ | 41,739 | | | $ | 47,105 | | |
Portfolio turnover | | | 76 | % | | | 99 | % | | | 7 | % | | | 106 | % | | | 142 | % | | | 118 | % | |
Notes to Financial Highlights
(a) For the period from April 1, 2012 to April 30, 2012. During the period, the Fund's fiscal year end was changed from March 31 to April 30.
(b) Rounds to zero.
(c) In addition to the fees and expenses which the Fund bears directly, the Fund indirectly bears a pro rata share of the fees and expenses of the acquired funds in which it invests. Such indirect expenses are not included in the reported expense ratios.
(d) Annualized.
(e) Ratios include line of credit interest expense which rounds to less than 0.01%.
(f) Total net expenses include the impact of certain waivers/reimbursements made by the Investment Manager and certain of its affiliates, if applicable.
(g) The benefits derived from expense reductions had an impact of less than 0.01%.
The accompanying Notes to Financial Statements are an integral part of this statement.
Annual Report 2014
14
Columbia U.S. Treasury Index Fund
Financial Highlights (continued)
| | | Year Ended April 30, | | Year Ended March 31, | |
Class B | | 2014 | | 2013 | | 2012(a) | | 2012 | | 2011 | | 2010 | |
Per share data | |
Net asset value, beginning of period | | $ | 11.52 | | | $ | 11.74 | | | $ | 11.59 | | | $ | 11.03 | | | $ | 11.12 | | | $ | 11.64 | | |
Income from investment operations: | |
Net investment income | | | 0.05 | | | | 0.05 | | | | 0.01 | | | | 0.10 | | | | 0.15 | | | | 0.19 | | |
Net realized and unrealized gain (loss) | | | (0.37 | ) | | | 0.10 | | | | 0.14 | | | | 0.69 | | | | 0.22 | | | | (0.45 | ) | |
Total from investment operations | | | (0.32 | ) | | | 0.15 | | | | 0.15 | | | | 0.79 | | | | 0.37 | | | | (0.26 | ) | |
Less distributions to shareholders: | |
Net investment income | | | (0.06 | ) | | | (0.04 | ) | | | (0.00 | )(b) | | | (0.10 | ) | | | (0.19 | ) | | | (0.26 | ) | |
Net realized gains | | | (0.12 | ) | | | (0.33 | ) | | | — | | | | (0.13 | ) | | | (0.27 | ) | | | (0.00 | )(b) | |
Total distributions to shareholders | | | (0.18 | ) | | | (0.37 | ) | | | (0.00 | )(b) | | | (0.23 | ) | | | (0.46 | ) | | | (0.26 | ) | |
Net asset value, end of period | | $ | 11.02 | | | $ | 11.52 | | | $ | 11.74 | | | $ | 11.59 | | | $ | 11.03 | | | $ | 11.12 | | |
Total return | | | (2.74 | %) | | | 1.30 | % | | | 1.34 | % | | | 7.21 | % | | | 3.27 | % | | | (2.26 | %) | |
Ratios to average net assets(c) | |
Total gross expenses | | | 1.41 | % | | | 1.40 | % | | | 1.41 | %(d) | | | 1.41 | %(e) | | | 1.41 | %(e) | | | 1.41 | %(e) | |
Total net expenses(f) | | | 1.20 | %(g) | | | 1.20 | %(g) | | | 1.20 | %(d) | | | 1.20 | %(e)(g) | | | 1.20 | %(e) | | | 1.23 | %(e) | |
Net investment income | | | 0.49 | % | | | 0.40 | % | | | 0.55 | %(d) | | | 0.83 | % | | | 1.29 | % | | | 1.69 | % | |
Supplemental data | |
Net assets, end of period (in thousands) | | $ | 1,489 | | | $ | 2,162 | | | $ | 3,102 | | | $ | 3,143 | | | $ | 4,053 | | | $ | 5,810 | | |
Portfolio turnover | | | 76 | % | | | 99 | % | | | 7 | % | | | 106 | % | | | 142 | % | | | 118 | % | |
Notes to Financial Highlights
(a) For the period from April 1, 2012 to April 30, 2012. During the period, the Fund's fiscal year end was changed from March 31 to April 30.
(b) Rounds to zero.
(c) In addition to the fees and expenses which the Fund bears directly, the Fund indirectly bears a pro rata share of the fees and expenses of the acquired funds in which it invests. Such indirect expenses are not included in the reported expense ratios.
(d) Annualized.
(e) Ratios include line of credit interest expense which rounds to less than 0.01%.
(f) Total net expenses include the impact of certain waivers/reimbursements made by the Investment Manager and certain of its affiliates, if applicable.
(g) The benefits derived from expense reductions had an impact of less than 0.01%.
The accompanying Notes to Financial Statements are an integral part of this statement.
Annual Report 2014
15
Columbia U.S. Treasury Index Fund
Financial Highlights (continued)
| | | Year Ended April 30, | | Year Ended March 31, | |
Class C | | 2014 | | 2013 | | 2012(a) | | 2012 | | 2011 | | 2010 | |
Per share data | |
Net asset value, beginning of period | | $ | 11.52 | | | $ | 11.74 | | | $ | 11.59 | | | $ | 11.03 | | | $ | 11.12 | | | $ | 11.64 | | |
Income from investment operations: | |
Net investment income | | | 0.07 | | | | 0.06 | | | | 0.01 | | | | 0.11 | | | | 0.16 | | | | 0.21 | | |
Net realized and unrealized gain (loss) | | | (0.37 | ) | | | 0.11 | | | | 0.15 | | | | 0.70 | | | | 0.23 | | | | (0.46 | ) | |
Total from investment operations | | | (0.30 | ) | | | 0.17 | | | | 0.16 | | | | 0.81 | | | | 0.39 | | | | (0.25 | ) | |
Less distributions to shareholders: | |
Net investment income | | | (0.08 | ) | | | (0.06 | ) | | | (0.01 | ) | | | (0.12 | ) | | | (0.21 | ) | | | (0.27 | ) | |
Net realized gains | | | (0.12 | ) | | | (0.33 | ) | | | — | | | | (0.13 | ) | | | (0.27 | ) | | | (0.00 | )(b) | |
Total distributions to shareholders | | | (0.20 | ) | | | (0.39 | ) | | | (0.01 | ) | | | (0.25 | ) | | | (0.48 | ) | | | (0.27 | ) | |
Net asset value, end of period | | $ | 11.02 | | | $ | 11.52 | | | $ | 11.74 | | | $ | 11.59 | | | $ | 11.03 | | | $ | 11.12 | | |
Total return | | | (2.59 | %) | | | 1.45 | % | | | 1.35 | % | | | 7.37 | % | | | 3.42 | % | | | (2.12 | %) | |
Ratios to average net assets(c) | |
Total gross expenses | | | 1.41 | % | | | 1.41 | % | | | 1.41 | %(d) | | | 1.41 | %(e) | | | 1.41 | %(e) | | | 1.41 | %(e) | |
Total net expenses(f) | | | 1.05 | %(g) | | | 1.05 | %(g) | | | 1.05 | %(d) | | | 1.05 | %(e)(g) | | | 1.05 | %(e) | | | 1.08 | %(e) | |
Net investment income | | | 0.64 | % | | | 0.55 | % | | | 0.70 | %(d) | | | 0.98 | % | | | 1.44 | % | | | 1.83 | % | |
Supplemental data | |
Net assets, end of period (in thousands) | | $ | 6,417 | | | $ | 10,111 | | | $ | 11,628 | | | $ | 12,172 | | | $ | 13,142 | | | $ | 19,568 | | |
Portfolio turnover | | | 76 | % | | | 99 | % | | | 7 | % | | | 106 | % | | | 142 | % | | | 118 | % | |
Notes to Financial Highlights
(a) For the period from April 1, 2012 to April 30, 2012. During the period, the Fund's fiscal year end was changed from March 31 to April 30.
(b) Rounds to zero.
(c) In addition to the fees and expenses which the Fund bears directly, the Fund indirectly bears a pro rata share of the fees and expenses of the acquired funds in which it invests. Such indirect expenses are not included in the reported expense ratios.
(d) Annualized.
(e) Ratios include line of credit interest expense which rounds to less than 0.01%.
(f) Total net expenses include the impact of certain waivers/reimbursements made by the Investment Manager and certain of its affiliates, if applicable.
(g) The benefits derived from expense reductions had an impact of less than 0.01%.
The accompanying Notes to Financial Statements are an integral part of this statement.
Annual Report 2014
16
Columbia U.S. Treasury Index Fund
Financial Highlights (continued)
| | | Year Ended April 30, | | Year Ended March 31, | |
Class I | | 2014 | | 2013 | | 2012(a) | | 2012 | | 2011(b) | |
Per share data | |
Net asset value, beginning of period | | $ | 11.52 | | | $ | 11.74 | | | $ | 11.59 | | | $ | 11.03 | | | $ | 11.76 | | |
Income from investment operations: | |
Net investment income | | | 0.17 | | | | 0.16 | | | | 0.02 | | | | 0.21 | | | | 0.11 | | |
Net realized and unrealized gain (loss) | | | (0.38 | ) | | | 0.11 | | | | 0.14 | | | | 0.70 | | | | (0.43 | ) | |
Total from investment operations | | | (0.21 | ) | | | 0.27 | | | | 0.16 | | | | 0.91 | | | | (0.32 | ) | |
Less distributions to shareholders: | |
Net investment income | | | (0.17 | ) | | | (0.16 | ) | | | (0.01 | ) | | | (0.22 | ) | | | (0.15 | ) | |
Net realized gains | | | (0.12 | ) | | | (0.33 | ) | | | — | | | | (0.13 | ) | | | (0.26 | ) | |
Total distributions to shareholders | | | (0.29 | ) | | | (0.49 | ) | | | (0.01 | ) | | | (0.35 | ) | | | (0.41 | ) | |
Net asset value, end of period | | $ | 11.02 | | | $ | 11.52 | | | $ | 11.74 | | | $ | 11.59 | | | $ | 11.03 | | |
Total return | | | (1.76 | %) | | | 2.31 | % | | | 1.42 | % | | | 8.29 | % | | | (2.78 | %) | |
Ratios to average net assets(c) | |
Total gross expenses | | | 0.41 | % | | | 0.41 | % | | | 0.41 | %(d) | | | 0.41 | %(e) | | | 0.41 | %(d)(e) | |
Total net expenses(f) | | | 0.20 | % | | | 0.20 | % | | | 0.20 | %(d) | | | 0.20 | %(e) | | | 0.20 | %(d)(e) | |
Net investment income | | | 1.49 | % | | | 1.39 | % | | | 1.55 | %(d) | | | 1.81 | % | | | 1.96 | %(d) | |
Supplemental data | |
Net assets, end of period (in thousands) | | $ | 68,254 | | | $ | 54,959 | | | $ | 91,092 | | | $ | 84,899 | | | $ | 123,074 | | |
Portfolio turnover | | | 76 | % | | | 99 | % | | | 7 | % | | | 106 | % | | | 142 | % | |
Notes to Financial Highlights
(a) For the period from April 1, 2012 to April 30, 2012. During the period, the Fund's fiscal year end was changed from March 31 to April 30.
(b) For the period from September 27, 2010 (commencement of operations) to March 31, 2011.
(c) In addition to the fees and expenses which the Fund bears directly, the Fund indirectly bears a pro rata share of the fees and expenses of the acquired funds in which it invests. Such indirect expenses are not included in the reported expense ratios.
(d) Annualized.
(e) Ratios include line of credit interest expense which rounds to less than 0.01%.
(f) Total net expenses include the impact of certain waivers/reimbursements made by the Investment Manager and certain of its affiliates, if applicable.
The accompanying Notes to Financial Statements are an integral part of this statement.
Annual Report 2014
17
Columbia U.S. Treasury Index Fund
Financial Highlights (continued)
| | | Year Ended April 30, | |
Class R5 | | 2014 | | 2013(a) | |
Per share data | |
Net asset value, beginning of period | | $ | 11.51 | | | $ | 11.68 | | |
Income from investment operations: | |
Net investment income | | | 0.17 | | | | 0.08 | | |
Net realized and unrealized loss | | | (0.38 | ) | | | (0.04 | )(b) | |
Total from investment operations | | | (0.21 | ) | | | 0.04 | | |
Less distributions to shareholders: | |
Net investment income | | | (0.17 | ) | | | (0.08 | ) | |
Net realized gains | | | (0.12 | ) | | | (0.13 | ) | |
Total distributions to shareholders | | | (0.29 | ) | | | (0.21 | ) | |
Net asset value, end of period | | $ | 11.01 | | | $ | 11.51 | | |
Total return | | | (1.76 | %) | | | 0.31 | % | |
Ratios to average net assets(c) | |
Total gross expenses | | | 0.41 | % | | | 0.45 | %(d) | |
Total net expenses(e) | | | 0.20 | % | | | 0.20 | %(d) | |
Net investment income | | | 1.52 | % | | | 1.41 | %(d) | |
Supplemental data | |
Net assets, end of period (in thousands) | | $ | 1,431 | | | $ | 2 | | |
Portfolio turnover | | | 76 | % | | | 99 | % | |
Notes to Financial Highlights
(a) For the period from November 8, 2012 (commencement of operations) to April 30, 2013.
(b) Calculation of the net gain (loss) per share (both realized and unrealized) does not correlate to the aggregate realized and unrealized gain (loss) presented in the Statement of Operations due to the timing of sales and repurchases of Fund shares in relation to fluctuations in the market value of the portfolio.
(c) In addition to the fees and expenses which the Fund bears directly, the Fund indirectly bears a pro rata share of the fees and expenses of the acquired funds in which it invests. Such indirect expenses are not included in the reported expense ratios.
(d) Annualized.
(e) Total net expenses include the impact of certain waivers/reimbursements made by the Investment Manager and certain of its affiliates, if applicable.
The accompanying Notes to Financial Statements are an integral part of this statement.
Annual Report 2014
18
Columbia U.S. Treasury Index Fund
Financial Highlights (continued)
| | | Year Ended April 30, | |
Class W | | 2014 | | 2013(a) | |
Per share data | |
Net asset value, beginning of period | | $ | 11.52 | | | $ | 11.90 | | |
Income from investment operations: | |
Net investment income | | | 0.14 | | | | 0.11 | | |
Net realized and unrealized loss | | | (0.37 | ) | | | (0.05 | )(b) | |
Total from investment operations | | | (0.23 | ) | | | 0.06 | | |
Less distributions to shareholders: | |
Net investment income | | | (0.15 | ) | | | (0.11 | ) | |
Net realized gains | | | (0.12 | ) | | | (0.33 | ) | |
Total distributions to shareholders | | | (0.27 | ) | | | (0.44 | ) | |
Net asset value, end of period | | $ | 11.02 | | | $ | 11.52 | | |
Total return | | | (2.00 | %) | | | 0.52 | % | |
Ratios to average net assets(c) | |
Total gross expenses | | | 0.66 | % | | | 0.65 | %(d) | |
Total net expenses(e) | | | 0.45 | %(f) | | | 0.45 | %(d) | |
Net investment income | | | 1.24 | % | | | 1.10 | %(d) | |
Supplemental data | |
Net assets, end of period (in thousands) | | $ | 12,167 | | | $ | 29,171 | | |
Portfolio turnover | | | 76 | % | | | 99 | % | |
Notes to Financial Highlights
(a) For the period from June 18, 2012 (commencement of operations) to April 30, 2013.
(b) Calculation of the net gain (loss) per share (both realized and unrealized) does not correlate to the aggregate realized and unrealized gain (loss) presented in the Statement of Operations due to the timing of sales and repurchases of Fund shares in relation to fluctuations in the market value of the portfolio.
(c) In addition to the fees and expenses which the Fund bears directly, the Fund indirectly bears a pro rata share of the fees and expenses of the acquired funds in which it invests. Such indirect expenses are not included in the reported expense ratios.
(d) Annualized.
(e) Total net expenses include the impact of certain waivers/reimbursements made by the Investment Manager and certain of its affiliates, if applicable.
(f) The benefits derived from expense reductions had an impact of less than 0.01%.
The accompanying Notes to Financial Statements are an integral part of this statement.
Annual Report 2014
19
Columbia U.S. Treasury Index Fund
Financial Highlights (continued)
| | | Year Ended April 30, | | Year Ended March 31, | |
Class Z | | 2014 | | 2013 | | 2012(a) | | 2012 | | 2011 | | 2010 | |
Per share data | |
Net asset value, beginning of period | | $ | 11.52 | | | $ | 11.74 | | | $ | 11.59 | | | $ | 11.03 | | | $ | 11.11 | | | $ | 11.64 | | |
Income from investment operations: | |
Net investment income | | | 0.17 | | | | 0.16 | | | | 0.02 | | | | 0.21 | | | | 0.26 | | | | 0.30 | | |
Net realized and unrealized gain (loss) | | | (0.38 | ) | | | 0.11 | | | | 0.14 | | | | 0.70 | | | | 0.23 | | | | (0.46 | ) | |
Total from investment operations | | | (0.21 | ) | | | 0.27 | | | | 0.16 | | | | 0.91 | | | | 0.49 | | | | (0.16 | ) | |
Less distributions to shareholders: | |
Net investment income | | | (0.17 | ) | | | (0.16 | ) | | | (0.01 | ) | | | (0.22 | ) | | | (0.30 | ) | | | (0.37 | ) | |
Net realized gains | | | (0.12 | ) | | | (0.33 | ) | | | — | | | | (0.13 | ) | | | (0.27 | ) | | | (0.00 | )(b) | |
Total distributions to shareholders | | | (0.29 | ) | | | (0.49 | ) | | | (0.01 | ) | | | (0.35 | ) | | | (0.57 | ) | | | (0.37 | ) | |
Net asset value, end of period | | $ | 11.02 | | | $ | 11.52 | | | $ | 11.74 | | | $ | 11.59 | | | $ | 11.03 | | | $ | 11.11 | | |
Total return | | | (1.76 | %) | | | 2.31 | % | | | 1.42 | % | | | 8.28 | % | | | 4.40 | % | | | (1.38 | %) | |
Ratios to average net assets(c) | |
Total gross expenses | | | 0.41 | % | | | 0.41 | % | | | 0.41 | %(d) | | | 0.41 | %(e) | | | 0.41 | %(e) | | | 0.41 | %(e) | |
Total net expenses(f) | | | 0.20 | %(g) | | | 0.20 | %(g) | | | 0.20 | %(d) | | | 0.20 | %(e)(g) | | | 0.20 | %(e) | | | 0.23 | %(e) | |
Net investment income | | | 1.49 | % | | | 1.40 | % | | | 1.55 | %(d) | | | 1.82 | % | | | 2.29 | % | | | 2.64 | % | |
Supplemental data | |
Net assets, end of period (in thousands) | | $ | 194,297 | | | $ | 227,687 | | | $ | 271,853 | | | $ | 267,044 | | | $ | 241,078 | | | $ | 301,978 | | |
Portfolio turnover | | | 76 | % | | | 99 | % | | | 7 | % | | | 106 | % | | | 142 | % | | | 118 | % | |
Notes to Financial Highlights
(a) For the period from April 1, 2012 to April 30, 2012. During the period, the Fund's fiscal year end was changed from March 31 to April 30.
(b) Rounds to zero.
(c) In addition to the fees and expenses which the Fund bears directly, the Fund indirectly bears a pro rata share of the fees and expenses of the acquired funds in which it invests. Such indirect expenses are not included in the reported expense ratios.
(d) Annualized.
(e) Ratios include line of credit interest expense which rounds to less than 0.01%.
(f) Total net expenses include the impact of certain waivers/reimbursements made by the Investment Manager and certain of its affiliates, if applicable.
(g) The benefits derived from expense reductions had an impact of less than 0.01%.
The accompanying Notes to Financial Statements are an integral part of this statement.
Annual Report 2014
20
Columbia U.S. Treasury Index Fund
Notes to Financial Statements
April 30, 2014
Note 1. Organization
Columbia U.S. Treasury Index Fund (the Fund), a series of Columbia Funds Series Trust I (the Trust), is a diversified fund. The Trust is registered under the Investment Company Act of 1940, as amended (the 1940 Act), as an open-end management investment company organized as a Massachusetts business trust.
Fund Shares
The Trust may issue an unlimited number of shares (without par value). The Fund offers Class A, Class B, Class C, Class I, Class R5, Class W and Class Z shares. Although all share classes generally have identical voting, dividend and liquidation rights, each share class votes separately when required by law. Different share classes pay different distribution amounts to the extent the expenses of such share classes differ, and distributions in liquidation will be proportional to the net asset value of each share class. Each share class has its own expense structure and sales charges, as applicable.
Class A shares are subject to a maximum front-end sales charge of 4.75% based on the initial investment amount. Class A shares purchased without an initial sales charge in accounts aggregating $1 million to $50 million at the time of purchase are subject to a contingent deferred sales charge (CDSC) if the shares are sold within 18 months of purchase, charged as follows: 1.00% CDSC if redeemed within 12 months of purchase, and 0.50% CDSC if redeemed more than 12, but less than 18, months after purchase.
Class B shares may be subject to a maximum CDSC of 5.00% based upon the holding period after purchase. Class B shares will generally convert to Class A shares eight years after purchase. The Fund no longer accepts investments by new or existing investors in the Fund's Class B shares, except in connection with the reinvestment of any dividend and/or capital gain distributions in Class B shares of the Fund and exchanges by existing Class B shareholders of certain other funds within the Columbia Family of Funds.
Class C shares are subject to a 1.00% CDSC on shares redeemed within one year of purchase.
Class I shares are not subject to sales charges and are available only to the Columbia Family of Funds.
Class R5 shares are not subject to sales charges and are generally available only to investors purchasing through authorized investment professionals and omnibus retirement plans.
Class W shares are not subject to sales charges and are available only to investors purchasing through authorized
investment programs managed by investment professionals, including discretionary managed account programs.
Class Z shares are not subject to sales charges and are available only to certain eligible investors, which are subject to different investment minimums.
Note 2. Summary of Significant Accounting Policies
Use of Estimates
The preparation of financial statements in accordance with U.S. generally accepted accounting principles (GAAP) requires management to make certain estimates and assumptions that affect the reported amounts of assets and liabilities, the disclosure of contingent assets and liabilities at the date of the financial statements and the reported amounts of revenue and expenses during the reporting period. Actual results could differ from those estimates.
The following is a summary of significant accounting policies consistently followed by the Fund in the preparation of its financial statements.
Security Valuation
Debt securities generally are valued by pricing services approved by the Board of Trustees (the Board) based upon market transactions for normal, institutional-size trading units of similar securities. The services may use various pricing techniques which take into account appropriate factors such as yield, quality, coupon rate, maturity, type of issue, trading characteristics and other data, as well as broker quotes. Debt securities for which quotations are readily available may also be valued based upon an over-the-counter or exchange bid quotation.
Investments in open-end investment companies, including money market funds, are valued at net asset value.
Investments for which market quotations are not readily available, or that have quotations which management believes are not reliable, are valued at fair value as determined in good faith under consistently applied procedures established by and under the general supervision of the Board. If a security or class of securities (such as foreign securities) is valued at fair value, such value is likely to be different from the last quoted market price for the security.
The determination of fair value often requires significant judgment. To determine fair value, management may use assumptions including but not limited to future cash flows and estimated risk premiums. Multiple inputs from various sources may be used to determine fair value.
Annual Report 2014
21
Columbia U.S. Treasury Index Fund
Notes to Financial Statements (continued)
April 30, 2014
Security Transactions
Security transactions are accounted for on the trade date. Cost is determined and gains (losses) are based upon the specific identification method for both financial statement and federal income tax purposes.
Income Recognition
Interest income is recorded on an accrual basis. Market premiums and discounts, including original issue discounts, are amortized and accreted, respectively, over the expected life of the security on all debt securities, unless otherwise noted.
Dividend income is recorded on the ex-dividend date.
Expenses
General expenses of the Trust are allocated to the Fund and other funds of the Trust based upon relative net assets or other expense allocation methodologies determined by the nature of the expense. Expenses directly attributable to the Fund are charged to the Fund. Expenses directly attributable to a specific class of shares are charged to that share class.
Determination of Class Net Asset Value
All income, expenses (other than class-specific expenses, which are charged to that share class, as shown in the Statement of Operations) and realized and unrealized gains (losses) are allocated to each class of the Fund on a daily basis, based on the relative net assets of each class, for purposes of determining the net asset value of each class.
Federal Income Tax Status
The Fund intends to qualify each year as a regulated investment company under Subchapter M of the Internal Revenue Code, as amended, and will distribute substantially all of its taxable income (including net short-term capital gains), if any, for its tax year, and as such will not be subject to federal income taxes. In addition, the Fund intends to distribute in each calendar year substantially all of its net investment income, capital gains and certain other amounts, if any, such that the Fund should not be subject to federal excise tax. Therefore, no federal income or excise tax provision is recorded.
Distributions to Shareholders
Distributions from net investment income, if any, are declared daily and paid monthly. Net realized capital gains, if any, are distributed at least annually. Income distributions and capital gain distributions are determined in accordance with federal income tax regulations, which may differ from GAAP.
Guarantees and Indemnifications
Under the Trust's organizational documents and, in some cases, by contract, its officers and trustees are indemnified
against certain liabilities arising out of the performance of their duties to the Trust or its funds. In addition, certain of the Fund's contracts with its service providers contain general indemnification clauses. The Fund's maximum exposure under these arrangements is unknown since the amount of any future claims that may be made against the Fund cannot be determined, and the Fund has no historical basis for predicting the likelihood of any such claims.
Note 3. Fees and Compensation Paid to Affiliates
Investment Management Fees
Under an Investment Management Services Agreement, Columbia Management Investment Advisers, LLC (the Investment Manager), a wholly-owned subsidiary of Ameriprise Financial, Inc. (Ameriprise Financial), determines which securities will be purchased, held or sold. The investment management fee is an annual fee that is equal to 0.10% of the Fund's average daily net assets.
Administration Fees
Under an Administrative Services Agreement, the Investment Manager also serves as the Fund Administrator. The Fund pays the Fund Administrator an annual fee for administration and accounting services equal to 0.30% of the Fund's average daily net assets.
The Investment Manager, from the administration fee it receives from the Fund, pays all operating expenses of the Fund, with the exception of brokerage fees and commissions, interest, fees and expenses of Trustees who are not officers, directors or employees of the Investment Manager or its affiliates, distribution and/or shareholder servicing and plan administration fees and any extraordinary non-recurring expenses that may arise, including litigation.
Compensation of Board Members
Board members are compensated for their services to the Fund as disclosed in the Statement of Operations. The Trust's eligible Trustees may participate in a Deferred Compensation Plan (the Plan) which may be terminated at any time. Obligations of the Plan will be paid solely out of the Fund's assets.
Compensation of Chief Compliance Officer
The Board has appointed a Chief Compliance Officer to the Fund in accordance with federal securities regulations. The Fund pays its pro-rata share of the expenses associated with the Chief Compliance Officer. The Fund's expenses for the Chief Compliance Officer will not exceed $15,000 per year.
Annual Report 2014
22
Columbia U.S. Treasury Index Fund
Notes to Financial Statements (continued)
April 30, 2014
Transfer Agent Fees
Under a Transfer and Dividend Disbursing Agent Agreement, Columbia Management Investment Services Corp. (the Transfer Agent), an affiliate of the Investment Manager and a wholly-owned subsidiary of Ameriprise Financial, is responsible for providing transfer agency services to the Fund. The Transfer Agent has contracted with Boston Financial Data Services (BFDS) to serve as sub-transfer agent.
The transfer agent fees are payable by the Investment Manager. The Transfer Agent pays the fees of BFDS for services as sub-transfer agent and is not entitled to reimbursement for such fees from the Fund. The Transfer Agent also receives compensation from fees for various shareholder services and reimbursements for certain out-of-pocket expenses.
An annual minimum account balance fee of $20 may apply to certain accounts with a value below the applicable share class's initial minimum investment requirements to reduce the impact of small accounts on transfer agent fees. These minimum account balance fees are recorded as part of expense reductions in the Statement of Operations. For the year ended April 30, 2014, these minimum account balance fees reduced total expenses by $1,500.
Distribution and Service Fees
The Fund has an agreement with Columbia Management Investment Distributors, Inc. (the Distributor), an affiliate of the Investment Manager and a wholly-owned subsidiary of Ameriprise Financial, for distribution and shareholder services. The Board has approved, and the Fund has adopted, distribution and shareholder service plans (the Plans) applicable to certain share classes, which set the distribution and service fees for the Fund. These fees are calculated daily and are intended to compensate the Distributor and/or eligible selling and/or servicing agents for selling shares of the Fund and providing services to investors.
Under the Plans, the Fund pays a monthly service fee to the Distributor at the maximum annual rate of 0.25% of the average daily net assets attributable to Class A, Class B, Class C and Class W shares of the Fund. Also under the Plans, the Fund pays a monthly distribution fee to the Distributor at the maximum annual rates of 0.75%, 0.75% and 0.25% of the average daily net assets attributable to Class B, Class C and Class W shares, respectively.
The Distributor has voluntarily agreed to waive a portion of the distribution fee for Class C shares so that the distribution fee does not exceed 0.60% annually of the average daily net assets attributable to Class C shares. This arrangement may be modified or terminated by the Distributor at any time.
Although the Fund may pay a distribution fee up to 0.25% of the Fund's average daily net assets attributable to Class W shares and a service fee of up to 0.25% of the Fund's average daily net assets attributable to Class W shares, the aggregate fee shall not exceed 0.25% of the Fund's average daily net assets attributable to Class W shares.
Sales Charges
Sales charges, including front-end charges and CDSCs, received by the Distributor for distributing Fund shares were $19,687 for Class A, $3,125 for Class B and $1,041 for Class C shares for the year ended April 30, 2014.
Expenses Waived/Reimbursed by the Investment Manager and its Affiliates
The Investment Manager and certain of its affiliates have contractually agreed to waive fees and/or reimburse expenses (excluding certain fees and expenses described below), for the period disclosed below, unless sooner terminated at the sole discretion of the Board, so that the Fund's net operating expenses, after giving effect to fees waived/expenses reimbursed and any balance credits and/or overdraft charges from the Fund's custodian, do not exceed the following annual rates as a percentage of the class' average daily net assets:
| | | | | Fee Rates Contractual
through
August 31, 2014 | |
Class A | | | | | | | 0.45 | % | |
Class B | | | | | | | 1.20 | | |
Class C | | | | | | | 1.20 | | |
Class I | | | | | | | 0.20 | | |
Class R5 | | | | | | | 0.20 | | |
Class W | | | | | | | 0.45 | | |
Class Z | | | | | | | 0.20 | | |
Under the agreement governing these fee waivers and/or expense reimbursement arrangements, the following fees and expenses are excluded from the waiver/reimbursement commitment, and therefore will be paid by the Fund, if applicable: taxes (including foreign transaction taxes), expenses associated with investments in affiliated and non-affiliated pooled investment vehicles (including mutual funds and exchange-traded funds), transaction costs and brokerage commissions, costs related to any securities lending program, dividend expenses associated with securities sold short, inverse floater program fees and expenses, transaction charges and interest on borrowed money, interest, extraordinary expenses and any other expenses the exclusion of which is specifically approved by the Board. This agreement may be modified or amended only with approval from all parties. Class C
Annual Report 2014
23
Columbia U.S. Treasury Index Fund
Notes to Financial Statements (continued)
April 30, 2014
distribution fees waived by the Distributor, as discussed above, are in addition to the waiver/reimbursement commitment under the agreement.
Note 4. Federal Tax Information
The timing and character of income and capital gain distributions are determined in accordance with income tax regulations, which may differ from GAAP because of temporary or permanent book to tax differences.
At April 30, 2014, these differences are primarily due to differing treatment for capital loss carryforwards, principal and/or interest of fixed income securities, deferral/reversal of wash sales losses, Trustees' deferred compensation and distribution reclassifications. To the extent these differences are permanent, reclassifications are made among the components of the Fund's net assets in the Statement of Assets and Liabilities. Temporary differences do not require reclassifications. In the Statement of Assets and Liabilities the following reclassifications were made:
Excess of distributions over net investment income | | $ | 48,214 | | |
Accumulated net realized loss | | | (48,213 | ) | |
Paid-in capital | | | (1 | ) | |
Net investment income and net realized gains (losses), as disclosed in the Statement of Operations, and net assets were not affected by this reclassification.
The tax character of distributions paid during the years indicated was as follows:
Year Ended April 30, | | 2014 | | 2013 | |
Ordinary income | | $ | 5,158,008 | | | $ | 10,166,584 | | |
Long-term capital gains | | | 2,849,127 | | | | 7,206,789 | | |
Total | | $ | 8,007,135 | | | $ | 17,373,373 | | |
Short-term capital gain distributions, if any, are considered ordinary income distributions for tax purposes.
At April 30, 2014, the components of distributable earnings on a tax basis were as follows:
Undistributed ordinary income | | $ | 396,636 | | |
Capital loss carryforwards | | | (723,342 | ) | |
Net unrealized appreciation | | $ | 5,412,839 | | |
At April 30, 2014, the cost of investments for federal income tax purposes was $299,317,747 and the aggregate gross unrealized appreciation and depreciation based on that cost was:
Unrealized appreciation | | $ | 6,157,136 | | |
Unrealized depreciation | | | (744,297 | ) | |
Net unrealized appreciation | | $ | 5,412,839 | | |
The following capital loss carryforwards, determined at April 30, 2014, may be available to reduce taxable income arising from future net realized gains on investments, if any, to the extent permitted by the Internal Revenue Code:
Year of Expiration | | Amount ($) | |
Unlimited short-term | | | 723,342 | | |
Management of the Fund has concluded that there are no significant uncertain tax positions that would require recognition in the financial statements. However, management's conclusion may be subject to review and adjustment at a later date based on factors including, but not limited to, new tax laws, regulations, and administrative interpretations (including relevant court decisions). Generally, the Fund's federal tax returns for the prior three fiscal years remain subject to examination by the Internal Revenue Service.
Note 5. Portfolio Information
The cost of purchases and proceeds from sales of securities, excluding short-term obligations, aggregated to $240,801,487 and $274,748,336, respectively, for the year ended April 30, 2014, of which $240,801,487 and $274,748,336, respectively, were U.S. government securities.
Note 6. Affiliated Money Market Fund
The Fund invests its daily cash balances in Columbia Short-Term Cash Fund, an affiliated money market fund established for the exclusive use by the Fund and other affiliated funds. The income earned by the Fund from such investments is included as "Dividends — affiliated issuers" in the Statement of Operations. As an investing fund, the Fund indirectly bears its proportionate share of the expenses of Columbia Short-Term Cash Fund.
Note 7. Shareholder Concentration
At April 30, 2014, one unaffiliated shareholder of record owned 17.7% of the outstanding shares of the Fund in one or more accounts. The Fund has no knowledge about whether any portion of those shares was owned beneficially. Affiliated shareholders of record owned 41.2% of the outstanding shares of the Fund in one or more accounts. Subscription and redemption activity by concentrated accounts may have a significant effect on the operations of the Fund.
Note 8. Line of Credit
The Fund has entered into a revolving credit facility with a syndicate of banks led by JPMorgan Chase Bank N.A. whereby the Fund may borrow for the temporary funding of shareholder redemptions or for other temporary or emergency purposes. The credit facility agreement, as amended, which is
Annual Report 2014
24
Columbia U.S. Treasury Index Fund
Notes to Financial Statements (continued)
April 30, 2014
a collective agreement between the Fund and certain other funds managed by the Investment Manager, severally and not jointly, permits collective borrowings up to $500 million. Interest is charged to each participating fund based on its borrowings at a rate equal to the higher of (i) the overnight federal funds rate plus 1.00% or (ii) the one-month LIBOR rate plus 1.00%. Each borrowing under the credit facility matures no later than 60 days after the date of borrowing. Effective December 10, 2013, the Fund also pays a commitment fee equal to its pro rata share of the amount of the credit facility at a rate of 0.075% per annum. Prior to December 10, 2013, the commitment fee was charged at the annual rate of 0.08% per annum. The commitment fee is included in other expenses in the Statement of Operations.
The Fund had no borrowings during the year ended April 30, 2014.
Note 9. Subsequent Events
Management has evaluated the events and transactions that have occurred through the date the financial statements were issued and noted no items requiring adjustment of the financial statements or additional disclosure.
Note 10. Information Regarding Pending and Settled Legal Proceedings
In December 2005, without admitting or denying the allegations, American Express Financial Corporation (AEFC, which is now known as Ameriprise Financial, Inc. (Ameriprise Financial)) entered into settlement agreements with the Securities and Exchange Commission (SEC) and Minnesota Department of Commerce (MDOC) related to market timing activities. As a result, AEFC was censured and ordered to cease and desist from committing or causing any violations of certain provisions of the Investment Advisers Act of 1940, the Investment Company Act of 1940, and various Minnesota laws. AEFC agreed to pay disgorgement of $10 million and civil money penalties of $7 million. AEFC also agreed to retain an independent distribution consultant to assist in developing a plan for distribution of all disgorgement and civil penalties ordered by the SEC in accordance with various undertakings detailed at www.sec.gov/litigation/admin/ia-2451.pdf. Ameriprise Financial and its affiliates have cooperated with the SEC and the MDOC in these legal proceedings, and have made regular reports to the Funds' Boards of Trustees.
Ameriprise Financial and certain of its affiliates have historically been involved in a number of legal, arbitration and regulatory proceedings, including routine litigation, class actions, and governmental actions, concerning matters arising in connection with the conduct of their business activities.
Ameriprise Financial believes that the Funds are not currently the subject of, and that neither Ameriprise Financial nor any of its affiliates are the subject of, any pending legal, arbitration or regulatory proceedings that are likely to have a material adverse effect on the Funds or the ability of Ameriprise Financial or its affiliates to perform under their contracts with the Funds. Ameriprise Financial is required to make 10-Q, 10-K and, as necessary, 8-K filings with the Securities and Exchange Commission on legal and regulatory matters that relate to Ameriprise Financial and its affiliates. Copies of these filings may be obtained by accessing the SEC website at www.sec.gov.
There can be no assurance that these matters, or the adverse publicity associated with them, will not result in increased fund redemptions, reduced sale of fund shares or other adverse consequences to the Funds. Further, although we believe proceedings are not likely to have a material adverse effect on the Funds or the ability of Ameriprise Financial or its affiliates to perform under their contracts with the Funds, these proceedings are subject to uncertainties and, as such, we are unable to estimate the possible loss or range of loss that may result. An adverse outcome in one or more of these proceedings could result in adverse judgments, settlements, fines, penalties or other relief that could have a material adverse effect on the consolidated financial condition or results of operations of Ameriprise Financial.
Annual Report 2014
25
Columbia U.S. Treasury Index Fund
Report of Independent Registered Public Accounting Firm
To the Trustees of Columbia Funds Series Trust I and the Shareholders of
Columbia U.S. Treasury Index Fund
In our opinion, the accompanying statement of assets and liabilities, including the portfolio of investments, and the related statements of operations and of changes in net assets and the financial highlights present fairly, in all material respects, the financial position of Columbia U.S. Treasury Index Fund (the "Fund", a series of Columbia Funds Series Trust I) at April 30, 2014, and the results of its operations, the changes in its net assets and the financial highlights for each of the periods indicated, in conformity with accounting principles generally accepted in the United States of America. These financial statements and financial highlights (hereafter referred to as "financial statements") are the responsibility of the Fund's management; our responsibility is to express an opinion on these financial statements based on our audits. We conducted our audits of these financial statements in accordance with the standards of the Public Company Accounting Oversight Board (United States). Those standards require that we plan and perform the audit to obtain reasonable assurance about whether the financial statements are free of material misstatement. An audit includes examining, on a test basis, evidence supporting the amounts and disclosures in the financial statements, assessing the accounting principles used and significant estimates made by management, and evaluating the overall financial statement presentation. We believe that our audits, which included confirmation of securities at April 30, 2014 by correspondence with the custodian, brokers and transfer agent, provide a reasonable basis for our opinion.
PricewaterhouseCoopers LLP
Minneapolis, Minnesota
June 20, 2014
Annual Report 2014
26
Columbia U.S. Treasury Index Fund
The Trustees serve terms of indefinite duration. The names, addresses and birth years of the Trustees and Officers of the Funds in Columbia Funds Series Trust I, the year each was first elected or appointed to office, their principal business occupations during at least the last five years, the number of Funds overseen by each Trustee and other directorships they hold are shown below. Each officer listed below serves as an officer of each Fund in Columbia Funds Series Trust I.
Independent Trustees
Name, Address and Year of Birth,
Position with Funds, Year First
Elected or Appointed to Office | | Principal Occupation(s) During Past Five Years, Number of Funds in Columbia
Funds Complex Overseen by Trustee, Other Directorships Held | |
Rodman L. Drake (Born 1943)
c/o Columbia Management
Investment Advisers, LLC
225 Franklin Street
Boston, MA 02110
Trustee (since 1994) and
Chairman of the Board (since 2009) | | Independent consultant since 2010; Co-Founder of Baringo Capital LLC (private equity) from 1997 to 2008; Chairman (from 2003 to 2010) and CEO (from 2008 to 2010) of Crystal River Capital, Inc. (real estate investment trust); Oversees 54; Jackson Hewitt Tax Service Inc. (tax preparation services) from 2004 to 2011; Student Loan Corporation (student loan provider) from 2005 to 2010; Celgene Corporation (global biotechnology company); The Helios Funds and Brookfield Funds (closed-end funds); Chimerix, Inc. (biopharmaceutical company) since August 1, 2013; Crystal River Capital, Inc. from 2005 to 2010; Parsons Brinckerhoff from 1995 to 2008; and Apex Silver Mines Ltd. from 2007 to 2009 | |
Douglas A. Hacker (Born 1955)
c/o Columbia Management
Investment Advisers, LLC
225 Franklin Street
Boston, MA 02110
Trustee (since 1996) | | Independent business executive since May 2006; Executive Vice President — Strategy of United Airlines from December 2002 to May 2006; President of UAL Loyalty Services (airline marketing company) from September 2001 to December 2002; Executive Vice President and Chief Financial Officer of United Airlines from July 1999 to September 2001. Oversees 54; Nash Finch Company (food distributor); Aircastle Limited (aircraft leasing); and SeaCube Container Leasing Ltd. (container leasing) | |
Janet Langford Kelly (Born 1957)
c/o Columbia Management
Investment Advisers, LLC
225 Franklin Street
Boston, MA 02110
Trustee (since 1996) | | Senior Vice President, General Counsel and Corporate Secretary, ConocoPhillips (integrated energy company) since September 2007; Deputy General Counsel — Corporate Legal Services, ConocoPhillips from August 2006 to August 2007; Partner, Zelle, Hofmann, Voelbel, Mason & Gette LLP (law firm) from March 2005 to July 2006; Adjunct Professor of Law, Northwestern University from September 2004 to June 2006; Director, UAL Corporation (airline) from February 2006 to July 2006; Chief Administrative Officer and Senior Vice President, Kmart Holding Corporation (consumer goods) from September 2003 to March 2004. Oversees 54; None | |
Nancy T. Lukitsh (Born 1956)
c/o Columbia Management
Investment Advisers, LLC
225 Franklin Street
Boston, MA 02110
Trustee (since 2011) | | Senior Vice President, Partner and Director of Marketing, Wellington Management Company, LLP (investment adviser) from 1997 to 2010; Chair, Wellington Management Investment Portfolios (commingled non-U.S. investment pools) from 2007 to 2010; Director, Wellington Trust Company, NA and other Wellington affiliates from 1997 to 2010. Oversees 54; None | |
William E. Mayer (Born 1940)
c/o Columbia Management
Investment Advisers, LLC
225 Franklin Street
Boston, MA 02110
Trustee (since 1994) | | Partner, Park Avenue Equity Partners (private equity) since February 1999; Dean and Professor, College of Business and Management, University of Maryland from 1992 to 1996. Oversees 54; DynaVox Inc. (speech creation); Lee Enterprises (print media); WR Hambrecht + Co. (financial service provider) from 2000 to 2012; BlackRock Kelso Capital Corporation (investment company) | |
David M. Moffett (Born 1952)
c/o Columbia Management
Investment Advisers, LLC
225 Franklin Street
Boston, MA 02110
Trustee (since 2011) | | Retired. Chief Executive Officer, Federal Home Loan Mortgage Corporation, from 2008 to 2009; Senior Adviser, Global Financial Services Group, Carlyle Group, Inc., from 2007 to 2008; Vice Chairman and Chief Financial Officer, U.S. Bancorp, from 1993 to 2007. Oversees 54; CIT Group Inc. (commercial and consumer finance); eBay Inc. (online trading community); MBIA Inc. (financial service provider); E.W. Scripps Co. (print and television media), Building Materials Holding Corp. (building materials and construction services); Genworth Financial, Inc. (financial and insurance products and services); and University of Oklahoma Foundation | |
Charles R. Nelson (Born 1942)
c/o Columbia Management
Investment Advisers, LLC
225 Franklin Street
Boston, MA 02110
Trustee (since 1981) | | Retired. Professor Emeritus, University of Washington, since 2011; Professor of Economics, University of Washington from 1976 to 2011; Ford and Louisa Van Voorhis Professor of Political Economy, University of Washington from 1993 to 2011; Adjunct Professor of Statistics, University of Washington from 1980 to 2011; Associate Editor, Journal of Money, Credit and Banking from September 1993 to 2008; consultant on econometric and statistical matters. Oversees 54; None | |
John J. Neuhauser (Born 1943)
c/o Columbia Management
Investment Advisers, LLC
225 Franklin Street
Boston, MA 02110
Trustee (since 1984) | | President, Saint Michael's College, since August 2007; Director or Trustee of several non-profit organizations, including Fletcher Allen Health Care, Inc.; University Professor, Boston College from November 2005 to August 2007; Academic Vice President and Dean of Faculties, Boston College from August 1999 to October 2005. Oversees 54; Liberty All-Star Equity Fund and Liberty All-Star Growth Fund (closed-end funds) | |
Annual Report 2014
27
Columbia U.S. Treasury Index Fund
Trustees and Officers (continued)
Independent Trustees (continued)
Name, Address and Year of Birth,
Position with Funds, Year First
Elected or Appointed to Office | | Principal Occupation(s) During Past Five Years, Number of Funds in Columbia
Funds Complex Overseen by Trustee, Other Directorships Held | |
Patrick J. Simpson (Born 1944)
c/o Columbia Management
Investment Advisers, LLC
225 Franklin Street
Boston, MA 02110
Trustee (since 2000) | | Partner, Perkins Coie LLP (law firm). Oversees 54; None | |
Anne-Lee Verville (Born 1945)
c/o Columbia Management
Investment Advisers, LLC
225 Franklin Street
Boston, MA 02110
Trustee (since 1998) | | Retired. General Manager — Global Education Industry from 1994 to 1997, President — Application Systems Division from 1991 to 1994, Chief Financial Officer — US Marketing & Services from 1988 to 1991, and Chief Information Officer from 1987 to 1988, IBM Corporation (computer and technology). Oversees 54; Enesco Group, Inc. (producer of giftware and home and garden decor products) from 2001 to 2006 | |
Interested Trustee
Name, Address and Year of Birth,
Position with Funds, Year First
Elected or Appointed to Office | | Principal Occupation(s) During Past Five Years, Number of Funds in Columbia
Funds Complex Overseen by Trustee, Other Directorships Held | |
William F. Truscott (born 1960)
53600 Ameriprise Financial Center
Minneapolis, MN 55474
Senior Vice President (since 2012) | | Chairman of the Board and President, Columbia Management Investment Advisers, LLC since May 2010 and February 2012 (previously President and Chief Investment Officer, from 2001 to April 2010); Chief Executive Officer, Global Asset Management, Ameriprise Financial, Inc. since September 2012 (previously, Chief Executive Officer, U.S. Asset Management & President, Annuities, from May 2010 to September 2012 and President — U.S. Asset Management and Chief Investment Officer from 2005 to April 2010); Director and Chief Executive Officer, Columbia Management Investment Distributors, Inc. since May 2010 and February 2012, respectively (previously Chairman of the Board and Chief Executive Officer from 2006 to April 2010); Chairman of the Board and Chief Executive Officer, RiverSource Distributors, Inc. since 2006; President and Chief Executive Officer, Ameriprise Certificate Company, 2006 to August 2012; Oversees 186; Director, Ameriprise Certificate Company, 2006-January 2013 | |
The Statement of Additional Information has additional information about the Fund's Board members and is available, without charge, upon request by calling 800.345.6611; contacting your financial intermediary; or visiting columbiamanagement.com.
The Board has appointed officers who are responsible for day-to-day business decisions based on policies it has established. The officers serve at the pleasure of the Board. In addition to Mr. Truscott, who is Senior Vice President, the Funds' other officers are:
Officers
Name,
Address and
Year of Birth | | Position and Year
First Appointed to
Position for any Fund
in the Columbia
Funds Complex or a
Predecessor Thereof | | Principal Occupation(s) During Past Five Years | |
J. Kevin Connaughton
225 Franklin Street
Boston, MA 02110
Born 1964 | | President and Principal Executive Officer (2009) | | Senior Vice President and General Manager — Mutual Fund Products, Columbia Management Investment Advisers, LLC, since May 2010; and President, Columbia Funds since 2009; previously, Managing Director, Columbia Management Advisors, LLC, from December 2004 to April 2010; Senior Vice President and Chief Financial Officer, Columbia Funds, from June 2008 to January 2009; and senior officer of Columbia Funds and affiliated funds since 2003. | |
Michael G. Clarke
225 Franklin Street
Boston, MA 02110
Born 1969 | | Treasurer (2011) and Chief Financial Officer (2009) | | Vice President, Columbia Management Investment Advisers, LLC, since May 2010; previously, Managing Director of Fund Administration, Columbia Management Advisors, LLC, from September 2004 to April 2010; and senior officer of Columbia Funds and affiliated funds since 2002. | |
Annual Report 2014
28
Columbia U.S. Treasury Index Fund
Trustees and Officers (continued)
Officers (continued)
Name,
Address and
Year of Birth | | Position and Year
First Appointed to
Position for any Fund
in the Columbia
Funds Complex or a
Predecessor Thereof | | Principal Occupation(s) During Past Five Years | |
Scott R. Plummer
5228 Ameriprise
Financial Center
Minneapolis, MN 55474
Born 1959 | | Senior Vice President (2006), Chief Legal Officer (2006) and Assistant Secretary (2011) | | Senior Vice President, Chief Legal Officer and Assistant Secretary, Columbia Management Investment Advisers, LLC, since June 2005; Senior Vice President and Lead Chief Counsel — Asset Management, Ameriprise Financial, Inc., since May 2010 (previously, Vice President and Chief Counsel — Asset Management, from 2005 to April 2010); Vice President, Chief Counsel and Assistant Secretary, Columbia Management Investment Distributors, Inc., since 2008; Vice President, General Counsel and Secretary, Ameriprise Certificate Company, since 2005; Chief Counsel, RiverSource Distributors, Inc., since 2006; and senior officer of Columbia Funds and affiliated funds since 2006. | |
Thomas P. McGuire
225 Franklin Street
Boston, MA 02110
Born 1972 | | Chief Compliance Officer (2012) | | Vice President — Asset Management Compliance, Ameriprise Financial, Inc., since May 2010; Chief Compliance Officer, Ameriprise Certificate Company, since September 2010; Compliance Executive, Bank of America, from 2005 to April 2010. | |
Colin Moore
225 Franklin Street
Boston, MA 02110
Born 1958 | | Senior Vice President (2010) | | Executive Vice President and Global Chief Investment Officer, Ameriprise Financial, Inc., since July 2013; Director and Global Chief Investment Officer, Columbia Management Investment Advisers, LLC, since May 2010; previously, Manager, Managing Director and Chief Investment Officer, Columbia Management Advisors, LLC, from 2007 to April 2010. | |
Michael E. DeFao
225 Franklin Street
Boston, MA 02110
Born 1968 | | Vice President (2011) and Assistant Secretary (2010) | | Vice President and Chief Counsel, Ameriprise Financial, Inc., since May 2010; Associate General Counsel, Bank of America from 2005 to April 2010. | |
Joseph F. DiMaria
225 Franklin Street
Boston, MA 02110
Born 1968 | | Vice President (2011) and Chief Accounting Officer (2008) | | Vice President — Mutual Fund Administration, Columbia Management Investment Advisers, LLC, since May 2010; previously, Director of Fund Administration, Columbia Management Advisors, LLC, from 2006 to April 2010. | |
Paul B. Goucher
100 Park Avenue
New York, NY 10017
Born 1968 | | Vice President (2011) and Assistant Secretary (2008) | | Vice President and Lead Chief Counsel, Ameriprise Financial, Inc., since November 2008 and January 2013, respectively (previously, Chief Counsel, from January 2010 to January 2013, and Group Counsel from November 2008 to January 2010); previously, Director, Managing Director and General Counsel, J. & W. Seligman & Co. Incorporated, from July 2008 to November 2008. | |
Amy Johnson
5228 Ameriprise
Financial Center
Minneapolis, MN
Born 1965 | | Vice President (2006) | | Senior Vice President and Chief Operating Officer, Columbia Management Investment Advisers, LLC, since May 2010; previously, Chief Administrative Officer, from 2009 to April 2010, and Vice President — Asset Management and Trust Company Services, from 2006 to 2009. | |
Paul D. Pearson
5228 Ameriprise
Financial Center
Minneapolis, MN
Born 1956 | | Vice President (2011) and Assistant Treasurer (1999) | | Vice President — Investment Accounting, Columbia Management Investment Advisers, LLC, since May 2010; previously, Vice President — Managed Assets, Investment Accounting, Ameriprise Financial, Inc. from 1998 to April 2010. | |
Christopher O. Petersen
5228 Ameriprise
Financial Center
Minneapolis, MN 55474
Born 1970 | | Vice President and Secretary (2010) | | Vice President and Chief Counsel, Ameriprise Financial, Inc., since January 2010 (previously, Vice President and Group Counsel or Counsel from 2004 to January 2010); officer of Columbia Funds and affiliated funds since 2007. | |
Stephen T. Welsh
225 Franklin Street
Boston, MA 02110
Born 1957 | | Vice President (2006) | | President and Director, Columbia Management Investment Services Corp., since May 2010; previously, President and Director, Columbia Management Services, Inc., from 2004 to April 2010; and Managing Director, Columbia Management Distributors, Inc., from 2007 to April 2010. | |
Annual Report 2014
29
This page intentionally left blank.
Annual Report 2014
30
This page intentionally left blank.
Annual Report 2014
31
This page intentionally left blank.
Annual Report 2014
32
Columbia U.S. Treasury Index Fund
Important Information About This Report
Each fund mails one shareholder report to each shareholder address. If you would like more than one report, please call shareholder services at 800.345.6611 and additional reports will be sent to you.
The policy of the Board is to vote the proxies of the companies in which each fund holds investments consistent with the procedures as stated in the Statement of Additional Information (SAI). You may obtain a copy of the SAI without charge by calling 800.345.6611; contacting your financial intermediary; visiting columbiamanagement.com; or searching the website of the Securities and Exchange Commission (SEC) at sec.gov. Information regarding how each fund voted proxies relating to portfolio securities is filed with the SEC by August 31 for the most recent 12-month period ending June 30 of that year, and is available without charge by visiting columbiamanagement.com; or searching the website of the SEC at sec.gov.
Each fund files a complete schedule of portfolio holdings with the SEC for the first and third quarters of each fiscal year on Form N-Q. Each fund's Form N-Q is available on the SEC's website at sec.gov and may be reviewed and copied at the SEC's Public Reference Room in Washington, D.C. Information on the operation of the Public Reference Room may be obtained by calling 800.SEC.0330. Each fund's complete schedule of portfolio holdings, as filed on Form N-Q, can also be obtained without charge, upon request, by calling 800.345.6611.
Annual Report 2014
33

Columbia U.S. Treasury Index Fund
P.O. Box 8081
Boston, MA 02266-8081
columbiamanagement.com
This information is for use with concurrent or prior delivery of a fund prospectus. Please read and consider the investment objectives, risks, charges and expenses for any fund carefully before investing. For a prospectus and, if available, a summary prospectus, which contains this and other important information about the Fund go to columbiamanagement.com. The Fund is distributed by Columbia Management Investment Distributors, Inc., member FINRA, and managed by Columbia Management Investment Advisers, LLC.
© 2014 Columbia Management Investment Advisers, LLC. All rights reserved.
ANN237_04_D01_(06/14)
Item 2. Code of Ethics.
(a) The registrant has adopted a code of ethics that applies to the registrant’s principal executive officer, principal financial officer, principal accounting officer or controller, or persons performing similar functions, regardless of whether these individuals are employed by the registrant or a third party.
(b) During the period covered by this report, there were not any amendments to a provision of the code of ethics adopted in 2(a) above.
(c) During the period covered by this report, there were no waivers, including any implicit waivers, from a provision of the code of ethics described in 2(a) above that relates to one or more of the items set forth in paragraph (b) of this item’s instructions.
Item 3. Audit Committee Financial Expert.
The registrant’s Board of Trustees has determined that Douglas A. Hacker, David M. Moffett and Anne-Lee Verville, each of whom are members of the registrant’s Board of Trustees and Audit Committee, each qualify as an audit committee financial expert. Mr. Hacker, Mr. Moffett and Ms. Verville are each independent trustees, as defined in paragraph (a)(2) of this item’s instructions.
Item 4. Principal Accountant Fees and Services.
Fee information below is disclosed for the five series of the registrant whose reports to stockholders are included in this annual filing.
(a) Audit Fees. Aggregate Audit Fees billed by the principal accountant for professional services rendered during the fiscal years ended April 30, 2014 and April 30, 2013 are approximately as follows:
2014 | | 2013 | |
$ | 120,500 | | $ | 127,300 | |
| | | | | |
Audit Fees include amounts related to the audit of the registrant’s annual financial statements or services that are normally provided by the accountant in connection with statutory and regulatory filings or engagements for those fiscal years. Fiscal year 2013
also includes Audit Fees for the review and provision of consent in connection with filing Form N-1A for fund mergers and for a new share class.
(b) Audit-Related Fees. Aggregate Audit-Related Fees billed to the registrant by the principal accountant for professional services rendered during the fiscal years ended April 30, 2014 and April 30, 2013 are approximately as follows:
Audit-Related Fees include amounts for assurance and related services by the principal accountant that are reasonably related to the performance of the audit of the registrant’s financial statements and are not reported in Audit Fees above. In fiscal years 2014 and 2013, Audit-Related Fees consist of agreed-upon procedures performed for semi-annual shareholder reports. In fiscal year 2013, Audit-Related Fees consist of agreed-upon procedures related to fund mergers.
During the fiscal years ended April 30, 2014 and April 30, 2013, there were no Audit-Related Fees billed by the registrant’s principal accountant to the registrant’s investment adviser (not including any sub-adviser whose role is primarily portfolio management and is subcontracted with or overseen by another investment adviser) and any entity controlling, controlled by, or under common control with the adviser that provides ongoing services to the registrant for an engagement that related directly to the operations and financial reporting of the registrant.
(c) Tax Fees. Aggregate Tax Fees billed by the principal accountant to the registrant for professional services rendered during the fiscal years ended April 30, 2014 and April 30, 2013 are approximately as follows:
2014 | | 2013 | |
$ | 27,200 | | $ | 44,700 | |
| | | | | |
Tax Fees include amounts for the review of annual tax returns, the review of required shareholder distribution calculations and typically include amounts for professional services by the principal accountant for tax compliance, tax advice and tax planning.
During the fiscal years ended April 30, 2014 and April 30, 2013, there were no Tax Fees billed by the registrant’s principal accountant to the registrant’s investment adviser (not including any sub-adviser whose role is primarily portfolio management and is subcontracted with or overseen by another investment adviser) and any entity controlling, controlled by, or under common control with the adviser that provides ongoing services to the registrant for an engagement that related directly to the operations and financial reporting of the registrant.
(d) All Other Fees. Aggregate All Other Fees billed by the principal accountant to the registrant for professional services rendered during the fiscal years ended April 30, 2014 and April 30, 2013 are approximately as follows:
All Other Fees include amounts for products and services provided by the principal accountant, other than the services reported in paragraphs (a) through (c) above.
Aggregate All Other Fees billed by the registrant’s principal accountant to the registrant’s investment adviser (not including any sub-adviser whose role is primarily portfolio management and is subcontracted with or overseen by another investment adviser) and any entity controlling, controlled by, or under common control with the adviser that provides ongoing services to the registrant for an engagement that related directly to the operations and financial reporting of the registrant during the fiscal years ended April 30, 2014 and April 30, 2013 are approximately as follows:
2014 | | 2013 | |
$ | 325,000 | | $ | 118,200 | |
| | | | | |
In fiscal year 2014, All Other Fees primarily consist of fees billed for internal control examinations of the registrant’s transfer agent and investment advisor. In fiscal year 2013, All Other Fees consist of fees billed for an internal control examination of the registrant’s transfer agent.
(e)(1) Audit Committee Pre-Approval Policies and Procedures
The registrant’s Audit Committee is required to pre-approve the engagement of the registrant’s independent auditors to provide audit and non-audit services to the registrant and non-audit services to its investment adviser (excluding any sub-adviser whose role is primarily portfolio management and is sub-contracted or overseen by another investment adviser (the “Adviser”) or any entity controlling, controlled by or under common control with the Adviser that provides ongoing services to the Fund (a “Control Affiliate”) if the engagement relates directly to the operations and financial reporting of the registrant.
The Audit Committee has adopted a Policy for Engagement of Independent Auditors for Audit and Non-Audit Services (the “Policy”). The Policy sets forth the understanding of the Audit Committee regarding the engagement of the registrant’s independent accountants to provide (i) audit and permissible audit-related, tax and other services to the registrant (“Fund Services”); (ii) non-audit services to the registrant’s Adviser and any Control Affiliates, that relates directly to the operations and financial reporting of a Fund (“Fund-related Adviser Services”); and (iii) certain other audit and non-audit services to the registrant’s Adviser and its Control Affiliates. A service will require specific pre-approval by the Audit Committee if it is to be provided by the Fund’s independent auditor; provided, however, that pre-approval of non-audit services to the
Fund, the Adviser or Control Affiliates may be waived if certain de minimis requirements set forth in the SEC’s rules are met.
Under the Policy, the Audit Committee may delegate pre-approval authority to any pre-designated member or members who are independent board members. The member(s) to whom such authority is delegated must report, for informational purposes only, any pre-approval decisions to the Audit Committee at its next regular meeting. The Audit Committee’s responsibilities with respect to the pre-approval of services performed by the independent auditor may not be delegated to management.
On an annual basis, at a regularly scheduled Audit Committee meeting, the Fund’s Treasurer or other Fund officer shall submit to the Audit Committee a schedule of the types of Fund Services and Fund-related Adviser Services that are subject to specific pre-approval. This schedule will provide a description of each type of service that is subject to specific pre-approval, along with total projected fees for each service. The pre-approval will generally cover a one-year period. The Audit Committee will review and approve the types of services and the projected fees for the next one-year period and may add to, or subtract from, the list of pre-approved services from time to time, based on subsequent determinations. This specific approval acknowledges that the Audit Committee is in agreement with the specific types of services that the independent auditor will be permitted to perform and the projected fees for each service.
The Fund’s Treasurer or other Fund officer shall report to the Audit Committee at each of its regular meetings regarding all Fund Services or Fund-related Adviser Services provided since the last such report was rendered, including a description of the services, by category, with forecasted fees for the annual reporting period, proposed changes requiring specific pre-approval and a description of services provided by the independent auditor, by category, with actual fees during the current reporting period.
*****
(e)(2) 100% of the services performed for items (b) through (d) above during 2014 and 2013 were pre-approved by the registrant’s Audit Committee.
(f) Not applicable.
(g) The aggregate non-audit fees billed by the registrant’s accountant for services rendered to the registrant, and rendered to the registrant’s investment adviser (not including any sub-adviser whose role is primarily portfolio management and is subcontracted with or overseen by another investment adviser), and any entity controlling, controlled by, or under common control with the adviser that provides ongoing services to the registrant during the fiscal years ended April 30, 2014 and April 30, 2013 are approximately as follows:
2014 | | 2013 | |
$ | 354,200 | | $ | 166,900 | |
| | | | | |
(h) The registrant’s Audit Committee of the Board of Directors has considered whether the provision of non-audit services that were rendered to the registrant’s adviser (not including any sub-adviser whose role is primarily portfolio management and is subcontracted with or overseen by another investment adviser), and any entity controlling, controlled by, or under common control with the investment adviser that provides ongoing services to the registrant that were not pre-approved pursuant to paragraph (c)(7)(ii) of Rule 2-01 of Regulation S-X, is compatible with maintaining the principal accountant’s independence.
Item 5. Audit Committee of Listed Registrants.
Not applicable.
Item 6. Investments
(a) The registrant’s “Schedule I — Investments in securities of unaffiliated issuers” (as set forth in 17 CFR 210.12-12) is included in Item 1 of this Form N-CSR.
(b) Not applicable.
Item 7. Disclosure of Proxy Voting Policies and Procedures for Closed-End Management Investment Companies.
Not applicable.
Item 8. Portfolio Managers of Closed-End Management Investment Companies.
Not applicable.
Item 9. Purchases of Equity Securities by Closed-End Management Investment Company and Affiliated Purchasers.
Not applicable.
Item 10. Submission of Matters to a Vote of Security Holders.
There were no material changes to the procedures by which shareholders may recommend nominees to the registrant’s board of directors.
Item 11. Controls and Procedures.
(a) The registrant’s principal executive officer and principal financial officers, based on their evaluation of the registrant’s disclosure controls and procedures as of a date within 90 days of the filing of this report, have concluded that such controls and procedures are adequately designed to ensure that material information required to be disclosed by the registrant in Form N-CSR is accumulated and
communicated to the registrant’s management, including the principal executive officer and principal financial officer, or persons performing similar functions, as appropriate to allow timely decisions regarding required disclosure.
(b) There was no change in the registrant’s internal control over financial reporting that occurred during the registrant’s second fiscal quarter of the period covered by this report that has materially affected, or is reasonably likely to materially affect, the registrant’s internal control over financial reporting.
Item 12. Exhibits.
(a)(1) Code of ethics required to be disclosed under Item 2 of Form N-CSR attached hereto as Exhibit 99.CODE ETH.
(a)(2) Certifications pursuant to Rule 30a-2(a) under the Investment Company Act of 1940 (17 CFR 270.30a-2(a)) attached hereto as Exhibit 99.CERT.
(a)(3) Not applicable.
(b) Certification pursuant to Rule 30a-2(b) under the Investment Company Act of 1940 (17 CFR 270.30a-2(b)) attached hereto as Exhibit 99.906CERT.
SIGNATURES
Pursuant to the requirements of the Securities Exchange Act of 1934 and the Investment Company Act of 1940, the registrant has duly caused this report to be signed on its behalf by the undersigned, thereunto duly authorized.
(registrant) | | Columbia Funds Series Trust I | |
| | |
| | |
By (Signature and Title) | | /s/ J. Kevin Connaughton | |
| J. Kevin Connaughton, President and Principal Executive Officer | |
| | |
| | |
Date | | June 20, 2014 | |
| | |
| | |
Pursuant to the requirements of the Securities Exchange Act of 1934 and the Investment Company Act of 1940, this report has been signed below by the following persons on behalf of the registrant and in the capacities and on the dates indicated. |
| | |
| | |
By (Signature and Title) | | /s/ J. Kevin Connaughton | |
| J. Kevin Connaughton, President and Principal Executive Officer | |
| | |
| | |
Date | | June 20, 2014 | |
| | |
| | |
By (Signature and Title) | | /s/ Michael G. Clarke | |
| Michael G. Clarke, Treasurer and Chief Financial Officer | |
| | |
| | |
Date | | June 20, 2014 | |
| | | | | | | |