UNITED STATES
SECURITIES AND EXCHANGE COMMISSION
Washington, D.C. 20549
FORM N-CSR
CERTIFIED SHAREHOLDER REPORT OF REGISTERED
MANAGEMENT INVESTMENT COMPANIES
Investment Company Act file number | 811-04367 |
|
Columbia Funds Series Trust I |
(Exact name of registrant as specified in charter) |
|
225 Franklin Street, Boston, MA | | 02110 |
(Address of principal executive offices) | | (Zip code) |
|
Christopher O. Petersen, Esq. c/o Columbia Management Investment Advisers, LLC 225 Franklin Street Boston, MA 02110 |
(Name and address of agent for service) |
|
Registrant’s telephone number, including area code: | (800) 345-6611 | |
|
Date of fiscal year end: | May 31 | |
|
Date of reporting period: | May 31, 2014 | |
| | | | | | | | |
Form N-CSR is to be used by management investment companies to file reports with the Commission not later than 10 days after the transmission to stockholders of any report that is required to be transmitted to stockholders under Rule 30e-1 under the Investment Company Act of 1940 (17 CFR 270.30e-1). The Commission may use the information provided on Form N-CSR in its regulatory, disclosure review, inspection, and policymaking roles.
A registrant is required to disclose the information specified by Form N-CSR, and the Commission will make this information public. A registrant is not required to respond to the collection of information contained in Form N-CSR unless the Form displays a currently valid Office of Management and Budget (“OMB”) control number. Please direct comments concerning the accuracy of the information collection burden estimate and any suggestions for reducing the burden to Secretary, Securities and Exchange Commission, 450 Fifth Street, NW, Washington, DC 20549-0609. The OMB has reviewed this collection of information under the clearance requirements of 44 U.S.C. § 3507.
Item 1. Reports to Stockholders.
Annual Report
May 31, 2014

Columbia Dividend Income Fund
Not FDIC insured • No bank guarantee • May lose value
 Dear Shareholders,
Continued Economic Recovery
The U.S. economy continued to recover at a slow but steady pace during the first quarter of 2014, supported by solid manufacturing activity, reasonable job growth and continued gains for the housing market. Industrial production was robust, buoyed by strong demand for autos and related parts. After a disappointing January, job growth picked up, which helped boost consumer confidence. Housing data was somewhat mixed, as harsh weather and higher mortgage rates put a damper on sales, while lower inventories helped prices trend higher. The Federal Reserve (the Fed) announced further reductions to its monthly asset purchases and reassured the markets that it would not make any significant changes to monetary policy until it was satisfied that the labor market was on solid ground. Despite mostly good news on the economic front, the broad financial markets recorded only modest gains, as bitter winter weather at home and mounting tensions between Russia and Western allies prompted investor caution.
Investors braced for higher interest rates, but long-term yields declined and the fixed-income markets were surprisingly resilient in the face of stable-to-improving economic data. Risk-on trading continued during the quarter as the higher yielding sectors of the fixed-income markets generally fared well. Emerging-market bonds, long-term U.S. Treasuries and sovereign debt were among the strongest performers, as were Treasury Inflation Protected Securities. Municipal bonds delivered solid gains, especially high-yield municipals, which benefited from continued improvement in state finances.
Against this backdrop, the broad bond market, as measured by the Barclays U.S. Aggregate Bond Index, edged out the broad stock market, as measured by the Standard & Poor's 500 Index, with gains of 1.84% vs. 1.81%, respectively. As indicated late last year, the Fed began tapering its monthly asset purchase program and announced further reductions. New Fed chair Janet Yellen reassured investors the Fed was committed to keeping short-term borrowing rates low into 2015.
Stay on Track with Columbia Management
Backed by more than 100 years of experience, Columbia Management is one of the nation's largest asset managers. At the heart of our success and, most importantly, that of our investors, are highly talented industry professionals, brought together by a unique way of working. At Columbia Management, reaching our performance goals matters, and how we reach them matters just as much.
Visit columbiamanagement.com for:
> The Columbia Management Perspectives blog, offering insights on current market events and investment opportunities
> Detailed up-to-date fund performance and portfolio information
> Quarterly fund commentaries
> Columbia Management investor, our award-winning quarterly newsletter for shareholders
Thank you for your continued support of the Columbia Funds. We look forward to serving your investment needs for many years to come.
Best Regards,

J. Kevin Connaughton
President, Columbia Funds
Investing involves risk including the risk of loss of principal.
The Barclays U.S. Aggregate Bond Index is a broad-based benchmark that measures the investment grade, U.S. dollar denominated, fixed-rate taxable bond market, including Treasuries, government-related and corporate securities, mortgage-backed securities (agency fixed-rate and hybrid adjustable-rate mortgage passthroughs), asset-backed securities, and commercial mortgage-backed securities. The S&P 500 Index, an unmanaged index, measures the performance of 500 widely held, large-capitalization U.S. stocks and is frequently used as a general measure of market performance. Indices are not available for investment, are not professionally managed and do not reflect sales charges, fees, brokerage commissions, taxes or other expenses of investing.
Investors should consider the investment objectives, risks, charges and expenses of a mutual fund carefully before investing. For a free prospectus and, if available, a summary prospectus, which contains this and other important information about a fund, visit columbiamanagement.com. The prospectus should be read carefully before investing.
Columbia Funds are distributed by Columbia Management Investment Distributors, Inc., member FINRA, and managed by Columbia Management Investment Advisers, LLC.
© 2014 Columbia Management Investment Advisers, LLC. All rights reserved.
Columbia Dividend Income Fund
Performance Overview | | | 2 | | |
Manager Discussion of Fund Performance | | | 4 | | |
Understanding Your Fund's Expenses | | | 6 | | |
Portfolio of Investments | | | 7 | | |
Statement of Assets and Liabilities | | | 12 | | |
Statement of Operations | | | 14 | | |
Statement of Changes in Net Assets | | | 15 | | |
Financial Highlights | | | 18 | | |
Notes to Financial Statements | | | 29 | | |
Report of Independent Registered
Public Accounting Firm | | | 35 | | |
Federal Income Tax Information | | | 36 | | |
Trustees and Officers | | | 37 | | |
Important Information About This Report | | | 41 | | |
Fund Investment Manager
Columbia Management Investment
Advisers, LLC
225 Franklin Street
Boston, MA 02110
Fund Distributor
Columbia Management Investment
Distributors, Inc.
225 Franklin Street
Boston, MA 02110
Fund Transfer Agent
Columbia Management Investment
Services Corp.
P.O. Box 8081
Boston, MA 02266-8081
For more information about any of the funds, please visit columbiamanagement.com or call 800.345.6611. Customer Service Representatives are available to answer your questions Monday through Friday from 8 a.m. to 7 p.m. Eastern time.
The views expressed in this report reflect the current views of the respective parties. These views are not guarantees of future performance and involve certain risks, uncertainties and assumptions that are difficult to predict, so actual outcomes and results may differ significantly from the views expressed. These views are subject to change at any time based upon economic, market or other conditions and the respective parties disclaim any responsibility to update such views. These views may not be relied on as investment advice and, because investment decisions for a Columbia Fund are based on numerous factors, may not be relied on as an indication of trading intent on behalf of any particular Columbia Fund. References to specific securities should not be construed as a recommendation or investment advice.
Columbia Dividend Income Fund
Performance Summary
> Columbia Dividend Income Fund (the Fund) Class A shares returned 15.25% excluding sales charges for the 12-month period that ended May 31, 2014.
> The Fund underperformed its benchmark, the Russell 1000 Index, which returned 20.90% for the same time period.
> Lack of exposure to more economically sensitive and highly priced momentum issues, including non-dividend-paying information technology and biotechnology stocks, held back the Fund's relative results, despite good performance from investments in the financial and industrial sectors.
Average Annual Total Returns (%) (for period ended May 31, 2014)
| | | Inception | | 1 Year | | 5 Years | | 10 Years | |
Class A | | 11/25/02 | | | | | | | | | | | | | |
Excluding sales charges | | | | | | | 15.25 | | | | 16.36 | | | | 8.90 | | |
Including sales charges | | | | | | | 8.63 | | | | 14.99 | | | | 8.26 | | |
Class B | | 11/25/02 | | | | | | | | | | | | | |
Excluding sales charges | | | | | | | 14.33 | | | | 15.49 | | | | 8.09 | | |
Including sales charges | | | | | | | 9.33 | | | | 15.27 | | | | 8.09 | | |
Class C | | 11/25/02 | | | | | | | | | | | | | |
Excluding sales charges | | | | | | | 14.33 | | | | 15.48 | | | | 8.10 | | |
Including sales charges | | | | | | | 13.33 | | | | 15.48 | | | | 8.10 | | |
Class I* | | 09/27/10 | | | 15.72 | | | | 16.79 | | | | 9.25 | | |
Class R* | | 03/28/08 | | | 14.96 | | | | 16.07 | | | | 8.64 | | |
Class R4* | | 11/08/12 | | | 15.51 | | | | 16.65 | | | | 9.18 | | |
Class R5* | | 11/08/12 | | | 15.68 | | | | 16.69 | | | | 9.20 | | |
Class T | | 03/04/98 | | | | | | | | | | | | | |
Excluding sales charges | | | | | | | 15.19 | | | | 16.30 | | | | 8.86 | | |
Including sales charges | | | | | | | 8.57 | | | | 14.93 | | | | 8.22 | | |
Class W* | | 09/27/10 | | | 15.21 | | | | 16.37 | | | | 8.94 | | |
Class Y* | | 11/08/12 | | | 15.72 | | | | 16.71 | | | | 9.21 | | |
Class Z | | 03/04/98 | | | 15.46 | | | | 16.64 | | | | 9.18 | | |
Russell 1000 Index | | | | | | | 20.90 | | | | 18.77 | | | | 8.14 | | |
Returns for Class A and Class T are shown with and without the maximum initial sales charge of 5.75%. Returns for Class B are shown with and without the applicable contingent deferred sales charge (CDSC) of 5.00% in the first year, declining to 1.00% in the sixth year and eliminated thereafter. Returns for Class C are shown with and without the 1.00% CDSC for the first year only. The Fund's other classes are not subject to sales charges and have limited eligibility. Please see the Fund's prospectus for details. Performance for different share classes will vary based on differences in sales charges and fees associated with each class. All results shown assume reinvestment of distributions during the period. Returns do not reflect the deduction of taxes that a shareholder may pay on Fund distributions or on the redemption of Fund shares. Performance results reflect the effect of any fee waivers or reimbursements of Fund expenses by Columbia Management Investment Advisers, LLC and/or any of its affiliates. Absent these fee waivers or expense reimbursement arrangements, performance results would have been lower.
The performance information shown represents past performance and is not a guarantee of future results. The investment return and principal value of your investment will fluctuate so that your shares, when redeemed, may be worth more or less than their original cost. Current performance may be lower or higher than the performance information shown. You may obtain performance information current to the most recent month-end by contacting your financial intermediary, visiting columbiamanagement.com or calling 800.345.6611.
*The returns shown for periods prior to the share class inception date (including returns for the Life of the Fund, if shown, which are since Fund inception) include the returns of the Fund's oldest share class. Since the Fund launched more than one share class at its inception, Class Z shares were used. These returns are adjusted to reflect any higher class-related operating expenses of the newer share classes, as applicable. Please visit columbiamanagement.com/mutual-funds/appended-performance for more information.
The Russell 1000 Index measures the performance of the large-cap segment of the U.S. equity universe. It is a subset of the Russell 3000 Index and includes approximately 1000 of the largest securities based on a combination of their market cap and current index membership. The Russell 1000 Index represents approximately 92% of the U.S. market.
Indices are not available for investment, are not professionally managed and do not reflect sales charges, fees, brokerage commissions, taxes or other expenses of investing. Securities in the Fund may not match those in an index.
Annual Report 2014
2
Columbia Dividend Income Fund
Performance Overview (continued)
Performance of a Hypothetical $10,000 Investment (June 1, 2004 – May 31, 2014)

The chart above shows the change in value of a hypothetical $10,000 investment in Class A shares of Columbia Dividend Income Fund during the stated time period, and does not reflect the deduction of taxes that a shareholder may pay on Fund distributions or on the redemption of Fund shares.
Annual Report 2014
3
Columbia Dividend Income Fund
Manager Discussion of Fund Performance
For the 12-month period that ended May 31, 2014, the Fund's Class A shares returned 15.25% excluding sales charges. The Fund underperformed its benchmark, the Russell 1000 Index, which returned 20.90% for the same period. Most of the Fund's relative underperformance came during the first half of the period, when investors favored more speculative stocks — notably in the information technology and biotechnology groups — over the more stable growth, dividend-paying stocks that the Fund traditionally emphasizes. Investments in the financials and industrials sectors tended to help overall results, but not enough to overcome the effects of underexposure to high-momentum companies and disappointing performance by selections in the consumer discretionary and energy sectors.
Continued Economic Growth Drove Fed Action, Markets
Even though a difficult winter weighed on the U.S. economy early in 2014, it was not enough to derail the steady growth that marked the 12-month period. Solid new job growth drove the unemployment rate down to 6.3%. Robust manufacturing activity boosted the nation's capacity utilization rate to a recovery high of 79.2% in March 2014. Personal income edged higher, borrowing increased and the savings rate declined. Consumer confidence generally rose during the 12-month period, reflecting consumer expectations that the economy was on solid ground. The housing market lost some momentum, the victim of bad winter weather, tighter borrowing standards, rising prices and higher mortgage rates. However, higher pending home sales near the end of the period was a positive data point.
Investors welcomed reduced tensions in Washington, where an extended budget deal and the president's nomination of Janet Yellen as the new Federal Reserve (Fed) chair received bipartisan support. In December, the Fed announced that it would take a measured approach to tapering its monthly bond-buying program, beginning in January 2014. Further tapering commenced as the period wore on. Against this backdrop of generally positive economic news, interest rates were expected to rise — and they did in the first half of the period. However, the yield on the 10-year U.S. Treasury, a bellwether for the bond market, declined in the second half, providing continued support to a rising U.S. stock market.
Contributors and Detractors
An overweight and good stock selection in the financials sector helped boost the Fund's relative performance, led by strong results from such established corporations as JP Morgan Chase, Wells Fargo and insurance broker Marsh McLennon. We did well to avoid low-dividend-paying and non-dividend-paying corporations, such as Citigroup and Berkshire Hathaway, as both underperformed this sector. Selection among industrials companies was also successful, led by strong performance by defense contractor Raytheon, aircraft manufacturer Boeing and diversified corporation Dover.
The shares of established, dividend-paying companies with healthy cash flows and strong balance sheets advanced but trailed the market appreciation of the favored highly priced and earnings momentum stocks over the period, especially during the first six months of the reporting period. In this environment, the Fund's emphasis on higher quality companies with better-than-average free cash
Portfolio Management
Scott Davis
Michael Barclay, CFA
Peter Santoro, CFA*
*Effective June 25, 2014, Mr. Santoro was named a Portfolio Manager of the Fund. David King no longer serves as a Portfolio Manager of the Fund.
Morningstar Style BoxTM

The Morningstar Style BoxTM is based on a fund's portfolio holdings. For equity funds, the vertical axis shows the market capitalization of the stocks owned, and the horizontal axis shows investment style (value, blend, or growth). Information shown is based on the most recent data provided by Morningstar.
© 2014 Morningstar, Inc. All rights reserved. The Morningstar information contained herein: (1) is proprietary to Morningstar and/or its content providers; (2) may not be copied or distributed; and (3) is not warranted to be accurate, complete or timely. Neither Morningstar nor its content providers are responsible for any damages or losses arising from any use of this information.
Investment Risks
Risks include stock market fluctuations due to business and economic developments. Value stocks may also be subject to specific business risks that have caused the stocks to be out of favor. Lower-rated and medium-quality debt securities are more speculative and incur more risk. Dividend payments are not guaranteed. The amount of a dividend payment, if any, can vary over time and issuers may reduce dividends paid on securities in the event of a recession or adverse event affecting a specific industry or issuer. See the Fund's prospectus for information on these and other risks.
Annual Report 2014
4
Columbia Dividend Income Fund
Manager Discussion of Fund Performance (continued)
flows and histories of paying healthy dividends led to a solid, double-digit total return that nevertheless fell short of that of the benchmark.
The Fund's positioning and selection in certain consumer discretionary, health care, energy and information technology stocks detracted from performance, as we avoided some of the more speculative names. In the consumer discretionary group, successful longer term holdings such as Home Depot and McDonald's fell out of favor and underperformed. We continued to hold them, although we sold another disappointing performer, toy-maker Mattel, after earnings fell short of expectations during the pivotal 2013 holiday sales season. In health care, the Fund had no exposure to non-dividend-paying biotechnology companies, many of which had explosive stock performance. Also hurting relative results in the health care group was a position in pharmaceutical company Pfizer, which stalled out amid concerns about restructuring.
In energy, integrated oil company Chevron underperformed, as did drilling firm Ensco before we sold it. The Fund also was hurt by its lack of exposure to such high-flying but non-dividend-paying information technology companies as Facebook and Google, while some more established holdings, such as IBM, trailed the market.
Looking Ahead
After a five-year market rally driven, in part, by Fed-induced speculation, stock prices have increased to levels that raise concerns about risk. While we cannot predict future market trends with any certainty, it is interesting to note that some formerly high-flying stocks already have declined, while more established companies, with healthy dividend payments, have improved in relative performance.
Going forward, we intend to maintain our focus on investments in higher quality companies, with healthy free cash flows and the ability to sustain and grow dividends. This is a relatively conservative process that pays careful attention to risk as well as opportunity. We plan to continue to focus on seeking good risk-adjusted returns over the longer term.
Top Ten Holdings (%)
(at May 31, 2014) | |
Verizon Communications, Inc. | | | 3.2 | | |
Johnson & Johnson | | | 2.9 | | |
Pfizer, Inc. | | | 2.8 | | |
Merck & Co., Inc. | | | 2.7 | | |
Microsoft Corp. | | | 2.6 | | |
Wells Fargo & Co. | | | 2.4 | | |
JPMorgan Chase & Co. | | | 2.4 | | |
AbbVie, Inc. | | | 2.3 | | |
Chevron Corp. | | | 2.3 | | |
Home Depot, Inc. (The) | | | 2.3 | | |
Percentages indicated are based upon total investments (excluding Money Market Funds).
For further detail about these holdings, please refer to the section entitled "Portfolio of Investments."
Fund holdings are as of the date given, are subject to change at any time, and are not recommendations to buy or sell any security.
Portfolio Breakdown (%)
(at May 31, 2014) | |
Common Stocks | | | 97.8 | | |
Consumer Discretionary | | | 8.9 | | |
Consumer Staples | | | 9.9 | | |
Energy | | | 10.5 | | |
Financials | | | 17.9 | | |
Health Care | | | 13.7 | | |
Industrials | | | 10.7 | | |
Information Technology | | | 14.1 | | |
Materials | | | 3.6 | | |
Telecommunication Services | | | 4.1 | | |
Utilities | | | 4.4 | | |
Exchange-Traded Funds | | | 1.1 | | |
Money Market Funds | | | 1.1 | | |
Total | | | 100.0 | | |
Percentages indicated are based upon total investments. The Fund's portfolio composition is subject to change.
Annual Report 2014
5
Columbia Dividend Income Fund
Understanding Your Fund's Expenses
(Unaudited)
As an investor, you incur two types of costs. There are transaction costs, which generally include sales charges on purchases and may include redemption fees. There are also ongoing costs, which generally include management fees, distribution and/or service fees, and other fund expenses. The following information is intended to help you understand your ongoing costs (in dollars) of investing in the Fund and to help you compare these costs with the ongoing costs of investing in other mutual funds.
Analyzing Your Fund's Expenses
To illustrate these ongoing costs, we have provided examples and calculated the expenses paid by investors in each share class of the Fund during the period. The actual and hypothetical information in the table is based on an initial investment of $1,000 at the beginning of the period indicated and held for the entire period. Expense information is calculated two ways and each method provides you with different information. The amount listed in the "Actual" column is calculated using the Fund's actual operating expenses and total return for the period. You may use the Actual information, together with the amount invested, to estimate the expenses that you paid over the period. Simply divide your account value by $1,000 (for example, an $8,600 account value divided by $1,000 = 8.6), then multiply the results by the expenses paid during the period under the "Actual" column. The amount listed in the "Hypothetical" column assumes a 5% annual rate of return before expenses (which is not the Fund's actual return) and then applies the Fund's actual expense ratio for the period to the hypothetical return. You should not use the hypothetical account values and expenses to estimate either your actual account balance at the end of the period or the expenses you paid during the period. See "Compare With Other Funds" below for details on how to use the hypothetical data.
Compare With Other Funds
Since all mutual funds are required to include the same hypothetical calculations about expenses in shareholder reports, you can use this information to compare the ongoing cost of investing in the Fund with other funds. To do so, compare the hypothetical example with the 5% hypothetical examples that appear in the shareholder reports of other funds. As you compare hypothetical examples of other funds, it is important to note that hypothetical examples are meant to highlight the ongoing costs of investing in a fund only and do not reflect any transaction costs, such as sales charges, or redemption or exchange fees. Therefore, the hypothetical calculations are useful in comparing ongoing costs only, and will not help you determine the relative total costs of owning different funds. If transaction costs were included in these calculations, your costs would be higher.
December 1, 2013 – May 31, 2014
| | | Account Value at the Beginning
of the Period ($) | | Account Value at the End
of the Period ($) | | Expenses Paid During
the Period ($) | | Fund's Annualized
Expense Ratio (%) | |
| | | Actual | | Hypothetical | | Actual | | Hypothetical | | Actual | | Hypothetical | | Actual | |
Class A | | | 1,000.00 | | | | 1,000.00 | | | | 1,067.00 | | | | 1,019.85 | | | | 5.26 | | | | 5.14 | | | | 1.02 | | |
Class B | | | 1,000.00 | | | | 1,000.00 | | | | 1,063.00 | | | | 1,016.11 | | | | 9.10 | | | | 8.90 | | | | 1.77 | | |
Class C | | | 1,000.00 | | | | 1,000.00 | | | | 1,063.00 | | | | 1,016.11 | | | | 9.10 | | | | 8.90 | | | | 1.77 | | |
Class I | | | 1,000.00 | | | | 1,000.00 | | | | 1,069.80 | | | | 1,022.04 | | | | 2.99 | | | | 2.92 | | | | 0.58 | | |
Class R | | | 1,000.00 | | | | 1,000.00 | | | | 1,065.70 | | | | 1,018.60 | | | | 6.54 | | | | 6.39 | | | | 1.27 | | |
Class R4 | | | 1,000.00 | | | | 1,000.00 | | | | 1,068.60 | | | | 1,021.09 | | | | 3.97 | | | | 3.88 | | | | 0.77 | | |
Class R5 | | | 1,000.00 | | | | 1,000.00 | | | | 1,068.70 | | | | 1,021.74 | | | | 3.30 | | | | 3.23 | | | | 0.64 | | |
Class T | | | 1,000.00 | | | | 1,000.00 | | | | 1,066.80 | | | | 1,019.60 | | | | 5.51 | | | | 5.39 | | | | 1.07 | | |
Class W | | | 1,000.00 | | | | 1,000.00 | | | | 1,067.20 | | | | 1,019.85 | | | | 5.26 | | | | 5.14 | | | | 1.02 | | |
Class Y | | | 1,000.00 | | | | 1,000.00 | | | | 1,068.90 | | | | 1,021.99 | | | | 3.04 | | | | 2.97 | | | | 0.59 | | |
Class Z | | | 1,000.00 | | | | 1,000.00 | | | | 1,067.70 | | | | 1,021.09 | | | | 3.97 | | | | 3.88 | | | | 0.77 | | |
Expenses paid during the period are equal to the annualized expense ratio for each class as indicated above, multiplied by the average account value over the period and then multiplied by the number of days in the Fund's most recent fiscal half year and divided by 365.
Expenses do not include fees and expenses incurred indirectly by the Fund from the underlying funds in which the Fund may invest (also referred to as "acquired funds"), including affiliated and non-affiliated pooled investment vehicles (including mutual funds and exchange-traded funds).
Annual Report 2014
6
Columbia Dividend Income Fund
Portfolio of Investments
May 31, 2014
(Percentages represent value of investments compared to net assets)
Common Stocks 97.6%
Issuer | | Shares | | Value ($) | |
Consumer Discretionary 8.8% | |
Hotels, Restaurants & Leisure 1.5% | |
McDonald's Corp. | | | 1,320,000 | | | | 133,887,600 | | |
Media 2.6% | |
Comcast Corp., Class A | | | 1,752,000 | | | | 91,454,400 | | |
Time Warner, Inc. | | | 2,070,000 | | | | 144,548,100 | | |
Total | | | | | 236,002,500 | | |
Multiline Retail 1.2% | |
Macy's, Inc. | | | 1,850,000 | | | | 110,796,500 | | |
Specialty Retail 2.3% | |
Home Depot, Inc. (The) | | | 2,515,000 | | | | 201,778,450 | | |
Textiles, Apparel & Luxury Goods 1.2% | |
Hanesbrands, Inc. | | | 575,000 | | | | 48,777,250 | | |
VF Corp. | | | 980,000 | | | | 61,759,600 | | |
Total | | | | | 110,536,850 | | |
Total Consumer Discretionary | | | | | 793,001,900 | | |
Consumer Staples 9.9% | |
Beverages 0.8% | |
Coca-Cola Co. (The) | | | 1,875,000 | | | | 76,706,250 | | |
Food & Staples Retailing 1.2% | |
CVS Caremark Corp. | | | 750,000 | | | | 58,740,000 | | |
Wal-Mart Stores, Inc. | | | 600,000 | | | | 46,062,000 | | |
Total | | | | | 104,802,000 | | |
Food Products 1.8% | |
General Mills, Inc. | | | 1,275,000 | | | | 70,035,750 | | |
Kellogg Co. | | | 715,000 | | | | 49,320,700 | | |
Kraft Foods Group, Inc. | | | 760,000 | | | | 45,189,600 | | |
Total | | | | | 164,546,050 | | |
Household Products 2.6% | |
Kimberly-Clark Corp. | | | 930,000 | | | | 104,485,500 | | |
Procter & Gamble Co. (The) | | | 1,580,000 | | | | 127,648,200 | | |
Total | | | | | 232,133,700 | | |
Tobacco 3.5% | |
Altria Group, Inc. | | | 2,860,000 | | | | 118,861,600 | | |
Common Stocks (continued)
Issuer | | Shares | | Value ($) | |
Philip Morris International, Inc. | | | 2,200,000 | | | | 194,788,000 | | |
Total | | | | | 313,649,600 | | |
Total Consumer Staples | | | | | 891,837,600 | | |
Energy 10.5% | |
Energy Equipment & Services 1.6% | |
Schlumberger Ltd. | | | 1,325,000 | | | | 137,853,000 | | |
Oil, Gas & Consumable Fuels 8.9% | |
| BP PLC, ADR | | | 945,000 | | | | 47,675,250 | | |
Chevron Corp. | | | 1,670,000 | | | | 205,059,300 | | |
ConocoPhillips | | | 1,575,000 | | | | 125,905,500 | | |
Exxon Mobil Corp. | | | 1,850,000 | | | | 185,980,500 | | |
Occidental Petroleum Corp. | | | 490,000 | | | | 48,848,100 | | |
Phillips 66 | | | 1,040,000 | | | | 88,181,600 | | |
Royal Dutch Shell PLC, ADR | | | 1,270,000 | | | | 99,822,000 | | |
Total | | | | | 801,472,250 | | |
Total Energy | | | | | 939,325,250 | | |
Financials 17.9% | |
Banks 7.9% | |
Fifth Third Bancorp | | | 2,850,000 | | | | 58,966,500 | | |
JPMorgan Chase & Co. | | | 3,800,000 | | | | 211,166,000 | | |
PNC Financial Services Group, Inc. (The) | | | 1,050,000 | | | | 89,533,500 | | |
U.S. Bancorp | | | 3,258,000 | | | | 137,455,020 | | |
Wells Fargo & Co. | | | 4,250,000 | | | | 215,815,000 | | |
Total | | | | | 712,936,020 | | |
Capital Markets 2.8% | |
BlackRock, Inc. | | | 437,000 | | | | 133,241,300 | | |
Northern Trust Corp. | | | 1,028,000 | | | | 62,091,200 | | |
T. Rowe Price Group, Inc. | | | 700,000 | | | | 57,071,000 | | |
Total | | | | | 252,403,500 | | |
Consumer Finance 1.0% | |
American Express Co. | | | 1,000,000 | | | | 91,500,000 | | |
Diversified Financial Services 0.8% | |
CME Group, Inc. | | | 980,000 | | | | 70,560,000 | | |
The accompanying Notes to Financial Statements are an integral part of this statement
Annual Report 2014
7
Columbia Dividend Income Fund
Portfolio of Investments (continued)
May 31, 2014
Common Stocks (continued)
Issuer | | Shares | | Value ($) | |
Insurance 4.1% | |
ACE Ltd. | | | 775,000 | | | | 80,375,250 | | |
Chubb Corp. (The) | | | 700,000 | | | | 64,862,000 | | |
Marsh & McLennan Companies, Inc. | | | 2,250,000 | | | | 113,107,500 | | |
MetLife, Inc. | | | 2,110,000 | | | | 107,462,300 | | |
Total | | | | | 365,807,050 | | |
Real Estate Investment Trusts (REITs) 1.3% | |
Public Storage | | | 355,000 | | | | 61,194,900 | | |
Simon Property Group, Inc. | | | 298,000 | | | | 49,605,080 | | |
Washington Prime Group, Inc.(a) | | | 149,000 | | | | 2,963,610 | | |
Total | | | | | 113,763,590 | | |
Total Financials | | | | | 1,606,970,160 | | |
Health Care 13.7% | |
Biotechnology 2.1% | |
Amgen, Inc. | | | 1,610,000 | | | | 186,743,900 | | |
Pharmaceuticals 11.6% | |
AbbVie, Inc. | | | 3,800,000 | | | | 206,454,000 | | |
Johnson & Johnson | | | 2,495,000 | | | | 253,142,700 | | |
Merck & Co., Inc. | | | 4,170,000 | | | | 241,276,200 | | |
Pfizer, Inc. | | | 8,325,000 | | | | 246,669,750 | | |
Roche Holding AG, ADR | | | 2,650,000 | | | | 97,758,500 | | |
Total | | | | | 1,045,301,150 | | |
Total Health Care | | | | | 1,232,045,050 | | |
Industrials 10.7% | |
Aerospace & Defense 5.9% | |
Boeing Co. (The) | | | 1,275,000 | | | | 172,443,750 | | |
Honeywell International, Inc. | | | 1,605,000 | | | | 149,505,750 | | |
Raytheon Co. | | | 1,575,000 | | | | 153,672,750 | | |
United Technologies Corp. | | | 475,000 | | | | 55,204,500 | | |
Total | | | | | 530,826,750 | | |
Air Freight & Logistics 1.1% | |
United Parcel Service, Inc., Class B | | | 975,000 | | | | 101,283,000 | | |
Common Stocks (continued)
Issuer | | Shares | | Value ($) | |
Commercial Services & Supplies 0.7% | |
Waste Management, Inc. | | | 1,336,000 | | | | 59,692,480 | | |
Electrical Equipment 0.6% | |
Emerson Electric Co. | | | 775,000 | | | | 51,715,750 | | |
Machinery 2.4% | |
Dover Corp. | | | 1,100,000 | | | | 95,898,000 | | |
Illinois Tool Works, Inc. | | | 565,000 | | | | 48,900,750 | | |
Parker Hannifin Corp. | | | 592,000 | | | | 74,136,160 | | |
Total | | | | | 218,934,910 | | |
Total Industrials | | | | | 962,452,890 | | |
Information Technology 14.0% | |
Communications Equipment 1.7% | |
Cisco Systems, Inc. | | | 4,325,000 | | | | 106,481,500 | | |
QUALCOMM, Inc. | | | 550,000 | | | | 44,247,500 | | |
Total | | | | | 150,729,000 | | |
IT Services 3.5% | |
Accenture PLC, Class A | | | 1,056,000 | | | | 86,011,200 | | |
Automatic Data Processing, Inc. | | | 1,220,000 | | | | 97,209,600 | | |
International Business Machines Corp. | | | 725,000 | | | | 133,661,000 | | |
Total | | | | | 316,881,800 | | |
Semiconductors & Semiconductor Equipment 3.7% | |
Intel Corp. | | | 5,650,000 | | | | 154,358,000 | | |
KLA-Tencor Corp. | | | 1,425,000 | | | | 93,366,000 | | |
Texas Instruments, Inc. | | | 1,750,000 | | | | 82,215,000 | | |
Total | | | | | 329,939,000 | | |
Software 3.0% | |
Microsoft Corp. | | | 5,600,000 | | | | 229,264,000 | | |
Oracle Corp. | | | 1,065,000 | | | | 44,751,300 | | |
Total | | | | | 274,015,300 | | |
Technology Hardware, Storage & Peripherals 2.1% | |
Apple, Inc. | | | 162,000 | | | | 102,546,000 | | |
EMC Corp. | | | 3,255,000 | | | | 86,452,800 | | |
Total | | | | | 188,998,800 | | |
Total Information Technology | | | | | 1,260,563,900 | | |
The accompanying Notes to Financial Statements are an integral part of this statement
Annual Report 2014
8
Columbia Dividend Income Fund
Portfolio of Investments (continued)
May 31, 2014
Common Stocks (continued)
Issuer | | Shares | | Value ($) | |
Materials 3.6% | |
Chemicals 3.1% | |
EI du Pont de Nemours & Co. | | | 1,620,000 | | | | 112,282,200 | | |
LyondellBasell Industries NV, Class A | | | 745,000 | | | | 74,179,650 | | |
Sherwin-Williams Co. (The) | | | 450,000 | | | | 92,074,500 | | |
Total | | | | | 278,536,350 | | |
Containers & Packaging 0.5% | |
Sonoco Products Co. | | | 1,125,000 | | | | 47,520,000 | | |
Total Materials | | | | | 326,056,350 | | |
Telecommunication Services 4.1% | |
Diversified Telecommunication Services 4.1% | |
AT&T, Inc. | | | 2,482,000 | | | | 88,036,540 | | |
Verizon Communications, Inc. | | | 5,672,200 | | | | 283,383,112 | | |
Total | | | | | 371,419,652 | | |
Total Telecommunication Services | | | | | 371,419,652 | | |
Utilities 4.4% | |
Electric Utilities 2.2% | |
American Electric Power Co., Inc. | | | 1,225,000 | | | | 65,353,750 | | |
Duke Energy Corp. | | | 572,000 | | | | 40,657,760 | | |
NextEra Energy, Inc. | | | 518,000 | | | | 50,432,480 | | |
Northeast Utilities | | | 1,035,000 | | | | 46,989,000 | | |
Total | | | | | 203,432,990 | | |
Common Stocks (continued)
Issuer | | Shares | | Value ($) | |
Multi-Utilities 2.2% | |
CMS Energy Corp. | | | 1,577,000 | | | | 46,915,750 | | |
Dominion Resources, Inc. | | | 697,000 | | | | 48,065,120 | | |
Sempra Energy | | | 527,000 | | | | 52,884,450 | | |
Wisconsin Energy Corp. | | | 1,025,000 | | | | 46,658,000 | | |
Total | | | | | 194,523,320 | | |
Total Utilities | | | | | 397,956,310 | | |
Total Common Stocks
(Cost: $6,068,298,546) | | | | | 8,781,629,062 | | |
Exchange-Traded Funds 1.0% | |
SPDR S&P 500 ETF Trust | | | 500,000 | | | | 96,315,000 | | |
Total Exchange-Traded Funds
(Cost: $71,016,623) | | | | | 96,315,000 | | |
Money Market Funds 1.1% | |
| | | Shares | | Value ($) | |
Columbia Short-Term Cash Fund,
0.088%(b)(c) | | | 97,058,448 | | | | 97,058,448 | | |
Total Money Market Funds
(Cost: $97,058,448) | | | | | 97,058,448 | | |
Total Investments
(Cost: $6,236,373,617) | | | | | 8,975,002,510 | | |
Other Assets & Liabilities, Net | | | | | 24,202,746 | | |
Net Assets | | | | | 8,999,205,256 | | |
Notes to Portfolio of Investments
(a) Non-income producing.
(b) The rate shown is the seven-day current annualized yield at May 31, 2014.
(c) As defined in the Investment Company Act of 1940, an affiliated company is one in which the Fund owns 5% or more of its outstanding voting securities, or a company which is under common ownership or control with the Fund. Holdings and transactions in these affiliated companies during the year ended May 31, 2014, are as follows:
Issuer | | Beginning
Cost ($) | | Purchase
Cost ($) | | Proceeds
From Sales ($) | | Ending
Cost ($) | | Dividends —
Affiliated
Issuers ($) | | Value ($) | |
Columbia Short-Term Cash Fund | | | 256,826,440 | | | | 1,371,632,433 | | | | (1,531,400,425 | ) | | | 97,058,448 | | | | 211,788 | | | | 97,058,448 | | |
Abbreviation Legend
ADR American Depositary Receipt
The accompanying Notes to Financial Statements are an integral part of this statement
Annual Report 2014
9
Columbia Dividend Income Fund
Portfolio of Investments (continued)
May 31, 2014
Fair Value Measurements
Generally accepted accounting principles (GAAP) require disclosure regarding the inputs and valuation techniques used to measure fair value and any changes in valuation inputs or techniques. In addition, investments shall be disclosed by major category.
The Fund categorizes its fair value measurements according to a three-level hierarchy that maximizes the use of observable inputs and minimizes the use of unobservable inputs by prioritizing that the most observable input be used when available. Observable inputs are those that market participants would use in pricing an investment based on market data obtained from sources independent of the reporting entity. Unobservable inputs are those that reflect the Fund's assumptions about the information market participants would use in pricing an investment. An investment's level within the fair value hierarchy is based on the lowest level of any input that is deemed significant to the asset or liability's fair value measurement. The input levels are not necessarily an indication of the risk or liquidity associated with investments at that level. For example, certain U.S. government securities are generally high quality and liquid, however, they are reflected as Level 2 because the inputs used to determine fair value may not always be quoted prices in an active market.
Fair value inputs are summarized in the three broad levels listed below:
> Level 1 — Valuations based on quoted prices for investments in active markets that the Fund has the ability to access at the measurement date (including NAV for open-end mutual funds). Valuation adjustments are not applied to Level 1 investments.
> Level 2 — Valuations based on other significant observable inputs (including quoted prices for similar securities, interest rates, prepayment speeds, credit risks, etc.).
> Level 3 — Valuations based on significant unobservable inputs (including the Fund's own assumptions and judgment in determining the fair value of investments).
Inputs that are used in determining fair value of an investment may include price information, credit data, volatility statistics, and other factors. These inputs can be either observable or unobservable. The availability of observable inputs can vary between investments, and is affected by various factors such as the type of investment, and the volume and level of activity for that investment or similar investments in the marketplace. The inputs will be considered by the Investment Manager, along with any other relevant factors in the calculation of an investment's fair value. The Fund uses prices and inputs that are current as of the measurement date, which may include periods of market dislocations. During these periods, the availability of prices and inputs may be reduced for many investments. This condition could cause an investment to be reclassified between the various levels within the hierarchy.
Investments falling into the Level 3 category are primarily supported by quoted prices from brokers and dealers participating in the market for those investments. However, these may be classified as Level 3 investments due to lack of market transparency and corroboration to support these quoted prices. Additionally, valuation models may be used as the pricing source for any remaining investments classified as Level 3. These models may rely on one or more significant unobservable inputs and/or significant assumptions by the Investment Manager. Inputs used in valuations may include, but are not limited to, financial statement analysis, capital account balances, discount rates and estimated cash flows, and comparable company data.
Under the direction of the Fund's Board of Trustees (the Board), the Investment Manager's Valuation Committee (the Committee) is responsible for overseeing the valuation procedures approved by the Board. The Committee consists of voting and non-voting members from various groups within the Investment Manager's organization, including operations and accounting, trading and investments, compliance, risk management and legal.
The Committee meets at least monthly to review and approve valuation matters, which may include a description of specific valuation determinations, data regarding pricing information received from approved pricing vendors and brokers and the results of Board-approved valuation control policies and procedures (the Policies). The Policies address, among other things, instances when market quotations are or are not readily available, including recommendations of third party pricing vendors and a determination of appropriate pricing methodologies; events that require specific valuation determinations and assessment of fair value techniques; securities with a potential for stale pricing, including those that are illiquid, restricted, or in default; and the effectiveness of third party pricing vendors, including periodic reviews of vendors. The Committee meets more frequently, as needed, to discuss additional valuation matters, which may include the need to review back-testing results, review time-sensitive information or approve related valuation actions. The Committee reports to the Board, with members of the Committee meeting with the Board at each of its regularly scheduled meetings to discuss valuation matters and actions during the period, similar to those described earlier.
For investments categorized as Level 3, the Committee monitors information similar to that described above, which may include: (i) data specific to the issuer or comparable issuers, (ii) general market or specific sector news and (iii) quoted prices and specific or similar security transactions. The Committee considers this data and any changes from prior periods in order to assess the reasonableness of observable and unobservable inputs, any assumptions or internal models used to value those securities and changes in fair value. This data is also used to corroborate, when available, information received from approved pricing vendors and brokers. Various factors impact the frequency of monitoring this information (which may occur as often as daily). However, the Committee may determine that changes to inputs, assumptions and models are not required as a result of the monitoring procedures performed.
The accompanying Notes to Financial Statements are an integral part of this statement
Annual Report 2014
10
Columbia Dividend Income Fund
Portfolio of Investments (continued)
May 31, 2014
The following table is a summary of the inputs used to value the Fund's investments at May 31, 2014:
Description | | Level 1
Quoted Prices in Active
Markets for Identical
Assets ($) | | Level 2
Other Significant
Observable Inputs ($) | | Level 3
Significant
Unobservable Inputs ($) | | Total ($) | |
Equity Securities | |
Common Stocks | |
Consumer Discretionary | | | 793,001,900 | | | | — | | | | — | | | | 793,001,900 | | |
Consumer Staples | | | 891,837,600 | | | | — | | | | — | | | | 891,837,600 | | |
Energy | | | 939,325,250 | | | | — | | | | — | | | | 939,325,250 | | |
Financials | | | 1,606,970,160 | | | | — | | | | — | | | | 1,606,970,160 | | |
Health Care | | | 1,232,045,050 | | | | — | | | | — | | | | 1,232,045,050 | | |
Industrials | | | 962,452,890 | | | | — | | | | — | | | | 962,452,890 | | |
Information Technology | | | 1,260,563,900 | | | | — | | | | — | | | | 1,260,563,900 | | |
Materials | | | 326,056,350 | | | | — | | | | — | | | | 326,056,350 | | |
Telecommunication Services | | | 371,419,652 | | | | — | | | | — | | | | 371,419,652 | | |
Utilities | | | 397,956,310 | | | | — | | | | — | | | | 397,956,310 | | |
Exchange-Traded Funds | | | 96,315,000 | | | | — | | | | — | | | | 96,315,000 | | |
Total Equity Securities | | | 8,877,944,062 | | | | — | | | | — | | | | 8,877,944,062 | | |
Mutual Funds | |
Money Market Funds | | | 97,058,448 | | | | — | | | | — | | | | 97,058,448 | | |
Total Mutual Funds | | | 97,058,448 | | | | — | | | | — | | | | 97,058,448 | | |
Total | | | 8,975,002,510 | | | | — | | | | — | | | | 8,975,002,510 | | |
See the Portfolio of Investments for all investment classifications not indicated in the table.
There were no transfers of financial assets between levels during the period.
The accompanying Notes to Financial Statements are an integral part of this statement
Annual Report 2014
11
Columbia Dividend Income Fund
Statement of Assets and Liabilities
May 31, 2014
Assets | |
Investments, at value | |
Unaffiliated issuers (identified cost $6,139,315,169) | | $ | 8,877,944,062 | | |
Affiliated issuers (identified cost $97,058,448) | | | 97,058,448 | | |
Total investments (identified cost $6,236,373,617) | | | 8,975,002,510 | | |
Receivable for: | |
Capital shares sold | | | 14,817,950 | | |
Dividends | | | 27,521,051 | | |
Reclaims | | | 587,760 | | |
Prepaid expenses | | | 10,450 | | |
Trustees' deferred compensation plan | | | 176,711 | | |
Total assets | | | 9,018,116,432 | | |
Liabilities | |
Payable for: | |
Capital shares purchased | | | 16,442,916 | | |
Investment management fees | | | 128,656 | | |
Distribution and/or service fees | | | 36,281 | | |
Transfer agent fees | | | 1,830,813 | | |
Administration fees | | | 10,876 | | |
Chief compliance officer expenses | | | 794 | | |
Other expenses | | | 284,129 | | |
Trustees' deferred compensation plan | | | 176,711 | | |
Total liabilities | | | 18,911,176 | | |
Net assets applicable to outstanding capital stock | | $ | 8,999,205,256 | | |
Represented by | |
Paid-in capital | | $ | 5,958,953,535 | | |
Undistributed net investment income | | | 38,551,721 | | |
Accumulated net realized gain | | | 263,071,107 | | |
Unrealized appreciation (depreciation) on: | |
Investments | | | 2,738,628,893 | | |
Total — representing net assets applicable to outstanding capital stock | | $ | 8,999,205,256 | | |
The accompanying Notes to Financial Statements are an integral part of this statement.
Annual Report 2014
12
Columbia Dividend Income Fund
Statement of Assets and Liabilities (continued)
May 31, 2014
Class A | |
Net assets | | $ | 2,556,781,925 | | |
Shares outstanding | | | 134,456,647 | | |
Net asset value per share | | $ | 19.02 | | |
Maximum offering price per share(a) | | $ | 20.18 | | |
Class B | |
Net assets | | $ | 12,895,719 | | |
Shares outstanding | | | 695,588 | | |
Net asset value per share | | $ | 18.54 | | |
Class C | |
Net assets | | $ | 601,468,038 | | |
Shares outstanding | | | 32,461,466 | | |
Net asset value per share | | $ | 18.53 | | |
Class I | |
Net assets | | $ | 233,625,577 | | |
Shares outstanding | | | 12,260,418 | | |
Net asset value per share | | $ | 19.06 | | |
Class R | |
Net assets | | $ | 87,405,701 | | |
Shares outstanding | | | 4,595,851 | | |
Net asset value per share | | $ | 19.02 | | |
Class R4 | |
Net assets | | $ | 123,273,672 | | |
Shares outstanding | | | 6,398,617 | | |
Net asset value per share | | $ | 19.27 | | |
Class R5 | |
Net assets | | $ | 156,524,790 | | |
Shares outstanding | | | 8,127,003 | | |
Net asset value per share | | $ | 19.26 | | |
Class T | |
Net assets | | $ | 85,510,613 | | |
Shares outstanding | | | 4,496,570 | | |
Net asset value per share | | $ | 19.02 | | |
Maximum offering price per share(a) | | $ | 20.18 | | |
Class W | |
Net assets | | $ | 193,000 | | |
Shares outstanding | | | 10,154 | | |
Net asset value per share | | $ | 19.01 | | |
Class Y | |
Net assets | | $ | 78,674,180 | | |
Shares outstanding | | | 4,082,214 | | |
Net asset value per share | | $ | 19.27 | | |
Class Z | |
Net assets | | $ | 5,062,852,041 | | |
Shares outstanding | | | 266,003,764 | | |
Net asset value per share | | $ | 19.03 | | |
(a) The maximum offering price per share is calculated by dividing the net asset value per share by 1.0 minus the maximum sales charge of 5.75%.
The accompanying Notes to Financial Statements are an integral part of this statement.
Annual Report 2014
13
Columbia Dividend Income Fund
Statement of Operations
Year Ended May 31, 2014
Net investment income | |
Income: | |
Dividends — unaffiliated issuers | | $ | 262,675,161 | | |
Dividends — affiliated issuers | | | 211,788 | | |
Foreign taxes withheld | | | (1,212,898 | ) | |
Total income | | | 261,674,051 | | |
Expenses: | |
Investment management fees | | | 45,795,703 | | |
Distribution and/or service fees | |
Class A | | | 6,506,805 | | |
Class B | | | 140,963 | | |
Class C | | | 5,364,908 | | |
Class R | | | 401,408 | | |
Class T | | | 251,295 | | |
Class W | | | 8,715 | | |
Transfer agent fees | |
Class A | | | 4,768,041 | | |
Class B | | | 25,815 | | |
Class C | | | 982,979 | | |
Class R | | | 147,068 | | |
Class R4 | | | 143,958 | | |
Class R5 | | | 58,363 | | |
Class T | | | 153,399 | | |
Class W | | | 6,271 | | |
Class Z | | | 9,025,029 | | |
Administration fees | | | 3,874,276 | | |
Compensation of board members | | | 241,784 | | |
Custodian fees | | | 52,790 | | |
Printing and postage fees | | | 450,859 | | |
Registration fees | | | 400,069 | | |
Professional fees | | | 304,952 | | |
Chief compliance officer expenses | | | 4,527 | | |
Other | | | 227,212 | | |
Total expenses | | | 79,337,189 | | |
Expense reductions | | | (7,399 | ) | |
Total net expenses | | | 79,329,790 | | |
Net investment income | | | 182,344,261 | | |
Realized and unrealized gain (loss) — net | |
Net realized gain (loss) on: | |
Investments | | | 380,405,883 | | |
Net realized gain | | | 380,405,883 | | |
Net change in unrealized appreciation (depreciation) on: | |
Investments | | | 701,650,579 | | |
Net change in unrealized appreciation (depreciation) | | | 701,650,579 | | |
Net realized and unrealized gain | | | 1,082,056,462 | | |
Net increase in net assets resulting from operations | | $ | 1,264,400,723 | | |
The accompanying Notes to Financial Statements are an integral part of this statement.
Annual Report 2014
14
Columbia Dividend Income Fund
Statement of Changes in Net Assets
| | | Year Ended
May 31,
2014 | | Year Ended
May 31,
2013(a) | |
Operations | |
Net investment income | | $ | 182,344,261 | | | $ | 166,264,861 | | |
Net realized gain | | | 380,405,883 | | | | 69,905,495 | | |
Net change in unrealized appreciation (depreciation) | | | 701,650,579 | | | | 1,378,068,459 | | |
Net increase in net assets resulting from operations | | | 1,264,400,723 | | | | 1,614,238,815 | | |
Distributions to shareholders | |
Net investment income | |
Class A | | | (48,774,426 | ) | | | (45,439,482 | ) | |
Class B | | | (163,709 | ) | | | (231,152 | ) | |
Class C | | | (6,162,553 | ) | | | (5,327,096 | ) | |
Class I | | | (6,727,718 | ) | | | (7,854,718 | ) | |
Class R | | | (1,296,709 | ) | | | (962,094 | ) | |
Class R4 | | | (1,589,980 | ) | | | (4,354 | ) | |
Class R5 | | | (2,521,637 | ) | | | (195,539 | ) | |
Class T | | | (1,525,087 | ) | | | (1,758,903 | ) | |
Class W | | | (60,409 | ) | | | (1,042,733 | ) | |
Class Y | | | (918,221 | ) | | | (36 | ) | |
Class Z | | | (104,137,594 | ) | | | (100,753,258 | ) | |
Net realized gains | |
Class A | | | (36,631,156 | ) | | | — | | |
Class B | | | (197,597 | ) | | | — | | |
Class C | | | (7,635,089 | ) | | | — | | |
Class I | | | (4,234,144 | ) | | | — | | |
Class R | | | (1,091,386 | ) | | | — | | |
Class R4 | | | (1,296,331 | ) | | | — | | |
Class R5 | | | (1,582,324 | ) | | | — | | |
Class T | | | (1,131,873 | ) | | | — | | |
Class W | | | (4,208 | ) | | | — | | |
Class Y | | | (870,609 | ) | | | — | | |
Class Z | | | (67,557,777 | ) | | | — | | |
Total distributions to shareholders | | | (296,110,537 | ) | | | (163,569,365 | ) | |
Increase (decrease) in net assets from capital stock activity | | | (399,830,870 | ) | | | 1,131,235,200 | | |
Total increase in net assets | | | 568,459,316 | | | | 2,581,904,650 | | |
Net assets at beginning of year | | | 8,430,745,940 | | | | 5,848,841,290 | | |
Net assets at end of year | | $ | 8,999,205,256 | | | $ | 8,430,745,940 | | |
Undistributed net investment income | | $ | 38,551,721 | | | $ | 30,930,058 | | |
(a) Class R4, Class R5 and Class Y shares are for the period from November 8, 2012 (commencement of operations) to May 31, 2013.
The accompanying Notes to Financial Statements are an integral part of this statement.
Annual Report 2014
15
Columbia Dividend Income Fund
Statement of Changes in Net Assets (continued)
| | | Year Ended May 31, 2014 | | Year Ended May 31, 2013(a) | |
| | | Shares | | Dollars ($) | | Shares | | Dollars ($) | |
Capital stock activity | |
Class A shares | |
Subscriptions(b) | | | 36,055,778 | | | | 636,504,270 | | | | 55,134,578 | | | | 848,069,779 | | |
Distributions reinvested | | | 4,496,666 | | | | 78,829,571 | | | | 2,786,791 | | | | 42,003,889 | | |
Redemptions | | | (53,787,698 | ) | | | (962,833,781 | ) | | | (34,094,313 | ) | | | (526,484,838 | ) | |
Net increase (decrease) | | | (13,235,254 | ) | | | (247,499,940 | ) | | | 23,827,056 | | | | 363,588,830 | | |
Class B shares | |
Subscriptions | | | 89,255 | | | | 1,522,927 | | | | 155,626 | | | | 2,307,875 | | |
Distributions reinvested | | | 16,521 | | | | 283,289 | | | | 12,336 | | | | 180,553 | | |
Redemptions(b) | | | (313,940 | ) | | | (5,463,321 | ) | | | (371,808 | ) | | | (5,525,464 | ) | |
Net decrease | | | (208,164 | ) | | | (3,657,105 | ) | | | (203,846 | ) | | | (3,037,036 | ) | |
Class C shares | |
Subscriptions | | | 8,354,924 | | | | 143,831,392 | | | | 10,095,798 | | | | 151,475,120 | | |
Distributions reinvested | | | 641,692 | | | | 11,021,164 | | | | 286,010 | | | | 4,207,040 | | |
Redemptions | | | (4,202,097 | ) | | | (73,154,169 | ) | | | (3,206,220 | ) | | | (48,033,266 | ) | |
Net increase | | | 4,794,519 | | | | 81,698,387 | | | | 7,175,588 | | | | 107,648,894 | | |
Class I shares | |
Subscriptions | | | 9,631,223 | | | | 169,505,506 | | | | 7,977,018 | | | | 121,334,158 | | |
Distributions reinvested | | | 628,117 | | | | 10,961,728 | | | | 520,345 | | | | 7,854,636 | | |
Redemptions | | | (16,758,388 | ) | | | (298,440,368 | ) | | | (9,164,265 | ) | | | (145,535,773 | ) | |
Net decrease | | | (6,499,048 | ) | | | (117,973,134 | ) | | | (666,902 | ) | | | (16,346,979 | ) | |
Class R shares | |
Subscriptions | | | 1,436,715 | | | | 25,425,514 | | | | 2,893,563 | | | | 44,275,976 | | |
Distributions reinvested | | | 116,051 | | | | 2,041,163 | | | | 49,849 | | | | 756,171 | | |
Redemptions | | | (1,236,288 | ) | | | (22,071,238 | ) | | | (968,736 | ) | | | (14,935,561 | ) | |
Net increase | | | 316,478 | | | | 5,395,439 | | | | 1,974,676 | | | | 30,096,586 | | |
Class R4 shares | |
Subscriptions | | | 5,872,195 | | | | 106,859,442 | | | | 2,232,048 | | | | 37,798,375 | | |
Distributions reinvested | | | 158,177 | | | | 2,829,629 | | | | 264 | | | | 4,324 | | |
Redemptions | | | (1,795,401 | ) | | | (32,248,824 | ) | | | (68,666 | ) | | | (1,166,135 | ) | |
Net increase | | | 4,234,971 | | | | 77,440,247 | | | | 2,163,646 | | | | 36,636,564 | | |
Class R5 shares | |
Subscriptions | | | 5,721,692 | | | | 102,523,878 | | | | 3,881,879 | | | | 64,071,911 | | |
Distributions reinvested | | | 219,606 | | | | 3,916,104 | | | | 11,861 | | | | 194,042 | | |
Redemptions | | | (1,578,647 | ) | | | (28,835,154 | ) | | | (129,388 | ) | | | (2,244,114 | ) | |
Net increase | | | 4,362,651 | | | | 77,604,828 | | | | 3,764,352 | | | | 62,021,839 | | |
The accompanying Notes to Financial Statements are an integral part of this statement.
Annual Report 2014
16
Columbia Dividend Income Fund
Statement of Changes in Net Assets (continued)
| | | Year Ended May 31, 2014 | | Year Ended May 31, 2013(a) | |
| | | Shares | | Dollars ($) | | Shares | | Dollars ($) | |
Capital stock activity (continued) | |
Class T shares | |
Subscriptions | | | 45,786 | | | | 809,219 | | | | 67,273 | | | | 1,012,626 | | |
Distributions reinvested | | | 124,591 | | | | 2,185,641 | | | | 96,746 | | | | 1,453,424 | | |
Redemptions | | | (619,844 | ) | | | (11,017,024 | ) | | | (757,086 | ) | | | (11,608,520 | ) | |
Net decrease | | | (449,467 | ) | | | (8,022,164 | ) | | | (593,067 | ) | | | (9,142,470 | ) | |
Class W shares | |
Subscriptions | | | 113,460 | | | | 1,959,011 | | | | 1,292,912 | | | | 19,320,811 | | |
Distributions reinvested | | | 3,839 | | | | 64,498 | | | | 70,316 | | | | 1,042,663 | | |
Redemptions | | | (656,856 | ) | | | (11,525,403 | ) | | | (4,226,000 | ) | | | (65,642,521 | ) | |
Net decrease | | | (539,557 | ) | | | (9,501,894 | ) | | | (2,862,772 | ) | | | (45,279,047 | ) | |
Class Y shares | |
Subscriptions | | | 4,491,964 | | | | 80,781,456 | | | | 76,146 | | | | 1,255,551 | | |
Distributions reinvested | | | 99,355 | | | | 1,788,719 | | | | — | (c) | | | 3 | | |
Redemptions | | | (578,024 | ) | | | (10,515,348 | ) | | | (7,227 | ) | | | (120,046 | ) | |
Net increase | | | 4,013,295 | | | | 72,054,827 | | | | 68,919 | | | | 1,135,508 | | |
Class Z shares | |
Subscriptions | | | 46,759,781 | | | | 827,016,801 | | | | 102,903,567 | | | | 1,567,502,490 | | |
Distributions reinvested | | | 5,022,547 | | | | 88,070,335 | | | | 3,458,110 | | | | 52,224,138 | | |
Redemptions | | | (69,756,764 | ) | | | (1,242,457,497 | ) | | | (65,428,661 | ) | | | (1,015,814,117 | ) | |
Net increase (decrease) | | | (17,974,436 | ) | | | (327,370,361 | ) | | | 40,933,016 | | | | 603,912,511 | | |
Total net increase (decrease) | | | (21,184,012 | ) | | | (399,830,870 | ) | | | 75,580,666 | | | | 1,131,235,200 | | |
(a) Class R4, Class R5 and Class Y shares are for the period from November 8, 2012 (commencement of operations) to May 31, 2013.
(b) Includes conversions of Class B shares to Class A shares, if any.
(c) Rounds to zero.
The accompanying Notes to Financial Statements are an integral part of this statement.
Annual Report 2014
17
Columbia Dividend Income Fund
The following tables are intended to help you understand the Fund's financial performance. Certain information reflects financial results for a single share of a class held for the periods shown. Per share net investment income (loss) amounts are calculated based on average shares outstanding during the period. Total return assumes reinvestment of all dividends and distributions, if any. Total return does not reflect payment of sales charges, if any, and is not annualized for periods of less than one year.
| | | Year Ended May 31, | | Year Ended September 30, | |
Class A | | 2014 | | 2013 | | 2012(a) | | 2011 | | 2010 | | 2009 | |
Per share data | |
Net asset value, beginning of period | | $ | 17.05 | | | $ | 13.96 | | | $ | 12.16 | | | $ | 12.12 | | | $ | 11.18 | | | $ | 12.01 | | |
Income from investment operations: | |
Net investment income | | | 0.35 | | | | 0.34 | | | | 0.25 | | | | 0.29 | | | | 0.28 | | | | 0.29 | | |
Net realized and unrealized gain (loss) | | | 2.20 | | | | 3.09 | | | | 1.73 | | | | 0.03 | (b) | | | 0.94 | | | | (0.86 | ) | |
Total from investment operations | | | 2.55 | | | | 3.43 | | | | 1.98 | | | | 0.32 | | | | 1.22 | | | | (0.57 | ) | |
Less distributions to shareholders: | |
Net investment income | | | (0.34 | ) | | | (0.34 | ) | | | (0.18 | ) | | | (0.28 | ) | | | (0.28 | ) | | | (0.27 | ) | |
Net realized gains | | | (0.24 | ) | | | — | | | | — | | | | — | | | | — | | | | — | | |
Total distributions to shareholders | | | (0.58 | ) | | | (0.34 | ) | | | (0.18 | ) | | | (0.28 | ) | | | (0.28 | ) | | | (0.27 | ) | |
Proceeds from regulatory settlements | | | — | | | | — | | | | — | | | | — | | | | — | | | | 0.01 | | |
Net asset value, end of period | | $ | 19.02 | | | $ | 17.05 | | | $ | 13.96 | | | $ | 12.16 | | | $ | 12.12 | | | $ | 11.18 | | |
Total return | | | 15.25 | % | | | 24.91 | % | | | 16.26 | % | | | 2.56 | % | | | 11.02 | % | | | (4.33 | %) | |
Ratios to average net assets(c) | |
Total gross expenses | | | 1.02 | % | | | 1.04 | % | | | 1.06 | %(d) | | | 1.09 | % | | | 1.07 | % | | | 1.11 | % | |
Total net expenses(e) | | | 1.02 | %(f) | | | 1.03 | %(f) | | | 1.00 | %(d) | | | 1.03 | %(f) | | | 1.05 | %(f) | | | 1.05 | %(f) | |
Net investment income | | | 1.96 | % | | | 2.20 | % | | | 2.71 | %(d) | | | 2.23 | % | | | 2.41 | % | | | 2.88 | % | |
Supplemental data | |
Net assets, end of period (in thousands) | | $ | 2,556,782 | | | $ | 2,518,406 | | | $ | 1,729,495 | | | $ | 1,103,389 | | | $ | 728,219 | | | $ | 483,916 | | |
Portfolio turnover | | | 19 | % | | | 24 | % | | | 23 | % | | | 20 | % | | | 17 | % | | | 23 | % | |
Notes to Financial Highlights
(a) For the period from October 1, 2011 to May 31, 2012. During the period, the Fund's fiscal year end was changed from September 30 to May 31.
(b) Calculation of the net gain (loss) per share (both realized and unrealized) does not correlate to the aggregate realized and unrealized gain (loss) presented in the Statement of Operations due to the timing of sales and repurchases of Fund shares in relation to fluctuations in the market value of the portfolio.
(c) In addition to the fees and expenses which the Fund bears directly, the Fund indirectly bears a pro rata share of the fees and expenses of the acquired funds in which it invests. Such indirect expenses are not included in the reported expense ratios.
(d) Annualized.
(e) Total net expenses include the impact of certain waivers/reimbursements made by the Investment Manager and certain of its affiliates, if applicable.
(f) The benefits derived from expense reductions had an impact of less than 0.01%.
The accompanying Notes to Financial Statements are an integral part of this statement.
Annual Report 2014
18
Columbia Dividend Income Fund
Financial Highlights (continued)
| | | Year Ended May 31, | | Year Ended September 30, | |
Class B | | 2014 | | 2013 | | 2012(a) | | 2011 | | 2010 | | 2009 | |
Per share data | |
Net asset value, beginning of period | | $ | 16.64 | | | $ | 13.63 | | | $ | 11.89 | | | $ | 11.86 | | | $ | 10.94 | | | $ | 11.75 | | |
Income from investment operations: | |
Net investment income | | | 0.21 | | | | 0.22 | | | | 0.18 | | | | 0.19 | | | | 0.19 | | | | 0.21 | | |
Net realized and unrealized gain (loss) | | | 2.14 | | | | 3.02 | | | | 1.69 | | | | 0.03 | (b) | | | 0.93 | | | | (0.82 | ) | |
Total from investment operations | | | 2.35 | | | | 3.24 | | | | 1.87 | | | | 0.22 | | | | 1.12 | | | | (0.61 | ) | |
Less distributions to shareholders: | |
Net investment income | | | (0.21 | ) | | | (0.23 | ) | | | (0.13 | ) | | | (0.19 | ) | | | (0.20 | ) | | | (0.20 | ) | |
Net realized gains | | | (0.24 | ) | | | — | | | | — | | | | — | | | | — | | | | — | | |
Total distributions to shareholders | | | (0.45 | ) | | | (0.23 | ) | | | (0.13 | ) | | | (0.19 | ) | | | (0.20 | ) | | | (0.20 | ) | |
Proceeds from regulatory settlements | | | — | | | | — | | | | — | | | | — | | | | — | | | | 0.00 | (c) | |
Net asset value, end of period | | $ | 18.54 | | | $ | 16.64 | | | $ | 13.63 | | | $ | 11.89 | | | $ | 11.86 | | | $ | 10.94 | | |
Total return | | | 14.33 | % | | | 23.99 | % | | | 15.69 | % | | | 1.74 | % | | | 10.24 | % | | | (4.97 | %) | |
Ratios to average net assets(d) | |
Total gross expenses | | | 1.77 | % | | | 1.79 | % | | | 1.81 | %(e) | | | 1.85 | % | | | 1.82 | % | | | 1.86 | % | |
Total net expenses(f) | | | 1.77 | %(g) | | | 1.77 | %(g) | | | 1.75 | %(e) | | | 1.79 | %(g) | | | 1.80 | %(g) | | | 1.80 | %(g) | |
Net investment income | | | 1.22 | % | | | 1.47 | % | | | 1.96 | %(e) | | | 1.48 | % | | | 1.67 | % | | | 2.18 | % | |
Supplemental data | |
Net assets, end of period (in thousands) | | $ | 12,896 | | | $ | 15,034 | | | $ | 15,095 | | | $ | 15,659 | | | $ | 21,126 | | | $ | 28,006 | | |
Portfolio turnover | | | 19 | % | | | 24 | % | | | 23 | % | | | 20 | % | | | 17 | % | | | 23 | % | |
Notes to Financial Highlights
(a) For the period from October 1, 2011 to May 31, 2012. During the period, the Fund's fiscal year end was changed from September 30 to May 31.
(b) Calculation of the net gain (loss) per share (both realized and unrealized) does not correlate to the aggregate realized and unrealized gain (loss) presented in the Statement of Operations due to the timing of sales and repurchases of Fund shares in relation to fluctuations in the market value of the portfolio.
(c) Rounds to zero.
(d) In addition to the fees and expenses which the Fund bears directly, the Fund indirectly bears a pro rata share of the fees and expenses of the acquired funds in which it invests. Such indirect expenses are not included in the reported expense ratios.
(e) Annualized.
(f) Total net expenses include the impact of certain waivers/reimbursements made by the Investment Manager and certain of its affiliates, if applicable.
(g) The benefits derived from expense reductions had an impact of less than 0.01%.
The accompanying Notes to Financial Statements are an integral part of this statement.
Annual Report 2014
19
Columbia Dividend Income Fund
Financial Highlights (continued)
| | | Year Ended May 31, | | Year Ended September 30, | |
Class C | | 2014 | | 2013 | | 2012(a) | | 2011 | | 2010 | | 2009 | |
Per share data | |
Net asset value, beginning of period | | $ | 16.63 | | | $ | 13.62 | | | $ | 11.88 | | | $ | 11.85 | | | $ | 10.93 | | | $ | 11.74 | | |
Income from investment operations: | |
Net investment income | | | 0.21 | | | | 0.22 | | | | 0.18 | | | | 0.19 | | | | 0.19 | | | | 0.20 | | |
Net realized and unrealized gain (loss) | | | 2.13 | | | | 3.02 | | | | 1.69 | | | | 0.03 | (b) | | | 0.93 | | | | (0.82 | ) | |
Total from investment operations | | | 2.34 | | | | 3.24 | | | | 1.87 | | | | 0.22 | | | | 1.12 | | | | (0.62 | ) | |
Less distributions to shareholders: | |
Net investment income | | | (0.20 | ) | | | (0.23 | ) | | | (0.13 | ) | | | (0.19 | ) | | | (0.20 | ) | | | (0.20 | ) | |
Net realized gains | | | (0.24 | ) | | | — | | | | — | | | | — | | | | — | | | | — | | |
Total distributions to shareholders | | | (0.44 | ) | | | (0.23 | ) | | | (0.13 | ) | | | (0.19 | ) | | | (0.20 | ) | | | (0.20 | ) | |
Proceeds from regulatory settlements | | | — | | | | — | | | | — | | | | — | | | | — | | | | 0.01 | | |
Net asset value, end of period | | $ | 18.53 | | | $ | 16.63 | | | $ | 13.62 | | | $ | 11.88 | | | $ | 11.85 | | | $ | 10.93 | | |
Total return | | | 14.33 | % | | | 24.00 | % | | | 15.71 | % | | | 1.74 | % | | | 10.25 | % | | | (4.98 | %) | |
Ratios to average net assets(c) | |
Total gross expenses | | | 1.77 | % | | | 1.79 | % | | | 1.81 | %(d) | | | 1.84 | % | | | 1.82 | % | | | 1.86 | % | |
Total net expenses(e) | | | 1.77 | %(f) | | | 1.78 | %(f) | | | 1.75 | %(d) | | | 1.78 | %(f) | | | 1.80 | %(f) | | | 1.80 | %(f) | |
Net investment income | | | 1.24 | % | | | 1.45 | % | | | 1.96 | %(d) | | | 1.49 | % | | | 1.66 | % | | | 2.08 | % | |
Supplemental data | |
Net assets, end of period (in thousands) | | $ | 601,468 | | | $ | 459,966 | | | $ | 279,093 | | | $ | 181,875 | | | $ | 94,091 | | | $ | 48,438 | | |
Portfolio turnover | | | 19 | % | | | 24 | % | | | 23 | % | | | 20 | % | | | 17 | % | | | 23 | % | |
Notes to Financial Highlights
(a) For the period from October 1, 2011 to May 31, 2012. During the period, the Fund's fiscal year end was changed from September 30 to May 31.
(b) Calculation of the net gain (loss) per share (both realized and unrealized) does not correlate to the aggregate realized and unrealized gain (loss) presented in the Statement of Operations due to the timing of sales and repurchases of Fund shares in relation to fluctuations in the market value of the portfolio.
(c) In addition to the fees and expenses which the Fund bears directly, the Fund indirectly bears a pro rata share of the fees and expenses of the acquired funds in which it invests. Such indirect expenses are not included in the reported expense ratios.
(d) Annualized.
(e) Total net expenses include the impact of certain waivers/reimbursements made by the Investment Manager and certain of its affiliates, if applicable.
(f) The benefits derived from expense reductions had an impact of less than 0.01%.
The accompanying Notes to Financial Statements are an integral part of this statement.
Annual Report 2014
20
Columbia Dividend Income Fund
Financial Highlights (continued)
| | | Year Ended May 31, | | Year Ended September 30, | |
Class I | | 2014 | | 2013 | | 2012(a) | | 2011 | | 2010(b) | |
Per share data | |
Net asset value, beginning of period | | $ | 17.09 | | | $ | 13.99 | | | $ | 12.18 | | | $ | 12.13 | | | $ | 12.14 | | |
Income from investment operations: | |
Net investment income | | | 0.42 | | | | 0.41 | | | | 0.28 | | | | 0.35 | | | | 0.01 | | |
Net realized and unrealized gain (loss) | | | 2.20 | | | | 3.09 | | | | 1.73 | | | | 0.03 | (c) | | | (0.02 | ) | |
Total from investment operations | | | 2.62 | | | | 3.50 | | | | 2.01 | | | | 0.38 | | | | (0.01 | ) | |
Less distributions to shareholders: | |
Net investment income | | | (0.41 | ) | | | (0.40 | ) | | | (0.20 | ) | | | (0.33 | ) | | | — | | |
Net realized gains | | | (0.24 | ) | | | — | | | | — | | | | — | | | | — | | |
Total distributions to shareholders | | | (0.65 | ) | | | (0.40 | ) | | | (0.20 | ) | | | (0.33 | ) | | | — | | |
Net asset value, end of period | | $ | 19.06 | | | $ | 17.09 | | | $ | 13.99 | | | $ | 12.18 | | | $ | 12.13 | | |
Total return | | | 15.72 | % | | | 25.42 | % | | | 16.53 | % | | | 3.02 | % | | | (0.08 | %) | |
Ratios to average net assets(d) | |
Total gross expenses | | | 0.58 | % | | | 0.60 | % | | | 0.63 | %(e) | | | 0.67 | % | | | 0.71 | %(e) | |
Total net expenses(f) | | | 0.58 | % | | | 0.60 | % | | | 0.63 | %(e) | | | 0.67 | %(g) | | | 0.71 | %(e)(g) | |
Net investment income | | | 2.35 | % | | | 2.64 | % | | | 3.08 | %(e) | | | 2.62 | % | | | 8.17 | %(e) | |
Supplemental data | |
Net assets, end of period (in thousands) | | $ | 233,626 | | | $ | 320,524 | | | $ | 271,694 | | | $ | 249,778 | | | $ | 2 | | |
Portfolio turnover | | | 19 | % | | | 24 | % | | | 23 | % | | | 20 | % | | | 17 | % | |
Notes to Financial Highlights
(a) For the period from October 1, 2011 to May 31, 2012. During the period, the Fund's fiscal year end was changed from September 30 to May 31.
(b) For the period from September 27, 2010 (commencement of operations) to September 30, 2010.
(c) Calculation of the net gain (loss) per share (both realized and unrealized) does not correlate to the aggregate realized and unrealized gain (loss) presented in the Statement of Operations due to the timing of sales and repurchases of Fund shares in relation to fluctuations in the market value of the portfolio.
(d) In addition to the fees and expenses which the Fund bears directly, the Fund indirectly bears a pro rata share of the fees and expenses of the acquired funds in which it invests. Such indirect expenses are not included in the reported expense ratios.
(e) Annualized.
(f) Total net expenses include the impact of certain waivers/reimbursements made by the Investment Manager and certain of its affiliates, if applicable.
(g) The benefits derived from expense reductions had an impact of less than 0.01%.
The accompanying Notes to Financial Statements are an integral part of this statement.
Annual Report 2014
21
Columbia Dividend Income Fund
Financial Highlights (continued)
| | | Year Ended May 31, | | Year Ended September 30, | |
Class R | | 2014 | | 2013 | | 2012(a) | | 2011 | | 2010 | | 2009 | |
Per share data | |
Net asset value, beginning of period | | $ | 17.05 | | | $ | 13.96 | | | $ | 12.17 | | | $ | 12.13 | | | $ | 11.18 | | | $ | 12.01 | | |
Income from investment operations: | |
Net investment income | | | 0.31 | | | | 0.30 | | | | 0.23 | | | | 0.26 | | | | 0.27 | | | | 0.28 | | |
Net realized and unrealized gain (loss) | | | 2.19 | | | | 3.09 | | | | 1.72 | | | | 0.03 | (b) | | | 0.93 | | | | (0.86 | ) | |
Total from investment operations | | | 2.50 | | | | 3.39 | | | | 1.95 | | | | 0.29 | | | | 1.20 | | | | (0.58 | ) | |
Less distributions to shareholders: | |
Net investment income | | | (0.29 | ) | | | (0.30 | ) | | | (0.16 | ) | | | (0.25 | ) | | | (0.25 | ) | | | (0.25 | ) | |
Net realized gains | | | (0.24 | ) | | | — | | | | — | | | | — | | | | — | | | | — | | |
Total distributions to shareholders | | | (0.53 | ) | | | (0.30 | ) | | | (0.16 | ) | | | (0.25 | ) | | | (0.25 | ) | | | (0.25 | ) | |
Proceeds from regulatory settlements | | | — | | | | — | | | | — | | | | — | | | | — | | | | 0.00 | (c) | |
Net asset value, end of period | | $ | 19.02 | | | $ | 17.05 | | | $ | 13.96 | | | $ | 12.17 | | | $ | 12.13 | | | $ | 11.18 | | |
Total return | | | 14.96 | % | | | 24.60 | % | | | 16.03 | % | | | 2.30 | % | | | 10.84 | % | | | (4.57 | %) | |
Ratios to average net assets(d) | |
Total gross expenses | | | 1.27 | % | | | 1.29 | % | | | 1.31 | %(e) | | | 1.34 | % | | | 1.32 | % | | | 1.36 | % | |
Total net expenses(f) | | | 1.27 | %(g) | | | 1.28 | %(g) | | | 1.25 | %(e) | | | 1.28 | %(g) | | | 1.30 | %(g) | | | 1.30 | %(g) | |
Net investment income | | | 1.73 | % | | | 1.95 | % | | | 2.46 | %(e) | | | 1.98 | % | | | 2.27 | % | | | 2.59 | % | |
Supplemental data | |
Net assets, end of period (in thousands) | | $ | 87,406 | | | $ | 72,979 | | | $ | 32,183 | | | $ | 13,101 | | | $ | 8,577 | | | $ | 657 | | |
Portfolio turnover | | | 19 | % | | | 24 | % | | | 23 | % | | | 20 | % | | | 17 | % | | | 23 | % | |
Notes to Financial Highlights
(a) For the period from October 1, 2011 to May 31, 2012. During the period, the Fund's fiscal year end was changed from September 30 to May 31.
(b) Calculation of the net gain (loss) per share (both realized and unrealized) does not correlate to the aggregate realized and unrealized gain (loss) presented in the Statement of Operations due to the timing of sales and repurchases of Fund shares in relation to fluctuations in the market value of the portfolio.
(c) Rounds to zero.
(d) In addition to the fees and expenses which the Fund bears directly, the Fund indirectly bears a pro rata share of the fees and expenses of the acquired funds in which it invests. Such indirect expenses are not included in the reported expense ratios.
(e) Annualized.
(f) Total net expenses include the impact of certain waivers/reimbursements made by the Investment Manager and certain of its affiliates, if applicable.
(g) The benefits derived from expense reductions had an impact of less than 0.01%.
The accompanying Notes to Financial Statements are an integral part of this statement.
Annual Report 2014
22
Columbia Dividend Income Fund
Financial Highlights (continued)
| | | Year Ended May 31, | |
Class R4 | | 2014 | | 2013(a) | |
Per share data | |
Net asset value, beginning of period | | $ | 17.27 | | | $ | 14.65 | | |
Income from investment operations: | |
Net investment income | | | 0.42 | | | | 0.20 | | |
Net realized and unrealized gain | | | 2.20 | | | | 2.60 | | |
Total from investment operations | | | 2.62 | | | | 2.80 | | |
Less distributions to shareholders: | |
Net investment income | | | (0.38 | ) | | | (0.18 | ) | |
Net realized gains | | | (0.24 | ) | | | — | | |
Total distributions to shareholders | | | (0.62 | ) | | | (0.18 | ) | |
Net asset value, end of period | | $ | 19.27 | | | $ | 17.27 | | |
Total return | | | 15.51 | % | | | 19.22 | % | |
Ratios to average net assets(b) | |
Total gross expenses | | | 0.77 | % | | | 0.82 | %(c) | |
Total net expenses(d) | | | 0.77 | %(e) | | | 0.82 | %(c) | |
Net investment income | | | 2.29 | % | | | 2.17 | %(c) | |
Supplemental data | |
Net assets, end of period (in thousands) | | $ | 123,274 | | | $ | 37,359 | | |
Portfolio turnover | | | 19 | % | | | 24 | % | |
Notes to Financial Highlights
(a) For the period from November 8, 2012 (commencement of operations) to May 31, 2013.
(b) In addition to the fees and expenses which the Fund bears directly, the Fund indirectly bears a pro rata share of the fees and expenses of the acquired funds in which it invests. Such indirect expenses are not included in the reported expense ratios.
(c) Annualized.
(d) Total net expenses include the impact of certain waivers/reimbursements made by the Investment Manager and certain of its affiliates, if applicable.
(e) The benefits derived from expense reductions had an impact of less than 0.01%.
The accompanying Notes to Financial Statements are an integral part of this statement.
Annual Report 2014
23
Columbia Dividend Income Fund
Financial Highlights (continued)
| | | Year Ended May 31, | |
Class R5 | | 2014 | | 2013(a) | |
Per share data | |
Net asset value, beginning of period | | $ | 17.26 | | | $ | 14.65 | | |
Income from investment operations: | |
Net investment income | | | 0.43 | | | | 0.22 | | |
Net realized and unrealized gain | | | 2.21 | | | | 2.58 | | |
Total from investment operations | | | 2.64 | | | | 2.80 | | |
Less distributions to shareholders: | |
Net investment income | | | (0.40 | ) | | | (0.19 | ) | |
Net realized gains | | | (0.24 | ) | | | — | | |
Total distributions to shareholders | | | (0.64 | ) | | | (0.19 | ) | |
Net asset value, end of period | | $ | 19.26 | | | $ | 17.26 | | |
Total return | | | 15.68 | % | | | 19.27 | % | |
Ratios to average net assets(b) | |
Total gross expenses | | | 0.64 | % | | | 0.65 | %(c) | |
Total net expenses(d) | | | 0.64 | % | | | 0.65 | %(c) | |
Net investment income | | | 2.41 | % | | | 2.41 | %(c) | |
Supplemental data | |
Net assets, end of period (in thousands) | | $ | 156,525 | | | $ | 64,986 | | |
Portfolio turnover | | | 19 | % | | | 24 | % | |
Notes to Financial Highlights
(a) For the period from November 8, 2012 (commencement of operations) to May 31, 2013.
(b) In addition to the fees and expenses which the Fund bears directly, the Fund indirectly bears a pro rata share of the fees and expenses of the acquired funds in which it invests. Such indirect expenses are not included in the reported expense ratios.
(c) Annualized.
(d) Total net expenses include the impact of certain waivers/reimbursements made by the Investment Manager and certain of its affiliates, if applicable.
The accompanying Notes to Financial Statements are an integral part of this statement.
Annual Report 2014
24
Columbia Dividend Income Fund
Financial Highlights (continued)
| | | Year Ended May 31, | | Year Ended September 30, | |
Class T | | 2014 | | 2013 | | 2012(a) | | 2011 | | 2010 | | 2009 | |
Per share data | |
Net asset value, beginning of period | | $ | 17.05 | | | $ | 13.96 | | | $ | 12.17 | | | $ | 12.13 | | | $ | 11.18 | | | $ | 12.01 | | |
Income from investment operations: | |
Net investment income | | | 0.34 | | | | 0.33 | | | | 0.24 | | | | 0.29 | | | | 0.28 | | | | 0.29 | | |
Net realized and unrealized gain (loss) | | | 2.20 | | | | 3.09 | | | | 1.72 | | | | 0.03 | (b) | | | 0.95 | | | | (0.85 | ) | |
Total from investment operations | | | 2.54 | | | | 3.42 | | | | 1.96 | | | | 0.32 | | | | 1.23 | | | | (0.56 | ) | |
Less distributions to shareholders: | |
Net investment income | | | (0.33 | ) | | | (0.33 | ) | | | (0.17 | ) | | | (0.28 | ) | | | (0.28 | ) | | | (0.27 | ) | |
Net realized gains | | | (0.24 | ) | | | — | | | | — | | | | — | | | | — | | | | — | | |
Total distributions to shareholders | | | (0.57 | ) | | | (0.33 | ) | | | (0.17 | ) | | | (0.28 | ) | | | (0.28 | ) | | | (0.27 | ) | |
Proceeds from regulatory settlements | | | — | | | | — | | | | — | | | | — | | | | — | | | | 0.00 | (c) | |
Net asset value, end of period | | $ | 19.02 | | | $ | 17.05 | | | $ | 13.96 | | | $ | 12.17 | | | $ | 12.13 | | | $ | 11.18 | | |
Total return | | | 15.19 | % | | | 24.85 | % | | | 16.14 | % | | | 2.51 | % | | | 11.06 | % | | | (4.38 | %) | |
Ratios to average net assets(d) | |
Total gross expenses | | | 1.07 | % | | | 1.09 | % | | | 1.11 | %(e) | | | 1.15 | % | | | 1.12 | % | | | 1.16 | % | |
Total net expenses(f) | | | 1.07 | %(g) | | | 1.08 | %(g) | | | 1.05 | %(e) | | | 1.09 | %(g) | | | 1.10 | %(g) | | | 1.10 | %(g) | |
Net investment income | | | 1.92 | % | | | 2.16 | % | | | 2.65 | %(e) | | | 2.18 | % | | | 2.36 | % | | | 2.87 | % | |
Supplemental data | |
Net assets, end of period (in thousands) | | $ | 85,511 | | | $ | 84,342 | | | $ | 77,344 | | | $ | 72,421 | | | $ | 80,405 | | | $ | 73,773 | | |
Portfolio turnover | | | 19 | % | | | 24 | % | | | 23 | % | | | 20 | % | | | 17 | % | | | 23 | % | |
Notes to Financial Highlights
(a) For the period from October 1, 2011 to May 31, 2012. During the period, the Fund's fiscal year end was changed from September 30 to May 31.
(b) Calculation of the net gain (loss) per share (both realized and unrealized) does not correlate to the aggregate realized and unrealized gain (loss) presented in the Statement of Operations due to the timing of sales and repurchases of Fund shares in relation to fluctuations in the market value of the portfolio.
(c) Rounds to zero.
(d) In addition to the fees and expenses which the Fund bears directly, the Fund indirectly bears a pro rata share of the fees and expenses of the acquired funds in which it invests. Such indirect expenses are not included in the reported expense ratios.
(e) Annualized.
(f) Total net expenses include the impact of certain waivers/reimbursements made by the Investment Manager and certain of its affiliates, if applicable.
(g) The benefits derived from expense reductions had an impact of less than 0.01%.
The accompanying Notes to Financial Statements are an integral part of this statement.
Annual Report 2014
25
Columbia Dividend Income Fund
Financial Highlights (continued)
| | | Year Ended May 31, | | Year Ended September 30, | |
Class W | | 2014 | | 2013 | | 2012(a) | | 2011 | | 2010(b) | |
Per share data | |
Net asset value, beginning of period | | $ | 17.05 | | | $ | 13.96 | | | $ | 12.16 | | | $ | 12.12 | | | $ | 12.13 | | |
Income from investment operations: | |
Net investment income | | | 0.31 | | | | 0.33 | | | | 0.25 | | | | 0.30 | | | | 0.01 | | |
Net realized and unrealized gain (loss) | | | 2.23 | | | | 3.10 | | | | 1.73 | | | | 0.02 | (c) | | | (0.02 | ) | |
Total from investment operations | | | 2.54 | | | | 3.43 | | | | 1.98 | | | | 0.32 | | | | (0.01 | ) | |
Less distributions to shareholders: | |
Net investment income | | | (0.34 | ) | | | (0.34 | ) | | | (0.18 | ) | | | (0.28 | ) | | | — | | |
Net realized gains | | | (0.24 | ) | | | — | | | | — | | | | — | | | | — | | |
Total distributions to shareholders | | | (0.58 | ) | | | (0.34 | ) | | | (0.18 | ) | | | (0.28 | ) | | | — | | |
Net asset value, end of period | | $ | 19.01 | | | $ | 17.05 | | | $ | 13.96 | | | $ | 12.16 | | | $ | 12.12 | | |
Total return | | | 15.21 | % | | | 24.91 | % | | | 16.27 | % | | | 2.57 | % | | | (0.08 | %) | |
Ratios to average net assets(d) | |
Total gross expenses | | | 1.00 | % | | | 1.04 | % | | | 1.05 | %(e) | | | 1.08 | % | | | 1.06 | %(e) | |
Total net expenses(f) | | | 1.00 | %(g) | | | 1.02 | %(g) | | | 1.00 | %(e) | | | 1.00 | %(g) | | | 1.05 | %(e)(g) | |
Net investment income | | | 1.75 | % | | | 2.20 | % | | | 2.71 | %(e) | | | 2.28 | % | | | 7.83 | %(e) | |
Supplemental data | |
Net assets, end of period (in thousands) | | $ | 193 | | | $ | 9,373 | | | $ | 47,647 | | | $ | 43,525 | | | $ | 2 | | |
Portfolio turnover | | | 19 | % | | | 24 | % | | | 23 | % | | | 20 | % | | | 17 | % | |
Notes to Financial Highlights
(a) For the period from October 1, 2011 to May 31, 2012. During the period, the Fund's fiscal year end was changed from September 30 to May 31.
(b) For the period from September 27, 2010 (commencement of operations) to September 30, 2010.
(c) Calculation of the net gain (loss) per share (both realized and unrealized) does not correlate to the aggregate realized and unrealized gain (loss) presented in the Statement of Operations due to the timing of sales and repurchases of Fund shares in relation to fluctuations in the market value of the portfolio.
(d) In addition to the fees and expenses which the Fund bears directly, the Fund indirectly bears a pro rata share of the fees and expenses of the acquired funds in which it invests. Such indirect expenses are not included in the reported expense ratios.
(e) Annualized.
(f) Total net expenses include the impact of certain waivers/reimbursements made by the Investment Manager and certain of its affiliates, if applicable.
(g) The benefits derived from expense reductions had an impact of less than 0.01%.
The accompanying Notes to Financial Statements are an integral part of this statement.
Annual Report 2014
26
Columbia Dividend Income Fund
Financial Highlights (continued)
| | | Year Ended May 31, | |
Class Y | | 2014 | | 2013(a) | |
Per share data | |
Net asset value, beginning of period | | $ | 17.27 | | | $ | 14.66 | | |
Income from investment operations | |
Net investment income | | | 0.47 | | | | 0.23 | | |
Net realized and unrealized gain | | | 2.18 | | | | 2.58 | | |
Total from investment operations | | | 2.65 | | | | 2.81 | | |
Less distributions to shareholders: | |
Net investment income | | | (0.41 | ) | | | (0.20 | ) | |
Net realized gains | | | (0.24 | ) | | | — | | |
Total distributions to shareholders | | | (0.65 | ) | | | (0.20 | ) | |
Net asset value, end of period | | $ | 19.27 | | | $ | 17.27 | | |
Total return | | | 15.72 | % | | | 19.29 | % | |
Ratios to average net assets(b) | |
Total gross expenses | | | 0.59 | % | | | 0.60 | %(c) | |
Total net expenses(d) | | | 0.59 | % | | | 0.60 | %(c) | |
Net investment income | | | 2.58 | % | | | 2.49 | %(c) | |
Supplemental data | |
Net assets, end of period (in thousands) | | $ | 78,674 | | | $ | 1,190 | | |
Portfolio turnover | | | 19 | % | | | 24 | % | |
Notes to Financial Highlights
(a) For the period from November 8, 2012 (commencement of operations) to May 31, 2013.
(b) In addition to the fees and expenses which the Fund bears directly, the Fund indirectly bears a pro rata share of the fees and expenses of the acquired funds in which it invests. Such indirect expenses are not included in the reported expense ratios.
(c) Annualized.
(d) Total net expenses include the impact of certain waivers/reimbursements made by the Investment Manager and certain of its affiliates, if applicable.
The accompanying Notes to Financial Statements are an integral part of this statement.
Annual Report 2014
27
Columbia Dividend Income Fund
Financial Highlights (continued)
| | | Year Ended May 31, | | Year Ended September 30, | |
Class Z | | 2014 | | 2013 | | 2012(a) | | 2011 | | 2010 | | 2009 | |
Per share data | |
Net asset value, beginning of period | | $ | 17.07 | | | $ | 13.97 | | | $ | 12.17 | | | $ | 12.13 | | | $ | 11.18 | | | $ | 12.01 | | |
Income from investment operations: | |
Net investment income | | | 0.39 | | | | 0.38 | | | | 0.27 | | | | 0.33 | | | | 0.31 | | | | 0.31 | | |
Net realized and unrealized gain (loss) | | | 2.19 | | | | 3.10 | | | | 1.72 | | | | 0.03 | (b) | | | 0.95 | | | | (0.85 | ) | |
Total from investment operations | | | 2.58 | | | | 3.48 | | | | 1.99 | | | | 0.36 | | | | 1.26 | | | | (0.54 | ) | |
Less distributions to shareholders: | |
Net investment income | | | (0.38 | ) | | | (0.38 | ) | | | (0.19 | ) | | | (0.32 | ) | | | (0.31 | ) | | | (0.30 | ) | |
Net realized gains | | | (0.24 | ) | | | — | | | | — | | | | — | | | | — | | | | — | | |
Total distributions to shareholders | | | (0.62 | ) | | | (0.38 | ) | | | (0.19 | ) | | | (0.32 | ) | | | (0.31 | ) | | | (0.30 | ) | |
Proceeds from regulatory settlements | | | — | | | | — | | | | — | | | | — | | | | — | | | | 0.01 | | |
Net asset value, end of period | | $ | 19.03 | | | $ | 17.07 | | | $ | 13.97 | | | $ | 12.17 | | | $ | 12.13 | | | $ | 11.18 | | |
Total return | | | 15.46 | % | | | 25.27 | % | | | 16.39 | % | | | 2.82 | % | | | 11.38 | % | | | (4.10 | %) | |
Ratios to average net assets(c) | |
Total gross expenses | | | 0.77 | % | | | 0.79 | % | | | 0.80 | %(d) | | | 0.84 | % | | | 0.82 | % | | | 0.86 | % | |
Total net expenses(e) | | | 0.77 | %(f) | | | 0.78 | %(f) | | | 0.75 | %(d) | | | 0.79 | %(f) | | | 0.80 | %(f) | | | 0.80 | %(f) | |
Net investment income | | | 2.22 | % | | | 2.46 | % | | | 2.96 | %(d) | | | 2.48 | % | | | 2.66 | % | | | 3.15 | % | |
Supplemental data | |
Net assets, end of period (in thousands) | | $ | 5,062,852 | | | $ | 4,846,586 | | | $ | 3,396,290 | | | $ | 2,227,757 | | | $ | 1,591,420 | | | $ | 1,060,268 | | |
Portfolio turnover | | | 19 | % | | | 24 | % | | | 23 | % | | | 20 | % | | | 17 | % | | | 23 | % | |
Notes to Financial Highlights
(a) For the period from October 1, 2011 to May 31, 2012. During the period, the Fund's fiscal year end was changed from September 30 to May 31.
(b) Calculation of the net gain (loss) per share (both realized and unrealized) does not correlate to the aggregate realized and unrealized gain (loss) presented in the Statement of Operations due to the timing of sales and repurchases of Fund shares in relation to fluctuations in the market value of the portfolio.
(c) In addition to the fees and expenses which the Fund bears directly, the Fund indirectly bears a pro rata share of the fees and expenses of the acquired funds in which it invests. Such indirect expenses are not included in the reported expense ratios.
(d) Annualized.
(e) Total net expenses include the impact of certain waivers/reimbursements made by the Investment Manager and certain of its affiliates, if applicable.
(f) The benefits derived from expense reductions had an impact of less than 0.01%.
The accompanying Notes to Financial Statements are an integral part of this statement.
Annual Report 2014
28
Columbia Dividend Income Fund
Notes to Financial Statements
May 31, 2014
Note 1. Organization
Columbia Dividend Income Fund (the Fund), a series of Columbia Funds Series Trust I (the Trust), is a diversified fund. The Trust is registered under the Investment Company Act of 1940, as amended (the 1940 Act), as an open-end management investment company organized as a Massachusetts business trust.
Fund Shares
The Trust may issue an unlimited number of shares (without par value). The Fund offers Class A, Class B, Class C, Class I, Class R, Class R4, Class R5, Class T, Class W, Class Y and Class Z shares. Although all share classes generally have identical voting, dividend and liquidation rights, each share class votes separately when required by law. Different share classes pay different distribution amounts to the extent the expenses of such share classes differ, and distributions in liquidation will be proportional to the net asset value of each share class. Each share class has its own expense structure and sales charges, as applicable.
Class A shares are subject to a maximum front-end sales charge of 5.75% based on the initial investment amount. Class A shares purchased without an initial sales charge in accounts aggregating $1 million to $50 million at the time of purchase are subject to a contingent deferred sales charge (CDSC) if the shares are sold within 18 months of purchase, charged as follows: 1.00% CDSC if redeemed within 12 months of purchase, and 0.50% CDSC if redeemed more than 12, but less than 18, months after purchase.
Class B shares may be subject to a maximum CDSC of 5.00% based upon the holding period after purchase. Class B shares will generally convert to Class A shares eight years after purchase. The Fund no longer accepts investments by new or existing investors in the Fund's Class B shares, except in connection with the reinvestment of any dividend and/or capital gain distributions in Class B shares of the Fund and exchanges by existing Class B shareholders of certain other funds within the Columbia Family of Funds.
Class C shares are subject to a 1.00% CDSC on shares redeemed within one year of purchase.
Class I shares are not subject to sales charges and are available only to the Columbia Family of Funds.
Class R shares are not subject to sales charges and are generally available only to certain retirement plans and other eligible investors.
Class R4 shares are not subject to sales charges and are generally available only to omnibus retirement plans and certain other eligible investors.
Class R5 shares are not subject to sales charges and are generally available only to investors purchasing through authorized investment professionals and omnibus retirement plans.
Class T shares are subject to a maximum front-end sales charge of 5.75% based on the investment amount. Class T shares purchased without an initial sales charge in accounts aggregating $1 million to $50 million at the time of purchase are subject to a CDSC if the shares are sold within 18 months of purchase, charged as follows: 1.00% CDSC if redeemed within 12 months of purchase, and 0.50% CDSC if redeemed more than 12, but less than 18, months after purchase. Class T shares are available only to investors who received (and who have continuously held) Class T shares in connection with the merger of certain Galaxy Funds into various Columbia Funds (formerly named Liberty Funds).
Class W shares are not subject to sales charges and are available only to investors purchasing through authorized investment programs managed by investment professionals, including discretionary managed account programs.
Class Y shares are not subject to sales charges and are generally available only to certain retirement plans.
Class Z shares are not subject to sales charges and are available only to certain eligible investors, which are subject to different investment minimums.
Note 2. Summary of Significant Accounting Policies
Use of Estimates
The preparation of financial statements in accordance with U.S. generally accepted accounting principles (GAAP) requires management to make certain estimates and assumptions that affect the reported amounts of assets and liabilities, the disclosure of contingent assets and liabilities at the date of the financial statements and the reported amounts of revenue and expenses during the reporting period. Actual results could differ from those estimates.
The following is a summary of significant accounting policies consistently followed by the Fund in the preparation of its financial statements.
Security Valuation
All equity securities and exchange-traded funds (ETFs) are valued at the close of business of the New York Stock Exchange (NYSE). Equity securities and ETFs are valued at the last quoted sales price on the principal exchange or market on which they trade, except for securities traded on the NASDAQ Stock Market, which are valued at the NASDAQ
Annual Report 2014
29
Columbia Dividend Income Fund
Notes to Financial Statements (continued)
May 31, 2014
official close price. Unlisted securities or listed securities for which there were no sales during the day are valued at the mean of the latest quoted bid and ask prices on such exchanges or markets.
Foreign equity securities are valued based on quotations from the principal market in which such securities are normally traded. If any foreign share prices are not readily available as a result of limited share activity the securities are valued at the mean of the latest quoted bid and ask prices on such exchanges or markets. Foreign currency exchange rates are generally determined at 4:00 p.m. Eastern (U.S.) time. However, many securities markets and exchanges outside the U.S. close prior to the close of the NYSE; therefore, the closing prices for securities in such markets or on such exchanges may not fully reflect events that occur after such close but before the close of the NYSE. In those situations, foreign securities will be fair valued pursuant to the policy adopted by the Board of Trustees (the Board), including utilizing a third party pricing service to determine these fair values. The third party pricing service takes into account multiple factors, including, but not limited to, movements in the U.S. securities markets, certain depositary receipts, futures contracts and foreign exchange rates that have occurred subsequent to the close of the foreign exchange or market, to determine a good faith estimate that reasonably reflects the current market conditions as of the close of the NYSE. The fair value of a security is likely to be different from the quoted or published price, if available.
Investments in open-end investment companies, including money market funds, are valued at net asset value.
Investments for which market quotations are not readily available, or that have quotations which management believes are not reliable, are valued at fair value as determined in good faith under consistently applied procedures established by and under the general supervision of the Board. If a security or class of securities (such as foreign securities) is valued at fair value, such value is likely to be different from the last quoted market price for the security.
The determination of fair value often requires significant judgment. To determine fair value, management may use assumptions including but not limited to future cash flows and estimated risk premiums. Multiple inputs from various sources may be used to determine fair value.
Security Transactions
Security transactions are accounted for on the trade date. Cost is determined and gains (losses) are based upon the specific identification method for both financial statement and federal income tax purposes.
Income Recognition
Corporate actions and dividend income are generally recorded net of any non-reclaimable tax withholdings, on the ex-dividend date or upon receipt of ex-dividend notification in the case of certain foreign securities.
The Fund may receive distributions from holdings in business development companies (BDCs), exchange-traded funds (ETFs) and real estate investment trusts (REITs), which report information on the character of their distributions annually. These distributions are allocated to dividend income, capital gain and return of capital based on estimates made by the Fund's management if actual information has not yet been reported. Return of capital is recorded as a reduction of the cost basis of securities held. If the Fund no longer owns the applicable securities, return of capital is recorded as a realized gain. Management's estimates are subsequently adjusted when the actual character of the distributions is disclosed by the BDCs, ETFs and REITs, which could result in a proportionate change in return of capital to shareholders.
Awards from class action litigation are recorded as a reduction of cost basis if the Fund still owns the applicable securities on the payment date. If the Fund no longer owns the applicable securities, the proceeds are recorded as realized gains.
Expenses
General expenses of the Trust are allocated to the Fund and other funds of the Trust based upon relative net assets or other expense allocation methodologies determined by the nature of the expense. Expenses directly attributable to the Fund are charged to the Fund. Expenses directly attributable to a specific class of shares are charged to that share class.
Determination of Class Net Asset Value
All income, expenses (other than class-specific expenses, which are charged to that share class, as shown in the Statement of Operations) and realized and unrealized gains (losses) are allocated to each class of the Fund on a daily basis, based on the relative net assets of each class, for purposes of determining the net asset value of each class.
Federal Income Tax Status
The Fund intends to qualify each year as a regulated investment company under Subchapter M of the Internal Revenue Code, as amended, and will distribute substantially all of its taxable income (including net short-term capital gains), if any, for its tax year, and as such will not be subject to federal income taxes. In addition, the Fund intends to distribute in each calendar year substantially all of its net investment income, capital gains and certain other amounts, if any, such that the Fund should not be subject to federal excise
Annual Report 2014
30
Columbia Dividend Income Fund
Notes to Financial Statements (continued)
May 31, 2014
tax. Therefore, no federal income or excise tax provision is recorded.
Foreign Taxes
The Fund may be subject to foreign taxes on income, gains on investments or currency repatriation, a portion of which may be recoverable. The Fund will accrue such taxes and recoveries, as applicable, based upon its current interpretation of tax rules and regulations that exist in the markets in which it invests.
Realized gains in certain countries may be subject to foreign taxes at the Fund level, based on statutory rates. The Fund accrues for such foreign taxes on realized and unrealized gains at the appropriate rate for each jurisdiction, as applicable. The amount, if any, is disclosed as a liability on the Statement of Assets and Liabilities.
Distributions to Shareholders
Distributions from net investment income, if any, are declared and paid each calendar quarter. Net realized capital gains, if any, are distributed at least annually. Income distributions and capital gain distributions are determined in accordance with federal income tax regulations, which may differ from GAAP.
Guarantees and Indemnifications
Under the Trust's organizational documents and, in some cases, by contract, its officers and trustees are indemnified against certain liabilities arising out of the performance of their duties to the Trust or its funds. In addition, certain of the Fund's contracts with its service providers contain general indemnification clauses. The Fund's maximum exposure under these arrangements is unknown since the amount of any future claims that may be made against the Fund cannot be determined, and the Fund has no historical basis for predicting the likelihood of any such claims.
Note 3. Fees and Compensation Paid to Affiliates
Investment Management Fees
Under an Investment Management Services Agreement, Columbia Management Investment Advisers, LLC (the Investment Manager), a wholly-owned subsidiary of Ameriprise Financial, Inc. (Ameriprise Financial), determines which securities will be purchased, held or sold. The investment management fee is an annual fee that is equal to a percentage of the Fund's average daily net assets that declines from 0.66% to 0.49% as the Fund's net assets increase. The effective investment management fee rate for the year ended May 31, 2014 was 0.52% of the Fund's average daily net assets.
Administration Fees
Under an Administrative Services Agreement, the Investment Manager also serves as the Fund Administrator. The Fund pays the Fund Administrator an annual fee for administration and accounting services equal to a percentage of the Fund's average daily net assets that declines from 0.06% to 0.03% as the Fund's net assets increase. The effective administration fee rate for the year ended May 31, 2014 was 0.04% of the Fund's average daily net assets.
Compensation of Board Members
Board members are compensated for their services to the Fund as disclosed in the Statement of Operations. The Trust's eligible Trustees may participate in a Deferred Compensation Plan (the Plan) which may be terminated at any time. Obligations of the Plan will be paid solely out of the Fund's assets.
Compensation of Chief Compliance Officer
The Board has appointed a Chief Compliance Officer to the Fund in accordance with federal securities regulations. The Fund pays its pro-rata share of the expenses associated with the Chief Compliance Officer. The Fund's expenses for the Chief Compliance Officer will not exceed $15,000 per year.
Transfer Agent Fees
Under a Transfer and Dividend Disbursing Agent Agreement, Columbia Management Investment Services Corp. (the Transfer Agent), an affiliate of the Investment Manager and a wholly-owned subsidiary of Ameriprise Financial, is responsible for providing transfer agency services to the Fund. The Transfer Agent has contracted with Boston Financial Data Services (BFDS) to serve as sub-transfer agent.
The Transfer Agent receives monthly account-based service fees based on the number of open accounts and also receives sub-transfer agency fees based on a percentage of the average aggregate value of the Fund's shares maintained in omnibus accounts (other than omnibus accounts for which American Enterprise Investment Services Inc. is the broker of record or accounts where the beneficial shareholder is a customer of Ameriprise Financial Services, Inc., which are paid a per account fee). The Transfer Agent pays the fees of BFDS for services as sub-transfer agent and is not entitled to reimbursement for such fees from the Fund (with the exception of out-of-pocket fees).
The Transfer Agent also receives compensation from fees for various shareholder services and reimbursements for certain out-of-pocket fees. Total transfer agent fees for Class R5 shares are subject to an annual limitation of not more than 0.05% of the average daily net assets attributable to Class R5
Annual Report 2014
31
Columbia Dividend Income Fund
Notes to Financial Statements (continued)
May 31, 2014
shares. Class I and Class Y shares are not subject to transfer agent fees.
For the year ended May 31, 2014, the Fund's effective transfer agent fee rates as a percentage of average daily net assets of each class were as follows:
Class A | | | 0.18 | % | |
Class B | | | 0.18 | | |
Class C | | | 0.18 | | |
Class R | | | 0.18 | | |
Class R4 | | | 0.18 | | |
Class R5 | | | 0.05 | | |
Class T | | | 0.18 | | |
Class W | | | 0.18 | | |
Class Z | | | 0.18 | | |
An annual minimum account balance fee of $20 may apply to certain accounts with a value below the applicable share class's initial minimum investment requirements to reduce the impact of small accounts on transfer agent fees. These minimum account balance fees are remitted to the Fund and recorded as part of expense reductions in the Statement of Operations. For the year ended May 31, 2014, these minimum account balance fees reduced total expenses by $7,399.
Distribution and Service Fees
The Fund has an agreement with Columbia Management Investment Distributors, Inc. (the Distributor), an affiliate of the Investment Manager and a wholly-owned subsidiary of Ameriprise Financial, for distribution and shareholder services. The Board has approved, and the Fund has adopted, distribution and shareholder service plans (the Plans) applicable to certain share classes, which set the distribution and service fees for the Fund. These fees are calculated daily and are intended to compensate the Distributor and/or eligible selling and/or servicing agents for selling shares of the Fund and providing services to investors.
Under the Plans, the Fund pays a monthly service fee to the Distributor at the maximum annual rate of 0.25% of the average daily net assets attributable to Class A, Class B, Class C and Class W shares of the Fund. Also under the Plans, the Fund pays a monthly distribution fee to the Distributor at the maximum annual rates of 0.10%, 0.75%, 0.75%, 0.50% and 0.25% of the average daily net assets attributable to Class A, Class B, Class C, Class R and Class W shares, respectively.
Although the Fund may pay distribution and service fees up to a maximum annual rate of 0.35% of the Fund's average daily net assets attributable to Class A shares (comprised of up to 0.10% for distribution services and up to 0.25% for
shareholder liaison services), the Fund currently limits such fees to an aggregate fee of not more than 0.25% of the Fund's average daily net assets attributable to Class A shares.
Although the Fund may pay a distribution fee up to 0.25% of the Fund's average daily net assets attributable to Class W shares and a service fee of up to 0.25% of the Fund's average daily net assets attributable to Class W shares, the aggregate fee shall not exceed 0.25% of the Fund's average daily net assets attributable to Class W shares.
Shareholder Services Fees
The Fund has adopted a shareholder services plan that permits it to pay for certain services provided to Class T shareholders by their selling and/or servicing agents. The Fund may pay shareholder servicing fees up to an aggregate annual rate of 0.50% of the Fund's average daily net assets attributable to Class T shares (comprised of up to 0.25% for shareholder liaison services and up to 0.25% for administrative support services). These fees are currently limited to an aggregate annual rate of not more than 0.30% of the Fund's average daily net assets attributable to Class T shares. The effective shareholder services fee rate for the year ended May 31, 2014 was 0.30% of the Fund's average daily net assets attributable to Class T shares.
Sales Charges
Sales charges, including front-end charges and CDSCs, received by the Distributor for distributing Fund shares were $2,198,116 for Class A, $5,686 for Class B, $64,964 for Class C, and $4,738 for Class T shares for the year ended May 31, 2014.
Expenses Waived/Reimbursed by the Investment Manager and its Affiliates
The Investment Manager and certain of its affiliates have contractually agreed to waive fees and/or reimburse expenses (excluding certain fees and expenses described below) for the periods disclosed below, unless sooner terminated at the sole discretion of the Board, so that the Fund's net operating expenses, after giving effect to fees waived/expenses reimbursed and any balance credits and/or overdraft charges from the Fund's custodian, do not exceed the following annual rates as a percentage of the class' average daily net assets:
| | | October 1, 2013
through
September 30, 2014 | | Prior to
October 1, 2013 | |
Class A | | | 1.16 | % | | | 1.19 | % | |
Class B | | | 1.91 | | | | 1.94 | | |
Class C | | | 1.91 | | | | 1.94 | | |
Class I | | | 0.78 | | | | 0.81 | | |
Annual Report 2014
32
Columbia Dividend Income Fund
Notes to Financial Statements (continued)
May 31, 2014
| | | October 1, 2013
through
September 30, 2014 | | Prior to
October 1, 2013 | |
Class R | | | 1.41 | % | | | 1.44 | % | |
Class R4 | | | 0.91 | | | | 0.94 | | |
Class R5 | | | 0.83 | | | | 0.86 | | |
Class T | | | 1.21 | | | | 1.24 | | |
Class W | | | 1.16 | | | | 1.19 | | |
Class Y | | | 0.78 | | | | 0.81 | | |
Class Z | | | 0.91 | | | | 0.94 | | |
Under the agreement governing these fee waivers and/or expense reimbursement arrangements, the following fees and expenses are excluded from the waiver/reimbursement commitment, and therefore will be paid by the Fund, if applicable: taxes (including foreign transaction taxes), expenses associated with investments in affiliated and non-affiliated pooled investment vehicles (including mutual funds and exchange-traded funds), transaction costs and brokerage commissions, costs related to any securities lending program, dividend expenses associated with securities sold short, inverse floater program fees and expenses, transaction charges and interest on borrowed money, interest, extraordinary expenses and any other expenses the exclusion of which is specifically approved by the Board. This agreement may be modified or amended only with approval from all parties.
Note 4. Federal Tax Information
The timing and character of income and capital gain distributions are determined in accordance with income tax regulations, which may differ from GAAP because of temporary or permanent book to tax differences.
At May 31, 2014, these differences are primarily due to differing treatment for deferral/reversal of wash sales losses, Trustees' deferred compensation and re-characterization of distributions for investments. To the extent these differences are permanent, reclassifications are made among the components of the Fund's net assets in the Statement of Assets and Liabilities. Temporary differences do not require reclassifications. In the Statement of Assets and Liabilities the following reclassifications were made:
Undistributed net investment income | | $ | (844,555 | ) | |
Accumulated net realized gain | | | 844,554 | | |
Paid-in capital | | | 1 | | |
Net investment income and net realized gains (losses), as disclosed in the Statement of Operations, and net assets were not affected by this reclassification.
The tax character of distributions paid during the years indicated was as follows:
Year Ended May 31, | | 2014 | | 2013 | |
Ordinary income | | $ | 173,878,043 | | | $ | 163,569,365 | | |
Long-term capital gains | | | 122,232,494 | | | | — | | |
Total | | | 296,110,537 | | | | 163,569,365 | | |
Short-term capital gain distributions, if any, are considered ordinary income distributions for tax purposes.
At May 31, 2014, the components of distributable earnings on a tax basis were as follows:
Undistributed ordinary income | | $ | 38,728,432 | | |
Undistributed long-term capital gains | | | 270,105,894 | | |
Net unrealized appreciation | | | 2,731,594,106 | | |
At May 31, 2014, the cost of investments for federal income tax purposes was $6,243,408,404 and the aggregate gross unrealized appreciation and depreciation based on that cost was:
Unrealized appreciation | | $ | 2,731,594,106 | | |
Unrealized depreciation | | | — | | |
Net unrealized appreciation | | | 2,731,594,106 | | |
For the year ended May 31, 2014, $1,266,110 of capital loss carryforward was utilized.
Management of the Fund has concluded that there are no significant uncertain tax positions that would require recognition in the financial statements. However, management's conclusion may be subject to review and adjustment at a later date based on factors including, but not limited to, new tax laws, regulations, and administrative interpretations (including relevant court decisions). Generally, the Fund's federal tax returns for the prior three fiscal years remain subject to examination by the Internal Revenue Service.
Note 5. Portfolio Information
The cost of purchases and proceeds from sales of securities, excluding short-term obligations, aggregated to $1,662,726,388 and $2,021,535,487, respectively, for the year ended May 31, 2014.
Note 6. Affiliated Money Market Fund
The Fund invests its daily cash balances in Columbia Short-Term Cash Fund, an affiliated money market fund established for the exclusive use by the Fund and other affiliated funds. The income earned by the Fund from such investments is included as "Dividends — affiliated issuers" in the Statement of Operations. As an investing fund, the Fund indirectly bears
Annual Report 2014
33
Columbia Dividend Income Fund
Notes to Financial Statements (continued)
May 31, 2014
its proportionate share of the expenses of Columbia Short-Term Cash Fund.
Note 7. Shareholder Concentration
At May 31, 2014, two unaffiliated shareholders of record owned 46.2% of the outstanding shares of the Fund in one or more accounts. The Fund has no knowledge about whether any portion of those shares was owned beneficially. Affiliated shareholders of record owned 13.1% of the outstanding shares of the Fund in one or more accounts. Subscription and redemption activity by concentrated accounts may have a significant effect on the operations of the Fund.
Note 8. Line of Credit
The Fund has entered into a revolving credit facility with a syndicate of banks led by JPMorgan Chase Bank N.A. whereby the Fund may borrow for the temporary funding of shareholder redemptions or for other temporary or emergency purposes. The credit facility agreement, as amended, which is a collective agreement between the Fund and certain other funds managed by the Investment Manager, severally and not jointly, permits collective borrowings up to $500 million. Interest is charged to each participating fund based on its borrowings at a rate equal to the higher of (i) the overnight federal funds rate plus 1.00% or (ii) the one-month LIBOR rate plus 1.00%. Each borrowing under the credit facility matures no later than 60 days after the date of borrowing. Effective December 10, 2013, the Fund also pays a commitment fee equal to its pro rata share of the amount of the credit facility at a rate of 0.075% per annum. Prior to December 10, 2013, the commitment fee was charged at the annual rate of 0.08% per annum. The commitment fee is included in other expenses in the Statement of Operations.
The Fund had no borrowings during the year ended May 31, 2014.
Note 9. Subsequent Events
Management has evaluated the events and transactions that have occurred through the date the financial statements were issued and noted no items requiring adjustment of the financial statements or additional disclosure.
Note 10. Information Regarding Pending and Settled Legal Proceedings
In December 2005, without admitting or denying the allegations, American Express Financial Corporation (AEFC, which is now known as Ameriprise Financial, Inc. (Ameriprise Financial)) entered into settlement agreements with the Securities and Exchange Commission (SEC) and Minnesota Department of Commerce (MDOC) related to market timing
activities. As a result, AEFC was censured and ordered to cease and desist from committing or causing any violations of certain provisions of the Investment Advisers Act of 1940, the Investment Company Act of 1940, and various Minnesota laws. AEFC agreed to pay disgorgement of $10 million and civil money penalties of $7 million. AEFC also agreed to retain an independent distribution consultant to assist in developing a plan for distribution of all disgorgement and civil penalties ordered by the SEC in accordance with various undertakings detailed at www.sec.gov/litigation/admin/ia-2451.pdf. Ameriprise Financial and its affiliates have cooperated with the SEC and the MDOC in these legal proceedings, and have made regular reports to the Funds' Boards of Trustees.
Ameriprise Financial and certain of its affiliates have historically been involved in a number of legal, arbitration and regulatory proceedings, including routine litigation, class actions, and governmental actions, concerning matters arising in connection with the conduct of their business activities. Ameriprise Financial believes that the Funds are not currently the subject of, and that neither Ameriprise Financial nor any of its affiliates are the subject of, any pending legal, arbitration or regulatory proceedings that are likely to have a material adverse effect on the Funds or the ability of Ameriprise Financial or its affiliates to perform under their contracts with the Funds. Ameriprise Financial is required to make 10-Q, 10-K and, as necessary, 8-K filings with the Securities and Exchange Commission on legal and regulatory matters that relate to Ameriprise Financial and its affiliates. Copies of these filings may be obtained by accessing the SEC website at www.sec.gov.
There can be no assurance that these matters, or the adverse publicity associated with them, will not result in increased fund redemptions, reduced sale of fund shares or other adverse consequences to the Funds. Further, although we believe proceedings are not likely to have a material adverse effect on the Funds or the ability of Ameriprise Financial or its affiliates to perform under their contracts with the Funds, these proceedings are subject to uncertainties and, as such, we are unable to estimate the possible loss or range of loss that may result. An adverse outcome in one or more of these proceedings could result in adverse judgments, settlements, fines, penalties or other relief that could have a material adverse effect on the consolidated financial condition or results of operations of Ameriprise Financial.
Annual Report 2014
34
Columbia Dividend Income Fund
Report of Independent Registered Public Accounting Firm
To the Trustees of Columbia Funds Series Trust I and the Shareholders of
Columbia Dividend Income Fund
In our opinion, the accompanying statement of assets and liabilities, including the portfolio of investments, and the related statements of operations and of changes in net assets and the financial highlights present fairly, in all material respects, the financial position of Columbia Dividend Income Fund (the "Fund", a series of Columbia Funds Series Trust I) at May 31, 2014, and the results of its operations, the changes in its net assets and the financial highlights for each of the periods indicated, in conformity with accounting principles generally accepted in the United States of America. These financial statements and financial highlights (hereafter referred to as "financial statements") are the responsibility of the Fund's management. Our responsibility is to express an opinion on these financial statements based on our audits. We conducted our audits of these financial statements in accordance with the standards of the Public Company Accounting Oversight Board (United States). Those standards require that we plan and perform the audit to obtain reasonable assurance about whether the financial statements are free of material misstatement. An audit includes examining, on a test basis, evidence supporting the amounts and disclosures in the financial statements, assessing the accounting principles used and significant estimates made by management, and evaluating the overall financial statement presentation. We believe that our audits, which included confirmation of securities at May 31, 2014 by correspondence with the custodian and transfer agent, provide a reasonable basis for our opinion.
PricewaterhouseCoopers LLP
Minneapolis, Minnesota
July 22, 2014
Annual Report 2014
35
Columbia Dividend Income Fund
Federal Income Tax Information
(Unaudited)
The Fund hereby designates the following tax attributes for the fiscal year ended May 31, 2014. Shareholders will be notified in early 2015 of the amounts for use in preparing 2014 income tax returns.
Tax Designations
| Qualified Dividend Income | | | 100.00 | % | |
| Dividends Received Deduction | | | 100.00 | % | |
Capital Gain Dividend | | $ | 398,161,379 | | |
Qualified Dividend Income. For taxable, non-corporate shareholders, the percentage of ordinary income dividends paid during the fiscal year that represents qualified dividend income subject to reduced tax rates.
Dividends Received Deduction. The percentage of ordinary income dividends paid during the fiscal year that qualifies for the corporate dividends received deduction.
Capital Gain Dividend. The Fund designates as a capital gain dividend the amount reflected above, or if subsequently determined to be different, the net capital gain of such fiscal period. The Fund also designates as capital gain dividends, to the extent necessary to fully distribute such capital gains, earnings and profits distributed to shareholders on the redemption of shares.
Annual Report 2014
36
Columbia Dividend Income Fund
The Trustees serve terms of indefinite duration. The names, addresses and birth years of the Trustees and Officers of the Funds in Columbia Funds Series Trust I, the year each was first elected or appointed to office, their principal business occupations during at least the last five years, the number of Funds overseen by each Trustee and other directorships they hold are shown below. Each officer listed below serves as an officer of each Fund in Columbia Funds Series Trust I.
Independent Trustees
Name, Address and Year of Birth,
Position with Funds, Year First
Elected or Appointed to Office | | Principal Occupation(s) During Past Five Years, Number of Funds in Columbia
Funds Complex Overseen by Trustee, Other Directorships Held | |
Douglas A. Hacker (Born 1955)
c/o Columbia Management
Investment Advisers, LLC
225 Franklin Street
Boston, MA 02110
Trustee (since 1996) | | Independent business executive since May 2006; Executive Vice President — Strategy of United Airlines from December 2002 to May 2006; President of UAL Loyalty Services (airline marketing company) from September 2001 to December 2002; Executive Vice President and Chief Financial Officer of United Airlines from July 1999 to September 2001. Oversees 56; Nash Finch Company (food distributor); Aircastle Limited (aircraft leasing); and SeaCube Container Leasing Ltd. (container leasing) | |
Janet Langford Kelly (Born 1957)
c/o Columbia Management
Investment Advisers, LLC
225 Franklin Street
Boston, MA 02110
Trustee (since 1996) | | Senior Vice President, General Counsel and Corporate Secretary, ConocoPhillips (integrated energy company) since September 2007; Deputy General Counsel — Corporate Legal Services, ConocoPhillips from August 2006 to August 2007; Partner, Zelle, Hofmann, Voelbel, Mason & Gette LLP (law firm) from March 2005 to July 2006; Adjunct Professor of Law, Northwestern University from September 2004 to June 2006; Director, UAL Corporation (airline) from February 2006 to July 2006; Chief Administrative Officer and Senior Vice President, Kmart Holding Corporation (consumer goods) from September 2003 to March 2004. Oversees 56; None | |
Nancy T. Lukitsh (Born 1956)
c/o Columbia Management
Investment Advisers, LLC
225 Franklin Street
Boston, MA 02110
Trustee (since 2011) | | Senior Vice President, Partner and Director of Marketing, Wellington Management Company, LLP (investment adviser) from 1997 to 2010; Chair, Wellington Management Investment Portfolios (commingled non-U.S. investment pools) from 2007 to 2010; Director, Wellington Trust Company, NA and other Wellington affiliates from 1997 to 2010. Oversees 56; None | |
William E. Mayer (Born 1940)
c/o Columbia Management
Investment Advisers, LLC
225 Franklin Street
Boston, MA 02110
Trustee (since 1994) | | Partner, Park Avenue Equity Partners (private equity) since February 1999; Dean and Professor, College of Business and Management, University of Maryland from 1992 to 1996. Oversees 56; DynaVox Inc. (speech creation); Lee Enterprises (print media); WR Hambrecht + Co. (financial service provider) from 2000 to 2012; BlackRock Kelso Capital Corporation (investment company) | |
David M. Moffett (Born 1952)
c/o Columbia Management
Investment Advisers, LLC
225 Franklin Street
Boston, MA 02110
Trustee (since 2011) | | Retired. Chief Executive Officer, Federal Home Loan Mortgage Corporation, from 2008 to 2009; Senior Adviser, Global Financial Services Group, Carlyle Group, Inc., from 2007 to 2008; Vice Chairman and Chief Financial Officer, U.S. Bancorp, from 1993 to 2007. Oversees 56; CIT Group Inc. (commercial and consumer finance); eBay Inc. (online trading community); MBIA Inc. (financial service provider); E.W. Scripps Co. (print and television media), Building Materials Holding Corp. (building materials and construction services); Genworth Financial, Inc. (financial and insurance products and services); and University of Oklahoma Foundation | |
Charles R. Nelson (Born 1942)
c/o Columbia Management
Investment Advisers, LLC
225 Franklin Street
Boston, MA 02110
Trustee (since 1981) | | Retired. Professor Emeritus, University of Washington, since 2011; Professor of Economics, University of Washington from 1976 to 2011; Ford and Louisa Van Voorhis Professor of Political Economy, University of Washington from 1993 to 2011; Adjunct Professor of Statistics, University of Washington from 1980 to 2011; Associate Editor, Journal of Money, Credit and Banking from September 1993 to 2008; consultant on econometric and statistical matters. Oversees 56; None | |
John J. Neuhauser (Born 1943)
c/o Columbia Management
Investment Advisers, LLC
225 Franklin Street
Boston, MA 02110
Trustee (since 1984) | | President, Saint Michael's College, since August 2007; Director or Trustee of several non-profit organizations, including Fletcher Allen Health Care, Inc.; University Professor, Boston College from November 2005 to August 2007; Academic Vice President and Dean of Faculties, Boston College from August 1999 to October 2005. Oversees 56; Liberty All-Star Equity Fund and Liberty All-Star Growth Fund (closed-end funds) | |
Patrick J. Simpson (Born 1944)
c/o Columbia Management
Investment Advisers, LLC
225 Franklin Street
Boston, MA 02110
Trustee (since 2000) | | Partner, Perkins Coie LLP (law firm). Oversees 56; None | |
Annual Report 2014
37
Columbia Dividend Income Fund
Trustees and Officers (continued)
Independent Trustees (continued)
Name, Address and Year of Birth,
Position with Funds, Year First
Elected or Appointed to Office | | Principal Occupation(s) During Past Five Years, Number of Funds in Columbia
Funds Complex Overseen by Trustee, Other Directorships Held | |
Anne-Lee Verville (Born 1945)
c/o Columbia Management
Investment Advisers, LLC
225 Franklin Street
Boston, MA 02110
Trustee (since 1998) | | Retired. General Manager — Global Education Industry from 1994 to 1997, President — Application Systems Division from 1991 to 1994, Chief Financial Officer — US Marketing & Services from 1988 to 1991, and Chief Information Officer from 1987 to 1988, IBM Corporation (computer and technology). Oversees 56; Enesco Group, Inc. (producer of giftware and home and garden decor products) from 2001 to 2006 | |
Interested Trustee
Name, Address and Year of Birth,
Position with Funds, Year First
Elected or Appointed to Office | | Principal Occupation(s) During Past Five Years, Number of Funds in Columbia
Funds Complex Overseen by Trustee, Other Directorships Held | |
William F. Truscott (born 1960)
53600 Ameriprise Financial Center
Minneapolis, MN 55474
Senior Vice President (since 2012) | | Chairman of the Board and President, Columbia Management Investment Advisers, LLC since May 2010 and February 2012 (previously President and Chief Investment Officer, from 2001 to April 2010); Chief Executive Officer, Global Asset Management, Ameriprise Financial, Inc. since September 2012 (previously, Chief Executive Officer, U.S. Asset Management & President, Annuities, from May 2010 to September 2012 and President — U.S. Asset Management and Chief Investment Officer from 2005 to April 2010); Director and Chief Executive Officer, Columbia Management Investment Distributors, Inc. since May 2010 and February 2012, respectively (previously Chairman of the Board and Chief Executive Officer from 2006 to April 2010); Chairman of the Board and Chief Executive Officer, RiverSource Distributors, Inc. since 2006; President and Chief Executive Officer, Ameriprise Certificate Company, 2006 to August 2012; Oversees 188; Director, Ameriprise Certificate Company, 2006-January 2013 | |
The Statement of Additional Information has additional information about the Fund's Board members and is available, without charge, upon request by calling 800.345.6611; contacting your financial intermediary; or visiting columbiamanagement.com.
The Board has appointed officers who are responsible for day-to-day business decisions based on policies it has established. The officers serve at the pleasure of the Board. In addition to Mr. Truscott, who is Senior Vice President, the Funds' other officers are:
Officers
Name,
Address and
Year of Birth | | Position and Year
First Appointed to
Position for any Fund
in the Columbia
Funds Complex or a
Predecessor Thereof | | Principal Occupation(s) During Past Five Years | |
J. Kevin Connaughton
225 Franklin Street
Boston, MA 02110
Born 1964 | | President and Principal Executive Officer (2009) | | Senior Vice President and General Manager — Mutual Fund Products, Columbia Management Investment Advisers, LLC, since May 2010; and President, Columbia Funds since 2009; previously, Managing Director, Columbia Management Advisors, LLC, from December 2004 to April 2010; Senior Vice President and Chief Financial Officer, Columbia Funds, from June 2008 to January 2009; and senior officer of Columbia Funds and affiliated funds since 2003. | |
Michael G. Clarke
225 Franklin Street
Boston, MA 02110
Born 1969 | | Treasurer (2011) and Chief Financial Officer (2009) | | Vice President, Columbia Management Investment Advisers, LLC, since May 2010; previously, Managing Director of Fund Administration, Columbia Management Advisors, LLC, from September 2004 to April 2010; and senior officer of Columbia Funds and affiliated funds since 2002. | |
Annual Report 2014
38
Columbia Dividend Income Fund
Trustees and Officers (continued)
Officers (continued)
Name,
Address and
Year of Birth | | Position and Year
First Appointed to
Position for any Fund
in the Columbia
Funds Complex or a
Predecessor Thereof | | Principal Occupation(s) During Past Five Years | |
Scott R. Plummer
5228 Ameriprise
Financial Center
Minneapolis, MN 55474
Born 1959 | | Senior Vice President (2006), Chief Legal Officer (2006) and Assistant Secretary (2011) | | Senior Vice President, Chief Legal Officer and Assistant Secretary, Columbia Management Investment Advisers, LLC, since June 2005; Senior Vice President and Lead Chief Counsel — Asset Management, Ameriprise Financial, Inc., since May 2010 (previously, Vice President and Chief Counsel — Asset Management, from 2005 to April 2010); Vice President, Chief Counsel and Assistant Secretary, Columbia Management Investment Distributors, Inc., since 2008; Vice President, General Counsel and Secretary, Ameriprise Certificate Company, since 2005; Chief Counsel, RiverSource Distributors, Inc., since 2006; and senior officer of Columbia Funds and affiliated funds since 2006. | |
Thomas P. McGuire
225 Franklin Street
Boston, MA 02110
Born 1972 | | Chief Compliance Officer (2012) | | Vice President — Asset Management Compliance, Ameriprise Financial, Inc., since May 2010; Chief Compliance Officer, Ameriprise Certificate Company, since September 2010; Compliance Executive, Bank of America, from 2005 to April 2010. | |
Colin Moore
225 Franklin Street
Boston, MA 02110
Born 1958 | | Senior Vice President (2010) | | Executive Vice President and Global Chief Investment Officer, Ameriprise Financial, Inc., since July 2013; Director and Global Chief Investment Officer, Columbia Management Investment Advisers, LLC, since May 2010; previously, Manager, Managing Director and Chief Investment Officer, Columbia Management Advisors, LLC, from 2007 to April 2010. | |
Michael E. DeFao
225 Franklin Street
Boston, MA 02110
Born 1968 | | Vice President (2011) and Assistant Secretary (2010) | | Vice President and Chief Counsel, Ameriprise Financial, Inc., since May 2010; Associate General Counsel, Bank of America from 2005 to April 2010. | |
Joseph F. DiMaria
225 Franklin Street
Boston, MA 02110
Born 1968 | | Vice President (2011) and Chief Accounting Officer (2008) | | Vice President — Mutual Fund Administration, Columbia Management Investment Advisers, LLC, since May 2010; previously, Director of Fund Administration, Columbia Management Advisors, LLC, from 2006 to April 2010. | |
Paul B. Goucher
100 Park Avenue
New York, NY 10017
Born 1968 | | Vice President (2011) and Assistant Secretary (2008) | | Vice President and Lead Chief Counsel, Ameriprise Financial, Inc., since November 2008 and January 2013, respectively (previously, Chief Counsel, from January 2010 to January 2013, and Group Counsel from November 2008 to January 2010); previously, Director, Managing Director and General Counsel, J. & W. Seligman & Co. Incorporated, from July 2008 to November 2008. | |
Amy Johnson
5228 Ameriprise
Financial Center
Minneapolis, MN
Born 1965 | | Vice President (2006) | | Senior Vice President and Chief Operating Officer, Columbia Management Investment Advisers, LLC, since May 2010; previously, Chief Administrative Officer, from 2009 to April 2010, and Vice President — Asset Management and Trust Company Services, from 2006 to 2009. | |
Paul D. Pearson
5228 Ameriprise
Financial Center
Minneapolis, MN
Born 1956 | | Vice President (2011) and Assistant Treasurer (1999) | | Vice President — Investment Accounting, Columbia Management Investment Advisers, LLC, since May 2010; previously, Vice President — Managed Assets, Investment Accounting, Ameriprise Financial, Inc. from 1998 to April 2010. | |
Christopher O. Petersen
5228 Ameriprise
Financial Center
Minneapolis, MN 55474
Born 1970 | | Vice President and Secretary (2010) | | Vice President and Chief Counsel, Ameriprise Financial, Inc., since January 2010 (previously, Vice President and Group Counsel or Counsel from 2004 to January 2010); officer of Columbia Funds and affiliated funds since 2007. | |
Stephen T. Welsh
225 Franklin Street
Boston, MA 02110
Born 1957 | | Vice President (2006) | | President and Director, Columbia Management Investment Services Corp., since May 2010; previously, President and Director, Columbia Management Services, Inc., from 2004 to April 2010; and Managing Director, Columbia Management Distributors, Inc., from 2007 to April 2010. | |
Annual Report 2014
39
This page intentionally left blank.
Annual Report 2014
40
Columbia Dividend Income Fund
Important Information About This Report
Each fund mails one shareholder report to each shareholder address. If you would like more than one report, please call shareholder services at 800.345.6611 and additional reports will be sent to you.
The policy of the Board is to vote the proxies of the companies in which each fund holds investments consistent with the procedures as stated in the Statement of Additional Information (SAI). You may obtain a copy of the SAI without charge by calling 800.345.6611; contacting your financial intermediary; visiting columbiamanagement.com; or searching the website of the Securities and Exchange Commission (SEC) at sec.gov. Information regarding how each fund voted proxies relating to portfolio securities is filed with the SEC by August 31 for the most recent 12-month period ending June 30 of that year, and is available without charge by visiting columbiamanagement.com; or searching the website of the SEC at sec.gov.
Each fund files a complete schedule of portfolio holdings with the SEC for the first and third quarters of each fiscal year on Form N-Q. Each fund's Form N-Q is available on the SEC's website at sec.gov and may be reviewed and copied at the SEC's Public Reference Room in Washington, D.C. Information on the operation of the Public Reference Room may be obtained by calling 800.SEC.0330. Each fund's complete schedule of portfolio holdings, as filed on Form N-Q, can also be obtained without charge, upon request, by calling 800.345.6611.
Annual Report 2014
41

Columbia Dividend Income Fund
P.O. Box 8081
Boston, MA 02266-8081
columbiamanagement.com
This information is for use with concurrent or prior delivery of a fund prospectus. Please read and consider the investment objectives, risks, charges and expenses for any fund carefully before investing. For a prospectus and, if available, a summary prospectus, which contains this and other important information about the Fund, go to columbiamanagement.com. The Fund is distributed by Columbia Management Investment Distributors, Inc., member FINRA, and managed by Columbia Management Investment Advisers, LLC.
© 2014 Columbia Management Investment Advisers, LLC. All rights reserved.
ANN139_05_D01_(07/14)
Annual Report
May 31, 2014

Columbia High Yield Municipal Fund
Not FDIC insured • No bank guarantee • May lose value
 Dear Shareholders,
Continued Economic Recovery
The U.S. economy continued to recover at a slow but steady pace during the first quarter of 2014, supported by solid manufacturing activity, reasonable job growth and continued gains for the housing market. Industrial production was robust, buoyed by strong demand for autos and related parts. After a disappointing January, job growth picked up, which helped boost consumer confidence. Housing data was somewhat mixed, as harsh weather and higher mortgage rates put a damper on sales, while lower inventories helped prices trend higher. The Federal Reserve (the Fed) announced further reductions to its monthly asset purchases and reassured the markets that it would not make any significant changes to monetary policy until it was satisfied that the labor market was on solid ground. Despite mostly good news on the economic front, the broad financial markets recorded only modest gains, as bitter winter weather at home and mounting tensions between Russia and Western allies prompted investor caution.
Investors braced for higher interest rates, but long-term yields declined and the fixed-income markets were surprisingly resilient in the face of stable-to-improving economic data. Risk-on trading continued during the quarter as the higher yielding sectors of the fixed-income markets generally fared well. Emerging-market bonds, long-term U.S. Treasuries and sovereign debt were among the strongest performers, as were Treasury Inflation Protected Securities. Municipal bonds delivered solid gains, especially high-yield municipals, which benefited from continued improvement in state finances.
Against this backdrop, the broad bond market, as measured by the Barclays U.S. Aggregate Bond Index, edged out the broad stock market, as measured by the Standard & Poor's 500 Index, with gains of 1.84% vs. 1.81%, respectively. As indicated late last year, the Fed began tapering its monthly asset purchase program and announced further reductions. New Fed chair Janet Yellen reassured investors the Fed was committed to keeping short-term borrowing rates low into 2015.
Stay on Track with Columbia Management
Backed by more than 100 years of experience, Columbia Management is one of the nation's largest asset managers. At the heart of our success and, most importantly, that of our investors, are highly talented industry professionals, brought together by a unique way of working. At Columbia Management, reaching our performance goals matters, and how we reach them matters just as much.
Visit columbiamanagement.com for:
> The Columbia Management Perspectives blog, offering insights on current market events and investment opportunities
> Detailed up-to-date fund performance and portfolio information
> Quarterly fund commentaries
> Columbia Management investor, our award-winning quarterly newsletter for shareholders
Thank you for your continued support of the Columbia Funds. We look forward to serving your investment needs for many years to come.
Best Regards,

J. Kevin Connaughton
President, Columbia Funds
Investing involves risk including the risk of loss of principal.
The Barclays U.S. Aggregate Bond Index is a broad-based benchmark that measures the investment grade, U.S. dollar denominated, fixed-rate taxable bond market, including Treasuries, government-related and corporate securities, mortgage-backed securities (agency fixed-rate and hybrid adjustable-rate mortgage passthroughs), asset-backed securities, and commercial mortgage-backed securities. The S&P 500 Index, an unmanaged index, measures the performance of 500 widely held, large-capitalization U.S. stocks and is frequently used as a general measure of market performance. Indices are not available for investment, are not professionally managed and do not reflect sales charges, fees, brokerage commissions, taxes or other expenses of investing.
Investors should consider the investment objectives, risks, charges and expenses of a mutual fund carefully before investing. For a free prospectus and, if available, a summary prospectus, which contains this and other important information about a fund, visit columbiamanagement.com. The prospectus should be read carefully before investing.
Columbia Funds are distributed by Columbia Management Investment Distributors, Inc., member FINRA, and managed by Columbia Management Investment Advisers, LLC.
© 2014 Columbia Management Investment Advisers, LLC. All rights reserved.
Columbia High Yield Municipal Fund
Performance Overview | | | 2 | | |
Manager Discussion of Fund Performance | | | 4 | | |
Understanding Your Fund's Expenses | | | 6 | | |
Portfolio of Investments | | | 7 | | |
Statement of Assets and Liabilities | | | 24 | | |
Statement of Operations | | | 26 | | |
Statement of Changes in Net Assets | | | 27 | | |
Financial Highlights | | | 29 | | |
Notes to Financial Statements | | | 35 | | |
Report of Independent Registered
Public Accounting Firm | | | 41 | | |
Federal Income Tax Information | | | 42 | | |
Trustees and Officers | | | 43 | | |
Important Information About This Report | | | 49 | | |
Fund Investment Manager
Columbia Management Investment
Advisers, LLC
225 Franklin Street
Boston, MA 02110
Fund Distributor
Columbia Management Investment
Distributors, Inc.
225 Franklin Street
Boston, MA 02110
Fund Transfer Agent
Columbia Management Investment
Services Corp.
P.O. Box 8081
Boston, MA 02266-8081
For more information about any of the funds, please visit columbiamanagement.com or call 800.345.6611. Customer Service Representatives are available to answer your questions Monday through Friday from 8 a.m. to 7 p.m. Eastern time.
The views expressed in this report reflect the current views of the respective parties. These views are not guarantees of future performance and involve certain risks, uncertainties and assumptions that are difficult to predict, so actual outcomes and results may differ significantly from the views expressed. These views are subject to change at any time based upon economic, market or other conditions and the respective parties disclaim any responsibility to update such views. These views may not be relied on as investment advice and, because investment decisions for a Columbia Fund are based on numerous factors, may not be relied on as an indication of trading intent on behalf of any particular Columbia Fund. References to specific securities should not be construed as a recommendation or investment advice.
Columbia High Yield Municipal Fund
Performance Summary
> Columbia High Yield Municipal Fund (the Fund) Class A shares returned 3.35% excluding sales charges for the 12-month period ended May 31, 2014. Class Z shares returned 3.56% for the same period.
> The Fund's Blended Benchmark and the Barclays High Yield Municipal Bond Index returned 1.43% and 0.33%, respectively, over the same 12-month period.
> Underweights in tobacco and Puerto Rico debt, which were weak performers during the 12-month period, and a sizable overweight in the strong-returning continuing care retirement communities sector helped the Fund beat both its Blended Benchmark and the Barclays High Yield Municipal Bond Index.
Average Annual Total Returns (%) (for period ended May 31, 2014)
| | | Inception | | 1 Year | | 5 Years | | 10 Years | |
Class A | | 07/31/00 | | | | | | | | | | | | | |
Excluding sales charges | | | | | | | 3.35 | | | | 8.76 | | | | 4.61 | | |
Including sales charges | | | | | | | -1.52 | | | | 7.71 | | | | 4.10 | | |
Class B | | 07/15/02 | | | | | | | | | | | | | |
Excluding sales charges | | | | | | | 2.59 | | | | 7.95 | | | | 3.83 | | |
Including sales charges | | | | | | | -2.34 | | | | 7.66 | | | | 3.83 | | |
Class C | | 07/15/02 | | | | | | | | | | | | | |
Excluding sales charges | | | | | | | 2.73 | | | | 8.11 | | | | 3.99 | | |
Including sales charges | | | | | | | 1.75 | | | | 8.11 | | | | 3.99 | | |
Class R4* | | 03/19/13 | | | 3.53 | | | | 8.99 | | | | 4.82 | | |
Class R5* | | 11/08/12 | | | 3.64 | | | | 9.02 | | | | 4.84 | | |
Class Z | | 03/05/84 | | | 3.56 | | | | 8.97 | | | | 4.82 | | |
Blended Benchmark | | | | | | | 1.43 | | | | 8.37 | | | | 5.61 | | |
Barclays High Yield Municipal Bond Index | | | | | | | 0.33 | | | | 10.22 | | | | 5.95 | | |
Returns for Class A are shown with and without the maximum initial sales charge of 4.75%. Returns for Class B are shown with and without the applicable contingent deferred sales charge (CDSC) of 5.00% in the first year, declining to 1.00% in the sixth year and eliminated thereafter. Returns for Class C are shown with and without the 1.00% CDSC for the first year only. The Fund's other classes are not subject to sales charges and have limited eligibility. Please see the Fund's prospectus for details. Performance for different share classes will vary based on differences in sales charges and fees associated with each class. All results shown assume reinvestment of distributions during the period. Returns do not reflect the deduction of taxes that a shareholder may pay on Fund distributions or on the redemption of Fund shares. Performance results reflect the effect of any fee waivers or reimbursements of Fund expenses by Columbia Management Investment Advisers, LLC and/or any of its affiliates. Absent these fee waivers or expense reimbursement arrangements, performance results would have been lower.
The performance information shown represents past performance and is not a guarantee of future results. The investment return and principal value of your investment will fluctuate so that your shares, when redeemed, may be worth more or less than their original cost. Current performance may be lower or higher than the performance information shown. You may obtain performance information current to the most recent month-end by contacting your financial intermediary, visiting columbiamanagement.com or calling 800.345.6611.
*The returns shown for periods prior to the share class inception date (including returns for the Life of the Fund, if shown, which are since Fund inception) include the returns of the Fund's oldest share class. These returns are adjusted to reflect any higher class-related operating expenses of the newer share classes, as applicable. Please visit columbiamanagement.com/mutual-funds/appended-performance for more information.
The Blended Benchmark, established by the Investment Manager, consists of a 60% weighting of the Barclays High Yield Municipal Bond Index and a 40% weighting of the Barclays Municipal Bond Index. The Barclays Municipal Bond Index is considered representative of the broad market for investment-grade, tax-exempt bonds with a maturity of at least one year.
The Barclays High Yield Municipal Bond Index is comprised of bonds with maturities greater than one-year, having a par value of at least $3 million issued as part of a transaction size greater than $20 million, and rated no higher than "BB+" or equivalent by any of the three principal rating agencies.
Indices are not available for investment, are not professionally managed and do not reflect sales charges, fees, brokerage commissions, taxes or other expenses of investing. Securities in the Fund may not match those in an index.
Annual Report 2014
2
Columbia High Yield Municipal Fund
Performance Overview (continued)
Performance of a Hypothetical $10,000 Investment (June 1, 2004 – May 31, 2014)
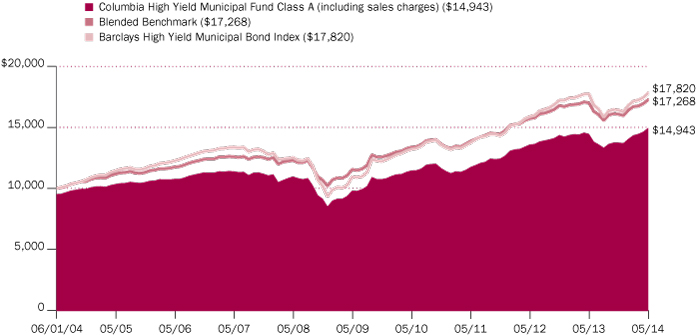
The chart above shows the change in value of a hypothetical $10,000 investment in Class A shares of Columbia High Yield Municipal Fund during the stated time period, and does not reflect the deduction of taxes that a shareholder may pay on Fund distributions or on the redemption of Fund shares.
Annual Report 2014
3
Columbia High Yield Municipal Fund
Manager Discussion of Fund Performance
For the 12-month period that ended May 31, 2014, Class A shares of the Fund returned 3.35% excluding sales charges. Class Z shares returned 3.56% for the same period. The Fund's Blended Benchmark returned 1.43%, and the Barclays High Yield Municipal Bond Index returned 0.33% over the same 12-month period. Sector positioning and security selection aided relative performance. Underweights in tobacco and Puerto Rico debt, which were weak performers during the 12-month period, and a sizable overweight in the strong-returning continuing care retirement communities sector helped the Fund beat both its Blended Benchmark and the Barclays High Yield Municipal Bond Index.
High-Yield Municipal Bonds Rebounded
The U.S. economy grew at a modest pace during the annual period as unemployment dropped to 6.3%, manufacturing activity picked up and consumer confidence rose. Early in the period, however, interest rates rose and bond prices fell amid concern that an improving economy would lead the Federal Reserve (the Fed) to taper its monthly bond buying program. High-yield municipal bonds were pressured further over the summer of 2013 by the City of Detroit's bankruptcy and mounting concern that Puerto Rico might default on its debt. Then, bond prices rallied in the first five months of 2014, as severe winter weather kept economic growth in check and the yield on the 10-year U.S. Treasury fell. (Bond yields and prices move in opposite directions.) Municipal issues had the added benefit of strong demand — driven by rising tax rates and continued low interest rates — and decreased supply. Although defaults declined, high-yield municipal bonds lagged investment-grade municipals for the year, largely due to the significant underperformance high-yield bonds produced in the summer of 2013.
Contributors and Detractors
The Fund benefited from its underexposure to the weakest high-yield sectors, namely Puerto Rico and tobacco, which together at period-end represented 28.5% of the Blended Benchmark but less than 8% of the Fund's net assets. Prices on Puerto Rico debt fell sharply last summer as the territory's weak macroeconomic conditions — including high unemployment, low-income levels and a huge debt burden — led to concern about potential defaults, credit downgrades and investor selling. The Fund had very little exposure to Puerto Rico when the downturn occurred, although we later added a small position after yields rose. Prices on tobacco bonds also declined, as rising interest rates and declining cigarette consumption deterred investors. The Fund's underweights in these sectors meant it had less exposure than the Blended Benchmark to lower quality issues, which underperformed higher quality issues.
The Fund also benefited from an overweight in continuing care retirement community (CCRC) bonds, which were among the top performers in both benchmarks, thanks to their yield advantage and an improving housing market. Top contributors included Air Force Village West, a CCRC in California that had been struggling to reach full occupancy when speculation that it planned to buy back some of its debt gave the bond price a nice boost. Bonds issued by Mirabella, a new CCRC in Seattle, also contributed, thanks to strong demand for their 6.75% coupon and general credit improvement. The timely purchase last summer of Puerto Rico COFINA (Corporación del Fondo de Interés Apremiante) sales-tax backed revenue bonds also aided relative performance. The COFINA bonds rallied
Portfolio Management
Chad Farrington, CFA
Top Ten States/Territories (%)
(at May 31, 2014) | |
California | | | 10.9 | | |
Illinois | | | 9.6 | | |
Florida | | | 8.9 | | |
Texas | | | 8.8 | | |
Michigan | | | 4.2 | | |
Missouri | | | 4.1 | | |
Massachusetts | | | 3.8 | | |
Puerto Rico | | | 3.7 | | |
New Jersey | | | 3.2 | | |
Louisiana | | | 3.2 | | |
Percentages indicated are based upon total investments (excluding Money Market Funds).
Fund holdings are as of the date given, are subject to change at any time, and are not recommendations to buy or sell any security.
Quality Breakdown (%)
(at May 31, 2014) | |
AAA rating | | | 0.2 | | |
AA rating | | | 5.4 | | |
A rating | | | 14.5 | | |
BBB rating | | | 25.2 | | |
BB rating | | | 12.1 | | |
B rating | | | 6.9 | | |
CCC rating | | | 0.3 | | |
Not rated | | | 35.4 | | |
Total | | | 100.0 | | |
Percentages indicated are based upon total fixed income securities (excluding Money Market Funds).
Bond ratings apply to the underlying holdings of the Fund and not the Fund itself and are divided into categories ranging from highest to lowest credit quality, determined by using the median rating of Moody's, S&P, and Fitch, as available. When ratings are available from only two rating agencies, the lower rating is used. When a rating is available from only one rating agency, that rating is used. When a bond is not rated by one of these agencies, it is designated as "Not rated". Credit quality ratings assigned by a rating agency are subjective opinions, not statements of fact, and are subject to change, including daily. The ratings assigned by credit rating agencies are but one of the considerations that the Investment Manager incorporates into its
Annual Report 2014
4
Columbia High Yield Municipal Fund
Manager Discussion of Fund Performance (continued)
when investors realized they had been overly punished in the downturn. Security selection also was strong among bonds with maturities of 22 years or more, which represented 52% of the Fund's assets versus 35% of the Blended Benchmark. The Fund's long-maturity issues beat the top-performing four- to six-year maturity segment in the Barclays High Yield Municipal Bond Index.
The Fund had few detractors during the period. Bonds issued by the Puerto Rico Electric Power Authority (PREPA), which we bought last August, were pressured by ongoing concern over the territory's financial health and high electric rates. An investment in debt issued by Glenmoor, a CCRC in Florida, hurt, as weak occupancy rates and a deteriorating financial position led to a default. Having slightly more interest rate sensitivity than the Blended Benchmark as rates rose also hindered relative performance.
Looking Ahead
At this time, we expect high-yield municipal bonds to benefit from continued strong demand if, as expected, the economy continues to improve, interest rates remain low and tax rates stay high. The sector also stands to gain as long as supply remains constrained. However, with high-yield municipals up nearly 9% during the first five months of 2014, we have become more defensive. The Fund ended the period with above-average liquidity, a slightly higher quality bias and interest-rate sensitivity that was more in line with the Blended Benchmark. We intend to wait for attractive buying opportunities that can help us generate an attractive total return with limited volatility.
credit analysis process, along with such other issuer-specific factors as cash flows, capital structure and leverage ratios, ability to de-leverage through free cash flow, quality of management, market positioning and access to capital, as well as such security-specific factors as the terms of the security (e.g., interest rate, and time to maturity) and the amount of any collateral.
Investment Risks
Fixed-income securities present issuer default risk. The fund invests substantially in municipal securities and will be affected by tax, legislative, regulatory, demographic or political changes, as well as changes impacting a state's financial, economic or other conditions. A relatively small number of tax-exempt issuers may necessitate the fund investing more heavily in a single issuer and, therefore, be more exposed to the risk of loss than a fund that invests more broadly. Prepayment and extension risk exists as a loan, bond or other investment may be called, prepaid or redeemed before maturity and that similar yielding investments may not be available for purchase. A rise in interest rates may result in a price decline of fixed-income securities held by the fund. Falling rates may result in the fund investing in lower yielding securities, lowering the fund's income and yield. Non-investment-grade (high-yield or junk) securities present greater price volatility and more risk to principal and income than higher rated securities. Market risk may affect a single issuer, sector of the economy, industry or the market as a whole. Federal and state tax rules apply to capital gain distributions and any gains or losses on sales. Income may be subject to state, local or alternative minimum taxes. Liquidity risk is associated with the difficulty of selling underlying investments at a desirable time or price. See the Fund's prospectus for information on these and other risks.
Annual Report 2014
5
Columbia High Yield Municipal Fund
Understanding Your Fund's Expenses
(Unaudited)
As an investor, you incur two types of costs. There are transaction costs, which generally include sales charges on purchases and may include redemption fees. There are also ongoing costs, which generally include management fees, distribution and/or service fees, and other fund expenses. The following information is intended to help you understand your ongoing costs (in dollars) of investing in the Fund and to help you compare these costs with the ongoing costs of investing in other mutual funds.
Analyzing Your Fund's Expenses
To illustrate these ongoing costs, we have provided examples and calculated the expenses paid by investors in each share class of the Fund during the period. The actual and hypothetical information in the table is based on an initial investment of $1,000 at the beginning of the period indicated and held for the entire period. Expense information is calculated two ways and each method provides you with different information. The amount listed in the "Actual" column is calculated using the Fund's actual operating expenses and total return for the period. You may use the Actual information, together with the amount invested, to estimate the expenses that you paid over the period. Simply divide your account value by $1,000 (for example, an $8,600 account value divided by $1,000 = 8.6), then multiply the results by the expenses paid during the period under the "Actual" column. The amount listed in the "Hypothetical" column assumes a 5% annual rate of return before expenses (which is not the Fund's actual return) and then applies the Fund's actual expense ratio for the period to the hypothetical return. You should not use the hypothetical account values and expenses to estimate either your actual account balance at the end of the period or the expenses you paid during the period. See "Compare With Other Funds" below for details on how to use the hypothetical data.
Compare With Other Funds
Since all mutual funds are required to include the same hypothetical calculations about expenses in shareholder reports, you can use this information to compare the ongoing cost of investing in the Fund with other funds. To do so, compare the hypothetical example with the 5% hypothetical examples that appear in the shareholder reports of other funds. As you compare hypothetical examples of other funds, it is important to note that hypothetical examples are meant to highlight the ongoing costs of investing in a fund only and do not reflect any transaction costs, such as sales charges, or redemption or exchange fees. Therefore, the hypothetical calculations are useful in comparing ongoing costs only, and will not help you determine the relative total costs of owning different funds. If transaction costs were included in these calculations, your costs would be higher.
December 1, 2013 – May 31, 2014
| | | Account Value at the Beginning
of the Period ($) | | Account Value at the End of the
Period ($) | | Expenses Paid During the
Period ($) | | Fund's Annualized
Expense Ratio (%) | |
| | | Actual | | Hypothetical | | Actual | | Hypothetical | | Actual | | Hypothetical | | Actual | |
Class A | | | 1,000.00 | | | | 1,000.00 | | | | 1,086.80 | | | | 1,020.69 | | | | 4.42 | | | | 4.28 | | | | 0.85 | | |
Class B | | | 1,000.00 | | | | 1,000.00 | | | | 1,082.90 | | | | 1,016.95 | | | | 8.31 | | | | 8.05 | | | | 1.60 | | |
Class C | | | 1,000.00 | | | | 1,000.00 | | | | 1,084.70 | | | | 1,017.70 | | | | 7.54 | | | | 7.29 | | | | 1.45 | | |
Class R4 | | | 1,000.00 | | | | 1,000.00 | | | | 1,088.80 | | | | 1,021.69 | | | | 3.39 | | | | 3.28 | | | | 0.65 | | |
Class R5 | | | 1,000.00 | | | | 1,000.00 | | | | 1,089.60 | | | | 1,022.14 | | | | 2.92 | | | | 2.82 | | | | 0.56 | | |
Class Z | | | 1,000.00 | | | | 1,000.00 | | | | 1,087.90 | | | | 1,021.69 | | | | 3.38 | | | | 3.28 | | | | 0.65 | | |
Expenses paid during the period are equal to the annualized expense ratio for each class as indicated above, multiplied by the average account value over the period and then multiplied by the number of days in the Fund's most recent fiscal half year and divided by 365.
Expenses do not include fees and expenses incurred indirectly by the Fund from the underlying funds in which the Fund may invest (also referred to as "acquired funds"), including affiliated and non-affiliated pooled investment vehicles (including mutual funds and exchange-traded funds).
Had Columbia Management Investment Advisers, LLC and/or certain of its affiliates not waived/reimbursed certain fees and expenses, account value at the end of the period would have been reduced.
Annual Report 2014
6
Columbia High Yield Municipal Fund
Portfolio of Investments
May 31, 2014
(Percentages represent value of investments compared to net assets)
Municipal Bonds 90.4%
Issue
Description | | Coupon
Rate | | Principal
Amount ($) | |
Value ($) | |
Alabama 0.3% | |
Courtland Industrial Development Board
Refunding Revenue Bonds
International Paper Co. Projects
Series 2003B AMT(a)
08/01/25 | | | 6.250 | % | | | 2,000,000 | | | | 2,001,540 | | |
Alaska 0.7% | |
City of Koyukuk
Revenue Bonds
Tanana Chiefs Conference Health Care
Series 2011
10/01/41 | | | 7.750 | % | | | 5,000,000 | | | | 5,489,400 | | |
Arizona 2.5% | |
Industrial Development Authority of the County of Pima (The)
Refunding Revenue Bonds
Facility-Edkey Charter Schools Project
Series 2013
07/01/33 | | | 6.000 | % | | | 2,000,000 | | | | 1,933,460 | | |
07/01/43 | | | 6.000 | % | | | 2,500,000 | | | | 2,336,875 | | |
07/01/48 | | | 6.000 | % | | | 1,500,000 | | | | 1,381,425 | | |
Revenue Bonds
American Charter Schools Foundation
Series 2007A
07/01/38 | | | 5.625 | % | | | 3,840,000 | | | | 3,374,477 | | |
Maricopa County Pollution Control Corp.
Revenue Bonds
El Paso Electric Co. Project
Series 2009B
04/01/40 | | | 7.250 | % | | | 3,600,000 | | | | 4,107,888 | | |
Surprise Municipal Property Corp.
Revenue Bonds
Series 2007
04/01/32 | | | 4.900 | % | | | 2,000,000 | | | | 2,035,340 | | |
Yavapai County Industrial Development Authority
Revenue Bonds
Yavapai Regional Medical Center
Series 2008B
08/01/37 | | | 5.625 | % | | | 3,500,000 | | | | 3,641,190 | | |
Total | | | | | | | 18,810,655 | | |
California 9.9% | |
Agua Caliente Band of Cahuilla Indians
Revenue Bonds
Series 2003(b)(c)
07/01/18 | | | 6.000 | % | | | 2,000,000 | | | | 1,965,180 | | |
Cabazon Band Mission Indians(b)(c)(d)(e)
Revenue Bonds
Series 2004
10/01/13 | | | 13.000 | % | | | 405,000 | | | | 206,514 | | |
10/01/15 | | | 8.375 | % | | | 560,000 | | | | 190,350 | | |
10/01/19 | | | 8.750 | % | | | 2,785,000 | | | | 946,649 | | |
Municipal Bonds (continued)
Issue
Description | | Coupon
Rate | | Principal
Amount ($) | |
Value ($) | |
Series 2010
10/01/20 | | | 8.375 | % | | | 1,420,000 | | | | 567,276 | | |
California Housing Finance Agency(a)
Revenue Bonds
Home Mortgage
Series 2006K AMT
08/01/26 | | | 4.625 | % | | | 5,000,000 | | | | 5,096,550 | | |
Series 2008K AMT
08/01/33 | | | 5.550 | % | | | 2,545,000 | | | | 2,564,342 | | |
California Municipal Finance Authority
Revenue Bonds
UTS Renewable Energy - Waste Water
Series 2011 AMT(a)(b)(d)
12/01/32 | | | 7.500 | % | | | 1,885,000 | | | | 1,909,298 | | |
California State Public Works Board
Refunding Revenue Bonds
Various Capital Projects
Series 2012-G
11/01/37 | | | 5.000 | % | | | 1,250,000 | | | | 1,364,713 | | |
California Statewide Communities Development Authority
Revenue Bonds
American Baptist Homes West
Series 2010
10/01/39 | | | 6.250 | % | | | 2,750,000 | | | | 2,967,717 | | |
Aspire Public Schools
Series 2010
07/01/46 | | | 6.125 | % | | | 2,990,000 | | | | 3,070,760 | | |
Chino Public Financing Authority
Refunding Special Tax Bonds
Series 2012
09/01/34 | | | 5.000 | % | | | 1,775,000 | | | | 1,893,037 | | |
City of Carson
Special Assessment Bonds
District No. 92-1
Series 1992
09/02/22 | | | 7.375 | % | | | 90,000 | | | | 90,640 | | |
City of Santa Maria Water & Wastewater
Refunding Revenue Bonds
Series 2012A(f)
02/01/25 | | | 0.000 | % | | | 3,100,000 | | | | 1,917,412 | | |
City of Upland
Certificate of Participation
San Antonio Community Hospital
Series 2011
01/01/41 | | | 6.500 | % | | | 5,000,000 | | | | 5,652,400 | | |
Compton Unified School District
Unlimited General Obligation Bonds
Election of 2002 - Capital Appreciation
Series 2006C(f)
06/01/25 | | | 0.000 | % | | | 2,310,000 | | | | 1,428,712 | | |
County of Sacramento
Revenue Bonds
Subordinated Series 2009D
07/01/35 | | | 6.000 | % | | | 2,500,000 | | | | 2,885,675 | | |
The accompanying Notes to Financial Statements are an integral part of this statement.
Annual Report 2014
7
Columbia High Yield Municipal Fund
Portfolio of Investments (continued)
May 31, 2014
Municipal Bonds (continued)
Issue
Description | | Coupon
Rate | | Principal
Amount ($) | |
Value ($) | |
Empire Union School District
Special Tax Bonds
Communities Facilities District No. 1987-1
Series 2002A (AMBAC)(f)
10/01/21 | | | 0.000 | % | | | 1,665,000 | | | | 1,276,256 | | |
Foothill-Eastern Transportation Corridor Agency
Refunding Revenue Bonds
Series 2014-C
01/15/43 | | | 6.500 | % | | | 5,000,000 | | | | 5,816,350 | | |
Golden State Tobacco Securitization Corp.
Asset-Backed Revenue Bonds
Senior Series 2007A-1
06/01/47 | | | 5.125 | % | | | 3,000,000 | | | | 2,319,990 | | |
Hesperia Public Financing Authority
Tax Allocation Bonds
Redevelopment & Housing Projects
Series 2007A
09/01/27 | | | 5.500 | % | | | 5,430,000 | | | | 5,622,656 | | |
M-S-R Energy Authority
Revenue Bonds
Series 2009B
11/01/39 | | | 6.500 | % | | | 5,000,000 | | | | 6,615,350 | | |
Oakdale Public Financing Authority
Tax Allocation Bonds
Central City Redevelopment Project
Series 2004
06/01/33 | | | 5.375 | % | | | 2,000,000 | | | | 2,000,400 | | |
Palomar Health
Certificate of Participation
Series 2010
11/01/41 | | | 6.000 | % | | | 2,500,000 | | | | 2,546,425 | | |
Riverside County Public Financing Authority
Certificate of Participation
Series 1999
05/15/29 | | | 5.800 | % | | | 5,650,000 | | | | 4,266,258 | | |
San Francisco City & County Redevelopment Agency
Tax Allocation Bonds
Mission Bay South Redevelopment
Series 2009D
08/01/39 | | | 6.625 | % | | | 1,500,000 | | | | 1,706,130 | | |
State of California Department of Veterans Affairs
Revenue Bonds
Series 2012A
12/01/25 | | | 3.500 | % | | | 5,000,000 | | | | 5,108,400 | | |
State of California
Unlimited General Obligation Bonds
Various Purpose
Series 2012
04/01/42 | | | 5.000 | % | | | 3,000,000 | | | | 3,271,560 | | |
Total | | | | | | | 75,267,000 | | |
Municipal Bonds (continued)
Issue
Description | | Coupon
Rate | | Principal
Amount ($) | |
Value ($) | |
Colorado 0.1% | |
Red Sky Ranch Metropolitan District
Limited General Obligation Bonds
Series 2003
12/01/33 | | | 6.050 | % | | | 1,000,000 | | | | 1,002,260 | | |
Connecticut 1.4% | |
Connecticut State Development Authority
Revenue Bonds
Alzheimer's Resource Center Project
Series 2007
08/15/27 | | | 5.500 | % | | | 500,000 | | | | 513,395 | | |
Harbor Point Infrastructure Improvement District
Tax Allocation Bonds
Harbor Point Project
Series 2010A
04/01/39 | | | 7.875 | % | | | 4,000,000 | | | | 4,667,920 | | |
Mohegan Tribe of Indians of Connecticut(b)(c)
Revenue Bonds
Public Improvement-Priority Distribution
Series 2001
01/01/31 | | | 6.250 | % | | | 4,475,000 | | | | 4,478,356 | | |
Series 2003
01/01/33 | | | 5.250 | % | | | 1,000,000 | | | | 992,920 | | |
Total | | | | | | | 10,652,591 | | |
Delaware 0.3% | |
Centerline Equity Issuer Trust
Secured AMT(a)(b)
05/15/19 | | | 6.300 | % | | | 1,000,000 | | | | 1,168,310 | | |
City of Wilmington
Revenue Bonds
Housing-Electra Arms Senior Associates Project
Series 1998 AMT(a)(d)
06/01/28 | | | 6.250 | % | | | 700,000 | | | | 699,944 | | |
Total | | | | | | | 1,868,254 | | |
District of Columbia 0.9% | |
Metropolitan Washington Airports Authority(a)
Revenue Bonds
Airport System
Series 2012A AMT
10/01/24 | | | 5.000 | % | | | 4,000,000 | | | | 4,629,920 | | |
Metropolitan Washington Airports Authority(a)(g)
Refunding Revenue Bonds
Series 2014-A AMT
10/01/23 | | | 5.000 | % | | | 2,000,000 | | | | 2,370,500 | | |
Total | | | | | | | 7,000,420 | | |
The accompanying Notes to Financial Statements are an integral part of this statement.
Annual Report 2014
8
Columbia High Yield Municipal Fund
Portfolio of Investments (continued)
May 31, 2014
Municipal Bonds (continued)
Issue
Description | | Coupon
Rate | | Principal
Amount ($) | |
Value ($) | |
Florida 8.1% | |
Broward County Housing Finance Authority
Revenue Bonds
Chaves Lake Apartments Project
Series 2000A AMT(a)(d)
07/01/40 | | | 7.500 | % | | | 1,500,000 | | | | 1,501,395 | | |
Capital Trust Agency, Inc.
Revenue Bonds
Atlantic Housing Foundation
Subordinated Series 2008B(d)
07/15/32 | | | 7.000 | % | | | 1,370,000 | | | | 781,023 | | |
City of Lakeland
Refunding Revenue Bonds
1st Mortgage-Carpenters Home Estates
Series 2008
01/01/28 | | | 6.250 | % | | | 675,000 | | | | 718,828 | | |
01/01/43 | | | 6.375 | % | | | 2,250,000 | | | | 2,364,930 | | |
County of Miami-Dade
Refunding Revenue Bonds
Subordinated Series 2012-B
10/01/37 | | | 5.000 | % | | | 1,530,000 | | | | 1,661,198 | | |
County of Miami-Dade(f)
Subordinated Revenue Bonds
Capital Appreciation
Series 2009B
10/01/41 | | | 0.000 | % | | | 30,000,000 | | | | 7,379,700 | | |
Florida Development Finance Corp.
Revenue Bonds
Renaissance Charter School
Series 2010A
09/15/40 | | | 6.000 | % | | | 3,750,000 | | | | 3,776,887 | | |
Series 2012-A
06/15/43 | | | 6.125 | % | | | 5,500,000 | | | | 5,266,525 | | |
Renaissance Charter School Project
Series 2013A
06/15/44 | | | 8.500 | % | | | 5,000,000 | | | | 5,215,550 | | |
Mid-Bay Bridge Authority
Revenue Bonds
Series 2011A
10/01/40 | | | 7.250 | % | | | 4,000,000 | | | | 4,822,000 | | |
Middle Village Community Development District
Special Assessment Bonds
Series 2004A(d)
05/01/35 | | | 6.000 | % | | | 1,910,000 | | | | 1,581,155 | | |
North Brevard County Hospital District
Refunding Revenue Bonds
Parrish Medical Center Project
Series 2008
10/01/38 | | | 5.750 | % | | | 4,000,000 | | | | 4,287,400 | | |
Orange County Health Facilities Authority
Refunding Revenue Bonds
Health Care-Orlando Lutheran
Series 2005
07/01/26 | | | 5.700 | % | | | 2,000,000 | | | | 2,018,520 | | |
Municipal Bonds (continued)
Issue
Description | | Coupon
Rate | | Principal
Amount ($) | |
Value ($) | |
Mayflower Retirement Center
Series 2012
06/01/42 | | | 5.125 | % | | | 750,000 | | | | 781,545 | | |
Revenue Bonds
1st Mortgage-Orlando Lutheran Tower
Series 2007
07/01/32 | | | 5.500 | % | | | 350,000 | | | | 352,149 | | |
07/01/38 | | | 5.500 | % | | | 1,750,000 | | | | 1,752,362 | | |
Palm Beach County Health Facilities Authority
Revenue Bonds
Sinai Residences Boca Raton
Series 2014-A
06/01/49 | | | 7.500 | % | | | 1,250,000 | | | | 1,390,975 | | |
Sarasota County Health Facilities Authority
Refunding Revenue Bonds
Village on the Isle Project
Series 2007
01/01/32 | | | 5.500 | % | | | 4,000,000 | | | | 4,201,160 | | |
Seven Oaks Community Development District II
Special Assessment Bonds
Series 2004A
05/01/35 | | | 5.875 | % | | | 420,000 | | | | 385,564 | | |
Series 2004B
05/01/16 | | | 7.500 | % | | | 1,185,000 | | | | 1,193,153 | | |
South Lake County Hospital District
Revenue Bonds
South Lake Hospital, Inc.
Series 2010A
04/01/39 | | | 6.250 | % | | | 2,000,000 | | | | 2,203,360 | | |
St. Johns County Industrial Development Authority
Refunding Revenue Bonds
Bayview Project
Series 2007A
10/01/41 | | | 5.250 | % | | | 3,725,000 | | | | 3,124,679 | | |
Refunding Subordinated Revenue Bonds
Glenmoor Project
Series 2014-B
01/01/49 | | | 2.500 | % | | | 1,186,427 | | | | 12 | | |
St. Johns County Industrial Development Authority(h)
Refunding Revenue Bonds
Glenmoor Project
Series 2014-A
01/01/49 | | | 1.344 | % | | | 3,206,250 | | | | 1,887,776 | | |
Waterset North Community Development District
Special Assessment Bonds
Series 2007A
05/01/39 | | | 6.600 | % | | | 1,875,000 | | | | 1,796,569 | | |
Westridge Community Development District
Special Assessment Bonds
Series 2005(d)(e)
05/01/37 | | | 5.800 | % | | | 2,650,000 | | | | 997,593 | | |
Total | | | | | | | 61,442,008 | | |
The accompanying Notes to Financial Statements are an integral part of this statement.
Annual Report 2014
9
Columbia High Yield Municipal Fund
Portfolio of Investments (continued)
May 31, 2014
Municipal Bonds (continued)
Issue
Description | | Coupon
Rate | | Principal
Amount ($) | |
Value ($) | |
Georgia 2.3% | |
DeKalb County Hospital Authority
Revenue Bonds
DeKalb Medical Center, Inc. Project
Series 2010
09/01/40 | | | 6.125 | % | | | 4,500,000 | | | | 4,735,260 | | |
Fulton County Residential Care Facilities for the Elderly
Authority
Revenue Bonds
1st Mortgage-Lenbrook Project
Series 2006A
07/01/29 | | | 5.000 | % | | | 3,000,000 | | | | 2,953,050 | | |
Municipal Electric Authority of Georgia
Revenue Bonds
Series 1991V
01/01/18 | | | 6.600 | % | | | 30,000 | | | | 31,120 | | |
Series 1991V Escrowed to Maturity
01/01/18 | | | 6.600 | % | | | 680,000 | | | | 766,408 | | |
Rockdale County Development Authority
Revenue Bonds
Visy Paper Project
Series 2007A AMT(a)
01/01/34 | | | 6.125 | % | | | 5,000,000 | | | | 5,114,550 | | |
Savannah Economic Development Authority
Refunding Revenue Bonds
Marshes Skidaway Island Project
Series 2013
01/01/49 | | | 7.250 | % | | | 3,500,000 | | | | 3,693,130 | | |
Total | | | | | | | 17,293,518 | | |
Guam 0.7% | |
Guam Department of Education
Certificate of Participation
John F. Kennedy High School
Series 2010A(c)
12/01/40 | | | 6.875 | % | | | 4,750,000 | | | | 5,255,922 | | |
Hawaii 1.0% | |
State of Hawaii Department of Budget & Finance
Revenue Bonds
15 Craigside Project
Series 2009A
11/15/44 | | | 9.000 | % | | | 2,375,000 | | | | 2,781,814 | | |
Hawaii Pacific University
Series 2013A
07/01/43 | | | 6.875 | % | | | 2,800,000 | | | | 2,999,360 | | |
Hawaiian Electric Co. Subsidiary
Series 2009
07/01/39 | | | 6.500 | % | | | 1,750,000 | | | | 1,958,005 | | |
Total | | | | | | | 7,739,179 | | |
Municipal Bonds (continued)
Issue
Description | | Coupon
Rate | | Principal
Amount ($) | |
Value ($) | |
Idaho 0.5% | |
Idaho Health Facilities Authority
Revenue Bonds
Terraces Boise Project
Series 2014A
10/01/49 | | | 8.125 | % | | | 4,000,000 | | | | 4,121,880 | | |
Illinois 8.8% | |
City of Chicago
Refunding Unlimited General Obligation Bonds
Project
Series 2014A
01/01/36 | | | 5.000 | % | | | 3,000,000 | | | | 3,092,070 | | |
Du Page County Special Service Area No. 31
Special Tax Bonds
Monarch Landing Project
Series 2006
03/01/36 | | | 5.625 | % | | | 750,000 | | | | 756,098 | | |
Illinois Finance Authority
Refunding Revenue Bonds
Chicago Charter School Project
Series 2007
12/01/36 | | | 5.000 | % | | | 1,750,000 | | | | 1,752,853 | | |
Uno Charter School Network, Inc. Project
Series 2011A
10/01/31 | | | 6.875 | % | | | 2,490,000 | | | | 2,832,076 | | |
Revenue Bonds
CHF-Normal LLC-Illinois State University
Series 2011
04/01/43 | | | 7.000 | % | | | 3,450,000 | | | | 3,969,949 | | |
Columbia College
Series 2007 (NPFGC)
12/01/37 | | | 5.000 | % | | | 5,000,000 | | | | 5,125,750 | | |
Provena Health
Series 2009A
08/15/34 | | | 7.750 | % | | | 4,000,000 | | | | 4,986,120 | | |
Riverside Health System
Series 2009
11/15/35 | | | 6.250 | % | | | 3,000,000 | | | | 3,334,200 | | |
Silver Cross & Medical Centers
Series 2009
08/15/44 | | | 7.000 | % | | | 5,000,000 | | | | 5,628,500 | | |
Smith Village Project
Series 2005A
11/15/35 | | | 6.250 | % | | | 2,750,000 | | | | 2,750,522 | | |
Illinois Finance Authority(d)(e)
Revenue Bonds
Leafs Hockey Club Project
Series 2007A
03/01/37 | | | 6.000 | % | | | 1,000,000 | | | | 309,550 | | |
Illinois State Toll Highway Authority
Refunding Revenue Bonds
Series 2014-A
12/01/21 | | | 5.000 | % | | | 1,525,000 | | | | 1,830,885 | | |
The accompanying Notes to Financial Statements are an integral part of this statement.
Annual Report 2014
10
Columbia High Yield Municipal Fund
Portfolio of Investments (continued)
May 31, 2014
Municipal Bonds (continued)
Issue
Description | | Coupon
Rate | | Principal
Amount ($) | |
Value ($) | |
Metropolitan Pier & Exposition Authority
Refunding Revenue Bonds
McCormick
Series 2010B-2
06/15/50 | | | 5.000 | % | | | 5,000,000 | | | | 5,168,250 | | |
Plano Special Service Area No. 4
Special Tax Bonds
Lakewood Springs Project Unit 5
Series 2005 B
03/01/35 | | | 6.000 | % | | | 2,828,000 | | | | 2,868,412 | | |
Railsplitter Tobacco Settlement Authority
Revenue Bonds
Series 2010
06/01/28 | | | 6.000 | % | | | 5,000,000 | | | | 5,855,000 | | |
Southwestern Illinois Development Authority
Revenue Bonds
Anderson Hospital
Series 2006
08/15/26 | | | 5.125 | % | | | 1,245,000 | | | | 1,265,779 | | |
State of Illinois
Unlimited General Obligation Refunding Bonds
Series 2012
08/01/23 | | | 5.000 | % | | | 2,500,000 | | | | 2,844,425 | | |
Village of Annawan
Tax Allocation Bonds
Patriot Renewable Fuels LLC Project
Series 2007
01/01/18 | | | 5.625 | % | | | 2,780,000 | | | | 2,564,022 | | |
Village of Hillside
Tax Allocation Bonds
Senior Lien-Mannheim Redevelopment Project
Series 2008
01/01/28 | | | 7.000 | % | | | 5,240,000 | | | | 5,444,727 | | |
Village of Lincolnshire
Special Tax Bonds
Sedgebrook Project
Series 2004
03/01/34 | | | 6.250 | % | | | 693,000 | | | | 708,606 | | |
Volo Village Special Service Area No. 3
Special Tax Bonds
Symphony Meadows Project
Series 2006-1
03/01/36 | | | 6.000 | % | | | 3,599,000 | | | | 3,598,604 | | |
Total | | | | | | | 66,686,398 | | |
Indiana 0.5% | |
City of Portage
Tax Allocation Bonds
Ameriplex Project
Series 2006
07/15/23 | | | 5.000 | % | | | 700,000 | | | | 724,640 | | |
Municipal Bonds (continued)
Issue
Description | | Coupon
Rate | | Principal
Amount ($) | |
Value ($) | |
Indiana Health & Educational Facilities Financing
Authority
Revenue Bonds
Baptist Homes of Indiana
Series 2005
11/15/35 | | | 5.250 | % | | | 2,750,000 | | | | 2,795,430 | | |
Total | | | | | | | 3,520,070 | | |
Iowa 1.2% | |
City of Marion
Refunding Revenue Bonds
1st Mortgage
Series 2003(h)
01/01/29 | | | 8.000 | % | | | 187,000 | | | | 192,948 | | |
Iowa Finance Authority
Refunding Revenue Bonds
Deerfield Retirement Community, Inc.
Series 2014-B
05/15/56 | | | 2.000 | % | | | 401,062 | | | | 4 | | |
Revenue Bonds
Iowa Fertilizer Co. Project
Series 2013
12/01/25 | | | 5.250 | % | | | 5,000,000 | | | | 5,208,800 | | |
Iowa Finance Authority(h)
Refunding Revenue Bonds
Deerfield Retirement Community, Inc.
Series 2014-A
11/15/46 | | | 2.700 | % | | | 2,138,019 | | | | 1,429,608 | | |
Iowa Student Loan Liquidity Corp.
Revenue Bonds
Senior Series 2011A-2 AMT(a)
12/01/30 | | | 5.850 | % | | | 1,950,000 | | | | 2,078,993 | | |
Total | | | | | | | 8,910,353 | | |
Kansas 2.2% | |
City of Lenexa
Revenue Bonds
Lakeview Village, Inc. Project
Series 2009
05/15/29 | | | 7.125 | % | | | 500,000 | | | | 556,580 | | |
05/15/39 | | | 7.250 | % | | | 1,500,000 | | | | 1,656,930 | | |
City of Manhattan
Revenue Bonds
Meadowlark Hills Retirement
Series 2007A
05/15/29 | | | 5.000 | % | | | 2,680,000 | | | | 2,665,983 | | |
City of Overland Park KS
Revenue Bonds
Prairiefire-Lionsgate Project
Series 2012
12/15/32 | | | 6.000 | % | | | 6,000,000 | | | | 5,830,080 | | |
The accompanying Notes to Financial Statements are an integral part of this statement.
Annual Report 2014
11
Columbia High Yield Municipal Fund
Portfolio of Investments (continued)
May 31, 2014
Municipal Bonds (continued)
Issue
Description | | Coupon
Rate | | Principal
Amount ($) | |
Value ($) | |
Wyandotte County-Kansas City Unified Government
Revenue Bonds
Legends Village West Project
Series 2006
10/01/28 | | | 4.875 | % | | | 6,245,000 | | | | 6,302,579 | | |
Total | | | | | | | 17,012,152 | | |
Kentucky 0.2% | |
Kentucky Economic Development Finance Authority
Revenue Bonds
Louisville Arena
Subordinated Series 2008A-1 (AGM)
12/01/38 | | | 6.000 | % | | | 1,150,000 | | | | 1,215,998 | | |
Kentucky Economic Development Finance Authority(h)
Refunding Revenue Bonds
1st Mortgage-AHF/KY-IA, Inc. Project
Series 2003
01/01/29 | | | 8.000 | % | | | 596,000 | | | | 614,959 | | |
Total | | | | | | | 1,830,957 | | |
Louisiana 2.9% | |
Louisiana Local Government Environmental Facilities &
Community Development Authority
Revenue Bonds
Westlake Chemical Corp.
Series 2010A-2
11/01/35 | | | 6.500 | % | | | 5,000,000 | | | | 5,802,550 | | |
Louisiana Public Facilities Authority(a)
Revenue Bonds
Impala Warehousing LLC Project
Series 2013 AMT
07/01/36 | | | 6.500 | % | | | 5,000,000 | | | | 5,242,350 | | |
Series 2013B
07/01/39 | | | 10.500 | % | | | 5,000,000 | | | | 5,198,900 | | |
New Orleans Aviation Board
Revenue Bonds
Consolidated Rental Car
Series 2009A
01/01/40 | | | 6.500 | % | | | 5,000,000 | | | | 5,664,250 | | |
Total | | | | | | | 21,908,050 | | |
Maryland 0.4% | |
Maryland Economic Development Corp.
Revenue Bonds
University of Maryland-College Park Projects
Series 2008
06/01/43 | | | 5.875 | % | | | 2,590,000 | | | | 2,779,873 | | |
Resolution Trust Corp.
Pass-Through Certificates
Series 1993A(d)
12/01/16 | | | 8.500 | % | | | 455,481 | | | | 452,079 | | |
Total | | | | | | | 3,231,952 | | |
Municipal Bonds (continued)
Issue
Description | | Coupon
Rate | | Principal
Amount ($) | |
Value ($) | |
Massachusetts 3.5% | |
Massachusetts Development Finance Agency
Refunding Revenue Bonds
1st Mortgage-VOA Concord
Series 2007
11/01/41 | | | 5.200 | % | | | 1,000,000 | | | | 893,220 | | |
Revenue Bonds
Foxborough Regional Charter School
Series 2010A
07/01/42 | | | 7.000 | % | | | 4,200,000 | | | | 4,710,678 | | |
Linden Ponds, Inc. Facility
Series 2011A-1
11/15/31 | | | 6.250 | % | | | 2,112,442 | | | | 1,850,203 | | |
11/15/39 | | | 6.250 | % | | | 634,649 | | | | 530,732 | | |
11/15/46 | | | 6.250 | % | | | 2,502,917 | | | | 2,039,502 | | |
Series 2011A-2
11/15/46 | | | 5.500 | % | | | 279,667 | | | | 200,823 | | |
Massachusetts Development Finance Agency(d)
Revenue Bonds
Health Care Facility-Alliance
Series 1999A
07/01/32 | | | 7.100 | % | | | 1,935,000 | | | | 1,935,658 | | |
Massachusetts Development Finance Agency(f)
Revenue Bonds
Linden Ponds, Inc. Facility
Series 2011B
11/15/56 | | | 0.000 | % | | | 1,391,019 | | | | 6,260 | | |
Massachusetts Educational Financing Authority(a)
Revenue Bonds
Series 2008H (AGM) AMT
01/01/30 | | | 6.350 | % | | | 2,275,000 | | | | 2,458,183 | | |
Series 2012J AMT
07/01/21 | | | 5.000 | % | | | 3,000,000 | | | | 3,405,060 | | |
Massachusetts Educational Financing Authority(a)(g)
Revenue Bonds
Education Loan
Series 2014-I AMT
01/01/21 | | | 5.000 | % | | | 1,885,000 | | | | 2,132,802 | | |
Massachusetts Health & Educational Facilities Authority
Revenue Bonds
Boston Medical Center Project
Series 2008
07/01/38 | | | 5.250 | % | | | 5,000,000 | | | | 5,210,300 | | |
Milford Regional Medical
Series 2007E
07/15/32 | | | 5.000 | % | | | 1,250,000 | | | | 1,268,325 | | |
Total | | | | | | | 26,641,746 | | |
Michigan 3.8% | |
Allen Academy
Refunding Revenue Bonds
Public School Academy
Series 2013
06/01/33 | | | 6.000 | % | | | 5,750,000 | | | | 5,666,740 | | |
The accompanying Notes to Financial Statements are an integral part of this statement.
Annual Report 2014
12
Columbia High Yield Municipal Fund
Portfolio of Investments (continued)
May 31, 2014
Municipal Bonds (continued)
Issue
Description | | Coupon
Rate | | Principal
Amount ($) | |
Value ($) | |
City of Detroit Sewage Disposal System
Refunding Revenue Bonds
Senior Lien
Series 2012A
07/01/23 | | | 5.000 | % | | | 3,025,000 | | | | 2,995,506 | | |
07/01/39 | | | 5.250 | % | | | 1,375,000 | | | | 1,365,458 | | |
City of Detroit Water Supply System
Refunding Revenue Bonds
Senior Lien
Series 2011C
07/01/41 | | | 5.000 | % | | | 1,025,000 | | | | 997,233 | | |
Revenue Bonds
Senior Lien
Series 2011A
07/01/41 | | | 5.250 | % | | | 1,445,000 | | | | 1,432,544 | | |
Michigan Finance Authority
Revenue Bonds
School District of the city of Detroit
Series 2012
06/01/20 | | | 5.000 | % | | | 1,400,000 | | | | 1,566,362 | | |
Michigan State Hospital Finance Authority
Refunding Revenue Bonds
Henry Ford Health System
Series 2006A
11/15/46 | | | 5.250 | % | | | 3,000,000 | | | | 3,042,540 | | |
Michigan Strategic Fund
Refunding Revenue Bonds
Michigan Sugar Co.- Carollton
Series 1998C AMT(a)(d)
11/01/25 | | | 6.550 | % | | | 1,500,000 | | | | 1,377,840 | | |
Michigan Tobacco Settlement Finance Authority
Revenue Bonds
Senior Series 2007A
06/01/34 | | | 6.000 | % | | | 1,000,000 | | | | 840,420 | | |
06/01/48 | | | 6.000 | % | | | 11,000,000 | | | | 9,060,040 | | |
Summit Academy North
Refunding Revenue Bonds
Series 2005
11/01/35 | | | 5.500 | % | | | 750,000 | | | | 673,455 | | |
Total | | | | | | | 29,018,138 | | |
Minnesota 1.7% | |
City of Anoka
Revenue Bonds
Homestead Anoka, Inc. Project
Series 2011A
11/01/46 | | | 7.000 | % | | | 4,070,000 | | | | 4,281,721 | | |
City of Eveleth
Refunding Revenue Bonds
Arrowhead Senior Living Community
Series 2007
10/01/27 | | | 5.200 | % | | | 2,375,000 | | | | 2,219,461 | | |
Municipal Bonds (continued)
Issue
Description | | Coupon
Rate | | Principal
Amount ($) | |
Value ($) | |
City of Minneapolis
Revenue Bonds
Riverton Community Housing Project
Series 2006A
08/01/40 | | | 5.700 | % | | | 1,600,000 | | | | 1,600,064 | | |
Minneapolis/St. Paul Housing Finance Board
Revenue Bonds
Mortgage-Backed Securities Program-Cityliving
Series 2006A-2 (GNMA/FNMA) AMT(a)
12/01/38 | | | 5.000 | % | | | 11,830 | | | | 11,933 | | |
St. Paul Housing & Redevelopment Authority
Revenue Bonds
Healtheast Project
Series 2005
11/15/30 | | | 6.000 | % | | | 3,000,000 | | | | 3,083,250 | | |
11/15/35 | | | 6.000 | % | | | 2,000,000 | | | | 2,052,360 | | |
Total | | | | | | | 13,248,789 | | |
Mississippi 0.4% | |
County of Lowndes
Refunding Revenue Bonds
Weyerhaeuser Co. Project
Series 1992A
04/01/22 | | | 6.800 | % | | | 1,995,000 | | | | 2,374,848 | | |
County of Lowndes(h)
Refunding Revenue Bonds
Weyerhaeuser Co. Project
Series 1992B
04/01/22 | | | 6.700 | % | | | 230,000 | | | | 271,405 | | |
Rankin County Five Lakes Utility District
Series 1994(d)
07/15/37 | | | 7.000 | % | | | 240,000 | | | | 240,110 | | |
Total | | | | | | | 2,886,363 | | |
Missouri 3.7% | |
City of Kansas City
Tax Allocation Bonds
Kansas City-Maincor Project
Series 2007A Escrowed to Maturity
03/01/18 | | | 5.250 | % | | | 800,000 | | | | 879,576 | | |
Shoal Creek Parkway Project
Series 2011
06/01/25 | | | 6.500 | % | | | 3,100,000 | | | | 3,151,646 | | |
City of Manchester
Refunding Tax Allocation Bonds
Highway 141/Manchester Road Project
Series 2010
11/01/39 | | | 6.875 | % | | | 5,000,000 | | | | 5,299,200 | | |
City of Riverside
Tax Allocation Bonds
L-385 Levee Project
Series 2004
05/01/20 | | | 5.250 | % | | | 1,275,000 | | | | 1,309,042 | | |
The accompanying Notes to Financial Statements are an integral part of this statement.
Annual Report 2014
13
Columbia High Yield Municipal Fund
Portfolio of Investments (continued)
May 31, 2014
Municipal Bonds (continued)
Issue
Description | | Coupon
Rate | | Principal
Amount ($) | |
Value ($) | |
Grundy County Industrial Development Authority
Revenue Bonds
Wright Memorial Hospital
Series 2009
09/01/34 | | | 6.750 | % | | | 2,250,000 | | | | 2,448,090 | | |
Kirkwood Industrial Development Authority
Revenue Bonds
Aberdeen Heights
Series 2010A
05/15/45 | | | 8.250 | % | | | 4,500,000 | | | | 5,150,790 | | |
Saline County Industrial Development Authority
Revenue Bonds
John Fitzgibbon Memorial Hospital, Inc.
Series 2005
12/01/35 | | | 5.625 | % | | | 5,485,000 | | | | 5,588,886 | | |
St. Louis County Industrial Development Authority
Refunding Revenue Bonds
Ranken Jordan Project
Series 2007
11/15/35 | | | 5.000 | % | | | 1,300,000 | | | | 1,212,471 | | |
Revenue Bonds
St. Andrews Residence for Seniors
Series 2007A
12/01/41 | | | 6.375 | % | | | 3,000,000 | | | | 3,033,660 | | |
Total | | | | | | | 28,073,361 | | |
Montana 0.1% | |
Montana Facility Finance Authority
Revenue Bonds
Senior Living-St. John's Lutheran
Series 2006A
05/15/36 | | | 6.125 | % | | | 1,000,000 | | | | 1,020,060 | | |
Nebraska 0.7% | |
Central Plains Energy Project
Revenue Bonds
Project #3
Series 2012
09/01/42 | | | 5.000 | % | | | 5,000,000 | | | | 5,215,950 | | |
Nevada 0.7% | |
City of Sparks
Senior Sales Tax Anticipation Revenue Bonds
Series 2008A(b)
06/15/28 | | | 6.750 | % | | | 5,000,000 | | | | 5,213,900 | | |
New Hampshire —% | |
New Hampshire Business Finance Authority
Revenue Bonds
Pennichuck Water Works, Inc. Project
Series 1988 Escrowed to Maturity AMT(a)(h)
07/01/18 | | | 7.500 | % | | | 155,000 | | | | 175,193 | | |
Municipal Bonds (continued)
Issue
Description | | Coupon
Rate | | Principal
Amount ($) | |
Value ($) | |
New Jersey 2.9% | |
Middlesex County Improvement Authority(d)(e)
Revenue Bonds
Heldrich Center Hotel
Series 2005C
01/01/37 | | | 8.750 | % | | | 1,250,000 | | | | 86,713 | | |
Subordinated Revenue Bonds
Heldrich Center Hotel
Series 2005B
01/01/25 | | | 6.125 | % | | | 2,750,000 | | | | 190,768 | | |
01/01/37 | | | 6.250 | % | | | 6,450,000 | | | | 447,436 | | |
New Jersey Economic Development Authority
Refunding Revenue Bonds
Seabrook Village, Inc. Facility
Series 2006
11/15/36 | | | 5.250 | % | | | 2,250,000 | | | | 2,265,142 | | |
New Jersey Economic Development Authority(a)
Refunding Revenue Bonds
Series 2006B AMT
01/01/37 | | | 6.875 | % | | | 4,000,000 | | | | 4,031,520 | | |
Revenue Bonds
UMM Energy Partners
Series 2012A AMT
06/15/43 | | | 5.125 | % | | | 2,000,000 | | | | 2,034,880 | | |
New Jersey Health Care Facilities Financing Authority
Revenue Bonds
St. Josephs Healthcare Systems
Series 2008
07/01/38 | | | 6.625 | % | | | 3,000,000 | | | | 3,245,850 | | |
New Jersey Higher Education Student Assistance Authority(a)
Revenue Bonds
Senior Series 2013-1B AMT
12/01/43 | | | 4.750 | % | | | 5,000,000 | | | | 5,013,850 | | |
Series 2013-1A AMT
12/01/21 | | | 5.000 | % | | | 1,500,000 | | | | 1,714,635 | | |
New Jersey Higher Education Student Assistance Authority(a)(g)
Revenue Bonds
Senior Series 2014-1A-1 AMT
12/01/22 | | | 5.000 | % | | | 1,000,000 | | | | 1,141,460 | | |
Tobacco Settlement Financing Corp.
Revenue Bonds
Capital Appreciation
Series 2007-1C(f)
06/01/41 | | | 0.000 | % | | | 7,500,000 | | | | 1,772,475 | | |
Total | | | | | | | 21,944,729 | | |
New York 2.3% | |
Broome County Industrial Development Agency
Revenue Bonds
Good Shepard Village
Series 2008A
07/01/40 | | | 6.875 | % | | | 3,500,000 | | | | 3,616,620 | | |
The accompanying Notes to Financial Statements are an integral part of this statement.
Annual Report 2014
14
Columbia High Yield Municipal Fund
Portfolio of Investments (continued)
May 31, 2014
Municipal Bonds (continued)
Issue
Description | | Coupon
Rate | | Principal
Amount ($) | |
Value ($) | |
Build NYC Resource Corp.
Revenue Bonds
Series 2013
International Leadership Charter School
07/01/43 | | | 6.000 | % | | | 4,330,000 | | | | 4,213,696 | | |
Nassau County Tobacco Settlement Corp.
Asset-Backed Revenue Bonds
Capital Appreciation
Third Series 2006D(f)
06/01/60 | | | 0.000 | % | | | 25,000,000 | | | | 121,750 | | |
New York State Dormitory Authority
Revenue Bonds
NYU Hospital Center
Series 2007B
07/01/37 | | | 5.625 | % | | | 2,000,000 | | | | 2,195,160 | | |
Series 2011A
07/01/40 | | | 6.000 | % | | | 1,000,000 | | | | 1,121,960 | | |
Port Authority of New York & New Jersey
Revenue Bonds
5th Installment-Special Project
Series 1996-4 AMT(a)
10/01/19 | | | 6.750 | % | | | 120,000 | | | | 116,801 | | |
Triborough Bridge & Tunnel Authority
Refunding Revenue Bonds
General
Series 2012B(f)
11/15/32 | | | 0.000 | % | | | 13,185,000 | | | | 6,363,477 | | |
Total | | | | | | | 17,749,464 | | |
North Carolina 0.9% | |
Durham Housing Authority
Revenue Bonds
Series 2005 AMT(a)(d)
02/01/38 | | | 5.650 | % | | | 3,139,165 | | | | 3,115,904 | | |
North Carolina Eastern Municipal Power Agency
Revenue Bonds
Series 1991A Escrowed to Maturity
01/01/18 | | | 6.500 | % | | | 3,320,000 | | | | 3,991,570 | | |
Total | | | | | | | 7,107,474 | | |
North Dakota 0.4% | |
City of Fargo
Revenue Bonds
Sanford
Series 2011
11/01/31 | | | 6.250 | % | | | 2,500,000 | | | | 2,958,275 | | |
Ohio 0.8% | |
County of Lucas
Improvement Refunding Revenue Bonds
Lutheran Homes
Series 2010A
11/01/45 | | | 7.000 | % | | | 5,000,000 | | | | 5,454,300 | | |
Municipal Bonds (continued)
Issue
Description | | Coupon
Rate | | Principal
Amount ($) | |
Value ($) | |
Summit County Port Authority
Revenue Bonds
Seville Projects
Series 2005A
05/15/25 | | | 5.100 | % | | | 375,000 | | | | 376,174 | | |
Total | | | | | | | 5,830,474 | | |
Oklahoma 0.3% | |
Oklahoma Development Finance Authority
Refunding Revenue Bonds
Inverness Village Community
Series 2012
01/01/32 | | | 6.000 | % | | | 2,000,000 | | | | 2,073,780 | | |
Oregon 1.0% | |
City of Forest Grove
Revenue Bonds
Oak Tree Foundation Project
Series 2007
03/01/37 | | | 5.500 | % | | | 2,900,000 | | | | 2,918,096 | | |
Cow Creek Band of Umpqua Tribe of Indians
Revenue Bonds
Series 2006C(b)(c)
10/01/26 | | | 5.625 | % | | | 1,700,000 | | | | 1,685,703 | | |
Warm Springs Reservation Confederated Tribe
Revenue Bonds
Pelton Round Butte Tribal
Series 2009B(c)
11/01/33 | | | 6.375 | % | | | 2,410,000 | | | | 2,625,068 | | |
Total | | | | | | | 7,228,867 | | |
Pennsylvania 2.6% | |
Dauphin County Industrial Development Authority
Revenue Bonds
Dauphin Consolidated Water Supply
Series 1992A AMT(a)
06/01/24 | | | 6.900 | % | | | 3,200,000 | | | | 4,017,824 | | |
Pennsylvania Economic Development Financing Authority
Revenue Bonds
Philadelphia Biosolids Facility
Series 2009
01/01/32 | | | 6.250 | % | | | 3,375,000 | | | | 3,624,109 | | |
Pennsylvania Higher Educational Facilities Authority
Revenue Bonds
Edinboro University Foundation
Series 2010
07/01/30 | | | 5.800 | % | | | 2,500,000 | | | | 2,627,775 | | |
Shippensburg University
Series 2011
10/01/43 | | | 6.250 | % | | | 2,000,000 | | | | 2,219,120 | | |
The accompanying Notes to Financial Statements are an integral part of this statement.
Annual Report 2014
15
Columbia High Yield Municipal Fund
Portfolio of Investments (continued)
May 31, 2014
Municipal Bonds (continued)
Issue
Description | | Coupon
Rate | | Principal
Amount ($) | |
Value ($) | |
Pennsylvania Housing Finance Agency
Revenue Bonds
Subordinated Series 2013-115A AMT(a)
10/01/33 | | | 4.200 | % | | | 5,000,000 | | | | 5,031,250 | | |
Pennsylvania Industrial Development Authority
Prerefunded 07/01/18 Revenue Bonds
Economic Development
Series 2008
07/01/23 | | | 5.500 | % | | | 295,000 | | | | 349,318 | | |
Philadelphia Authority for Industrial Development
Revenue Bonds
1st Philadelphia Preparatory Charter School
Series 2014-A
06/15/33 | | | 7.000 | % | | | 1,870,000 | | | | 1,950,691 | | |
Total | | | | | | | 19,820,087 | | |
Puerto Rico 3.3% | |
Commonwealth of Puerto Rico
Unlimited General Obligation Bonds
Series 2014A(c)
07/01/35 | | | 8.000 | % | | | 7,000,000 | | | | 6,247,360 | | |
Puerto Rico Commonwealth Aqueduct & Sewer Authority
Revenue Bonds
Senior Lien
Series 2012-A(c)
07/01/42 | | | 5.250 | % | | | 2,525,000 | | | | 1,868,449 | | |
Puerto Rico Electric Power Authority(c)
Refunding Revenue Bonds
Series 2010ZZ
07/01/25 | | | 5.250 | % | | | 2,000,000 | | | | 1,293,320 | | |
Revenue Bonds
Series 2013A
07/01/36 | | | 6.750 | % | | | 1,000,000 | | | | 691,230 | | |
07/01/43 | | | 7.000 | % | | | 6,570,000 | | | | 4,574,494 | | |
Puerto Rico Industrial Tourist Educational, Medical &
Environmental Control Facilities Financing Authority
Revenue Bonds
AES Puerto Rico Project
Series 2000 AMT(a)(c)
06/01/26 | | | 6.625 | % | | | 5,820,000 | | | | 5,540,582 | | |
Puerto Rico Sales Tax Financing Corp.(c)
Revenue Bonds
1st Subordinated Series 2010-A
08/01/39 | | | 5.375 | % | | | 5,155,000 | | | | 4,169,570 | | |
First Subordinated Series 2009B
08/01/44 | | | 6.500 | % | | | 1,000,000 | | | | 908,490 | | |
Total | | | | | | | 25,293,495 | | |
South Carolina 2.4% | |
Laurens County School District No. 055
Revenue Bonds
Series 2005
12/01/30 | | | 5.250 | % | | | 1,300,000 | | | | 1,343,251 | | |
Municipal Bonds (continued)
Issue
Description | | Coupon
Rate | | Principal
Amount ($) | |
Value ($) | |
South Carolina Jobs-Economic Development Authority
Refunding Revenue Bonds
1st Mortgage-Lutheran Homes
Series 2007
05/01/28 | | | 5.500 | % | | | 2,300,000 | | | | 2,352,693 | | |
1st Mortgage-Wesley Commons
Series 2006
10/01/36 | | | 5.300 | % | | | 3,000,000 | | | | 2,888,820 | | |
Revenue Bonds
Kershaw County Medical Center Project
Series 2008
09/15/38 | | | 6.000 | % | | | 5,050,000 | | | | 5,395,016 | | |
Series 2013
Lutheran Homes South Carolina Inc. Obligation Group
05/01/43 | | | 5.000 | % | | | 750,000 | | | | 719,002 | | |
05/01/48 | | | 5.125 | % | | | 1,500,000 | | | | 1,454,220 | | |
York Preparatory Academy Project
Series 2014-A
11/01/45 | | | 7.250 | % | | | 4,000,000 | | | | 4,175,000 | | |
Total | | | | | | | 18,328,002 | | |
South Dakota 0.2% | |
South Dakota Economic Development Finance Authority
Revenue Bonds
Pooled Loan Program-Davis Family
Series 2004-4A AMT(a)
04/01/29 | | | 6.000 | % | | | 1,400,000 | | | | 1,405,964 | | |
Tennessee 0.1% | |
Shelby County Health Educational & Housing Facilities Board
Prerefunded 12/01/16 Revenue Bonds
Germantown Village
Series 2006
12/01/34 | | | 6.250 | % | | | 475,000 | | | | 537,325 | | |
Texas 8.0% | |
Capital Area Cultural Education Facilities Finance Corp.
Revenue Bonds
Roman Catholic Diocese
Series 2005B(h)
04/01/45 | | | 6.125 | % | | | 5,000,000 | | | | 5,739,000 | | |
Central Texas Regional Mobility Authority
Revenue Bonds
Subordinated Lien
Series 2011
01/01/41 | | | 6.750 | % | | | 5,000,000 | | | | 5,726,750 | | |
City of Houston Airport System
Refunding Revenue Bonds
Special Facilities Continental
Series 2011A AMT(a)
07/15/38 | | | 6.625 | % | | | 4,000,000 | | | | 4,386,560 | | |
The accompanying Notes to Financial Statements are an integral part of this statement.
Annual Report 2014
16
Columbia High Yield Municipal Fund
Portfolio of Investments (continued)
May 31, 2014
Municipal Bonds (continued)
Issue
Description | | Coupon
Rate | | Principal
Amount ($) | |
Value ($) | |
Dallas County Flood Control District No. 1
Unlimited General Obligation Refunding Bonds
Series 2002
04/01/32 | | | 7.250 | % | | | 1,000,000 | | | | 1,002,940 | | |
Deaf Smith County Hospital District
Limited General Obligation Bonds
Series 2010A
03/01/40 | | | 6.500 | % | | | 4,000,000 | | | | 4,452,560 | | |
Gulf Coast Industrial Development Authority
Revenue Bonds
Citgo Petroleum Project
Series 1998 AMT(a)(h)
04/01/28 | | | 8.000 | % | | | 875,000 | | | | 876,234 | | |
HFDC of Central Texas, Inc.
Revenue Bonds
Series 2006A
11/01/36 | | | 5.750 | % | | | 5,000,000 | | | | 5,054,150 | | |
HFDC of Central Texas, Inc.(d)(e)
Revenue Bonds
Sears Tyler Methodist
Series 2009A
11/15/44 | | | 7.750 | % | | | 4,000,000 | | | | 2,499,920 | | |
La Vernia Higher Education Finance Corp.
Revenue Bonds
Kipp, Inc.
Series 2009A
08/15/29 | | | 6.000 | % | | | 1,000,000 | | | | 1,106,490 | | |
08/15/39 | | | 6.250 | % | | | 1,500,000 | | | | 1,672,830 | | |
Mission Economic Development Corp
Revenue Bonds
Dallas Clean Energy McCommas
Series 2011 AMT(a)
12/01/24 | | | 6.875 | % | | | 5,000,000 | | | | 5,245,800 | | |
Pharr Higher Education Finance Authority
Revenue Bonds
Idea Public Schools
Series 2009A
08/15/39 | | | 6.500 | % | | | 3,000,000 | | | | 3,371,730 | | |
Red River Health Facilities Development Corp.
Revenue Bonds
MRC Crossings Project
Series 2014-A
11/15/49 | | | 8.000 | % | | | 2,000,000 | | | | 2,087,680 | | |
Red River Health Facilities Development Corp.(d)
Revenue Bonds
Series 2013
Sears Methodist Retirement System Obligation Group
11/15/38 | | | 5.450 | % | | | 1,300,000 | | | | 945,321 | | |
11/15/46 | | | 6.050 | % | | | 589,000 | | | | 455,562 | | |
11/15/46 | | | 6.050 | % | | | 101,000 | | | | 78,118 | | |
11/15/49 | | | 6.150 | % | | | 800,000 | | | | 621,144 | | |
05/09/53 | | | 6.250 | % | | | 52,000 | | | | 40,414 | | |
Municipal Bonds (continued)
Issue
Description | | Coupon
Rate | | Principal
Amount ($) | |
Value ($) | |
Sanger Industrial Development Corp.
Revenue Bonds
Texas Pellets Project
Series 2012B AMT(a)
07/01/38 | | | 8.000 | % | | | 5,000,000 | | | | 5,326,500 | | |
Tarrant County Cultural Education Facilities Finance Corp.
Revenue Bonds
Air Force Village
Series 2009
11/15/44 | | | 6.375 | % | | | 4,250,000 | | | | 4,503,173 | | |
CC Young Memorial Home
Series 2009A
02/15/38 | | | 8.000 | % | | | 4,000,000 | | | | 4,440,360 | | |
Texas Municipal Gas Acquisition & Supply Corp. III
Revenue Bonds
Series 2012
12/15/32 | | | 5.000 | % | | | 1,250,000 | | | | 1,301,988 | | |
Total | | | | | | | 60,935,224 | | |
Virgin Islands 0.9% | |
Virgin Islands Public Finance Authority
Revenue Bonds
Matching Fund Loan Notes
Series 2012-A(c)
10/01/32 | | | 5.000 | % | | | 3,785,000 | | | | 4,080,344 | | |
Virgin Islands Water & Power Authority
Refunding Revenue Bonds
Series 2012A(c)
07/01/21 | | | 4.000 | % | | | 3,000,000 | | | | 3,041,640 | | |
Total | | | | | | | 7,121,984 | | |
Virginia 2.2% | |
City of Chesapeake Expressway Toll Road
Refunding Revenue Bonds
Transportation System
Series 2012(h)
07/15/40 | | | 0.000 | % | | | 7,530,000 | | | | 4,404,448 | | |
Mosaic District Community Development Authority
Special Assessment Bonds
Series 2011A
03/01/36 | | | 6.875 | % | | | 2,500,000 | | | | 2,872,025 | | |
Tobacco Settlement Financing Corp.
Revenue Bonds
Senior Series 2007-B1
06/01/47 | | | 5.000 | % | | | 10,000,000 | | | | 7,107,300 | | |
Virginia Small Business Financing Authority
Prerefunded 07/01/14 Revenue Bonds
Hampton Roads Proton
Series 2009B
07/01/19 | | | 8.000 | % | | | 2,335,000 | | | | 2,397,111 | | |
Total | | | | | | | 16,780,884 | | |
The accompanying Notes to Financial Statements are an integral part of this statement.
Annual Report 2014
17
Columbia High Yield Municipal Fund
Portfolio of Investments (continued)
May 31, 2014
Municipal Bonds (continued)
Issue
Description | | Coupon
Rate | | Principal
Amount ($) | |
Value ($) | |
Washington 1.6% | |
Greater Wenatchee Regional Events Center Public
Facilities District
Revenue Bonds
Series 2012-A
09/01/42 | | | 5.500 | % | | | 2,150,000 | | | | 2,170,382 | | |
Port of Seattle Industrial Development Corp.
Refunding Revenue Bonds
Special Facilities Delta Air Lines
Series 2012 AMT(a)
04/01/30 | | | 5.000 | % | | | 2,500,000 | | | | 2,506,750 | | |
Tacoma Consolidated Local Improvement Districts
Special Assessment Bonds
Series 2013
No. 65
04/01/43 | | | 5.750 | % | | | 2,500,000 | | | | 2,510,450 | | |
Washington State Housing Finance Commission
Refunding Revenue Bonds
Nonprofit Housing Revenue-Mirabella
Series 2012
10/01/47 | | | 6.750 | % | | | 5,000,000 | | | | 5,091,950 | | |
Total | | | | | | | 12,279,532 | | |
Wisconsin 1.0% | |
Wisconsin Health & Educational Facilities Authority
Revenue Bonds
Medical College of Wisconsin
Series 2008A
12/01/35 | | | 5.250 | % | | | 5,000,000 | | | | 5,293,200 | | |
St. John's Community, Inc.
Series 2009A
09/15/39 | | | 7.625 | % | | | 1,750,000 | | | | 2,027,637 | | |
Total | | | | | | | 7,320,837 | | |
Total Municipal Bonds
(Cost: $654,265,290) | | | | | | | 687,254,456 | | |
Municipal Preferred Stocks 0.1%
Maryland 0.1% | |
Munimae TE Bond Subsidiary LLC
AMT(a)(b)(d)
06/30/49 | | | 5.800 | % | | | 1,000,000 | | | | 945,060 | | |
Total Municipal Preferred Stocks
(Cost: $1,000,000) | | | | | | | 945,060 | | |
Municipal Short Term 0.5%
Issue
Description | | Effective
Yield | | Principal
Amount ($) | |
Value ($) | |
New York 0.5% | |
Town of Ramapo
Unlimited General Obligation Notes
BAN Series 2014-B
05/27/15 | | | 4.000 | % | | | 3,865,000 | | | | 3,921,158 | | |
Total Municipal Short Term
(Cost: $3,909,916) | | | | | | | 3,921,158 | | |
Money Market Funds 8.4%
| | | Shares | | Value ($) | |
Dreyfus Tax-Exempt Cash Management Fund,
0.000%(i) | | | 23,184,525 | | | | 23,184,525 | | |
JPMorgan Municipal Money Market Fund,
0.010%(i) | | | 40,861,962 | | | | 40,861,962 | | |
Total Money Market Funds
(Cost: $64,046,487) | | | | | 64,046,487 | | |
Total Investments
(Cost: $723,221,693) | | | | | 756,167,161 | | |
Other Assets & Liabilities, Net | | | | | 4,656,584 | | |
Net Assets | | | | | 760,823,745 | | |
Notes to Portfolio of Investments
(a) Income from this security may be subject to alternative minimum tax.
(b) Security exempt from registration pursuant to Rule 144A under the Securities Act of 1933. This security may be resold in transactions exempt from registration, normally to qualified institutional buyers. At May 31, 2014, the value of these securities amounted to $20,269,516 or 2.66% of net assets.
(c) Municipal obligations include debt obligations issued by or on behalf of territories, possessions, or sovereign nations within the territorial boundaries of the United States. At May 31, 2014, the value of these securities amounted to $51,329,417 or 6.75% of net assets.
The accompanying Notes to Financial Statements are an integral part of this statement.
Annual Report 2014
18
Columbia High Yield Municipal Fund
Portfolio of Investments (continued)
May 31, 2014
Notes to Portfolio of Investments (continued)
(d) Identifies issues considered by the Investment Manager to be illiquid as to their marketability. The aggregate value of such securities at May 31, 2014 was $23,122,794, representing 3.04% of net assets. Information concerning such security holdings at May 31, 2014 is as follows:
Security Description | | Acquisition Dates | | Cost ($) | |
Broward County Housing Finance Authority
Revenue Bonds
Chaves Lake Apartments Project
Series 2000A AMT
07/01/40 7.500% | | 03/07/00 - 05/21/07 | | | 1,496,952 | | |
Cabazon Band Mission Indians
Revenue Bonds
Series 2004
10/01/13 13.000% | | 05/14/10 | | | 370,523 | | |
Cabazon Band Mission Indians
Revenue Bonds
Series 2004
10/01/15 8.375% | | 10/04/04 - 05/14/10 | | | 510,005 | | |
Cabazon Band Mission Indians
Revenue Bonds
Series 2004
10/01/19 8.750% | | 10/04/04 - 05/14/10 | | | 2,498,267 | | |
Cabazon Band Mission Indians
Revenue Bonds
Series 2010
10/01/20 8.375% | | 05/14/10 | | | 1,420,000 | | |
California Municipal Finance Authority
Revenue Bonds
UTS Renewable Energy - Waste Water
Series 2011 AMT
12/01/32 7.500% | | 12/22/11 | | | 1,885,000 | | |
Capital Trust Agency, Inc.
Revenue Bonds
Atlantic Housing Foundation
Subordinated Series 2008B
07/15/32 7.000% | | 07/23/08 | | | 1,370,000 | | |
Durham Housing Authority
Revenue Bonds
Series 2005 AMT
02/01/38 5.650% | | 12/18/06 | | | 3,139,165 | | |
HFDC of Central Texas, Inc.
Revenue Bonds
Sears Tyler Methodist
Series 2009A
11/15/44 7.750% | | 10/29/09 | | | 3,885,957 | | |
Illinois Finance Authority
Revenue Bonds
Leafs Hockey Club Project
Series 2007A
03/01/37 6.000% | | 02/14/07 | | | 972,870 | | |
Massachusetts Development Finance Agency
Revenue Bonds
Health Care Facility-Alliance
Series 1999A
07/01/32 7.100% | | 09/02/99 | | | 1,924,984 | | |
The accompanying Notes to Financial Statements are an integral part of this statement.
Annual Report 2014
19
Columbia High Yield Municipal Fund
Portfolio of Investments (continued)
May 31, 2014
Notes to Portfolio of Investments (continued)
Security Description | | Acquisition Dates | | Cost ($) | |
Michigan Strategic Fund
Refunding Revenue Bonds
Michigan Sugar Co. - Carollton
Series 1998C AMT
11/01/25 6.550% | | 11/24/98 | | | 1,500,000 | | |
Middle Village Community Development District
Special Assessment Bonds
Series 2004A
05/01/35 6.000% | | 01/21/04 | | | 1,903,759 | | |
Middlesex County Improvement Authority
Revenue Bonds
Heldrich Center Hotel
Series 2005C
01/01/37 8.750% | | 06/28/06 | | | 1,228,125 | | |
Middlesex County Improvement Authority
Subordinated Revenue Bonds
Heldrich Center Hotel
Series 2005B
01/01/25 6.125% | | 10/01/09 | | | 508,750 | | |
Middlesex County Improvement Authority
Subordinated Revenue Bonds
Heldrich Center Hotel
Series 2005B
01/01/37 6.250% | | 03/18/05 - 10/01/09 | | | 4,614,875 | | |
Munimae TE Bond Subsidiary LLC
AMT
06/30/49 5.800% | | 10/14/04 | | | 1,000,000 | | |
Resolution Trust Corp.
Pass-Through Certificates
Series 1993A
12/01/16 8.500% | | 11/12/93 | | | 457,753 | | |
Rankin County Five Lakes Utility District
Series 1994
07/15/37 7.000% | | 10/02/07 | | | 240,000 | | |
Red River Health Facilities Development Corp.
Revenue Bonds
Series 2013
Sears Methodist Retirement System Obligation Group
11/15/38 5.540% | | 09/03/98 - 11/06/98 | | | 1,283,609 | | |
Red River Health Facilities Development Corp.
Revenue Bonds
Series 2013
Sears Methodist Retirement System Obligation Group
11/15/46 6.050% | | 04/10/03 - 09/21/04 | | | 581,959 | | |
Red River Health Facilities Development Corp.
Revenue Bonds
Series 2013
Sears Methodist Retirement System Obligation Group
11/15/46 6.050% | | 04/10/03 - 05/08/13 | | | 104,319 | | |
Red River Health Facilities Development Corp.
Revenue Bonds
Series 2013
Sears Methodist Retirement System Obligation Group
11/15/49 6.150% | | 05/08/13 | | | 800,000 | | |
The accompanying Notes to Financial Statements are an integral part of this statement.
Annual Report 2014
20
Columbia High Yield Municipal Fund
Portfolio of Investments (continued)
May 31, 2014
Notes to Portfolio of Investments (continued)
Security Description | | Acquisition Dates | | Cost ($) | |
Red River Health Facilities Development Corp.
Revenue Bonds
Series 2013
Sears Methodist Retirement System Obligation Group
05/09/53 6.250% | | 05/08/13 | | | 52,000 | | |
Westridge Community Development District
Special Assessment Bonds
Series 2005
05/01/37 5.800% | | 12/22/05 | | | 2,650,000 | | |
City of Wilmington
Revenue Bonds
Housing-Electra Arms Senior Associates Project
Series 1998 AMT
06/01/28 6.250% | | 10/08/98 | | | 690,342 | | |
(e) Represents securities that have defaulted on payment of interest. The Fund has stopped accruing interest on these securities. At May 31, 2014, the value of these securities amounted to $6,442,769, which represents 0.85% of net assets.
(f) Zero coupon bond.
(g) Represents a security purchased on a when-issued or delayed delivery basis.
(h) Variable rate security.
(i) The rate shown is the seven-day current annualized yield at May 31, 2014.
Abbreviation Legend
AGM Assured Guaranty Municipal Corporation
AMBAC Ambac Assurance Corporation
AMT Alternative Minimum Tax
BAN Bond Anticipation Note
FNMA Federal National Mortgage Association
GNMA Government National Mortgage Association
NPFGC National Public Finance Guarantee Corporation
The accompanying Notes to Financial Statements are an integral part of this statement.
Annual Report 2014
21
Columbia High Yield Municipal Fund
Portfolio of Investments (continued)
May 31, 2014
Fair Value Measurements
Generally accepted accounting principles (GAAP) require disclosure regarding the inputs and valuation techniques used to measure fair value and any changes in valuation inputs or techniques. In addition, investments shall be disclosed by major category.
The Fund categorizes its fair value measurements according to a three-level hierarchy that maximizes the use of observable inputs and minimizes the use of unobservable inputs by prioritizing that the most observable input be used when available. Observable inputs are those that market participants would use in pricing an investment based on market data obtained from sources independent of the reporting entity. Unobservable inputs are those that reflect the Fund's assumptions about the information market participants would use in pricing an investment. An investment's level within the fair value hierarchy is based on the lowest level of any input that is deemed significant to the asset or liability's fair value measurement. The input levels are not necessarily an indication of the risk or liquidity associated with investments at that level. For example, certain U.S. government securities are generally high quality and liquid, however, they are reflected as Level 2 because the inputs used to determine fair value may not always be quoted prices in an active market.
Fair value inputs are summarized in the three broad levels listed below:
> Level 1 — Valuations based on quoted prices for investments in active markets that the Fund has the ability to access at the measurement date (including NAV for open-end mutual funds). Valuation adjustments are not applied to Level 1 investments.
> Level 2 — Valuations based on other significant observable inputs (including quoted prices for similar securities, interest rates, prepayment speeds, credit risks, etc.).
> Level 3 — Valuations based on significant unobservable inputs (including the Fund's own assumptions and judgment in determining the fair value of investments).
Inputs that are used in determining fair value of an investment may include price information, credit data, volatility statistics, and other factors. These inputs can be either observable or unobservable. The availability of observable inputs can vary between investments, and is affected by various factors such as the type of investment, and the volume and level of activity for that investment or similar investments in the marketplace. The inputs will be considered by the Investment Manager, along with any other relevant factors in the calculation of an investment's fair value. The Fund uses prices and inputs that are current as of the measurement date, which may include periods of market dislocations. During these periods, the availability of prices and inputs may be reduced for many investments. This condition could cause an investment to be reclassified between the various levels within the hierarchy.
Investments falling into the Level 3 category are primarily supported by quoted prices from brokers and dealers participating in the market for those investments. However, these may be classified as Level 3 investments due to lack of market transparency and corroboration to support these quoted prices. Additionally, valuation models may be used as the pricing source for any remaining investments classified as Level 3. These models may rely on one or more significant unobservable inputs and/or significant assumptions by the Investment Manager. Inputs used in valuations may include, but are not limited to, financial statement analysis, capital account balances, discount rates and estimated cash flows, and comparable company data.
Under the direction of the Fund's Board of Trustees (the Board), the Investment Manager's Valuation Committee (the Committee) is responsible for overseeing the valuation procedures approved by the Board. The Committee consists of voting and non-voting members from various groups within the Investment Manager's organization, including operations and accounting, trading and investments, compliance, risk management and legal.
The Committee meets at least monthly to review and approve valuation matters, which may include a description of specific valuation determinations, data regarding pricing information received from approved pricing vendors and brokers and the results of Board-approved valuation control policies and procedures (the Policies). The Policies address, among other things, instances when market quotations are or are not readily available, including recommendations of third party pricing vendors and a determination of appropriate pricing methodologies; events that require specific valuation determinations and assessment of fair value techniques; securities with a potential for stale pricing, including those that are illiquid, restricted, or in default; and the effectiveness of third party pricing vendors, including periodic reviews of vendors. The Committee meets more frequently, as needed, to discuss additional valuation matters, which may include the need to review back-testing results, review time-sensitive information or approve related valuation actions. The Committee reports to the Board, with members of the Committee meeting with the Board at each of its regularly scheduled meetings to discuss valuation matters and actions during the period, similar to those described earlier.
For investments categorized as Level 3, the Committee monitors information similar to that described above, which may include: (i) data specific to the issuer or comparable issuers, (ii) general market or specific sector news and (iii) quoted prices and specific or similar security transactions. The Committee considers this data and any changes from prior periods in order to assess the reasonableness of observable and unobservable inputs, any assumptions or internal models used to value those securities and changes in fair value. This data is also used to corroborate, when available, information received from approved pricing vendors and brokers. Various factors impact the frequency of monitoring this information (which may occur as often as daily). However, the Committee may determine that changes to inputs, assumptions and models are not required as a result of the monitoring procedures performed.
The accompanying Notes to Financial Statements are an integral part of this statement.
Annual Report 2014
22
Columbia High Yield Municipal Fund
Portfolio of Investments (continued)
May 31, 2014
Fair Value Measurements (continued)
The following table is a summary of the inputs used to value the Fund's investments at May 31, 2014:
Description | | Level 1
Quoted Prices in Active
Markets for Identical
Assets ($) | |
Level 2
Other Significant
Observable Inputs ($) | |
Level 3
Significant
Unobservable Inputs ($) | |
Total ($) | |
Bonds | |
Municipal Bonds | | | — | | | | 687,254,456 | | | | — | | | | 687,254,456 | | |
Total Bonds | | | — | | | | 687,254,456 | | | | — | | | | 687,254,456 | | |
Equity Securities | |
Municipal Preferred Stocks | | | — | | | | 945,060 | | | | — | | | | 945,060 | | |
Total Equity Securities | | | — | | | | 945,060 | | | | — | | | | 945,060 | | |
Short-Term Securities | |
Municipal Short Term | | | — | | | | 3,921,158 | | | | — | | | | 3,921,158 | | |
Total Short-Term Securities | | | — | | | | 3,921,158 | | | | — | | | | 3,921,158 | | |
Mutual Funds | |
Money Market Funds | | | 64,046,487 | | | | — | | | | — | | | | 64,046,487 | | |
Total Mutual Funds | | | 64,046,487 | | | | — | | | | — | | | | 64,046,487 | | |
Total | | | 64,046,487 | | | | 692,120,674 | | | | — | | | | 756,167,161 | | |
See the Portfolio of Investments for all investment classifications not indicated in the table.
The Fund's assets assigned to the Level 2 input category are generally valued using the market approach, in which a security's value is determined through reference to prices and information from market transactions for similar or identical assets.
There were no transfers of financial assets between levels during the period.
The accompanying Notes to Financial Statements are an integral part of this statement.
Annual Report 2014
23
Columbia High Yield Municipal Fund
Statement of Assets and Liabilities
May 31, 2014
Assets | |
Investments, at value | |
(identified cost $723,221,693) | | $ | 756,167,161 | | |
Receivable for: | |
Investments sold | | | 426,864 | | |
Capital shares sold | | | 1,805,738 | | |
Dividends | | | 1 | | |
Interest | | | 11,959,249 | | |
Expense reimbursement due from Investment Manager | | | 1,881 | | |
Prepaid expenses | | | 1,099 | | |
Trustees' deferred compensation plan | | | 73,904 | | |
Total assets | | | 770,435,897 | | |
Liabilities | |
Payable for: | |
Investments purchased on a delayed delivery basis | | | 5,609,245 | | |
Capital shares purchased | | | 792,103 | | |
Dividend distributions to shareholders | | | 2,964,241 | | |
Investment management fees | | | 9,782 | | |
Distribution and/or service fees | | | 1,125 | | |
Transfer agent fees | | | 109,896 | | |
Administration fees | | | 1,421 | | |
Compensation of board members | | | 365 | | |
Chief compliance officer expenses | | | 63 | | |
Other expenses | | | 49,267 | | |
Trustees' deferred compensation plan | | | 73,904 | | |
Other liabilities | | | 740 | | |
Total liabilities | | | 9,612,152 | | |
Net assets applicable to outstanding capital stock | | $ | 760,823,745 | | |
Represented by | |
Paid-in capital | | $ | 808,869,827 | | |
Undistributed net investment income | | | 5,650,445 | | |
Accumulated net realized loss | | | (86,641,995 | ) | |
Unrealized appreciation (depreciation) on: | |
Investments | | | 32,945,468 | | |
Total — representing net assets applicable to outstanding capital stock | | $ | 760,823,745 | | |
The accompanying Notes to Financial Statements are an integral part of this statement.
Annual Report 2014
24
Columbia High Yield Municipal Fund
Statement of Assets and Liabilities (continued)
May 31, 2014
Class A | |
Net assets | | $ | 123,889,897 | | |
Shares outstanding | | | 11,729,729 | | |
Net asset value per share | | $ | 10.56 | | |
Maximum offering price per share(a) | | $ | 11.09 | | |
Class B | |
Net assets | | $ | 773,846 | | |
Shares outstanding | | | 73,271 | | |
Net asset value per share | | $ | 10.56 | | |
Class C | |
Net assets | | $ | 19,946,326 | | |
Shares outstanding | | | 1,888,708 | | |
Net asset value per share | | $ | 10.56 | | |
Class R4 | |
Net assets | | $ | 2,475,651 | | |
Shares outstanding | | | 234,148 | | |
Net asset value per share | | $ | 10.57 | | |
Class R5 | |
Net assets | | $ | 7,807,292 | | |
Shares outstanding | | | 740,014 | | |
Net asset value per share | | $ | 10.55 | | |
Class Z | |
Net assets | | $ | 605,930,733 | | |
Shares outstanding | | | 57,366,024 | | |
Net asset value per share | | $ | 10.56 | | |
(a) The maximum offering price per share is calculated by dividing the net asset value per share by 1.0 minus the maximum sales charge of 4.75%.
The accompanying Notes to Financial Statements are an integral part of this statement.
Annual Report 2014
25
Columbia High Yield Municipal Fund
Statement of Operations
Year Ended May 31, 2014
Net investment income | |
Income: | |
Dividends | | $ | 681 | | |
Interest | | | 43,175,660 | | |
Total income | | | 43,176,341 | | |
Expenses: | |
Investment management fees | | | 3,539,495 | | |
Distribution and/or service fees | |
Class A | | | 173,182 | | |
Class B | | | 8,561 | | |
Class C | | | 127,046 | | |
Transfer agent fees | |
Class A | | | 152,927 | | |
Class B | | | 1,612 | | |
Class C | | | 23,652 | | |
Class R4 | | | 1,030 | | |
Class R5 | | | 1,513 | | |
Class Z | | | 1,158,417 | | |
Administration fees | | | 514,436 | | |
Compensation of board members | | | 41,444 | | |
Custodian fees | | | 8,004 | | |
Printing and postage fees | | | 45,559 | | |
Registration fees | | | 104,888 | | |
Professional fees | | | 48,556 | | |
Chief compliance officer expenses | | | 329 | | |
Other | | | 23,343 | | |
Total expenses | | | 5,973,994 | | |
Fees waived or expenses reimbursed by Investment Manager and its affiliates | | | (660,295 | ) | |
Fees waived by Distributor — Class C | | | (20,060 | ) | |
Expense reductions | | | (860 | ) | |
Total net expenses | | | 5,292,779 | | |
Net investment income | | | 37,883,562 | | |
Realized and unrealized gain (loss) — net | |
Net realized gain (loss) on: | |
Investments | | | (2,477,285 | ) | |
Net realized loss | | | (2,477,285 | ) | |
Net change in unrealized appreciation (depreciation) on: | |
Investments | | | (23,241,220 | ) | |
Net change in unrealized appreciation (depreciation) | | | (23,241,220 | ) | |
Net realized and unrealized loss | | | (25,718,505 | ) | |
Net increase in net assets resulting from operations | | $ | 12,165,057 | | |
The accompanying Notes to Financial Statements are an integral part of this statement.
Annual Report 2014
26
Columbia High Yield Municipal Fund
Statement of Changes in Net Assets
| | | Year Ended
May 31,
2014 | | Year Ended
May 31,
2013(a)(b) | |
Operations | |
Net investment income | | $ | 37,883,562 | | | $ | 42,763,112 | | |
Net realized loss | | | (2,477,285 | ) | | | (8,077,988 | ) | |
Net change in unrealized appreciation (depreciation) | | | (23,241,220 | ) | | | 28,156,737 | | |
Net increase in net assets resulting from operations | | | 12,165,057 | | | | 62,841,861 | | |
Distributions to shareholders | |
Net investment income | |
Class A | | | (4,171,006 | ) | | | (3,866,763 | ) | |
Class B | | | (36,685 | ) | | | (57,965 | ) | |
Class C | | | (563,275 | ) | | | (482,603 | ) | |
Class R4 | | | (29,622 | ) | | | (22 | ) | |
Class R5 | | | (156,782 | ) | | | (2,139 | ) | |
Class Z | | | (32,518,163 | ) | | | (37,468,261 | ) | |
Total distributions to shareholders | | | (37,475,533 | ) | | | (41,877,753 | ) | |
Increase (decrease) in net assets from capital stock activity | | | (171,033,114 | ) | | | (2,043,493 | ) | |
Total increase (decrease) in net assets | | | (196,343,590 | ) | | | 18,920,615 | | |
Net assets at beginning of year | | | 957,167,335 | | | | 938,246,720 | | |
Net assets at end of year | | $ | 760,823,745 | | | $ | 957,167,335 | | |
Undistributed net investment income | | $ | 5,650,445 | | | $ | 5,111,117 | | |
(a) Class R4 shares are for the period from March 19, 2013 (commencement of operations) to May 31, 2013.
(b) Class R5 shares are for the period from November 8, 2012 (commencement of operations) to May 31, 2013.
The accompanying Notes to Financial Statements are an integral part of this statement.
Annual Report 2014
27
Columbia High Yield Municipal Fund
Statement of Changes in Net Assets (continued)
| | | Year Ended May 31, 2014 | | Year Ended May 31, 2013(a)(b) | |
| | | Shares | | Dollars ($) | | Shares | | Dollars ($) | |
Capital stock activity | |
Class A shares | |
Subscriptions(c) | | | 6,654,787 | | | | 67,814,519 | | | | 4,409,463 | | | | 47,154,347 | | |
Distributions reinvested | | | 351,338 | | | | 3,562,259 | | | | 293,226 | | | | 3,145,455 | | |
Redemptions | | | (3,802,902 | ) | | | (38,367,717 | ) | | | (5,083,754 | ) | | | (54,363,465 | ) | |
Net increase (decrease) | | | 3,203,223 | | | | 33,009,061 | | | | (381,065 | ) | | | (4,063,663 | ) | |
Class B shares | |
Subscriptions | | | 18,382 | | | | 190,540 | | | | 49,824 | | | | 534,204 | | |
Distributions reinvested | | | 1,777 | | | | 17,952 | | | | 2,702 | | | | 28,972 | | |
Redemptions(c) | | | (60,422 | ) | | | (613,729 | ) | | | (143,124 | ) | | | (1,535,572 | ) | |
Net decrease | | | (40,263 | ) | | | (405,237 | ) | | | (90,598 | ) | | | (972,396 | ) | |
Class C shares | |
Subscriptions | | | 1,038,864 | | | | 10,653,232 | | | | 417,007 | | | | 4,468,619 | | |
Distributions reinvested | | | 42,477 | | | | 430,416 | | | | 30,724 | | | | 329,681 | | |
Redemptions | | | (562,243 | ) | | | (5,652,430 | ) | | | (272,023 | ) | | | (2,913,697 | ) | |
Net increase | | | 519,098 | | | | 5,431,218 | | | | 175,708 | | | | 1,884,603 | | |
Class R4 shares | |
Subscriptions | | | 238,941 | | | | 2,450,088 | | | | 232 | | | | 2,500 | | |
Distributions reinvested | | | 2,847 | | | | 29,436 | | | | 1 | | | | 9 | | |
Redemptions | | | (7,873 | ) | | | (81,197 | ) | | | — | | | | — | | |
Net increase | | | 233,915 | | | | 2,398,327 | | | | 233 | | | | 2,509 | | |
Class R5 shares | |
Subscriptions | | | 820,602 | | | | 8,314,135 | | | | 47,345 | | | | 512,734 | | |
Distributions reinvested | | | 15,290 | | | | 156,314 | | | | 195 | | | | 2,088 | | |
Redemptions | | | (143,418 | ) | | | (1,458,967 | ) | | | — | | | | — | | |
Net increase | | | 692,474 | | | | 7,011,482 | | | | 47,540 | | | | 514,822 | | |
Class Z shares | |
Subscriptions | | | 9,591,736 | | | | 97,338,786 | | | | 21,122,398 | | | | 226,557,842 | | |
Distributions reinvested | | | 472,218 | | | | 4,776,139 | | | | 531,718 | | | | 5,704,086 | | |
Redemptions | | | (31,901,761 | ) | | | (320,592,890 | ) | | | (21,564,469 | ) | | | (231,671,296 | ) | |
Net increase (decrease) | | | (21,837,807 | ) | | | (218,477,965 | ) | | | 89,647 | | | | 590,632 | | |
Total net decrease | | | (17,229,360 | ) | | | (171,033,114 | ) | | | (158,535 | ) | | | (2,043,493 | ) | |
(a) Class R4 shares are for the period from March 19, 2013 (commencement of operations) to May 31, 2013.
(b) Class R5 shares are for the period from November 8, 2012 (commencement of operations) to May 31, 2013.
(c) Includes conversions of Class B shares to Class A shares, if any.
The accompanying Notes to Financial Statements are an integral part of this statement.
Annual Report 2014
28
Columbia High Yield Municipal Fund
The following tables are intended to help you understand the Fund's financial performance. Certain information reflects financial results for a single share of a class held for the periods shown. Per share net investment income (loss) amounts are calculated based on average shares outstanding during the period. Total return assumes reinvestment of all dividends and distributions, if any. Total return does not reflect payment of sales charges, if any, and is not annualized for periods of less than one year.
| | | Year Ended May 31, | | Year Ended June 30, | |
Class A | | 2014 | | 2013 | | 2012(a) | | 2011 | | 2010 | | 2009 | |
Per share data | |
Net asset value, beginning of period | | $ | 10.72 | | | $ | 10.49 | | | $ | 9.60 | | | $ | 9.77 | | | $ | 8.79 | | | $ | 10.32 | | |
Income from investment operations: | |
Net investment income | | | 0.49 | | | | 0.45 | | | | 0.45 | | | | 0.53 | | | | 0.52 | | | | 0.53 | | |
Net realized and unrealized gain (loss) | | | (0.16 | ) | | | 0.22 | | | | 0.88 | | | | (0.19 | ) | | | 0.97 | | | | (1.53 | ) | |
Total from investment operations | | | 0.33 | | | | 0.67 | | | | 1.33 | | | | 0.34 | | | | 1.49 | | | | (1.00 | ) | |
Less distributions to shareholders: | |
Net investment income | | | (0.49 | ) | | | (0.44 | ) | | | (0.44 | ) | | | (0.51 | ) | | | (0.51 | ) | | | (0.53 | ) | |
Total distributions to shareholders | | | (0.49 | ) | | | (0.44 | ) | | | (0.44 | ) | | | (0.51 | ) | | | (0.51 | ) | | | (0.53 | ) | |
Net asset value, end of period | | $ | 10.56 | | | $ | 10.72 | | | $ | 10.49 | | | $ | 9.60 | | | $ | 9.77 | | | $ | 8.79 | | |
Total return | | | 3.35 | % | | | 6.44 | % | | | 14.19 | % | | | 3.63 | % | | | 17.25 | % | | | (9.60 | %) | |
Ratios to average net assets(b) | |
Total gross expenses | | | 0.95 | % | | | 0.96 | % | | | 0.96 | %(c) | | | 0.91 | % | | | 0.85 | % | | | 0.90 | % | |
Total net expenses(d) | | | 0.86 | %(e) | | | 0.85 | %(e) | | | 0.80 | %(c)(e) | | | 0.85 | %(e) | | | 0.85 | %(e) | | | 0.90 | %(e) | |
Net investment income | | | 4.87 | % | | | 4.17 | % | | | 4.92 | %(c) | | | 5.46 | % | | | 5.44 | % | | | 5.90 | % | |
Supplemental data | |
Net assets, end of period (in thousands) | | $ | 123,890 | | | $ | 91,422 | | | $ | 93,456 | | | $ | 63,669 | | | $ | 80,691 | | | $ | 59,189 | | |
Portfolio turnover | | | 12 | % | | | 9 | % | | | 9 | % | | | 23 | % | | | 18 | % | | | 26 | % | |
Notes to Financial Highlights
(a) For the period from July 1, 2011 to May 31, 2012. During the period, the Fund's fiscal year end was changed from June 30 to May 31.
(b) In addition to the fees and expenses which the Fund bears directly, the Fund indirectly bears a pro rata share of the fees and expenses of the acquired funds in which it invests. Such indirect expenses are not included in the reported expense ratios.
(c) Annualized.
(d) Total net expenses include the impact of certain waivers/reimbursements made by the Investment Manager and certain of its affiliates, if applicable.
(e) The benefits derived from expense reductions had an impact of less than 0.01%.
The accompanying Notes to Financial Statements are an integral part of this statement.
Annual Report 2014
29
Columbia High Yield Municipal Fund
Financial Highlights (continued)
| | | Year Ended May 31, | | Year Ended June 30, | |
Class B | | 2014 | | 2013 | | 2012(a) | | 2011 | | 2010 | | 2009 | |
Per share data | |
Net asset value, beginning of period | | $ | 10.72 | | | $ | 10.49 | | | $ | 9.60 | | | $ | 9.77 | | | $ | 8.79 | | | $ | 10.32 | | |
Income from investment operations: | |
Net investment income | | | 0.42 | | | | 0.37 | | | | 0.39 | | | | 0.46 | | | | 0.45 | | | | 0.46 | | |
Net realized and unrealized gain (loss) | | | (0.17 | ) | | | 0.22 | | | | 0.87 | | | | (0.19 | ) | | | 0.97 | | | | (1.53 | ) | |
Total from investment operations | | | 0.25 | | | | 0.59 | | | | 1.26 | | | | 0.27 | | | | 1.42 | | | | (1.07 | ) | |
Less distributions to shareholders: | |
Net investment income | | | (0.41 | ) | | | (0.36 | ) | | | (0.37 | ) | | | (0.44 | ) | | | (0.44 | ) | | | (0.46 | ) | |
Total distributions to shareholders | | | (0.41 | ) | | | (0.36 | ) | | | (0.37 | ) | | | (0.44 | ) | | | (0.44 | ) | | | (0.46 | ) | |
Net asset value, end of period | | $ | 10.56 | | | $ | 10.72 | | | $ | 10.49 | | | $ | 9.60 | | | $ | 9.77 | | | $ | 8.79 | | |
Total return | | | 2.59 | % | | | 5.65 | % | | | 13.41 | % | | | 2.85 | % | | | 16.39 | % | | | (10.27 | %) | |
Ratios to average net assets(b) | |
Total gross expenses | | | 1.71 | % | | | 1.70 | % | | | 1.72 | %(c) | | | 1.65 | % | | | 1.60 | % | | | 1.65 | % | |
Total net expenses(d) | | | 1.62 | %(e) | | | 1.60 | %(e) | | | 1.55 | %(c)(e) | | | 1.60 | %(e) | | | 1.60 | %(e) | | | 1.65 | %(e) | |
Net investment income | | | 4.13 | % | | | 3.41 | % | | | 4.24 | %(c) | | | 4.69 | % | | | 4.72 | % | | | 5.13 | % | |
Supplemental data | |
Net assets, end of period (in thousands) | | $ | 774 | | | $ | 1,217 | | | $ | 2,142 | | | $ | 3,052 | | | $ | 5,995 | | | $ | 8,392 | | |
Portfolio turnover | | | 12 | % | | | 9 | % | | | 9 | % | | | 23 | % | | | 18 | % | | | 26 | % | |
Notes to Financial Highlights
(a) For the period from July 1, 2011 to May 31, 2012. During the period, the Fund's fiscal year end was changed from June 30 to May 31.
(b) In addition to the fees and expenses which the Fund bears directly, the Fund indirectly bears a pro rata share of the fees and expenses of the acquired funds in which it invests. Such indirect expenses are not included in the reported expense ratios.
(c) Annualized.
(d) Total net expenses include the impact of certain waivers/reimbursements made by the Investment Manager and certain of its affiliates, if applicable.
(e) The benefits derived from expense reductions had an impact of less than 0.01%.
The accompanying Notes to Financial Statements are an integral part of this statement.
Annual Report 2014
30
Columbia High Yield Municipal Fund
Financial Highlights (continued)
| | | Year Ended May 31, | | Year Ended June 30, | |
Class C | | 2014 | | 2013 | | 2012(a) | | 2011 | | 2010 | | 2009 | |
Per share data | |
Net asset value, beginning of period | | $ | 10.72 | | | $ | 10.49 | | | $ | 9.60 | | | $ | 9.77 | | | $ | 8.79 | | | $ | 10.32 | | |
Income from investment operations: | |
Net investment income | | | 0.43 | | | | 0.38 | | | | 0.40 | | | | 0.48 | | | | 0.46 | | | | 0.48 | | |
Net realized and unrealized gain (loss) | | | (0.16 | ) | | | 0.22 | | | | 0.88 | | | | (0.20 | ) | | | 0.97 | | | | (1.54 | ) | |
Total from investment operations | | | 0.27 | | | | 0.60 | | | | 1.28 | | | | 0.28 | | | | 1.43 | | | | (1.06 | ) | |
Less distributions to shareholders: | |
Net investment income | | | (0.43 | ) | | | (0.37 | ) | | | (0.39 | ) | | | (0.45 | ) | | | (0.45 | ) | | | (0.47 | ) | |
Total distributions to shareholders | | | (0.43 | ) | | | (0.37 | ) | | | (0.39 | ) | | | (0.45 | ) | | | (0.45 | ) | | | (0.47 | ) | |
Net asset value, end of period | | $ | 10.56 | | | $ | 10.72 | | | $ | 10.49 | | | $ | 9.60 | | | $ | 9.77 | | | $ | 8.79 | | |
Total return | | | 2.73 | % | | | 5.81 | % | | | 13.56 | % | | | 3.01 | % | | | 16.55 | % | | | (10.14 | %) | |
Ratios to average net assets(b) | |
Total gross expenses | | | 1.70 | % | | | 1.71 | % | | | 1.71 | %(c) | | | 1.66 | % | | | 1.60 | % | | | 1.65 | % | |
Total net expenses(d) | | | 1.46 | %(e) | | | 1.45 | %(e) | | | 1.40 | %(c)(e) | | | 1.45 | %(e) | | | 1.45 | %(e) | | | 1.50 | %(e) | |
Net investment income | | | 4.26 | % | | | 3.57 | % | | | 4.30 | %(c) | | | 4.88 | % | | | 4.85 | % | | | 5.29 | % | |
Supplemental data | |
Net assets, end of period (in thousands) | | $ | 19,946 | | | $ | 14,684 | | | $ | 12,525 | | | $ | 8,509 | | | $ | 9,288 | | | $ | 8,341 | | |
Portfolio turnover | | | 12 | % | | | 9 | % | | | 9 | % | | | 23 | % | | | 18 | % | | | 26 | % | |
Notes to Financial Highlights
(a) For the period from July 1, 2011 to May 31, 2012. During the period, the Fund's fiscal year end was changed from June 30 to May 31.
(b) In addition to the fees and expenses which the Fund bears directly, the Fund indirectly bears a pro rata share of the fees and expenses of the acquired funds in which it invests. Such indirect expenses are not included in the reported expense ratios.
(c) Annualized.
(d) Total net expenses include the impact of certain waivers/reimbursements made by the Investment Manager and certain of its affiliates, if applicable.
(e) The benefits derived from expense reductions had an impact of less than 0.01%.
The accompanying Notes to Financial Statements are an integral part of this statement.
Annual Report 2014
31
Columbia High Yield Municipal Fund
Financial Highlights (continued)
| | | Year Ended May 31, | |
Class R4 | | 2014 | | 2013(a) | |
Per share data | |
Net asset value, beginning of period | | $ | 10.73 | | | $ | 10.77 | | |
Income from investment operations: | |
Net investment income | | | 0.52 | | | | 0.10 | | |
Net realized and unrealized loss | | | (0.18 | ) | | | (0.05 | )(b) | |
Total from investment operations | | | 0.34 | | | | 0.05 | | |
Less distributions to shareholders: | |
Net investment income | | | (0.50 | ) | | | (0.09 | ) | |
Total distributions to shareholders | | | (0.50 | ) | | | (0.09 | ) | |
Net asset value, end of period | | $ | 10.57 | | | $ | 10.73 | | |
Total return | | | 3.53 | % | | | 0.50 | % | |
Ratios to average net assets(c) | |
Total gross expenses | | | 0.76 | % | | | 0.71 | %(d) | |
Total net expenses(e) | | | 0.65 | %(f) | | | 0.68 | %(d) | |
Net investment income | | | 5.09 | % | | | 4.54 | %(d) | |
Supplemental data | |
Net assets, end of period (in thousands) | | $ | 2,476 | | | $ | 3 | | |
Portfolio turnover | | | 12 | % | | | 9 | % | |
Notes to Financial Highlights
(a) For the period from March 19, 2013 (commencement of operations) to May 31, 2013.
(b) Calculation of the net gain (loss) per share (both realized and unrealized) does not correlate to the aggregate realized and unrealized gain (loss) presented in the Statement of Operations due to the timing of sales and repurchases of Fund shares in relation to fluctuations in the market value of the portfolio.
(c) In addition to the fees and expenses which the Fund bears directly, the Fund indirectly bears a pro rata share of the fees and expenses of the acquired funds in which it invests. Such indirect expenses are not included in the reported expense ratios.
(d) Annualized.
(e) Total net expenses include the impact of certain waivers/reimbursements made by the Investment Manager and certain of its affiliates, if applicable.
(f) The benefits derived from expense reductions had an impact of less than 0.01%.
The accompanying Notes to Financial Statements are an integral part of this statement.
Annual Report 2014
32
Columbia High Yield Municipal Fund
Financial Highlights (continued)
| | | Year Ended May 31, | |
Class R5 | | 2014 | | 2013(a) | |
Per share data | |
Net asset value, beginning of period | | $ | 10.71 | | | $ | 10.75 | | |
Income from investment operations: | |
Net investment income | | | 0.52 | | | | 0.28 | | |
Net realized and unrealized loss | | | (0.17 | ) | | | (0.06 | )(b) | |
Total from investment operations | | | 0.35 | | | | 0.22 | | |
Less distributions to shareholders: | |
Net investment income | | | (0.51 | ) | | | (0.26 | ) | |
Total distributions to shareholders | | | (0.51 | ) | | | (0.26 | ) | |
Net asset value, end of period | | $ | 10.55 | | | $ | 10.71 | | |
Total return | | | 3.64 | % | | | 2.05 | % | |
Ratios to average net assets(c) | |
Total gross expenses | | | 0.63 | % | | | 0.61 | %(d) | |
Total net expenses(e) | | | 0.57 | % | | | 0.61 | %(d) | |
Net investment income | | | 5.21 | % | | | 4.76 | %(d) | |
Supplemental data | |
Net assets, end of period (in thousands) | | $ | 7,807 | | | $ | 509 | | |
Portfolio turnover | | | 12 | % | | | 9 | % | |
Notes to Financial Highlights
(a) For the period from November 8, 2012 (commencement of operations) to May 31, 2013.
(b) Calculation of the net gain (loss) per share (both realized and unrealized) does not correlate to the aggregate realized and unrealized gain (loss) presented in the Statement of Operations due to the timing of sales and repurchases of Fund shares in relation to fluctuations in the market value of the portfolio.
(c) In addition to the fees and expenses which the Fund bears directly, the Fund indirectly bears a pro rata share of the fees and expenses of the acquired funds in which it invests. Such indirect expenses are not included in the reported expense ratios.
(d) Annualized.
(e) Total net expenses include the impact of certain waivers/reimbursements made by the Investment Manager and certain of its affiliates, if applicable.
The accompanying Notes to Financial Statements are an integral part of this statement.
Annual Report 2014
33
Columbia High Yield Municipal Fund
Financial Highlights (continued)
| | | Year Ended May 31, | | Year Ended June 30, | |
Class Z | | 2014 | | 2013 | | 2012(a) | | 2011 | | 2010 | | 2009 | |
Per share data | |
Net asset value, beginning of period | | $ | 10.72 | | | $ | 10.49 | | | $ | 9.60 | | | $ | 9.77 | | | $ | 8.79 | | | $ | 10.32 | | |
Income from investment operations: | |
Net investment income | | | 0.51 | | | | 0.47 | | | | 0.47 | | | | 0.55 | | | | 0.54 | | | | 0.55 | | |
Net realized and unrealized gain (loss) | | | (0.16 | ) | | | 0.22 | | | | 0.88 | | | | (0.19 | ) | | | 0.97 | | | | (1.54 | ) | |
Total from investment operations | | | 0.35 | | | | 0.69 | | | | 1.35 | | | | 0.36 | | | | 1.51 | | | | (0.99 | ) | |
Less distributions to shareholders: | |
Net investment income | | | (0.51 | ) | | | (0.46 | ) | | | (0.46 | ) | | | (0.53 | ) | | | (0.53 | ) | | | (0.54 | ) | |
Total distributions to shareholders | | | (0.51 | ) | | | (0.46 | ) | | | (0.46 | ) | | | (0.53 | ) | | | (0.53 | ) | | | (0.54 | ) | |
Net asset value, end of period | | $ | 10.56 | | | $ | 10.72 | | | $ | 10.49 | | | $ | 9.60 | | | $ | 9.77 | | | $ | 8.79 | | |
Total return | | | 3.56 | % | | | 6.65 | % | | | 14.39 | % | | | 3.82 | % | | | 17.48 | % | | | (9.42 | %) | |
Ratios to average net assets(b) | |
Total gross expenses | | | 0.75 | % | | | 0.76 | % | | | 0.76 | %(c) | | | 0.71 | % | | | 0.65 | % | | | 0.70 | % | |
Total net expenses(d) | | | 0.67 | %(e) | | | 0.65 | %(e) | | | 0.60 | %(c)(e) | | | 0.65 | %(e) | | | 0.65 | %(e) | | | 0.70 | %(e) | |
Net investment income | | | 5.07 | % | | | 4.37 | % | | | 5.12 | %(c) | | | 5.68 | % | | | 5.64 | % | | | 6.07 | % | |
Supplemental data | |
Net assets, end of period (in thousands) | | $ | 605,931 | | | $ | 849,332 | | | $ | 830,124 | | | $ | 641,387 | | | $ | 668,875 | | | $ | 498,734 | | |
Portfolio turnover | | | 12 | % | | | 9 | % | | | 9 | % | | | 23 | % | | | 18 | % | | | 26 | % | |
Notes to Financial Highlights
(a) For the period from July 1, 2011 to May 31, 2012. During the period, the Fund's fiscal year end was changed from June 30 to May 31.
(b) In addition to the fees and expenses which the Fund bears directly, the Fund indirectly bears a pro rata share of the fees and expenses of the acquired funds in which it invests. Such indirect expenses are not included in the reported expense ratios.
(c) Annualized.
(d) Total net expenses include the impact of certain waivers/reimbursements made by the Investment Manager and certain of its affiliates, if applicable.
(e) The benefits derived from expense reductions had an impact of less than 0.01%.
The accompanying Notes to Financial Statements are an integral part of this statement.
Annual Report 2014
34
Columbia High Yield Municipal Fund
Notes to Financial Statements
May 31, 2014
Note 1. Organization
Columbia High Yield Municipal Fund (the Fund), a series of Columbia Funds Series Trust I (the Trust), is a diversified fund. The Trust is registered under the Investment Company Act of 1940, as amended (the 1940 Act), as an open-end management investment company organized as a Massachusetts business trust.
Fund Shares
The Trust may issue an unlimited number of shares (without par value). The Fund offers Class A, Class B, Class C, Class R4, Class R5 and Class Z shares. Although all share classes generally have identical voting, dividend and liquidation rights, each share class votes separately when required by law. Different share classes pay different distribution amounts to the extent the expenses of such share classes differ, and distributions in liquidation will be proportional to the net asset value of each share class. Each share class has its own expense structure and sales charges, as applicable.
Class A shares are subject to a maximum front-end sales charge of 4.75% based on the initial investment amount. Class A shares purchased without an initial sales charge in accounts aggregating $1 million to $50 million at the time of purchase are subject to a contingent deferred sales charge (CDSC) if the shares are sold within 18 months of purchase, charged as follows: 1.00% CDSC if redeemed within 12 months of purchase, and 0.50% CDSC if redeemed more than 12, but less than 18, months after purchase.
Class B shares may be subject to a maximum CDSC of 5.00% based upon the holding period after purchase. Class B shares will generally convert to Class A shares eight years after purchase. The Fund no longer accepts investments by new or existing investors in the Fund's Class B shares, except in connection with the reinvestment of any dividend and/or capital gain distributions in Class B shares of the Fund and exchanges by existing Class B shareholders of certain other funds within the Columbia Family of Funds.
Class C shares are subject to a 1.00% CDSC on shares redeemed within one year of purchase.
Class R4 shares are not subject to sales charges and are generally available only to omnibus retirement plans and certain other eligible investors.
Class R5 shares are not subject to sales charges and are generally available only to investors purchasing through authorized investment professionals and omnibus retirement plans.
Class Z shares are not subject to sales charges and are available only to certain eligible investors, which are subject to different investment minimums.
Note 2. Summary of Significant Accounting Policies
Use of Estimates
The preparation of financial statements in accordance with U.S. generally accepted accounting principles (GAAP) requires management to make certain estimates and assumptions that affect the reported amounts of assets and liabilities, the disclosure of contingent assets and liabilities at the date of the financial statements and the reported amounts of revenue and expenses during the reporting period. Actual results could differ from those estimates.
The following is a summary of significant accounting policies consistently followed by the Fund in the preparation of its financial statements.
Security Valuation
Debt securities generally are valued by pricing services approved by the Board of Trustees (the Board) based upon market transactions for normal, institutional-size trading units of similar securities. The services may use various pricing techniques which take into account appropriate factors such as yield, quality, coupon rate, maturity, type of issue, trading characteristics and other data, as well as broker quotes. Debt securities for which quotations are readily available may also be valued based upon an over-the-counter or exchange bid quotation.
All equity securities are valued at the close of business of the New York Stock Exchange (NYSE). Equity securities are valued at the last quoted sales price on the principal exchange or market on which they trade, except for securities traded on the NASDAQ Stock Market, which are valued at the NASDAQ official close price. Unlisted securities or listed securities for which there were no sales during the day are valued at the mean of the latest quoted bid and ask prices on such exchanges or markets.
Investments in open-end investment companies, including money market funds, are valued at net asset value.
Short-term securities purchased within 60 days to maturity are valued at amortized cost, which approximates market value. The value of short-term securities originally purchased with maturities greater than 60 days is determined based on an amortized value to par upon reaching 60 days to maturity. Short-term securities maturing in more than 60 days from the valuation date are valued at the market price or approximate market value based on current interest rates.
Annual Report 2014
35
Columbia High Yield Municipal Fund
Notes to Financial Statements (continued)
May 31, 2014
Investments for which market quotations are not readily available, or that have quotations which management believes are not reliable, are valued at fair value as determined in good faith under consistently applied procedures established by and under the general supervision of the Board. If a security or class of securities (such as foreign securities) is valued at fair value, such value is likely to be different from the last quoted market price for the security.
The determination of fair value often requires significant judgment. To determine fair value, management may use assumptions including but not limited to future cash flows and estimated risk premiums. Multiple inputs from various sources may be used to determine fair value.
Delayed Delivery Securities
The Fund may trade securities on other than normal settlement terms, including securities purchased or sold on a "when-issued" basis. This may increase risk since the other party to the transaction may fail to deliver which could cause the Fund to subsequently invest at less advantageous prices. The Fund designates cash or liquid securities in an amount equal to the delayed delivery commitment.
Restricted Securities
Restricted securities are securities that may only be resold upon registration under federal securities laws or in transactions exempt from registration. In some cases, the issuer of restricted securities has agreed to register such securities for resale at the issuer's expense either upon demand by the Fund or in connection with another registered offering of the securities. Many restricted securities may be resold in the secondary market in transactions exempt from registration. Such restricted securities may be determined to be liquid under criteria established by the Board. The Fund will not incur any registration costs upon such resale.
Security Transactions
Security transactions are accounted for on the trade date. Cost is determined and gains (losses) are based upon the specific identification method for both financial statement and federal income tax purposes.
Income Recognition
Interest income is recorded on an accrual basis. Market premiums and discounts, including original issue discounts, are amortized and accreted, respectively, over the expected life of the security on all debt securities, unless otherwise noted.
Dividend income is recorded on the ex-dividend date.
Expenses
General expenses of the Trust are allocated to the Fund and other funds of the Trust based upon relative net assets or other expense allocation methodologies determined by the nature of the expense. Expenses directly attributable to the Fund are charged to the Fund. Expenses directly attributable to a specific class of shares are charged to that share class.
Determination of Class Net Asset Value
All income, expenses (other than class-specific expenses, which are charged to that share class, as shown in the Statement of Operations) and realized and unrealized gains (losses) are allocated to each class of the Fund on a daily basis, based on the relative net assets of each class, for purposes of determining the net asset value of each class.
Federal Income Tax Status
The Fund intends to qualify each year as a regulated investment company under Subchapter M of the Internal Revenue Code, as amended, and will distribute substantially all of its tax exempt and taxable income (including net short-term capital gains), if any, for its tax year, and as such will not be subject to federal income taxes. In addition, the Fund intends to distribute in each calendar year substantially all of its net investment income, capital gains and certain other amounts, if any, such that the Fund should not be subject to federal excise tax. Therefore, no federal income or excise tax provision is recorded.
Distributions to Shareholders
Distributions from net investment income, if any, are declared daily and paid monthly. Net realized capital gains, if any, are distributed at least annually. Income distributions and capital gain distributions are determined in accordance with federal income tax regulations, which may differ from GAAP.
Guarantees and Indemnifications
Under the Trust's organizational documents and, in some cases, by contract, its officers and trustees are indemnified against certain liabilities arising out of the performance of their duties to the Trust or its funds. In addition, certain of the Fund's contracts with its service providers contain general indemnification clauses. The Fund's maximum exposure under these arrangements is unknown since the amount of any future claims that may be made against the Fund cannot be determined, and the Fund has no historical basis for predicting the likelihood of any such claims.
Annual Report 2014
36
Columbia High Yield Municipal Fund
Notes to Financial Statements (continued)
May 31, 2014
Note 3. Fees and Compensation Paid to Affiliates
Investment Management Fees
Under an Investment Management Services Agreement, Columbia Management Investment Advisers, LLC (the Investment Manager), a wholly-owned subsidiary of Ameriprise Financial, Inc. (Ameriprise Financial), determines which securities will be purchased, held or sold. The investment management fee is an annual fee that is equal to a percentage of the Fund's average daily net assets that declines from 0.47% to 0.30% as the Fund's net assets increase. The effective investment management fee rate for the year ended May 31, 2014 was 0.47% of the Fund's average daily net assets.
Administration Fees
Under an Administrative Services Agreement, the Investment Manager also serves as the Fund Administrator. The Fund pays the Fund Administrator an annual fee for administration and accounting services equal to a percentage of the Fund's average daily net assets that declines from 0.07% to 0.04% as the Fund's net assets increase. The effective administration fee rate for the year ended May 31, 2014 was 0.07% of the Fund's average daily net assets.
Compensation of Board Members
Board members are compensated for their services to the Fund as disclosed in the Statement of Operations. The Trust's eligible Trustees may participate in a Deferred Compensation Plan (the Plan) which may be terminated at any time. Obligations of the Plan will be paid solely out of the Fund's assets.
Compensation of Chief Compliance Officer
The Board has appointed a Chief Compliance Officer to the Fund in accordance with federal securities regulations. The Fund pays its pro-rata share of the expenses associated with the Chief Compliance Officer. The Fund's expenses for the Chief Compliance Officer will not exceed $15,000 per year.
Transfer Agent Fees
Under a Transfer and Dividend Disbursing Agent Agreement, Columbia Management Investment Services Corp. (the Transfer Agent), an affiliate of the Investment Manager and a wholly-owned subsidiary of Ameriprise Financial, is responsible for providing transfer agency services to the Fund. The Transfer Agent has contracted with Boston Financial Data Services (BFDS) to serve as sub-transfer agent.
The Transfer Agent receives monthly account-based service fees based on the number of open accounts and also receives
sub-transfer agency fees based on a percentage of the average aggregate value of the Fund's shares maintained in omnibus accounts (other than omnibus accounts for which American Enterprise Investment Services Inc. is the broker of record or accounts where the beneficial shareholder is a customer of Ameriprise Financial Services, Inc., which are paid a per account fee). The Transfer Agent pays the fees of BFDS for services as sub-transfer agent and is not entitled to reimbursement for such fees from the Fund (with the exception of out-of-pocket fees).
The Transfer Agent also receives compensation from fees for various shareholder services and reimbursements for certain out-of-pocket fees. Total transfer agent fees for Class R5 shares are subject to an annual limitation of not more than 0.05% of the average daily net assets attributable to Class R5 shares.
For the year ended May 31, 2014, the Fund's effective transfer agent fee rates as a percentage of average daily net assets of each class were as follows:
Class A | | | 0.18 | % | |
Class B | | | 0.18 | | |
Class C | | | 0.18 | | |
Class R4 | | | 0.18 | | |
Class R5 | | | 0.05 | | |
Class Z | | | 0.18 | | |
An annual minimum account balance fee of $20 may apply to certain accounts with a value below the applicable share class's initial minimum investment requirements to reduce the impact of small accounts on transfer agent fees. These minimum account balance fees are remitted to the Fund and recorded as part of expense reductions in the Statement of Operations. For the year ended May 31, 2014, these minimum account balance fees reduced total expenses by $860.
Distribution and Service Fees
The Fund has an agreement with Columbia Management Investment Distributors, Inc. (the Distributor), an affiliate of the Investment Manager and a wholly-owned subsidiary of Ameriprise Financial, for distribution and shareholder services. The Board has approved, and the Fund has adopted, distribution and shareholder service plans (the Plans) applicable to certain share classes, which set the distribution and service fees for the Fund. These fees are calculated daily and are intended to compensate the Distributor and/or eligible selling and/or servicing agents for selling shares of the Fund and providing services to investors.
Under the Plans, the Fund pays a monthly service fee to the Distributor at the maximum annual rate of 0.20% of the
Annual Report 2014
37
Columbia High Yield Municipal Fund
Notes to Financial Statements (continued)
May 31, 2014
average daily net assets attributable to Class A, Class B and Class C shares of the Fund. Also under the Plans, the Fund pays a monthly distribution fee to the Distributor at the maximum annual rate of 0.75% of the average daily net assets attributable to Class B and Class C shares only.
The Distributor has voluntarily agreed to waive a portion of the distribution fee for Class C shares so that the distribution fee does not exceed 0.60% annually of the average daily net assets attributable to Class C shares. This arrangement may be modified or terminated by the Distributor at any time.
Sales Charges
Sales charges, including front-end charges and CDSCs, received by the Distributor for distributing Fund shares were $154,935 for Class A, $895 for Class B and $1,463 for Class C shares for the year ended May 31, 2014.
Expenses Waived/Reimbursed by the Investment Manager and its Affiliates
The Investment Manager and certain of its affiliates have contractually agreed to waive fees and/or reimburse expenses (excluding certain fees and expenses described below) for the periods disclosed below, unless sooner terminated at the sole discretion of the Board, so that the Fund's net operating expenses, after giving effect to fees waived/expenses reimbursed and any balance credits and/or overdraft charges from the Fund's custodian, do not exceed the following annual rates as a percentage of the class' average daily net assets:
| | | October 1, 2013
through
September 30, 2014 | | Prior to
October 1, 2013 | |
Class A | | | 0.85 | % | | | 0.89 | % | |
Class B | | | 1.60 | | | | 1.64 | | |
Class C | | | 1.60 | | | | 1.64 | | |
Class R4 | | | 0.65 | | | | 0.69 | | |
Class R5 | | | 0.56 | | | | 0.61 | | |
Class Z | | | 0.65 | | | | 0.69 | | |
Under the agreement governing these fee waivers and/or expense reimbursement arrangements, the following fees and expenses are excluded from the waiver/reimbursement commitment, and therefore will be paid by the Fund, if applicable: taxes (including foreign transaction taxes), expenses associated with investments in affiliated and non-affiliated pooled investment vehicles (including mutual funds and exchange-traded funds), transaction costs and brokerage commissions, costs related to any securities lending program, dividend expenses associated with securities sold short, inverse floater program fees and expenses, transaction charges
and interest on borrowed money, interest, extraordinary expenses and any other expenses the exclusion of which is specifically approved by the Board. This agreement may be modified or amended only with approval from all parties. Class C distribution fees waived by the Distributor, as discussed above, are in addition to the waiver/reimbursement commitment under the agreement.
Note 4. Federal Tax Information
The timing and character of income and capital gain distributions are determined in accordance with income tax regulations, which may differ from GAAP because of temporary or permanent book to tax differences.
At May 31, 2014, these differences are primarily due to differing treatment for capital loss carryforwards, principal and/or interest of fixed income securities, deferral/reversal of wash sale losses, Trustees' deferred compensation, distributions, post-October capital losses and tax straddles. To the extent these differences are permanent, reclassifications are made among the components of the Fund's net assets in the Statement of Assets and Liabilities. Temporary differences do not require reclassifications. In the Statement of Assets and Liabilities the following reclassifications were made:
Undistributed net investment income | | $ | 131,299 | | |
Accumulated net realized loss | | | 335,692 | | |
Paid-in capital | | | (466,991 | ) | |
Net investment income and net realized gains (losses), as disclosed in the Statement of Operations, and net assets were not affected by this reclassification.
The tax character of distributions paid during the years indicated was as follows:
| | | Year Ended
May 31,
2014 ($) | | Year Ended
May 31,
2013 ($) | |
Tax-Exempt income | | | 36,619,211 | | | | 41,620,958 | | |
Ordinary income | | | 856,322 | | | | 256,795 | | |
Total | | | 37,475,533 | | | | 41,877,753 | | |
Short-term capital gain distributions, if any, are considered ordinary income distributions for tax purposes.
At May 31, 2014, the components of distributable earnings on a tax basis were as follows:
Undistributed tax-exempt income | | | 11,235,886 | | |
Capital loss carryforwards | | | (82,107,134 | ) | |
Net unrealized appreciation | | | 33,847,022 | | |
Annual Report 2014
38
Columbia High Yield Municipal Fund
Notes to Financial Statements (continued)
May 31, 2014
At May 31, 2014, the cost of investments for federal income tax purposes was $722,320,139 and the aggregate gross unrealized appreciation and depreciation based on that cost was:
Unrealized appreciation | | $ | 55,633,142 | | |
Unrealized depreciation | | | (21,786,120 | ) | |
Net unrealized appreciation | | | 33,847,022 | | |
The following capital loss carryforwards, determined at May 31, 2014, may be available to reduce taxable income arising from future net realized gains on investments, if any, to the extent permitted by the Internal Revenue Code:
Year of Expiration | | Amount ($) | |
2015 | | | 1,471,699 | | |
2016 | | | 5,694,295 | | |
2017 | | | 17,741,445 | | |
2018 | | | 35,721,468 | | |
2019 | | | 4,244,605 | | |
Unlimited short-term | | | 1,233,382 | | |
Unlimited long-term | | | 16,000,240 | | |
Total | | | 82,107,134 | | |
Unlimited capital loss carryforwards are required to be utilized prior to any capital losses which carry an expiration date. As a result of this ordering rule, capital loss carryforwards which carry an expiration date may be more likely to expire unused.
For the year ended May 31, 2014, $1,175,604 of capital loss carryforward was utilized and $466,991 expired unused.
Under current tax rules, regulated investment companies can elect to treat certain late-year ordinary losses incurred and post-October capital losses (capital losses realized after October 31) as arising on the first day of the following taxable year. As of May 31, 2014, the Fund will elect to treat post-October capital losses of $3,302,462 as arising on June 1, 2014.
Management of the Fund has concluded that there are no significant uncertain tax positions that would require recognition in the financial statements. However, management's conclusion may be subject to review and adjustment at a later date based on factors including, but not limited to, new tax laws, regulations, and administrative interpretations (including relevant court decisions). Generally, the Fund's federal tax returns for the prior three fiscal years remain subject to examination by the Internal Revenue Service.
Note 5. Portfolio Information
The cost of purchases and proceeds from sales of securities, excluding short-term obligations, aggregated to $88,391,959 and $297,342,255, respectively, for the year ended May 31, 2014.
Note 6. Shareholder Concentration
At May 31, 2014, one unaffiliated shareholder of record owned 65.0% of the outstanding shares of the Fund in one or more accounts. The Fund has no knowledge about whether any portion of those shares was owned beneficially.
Note 7. Line of Credit
The Fund has entered into a revolving credit facility with a syndicate of banks led by JPMorgan Chase Bank N.A. whereby the Fund may borrow for the temporary funding of shareholder redemptions or for other temporary or emergency purposes. The credit facility agreement, as amended, which is a collective agreement between the Fund and certain other funds managed by the Investment Manager, severally and not jointly, permits collective borrowings up to $500 million. Interest is charged to each participating fund based on its borrowings at a rate equal to the higher of (i) the overnight federal funds rate plus 1.00% or (ii) the one-month LIBOR rate plus 1.00%. Each borrowing under the credit facility matures no later than 60 days after the date of borrowing. Effective December 10, 2013, the Fund also pays a commitment fee equal to its pro rata share of the amount of the credit facility at a rate of 0.075% per annum. Prior to December 10, 2013, the commitment fee was charged at the annual rate of 0.08% per annum. The commitment fee is included in other expenses in the Statement of Operations.
The Fund had no borrowings during the year ended May 31, 2014.
Note 8. Significant Risks
Low and Below Investment Grade (High-Yield) Securities Risk
Securities with the lowest investment grade rating, securities rated below investment grade (commonly called "high-yield" or "junk" bonds) and unrated securities of comparable quality expose the Fund to a greater risk of loss of principal and income than a fund that invests solely or primarily in investment grade securities. In addition, these investments have greater price fluctuations, are less liquid and are more likely to experience a default than higher-rated securities. High-yield securities are considered to be predominantly speculative with respect to the issuer's capacity to pay interest and repay principal.
Annual Report 2014
39
Columbia High Yield Municipal Fund
Notes to Financial Statements (continued)
May 31, 2014
Note 9. Subsequent Events
Management has evaluated the events and transactions that have occurred through the date the financial statements were issued and noted no items requiring adjustment of the financial statements or additional disclosure.
Note 10. Information Regarding Pending and Settled Legal Proceedings
In December 2005, without admitting or denying the allegations, American Express Financial Corporation (AEFC, which is now known as Ameriprise Financial, Inc. (Ameriprise Financial)) entered into settlement agreements with the Securities and Exchange Commission (SEC) and Minnesota Department of Commerce (MDOC) related to market timing activities. As a result, AEFC was censured and ordered to cease and desist from committing or causing any violations of certain provisions of the Investment Advisers Act of 1940, the Investment Company Act of 1940, and various Minnesota laws. AEFC agreed to pay disgorgement of $10 million and civil money penalties of $7 million. AEFC also agreed to retain an independent distribution consultant to assist in developing a plan for distribution of all disgorgement and civil penalties ordered by the SEC in accordance with various undertakings detailed at www.sec.gov/litigation/admin/ia-2451.pdf. Ameriprise Financial and its affiliates have cooperated with the SEC and the MDOC in these legal proceedings, and have made regular reports to the Funds' Boards of Trustees.
Ameriprise Financial and certain of its affiliates have historically been involved in a number of legal, arbitration and regulatory proceedings, including routine litigation, class actions, and governmental actions, concerning matters arising in connection with the conduct of their business activities. Ameriprise Financial believes that the Funds are not currently the subject of, and that neither Ameriprise Financial nor any of its affiliates are the subject of, any pending legal, arbitration or regulatory proceedings that are likely to have a material adverse effect on the Funds or the ability of Ameriprise Financial or its affiliates to perform under their contracts with the Funds. Ameriprise Financial is required to make 10-Q, 10-K and, as necessary, 8-K filings with the Securities and Exchange Commission on legal and regulatory matters that relate to Ameriprise Financial and its affiliates. Copies of these filings may be obtained by accessing the SEC website at www.sec.gov.
There can be no assurance that these matters, or the adverse publicity associated with them, will not result in increased fund redemptions, reduced sale of fund shares or other adverse consequences to the Funds. Further, although we believe proceedings are not likely to have a material adverse effect on
the Funds or the ability of Ameriprise Financial or its affiliates to perform under their contracts with the Funds, these proceedings are subject to uncertainties and, as such, we are unable to estimate the possible loss or range of loss that may result. An adverse outcome in one or more of these proceedings could result in adverse judgments, settlements, fines, penalties or other relief that could have a material adverse effect on the consolidated financial condition or results of operations of Ameriprise Financial.
Annual Report 2014
40
Columbia High Yield Municipal Fund
Report of Independent Registered Public Accounting Firm
To the Trustees of Columbia Funds Series Trust I and the
Shareholders of Columbia High Yield Municipal Fund
In our opinion, the accompanying statement of assets and liabilities, including the portfolio of investments, and the related statements of operations and of changes in net assets and the financial highlights present fairly, in all material respects, the financial position of Columbia High Yield Municipal Fund (the "Fund", a series of Columbia Funds Series Trust I) at May 31, 2014, and the results of its operations, the changes in its net assets and the financial highlights for each of the periods indicated, in conformity with accounting principles generally accepted in the United States of America. These financial statements and financial highlights (hereafter referred to as "financial statements") are the responsibility of the Fund's management. Our responsibility is to express an opinion on these financial statements based on our audits. We conducted our audits of these financial statements in accordance with the standards of the Public Company Accounting Oversight Board (United States). Those standards require that we plan and perform the audit to obtain reasonable assurance about whether the financial statements are free of material misstatement. An audit includes examining, on a test basis, evidence supporting the amounts and disclosures in the financial statements, assessing the accounting principles used and significant estimates made by management, and evaluating the overall financial statement presentation. We believe that our audits, which included confirmation of securities at May 31, 2014 by correspondence with the custodian, brokers and transfer agent, and the application of alternative auditing procedures where such confirmations had not been received, provide a reasonable basis for our opinion.
PricewaterhouseCoopers LLP
Minneapolis, Minnesota
July 22, 2014
Annual Report 2014
41
Columbia High Yield Municipal Fund
Federal Income Tax Information
(Unaudited)
The Fund hereby designates the following tax attributes for the fiscal year ended May 31, 2014. Shareholders will be notified in early 2015 of the amounts for use in preparing 2014 income tax returns.
Tax Designations:
| Exempt-Interest Dividends | | | 97.71 | % | |
Exempt-Interest Dividends. The percentage of net investment income dividends paid during the fiscal year that qualifies as exempt-interest dividends for federal income tax purposes.
Annual Report 2014
42
Columbia High Yield Municipal Fund
The Trustees serve terms of indefinite duration. The names, addresses and birth years of the Trustees and Officers of the Funds in Columbia Funds Series Trust I, the year each was first elected or appointed to office, their principal business occupations during at least the last five years, the number of Funds overseen by each Trustee and other directorships they hold are shown below. Each officer listed below serves as an officer of each Fund in Columbia Funds Series Trust I.
Independent Trustees
Name, Address and Year of Birth,
Position with Funds, Year First
Elected or Appointed to Office | | Principal Occupation(s) During Past Five Years, Number of Funds in Columbia
Funds Complex Overseen by Trustee, Other Directorships Held | |
Douglas A. Hacker (Born 1955)
c/o Columbia Management
Investment Advisers, LLC
225 Franklin Street
Boston, MA 02110
Trustee (since 1996) | | Independent business executive since May 2006; Executive Vice President — Strategy of United Airlines from December 2002 to May 2006; President of UAL Loyalty Services (airline marketing company) from September 2001 to December 2002; Executive Vice President and Chief Financial Officer of United Airlines from July 1999 to September 2001. Oversees 56; Nash Finch Company (food distributor); Aircastle Limited (aircraft leasing); and SeaCube Container Leasing Ltd. (container leasing) | |
Janet Langford Kelly (Born 1957)
c/o Columbia Management
Investment Advisers, LLC
225 Franklin Street
Boston, MA 02110
Trustee (since 1996) | | Senior Vice President, General Counsel and Corporate Secretary, ConocoPhillips (integrated energy company) since September 2007; Deputy General Counsel — Corporate Legal Services, ConocoPhillips from August 2006 to August 2007; Partner, Zelle, Hofmann, Voelbel, Mason & Gette LLP (law firm) from March 2005 to July 2006; Adjunct Professor of Law, Northwestern University from September 2004 to June 2006; Director, UAL Corporation (airline) from February 2006 to July 2006; Chief Administrative Officer and Senior Vice President, Kmart Holding Corporation (consumer goods) from September 2003 to March 2004. Oversees 56; None | |
Nancy T. Lukitsh (Born 1956)
c/o Columbia Management
Investment Advisers, LLC
225 Franklin Street
Boston, MA 02110
Trustee (since 2011) | | Senior Vice President, Partner and Director of Marketing, Wellington Management Company, LLP (investment adviser) from 1997 to 2010; Chair, Wellington Management Investment Portfolios (commingled non-U.S. investment pools) from 2007 to 2010; Director, Wellington Trust Company, NA and other Wellington affiliates from 1997 to 2010. Oversees 56; None | |
William E. Mayer (Born 1940)
c/o Columbia Management
Investment Advisers, LLC
225 Franklin Street
Boston, MA 02110
Trustee (since 1994) | | Partner, Park Avenue Equity Partners (private equity) since February 1999; Dean and Professor, College of Business and Management, University of Maryland from 1992 to 1996. Oversees 56; DynaVox Inc. (speech creation); Lee Enterprises (print media); WR Hambrecht + Co. (financial service provider) from 2000 to 2012; BlackRock Kelso Capital Corporation (investment company) | |
David M. Moffett (Born 1952)
c/o Columbia Management
Investment Advisers, LLC
225 Franklin Street
Boston, MA 02110
Trustee (since 2011) | | Retired. Chief Executive Officer, Federal Home Loan Mortgage Corporation, from 2008 to 2009; Senior Adviser, Global Financial Services Group, Carlyle Group, Inc., from 2007 to 2008; Vice Chairman and Chief Financial Officer, U.S. Bancorp, from 1993 to 2007. Oversees 56; CIT Group Inc. (commercial and consumer finance); eBay Inc. (online trading community); MBIA Inc. (financial service provider); E.W. Scripps Co. (print and television media), Building Materials Holding Corp. (building materials and construction services); Genworth Financial, Inc. (financial and insurance products and services); and University of Oklahoma Foundation | |
Charles R. Nelson (Born 1942)
c/o Columbia Management
Investment Advisers, LLC
225 Franklin Street
Boston, MA 02110
Trustee (since 1981) | | Retired. Professor Emeritus, University of Washington, since 2011; Professor of Economics, University of Washington from 1976 to 2011; Ford and Louisa Van Voorhis Professor of Political Economy, University of Washington from 1993 to 2011; Adjunct Professor of Statistics, University of Washington from 1980 to 2011; Associate Editor, Journal of Money, Credit and Banking from September 1993 to 2008; consultant on econometric and statistical matters. Oversees 56; None | |
John J. Neuhauser (Born 1943)
c/o Columbia Management
Investment Advisers, LLC
225 Franklin Street
Boston, MA 02110
Trustee (since 1984) | | President, Saint Michael's College, since August 2007; Director or Trustee of several non-profit organizations, including Fletcher Allen Health Care, Inc.; University Professor, Boston College from November 2005 to August 2007; Academic Vice President and Dean of Faculties, Boston College from August 1999 to October 2005. Oversees 56; Liberty All-Star Equity Fund and Liberty All-Star Growth Fund (closed-end funds) | |
Patrick J. Simpson (Born 1944)
c/o Columbia Management
Investment Advisers, LLC
225 Franklin Street
Boston, MA 02110
Trustee (since 2000) | | Partner, Perkins Coie LLP (law firm). Oversees 56; None | |
Annual Report 2014
43
Columbia High Yield Municipal Fund
Trustees and Officers (continued)
Independent Trustees (continued)
Name, Address and Year of Birth,
Position with Funds, Year First
Elected or Appointed to Office | | Principal Occupation(s) During Past Five Years, Number of Funds in Columbia
Funds Complex Overseen by Trustee, Other Directorships Held | |
Anne-Lee Verville (Born 1945)
c/o Columbia Management
Investment Advisers, LLC
225 Franklin Street
Boston, MA 02110
Trustee (since 1998) | | Retired. General Manager — Global Education Industry from 1994 to 1997, President — Application Systems Division from 1991 to 1994, Chief Financial Officer — US Marketing & Services from 1988 to 1991, and Chief Information Officer from 1987 to 1988, IBM Corporation (computer and technology). Oversees 56; Enesco Group, Inc. (producer of giftware and home and garden decor products) from 2001 to 2006 | |
Interested Trustee
Name, Address and Year of Birth,
Position with Funds, Year First
Elected or Appointed to Office | | Principal Occupation(s) During Past Five Years, Number of Funds in Columbia
Funds Complex Overseen by Trustee, Other Directorships Held | |
William F. Truscott (born 1960)
53600 Ameriprise Financial Center
Minneapolis, MN 55474
Senior Vice President (since 2012) | | Chairman of the Board and President, Columbia Management Investment Advisers, LLC since May 2010 and February 2012 (previously President and Chief Investment Officer, from 2001 to April 2010); Chief Executive Officer, Global Asset Management, Ameriprise Financial, Inc. since September 2012 (previously, Chief Executive Officer, U.S. Asset Management & President, Annuities, from May 2010 to September 2012 and President — U.S. Asset Management and Chief Investment Officer from 2005 to April 2010); Director and Chief Executive Officer, Columbia Management Investment Distributors, Inc. since May 2010 and February 2012, respectively (previously Chairman of the Board and Chief Executive Officer from 2006 to April 2010); Chairman of the Board and Chief Executive Officer, RiverSource Distributors, Inc. since 2006; President and Chief Executive Officer, Ameriprise Certificate Company, 2006 to August 2012; Oversees 188; Director, Ameriprise Certificate Company, 2006-January 2013 | |
The Statement of Additional Information has additional information about the Fund's Board members and is available, without charge, upon request by calling 800.345.6611; contacting your financial intermediary; or visiting columbiamanagement.com.
The Board has appointed officers who are responsible for day-to-day business decisions based on policies it has established. The officers serve at the pleasure of the Board. In addition to Mr. Truscott, who is Senior Vice President, the Funds' other officers are:
Officers
Name,
Address and
Year of Birth | | Position and Year
First Appointed to
Position for any Fund
in the Columbia
Funds Complex or a
Predecessor Thereof | | Principal Occupation(s) During Past Five Years | |
J. Kevin Connaughton
225 Franklin Street
Boston, MA 02110
Born 1964 | | President and Principal Executive Officer (2009) | | Senior Vice President and General Manager — Mutual Fund Products, Columbia Management Investment Advisers, LLC, since May 2010; and President, Columbia Funds since 2009; previously, Managing Director, Columbia Management Advisors, LLC, from December 2004 to April 2010; Senior Vice President and Chief Financial Officer, Columbia Funds, from June 2008 to January 2009; and senior officer of Columbia Funds and affiliated funds since 2003. | |
Michael G. Clarke
225 Franklin Street
Boston, MA 02110
Born 1969 | | Treasurer (2011) and Chief Financial Officer (2009) | | Vice President, Columbia Management Investment Advisers, LLC, since May 2010; previously, Managing Director of Fund Administration, Columbia Management Advisors, LLC, from September 2004 to April 2010; and senior officer of Columbia Funds and affiliated funds since 2002. | |
Annual Report 2014
44
Columbia High Yield Municipal Fund
Trustees and Officers (continued)
Officers (continued)
Name,
Address and
Year of Birth | | Position and Year
First Appointed to
Position for any Fund
in the Columbia
Funds Complex or a
Predecessor Thereof | | Principal Occupation(s) During Past Five Years | |
Scott R. Plummer
5228 Ameriprise
Financial Center
Minneapolis, MN 55474
Born 1959 | | Senior Vice President (2006), Chief Legal Officer (2006) and Assistant Secretary (2011) | | Senior Vice President, Chief Legal Officer and Assistant Secretary, Columbia Management Investment Advisers, LLC, since June 2005; Senior Vice President and Lead Chief Counsel — Asset Management, Ameriprise Financial, Inc., since May 2010 (previously, Vice President and Chief Counsel — Asset Management, from 2005 to April 2010); Vice President, Chief Counsel and Assistant Secretary, Columbia Management Investment Distributors, Inc., since 2008; Vice President, General Counsel and Secretary, Ameriprise Certificate Company, since 2005; Chief Counsel, RiverSource Distributors, Inc., since 2006; and senior officer of Columbia Funds and affiliated funds since 2006. | |
Thomas P. McGuire
225 Franklin Street
Boston, MA 02110
Born 1972 | | Chief Compliance Officer (2012) | | Vice President — Asset Management Compliance, Ameriprise Financial, Inc., since May 2010; Chief Compliance Officer, Ameriprise Certificate Company, since September 2010; Compliance Executive, Bank of America, from 2005 to April 2010. | |
Colin Moore
225 Franklin Street
Boston, MA 02110
Born 1958 | | Senior Vice President (2010) | | Executive Vice President and Global Chief Investment Officer, Ameriprise Financial, Inc., since July 2013; Director and Global Chief Investment Officer, Columbia Management Investment Advisers, LLC, since May 2010; previously, Manager, Managing Director and Chief Investment Officer, Columbia Management Advisors, LLC, from 2007 to April 2010. | |
Michael E. DeFao
225 Franklin Street
Boston, MA 02110
Born 1968 | | Vice President (2011) and Assistant Secretary (2010) | | Vice President and Chief Counsel, Ameriprise Financial, Inc., since May 2010; Associate General Counsel, Bank of America from 2005 to April 2010. | |
Joseph F. DiMaria
225 Franklin Street
Boston, MA 02110
Born 1968 | | Vice President (2011) and Chief Accounting Officer (2008) | | Vice President — Mutual Fund Administration, Columbia Management Investment Advisers, LLC, since May 2010; previously, Director of Fund Administration, Columbia Management Advisors, LLC, from 2006 to April 2010. | |
Paul B. Goucher
100 Park Avenue
New York, NY 10017
Born 1968 | | Vice President (2011) and Assistant Secretary (2008) | | Vice President and Lead Chief Counsel, Ameriprise Financial, Inc., since November 2008 and January 2013, respectively (previously, Chief Counsel, from January 2010 to January 2013, and Group Counsel from November 2008 to January 2010); previously, Director, Managing Director and General Counsel, J. & W. Seligman & Co. Incorporated, from July 2008 to November 2008. | |
Amy Johnson
5228 Ameriprise
Financial Center
Minneapolis, MN
Born 1965 | | Vice President (2006) | | Senior Vice President and Chief Operating Officer, Columbia Management Investment Advisers, LLC, since May 2010; previously, Chief Administrative Officer, from 2009 to April 2010, and Vice President — Asset Management and Trust Company Services, from 2006 to 2009. | |
Paul D. Pearson
5228 Ameriprise
Financial Center
Minneapolis, MN
Born 1956 | | Vice President (2011) and Assistant Treasurer (1999) | | Vice President — Investment Accounting, Columbia Management Investment Advisers, LLC, since May 2010; previously, Vice President — Managed Assets, Investment Accounting, Ameriprise Financial, Inc. from 1998 to April 2010. | |
Christopher O. Petersen
5228 Ameriprise
Financial Center
Minneapolis, MN 55474
Born 1970 | | Vice President and Secretary (2010) | | Vice President and Chief Counsel, Ameriprise Financial, Inc., since January 2010 (previously, Vice President and Group Counsel or Counsel from 2004 to January 2010); officer of Columbia Funds and affiliated funds since 2007. | |
Stephen T. Welsh
225 Franklin Street
Boston, MA 02110
Born 1957 | | Vice President (2006) | | President and Director, Columbia Management Investment Services Corp., since May 2010; previously, President and Director, Columbia Management Services, Inc., from 2004 to April 2010; and Managing Director, Columbia Management Distributors, Inc., from 2007 to April 2010. | |
Annual Report 2014
45
This page intentionally left blank.
Annual Report 2014
46
This page intentionally left blank.
Annual Report 2014
47
This page intentionally left blank.
Annual Report 2014
48
Columbia High Yield Municipal Fund
Important Information About This Report
Each fund mails one shareholder report to each shareholder address. If you would like more than one report, please call shareholder services at 800.345.6611 and additional reports will be sent to you.
The policy of the Board is to vote the proxies of the companies in which each fund holds investments consistent with the procedures as stated in the Statement of Additional Information (SAI). You may obtain a copy of the SAI without charge by calling 800.345.6611; contacting your financial intermediary; visiting columbiamanagement.com; or searching the website of the Securities and Exchange Commission (SEC) at sec.gov. Information regarding how each fund voted proxies relating to portfolio securities is filed with the SEC by August 31 for the most recent 12-month period ending June 30 of that year, and is available without charge by visiting columbiamanagement.com; or searching the website of the SEC at sec.gov.
Each fund files a complete schedule of portfolio holdings with the SEC for the first and third quarters of each fiscal year on Form N-Q. Each fund's Form N-Q is available on the SEC's website at sec.gov and may be reviewed and copied at the SEC's Public Reference Room in Washington, D.C. Information on the operation of the Public Reference Room may be obtained by calling 800.SEC.0330. Each fund's complete schedule of portfolio holdings, as filed on Form N-Q, can also be obtained without charge, upon request, by calling 800.345.6611.
Annual Report 2014
49

Columbia High Yield Municipal Fund
P.O. Box 8081
Boston, MA 02266-8081
columbiamanagement.com
This information is for use with concurrent or prior delivery of a fund prospectus. Please read and consider the investment objectives, risks, charges and expenses for any fund carefully before investing. For a prospectus and, if available, a summary prospectus, which contains this and other important information about the Fund, go to columbiamanagement.com. The Fund is distributed by Columbia Management Investment Distributors, Inc., member FINRA, and managed by Columbia Management Investment Advisers, LLC.
© 2014 Columbia Management Investment Advisers, LLC. All rights reserved.
ANN161_05_D01_(07/14)
Annual Report
May 31, 2014

Columbia Risk Allocation Fund
Not FDIC insured • No bank guarantee • May lose value
 Dear Shareholders,
Continued Economic Recovery
The U.S. economy continued to recover at a slow but steady pace during the first quarter of 2014, supported by solid manufacturing activity, reasonable job growth and continued gains for the housing market. Industrial production was robust, buoyed by strong demand for autos and related parts. After a disappointing January, job growth picked up, which helped boost consumer confidence. Housing data was somewhat mixed, as harsh weather and higher mortgage rates put a damper on sales, while lower inventories helped prices trend higher. The Federal Reserve (the Fed) announced further reductions to its monthly asset purchases and reassured the markets that it would not make any significant changes to monetary policy until it was satisfied that the labor market was on solid ground. Despite mostly good news on the economic front, the broad financial markets recorded only modest gains, as bitter winter weather at home and mounting tensions between Russia and Western allies prompted investor caution.
Investors braced for higher interest rates, but long-term yields declined and the fixed-income markets were surprisingly resilient in the face of stable-to-improving economic data. Risk-on trading continued during the quarter as the higher yielding sectors of the fixed-income markets generally fared well. Emerging-market bonds, long-term U.S. Treasuries and sovereign debt were among the strongest performers, as were Treasury Inflation Protected Securities. Municipal bonds delivered solid gains, especially high-yield municipals, which benefited from continued improvement in state finances.
Against this backdrop, the broad bond market, as measured by the Barclays U.S. Aggregate Bond Index, edged out the broad stock market, as measured by the Standard & Poor's 500 Index, with gains of 1.84% vs. 1.81%, respectively. As indicated late last year, the Fed began tapering its monthly asset purchase program and announced further reductions. New Fed chair Janet Yellen reassured investors the Fed was committed to keeping short-term borrowing rates low into 2015.
Stay on Track with Columbia Management
Backed by more than 100 years of experience, Columbia Management is one of the nation's largest asset managers. At the heart of our success and, most importantly, that of our investors, are highly talented industry professionals, brought together by a unique way of working. At Columbia Management, reaching our performance goals matters, and how we reach them matters just as much.
Visit columbiamanagement.com for:
> The Columbia Management Perspectives blog, offering insights on current market events and investment opportunities
> Detailed up-to-date fund performance and portfolio information
> Quarterly fund commentaries
> Columbia Management investor, our award-winning quarterly newsletter for shareholders
Thank you for your continued support of the Columbia Funds. We look forward to serving your investment needs for many years to come.
Best Regards,

J. Kevin Connaughton
President, Columbia Funds
Investing involves risk including the risk of loss of principal.
The Barclays U.S. Aggregate Bond Index is a broad-based benchmark that measures the investment grade, U.S. dollar denominated, fixed-rate taxable bond market, including Treasuries, government-related and corporate securities, mortgage-backed securities (agency fixed-rate and hybrid adjustable-rate mortgage passthroughs), asset-backed securities, and commercial mortgage-backed securities. The S&P 500 Index, an unmanaged index, measures the performance of 500 widely held, large-capitalization U.S. stocks and is frequently used as a general measure of market performance. Indices are not available for investment, are not professionally managed and do not reflect sales charges, fees, brokerage commissions, taxes or other expenses of investing.
Investors should consider the investment objectives, risks, charges and expenses of a mutual fund carefully before investing. For a free prospectus and, if available, a summary prospectus, which contains this and other important information about a fund, visit columbiamanagement.com. The prospectus should be read carefully before investing.
Columbia Funds are distributed by Columbia Management Investment Distributors, Inc., member FINRA, and managed by Columbia Management Investment Advisers, LLC.
© 2014 Columbia Management Investment Advisers, LLC. All rights reserved.
Columbia Risk Allocation Fund
Performance Overview | | | 2 | | |
Manager Discussion of Fund Performance | | | 4 | | |
Understanding Your Fund's Expenses | | | 6 | | |
Portfolio of Investments | | | 7 | | |
Statement of Assets and Liabilities | | | 14 | | |
Statement of Operations | | | 16 | | |
Statement of Changes in Net Assets | | | 17 | | |
Financial Highlights | | | 19 | | |
Notes to Financial Statements | | | 26 | | |
Report of Independent Registered
Public Accounting Firm | | | 39 | | |
Federal Income Tax Information | | | 40 | | |
Trustees and Officers | | | 41 | | |
Important Information About This Report | | | 45 | | |
Fund Investment Manager
Columbia Management Investment
Advisers, LLC
225 Franklin Street
Boston, MA 02110
Fund Distributor
Columbia Management Investment
Distributors, Inc.
225 Franklin Street
Boston, MA 02110
Fund Transfer Agent
Columbia Management Investment
Services Corp.
P.O. Box 8081
Boston, MA 02266-8081
For more information about any of the funds, please visit columbiamanagement.com or call 800.345.6611. Customer Service Representatives are available to answer your questions Monday through Friday from 8 a.m. to 7 p.m. Eastern time.
The views expressed in this report reflect the current views of the respective parties. These views are not guarantees of future performance and involve certain risks, uncertainties and assumptions that are difficult to predict, so actual outcomes and results may differ significantly from the views expressed. These views are subject to change at any time based upon economic, market or other conditions and the respective parties disclaim any responsibility to update such views. These views may not be relied on as investment advice and, because investment decisions for a Columbia Fund are based on numerous factors, may not be relied on as an indication of trading intent on behalf of any particular Columbia Fund. References to specific securities should not be construed as a recommendation or investment advice.
Columbia Risk Allocation Fund
Performance Summary
> Columbia Risk Allocation Fund (the Fund) Class A shares returned 7.07% excluding sales charges for the 12-month period that ended May 31, 2014.
> During the same 12-month period, the Fund underperformed its Blended Benchmark, which returned 13.16% and outperformed the Citigroup 3-Month U.S. Treasury Bill Index, which returned 0.04%.
> On March 17, 2014, the Fund's investment strategy was modified to allow more tactical asset allocations and the Fund's asset allocation expanded to include exposure to four asset classes: global equity, global interest rates, global inflation and credit spreads. Prior to this expansion in strategy, the Fund underperformed its Blended Benchmark, fueled by strong equity returns and the Fund's underweight to equities relative to the risk budget of 60% equities/40% fixed-income securities.
> For the period from March 17, 2014 through May 31, 2014, the Fund modestly outperformed its Blended Benchmark. Equity and credit exposures were the largest positive contributors to returns, while its commodity exposure was a slight detractor.
Average Annual Total Returns (%) (for period ended May 31, 2014)
| | Inception | | 1 Year | | Life | |
Class A | | 06/19/12 | | | | | | | | | |
Excluding sales charges | | | | | | | 7.07 | | | | 5.75 | | |
Including sales charges | | | | | | | 0.95 | | | | 2.58 | | |
Class C | | 06/19/12 | | | | | | | | | |
Excluding sales charges | | | | | | | 6.07 | | | | 4.87 | | |
Including sales charges | | | | | | | 5.07 | | | | 4.87 | | |
Class K | | 06/19/12 | | | 7.18 | | | | 5.80 | | |
Class R | | 06/19/12 | | | 6.77 | | | | 5.48 | | |
Class R5 | | 06/19/12 | | | 7.47 | | | | 6.07 | | |
Class W | | 06/19/12 | | | 7.18 | | | | 5.81 | | |
Class Z | | 06/19/12 | | | 7.37 | | | | 6.03 | | |
Blended Benchmark | | | | | | | 13.16 | | | | 13.75 | | |
Citigroup 3-Month U.S. Treasury Bill Index | | | | | 0.04 | | | | 0.06 | | |
Returns for Class A are shown with and without the maximum initial sales charge of 5.75%. Returns for Class C are shown with and without the 1.00% contingent deferred sales charge for the first year only. The Fund's other classes are not subject to sales charges and have limited eligibility. Please see the Fund's prospectus for details. Performance for different share classes will vary based on differences in sales charges and fees associated with each class. All results shown assume reinvestment of distributions during the period. Returns do not reflect the deduction of taxes that a shareholder may pay on Fund distributions or on the redemption of Fund shares. Performance results reflect the effect of any fee waivers or reimbursements of Fund expenses by Columbia Management Investment Advisers, LLC and/or any of its affiliates. Absent these fee waivers or expense reimbursement arrangements, performance results would have been lower.
The performance information shown represents past performance and is not a guarantee of future results. The investment return and principal value of your investment will fluctuate so that your shares, when redeemed, may be worth more or less than their original cost. Current performance may be lower or higher than the performance information shown. You may obtain performance information current to the most recent month-end by contacting your financial intermediary, visiting columbiamanagement.com or calling 800.345.6611.
The Blended Benchmark, a weighted custom composite established by the Investment Manager, consists of a 60% weighting of the S&P 500 Index and a 40% weighting of the Barclays U.S. Aggregate Bond Index. The S&P 500 Index tracks the performance of 500 widely held, large capitalization U.S. stocks, and the Barclays U.S. Aggregate Bond Index is a market value-weighted index that tracks the daily price, coupon, pay-downs and total return performance of fixed-rate, publicly placed, dollar-denominated and non-convertible investment grade debt issues with at least $250 million par amount outstanding and with at least one year to final maturity.
The Citigroup 3-Month U.S. Treasury Bill Index is an unmanaged index that represents the performance of three-month Treasury bills and reflects reinvestment of all distributions and changes in market prices.
Indices are not available for investment, are not professionally managed and do not reflect sales charges, fees, brokerage commissions, taxes or other expenses of investing. Securities in the Fund may not match those in an index.
Annual Report 2014
2
Columbia Risk Allocation Fund
Performance Overview (continued)
Performance of a Hypothetical $10,000 Investment (June 19, 2012 – May 31, 2014)
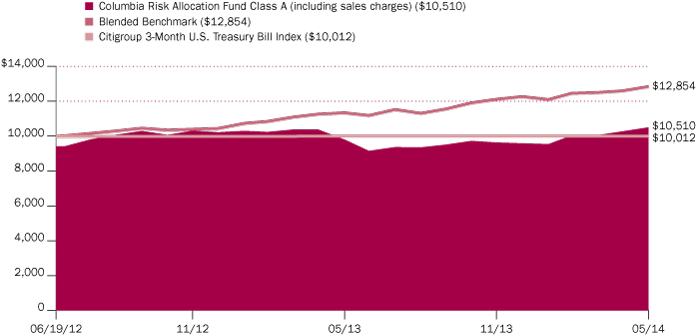
The chart above shows the change in value of a hypothetical $10,000 investment in Class A shares of Columbia Risk Allocation Fund during the stated time period, and does not reflect the deduction of taxes that a shareholder may pay on Fund distributions or on the redemption of Fund shares.
Annual Report 2014
3
Columbia Risk Allocation Fund
Manager Discussion of Fund Performance
For the 12-month period that ended May 31, 2014, the Fund's Class A shares returned 7.07% excluding sales charges. The Fund underperformed its Blended Benchmark, which returned 13.16% over the same time period. The Citigroup 3-Month U.S. Treasury Bill Index returned 0.04% during the 12-month period. The Fund takes a risk-based approach to allocating assets.
Equity Exposure Contributed Most Positively
The investment objective of the Fund is to pursue consistent total returns by seeking to allocate risks across multiple asset classes. Prior to March 17, 2014, the Fund's strategy was based on the belief that the best way to achieve consistent risk-adjusted returns was through the use of a risk-balanced structure comprised of equities, fixed income and inflation-hedging securities. The aim of the Fund was to improve upon the capital-based approach to asset allocation, which has tended to result in risk-concentrated portfolios, specifically in equities, over time. The Fund was designed to provide a more consistent return over the long term, while minimizing the severity and duration of drawdowns (peak-to-trough declines) relative to the traditional 60% equities/40% fixed income portfolio.
Based on this investment strategy, during the period from June 1, 2013 through March 14, 2014, the Fund's equity exposure contributed most positively to its absolute performance, while its fixed income and inflation-hedging securities exposures detracted. However, due to strong equity returns and the Fund's underweight to equities relative to the risk budget of a 60% equities/40% fixed-income balanced portfolio, the Fund underperformed its Blended Benchmark.
During these same months, new research by the Columbia Global Asset Allocation Team identified environments wherein a traditional risk-balanced approach may not be optimal. Thus, a revised strategy went into effect on March 17, 2014. The current investment process builds on the foundation of the Fund's original design, but with a more dynamic and flexible approach.
Effective March 17, 2014, the Fund began to use a global allocation strategy, taking a more flexible risk-based approach by allocating to four broad global asset classes: equities, interest rates (fixed-income securities issued by U.S. and non-U.S. governments), inflation and credit spreads (other fixed-income securities). With this new approach, the Fund employs market-based indicators to identify four distinct market states where a policy or benchmark portfolio has been designed to optimize the risk/return profile of that state. Once a policy is established, the Fund then employs a tactical overlay process driven by the portfolio managers' strategy outlook.
For the period from March 17, 2014 through May 31, 2014, the Fund modestly outperformed its Blended Benchmark. Equity and credit exposures were the largest positive contributors to returns, while its commodity exposure within its inflation-hedging allocation was a slight detractor.
New Investment Team
With the change in the Fund's investment strategy, a new investment team assumed portfolio management in mid-March 2014.
Portfolio Management
Jeffrey Knight, CFA
Orhan Imer, Ph.D., CFA*
Toby Nangle*
Beth Vanney, CFA
* Effective March 17, 2014, Messrs. Imer and Nangle were named as Portfolio Managers of the Fund. Todd White, Anwiti Bahuguna, Fred Copper and Kent Peterson no longer serve as Portfolio Managers of the Fund.
Portfolio Breakdown (%)
(at May 31, 2014) | |
Alternative Investment Funds | | | 10.8 | | |
Equity Funds | | | 13.2 | | |
Exchange-Traded Funds | | | 2.7 | | |
Exchange-Traded Notes | | | 2.3 | | |
Foreign Government Obligations | | | 0.8 | | |
Inflation-Indexed Bonds | | | 30.0 | | |
Money Market Funds | | | 33.0 | | |
Residential Mortgage-Backed
Securities — Agency | | | 3.2 | | |
U.S. Treasury Obligations | | | 4.0 | | |
Total | | | 100.0 | | |
Percentages indicated are based upon total investments. The Fund's portfolio composition is subject to change.
(a) Includes investments in Money Market Funds (amounting to $68.9 million) which have been segregated to cover obligations related to the Fund's investment in derivatives which provides exposure to multiple markets. For a description of the Fund's investments in derivatives, see Investments in Derivatives following the Portfolio of Investments, and Note 2 to the financial statements.
Market Exposure By Asset
Class Categories (%)(a)
(at May 31, 2014) | |
Equity Assets | | | 74.9 | | |
Inflation-Hedging Assets | | | 59.6 | | |
Spread Assets | | | 23.8 | | |
Interest Rate Assets | | | 18.0 | | |
(a) Percentages are based upon net assets. The percentages do not equal 100% due to the effects of leverage within the Fund's portfolio. Leverage exists when the Fund purchases or sells an instrument or enters into a transaction without investing cash in an amount equal to the full economic
Annual Report 2014
4
Columbia Risk Allocation Fund
Manager Discussion of Fund Performance (continued)
Looking Ahead
At the end of the annual period, we continued to favor equities over bonds, despite the modest underperformance of equities relative to bonds in 2014 year to date. This strong bond market performance was contrary to consensus expectations, which had forecast yields to rise above 3.5% this year. With the 10-year U.S. Treasury yielding less than 2.5% at the end of the annual period, investors may be questioning accelerating global economic growth expectations established at the start of 2014. First quarter 2014 U.S. gross domestic product was, in fact, disappointingly weak at -1.0%.
We currently believe U.S. economic growth will likely remain in a slowdown phase in the months ahead. A review of historical asset class performance in this phase indicates that equities may be likely to outperform bonds, as long as economic growth is positive. We were, in fact, beginning to see signs of improvement in the second quarter of 2014, including better payroll data and some stabilization in consumption trends on slightly better wage growth. Overall, the broad range of U.S. data continues to suggest to us a rebound in economic growth in the second calendar quarter, and thus we anticipate outperformance of equities over bonds.
In the weeks and months ahead, the durability of strong performance in risk asset markets is likely to be key, for, if bond yields fail to move higher and if risk assets begin to lose momentum, the market environment may become very challenging.
exposure of the instrument or transaction. The Fund's portfolio composition and it's market exposure is subject to change. Inflation-Hedging Assets may include, but are not limited to, direct or indirect investments in commodity-related investments, including certain types of commodities-linked derivatives and notes, and U.S. and non-U.S. inflation-linked bonds. Interest Rate Assets generally include fixed-income securities issued by U.S. and non-U.S. governments. Spread Assets generally include any other fixed-income securities.
Investment Risks
Market risk may affect a single issuer, sector of the economy, industry or the market as a whole. The Fund's investment in other funds subjects it to the investment performance (positive or negative), risks and expenses of these underlying funds. Asset allocation does not assure a profit or protect against loss. Investing in derivatives is a specialized activity that involves special risks, which may result in significant losses or limited gains. Commodity investments may be affected by the overall market and industry- and commodity-specific factors, and may be more volatile and less liquid than other investments. Short positions (where the underlying asset is not owned) can create unlimited risk. International investments may present different and increased risks from U.S. investments. Risks are enhanced for emerging market issuers. Investment in or exposure to foreign currencies subjects the fund to currency fluctuation and risk of loss. Investments in small- and mid-cap companies involve risks and volatility greater than investments in larger, more established companies. Fixed-income securities present issuer default risk. Interest payments on inflation-protected securities may be more volatile than interest paid on ordinary bonds. In periods of deflation, these securities provide no income. As a non-diversified fund, fewer investments could have a greater affect on performance. Investments selected using quantitative methods may perform differently from the market as a whole and may not enable the fund to achieve its objective. See the Fund's prospectus for information on these and other risks.
Annual Report 2014
5
Columbia Risk Allocation Fund
Understanding Your Fund's Expenses
(Unaudited)
As an investor, you incur two types of costs. There are transaction costs, which generally include sales charges on purchases and may include redemption fees. There are also ongoing costs, which generally include management fees, distribution and/or service fees, and other fund expenses. The following information is intended to help you understand your ongoing costs (in dollars) of investing in the Fund and to help you compare these costs with the ongoing costs of investing in other mutual funds.
Analyzing Your Fund's Expenses
To illustrate these ongoing costs, we have provided examples and calculated the expenses paid by investors in each share class of the Fund during the period. The actual and hypothetical information in the table is based on an initial investment of $1,000 at the beginning of the period indicated and held for the entire period. Expense information is calculated two ways and each method provides you with different information. The amount listed in the "Actual" column is calculated using the Fund's actual operating expenses and total return for the period. You may use the Actual information, together with the amount invested, to estimate the expenses that you paid over the period. Simply divide your account value by $1,000 (for example, an $8,600 account value divided by $1,000 = 8.6), then multiply the results by the expenses paid during the period under the "Actual" column. The amount listed in the "Hypothetical" column assumes a 5% annual rate of return before expenses (which is not the Fund's actual return) and then applies the Fund's actual expense ratio for the period to the hypothetical return. You should not use the hypothetical account values and expenses to estimate either your actual account balance at the end of the period or the expenses you paid during the period. See "Compare With Other Funds" below for details on how to use the hypothetical data.
Compare With Other Funds
Since all mutual funds are required to include the same hypothetical calculations about expenses in shareholder reports, you can use this information to compare the ongoing cost of investing in the Fund with other funds. To do so, compare the hypothetical example with the 5% hypothetical examples that appear in the shareholder reports of other funds. As you compare hypothetical examples of other funds, it is important to note that hypothetical examples are meant to highlight the ongoing costs of investing in a fund only and do not reflect any transaction costs, such as sales charges, or redemption or exchange fees. Therefore, the hypothetical calculations are useful in comparing ongoing costs only, and will not help you determine the relative total costs of owning different funds. If transaction costs were included in these calculations, your costs would be higher.
December 1, 2013 – May 31, 2014
| | Account Value at the
Beginning of the
Period ($) | | Account Value at
the End of the
Period ($) | | Expenses Paid During
the Period ($) | | Fund's
Annualized
Expense
Ratio (%) | | Effective Expenses
Paid During the
Period ($) | | Fund's
Effective
Annualized
Expense
Ratio (%) | |
| | Actual | | Hypothetical | | Actual | | Hypothetical | | Actual | | Hypothetical | | Actual | | Actual | | Hypothetical | | Actual | |
Class A | | | 1,000.00 | | | | 1,000.00 | | | | 1,090.20 | | | | 1,021.19 | | | | 3.91 | | | | 3.78 | | | | 0.75 | | | | 5.11 | | | | 4.94 | | | | 0.98 | | |
Class C | | | 1,000.00 | | | | 1,000.00 | | | | 1,084.50 | | | | 1,017.45 | | | | 7.80 | | | | 7.54 | | | | 1.50 | | | | 8.99 | | | | 8.70 | | | | 1.73 | | |
Class K | | | 1,000.00 | | | | 1,000.00 | | | | 1,091.30 | | | | 1,021.79 | | | | 3.28 | | | | 3.18 | | | | 0.63 | | | | 4.48 | | | | 4.33 | | | | 0.86 | | |
Class R | | | 1,000.00 | | | | 1,000.00 | | | | 1,088.30 | | | | 1,019.95 | | | | 5.21 | | | | 5.04 | | | | 1.00 | | | | 6.40 | | | | 6.19 | | | | 1.23 | | |
Class R5 | | | 1,000.00 | | | | 1,000.00 | | | | 1,093.20 | | | | 1,023.04 | | | | 1.98 | | | | 1.92 | | | | 0.38 | | | | 3.18 | | | | 3.08 | | | | 0.61 | | |
Class W | | | 1,000.00 | | | | 1,000.00 | | | | 1,091.30 | | | | 1,021.19 | | | | 3.91 | | | | 3.78 | | | | 0.75 | | | | 5.11 | | | | 4.94 | | | | 0.98 | | |
Class Z | | | 1,000.00 | | | | 1,000.00 | | | | 1,092.10 | | | | 1,022.44 | | | | 2.61 | | | | 2.52 | | | | 0.50 | | | | 3.81 | | | | 3.68 | | | | 0.73 | | |
Expenses paid during the period are equal to the Fund's annualized expense ratio for each class as indicated above, multiplied by the average account value over the period and then multiplied by the number of days in the Fund's most recent fiscal half year and divided by 365.
Effective expenses paid during the period and the Fund's effective annualized expense ratio include expenses borne directly to the class plus the Fund's pro rata portion of the ongoing expenses charged by the underlying funds using the expense ratio of each class of the underlying funds as of the underlying fund's most recent shareholder report.
Had Columbia Management Investment Advisers, LLC and/or certain of its affiliates not waived/reimbursed certain fees and expenses, account value at the end of the period would have been reduced.
Annual Report 2014
6
Columbia Risk Allocation Fund
Portfolio of Investments
May 31, 2014
(Percentages represent value of investments compared to net assets)
Equity Funds 14.0%
| | |
Shares | |
Value ($) | |
Real Estate 14.0% | |
Columbia Real Estate Equity Fund,
Class I Shares(a) | | | 1,831,980 | | | | 27,681,223 | | |
Total Equity Funds
(Cost: $27,191,544) | | | | | 27,681,223 | | |
Alternative Investment Funds 11.5%
Columbia Commodity Strategy Fund,
Class I Shares(a)(b) | | | 2,610,161 | | | | 22,630,094 | | |
Total Alternative Investment Funds
(Cost: $22,898,470) | | | | | 22,630,094 | | |
Residential Mortgage-Backed Securities — Agency 3.3%
Issuer | | Coupon
Rate | | Principal
Amount ($) | | Value ($) | |
Federal Home Loan Mortgage Corp.(c)(d)
06/12/44 | | | 3.500 | % | | | 1,080,000 | | | | 1,111,556 | | |
Federal National Mortgage Association(c)(d)
06/12/44 | | | 5.000 | % | | | 1,730,000 | | | | 1,911,650 | | |
06/17/29 | | | 2.500 | % | | | 1,240,000 | | | | 1,261,700 | | |
06/12/44 | | | 4.000 | % | | | 890,000 | | | | 943,261 | | |
Government National Mortgage Association(c)(d)
06/19/44 | | | 3.500 | % | | | 1,320,000 | | | | 1,372,800 | | |
Total Residential Mortgage-Backed Securities —
Agency
(Cost: $6,573,725) | | | | | | | 6,600,967 | | |
U.S. Treasury Obligations 4.3%
U.S. Treasury
02/28/21 | | | 2.000 | % | | | 187,500 | | | | 187,617 | | |
04/30/16 | | | 0.375 | % | | | 1,240,000 | | | | 1,240,872 | | |
02/15/21 | | | 3.625 | % | | | 2,375,000 | | | | 2,627,344 | | |
08/15/26 | | | 6.750 | % | | | 187,500 | | | | 268,828 | | |
08/15/27 | | | 6.375 | % | | | 150,000 | | | | 211,336 | | |
11/15/40 | | | 4.250 | % | | | 187,500 | | | | 221,924 | | |
02/15/42 | | | 3.125 | % | | | 375,000 | | | | 364,570 | | |
08/15/43 | | | 3.625 | % | | | 300,000 | | | | 318,375 | | |
10/31/18 | | | 1.750 | % | | | 750,000 | | | | 763,300 | | |
12/31/19 | | | 1.125 | % | | | 1,125,000 | | | | 1,089,844 | | |
01/31/20 | | | 1.375 | % | | | 1,075,000 | | | | 1,054,256 | | |
08/15/23 | | | 2.500 | % | | | 75,000 | | | | 75,773 | | |
Total U.S. Treasury Obligations
(Cost: $8,369,075) | | | | | | | 8,424,039 | | |
Foreign Government Obligations(e) 0.8%
Issuer | | Coupon
Rate | | Principal
Amount ($) | | Value ($) | |
Belgium Government Bond
06/22/24 | | | 2.600 | % | | EUR | 388,000 | | | | 562,831 | | |
Mexican Bonos
06/10/21 | | | 6.500 | % | | MXN | 5,500,000 | | | | 453,952 | | |
Spain Government Bond
01/31/22 | | | 5.850 | % | | EUR | 350,000 | | | | 591,374 | | |
Total Foreign Government Obligations
(Cost: $1,598,040) | | | | | | | 1,608,157 | | |
Inflation-Indexed Bonds(e) 31.7%
France Government Bond OAT
07/25/24 | | | 0.250 | % | | EUR | 4,396,103 | | | | 5,972,066 | | |
Italy Buoni Poliennali Del Tesoro
09/15/19 | | | 2.350 | % | | EUR | 2,824,507 | | | | 4,164,959 | | |
09/15/21 | | | 2.100 | % | | EUR | 2,791,455 | | | | 4,025,870 | | |
09/15/26 | | | 3.100 | % | | EUR | 1,379,469 | | | | 2,115,420 | | |
New Zealand Government Bond
Senior Unsecured
09/20/25 | | | 2.000 | % | | NZD | 2,492,736 | | | | 2,021,869 | | |
Sweden Inflation-Linked Bond
06/01/25 | | | 1.000 | % | | SEK | 12,573,903 | | | | 1,976,909 | | |
U.S. Treasury Inflation-Indexed Bond
01/15/21 | | | 1.125 | % | | | 5,699,216 | | | | 6,172,115 | | |
01/15/24 | | | 0.625 | % | | | 6,001,551 | | | | 6,229,119 | | |
01/15/25 | | | 2.375 | % | | | 3,429,252 | | | | 4,173,350 | | |
01/15/29 | | | 2.500 | % | | | 1,651,230 | | | | 2,090,751 | | |
02/15/40 | | | 2.125 | % | | | 2,597,015 | | | | 3,290,129 | | |
02/15/44 | | | 1.375 | % | | | 3,802,875 | | | | 4,156,741 | | |
United Kingdom Gilt Inflation-Linked
03/22/34 | | | 0.750 | % | | GBP | 4,124,833 | | | | 8,092,187 | | |
03/22/44 | | | 0.125 | % | | GBP | 4,545,142 | | | | 8,075,465 | | |
Total Inflation-Indexed Bonds
(Cost: $62,130,331) | | | | | | | 62,556,950 | | |
Exchange-Traded Funds 2.8%
| | | Shares | | Value ($) | |
iShares MSCI Canada ETF | | | 183,273 | | | | 5,626,481 | | |
Total Exchange-Traded Funds
(Cost: $5,617,170) | | | | | 5,626,481 | | |
Exchange-Traded Notes 2.5%
iPath Dow Jones-UBS Commodity
Index Total Return ETN(b) | | | 123,579 | | | | 4,843,061 | | |
Total Exchange-Traded Notes
(Cost: $5,011,054) | | | | | 4,843,061 | | |
The accompanying Notes to Financial Statements are an integral part of this statement.
Annual Report 2014
7
Columbia Risk Allocation Fund
Portfolio of Investments (continued)
May 31, 2014
Money Market Funds 34.9%
| | | Shares | | Value ($) | |
Columbia Short-Term Cash Fund,
0.092%(a)(f) | | | 68,867,224 | | | | 68,867,224 | | |
Total Money Market Funds
(Cost: $68,867,224) | | | | | 68,867,224 | | |
Total Investments
(Cost: $208,256,633) | | | | | 208,838,196 | | |
Other Assets & Liabilities, Net | | | | | (11,393,884 | ) | |
Net Assets | | | | | 197,444,312 | | |
Investments in Derivatives
Forward Foreign Currency Exchange Contracts Open at May 31, 2014
Counterparty | | Exchange Date | | Currency to
be Delivered | | Currency to
be Received | | Unrealized
Appreciation ($) | | Unrealized
Depreciation ($) | |
Barclays Bank, PLC | | 06/17/2014
| | | 415,000
EUR | | | | 570,012
USD | | | | 4,320
| | | | —
| | |
Barclays Bank, PLC | | 06/19/2014
| | | 8,960,000
SEK | | | | 1,353,541
USD | | | | 15,030
| | | | —
| | |
Citigroup Global Markets Inc. | | 06/23/2014
| | | 500,000
AUD | | | | 468,670
USD | | | | 3,988
| | | | —
| | |
Goldman, Sachs & Co. | | 07/02/2014 | | | 35,636
USD | | | | 375,000
ZAR | | | | —
| | | | (367
| ) | |
Goldman, Sachs & Co. | | 07/09/2014 | | | 65,268
USD | | | | 200,000
PLN | | | | 500
| | | | —
| | |
HSBC Securities (USA), Inc. | | 06/11/2014 | | | 2,557,294
USD | | | | 261,000,000
JPY | | | | 6,685
| | | | —
| | |
HSBC Securities (USA), Inc. | | 06/24/2014 | | | 322,739
USD | | | | 350,000
CAD | | | | —
| | | | (114
| ) | |
HSBC Securities (USA), Inc. | | 06/24/2014 | | | 1,217,642
USD | | | | 1,325,000
CAD | | | | 3,722
| | | | —
| | |
J.P. Morgan Securities, Inc. | | 07/11/2014 | | | 45,691
USD | | | | 250,000
DKK | | | | —
| | | | (15
| ) | |
Standard Chartered Bank | | 06/12/2014 | | | 7,659
USD | | | | 25,000
MYR | | | | 114
| | | | —
| | |
Standard Chartered Bank | | 06/12/2014 | | | 15,592
USD | | | | 50,000
MYR | | | | —
| | | | (47
| ) | |
Standard Chartered Bank | | 06/19/2014 | | | 1,900,000
GBP | | | | 3,190,627
USD | | | | 6,234
| | | | —
| | |
Standard Chartered Bank | | 06/20/2014 | | | 5,000,000
MXN | | | | 386,659
USD | | | | —
| | | | (1,723
| ) | |
The accompanying Notes to Financial Statements are an integral part of this statement.
Annual Report 2014
8
Columbia Risk Allocation Fund
Portfolio of Investments (continued)
May 31, 2014
Forward Foreign Currency Exchange Contracts Open at May 31, 2014 (continued)
Counterparty | | Exchange Date | | Currency to
be Delivered | | Currency to
be Received | | Unrealized
Appreciation ($) | | Unrealized
Depreciation ($) | |
State Street Bank & Trust Company | | 06/05/2014 | | | 12,578
USD | | | | 75,000
NOK | | | | —
| | | | (33
| ) | |
State Street Bank & Trust Company | | 06/05/2014 | | | 24,965
USD | | | | 150,000
NOK | | | | 126
| | | | —
| | |
State Street Bank & Trust Company | | 06/20/2014 | | | 847,956
USD | | | | 1,900,000
BRL | | | | —
| | | | (3,929
| ) | |
Total | | | | | | | | | 40,719 | | | | (6,228 | ) | |
Futures Contracts Outstanding at May 31, 2014
At May 31, 2014, cash totaling $4,953,096 was pledged as collateral to cover initial margin requirements on open futures contracts.
Contract Description | | Number of
Contracts
Long (Short) | | Trading
Currency | | Notional
Market
Value ($) | | Expiration
Date | | Unrealized
Appreciation ($) | | Unrealized
Depreciation ($) | |
| 10YR MINI JGB | | | 21 | | | JPY | | | | | 3,001,061 | | | 06/2014 | | | 9,780 | | | | — | | |
AUST 3YR BOND | | | 9 | | | AUD | | | | | 914,953 | | | 06/2014 | | | 2,088 | | | | — | | |
CAN 10YR BOND | | | 2 | | | CAD | | | | | 250,558 | | | 09/2014 | | | 1,475 | | | | — | | |
EMINI MSCI EAFE INDEX | | | 558 | | | USD | | | | | 54,647,730 | | | 06/2014 | | | 807,438 | | | | — | | |
| EURO BUXL 30YR BOND | | | 2 | | | EUR | | | | | 365,270 | | | 06/2014 | | | 4,856 | | | | — | | |
EURO-BTP (ITALY GOVT) | | | 8 | | | EUR | | | | | 1,365,004 | | | 06/2014 | | | 18,637 | | | | — | | |
| EURO-BUND | | | 3 | | | EUR | | | | | 600,372 | | | 06/2014 | | | 5,298 | | | | — | | |
| EURO-OAT | | | 5 | | | EUR | | | | | 955,364 | | | 06/2014 | | | 7,001 | | | | — | | |
LONG GILT | | | 8 | | | GBP | | | | | 1,485,246 | | | 09/2014 | | | 12,281 | | | | — | | |
MSCI EMER MKT MIN | | | 314 | | | USD | | | | | 16,086,220 | | | 06/2014 | | | 200,443 | | | | — | | |
S&P 500 EMINI | | | 745 | | | USD | | | | | 71,575,875 | | | 06/2014 | | | 1,165,212 | | | | — | | |
SHORT EURO-BTP (ITALY GOVT) | | | 6 | | | EUR | | | | | 906,877 | | | 06/2014 | | | 1,761 | | | | — | | |
US 10YR NOTE | | | 1 | | | USD | | | | | 125,516 | | | 09/2014 | | | 108 | | | | — | | |
US LONG BOND | | | 4 | | | USD | | | | | 549,875 | | | 09/2014 | | | — | | | | (1,789 | ) | |
US ULTRA T-BOND | | | 6 | | | USD | | | | | 901,688 | | | 09/2014 | | | — | | | | (3,902 | ) | |
Total | | | | | | | | | | | 2,236,378 | | | | (5,691 | ) | |
Credit Default Swap Contracts Outstanding at May 31, 2014
At May 31, 2014, cash totaling $670,000 was received from broker as collateral to cover open credit default swap contracts.
At May 31, 2014, cash totaling $1,942,701 was pledged as collateral to cover open centrally cleared credit default swap contracts.
The accompanying Notes to Financial Statements are an integral part of this statement.
Annual Report 2014
9
Columbia Risk Allocation Fund
Portfolio of Investments (continued)
May 31, 2014
Credit Default Swap Contracts Outstanding at May 31, 2014 (continued)
Sell Protection
Counterparty | | Reference
Entity | | Expiration
Date | | Receive
Fixed
Rate (%) | | Implied Credit
Spread (%)** | | Notional
Amount ($) | | Market
Value ($) | | Unamortized
Premium
(Paid)
Received ($) | | Periodic
Payments
Receivable
(Payable) ($) | | Unrealized
Appreciation
($) | | Unrealized
Depreciation
($) | |
Goldman Sachs
International | | CDX Emerging
Markets
Index 21-V1 | | 06/20/2019 | | | 5.000 | | | | 2.49 | | | | 6,250,000 | | | | 723,973 | | | | (621,156 | ) | | | 62,500 | | | | 165,317 | | | | — | | |
Morgan Stanley | | CDX Emerging
Markets
Index 21-V1 | | 06/20/2019 | | | 5.000 | | | | 2.49 | | | | 5,250,000 | | | | 608,137 | | | | (573,632 | ) | | | 52,500 | | | | 87,005 | | | | — | | |
Morgan Stanley* | | CDX North
America
High Yield 22-V1 | | 06/20/2019 | | | 5.000 | | | | 3.13 | | | | 11,880,000 | | | | 138,368 | | | | — | | | | 118,800 | | | | 257,168 | | | | — | | |
Morgan Stanley* | | CDX North
America
Investment
Grade 22-V1 | | 06/20/2019 | | | 1.000 | | | | 0.62 | | | | 17,000,000 | | | | 25,569 | | | | — | | | | 34,000 | | | | 59,569 | | | | — | | |
Total | | | | | | | | | | | | | | | | | | | 569,059 | | | | — | | |
* Centrally cleared swap contract
**Implied credit spreads, represented in absolute terms, utilized in determining the market value of credit default swap agreements on corporate or sovereign issues as of period end serve as an indicator of the current status of the payment/performance risk and represent the likelihood or risk of default for the credit derivative. The implied credit spread of a particular referenced entity reflects the cost of buying/selling protection and may include upfront payments required to be made to enter into the agreement. Wider credit spreads represent a deterioration of the referenced entity's credit soundness and a greater likelihood or risk of default or other credit event occurring as defined under the terms of the agreement.
Interest Rate Swap Contracts Outstanding at May 31, 2014
At May 31, 2014, cash totaling $1,157,653 was pledged as collateral to cover open centrally cleared interest rate swap contracts.
Counterparty | | Floating Rate
Index | | Fund
Pay/
Receive
Floating
Rate | | Fixed
Rate (%) | | Expiration
Date | | Notional
Currency | | Notional
Amount ($) | | Unamortized
Premium
(Paid)
Received ($) | | Unrealized
Appreciation
($) | | Unrealized
Depreciation
($) | |
Morgan Stanley*
| | 3-Month
USD LIBOR-BBA | | Pay
| | | 2.2870
| | | 05/02/2021
| | USD |
| | | | 11,000,000
| | | | (65
| ) | | | 168,598
| | | | —
| | |
Morgan Stanley*
| | 3-Month
USD LIBOR-BBA | | Pay
| | | 3.1590
| | | 05/02/2029
| | USD |
| | | | 3,000,000
| | | | (30
| ) | | | 76,684
| | | | —
| | |
Total | | | | | | | | | | | | | | | | | 245,282 | | | | — | | |
*Centrally cleared swap contract
The accompanying Notes to Financial Statements are an integral part of this statement.
Annual Report 2014
10
Columbia Risk Allocation Fund
Portfolio of Investments (continued)
May 31, 2014
Notes to Portfolio of Investments
(a) As defined in the Investment Company Act of 1940, an affiliated company is one in which the Fund owns 5% or more of its outstanding voting securities, or a company which is under common ownership or control with the Fund. Holdings and transactions in these affiliated companies during the year ended May 31, 2014, are as follows:
Issuer | | Beginning
Cost ($) | | Purchase
Cost ($) | | Proceeds
From Sales ($) | | Realized
Gain (Loss) ($) | | Ending
Cost ($) | | Dividends —
Affiliated
Issuers ($) | | Value ($) | |
Columbia Absolute
Return Enhanced
Multi-Strategy Fund,
Class I Shares* | | | — | | | | 2,897,598 | | | | (2,798,005 | ) | | | (99,593 | ) | | | — | | | | 14,598 | | | | — | | |
Columbia
Commodity
Strategy Fund,
Class I Shares | | | 3,008,001 | | | | 23,183,999 | | | | (3,112,000 | ) | | | (181,530 | ) | | | 22,898,470 | | | | — | | | | 22,630,094 | | |
Columbia Emerging
Markets Fund,
Class I Shares* | | | 1,798,701 | | | | 1,088,129 | | | | (2,971,675 | ) | | | 84,845 | | | | — | | | | 10,129 | | | | — | | |
Columbia
Real Estate
Equity Fund,
Class I Shares | | | — | | | | 27,191,544 | | | | — | | | | — | | | | 27,191,544 | | | | 2,544 | | | | 27,681,223 | | |
Columbia
Short-Term
Cash Fund | | | 8,436,243 | | | | 142,939,238 | | | | (82,508,257 | ) | | | — | | | | 68,867,224 | | | | 8,255 | | | | 68,867,224 | | |
Total | | | 13,242,945 | | | | 197,300,508 | | | | (91,389,937 | ) | | | (196,278 | ) | | | 118,957,238 | | | | 35,526 | | | | 119,178,541 | | |
*Issuer was not an affiliate for the entire period ended May 31, 2014.
(b) Non-income producing.
(c) Represents a security purchased on a when-issued or delayed delivery basis.
(d) The maturity dates shown represent the original maturity of the underlying obligation. Actual maturity may vary based upon prepayment activity on these obligations. Unless otherwise noted, the coupon rates presented are fixed rates.
(e) Principal amounts are denominated in United States Dollars unless otherwise noted.
(f) The rate shown is the seven-day current annualized yield at May 31, 2014.
Currency Legend
AUD Australian Dollar
BRL Brazilian Real
CAD Canadian Dollar
DKK Danish Krone
EUR Euro
GBP British Pound
JPY Japanese Yen
MXN Mexican Peso
MYR Malaysia Ringgits
NOK Norwegian Krone
NZD New Zealand Dollar
PLN Polish Zloty
SEK Swedish Krona
USD US Dollar
ZAR South African Rand
The accompanying Notes to Financial Statements are an integral part of this statement.
Annual Report 2014
11
Columbia Risk Allocation Fund
Portfolio of Investments (continued)
May 31, 2014
Fair Value Measurements
Generally accepted accounting principles (GAAP) require disclosure regarding the inputs and valuation techniques used to measure fair value and any changes in valuation inputs or techniques. In addition, investments shall be disclosed by major category.
The Fund categorizes its fair value measurements according to a three-level hierarchy that maximizes the use of observable inputs and minimizes the use of unobservable inputs by prioritizing that the most observable input be used when available. Observable inputs are those that market participants would use in pricing an investment based on market data obtained from sources independent of the reporting entity. Unobservable inputs are those that reflect the Fund's assumptions about the information market participants would use in pricing an investment. An investment's level within the fair value hierarchy is based on the lowest level of any input that is deemed significant to the asset or liability's fair value measurement. The input levels are not necessarily an indication of the risk or liquidity associated with investments at that level. For example, certain U.S. government securities are generally high quality and liquid, however, they are reflected as Level 2 because the inputs used to determine fair value may not always be quoted prices in an active market.
Fair value inputs are summarized in the three broad levels listed below:
> Level 1 — Valuations based on quoted prices for investments in active markets that the Fund has the ability to access at the measurement date (including NAV for open-end mutual funds). Valuation adjustments are not applied to Level 1 investments.
> Level 2 — Valuations based on other significant observable inputs (including quoted prices for similar securities, interest rates, prepayment speeds, credit risks, etc.).
> Level 3 — Valuations based on significant unobservable inputs (including the Fund's own assumptions and judgment in determining the fair value of investments).
Inputs that are used in determining fair value of an investment may include price information, credit data, volatility statistics, and other factors. These inputs can be either observable or unobservable. The availability of observable inputs can vary between investments, and is affected by various factors such as the type of investment, and the volume and level of activity for that investment or similar investments in the marketplace. The inputs will be considered by the Investment Manager, along with any other relevant factors in the calculation of an investment's fair value. The Fund uses prices and inputs that are current as of the measurement date, which may include periods of market dislocations. During these periods, the availability of prices and inputs may be reduced for many investments. This condition could cause an investment to be reclassified between the various levels within the hierarchy.
Foreign equity securities actively traded in markets where there is a significant delay in the local close relative to the New York Stock Exchange (NYSE) are classified as Level 2. The values of these securities may include an adjustment to reflect the impact of significant market movements following the close of local trading, as described in Note 2 to the financial statements — Security Valuation.
Investments falling into the Level 3 category are primarily supported by quoted prices from brokers and dealers participating in the market for those investments. However, these may be classified as Level 3 investments due to lack of market transparency and corroboration to support these quoted prices. Additionally, valuation models may be used as the pricing source for any remaining investments classified as Level 3. These models may rely on one or more significant unobservable inputs and/or significant assumptions by the Investment Manager. Inputs used in valuations may include, but are not limited to, financial statement analysis, capital account balances, discount rates and estimated cash flows, and comparable company data.
Under the direction of the Fund's Board of Trustees (the Board), the Investment Manager's Valuation Committee (the Committee) is responsible for overseeing the valuation procedures approved by the Board. The Committee consists of voting and non-voting members from various groups within the Investment Manager's organization, including operations and accounting, trading and investments, compliance, risk management and legal.
The Committee meets at least monthly to review and approve valuation matters, which may include a description of specific valuation determinations, data regarding pricing information received from approved pricing vendors and brokers and the results of Board-approved valuation control policies and procedures (the Policies). The Policies address, among other things, instances when market quotations are or are not readily available, including recommendations of third party pricing vendors and a determination of appropriate pricing methodologies; events that require specific valuation determinations and assessment of fair value techniques; securities with a potential for stale pricing, including those that are illiquid, restricted, or in default; and the effectiveness of third party pricing vendors, including periodic reviews of vendors. The Committee meets more frequently, as needed, to discuss additional valuation matters, which may include the need to review back-testing results, review time-sensitive information or approve related valuation actions. The Committee reports to the Board, with members of the Committee meeting with the Board at each of its regularly scheduled meetings to discuss valuation matters and actions during the period, similar to those described earlier.
For investments categorized as Level 3, the Committee monitors information similar to that described above, which may include: (i) data specific to the issuer or comparable issuers, (ii) general market or specific sector news and (iii) quoted prices and specific or similar security transactions. The Committee considers this data and any changes from prior periods in order to assess the reasonableness of observable and unobservable inputs, any assumptions or internal models used to value those securities and changes in fair value. This data is also used to corroborate, when available, information received from approved pricing vendors and brokers. Various factors impact the frequency of monitoring this information (which may occur as often as daily). However, the Committee may determine that changes to inputs, assumptions and models are not required as a result of the monitoring procedures performed.
The accompanying Notes to Financial Statements are an integral part of this statement.
Annual Report 2014
12
Columbia Risk Allocation Fund
Portfolio of Investments (continued)
May 31, 2014
Fair Value Measurements (continued)
The following table is a summary of the inputs used to value the Fund's investments at May 31, 2014:
Description | | Level 1
Quoted Prices in Active
Markets for Identical
Assets ($) | | Level 2
Other Significant
Observable Inputs ($) | | Level 3
Significant
Unobservable Inputs ($) | | Total ($) | |
Mutual Funds | |
Equity Funds | | | 27,681,223 | | | | — | | | | — | | | | 27,681,223 | | |
Alternative Investment Funds | | | 22,630,094 | | | | — | | | | — | | | | 22,630,094 | | |
Money Market Funds | | | 68,867,224 | | | | — | | | | — | | | | 68,867,224 | | |
Total Mutual Funds | | | 119,178,541 | | | | — | | | | — | | | | 119,178,541 | | |
Bonds | |
Residential Mortgage-Backed
Securities — Agency | | | — | | | | 6,600,967 | | | | — | | | | 6,600,967 | | |
U.S. Treasury Obligations | | | 8,424,039 | | | | — | | | | — | | | | 8,424,039 | | |
Foreign Government Obligations | | | — | | | | 1,608,157 | | | | — | | | | 1,608,157 | | |
Inflation-Indexed Bonds | | | — | | | | 62,556,950 | | | | — | | | | 62,556,950 | | |
Total Bonds | | | 8,424,039 | | | | 70,766,074 | | | | — | | | | 79,190,113 | | |
Equity Securities | |
Exchange-Traded Funds | | | 5,626,481 | | | | — | | | | — | | | | 5,626,481 | | |
Total Equity Securities | | | 5,626,481 | | | | — | | | | — | | | | 5,626,481 | | |
Other | |
Exchange-Traded Notes | | | 4,843,061 | | | | — | | | | — | | | | 4,843,061 | | |
Total Other | | | 4,843,061 | | | | — | | | | — | | | | 4,843,061 | | |
Investments in Securities | | | 138,072,122 | | | | 70,766,074 | | | | — | | | | 208,838,196 | | |
Derivatives | |
Assets | |
Forward Foreign Currency
Exchange Contracts | | | — | | | | 40,719 | | | | — | | | | 40,719 | | |
Futures Contracts | | | 2,236,378 | | | | — | | | | — | | | | 2,236,378 | | |
Swap Contracts | | | — | | | | 814,341 | | | | — | | | | 814,341 | | |
Liabilities | |
Forward Foreign Currency
Exchange Contracts | | | — | | | | (6,228 | ) | | | — | | | | (6,228 | ) | |
Futures Contracts | | | (5,691 | ) | | | — | | | | — | | | | (5,691 | ) | |
Total | | | 140,302,809 | | | | 71,614,906 | | | | — | | | | 211,917,715 | | |
See the Portfolio of Investments for all investment classifications not indicated in the table.
The Fund's assets assigned to the Level 2 input category are generally valued using the market approach, in which a security's value is determined through reference to prices and information from market transactions for similar or identical assets.
There were no transfers of financial assets between levels during the period.
Derivative instruments are valued at unrealized appreciation (depreciation).
The accompanying Notes to Financial Statements are an integral part of this statement.
Annual Report 2014
13
Columbia Risk Allocation Fund
Statement of Assets and Liabilities
May 31, 2014
Assets | |
Investments, at value | |
Unaffiliated issuers (identified cost $89,299,395) | | $ | 89,659,655 | | |
Affiliated issuers (identified cost $118,957,238) | | | 119,178,541 | | |
Total investments (identified cost $208,256,633) | | | 208,838,196 | | |
Foreign currency (identified cost $4,010) | | | 3,991 | | |
Margin deposits | | | 8,053,450 | | |
Unrealized appreciation on forward foreign currency exchange contracts | | | 40,719 | | |
Unrealized appreciation on swap contracts | | | 252,322 | | |
Premiums paid on outstanding swap contracts | | | 1,194,883 | | |
Receivable for: | |
Investments sold | | | 21,040,312 | | |
Investments sold on a delayed delivery basis | | | 8,419,008 | | |
Capital shares sold | | | 340,417 | | |
Dividends | | | 3,414 | | |
Interest | | | 344,385 | | |
Reclaims | | | 5,651 | | |
Variation margin | | | 141,452 | | |
Expense reimbursement due from Investment Manager | | | 1,323 | | |
Prepaid expenses | | | 18 | | |
Trustees' deferred compensation plan | | | 3,815 | | |
Total assets | | | 248,683,356 | | |
Liabilities | |
Unrealized depreciation on forward foreign currency exchange contracts | | | 6,228 | | |
Payable for: | |
Investments purchased | | | 35,383,183 | | |
Investments purchased on a delayed delivery basis | | | 14,926,309 | | |
Capital shares purchased | | | 632,062 | | |
Variation margin | | | 208,171 | | |
Investment management fees | | | 2,954 | | |
Distribution and/or service fees | | | 1,320 | | |
Transfer agent fees | | | 32,093 | | |
Administration fees | | | 325 | | |
Plan administration fees | | | 1 | | |
Compensation of board members | | | 297 | | |
Chief compliance officer expenses | | | 1 | | |
Other expenses | | | 42,285 | | |
Trustees' deferred compensation plan | | | 3,815 | | |
Total liabilities | | | 51,239,044 | | |
Net assets applicable to outstanding capital stock | | $ | 197,444,312 | | |
Represented by | |
Paid-in capital | | $ | 193,101,461 | | |
Undistributed net investment income | | | 90,652 | | |
Accumulated net realized gain | | | 593,739 | | |
Unrealized appreciation (depreciation) on: | |
Investments — unaffiliated issuers | | | 360,260 | | |
Investments — affiliated issuers | | | 221,303 | | |
Foreign currency translations | | | (2,622 | ) | |
Forward foreign currency exchange contracts | | | 34,491 | | |
Futures contracts | | | 2,230,687 | | |
Swap contracts | | | 814,341 | | |
Total — representing net assets applicable to outstanding capital stock | | $ | 197,444,312 | | |
The accompanying Notes to Financial Statements are an integral part of this statement.
Annual Report 2014
14
Columbia Risk Allocation Fund
Statement of Assets and Liabilities (continued)
May 31, 2014
Class A | |
Net assets | | $ | 7,280,636 | | |
Shares outstanding | | | 711,039 | | |
Net asset value per share | | $ | 10.24 | | |
Maximum offering price per share(a) | | $ | 10.86 | | |
Class C | |
Net assets | | $ | 416,413 | | |
Shares outstanding | | | 41,168 | | |
Net asset value per share | | $ | 10.11 | | |
Class K | |
Net assets | | $ | 2,772 | | |
Shares outstanding | | | 270 | | |
Net asset value per share(b) | | $ | 10.25 | | |
Class R | |
Net assets | | $ | 2,759 | | |
Shares outstanding | | | 270 | | |
Net asset value per share(b) | | $ | 10.20 | | |
Class R5 | |
Net assets | | $ | 26,008 | | |
Shares outstanding | | | 2,528 | | |
Net asset value per share | | $ | 10.29 | | |
Class W | |
Net assets | | $ | 183,245,929 | | |
Shares outstanding | | | 17,872,765 | | |
Net asset value per share | | $ | 10.25 | | |
Class Z | |
Net assets | | $ | 6,469,795 | | |
Shares outstanding | | | 629,387 | | |
Net asset value per share | | $ | 10.28 | | |
(a) The maximum offering price per share is calculated by dividing the net asset value per share by 1.0 minus the maximum sales charge of 5.75%.
(b) Net asset value per share rounds to this amount due to fractional shares outstanding.
The accompanying Notes to Financial Statements are an integral part of this statement.
Annual Report 2014
15
Columbia Risk Allocation Fund
Statement of Operations
Year Ended May 31, 2014
Net investment income | |
Income: | |
Dividends — unaffiliated issuers | | $ | 903 | | |
Dividends — affiliated issuers | | | 35,526 | | |
Interest | | | 226,672 | | |
Total income | | | 263,101 | | |
Expenses: | |
Investment management fees | | | 112,337 | | |
Distribution and/or service fees | |
Class A | | | 17,757 | | |
Class C | | | 7,517 | | |
Class R | | | 12 | | |
Class W | | | 26,568 | | |
Transfer agent fees | |
Class A | | | 23,252 | | |
Class C | | | 2,491 | | |
Class K | | | 1 | | |
Class R | | | 7 | | |
Class R5 | | | 2 | | |
Class W | | | 23,452 | | |
Class Z | | | 16,795 | | |
Administration fees | | | 14,195 | | |
Plan administration fees | |
Class K | | | 6 | | |
Compensation of board members | | | 21,179 | | |
Custodian fees | | | 21,029 | | |
Printing and postage fees | | | 26,406 | | |
Registration fees | | | 108,537 | | |
Professional fees | | | 34,811 | | |
Chief compliance officer expenses | | | 6 | | |
Other | | | 13,040 | | |
Total expenses | | | 469,400 | | |
Fees waived or expenses reimbursed by Investment Manager and its affiliates | | | (299,257 | ) | |
Total net expenses | | | 170,143 | | |
Net investment income | | | 92,958 | | |
Realized and unrealized gain (loss) — net | |
Net realized gain (loss) on: | |
Investments — unaffiliated issuers | | | 55,499 | | |
Investments — affiliated issuers | | | (196,278 | ) | |
Foreign currency translations | | | 36,527 | | |
Forward foreign currency exchange contracts | | | 14,076 | | |
Futures contracts | | | 673,470 | | |
Swap contracts | | | 292,615 | | |
Net realized gain | | | 875,909 | | |
Net change in unrealized appreciation (depreciation) on: | |
Investments — unaffiliated issuers | | | 680,608 | | |
Investments — affiliated issuers | | | 263,382 | | |
Foreign currency translations | | | 4,766 | | |
Forward foreign currency exchange contracts | | | 34,491 | | |
Futures contracts | | | 2,072,793 | | |
Swap contracts | | | 1,063,339 | | |
Net change in unrealized appreciation (depreciation) | | | 4,119,379 | | |
Net realized and unrealized gain | | | 4,995,288 | | |
Net increase in net assets resulting from operations | | $ | 5,088,246 | | |
The accompanying Notes to Financial Statements are an integral part of this statement.
Annual Report 2014
16
Columbia Risk Allocation Fund
Statement of Changes in Net Assets
| | | Year Ended
May 31,
2014 | | Year Ended
May 31,
2013(a) | |
Operations | |
Net investment income (loss) | | $ | 92,958 | | | $ | (44,233 | ) | |
Net realized gain | | | 875,909 | | | | 800,913 | | |
Net change in unrealized appreciation (depreciation) | | | 4,119,379 | | | | (460,919 | ) | |
Net increase in net assets resulting from operations | | | 5,088,246 | | | | 295,761 | | |
Distributions to shareholders | |
Net investment income | |
Class A | | | — | | | | (92,647 | ) | |
Class C | | | — | | | | (5,059 | ) | |
Class K | | | — | | | | (35 | ) | |
Class R | | | — | | | | (31 | ) | |
Class R5 | | | — | | | | (38 | ) | |
Class W | | | — | | | | (35 | ) | |
Class Z | | | — | | | | (77,174 | ) | |
Net realized gains | |
Class A | | | (325,536 | ) | | | (151,405 | ) | |
Class C | | | (25,110 | ) | | | (11,866 | ) | |
Class K | | | (120 | ) | | | (57 | ) | |
Class R | | | (120 | ) | | | (57 | ) | |
Class R5 | | | (120 | ) | | | (57 | ) | |
Class W | | | (120 | ) | | | (57 | ) | |
Class Z | | | (244,580 | ) | | | (114,400 | ) | |
Total distributions to shareholders | | | (595,706 | ) | | | (452,918 | ) | |
Increase (decrease) in net assets from capital stock activity | | | 178,259,541 | | | | 4,849,388 | | |
Total increase in net assets | | | 182,752,081 | | | | 4,692,231 | | |
Net assets at beginning of year | | | 14,692,231 | | | | 10,000,000 | | |
Net assets at end of year | | $ | 197,444,312 | | | $ | 14,692,231 | | |
Undistributed net investment income | | $ | 90,652 | | | $ | 44,645 | | |
(a) For the period from June 19, 2012 (commencement of operations) to May 31, 2013.
The accompanying Notes to Financial Statements are an integral part of this statement.
Annual Report 2014
17
Columbia Risk Allocation Fund
Statement of Changes in Net Assets (continued)
| | | Year Ended May 31, 2014 | | Year Ended May 31, 2013(a) | |
| | | Shares | | Dollars ($) | | Shares | | Dollars ($) | |
Capital stock activity | |
Class A shares | |
Subscriptions | | | 107,221 | | | | 1,054,840 | | | | 338,036 | | | | 3,552,279 | | |
Distributions reinvested | | | 9,337 | | | | 86,275 | | | | 5,774 | | | | 60,283 | | |
Redemptions | | | (214,690 | ) | | | (2,070,228 | ) | | | (34,014 | ) | | | (356,482 | ) | |
Net increase (decrease) | | | (98,132 | ) | | | (929,113 | ) | | | 309,796 | | | | 3,256,080 | | |
Class C shares | |
Subscriptions | | | 9,144 | | | | 87,700 | | | | 137,812 | | | | 1,455,041 | | |
Distributions reinvested | | | 2,728 | | | | 24,991 | | | | 1,613 | | | | 16,844 | | |
Redemptions | | | (109,050 | ) | | | (1,051,933 | ) | | | (1,329 | ) | | | (13,996 | ) | |
Net increase (decrease) | | | (97,178 | ) | | | (939,242 | ) | | | 138,096 | | | | 1,457,889 | | |
Class K shares | |
Subscriptions | | | 20 | | | | 200 | | | | — | | | | — | | |
Net increase | | | 20 | | | | 200 | | | | — | | | | — | | |
Class R shares | |
Subscriptions | | | 20 | | | | 200 | | | | — | | | | — | | |
Net increase | | | 20 | | | | 200 | | | | — | | | | — | | |
Class R5 shares | |
Subscriptions | | | 2,278 | | | | 22,730 | | | | — | | | | — | | |
Net increase | | | 2,278 | | | | 22,730 | | | | — | | | | — | | |
Class W shares | |
Subscriptions | | | 18,117,939 | | | | 181,441,953 | | | | — | | | | — | | |
Redemptions | | | (245,424 | ) | | | (2,482,059 | ) | | | — | | | | — | | |
Net increase | | | 17,872,515 | | | | 178,959,894 | | | | — | | | | — | | |
Class Z shares | |
Subscriptions | | | 121,008 | | | | 1,181,488 | | | | 13,192 | | | | 140,629 | | |
Distributions reinvested | | | 574 | | | | 5,319 | | | | 63 | | | | 657 | | |
Redemptions | | | (4,283 | ) | | | (41,935 | ) | | | (542 | ) | | | (5,867 | ) | |
Net increase | | | 117,299 | | | | 1,144,872 | | | | 12,713 | | | | 135,419 | | |
Total net increase | | | 17,796,822 | | | | 178,259,541 | | | | 460,605 | | | | 4,849,388 | | |
(a) For the period from June 19, 2012 (commencement of operations) to May 31, 2013.
The accompanying Notes to Financial Statements are an integral part of this statement.
Annual Report 2014
18
Columbia Risk Allocation Fund
The following tables are intended to help you understand the Fund's financial performance. Certain information reflects financial results for a single share of a class held for the periods shown. Per share net investment income (loss) amounts are calculated based on average shares outstanding during the period. Total return assumes reinvestment of all dividends and distributions, if any. Total return does not reflect payment of sales charges, if any, and is not annualized for periods of less than one year.
| | | Year Ended May 31, | |
Class A | | 2014 | | 2013(a) | |
Per share data | |
Net asset value, beginning of period | | $ | 10.06 | | | $ | 10.00 | | |
Income from investment operations: | |
Net investment income (loss) | | | 0.01 | | | | (0.04 | ) | |
Net realized and unrealized gain | | | 0.65 | | | | 0.47 | | |
Total from investment operations | | | 0.66 | | | | 0.43 | | |
Less distributions to shareholders: | |
Net investment income | | | — | | | | (0.14 | ) | |
Net realized gains | | | (0.48 | ) | | | (0.23 | ) | |
Total distributions to shareholders | | | (0.48 | ) | | | (0.37 | ) | |
Net asset value, end of period | | $ | 10.24 | | | $ | 10.06 | | |
Total return | | | 7.07 | % | | | 4.15 | % | |
Ratios to average net assets(b) | |
Total gross expenses | | | 2.01 | % | | | 2.97 | %(c) | |
Total net expenses(d) | | | 0.75 | % | | | 0.60 | %(c) | |
Net investment income (loss) | | | 0.14 | % | | | (0.42 | %)(c) | |
Supplemental data | |
Net assets, end of period (in thousands) | | $ | 7,281 | | | $ | 8,139 | | |
Portfolio turnover | | | 303 | %(e) | | | 76 | % | |
Notes to Financial Highlights
(a) For the period from June 19, 2012 (commencement of operations) to May 31, 2013.
(b) In addition to the fees and expenses which the Fund bears directly, the Fund indirectly bears a pro rata share of the fees and expenses of the acquired funds in which it invests. Such indirect expenses are not included in the reported expense ratios.
(c) Annualized.
(d) Total net expenses include the impact of certain waivers/reimbursements made by the Investment Manager and certain of its affiliates, if applicable.
(e) Includes mortgage dollar rolls. If mortgage dollar roll transactions were excluded, the portfolio turnover would have been 256% for the year ended May 31, 2014.
The accompanying Notes to Financial Statements are an integral part of this statement.
Annual Report 2014
19
Columbia Risk Allocation Fund
Financial Highlights (continued)
| | | Year Ended May 31, | |
Class C | | 2014 | | 2013(a) | |
Per share data | |
Net asset value, beginning of period | | $ | 10.03 | | | $ | 10.00 | | |
Income from investment operations: | |
Net investment loss | | | (0.06 | ) | | | (0.12 | ) | |
Net realized and unrealized gain | | | 0.62 | | | | 0.48 | | |
Total from investment operations | | | 0.56 | | | | 0.36 | | |
Less distributions to shareholders: | |
Net investment income | | | — | | | | (0.10 | ) | |
Net realized gains | | | (0.48 | ) | | | (0.23 | ) | |
Total distributions to shareholders | | | (0.48 | ) | | | (0.33 | ) | |
Net asset value, end of period | | $ | 10.11 | | | $ | 10.03 | | |
Total return | | | 6.07 | % | | | 3.43 | % | |
Ratios to average net assets(b) | |
Total gross expenses | | | 2.76 | % | | | 3.69 | %(c) | |
Total net expenses(d) | | | 1.50 | % | | | 1.33 | %(c) | |
Net investment loss | | | (0.65 | %) | | | (1.19 | %)(c) | |
Supplemental data | |
Net assets, end of period (in thousands) | | $ | 416 | | | $ | 1,387 | | |
Portfolio turnover | | | 303 | %(e) | | | 76 | % | |
Notes to Financial Highlights
(a) For the period from June 19, 2012 (commencement of operations) to May 31, 2013.
(b) In addition to the fees and expenses which the Fund bears directly, the Fund indirectly bears a pro rata share of the fees and expenses of the acquired funds in which it invests. Such indirect expenses are not included in the reported expense ratios.
(c) Annualized.
(d) Total net expenses include the impact of certain waivers/reimbursements made by the Investment Manager and certain of its affiliates, if applicable.
(e) Includes mortgage dollar rolls. If mortgage dollar roll transactions were excluded, the portfolio turnover would have been 256% for the year ended May 31, 2014.
The accompanying Notes to Financial Statements are an integral part of this statement.
Annual Report 2014
20
Columbia Risk Allocation Fund
Financial Highlights (continued)
| | | Year Ended May 31, | |
Class K | | 2014 | | 2013(a) | |
Per share data | |
Net asset value, beginning of period | | $ | 10.06 | | | $ | 10.00 | | |
Income from investment operations: | |
Net investment income (loss) | | | 0.03 | | | | (0.04 | ) | |
Net realized and unrealized gain | | | 0.64 | | | | 0.47 | | |
Total from investment operations | | | 0.67 | | | | 0.43 | | |
Less distributions to shareholders: | |
Net investment income | | | — | | | | (0.14 | ) | |
Net realized gains | | | (0.48 | ) | | | (0.23 | ) | |
Total distributions to shareholders | | | (0.48 | ) | | | (0.37 | ) | |
Net asset value, end of period | | $ | 10.25 | | | $ | 10.06 | | |
Total return | | | 7.18 | % | | | 4.13 | % | |
Ratios to average net assets(b) | |
Total gross expenses | | | 1.79 | % | | | 2.90 | %(c) | |
Total net expenses(d) | | | 0.63 | % | | | 0.63 | %(c) | |
Net investment income (loss) | | | 0.35 | % | | | (0.37 | %)(c) | |
Supplemental data | |
Net assets, end of period (in thousands) | | $ | 3 | | | $ | 3 | | |
Portfolio turnover | | | 303 | %(e) | | | 76 | % | |
Notes to Financial Highlights
(a) For the period from June 19, 2012 (commencement of operations) to May 31, 2013.
(b) In addition to the fees and expenses which the Fund bears directly, the Fund indirectly bears a pro rata share of the fees and expenses of the acquired funds in which it invests. Such indirect expenses are not included in the reported expense ratios.
(c) Annualized.
(d) Total net expenses include the impact of certain waivers/reimbursements made by the Investment Manager and certain of its affiliates, if applicable.
(e) Includes mortgage dollar rolls. If mortgage dollar roll transactions were excluded, the portfolio turnover would have been 256% for the year ended May 31, 2014.
The accompanying Notes to Financial Statements are an integral part of this statement.
Annual Report 2014
21
Columbia Risk Allocation Fund
Financial Highlights (continued)
| | | Year Ended May 31, | |
Class R | | 2014 | | 2013(a) | |
Per share data | |
Net asset value, beginning of period | | $ | 10.05 | | | $ | 10.00 | | |
Income from investment operations: | |
Net investment loss | | | (0.01 | ) | | | (0.07 | ) | |
Net realized and unrealized gain | | | 0.64 | | | | 0.47 | | |
Total from investment operations | | | 0.63 | | | | 0.40 | | |
Less distributions to shareholders: | |
Net investment income | | | — | | | | (0.12 | ) | |
Net realized gains | | | (0.48 | ) | | | (0.23 | ) | |
Total distributions to shareholders | | | (0.48 | ) | | | (0.35 | ) | |
Net asset value, end of period | | $ | 10.20 | | | $ | 10.05 | | |
Total return | | | 6.77 | % | | | 3.90 | % | |
Ratios to average net assets(b) | |
Total gross expenses | | | 2.26 | % | | | 3.14 | %(c) | |
Total net expenses(d) | | | 1.00 | % | | | 0.87 | %(c) | |
Net investment loss | | | (0.14 | %) | | | (0.74 | %)(c) | |
Supplemental data | |
Net assets, end of period (in thousands) | | $ | 3 | | | $ | 3 | | |
Portfolio turnover | | | 303 | %(e) | | | 76 | % | |
Notes to Financial Highlights
(a) For the period from June 19, 2012 (commencement of operations) to May 31, 2013.
(b) In addition to the fees and expenses which the Fund bears directly, the Fund indirectly bears a pro rata share of the fees and expenses of the acquired funds in which it invests. Such indirect expenses are not included in the reported expense ratios.
(c) Annualized.
(d) Total net expenses include the impact of certain waivers/reimbursements made by the Investment Manager and certain of its affiliates, if applicable.
(e) Includes mortgage dollar rolls. If mortgage dollar roll transactions were excluded, the portfolio turnover would have been 256% for the year ended May 31, 2014.
The accompanying Notes to Financial Statements are an integral part of this statement.
Annual Report 2014
22
Columbia Risk Allocation Fund
Financial Highlights (continued)
| | | Year Ended May 31, | |
Class R5 | | 2014 | | 2013(a) | |
Per share data | |
Net asset value, beginning of period | | $ | 10.07 | | | $ | 10.00 | | |
Income from investment operations: | |
Net investment income (loss) | | | 0.07 | | | | (0.03 | ) | |
Net realized and unrealized gain | | | 0.63 | | | | 0.48 | | |
Total from investment operations | | | 0.70 | | | | 0.45 | | |
Less distributions to shareholders: | |
Net investment income | | | — | | | | (0.15 | ) | |
Net realized gains | | | (0.48 | ) | | | (0.23 | ) | |
Total distributions to shareholders | | | (0.48 | ) | | | (0.38 | ) | |
Net asset value, end of period | | $ | 10.29 | | | $ | 10.07 | | |
Total return | | | 7.47 | % | | | 4.37 | % | |
Ratios to average net assets(b) | |
Total gross expenses | | | 1.54 | % | | | 2.66 | %(c) | |
Total net expenses(d) | | | 0.38 | % | | | 0.38 | %(c) | |
Net investment income (loss) | | | 0.68 | % | | | (0.25 | %)(c) | |
Supplemental data | |
Net assets, end of period (in thousands) | | $ | 26 | | | $ | 3 | | |
Portfolio turnover | | | 303 | %(e) | | | 76 | % | |
Notes to Financial Highlights
(a) For the period from June 19, 2012 (commencement of operations) to May 31, 2013.
(b) In addition to the fees and expenses which the Fund bears directly, the Fund indirectly bears a pro rata share of the fees and expenses of the acquired funds in which it invests. Such indirect expenses are not included in the reported expense ratios.
(c) Annualized.
(d) Total net expenses include the impact of certain waivers/reimbursements made by the Investment Manager and certain of its affiliates, if applicable.
(e) Includes mortgage dollar rolls. If mortgage dollar roll transactions were excluded, the portfolio turnover would have been 256% for the year ended May 31, 2014.
The accompanying Notes to Financial Statements are an integral part of this statement.
Annual Report 2014
23
Columbia Risk Allocation Fund
Financial Highlights (continued)
| | | Year Ended May 31, | |
Class W | | 2014 | | 2013(a) | |
Per share data | |
Net asset value, beginning of period | | $ | 10.06 | | | $ | 10.00 | | |
Income from investment operations: | |
Net investment income (loss) | | | 0.05 | | | | (0.04 | ) | |
Net realized and unrealized gain | | | 0.62 | | | | 0.47 | | |
Total from investment operations | | | 0.67 | | | | 0.43 | | |
Less distributions to shareholders: | |
Net investment income | | | — | | | | (0.14 | ) | |
Net realized gains | | | (0.48 | ) | | | (0.23 | ) | |
Total distributions to shareholders | | | (0.48 | ) | | | (0.37 | ) | |
Net asset value, end of period | | $ | 10.25 | | | $ | 10.06 | | |
Total return | | | 7.18 | % | | | 4.15 | % | |
Ratios to average net assets(b) | |
Total gross expenses | | | 2.01 | % | | | 2.90 | %(c) | |
Total net expenses(d) | | | 0.75 | % | | | 0.62 | %(c) | |
Net investment income (loss) | | | 0.62 | % | | | (0.42 | %)(c) | |
Supplemental data | |
Net assets, end of period (in thousands) | | $ | 183,246 | | | $ | 3 | | |
Portfolio turnover | | | 303 | %(e) | | | 76 | % | |
Notes to Financial Highlights
(a) For the period from June 19, 2012 (commencement of operations) to May 31, 2013.
(b) In addition to the fees and expenses which the Fund bears directly, the Fund indirectly bears a pro rata share of the fees and expenses of the acquired funds in which it invests. Such indirect expenses are not included in the reported expense ratios.
(c) Annualized.
(d) Total net expenses include the impact of certain waivers/reimbursements made by the Investment Manager and certain of its affiliates, if applicable.
(e) Includes mortgage dollar rolls. If mortgage dollar roll transactions were excluded, the portfolio turnover would have been 256% for the year ended May 31, 2014.
The accompanying Notes to Financial Statements are an integral part of this statement.
Annual Report 2014
24
Columbia Risk Allocation Fund
Financial Highlights (continued)
| | | Year Ended May 31, | |
Class Z | | 2014 | | 2013(a) | |
Per share data | |
Net asset value, beginning of period | | $ | 10.07 | | | $ | 10.00 | | |
Income from investment operations: | |
Net investment income (loss) | | | 0.04 | | | | (0.02 | ) | |
Net realized and unrealized gain | | | 0.65 | | | | 0.47 | | |
Total from investment operations | | | 0.69 | | | | 0.45 | | |
Less distributions to shareholders: | |
Net investment income | | | — | | | | (0.15 | ) | |
Net realized gains | | | (0.48 | ) | | | (0.23 | ) | |
Total distributions to shareholders | | | (0.48 | ) | | | (0.38 | ) | |
Net asset value, end of period | | $ | 10.28 | | | $ | 10.07 | | |
Total return | | | 7.37 | % | | | 4.39 | % | |
Ratios to average net assets(b) | |
Total gross expenses | | | 1.76 | % | | | 2.66 | %(c) | |
Total net expenses(d) | | | 0.50 | % | | | 0.35 | %(c) | |
Net investment income (loss) | | | 0.41 | % | | | (0.17 | %)(c) | |
Supplemental data | |
Net assets, end of period (in thousands) | | $ | 6,470 | | | $ | 5,156 | | |
Portfolio turnover | | | 303 | %(e) | | | 76 | % | |
Notes to Financial Highlights
(a) For the period from June 19, 2012 (commencement of operations) to May 31, 2013.
(b) In addition to the fees and expenses which the Fund bears directly, the Fund indirectly bears a pro rata share of the fees and expenses of the acquired funds in which it invests. Such indirect expenses are not included in the reported expense ratios.
(c) Annualized.
(d) Total net expenses include the impact of certain waivers/reimbursements made by the Investment Manager and certain of its affiliates, if applicable.
(e) Includes mortgage dollar rolls. If mortgage dollar roll transactions were excluded, the portfolio turnover would have been 256% for the year ended May 31, 2014.
The accompanying Notes to Financial Statements are an integral part of this statement.
Annual Report 2014
25
Columbia Risk Allocation Fund
Notes to Financial Statements
May 31, 2014
Note 1. Organization
Columbia Risk Allocation Fund (the Fund), a series of Columbia Funds Series Trust I (the Trust), is a non-diversified fund. The Trust is registered under the Investment Company Act of 1940, as amended (the 1940 Act), as an open-end management investment company organized as a Massachusetts business trust.
The Fund may invest significantly in Class I shares of mutual funds managed by Columbia Management Investment Advisers, LLC (the Investment Manager), a wholly-owned subsidiary of Ameriprise Financial, Inc. (Ameriprise Financial), or its affiliates (affiliated underlying funds). The Fund may also invest in third-party advised (unaffiliated) funds and exchange-traded funds (ETFs), (collectively with the affiliated underlying funds, the Underlying Funds). The Fund also invests significantly in derivatives. The financial statements of the Underlying Funds in which the Fund invests should be read in conjunction with the Fund's financial statements.
Fund Shares
The Trust may issue an unlimited number of shares (without par value). The Fund offers Class A, Class C, Class K, Class R, Class R5, Class W and Class Z shares. Although all share classes generally have identical voting, dividend and liquidation rights, each share class votes separately when required by law. Different share classes pay different distribution amounts to the extent the expenses of such share classes differ, and distributions in liquidation will be proportional to the net asset value of each share class. Each share class has its own expense structure and sales charges, as applicable.
Class A shares are subject to a maximum front-end sales charge of 5.75% based on the initial investment amount. Class A shares purchased without an initial sales charge in accounts aggregating $1 million to $50 million at the time of purchase are subject to a contingent deferred sales charge (CDSC) if the shares are sold within 18 months of purchase, charged as follows: 1.00% CDSC if redeemed within 12 months of purchase, and 0.50% CDSC if redeemed more than 12, but less than 18, months after purchase.
Class C shares are subject to a 1.00% CDSC on shares redeemed within one year of purchase.
Class K shares are not subject to sales charges, however this share class is closed to new investors.
Class R shares are not subject to sales charges and are generally available only to certain retirement plans and other eligible investors.
Class R5 shares are not subject to sales charges and are generally available only to investors purchasing through authorized investment professionals and omnibus retirement plans.
Class W shares are not subject to sales charges and are available only to investors purchasing through authorized investment programs managed by investment professionals, including discretionary managed account programs.
Class Z shares are not subject to sales charges and are available only to certain eligible investors, which are subject to different investment minimums.
Note 2. Summary of Significant Accounting Policies
Use of Estimates
The preparation of financial statements in accordance with U.S. generally accepted accounting principles (GAAP) requires management to make certain estimates and assumptions that affect the reported amounts of assets and liabilities, the disclosure of contingent assets and liabilities at the date of the financial statements and the reported amounts of revenue and expenses during the reporting period. Actual results could differ from those estimates.
The following is a summary of significant accounting policies consistently followed by the Fund in the preparation of its financial statements.
Security Valuation
All equity securities and exchange-traded funds (ETFs) are valued at the close of business of the New York Stock Exchange (NYSE). Equity securities and ETFs are valued at the last quoted sales price on the principal exchange or market on which they trade, except for securities traded on the NASDAQ Stock Market, which are valued at the NASDAQ official close price. Unlisted securities or listed securities for which there were no sales during the day are valued at the mean of the latest quoted bid and ask prices on such exchanges or markets.
Debt securities generally are valued by pricing services approved by the Board of Trustees (the Board) based upon market transactions for normal, institutional-size trading units of similar securities. The services may use various pricing techniques which take into account appropriate factors such as yield, quality, coupon rate, maturity, type of issue, trading characteristics and other data, as well as broker quotes. Debt securities for which quotations are readily available may also be valued based upon an over-the-counter or exchange bid quotation.
Annual Report 2014
26
Columbia Risk Allocation Fund
Notes to Financial Statements (continued)
May 31, 2014
Asset and mortgage-backed securities are generally valued by pricing services, which utilize pricing models that incorporate the securities' cash flow and loan performance data. These models also take into account available market data, including trades, market quotations, and benchmark yield curves for identical or similar securities. Factors used to identify similar securities may include, but are not limited to, issuer, collateral type, vintage, prepayment speeds, collateral performance, credit ratings, credit enhancement and expected life. Asset-backed securities for which quotations are readily available may also be valued based upon an over-the-counter or exchange bid quotation.
Investments in the Underlying Funds are valued at the net asset value of each class of the respective Underlying Fund determined as of the close of the New York Stock Exchange on the valuation date.
Forward foreign currency exchange contracts are marked-to-market based upon foreign currency exchange rates provided by a pricing service.
Futures and options on futures contracts are valued based upon the settlement price established each day by the board of trade or exchange on which they are traded.
Swap transactions are valued through an independent pricing service or broker, or if neither is available, through an internal model based upon observable inputs.
Investments for which market quotations are not readily available, or that have quotations which management believes are not reliable, are valued at fair value as determined in good faith under consistently applied procedures established by and under the general supervision of the Board. If a security or class of securities (such as foreign securities) is valued at fair value, such value is likely to be different from the last quoted market price for the security.
The determination of fair value often requires significant judgment. To determine fair value, management may use assumptions including but not limited to future cash flows and estimated risk premiums. Multiple inputs from various sources may be used to determine fair value.
Foreign Currency Transactions and Translations
The values of all assets and liabilities denominated in foreign currencies are translated into U.S. dollars at that day's exchange rates. Net realized and unrealized gains (losses) on foreign currency transactions and translations include gains (losses) arising from the fluctuation in exchange rates between trade and settlement dates on securities transactions, gains (losses) arising from the disposition of foreign currency and currency gains (losses) between the accrual and payment dates on dividends, interest income and foreign withholding taxes.
For financial statement purposes, the Fund does not distinguish that portion of gains (losses) on investments which is due to changes in foreign exchange rates from that which is due to changes in market prices of the investments. Such fluctuations are included with the net realized and unrealized gains (losses) on investments in the Statement of Operations.
Derivative Instruments
The Fund invests in certain derivative instruments, as detailed below, to meet its investment objectives. Derivatives are instruments whose values depend on, or are derived from, in whole or in part, the value of one or more other assets, such as securities, currencies, commodities or indices. Derivative instruments may be used to maintain cash reserves while maintaining exposure to certain other assets, to offset anticipated declines in values of investments, to facilitate trading, to reduce transaction costs and to pursue higher investment returns. The Fund may also use derivative instruments to mitigate certain investment risks, such as foreign currency exchange rate risk, interest rate risk and credit risk. Derivatives may involve various risks, including the potential inability of the counterparty to fulfill its obligation under the terms of the contract, the potential for an illiquid secondary market (making it difficult for the Fund to sell, including at favorable prices) and the potential for market movements which may expose the Fund to gains or losses in excess of the amount shown in the Statement of Assets and Liabilities. The notional amounts of derivative instruments, if applicable, are not recorded in the financial statements.
A derivative instrument may suffer a mark to market loss if the value of the contract decreases due to an unfavorable change in the market rates or values of the underlying instrument. Losses can also occur if the counterparty does not perform under the contract. The Fund's risk of loss from counterparty credit risk on over-the-counter derivatives is generally limited to the aggregate unrealized gain netted against any collateral held by the Fund and the amount of any variation margin held by the counterparty. With exchange-traded or centrally cleared derivatives, there is minimal counterparty credit risk to the Fund since the exchange's clearinghouse, as counterparty to such instruments, guarantees against a possible default. The clearinghouse stands between the buyer and the seller of the contract; therefore, the counterparty credit risk is limited to failure of the clearinghouse. However, credit risk still exists in exchange-traded or centrally cleared derivatives with respect to initial and variation margin that is held in a broker's customer account. While brokers are required to segregate customer margin from their own assets, in the event that a broker becomes insolvent or goes into bankruptcy and at that time there is a shortfall in the aggregate amount of margin held by the broker for all its clients, U.S. bankruptcy laws will
Annual Report 2014
27
Columbia Risk Allocation Fund
Notes to Financial Statements (continued)
May 31, 2014
typically allocate that shortfall on a pro-rata basis across all the broker's customers, potentially resulting in losses to the Fund.
In order to better define its contractual rights and to secure rights that will help the Fund mitigate its counterparty risk, the Fund may enter into an International Swaps and Derivatives Association, Inc. Master Agreement (ISDA Master Agreement) or similar agreement with its derivative contract counterparties. An ISDA Master Agreement is an agreement between the Fund and a counterparty that governs over-the-counter derivatives and forward foreign currency exchange contracts and typically contains, among other things, collateral posting terms and netting provisions in the event of a default and/or termination event. Under an ISDA Master Agreement, the Fund may, under certain circumstances, offset with the counterparty certain derivative instrument's payables and/or receivables with collateral held and/or posted and create one single net payment. The provisions of the ISDA Master Agreement typically permit a single net payment in the event of default (close-out netting) including the bankruptcy or insolvency of the counterparty. Note, however, that bankruptcy or insolvency laws of a particular jurisdiction may impose restrictions on or prohibitions against the right of offset in bankruptcy, insolvency or other events.
Collateral (margin) requirements differ by type of derivative. Margin requirements are established by the exchange or clearinghouse for exchange-traded and centrally cleared derivatives. Brokers can ask for margin in excess of the minimum in certain circumstances. Collateral terms are contract specific for over-the-counter derivatives. For over-the-counter derivatives traded under an ISDA Master Agreement, the collateral requirements are typically calculated by netting the mark-to-market amount for each transaction under such agreement and comparing that amount to the value of any variation margin currently pledged by the Fund and/or the counterparty. Generally, the amount of collateral due from or to a party has to exceed a minimum transfer amount threshold (e.g., $500,000) before a transfer has to be made. To the extent amounts due to the Fund from its counterparties are not fully collateralized, contractually or otherwise, the Fund bears the risk of loss from counterparty nonperformance. The Fund attempts to mitigate counterparty risk by only entering into agreements with counterparties that it believes have the financial resources to honor their obligations and by monitoring the financial stability of those counterparties.
Certain ISDA Master Agreements allow counterparties to over-the-counter derivatives to terminate derivative contracts prior to maturity in the event the Fund's net assets decline by a stated percentage over a specified time period or the Fund
fails to meet the terms of the ISDA Master Agreement, which would cause the Fund to accelerate payment of any net liability owed to the counterparty. The Fund also has termination rights if the counterparty fails to meet the terms of the ISDA Master Agreement. In addition to considering counterparty credit risk, the Fund would consider terminating the derivative contracts based on whether termination would result in a net liability owed from the counterparty.
For financial reporting purposes, the Fund does not offset derivative assets and derivative liabilities that are subject to netting arrangements in the Statement of Assets and Liabilities.
Forward Foreign Currency Exchange Contracts
Forward foreign currency exchange contracts are over-the-counter agreements between two parties to buy and sell a currency at a set price on a future date. These contracts are typically intended to be used to minimize the exposure to foreign exchange rate fluctuations during the period between the trade and settlement dates of the contract. The Fund utilized forward foreign currency exchange contracts to generate total return through long and short currency positions versus the U.S. dollar and to gain market exposure to foreign currencies. These instruments may be used for other purposes in future periods.
The values of forward foreign currency exchange contracts fluctuate with changes in foreign currency exchange rates. The Fund will record a realized gain or loss when the forward foreign currency exchange contract expires or is closed.
The use of forward foreign currency exchange contracts does not eliminate fluctuations in the prices of the Fund's portfolio securities. The risks of forward foreign currency exchange contracts include movement in the values of the foreign currencies relative to the U.S. dollar (or other foreign currencies) and the possibility that counterparties will not complete their contractual obligations, which may be in excess of the amount reflected, if any, in the Statement of Assets and Liabilities.
Futures Contracts
Futures contracts are exchange traded and represent commitments for the future purchase or sale of an asset at a specified price on a specified date. The Fund bought and sold futures contracts to obtain fixed income and equity market risk exposure. These instruments may be used for other purposes in future periods. Upon entering into futures contracts, the Fund bears risks that it may not achieve the anticipated benefits of the futures contracts and may realize a loss. Additional risks include counterparty credit risk, the
Annual Report 2014
28
Columbia Risk Allocation Fund
Notes to Financial Statements (continued)
May 31, 2014
possibility of an illiquid market, and that a change in the value of the contract or option may not correlate with changes in the value of the underlying asset.
Upon entering into a futures contract, the Fund pledges cash or securities with the broker in an amount sufficient to meet the initial margin requirement. The initial margin deposit must be maintained at an established level over the life of the contract. Cash deposited as initial margin is recorded in the Statement of Assets and Liabilities as margin deposits. Securities deposited as initial margin are designated in the Portfolio of Investments. Subsequent payments (variation margin) are made or received by the Fund each day. The variation margin payments are equal to the daily change in the contract value and are recorded as variation margin receivable or payable and are offset in unrealized gains or losses. The Fund recognizes a realized gain or loss when the contract is closed or expires. Futures contracts involve, to varying degrees, risk of loss in excess of the variation margin disclosed in the Statement of Assets and Liabilities.
Swap Contracts
Swap contracts are privately negotiated in the over-the-counter market and may be entered into as a bilateral contract or centrally cleared (centrally cleared swap contract). In a centrally cleared swap contract, immediately following execution of the swap contract, the swap contract is novated to a central counterparty (the CCP) and the Fund faces the CCP through a broker. Upon entering into a centrally cleared swap contract, the Fund is required to deposit initial margin with the broker in the form of cash or securities in an amount that varies depending on the size and risk profile of the particular swap contract. Securities deposited as initial margin are designated in the Portfolio of Investments and cash deposited is recorded in the Statement of Assets and Liabilities as margin deposits. Unlike a bilateral swap contract, for centrally cleared swap contracts, the Fund has minimal credit exposure to the counterparty as the CCP stands between the Fund and the counterparty. Swap contracts are marked-to-market daily and changes in value are recorded as unrealized appreciation (depreciation). The daily change in valuation of centrally cleared swap contracts, if any, is recorded as a receivable or payable for variation margin in the Statements of Assets and Liabilities.
Credit Default Swap Contracts
The Fund entered into credit default swap contracts to obtain credit risk exposure. Credit default swap contracts are agreements in which one party pays fixed periodic payments to a counterparty in consideration for a guarantee from the
counterparty to make a specific payment should a specified credit event(s) take place. Although specified events are contract specific, credit events are generally defined as bankruptcy, failure to pay, restructuring, obligation acceleration, obligation default, or repudiation/moratorium.
As the purchaser of a credit default swap contract, the Fund purchases protection by paying a periodic interest rate on the notional amount to the counterparty. The interest amount is accrued daily as a component of unrealized appreciation (depreciation) and is recorded as a realized loss upon payment. If a credit event as specified in the contract occurs, the Fund may have the option either to deliver the reference obligation to the seller in exchange for a cash payment of its par amount, or to receive a net cash settlement equal to the par amount less an agreed-upon value of the reference obligation as of the date of the credit event. Credit events are contract specific but may include bankruptcy, failure to pay, restructuring and obligation acceleration. The difference between the value of the obligation or cash delivered and the notional amount received will be recorded as a realized gain (loss).
As the seller of a credit default swap contract, the Fund sells protection to a buyer and will generally receive a periodic interest rate on the notional amount. The interest amount is accrued daily as a component of unrealized appreciation (depreciation) and is recorded as a realized gain upon receipt of the payment. If a credit event as specified in the contract occurs, the Fund may either be required to accept the reference obligation from the buyer in exchange for a cash payment of its notional amount, or to pay the buyer a net cash settlement equal to the notional amount less an agreed-upon value of the reference obligation (recovery value) as of the date of the credit event. The difference between the value of the obligation or cash received and the notional amount paid will be recorded as a realized gain (loss). The maximum potential amount of undiscounted future payments the Fund could be required to make as the seller of protection under a credit default swap contract is equal to the notional amount of the reference obligation. These potential amounts may be partially offset by any recovery values of the respective reference obligations or premiums received upon entering into the agreement. The notional amounts and market values of all credit default swap contracts in which the Fund is the seller of protection, if any, are disclosed in the Credit Default Swap Contracts Outstanding schedule following the Portfolio of Investments. These potential amounts may be partially offset by any recovery values of the respective reference obligations or premiums received upon entering into the agreement.
Annual Report 2014
29
Columbia Risk Allocation Fund
Notes to Financial Statements (continued)
May 31, 2014
As a protection seller, the Fund bears the risk of loss from the credit events specified in the contract. For credit default swap contracts on credit indices, quoted market prices and resulting market values serve as an indicator of the current status of the payment/performance risk. Increasing market values, in absolute terms when compared to the notional amount of the swap, represent a deterioration of the reference entity's credit soundness and a greater likelihood or risk of default or other credit event occurring as defined under the terms of the contract.
Any premium paid or received by the Fund upon entering into a credit default swap contract is recorded as an asset or liability, respectively, and amortized daily as a component of realized gain (loss) in the Statement of Operations. Credit default swap contracts are valued daily, and the change in value is recorded as unrealized appreciation (depreciation) until the termination of the swap, at which time a realized gain (loss) is recorded.
Credit default swap contracts can involve greater risks than if a fund had invested in the reference obligation directly since, in addition to general market risks, credit default swaps are subject to counterparty credit risk, leverage risk, hedging risk, correlation risk and liquidity risk. The Fund will enter into credit default swap transactions only with counterparties that meet certain standards of creditworthiness.
Interest Rate Swap Contracts
The Fund entered into interest rate swap transactions to obtain interest rate market risk exposure. These instruments may be used for other purposes in future periods. Interest rate swaps are agreements between two parties that involve the exchange of one type of interest rate for another type of interest rate cash flow on specified dates in the future, based on a predetermined, specified notional amount. Certain interest rate swaps are considered forward-starting, whereby the accrual for the exchange of cash flows does not begin until a specified date in the future (the effective date). The net cash flow for a standard interest rate swap transaction is generally the difference between a floating market interest rate versus a fixed interest rate.
Interest rate swaps are valued daily and unrealized appreciation (depreciation) is recorded. Certain interest rate swaps may accrue periodic interest on a daily basis as a component of unrealized appreciation (depreciation); the Fund will realize a gain or loss upon the payment or receipt of accrued interest. The Fund will realize a gain or a loss when the interest rate swap is terminated.
Risks of entering into interest rate swaps include a lack of correlation between the swaps and the portfolio of bonds the swaps are designed to hedge or replicate. A lack of correlation may cause the interest rate swaps to experience adverse changes in value relative to expectations. In addition, interest rate swaps are subject to the risk of default of a counterparty, and the risk of adverse movements in market interest rates relative to the interest rate swap positions taken. The Fund's maximum risk of loss from counterparty credit risk is the discounted net value of the cash flows to be received from/paid to the counterparty over the contract's remaining life to the extent that such amount is positive, plus the cost of entering into a similar transaction with another counterparty.
The Fund attempts to mitigate counterparty credit risk by entering into interest rate swap transactions only with counterparties that meet prescribed levels of creditworthiness, as determined by the Investment Manager. The Fund and any counterparty are required to maintain an agreement that requires the Fund and that counterparty to monitor (on a daily basis) the net market value of all derivative transactions entered into pursuant to the contract between the Fund and such counterparty. If the net market value of such derivatives transactions between the Fund and that counterparty exceeds a certain threshold (as defined in the agreement), the Fund or the counterparty is required to post cash and/or securities as collateral. Market values of derivatives transactions presented in the financial statements are not netted with the market values of other derivatives transactions or with any collateral amounts posted by the Fund or any counterparty.
Annual Report 2014
30
Columbia Risk Allocation Fund
Notes to Financial Statements (continued)
May 31, 2014
Offsetting of Derivative Assets and Derivative Liabilities
The following tables present the Fund's gross and net amount of assets and liabilities available for offset under netting arrangements as well as any related collateral received or pledged by the Fund as of May 31, 2014:
| | | Net Amounts of | | Gross Amounts Not Offset in
the Statement of Assets and Liabilities | | | |
| | | Gross
Amounts of
Recognized
Assets ($) | | Gross Amounts
Offset in the
Statement of
Assets and
Liabilities ($) | | Assets
Presented in the
Statement of
Assets and
Liabilities ($) | | Financial
Instruments ($)(a) | | Cash
Collateral
Received ($) | | Securities
Collateral
Received ($) | | Net
Amount ($)(b) | |
Asset Derivatives: | |
Forward Foreign Currency
Exchange Contracts | | | 40,719 | | | | — | | | | 40,719 | | | | 2,377 | | | | — | | | | — | | | | 38,342 | | |
Over-the-Counter
Swap Contracts(c) | | | 1,447,110 | | | | — | | | | 1,447,110 | | | | — | | | | 670,000 | | | | — | | | | 777,110 | | |
Centrally Cleared
Swap Contracts(d) | | | 20,098 | | | | — | | | | 20,098 | | | | 19,365 | | | | — | | | | — | | | | 733 | | |
Total | | | 1,507,927 | | | | — | | | | 1,507,927 | | | | 21,742 | | | | 670,000 | | | | — | | | | 816,185 | | |
| | | Net Amounts of | | Gross Amounts Not Offset in
the Statement of Assets and Liabilities | | | |
| | | Gross
Amounts of
Recognized
Liabilities ($) | | Gross Amounts
Offset in the
Statement of
Assets and
Liabilities ($) | | Liabilities
Presented in the
Statement of
Assets and
Liabilities ($) | | Financial
Instruments ($)(e) | | Cash
Collateral
Pledged ($) | | Securities
Collateral
Pledged ($) | | Net
Amount ($)(f) | |
Liability Derivatives: | |
Forward Foreign Currency
Exchange Contracts | | | 6,228 | | | | — | | | | 6,228 | | | | 2,377 | | | | — | | | | — | | | | 3,851 | | |
Centrally Cleared
Swap Contracts(g) | | | 19,365 | | | | — | | | | 19,365 | | | | 19,365 | | | | — | | | | — | | | | — | | |
Total | | | 25,593 | | | | — | | | | 25,593 | | | | 21,742 | | | | — | | | | — | | | | 3,851 | | |
(a) Represents the amount of assets that could be offset by liabilities with the same counterparty under master netting or similar agreements that management elects not to offset on the Statement of Assets and Liabilities.
(b) Represents the net amount due from counterparties in the event of default.
(c) Over-the-Counter Swap Contracts are presented at market value plus periodic payments receivable (payable), which is comprised of unrealized appreciation, unrealized depreciation, premiums paid and premiums received.
(d) Centrally cleared swaps are included within receivable for variation margin on the Statement of Assets and Liabilities.
(e) Represents the amount of liabilities that could be offset by assets with the same counterparty under master netting or similar agreements that management elects not to offset on the Statement of Assets and Liabilities.
(f) Represents the net amount due to counterparties in the event of default.
(g) Centrally cleared swaps are included within payable for variation margin on the Statement of Assets and Liabilities.
Effects of Derivative Transactions in the Financial Statements
The following tables are intended to provide additional information about the effect of derivatives on the financial statements of the Fund, including: the fair value of derivatives by risk category and the location of those fair values in the
Statement of Assets and Liabilities; the impact of derivative transactions over the period in the Statement of Operations including realized gains or losses and unrealized gains or losses. The derivative schedules following the Portfolio of Investments present additional information regarding derivative instruments outstanding at the end of the period, if any.
Annual Report 2014
31
Columbia Risk Allocation Fund
Notes to Financial Statements (continued)
May 31, 2014
The following table is a summary of the fair value of derivative instruments at May 31, 2014:
Asset Derivatives | |
Risk Exposure
Category | | Statement of Assets and
Liabilities Location | | Fair Value ($) | |
Credit risk | | Net assets — unrealized
appreciation on swap
contracts | | | 569,059 | * | |
Credit risk | | Premiums paid on
outstanding swap
contracts | | | 1,194,788 | | |
Equity risk | | Net assets — unrealized
appreciation on futures
contracts | | | 2,173,093 | * | |
Foreign exchange
risk | | Unrealized appreciation on
forward foreign currency
exchange contracts | | | 40,719 | | |
Interest rate risk | | Net assets — unrealized
appreciation on futures
contracts | | | 63,285 | * | |
Interest rate risk | | Net assets — unrealized
appreciation on swap
contracts | | | 245,282 | * | |
Interest rate risk | | Premiums paid on
outstanding swap
contracts | | | 95 | | |
Total | | | | | 4,286,321 | | |
Liability Derivatives | |
Risk Exposure
Category | | Statement of Assets and
Liabilities Location | | Fair Value ($) | |
Foreign exchange
risk | | Unrealized depreciation on
forward foreign currency
exchange contracts | | | 6,228 | | |
Interest rate
risk | | Net assets — unrealized
depreciation on futures
contracts | | | 5,691 | * | |
Total | | | | | 11,919 | | |
*Includes cumulative appreciation (depreciation) as reported in the tables following the Portfolio of Investments. Only the current day's variation margin is reported in receivables or payables in the Statement of Assets and Liabilities.
The following table indicates the effect of derivative instruments in the Statement of Operations for the year ended May 31, 2014:
Amount of Realized Gain (Loss) on Derivatives Recognized in Income | |
| Risk Exposure Category | | Forward Foreign
Currency Exchange
Contracts ($) | | Futures
Contracts ($) | | Swap
Contracts ($) | | Total ($) | |
Credit risk | | | — | | | | — | | | | 457,301 | | | | 457,301 | | |
Equity risk | | | — | | | | 696,298 | | | | — | | | | 696,298 | | |
Foreign exchange risk | | | 14,076 | | | | — | | | | — | | | | 14,076 | | |
Interest rate risk | | | — | | | | (22,828 | ) | | | (164,686 | ) | | | (187,514 | ) | |
Total | | | 14,076 | | | | 673,470 | | | | 292,615 | | | | 980,161 | | |
Change in Unrealized Appreciation (Depreciation) on Derivatives Recognized in Income | |
| Risk Exposure Category | | Forward Foreign
Currency Exchange
Contracts ($) | | Future
Contracts ($) | | Swap
Contracts ($) | | Total ($) | |
Credit risk | | | — | | | | — | | | | 569,059 | | | | 569,059 | | |
Equity risk | | | — | | | | 1,934,451 | | | | — | | | | 1,934,451 | | |
Foreign exchange risk | | | 34,491 | | | | — | | | | — | | | | 34,491 | | |
Interest rate risk | | | — | | | | 138,342 | | | | 494,280 | | | | 632,622 | | |
Total | | | 34,491 | | | | 2,072,793 | | | | 1,063,339 | | | | 3,170,623 | | |
Annual Report 2014
32
Columbia Risk Allocation Fund
Notes to Financial Statements (continued)
May 31, 2014
The following table is a summary of the average outstanding volume by derivative instrument for the year ended May 31, 2014:
| Derivative Instrument | | | | Average
notional
amounts($)* | |
Futures contracts — Long | | | | | 45,886,326 | | |
Credit default Swap
Contracts — sell protection | | | | | 14,495,000 | | |
| Derivative Instrument | | Average
unrealized
appreciation($)* | | Average
unrealized
depreciation($)* | |
Forward foreign currency
exchange contracts | | | 10,180 | | | | (1,557 | ) | |
Interest rate swaps | | | 67,171 | | | | (140,243 | ) | |
*Based on ending quarterly outstanding amounts for the year ending May 31, 2014.
Delayed Delivery Securities
The Fund may trade securities on other than normal settlement terms, including securities purchased or sold on a "when-issued" basis. This may increase risk since the other party to the transaction may fail to deliver which could cause the Fund to subsequently invest at less advantageous prices. The Fund designates cash or liquid securities in an amount equal to the delayed delivery commitment.
Mortgage Dollar Roll Transactions
The Fund may enter into mortgage "dollar rolls" in which the Fund sells securities for delivery in the current month and simultaneously contracts with the same counterparty to repurchase similar but not identical securities (same type, coupon and maturity) on a specified future date. During the roll period, the Fund loses the right to receive principal and interest paid on the securities sold. However, the Fund will benefit because it receives negotiated amounts in the form of reductions of the purchase price for the future purchase plus the interest earned on the cash proceeds of the securities sold until the settlement date of the forward purchase. The Fund records the incremental difference between the forward purchase and sale of each forward roll as a realized gain or loss. Unless any realized gains exceed the income, capital appreciation, and gain or loss due to mortgage prepayments that would have been realized on the securities sold as part of the mortgage dollar roll, the use of this technique will diminish the investment performance of the Fund compared to what the performance would have been without the use of mortgage dollar rolls. All cash proceeds will be invested in instruments that are permissible investments for the Fund. The Fund identifies cash or liquid securities in an amount equal to the forward purchase price.
For financial reporting and tax purposes, the Fund treats "to be announced" mortgage dollar rolls as two separate transactions, one involving the purchase of a security and a separate transaction involving a sale. These transactions may increase the Fund's portfolio turnover rate. The Fund does not currently enter into mortgage dollar rolls that are accounted for as financing transactions.
Mortgage dollar rolls involve the risk that the market value of the securities the Fund is obligated to repurchase may decline below the repurchase price, or that the counterparty may default on its obligations.
Treasury Inflation Protected Securities
The Fund may invest in treasury inflation protected securities (TIPS). The principal amount of TIPS is adjusted periodically and is increased for inflation or decreased for deflation based on a monthly published index. Interest payments are based on the adjusted principal at the time the interest is paid. These adjustments are recorded as interest income in the Statement of Operations.
Security Transactions
Security transactions are accounted for on the trade date. Cost is determined and gains (losses) are based upon the specific identification method for both financial statement and federal income tax purposes.
Income Recognition
Interest income is recorded on an accrual basis. Market premiums and discounts, including original issue discounts, are amortized and accreted, respectively, over the expected life of the security on all debt securities, unless otherwise noted. The Fund classifies gains and losses realized on prepayments received on mortgage-backed securities as adjustments to interest income.
Income and capital gain distributions from the Underlying Funds, if any, are recorded on the ex-dividend date.
Expenses
General expenses of the Trust are allocated to the Fund and other funds of the Trust based upon relative net assets or other expense allocation methodologies determined by the nature of the expense. Expenses directly attributable to the Fund are charged to the Fund. Expenses directly attributable to a specific class of shares are charged to that share class.
Determination of Class Net Asset Value
All income, expenses (other than class-specific expenses, which are charged to that share class, as shown in the Statement of Operations) and realized and unrealized gains (losses) are allocated to each class of the Fund on a daily
Annual Report 2014
33
Columbia Risk Allocation Fund
Notes to Financial Statements (continued)
May 31, 2014
basis, based on the relative net assets of each class, for purposes of determining the net asset value of each class.
Federal Income Tax Status
The Fund intends to qualify each year as a regulated investment company under Subchapter M of the Internal Revenue Code, as amended, and will distribute substantially all of its taxable income (including net short-term capital gains), if any, for its tax year, and as such will not be subject to federal income taxes. In addition, the Fund intends to distribute in each calendar year substantially all of its net investment income, capital gains and certain other amounts, if any, such that the Fund should not be subject to federal excise tax. Therefore, no federal income or excise tax provision is recorded.
Foreign Taxes
The Fund may be subject to foreign taxes on income, gains on investments or currency repatriation, a portion of which may be recoverable. The Fund will accrue such taxes and recoveries, as applicable, based upon its current interpretation of tax rules and regulations that exist in the markets in which it invests.
Realized gains in certain countries may be subject to foreign taxes at the Fund level, based on statutory rates. The Fund accrues for such foreign taxes on realized and unrealized gains at the appropriate rate for each jurisdiction, as applicable. The amount, if any, is disclosed as a liability on the Statement of Assets and Liabilities.
Distributions to Shareholders
Distributions from net investment income, if any, are declared and paid annually. Net realized capital gains, if any, are distributed along with the income distribution. Income distributions and capital gain distributions are determined in accordance with federal income tax regulations, which may differ from GAAP.
Guarantees and Indemnifications
Under the Trust's organizational documents and, in some cases, by contract, its officers and trustees are indemnified against certain liabilities arising out of the performance of their duties to the Trust or its funds. In addition, certain of the Fund's contracts with its service providers contain general indemnification clauses. The Fund's maximum exposure under these arrangements is unknown since the amount of any future claims that may be made against the Fund cannot be determined, and the Fund has no historical basis for predicting the likelihood of any such claims.
Note 3. Fees and Compensation Paid to Affiliates
Investment Management Fees and Underlying Fund Fees
Under an Investment Management Services Agreement, the Investment Manager determines which securities will be purchased, held or sold. The investment management fee is an annual fee that is a blend of (i) 0.00% on assets invested in affiliated mutual funds, ETFs and closed-end funds that pay an investment advisory fee to the Investment Manager, (ii) 0.10% on assets invested in ETFs and mutual funds that are not managed by the Investment Manager or its affiliates and (iii) an advisory fee that declines from 0.70% to 0.60%, depending on asset levels, on assets invested in securities, instruments and other assets not described above, including affiliated mutual funds, ETFs and closed-end funds advised by the Investment Manager that do not pay an investment advisory fee, ETFs, third party closed-end funds, derivatives and individual securities. The effective investment management fee rate for the year ended May 31, 2014 was 0.47% of the Fund's average daily net assets.
In addition to the fees and expenses which the Fund bears directly, the Fund indirectly bears a pro rata share of the fees and expenses of the Underlying Funds in which the Fund invests. Because the Underlying Funds have varied expense and fee levels and the Fund may own different proportions of Underlying Funds at different times, the amount of fees and expenses incurred indirectly by the Fund will vary. These expenses are not reflected in the expenses shown in Statement of Operations and are not included in the ratios to average net assets shown in the Financial Highlights.
Administration Fees
Under an Administrative Services Agreement, the Investment Manager also serves as the Fund Administrator. The Fund pays the Fund Administrator an annual fee for administration and accounting services equal to a percentage of the Fund's average daily net assets that declines from 0.06% to 0.03% as the Fund's net assets increase. The effective administration fee rate for the year ended May 31, 2014 was 0.06% of the Fund's average daily net assets.
Other Expenses
Other expenses are for, among other things, miscellaneous expenses of the Fund or the Board, including payments to a company providing limited administrative services to the Fund and the Board. That company's expenses include boardroom and office expense, employee compensation, employee health and retirement benefits, and certain other expenses. For the
Annual Report 2014
34
Columbia Risk Allocation Fund
Notes to Financial Statements (continued)
May 31, 2014
year ended May 31, 2014, there were no expenses incurred for these particular items.
Other Expenses
Other expenses include offering costs which were incurred prior to the shares of the Fund being offered. Offering costs include, among other things, state registration filing fees and printing costs. The Fund amortizes offering costs over a period of 12 months from the commencement of operations.
Compensation of Board Members
Board members are compensated for their services to the Fund as disclosed in the Statement of Operations. The Trust's eligible Trustees may participate in a Deferred Compensation Plan (the Plan) which may be terminated at any time. Obligations of the Plan will be paid solely out of the Fund's assets.
Compensation of Chief Compliance Officer
The Board has appointed a Chief Compliance Officer to the Fund in accordance with federal securities regulations. The Fund pays its pro-rata share of the expenses associated with the Chief Compliance Officer. The Fund's expenses for the Chief Compliance Officer will not exceed $15,000 per year.
Transfer Agent Fees
Under a Transfer and Dividend Disbursing Agent Agreement, Columbia Management Investment Services Corp. (the Transfer Agent), an affiliate of the Investment Manager and a wholly-owned subsidiary of Ameriprise Financial, is responsible for providing transfer agency services to the Fund. The Transfer Agent has contracted with Boston Financial Data Services (BFDS) to serve as sub-transfer agent.
The Transfer Agent receives monthly account-based service fees based on the number of open accounts and also receives sub-transfer agency fees based on a percentage of the average aggregate value of the Fund's shares maintained in omnibus accounts (other than omnibus accounts for which American Enterprise Investment Services Inc. is the broker of record or accounts where the beneficial shareholder is a customer of Ameriprise Financial Services, Inc., which are paid a per account fee). The Transfer Agent pays the fees of BFDS for services as sub-transfer agent and is not entitled to reimbursement for such fees from the Fund (with the exception of out-of-pocket fees).
The Transfer Agent also receives compensation from fees for various shareholder services and reimbursements for certain out-of-pocket fees. Total transfer agent fees for Class K and Class R5 shares are subject to an annual limitation of not more
than 0.05% of the average daily net assets attributable to each share class.
For the year ended May 31, 2014, the Fund's effective transfer agent fee rates as a percentage of average daily net assets of each class were as follows:
Class A | | | 0.28 | % | |
Class C | | | 0.28 | | |
Class K | | | 0.05 | | |
Class R | | | 0.28 | | |
Class R5 | | | 0.05 | | |
Class W | | | 0.28 | | |
Class Z | | | 0.28 | | |
An annual minimum account balance fee of $20 may apply to certain accounts with a value below the applicable share class's initial minimum investment requirements to reduce the impact of small accounts on transfer agent fees. These minimum account balance fees are remitted to the Fund and recorded as part of expense reductions in the Statement of Operations. For the year ended May 31, 2014, no minimum account balance fees were charged by the Fund.
Plan Administration Fees
Under a Plan Administration Services Agreement with the Transfer Agent, the Fund pays an annual fee at a rate of 0.25% of the Fund's average daily net assets attributable to Class K shares for the provision of various administrative, recordkeeping, communication and educational services.
Distribution and Service Fees
The Fund has an agreement with Columbia Management Investment Distributors, Inc. (the Distributor), an affiliate of the Investment Manager and a wholly-owned subsidiary of Ameriprise Financial, for distribution and shareholder services. The Board has approved, and the Fund has adopted, distribution and shareholder service plans (the Plans) applicable to certain share classes, which set the distribution and service fees for the Fund. These fees are calculated daily and are intended to compensate the Distributor and/or eligible selling and/or servicing agents for selling shares of the Fund and providing services to investors.
Under the Plans, the Fund pays a monthly service fee to the Distributor at the maximum annual rate of 0.25% of the average daily net assets attributable to Class A, Class C and Class W shares of the Fund. Also under the Plans, the Fund pays a monthly distribution fee to the Distributor at the maximum annual rates of 0.10%, 0.75%, 0.50% and 0.25% of
Annual Report 2014
35
Columbia Risk Allocation Fund
Notes to Financial Statements (continued)
May 31, 2014
the average daily net assets attributable to Class A, Class C, Class R and Class W shares, respectively.
Although the Fund may pay distribution and service fees up to a maximum annual rate of 0.35% of the Fund's average daily net assets attributable to Class A shares (comprised of up to 0.10% for distribution services and up to 0.25% for shareholder liaison services), the Fund currently limits such fees to an aggregate fee of not more than 0.25% of the Fund's average daily net assets attributable to Class A shares.
Although the Fund may pay a distribution fee up to 0.25% of the Fund's average daily net assets attributable to Class W shares and a service fee of up to 0.25% of the Fund's average daily net assets attributable to Class W shares, the aggregate fee shall not exceed 0.25% of the Fund's average daily net assets attributable to Class W shares.
Sales Charges
Sales charges, including front-end charges and CDSCs, received by the Distributor for distributing Fund shares were $7,966 for Class A and $48 for Class C shares for the year ended May 31, 2014.
Expenses Waived/Reimbursed by the Investment Manager and its Affiliates
The Investment Manager and certain of its affiliates have contractually agreed to waive fees and/or reimburse expenses (excluding certain fees and expenses described below) for the period disclosed below, unless sooner terminated at the sole discretion of the Board, so that the Fund's net operating expenses, after giving effect to fees waived/expenses reimbursed and any balance credits and/or overdraft charges from the Fund's custodian, do not exceed the following annual rates as a percentage of the class' average daily net assets:
| | | Fee Rates Contractual
through
September 30, 2014 | |
Class A | | | 0.75 | % | |
Class C | | | 1.50 | | |
Class K | | | 0.63 | | |
Class R | | | 1.00 | | |
Class R5 | | | 0.38 | | |
Class W | | | 0.75 | | |
Class Z | | | 0.50 | | |
Under the agreement governing these fee waivers and/or expense reimbursement arrangements, the following fees and expenses are excluded from the waiver/reimbursement commitment, and therefore will be paid by the Fund, if applicable: taxes (including foreign transaction taxes), expenses associated with investments in affiliated and
non-affiliated pooled investment vehicles (including mutual funds and exchange-traded funds), transaction costs and brokerage commissions, costs related to any securities lending program, dividend expenses associated with securities sold short, inverse floater program fees and expenses, transaction charges and interest on borrowed money, interest, extraordinary expenses and any other expenses the exclusion of which is specifically approved by the Board. This agreement may be modified or amended only with approval from all parties.
Note 4. Federal Tax Information
The timing and character of income and capital gain distributions are determined in accordance with income tax regulations, which may differ from GAAP because of temporary or permanent book to tax differences.
At May 31, 2014, these differences are primarily due to differing treatment for Trustees' deferred compensation, deferral/reversal of wash sales losses, foreign currency transactions, investments in partnerships, passive foreign investment company (PFIC) holdings, derivative investments and swap investments. To the extent these differences are permanent, reclassifications are made among the components of the Fund's net assets in the Statement of Assets and Liabilities. Temporary differences do not require reclassifications. In the Statement of Assets and Liabilities the following reclassifications were made:
Undistributed net investment income | | $ | (46,951 | ) | |
Accumulated net realized gain | | | 46,952 | | |
Paid-in capital | | | (1 | ) | |
Net investment income and net realized gains (losses), as disclosed in the Statement of Operations, and net assets were not affected by this reclassification.
The tax character of distributions paid during the years indicated was as follows:
Year Ended May 31, | | 2014 | | 2013 | |
Ordinary income | | $ | 389,922 | | | $ | 347,321 | | |
Long-term capital gains | | | 205,784 | | | | 105,597 | | |
Total | | $ | 595,706 | | | $ | 452,918 | | |
Short-term capital gain distributions, if any, are considered ordinary income distributions for tax purposes.
At May 31, 2014, the components of distributable earnings on a tax basis were as follows:
Undistributed ordinary income | | $ | 1,882,271 | | |
Undistributed long-term capital gains | | | 1,119,466 | | |
Net unrealized appreciation | | | 545,196 | | |
Annual Report 2014
36
Columbia Risk Allocation Fund
Notes to Financial Statements (continued)
May 31, 2014
At May 31, 2014, the cost of investments for federal income tax purposes was $208,293,000 and the aggregate gross unrealized appreciation and depreciation based on that cost was:
Unrealized appreciation | | $ | 1,096,153 | | |
Unrealized depreciation | | | (550,957 | ) | |
Net unrealized appreciation | | $ | 545,196 | | |
Management of the Fund has concluded that there are no significant uncertain tax positions that would require recognition in the financial statements. However, management's conclusion may be subject to review and adjustment at a later date based on factors including, but not limited to, new tax laws, regulations, and administrative interpretations (including relevant court decisions). Generally, the Fund's federal tax returns for the prior three fiscal years remain subject to examination by the Internal Revenue Service.
Note 5. Portfolio Information
The cost of purchases and proceeds from sales of securities, excluding short-term obligations but including mortgage dollar rolls, aggregated to $200,117,384 and $67,301,678, respectively, for the year ended May 31, 2014, of which $77,438,364 and $24,402,296, respectively, were U.S. government securities.
Note 6. Affiliated Money Market Fund
The Fund significantly invests in Columbia Short-Term Cash Fund, an affiliated money market fund established for the exclusive use by the Fund and other affiliated funds. The income earned by the Fund from such investments is included as "Dividends — affiliated issuers" in the Statement of Operations. As an investing fund, the Fund indirectly bears its proportionate share of the expenses of Columbia Short-Term Cash Fund.
Note 7. Shareholder Concentration
At May 31, 2014, affiliated shareholders of record owned 99.0% of the outstanding shares of the Fund in one or more accounts. Subscription and redemption activity by concentrated accounts may have a significant effect on the operations of the Fund.
Note 8. Line of Credit
The Fund has entered into a revolving credit facility with a syndicate of banks led by JPMorgan Chase Bank N.A. whereby the Fund may borrow for the temporary funding of shareholder redemptions or for other temporary or emergency purposes. The credit facility agreement, as amended, which is a collective agreement between the Fund and certain other
funds managed by the Investment Manager, severally and not jointly, permits collective borrowings up to $500 million. Interest is charged to each participating fund based on its borrowings at a rate equal to the higher of (i) the overnight federal funds rate plus 1.00% or (ii) the one-month LIBOR rate plus 1.00%. Each borrowing under the credit facility matures no later than 60 days after the date of borrowing. Effective December 10, 2013, the Fund also pays a commitment fee equal to its pro rata share of the amount of the credit facility at a rate of 0.075% per annum. Prior to December 10, 2013, the commitment fee was charged at the annual rate of 0.08% per annum. The commitment fee is included in other expenses in the Statement of Operations.
The Fund had no borrowings during the year ended May 31, 2014.
Note 9. Significant Risks
Commodity — Related Investment Risk
The value of commodities investments will generally be affected by overall market movements and factors specific to a particular industry or commodity, which may include demand for the commodity, weather, embargoes, tariffs, and economic health, political, international, regulatory and other developments. Economic and other events (whether real or perceived) can reduce the demand for commodities, which may, in turn, reduce market prices and cause the value of Fund shares to fall. The frequency and magnitude of such changes cannot be predicted. Exposure to commodities and commodities markets may subject the value of the Fund's investments to greater volatility than other types of investments. Limited or no active trading market may exist for certain commodities investments, which may impair the ability to sell or to realize the full value of such investments in the event of the need to liquidate such investments. In addition, adverse market conditions may impair the liquidity of actively traded commodities investments. Certain types of commodities instruments (such as commodity-linked swaps and commodity-linked structured notes) are subject to the risk that the counterparty to the instrument may not perform or be unable to perform in accordance with the terms of the instrument. Subsidiaries making commodity-related investments will not generally be subject to U.S. laws (including securities laws) and their protections. Further, they will be subject to the laws of a foreign jurisdiction, which can be adversely affected by developments in that jurisdiction.
Derivatives Risk
Losses involving derivative instruments may be substantial, because a relatively small price movement in the underlying security(ies) instrument, commodity, currency or index may
Annual Report 2014
37
Columbia Risk Allocation Fund
Notes to Financial Statements (continued)
May 31, 2014
result in a substantial loss for the Fund. In addition to the potential for increased losses, the use of derivative instruments may lead to increased volatility within the Fund. Derivatives will typically increase the Fund's exposure to principal risks to which it is otherwise exposed, and may expose the Fund to additional risks, including correlation risk, counterparty risk, hedging risk, leverage risk and liquidity risk.
Leverage Risk
Leverage occurs when the Fund increases its assets available for investment using borrowings, short sales, derivatives, or similar instruments or techniques. The use of leverage may make any change in the Fund's net asset value (NAV) even greater and thus result in increased volatility of returns. Because short sales involve borrowing securities and then selling them, the Fund's short sales effectively leverage the Fund's assets. The Fund's assets that are used as collateral to secure the Fund's obligations to return the securities sold short may decrease in value while the short positions are outstanding, which may force the Fund to use its other assets to increase the collateral. Leverage can create an interest expense that may lower the Fund's overall returns. Leverage presents the opportunity for increased net income and capital gains, but also exaggerates the Fund's risk of loss. There can be no guarantee that a leveraging strategy will be successful.
Non-Diversification Risk
A non-diversified fund is permitted to invest a greater percentage of its total assets in fewer issuers than a diversified fund. The Fund may, therefore, have a greater risk of loss from a few issuers than a similar fund that invests more broadly.
Note 10. Subsequent Events
Management has evaluated the events and transactions that have occurred through the date the financial statements were issued and noted no items requiring adjustment of the financial statements or additional disclosure.
Note 11. Information Regarding Pending and Settled Legal Proceedings
In December 2005, without admitting or denying the allegations, American Express Financial Corporation (AEFC, which is now known as Ameriprise Financial, Inc. (Ameriprise Financial)) entered into settlement agreements with the Securities and Exchange Commission (SEC) and Minnesota Department of Commerce (MDOC) related to market timing activities. As a result, AEFC was censured and ordered to cease and desist from committing or causing any violations of certain provisions of the Investment Advisers Act of 1940, the Investment Company Act of 1940, and various Minnesota laws. AEFC agreed to pay disgorgement of $10 million and civil
money penalties of $7 million. AEFC also agreed to retain an independent distribution consultant to assist in developing a plan for distribution of all disgorgement and civil penalties ordered by the SEC in accordance with various undertakings detailed at www.sec.gov/litigation/admin/ia-2451.pdf. Ameriprise Financial and its affiliates have cooperated with the SEC and the MDOC in these legal proceedings, and have made regular reports to the Funds' Boards of Trustees.
Ameriprise Financial and certain of its affiliates have historically been involved in a number of legal, arbitration and regulatory proceedings, including routine litigation, class actions, and governmental actions, concerning matters arising in connection with the conduct of their business activities. Ameriprise Financial believes that the Funds are not currently the subject of, and that neither Ameriprise Financial nor any of its affiliates are the subject of, any pending legal, arbitration or regulatory proceedings that are likely to have a material adverse effect on the Funds or the ability of Ameriprise Financial or its affiliates to perform under their contracts with the Funds. Ameriprise Financial is required to make 10-Q, 10-K and, as necessary, 8-K filings with the Securities and Exchange Commission on legal and regulatory matters that relate to Ameriprise Financial and its affiliates. Copies of these filings may be obtained by accessing the SEC website at www.sec.gov.
There can be no assurance that these matters, or the adverse publicity associated with them, will not result in increased fund redemptions, reduced sale of fund shares or other adverse consequences to the Funds. Further, although we believe proceedings are not likely to have a material adverse effect on the Funds or the ability of Ameriprise Financial or its affiliates to perform under their contracts with the Funds, these proceedings are subject to uncertainties and, as such, we are unable to estimate the possible loss or range of loss that may result. An adverse outcome in one or more of these proceedings could result in adverse judgments, settlements, fines, penalties or other relief that could have a material adverse effect on the consolidated financial condition or results of operations of Ameriprise Financial.
Annual Report 2014
38
Columbia Risk Allocation Fund
Report of Independent Registered Public Accounting Firm
To the Trustees of Columbia Funds Series Trust I and the Shareholders of
Columbia Risk Allocation Fund
In our opinion, the accompanying statement of assets and liabilities, including the portfolio of investments, and the related statements of operations and of changes in net assets and the financial highlights present fairly, in all material respects, the financial position of Columbia Risk Allocation Fund (the "Fund", a series of Columbia Funds Series Trust I) at May 31, 2014, the results of its operations for the year then ended and the changes in its net assets and the financial highlights for the year then ended and for the period June 19, 2012 (commencement of operations) through May 31,2013, in conformity with accounting principles generally accepted in the United States of America. These financial statements and financial highlights (hereafter referred to as "financial statements") are the responsibility of the Fund's management. Our responsibility is to express an opinion on these financial statements based on our audits. We conducted our audits of these financial statements in accordance with the standards of the Public Company Accounting Oversight Board (United States). Those standards require that we plan and perform the audit to obtain reasonable assurance about whether the financial statements are free of material misstatement. An audit includes examining, on a test basis, evidence supporting the amounts and disclosures in the financial statements, assessing the accounting principles used and significant estimates made by management, and evaluating the overall financial statement presentation. We believe that our audits, which included confirmation of securities at May 31, 2014 by correspondence with the custodian, brokers and transfer agent, and the application of alternative auditing procedures where such confirmations had not been received, provide a reasonable basis for our opinion.
PricewaterhouseCoopers LLP
Minneapolis, Minnesota
July 22, 2014
Annual Report 2014
39
Columbia Risk Allocation Fund
Federal Income Tax Information
(Unaudited)
The Fund hereby designates the following tax attributes for the fiscal year ended May 31, 2014. Shareholders will be notified in early 2015 of the amounts for use in preparing 2014 income tax returns.
Tax Designations:
Capital Gain Dividend | | $ | 1,185,942 | | |
Capital Gain Dividend. The Fund designates as a capital gain dividend the amount reflected above, or if subsequently determined to be different, the net capital gain of such fiscal period. The Fund also designates as capital gain dividends, to the extent necessary to fully distribute such capital gains, earnings and profits distributed to shareholders on the redemption of shares.
Annual Report 2014
40
Columbia Risk Allocation Fund
The Trustees serve terms of indefinite duration. The names, addresses and birth years of the Trustees and Officers of the Funds in Columbia Funds Series Trust I, the year each was first elected or appointed to office, their principal business occupations during at least the last five years, the number of Funds overseen by each Trustee and other directorships they hold are shown below. Each officer listed below serves as an officer of each Fund in Columbia Funds Series Trust I.
Independent Trustees
Name, Address and Year of Birth,
Position with Funds, Year First
Elected or Appointed to Office | | Principal Occupation(s) During Past Five Years, Number of Funds in Columbia
Funds Complex Overseen by Trustee, Other Directorships Held | |
Douglas A. Hacker (Born 1955)
c/o Columbia Management
Investment Advisers, LLC
225 Franklin Street
Boston, MA 02110
Trustee (since 1996) | | Independent business executive since May 2006; Executive Vice President — Strategy of United Airlines from December 2002 to May 2006; President of UAL Loyalty Services (airline marketing company) from September 2001 to December 2002; Executive Vice President and Chief Financial Officer of United Airlines from July 1999 to September 2001. Oversees 56; Nash Finch Company (food distributor); Aircastle Limited (aircraft leasing); and SeaCube Container Leasing Ltd. (container leasing) | |
Janet Langford Kelly (Born 1957)
c/o Columbia Management
Investment Advisers, LLC
225 Franklin Street
Boston, MA 02110
Trustee (since 1996) | | Senior Vice President, General Counsel and Corporate Secretary, ConocoPhillips (integrated energy company) since September 2007; Deputy General Counsel — Corporate Legal Services, ConocoPhillips from August 2006 to August 2007; Partner, Zelle, Hofmann, Voelbel, Mason & Gette LLP (law firm) from March 2005 to July 2006; Adjunct Professor of Law, Northwestern University from September 2004 to June 2006; Director, UAL Corporation (airline) from February 2006 to July 2006; Chief Administrative Officer and Senior Vice President, Kmart Holding Corporation (consumer goods) from September 2003 to March 2004. Oversees 56; None | |
Nancy T. Lukitsh (Born 1956)
c/o Columbia Management
Investment Advisers, LLC
225 Franklin Street
Boston, MA 02110
Trustee (since 2011) | | Senior Vice President, Partner and Director of Marketing, Wellington Management Company, LLP (investment adviser) from 1997 to 2010; Chair, Wellington Management Investment Portfolios (commingled non-U.S. investment pools) from 2007 to 2010; Director, Wellington Trust Company, NA and other Wellington affiliates from 1997 to 2010. Oversees 56; None | |
William E. Mayer (Born 1940)
c/o Columbia Management
Investment Advisers, LLC
225 Franklin Street
Boston, MA 02110
Trustee (since 1994) | | Partner, Park Avenue Equity Partners (private equity) since February 1999; Dean and Professor, College of Business and Management, University of Maryland from 1992 to 1996. Oversees 56; DynaVox Inc. (speech creation); Lee Enterprises (print media); WR Hambrecht + Co. (financial service provider) from 2000 to 2012; BlackRock Kelso Capital Corporation (investment company) | |
David M. Moffett (Born 1952)
c/o Columbia Management
Investment Advisers, LLC
225 Franklin Street
Boston, MA 02110
Trustee (since 2011) | | Retired. Chief Executive Officer, Federal Home Loan Mortgage Corporation, from 2008 to 2009; Senior Adviser, Global Financial Services Group, Carlyle Group, Inc., from 2007 to 2008; Vice Chairman and Chief Financial Officer, U.S. Bancorp, from 1993 to 2007. Oversees 56; CIT Group Inc. (commercial and consumer finance); eBay Inc. (online trading community); MBIA Inc. (financial service provider); E.W. Scripps Co. (print and television media), Building Materials Holding Corp. (building materials and construction services); Genworth Financial, Inc. (financial and insurance products and services); and University of Oklahoma Foundation | |
Charles R. Nelson (Born 1942)
c/o Columbia Management
Investment Advisers, LLC
225 Franklin Street
Boston, MA 02110
Trustee (since 1981) | | Retired. Professor Emeritus, University of Washington, since 2011; Professor of Economics, University of Washington from 1976 to 2011; Ford and Louisa Van Voorhis Professor of Political Economy, University of Washington from 1993 to 2011; Adjunct Professor of Statistics, University of Washington from 1980 to 2011; Associate Editor, Journal of Money, Credit and Banking from September 1993 to 2008; consultant on econometric and statistical matters. Oversees 56; None | |
John J. Neuhauser (Born 1943)
c/o Columbia Management
Investment Advisers, LLC
225 Franklin Street
Boston, MA 02110
Trustee (since 1984) | | President, Saint Michael's College, since August 2007; Director or Trustee of several non-profit organizations, including Fletcher Allen Health Care, Inc.; University Professor, Boston College from November 2005 to August 2007; Academic Vice President and Dean of Faculties, Boston College from August 1999 to October 2005. Oversees 56; Liberty All-Star Equity Fund and Liberty All-Star Growth Fund (closed-end funds) | |
Annual Report 2014
41
Columbia Risk Allocation Fund
Trustees and Officers (continued)
Independent Trustees (continued)
Name, Address and Year of Birth,
Position with Funds, Year First
Elected or Appointed to Office | | Principal Occupation(s) During Past Five Years, Number of Funds in Columbia
Funds Complex Overseen by Trustee, Other Directorships Held | |
Patrick J. Simpson (Born 1944)
c/o Columbia Management
Investment Advisers, LLC
225 Franklin Street
Boston, MA 02110
Trustee (since 2000) | | Partner, Perkins Coie LLP (law firm). Oversees 56; None | |
Anne-Lee Verville (Born 1945)
c/o Columbia Management
Investment Advisers, LLC
225 Franklin Street
Boston, MA 02110
Trustee (since 1998) | | Retired. General Manager — Global Education Industry from 1994 to 1997, President — Application Systems Division from 1991 to 1994, Chief Financial Officer — US Marketing & Services from 1988 to 1991, and Chief Information Officer from 1987 to 1988, IBM Corporation (computer and technology). Oversees 56; Enesco Group, Inc. (producer of giftware and home and garden decor products) from 2001 to 2006 | |
Interested Trustee
Name, Address and Year of Birth,
Position with Funds, Year First
Elected or Appointed to Office | | Principal Occupation(s) During Past Five Years, Number of Funds in Columbia
Funds Complex Overseen by Trustee, Other Directorships Held | |
William F. Truscott (born 1960)
53600 Ameriprise Financial Center
Minneapolis, MN 55474
Senior Vice President (since 2012) | | Chairman of the Board and President, Columbia Management Investment Advisers, LLC since May 2010 and February 2012 (previously President and Chief Investment Officer, from 2001 to April 2010); Chief Executive Officer, Global Asset Management, Ameriprise Financial, Inc. since September 2012 (previously, Chief Executive Officer, U.S. Asset Management & President, Annuities, from May 2010 to September 2012 and President — U.S. Asset Management and Chief Investment Officer from 2005 to April 2010); Director and Chief Executive Officer, Columbia Management Investment Distributors, Inc. since May 2010 and February 2012, respectively (previously Chairman of the Board and Chief Executive Officer from 2006 to April 2010); Chairman of the Board and Chief Executive Officer, RiverSource Distributors, Inc. since 2006; President and Chief Executive Officer, Ameriprise Certificate Company, 2006 to August 2012; Oversees 188; Director, Ameriprise Certificate Company, 2006-January 2013 | |
The Statement of Additional Information has additional information about the Fund's Board members and is available, without charge, upon request by calling 800.345.6611; contacting your financial intermediary; or visiting columbiamanagement.com.
The Board has appointed officers who are responsible for day-to-day business decisions based on policies it has established. The officers serve at the pleasure of the Board. In addition to Mr. Truscott, who is Senior Vice President, the Funds' other officers are:
Officers
Name,
Address and
Year of Birth | | Position and Year
First Appointed to
Position for any Fund
in the Columbia
Funds Complex or a
Predecessor Thereof | | Principal Occupation(s) During Past Five Years | |
J. Kevin Connaughton
225 Franklin Street
Boston, MA 02110
Born 1964 | | President and Principal Executive Officer (2009) | | Senior Vice President and General Manager — Mutual Fund Products, Columbia Management Investment Advisers, LLC, since May 2010; and President, Columbia Funds since 2009; previously, Managing Director, Columbia Management Advisors, LLC, from December 2004 to April 2010; Senior Vice President and Chief Financial Officer, Columbia Funds, from June 2008 to January 2009; and senior officer of Columbia Funds and affiliated funds since 2003. | |
Michael G. Clarke
225 Franklin Street
Boston, MA 02110
Born 1969 | | Treasurer (2011) and Chief Financial Officer (2009) | | Vice President, Columbia Management Investment Advisers, LLC, since May 2010; previously, Managing Director of Fund Administration, Columbia Management Advisors, LLC, from September 2004 to April 2010; and senior officer of Columbia Funds and affiliated funds since 2002. | |
Annual Report 2014
42
Columbia Risk Allocation Fund
Trustees and Officers (continued)
Officers (continued)
Name,
Address and
Year of Birth | | Position and Year
First Appointed to
Position for any Fund
in the Columbia
Funds Complex or a
Predecessor Thereof | | Principal Occupation(s) During Past Five Years | |
Scott R. Plummer
5228 Ameriprise
Financial Center
Minneapolis, MN 55474
Born 1959 | | Senior Vice President (2006), Chief Legal Officer (2006) and Assistant Secretary (2011) | | Senior Vice President, Chief Legal Officer and Assistant Secretary, Columbia Management Investment Advisers, LLC, since June 2005; Senior Vice President and Lead Chief Counsel — Asset Management, Ameriprise Financial, Inc., since May 2010 (previously, Vice President and Chief Counsel — Asset Management, from 2005 to April 2010); Vice President, Chief Counsel and Assistant Secretary, Columbia Management Investment Distributors, Inc., since 2008; Vice President, General Counsel and Secretary, Ameriprise Certificate Company, since 2005; Chief Counsel, RiverSource Distributors, Inc., since 2006; and senior officer of Columbia Funds and affiliated funds since 2006. | |
Thomas P. McGuire
225 Franklin Street
Boston, MA 02110
Born 1972 | | Chief Compliance Officer (2012) | | Vice President — Asset Management Compliance, Ameriprise Financial, Inc., since May 2010; Chief Compliance Officer, Ameriprise Certificate Company, since September 2010; Compliance Executive, Bank of America, from 2005 to April 2010. | |
Colin Moore
225 Franklin Street
Boston, MA 02110
Born 1958 | | Senior Vice President (2010) | | Executive Vice President and Global Chief Investment Officer, Ameriprise Financial, Inc., since July 2013; Director and Global Chief Investment Officer, Columbia Management Investment Advisers, LLC, since May 2010; previously, Manager, Managing Director and Chief Investment Officer, Columbia Management Advisors, LLC, from 2007 to April 2010. | |
Michael E. DeFao
225 Franklin Street
Boston, MA 02110
Born 1968 | | Vice President (2011) and Assistant Secretary (2010) | | Vice President and Chief Counsel, Ameriprise Financial, Inc., since May 2010; Associate General Counsel, Bank of America from 2005 to April 2010. | |
Joseph F. DiMaria
225 Franklin Street
Boston, MA 02110
Born 1968 | | Vice President (2011) and Chief Accounting Officer (2008) | | Vice President — Mutual Fund Administration, Columbia Management Investment Advisers, LLC, since May 2010; previously, Director of Fund Administration, Columbia Management Advisors, LLC, from 2006 to April 2010. | |
Paul B. Goucher
100 Park Avenue
New York, NY 10017
Born 1968 | | Vice President (2011) and Assistant Secretary (2008) | | Vice President and Lead Chief Counsel, Ameriprise Financial, Inc., since November 2008 and January 2013, respectively (previously, Chief Counsel, from January 2010 to January 2013, and Group Counsel from November 2008 to January 2010); previously, Director, Managing Director and General Counsel, J. & W. Seligman & Co. Incorporated, from July 2008 to November 2008. | |
Amy Johnson
5228 Ameriprise
Financial Center
Minneapolis, MN
Born 1965 | | Vice President (2006) | | Senior Vice President and Chief Operating Officer, Columbia Management Investment Advisers, LLC, since May 2010; previously, Chief Administrative Officer, from 2009 to April 2010, and Vice President — Asset Management and Trust Company Services, from 2006 to 2009. | |
Paul D. Pearson
5228 Ameriprise
Financial Center
Minneapolis, MN
Born 1956 | | Vice President (2011) and Assistant Treasurer (1999) | | Vice President — Investment Accounting, Columbia Management Investment Advisers, LLC, since May 2010; previously, Vice President — Managed Assets, Investment Accounting, Ameriprise Financial, Inc. from 1998 to April 2010. | |
Christopher O. Petersen
5228 Ameriprise
Financial Center
Minneapolis, MN 55474
Born 1970 | | Vice President and Secretary (2010) | | Vice President and Chief Counsel, Ameriprise Financial, Inc., since January 2010 (previously, Vice President and Group Counsel or Counsel from 2004 to January 2010); officer of Columbia Funds and affiliated funds since 2007. | |
Stephen T. Welsh
225 Franklin Street
Boston, MA 02110
Born 1957 | | Vice President (2006) | | President and Director, Columbia Management Investment Services Corp., since May 2010; previously, President and Director, Columbia Management Services, Inc., from 2004 to April 2010; and Managing Director, Columbia Management Distributors, Inc., from 2007 to April 2010. | |
Annual Report 2014
43
This page intentionally left blank.
Annual Report 2014
44
Columbia Risk Allocation Fund
Important Information About This Report
Each fund mails one shareholder report to each shareholder address. If you would like more than one report, please call shareholder services at 800.345.6611 and additional reports will be sent to you.
The policy of the Board is to vote the proxies of the companies in which each fund holds investments consistent with the procedures as stated in the Statement of Additional Information (SAI). You may obtain a copy of the SAI without charge by calling 800.345.6611; contacting your financial intermediary; visiting columbiamanagement.com; or searching the website of the Securities and Exchange Commission (SEC) at sec.gov. Information regarding how each fund voted proxies relating to portfolio securities is filed with the SEC by August 31 for the most recent 12-month period ending June 30 of that year, and is available without charge by visiting columbiamanagement.com; or searching the website of the SEC at sec.gov.
Each fund files a complete schedule of portfolio holdings with the SEC for the first and third quarters of each fiscal year on Form N-Q. Each fund's Form N-Q is available on the SEC's website at sec.gov and may be reviewed and copied at the SEC's Public Reference Room in Washington, D.C. Information on the operation of the Public Reference Room may be obtained by calling 800.SEC.0330. Each fund's complete schedule of portfolio holdings, as filed on Form N-Q, can also be obtained without charge, upon request, by calling 800.345.6611.
You may obtain the current net asset value (NAV) of Fund shares at no cost by calling 800.345.6611 or by sending an e-mail to serviceinquiries@columbiamanagement.com.
Annual Report 2014
45

Columbia Risk Allocation Fund
P.O. Box 8081
Boston, MA 02266-8081
columbiamanagement.com
This information is for use with concurrent or prior delivery of a fund prospectus. Please read and consider the investment objectives, risks, charges and expenses for any fund carefully before investing. For a prospectus and, if available, a summary prospectus, which contains this and other important information about the Fund, go to columbiamanagement.com. The Fund is distributed by Columbia Management Investment Distributors, Inc., member FINRA, and managed by Columbia Management Investment Advisers, LLC.
© 2014 Columbia Management Investment Advisers, LLC. All rights reserved.
ANN214_05_D01_(07/14)
Item 2. Code of Ethics.
(a) The registrant has adopted a code of ethics that applies to the registrant’s principal executive officer, principal financial officer, principal accounting officer or controller, or persons performing similar functions, regardless of whether these individuals are employed by the registrant or a third party.
(b) During the period covered by this report, there were not any amendments to a provision of the code of ethics adopted in 2(a) above.
(c) During the period covered by this report, there were no waivers, including any implicit waivers, from a provision of the code of ethics described in 2(a) above that relates to one or more of the items set forth in paragraph (b) of this item’s instructions.
Item 3. Audit Committee Financial Expert.
The registrant’s Board of Trustees has determined that Douglas A. Hacker, David M. Moffett and Anne-Lee Verville, each of whom are members of the registrant’s Board of Trustees and Audit Committee, each qualify as an audit committee financial expert. Mr. Hacker, Mr. Moffett and Ms. Verville are each independent trustees, as defined in paragraph (a)(2) of this item’s instructions.
Item 4. Principal Accountant Fees and Services.
Fee information below is disclosed for the three series of the registrant whose reports to stockholders are included in this annual filing. Fiscal year 2013 also includes fees for a fund that merged away during the period.
(a) Audit Fees. Aggregate Audit Fees billed by the principal accountant for professional services rendered during the fiscal years ended May 31, 2014 and May 31, 2013 are approximately as follows:
2014 | | 2013 | |
$ | 73,300 | | $ | 80,100 | |
| | | | | |
Audit Fees include amounts related to the audit of the registrant’s annual financial statements or services that are normally provided by the accountant in connection with
statutory and regulatory filings or engagements for those fiscal years. Fiscal year 2013 also includes Audit Fees for the review and provision of consent in connection with filing Form N-1A for a new fund.
(b) Audit-Related Fees. Aggregate Audit-Related Fees billed to the registrant by the principal accountant for professional services rendered during the fiscal years ended May 31, 2014 and May 31, 2013 are approximately as follows:
Audit-Related Fees include amounts for assurance and related services by the principal accountant that are reasonably related to the performance of the audit of the registrant’s financial statements and are not reported in Audit Fees above. In fiscal years 2014 and 2013, Audit-Related Fees consist of agreed-upon procedures performed for semi-annual shareholder reports.
During the fiscal years ended May 31, 2014 and May 31, 2013, there were no Audit-Related Fees billed by the registrant’s principal accountant to the registrant’s investment adviser (not including any sub-adviser whose role is primarily portfolio management and is subcontracted with or overseen by another investment adviser) and any entity controlling, controlled by, or under common control with the adviser that provides ongoing services to the registrant for an engagement that related directly to the operations and financial reporting of the registrant.
(c) Tax Fees. Aggregate Tax Fees billed by the principal accountant to the registrant for professional services rendered during the fiscal years ended May 31, 2014 and May 31, 2013 are approximately as follows:
2014 | | 2013 | |
$ | 14,300 | | $ | 23,600 | |
| | | | | |
Tax Fees include amounts for the review of annual tax returns, the review of required shareholder distribution calculations and typically include amounts for professional services by the principal accountant for tax compliance, tax advice and tax planning. Fiscal year 2013 also includes Tax Fees for agreed-upon procedures for a fund merger and the review of a final tax return.
During the fiscal years ended May 31, 2014 and May 31, 2013, there were no Tax Fees billed by the registrant’s principal accountant to the registrant’s investment adviser (not including any sub-adviser whose role is primarily portfolio management and is subcontracted with or overseen by another investment adviser) and any entity controlling, controlled by, or under common control with the adviser that provides ongoing services to the registrant for an engagement that related directly to the operations and financial reporting of the registrant.
(d) All Other Fees. Aggregate All Other Fees billed by the principal accountant to the registrant for professional services rendered during the fiscal years ended May 31, 2014 and May 31, 2013 are approximately as follows:
All Other Fees include amounts for products and services provided by the principal accountant, other than the services reported in paragraphs (a) through (c) above.
Aggregate All Other Fees billed by the registrant’s principal accountant to the registrant’s investment adviser (not including any sub-adviser whose role is primarily portfolio management and is subcontracted with or overseen by another investment adviser) and any entity controlling, controlled by, or under common control with the adviser that provides ongoing services to the registrant for an engagement that related directly to the operations and financial reporting of the registrant during the fiscal years ended May 31, 2014 and May 31, 2013 are approximately as follows:
2014 | | 2013 | |
$ | 325,000 | | $ | 232,300 | |
| | | | | |
In both fiscal years 2014 and 2013, All Other Fees primarily consist of fees billed for internal control examinations of the registrant’s transfer agent and investment advisor.
(e)(1) Audit Committee Pre-Approval Policies and Procedures
The registrant’s Audit Committee is required to pre-approve the engagement of the registrant’s independent auditors to provide audit and non-audit services to the registrant and non-audit services to its investment adviser (excluding any sub-adviser whose role is primarily portfolio management and is sub-contracted or overseen by another investment adviser (the “Adviser”) or any entity controlling, controlled by or under common control with the Adviser that provides ongoing services to the Fund (a “Control Affiliate”) if the engagement relates directly to the operations and financial reporting of the registrant.
The Audit Committee has adopted a Policy for Engagement of Independent Auditors for Audit and Non-Audit Services (the “Policy”). The Policy sets forth the understanding of the Audit Committee regarding the engagement of the registrant’s independent accountants to provide (i) audit and permissible audit-related, tax and other services to the registrant (“Fund Services”); (ii) non-audit services to the registrant’s Adviser and any Control Affiliates, that relates directly to the operations and financial reporting of a Fund (“Fund-related Adviser Services”); and (iii) certain other audit and non-audit services to the registrant’s Adviser and its Control Affiliates. A service will require specific pre-approval by the Audit Committee if it is to be provided by the Fund’s independent auditor; provided, however, that pre-approval of non-audit services to the Fund, the Adviser or Control Affiliates may be waived if certain de minimis requirements set forth in the SEC’s rules are met.
Under the Policy, the Audit Committee may delegate pre-approval authority to any pre-designated member or members who are independent board members. The member(s) to whom such authority is delegated must report, for informational purposes only, any pre-approval decisions to the Audit Committee at its next regular meeting. The Audit Committee’s responsibilities with respect to the pre-approval of services performed by the independent auditor may not be delegated to management.
On an annual basis, at a regularly scheduled Audit Committee meeting, the Fund’s Treasurer or other Fund officer shall submit to the Audit Committee a schedule of the types of Fund Services and Fund-related Adviser Services that are subject to specific pre-approval. This schedule will provide a description of each type of service that is subject to specific pre-approval, along with total projected fees for each service. The pre-approval will generally cover a one-year period. The Audit Committee will review and approve the types of services and the projected fees for the next one-year period and may add to, or subtract from, the list of pre-approved services from time to time, based on subsequent determinations. This specific approval acknowledges that the Audit Committee is in agreement with the specific types of services that the independent auditor will be permitted to perform and the projected fees for each service.
The Fund’s Treasurer or other Fund officer shall report to the Audit Committee at each of its regular meetings regarding all Fund Services or Fund-related Adviser Services provided since the last such report was rendered, including a description of the services, by category, with forecasted fees for the annual reporting period, proposed changes requiring specific pre-approval and a description of services provided by the independent auditor, by category, with actual fees during the current reporting period.
*****
(e)(2) 100% of the services performed for items (b) through (d) above during 2014 and 2013 were pre-approved by the registrant’s Audit Committee.
(f) Not applicable.
(g) The aggregate non-audit fees billed by the registrant’s accountant for services rendered to the registrant, and rendered to the registrant’s investment adviser (not including any sub-adviser whose role is primarily portfolio management and is subcontracted with or overseen by another investment adviser), and any entity controlling, controlled by, or under common control with the adviser that provides ongoing services to the registrant during the fiscal years ended May 31, 2014 and May 31, 2013 are approximately as follows:
2014 | | 2013 | |
$ | 340,500 | | $ | 257,500 | |
| | | | | |
(h) The registrant’s Audit Committee of the Board of Directors has considered whether the provision of non-audit services that were rendered to the registrant’s adviser (not including any sub-adviser whose role is primarily portfolio management and is
subcontracted with or overseen by another investment adviser), and any entity controlling, controlled by, or under common control with the investment adviser that provides ongoing services to the registrant that were not pre-approved pursuant to paragraph (c)(7)(ii) of Rule 2-01 of Regulation S-X, is compatible with maintaining the principal accountant’s independence.
Item 5. Audit Committee of Listed Registrants.
Not applicable.
Item 6. Investments
(a) The registrant’s “Schedule I — Investments in securities of unaffiliated issuers” (as set forth in 17 CFR 210.12-12) is included in Item 1 of this Form N-CSR.
(b) Not applicable.
Item 7. Disclosure of Proxy Voting Policies and Procedures for Closed-End Management Investment Companies.
Not applicable.
Item 8. Portfolio Managers of Closed-End Management Investment Companies.
Not applicable.
Item 9. Purchases of Equity Securities by Closed-End Management Investment Company and Affiliated Purchasers.
Not applicable.
Item 10. Submission of Matters to a Vote of Security Holders.
There were no material changes to the procedures by which shareholders may recommend nominees to the registrant’s board of directors.
Item 11. Controls and Procedures.
(a) The registrant’s principal executive officer and principal financial officers, based on their evaluation of the registrant’s disclosure controls and procedures as of a date within 90 days of the filing of this report, have concluded that such controls and procedures are adequately designed to ensure that material information required to be disclosed by the registrant in Form N-CSR is accumulated and communicated to the registrant’s management, including the principal executive officer and principal financial officer, or persons performing similar functions, as appropriate to allow timely decisions regarding required disclosure.
(b) There was no change in the registrant’s internal control over financial reporting that occurred during the registrant’s second fiscal quarter of the period covered by this report that has materially affected, or is reasonably likely to materially affect, the registrant’s internal control over financial reporting.
Item 12. Exhibits.
(a)(1) Code of ethics required to be disclosed under Item 2 of Form N-CSR attached hereto as Exhibit 99.CODE ETH.
(a)(2) Certifications pursuant to Rule 30a-2(a) under the Investment Company Act of 1940 (17 CFR 270.30a-2(a)) attached hereto as Exhibit 99.CERT.
(a)(3) Not applicable.
(b) Certification pursuant to Rule 30a-2(b) under the Investment Company Act of 1940 (17 CFR 270.30a-2(b)) attached hereto as Exhibit 99.906CERT.
SIGNATURES
Pursuant to the requirements of the Securities Exchange Act of 1934 and the Investment Company Act of 1940, the registrant has duly caused this report to be signed on its behalf by the undersigned, thereunto duly authorized.
(registrant) | | Columbia Funds Series Trust I |
By (Signature and Title) | | /s/ J. Kevin Connaughton |
| | J. Kevin Connaughton, President and Principal Executive Officer |
| | | |
Pursuant to the requirements of the Securities Exchange Act of 1934 and the Investment Company Act of 1940, this report has been signed below by the following persons on behalf of the registrant and in the capacities and on the dates indicated.
By (Signature and Title) | | /s/ J. Kevin Connaughton |
| | J. Kevin Connaughton, President and Principal Executive Officer |
By (Signature and Title) | | /s/ Michael G. Clarke |
| | Michael G. Clarke, Treasurer and Chief Financial Officer |
| | | |