UNITED STATES
SECURITIES AND EXCHANGE COMMISSION
Washington, D.C. 20549
FORM N-CSR
CERTIFIED SHAREHOLDER REPORT OF REGISTERED
MANAGEMENT INVESTMENT COMPANIES
Investment Company Act file number | 811-04367 |
|
Columbia Funds Series Trust I |
(Exact name of registrant as specified in charter) |
|
225 Franklin Street, Boston, MA | | 02110 |
(Address of principal executive offices) | | (Zip code) |
|
Christopher O. Petersen, Esq. c/o Columbia Management Investment Advisers, LLC 225 Franklin Street Boston, MA 02110 |
(Name and address of agent for service) |
|
Registrant’s telephone number, including area code: | (800) 345-6611 | |
|
Date of fiscal year end: | October 31 | |
|
Date of reporting period: | October 31, 2014 | |
| | | | | | | | |
Form N-CSR is to be used by management investment companies to file reports with the Commission not later than 10 days after the transmission to stockholders of any report that is required to be transmitted to stockholders under Rule 30e-1 under the Investment Company Act of 1940 (17 CFR 270.30e-1). The Commission may use the information provided on Form N-CSR in its regulatory, disclosure review, inspection, and policymaking roles.
A registrant is required to disclose the information specified by Form N-CSR, and the Commission will make this information public. A registrant is not required to respond to the collection of information contained in Form N-CSR unless the Form displays a currently valid Office of Management and Budget (“OMB”) control number. Please direct comments concerning the accuracy of the information collection burden estimate and any suggestions for reducing the burden to Secretary, Securities and Exchange Commission, 450 Fifth Street, NW, Washington, DC 20549-0609. The OMB has reviewed this collection of information under the clearance requirements of 44 U.S.C. § 3507.
Item 1. Reports to Stockholders.
Annual Report
October 31, 2014

Columbia AMT-Free Connecticut Intermediate Muni
Bond Fund
Not FDIC insured • No bank guarantee • May lose value

About Columbia Management
Backed by more than 100 years of experience, Columbia Management is one of the nation's largest asset managers. At the heart of our success — and, most importantly, that of our investors — are some of the most talented professionals in the industry, brought together by a unique way of working.
It starts with carefully selected, specialized investment teams. While each team brings a diverse and innovative range of skills, all are grounded by a common set of core beliefs. All possess a solid conviction in the power of proprietary, bottom-up research. All look not only at generating returns, but also at the likely consistency of those returns and the risks required to achieve them. And while our culture encourages teams to operate independently and question established thinking, a rigorous investment oversight process ensures that each team stays true to its clearly articulated investment process. At Columbia Management, reaching our performance goals matters, and the way we reach them matters just as much.
Columbia funds are distributed by Columbia Management Investment Distributors, Inc., member FINRA, and managed by Columbia Management Investment Advisers, LLC.
© 2014 Columbia Management Investment Advisers, LLC. All rights reserved.
Not part of the shareholder report
Connect with Columbia Management
Get the market insight you need from our investment experts
Investor insight
Stay informed with economic and market commentary, investment videos, white papers, mutual fund commentary and more at columbiamanagement.com.
 Columbia Management investor
(e-newsletter)
Read our award-winning* shareholder newsletter. Our quarterly newsletter is available online and provides timely and relevant content about economic trends, fund news, service enhancements and changes. Sign up to receive the newsletter electronically at columbiamanagement.com/newsletter.
 Investment videos
Watch and discover what our thought leaders are saying about financial markets and the economy. For an analysis of current events and trends that may affect your investments, visit our online video library at columbiamanagement.com/
market-insights/videos.
 Social media
Columbia Management offers you multiple ways to access our market commentary and investment insights.
> Perspectives blog at columbiamanagement.com
Read timely posts by our investment team, including our chief investment officer, chief economist and portfolio managers.
> Twitter.com/ColumbiaMgmt
Follow us on Twitter for quick, up-to-the-minute comments on market news and more.
> Youtube.com/columbiamanagement
View our commentaries on the economy, markets and current investment opportunities.
> Linkedin.com/company/columbia-management
Connect with us on LinkedIn for updates from our thought leaders.


*Columbia Management investor was awarded top honors in the Mutual Fund Education Alliance STAR Awards competition for excellence in mutual fund marketing and communications. Materials in the competition were evaluated on educational value, message comprehension, effective design and objectives.
Not part of the shareholder report
Subscribe to Columbia Management
Get market insight and fund updates delivered to you
Email subscription center
Visit the Columbia Management email subscription center at columbiamanagement.com/subscribe to register for economic and market commentary, product and service updates, white papers and more.
> Columbia Management investor
Quarterly newsletter featuring the latest macro- and micro-economic trends, investment themes, products, service changes and other items of interest to Columbia Management investors
> Investment Strategy Outlook
Quarterly publication featuring the Columbia Management Asset Allocation Team's perspective on global economic investment conditions and markets
> MarketTrack
Quarterly publication featuring more than 40 charts and graphs that highlight the current state of the economy and markets; includes straightforward insight on current investment opportunities
> White papers
Frequent articles that delve deep into a variety of investment topics
> Mutual fund updates
Quarterly portfolio manager commentary and fund fact sheets available for Columbia funds. (Not all funds have a commentary.)
Register today by visiting columbiamanagement.com/subscribe 
Not part of the shareholder report
 Dear Shareholders,
The U.S. Economy Gained Momentum
The U.S. economy picked up momentum throughout the third quarter of 2014 with improvements in every sector. Second-quarter gross domestic product growth was revised upward to 4.6%, with expectations that third-quarter growth would also be above trend. American companies added more than 200,000 new jobs monthly, driving unemployment below 6% for the first time since 2008. Consumer spending got a boost as both income and savings rose, and confidence hit a post-recession high. After a weak start to the year, corporate profits rebounded, indicating that business remains in good shape. Rising profits led to higher capital spending. The housing market recovery remained on track, as home sales and prices trended higher, and inventories declined. Manufacturing remained a lynchpin of the economy's expansion. Even so, performance fell short of expectations at the end of the period.
Despite Momentum, Markets Remained Stagnant
The financial markets produced lackluster results, despite good economic news and the Federal Reserve's reassurance that it intended to keep short-term interest rates low for another year. A surge in global tensions and concerns that equity valuations have risen sharply put a damper on investor enthusiasm. The S&P 500 Index inched ahead 1.13%, buoyed by its concentration in large-cap stocks with a defensive edge. Traditional fixed-income sectors, including U.S. Treasuries, mortgages and securitized bonds, eked out returns of less than 1% for the quarter. Investment-grade corporate bonds and high-yield bonds lost some ground, although fundamentals for both groups remained solid. Convertible securities and U.S. Treasury inflation-protected securities pulled up the rear.
Stay on Track with Columbia Management
Backed by more than 100 years of experience, Columbia Management is one of the nation's largest asset managers. At the heart of our success and, most importantly, that of our investors, are highly talented industry professionals, brought together by a unique way of working. At Columbia Management, reaching our performance goals matters, and how we reach them matters just as much.
Visit columbiamanagement.com for:
> The Columbia Management Perspectives blog, offering insights on current market events and investment opportunities
> Detailed up-to-date fund performance and portfolio information
> Quarterly fund commentaries
> Columbia Management investor, our award-winning quarterly newsletter for shareholders
Thank you for your continued support of the Columbia Funds. We look forward to serving your investment needs for many years to come.
Best Regards,

J. Kevin Connaughton
President, Columbia Funds
Investing involves risk including the risk of loss of principal.
The S&P 500 Index, an unmanaged index, measures the performance of 500 widely held, large-capitalization U.S. stocks and is frequently used as a general measure of market performance. Indices are not available for investment, are not professionally managed and do not reflect sales charges, fees, brokerage commissions, taxes or other expenses of investing.
Investors should consider the investment objectives, risks, charges and expenses of a mutual fund carefully before investing. For a free prospectus and, if available, a summary prospectus, which contains this and other important information about a fund, visit columbiamanagement.com. The prospectus should be read carefully before investing.
Columbia Funds are distributed by Columbia Management Investment Distributors, Inc., member FINRA, and managed by Columbia Management Investment Advisers, LLC.
© 2014 Columbia Management Investment Advisers, LLC. All rights reserved.
Columbia AMT-Free Connecticut Intermediate Muni Bond Fund
Fund Investment Manager
Columbia Management Investment
Advisers, LLC
225 Franklin Street
Boston, MA 02110
Fund Distributor
Columbia Management Investment
Distributors, Inc.
225 Franklin Street
Boston, MA 02110
Fund Transfer Agent
Columbia Management Investment
Services Corp.
P.O. Box 8081
Boston, MA 02266-8081
For more information about any of the funds, please visit columbiamanagement.com or call 800.345.6611. Customer Service Representatives are available to answer your questions Monday through Friday from 8 a.m. to 7 p.m. Eastern time.
The views expressed in this report reflect the current views of the respective parties. These views are not guarantees of future performance and involve certain risks, uncertainties and assumptions that are difficult to predict, so actual outcomes and results may differ significantly from the views expressed. These views are subject to change at any time based upon economic, market or other conditions and the respective parties disclaim any responsibility to update such views. These views may not be relied on as investment advice and, because investment decisions for a Columbia Fund are based on numerous factors, may not be relied on as an indication of trading intent on behalf of any particular Columbia Fund. References to specific securities should not be construed as a recommendation or investment advice.
Performance Overview | | | 3 | | |
Manager Discussion of Fund Performance | | | 5 | | |
Understanding Your Fund's Expenses | | | 7 | | |
Portfolio of Investments | | | 8 | | |
Statement of Assets and Liabilities | | | 13 | | |
Statement of Operations | | | 15 | | |
Statement of Changes in Net Assets | | | 16 | | |
Financial Highlights | | | 18 | | |
Notes to Financial Statements | | | 24 | | |
Report of Independent Registered
Public Accounting Firm | | | 30 | | |
Federal Income Tax Information | | | 31 | | |
Trustees and Officers | | | 32 | | |
Board Consideration and Approval of Advisory Agreement | | | 35 | | |
Important Information About This Report | | | 39 | | |
Columbia AMT-Free Connecticut Intermediate Muni Bond Fund
Performance Summary
> Columbia AMT-Free Connecticut Intermediate Muni Bond Fund (the Fund) Class A shares returned 4.83% excluding sales charges for the 12-month period that ended October 31, 2014. Class Z shares of the Fund returned 5.09%.
> The Fund's benchmark, the Barclays 3-15 Year Blend Municipal Bond Index, which is national in scope, returned 6.05% for the same time period.
> The Fund's duration was shorter than that of the benchmark, which detracted from performance as interest rates declined.
Average Annual Total Returns (%) (for period ended October 31, 2014)
| | Inception | | 1 Year | | 5 Years | | 10 Years | |
Class A | | 11/18/02 | | | | | | | | | | | | | |
Excluding sales charges | | | | | | | 4.83 | | | | 3.72 | | | | 3.26 | | |
Including sales charges | | | | | | | 1.46 | | | | 3.03 | | | | 2.76 | | |
Class B | | 11/18/02 | | | | | | | | | | | | | |
Excluding sales charges | | | | | | | 4.04 | | | | 2.94 | | | | 2.49 | | |
Including sales charges | | | | | | | 1.04 | | | | 2.94 | | | | 2.49 | | |
Class C | | 11/18/02 | | | | | | | | | | | | | |
Excluding sales charges | | | | | | | 4.37 | | | | 3.29 | | | | 2.84 | | |
Including sales charges | | | | | | | 3.37 | | | | 3.29 | | | | 2.84 | | |
Class R4* | | 03/19/13 | | | 5.13 | | | | 3.98 | | | | 3.52 | | |
Class T | | 06/26/00 | | | | | | | | | | | | | |
Excluding sales charges | | | | | | | 4.93 | | | | 3.82 | | | | 3.36 | | |
Including sales charges | | | | | | | -0.05 | | | | 2.82 | | | | 2.86 | | |
Class Z | | 08/01/94 | | | 5.09 | | | | 3.97 | | | | 3.52 | | |
Barclays 3-15 Year Blend Municipal Bond Index | | | | | | | 6.05 | | | | 4.84 | | | | 4.54 | | |
Returns for Class A are shown with and without the maximum initial sales charge of 3.25% (for the one-year and five-year periods) and 4.75% (for the ten-year period). (Prior to August 22, 2005, new purchases of Class A shares had a maximum initial sales charge of 4.75%.) Returns for Class B are shown with and without the applicable contingent deferred sales charge (CDSC) of 3.00% in the first year, declining to 1.00% in the fourth year and eliminated thereafter. Returns for Class C are shown with and without the 1.00% CDSC for the first year only. Returns for Class T are shown with and without the maximum sales charge of 4.75%. The Fund's other classes are not subject to sales charges and have limited eligibility. Please see the Fund's prospectus for details. Performance for different share classes will vary based on differences in sales charges and fees associated with each class. All results shown assume reinvestment of distributions during the period. Returns do not reflect the deduction of taxes that a shareholder may pay on Fund distributions or on the redemption of Fund shares. Performance results reflect the effect of any fee waivers or reimbursements of Fund expenses by Columbia Management Investment Advisers, LLC and/or any of its affiliates. Absent these fee waivers or expense reimbursement arrangements, performance results would have been lower.
The performance information shown represents past performance and is not a guarantee of future results. The investment return and principal value of your investment will fluctuate so that your shares, when redeemed, may be worth more or less than their original cost. Current performance may be lower or higher than the performance information shown. You may obtain performance information current to the most recent month-end by contacting your financial intermediary, visiting columbiamanagement.com or calling 800.345.6611.
*The returns shown for periods prior to the share class inception date (including returns for the Life of the Fund, if shown, which are since Fund inception) include the returns of the Fund's oldest share class. These returns are adjusted to reflect any higher class-related operating expenses of the newer share classes, as applicable. Please visit columbiamanagement.com/mutual-funds/appended-performance for more information.
The Barclays 3-15 Year Blend Municipal Bond Index is an unmanaged index that tracks the performance of municipal bonds issued after December 31, 1990, with remaining maturities between 2 and 17 years and at least $7 million in principal amount outstanding.
Indices are not available for investment, are not professionally managed and do not reflect sales charges, fees, brokerage commissions, taxes or other expenses of investing. Securities in the Fund may not match those in an index.
Annual Report 2014
3
Columbia AMT-Free Connecticut Intermediate Muni Bond Fund
Performance Overview (continued)
Performance of a Hypothetical $10,000 Investment (November 1, 2004 – October 31, 2014)
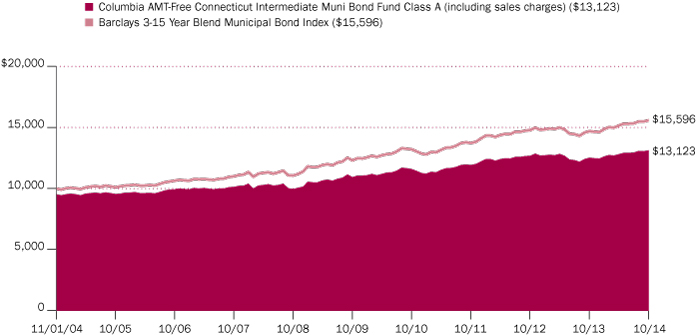
The chart above shows the change in value of a hypothetical $10,000 investment in Class A shares of Columbia AMT-Free Connecticut Intermediate Muni Bond Fund during the stated time period, and does not reflect the deduction of taxes that a shareholder may pay on Fund distributions or on the redemption of Fund shares. The performance of a $10,000 investment in Class A shares with sales charge is calculated with an initial sales charge of 4.75%, which was the effective sales charge prior to August 22, 2005.
Annual Report 2014
4
Columbia AMT-Free Connecticut Intermediate Muni Bond Fund
Manager Discussion of Fund Performance
For the 12-month period that ended October 31, 2014, the Fund's Class A shares returned 4.83% excluding sales charges. Class Z shares of the Fund returned 5.09%. By comparison, the Fund's benchmark, the Barclays 3-15 Year Blend Municipal Bond Index, which is national in scope, returned 6.05%.The Fund's emphasis on lower rated investment-grade municipal bonds aided performance. However, its duration was shorter than that of the benchmark during the first half of 2014, which detracted from performance as longer maturity bonds outperformed. Duration is a measure of interest rate sensitivity.
In July 2014, "AMT-Free" was added to the Fund's name, referencing a policy change that prohibits the Fund from investing in bonds subject to the federal Alternative Minimum Tax. No such bonds were owned during the period.
Strong Demand, Short Supply Aided Municipal Market
The municipal market ended 2013 under pressure, as the Federal Reserve (the Fed) announced its intention to taper its monthly bond purchases beginning in January. Against this backdrop, yields rose and several major credit events clouded the municipal outlook. However, the environment improved in 2014 as money flowed back into municipal funds and new issue supply decreased. Lower rated and longer maturity municipals were the best performers for the period. Five-year yields dropped by six basis points, while 10-year and 15-year yields declined by 37 and 77 basis points, respectively. (A basis point is 1/100th of one percent.) As a result, the yield curve flattened. The yield curve is a graph of AAA municipal yields, from short to long term. The difference between one- and 15-year yields was 304 basis points at the beginning of the 12-month period and 231 basis points at the end.
Contributors and Detractors
The Fund's quality and sector positioning aided results relative to the benchmark. The best returns came from non-rated issues. However, these did not account for a substantial weight in the portfolio, as non-rated names are limited in Connecticut. An emphasis on names rated A and an underweight in the top two rating categories also aided results. However, returns on the Fund's holdings rated A, while solid, lagged their benchmark counterparts. On a sector basis, hospital-related bonds performed well for the Fund, as did education bonds — mostly those of private institutions of higher education. The Fund's electric revenue and water and sewer bonds also outperformed benchmark holdings, with returns in excess of 9.0%. In both sectors, the Fund's holdings were also longer than the benchmark average in maturity and duration.
Pre-refunded bonds, with their shorter durations, were a drag on performance. Their higher quality and good liquidity, which are positive characteristics in times of stress, did not attract investors in the prevailing environment. Pre-refunded bonds are older bonds that have been refinanced by investing the proceeds from the lower yielding bond in Treasuries until the scheduled call date of the original bond occurs. Pre-refunding typically occurs when the issuer can issue a new bond at a lower rate. The Fund had more exposure than the benchmark to the zero to three-year maturity range and less exposure than the benchmark to 12- to 17-year issues, the best spot to be during the period.
Portfolio Management
Brian McGreevy
Quality Breakdown (%)
(at October 31, 2014) | |
AAA rating | | | 12.1 | | |
AA rating | | | 34.3 | | |
A rating | | | 47.1 | | |
BBB rating | | | 3.8 | | |
Not rated | | | 2.7 | | |
Total | | | 100.0 | | |
Percentages indicated are based upon total fixed income securities (excluding Money Market Funds).
Bond ratings apply to the underlying holdings of the Fund and not the Fund itself and are divided into categories ranging from highest to lowest credit quality, determined by using the middle rating of Moody's, S&P and Fitch, after dropping the highest and lowest available ratings. When ratings are available from only two rating agencies, the lower rating is used. When a rating is available from only one rating agency, that rating is used. When a bond is not rated by any rating agency, it is designated as "Not rated". Credit quality ratings assigned by a rating agency are subjective opinions, not statements of fact, and are subject to change, including daily. The ratings assigned by credit rating agencies are but one of the considerations that the Investment Manager and/or Fund's subadviser incorporates into its credit analysis process, along with such other issuer-specific factors as cash flows, capital structure and leverage ratios, ability to de-leverage (repay) through free cash flow, quality of management, market positioning and access to capital, as well as such security-specific factors as the terms of the security (e.g., interest rate, and time to maturity) and the amount and type of any collateral.
Annual Report 2014
5
Columbia AMT-Free Connecticut Intermediate Muni Bond Fund
Manager Discussion of Fund Performance (continued)
Investment Risks
Fixed-income securities present issuer default risk. The Fund invests substantially in municipal securities and will be affected by tax, legislative, regulatory, demographic or political changes, as well as changes impacting a state's financial, economic or other conditions. A relatively small number of tax-exempt issuers may necessitate the Fund investing more heavily in a single issuer and, therefore, be more exposed to the risk of loss than a fund that invests more broadly. The value of the Fund's portfolio may be more volatile than a more geographically diversified fund. Prepayment and extension risk exists as a loan, bond or other investment may be called, prepaid or redeemed before maturity and that similar yielding investments may not be available for purchase. A rise in interest rates may result in a price decline of fixed-income (debt) instruments held by the fund, negatively affecting its performance and NAV. Falling rates may result in the Fund investing in lower yielding debt instruments, lowering the Fund's income and yield. Debt instruments with longer maturity and duration have greater sensitivity to interest rate changes. Interest rates can change due to local government and banking regulation changes. Non-investment-grade (high-yield or junk) securities present greater price volatility and more risk to principal and income than higher rated securities. Market risk may affect a single issuer, sector of the economy, industry or the market as a whole. Federal and state tax rules apply to capital gain distributions and any gains or losses on sales. Income may be subject to state or local taxes. Liquidity risk is associated with the difficulty of selling underlying investments at a desirable time or price. See the Fund's prospectus for more information on these and other risks.
Connecticut Still Recovering
As a sluggish public sector and the financial services industry continued to weigh on payroll growth, Connecticut's recovery from the 2008 recession remained a work in progress. Unemployment currently sits 0.5 percentage points above the national average and the state's housing recovery has been burdened by a backlog of foreclosures. However, income growth has started to pick up thanks to an improved outlook for the state's manufacturing sector. Prospects for new military contracts have helped stabilize some of Connecticut's largest employers. Longer term, we believe the state must improve competitiveness to attract and maintain businesses. High energy costs and higher-than-average corporate tax rates account for Connecticut's rank as the third most expensive place to do business in the country. High business costs also account for a good portion of the domestic population migration out of state that has been underway for years.
Looking Ahead
Given the slow but steady improvement in the U.S. economy, we do not currently expect the Fed to materially change its current policy stance until late in 2015. With that in mind, we plan to maintain Fund duration at or near the level of the benchmark. We see value in the seven- to 10-year maturity range and also at the far end of the Fund's target maturity range, which is 17 to 20 years. We believe that security selection, backed by rigorous credit analysis, will be the key to performance going forward. We plan to analyze the potential for changes in tax or revenue policies in light of the November election results and to monitor hospital-related holdings in light of changes, rules and regulations tied to the implementation of the Affordable Care Act.
Annual Report 2014
6
Columbia AMT-Free Connecticut Intermediate Muni Bond Fund
Understanding Your Fund's Expenses
(Unaudited)
As an investor, you incur two types of costs. There are transaction costs, which generally include sales charges on purchases and may include redemption fees. There are also ongoing costs, which generally include management fees, distribution and/or service fees, and other fund expenses. The following information is intended to help you understand your ongoing costs (in dollars) of investing in the Fund and to help you compare these costs with the ongoing costs of investing in other mutual funds.
Analyzing Your Fund's Expenses
To illustrate these ongoing costs, we have provided examples and calculated the expenses paid by investors in each share class of the Fund during the period. The actual and hypothetical information in the table is based on an initial investment of $1,000 at the beginning of the period indicated and held for the entire period. Expense information is calculated two ways and each method provides you with different information. The amount listed in the "Actual" column is calculated using the Fund's actual operating expenses and total return for the period. You may use the Actual information, together with the amount invested, to estimate the expenses that you paid over the period. Simply divide your account value by $1,000 (for example, an $8,600 account value divided by $1,000 = 8.6), then multiply the results by the expenses paid during the period under the "Actual" column. The amount listed in the "Hypothetical" column assumes a 5% annual rate of return before expenses (which is not the Fund's actual return) and then applies the Fund's actual expense ratio for the period to the hypothetical return. You should not use the hypothetical account values and expenses to estimate either your actual account balance at the end of the period or the expenses you paid during the period. See "Compare With Other Funds" below for details on how to use the hypothetical data.
Compare With Other Funds
Since all mutual funds are required to include the same hypothetical calculations about expenses in shareholder reports, you can use this information to compare the ongoing cost of investing in the Fund with other funds. To do so, compare the hypothetical example with the 5% hypothetical examples that appear in the shareholder reports of other funds. As you compare hypothetical examples of other funds, it is important to note that hypothetical examples are meant to highlight the ongoing costs of investing in a fund only and do not reflect any transaction costs, such as sales charges, or redemption or exchange fees. Therefore, the hypothetical calculations are useful in comparing ongoing costs only, and will not help you determine the relative total costs of owning different funds. If transaction costs were included in these calculations, your costs would be higher.
May 1, 2014 – October 31, 2014
| | Account Value at the Beginning
of the Period ($) | | Account Value at the End of the
Period ($) | | Expenses Paid During the
Period ($) | | Fund's Annualized
Expense Ratio (%) | |
| | Actual | | Hypothetical | | Actual | | Hypothetical | | Actual | | Hypothetical | | Actual | |
Class A | | | 1,000.00 | | | | 1,000.00 | | | | 1,023.40 | | | | 1,021.12 | | | | 4.13 | | | | 4.13 | | | | 0.81 | | |
Class B | | | 1,000.00 | | | | 1,000.00 | | | | 1,019.50 | | | | 1,017.34 | | | | 7.94 | | | | 7.93 | | | | 1.56 | | |
Class C | | | 1,000.00 | | | | 1,000.00 | | | | 1,021.10 | | | | 1,018.85 | | | | 6.42 | | | | 6.41 | | | | 1.26 | | |
Class R4 | | | 1,000.00 | | | | 1,000.00 | | | | 1,024.90 | | | | 1,022.38 | | | | 2.86 | | | | 2.85 | | | | 0.56 | | |
Class T | | | 1,000.00 | | | | 1,000.00 | | | | 1,023.50 | | | | 1,021.63 | | | | 3.62 | | | | 3.62 | | | | 0.71 | | |
Class Z | | | 1,000.00 | | | | 1,000.00 | | | | 1,024.70 | | | | 1,022.38 | | | | 2.86 | | | | 2.85 | | | | 0.56 | | |
Expenses paid during the period are equal to the annualized expense ratio for each class as indicated above, multiplied by the average account value over the period and then multiplied by the number of days in the Fund's most recent fiscal half year and divided by 365.
Expenses do not include fees and expenses incurred indirectly by the Fund from its investment in underlying funds, including affiliated and non-affiliated pooled investment vehicles, such as mutual funds and exchange-traded funds.
Had Columbia Management Investment Advisers, LLC and/or certain of its affiliates not waived/reimbursed certain fees and expenses, account value at the end of the period would have been reduced.
Annual Report 2014
7
Columbia AMT-Free Connecticut Intermediate Muni Bond Fund
Portfolio of Investments
October 31, 2014
(Percentages represent value of investments compared to net assets)
Municipal Bonds 99.2%
Issue
Description | | Coupon
Rate | | Principal
Amount ($) | |
Value ($) | |
Disposal 1.0% | |
New Haven Solid Waste Authority
Revenue Bonds
Series 2008
06/01/23 | | | 5.125 | % | | | 1,520,000 | | | | 1,675,040 | | |
Higher Education 13.2% | |
Connecticut State Health & Educational Facility Authority
Refunding Revenue Bonds
Connecticut State University
Series 2014O
11/01/25 | | | 4.000 | % | | | 2,000,000 | | | | 2,275,660 | | |
Sacred Heart University
Series 2012H (AGM)
07/01/19 | | | 5.000 | % | | | 2,350,000 | | | | 2,723,932 | | |
Revenue Bonds
Fairfield University
Series 2008N
07/01/18 | | | 5.000 | % | | | 2,120,000 | | | | 2,393,438 | | |
07/01/22 | | | 5.000 | % | | | 2,500,000 | | | | 2,821,875 | | |
Quinnipiac University
Series 2007I (NPFGC)
07/01/22 | | | 5.000 | % | | | 2,000,000 | | | | 2,188,120 | | |
Quinnipiac University Health & Education
Series 2007 (NPFGC)
07/01/28 | | | 5.000 | % | | | 2,000,000 | | | | 2,221,940 | | |
Sacred Heart University
Series 2011G
07/01/20 | | | 5.000 | % | | | 1,190,000 | | | | 1,339,226 | | |
Trinity College
Series 1998F (NPFGC)
07/01/21 | | | 5.500 | % | | | 500,000 | | | | 579,260 | | |
Yale University
Series 1997T-1
07/01/29 | | | 4.700 | % | | | 4,800,000 | | | | 5,220,672 | | |
Total | | | | | | | 21,764,123 | | |
Hospital 15.1% | |
Connecticut State Health & Educational Facility Authority
Revenue Bonds
Bridgeport Hospital
Series 2012D
07/01/22 | | | 5.000 | % | | | 1,400,000 | | | | 1,664,278 | | |
Hartford Healthcare
Series 2014E
07/01/34 | | | 5.000 | % | | | 2,360,000 | | | | 2,643,979 | | |
Health System Catholic East
Series 2010
11/15/29 | | | 4.750 | % | | | 3,420,000 | | | | 3,687,512 | | |
Hospital for Special Care
Series 2007C (RAD)
07/01/17 | | | 5.250 | % | | | 500,000 | | | | 546,075 | | |
07/01/20 | | | 5.250 | % | | | 1,235,000 | | | | 1,321,722 | | |
07/01/27 | | | 5.250 | % | | | 750,000 | | | | 786,420 | | |
Municipal Bonds (continued)
Issue
Description | | Coupon
Rate | | Principal
Amount ($) | |
Value ($) | |
Lawrence & Memorial Hospital
Series 2011S
07/01/31 | | | 5.000 | % | | | 2,000,000 | | | | 2,208,180 | | |
Middlesex Hospital
Series 2006M (AGM)
07/01/27 | | | 4.875 | % | | | 500,000 | | | | 534,455 | | |
Series 2011N
07/01/20 | | | 5.000 | % | | | 1,365,000 | | | | 1,561,301 | | |
07/01/21 | | | 5.000 | % | | | 1,000,000 | | | | 1,141,750 | | |
Stamford Hospital
Series 2012J
07/01/20 | | | 5.000 | % | | | 1,525,000 | | | | 1,760,094 | | |
Western Connecticut Health Network
Series 2011
07/01/19 | | | 5.000 | % | | | 1,760,000 | | | | 2,001,666 | | |
07/01/20 | | | 5.000 | % | | | 1,630,000 | | | | 1,864,410 | | |
Yale-New Haven Health
Series 2014A
07/01/31 | | | 5.000 | % | | | 2,500,000 | | | | 2,869,275 | | |
Yale-New Haven Hospital
Series 2013N
07/01/25 | | | 5.000 | % | | | 300,000 | | | | 354,135 | | |
Total | | | | | | | 24,945,252 | | |
Investor Owned 3.3% | |
Connecticut State Development Authority
Refunding Revenue Bonds
Connecticut Light & Power Co. Project
Series 2011
09/01/28 | | | 4.375 | % | | | 5,000,000 | | | | 5,441,100 | | |
Joint Power Authority 0.7% | |
Connecticut Municipal Electric Energy Cooperative
Revenue Bonds
Series 2012A
01/01/27 | | | 5.000 | % | | | 1,000,000 | | | | 1,140,530 | | |
Local General Obligation 19.0% | |
City of Bridgeport
Unlimited General Obligation Bonds
Series 2014A (AGM)
07/01/31 | | | 5.000 | % | | | 1,350,000 | | | | 1,549,408 | | |
Unlimited General Obligation Refunding Bonds
Series 2004C (NPFGC)
08/15/17 | | | 5.250 | % | | | 1,500,000 | | | | 1,668,525 | | |
08/15/21 | | | 5.500 | % | | | 1,125,000 | | | | 1,350,203 | | |
City of Hartford
Unlimited General Obligation Bonds
Series 2011A
04/01/22 | | | 5.250 | % | | | 1,325,000 | | | | 1,563,023 | | |
04/01/23 | | | 5.250 | % | | | 1,325,000 | | | | 1,545,546 | | |
04/01/24 | | | 5.250 | % | | | 1,325,000 | | | | 1,535,715 | | |
Unlimited General Obligation Refunding Bonds
Series 2005C (NPFGC)
09/01/19 | | | 5.000 | % | | | 2,085,000 | | | | 2,423,896 | | |
Series 2013A
04/01/26 | | | 5.000 | % | | | 1,810,000 | | | | 2,106,369 | | |
The accompanying Notes to Financial Statements are an integral part of this statement.
Annual Report 2014
8
Columbia AMT-Free Connecticut Intermediate Muni Bond Fund
Portfolio of Investments (continued)
October 31, 2014
Municipal Bonds (continued)
Issue
Description | | Coupon
Rate | | Principal
Amount ($) | |
Value ($) | |
City of New Haven
Unlimited General Obligation Bonds
Series 2011 (AGM)
08/01/18 | | | 5.000 | % | | | 820,000 | | | | 930,454 | | |
Unlimited General Obligation Refunding Bonds
Series 2008 (AGM)
11/01/18 | | | 5.000 | % | | | 4,410,000 | | | | 5,033,398 | | |
City of Stamford
Unlimited General Obligation Refunding Bonds
Series 2003B
08/15/17 | | | 5.250 | % | | | 1,125,000 | | | | 1,268,550 | | |
Regional School District No. 15
Limited General Obligation Refunding Bonds
Series 2003 (NPFGC)
02/01/16 | | | 5.000 | % | | | 1,025,000 | | | | 1,083,630 | | |
Town of Brookfield
Unlimited General Obligation Refunding Bonds
Series 2014
08/01/25 | | | 5.000 | % | | | 325,000 | | | | 410,946 | | |
Town of Fairfield
Unlimited General Obligation Refunding Bonds
Series 2008
01/01/20 | | | 5.000 | % | | | 1,000,000 | | | | 1,187,040 | | |
01/01/22 | | | 5.000 | % | | | 500,000 | | | | 608,240 | | |
Town of Hamden
Unlimited General Obligation Bonds
Build America Bonds
Series 2014A
08/15/23 | | | 5.000 | % | | | 320,000 | | | | 371,568 | | |
Town of North Haven
Unlimited General Obligation Bonds
Series 2007
07/15/24 | | | 4.750 | % | | | 1,150,000 | | | | 1,389,614 | | |
07/15/25 | | | 4.750 | % | | | 1,150,000 | | | | 1,399,872 | | |
Town of Ridgefield
Unlimited General Obligation Refunding Bonds
Series 2009
09/15/20 | | | 5.000 | % | | | 2,130,000 | | | | 2,568,226 | | |
Town of Trumbull
Unlimited General Obligation Refunding Bonds
Series 2009
09/15/20 | | | 4.000 | % | | | 575,000 | | | | 642,419 | | |
09/15/21 | | | 4.000 | % | | | 600,000 | | | | 664,218 | | |
Total | | | | | | | 31,300,860 | | |
Multi-Family 1.4% | |
Bridgeport Housing Authority
Revenue Bonds
Custodial Receipts Energy Performance
Series 2009
06/01/22 | | | 5.000 | % | | | 1,035,000 | | | | 1,091,242 | | |
06/01/23 | | | 5.000 | % | | | 1,085,000 | | | | 1,139,434 | | |
Total | | | | | | | 2,230,676 | | |
Municipal Bonds (continued)
Issue
Description | | Coupon
Rate | | Principal
Amount ($) | |
Value ($) | |
Municipal Power 0.2% | |
Guam Power Authority
Refunding Revenue Bonds
Series 2012A (AGM)(a)
10/01/24 | | | 5.000 | % | | | 315,000 | | | | 373,351 | | |
Nursing Home 0.8% | |
Connecticut State Development Authority
Revenue Bonds
Alzheimers Resource Center, Inc. Project
Series 2007
08/15/17 | | | 5.200 | % | | | 670,000 | | | | 715,647 | | |
08/15/21 | | | 5.400 | % | | | 500,000 | | | | 524,895 | | |
Total | | | | | | | 1,240,542 | | |
Pool/Bond Bank 0.7% | |
State of Connecticut
Refunding Revenue Bonds
Revolving Fund
Series 2009C
10/01/18 | | | 5.000 | % | | | 1,000,000 | | | | 1,158,250 | | |
Prep School 3.7% | |
Connecticut State Health & Educational Facility Authority
Revenue Bonds
Greenwich Academy
Series 2007E (AGM)
03/01/26 | | | 5.250 | % | | | 2,770,000 | | | | 3,301,120 | | |
Loomis Chaffe School
Series 2005F (AMBAC)
07/01/27 | | | 5.250 | % | | | 1,670,000 | | | | 2,155,419 | | |
Miss Porters School Issue
Series 2006B (AMBAC)
07/01/29 | | | 4.500 | % | | | 600,000 | | | | 630,372 | | |
Total | | | | | | | 6,086,911 | | |
Refunded/Escrowed 6.9% | |
City of Hartford
Unlimited General Obligation Bonds
Series 2009A Escrowed to Maturity (AGM)
08/15/17 | | | 5.000 | % | | | 695,000 | | | | 778,887 | | |
Connecticut Municipal Electric Energy Cooperative
Prerefunded 01/01/17 Revenue Bonds
Series 2006A (AMBAC)
01/01/22 | | | 5.000 | % | | | 2,000,000 | | | | 2,196,900 | | |
Revenue Bonds
Series 2009A Escrowed to Maturity (AGM)
01/01/17 | | | 5.000 | % | | | 1,525,000 | | | | 1,675,136 | | |
Connecticut State Health & Educational Facility Authority
Prerefunded 07/01/15 Revenue Bonds
William W Backus Hospital
Series 2005G (AGM)
07/01/24 | | | 5.000 | % | | | 1,300,000 | | | | 1,341,639 | | |
The accompanying Notes to Financial Statements are an integral part of this statement.
Annual Report 2014
9
Columbia AMT-Free Connecticut Intermediate Muni Bond Fund
Portfolio of Investments (continued)
October 31, 2014
Municipal Bonds (continued)
Issue
Description | | Coupon
Rate | | Principal
Amount ($) | |
Value ($) | |
Puerto Rico Highways & Transportation Authority
Refunding Revenue Bonds
Series 2005BB Escrowed to Maturity (AGM)(a)
07/01/22 | | | 5.250 | % | | | 895,000 | | | | 1,111,581 | | |
State of Connecticut
Prerefunded 11/15/15 Unlimited General Obligation Bonds
Series 2005D (NPFGC)
11/15/23 | | | 5.000 | % | | | 4,000,000 | | | | 4,199,600 | | |
Total | | | | | | | 11,303,743 | | |
Single Family 5.5% | |
Connecticut Housing Finance Authority
Revenue Bonds
Subordinated Series 2008B-1
11/15/23 | | | 4.750 | % | | | 3,000,000 | | | | 3,139,560 | | |
Subordinated Series 2009B-1
11/15/24 | | | 4.550 | % | | | 4,000,000 | | | | 4,280,520 | | |
Connecticut Housing Finance Authority(b)
Refunding Revenue Bonds
Series 2014
11/15/29 | | | 3.000 | % | | | 1,625,000 | | | | 1,605,565 | | |
Total | | | | | | | 9,025,645 | | |
Special Non Property Tax 9.3% | |
State of Connecticut Special Tax
Revenue Bonds
Transportation Infrastructure
Series 2009A
12/01/19 | | | 4.500 | % | | | 3,765,000 | | | | 4,363,070 | | |
Series 2014A
09/01/25 | | | 5.000 | % | | | 2,500,000 | | | | 3,052,350 | | |
State of Connecticut
Refunding Special Tax Bonds
2nd Lien Transportation Infrastructure
Series 2009-1
02/01/17 | | | 4.250 | % | | | 1,000,000 | | | | 1,083,940 | | |
02/01/19 | | | 5.000 | % | | | 3,450,000 | | | | 4,007,554 | | |
Territory of Guam
Revenue Bonds
Series 2011A(a)
01/01/31 | | | 5.000 | % | | | 550,000 | | | | 600,045 | | |
Virgin Islands Public Finance Authority
Revenue Bonds
Matching Fund Loan Notes-Senior Lien
Series 2010A(a)
10/01/25 | | | 5.000 | % | | | 2,020,000 | | | | 2,239,796 | | |
Total | | | | | | | 15,346,755 | | |
Municipal Bonds (continued)
Issue
Description | | Coupon
Rate | | Principal
Amount ($) | |
Value ($) | |
Special Property Tax 1.9% | |
Harbor Point Infrastructure Improvement District
Tax Allocation Bonds
Harbor Point Project
Series 2010A
04/01/22 | | | 7.000 | % | | | 2,662,000 | | | | 3,136,688 | | |
State Appropriated 2.7% | |
University of Connecticut
Revenue Bonds
Series 2007A
04/01/24 | | | 4.000 | % | | | 2,100,000 | | | | 2,236,185 | | |
Series 2009A
02/15/23 | | | 5.000 | % | | | 2,000,000 | | | | 2,294,920 | | |
Total | | | | | | | 4,531,105 | | |
State General Obligation 8.0% | |
Connecticut Housing Finance Authority
Revenue Bonds
State Supported Special Obligation
Series 2009-10
06/15/18 | | | 5.000 | % | | | 1,755,000 | | | | 1,994,066 | | |
06/15/19 | | | 5.000 | % | | | 1,840,000 | | | | 2,128,273 | | |
State of Connecticut
Unlimited General Obligation Bonds
Series 2008B
04/15/22 | | | 5.000 | % | | | 5,415,000 | | | | 6,138,281 | | |
Unlimited General Obligation Refunding Bonds
Series 2005B (AMBAC)
06/01/20 | | | 5.250 | % | | | 600,000 | | | | 720,780 | | |
Series 2006E
12/15/20 | | | 5.000 | % | | | 2,000,000 | | | | 2,188,420 | | |
Total | | | | | | | 13,169,820 | | |
Water & Sewer 5.8% | |
Greater New Haven Water Pollution Control Authority
Refunding Revenue Bonds
Series 2014B
08/15/31 | | | 5.000 | % | | | 1,000,000 | | | | 1,162,070 | | |
Hartford County Metropolitan District
Revenue Bonds
Clean Water Project
Series 2014A(b)
11/01/27 | | | 5.000 | % | | | 1,000,000 | | | | 1,207,040 | | |
South Central Connecticut Regional Water Authority
Refunding Revenue Bonds
20th Series 2007A (NPFGC)
08/01/22 | | | 5.250 | % | | | 1,370,000 | | | | 1,684,470 | | |
08/01/23 | | | 5.250 | % | | | 500,000 | | | | 620,840 | | |
27th Series 2012
08/01/29 | | | 5.000 | % | | | 2,945,000 | | | | 3,384,600 | | |
29th Series 2014
08/01/25 | | | 5.000 | % | | | 500,000 | | | | 596,775 | | |
The accompanying Notes to Financial Statements are an integral part of this statement.
Annual Report 2014
10
Columbia AMT-Free Connecticut Intermediate Muni Bond Fund
Portfolio of Investments (continued)
October 31, 2014
Municipal Bonds (continued)
Issue
Description | | Coupon
Rate | | Principal
Amount ($) | |
Value ($) | |
South Central Connecticut Regional Water Authority(c)
Revenue Bonds
18th Series 2003B (NPFGC)
08/01/29 | | | 5.250 | % | | | 750,000 | | | | 837,150 | | |
Total | | | | | | | 9,492,945 | | |
Total Municipal Bonds
(Cost: $151,394,648) | | | | | | | 163,363,336 | | |
Money Market Funds 0.7%
| | | Shares | |
Value ($) | |
Dreyfus Tax-Exempt Cash
Management Fund,
0.000%(d) | | | 1,200,007 | | | | 1,200,007 | | |
Total Money Market Funds
(Cost: $1,200,007) | | | | | 1,200,007 | | |
Total Investments
(Cost: $152,594,655) | | | | | 164,563,343 | | |
Other Assets & Liabilities, Net | | | | | 239,459 | | |
Net Assets | | | | | 164,802,802 | | |
Notes to Portfolio of Investments
(a) Municipal obligations include debt obligations issued by or on behalf of territories, possessions, or sovereign nations within the territorial boundaries of the United States. At October 31, 2014, the value of these securities amounted to $4,324,773 or 2.62% of net assets.
(b) Represents a security purchased on a when-issued or delayed delivery basis.
(c) Variable rate security.
(d) The rate shown is the seven-day current annualized yield at October 31, 2014.
Abbreviation Legend
AGM Assured Guaranty Municipal Corporation
AMBAC Ambac Assurance Corporation
NPFGC National Public Finance Guarantee Corporation
RAD Radian Asset Assurance, Inc.
Fair Value Measurements
Generally accepted accounting principles (GAAP) require disclosure regarding the inputs and valuation techniques used to measure fair value and any changes in valuation inputs or techniques. In addition, investments shall be disclosed by major category.
The Fund categorizes its fair value measurements according to a three-level hierarchy that maximizes the use of observable inputs and minimizes the use of unobservable inputs by prioritizing that the most observable input be used when available. Observable inputs are those that market participants would use in pricing an investment based on market data obtained from sources independent of the reporting entity. Unobservable inputs are those that reflect the Fund's assumptions about the information market participants would use in pricing an investment. An investment's level within the fair value hierarchy is based on the lowest level of any input that is deemed significant to the asset or liability's fair value measurement. The input levels are not necessarily an indication of the risk or liquidity associated with investments at that level. For example, certain U.S. government securities are generally high quality and liquid, however, they are reflected as Level 2 because the inputs used to determine fair value may not always be quoted prices in an active market.
Fair value inputs are summarized in the three broad levels listed below:
> Level 1 — Valuations based on quoted prices for investments in active markets that the Fund has the ability to access at the measurement date (including NAV for open-end mutual funds). Valuation adjustments are not applied to Level 1 investments.
> Level 2 — Valuations based on other significant observable inputs (including quoted prices for similar securities, interest rates, prepayment speeds, credit risks, etc.).
> Level 3 — Valuations based on significant unobservable inputs (including the Fund's own assumptions and judgment in determining the fair value of investments).
The accompanying Notes to Financial Statements are an integral part of this statement.
Annual Report 2014
11
Columbia AMT-Free Connecticut Intermediate Muni Bond Fund
Portfolio of Investments (continued)
October 31, 2014
Fair Value Measurements (continued)
Inputs that are used in determining fair value of an investment may include price information, credit data, volatility statistics, and other factors. These inputs can be either observable or unobservable. The availability of observable inputs can vary between investments, and is affected by various factors such as the type of investment, and the volume and level of activity for that investment or similar investments in the marketplace. The inputs will be considered by the Investment Manager, along with any other relevant factors in the calculation of an investment's fair value. The Fund uses prices and inputs that are current as of the measurement date, which may include periods of market dislocations. During these periods, the availability of prices and inputs may be reduced for many investments. This condition could cause an investment to be reclassified between the various levels within the hierarchy.
Investments falling into the Level 3 category are primarily supported by quoted prices from brokers and dealers participating in the market for those investments. However, these may be classified as Level 3 investments due to lack of market transparency and corroboration to support these quoted prices. Additionally, valuation models may be used as the pricing source for any remaining investments classified as Level 3. These models may rely on one or more significant unobservable inputs and/or significant assumptions by the Investment Manager. Inputs used in valuations may include, but are not limited to, financial statement analysis, capital account balances, discount rates and estimated cash flows, and comparable company data.
Under the direction of the Fund's Board of Trustees (the Board), the Investment Manager's Valuation Committee (the Committee) is responsible for overseeing the valuation procedures approved by the Board. The Committee consists of voting and non-voting members from various groups within the Investment Manager's organization, including operations and accounting, trading and investments, compliance, risk management and legal.
The Committee meets at least monthly to review and approve valuation matters, which may include a description of specific valuation determinations, data regarding pricing information received from approved pricing vendors and brokers and the results of Board-approved valuation control policies and procedures (the Policies). The Policies address, among other things, instances when market quotations are or are not readily available, including recommendations of third party pricing vendors and a determination of appropriate pricing methodologies; events that require specific valuation determinations and assessment of fair value techniques; securities with a potential for stale pricing, including those that are illiquid, restricted, or in default; and the effectiveness of third party pricing vendors, including periodic reviews of vendors. The Committee meets more frequently, as needed, to discuss additional valuation matters, which may include the need to review back-testing results, review time-sensitive information or approve related valuation actions. The Committee reports to the Board, with members of the Committee meeting with the Board at each of its regularly scheduled meetings to discuss valuation matters and actions during the period, similar to those described earlier.
For investments categorized as Level 3, the Committee monitors information similar to that described above, which may include: (i) data specific to the issuer or comparable issuers, (ii) general market or specific sector news and (iii) quoted prices and specific or similar security transactions. The Committee considers this data and any changes from prior periods in order to assess the reasonableness of observable and unobservable inputs, any assumptions or internal models used to value those securities and changes in fair value. This data is also used to corroborate, when available, information received from approved pricing vendors and brokers. Various factors impact the frequency of monitoring this information (which may occur as often as daily). However, the Committee may determine that changes to inputs, assumptions and models are not required as a result of the monitoring procedures performed.
The following table is a summary of the inputs used to value the Fund's investments at October 31, 2014:
Description | | Level 1
Quoted Prices in Active
Markets for Identical
Assets ($) | |
Level 2
Other Significant
Observable Inputs ($) | |
Level 3
Significant
Unobservable Inputs ($) | |
Total ($) | |
Bonds | |
Municipal Bonds | | | — | | | | 163,363,336 | | | | — | | | | 163,363,336 | | |
Total Bonds | | | — | | | | 163,363,336 | | | | — | | | | 163,363,336 | | |
Mutual Funds | |
Money Market Funds | | | 1,200,007 | | | | — | | | | — | | | | 1,200,007 | | |
Total Mutual Funds | | | 1,200,007 | | | | — | | | | — | | | | 1,200,007 | | |
Total | | | 1,200,007 | | | | 163,363,336 | | | | — | | | | 164,563,343 | | |
See the Portfolio of Investments for all investment classifications not indicated in the table.
The Fund's assets assigned to the Level 2 input category are generally valued using the market approach, in which a security's value is determined through reference to prices and information from market transactions for similar or identical assets.
There were no transfers of financial assets between levels during the period.
The accompanying Notes to Financial Statements are an integral part of this statement.
Annual Report 2014
12
Columbia AMT-Free Connecticut Intermediate Muni Bond Fund
Statement of Assets and Liabilities
October 31, 2014
Assets | |
Investments, at value | |
(identified cost $152,594,655) | | $ | 164,563,343 | | |
Cash | | | 2,272,606 | | |
Receivable for: | |
Capital shares sold | | | 140,255 | | |
Interest | | | 1,977,433 | | |
Expense reimbursement due from Investment Manager | | | 683 | | |
Prepaid expenses | | | 1,448 | | |
Trustees' deferred compensation plan | | | 34,980 | | |
Total assets | | | 168,990,748 | | |
Liabilities | |
Payable for: | |
Investments purchased on a delayed delivery basis | | | 2,832,510 | | |
Capital shares purchased | | | 828,302 | | |
Dividend distributions to shareholders | | | 428,283 | | |
Investment management fees | | | 1,816 | | |
Distribution and/or service fees | | | 228 | | |
Transfer agent fees | | | 31,520 | | |
Administration fees | | | 318 | | |
Chief compliance officer expenses | | | 9 | | |
Other expenses | | | 29,980 | | |
Trustees' deferred compensation plan | | | 34,980 | | |
Total liabilities | | | 4,187,946 | | |
Net assets applicable to outstanding capital stock | | $ | 164,802,802 | | |
Represented by | |
Paid-in capital | | $ | 152,390,563 | | |
Undistributed net investment income | | | 143,579 | | |
Accumulated net realized gain | | | 299,972 | | |
Unrealized appreciation (depreciation) on: | |
Investments | | | 11,968,688 | | |
Total — representing net assets applicable to outstanding capital stock | | $ | 164,802,802 | | |
The accompanying Notes to Financial Statements are an integral part of this statement.
Annual Report 2014
13
Columbia AMT-Free Connecticut Intermediate Muni Bond Fund
Statement of Assets and Liabilities (continued)
October 31, 2014
Class A | |
Net assets | | $ | 7,710,837 | | |
Shares outstanding | | | 697,120 | | |
Net asset value per share | | $ | 11.06 | | |
Maximum offering price per share(a) | | $ | 11.43 | | |
Class B | |
Net assets | | $ | 148,547 | | |
Shares outstanding | | | 13,430 | | |
Net asset value per share | | $ | 11.06 | | |
Class C | |
Net assets | | $ | 6,263,836 | | |
Shares outstanding | | | 566,321 | | |
Net asset value per share | | $ | 11.06 | | |
Class R4 | |
Net assets | | $ | 416,449 | | |
Shares outstanding | | | 37,696 | | |
Net asset value per share | | $ | 11.05 | | |
Class T | |
Net assets | | $ | 12,430,939 | | |
Shares outstanding | | | 1,124,843 | | |
Net asset value per share | | $ | 11.05 | | |
Maximum offering price per share(a) | | $ | 11.60 | | |
Class Z | |
Net assets | | $ | 137,832,194 | | |
Shares outstanding | | | 12,461,369 | | |
Net asset value per share | | $ | 11.06 | | |
(a) The maximum offering price per share is calculated by dividing the net asset value per share by 1.0 minus the maximum sales charge of 3.25% for Class A and 4.75% for Class T.
The accompanying Notes to Financial Statements are an integral part of this statement.
Annual Report 2014
14
Columbia AMT-Free Connecticut Intermediate Muni Bond Fund
Statement of Operations
Year Ended October 31, 2014
Net investment income | |
Income: | |
Dividends | | $ | 313 | | |
Interest | | | 6,235,929 | | |
Total income | | | 6,236,242 | | |
Expenses: | |
Investment management fees | | | 688,737 | | |
Distribution and/or service fees | |
Class A | | | 22,186 | | |
Class B | | | 1,453 | | |
Class C | | | 66,202 | | |
Class T | | | 19,069 | | |
Transfer agent fees | |
Class A | | | 16,830 | | |
Class B | | | 276 | | |
Class C | | | 12,575 | | |
Class R4 | | | 782 | | |
Class T | | | 24,151 | | |
Class Z | | | 272,443 | | |
Administration fees | | | 120,529 | | |
Compensation of board members | | | 25,079 | | |
Custodian fees | | | 2,108 | | |
Printing and postage fees | | | 28,783 | | |
Registration fees | | | 36,660 | | |
Professional fees | | | 29,420 | | |
Chief compliance officer expenses | | | 89 | | |
Other | | | 7,446 | | |
Total expenses | | | 1,374,818 | | |
Fees waived or expenses reimbursed by Investment Manager and its affiliates | | | (301,578 | ) | |
Fees waived by Distributor — Class C | | | (20,981 | ) | |
Expense reductions | | | (100 | ) | |
Total net expenses | | | 1,052,159 | | |
Net investment income | | | 5,184,083 | | |
Realized and unrealized gain (loss) — net | |
Net realized gain (loss) on: | |
Investments | | | 813,241 | | |
Net realized gain | | | 813,241 | | |
Net change in unrealized appreciation (depreciation) on: | |
Investments | | | 2,345,718 | | |
Net change in unrealized appreciation | | | 2,345,718 | | |
Net realized and unrealized gain | | | 3,158,959 | | |
Net increase in net assets resulting from operations | | $ | 8,343,042 | | |
The accompanying Notes to Financial Statements are an integral part of this statement.
Annual Report 2014
15
Columbia AMT-Free Connecticut Intermediate Muni Bond Fund
Statement of Changes in Net Assets
| | | Year Ended
October 31,
2014 | | Year Ended
October 31,
2013(a) | |
Operations | |
Net investment income | | $ | 5,184,083 | | | $ | 5,776,911 | | |
Net realized gain (loss) | | | 813,241 | | | | (511,379 | ) | |
Net change in unrealized appreciation (depreciation) | | | 2,345,718 | | | | (7,683,067 | ) | |
Net increase (decrease) in net assets resulting from operations | | | 8,343,042 | | | | (2,417,535 | ) | |
Distributions to shareholders | |
Net investment income | |
Class A | | | (248,236 | ) | | | (240,467 | ) | |
Class B | | | (2,982 | ) | | | (2,976 | ) | |
Class C | | | (156,889 | ) | | | (167,685 | ) | |
Class R4 | | | (12,860 | ) | | | (44 | ) | |
Class T | | | (379,822 | ) | | | (385,443 | ) | |
Class Z | | | (4,374,518 | ) | | | (4,973,046 | ) | |
Net realized gains | |
Class A | | | — | | | | (36,990 | ) | |
Class B | | | — | | | | (807 | ) | |
Class C | | | — | | | | (30,336 | ) | |
Class T | | | — | | | | (59,534 | ) | |
Class Z | | | — | | | | (746,436 | ) | |
Total distributions to shareholders | | | (5,175,307 | ) | | | (6,643,764 | ) | |
Decrease in net assets from capital stock activity | | | (20,333,069 | ) | | | (23,061,437 | ) | |
Total decrease in net assets | | | (17,165,334 | ) | | | (32,122,736 | ) | |
Net assets at beginning of year | | | 181,968,136 | | | | 214,090,872 | | |
Net assets at end of year | | $ | 164,802,802 | | | $ | 181,968,136 | | |
Undistributed net investment income | | $ | 143,579 | | | $ | 141,748 | | |
(a) Class R4 shares are based on operations from March 19, 2013 (commencement of operations) through the stated period end.
The accompanying Notes to Financial Statements are an integral part of this statement.
Annual Report 2014
16
Columbia AMT-Free Connecticut Intermediate Muni Bond Fund
Statement of Changes in Net Assets (continued)
| | | Year Ended October 31, 2014 | | Year Ended October 31, 2013(a) | |
| | | Shares | | Dollars ($) | | Shares | | Dollars ($) | |
Capital stock activity | |
Class A shares | |
Subscriptions(b) | | | 318,442 | | | | 3,480,852 | | | | 271,318 | | | | 3,047,855 | | |
Distributions reinvested | | | 19,947 | | | | 218,400 | | | | 20,678 | | | | 229,031 | | |
Redemptions | | | (471,961 | ) | | | (5,170,674 | ) | | | (249,512 | ) | | | (2,763,143 | ) | |
Net increase (decrease) | | | (133,572 | ) | | | (1,471,422 | ) | | | 42,484 | | | | 513,743 | | |
Class B shares | |
Subscriptions | | | 62 | | | | 682 | | | | 87 | | | | 974 | | |
Distributions reinvested | | | 210 | | | | 2,300 | | | | 242 | | | | 2,684 | | |
Redemptions(b) | | | (9 | ) | | | (107 | ) | | | (4,580 | ) | | | (51,593 | ) | |
Net increase (decrease) | | | 263 | | | | 2,875 | | | | (4,251 | ) | | | (47,935 | ) | |
Class C shares | |
Subscriptions | | | 106,476 | | | | 1,167,330 | | | | 161,593 | | | | 1,783,135 | | |
Distributions reinvested | | | 10,084 | | | | 110,446 | | | | 11,462 | | | | 127,275 | | |
Redemptions | | | (193,145 | ) | | | (2,114,703 | ) | | | (193,430 | ) | | | (2,125,797 | ) | |
Net decrease | | | (76,585 | ) | | | (836,927 | ) | | | (20,375 | ) | | | (215,387 | ) | |
Class R4 shares | |
Subscriptions | | | 51,517 | | | | 556,485 | | | | 223 | | | | 2,500 | | |
Distributions reinvested | | | 1,153 | | | | 12,641 | | | | 1 | | | | 6 | | |
Redemptions | | | (15,198 | ) | | | (167,050 | ) | | | — | | | | — | | |
Net increase | | | 37,472 | | | | 402,076 | | | | 224 | | | | 2,506 | | |
Class T shares | |
Subscriptions | | | 5,935 | | | | 64,807 | | | | 8,291 | | | | 91,194 | | |
Distributions reinvested | | | 18,739 | | | | 205,099 | | | | 22,804 | | | | 253,463 | | |
Redemptions | | | (124,182 | ) | | | (1,354,178 | ) | | | (121,242 | ) | | | (1,347,078 | ) | |
Net decrease | | | (99,508 | ) | | | (1,084,272 | ) | | | (90,147 | ) | | | (1,002,421 | ) | |
Class Z shares | |
Subscriptions | | | 1,341,677 | | | | 14,691,260 | | | | 1,263,206 | | | | 14,097,975 | | |
Distributions reinvested | | | 20,249 | | | | 221,724 | | | | 26,613 | | | | 295,542 | | |
Redemptions | | | (2,956,945 | ) | | | (32,258,383 | ) | | | (3,334,224 | ) | | | (36,705,460 | ) | |
Net decrease | | | (1,595,019 | ) | | | (17,345,399 | ) | | | (2,044,405 | ) | | | (22,311,943 | ) | |
Total net decrease | | | (1,866,949 | ) | | | (20,333,069 | ) | | | (2,116,470 | ) | | | (23,061,437 | ) | |
(a) Class R4 shares are based on operations from March 19, 2013 (commencement of operations) through the stated period end.
(b) Includes conversions of Class B shares to Class A shares, if any.
The accompanying Notes to Financial Statements are an integral part of this statement.
Annual Report 2014
17
Columbia AMT-Free Connecticut Intermediate Muni Bond Fund
The following tables are intended to help you understand the Fund's financial performance. Certain information reflects financial results for a single share of a class held for the periods shown. Per share net investment income (loss) amounts are calculated based on average shares outstanding during the period. Total return assumes reinvestment of all dividends and distributions, if any. Total return does not reflect payment of sales charges, if any. Total return and portfolio turnover are not annualized for periods of less than one year. The portfolio turnover rate is calculated without regard to purchase and sales transactions of short-term instruments and certain derivatives, if any. If such transactions were included, the Fund's portfolio turnover rate may be higher.
| | | Year Ended October 31, | |
Class A | | 2014 | | 2013 | | 2012 | | 2011 | | 2010 | |
Per share data | |
Net asset value, beginning of period | | $ | 10.85 | | | $ | 11.34 | | | $ | 10.97 | | | $ | 11.00 | | | $ | 10.69 | | |
Income from investment operations: | |
Net investment income | | | 0.31 | | | | 0.29 | | | | 0.31 | | | | 0.33 | | | | 0.33 | | |
Net realized and unrealized gain (loss) | | | 0.21 | | | | (0.44 | ) | | | 0.38 | | | | (0.03 | ) | | | 0.31 | | |
Total from investment operations | | | 0.52 | | | | (0.15 | ) | | | 0.69 | | | | 0.30 | | | | 0.64 | | |
Less distributions to shareholders: | |
Net investment income | | | (0.31 | ) | | | (0.29 | ) | | | (0.31 | ) | | | (0.33 | ) | | | (0.33 | ) | |
Net realized gains | | | — | | | | (0.05 | ) | | | (0.01 | ) | | | — | | | | — | | |
Total distributions to shareholders | | | (0.31 | ) | | | (0.34 | ) | | | (0.32 | ) | | | (0.33 | ) | | | (0.33 | ) | |
Net asset value, end of period | | $ | 11.06 | | | $ | 10.85 | | | $ | 11.34 | | | $ | 10.97 | | | $ | 11.00 | | |
Total return | | | 4.83 | % | | | (1.34 | %) | | | 6.36 | % | | | 2.83 | % | | | 6.10 | % | |
Ratios to average net assets(a) | |
Total gross expenses | | | 0.99 | % | | | 0.97 | % | | | 1.00 | % | | | 1.03 | % | | | 0.94 | % | |
Total net expenses(b) | | | 0.81 | %(c) | | | 0.80 | %(c) | | | 0.79 | %(c) | | | 0.79 | %(c) | | | 0.80 | %(c) | |
Net investment income | | | 2.81 | % | | | 2.67 | % | | | 2.79 | % | | | 3.09 | % | | | 3.08 | % | |
Supplemental data | |
Net assets, end of period (in thousands) | | $ | 7,711 | | | $ | 9,016 | | | $ | 8,937 | | | $ | 9,108 | | | $ | 11,458 | | |
Portfolio turnover | | | 12 | % | | | 9 | % | | | 19 | % | | | 6 | % | | | 10 | % | |
Notes to Financial Highlights
(a) In addition to the fees and expenses that the Fund bears directly, the Fund indirectly bears a pro rata share of the fees and expenses of any other funds in which it invests. Such indirect expenses are not included in the Fund's reported expense ratios.
(b) Total net expenses include the impact of certain fee waivers/expense reimbursements made by the Investment Manager and certain of its affiliates, if applicable.
(c) The benefits derived from expense reductions had an impact of less than 0.01%.
The accompanying Notes to Financial Statements are an integral part of this statement.
Annual Report 2014
18
Columbia AMT-Free Connecticut Intermediate Muni Bond Fund
Financial Highlights (continued)
| | | Year Ended October 31, | |
Class B | | 2014 | | 2013 | | 2012 | | 2011 | | 2010 | |
Per share data | |
Net asset value, beginning of period | | $ | 10.85 | | | $ | 11.34 | | | $ | 10.97 | | | $ | 11.00 | | | $ | 10.69 | | |
Income from investment operations: | |
Net investment income | | | 0.23 | | | | 0.21 | | | | 0.23 | | | | 0.25 | | | | 0.25 | | |
Net realized and unrealized gain (loss) | | | 0.20 | | | | (0.44 | ) | | | 0.38 | | | | (0.03 | ) | | | 0.31 | | |
Total from investment operations | | | 0.43 | | | | (0.23 | ) | | | 0.61 | | | | 0.22 | | | | 0.56 | | |
Less distributions to shareholders: | |
Net investment income | | | (0.22 | ) | | | (0.21 | ) | | | (0.23 | ) | | | (0.25 | ) | | | (0.25 | ) | |
Net realized gains | | | — | | | | (0.05 | ) | | | (0.01 | ) | | | — | | | | — | | |
Total distributions to shareholders | | | (0.22 | ) | | | (0.26 | ) | | | (0.24 | ) | | | (0.25 | ) | | | (0.25 | ) | |
Net asset value, end of period | | $ | 11.06 | | | $ | 10.85 | | | $ | 11.34 | | | $ | 10.97 | | | $ | 11.00 | | |
Total return | | | 4.04 | % | | | (2.08 | %) | | | 5.56 | % | | | 2.05 | % | | | 5.31 | % | |
Ratios to average net assets(a) | |
Total gross expenses | | | 1.73 | % | | | 1.72 | % | | | 1.84 | % | | | 1.83 | % | | | 1.69 | % | |
Total net expenses(b) | | | 1.56 | %(c) | | | 1.55 | %(c) | | | 1.54 | %(c) | | | 1.55 | %(c) | | | 1.55 | %(c) | |
Net investment income | | | 2.06 | % | | | 1.91 | % | | | 2.06 | % | | | 2.35 | % | | | 2.34 | % | |
Supplemental data | |
Net assets, end of period (in thousands) | | $ | 149 | | | $ | 143 | | | $ | 197 | | | $ | 265 | | | $ | 1,467 | | |
Portfolio turnover | | | 12 | % | | | 9 | % | | | 19 | % | | | 6 | % | | | 10 | % | |
Notes to Financial Highlights
(a) In addition to the fees and expenses that the Fund bears directly, the Fund indirectly bears a pro rata share of the fees and expenses of any other funds in which it invests. Such indirect expenses are not included in the Fund's reported expense ratios.
(b) Total net expenses include the impact of certain fee waivers/expense reimbursements made by the Investment Manager and certain of its affiliates, if applicable.
(c) The benefits derived from expense reductions had an impact of less than 0.01%.
The accompanying Notes to Financial Statements are an integral part of this statement.
Annual Report 2014
19
Columbia AMT-Free Connecticut Intermediate Muni Bond Fund
Financial Highlights (continued)
| | | Year Ended October 31, | |
Class C | | 2014 | | 2013 | | 2012 | | 2011 | | 2010 | |
Per share data | |
Net asset value, beginning of period | | $ | 10.85 | | | $ | 11.34 | | | $ | 10.97 | | | $ | 11.00 | | | $ | 10.69 | | |
Income from investment operations: | |
Net investment income | | | 0.26 | | | | 0.25 | | | | 0.27 | | | | 0.29 | | | | 0.29 | | |
Net realized and unrealized gain (loss) | | | 0.21 | | | | (0.44 | ) | | | 0.38 | | | | (0.03 | ) | | | 0.31 | | |
Total from investment operations | | | 0.47 | | | | (0.19 | ) | | | 0.65 | | | | 0.26 | | | | 0.60 | | |
Less distributions to shareholders: | |
Net investment income | | | (0.26 | ) | | | (0.25 | ) | | | (0.27 | ) | | | (0.29 | ) | | | (0.29 | ) | |
Net realized gains | | | — | | | | (0.05 | ) | | | (0.01 | ) | | | — | | | | — | | |
Total distributions to shareholders | | | (0.26 | ) | | | (0.30 | ) | | | (0.28 | ) | | | (0.29 | ) | | | (0.29 | ) | |
Net asset value, end of period | | $ | 11.06 | | | $ | 10.85 | | | $ | 11.34 | | | $ | 10.97 | | | $ | 11.00 | | |
Total return | | | 4.37 | % | | | (1.74 | %) | | | 5.94 | % | | | 2.41 | % | | | 5.68 | % | |
Ratios to average net assets(a) | |
Total gross expenses | | | 1.74 | % | | | 1.72 | % | | | 1.74 | % | | | 1.79 | % | | | 1.69 | % | |
Total net expenses(b) | | | 1.24 | %(c) | | | 1.20 | %(c) | | | 1.19 | %(c) | | | 1.19 | %(c) | | | 1.20 | %(c) | |
Net investment income | | | 2.38 | % | | | 2.26 | % | | | 2.39 | % | | | 2.68 | % | | | 2.68 | % | |
Supplemental data | |
Net assets, end of period (in thousands) | | $ | 6,264 | | | $ | 6,977 | | | $ | 7,520 | | | $ | 7,172 | | | $ | 7,897 | | |
Portfolio turnover | | | 12 | % | | | 9 | % | | | 19 | % | | | 6 | % | | | 10 | % | |
Notes to Financial Highlights
(a) In addition to the fees and expenses that the Fund bears directly, the Fund indirectly bears a pro rata share of the fees and expenses of any other funds in which it invests. Such indirect expenses are not included in the Fund's reported expense ratios.
(b) Total net expenses include the impact of certain fee waivers/expense reimbursements made by the Investment Manager and certain of its affiliates, if applicable.
(c) The benefits derived from expense reductions had an impact of less than 0.01%.
The accompanying Notes to Financial Statements are an integral part of this statement.
Annual Report 2014
20
Columbia AMT-Free Connecticut Intermediate Muni Bond Fund
Financial Highlights (continued)
| | | Year Ended October 31, | |
Class R4 | | 2014 | | 2013(a) | |
Per share data | |
Net asset value, beginning of period | | $ | 10.84 | | | $ | 11.19 | | |
Income from investment operations: | |
Net investment income | | | 0.34 | | | | 0.20 | | |
Net realized and unrealized gain (loss) | | | 0.21 | | | | (0.35 | ) | |
Total from investment operations | | | 0.55 | | | | (0.15 | ) | |
Less distributions to shareholders: | |
Net investment income | | | (0.34 | ) | | | (0.20 | ) | |
Total distributions to shareholders | | | (0.34 | ) | | | (0.20 | ) | |
Net asset value, end of period | | $ | 11.05 | | | $ | 10.84 | | |
Total return | | | 5.13 | % | | | (1.36 | %) | |
Ratios to average net assets(b) | |
Total gross expenses | | | 0.74 | % | | | 0.62 | %(c) | |
Total net expenses(d) | | | 0.56 | %(e) | | | 0.56 | %(c)(e) | |
Net investment income | | | 3.08 | % | | | 2.92 | %(c) | |
Supplemental data | |
Net assets, end of period (in thousands) | | $ | 416 | | | $ | 2 | | |
Portfolio turnover | | | 12 | % | | | 9 | % | |
Notes to Financial Highlights
(a) Based on operations from March 19, 2013 (commencement of operations) through the stated period end.
(b) In addition to the fees and expenses that the Fund bears directly, the Fund indirectly bears a pro rata share of the fees and expenses of any other funds in which it invests. Such indirect expenses are not included in the Fund's reported expense ratios.
(c) Annualized.
(d) Total net expenses include the impact of certain fee waivers/expense reimbursements made by the Investment Manager and certain of its affiliates, if applicable.
(e) The benefits derived from expense reductions had an impact of less than 0.01%.
The accompanying Notes to Financial Statements are an integral part of this statement.
Annual Report 2014
21
Columbia AMT-Free Connecticut Intermediate Muni Bond Fund
Financial Highlights (continued)
| | | Year Ended October 31, | |
Class T | | 2014 | | 2013 | | 2012 | | 2011 | | 2010 | |
Per share data | |
Net asset value, beginning of period | | $ | 10.85 | | | $ | 11.34 | | | $ | 10.97 | | | $ | 11.00 | | | $ | 10.69 | | |
Income from investment operations: | |
Net investment income | | | 0.32 | | | | 0.31 | | | | 0.32 | | | | 0.34 | | | | 0.35 | | |
Net realized and unrealized gain (loss) | | | 0.21 | | | | (0.45 | ) | | | 0.38 | | | | (0.03 | ) | | | 0.30 | | |
Total from investment operations | | | 0.53 | | | | (0.14 | ) | | | 0.70 | | | | 0.31 | | | | 0.65 | | |
Less distributions to shareholders: | |
Net investment income | | | (0.33 | ) | | | (0.30 | ) | | | (0.32 | ) | | | (0.34 | ) | | | (0.34 | ) | |
Net realized gains | | | — | | | | (0.05 | ) | | | (0.01 | ) | | | — | | | | — | | |
Total distributions to shareholders | | | (0.33 | ) | | | (0.35 | ) | | | (0.33 | ) | | | (0.34 | ) | | | (0.34 | ) | |
Net asset value, end of period | | $ | 11.05 | | | $ | 10.85 | | | $ | 11.34 | | | $ | 10.97 | | | $ | 11.00 | | |
Total return | | | 4.93 | % | | | (1.25 | %) | | | 6.47 | % | | | 2.93 | % | | | 6.21 | % | |
Ratios to average net assets(a) | |
Total gross expenses | | | 0.89 | % | | | 0.87 | % | | | 0.89 | % | | | 0.94 | % | | | 0.84 | % | |
Total net expenses(b) | | | 0.71 | %(c) | | | 0.70 | %(c) | | | 0.69 | %(c) | | | 0.69 | %(c) | | | 0.70 | %(c) | |
Net investment income | | | 2.91 | % | | | 2.76 | % | | | 2.89 | % | | | 3.18 | % | | | 3.18 | % | |
Supplemental data | |
Net assets, end of period (in thousands) | | $ | 12,431 | | | $ | 13,287 | | | $ | 14,903 | | | $ | 15,110 | | | $ | 16,603 | | |
Portfolio turnover | | | 12 | % | | | 9 | % | | | 19 | % | | | 6 | % | | | 10 | % | |
Notes to Financial Highlights
(a) In addition to the fees and expenses that the Fund bears directly, the Fund indirectly bears a pro rata share of the fees and expenses of any other funds in which it invests. Such indirect expenses are not included in the Fund's reported expense ratios.
(b) Total net expenses include the impact of certain fee waivers/expense reimbursements made by the Investment Manager and certain of its affiliates, if applicable.
(c) The benefits derived from expense reductions had an impact of less than 0.01%.
The accompanying Notes to Financial Statements are an integral part of this statement.
Annual Report 2014
22
Columbia AMT-Free Connecticut Intermediate Muni Bond Fund
Financial Highlights (continued)
| | | Year Ended October 31, | |
Class Z | | 2014 | | 2013 | | 2012 | | 2011 | | 2010 | |
Per share data | |
Net asset value, beginning of period | | $ | 10.85 | | | $ | 11.34 | | | $ | 10.97 | | | $ | 11.00 | | | $ | 10.69 | | |
Income from investment operations: | |
Net investment income | | | 0.33 | | | | 0.32 | | | | 0.34 | | | | 0.36 | | | | 0.36 | | |
Net realized and unrealized gain (loss) | | | 0.21 | | | | (0.44 | ) | | | 0.38 | | | | (0.03 | ) | | | 0.31 | | |
Total from investment operations | | | 0.54 | | | | (0.12 | ) | | | 0.72 | | | | 0.33 | | | | 0.67 | | |
Less distributions to shareholders: | |
Net investment income | | | (0.33 | ) | | | (0.32 | ) | | | (0.34 | ) | | | (0.36 | ) | | | (0.36 | ) | |
Net realized gains | | | — | | | | (0.05 | ) | | | (0.01 | ) | | | — | | | | — | | |
Total distributions to shareholders | | | (0.33 | ) | | | (0.37 | ) | | | (0.35 | ) | | | (0.36 | ) | | | (0.36 | ) | |
Net asset value, end of period | | $ | 11.06 | | | $ | 10.85 | | | $ | 11.34 | | | $ | 10.97 | | | $ | 11.00 | | |
Total return | | | 5.09 | % | | | (1.10 | %) | | | 6.63 | % | | | 3.08 | % | | | 6.37 | % | |
Ratios to average net assets(a) | |
Total gross expenses | | | 0.74 | % | | | 0.72 | % | | | 0.74 | % | | | 0.79 | % | | | 0.69 | % | |
Total net expenses(b) | | | 0.56 | %(c) | | | 0.55 | %(c) | | | 0.54 | %(c) | | | 0.54 | %(c) | | | 0.55 | %(c) | |
Net investment income | | | 3.06 | % | | | 2.91 | % | | | 3.04 | % | | | 3.33 | % | | | 3.33 | % | |
Supplemental data | |
Net assets, end of period (in thousands) | | $ | 137,832 | | | $ | 152,543 | | | $ | 182,533 | | | $ | 182,400 | | | $ | 209,384 | | |
Portfolio turnover | | | 12 | % | | | 9 | % | | | 19 | % | | | 6 | % | | | 10 | % | |
Notes to Financial Highlights
(a) In addition to the fees and expenses that the Fund bears directly, the Fund indirectly bears a pro rata share of the fees and expenses of any other funds in which it invests. Such indirect expenses are not included in the Fund's reported expense ratios.
(b) Total net expenses include the impact of certain fee waivers/expense reimbursements made by the Investment Manager and certain of its affiliates, if applicable.
(c) The benefits derived from expense reductions had an impact of less than 0.01%.
The accompanying Notes to Financial Statements are an integral part of this statement.
Annual Report 2014
23
Columbia AMT-Free Connecticut Intermediate Muni Bond Fund
Notes to Financial Statements
October 31, 2014
Note 1. Organization
Columbia AMT-Free Connecticut Intermediate Muni Bond Fund (formerly known as Columbia Connecticut Intermediate Municipal Bond Fund) (the Fund), a series of Columbia Funds Series Trust I (the Trust), is a non-diversified fund. The Trust is registered under the Investment Company Act of 1940, as amended (the 1940 Act), as an open-end management investment company organized as a Massachusetts business trust. Effective July 7, 2014, Columbia Connecticut Intermediate Municipal Bond Fund was renamed Columbia AMT-Free Connecticut Intermediate Muni Bond Fund.
Fund Shares
The Trust may issue an unlimited number of shares (without par value). The Fund offers Class A, Class B, Class C, Class R4, Class T and Class Z shares. Although all share classes generally have identical voting, dividend and liquidation rights, each share class votes separately when required by the Trust's organizational documents or by law. Different share classes pay different distribution amounts to the extent the expenses of such share classes differ, and distributions in liquidation will be proportional to the net asset value of each share class. Each share class has its own expense structure and sales charges.
Class A shares are subject to a maximum front-end sales charge of 3.25% based on the initial investment amount. Class A shares purchased without an initial sales charge in accounts aggregating $1 million to $50 million at the time of purchase are subject to a contingent deferred sales charge (CDSC) if the shares are sold within 18 months of purchase, charged as follows: 1.00% CDSC if redeemed within 12 months of purchase, and 0.50% CDSC if redeemed more than 12, but less than 18, months after purchase.
Class B shares may be subject to a maximum CDSC of 3.00% based upon the holding period after purchase. Class B shares will generally convert to Class A shares eight years after purchase. The Fund no longer accepts investments by new or existing investors in the Fund's Class B shares, except in connection with the reinvestment of any dividend and/or capital gain distributions in Class B shares of the Fund and exchanges by existing Class B shareholders of certain other funds within the Columbia Family of Funds.
Class C shares are subject to a 1.00% CDSC on shares redeemed within one year of purchase.
Class R4 shares are not subject to sales charges and are generally available only to omnibus retirement plans and certain investors as described in the Fund's prospectus.
Class T shares are subject to a maximum front-end sales charge of 4.75% based on the investment amount. Class T shares purchased without an initial sales charge in accounts
aggregating $1 million to $50 million at the time of purchase are subject to a CDSC if the shares are sold within 18 months of purchase, charged as follows: 1.00% CDSC if redeemed within 12 months of purchase, and 0.50% CDSC if redeemed more than 12, but less than 18, months after purchase. Class T shares are available only to investors who received (and who have continuously held) Class T shares in connection with previous fund reorganizations.
Class Z shares are not subject to sales charges and are available only to eligible investors, which are subject to different investment minimums as described in the Fund's prospectus.
Note 2. Summary of Significant Accounting Policies
Basis of Preparation
The Fund is an investment company that applies the accounting and reporting guidance in the Financial Accounting Standards Board (FASB) Accounting Standards Codification Topic 946, Financial Services — Investment Companies (ASC 946). The financial statements are prepared in accordance with U.S. generally accepted accounting principles (GAAP) which requires management to make certain estimates and assumptions that affect the reported amounts of assets and liabilities, the disclosure of contingent assets and liabilities at the date of the financial statements and the reported amounts of income and expenses during the reporting period. Actual results could differ from those estimates.
The following is a summary of significant accounting policies followed by the Fund in the preparation of its financial statements.
Security Valuation
Debt securities generally are valued by pricing services approved by the Board of Trustees (the Board) based upon market transactions for normal, institutional-size trading units of similar securities. The services may use various pricing techniques that take into account, as applicable, factors such as yield, quality, coupon rate, maturity, type of issue, trading characteristics and other data, as well as broker quotes. Debt securities for which quotations are readily available may also be valued based upon an over-the-counter or exchange bid quotation.
Investments in open-end investment companies, including money market funds, are valued at their net asset value.
Investments for which market quotations are not readily available, or that have quotations which management believes are not reliable, are valued at fair value as determined in good faith under procedures established by and under the general
Annual Report 2014
24
Columbia AMT-Free Connecticut Intermediate Muni Bond Fund
Notes to Financial Statements (continued)
October 31, 2014
supervision of the Board. If a security or class of securities (such as foreign securities) is valued at fair value, such value is likely to be different from the quoted or published price for the security.
The determination of fair value often requires significant judgment. To determine fair value, management may use assumptions including but not limited to future cash flows and estimated risk premiums. Multiple inputs from various sources may be used to determine fair value.
Delayed Delivery Securities
The Fund may trade securities on other than normal settlement terms, including securities purchased or sold on a "when-issued" basis. This may increase risk to the Fund since the other party to the transaction may fail to deliver which could cause the Fund to subsequently invest at less advantageous prices. The Fund designates cash or liquid securities in an amount equal to the delayed delivery commitment.
Security Transactions
Security transactions are accounted for on the trade date. Cost is determined and gains (losses) are based upon the specific identification method for both financial statement and federal income tax purposes.
Income Recognition
Interest income is recorded on an accrual basis. Market premiums and discounts, including original issue discounts, are amortized and accreted, respectively, over the expected life of the security on all debt securities, unless otherwise noted.
The Fund may place a debt security on non-accrual status and reduce related interest income when it becomes probable that the interest will not be collected and the amount of uncollectible interest can be reasonably estimated. A defaulted debt security is removed from non-accrual status when the issuer resumes interest payments or when collectability of interest is reasonably assured.
Dividend income is recorded on the ex-dividend date.
Expenses
General expenses of the Trust are allocated to the Fund and other funds of the Trust based upon relative net assets or other expense allocation methodologies determined by the nature of the expense. Expenses directly attributable to the Fund are charged to the Fund. Expenses directly attributable to a specific class of shares are charged to that share class.
Determination of Class Net Asset Value
All income, expenses (other than class-specific expenses, which are charged to that share class, as shown in the Statement of Operations) and realized and unrealized gains
(losses) are allocated to each class of the Fund on a daily basis, based on the relative net assets of each class, for purposes of determining the net asset value of each class.
Federal Income Tax Status
The Fund intends to qualify each year as a regulated investment company under Subchapter M of the Internal Revenue Code, as amended, and will distribute substantially all of its tax exempt and taxable income (including net short-term capital gains), if any, for its tax year, and as such will not be subject to federal income taxes. In addition, the Fund intends to distribute in each calendar year substantially all of its net investment income, capital gains and certain other amounts, if any, such that the Fund should not be subject to federal excise tax. Therefore, no federal income or excise tax provision is recorded.
Distributions to Shareholders
Distributions from net investment income, if any, are declared daily and paid monthly. Net realized capital gains, if any, are distributed at least annually. Income distributions and capital gain distributions are determined in accordance with federal income tax regulations, which may differ from GAAP.
Guarantees and Indemnifications
Under the Trust's organizational documents and, in some cases, by contract, its officers and trustees are indemnified against certain liabilities arising out of the performance of their duties to the Trust or its funds. In addition, certain of the Fund's contracts with its service providers contain general indemnification clauses. The Fund's maximum exposure under these arrangements is unknown since the amount of any future claims that may be made against the Fund cannot be determined, and the Fund has no historical basis for predicting the likelihood of any such claims.
Note 3. Fees and Compensation Paid to Affiliates
Investment Management Fees
Under an Investment Management Services Agreement, Columbia Management Investment Advisers, LLC (the Investment Manager), a wholly-owned subsidiary of Ameriprise Financial, Inc. (Ameriprise Financial), determines which securities will be purchased, held or sold. The investment management fee is an annual fee that is equal to a percentage of the Fund's average daily net assets that declines from 0.40% to 0.27% as the Fund's net assets increase. The effective investment management fee rate for the year ended October 31, 2014 was 0.40% of the Fund's average daily net assets.
Annual Report 2014
25
Columbia AMT-Free Connecticut Intermediate Muni Bond Fund
Notes to Financial Statements (continued)
October 31, 2014
Administration Fees
Under an Administrative Services Agreement, the Investment Manager also serves as the Fund Administrator. The Fund pays the Fund Administrator an annual fee for administration and accounting services equal to a percentage of the Fund's average daily net assets that declines from 0.07% to 0.04% as the Fund's net assets increase. The effective administration fee rate for the year ended October 31, 2014 was 0.07% of the Fund's average daily net assets.
Compensation of Board Members
Board members are compensated for their services to the Fund as disclosed in the Statement of Operations. The Trust's eligible Trustees may participate in a Deferred Compensation Plan (the Plan) which may be terminated at any time. Obligations of the Plan will be paid solely out of the Fund's assets.
Compensation of Chief Compliance Officer
The Board has appointed a Chief Compliance Officer to the Fund in accordance with federal securities regulations. The Fund pays its pro-rata share of the expenses associated with the Chief Compliance Officer. The Fund's expenses for the Chief Compliance Officer will not exceed $15,000 per year.
Transfer Agent Fees
Under a Transfer and Dividend Disbursing Agent Agreement, Columbia Management Investment Services Corp. (the Transfer Agent), an affiliate of the Investment Manager and a wholly-owned subsidiary of Ameriprise Financial, is responsible for providing transfer agency services to the Fund. The Transfer Agent has contracted with Boston Financial Data Services (BFDS) to serve as sub-transfer agent.
Effective November 1, 2014, the Transfer Agent receives a monthly transfer agency fee based on the number or the average value of accounts, depending on the type of account. Prior to November 1, 2014, the Transfer Agent received a monthly account-based service fee based on the number of open accounts. In addition, the Transfer Agent also receives sub-transfer agency fees based on a percentage of the average aggregate value of the Fund's shares maintained in omnibus accounts (other than omnibus accounts for which American Enterprise Investment Services Inc. is the broker of record or accounts where the beneficial shareholder is a customer of Ameriprise Financial Services, Inc., which receive a per account fee). The Transfer Agent pays the fees of BFDS for services as sub-transfer agent and is not entitled to reimbursement for such fees from the Fund (with the exception of out-of-pocket fees).
The Transfer Agent also receives compensation from the Fund for various shareholder services and reimbursements for certain out-of-pocket fees.
For the year ended October 31, 2014, the Fund's effective transfer agent fee rates as a percentage of average daily net assets of each class were as follows:
Class A | | | 0.19 | % | |
Class B | | | 0.19 | | |
Class C | | | 0.19 | | |
Class R4 | | | 0.19 | | |
Class T | | | 0.19 | | |
Class Z | | | 0.19 | | |
An annual minimum account balance fee of $20 may apply to certain accounts with a value below the applicable share class's initial minimum investment requirements to reduce the impact of small accounts on transfer agent fees. These minimum account balance fees are remitted to the Fund and recorded as part of expense reductions in the Statement of Operations. For the year ended October 31, 2014, these minimum account balance fees reduced total expenses of the Fund by $100.
Distribution and Service Fees
The Fund has an agreement with Columbia Management Investment Distributors, Inc. (the Distributor), an affiliate of the Investment Manager and a wholly-owned subsidiary of Ameriprise Financial, for distribution and shareholder services. The Board has approved, and the Fund has adopted, distribution and shareholder service plans (the Plans) applicable to certain share classes, which set the distribution and service fees for the Fund. These fees are calculated daily and are intended to compensate the Distributor and/or eligible selling and/or servicing agents for selling shares of the Fund and providing services to investors.
Under the Plans, the Fund pays a monthly service fee to the Distributor at the maximum annual rate of 0.25% of the average daily net assets attributable to Class A, Class B and Class C shares of the Fund. Also under the Plans, the Fund pays a monthly distribution fee to the Distributor at the maximum annual rate of 0.75% of the average daily net assets attributable to Class B and Class C shares only.
Effective March 1, 2014, the Distributor has voluntarily agreed to waive a portion of the distribution fee for Class C shares so that the distribution fee does not exceed 0.45% annually of the average daily net assets attributable to Class C shares. This arrangement may be modified or terminated by the Distributor at any time. Prior to March 1, 2014, the Distributor voluntarily waived a portion of the distribution
Annual Report 2014
26
Columbia AMT-Free Connecticut Intermediate Muni Bond Fund
Notes to Financial Statements (continued)
October 31, 2014
fee for Class C shares so that the distribution fee did not exceed 0.40% annually of the average daily net assets attributable to Class C shares.
Shareholder Services Fees
The Fund has adopted a shareholder services plan that permits it to pay for certain services provided to Class T shareholders by their selling and/or servicing agents. The Fund may pay shareholder servicing fees up to an aggregate annual rate of 0.40% of the Fund's average daily net assets attributable to Class T shares (comprised of up to 0.20% for shareholder liaison services and up to 0.20% for administrative support services). These fees are currently limited to an aggregate annual rate of not more than 0.15% of the Fund's average daily net assets attributable to Class T shares. In addition, the servicing fee for Class T shares will be waived by selling and/or servicing agents to the extent necessary to prevent the net investment income for the Class T shares from falling below 0.00% on a daily basis. The effective shareholder services fee rate for the year ended October 31, 2014 was 0.15% of the Fund's average daily net assets attributable to Class T shares.
Sales Charges
Sales charges, including front-end charges and CDSCs, received by the Distributor for distributing Fund shares were $8,535 for Class A, $150 for Class C, and $48 for Class T shares for the year ended October 31, 2014.
Expenses Waived/Reimbursed by the Investment Manager and its Affiliates
The Investment Manager and certain of its affiliates have contractually agreed to waive fees and/or reimburse expenses (excluding certain fees and expenses described below) for the period disclosed below, unless sooner terminated at the sole discretion of the Board, so that the Fund's net operating expenses, after giving effect to fees waived/expenses reimbursed and any balance credits and/or overdraft charges from the Fund's custodian, do not exceed the following annual rates as a percentage of the class' average daily net assets:
| | | Fee Rates Contractual
through
February 28, 2015 | |
Class A | | | 0.81 | % | |
Class B | | | 1.56 | | |
Class C | | | 1.56 | | |
Class R4 | | | 0.56 | | |
Class T | | | 0.71 | | |
Class Z | | | 0.56 | | |
Under the agreement governing these fee waivers and/or expense reimbursement arrangements, the following fees and
expenses are excluded from the waiver/reimbursement commitment, and therefore will be paid by the Fund, if applicable: taxes (including foreign transaction taxes), expenses associated with investments in affiliated and non-affiliated pooled investment vehicles (including mutual funds and exchange-traded funds), transaction costs and brokerage commissions, costs related to any securities lending program, dividend expenses associated with securities sold short, inverse floater program fees and expenses, transaction charges and interest on borrowed money, interest, extraordinary expenses and any other expenses the exclusion of which is specifically approved by the Board. This agreement may be modified or amended only with approval from all parties. Class C distribution fees waived by the Distributor, as discussed above, are in addition to the waiver/reimbursement commitment under the agreement.
Note 4. Federal Tax Information
The timing and character of income and capital gain distributions are determined in accordance with income tax regulations, which may differ from GAAP because of temporary or permanent book to tax differences.
At October 31, 2014, these differences are primarily due to differing treatment for utilization of prior year capital loss carryforward, Trustees' deferred compensation, and distributions. To the extent these differences are permanent, reclassifications are made among the components of the Fund's net assets in the Statement of Assets and Liabilities. Temporary differences do not require reclassifications. In the Statement of Assets and Liabilities the following reclassifications were made:
Undistributed net investment income | | $ | (6,945 | ) | |
Accumulated net realized gain | | | 6,945 | | |
Net investment income (loss) and net realized gains (losses), as disclosed in the Statement of Operations, and net assets were not affected by this reclassification.
The tax character of distributions paid during the years indicated was as follows:
Year Ended October 31, | | 2014 | | 2013 | |
Ordinary income | | $ | — | | | $ | 26,528 | | |
Tax-exempt income | | | 5,175,307 | | | | 5,768,088 | | |
Long-term capital gains | | | — | | | | 849,148 | | |
Total | | $ | 5,175,307 | | | $ | 6,643,764 | | |
Short-term capital gain distributions, if any, are considered ordinary income distributions for tax purposes.
Annual Report 2014
27
Columbia AMT-Free Connecticut Intermediate Muni Bond Fund
Notes to Financial Statements (continued)
October 31, 2014
At October 31, 2014, the components of distributable earnings on a tax basis were as follows:
Undistributed tax-exempt income | | $ | 586,691 | | |
Undistributed long-term capital gains | | | 299,972 | | |
Capital loss carryforwards | | | (520,214 | ) | |
Net unrealized appreciation | | | 11,988,838 | | |
At October 31, 2014, the cost of investments for federal income tax purposes was $152,574,505 and the aggregate gross unrealized appreciation and depreciation based on that cost was:
Unrealized appreciation | | $ | 12,008,743 | | |
Unrealized depreciation | | | (19,905 | ) | |
Net unrealized appreciation | | $ | 11,988,838 | | |
For the year ended October 31, 2014, $520,214 of capital loss carryforward was utilized.
Management of the Fund has concluded that there are no significant uncertain tax positions in the Fund that would require recognition in the financial statements. However, management's conclusion may be subject to review and adjustment at a later date based on factors including, but not limited to, new tax laws, regulations, and administrative interpretations (including relevant court decisions). Generally, the Fund's federal tax returns for the prior three fiscal years remain subject to examination by the Internal Revenue Service.
Note 5. Portfolio Information
The cost of purchases and proceeds from sales of securities, excluding short-term obligations and certain derivatives, if any, aggregated to $19,528,883 and $35,352,914, respectively, for the year ended October 31, 2014. The amount of purchase and sale activity impacts the portfolio turnover rate reported in the Financial Highlights.
Note 6. Shareholder Concentration
At October 31, 2014, one unaffiliated shareholder of record owned 81.8% of the outstanding shares of the Fund in one or more accounts. The Fund has no knowledge about whether any portion of those shares was owned beneficially. Subscription and redemption activity by concentrated accounts may have a significant effect on the operations of the Fund.
Note 7. Line of Credit
The Fund has entered into a revolving credit facility with a syndicate of banks led by JPMorgan Chase Bank N.A. (JPMorgan) whereby the Fund may borrow for the temporary funding of shareholder redemptions or for other temporary or emergency purposes. The credit facility agreement, as amended, which is a collective agreement between the Fund and certain other funds managed by the Investment Manager, severally and not jointly, permits collective borrowings up to
$500 million. Interest is charged to each participating fund based on its borrowings at a rate equal to the higher of (i) the overnight federal funds rate plus 1.00% or (ii) the one-month LIBOR rate plus 1.00%. Each borrowing under the credit facility matures no later than 60 days after the date of borrowing. Effective December 10, 2013, the Fund also pays a commitment fee equal to its pro rata share of the amount of the credit facility at a rate of 0.075% per annum. Prior to December 10, 2013, the commitment fee was charged at the annual rate of 0.08% per annum. The commitment fee is included in other expenses in the Statement of Operations.
Effective December 9, 2014, the Fund extended its revolving credit facility with JPMorgan. The credit facility agreement, as amended, permits collective borrowings up to $550 million under the same terms and interest rates as described above.
The Fund had no borrowings during the year ended October 31, 2014.
Note 8. Significant Risks
Credit Risk
Credit risk is the risk that the value of debt securities in the Fund's portfolio may decline because the issuer may default and fail to pay interest or repay principal when due. Rating agencies assign credit ratings to debt securities to indicate their credit risk. Lower rated or unrated debt securities held by the Fund may present increased credit risk as compared to higher-rated debt securities.
Interest Rate Risk
Interest rate risk is the risk of losses attributable to changes in interest rates. In general, if prevailing interest rates rise, the values of debt securities tend to fall, and if interest rates fall, the values of debt securities tend to rise. Actions by governments and central banking authorities can result in increases in interest rates. Increasing interest rates may negatively affect the value of debt securities held by the Fund, resulting in a negative impact on the Fund's performance and net asset value per share. In general, the longer the maturity or duration of a debt security, the greater its sensitivity to changes in interest rates.
Liquidity Risk
Liquidity risk is the risk associated with a lack of marketability of investments which may make it difficult to sell the investment at a desirable time or price. Changing regulatory, market or other conditions or environments (for example, the interest rate or credit environments) may adversely affect the liquidity of the Fund's investments. The Fund may have to accept a lower selling price for the holding, sell other investments, or forego another, more appealing investment opportunity. Generally, the less liquid the market at
Annual Report 2014
28
Columbia AMT-Free Connecticut Intermediate Muni Bond Fund
Notes to Financial Statements (continued)
October 31, 2014
the time the Fund sells a portfolio investment, the greater the risk of loss or decline of value to the Fund. A less liquid market can lead to an increase in Fund redemptions, which may negatively impact Fund performance and net asset value per share, including, for example, if the Fund is forced to sell securities in a down market.
Geographic Concentration Risk
Because state-specific tax-exempt funds invest primarily in the municipal securities issued by the state and political sub-divisions of the state, the Fund will be particularly affected by political and economic conditions and developments in the state in which it invests. The Fund may, therefore, have a greater risk than that of a municipal bond fund which is more geographically diversified. The value of the municipal securities owned by the Fund also may be adversely affected by future changes in federal or state income tax laws.
Non-Diversification Risk
A non-diversified fund is permitted to invest a greater percentage of its total assets in fewer issuers than a diversified fund. The Fund may, therefore, have a greater risk of loss from a few issuers than a similar fund that invests more broadly.
Note 9. Subsequent Events
Management has evaluated the events and transactions that have occurred through the date the financial statements were issued. Other than as noted in Notes 3 and 7 above, there were no items requiring adjustment of the financial statements or additional disclosure.
Note 10. Information Regarding Pending and Settled Legal Proceedings
In December 2005, without admitting or denying the allegations, American Express Financial Corporation (AEFC, which is now known as Ameriprise Financial, Inc. (Ameriprise Financial)) entered into settlement agreements with the Securities and Exchange Commission (SEC) and Minnesota Department of Commerce (MDOC) related to market timing activities. As a result, AEFC was censured and ordered to cease and desist from committing or causing any violations of certain provisions of the Investment Advisers Act of 1940, the Investment Company Act of 1940, and various Minnesota laws. AEFC agreed to pay disgorgement of $10 million and civil money penalties of $7 million. AEFC also agreed to retain an independent distribution consultant to assist in developing a plan for distribution of all disgorgement and civil penalties ordered by the SEC in accordance with various undertakings detailed at www.sec.gov/litigation/admin/ia-2451.pdf. Ameriprise Financial and its affiliates have cooperated with the
SEC and the MDOC in these legal proceedings, and have made regular reports to the Funds' Boards of Trustees.
Ameriprise Financial and certain of its affiliates have historically been involved in a number of legal, arbitration and regulatory proceedings, including routine litigation, class actions, and governmental actions, concerning matters arising in connection with the conduct of their business activities. Ameriprise Financial believes that the Funds are not currently the subject of, and that neither Ameriprise Financial nor any of its affiliates are the subject of, any pending legal, arbitration or regulatory proceedings that are likely to have a material adverse effect on the Funds or the ability of Ameriprise Financial or its affiliates to perform under their contracts with the Funds. Ameriprise Financial is required to make quarterly (10-Q), annual (10-K) and, as necessary, 8-K filings with the Securities and Exchange Commission on legal and regulatory matters that relate to Ameriprise Financial and its affiliates. Copies of these filings may be obtained by accessing the SEC website at www.sec.gov.
There can be no assurance that these matters, or the adverse publicity associated with them, will not result in increased fund redemptions, reduced sale of fund shares or other adverse consequences to the Funds. Further, although we believe proceedings are not likely to have a material adverse effect on the Funds or the ability of Ameriprise Financial or its affiliates to perform under their contracts with the Funds, these proceedings are subject to uncertainties and, as such, we are unable to estimate the possible loss or range of loss that may result. An adverse outcome in one or more of these proceedings could result in adverse judgments, settlements, fines, penalties or other relief that could have a material adverse effect on the consolidated financial condition or results of operations of Ameriprise Financial.
Annual Report 2014
29
Columbia AMT-Free Connecticut Intermediate Muni Bond Fund
Report of Independent Registered Public Accounting Firm
To the Trustees of Columbia Funds Series Trust I and the Shareholders of
Columbia AMT-Free Connecticut Intermediate Muni Bond Fund
(formerly Columbia Connecticut Intermediate Municipal Bond Fund)
In our opinion, the accompanying statement of assets and liabilities, including the portfolio of investments, and the related statements of operations and of changes in net assets and the financial highlights present fairly, in all material respects, the financial position of Columbia AMT-Free Connecticut Intermediate Muni Bond Fund (formerly Columbia Connecticut Intermediate Municipal Bond Fund) (the "Fund", a series of Columbia Funds Series Trust I) at October 31, 2014, and the results of its operations, the changes in its net assets and the financial highlights for each of the periods indicated, in conformity with accounting principles generally accepted in the United States of America. These financial statements and financial highlights (hereafter referred to as "financial statements") are the responsibility of the Fund's management. Our responsibility is to express an opinion on these financial statements based on our audits. We conducted our audits of these financial statements in accordance with the standards of the Public Company Accounting Oversight Board (United States). Those standards require that we plan and perform the audit to obtain reasonable assurance about whether the financial statements are free of material misstatement. An audit includes examining, on a test basis, evidence supporting the amounts and disclosures in the financial statements, assessing the accounting principles used and significant estimates made by management, and evaluating the overall financial statement presentation. We believe that our audits, which included confirmation of securities at October 31, 2014 by correspondence with the custodian and brokers, provide a reasonable basis for our opinion.
PricewaterhouseCoopers LLP
Minneapolis, Minnesota
December 22, 2014
Annual Report 2014
30
Columbia AMT-Free Connecticut Intermediate Muni Bond Fund
Federal Income Tax Information
(Unaudited)
The Fund hereby designates the following tax attributes for the fiscal year ended October 31, 2014. Shareholders will be notified in early 2015 of the amounts for use in preparing 2014 income tax returns.
Tax Designations:
Capital Gain Dividend | | $ | 314,971 | | |
| Exempt-Interest Dividends | | | 100.00 | % | |
Capital Gain Dividend. The Fund designates as a capital gain dividend the amount reflected above, or if subsequently determined to be different, the net capital gain of such fiscal period.
Exempt-Interest Dividends. The percentage of net investment income distributed during the fiscal year that qualifies as exempt-interest dividends for federal income tax purposes.
Annual Report 2014
31
Columbia AMT-Free Connecticut Intermediate Muni Bond Fund
The Trustees serve terms of indefinite duration. The names, addresses and birth years of the Trustees and Officers of the Funds in Columbia Funds Series Trust I, the year each was first elected or appointed to office, their principal business occupations during at least the last five years, the number of Funds overseen by each Trustee and other directorships they hold are shown below. Each officer listed below serves as an officer of each Fund in Columbia Funds Series Trust I.
Independent Trustees
Name, Address and Year of Birth,
Position with Funds, Year First
Elected or Appointed to Office | | Principal Occupation(s) During Past Five Years, Number of Funds in Columbia
Funds Complex Overseen by Trustee, Other Directorships Held | |
Douglas A. Hacker (Born 1955)
c/o Columbia Management
Investment Advisers, LLC
225 Franklin Street
Boston, MA 02110
Trustee (since 1996) and Chairman of the Board (since 2014) | | Independent business executive since May 2006; Executive Vice President — Strategy of United Airlines from December 2002 to May 2006; President of UAL Loyalty Services (airline marketing company) from September 2001 to December 2002; Executive Vice President and Chief Financial Officer of United Airlines from July 1999 to September 2001. Oversees 56; Spartan Stores, Inc. (food distributor); Nash Finch Company (food distributor) from 2005 to 2013; Aircastle Limited (aircraft leasing); and SeaCube Container Leasing Ltd. (container leasing) from 2010 to 2013 | |
Janet Langford Kelly (Born 1957)
c/o Columbia Management
Investment Advisers, LLC
225 Franklin Street
Boston, MA 02110
Trustee (since 1996) | | Senior Vice President, General Counsel and Corporate Secretary, ConocoPhillips (integrated energy company) since September 2007; Deputy General Counsel — Corporate Legal Services, ConocoPhillips from August 2006 to August 2007; Partner, Zelle, Hofmann, Voelbel, Mason & Gette LLP (law firm) from March 2005 to July 2006; Adjunct Professor of Law, Northwestern University from September 2004 to June 2006; Director, UAL Corporation (airline) from February 2006 to July 2006; Chief Administrative Officer and Senior Vice President, Kmart Holding Corporation (consumer goods) from September 2003 to March 2004. Oversees 56; None | |
Nancy T. Lukitsh (Born 1956)
c/o Columbia Management
Investment Advisers, LLC
225 Franklin Street
Boston, MA 02110
Trustee (since 2011) | | Senior Vice President, Partner and Director of Marketing, Wellington Management Company, LLP (investment adviser) from 1997 to 2010; Chair, Wellington Management Investment Portfolios (commingled non-U.S. investment pools) from 2007 to 2010; Director, Wellington Trust Company, NA and other Wellington affiliates from 1997 to 2010. Oversees 56; None | |
William E. Mayer (Born 1940)
c/o Columbia Management
Investment Advisers, LLC
225 Franklin Street
Boston, MA 02110
Trustee (since 1994) | | Partner, Park Avenue Equity Partners (private equity) since February 1999; Dean and Professor, College of Business and Management, University of Maryland from 1992 to 1996. Oversees 56; DynaVox Inc. (speech creation); Lee Enterprises (print media); WR Hambrecht + Co. (financial service provider) from 2000 to 2012; BlackRock Kelso Capital Corporation (investment company); Premier, Inc. (healthcare) | |
David M. Moffett (Born 1952)
c/o Columbia Management
Investment Advisers, LLC
225 Franklin Street
Boston, MA 02110
Trustee (since 2011) | | Retired. Chief Executive Officer, Federal Home Loan Mortgage Corporation, from 2008 to 2009; Senior Adviser, Global Financial Services Group, Carlyle Group, Inc., from 2007 to 2008; Vice Chairman and Chief Financial Officer, U.S. Bancorp, from 1993 to 2007. Oversees 56; CIT Group Inc. (commercial and consumer finance); eBay Inc. (online trading community); MBIA Inc. (financial service provider); E.W. Scripps Co. (print and television media), Building Materials Holding Corp. (building materials and construction services); Genworth Financial, Inc. (financial and insurance products and services); and University of Oklahoma Foundation | |
Charles R. Nelson (Born 1942)
c/o Columbia Management
Investment Advisers, LLC
225 Franklin Street
Boston, MA 02110
Trustee (since 1981) | | Retired. Professor Emeritus, University of Washington, since 2011; Professor of Economics, University of Washington from 1976 to 2011; Ford and Louisa Van Voorhis Professor of Political Economy, University of Washington from 1993 to 2011; Adjunct Professor of Statistics, University of Washington from 1980 to 2011; Associate Editor, Journal of Money, Credit and Banking from September 1993 to 2008; consultant on econometric and statistical matters. Oversees 56; None | |
John J. Neuhauser (Born 1943)
c/o Columbia Management
Investment Advisers, LLC
225 Franklin Street
Boston, MA 02110
Trustee (since 1984) | | President, Saint Michael's College, since August 2007; Director or Trustee of several non-profit organizations, including Fletcher Allen Health Care, Inc.; Academic Vice President and Dean of Faculties, Boston College from August 1999 to October 2005; University Professor, Boston College from November 2005 to August 2007. Oversees 56; Liberty All-Star Equity Fund and Liberty All-Star Growth Fund (closed-end funds) | |
Patrick J. Simpson (Born 1944)
c/o Columbia Management
Investment Advisers, LLC
225 Franklin Street
Boston, MA 02110
Trustee (since 2000) | | Partner, Perkins Coie LLP (law firm). Oversees 56; None | |
Annual Report 2014
32
Columbia AMT-Free Connecticut Intermediate Muni Bond Fund
Trustees and Officers (continued)
Independent Trustees (continued)
Name, Address and Year of Birth,
Position with Funds, Year First
Elected or Appointed to Office | | Principal Occupation(s) During Past Five Years, Number of Funds in Columbia
Funds Complex Overseen by Trustee, Other Directorships Held | |
Anne-Lee Verville (Born 1945)
c/o Columbia Management
Investment Advisers, LLC
225 Franklin Street
Boston, MA 02110
Trustee (since 1998) | | Retired. General Manager — Global Education Industry from 1994 to 1997, President — Application Systems Division from 1991 to 1994, Chief Financial Officer — US Marketing & Services from 1988 to 1991, and Chief Information Officer from 1987 to 1988, IBM Corporation (computer and technology). Oversees 56; Enesco Group, Inc. (producer of giftware and home and garden decor products) from 2001 to 2006 | |
Interested Trustee
Name, Address and Year of Birth,
Position with Funds, Year First
Elected or Appointed to Office | | Principal Occupation(s) During Past Five Years, Number of Funds in Columbia
Funds Complex Overseen by Trustee, Other Directorships Held | |
William F. Truscott (Born 1960)
53600 Ameriprise Financial Center
Minneapolis, MN 55474
Trustee (since 2012) | | Chairman of the Board and President, Columbia Management Investment Advisers, LLC since May 2010 and February 2012, respectively (previously President and Chief Investment Officer from 2001 to April 2010); Chief Executive Officer, Global Asset Management, Ameriprise Financial, Inc. since September 2012 (previously, Chief Executive Officer, U.S. Asset Management & President, Annuities, from May 2010 to September 2012 and President — U.S. Asset Management and Chief Investment Officer from 2005 to April 2010); Director and Chief Executive Officer, Columbia Management Investment Distributors, Inc. since May 2010 and February 2012, respectively (previously Chairman of the Board and Chief Executive Officer from 2006 to April 2010); Chairman of the Board and Chief Executive Officer, RiverSource Distributors, Inc. since 2006; President and Chief Executive Officer, Ameriprise Certificate Company, 2006 to August 2012; Director, Threadneedle Asset Management Holdings, SARL since 2014. Oversees 188; Chairman of the Board, Columbia Management Investment Advisers, LLC since May 2010; Director, Columbia Management Investment Distributors, Inc. since May 2010; Director, Ameriprise Certificate Company from 2006 to January 2013 | |
The Statement of Additional Information has additional information about the Fund's Board members and is available, without charge, upon request by calling 800.345.6611; contacting your financial intermediary; or visiting columbiamanagement.com.
The Board has appointed officers who are responsible for day-to-day business decisions based on policies it has established. The officers serve at the pleasure of the Board. In addition to Mr. Truscott, who is Senior Vice President, the Funds' other officers are:
Officers
Name,
Address and
Year of Birth | | Position and Year
First Appointed to
Position for any Fund
in the Columbia
Funds Complex or a
Predecessor Thereof | | Principal Occupation(s) During Past Five Years | |
J. Kevin Connaughton
225 Franklin Street
Boston, MA 02110
Born 1964 | | President and Principal Executive Officer (2009) | | Managing Director and General Manager — Mutual Fund Products, Columbia Management Investment Advisers, LLC, since May 2010; and President, Columbia Funds since 2009; Managing Director, Columbia Management Advisors, LLC, from December 2004 to April 2010; Senior Vice President and Chief Financial Officer, Columbia Funds, from June 2008 to January 2009; and senior officer of Columbia Funds and affiliated funds since 2003. | |
Michael G. Clarke
225 Franklin Street
Boston, MA 02110
Born 1969 | | Treasurer (2011) and Chief Financial Officer (2009) | | Vice President — Mutual Fund Administration, Columbia Management Investment Advisers, LLC since May 2010; Managing Director of Fund Administration, Columbia Management Advisors, LLC from September 2004 to April 2010; and senior officer of Columbia Funds and affiliated funds since 2002. | |
Annual Report 2014
33
Columbia AMT-Free Connecticut Intermediate Muni Bond Fund
Trustees and Officers (continued)
Officers (continued)
Name,
Address and
Year of Birth | | Position and Year
First Appointed to
Position for any Fund
in the Columbia
Funds Complex or a
Predecessor Thereof | | Principal Occupation(s) During Past Five Years | |
Scott R. Plummer
5228 Ameriprise
Financial Center
Minneapolis, MN 55474
Born 1959 | | Senior Vice President (2006), Chief Legal Officer (2006) and Assistant Secretary (2011) | | Senior Vice President and Assistant General Counsel — Global Asset Management, Ameriprise Financial since February 2014 (previously, Senior Vice President and Lead Chief Counsel — Asset Management, 2012 – February 2014; Vice President and Lead Chief Counsel — Asset Management, 2010 – 2012; and Vice President and Chief Counsel — Asset Management, 2005 – 2010); Senior Vice President, Chief Legal Officer and Assistant Secretary, Columbia Management Investment Advisers, LLC since June 2005; Vice President, Chief Counsel and Assistant Secretary, Columbia Management Investment Distributors, Inc. since 2008; Vice President, General Counsel and Secretary, Ameriprise Certificate Company since 2005; Chief Counsel, RiverSource Distributors, Inc. since 2006; senior officer of Columbia Funds and affiliated funds since 2006. | |
Thomas P. McGuire
225 Franklin Street
Boston, MA 02110
Born 1972 | | Chief Compliance Officer (2012) | | Vice President — Asset Management Compliance, Ameriprise Financial, Inc. since May 2010; Chief Compliance Officer, Ameriprise Certificate Company since September 2010; Compliance Executive, Bank of America from 2005 to April 2010. | |
Colin Moore
225 Franklin Street
Boston, MA 02110
Born 1958 | | Senior Vice President (2010) | | Executive Vice President and Global Chief Investment Officer, Ameriprise Financial, Inc. since July 2013; Director and Global Chief Investment Officer, Columbia Management Investment Advisers, LLC since May 2010; Manager, Managing Director and Chief Investment Officer, Columbia Management Advisors, LLC from 2007 to April 2010. | |
Michael E. DeFao
225 Franklin Street
Boston, MA 02110
Born 1968 | | Vice President (2011) and Assistant Secretary (2010) | | Vice President and Chief Counsel, Ameriprise Financial, Inc. since May 2010; Associate General Counsel, Bank of America from 2005 to April 2010. | |
Joseph F. DiMaria
225 Franklin Street
Boston, MA 02110
Born 1968 | | Vice President (2011) and Chief Accounting Officer (2008) | | Vice President — Mutual Fund Treasurer, Columbia Management Investment Advisers, LLC since May 2010; Director of Fund Administration, Columbia Management Advisors, LLC from 2006 to April 2010. | |
Paul B. Goucher
100 Park Avenue
New York, NY 10017
Born 1968 | | Vice President (2011) and Assistant Secretary (2008) | | Vice President and Lead Chief Counsel, Ameriprise Financial, Inc. since November 2008 and January 2013, respectively (previously, Chief Counsel from January 2010 to January 2013, and Group Counsel from November 2008 to January 2010); Director, Managing Director and General Counsel, J. & W. Seligman & Co. Incorporated from July 2008 to November 2008. | |
Amy Johnson
5228 Ameriprise
Financial Center
Minneapolis, MN
Born 1965 | | Vice President (2006) | | Senior Vice President and Chief Operating Officer, Columbia Management Investment Advisers, LLC since May 2010; previously, Chief Administrative Officer, from 2009 to April 2010, and Vice President — Asset Management and Trust Company Services from 2006 to 2009. | |
Paul D. Pearson
5228 Ameriprise
Financial Center
Minneapolis, MN
Born 1956 | | Vice President (2011) and Assistant Treasurer (1999) | | Vice President — Investment Accounting, Columbia Management Investment Advisers, LLC since May 2010; Vice President — Managed Assets, Investment Accounting, Ameriprise Financial, Inc. from 1998 to April 2010. | |
Christopher O. Petersen
5228 Ameriprise
Financial Center
Minneapolis, MN 55474
Born 1970 | | Vice President and Secretary (2010) | | Vice President and Chief Counsel, Ameriprise Financial, Inc. since January 2010 (previously, Vice President and Group Counsel or Counsel from 2004 to January 2010); officer of Columbia Funds and affiliated funds since 2007. | |
Stephen T. Welsh
225 Franklin Street
Boston, MA 02110
Born 1957 | | Vice President (2006) | | President and Director, Columbia Management Investment Services Corp. from May 2010 to October 2014; President and Director, Columbia Management Services, Inc. from 2004 to April 2010; and Managing Director, Columbia Management Distributors, Inc. from 2007 to April 2010. | |
Annual Report 2014
34
Columbia AMT-Free Connecticut Intermediate Muni Bond Fund
Board Consideration and Approval of Advisory Agreement
On June 11, 2014, the Board of Trustees (the "Board") and the Trustees who are not interested persons (as defined in the Investment Company Act of 1940) of the Trust (the "Independent Trustees") unanimously approved the continuation of the Investment Management Services Agreement (the "Advisory Agreement") with Columbia Management Investment Advisers, LLC (the "Investment Manager") with respect to Columbia AMT-Free Connecticut Intermediate Muni Bond Fund (the "Fund"), a series of the Trust. As detailed below, the Advisory Fees and Expenses Committee (the "Committee") and the Board met on multiple occasions to review and discuss, both among themselves and with the management team of the Investment Manager, materials provided by the Investment Manager before determining to approve the continuation of the Advisory Agreement.
In connection with their deliberations regarding the continuation of the Advisory Agreement, the Committee and the Board evaluated materials requested from the Investment Manager regarding the Fund and the Advisory Agreement, and discussed these materials with representatives of the Investment Manager at Committee meetings held on March 4, 2014, April 30, 2014 and June 10, 2014 and at Board meetings held on April 30, 2014 and June 11, 2014. In addition, the Board considers matters bearing on the Advisory Agreement at most of its other meetings throughout the year and meets regularly with senior management of the Funds and the Investment Manager. Through the Board's Investment Oversight Committees, Trustees also meet with selected Fund portfolio managers and other investment personnel at various times throughout the year. The Committee and the Board also consulted with its independent fee consultant, Fund counsel and with the Independent Trustees' independent legal counsel, who advised on various matters with respect to the Committee's and the Board's considerations and otherwise assisted the Committee and the Board in their deliberations. On June 10, 2014, the Committee recommended that the Board approve the continuation of the Advisory Agreement. On June 11, 2014, the Board, including the Independent Trustees, voting separately, unanimously approved the continuation of the Advisory Agreement for the Fund.
The Committee and the Board considered all information that they, their legal counsel, or the Investment Manager believed reasonably necessary to evaluate and to determine whether to approve the continuation of the Advisory Agreement. The information and factors considered by the Committee and the Board in recommending for approval or approving the continuation of the Advisory Agreement for the Fund included the following:
• Information on the investment performance of the Fund relative to the performance of a group of mutual funds determined to be comparable to the Fund by an independent third-party data provider, as well as performance relative to benchmarks;
• Information on the Fund's advisory fees and total expenses, including information comparing the Fund's expenses to those of a group of comparable mutual funds, as determined by the independent third-party data provider;
• The Investment Manager's agreement to contractually limit or cap total operating expenses for the Fund through February 28, 2015 so that total operating expenses (excluding certain fees and expenses, such as transaction costs and certain other investment related expenses, interest, taxes, acquired fund fees and expenses, and extraordinary expenses) would not exceed the annual rates of 0.81% for Class A, 1.56% for Class B, 1.56% for Class C, 0.56% for Class R4, 0.71% for Class T and 0.56% for Class Z;
• The terms and conditions of the Advisory Agreement;
• The current and proposed terms and conditions of other agreements and arrangements with affiliates of the Investment Manager relating to the operations of the Fund, including the Administrative Services Agreement, the Distribution Agreement and the Transfer and Dividend Disbursing Agent Agreement;
• Descriptions of various functions performed by the Investment Manager under the Advisory Agreement, including portfolio management and portfolio trading practices;
• Information regarding the management fees and investment performance of similarly-managed portfolios of other clients of the Investment Manager, including institutional separate accounts;
• Information regarding the reputation, regulatory history and resources of the Investment Manager, including information regarding senior management, portfolio managers and other personnel;
• Information regarding the capabilities of the Investment Manager with respect to compliance monitoring services, including an assessment of the Investment Manager's compliance system by the Fund's Chief Compliance Officer; and
• The profitability to the Investment Manager and its affiliates from their relationships with the Fund.
Annual Report 2014
35
Columbia AMT-Free Connecticut Intermediate Muni Bond Fund
Board Consideration and Approval of Advisory Agreement (continued)
Nature, Extent and Quality of Services Provided under the Advisory Agreement
The Committee and the Board considered the nature, extent and quality of services provided to the Fund by the Investment Manager and its affiliates under the Advisory Agreement and under separate agreements for the provision of transfer agency and administrative services, and the resources dedicated to the Fund and the other Columbia Funds by the Investment Manager and its affiliates. The Committee and the Board considered, among other things, the Investment Manager's ability to attract, motivate and retain highly qualified research, advisory and supervisory investment professionals (including personnel and other resources, compensation programs for personnel involved in fund management, reputation and other attributes), the portfolio management services provided by those investment professionals, and the quality of the Investment Manager's investment research capabilities and trade execution services. The Committee and the Board also considered the potential benefits to shareholders of investing in a mutual fund that is part of a fund complex offering exposure to a variety of asset classes and investment disciplines and providing a variety of fund and shareholder services.
The Committee and the Board also considered the professional experience and qualifications of the senior personnel of the Investment Manager, which included consideration of the Investment Manager's experience with similarly-structured funds. The Committee and the Board noted the compliance programs of and the compliance-related resources provided to the Fund by the Investment Manager and its affiliates, and considered the Investment Manager's ability to provide administrative services to the Fund pursuant to a separate Administrative Services Agreement, including the Investment Manager's ability to coordinate the activities of the Fund's other service providers. After reviewing these and related factors, the Committee and the Board concluded, within the context of their overall conclusions, that the nature, extent and quality of the services provided to the Fund under the Advisory Agreement supported the continuation of the Advisory Agreement.
Investment Performance
The Committee and the Board reviewed information about the performance of the Fund over various time periods, including performance information relative to benchmarks and information based on reports of the independent third-party data provider that compared the performance of the Fund to the performance of a group of comparable mutual funds, and data provided by the independent fee consultant. The Committee and the Board also reviewed a description of the third party's methodology for identifying the Fund's peer groups for purposes of performance and expense comparisons. Although the Fund's performance lagged that of a relevant peer group for certain (although not necessarily all) periods, the Committee and the Board concluded that other factors relevant to performance were sufficient, in light of other considerations, to warrant continuation of the Fund's Advisory Agreement. Those factors included one or more of the following: (i) that the Fund's performance, although lagging in certain recent periods, was stronger over the longer term; (ii) that the underperformance was attributable, to a significant extent, to investment decisions that were reasonable and consistent with the Fund's investment strategy and policies and that the Fund was performing within a reasonable range of expectations, given those investment decisions, market conditions and the Fund's investment strategy; (iii) that the Fund's performance was competitive when compared to other relevant performance benchmarks or peer groups; and (iv) that the Investment Manager had taken or was taking steps designed to help improve the Fund's investment performance, including, but not limited to, enhancing the resources supporting the portfolio managers, or modifying investment strategies.
The Committee and the Board noted that, through December 31, 2013, the Fund's performance was in the twenty-third, thirty-ninth and sixty-fourth percentile (where the best performance would be in the first percentile) of its category selected by the independent third-party data provider for the purposes of performance comparisons for the one-, three- and five- year periods, respectively.
The Committee and the Board also considered the Investment Manager's performance and reputation generally, the Investment Manager's historical responsiveness to Board concerns about performance, and the Investment Manager's willingness to take steps intended to improve performance. After reviewing these and related factors, the Committee and the Board concluded, within the context of their overall conclusions, that the performance of the Fund was sufficient, in light of other considerations, to warrant the continuation of the Advisory Agreement.
Investment Advisory Fee Rates and Other Expenses
The Committee and the Board considered the advisory fees charged to the Fund under the Advisory Agreement as well as the total expenses incurred by the Fund. In assessing the reasonableness of the fees under the Advisory Agreement, the Committee and the Board considered, among other information, the Fund's advisory fee and its total expense ratio as a
Annual Report 2014
36
Columbia AMT-Free Connecticut Intermediate Muni Bond Fund
Board Consideration and Approval of Advisory Agreement (continued)
percentage of average daily net assets. The Committee and the Board also considered data provided by the independent fee consultant. The Committee and the Board noted that the Fund's actual management fee and net expense ratio are both ranked in the first quintile (where the lowest fees and expenses would be in the first quintile) against the Fund's expense universe as determined by the independent third-party data provider for purposes of expense comparison. The Committee and the Board also took into account the fee waiver and expense limitation arrangements agreed to by the Investment Manager, as noted above.
The Committee and the Board also received and considered information about the advisory fees charged by the Investment Manager to institutional separate accounts. In considering the fees charged to those accounts, the Committee and the Board took into account, among other things, the Investment Manager's representations about the differences between managing mutual funds as compared to other types of accounts, including differences in the services provided, differences in the risk profile of such business for the Investment Manager and the additional resources required to manage mutual funds effectively. In evaluating the Fund's advisory fees, the Committee and the Board also took into account the demands, complexity and quality of the investment management of the Fund.
After reviewing these and related factors, the Committee and the Board concluded, within the context of their overall conclusions, that the advisory fee rates and expenses of the Fund were sufficient, in light of other considerations, to warrant the continuation of the Advisory Agreement.
Costs of Services Provided and Profitability
The Committee and the Board also took note of the costs of the services provided (both on an absolute and relative basis) and the profitability to the Investment Manager and its affiliates in connection with their relationships with the Fund. In evaluating these considerations, the Committee and the Board took note of the advisory fees charged by the Investment Manager to other clients, including fees charged by the Investment Manager to institutional separate account clients with similar investment strategies to those of the Fund.
The Committee and the Board also considered the compensation directly or indirectly received by the Investment Manager's affiliates in connection with their relationships with the Fund. The Committee and the Board reviewed information provided by management as to the profitability of the Investment Manager and its affiliates of their relationships with the Fund, information about the allocation of expenses used to calculate profitability, and comparisons of profitability levels realized in 2013 to profitability levels realized in 2012. When reviewing profitability, the Committee and the Board also considered court cases in which adviser profitability was an issue in whole or in part, the performance of similarly managed funds, the performance of the Fund, and the expense ratio of the Fund. The Committee and the Board also considered information provided by the Investment Manager regarding the Investment Manager's financial condition and comparing its profitability to that of other asset management firms that are, or are subsidiaries of, publicly traded companies.
After reviewing these and related factors, the Committee and the Board concluded, within the context of their overall conclusions, that the costs of services provided and the profitability to the Investment Manager and its affiliates from their relationships with the Fund supported the continuation of the Advisory Agreement.
Economies of Scale
The Committee and the Board considered the potential existence of economies of scale in the provision by the Investment Manager of services to the Fund, to groups of related funds, and to the Investment Manager's investment advisory clients as a whole, and whether those economies of scale were shared with the Fund through breakpoints in investment advisory fees or other means, such as expense limitation arrangements and additional investments by the Investment Manager in investment, trading and compliance resources. The Committee and the Board noted that the investment advisory fee schedules for the Fund contained breakpoints that would reduce the fee rate on assets above specified threshold levels.
In considering these matters, the Committee and the Board also considered the costs of the services provided and the profitability to the Investment Manager and its affiliates from their relationships with the Fund, as discussed above. After reviewing these and related factors, the Committee and the Board concluded, within the context of their overall conclusions, that the extent to which any economies of scale were expected to be shared with the Fund supported the continuation of the Advisory Agreement.
Annual Report 2014
37
Columbia AMT-Free Connecticut Intermediate Muni Bond Fund
Board Consideration and Approval of Advisory Agreement (continued)
Other Benefits to the Investment Manager
The Committee and the Board received and considered information regarding "fall-out" or ancillary benefits received by the Investment Manager and its affiliates as a result of their relationships with the Fund, such as the engagement of the Investment Manager to provide administrative services to the Fund and the engagement of the Investment Manager's affiliates to provide distribution and transfer agency services to the Fund. In this regard, among other matters, the Committee and the Board considered that the Fund's distributor retains a portion of the distribution fees from the Fund and receives a portion of the sales charges on sales or redemptions of certain classes of shares of the Fund. The Committee and the Board also considered the benefits of research made available to the Investment Manager by reason of brokerage commissions generated by the Fund's securities transactions, and reviewed information about the Investment Manager's practices with respect to allocating portfolio transactions for brokerage and research services. The Committee and the Board considered the possible conflicts of interest associated with certain fall-out or other ancillary benefits and the reporting, disclosure and other processes that are in place to address such possible conflicts of interest. The Committee and the Board recognized that the Investment Manager's profitability would be somewhat lower without these benefits.
Conclusion
The Committee and the Board reviewed all of the above considerations in reaching their decisions to recommend or approve the continuation of the Advisory Agreement. In their deliberations, the Trustees did not identify any particular information that was all-important or controlling, and individual Trustees may have attributed different weights to the various factors. Based on their evaluation of all factors that they deemed to be material, including those factors described above, and assisted by the advice of independent legal counsel, the Board, including the Independent Trustees, voting separately, unanimously approved the continuation of the Advisory Agreement.
Annual Report 2014
38
Columbia AMT-Free Connecticut Intermediate Muni Bond Fund
Important Information About This Report
Each fund mails one shareholder report to each shareholder address. If you would like more than one report, please call shareholder services at 800.345.6611 and additional reports will be sent to you.
The policy of the Board is to vote the proxies of the companies in which each fund holds investments consistent with the procedures as stated in the Statement of Additional Information (SAI). You may obtain a copy of the SAI without charge by calling 800.345.6611; contacting your financial intermediary; visiting columbiamanagement.com; or searching the website of the Securities and Exchange Commission (SEC) at sec.gov. Information regarding how each fund voted proxies relating to portfolio securities is filed with the SEC by August 31 for the most recent 12-month period ending June 30 of that year, and is available without charge by visiting columbiamanagement.com; or searching the website of the SEC at sec.gov.
Each fund files a complete schedule of portfolio holdings with the SEC for the first and third quarters of each fiscal year on Form N-Q. Each fund's Form N-Q is available on the SEC's website at sec.gov and may be reviewed and copied at the SEC's Public Reference Room in Washington, D.C. Information on the operation of the Public Reference Room may be obtained by calling 800.SEC.0330. Each fund's complete schedule of portfolio holdings, as filed on Form N-Q, can also be obtained without charge, upon request, by calling 800.345.6611.
Annual Report 2014
39

Columbia AMT-Free Connecticut Intermediate Muni Bond Fund
P.O. Box 8081
Boston, MA 02266-8081
columbiamanagement.com
This information is for use with concurrent or prior delivery of a fund prospectus. Please read and consider the investment objectives, risks, charges and expenses for any fund carefully before investing. For a prospectus and, if available, a summary prospectus, which contains this and other important information about the Fund, go to columbiamanagement.com. The Fund is distributed by Columbia Management Investment Distributors, Inc., member FINRA, and managed by Columbia Management Investment Advisers, LLC.
© 2014 Columbia Management Investment Advisers, LLC. All rights reserved.
ANN131_10_D01_(12/14)
Annual Report
October 31, 2014

Columbia California Tax-Exempt Fund
Not FDIC insured • No bank guarantee • May lose value
About Columbia Management
Backed by more than 100 years of experience, Columbia Management is one of the nation's largest asset managers. At the heart of our success — and, most importantly, that of our investors — are some of the most talented professionals in the industry, brought together by a unique way of working.
It starts with carefully selected, specialized investment teams. While each team brings a diverse and innovative range of skills, all are grounded by a common set of core beliefs. All possess a solid conviction in the power of proprietary, bottom-up research. All look not only at generating returns, but also at the likely consistency of those returns and the risks required to achieve them. And while our culture encourages teams to operate independently and question established thinking, a rigorous investment oversight process ensures that each team stays true to its clearly articulated investment process. At Columbia Management, reaching our performance goals matters, and the way we reach them matters just as much.
Columbia funds are distributed by Columbia Management Investment Distributors, Inc., member FINRA, and managed by Columbia Management Investment Advisers, LLC.
© 2014 Columbia Management Investment Advisers, LLC. All rights reserved.
Not part of the shareholder report
Connect with Columbia Management
Get the market insight you need from our investment experts
Investor insight
Stay informed with economic and market commentary, investment videos, white papers, mutual fund commentary and more at columbiamanagement.com.
Columbia Management investor
(e-newsletter)
Read our award-winning* shareholder newsletter. Our quarterly newsletter is available online and provides timely and relevant content about economic trends, fund news, service enhancements and changes. Sign up to receive the newsletter electronically at columbiamanagement.com/newsletter.
Investment videos
Watch and discover what our thought leaders are saying about financial markets and the economy. For an analysis of current events and trends that may affect your investments, visit our online video library at columbiamanagement.com/
market-insights/videos.
Social media
Columbia Management offers you multiple ways to access our market commentary and investment insights.
> Perspectives blog at columbiamanagement.com
Read timely posts by our investment team, including our chief investment officer, chief economist and portfolio managers.
> Twitter.com/ColumbiaMgmt
Follow us on Twitter for quick, up-to-the-minute comments on market news and more.
> Youtube.com/columbiamanagement
View our commentaries on the economy, markets and current investment opportunities.
> Linkedin.com/company/columbia-management
Connect with us on LinkedIn for updates from our thought leaders.
*Columbia Management investor was awarded top honors in the Mutual Fund Education Alliance STAR Awards competition for excellence in mutual fund marketing and communications. Materials in the competition were evaluated on educational value, message comprehension, effective design and objectives.
Not part of the shareholder report
 Dear Shareholders,
The U.S. Economy Gained Momentum
The U.S. economy picked up momentum throughout the third quarter of 2014 with improvements in every sector. Second-quarter gross domestic product growth was revised upward to 4.6%, with expectations that third-quarter growth would also be above trend. American companies added more than 200,000 new jobs monthly, driving unemployment below 6% for the first time since 2008. Consumer spending got a boost as both income and savings rose, and confidence hit a post-recession high. After a weak start to the year, corporate profits rebounded, indicating that business remains in good shape. Rising profits led to higher capital spending. The housing market recovery remained on track, as home sales and prices trended higher, and inventories declined. Manufacturing remained a lynchpin of the economy's expansion. Even so, performance fell short of expectations at the end of the period.
Despite Momentum, Markets Remained Stagnant
The financial markets produced lackluster results, despite good economic news and the Federal Reserve's reassurance that it intended to keep short-term interest rates low for another year. A surge in global tensions and concerns that equity valuations have risen sharply put a damper on investor enthusiasm. The S&P 500 Index inched ahead 1.13%, buoyed by its concentration in large-cap stocks with a defensive edge. Traditional fixed-income sectors, including U.S. Treasuries, mortgages and securitized bonds, eked out returns of less than 1% for the quarter. Investment-grade corporate bonds and high-yield bonds lost some ground, although fundamentals for both groups remained solid. Convertible securities and U.S. Treasury inflation-protected securities pulled up the rear.
Stay on Track with Columbia Management
Backed by more than 100 years of experience, Columbia Management is one of the nation's largest asset managers. At the heart of our success and, most importantly, that of our investors, are highly talented industry professionals, brought together by a unique way of working. At Columbia Management, reaching our performance goals matters, and how we reach them matters just as much.
Visit columbiamanagement.com for:
> The Columbia Management Perspectives blog, offering insights on current market events and investment opportunities
> Detailed up-to-date fund performance and portfolio information
> Quarterly fund commentaries
> Columbia Management investor, our award-winning quarterly newsletter for shareholders
Thank you for your continued support of the Columbia Funds. We look forward to serving your investment needs for many years to come.
Best Regards,

J. Kevin Connaughton
President, Columbia Funds
Investing involves risk including the risk of loss of principal.
The S&P 500 Index, an unmanaged index, measures the performance of 500 widely held, large-capitalization U.S. stocks and is frequently used as a general measure of market performance. Indices are not available for investment, are not professionally managed and do not reflect sales charges, fees, brokerage commissions, taxes or other expenses of investing.
Investors should consider the investment objectives, risks, charges and expenses of a mutual fund carefully before investing. For a free prospectus and, if available, a summary prospectus, which contains this and other important information about a fund, visit columbiamanagement.com. The prospectus should be read carefully before investing.
Columbia Funds are distributed by Columbia Management Investment Distributors, Inc., member FINRA, and managed by Columbia Management Investment Advisers, LLC.
© 2014 Columbia Management Investment Advisers, LLC. All rights reserved.
Columbia California Tax-Exempt Fund
Performance Overview | | | 2 | | |
Manager Discussion of Fund Performance | | | 4 | | |
Understanding Your Fund's Expenses | | | 7 | | |
Portfolio of Investments | | | 8 | | |
Statement of Assets and Liabilities | | | 18 | | |
Statement of Operations | | | 20 | | |
Statement of Changes in Net Assets | | | 21 | | |
Financial Highlights | | | 23 | | |
Notes to Financial Statements | | | 28 | | |
Report of Independent Registered
Public Accounting Firm | | | 34 | | |
Federal Income Tax Information | | | 35 | | |
Trustees and Officers | | | 36 | | |
Board Consideration and Approval of Advisory Agreement | | | 39 | | |
Important Information About This Report | | | 43 | | |
Fund Investment Manager
Columbia Management Investment
Advisers, LLC
225 Franklin Street
Boston, MA 02110
Fund Distributor
Columbia Management Investment
Distributors, Inc.
225 Franklin Street
Boston, MA 02110
Fund Transfer Agent
Columbia Management Investment
Services Corp.
P.O. Box 8081
Boston, MA 02266-8081
For more information about any of the funds, please visit columbiamanagement.com or call 800.345.6611. Customer Service Representatives are available to answer your questions Monday through Friday from 8 a.m. to 7 p.m. Eastern time.
The views expressed in this report reflect the current views of the respective parties. These views are not guarantees of future performance and involve certain risks, uncertainties and assumptions that are difficult to predict, so actual outcomes and results may differ significantly from the views expressed. These views are subject to change at any time based upon economic, market or other conditions and the respective parties disclaim any responsibility to update such views. These views may not be relied on as investment advice and, because investment decisions for a Columbia Fund are based on numerous factors, may not be relied on as an indication of trading intent on behalf of any particular Columbia Fund. References to specific securities should not be construed as a recommendation or investment advice.
Columbia California Tax-Exempt Fund
Performance Summary
> Columbia California Tax-Exempt Fund (the Fund) Class A shares returned 11.22% excluding sales charges for the 12-month period that ended October 31, 2014. Class Z shares of the Fund returned 11.35%.
> During the same 12-month period, the Barclays California Municipal Bond Index returned 8.96% and the broad Barclays Municipal Bond Index returned 7.82%.
> Effective duration and yield curve positioning during the period more than offset mixed results from sector allocation and security selection.
Average Annual Total Returns (%) (for period ended October 31, 2014)
| | Inception | | 1 Year | | 5 Years | | 10 Years | |
Class A | | 06/16/86 | | | | | | | | | | | | | |
Excluding sales charges | | | | | | | 11.22 | | | | 6.74 | | | | 4.99 | | |
Including sales charges | | | | | | | 5.88 | | | | 5.71 | | | | 4.48 | | |
Class B | | 08/04/92 | | | | | | | | | | | | | |
Excluding sales charges | | | | | | | 10.39 | | | | 5.94 | | | | 4.21 | | |
Including sales charges | | | | | | | 5.39 | | | | 5.62 | | | | 4.21 | | |
Class C | | 08/01/97 | | | | | | | | | | | | | |
Excluding sales charges | | | | | | | 10.72 | | | | 6.26 | | | | 4.52 | | |
Including sales charges | | | | | | | 9.72 | | | | 6.26 | | | | 4.52 | | |
Class R4* | | 03/19/13 | | | 11.35 | | | | 6.82 | | | | 5.03 | | |
Class Z* | | 09/19/05 | | | 11.35 | | | | 6.99 | | | | 5.22 | | |
Barclays California Municipal Bond Index | | | | | | | 8.96 | | | | 6.19 | | | | 5.03 | | |
Barclays Municipal Bond Index | | | | | | | 7.82 | | | | 5.26 | | | | 4.71 | | |
Returns for Class A are shown with and without the maximum initial sales charge of 4.75%. Returns for Class B are shown with and without the applicable contingent deferred sales charge (CDSC) of 5.00% in the first year, declining to 1.00% in the sixth year and eliminated thereafter. Returns for Class C are shown with and without the 1.00% CDSC for the first year only. The Fund's other classes are not subject to sales charges and have limited eligibility. Please see the Fund's prospectus for details. Performance for different share classes will vary based on differences in sales charges and fees associated with each class. All results shown assume reinvestment of distributions during the period. Returns do not reflect the deduction of taxes that a shareholder may pay on Fund distributions or on the redemption of Fund shares. Performance results reflect the effect of any fee waivers or reimbursements of Fund expenses by Columbia Management Investment Advisers, LLC and/or any of its affiliates. Absent these fee waivers or expense reimbursement arrangements, performance results would have been lower.
The performance information shown represents past performance and is not a guarantee of future results. The investment return and principal value of your investment will fluctuate so that your shares, when redeemed, may be worth more or less than their original cost. Current performance may be lower or higher than the performance information shown. You may obtain performance information current to the most recent month-end by contacting your financial intermediary, visiting columbiamanagement.com or calling 800.345.6611.
*The returns shown for periods prior to the share class inception date (including returns for the Life of the Fund, if shown, which are since Fund inception) include the returns of the Fund's oldest share class. These returns are adjusted to reflect any higher class-related operating expenses of the newer share classes, as applicable. Please visit columbiamanagement.com/mutual-funds/appended-performance for more information.
The Barclays California Municipal Bond Index is a subset of the Barclays Municipal Bond Index consisting solely of bonds issued by obligors located in the state of California.
The Barclays Municipal Bond Index is an unmanaged index considered representative of the broad market for investment-grade, tax-exempt bonds with a maturity of at least one year.
Indices are not available for investment, are not professionally managed and do not reflect sales charges, fees, brokerage commissions, taxes or other expenses of investing. Securities in the Fund may not match those in an index.
Annual Report 2014
2
Columbia California Tax-Exempt Fund
Performance Overview (continued)
Performance of a Hypothetical $10,000 Investment (November 1, 2004 – October 31, 2014)
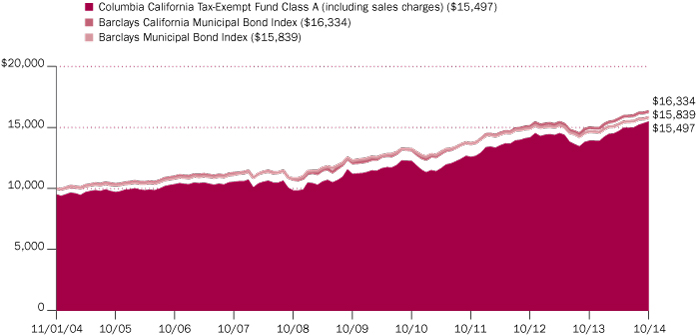
The chart above shows the change in value of a hypothetical $10,000 investment in Class A shares of Columbia California Tax-Exempt Fund during the stated time period, and does not reflect the deduction of taxes that a shareholder may pay on Fund distributions or on the redemption of Fund shares.
Annual Report 2014
3
Columbia California Tax-Exempt Fund
Manager Discussion of Fund Performance
Portfolio Management
Catherine Stienstra
Quality Breakdown (%)
(at October 31, 2014) | |
AAA rating | | | 2.4 | | |
AA rating | | | 13.5 | | |
A rating | | | 58.1 | | |
BBB rating | | | 15.0 | | |
Non-investment grade | | | 2.5 | | |
Not rated | | | 8.5 | | |
Total | | | 100.0 | | |
Percentages indicated are based upon total fixed income securities (excluding Money Market Funds).
Bond ratings apply to the underlying holdings of the Fund and not the Fund itself and are divided into categories ranging from highest to lowest credit quality, determined by using the middle rating of Moody's, S&P and Fitch, after dropping the highest and lowest available ratings. When ratings are available from only two rating agencies, the lower rating is used. When a rating is available from only one rating agency, that rating is used. When a bond is not rated by any rating agency, it is designated as "Not rated". Credit quality ratings assigned by a rating agency are subjective opinions, not statements of fact, and are subject to change, including daily. The ratings assigned by credit rating agencies are but one of the considerations that the Investment Manager and/or Fund's subadviser incorporates into its credit analysis process, along with such other issuer-specific factors as cash flows, capital structure and leverage ratios, ability to de-leverage (repay) through free cash flow, quality of management, market positioning and access to capital, as well as such security-specific factors as the terms of the security (e.g., interest rate, and time to maturity) and the amount and type of any collateral.
For the 12-month period that ended October 31, 2014, the Fund's Class A shares returned 11.22% excluding sales charges. Class Z shares of the Fund returned 11.35%. During the same 12-month period, the Barclays California Municipal Bond Index (Barclays CA Index) returned 8.96% and the broad Barclays Municipal Bond Index returned 7.82%. Effective duration and yield curve positioning during the period more than offset mixed results from sector allocation and security selection. Duration is a measure of sensitivity to movements in interest rates.
Tax-Exempt Bond Market Posted Gains
The tax-exempt fixed-income market posted solid gains during the annual period, as municipal bond yields declined across most of the yield curve (spectrum of maturities) and supply/demand conditions remained supportive. Municipal bonds were the best performing sector in the broad U.S. fixed-income market in 2014 year to date through October 31, generating the strongest returns seen in the sector in five years. Yields on longer term maturities declined while yields on shorter term maturities rose modestly, resulting in a flatter municipal bond yield curve. Lower quality, higher yielding municipal bonds generally outperformed their higher quality, lower yielding counterparts.
As the annual period began, municipal bond mutual funds were experiencing redemptions, albeit more slowly than the record levels hit in late summer 2013. Fund flows turned positive in February 2014, with improved demand for municipal bonds supported by reduced supply and higher taxes. The markets became unsettled in March 2014 when comments from the Federal Reserve (Fed) hinted that interest rates might increase sooner than previously anticipated. Fed Chair Janet Yellen subsequently re-emphasized the Fed's commitment to keep short-term interest rates low. In the second quarter of 2014, the municipal bond market generated strong gains as yields fell. Geopolitical uncertainty and inconsistent economic data helped push municipal bond prices higher. In the third quarter and into October, municipal bonds generally continued their strong performance, despite an uptick in market volatility.
From a fundamental perspective, states saw greater revenue — topping pre-recession peaks — on the back of increasing sales, income and property taxes along with lower expenses following recent austerity measures. Select negative credit stories made headlines, including the state of Illinois' pension turmoil, Puerto Rico's multi-notch downgrade, Detroit's Chapter 9 bankruptcy filing and the state of New Jersey's downgrade after a revenue shortfall led the state to make a reduced payment to its pension funds. However, such issues were not representative of the broad municipal bond market. Overall default rates trended down and were at their lowest level since 2009. It is well worth noting that California state credit ratings were upgraded in June 2014 by Moody's Investors Service to Aa3 — its highest rating achieved since 2001 — based on better fiscal management and a balanced budget. In addition, Standard & Poor's upgraded California's credit rating in October to A+. The technical (supply and demand) landscape for the annual period overall also supported the performance of the tax-exempt fixed-income market, as supply on both the national and state levels declined, and demand, as evidenced by municipal bond mutual fund inflows, was positive.
Annual Report 2014
4
Columbia California Tax-Exempt Fund
Manager Discussion of Fund Performance (continued)
Duration and Yield Curve Positioning Aided Returns
The Fund benefited most from its combined duration and yield curve positioning. The Fund had a longer duration than the Barclays CA Index, which helped as longer maturity tax-exempt bond yields fell. An overweight relative to the Barclays CA Index in bonds with maturities of 15 years or longer and a relative underweight in bonds with maturities of 1 to 15 years contributed positively as well, as longer dated maturities outperformed shorter term maturities during a time when the municipal bond yield curve flattened.
From a sector perspective, the Fund benefited from having an overweight exposure to the hospital sector and from having underweight allocations to the electric utilities and state general obligation bond sectors. Effective issue selection among the special tax, hospital, water/sewer, education and state and local general obligation bond sectors contributed positively as well. In terms of credit quality, having overweight allocations to bonds rated A and BBB and to non-rated securities and underweight allocations to bonds rated AAA and AA added value, as lower quality securities generally outperformed higher quality securities during the annual period.
Security Selection in Electric Utilities Sector Detracted
Detracting from Fund results was security selection within the electric utilities sector, particularly a small position in Puerto Rico Electric Power Authority (PREPA) bonds. These bonds performed poorly, as the cash-strapped electrical power authority faced critical deadlines to extend or make payments on lines of credit with banks. We sold the Fund's remaining position in these bonds in July 2014, leaving the Fund with no exposure to any Puerto Rico credits. Indeed, the negative impact of the position in PREPA was partially offset by the positive effect of having an overall underweight allocation to Puerto Rico bonds.
Having an overweight allocation to special tax bonds and underweight allocations to the prepaid gas, transportation and local general obligation sectors detracted from the Fund's relative results as well.
Fundamental Analysis Drove Portfolio Changes
During the annual period, we increased the Fund's exposure to state appropriated bonds and to the transportation sector. We decreased the Fund's exposure to pre-refunded bonds and to the local general obligation bond sector. From a credit quality perspective, we increased the Fund's allocation to bonds rated A and to bonds rated below investment grade and decreased its allocation to bonds rated AA. Overall, the Fund's duration remained longer than that of the Barclays CA Index during the annual period. However, while still maintaining a relatively longer duration at the end of the annual period, we had allowed the Fund's duration to drift modestly shorter as the end of the Fed's quantitative easing program and a potential shift in Fed policy approached.
The Fund held a modest position in an inverse floater to enhance income — with minimal impact during the annual period. Inverse floaters are bonds or other types of debt whose coupon rate has an inverse relationship to short-term interest rates or to a benchmark rate. An inverse floater adjusts its coupon payment as the interest rate changes, such that when interest rates rise, the coupon rate falls.
Investment Risks
Fixed-income securities present issuer default risk. The Fund invests substantially in municipal securities and will be affected by tax, legislative, regulatory, demographic or political changes, as well as changes impacting a state's financial, economic or other conditions. A relatively small number of tax-exempt issuers may necessitate the Fund investing more heavily in a single issuer and, therefore, be more exposed to the risk of loss than a fund that invests more broadly. The value of the Fund's portfolio may be more volatile than a more geographically diversified fund. Prepayment and extension risk exists as a loan, bond or other investment may be called, prepaid or redeemed before maturity and that similar yielding investments may not be available for purchase. A rise in interest rates may result in a price decline of fixed-income (debt) instruments held by the fund, negatively affecting its performance and NAV. Falling rates may result in the fund investing in lower yielding debt instruments, lowering the fund's income and yield. Debt instruments with longer maturity and duration have greater sensitivity to interest rate changes. Interest rates can change due to local government and banking regulation changes. Non-investment-grade (high-yield or junk) securities present greater price volatility and more risk to principal and income than higher rated securities. Market risk may affect a single issuer, sector of the economy, industry or the market as a whole. Federal and state tax rules apply to capital gain distributions and any gains or losses on sales. Income may be subject to state or local taxes. Liquidity risk is associated with the difficulty of selling underlying investments at a desirable time or price. See the Fund's prospectus for more information on these and other risks.
Annual Report 2014
5
Columbia California Tax-Exempt Fund
Manager Discussion of Fund Performance (continued)
Looking Ahead
As we move closer to the end of 2014, we currently expect to see a gradual rise in interest rates should the economy continue to slowly recover. The Fed's quantitative easing asset purchases officially ended in October 2014, and its comments at that time left the market with the impression that if economic data were to come in stronger in support of its employment and inflation targets, then we can expect the first interest rate hike sooner than later, but any such tightening of monetary policy would be data dependent. To date, geopolitical unrest, an economic slowdown in the eurozone and/or declining energy prices have kept U.S. Treasury yields suppressed even while economic data, including employment figures, were improving and inflation remained low. Of course, we remain mindful that these same factors could derail the U.S. economic recovery and alter Fed policy going forward.
At the end of the annual period, we remained generally constructive on the municipal bond market. Fundamentals had improved, defaults remained low, positive supply/demand technicals were expected to continue and taxable equivalent yields remained attractive due to high levels of taxation. As such, we currently expect to maintain the Fund's duration profile longer than that of the Barclays CA Index for the near term. We also expect, at this time, to continue to emphasize lower rated investment-grade credits and below-investment-grade credits for the additional income they may provide. Going forward, we currently expect short-term municipal bond yields to rise more than longer term yields, which will result in a flatter yield curve. Therefore, we intend to maintain an overweight exposure to municipal bonds with maturities of 15 years and longer and an underweight exposure to bonds with maturities of 1-10 years relative to the Barclays CA Index.
As always, the Fund's emphasis remains on generating income generally exempt from federal income tax and California state and local taxes as well as capital appreciation, consistent with moderate fluctuation of principal.
Annual Report 2014
6
Columbia California Tax-Exempt Fund
Understanding Your Fund's Expenses
(Unaudited)
As an investor, you incur two types of costs. There are transaction costs, which generally include sales charges on purchases and may include redemption fees. There are also ongoing costs, which generally include management fees, distribution and/or service fees, and other fund expenses. The following information is intended to help you understand your ongoing costs (in dollars) of investing in the Fund and to help you compare these costs with the ongoing costs of investing in other mutual funds.
Analyzing Your Fund's Expenses
To illustrate these ongoing costs, we have provided examples and calculated the expenses paid by investors in each share class of the Fund during the period. The actual and hypothetical information in the table is based on an initial investment of $1,000 at the beginning of the period indicated and held for the entire period. Expense information is calculated two ways and each method provides you with different information. The amount listed in the "Actual" column is calculated using the Fund's actual operating expenses and total return for the period. You may use the Actual information, together with the amount invested, to estimate the expenses that you paid over the period. Simply divide your account value by $1,000 (for example, an $8,600 account value divided by $1,000 = 8.6), then multiply the results by the expenses paid during the period under the "Actual" column. The amount listed in the "Hypothetical" column assumes a 5% annual rate of return before expenses (which is not the Fund's actual return) and then applies the Fund's actual expense ratio for the period to the hypothetical return. You should not use the hypothetical account values and expenses to estimate either your actual account balance at the end of the period or the expenses you paid during the period. See "Compare With Other Funds" below for details on how to use the hypothetical data.
Compare With Other Funds
Since all mutual funds are required to include the same hypothetical calculations about expenses in shareholder reports, you can use this information to compare the ongoing cost of investing in the Fund with other funds. To do so, compare the hypothetical example with the 5% hypothetical examples that appear in the shareholder reports of other funds. As you compare hypothetical examples of other funds, it is important to note that hypothetical examples are meant to highlight the ongoing costs of investing in a fund only and do not reflect any transaction costs, such as sales charges, or redemption or exchange fees. Therefore, the hypothetical calculations are useful in comparing ongoing costs only, and will not help you determine the relative total costs of owning different funds. If transaction costs were included in these calculations, your costs would be higher.
May 1, 2014 – October 31, 2014
| | Account Value at the Beginning
of the Period ($) | | Account Value at the End of the
Period ($) | | Expenses Paid During the
Period ($) | | Fund's Annualized
Expense Ratio (%) | |
| | Actual | | Hypothetical | | Actual | | Hypothetical | | Actual | | Hypothetical | | Actual | |
Class A | | | 1,000.00 | | | | 1,000.00 | | | | 1,051.60 | | | | 1,021.22 | | | | 4.09 | | | | 4.02 | | | | 0.79 | | |
Class B | | | 1,000.00 | | | | 1,000.00 | | | | 1,047.70 | | | | 1,017.44 | | | | 7.95 | | | | 7.83 | | | | 1.54 | | |
Class C | | | 1,000.00 | | | | 1,000.00 | | | | 1,049.30 | | | | 1,018.95 | | | | 6.41 | | | | 6.31 | | | | 1.24 | | |
Class R4 | | | 1,000.00 | | | | 1,000.00 | | | | 1,052.90 | | | | 1,022.48 | | | | 2.79 | | | | 2.75 | | | | 0.54 | | |
Class Z | | | 1,000.00 | | | | 1,000.00 | | | | 1,053.00 | | | | 1,022.48 | | | | 2.79 | | | | 2.75 | | | | 0.54 | | |
Expenses paid during the period are equal to the annualized expense ratio for each class as indicated above, multiplied by the average account value over the period and then multiplied by the number of days in the Fund's most recent fiscal half year and divided by 365.
Expenses do not include fees and expenses incurred indirectly by the Fund from its investment in underlying funds, including affiliated and non-affiliated pooled investment vehicles, such as mutual funds and exchange-traded funds.
Had Columbia Management Investment Advisers, LLC and/or certain of its affiliates not waived/reimbursed certain fees and expenses, account value at the end of the period would have been reduced.
Annual Report 2014
7
Columbia California Tax-Exempt Fund
Portfolio of Investments
October 31, 2014
(Percentages represent value of investments compared to net assets)
Municipal Bonds 98.5%
Issue
Description | | Coupon
Rate | | Principal
Amount ($) | |
Value ($) | |
Airport 4.9% | |
City of Fresno Airport(a)
Refunding Revenue Bonds
Series 2013B AMT
07/01/28 | | | 5.000 | % | | | 500,000 | | | | 554,840 | | |
07/01/30 | | | 5.125 | % | | | 1,050,000 | | | | 1,163,715 | | |
County of Orange Airport
Revenue Bonds
Series 2009A
07/01/39 | | | 5.250 | % | | | 2,500,000 | | | | 2,831,625 | | |
County of Sacramento Airport System
Revenue Bonds
Senior Series 2009B
07/01/39 | | | 5.750 | % | | | 3,000,000 | | | | 3,417,480 | | |
County of Sacramento Airport System(a)
Revenue Bonds
Senior Series 2008B (AGM) AMT
07/01/39 | | | 5.250 | % | | | 1,000,000 | | | | 1,069,990 | | |
San Francisco City & County Airports Commission-San Francisco International Airport(a)
Refunding Revenue Bonds
2nd Series 2008-34E (AGM) AMT
05/01/25 | | | 5.750 | % | | | 1,500,000 | | | | 1,698,450 | | |
2nd Series 2011F AMT
05/01/29 | | | 5.000 | % | | | 5,210,000 | | | | 5,880,266 | | |
Revenue Bonds
Series 2014A AMT
05/01/44 | | | 5.000 | % | | | 6,000,000 | | | | 6,625,080 | | |
Total | | | | | | | 23,241,446 | | |
Disposal 0.4% | |
California Pollution Control Financing Authority
Refunding Revenue Bonds
Waste Management, Inc.
Series 2002A AMT(a)(b)
01/01/22 | | | 5.000 | % | | | 2,000,000 | | | | 2,117,980 | | |
Higher Education 5.9% | |
California Educational Facilities Authority
Revenue Bonds
California College of the Arts
Series 2005
06/01/26 | | | 5.000 | % | | | 1,000,000 | | | | 1,012,270 | | |
California Lutheran University
Series 2008
10/01/21 | | | 5.250 | % | | | 665,000 | | | | 741,694 | | |
10/01/38 | | | 5.750 | % | | | 3,000,000 | | | | 3,381,870 | | |
Chapman University
Series 2011
04/01/31 | | | 5.000 | % | | | 4,375,000 | | | | 4,847,150 | | |
Loyola Marymount University
Series 2010A
10/01/40 | | | 5.125 | % | | | 1,250,000 | | | | 1,391,325 | | |
Municipal Bonds (continued)
Issue
Description | | Coupon
Rate | | Principal
Amount ($) | |
Value ($) | |
Woodbury University
Series 2006
01/01/25 | | | 5.000 | % | | | 1,830,000 | | | | 1,831,940 | | |
California Municipal Finance Authority
Revenue Bonds
Biola University
Series 2008
10/01/28 | | | 5.800 | % | | | 2,000,000 | | | | 2,225,060 | | |
Series 2013
10/01/38 | | | 5.000 | % | | | 1,000,000 | | | | 1,083,710 | | |
10/01/42 | | | 5.000 | % | | | 2,360,000 | | | | 2,542,806 | | |
California State University
Revenue Bonds
Systemwide
Series 2009A
11/01/40 | | | 6.000 | % | | | 2,000,000 | | | | 2,371,720 | | |
California Statewide Communities Development Authority
Revenue Bonds
California Baptist University
Series 2014A
11/01/43 | | | 6.375 | % | | | 3,000,000 | | | | 3,387,660 | | |
Lancer Plaza Project
Series 2013
11/01/33 | | | 5.625 | % | | | 1,400,000 | | | | 1,483,608 | | |
11/01/43 | | | 5.875 | % | | | 1,875,000 | | | | 1,982,306 | | |
Total | | | | | | | 28,283,119 | | |
Hospital 11.7% | |
California Health Facilities Financing Authority
Refunding Revenue Bonds
Cedars Sinai Medical Center
Series 2005
11/15/34 | | | 5.000 | % | | | 4,025,000 | | | | 4,162,252 | | |
Revenue Bonds
Adventist Health System West
Series 2009A
09/01/39 | | | 5.750 | % | | | 7,000,000 | | | | 8,122,800 | | |
Catholic Healthcare
Series 2011A
03/01/41 | | | 5.250 | % | | | 3,000,000 | | | | 3,263,790 | | |
Catholic Healthcare West
Series 2009A
07/01/39 | | | 6.000 | % | | | 1,000,000 | | | | 1,169,080 | | |
Series 2009E
07/01/25 | | | 5.625 | % | | | 1,125,000 | | | | 1,293,615 | | |
Kaiser Permanente
Series 2006A
04/01/39 | | | 5.250 | % | | | 3,350,000 | | | | 3,471,203 | | |
St. Joseph Health System
Series 2009A
07/01/29 | | | 5.500 | % | | | 1,500,000 | | | | 1,741,500 | | |
St. Joseph Health Systems
Series 2013A
07/01/37 | | | 5.000 | % | | | 2,000,000 | | | | 2,267,280 | | |
The accompanying Notes to Financial Statements are an integral part of this statement.
Annual Report 2014
8
Columbia California Tax-Exempt Fund
Portfolio of Investments (continued)
October 31, 2014
Municipal Bonds (continued)
Issue
Description | | Coupon
Rate | | Principal
Amount ($) | |
Value ($) | |
Sutter Health Obligation Group
Series 2008A
08/15/30 | | | 5.000 | % | | | 2,500,000 | | | | 2,739,675 | | |
Series 2011B
08/15/31 | | | 5.875 | % | | | 1,815,000 | | | | 2,185,478 | | |
California Municipal Finance Authority
Certificate of Participation | |
Community Hospitals of Central California
Series 2007
02/01/37 | | | 5.250 | % | | | 2,500,000 | | | | 2,610,275 | | |
Revenue Bonds
Community Hospitals of Central California
Series 2009
02/01/39 | | | 5.500 | % | | | 4,000,000 | | | | 4,313,160 | | |
California Statewide Communities Development Authority
Revenue Bonds
Catholic Healthcare West
Series 2008B
07/01/30 | | | 5.500 | % | | | 1,920,000 | | | | 2,134,925 | | |
Henry Mayo Newhall Memorial
Series 2014A (AGM)
10/01/43 | | | 5.250 | % | | | 1,500,000 | | | | 1,688,835 | | |
John Muir Health
Series 2006A
08/15/32 | | | 5.000 | % | | | 3,000,000 | | | | 3,173,700 | | |
Series 2009
07/01/39 | | | 5.125 | % | | | 500,000 | | | | 560,265 | | |
Kaiser Permanente
Series 2001C
08/01/31 | | | 5.250 | % | | | 1,100,000 | | | | 1,160,368 | | |
Sutter Health
Series 2011A
08/15/42 | | | 6.000 | % | | | 2,000,000 | | | | 2,418,160 | | |
City of Marysville
Revenue Bonds
Fremont-Rideout Health Group
Series 2011
01/01/42 | | | 5.250 | % | | | 4,000,000 | | | | 4,297,760 | | |
City of Torrance
Revenue Bonds
Torrance Memorial Medical Center
Series 2010A
09/01/30 | | | 5.000 | % | | | 3,000,000 | | | | 3,270,150 | | |
Total | | | | | | | 56,044,271 | | |
Investor Owned 1.0% | |
City of Chula Vista
Revenue Bonds
San Diego Gas & Electric Co.
Series 2004D
01/01/34 | | | 5.875 | % | | | 1,000,000 | | | | 1,191,040 | | |
Municipal Bonds (continued)
Issue
Description | | Coupon
Rate | | Principal
Amount ($) | |
Value ($) | |
City of Chula Vista(a)
Revenue Bonds
San Diego Gas & Electric Co.
Series 1992D AMT
12/01/27 | | | 5.000 | % | | | 3,500,000 | | | | 3,741,325 | | |
Total | | | | | | | 4,932,365 | | |
Local Appropriation 3.2% | |
City of Modesto
Certificate of Participation
Community Center Refinancing Project
Series 1993A (AMBAC)
11/01/23 | | | 5.000 | % | | | 2,235,000 | | | | 2,269,374 | | |
Los Angeles Municipal Improvement Corp.
Revenue Bonds
Capital Equipment
Series 2008A
09/01/24 | | | 5.000 | % | | | 1,000,000 | | | | 1,091,440 | | |
Series 2008B
09/01/38 | | | 5.000 | % | | | 3,000,000 | | | | 3,185,430 | | |
Pico Rivera Public Financing Authority
Revenue Bonds
Series 2009
09/01/31 | | | 5.500 | % | | | 1,500,000 | | | | 1,666,770 | | |
Sacramento City Schools Joint Powers Financing Authority
Refunding Revenue Bonds
Series 2006A
03/01/40 | | | 5.000 | % | | | 2,000,000 | | | | 2,191,940 | | |
San Mateo County Board of Education
Refunding Certificate of Participation
Series 2009
06/01/35 | | | 5.250 | % | | | 2,000,000 | | | | 2,200,300 | | |
Victor Elementary School District
Certificate of Participation
School Construction Refinancing Project
Series 1996 (NPFGC)
05/01/18 | | | 6.450 | % | | | 2,265,000 | | | | 2,483,595 | | |
Total | | | | | | | 15,088,849 | | |
Local General Obligation 5.3% | |
Central Valley Schools Financing Authority
General Obligation Refunding Revenue Bonds
School District Program
Series 1998A (NPFGC)
02/01/18 | | | 6.450 | % | | | 560,000 | | | | 604,195 | | |
East Side Union High School District
Unlimited General Obligation Refunding Bonds
Series 2003B (NPFGC)
08/01/26 | | | 5.250 | % | | | 2,010,000 | | | | 2,432,602 | | |
The accompanying Notes to Financial Statements are an integral part of this statement.
Annual Report 2014
9
Columbia California Tax-Exempt Fund
Portfolio of Investments (continued)
October 31, 2014
Municipal Bonds (continued)
Issue
Description | | Coupon
Rate | | Principal
Amount ($) | |
Value ($) | |
Grossmont Healthcare District
Unlimited General Obligation Bonds
2006 Election
Series 2011B
07/15/34 | | | 6.000 | % | | | 2,000,000 | | | | 2,464,320 | | |
Los Angeles Unified School District
Unlimited General Obligation Bonds
Series 2009D
01/01/34 | | | 5.000 | % | | | 750,000 | | | | 849,045 | | |
Manteca Unified School District
Unlimited General Obligation Bonds
Capital Appreciation-Election of 2004
Series 2006 (NPFGC)(c)
08/01/32 | | | 0.000 | % | | | 5,440,000 | | | | 2,331,802 | | |
Menifee Union School District
Unlimited General Obligation Bonds
Election of 2008
Series 2008A
08/01/33 | | | 5.500 | % | | | 3,125,000 | | | | 3,538,344 | | |
Oakland Unified School District/Alameda County
Unlimited General Obligation Bonds
Election of 2006
Series 2012A
08/01/22 | | | 5.000 | % | | | 750,000 | | | | 845,273 | | |
08/01/32 | | | 5.500 | % | | | 2,500,000 | | | | 2,811,400 | | |
Election of 2012
Series 2013
08/01/30 | | | 6.250 | % | | | 1,095,000 | | | | 1,332,593 | | |
Rocklin Unified School District
Unlimited General Obligation Bonds
Capital Appreciation
Series 1995C (NPFGC)(c)
07/01/20 | | | 0.000 | % | | | 3,460,000 | | | | 2,838,100 | | |
San Gorgonio Memorial Health Care District
Unlimited General Obligation Refunding Bonds
Series 2014
08/01/39 | | | 5.000 | % | | | 4,000,000 | | | | 4,357,200 | | |
Simi Valley Unified School District
Refunding Certificate of Participation
Capital Improvement Projects
Series 1998 (AMBAC)
08/01/22 | | | 5.250 | % | | | 925,000 | | | | 997,020 | | |
Total | | | | | | | 25,401,894 | | |
Multi-Family 2.9% | |
California Housing Finance Agency
Revenue Bonds
Multifamily Housing III
Series 1999A AMT(a)
02/01/36 | | | 5.375 | % | | | 2,280,000 | | | | 2,281,642 | | |
Municipal Bonds (continued)
Issue
Description | | Coupon
Rate | | Principal
Amount ($) | |
Value ($) | |
California Municipal Finance Authority
Revenue Bonds
Caritas Affordable Housing
Senior Series 2014
08/15/49 | | | 5.250 | % | | | 3,500,000 | | | | 3,825,990 | | |
Subordinated Series 2014
08/15/49 | | | 5.875 | % | | | 1,000,000 | | | | 1,050,230 | | |
California Statewide Communities Development Authority
Refunding Revenue Bonds
University of California Irvine East Campus Apartments
Series 2006
05/15/38 | | | 5.000 | % | | | 2,500,000 | | | | 2,553,400 | | |
Series 2012
05/15/31 | | | 5.125 | % | | | 2,000,000 | | | | 2,242,420 | | |
Revenue Bonds
University of California Irvine East Campus Apartments
Series 2008
05/15/32 | | | 5.750 | % | | | 1,500,000 | | | | 1,657,740 | | |
Total | | | | | | | 13,611,422 | | |
Municipal Power 2.5% | |
Anaheim Public Financing Authority
Revenue Bonds
Anaheim Electric Systems Distribution
Series 2009
10/01/25 | | | 5.000 | % | | | 1,000,000 | | | | 1,136,490 | | |
City of Redding
Certificate of Participation
Series 2008A (AGM)
06/01/27 | | | 5.000 | % | | | 865,000 | | | | 970,764 | | |
City of Riverside Electric
Revenue Bonds
Series 2008D (AGM)
10/01/28 | | | 5.000 | % | | | 1,325,000 | | | | 1,494,944 | | |
City of Vernon Electric System
Revenue Bonds
Series 2009A
08/01/21 | | | 5.125 | % | | | 2,730,000 | | | | 3,056,999 | | |
Series 2012A
08/01/30 | | | 5.000 | % | | | 1,000,000 | | | | 1,100,280 | | |
Imperial Irrigation District
Refunding Revenue Bonds
Systems
Series 2011A
11/01/31 | | | 6.250 | % | | | 1,000,000 | | | | 1,211,640 | | |
Modesto Irrigation District
Certificate of Participation
Series 2004B
07/01/35 | | | 5.500 | % | | | 2,000,000 | | | | 2,167,960 | | |
The accompanying Notes to Financial Statements are an integral part of this statement.
Annual Report 2014
10
Columbia California Tax-Exempt Fund
Portfolio of Investments (continued)
October 31, 2014
Municipal Bonds (continued)
Issue
Description | | Coupon
Rate | | Principal
Amount ($) | |
Value ($) | |
Southern California Public Power Authority
Revenue Bonds
Milford Wind Corridor Project
Series 2010-1
07/01/30 | | | 5.000 | % | | | 500,000 | | | | 582,890 | | |
Total | | | | | | | 11,721,967 | | |
Other Bond Issue 1.7% | |
California Infrastructure & Economic Development Bank
Revenue Bonds
Series 2008
02/01/33 | | | 5.250 | % | | | 3,000,000 | | | | 3,307,860 | | |
02/01/38 | | | 5.250 | % | | | 3,050,000 | | | | 3,362,991 | | |
San Diego County Regional Airport Authority
Revenue Bonds
Consolidated Rental Car Facility Project
Series 2014A
07/01/44 | | | 5.000 | % | | | 1,500,000 | | | | 1,671,390 | | |
Total | | | | | | | 8,342,241 | | |
Ports 2.3% | |
Port Commission of the City & County of San Francisco
Revenue Bonds
Series 2010A
03/01/40 | | | 5.125 | % | | | 5,000,000 | | | | 5,412,150 | | |
Port of Los Angeles
Refunding Revenue Bonds
Series 2014A AMT(a)
08/01/44 | | | 5.000 | % | | | 5,000,000 | | | | 5,614,750 | | |
Total | | | | | | | 11,026,900 | | |
Prep School 0.5% | |
California School Finance Authority
Revenue Bonds
KIPP Los Angeles Projects
Series 2014A
07/01/44 | | | 5.125 | % | | | 1,000,000 | | | | 1,040,530 | | |
California Statewide Communities Development Authority
Revenue Bonds
Aspire Public Schools
Series 2010
07/01/30 | | | 6.000 | % | | | 1,420,000 | | | | 1,470,538 | | |
Total | | | | | | | 2,511,068 | | |
Prepaid Gas 0.3% | |
M-S-R Energy Authority
Revenue Bonds
Series 2009B
11/01/34 | | | 7.000 | % | | | 1,000,000 | | | | 1,396,600 | | |
Municipal Bonds (continued)
Issue
Description | | Coupon
Rate | | Principal
Amount ($) | |
Value ($) | |
Refunded/Escrowed 4.8% | |
California Health Facilities Financing Authority
Prerefunded 02/01/20 Revenue Bonds
Insured Episcopal Home
Series 2010B
02/01/32 | | | 6.000 | % | | | 2,000,000 | | | | 2,488,600 | | |
City of Newport Beach
Prerefunded 12/01/21 Revenue Bonds
Hoag Memorial Hospital Presbyterian
Series 2011
12/01/40 | | | 6.000 | % | | | 1,000,000 | | | | 1,286,360 | | |
City of Pomona
Refunding Revenue Bonds
Series 1990B Escrowed to Maturity (GNMA/FHLMC)
08/01/23 | | | 7.500 | % | | | 790,000 | | | | 1,005,852 | | |
City of Redding
Revenue Bonds
Series 1992 Escrowed to Maturity (NPFGC)(b)
07/01/22 | | | 12.291 | % | | | 370,000 | | | | 519,110 | | |
County of Riverside
Revenue Bonds
Series 1989A Escrowed to Maturity (GNMA) AMT(a)
05/01/21 | | | 7.800 | % | | | 2,500,000 | | | | 3,419,700 | | |
Rowland Water District
Prerefunded 12/01/18 Certificate of Participation
Recycled Water Project
Series 2008
12/01/39 | | | 6.250 | % | | | 2,235,000 | | | | 2,714,117 | | |
San Joaquin Hills Transportation Corridor Agency
Revenue Bonds
Senior Lien
Series 1993 Escrowed to Maturity(c)
01/01/20 | | | 0.000 | % | | | 12,000,000 | | | | 11,280,720 | | |
Total | | | | | | | 22,714,459 | | |
Resource Recovery 0.7% | |
California Municipal Finance Authority
Revenue Bonds
UTS Renewable Energy-Waste Water Facilities
Series 2011 AMT(a)(d)(e)
12/01/32 | | | 7.500 | % | | | 2,825,000 | | | | 3,227,280 | | |
Retirement Communities 2.7% | |
ABAG Finance Authority for Nonprofit Corps.
Refunding Revenue Bonds
Episcopal Senior Communities
Series 2011
07/01/31 | | | 6.000 | % | | | 2,200,000 | | | | 2,537,106 | | |
The accompanying Notes to Financial Statements are an integral part of this statement.
Annual Report 2014
11
Columbia California Tax-Exempt Fund
Portfolio of Investments (continued)
October 31, 2014
Municipal Bonds (continued)
Issue
Description | | Coupon
Rate | | Principal
Amount ($) | |
Value ($) | |
California Statewide Communities Development Authority
Refunding Revenue Bonds
Episcopal Communities and Services
Series 2012
05/15/42 | | | 5.000 | % | | | 3,000,000 | | | | 3,244,230 | | |
Revenue Bonds
American Baptist Homes West
Series 2010
10/01/39 | | | 6.250 | % | | | 1,500,000 | | | | 1,708,020 | | |
Covenant Retirement Communities, Inc.
Series 2013
12/01/36 | | | 5.625 | % | | | 2,000,000 | | | | 2,194,300 | | |
Eskaton Properties, Inc.
Series 2012
11/15/34 | | | 5.250 | % | | | 1,250,000 | | | | 1,353,813 | | |
City of La Verne
Refunding Certificate of Participation
Brethren Hillcrest Homes
Series 2014
05/15/36 | | | 5.000 | % | | | 1,100,000 | | | | 1,175,416 | | |
Los Angeles County Regional Financing Authority
Revenue Bonds
Montecedro, Inc. Project
Series 2014A
11/15/44 | | | 5.000 | % | | | 500,000 | | | | 548,480 | | |
Total | | | | | | | 12,761,365 | | |
Single Family 0.6% | |
California Housing Finance Agency(a)
Revenue Bonds
Home Mortgage
Series 2006H (FGIC) AMT
08/01/30 | | | 5.750 | % | | | 350,000 | | | | 365,515 | | |
Series 2006K AMT
08/01/26 | | | 4.625 | % | | | 2,500,000 | | | | 2,542,875 | | |
02/01/42 | | | 5.500 | % | | | 135,000 | | | | 137,804 | | |
Total | | | | | | | 3,046,194 | | |
Special Non Property Tax 1.2% | |
Riverside County Transportation Commission
Revenue Bonds
Limited Tax
Series 2010A
06/01/32 | | | 5.000 | % | | | 5,000,000 | | | | 5,764,850 | | |
Special Property Tax 20.0% | |
Anaheim Community Facilities District No. 06-2
Special Tax Bonds
Stadium Lofts
Series 2007
09/01/37 | | | 5.000 | % | | | 1,000,000 | | | | 1,021,910 | | |
Municipal Bonds (continued)
Issue
Description | | Coupon
Rate | | Principal
Amount ($) | |
Value ($) | |
Bakersfield Redevelopment Agency
Tax Allocation Bonds
Old Town Kern Pioneer
Series 2009A
08/01/29 | | | 7.500 | % | | | 1,720,000 | | | | 1,895,423 | | |
Southeast Bakersfield
Series 2009B
08/01/29 | | | 7.250 | % | | | 805,000 | | | | 878,617 | | |
Carson Redevelopment Agency Successor Agency
Tax Allocation Bonds
Housing
Series 2010A
10/01/30 | | | 5.000 | % | | | 5,000,000 | | | | 5,394,750 | | |
Cerritos Public Financing Authority
Tax Allocation Bonds
Los Coyotes Redevelopment Project Loan
Series 1993A (AMBAC)
11/01/23 | | | 6.500 | % | | | 2,000,000 | | | | 2,438,900 | | |
Chino Public Financing Authority
Refunding Special Tax Bonds
Series 2012
09/01/30 | | | 5.000 | % | | | 2,500,000 | | | | 2,810,725 | | |
09/01/38 | | | 5.000 | % | | | 625,000 | | | | 684,081 | | |
City of Carson
Special Assessment Bonds
Assessment District No. 92-1
Series 1992
09/02/22 | | | 7.375 | % | | | 90,000 | | | | 90,890 | | |
City of Irvine
Special Tax Bonds
Community Facilities District 2013-3
Series 2014
09/01/39 | | | 5.000 | % | | | 750,000 | | | | 834,518 | | |
09/01/44 | | | 5.000 | % | | | 1,025,000 | | | | 1,137,525 | | |
City of Palo Alto
Refunding & Improvement Special Assessment Bonds
Limited Obligation-University Ave.
Series 2012
09/02/29 | | | 5.000 | % | | | 800,000 | | | | 878,704 | | |
City of Yucaipa
Refunding Special Tax Bonds
Community Facilities District No. 98-1
Series 2011
09/01/30 | | | 5.375 | % | | | 1,500,000 | | | | 1,689,600 | | |
Corona-Norca Unified School District
Refunding Special Tax Bonds
Community Facilities District #98-1
Series 2013
09/01/32 | | | 5.000 | % | | | 1,300,000 | | | | 1,453,296 | | |
The accompanying Notes to Financial Statements are an integral part of this statement.
Annual Report 2014
12
Columbia California Tax-Exempt Fund
Portfolio of Investments (continued)
October 31, 2014
Municipal Bonds (continued)
Issue
Description | | Coupon
Rate | | Principal
Amount ($) | |
Value ($) | |
Eastern Municipal Water District
Special Tax Bonds
District No. 2004-27 Cottonwood
Series 2006
09/01/27 | | | 5.000 | % | | | 190,000 | | | | 194,714 | | |
09/01/36 | | | 5.000 | % | | | 480,000 | | | | 489,854 | | |
Elk Grove Unified School District
Refunding Special Tax Bonds
Community Facilities District No. 1
Series 1995 (AMBAC)
12/01/24 | | | 6.500 | % | | | 3,000,000 | | | | 3,615,810 | | |
Elk Grove Unified School District(c)
Refunding Special Tax Bonds
Capital Appreciation-Community Facilities District No. 1
Series 1995 (AMBAC)
12/01/18 | | | 0.000 | % | | | 2,720,000 | | | | 2,258,253 | | |
Folsom Redevelopment Agency
Tax Allocation Bonds
Central Folsom Redevelopment Project
Series 2009
08/01/29 | | | 5.125 | % | | | 1,000,000 | | | | 1,057,920 | | |
08/01/36 | | | 5.500 | % | | | 1,000,000 | | | | 1,062,460 | | |
Inglewood Redevelopment Agency
Refunding Tax Allocation Bonds
Merged Redevelopment Project
Series 1998A (AMBAC)
05/01/23 | | | 5.250 | % | | | 2,100,000 | | | | 2,358,930 | | |
Inland Valley Development Agency
Refunding Tax Allocation Bonds
Series 2014A
09/01/44 | | | 5.000 | % | | | 5,000,000 | | | | 5,496,400 | | |
Jurupa Public Financing Authority
Refunding Special Tax Bonds
Series 2014A
09/01/42 | | | 5.000 | % | | | 1,000,000 | | | | 1,098,510 | | |
Los Angeles Community Redevelopment Agency
Tax Allocation Bonds
Hollywood Redevelopment Project
Series 1998C (NPFGC)
07/01/18 | | | 5.375 | % | | | 1,665,000 | | | | 1,865,183 | | |
Mountain View Shoreline Regional Park Community
Tax Allocation Bonds
Series 2011A
08/01/35 | | | 5.625 | % | | | 1,300,000 | | | | 1,480,609 | | |
08/01/40 | | | 5.750 | % | | | 2,000,000 | | | | 2,341,460 | | |
Oakdale Public Financing Authority
Tax Allocation Bonds
Central City Redevelopment Project
Series 2004
06/01/33 | | | 5.375 | % | | | 1,500,000 | | | | 1,500,945 | | |
Municipal Bonds (continued)
Issue
Description | | Coupon
Rate | | Principal
Amount ($) | |
Value ($) | |
Oakland Redevelopment Successor Agency
Refunding Tax Allocation Bonds
Subordinated Series 2013
09/01/20 | | | 5.000 | % | | | 2,000,000 | | | | 2,351,580 | | |
Palmdale Civic Authority
Refunding Revenue Bonds
Redevelopment Project No. 1
Series 2009A
07/01/27 | | | 6.000 | % | | | 4,780,000 | | | | 5,524,581 | | |
Pittsburg Successor Agency Redevelopment Agency
Tax Allocation Bonds
Los Medanos Community Development Project
Series 1999 (AMBAC)(c)
08/01/24 | | | 0.000 | % | | | 2,100,000 | | | | 1,418,466 | | |
Poway Unified School District
Special Tax Bonds
Community Facilities District No. 6-4S Ranch
Series 2012
09/01/31 | | | 5.000 | % | | | 1,370,000 | | | | 1,523,550 | | |
Rancho Cucamonga Redevelopment Agency Successor Agency
Tax Allocation Bonds
Housing Set Aside
Series 2007A (NPFGC)
09/01/34 | | | 5.000 | % | | | 3,200,000 | | | | 3,330,880 | | |
Riverside Public Financing Authority
Unrefunded Revenue Bonds
Multiple Loans
Series 1991A
02/01/18 | | | 8.000 | % | | | 15,000 | | | | 15,177 | | |
San Diego Redevelopment Agency
Tax Allocation Bonds
Capital Appreciation
Series 2001 (AGM)(c)
09/01/20 | | | 0.000 | % | | | 3,630,000 | | | | 3,177,230 | | |
San Francisco City & County Redevelopment Agency
Tax Allocation Bonds
Mission Bay North Redevelopment
Series 2009C
08/01/29 | | | 6.000 | % | | | 1,035,000 | | | | 1,194,669 | | |
08/01/39 | | | 6.500 | % | | | 2,625,000 | | | | 3,072,090 | | |
Mission Bay South Redevelopment
Series 2009D
08/01/29 | | | 6.375 | % | | | 1,000,000 | | | | 1,161,220 | | |
Mission Bay South Redevelopment Project
Series 2014A
08/01/43 | | | 5.000 | % | | | 1,000,000 | | | | 1,100,380 | | |
San Francisco Redevelopment Projects
Series 2009B
08/01/28 | | | 6.125 | % | | | 1,010,000 | | | | 1,179,306 | | |
08/01/32 | | | 6.500 | % | | | 500,000 | | | | 581,520 | | |
Series 2011B
08/01/26 | | | 6.125 | % | | | 500,000 | | | | 608,035 | | |
08/01/31 | | | 6.250 | % | | | 2,600,000 | | | | 3,125,772 | | |
08/01/41 | | | 6.625 | % | | | 1,600,000 | | | | 1,978,576 | | |
The accompanying Notes to Financial Statements are an integral part of this statement.
Annual Report 2014
13
Columbia California Tax-Exempt Fund
Portfolio of Investments (continued)
October 31, 2014
Municipal Bonds (continued)
Issue
Description | | Coupon
Rate | | Principal
Amount ($) | |
Value ($) | |
Santa Monica Redevelopment Agency
Tax Allocation Bonds
Earthquake Recovery Redevelopment
Series 2011
07/01/36 | | | 5.875 | % | | | 1,250,000 | | | | 1,470,587 | | |
Santee Community Development Commission
Tax Allocation Bonds
Santee Community Redevelopment Project
Series 2011A
08/01/31 | | | 7.000 | % | | | 1,000,000 | | | | 1,223,800 | | |
Sulphur Springs Union School District
Refunding Special Tax Bonds
Community Facilities District No. 2002-1-SE
Series 2012
09/01/30 | | | 5.000 | % | | | 1,270,000 | | | | 1,417,904 | | |
09/01/31 | | | 5.000 | % | | | 1,365,000 | | | | 1,517,989 | | |
09/01/33 | | | 5.000 | % | | | 1,000,000 | | | | 1,101,950 | | |
Temecula Redevelopment Agency
Tax Allocation Bonds
Housing Redevelopment Project No. 1
Series 2011A
08/01/31 | | | 6.750 | % | | | 1,000,000 | | | | 1,247,630 | | |
08/01/39 | | | 7.000 | % | | | 2,100,000 | | | | 2,603,895 | | |
Union City Community Redevelopment Agency
Tax Allocation Bonds
Subordinated Lien-Community Redevelopment Project
Series 2011
12/01/33 | | | 6.875 | % | | | 1,500,000 | | | | 1,900,140 | | |
West Covina Community Development Commission
Refunding Special Tax Bonds
Fashion Plaza
Series 1996
09/01/17 | | | 6.000 | % | | | 1,905,000 | | | | 2,041,055 | | |
Yorba Linda Redevelopment Agency
Tax Allocation Bonds
Subordinated Lien-Redevelopment Project
Series 2011A
09/01/26 | | | 6.000 | % | | | 1,000,000 | | | | 1,220,660 | | |
09/01/32 | | | 6.500 | % | | | 2,000,000 | | | | 2,469,840 | | |
Total | | | | | | | 95,588,469 | | |
State Appropriated 9.1% | |
California State Public Works Board
Refunding Revenue Bonds
Various Capital Projects
Series 2012G
11/01/29 | | | 5.000 | % | | | 2,500,000 | | | | 2,919,050 | | |
11/01/37 | | | 5.000 | % | | | 6,825,000 | | | | 7,779,067 | | |
Revenue Bonds
California State University Projects
Series 2011B
10/01/31 | | | 5.000 | % | | | 1,200,000 | | | | 1,364,928 | | |
Municipal Bonds (continued)
Issue
Description | | Coupon
Rate | | Principal
Amount ($) | |
Value ($) | |
Judicial Council Projects
Series 2011D
12/01/31 | | | 5.000 | % | | | 5,100,000 | | | | 5,872,854 | | |
Series 2013A
03/01/32 | | | 5.000 | % | | | 1,500,000 | | | | 1,706,655 | | |
Series 2013A
03/01/38 | | | 5.000 | % | | | 2,500,000 | | | | 2,786,125 | | |
Series 2014A
09/01/39 | | | 5.000 | % | | | 3,895,000 | | | | 4,398,117 | | |
Series 2014B
10/01/39 | | | 5.000 | % | | | 1,000,000 | | | | 1,130,110 | | |
Various Capital Projects
Series 2011A
10/01/31 | | | 5.125 | % | | | 5,000,000 | | | | 5,780,700 | | |
Subordinated Series 2009I-1
11/01/29 | | | 6.125 | % | | | 5,000,000 | | | | 6,165,050 | | |
Subordinated Series 2010A-1
03/01/35 | | | 6.000 | % | | | 2,750,000 | | | | 3,279,182 | | |
Total | | | | | | | 43,181,838 | | |
State General Obligation 13.1% | |
State of California
Unlimited General Obligation Bonds
Series 2008
08/01/34 | | | 5.000 | % | | | 3,000,000 | | | | 3,341,910 | | |
Various Purpose
Series 2005
03/01/32 | | | 5.000 | % | | | 1,000,000 | | | | 1,051,330 | | |
Series 2007
12/01/31 | | | 5.000 | % | | | 3,500,000 | | | | 3,863,265 | | |
12/01/32 | | | 5.000 | % | | | 5,000,000 | | | | 5,504,650 | | |
Series 2009
10/01/29 | | | 5.000 | % | | | 4,500,000 | | | | 5,122,305 | | |
04/01/31 | | | 5.750 | % | | | 2,750,000 | | | | 3,250,197 | | |
04/01/35 | | | 6.000 | % | | | 4,000,000 | | | | 4,791,040 | | |
04/01/38 | | | 6.000 | % | | | 10,500,000 | | | | 12,581,415 | | |
11/01/39 | | | 5.500 | % | | | 4,965,000 | | | | 5,736,760 | | |
Series 2010
03/01/30 | | | 5.250 | % | | | 1,000,000 | | | | 1,164,710 | | |
03/01/33 | | | 6.000 | % | | | 4,000,000 | | | | 4,905,400 | | |
03/01/40 | | | 5.500 | % | | | 4,800,000 | | | | 5,545,776 | | |
Series 2012
04/01/42 | | | 5.000 | % | | | 5,200,000 | | | | 5,773,612 | | |
Unrefunded Unlimited General Obligation Bonds
Series 2004
04/01/29 | | | 5.300 | % | | | 2,000 | | | | 2,008 | | |
Total | | | | | | | 62,634,378 | | |
Turnpike/Bridge/Toll Road 1.5% | |
Foothill-Eastern Transportation Corridor Agency
Refunding Revenue Bonds
Series 2014A
01/15/46 | | | 5.750 | % | | | 2,850,000 | | | | 3,273,339 | | |
The accompanying Notes to Financial Statements are an integral part of this statement.
Annual Report 2014
14
Columbia California Tax-Exempt Fund
Portfolio of Investments (continued)
October 31, 2014
Municipal Bonds (continued)
Issue
Description | | Coupon
Rate | | Principal
Amount ($) | |
Value ($) | |
Revenue Bonds
Senior Lien
Series 1995A (NPFGC)
01/01/35 | | | 5.000 | % | | | 2,000,000 | | | | 2,005,560 | | |
Riverside County Transportation Commission
Revenue Bonds
Senior Lien
Series 2013A
06/01/48 | | | 5.750 | % | | | 1,500,000 | | | | 1,703,520 | | |
Total | | | | | | | 6,982,419 | | |
Water & Sewer 2.2% | |
City of Big Bear Lake Water
Refunding Revenue Bonds
Series 1996 (NPFGC)
04/01/15 | | | 6.000 | % | | | 370,000 | | | | 375,717 | | |
City of Lodi
Certificate of Participation
Series 2007A (AGM)
10/01/37 | | | 5.000 | % | | | 1,250,000 | | | | 1,365,475 | | |
Eastern Municipal Water District
Certificate of Participation
Series 2008H
07/01/33 | | | 5.000 | % | | | 1,000,000 | | | | 1,116,440 | | |
San Diego Public Facilities Financing Authority Sewer
Revenue Bonds
Senior Series 2009A
05/15/34 | | | 5.250 | % | | | 1,500,000 | | | | 1,726,200 | | |
05/15/39 | | | 5.250 | % | | | 3,000,000 | | | | 3,442,530 | | |
Municipal Bonds (continued)
Issue
Description | | Coupon
Rate | | Principal
Amount ($) | |
Value ($) | |
San Diego Public Facilities Financing Authority Water
Revenue Bonds
Series 2009B
08/01/34 | | | 5.375 | % | | | 2,000,000 | | | | 2,329,180 | | |
Total | | | | | | | 10,355,542 | | |
Total Municipal Bonds
(Cost: $416,870,465) | | | | | | | 469,976,916 | | |
Money Market Funds 0.4%
| | | Shares | | Value ($) | |
Dreyfus General California
Municipal Money Market Fund,
0.000%(f) | | | 1,011,912 | | | | 1,011,912 | | |
JPMorgan Tax-Free Money Market Fund,
0.010%(f) | | | 962,164 | | | | 962,164 | | |
Total Money Market Funds
(Cost: $1,974,076) | | | | | 1,974,076 | | |
Total Investments
(Cost: $418,844,541) | | | | | 471,950,992 | | |
Other Assets & Liabilities, Net | | | | | 5,249,303 | | |
Net Assets | | | | | 477,200,295 | | |
Notes to Portfolio of Investments
(a) Income from this security may be subject to alternative minimum tax.
(b) Variable rate security.
(c) Zero coupon bond.
(d) Security exempt from registration pursuant to Rule 144A under the Securities Act of 1933. This security may be resold in transactions exempt from registration, normally to qualified institutional buyers. At October 31, 2014, the value of these securities amounted to $3,227,280 or 0.68% of net assets.
(e) Identifies securities considered by the Investment Manager to be illiquid as to their marketability. The aggregate value of such securities at October 31, 2014 was $3,227,280, which represents 0.68% of net assets. Information concerning such security holdings at October 31, 2014 is as follows:
Security Description | | Acquisition Dates | | Cost ($) | |
California Municipal Finance Authority
Revenue Bonds
UTS Renewable Energy - Waste Water Facilities
Series 2011 AMT
12/01/32 7.500% | | 12/22/11 | | | 2,825,000 | | |
(f) The rate shown is the seven-day current annualized yield at October 31, 2014.
The accompanying Notes to Financial Statements are an integral part of this statement.
Annual Report 2014
15
Columbia California Tax-Exempt Fund
Portfolio of Investments (continued)
October 31, 2014
AGM Assured Guaranty Municipal Corporation
AMBAC Ambac Assurance Corporation
AMT Alternative Minimum Tax
FGIC Financial Guaranty Insurance Company
FHLMC Federal Home Loan Mortgage Corporation
GNMA Government National Mortgage Association
NPFGC National Public Finance Guarantee Corporation
Fair Value Measurements
Generally accepted accounting principles (GAAP) require disclosure regarding the inputs and valuation techniques used to measure fair value and any changes in valuation inputs or techniques. In addition, investments shall be disclosed by major category.
The Fund categorizes its fair value measurements according to a three-level hierarchy that maximizes the use of observable inputs and minimizes the use of unobservable inputs by prioritizing that the most observable input be used when available. Observable inputs are those that market participants would use in pricing an investment based on market data obtained from sources independent of the reporting entity. Unobservable inputs are those that reflect the Fund's assumptions about the information market participants would use in pricing an investment. An investment's level within the fair value hierarchy is based on the lowest level of any input that is deemed significant to the asset or liability's fair value measurement. The input levels are not necessarily an indication of the risk or liquidity associated with investments at that level. For example, certain U.S. government securities are generally high quality and liquid, however, they are reflected as Level 2 because the inputs used to determine fair value may not always be quoted prices in an active market.
Fair value inputs are summarized in the three broad levels listed below:
> Level 1 — Valuations based on quoted prices for investments in active markets that the Fund has the ability to access at the measurement date (including NAV for open-end mutual funds). Valuation adjustments are not applied to Level 1 investments.
> Level 2 — Valuations based on other significant observable inputs (including quoted prices for similar securities, interest rates, prepayment speeds, credit risks, etc.).
> Level 3 — Valuations based on significant unobservable inputs (including the Fund's own assumptions and judgment in determining the fair value of investments).
Inputs that are used in determining fair value of an investment may include price information, credit data, volatility statistics, and other factors. These inputs can be either observable or unobservable. The availability of observable inputs can vary between investments, and is affected by various factors such as the type of investment, and the volume and level of activity for that investment or similar investments in the marketplace. The inputs will be considered by the Investment Manager, along with any other relevant factors in the calculation of an investment's fair value. The Fund uses prices and inputs that are current as of the measurement date, which may include periods of market dislocations. During these periods, the availability of prices and inputs may be reduced for many investments. This condition could cause an investment to be reclassified between the various levels within the hierarchy.
Investments falling into the Level 3 category are primarily supported by quoted prices from brokers and dealers participating in the market for those investments. However, these may be classified as Level 3 investments due to lack of market transparency and corroboration to support these quoted prices. Additionally, valuation models may be used as the pricing source for any remaining investments classified as Level 3. These models may rely on one or more significant unobservable inputs and/or significant assumptions by the Investment Manager. Inputs used in valuations may include, but are not limited to, financial statement analysis, capital account balances, discount rates and estimated cash flows, and comparable company data.
Under the direction of the Fund's Board of Trustees (the Board), the Investment Manager's Valuation Committee (the Committee) is responsible for overseeing the valuation procedures approved by the Board. The Committee consists of voting and non-voting members from various groups within the Investment Manager's organization, including operations and accounting, trading and investments, compliance, risk management and legal.
The Committee meets at least monthly to review and approve valuation matters, which may include a description of specific valuation determinations, data regarding pricing information received from approved pricing vendors and brokers and the results of Board-approved valuation control policies and procedures (the Policies). The Policies address, among other things, instances when market quotations are or are not readily available, including recommendations of third party pricing vendors and a determination of appropriate pricing methodologies; events that require specific valuation determinations and assessment of fair value techniques; securities with a potential for stale pricing, including those that are illiquid, restricted, or in default; and the effectiveness of third party pricing vendors, including periodic reviews of vendors. The Committee meets more frequently, as needed, to discuss additional valuation matters, which may include the need to review back-testing results, review time-sensitive information or approve related valuation actions. The Committee reports to the Board, with
The accompanying Notes to Financial Statements are an integral part of this statement.
Annual Report 2014
16
Columbia California Tax-Exempt Fund
Portfolio of Investments (continued)
October 31, 2014
Fair Value Measurements (continued)
members of the Committee meeting with the Board at each of its regularly scheduled meetings to discuss valuation matters and actions during the period, similar to those described earlier.
For investments categorized as Level 3, the Committee monitors information similar to that described above, which may include: (i) data specific to the issuer or comparable issuers, (ii) general market or specific sector news and (iii) quoted prices and specific or similar security transactions. The Committee considers this data and any changes from prior periods in order to assess the reasonableness of observable and unobservable inputs, any assumptions or internal models used to value those securities and changes in fair value. This data is also used to corroborate, when available, information received from approved pricing vendors and brokers. Various factors impact the frequency of monitoring this information (which may occur as often as daily). However, the Committee may determine that changes to inputs, assumptions and models are not required as a result of the monitoring procedures performed.
The following table is a summary of the inputs used to value the Fund's investments at October 31, 2014:
Description | | Level 1
Quoted Prices in Active
Markets for Identical
Assets ($) | |
Level 2
Other Significant
Observable Inputs ($) | |
Level 3
Significant
Unobservable Inputs ($) | |
Total ($) | |
Bonds | |
Municipal Bonds | | | — | | | | 469,976,916 | | | | — | | | | 469,976,916 | | |
Total Bonds | | | — | | | | 469,976,916 | | | | — | | | | 469,976,916 | | |
Mutual Funds | |
Money Market Funds | | | 1,974,076 | | | | — | | | | — | | | | 1,974,076 | | |
Total Mutual Funds | | | 1,974,076 | | | | — | | | | — | | | | 1,974,076 | | |
Total | | | 1,974,076 | | | | 469,976,916 | | | | — | | | | 471,950,992 | | |
See the Portfolio of Investments for all investment classifications not indicated in the table.
The Fund's assets assigned to the Level 2 input category are generally valued using the market approach, in which a security's value is determined through reference to prices and information from market transactions for similar or identical assets.
There were no transfers of financial assets between levels during the period.
The accompanying Notes to Financial Statements are an integral part of this statement.
Annual Report 2014
17
Columbia California Tax-Exempt Fund
Statement of Assets and Liabilities
October 31, 2014
Assets | |
Investments, at value | |
(identified cost $418,844,541) | | $ | 471,950,992 | | |
Receivable for: | |
Capital shares sold | | | 1,694,814 | | |
Interest | | | 5,920,212 | | |
Expense reimbursement due from Investment Manager | | | 717 | | |
Prepaid expenses | | | 3,871 | | |
Trustees' deferred compensation plan | | | 59,940 | | |
Total assets | | | 479,630,546 | | |
Liabilities | |
Payable for: | |
Capital shares purchased | | | 622,816 | | |
Dividend distributions to shareholders | | | 1,564,099 | | |
Investment management fees | | | 5,221 | | |
Distribution and/or service fees | | | 3,273 | | |
Transfer agent fees | | | 80,169 | | |
Administration fees | | | 883 | | |
Compensation of board members | | | 26,713 | | |
Chief compliance officer expenses | | | 23 | | |
Other expenses | | | 67,114 | | |
Trustees' deferred compensation plan | | | 59,940 | | |
Total liabilities | | | 2,430,251 | | |
Net assets applicable to outstanding capital stock | | $ | 477,200,295 | | |
Represented by | |
Paid-in capital | | $ | 422,403,624 | | |
Undistributed net investment income | | | 93,025 | | |
Accumulated net realized gain | | | 1,597,195 | | |
Unrealized appreciation (depreciation) on: | |
Investments | | | 53,106,451 | | |
Total — representing net assets applicable to outstanding capital stock | | $ | 477,200,295 | | |
The accompanying Notes to Financial Statements are an integral part of this statement.
Annual Report 2014
18
Columbia California Tax-Exempt Fund
Statement of Assets and Liabilities (continued)
October 31, 2014
Class A | |
Net assets | | $ | 359,824,764 | | |
Shares outstanding | | | 45,026,988 | | |
Net asset value per share | | $ | 7.99 | | |
Maximum offering price per share(a) | | $ | 8.39 | | |
Class B | |
Net assets | | $ | 359,669 | | |
Shares outstanding | | | 45,016 | | |
Net asset value per share | | $ | 7.99 | | |
Class C | |
Net assets | | $ | 41,962,470 | | |
Shares outstanding | | | 5,250,099 | | |
Net asset value per share | | $ | 7.99 | | |
Class R4 | |
Net assets | | $ | 21,888 | | |
Shares outstanding | | | 2,738 | | |
Net asset value per share | | $ | 7.99 | | |
Class Z | |
Net assets | | $ | 75,031,504 | | |
Shares outstanding | | | 9,386,028 | | |
Net asset value per share | | $ | 7.99 | | |
(a) The maximum offering price per share is calculated by dividing the net asset value per share by 1.0 minus the maximum sales charge of 4.75%.
The accompanying Notes to Financial Statements are an integral part of this statement.
Annual Report 2014
19
Columbia California Tax-Exempt Fund
Statement of Operations
Year Ended October 31, 2014
Net investment income | |
Income: | |
Dividends | | $ | 867 | | |
Interest | | | 22,594,542 | | |
Total income | | | 22,595,409 | | |
Expenses: | |
Investment management fees | | | 1,870,343 | | |
Distribution and/or service fees | |
Class A | | | 888,158 | | |
Class B | | | 5,223 | | |
Class C | | | 396,461 | | |
Transfer agent fees | |
Class A | | | 441,103 | | |
Class B | | | 651 | | |
Class C | | | 49,206 | | |
Class R4 | | | 16 | | |
Class Z | | | 89,517 | | |
Administration fees | | | 316,431 | | |
Compensation of board members | | | 35,035 | | |
Custodian fees | | | 4,012 | | |
Printing and postage fees | | | 38,252 | | |
Registration fees | | | 24,473 | | |
Professional fees | | | 37,850 | | |
Chief compliance officer expenses | | | 237 | | |
Other | | | 25,774 | | |
Total expenses | | | 4,222,742 | | |
Fees waived or expenses reimbursed by Investment Manager and its affiliates | | | (422,557 | ) | |
Fees waived by Distributor — Class C | | | (118,938 | ) | |
Expense reductions | | | (640 | ) | |
Total net expenses | | | 3,680,607 | | |
Net investment income | | | 18,914,802 | | |
Realized and unrealized gain (loss) — net | |
Net realized gain (loss) on: | |
Investments | | | 2,218,440 | | |
Net realized gain | | | 2,218,440 | | |
Net change in unrealized appreciation (depreciation) on: | |
Investments | | | 28,551,820 | | |
Net change in unrealized appreciation | | | 28,551,820 | | |
Net realized and unrealized gain | | | 30,770,260 | | |
Net increase in net assets resulting from operations | | $ | 49,685,062 | | |
The accompanying Notes to Financial Statements are an integral part of this statement.
Annual Report 2014
20
Columbia California Tax-Exempt Fund
Statement of Changes in Net Assets
| | | Year Ended
October 31,
2014 | | Year Ended
October 31,
2013(a) | |
Operations | |
Net investment income | | $ | 18,914,802 | | | $ | 20,591,071 | | |
Net realized gain | | | 2,218,440 | | | | 3,635,525 | | |
Net change in unrealized appreciation (depreciation) | | | 28,551,820 | | | | (34,163,023 | ) | |
Net increase (decrease) in net assets resulting from operations | | | 49,685,062 | | | | (9,936,427 | ) | |
Distributions to shareholders | |
Net investment income | |
Class A | | | (14,369,610 | ) | | | (15,699,029 | ) | |
Class B | | | (17,298 | ) | | | (35,598 | ) | |
Class C | | | (1,423,946 | ) | | | (1,511,619 | ) | |
Class R4 | | | (535 | ) | | | (63 | ) | |
Class Z | | | (3,100,213 | ) | | | (3,345,308 | ) | |
Net realized gains | |
Class A | | | (2,827,887 | ) | | | (276,495 | ) | |
Class B | | | (5,909 | ) | | | (932 | ) | |
Class C | | | (307,302 | ) | | | (29,562 | ) | |
Class R4 | | | (19 | ) | | | — | | |
Class Z | | | (554,329 | ) | | | (54,442 | ) | |
Total distributions to shareholders | | | (22,607,048 | ) | | | (20,953,048 | ) | |
Decrease in net assets from capital stock activity | | | (18,308,049 | ) | | | (62,827,380 | ) | |
Total increase (decrease) in net assets | | | 8,769,965 | | | | (93,716,855 | ) | |
Net assets at beginning of year | | | 468,430,330 | | | | 562,147,185 | | |
Net assets at end of year | | $ | 477,200,295 | | | $ | 468,430,330 | | |
Undistributed net investment income | | $ | 93,025 | | | $ | 89,825 | | |
(a) Class R4 shares are based on operations from March 19, 2013 (commencement of operations) through the stated period end.
The accompanying Notes to Financial Statements are an integral part of this statement.
Annual Report 2014
21
Columbia California Tax-Exempt Fund
Statement of Changes in Net Assets (continued)
| | | Year Ended October 31, 2014 | | Year Ended October 31, 2013(a) | |
| | | Shares | | Dollars ($) | | Shares | | Dollars ($) | |
Capital stock activity | |
Class A shares | |
Subscriptions(b) | | | 2,150,703 | | | | 16,632,791 | | | | 2,100,772 | | | | 16,607,171 | | |
Distributions reinvested | | | 1,711,385 | | | | 13,152,966 | | | | 1,531,575 | | | | 11,942,961 | | |
Redemptions | | | (6,208,293 | ) | | | (47,783,946 | ) | | | (10,137,669 | ) | | | (78,339,999 | ) | |
Net decrease | | | (2,346,205 | ) | | | (17,998,189 | ) | | | (6,505,322 | ) | | | (49,789,867 | ) | |
Class B shares | |
Subscriptions | | | 133 | | | | 1,011 | | | | 2,410 | | | | 19,341 | | |
Distributions reinvested | | | 2,611 | | | | 19,899 | | | | 4,146 | | | | 32,508 | | |
Redemptions(b) | | | (59,656 | ) | | | (457,943 | ) | | | (86,763 | ) | | | (675,142 | ) | |
Net decrease | | | (56,912 | ) | | | (437,033 | ) | | | (80,207 | ) | | | (623,293 | ) | |
Class C shares | |
Subscriptions | | | 933,341 | | | | 7,218,247 | | | | 804,466 | | | | 6,360,219 | | |
Distributions reinvested | | | 119,969 | | | | 923,171 | | | | 96,897 | | | | 754,731 | | |
Redemptions | | | (1,034,056 | ) | | | (7,936,798 | ) | | | (1,384,378 | ) | | | (10,756,621 | ) | |
Net increase (decrease) | | | 19,254 | | | | 204,620 | | | | (483,015 | ) | | | (3,641,671 | ) | |
Class R4 shares | |
Subscriptions | | | 2,424 | | | | 18,700 | | | | 314 | | | | 2,500 | | |
Distributions reinvested | | | 29 | | | | 229 | | | | 1 | | | | 9 | | |
Redemptions | | | (30 | ) | | | (238 | ) | | | — | | | | — | | |
Net increase | | | 2,423 | | | | 18,691 | | | | 315 | | | | 2,509 | | |
Class Z shares | |
Subscriptions | | | 2,778,204 | | | | 21,125,662 | | | | 1,445,948 | | | | 11,366,678 | | |
Distributions reinvested | | | 93,113 | | | | 717,607 | | | | 51,005 | | | | 397,710 | | |
Redemptions | | | (2,875,052 | ) | | | (21,939,407 | ) | | | (2,657,247 | ) | | | (20,539,446 | ) | |
Net decrease | | | (3,735 | ) | | | (96,138 | ) | | | (1,160,294 | ) | | | (8,775,058 | ) | |
Total net decrease | | | (2,385,175 | ) | | | (18,308,049 | ) | | | (8,228,523 | ) | | | (62,827,380 | ) | |
(a) Class R4 shares are based on operations from March 19, 2013 (commencement of operations) through the stated period end.
(b) Includes conversions of Class B shares to Class A shares, if any.
The accompanying Notes to Financial Statements are an integral part of this statement.
Annual Report 2014
22
Columbia California Tax-Exempt Fund
The following tables are intended to help you understand the Fund's financial performance. Certain information reflects financial results for a single share of a class held for the periods shown. Per share net investment income (loss) amounts are calculated based on average shares outstanding during the period. Total return assumes reinvestment of all dividends and distributions, if any. Total return does not reflect payment of sales charges, if any. Total return and portfolio turnover are not annualized for periods of less than one year. The portfolio turnover rate is calculated without regard to purchase and sales transactions of short-term instruments and certain derivatives, if any. If such transactions were included, the Fund's portfolio turnover rate may be higher.
| | Year Ended October 31, | |
Class A | | 2014 | | 2013 | | 2012 | | 2011 | | 2010 | |
Per share data | |
Net asset value, beginning of period | | $ | 7.54 | | | $ | 7.99 | | | $ | 7.38 | | | $ | 7.64 | | | $ | 7.30 | | |
Income from investment operations: | |
Net investment income | | | 0.31 | | | | 0.31 | | | | 0.31 | | | | 0.31 | | | | 0.32 | | |
Net realized and unrealized gain (loss) | | | 0.51 | | | | (0.45 | ) | | | 0.61 | | | | (0.12 | ) | | | 0.36 | | |
Total from investment operations | | | 0.82 | | | | (0.14 | ) | | | 0.92 | | | | 0.19 | | | | 0.68 | | |
Less distributions to shareholders: | |
Net investment income | | | (0.31 | ) | | | (0.30 | ) | | | (0.31 | ) | | | (0.31 | ) | | | (0.32 | ) | |
Net realized gains | | | (0.06 | ) | | | (0.01 | ) | | | — | | | | (0.14 | ) | | | (0.02 | ) | |
Total distributions to shareholders | | | (0.37 | ) | | | (0.31 | ) | | | (0.31 | ) | | | (0.45 | ) | | | (0.34 | ) | |
Net asset value, end of period | | $ | 7.99 | | | $ | 7.54 | | | $ | 7.99 | | | $ | 7.38 | | | $ | 7.64 | | |
Total return | | | 11.22 | % | | | (1.80 | %) | | | 12.63 | % | | | 2.84 | % | | | 9.52 | % | |
Ratios to average net assets(a) | |
Total gross expenses | | | 0.88 | % | | | 0.87 | % | | | 0.86 | % | | | 0.92 | % | | | 0.87 | % | |
Total net expenses(b) | | | 0.79 | %(c) | | | 0.78 | %(c) | | | 0.78 | %(c) | | | 0.81 | %(c) | | | 0.84 | %(c) | |
Net investment income | | | 4.05 | % | | | 3.91 | % | | | 3.97 | % | | | 4.30 | % | | | 4.25 | % | |
Supplemental data | |
Net assets, end of period (in thousands) | | $ | 359,825 | | | $ | 357,344 | | | $ | 430,657 | | | $ | 407,479 | | | $ | 259,552 | | |
Portfolio turnover | | | 14 | % | | | 14 | % | | | 14 | % | | | 28 | % | | | 12 | % | |
Notes to Financial Highlights
(a) In addition to the fees and expenses that the Fund bears directly, the Fund indirectly bears a pro rata share of the fees and expenses of any other funds in which it invests. Such indirect expenses are not included in the Fund's reported expense ratios.
(b) Total net expenses include the impact of certain fee waivers/expense reimbursements made by the Investment Manager and certain of its affiliates, if applicable.
(c) The benefits derived from expense reductions had an impact of less than 0.01%.
The accompanying Notes to Financial Statements are an integral part of this statement.
Annual Report 2014
23
Columbia California Tax-Exempt Fund
Financial Highlights (continued)
| | | Year Ended October 31, | |
Class B | | 2014 | | 2013 | | 2012 | | 2011 | | 2010 | |
Per share data | |
Net asset value, beginning of period | | $ | 7.54 | | | $ | 7.99 | | | $ | 7.38 | | | $ | 7.64 | | | $ | 7.30 | | |
Income from investment operations: | |
Net investment income | | | 0.25 | | | | 0.25 | | | | 0.25 | | | | 0.25 | | | | 0.26 | | |
Net realized and unrealized gain (loss) | | | 0.51 | | | | (0.45 | ) | | | 0.61 | | | | (0.12 | ) | | | 0.36 | | |
Total from investment operations | | | 0.76 | | | | (0.20 | ) | | | 0.86 | | | | 0.13 | | | | 0.62 | | |
Less distributions to shareholders: | |
Net investment income | | | (0.25 | ) | | | (0.24 | ) | | | (0.25 | ) | | | (0.25 | ) | | | (0.26 | ) | |
Net realized gains | | | (0.06 | ) | | | (0.01 | ) | | | — | | | | (0.14 | ) | | | (0.02 | ) | |
Total distributions to shareholders | | | (0.31 | ) | | | (0.25 | ) | | | (0.25 | ) | | | (0.39 | ) | | | (0.28 | ) | |
Net asset value, end of period | | $ | 7.99 | | | $ | 7.54 | | | $ | 7.99 | | | $ | 7.38 | | | $ | 7.64 | | |
Total return | | | 10.39 | % | | | (2.53 | %) | | | 11.78 | % | | | 2.06 | % | | | 8.71 | % | |
Ratios to average net assets(a) | |
Total gross expenses | | | 1.63 | % | | | 1.62 | % | | | 1.61 | % | | | 1.68 | % | | | 1.62 | % | |
Total net expenses(b) | | | 1.54 | %(c) | | | 1.53 | %(c) | | | 1.53 | %(c) | | | 1.58 | %(c) | | | 1.59 | %(c) | |
Net investment income | | | 3.31 | % | | | 3.13 | % | | | 3.22 | % | | | 3.53 | % | | | 3.52 | % | |
Supplemental data | |
Net assets, end of period (in thousands) | | $ | 360 | | | $ | 769 | | | $ | 1,456 | | | $ | 1,989 | | | $ | 2,095 | | |
Portfolio turnover | | | 14 | % | | | 14 | % | | | 14 | % | | | 28 | % | | | 12 | % | |
Notes to Financial Highlights
(a) In addition to the fees and expenses that the Fund bears directly, the Fund indirectly bears a pro rata share of the fees and expenses of any other funds in which it invests. Such indirect expenses are not included in the Fund's reported expense ratios.
(b) Total net expenses include the impact of certain fee waivers/expense reimbursements made by the Investment Manager and certain of its affiliates, if applicable.
(c) The benefits derived from expense reductions had an impact of less than 0.01%.
The accompanying Notes to Financial Statements are an integral part of this statement.
Annual Report 2014
24
Columbia California Tax-Exempt Fund
Financial Highlights (continued)
| | | Year Ended October 31, | |
Class C | | 2014 | | 2013 | | 2012 | | 2011 | | 2010 | |
Per share data | |
Net asset value, beginning of period | | $ | 7.54 | | | $ | 7.99 | | | $ | 7.38 | | | $ | 7.64 | | | $ | 7.30 | | |
Income from investment operations: | |
Net investment income | | | 0.28 | | | | 0.27 | | | | 0.27 | | | | 0.28 | | | | 0.28 | | |
Net realized and unrealized gain (loss) | | | 0.51 | | | | (0.44 | ) | | | 0.61 | | | | (0.13 | ) | | | 0.37 | | |
Total from investment operations | | | 0.79 | | | | (0.17 | ) | | | 0.88 | | | | 0.15 | | | | 0.65 | | |
Less distributions to shareholders: | |
Net investment income | | | (0.28 | ) | | | (0.27 | ) | | | (0.27 | ) | | | (0.27 | ) | | | (0.29 | ) | |
Net realized gains | | | (0.06 | ) | | | (0.01 | ) | | | — | | | | (0.14 | ) | | | (0.02 | ) | |
Total distributions to shareholders | | | (0.34 | ) | | | (0.28 | ) | | | (0.27 | ) | | | (0.41 | ) | | | (0.31 | ) | |
Net asset value, end of period | | $ | 7.99 | | | $ | 7.54 | | | $ | 7.99 | | | $ | 7.38 | | | $ | 7.64 | | |
Total return | | | 10.72 | % | | | (2.24 | %) | | | 12.12 | % | | | 2.37 | % | | | 9.03 | % | |
Ratios to average net assets(a) | |
Total gross expenses | | | 1.63 | % | | | 1.62 | % | | | 1.61 | % | | | 1.69 | % | | | 1.62 | % | |
Total net expenses(b) | | | 1.24 | %(c) | | | 1.23 | %(c) | | | 1.23 | %(c) | | | 1.27 | %(c) | | | 1.29 | %(c) | |
Net investment income | | | 3.59 | % | | | 3.46 | % | | | 3.52 | % | | | 3.86 | % | | | 3.79 | % | |
Supplemental data | |
Net assets, end of period (in thousands) | | $ | 41,962 | | | $ | 39,465 | | | $ | 45,680 | | | $ | 39,040 | | | $ | 32,080 | | |
Portfolio turnover | | | 14 | % | | | 14 | % | | | 14 | % | | | 28 | % | | | 12 | % | |
Notes to Financial Highlights
(a) In addition to the fees and expenses that the Fund bears directly, the Fund indirectly bears a pro rata share of the fees and expenses of any other funds in which it invests. Such indirect expenses are not included in the Fund's reported expense ratios.
(b) Total net expenses include the impact of certain fee waivers/expense reimbursements made by the Investment Manager and certain of its affiliates, if applicable.
(c) The benefits derived from expense reductions had an impact of less than 0.01%.
The accompanying Notes to Financial Statements are an integral part of this statement.
Annual Report 2014
25
Columbia California Tax-Exempt Fund
Financial Highlights (continued)
| | | Year Ended October 31, | |
Class R4 | | 2014 | | 2013(a) | |
Per share data | |
Net asset value, beginning of period | | $ | 7.55 | | | $ | 7.97 | | |
Income from investment operations: | |
Net investment income | | | 0.33 | | | | 0.20 | | |
Net realized and unrealized gain (loss) | | | 0.50 | | | | (0.42 | ) | |
Total from investment operations | | | 0.83 | | | | (0.22 | ) | |
Less distributions to shareholders: | |
Net investment income | | | (0.33 | ) | | | (0.20 | ) | |
Net realized gains | | | (0.06 | ) | | | — | | |
Total distributions to shareholders | | | (0.39 | ) | | | (0.20 | ) | |
Net asset value, end of period | | $ | 7.99 | | | $ | 7.55 | | |
Total return | | | 11.35 | % | | | (2.75 | %) | |
Ratios to average net assets(b) | |
Total gross expenses | | | 0.62 | % | | | 0.60 | %(c) | |
Total net expenses(d) | | | 0.54 | %(e) | | | 0.53 | %(c)(e) | |
Net investment income | | | 4.25 | % | | | 4.32 | %(c) | |
Supplemental data | |
Net assets, end of period (in thousands) | | $ | 22 | | | $ | 2 | | |
Portfolio turnover | | | 14 | % | | | 14 | % | |
Notes to Financial Highlights
(a) Based on operations from March 19, 2013 (commencement of operations) through the stated period end.
(b) In addition to the fees and expenses that the Fund bears directly, the Fund indirectly bears a pro rata share of the fees and expenses of any other funds in which it invests. Such indirect expenses are not included in the Fund's reported expense ratios.
(c) Annualized.
(d) Total net expenses include the impact of certain fee waivers/expense reimbursements made by the Investment Manager and certain of its affiliates, if applicable.
(e) The benefits derived from expense reductions had an impact of less than 0.01%.
The accompanying Notes to Financial Statements are an integral part of this statement.
Annual Report 2014
26
Columbia California Tax-Exempt Fund
Financial Highlights (continued)
| | | Year Ended October 31, | |
Class Z | | 2014 | | 2013 | | 2012 | | 2011 | | 2010 | |
Per share data | |
Net asset value, beginning of period | | $ | 7.55 | | | $ | 8.00 | | | $ | 7.38 | | | $ | 7.64 | | | $ | 7.30 | | |
Income from investment operations: | |
Net investment income | | | 0.33 | | | | 0.33 | | | | 0.33 | | | | 0.33 | | | | 0.33 | | |
Net realized and unrealized gain (loss) | | | 0.50 | | | | (0.45 | ) | | | 0.62 | | | | (0.13 | ) | | | 0.37 | | |
Total from investment operations | | | 0.83 | | | | (0.12 | ) | | | 0.95 | | | | 0.20 | | | | 0.70 | | |
Less distributions to shareholders: | |
Net investment income | | | (0.33 | ) | | | (0.32 | ) | | | (0.33 | ) | | | (0.32 | ) | | | (0.34 | ) | |
Net realized gains | | | (0.06 | ) | | | (0.01 | ) | | | — | | | | (0.14 | ) | | | (0.02 | ) | |
Total distributions to shareholders | | | (0.39 | ) | | | (0.33 | ) | | | (0.33 | ) | | | (0.46 | ) | | | (0.36 | ) | |
Net asset value, end of period | | $ | 7.99 | | | $ | 7.55 | | | $ | 8.00 | | | $ | 7.38 | | | $ | 7.64 | | |
Total return | | | 11.35 | % | | | (1.54 | %) | | | 13.05 | % | | | 3.05 | % | | | 9.78 | % | |
Ratios to average net assets(a) | |
Total gross expenses | | | 0.63 | % | | | 0.62 | % | | | 0.61 | % | | | 0.70 | % | | | 0.63 | % | |
Total net expenses(b) | | | 0.54 | %(c) | | | 0.53 | %(c) | | | 0.53 | %(c) | | | 0.59 | %(c) | | | 0.60 | %(c) | |
Net investment income | | | 4.30 | % | | | 4.16 | % | | | 4.22 | % | | | 4.57 | % | | | 4.49 | % | |
Supplemental data | |
Net assets, end of period (in thousands) | | $ | 75,032 | | | $ | 70,850 | | | $ | 84,354 | | | $ | 76,568 | | | $ | 94,541 | | |
Portfolio turnover | | | 14 | % | | | 14 | % | | | 14 | % | | | 28 | % | | | 12 | % | |
Notes to Financial Highlights
(a) In addition to the fees and expenses that the Fund bears directly, the Fund indirectly bears a pro rata share of the fees and expenses of any other funds in which it invests. Such indirect expenses are not included in the Fund's reported expense ratios.
(b) Total net expenses include the impact of certain fee waivers/expense reimbursements made by the Investment Manager and certain of its affiliates, if applicable.
(c) The benefits derived from expense reductions had an impact of less than 0.01%.
The accompanying Notes to Financial Statements are an integral part of this statement.
Annual Report 2014
27
Columbia California Tax-Exempt Fund
Notes to Financial Statements
October 31, 2014
Note 1. Organization
Columbia California Tax-Exempt Fund (the Fund), a series of Columbia Funds Series Trust I (the Trust), is a non-diversified fund. The Trust is registered under the Investment Company Act of 1940, as amended (the 1940 Act), as an open-end management investment company organized as a Massachusetts business trust.
Fund Shares
The Trust may issue an unlimited number of shares (without par value). The Fund offers Class A, Class B, Class C, Class R4 and Class Z shares. Although all share classes generally have identical voting, dividend and liquidation rights, each share class votes separately when required by the Trust's organizational documents or by law. Different share classes pay different distribution amounts to the extent the expenses of such share classes differ, and distributions in liquidation will be proportional to the net asset value of each share class. Each share class has its own expense structure and sales charges.
Class A shares are subject to a maximum front-end sales charge of 4.75% based on the initial investment amount. Class A shares purchased without an initial sales charge in accounts aggregating $1 million to $50 million at the time of purchase are subject to a contingent deferred sales charge (CDSC) if the shares are sold within 18 months of purchase, charged as follows: 1.00% CDSC if redeemed within 12 months of purchase, and 0.50% CDSC if redeemed more than 12, but less than 18, months after purchase.
Class B shares may be subject to a maximum CDSC of 5.00% based upon the holding period after purchase. Class B shares will generally convert to Class A shares eight years after purchase. The Fund no longer accepts investments by new or existing investors in the Fund's Class B shares, except in connection with the reinvestment of any dividend and/or capital gain distributions in Class B shares of the Fund and exchanges by existing Class B shareholders of certain other funds within the Columbia Family of Funds.
Class C shares are subject to a 1.00% CDSC on shares redeemed within one year of purchase.
Class R4 shares are not subject to sales charges and are generally available only to omnibus retirement plans and certain investors as described in the Fund's prospectus.
Class Z shares are not subject to sales charges and are available only to eligible investors, which are subject to different investment minimums as described in the Fund's prospectus.
Note 2. Summary of Significant Accounting Policies
Basis of Preparation
The Fund is an investment company that applies the accounting and reporting guidance in the Financial Accounting Standards Board (FASB) Accounting Standards Codification Topic 946, Financial Services — Investment Companies (ASC 946). The financial statements are prepared in accordance with U.S. generally accepted accounting principles (GAAP) which requires management to make certain estimates and assumptions that affect the reported amounts of assets and liabilities, the disclosure of contingent assets and liabilities at the date of the financial statements and the reported amounts of income and expenses during the reporting period. Actual results could differ from those estimates.
The following is a summary of significant accounting policies followed by the Fund in the preparation of its financial statements.
Security Valuation
Debt securities generally are valued by pricing services approved by the Board of Trustees (the Board) based upon market transactions for normal, institutional-size trading units of similar securities. The services may use various pricing techniques that take into account, as applicable, factors such as yield, quality, coupon rate, maturity, type of issue, trading characteristics and other data, as well as broker quotes. Debt securities for which quotations are readily available may also be valued based upon an over-the-counter or exchange bid quotation.
Investments in open-end investment companies, including money market funds, are valued at their net asset value.
Investments for which market quotations are not readily available, or that have quotations which management believes are not reliable, are valued at fair value as determined in good faith under procedures established by and under the general supervision of the Board. If a security or class of securities (such as foreign securities) is valued at fair value, such value is likely to be different from the quoted or published price for the security.
The determination of fair value often requires significant judgment. To determine fair value, management may use assumptions including but not limited to future cash flows and estimated risk premiums. Multiple inputs from various sources may be used to determine fair value.
Annual Report 2014
28
Columbia California Tax-Exempt Fund
Notes to Financial Statements (continued)
October 31, 2014
Security Transactions
Security transactions are accounted for on the trade date. Cost is determined and gains (losses) are based upon the specific identification method for both financial statement and federal income tax purposes.
Income Recognition
Interest income is recorded on an accrual basis. Market premiums and discounts, including original issue discounts, are amortized and accreted, respectively, over the expected life of the security on all debt securities, unless otherwise noted.
The Fund may place a debt security on non-accrual status and reduce related interest income when it becomes probable that the interest will not be collected and the amount of uncollectible interest can be reasonably estimated. A defaulted debt security is removed from non-accrual status when the issuer resumes interest payments or when collectability of interest is reasonably assured.
Dividend income is recorded on the ex-dividend date.
Expenses
General expenses of the Trust are allocated to the Fund and other funds of the Trust based upon relative net assets or other expense allocation methodologies determined by the nature of the expense. Expenses directly attributable to the Fund are charged to the Fund. Expenses directly attributable to a specific class of shares are charged to that share class.
Determination of Class Net Asset Value
All income, expenses (other than class-specific expenses, which are charged to that share class, as shown in the Statement of Operations) and realized and unrealized gains (losses) are allocated to each class of the Fund on a daily basis, based on the relative net assets of each class, for purposes of determining the net asset value of each class.
Federal Income Tax Status
The Fund intends to qualify each year as a regulated investment company under Subchapter M of the Internal Revenue Code, as amended, and will distribute substantially all of its tax exempt and taxable income (including net short-term capital gains), if any, for its tax year, and as such will not be subject to federal income taxes. In addition, the Fund intends to distribute in each calendar year substantially all of its net investment income, capital gains and certain other amounts, if any, such that the Fund should not be subject to federal excise tax. Therefore, no federal income or excise tax provision is recorded.
Distributions to Shareholders
Distributions from net investment income, if any, are declared daily and paid monthly. Net realized capital gains, if any, are
distributed at least annually. Income distributions and capital gain distributions are determined in accordance with federal income tax regulations, which may differ from GAAP.
Guarantees and Indemnifications
Under the Trust's organizational documents and, in some cases, by contract, its officers and trustees are indemnified against certain liabilities arising out of the performance of their duties to the Trust or its funds. In addition, certain of the Fund's contracts with its service providers contain general indemnification clauses. The Fund's maximum exposure under these arrangements is unknown since the amount of any future claims that may be made against the Fund cannot be determined, and the Fund has no historical basis for predicting the likelihood of any such claims.
Note 3. Fees and Compensation Paid to Affiliates
Investment Management Fees
Under an Investment Management Services Agreement, Columbia Management Investment Advisers, LLC (the Investment Manager), a wholly-owned subsidiary of Ameriprise Financial, Inc. (Ameriprise Financial), determines which securities will be purchased, held or sold. The investment management fee is an annual fee that is equal to a percentage of the Fund's average daily net assets that declines from 0.40% to 0.27% as the Fund's net assets increase. The effective investment management fee rate for the year ended October 31, 2014 was 0.40% of the Fund's average daily net assets.
Administration Fees
Under an Administrative Services Agreement, the Investment Manager also serves as the Fund Administrator. The Fund pays the Fund Administrator an annual fee for administration and accounting services equal to a percentage of the Fund's average daily net assets that declines from 0.07% to 0.04% as the Fund's net assets increase. The effective administration fee rate for the year ended October 31, 2014 was 0.07% of the Fund's average daily net assets.
Compensation of Board Members
Board members are compensated for their services to the Fund as disclosed in the Statement of Operations. The Trust's eligible Trustees may participate in a Deferred Compensation Plan (the Plan) which may be terminated at any time. Obligations of the Plan will be paid solely out of the Fund's assets.
Compensation of Chief Compliance Officer
The Board has appointed a Chief Compliance Officer to the Fund in accordance with federal securities regulations. The
Annual Report 2014
29
Columbia California Tax-Exempt Fund
Notes to Financial Statements (continued)
October 31, 2014
Fund pays its pro-rata share of the expenses associated with the Chief Compliance Officer. The Fund's expenses for the Chief Compliance Officer will not exceed $15,000 per year.
Transfer Agent Fees
Under a Transfer and Dividend Disbursing Agent Agreement, Columbia Management Investment Services Corp. (the Transfer Agent), an affiliate of the Investment Manager and a wholly-owned subsidiary of Ameriprise Financial, is responsible for providing transfer agency services to the Fund. The Transfer Agent has contracted with Boston Financial Data Services (BFDS) to serve as sub-transfer agent.
Effective November 1, 2014, the Transfer Agent receives a monthly transfer agency fee based on the number or the average value of accounts, depending on the type of account. Prior to November 1, 2014, the Transfer Agent received a monthly account-based service fee based on the number of open accounts. In addition, the Transfer Agent also receives sub-transfer agency fees based on a percentage of the average aggregate value of the Fund's shares maintained in omnibus accounts (other than omnibus accounts for which American Enterprise Investment Services Inc. is the broker of record or accounts where the beneficial shareholder is a customer of Ameriprise Financial Services, Inc., which receive a per account fee). The Transfer Agent pays the fees of BFDS for services as sub-transfer agent and is not entitled to reimbursement for such fees from the Fund (with the exception of out-of-pocket fees).
The Transfer Agent also receives compensation from the Fund for various shareholder services and reimbursements for certain out-of-pocket fees.
For the year ended October 31, 2014, the Fund's effective transfer agent fee rates as a percentage of average daily net assets of each class were as follows:
Class A | | | 0.12 | % | |
Class B | | | 0.12 | | |
Class C | | | 0.12 | | |
Class R4 | | | 0.13 | | |
Class Z | | | 0.12 | | |
The Fund and certain other associated investment companies, have severally, but not jointly, guaranteed the performance and observance of all the terms and conditions of a lease entered into by Seligman Data Corp. (SDC), the former transfer agent, including the payment of rent by SDC (the Guaranty). SDC was the legacy Seligman funds' former transfer agent.
The lease and the Guaranty expire in January 2019. At October 31, 2014, the Fund's total potential future obligation over the life of the Guaranty is $54,036. The liability remaining at October 31, 2014 for non-recurring charges
associated with the lease amounted to $30,759 and is recorded as a part of the payable for other expenses in the Statement of Assets and Liabilities.
An annual minimum account balance fee of $20 may apply to certain accounts with a value below the applicable share class's initial minimum investment requirements to reduce the impact of small accounts on transfer agent fees. These minimum account balance fees are remitted to the Fund and recorded as part of expense reductions in the Statement of Operations. For the year ended October 31, 2014, these minimum account balance fees reduced total expenses of the Fund by $640.
Distribution and Service Fees
The Fund has an agreement with Columbia Management Investment Distributors, Inc. (the Distributor), an affiliate of the Investment Manager and a wholly-owned subsidiary of Ameriprise Financial, for distribution and shareholder services. The Board has approved, and the Fund has adopted, distribution and shareholder service plans (the Plans) applicable to certain share classes, which set the distribution and service fees for the Fund. These fees are calculated daily and are intended to compensate the Distributor and/or eligible selling and/or servicing agents for selling shares of the Fund and providing services to investors.
Under the Plans, the Fund pays a monthly service fee to the Distributor at the maximum annual rate of 0.25% of the average daily net assets attributable to Class A, Class B and Class C shares of the Fund. Also under the Plans, the Fund pays a monthly distribution fee to the Distributor at the maximum annual rate of 0.75% of the average daily net assets attributable to Class B and Class C shares only.
The Distributor has voluntarily agreed to waive a portion of the distribution fee for Class C shares so that the distribution fee does not exceed 0.45% annually of the average daily net assets attributable to Class C shares. This arrangement may be modified or terminated by the Distributor at any time.
Sales Charges
Sales charges, including front-end charges and CDSCs, received by the Distributor for distributing Fund shares were $138,190 for Class A, $507 for Class B and $1,937 for Class C shares for the year ended October 31, 2014.
Expenses Waived/Reimbursed by the Investment Manager and its Affiliates
The Investment Manager and certain of its affiliates have contractually agreed to waive fees and/or reimburse expenses (excluding certain fees and expenses described below) for the periods disclosed below, unless sooner terminated at the sole discretion of the Board, so that the Fund's net operating
Annual Report 2014
30
Columbia California Tax-Exempt Fund
Notes to Financial Statements (continued)
October 31, 2014
expenses, after giving effect to fees waived/expenses reimbursed and any balance credits and/or overdraft charges from the Fund's custodian, do not exceed the following annual rates as a percentage of the class' average daily net assets:
| | | March 1, 2014
through
February 28, 2015 | | Prior to
March 1, 2014 | |
Class A | | | 0.79 | % | | | 0.78 | % | |
Class B | | | 1.54 | | | | 1.53 | | |
Class C | | | 1.54 | | | | 1.53 | | |
Class R4 | | | 0.54 | | | | 0.53 | | |
Class Z | | | 0.54 | | | | 0.53 | | |
Under the agreement governing these fee waivers and/or expense reimbursement arrangements, the following fees and expenses are excluded from the waiver/reimbursement commitment, and therefore will be paid by the Fund, if applicable: taxes (including foreign transaction taxes), expenses associated with investments in affiliated and non-affiliated pooled investment vehicles (including mutual funds and exchange-traded funds), transaction costs and brokerage commissions, costs related to any securities lending program, dividend expenses associated with securities sold short, inverse floater program fees and expenses, transaction charges and interest on borrowed money, interest, extraordinary expenses and any other expenses the exclusion of which is specifically approved by the Board. This agreement may be modified or amended only with approval from all parties. Class C distribution fees waived by the Distributor, as discussed above, are in addition to the waiver/reimbursement commitment under the agreement.
Note 4. Federal Tax Information
The timing and character of income and capital gain distributions are determined in accordance with income tax regulations, which may differ from GAAP because of temporary or permanent book to tax differences.
At October 31, 2014, these differences are primarily due to differing treatment for principal and/or interest from fixed income securities, Trustees' deferred compensation, distributions and tax straddles. To the extent these differences are permanent, reclassifications are made among the components of the Fund's net assets in the Statement of Assets and Liabilities. Temporary differences do not require reclassifications. In the Statement of Assets and Liabilities the following reclassifications were made:
Accumulated net realized gain | | $ | 3 | | |
Paid-in capital | | | (3 | ) | |
Net investment income (loss) and net realized gains (losses), as disclosed in the Statement of Operations, and net assets were not affected by this reclassification.
The tax character of distributions paid during the years indicated was as follows:
Year Ended October 31, | | 2014 | | 2013 | |
Ordinary income | | $ | 32,140 | | | $ | 42,601 | | |
Tax-exempt income | | | 18,879,462 | | | | 20,549,016 | | |
Long-term capital gains | | | 3,695,446 | | | | 361,431 | | |
Total | | $ | 22,607,048 | | | $ | 20,953,048 | | |
Short-term capital gain distributions, if any, are considered ordinary income distributions for tax purposes.
At October 31, 2014, the components of distributable earnings on a tax basis were as follows:
Undistributed tax-exempt income | | $ | 1,728,633 | | |
Undistributed long-term capital gains | | | 1,951,876 | | |
Net unrealized appreciation | | | 52,832,904 | | |
At October 31, 2014, the cost of investments for federal income tax purposes was $419,118,088 and the aggregate gross unrealized appreciation and depreciation based on that cost was:
Unrealized appreciation | | $ | 52,832,904 | | |
Unrealized depreciation | | | — | | |
Net unrealized appreciation | | | 52,832,904 | | |
Management of the Fund has concluded that there are no significant uncertain tax positions in the Fund that would require recognition in the financial statements. However, management's conclusion may be subject to review and adjustment at a later date based on factors including, but not limited to, new tax laws, regulations, and administrative interpretations (including relevant court decisions). Generally, the Fund's federal tax returns for the prior three fiscal years remain subject to examination by the Internal Revenue Service.
Note 5. Portfolio Information
The cost of purchases and proceeds from sales of securities, excluding short-term obligations and certain derivatives, if any, aggregated to $65,564,240 and $83,754,533, respectively, for the year ended October 31, 2014. The amount of purchase and sale activity impacts the portfolio turnover rate reported in the Financial Highlights.
Note 6. Shareholder Concentration
At October 31, 2014, one unaffiliated shareholder of record owned 23.0% of the outstanding shares of the Fund in one or more accounts. The Fund has no knowledge about whether any
Annual Report 2014
31
Columbia California Tax-Exempt Fund
Notes to Financial Statements (continued)
October 31, 2014
portion of those shares was owned beneficially. Affiliated shareholders of record owned 26.4% of the outstanding shares of the Fund in one or more accounts. Subscription and redemption activity by concentrated accounts may have a significant effect on the operations of the Fund.
Note 7. Line of Credit
The Fund has entered into a revolving credit facility with a syndicate of banks led by JPMorgan Chase Bank N.A. (JPMorgan) whereby the Fund may borrow for the temporary funding of shareholder redemptions or for other temporary or emergency purposes. The credit facility agreement, as amended, which is a collective agreement between the Fund and certain other funds managed by the Investment Manager, severally and not jointly, permits collective borrowings up to $500 million. Interest is charged to each participating fund based on its borrowings at a rate equal to the higher of (i) the overnight federal funds rate plus 1.00% or (ii) the one-month LIBOR rate plus 1.00%. Each borrowing under the credit facility matures no later than 60 days after the date of borrowing. Effective December 10, 2013, the Fund also pays a commitment fee equal to its pro rata share of the amount of the credit facility at a rate of 0.075% per annum. Prior to December 10, 2013, the commitment fee was charged at the annual rate of 0.08% per annum. The commitment fee is included in other expenses in the Statement of Operations.
Effective December 9, 2014, the Fund extended its revolving credit facility with JPMorgan. The credit facility agreement, as amended, permits collective borrowings up to $550 million under the same terms and interest rates as described above.
The Fund had no borrowings during the year ended October 31, 2014.
Note 8. Significant Risks
Credit Risk
Credit risk is the risk that the value of debt securities in the Fund's portfolio may decline because the issuer may default and fail to pay interest or repay principal when due. Rating agencies assign credit ratings to debt securities to indicate their credit risk. Lower rated or unrated debt securities held by the Fund may present increased credit risk as compared to higher-rated debt securities.
Interest Rate Risk
Interest rate risk is the risk of losses attributable to changes in interest rates. In general, if prevailing interest rates rise, the values of debt securities tend to fall, and if interest rates fall, the values of debt securities tend to rise. Actions by governments and central banking authorities can result in increases in interest rates. Increasing interest rates may
negatively affect the value of debt securities held by the Fund, resulting in a negative impact on the Fund's performance and net asset value per share. In general, the longer the maturity or duration of a debt security, the greater its sensitivity to changes in interest rates.
Liquidity Risk
Liquidity risk is the risk associated with a lack of marketability of investments which may make it difficult to sell the investment at a desirable time or price. Changing regulatory, market or other conditions or environments (for example, the interest rate or credit environments) may adversely affect the liquidity of the Fund's investments. The Fund may have to accept a lower selling price for the holding, sell other investments, or forego another, more appealing investment opportunity. Generally, the less liquid the market at the time the Fund sells a portfolio investment, the greater the risk of loss or decline of value to the Fund. A less liquid market can lead to an increase in Fund redemptions, which may negatively impact Fund performance and net asset value per share, including, for example, if the Fund is forced to sell securities in a down market.
Geographic Concentration Risk
Because state-specific tax-exempt funds invest primarily in the municipal securities issued by the state and political sub-divisions of the state, the Fund will be particularly affected by political and economic conditions and developments in the state in which it invests. The Fund may, therefore, have a greater risk than that of a municipal bond fund which is more geographically diversified. The value of the municipal securities owned by the Fund also may be adversely affected by future changes in federal or state income tax laws.
Non-Diversification Risk
A non-diversified fund is permitted to invest a greater percentage of its total assets in fewer issuers than a diversified fund. The Fund may, therefore, have a greater risk of loss from a few issuers than a similar fund that invests more broadly.
Note 9. Subsequent Events
Management has evaluated the events and transactions that have occurred through the date the financial statements were issued. Other than as noted in Notes 3 and 7 above, there were no items requiring adjustment of the financial statements or additional disclosure.
Note 10. Information Regarding Pending and Settled Legal Proceedings
In December 2005, without admitting or denying the allegations, American Express Financial Corporation (AEFC,
Annual Report 2014
32
Columbia California Tax-Exempt Fund
Notes to Financial Statements (continued)
October 31, 2014
which is now known as Ameriprise Financial, Inc. (Ameriprise Financial)) entered into settlement agreements with the Securities and Exchange Commission (SEC) and Minnesota Department of Commerce (MDOC) related to market timing activities. As a result, AEFC was censured and ordered to cease and desist from committing or causing any violations of certain provisions of the Investment Advisers Act of 1940, the Investment Company Act of 1940, and various Minnesota laws. AEFC agreed to pay disgorgement of $10 million and civil money penalties of $7 million. AEFC also agreed to retain an independent distribution consultant to assist in developing a plan for distribution of all disgorgement and civil penalties ordered by the SEC in accordance with various undertakings detailed at www.sec.gov/litigation/admin/ia-2451.pdf. Ameriprise Financial and its affiliates have cooperated with the SEC and the MDOC in these legal proceedings, and have made regular reports to the Funds' Boards of Trustees.
Ameriprise Financial and certain of its affiliates have historically been involved in a number of legal, arbitration and regulatory proceedings, including routine litigation, class actions, and governmental actions, concerning matters arising in connection with the conduct of their business activities. Ameriprise Financial believes that the Funds are not currently the subject of, and that neither Ameriprise Financial nor any of its affiliates are the subject of, any pending legal, arbitration or regulatory proceedings that are likely to have a material adverse effect on the Funds or the ability of Ameriprise Financial or its affiliates to perform under their contracts with the Funds. Ameriprise Financial is required to make quarterly (10-Q), annual (10-K) and, as necessary, 8-K filings with the Securities and Exchange Commission on legal and regulatory matters that relate to Ameriprise Financial and its affiliates. Copies of these filings may be obtained by accessing the SEC website at www.sec.gov.
There can be no assurance that these matters, or the adverse publicity associated with them, will not result in increased fund redemptions, reduced sale of fund shares or other adverse consequences to the Funds. Further, although we believe proceedings are not likely to have a material adverse effect on the Funds or the ability of Ameriprise Financial or its affiliates to perform under their contracts with the Funds, these proceedings are subject to uncertainties and, as such, we are unable to estimate the possible loss or range of loss that may result. An adverse outcome in one or more of these proceedings could result in adverse judgments, settlements, fines, penalties or other relief that could have a material adverse effect on the consolidated financial condition or results of operations of Ameriprise Financial.
Annual Report 2014
33
Columbia California Tax-Exempt Fund
Report of Independent Registered Public Accounting Firm
To the Trustees of Columbia Funds Series Trust I and the Shareholders of
Columbia California Tax-Exempt Fund
In our opinion, the accompanying statement of assets and liabilities, including the portfolio of investments, and the related statements of operations and of changes in net assets and the financial highlights present fairly, in all material respects, the financial position of Columbia California Tax-Exempt Fund (the "Fund", a series of Columbia Funds Series Trust I) at October 31, 2014, and the results of its operations, the changes in its net assets and the financial highlights for each of the periods indicated, in conformity with accounting principles generally accepted in the United States of America. These financial statements and financial highlights (hereafter referred to as "financial statements") are the responsibility of the Fund's management. Our responsibility is to express an opinion on these financial statements based on our audits. We conducted our audits of these financial statements in accordance with the standards of the Public Company Accounting Oversight Board (United States). Those standards require that we plan and perform the audit to obtain reasonable assurance about whether the financial statements are free of material misstatement. An audit includes examining, on a test basis, evidence supporting the amounts and disclosures in the financial statements, assessing the accounting principles used and significant estimates made by management, and evaluating the overall financial statement presentation. We believe that our audits, which included confirmation of securities at October 31, 2014 by correspondence with the custodian and brokers, provide a reasonable basis for our opinion.
PricewaterhouseCoopers LLP
Minneapolis, Minnesota
December 22, 2014
Annual Report 2014
34
Columbia California Tax-Exempt Fund
Federal Income Tax Information
(Unaudited)
The Fund hereby designates the following tax attributes for the fiscal year ended October 31, 2014. Shareholders will be notified in early 2015 of the amounts for use in preparing 2014 income tax returns.
Tax Designations:
Capital Gain Dividend | | $ | 2,206,883 | | |
| Exempt-Interest Dividends | | | 99.83 | % | |
Capital Gain Dividend. The Fund designates as a capital gain dividend the amount reflected above, or if subsequently determined to be different, the net capital gain of such fiscal period.
Exempt-Interest Dividends. The percentage of net investment income distributed during the fiscal year that qualifies as exempt-interest dividends for federal income tax purposes. A portion of the income may be subject to federal alternative minimum tax.
Annual Report 2014
35
Columbia California Tax-Exempt Fund
The Trustees serve terms of indefinite duration. The names, addresses and birth years of the Trustees and Officers of the Funds in Columbia Funds Series Trust I, the year each was first elected or appointed to office, their principal business occupations during at least the last five years, the number of Funds overseen by each Trustee and other directorships they hold are shown below. Each officer listed below serves as an officer of each Fund in Columbia Funds Series Trust I.
Independent Trustees
Name, Address and Year of Birth,
Position with Funds, Year First
Elected or Appointed to Office | | Principal Occupation(s) During Past Five Years, Number of Funds in Columbia
Funds Complex Overseen by Trustee, Other Directorships Held | |
Douglas A. Hacker (Born 1955)
c/o Columbia Management
Investment Advisers, LLC
225 Franklin Street
Boston, MA 02110
Trustee (since 1996) and Chairman of the Board (since 2014) | | Independent business executive since May 2006; Executive Vice President — Strategy of United Airlines from December 2002 to May 2006; President of UAL Loyalty Services (airline marketing company) from September 2001 to December 2002; Executive Vice President and Chief Financial Officer of United Airlines from July 1999 to September 2001. Oversees 56; Spartan Stores, Inc. (food distributor); Nash Finch Company (food distributor) from 2005 to 2013; Aircastle Limited (aircraft leasing); and SeaCube Container Leasing Ltd. (container leasing) from 2010 to 2013 | |
Janet Langford Kelly (Born 1957)
c/o Columbia Management
Investment Advisers, LLC
225 Franklin Street
Boston, MA 02110
Trustee (since 1996) | | Senior Vice President, General Counsel and Corporate Secretary, ConocoPhillips (integrated energy company) since September 2007; Deputy General Counsel — Corporate Legal Services, ConocoPhillips from August 2006 to August 2007; Partner, Zelle, Hofmann, Voelbel, Mason & Gette LLP (law firm) from March 2005 to July 2006; Adjunct Professor of Law, Northwestern University from September 2004 to June 2006; Director, UAL Corporation (airline) from February 2006 to July 2006; Chief Administrative Officer and Senior Vice President, Kmart Holding Corporation (consumer goods) from September 2003 to March 2004. Oversees 56; None | |
Nancy T. Lukitsh (Born 1956)
c/o Columbia Management
Investment Advisers, LLC
225 Franklin Street
Boston, MA 02110
Trustee (since 2011) | | Senior Vice President, Partner and Director of Marketing, Wellington Management Company, LLP (investment adviser) from 1997 to 2010; Chair, Wellington Management Investment Portfolios (commingled non-U.S. investment pools) from 2007 to 2010; Director, Wellington Trust Company, NA and other Wellington affiliates from 1997 to 2010. Oversees 56; None | |
William E. Mayer (Born 1940)
c/o Columbia Management
Investment Advisers, LLC
225 Franklin Street
Boston, MA 02110
Trustee (since 1994) | | Partner, Park Avenue Equity Partners (private equity) since February 1999; Dean and Professor, College of Business and Management, University of Maryland from 1992 to 1996. Oversees 56; DynaVox Inc. (speech creation); Lee Enterprises (print media); WR Hambrecht + Co. (financial service provider) from 2000 to 2012; BlackRock Kelso Capital Corporation (investment company); Premier, Inc. (healthcare) | |
David M. Moffett (Born 1952)
c/o Columbia Management
Investment Advisers, LLC
225 Franklin Street
Boston, MA 02110
Trustee (since 2011) | | Retired. Chief Executive Officer, Federal Home Loan Mortgage Corporation from 2008 to 2009; Senior Adviser, Global Financial Services Group, Carlyle Group, Inc. from 2007 to 2008; Vice Chairman and Chief Financial Officer, U.S. Bancorp from 1993 to 2007. Oversees 56; CIT Group Inc. (commercial and consumer finance); eBay Inc. (online trading community); MBIA Inc. (financial service provider); E.W. Scripps Co. (print and television media), Building Materials Holding Corp. (building materials and construction services); Genworth Financial, Inc. (financial and insurance products and services); and University of Oklahoma Foundation | |
Charles R. Nelson (Born 1942)
c/o Columbia Management
Investment Advisers, LLC
225 Franklin Street
Boston, MA 02110
Trustee (since 1981) | | Retired. Professor Emeritus, University of Washington since 2011; Professor of Economics, University of Washington from 1976 to 2011; Ford and Louisa Van Voorhis Professor of Political Economy, University of Washington from 1993 to 2011; Adjunct Professor of Statistics, University of Washington from 1980 to 2011; Associate Editor, Journal of Money, Credit and Banking from September 1993 to 2008; consultant on econometric and statistical matters. Oversees 56; None | |
John J. Neuhauser (Born 1943)
c/o Columbia Management
Investment Advisers, LLC
225 Franklin Street
Boston, MA 02110
Trustee (since 1984) | | President, Saint Michael's College since August 2007; Director or Trustee of several non-profit organizations, including Fletcher Allen Health Care, Inc.; Academic Vice President and Dean of Faculties, Boston College from August 1999 to October 2005; University Professor, Boston College from November 2005 to August 2007. Oversees 56; Liberty All-Star Equity Fund and Liberty All-Star Growth Fund (closed-end funds) | |
Patrick J. Simpson (Born 1944)
c/o Columbia Management
Investment Advisers, LLC
225 Franklin Street
Boston, MA 02110
Trustee (since 2000) | | Partner, Perkins Coie LLP (law firm). Oversees 56; None | |
Annual Report 2014
36
Columbia California Tax-Exempt Fund
Trustees and Officers (continued)
Independent Trustees (continued)
Name, Address and Year of Birth,
Position with Funds, Year First
Elected or Appointed to Office | | Principal Occupation(s) During Past Five Years, Number of Funds in Columbia
Funds Complex Overseen by Trustee, Other Directorships Held | |
Anne-Lee Verville (Born 1945)
c/o Columbia Management
Investment Advisers, LLC
225 Franklin Street
Boston, MA 02110
Trustee (since 1998) | | Retired. General Manager — Global Education Industry from 1994 to 1997, President — Application Systems Division from 1991 to 1994, Chief Financial Officer — US Marketing & Services from 1988 to 1991, and Chief Information Officer from 1987 to 1988, IBM Corporation (computer and technology). Oversees 56; Enesco Group, Inc. (producer of giftware and home and garden decor products) from 2001 to 2006 | |
Interested Trustee
Name, Address and Year of Birth,
Position with Funds, Year First
Elected or Appointed to Office | | Principal Occupation(s) During Past Five Years, Number of Funds in Columbia
Funds Complex Overseen by Trustee, Other Directorships Held | |
William F. Truscott (Born 1960)
53600 Ameriprise Financial Center
Minneapolis, MN 55474
Trustee (since 2012) | | Chairman of the Board and President, Columbia Management Investment Advisers, LLC since May 2010 and February 2012, respectively (previously President and Chief Investment Officer from 2001 to April 2010); Chief Executive Officer, Global Asset Management, Ameriprise Financial, Inc. since September 2012 (previously, Chief Executive Officer, U.S. Asset Management & President, Annuities from May 2010 to September 2012 and President — U.S. Asset Management and Chief Investment Officer from 2005 to April 2010); Director and Chief Executive Officer, Columbia Management Investment Distributors, Inc. since May 2010 and February 2012, respectively (previously Chairman of the Board and Chief Executive Officer from 2006 to April 2010); Chairman of the Board and Chief Executive Officer, RiverSource Distributors, Inc. since 2006; President and Chief Executive Officer, Ameriprise Certificate Company from 2006 to August 2012; Director, Threadneedle Asset Management Holdings, SARL since 2014. Oversees 188; Chairman of the Board, Columbia Management Investment Advisers, LLC since May 2010; Director, Columbia Management Investment Distributors, Inc. since May 2010; Director, Ameriprise Certificate Company from 2006 to January 2013 | |
The Statement of Additional Information has additional information about the Fund's Board members and is available, without charge, upon request by calling 800.345.6611; contacting your financial intermediary; or visiting columbiamanagement.com.
The Board has appointed officers who are responsible for day-to-day business decisions based on policies it has established. The officers serve at the pleasure of the Board. In addition to Mr. Truscott, who is Senior Vice President, the Funds' other officers are:
Officers
Name,
Address and
Year of Birth | | Position and Year
First Appointed to
Position for any Fund
in the Columbia
Funds Complex or a
Predecessor Thereof | | Principal Occupation(s) During Past Five Years | |
J. Kevin Connaughton
225 Franklin Street
Boston, MA 02110
Born 1964 | | President and Principal Executive Officer (2009) | | Managing Director and General Manager — Mutual Fund Products, Columbia Management Investment Advisers, LLC since May 2010; and President, Columbia Funds since 2009; Managing Director, Columbia Management Advisors, LLC from December 2004 to April 2010; Senior Vice President and Chief Financial Officer, Columbia Funds from June 2008 to January 2009; and senior officer of Columbia Funds and affiliated funds since 2003. | |
Michael G. Clarke
225 Franklin Street
Boston, MA 02110
Born 1969 | | Treasurer (2011) and Chief Financial Officer (2009) | | Vice President — Mutual Fund Administration, Columbia Management Investment Advisers, LLC since May 2010; Managing Director of Fund Administration, Columbia Management Advisors, LLC, from September 2004 to April 2010; and senior officer of Columbia Funds and affiliated funds since 2002. | |
Annual Report 2014
37
Columbia California Tax-Exempt Fund
Trustees and Officers (continued)
Officers (continued)
Name,
Address and
Year of Birth | | Position and Year
First Appointed to
Position for any Fund
in the Columbia
Funds Complex or a
Predecessor Thereof | | Principal Occupation(s) During Past Five Years | |
Scott R. Plummer
5228 Ameriprise
Financial Center
Minneapolis, MN 55474
Born 1959 | | Senior Vice President (2006), Chief Legal Officer (2006) and Assistant Secretary (2011) | | Senior Vice President and Assistant General Counsel — Global Asset Management, Ameriprise Financial since February 2014 (previously, Senior Vice President and Lead Chief Counsel — Asset Management, 2012 – February 2014; Vice President and Lead Chief Counsel — Asset Management, 2010 – 2012; and Vice President and Chief Counsel — Asset Management, 2005 – 2010); Senior Vice President, Chief Legal Officer and Assistant Secretary, Columbia Management Investment Advisers, LLC since June 2005; Vice President, Chief Counsel and Assistant Secretary, Columbia Management Investment Distributors, Inc. since 2008; Vice President, General Counsel and Secretary, Ameriprise Certificate Company since 2005; Chief Counsel, RiverSource Distributors, Inc. since 2006; senior officer of Columbia Funds and affiliated funds since 2006. | |
Thomas P. McGuire
225 Franklin Street
Boston, MA 02110
Born 1972 | | Chief Compliance Officer (2012) | | Vice President — Asset Management Compliance, Ameriprise Financial, Inc. since May 2010; Chief Compliance Officer, Ameriprise Certificate Company since September 2010; Compliance Executive, Bank of America from 2005 to April 2010. | |
Colin Moore
225 Franklin Street
Boston, MA 02110
Born 1958 | | Senior Vice President (2010) | | Executive Vice President and Global Chief Investment Officer, Ameriprise Financial, Inc. since July 2013; Director and Global Chief Investment Officer, Columbia Management Investment Advisers, LLC since May 2010; Manager, Managing Director and Chief Investment Officer, Columbia Management Advisors, LLC from 2007 to April 2010. | |
Michael E. DeFao
225 Franklin Street
Boston, MA 02110
Born 1968 | | Vice President (2011) and Assistant Secretary (2010) | | Vice President and Chief Counsel, Ameriprise Financial, Inc. since May 2010; Associate General Counsel, Bank of America from 2005 to April 2010. | |
Joseph F. DiMaria
225 Franklin Street
Boston, MA 02110
Born 1968 | | Vice President (2011) and Chief Accounting Officer (2008) | | Vice President — Mutual Fund Treasurer, Columbia Management Investment Advisers, LLC since May 2010; Director of Fund Administration, Columbia Management Advisors, LLC from 2006 to April 2010. | |
Paul B. Goucher
100 Park Avenue
New York, NY 10017
Born 1968 | | Vice President (2011) and Assistant Secretary (2008) | | Vice President and Lead Chief Counsel, Ameriprise Financial, Inc. since November 2008 and January 2013, respectively (previously, Chief Counsel from January 2010 to January 2013, and Group Counsel from November 2008 to January 2010); Director, Managing Director and General Counsel, J. & W. Seligman & Co. Incorporated from July 2008 to November 2008. | |
Amy Johnson
5228 Ameriprise
Financial Center
Minneapolis, MN
Born 1965 | | Vice President (2006) | | Senior Vice President and Chief Operating Officer, Columbia Management Investment Advisers, LLC since May 2010; previously, Chief Administrative Officer, from 2009 to April 2010, and Vice President — Asset Management and Trust Company Services from 2006 to 2009. | |
Paul D. Pearson
5228 Ameriprise
Financial Center
Minneapolis, MN
Born 1956 | | Vice President (2011) and Assistant Treasurer (1999) | | Vice President — Investment Accounting, Columbia Management Investment Advisers, LLC since May 2010; Vice President — Managed Assets, Investment Accounting, Ameriprise Financial, Inc. from 1998 to April 2010. | |
Christopher O. Petersen
5228 Ameriprise
Financial Center
Minneapolis, MN 55474
Born 1970 | | Vice President and Secretary (2010) | | Vice President and Chief Counsel, Ameriprise Financial, Inc. since January 2010 (previously, Vice President and Group Counsel or Counsel from 2004 to January 2010); officer of Columbia Funds and affiliated funds since 2007. | |
Stephen T. Welsh
225 Franklin Street
Boston, MA 02110
Born 1957 | | Vice President (2006) | | President and Director, Columbia Management Investment Services Corp. from May 2010 to October 2014; President and Director, Columbia Management Services, Inc. from 2004 to April 2010; and Managing Director, Columbia Management Distributors, Inc. from 2007 to April 2010. | |
Annual Report 2014
38
Columbia California Tax-Exempt Fund
Board Consideration and Approval of Advisory Agreement
On June 11, 2014, the Board of Trustees (the "Board") and the Trustees who are not interested persons (as defined in the Investment Company Act of 1940) of the Trust (the "Independent Trustees") unanimously approved the continuation of the Investment Management Services Agreement (the "Advisory Agreement") with Columbia Management Investment Advisers, LLC (the "Investment Manager") with respect to Columbia California Tax-Exempt Fund (the "Fund"), a series of the Trust. As detailed below, the Advisory Fees and Expenses Committee (the "Committee") and the Board met on multiple occasions to review and discuss, both among themselves and with the management team of the Investment Manager, materials provided by the Investment Manager before determining to approve the continuation of the Advisory Agreement.
In connection with their deliberations regarding the continuation of the Advisory Agreement, the Committee and the Board evaluated materials requested from the Investment Manager regarding the Fund and the Advisory Agreement, and discussed these materials with representatives of the Investment Manager at Committee meetings held on March 4, 2014, April 30, 2014 and June 10, 2014 and at Board meetings held on April 30, 2014 and June 11, 2014. In addition, the Board considers matters bearing on the Advisory Agreement at most of its other meetings throughout the year and meets regularly with senior management of the Funds and the Investment Manager. Through the Board's Investment Oversight Committees, Trustees also meet with selected Fund portfolio managers and other investment personnel at various times throughout the year. The Committee and the Board also consulted with its independent fee consultant, Fund counsel and with the Independent Trustees' independent legal counsel, who advised on various matters with respect to the Committee's and the Board's considerations and otherwise assisted the Committee and the Board in their deliberations. On June 10, 2014, the Committee recommended that the Board approve the continuation of the Advisory Agreement. On June 11, 2014, the Board, including the Independent Trustees, voting separately, unanimously approved the continuation of the Advisory Agreement for the Fund.
The Committee and the Board considered all information that they, their legal counsel, or the Investment Manager believed reasonably necessary to evaluate and to determine whether to approve the continuation of the Advisory Agreement. The information and factors considered by the Committee and the Board in recommending for approval or approving the continuation of the Advisory Agreement for the Fund included the following:
• Information on the investment performance of the Fund relative to the performance of a group of mutual funds determined to be comparable to the Fund by an independent third-party data provider, as well as performance relative to benchmarks;
• Information on the Fund's advisory fees and total expenses, including information comparing the Fund's expenses to those of a group of comparable mutual funds, as determined by the independent third-party data provider;
• The Investment Manager's agreement to contractually limit or cap total operating expenses for the Fund through February 28, 2015 so that total operating expenses (excluding certain fees and expenses, such as transaction costs and certain other investment related expenses, interest, taxes, acquired fund fees and expenses, and extraordinary expenses) would not exceed an annual rate of 0.79% for Class A, 1.54% for Class B, 1.54% for Class C, 0.54% for Class R4 and 0.54% for Class Z;
• The terms and conditions of the Advisory Agreement;
• The current and proposed terms and conditions of other agreements and arrangements with affiliates of the Investment Manager relating to the operations of the Fund, including the Administrative Services Agreement, the Distribution Agreement and the Transfer and Dividend Disbursing Agent Agreement;
• Descriptions of various functions performed by the Investment Manager under the Advisory Agreement, including portfolio management and portfolio trading practices;
• Information regarding the management fees and investment performance of similarly-managed portfolios of other clients of the Investment Manager, including institutional separate accounts;
• Information regarding the reputation, regulatory history and resources of the Investment Manager, including information regarding senior management, portfolio managers and other personnel;
• Information regarding the capabilities of the Investment Manager with respect to compliance monitoring services, including an assessment of the Investment Manager's compliance system by the Fund's Chief Compliance Officer; and
• The profitability to the Investment Manager and its affiliates from their relationships with the Fund.
Annual Report 2014
39
Columbia California Tax-Exempt Fund
Board Consideration and Approval of Advisory Agreement (continued)
Nature, Extent and Quality of Services Provided under the Advisory Agreement
The Committee and the Board considered the nature, extent and quality of services provided to the Fund by the Investment Manager and its affiliates under the Advisory Agreement and under separate agreements for the provision of transfer agency and administrative services, and the resources dedicated to the Fund and the other Columbia Funds by the Investment Manager and its affiliates. The Committee and the Board considered, among other things, the Investment Manager's ability to attract, motivate and retain highly qualified research, advisory and supervisory investment professionals (including personnel and other resources, compensation programs for personnel involved in fund management, reputation and other attributes), the portfolio management services provided by those investment professionals, and the quality of the Investment Manager's investment research capabilities and trade execution services. The Committee and the Board also considered the potential benefits to shareholders of investing in a mutual fund that is part of a fund complex offering exposure to a variety of asset classes and investment disciplines and providing a variety of fund and shareholder services.
The Committee and the Board also considered the professional experience and qualifications of the senior personnel of the Investment Manager, which included consideration of the Investment Manager's experience with similarly-structured funds. The Committee and the Board noted the compliance programs of and the compliance-related resources provided to the Fund by the Investment Manager and its affiliates, and considered the Investment Manager's ability to provide administrative services to the Fund pursuant to a separate Administrative Services Agreement, including the Investment Manager's ability to coordinate the activities of the Fund's other service providers. After reviewing these and related factors, the Committee and the Board concluded, within the context of their overall conclusions, that the nature, extent and quality of the services provided to the Fund under the Advisory Agreement supported the continuation of the Advisory Agreement.
Investment Performance
The Committee and the Board reviewed information about the performance of the Fund over various time periods, including performance information relative to benchmarks and information based on reports of the independent third-party data provider that compared the performance of the Fund to the performance of a group of comparable mutual funds, and data provided by the independent fee consultant. The Committee and the Board also reviewed a description of the third party's methodology for identifying the Fund's peer groups for purposes of performance and expense comparisons.
The Committee and the Board noted that, through December 31, 2013, the Fund's performance was in the twenty-ninth, twenty-first and forty-eighth percentile (where the best performance would be in the first percentile) of its category selected by the independent third-party data provider for the purposes of performance comparisons for the one-, three- and five- year periods, respectively.
The Committee and the Board also considered the Investment Manager's performance and reputation generally, the Investment Manager's historical responsiveness to Board concerns about performance, and the Investment Manager's willingness to take steps intended to improve performance. After reviewing these and related factors, the Committee and the Board concluded, within the context of their overall conclusions, that the performance of the Fund was sufficient, in light of other considerations, to warrant the continuation of the Advisory Agreement.
Investment Advisory Fee Rates and Other Expenses
The Committee and the Board considered the advisory fees charged to the Fund under the Advisory Agreement as well as the total expenses incurred by the Fund. In assessing the reasonableness of the fees under the Advisory Agreement, the Committee and the Board considered, among other information, the Fund's advisory fee and its total expense ratio as a percentage of average daily net assets. The Committee and the Board also considered data provided by the independent fee consultant. The Committee and the Board noted that the Fund's actual management fee and net expense ratio are ranked in the first and third quintiles, respectively, (where the lowest fees and expenses would be in the first quintile) against the Fund's expense universe as determined by the independent third-party data provider for purposes of expense comparison. The Committee and the Board also took into account the fee waiver and expense limitation arrangements agreed to by the Investment Manager, as noted above.
The Committee and the Board also received and considered information about the advisory fees charged by the Investment Manager to institutional separate accounts. In considering the fees charged to those accounts, the Committee and the Board took into account, among other things, the Investment Manager's representations about the differences between managing
Annual Report 2014
40
Columbia California Tax-Exempt Fund
Board Consideration and Approval of Advisory Agreement (continued)
mutual funds as compared to other types of accounts, including differences in the services provided, differences in the risk profile of such business for the Investment Manager and the additional resources required to manage mutual funds effectively. In evaluating the Fund's advisory fees, the Committee and the Board also took into account the demands, complexity and quality of the investment management of the Fund.
After reviewing these and related factors, the Committee and the Board concluded, within the context of their overall conclusions, that the advisory fee rates and expenses of the Fund were sufficient, in light of other considerations, to warrant the continuation of the Advisory Agreement.
Costs of Services Provided and Profitability
The Committee and the Board also took note of the costs of the services provided (both on an absolute and relative basis) and the profitability to the Investment Manager and its affiliates in connection with their relationships with the Fund. In evaluating these considerations, the Committee and the Board took note of the advisory fees charged by the Investment Manager to other clients, including fees charged by the Investment Manager to institutional separate account clients with similar investment strategies to those of the Fund.
The Committee and the Board also considered the compensation directly or indirectly received by the Investment Manager's affiliates in connection with their relationships with the Fund. The Committee and the Board reviewed information provided by management as to the profitability of the Investment Manager and its affiliates of their relationships with the Fund, information about the allocation of expenses used to calculate profitability, and comparisons of profitability levels realized in 2013 to profitability levels realized in 2012. When reviewing profitability, the Committee and the Board also considered court cases in which adviser profitability was an issue in whole or in part, the performance of similarly managed funds, the performance of the Fund, and the expense ratio of the Fund. The Committee and the Board also considered information provided by the Investment Manager regarding the Investment Manager's financial condition and comparing its profitability to that of other asset management firms that are, or are subsidiaries of, publicly traded companies.
After reviewing these and related factors, the Committee and the Board concluded, within the context of their overall conclusions, that the costs of services provided and the profitability to the Investment Manager and its affiliates from their relationships with the Fund supported the continuation of the Advisory Agreement.
Economies of Scale
The Committee and the Board considered the potential existence of economies of scale in the provision by the Investment Manager of services to the Fund, to groups of related funds, and to the Investment Manager's investment advisory clients as a whole, and whether those economies of scale were shared with the Fund through breakpoints in investment advisory fees or other means, such as expense limitation arrangements and additional investments by the Investment Manager in investment, trading and compliance resources. The Committee and the Board noted that the investment advisory fee schedules for the Fund contained breakpoints that would reduce the fee rate on assets above specified threshold levels.
In considering these matters, the Committee and the Board also considered the costs of the services provided and the profitability to the Investment Manager and its affiliates from their relationships with the Fund, as discussed above. After reviewing these and related factors, the Committee and the Board concluded, within the context of their overall conclusions, that the extent to which any economies of scale were expected to be shared with the Fund supported the continuation of the Advisory Agreement.
Other Benefits to the Investment Manager
The Committee and the Board received and considered information regarding "fall-out" or ancillary benefits received by the Investment Manager and its affiliates as a result of their relationships with the Fund, such as the engagement of the Investment Manager to provide administrative services to the Fund and the engagement of the Investment Manager's affiliates to provide distribution and transfer agency services to the Fund. In this regard, among other matters, the Committee and the Board considered that the Fund's distributor retains a portion of the distribution fees from the Fund and receives a portion of the sales charges on sales or redemptions of certain classes of shares of the Fund. The Committee and the Board also considered the benefits of research made available to the Investment Manager by reason of brokerage commissions generated by the Fund's securities transactions, and reviewed information about the Investment Manager's practices with respect to allocating portfolio transactions for brokerage and research services. The Committee and the Board
Annual Report 2014
41
Columbia California Tax-Exempt Fund
Board Consideration and Approval of Advisory Agreement (continued)
considered the possible conflicts of interest associated with certain fall-out or other ancillary benefits and the reporting, disclosure and other processes that are in place to address such possible conflicts of interest. The Committee and the Board recognized that the Investment Manager's profitability would be somewhat lower without these benefits.
Conclusion
The Committee and the Board reviewed all of the above considerations in reaching their decisions to recommend or approve the continuation of the Advisory Agreement. In their deliberations, the Trustees did not identify any particular information that was all-important or controlling, and individual Trustees may have attributed different weights to the various factors. Based on their evaluation of all factors that they deemed to be material, including those factors described above, and assisted by the advice of independent legal counsel, the Board, including the Independent Trustees, voting separately, unanimously approved the continuation of the Advisory Agreement.
Annual Report 2014
42
Columbia California Tax-Exempt Fund
Important Information About This Report
Each fund mails one shareholder report to each shareholder address. If you would like more than one report, please call shareholder services at 800.345.6611 and additional reports will be sent to you.
The policy of the Board is to vote the proxies of the companies in which each fund holds investments consistent with the procedures as stated in the Statement of Additional Information (SAI). You may obtain a copy of the SAI without charge by calling 800.345.6611; contacting your financial intermediary; visiting columbiamanagement.com; or searching the website of the Securities and Exchange Commission (SEC) at sec.gov. Information regarding how each fund voted proxies relating to portfolio securities is filed with the SEC by August 31 for the most recent 12-month period ending June 30 of that year, and is available without charge by visiting columbiamanagement.com; or searching the website of the SEC at sec.gov.
Each fund files a complete schedule of portfolio holdings with the SEC for the first and third quarters of each fiscal year on Form N-Q. Each fund's Form N-Q is available on the SEC's website at sec.gov and may be reviewed and copied at the SEC's Public Reference Room in Washington, D.C. Information on the operation of the Public Reference Room may be obtained by calling 800.SEC.0330. Each fund's complete schedule of portfolio holdings, as filed on Form N-Q, can also be obtained without charge, upon request, by calling 800.345.6611.
Annual Report 2014
43

Columbia California Tax-Exempt Fund
P.O. Box 8081
Boston, MA 02266-8081
columbiamanagement.com
This information is for use with concurrent or prior delivery of a fund prospectus. Please read and consider the investment objectives, risks, charges and expenses for any fund carefully before investing. For a prospectus and, if available, a summary prospectus, which contains this and other important information about the Fund, go to columbiamanagement.com. The Fund is distributed by Columbia Management Investment Distributors, Inc., member FINRA, and managed by Columbia Management Investment Advisers, LLC.
© 2014 Columbia Management Investment Advisers, LLC. All rights reserved.
ANN123_10_D01_(12/14)
Annual Report
October 31, 2014

Columbia New York Tax-Exempt Fund
Not FDIC insured • No bank guarantee • May lose value
About Columbia Management
Backed by more than 100 years of experience, Columbia Management is one of the nation's largest asset managers. At the heart of our success — and, most importantly, that of our investors — are some of the most talented professionals in the industry, brought together by a unique way of working.
It starts with carefully selected, specialized investment teams. While each team brings a diverse and innovative range of skills, all are grounded by a common set of core beliefs. All possess a solid conviction in the power of proprietary, bottom-up research. All look not only at generating returns, but also at the likely consistency of those returns and the risks required to achieve them. And while our culture encourages teams to operate independently and question established thinking, a rigorous investment oversight process ensures that each team stays true to its clearly articulated investment process. At Columbia Management, reaching our performance goals matters, and the way we reach them matters just as much.
Columbia funds are distributed by Columbia Management Investment Distributors, Inc., member FINRA, and managed by Columbia Management Investment Advisers, LLC.
© 2014 Columbia Management Investment Advisers, LLC. All rights reserved.
Not part of the shareholder report
Connect with Columbia Management
Get the market insight you need from our investment experts
Investor insight
Stay informed with economic and market commentary, investment videos, white papers, mutual fund commentary and more at columbiamanagement.com.
Columbia Management investor
(e-newsletter)
Read our award-winning* shareholder newsletter. Our quarterly newsletter is available online and provides timely and relevant content about economic trends, fund news, service enhancements and changes. Sign up to receive the newsletter electronically at columbiamanagement.com/newsletter.
Investment videos
Watch and discover what our thought leaders are saying about financial markets and the economy. For an analysis of current events and trends that may affect your investments, visit our online video library at columbiamanagement.com/
market-insights/videos.
Social media
Columbia Management offers you multiple ways to access our market commentary and investment insights.
> Perspectives blog at columbiamanagement.com
Read timely posts by our investment team, including our chief investment officer, chief economist and portfolio managers.
> Twitter.com/ColumbiaMgmt
Follow us on Twitter for quick, up-to-the-minute comments on market news and more.
> Youtube.com/columbiamanagement
View our commentaries on the economy, markets and current investment opportunities.
> Linkedin.com/company/columbia-management
Connect with us on LinkedIn for updates from our thought leaders.
*Columbia Management investor was awarded top honors in the Mutual Fund Education Alliance STAR Awards competition for excellence in mutual fund marketing and communications. Materials in the competition were evaluated on educational value, message comprehension, effective design and objectives.
Not part of the shareholder report
Subscribe to Columbia Management
Get market insight and fund updates delivered to you
Email subscription center
Visit the Columbia Management email subscription center at columbiamanagement.com/subscribe to register for economic and market commentary, product and service updates, white papers and more.
> Columbia Management investor
Quarterly newsletter featuring the latest macro- and micro-economic trends, investment themes, products, service changes and other items of interest to Columbia Management investors
> Investment Strategy Outlook
Quarterly publication featuring the Columbia Management Asset Allocation Team's perspective on global economic investment conditions and markets
> MarketTrack
Quarterly publication featuring more than 40 charts and graphs that highlight the current state of the economy and markets; includes straightforward insight on current investment opportunities
> White papers
Frequent articles that delve deep into a variety of investment topics
> Mutual fund updates
Quarterly portfolio manager commentary and fund fact sheets available for Columbia funds. (Not all funds have a commentary.)
Register today by visiting columbiamanagement.com/subscribe
Not part of the shareholder report
 Dear Shareholders,
The U.S. Economy Gained Momentum
The U.S. economy picked up momentum throughout the third quarter of 2014 with improvements in every sector. Second-quarter gross domestic product growth was revised upward to 4.6%, with expectations that third-quarter growth would also be above trend. American companies added more than 200,000 new jobs monthly, driving unemployment below 6% for the first time since 2008. Consumer spending got a boost as both income and savings rose, and confidence hit a post-recession high. After a weak start to the year, corporate profits rebounded, indicating that business remains in good shape. Rising profits led to higher capital spending. The housing market recovery remained on track, as home sales and prices trended higher, and inventories declined. Manufacturing remained a lynchpin of the economy's expansion. Even so, performance fell short of expectations at the end of the period.
Despite Momentum, Markets Remained Stagnant
The financial markets produced lackluster results, despite good economic news and the Federal Reserve's reassurance that it intended to keep short-term interest rates low for another year. A surge in global tensions and concerns that equity valuations have risen sharply put a damper on investor enthusiasm. The S&P 500 Index inched ahead 1.13%, buoyed by its concentration in large-cap stocks with a defensive edge. Traditional fixed-income sectors, including U.S. Treasuries, mortgages and securitized bonds, eked out returns of less than 1% for the quarter. Investment-grade corporate bonds and high-yield bonds lost some ground, although fundamentals for both groups remained solid. Convertible securities and U.S. Treasury inflation-protected securities pulled up the rear.
Stay on Track with Columbia Management
Backed by more than 100 years of experience, Columbia Management is one of the nation's largest asset managers. At the heart of our success and, most importantly, that of our investors, are highly talented industry professionals, brought together by a unique way of working. At Columbia Management, reaching our performance goals matters, and how we reach them matters just as much.
Visit columbiamanagement.com for:
> The Columbia Management Perspectives blog, offering insights on current market events and investment opportunities
> Detailed up-to-date fund performance and portfolio information
> Quarterly fund commentaries
> Columbia Management investor, our award-winning quarterly newsletter for shareholders
Thank you for your continued support of the Columbia Funds. We look forward to serving your investment needs for many years to come.
Best Regards,

J. Kevin Connaughton
President, Columbia Funds
Investing involves risk including the risk of loss of principal.
The S&P 500 Index, an unmanaged index, measures the performance of 500 widely held, large-capitalization U.S. stocks and is frequently used as a general measure of market performance. Indices are not available for investment, are not professionally managed and do not reflect sales charges, fees, brokerage commissions, taxes or other expenses of investing.
Investors should consider the investment objectives, risks, charges and expenses of a mutual fund carefully before investing. For a free prospectus and, if available, a summary prospectus, which contains this and other important information about a fund, visit columbiamanagement.com. The prospectus should be read carefully before investing.
Columbia Funds are distributed by Columbia Management Investment Distributors, Inc., member FINRA, and managed by Columbia Management Investment Advisers, LLC.
© 2014 Columbia Management Investment Advisers, LLC. All rights reserved.
Columbia New York Tax-Exempt Fund
Fund Investment Manager
Columbia Management Investment
Advisers, LLC
225 Franklin Street
Boston, MA 02110
Fund Distributor
Columbia Management Investment
Distributors, Inc.
225 Franklin Street
Boston, MA 02110
Fund Transfer Agent
Columbia Management Investment
Services Corp.
P.O. Box 8081
Boston, MA 02266-8081
For more information about any of the funds, please visit columbiamanagement.com or call 800.345.6611. Customer Service Representatives are available to answer your questions Monday through Friday from 8 a.m. to 7 p.m. Eastern time.
The views expressed in this report reflect the current views of the respective parties. These views are not guarantees of future performance and involve certain risks, uncertainties and assumptions that are difficult to predict, so actual outcomes and results may differ significantly from the views expressed. These views are subject to change at any time based upon economic, market or other conditions and the respective parties disclaim any responsibility to update such views. These views may not be relied on as investment advice and, because investment decisions for a Columbia Fund are based on numerous factors, may not be relied on as an indication of trading intent on behalf of any particular Columbia Fund. References to specific securities should not be construed as a recommendation or investment advice.
Performance Overview | | | 3 | | |
Manager Discussion of Fund Performance | | | 5 | | |
Understanding Your Fund's Expenses | | | 8 | | |
Portfolio of Investments | | | 9 | | |
Statement of Assets and Liabilities | | | 17 | | |
Statement of Operations | | | 19 | | |
Statement of Changes in Net Assets | | | 20 | | |
Financial Highlights | | | 22 | | |
Notes to Financial Statements | | | 28 | | |
Report of Independent Registered
Public Accounting Firm | | | 34 | | |
Federal Income Tax Information | | | 35 | | |
Trustees and Officers | | | 36 | | |
Board Consideration and Approval of Advisory Agreement | | | 39 | | |
Important Information About This Report | | | 43 | | |
Columbia New York Tax-Exempt Fund
Performance Summary
> Columbia New York Tax-Exempt Fund (the Fund) Class A shares returned 8.80% excluding sales charges for the 12-month period that ended October 31, 2014. Class Z shares of the Fund returned 9.07%.
> During the same 12-month period, the Barclays New York Municipal Bond Index returned 7.58% and the broad Barclays Municipal Bond Index returned 7.82%.
> Effective duration and yield curve positioning during the period more than offset mixed results from sector allocation and security selection.
Average Annual Total Returns (%) (for period ended October 31, 2014)
| | Inception | | 1 Year | | 5 Years | | 10 Years | |
Class A | | 09/26/86 | | | | | | | | | | | | | |
Excluding sales charges | | | | | | | 8.80 | | | | 5.62 | | | | 4.49 | | |
Including sales charges | | | | | | | 3.63 | | | | 4.61 | | | | 3.99 | | |
Class B | | 08/04/92 | | | | | | | | | | | | | |
Excluding sales charges | | | | | | | 7.99 | | | | 4.84 | | | | 3.72 | | |
Including sales charges | | | | | | | 2.99 | | | | 4.50 | | | | 3.72 | | |
Class C | | 08/01/97 | | | | | | | | | | | | | |
Excluding sales charges | | | | | | | 8.32 | | | | 5.15 | | | | 4.03 | | |
Including sales charges | | | | | | | 7.32 | | | | 5.15 | | | | 4.03 | | |
Class R4* | | 03/19/13 | | | 9.09 | | | | 5.71 | | | | 4.54 | | |
Class R5* | | 11/08/12 | | | 8.98 | | | | 5.74 | | | | 4.55 | | |
Class Z* | | 09/01/11 | | | 9.07 | | | | 5.79 | | | | 4.58 | | |
Barclays New York Municipal Bond Index | | | | | | | 7.58 | | | | 5.08 | | | | 4.64 | | |
Barclays Municipal Bond Index | | | | | | | 7.82 | | | | 5.26 | | | | 4.71 | | |
Returns for Class A are shown with and without the maximum initial sales charge of 4.75%. Returns for Class B are shown with and without the applicable contingent deferred sales charge (CDSC) of 5.00% in the first year, declining to 1.00% in the sixth year and eliminated thereafter. Returns for Class C are shown with and without the 1.00% CDSC for the first year only. The Fund's other classes are not subject to sales charges and have limited eligibility. Please see the Fund's prospectus for details. Performance for different share classes will vary based on differences in sales charges and fees associated with each class. All results shown assume reinvestment of distributions during the period. Returns do not reflect the deduction of taxes that a shareholder may pay on Fund distributions or on the redemption of Fund shares. Performance results reflect the effect of any fee waivers or reimbursements of Fund expenses by Columbia Management Investment Advisers, LLC and/or any of its affiliates. Absent these fee waivers or expense reimbursement arrangements, performance results would have been lower.
The performance information shown represents past performance and is not a guarantee of future results. The investment return and principal value of your investment will fluctuate so that your shares, when redeemed, may be worth more or less than their original cost. Current performance may be lower or higher than the performance information shown. You may obtain performance information current to the most recent month-end by contacting your financial intermediary, visiting columbiamanagement.com or calling 800.345.6611.
*The returns shown for periods prior to the share class inception date (including returns for the Life of the Fund, if shown, which are since Fund inception) include the returns of the Fund's oldest share class. These returns are adjusted to reflect any higher class-related operating expenses of the newer share classes, as applicable. Please visit columbiamanagement.com/mutual-funds/appended-performance for more information.
The Barclays New York Municipal Bond Index is a market-capitalization-weighted index of New York investment-grade bonds with maturity of one year or more.
The Barclays Municipal Bond Index is an unmanaged index considered representative of the broad market for investment-grade, tax-exempt bonds with a maturity of at least one year.
Indices are not available for investment, are not professionally managed and do not reflect sales charges, fees, brokerage commissions, taxes or other expenses of investing. Securities in the Fund may not match those in an index.
Annual Report 2014
3
Columbia New York Tax-Exempt Fund
Performance Overview (continued)
Performance of a Hypothetical $10,000 Investment (November 1, 2004 – October 31, 2014)
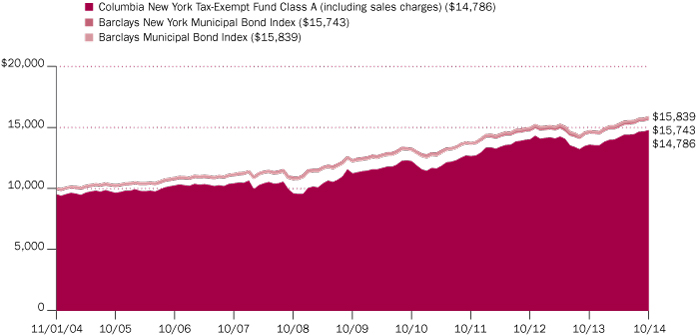
The chart above shows the change in value of a hypothetical $10,000 investment in Class A shares of Columbia New York Tax-Exempt Fund during the stated time period, and does not reflect the deduction of taxes that a shareholder may pay on Fund distributions or on the redemption of Fund shares.
Annual Report 2014
4
Columbia New York Tax-Exempt Fund
Manager Discussion of Fund Performance
For the 12-month period that ended October 31, 2014, the Fund's Class A shares returned 8.80% excluding sales charges. Class Z shares of the Fund returned 9.07%. During the same 12-month period, the Barclays New York Municipal Bond Index (Barclays NY Index) returned 7.58% and the broad Barclays Municipal Bond Index returned 7.82%. Effective duration and yield curve positioning during the period more than offset mixed results from sector allocation and security selection. Duration is a measure of sensitivity to changes in interest rates.
Tax-Exempt Bond Market Posted Gains
The tax-exempt fixed-income market posted solid gains during the annual period, as municipal bond yields declined across most of the yield curve (spectrum of maturities) and supply/demand conditions remained supportive. Municipal bonds were the best performing sector in the broad U.S. fixed-income market in 2014 year to date through October 31, generating the strongest returns seen in the sector in five years. Yields on longer term maturities declined while yields on shorter term maturities rose modestly, resulting in a flatter municipal bond yield curve. Lower quality, higher yielding municipal bonds generally outperformed their higher quality, lower yielding counterparts.
As the annual period began, municipal bond mutual funds were experiencing redemptions, albeit more slowly than the record levels hit in late summer 2013. Fund flows turned positive in February 2014, with improved demand for municipal bonds supported by reduced supply and higher taxes. The markets became unsettled in March 2014 when comments from the Federal Reserve (Fed) hinted that interest rates might increase sooner than previously anticipated. Fed Chair Janet Yellen subsequently re-emphasized the Fed's commitment to keep short-term interest rates low. In the second quarter of 2014, the municipal bond market generated strong gains as yields fell. Geopolitical uncertainty and inconsistent economic data helped push municipal bond prices higher. In the third quarter and into October, municipal bonds generally continued their strong performance, despite an uptick in market volatility.
From a fundamental perspective, states saw greater revenue — topping pre-recession peaks — on the back of increasing sales, income and property taxes along with lower expenses following recent austerity measures taken. Select negative credit stories made headlines, including the state of Illinois' pension turmoil, Puerto Rico's multi-notch downgrade, Detroit's Chapter 9 bankruptcy filing and the state of New Jersey's downgrade after a revenue shortfall led the state to make a reduced payment to its pension funds. However, such issues were not representative of the broad municipal bond market. Overall default rates trended down and were at their lowest level since 2009. It is well worth noting that New York state credit ratings were upgraded by three independent agencies after a fourth consecutive on-time budget passed for Governor Cuomo. The technical (supply and demand) landscape for the annual period overall also supported the performance of the tax-exempt fixed-income market, as supply on both the national and state levels declined, and demand, as evidenced by municipal bond mutual fund inflows, was positive.
Duration and Yield Curve Positioning Aided Returns
The Fund benefited most from its combined duration and yield curve positioning. The Fund had a longer duration than the Barclays NY Index, which helped as
Portfolio Management
Catherine Stienstra
Quality Breakdown (%)
(at October 31, 2014) | |
AAA rating | | | 3.2 | | |
AA rating | | | 32.9 | | |
A rating | | | 42.4 | | |
BBB rating | | | 13.7 | | |
Non-investment grade | | | 2.0 | | |
Not rated | | | 5.8 | | |
Total | | | 100.0 | | |
Percentages indicated are based upon total fixed income securities (excluding Money Market Funds).
Bond ratings apply to the underlying holdings of the Fund and not the Fund itself and are divided into categories ranging from highest to lowest credit quality, determined by using the middle rating of Moody's, S&P and Fitch, after dropping the highest and lowest available ratings. When ratings are available from only two rating agencies, the lower rating is used. When a rating is available from only one rating agency, that rating is used. When a bond is not rated by any rating agency, it is designated as "Not rated". Credit quality ratings assigned by a rating agency are subjective opinions, not statements of fact, and are subject to change, including daily. The ratings assigned by credit rating agencies are but one of the considerations that the Investment Manager and/or Fund's subadviser incorporates into its credit analysis process, along with such other issuer-specific factors as cash flows, capital structure and leverage ratios, ability to de-leverage (repay) through free cash flow, quality of management, market positioning and access to capital, as well as such security-specific factors as the terms of the security (e.g., interest rate, and time to maturity) and the amount and type of any collateral.
Annual Report 2014
5
Columbia New York Tax-Exempt Fund
Manager Discussion of Fund Performance (continued)
Investment Risks
Fixed-income securities present issuer default risk. The Fund invests substantially in municipal securities and will be affected by tax, legislative, regulatory, demographic or political changes, as well as changes impacting a state's financial, economic or other conditions. A relatively small number of tax-exempt issuers may necessitate the Fund investing more heavily in a single issuer and, therefore, be more exposed to the risk of loss than a fund that invests more broadly. The value of the Fund's portfolio may be more volatile than a more geographically diversified fund. Prepayment and extension risk exists as a loan, bond or other investment may be called, prepaid or redeemed before maturity and that similar yielding investments may not be available for purchase. A rise in interest rates may result in a price decline of fixed-income (debt) instruments held by the Fund, negatively affecting its performance and NAV. Falling rates may result in the Fund investing in lower yielding debt instruments, lowering the Fund's income and yield. Debt instruments with longer maturity and duration have greater sensitivity to interest rate changes. Interest rates can change due to local government and banking regulation changes. Non-investment-grade (high-yield or junk) securities present greater price volatility and more risk to principal and income than higher rated securities. Market risk may affect a single issuer, sector of the economy, industry or the market as a whole. Federal and state tax rules apply to capital gain distributions and any gains or losses on sales. Income may be subject to state or local taxes. Liquidity risk is associated with the difficulty of selling underlying investments at a desirable time or price. See the Fund's prospectus for more information on these and other risks.
longer maturity tax-exempt bond yields fell. Also, having an overweight relative to the Barclays NY Index in bonds with maturities of 15 years or longer and a relative underweight in bonds with maturities of 1 to 15 years contributed positively, as longer dated maturities outperformed shorter term maturities during a time when the municipal bond yield curve flattened.
From a sector perspective, the Fund benefited from having underweight allocations to the special tax and state and local general obligation bond sectors. Effective issue selection among the hospital, transportation, education and special tax bond sectors contributed positively as well. In terms of credit quality, having overweight allocations to bonds rated A and BBB and to non-rated securities and underweighted allocations to bonds rated AAA and AA added value, as lower quality securities generally outperformed higher quality securities during the annual period.
Security Selection in Electric Utilities Sector Detracted
Detracting from Fund results was security selection within the electric utilities sector, particularly a small position in Puerto Rico Electric Power Authority (PREPA) bonds. These bonds performed poorly, as the cash-strapped electrical power authority faced critical deadlines to extend or make payments on lines of credit with banks. We sold the Fund's remaining position in these bonds in July 2014, leaving the Fund with no exposure to any Puerto Rico credits. Indeed, the negative impact of the position in PREPA was partially offset by the positive effect of having an overall underweight allocation to Puerto Rico bonds.
Security selection within the industrial development revenue/pollution control revenue sector detracted from the Fund's relative results as did having underweight allocations to the transportation and water/sewer sectors.
Fundamental Analysis Drove Portfolio Changes
During the annual period, we increased the Fund's exposure to the transportation and water/sewer sectors. We decreased the Fund's exposure to pre-refunded bonds and to the local general obligation sector. Overall, the Fund's duration remained longer than that of the Barclays NY Index during the annual period. However, while still maintaining a relatively longer duration at the end of October 2014, we had allowed the Fund's duration to drift modestly shorter as the end of the Fed's quantitative easing program and a potential shift in Fed policy approached.
The Fund held a modest position in an inverse floater to enhance income — with minimal impact during the annual period. Inverse floaters are bonds or other types of debt whose coupon rate has an inverse relationship to short-term interest rates or to a benchmark rate. An inverse floater adjusts its coupon payment as the interest rate changes, such that when interest rates rise, the coupon rate falls.
Looking Ahead
As we move closer to the end of 2014, we currently expect to see a gradual rise in interest rates should the economy continue to slowly recover. The Fed's quantitative easing asset purchases officially ended in October 2014, and its comments at that time left the market with the impression that if economic data were to come in stronger in support of its employment and inflation targets, then we could expect the first interest rate hike sooner than later, but any such tightening of monetary policy would be data dependent. To date, geopolitical unrest, an economic slowdown in the eurozone and/or declining energy prices
Annual Report 2014
6
Columbia New York Tax-Exempt Fund
Manager Discussion of Fund Performance (continued)
have kept U.S. Treasury yields suppressed even while economic data, including employment figures, were improving and inflation remained low. Of course, we remain mindful that these same factors could derail the U.S. economic recovery and alter Fed policy going forward.
At the end of the annual period, we remained generally constructive on the municipal bond market. Fundamentals had improved, defaults remained low, positive supply/demand technicals were expected to continue and taxable equivalent yields remained attractive due to high levels of taxation. As such, we currently expect to maintain the Fund's duration profile longer than that of the Barclays NY Index for the near term. We also expect, at this time, to continue to emphasize lower rated investment-grade credits and below-investment-grade credits for the additional income they provide. Going forward, we currently expect short-term municipal bond yields to rise more than longer term yields, which will result in a flatter yield curve. Therefore, we intend to maintain an overweight exposure to municipal bonds with maturities of 15 years and longer and an underweight exposure to bonds with maturities of 1-10 years relative to the Barclays NY Index.
As always, the Fund's emphasis remains on generating income generally exempt from federal income tax and New York state and local taxes as well as capital appreciation, consistent with moderate fluctuation of principal.
Annual Report 2014
7
Columbia New York Tax-Exempt Fund
Understanding Your Fund's Expenses
(Unaudited)
As an investor, you incur two types of costs. There are transaction costs, which generally include sales charges on purchases and may include redemption fees. There are also ongoing costs, which generally include management fees, distribution and/or service fees, and other fund expenses. The following information is intended to help you understand your ongoing costs (in dollars) of investing in the Fund and to help you compare these costs with the ongoing costs of investing in other mutual funds.
Analyzing Your Fund's Expenses
To illustrate these ongoing costs, we have provided examples and calculated the expenses paid by investors in each share class of the Fund during the period. The actual and hypothetical information in the table is based on an initial investment of $1,000 at the beginning of the period indicated and held for the entire period. Expense information is calculated two ways and each method provides you with different information. The amount listed in the "Actual" column is calculated using the Fund's actual operating expenses and total return for the period. You may use the Actual information, together with the amount invested, to estimate the expenses that you paid over the period. Simply divide your account value by $1,000 (for example, an $8,600 account value divided by $1,000 = 8.6), then multiply the results by the expenses paid during the period under the "Actual" column. The amount listed in the "Hypothetical" column assumes a 5% annual rate of return before expenses (which is not the Fund's actual return) and then applies the Fund's actual expense ratio for the period to the hypothetical return. You should not use the hypothetical account values and expenses to estimate either your actual account balance at the end of the period or the expenses you paid during the period. See "Compare With Other Funds" below for details on how to use the hypothetical data.
Compare With Other Funds
Since all mutual funds are required to include the same hypothetical calculations about expenses in shareholder reports, you can use this information to compare the ongoing cost of investing in the Fund with other funds. To do so, compare the hypothetical example with the 5% hypothetical examples that appear in the shareholder reports of other funds. As you compare hypothetical examples of other funds, it is important to note that hypothetical examples are meant to highlight the ongoing costs of investing in a fund only and do not reflect any transaction costs, such as sales charges, or redemption or exchange fees. Therefore, the hypothetical calculations are useful in comparing ongoing costs only, and will not help you determine the relative total costs of owning different funds. If transaction costs were included in these calculations, your costs would be higher.
May 1, 2014 – October 31, 2014
| | Account Value at the Beginning
of the Period ($) | | Account Value at the End of the
Period ($) | | Expenses Paid During the
Period ($) | | Fund's Annualized
Expense Ratio (%) | |
| | Actual | | Hypothetical | | Actual | | Hypothetical | | Actual | | Hypothetical | | Actual | |
Class A | | | 1,000.00 | | | | 1,000.00 | | | | 1,040.50 | | | | 1,021.27 | | | | 4.01 | | | | 3.97 | | | | 0.78 | | |
Class B | | | 1,000.00 | | | | 1,000.00 | | | | 1,036.60 | | | | 1,017.49 | | | | 7.85 | | | | 7.78 | | | | 1.53 | | |
Class C | | | 1,000.00 | | | | 1,000.00 | | | | 1,038.10 | | | | 1,019.00 | | | | 6.32 | | | | 6.26 | | | | 1.23 | | |
Class R4 | | | 1,000.00 | | | | 1,000.00 | | | | 1,041.80 | | | | 1,022.53 | | | | 2.73 | | | | 2.70 | | | | 0.53 | | |
Class R5 | | | 1,000.00 | | | | 1,000.00 | | | | 1,042.00 | | | | 1,022.68 | | | | 2.57 | | | | 2.55 | | | | 0.50 | | |
Class Z | | | 1,000.00 | | | | 1,000.00 | | | | 1,043.20 | | | | 1,022.53 | | | | 2.73 | | | | 2.70 | | | | 0.53 | | |
Expenses paid during the period are equal to the annualized expense ratio for each class as indicated above, multiplied by the average account value over the period and then multiplied by the number of days in the Fund's most recent fiscal half year and divided by 365.
Expenses do not include fees and expenses incurred indirectly by the Fund from its investment in underlying funds, including affiliated and non-affiliated pooled investment vehicles, such as mutual funds and exchange-traded funds.
Had Columbia Management Investment Advisers, LLC and/or certain of its affiliates not waived/reimbursed certain fees and expenses, account value at the end of the period would have been reduced.
Annual Report 2014
8
Columbia New York Tax-Exempt Fund
Portfolio of Investments
October 31, 2014
(Percentages represent value of investments compared to net assets)
Municipal Bonds 97.5%
Issue
Description | | Coupon
Rate | | Principal
Amount ($) | | Value ($) | |
Air Transportation 4.5% | |
New York City Industrial Development Agency(a)
Refunding Revenue Bonds
Trips Obligated Group
Senior Series 2012A AMT
07/01/28 | | | 5.000 | % | | | 2,000,000 | | | | 2,188,140 | | |
Revenue Bonds
Terminal One Group Association Project
Series 2005 AMT
01/01/15 | | | 5.500 | % | | | 1,500,000 | | | | 1,512,540 | | |
New York City Industrial Development Agency(a)(b)
Revenue Bonds
Terminal One Group Association Project
Series 2005 AMT
01/01/24 | | | 5.500 | % | | | 2,000,000 | | | | 2,103,620 | | |
Port Authority of New York & New Jersey
Revenue Bonds
JFK International Air Terminal
Series 2010
12/01/42 | | | 6.000 | % | | | 2,000,000 | | | | 2,318,060 | | |
Total | | | | | | | 8,122,360 | | |
Assisted Living 0.6% | |
Mount Vernon Industrial Development Agency
Revenue Bonds
Wartburg Senior Housing, Inc. - Meadowview
Series 1999
06/01/19 | | | 6.150 | % | | | 500,000 | | | | 500,990 | | |
06/01/29 | | | 6.200 | % | | | 615,000 | | | | 615,535 | | |
Total | | | | | | | 1,116,525 | | |
Higher Education 11.5% | |
Albany Capital Resource Corp.
Refunding Revenue Bonds
Albany College of Pharmacy & Health Services
Series 2014
12/01/33 | | | 5.000 | % | | | 125,000 | | | | 140,134 | | |
Build NYC Resource Corp.
Refunding Revenue Bonds
City University of New York-Queens
Series 2014A
06/01/43 | | | 5.000 | % | | | 1,000,000 | | | | 1,126,410 | | |
Dutchess County Local Development Corp.
Refunding Revenue Bonds
Marist College Project
Series 2012A
07/01/21 | | | 5.000 | % | | | 675,000 | | | | 795,960 | | |
Geneva Development Corp.
Refunding Revenue Bonds
Hobart & William Smith College
Series 2012
09/01/25 | | | 5.000 | % | | | 295,000 | | | | 344,115 | | |
Municipal Bonds (continued)
Issue
Description | | Coupon
Rate | | Principal
Amount ($) | |
Value ($) | |
Nassau County Industrial Development Agency
Refunding Revenue Bonds
New York Institute of Technology Project
Series 2000A
03/01/26 | | | 4.750 | % | | | 1,210,000 | | | | 1,278,643 | | |
New York State Dormitory Authority
Revenue Bonds
Consolidated City University System 5th General Resolution
Series 2008B
07/01/27 | | | 5.000 | % | | | 1,000,000 | | | | 1,124,930 | | |
Cornell University
Series 2006A
07/01/31 | | | 5.000 | % | | | 1,000,000 | | | | 1,066,110 | | |
Manhattan Marymount College
Series 2009
07/01/29 | | | 5.250 | % | | | 1,500,000 | | | | 1,582,935 | | |
Mount Sinai School of Medicine
Series 2009
07/01/39 | | | 5.125 | % | | | 1,000,000 | | | | 1,111,610 | | |
Pratt Institute
Series 2009C (AGM)
07/01/39 | | | 5.125 | % | | | 1,000,000 | | | | 1,074,260 | | |
St. John's University
Series 2007A (NPFGC)
07/01/32 | | | 5.250 | % | | | 1,000,000 | | | | 1,054,580 | | |
Series 2007C (NPFGC)
07/01/26 | | | 5.250 | % | | | 1,205,000 | | | | 1,473,534 | | |
Series 2012A
07/01/27 | | | 5.000 | % | | | 240,000 | | | | 274,949 | | |
State University Dormitory Facilities
Series 2011A
07/01/31 | | | 5.000 | % | | | 1,000,000 | | | | 1,152,480 | | |
Teacher's College
Series 2009
03/01/39 | | | 5.500 | % | | | 500,000 | | | | 559,340 | | |
The New School
Series 2010
07/01/40 | | | 5.500 | % | | | 1,500,000 | | | | 1,691,520 | | |
Niagara Area Development Corp.
Revenue Bonds
Niagara University Project
Series 2012A
05/01/35 | | | 5.000 | % | | | 500,000 | | | | 536,475 | | |
Seneca County Industrial Development Agency
Revenue Bonds
New York Chiropractic College
Series 2007
10/01/27 | | | 5.000 | % | | | 750,000 | | | | 785,160 | | |
St. Lawrence County Industrial Development Agency
Revenue Bonds
Clarkson University Project
Series 2007
07/01/31 | | | 5.000 | % | | | 1,000,000 | | | | 1,044,050 | | |
The accompanying Notes to Financial Statements are an integral part of this statement.
Annual Report 2014
9
Columbia New York Tax-Exempt Fund
Portfolio of Investments (continued)
October 31, 2014
Municipal Bonds (continued)
Issue
Description | | Coupon
Rate | | Principal
Amount ($) | |
Value ($) | |
Town of Hempstead Local Development Corp.
Revenue Bonds
Molloy College Project
Series 2009
07/01/39 | | | 5.750 | % | | | 1,000,000 | | | | 1,086,620 | | |
Yonkers Industrial Development Agency
Revenue Bonds
Sarah Lawrence College Project
Series 2001A
06/01/29 | | | 6.000 | % | | | 1,000,000 | | | | 1,118,000 | | |
Total | | | | | | | 20,421,815 | | |
Hospital 18.0% | |
Albany Industrial Development Agency
Revenue Bonds
St. Peters Hospital Project
Series 2008A
11/15/27 | | | 5.250 | % | | | 2,000,000 | | | | 2,201,280 | | |
Build NYC Resource Corp.
Refunding Revenue Bonds
New York Methodist Hospital Project
Series 2014
07/01/29 | | | 5.000 | % | | | 225,000 | | | | 256,028 | | |
07/01/30 | | | 5.000 | % | | | 180,000 | | | | 204,026 | | |
Dutchess County Local Development Corp.
Revenue Bonds
Series 2014A
07/01/44 | | | 5.000 | % | | | 1,000,000 | | | | 1,091,200 | | |
Monroe County Industrial Development Corp.
Refunding Revenue Bonds
Rochester General Hospital
Series 2013A
12/01/32 | | | 5.000 | % | | | 1,350,000 | | | | 1,494,463 | | |
Revenue Bonds
Unity Hospital-Rochester Project
Series 2010 (FHA)
08/15/35 | | | 5.750 | % | | | 2,000,000 | | | | 2,401,780 | | |
Nassau County Local Economic Assistance Corp.
Revenue Bonds
Catholic Health Services-Long Island
Series 2014
07/01/32 | | | 5.000 | % | | | 750,000 | | | | 846,150 | | |
New York State Dormitory Authority
Revenue Bonds
Kaleida Health
Series 2006 (FHA)
02/15/35 | | | 4.700 | % | | | 1,000,000 | | | | 1,018,880 | | |
Mount Sinai Hospital
Series 2010A
07/01/26 | | | 5.000 | % | | | 2,275,000 | | | | 2,606,035 | | |
Series 2011A
07/01/41 | | | 5.000 | % | | | 2,000,000 | | | | 2,184,380 | | |
New York Hospital Medical Center Queens
Series 2007 (FHA)
02/15/37 | | | 4.750 | % | | | 975,000 | | | | 1,003,490 | | |
Municipal Bonds (continued)
Issue
Description | | Coupon
Rate | | Principal
Amount ($) | |
Value ($) | |
New York University Hospital Center
Series 2007B
07/01/24 | | | 5.250 | % | | | 640,000 | | | | 685,024 | | |
07/01/37 | | | 5.625 | % | | | 1,000,000 | | | | 1,093,100 | | |
Series 2011A
07/01/31 | | | 5.750 | % | | | 800,000 | | | | 922,152 | | |
North Shore-Long Island Jewish Obligation Group
Series 2007A
05/01/32 | | | 5.000 | % | | | 1,000,000 | | | | 1,052,270 | | |
Series 2009A
05/01/37 | | | 5.500 | % | | | 2,000,000 | | | | 2,223,260 | | |
Orange Regional Medical Center
Series 2008
12/01/29 | | | 6.125 | % | | | 900,000 | | | | 964,701 | | |
University of Rochester
Series 2007B
07/01/27 | | | 5.000 | % | | | 1,000,000 | | | | 1,079,670 | | |
Series 2009A
07/01/39 | | | 5.125 | % | | | 1,000,000 | | | | 1,130,930 | | |
Onondaga Civic Development Corp.
Revenue Bonds
St. Joseph's Hospital Health Center Project
Series 2014
07/01/31 | | | 5.125 | % | | | 1,000,000 | | | | 1,054,370 | | |
Saratoga County Industrial Development Agency
Revenue Bonds
Saratoga Hospital Project
Series 2007B
12/01/32 | | | 5.250 | % | | | 500,000 | | | | 526,245 | | |
Suffolk County Economic Development Corp.
Revenue Bonds
Catholic Health Services
Series 2011
07/01/28 | | | 5.000 | % | | | 3,500,000 | | | | 3,857,700 | | |
Westchester County Healthcare Corp.
Revenue Bonds
Senior Lien
Series 2010C-2
11/01/37 | | | 6.125 | % | | | 1,850,000 | | | | 2,137,823 | | |
Total | | | | | | | 32,034,957 | | |
Human Service Provider 0.6% | |
Dutchess County Local Development Corp.
Revenue Bonds
Anderson Center Services, Inc. Project
Series 2010
10/01/30 | | | 6.000 | % | | | 1,000,000 | | | | 1,048,020 | | |
Independent Power 0.5% | |
Suffolk County Industrial Development Agency
Revenue Bonds
Nissequogue Cogen Partners Facility
Series 1998 AMT(a)
01/01/23 | | | 5.500 | % | | | 930,000 | | | | 930,019 | | |
The accompanying Notes to Financial Statements are an integral part of this statement.
Annual Report 2014
10
Columbia New York Tax-Exempt Fund
Portfolio of Investments (continued)
October 31, 2014
Municipal Bonds (continued)
Issue
Description | | Coupon
Rate | | Principal
Amount ($) | |
Value ($) | |
Investor Owned 2.0% | |
New York State Energy Research & Development Authority
Revenue Bonds
Brooklyn Union Gas Co. Project
Series 1996 (NPFGC)
01/01/21 | | | 5.500 | % | | | 2,000,000 | | | | 2,008,520 | | |
New York State Energy Research & Development Authority(b)
Revenue Bonds
Series 1993
04/01/20 | | | 12.302 | % | | | 1,500,000 | | | | 1,504,020 | | |
Total | | | | | | | 3,512,540 | | |
Local Appropriation 1.3% | |
New York State Dormitory Authority
Revenue Bonds
Capital Appreciation-Court Facilities-Westchester
Series 1998(c)
08/01/19 | | | 0.000 | % | | | 1,200,000 | | | | 1,125,960 | | |
Suffolk County Judicial Facilities Agency
Revenue Bonds
H. Lee Dennison Building
Series 2013
11/01/25 | | | 5.000 | % | | | 1,000,000 | | | | 1,129,910 | | |
Total | | | | | | | 2,255,870 | | |
Local General Obligation 5.8% | |
City of New York
Unlimited General Obligation Bonds
Series 2013J
08/01/24 | | | 5.000 | % | | | 1,000,000 | | | | 1,208,230 | | |
Subordinated Series 2009I-1
04/01/27 | | | 5.125 | % | | | 1,500,000 | | | | 1,717,470 | | |
Unlimited General Obligation Refunding Bonds
Fiscal 2015
Series 2014A
08/01/31 | | | 5.000 | % | | | 500,000 | | | | 588,135 | | |
08/01/32 | | | 5.000 | % | | | 500,000 | | | | 586,280 | | |
City of Syracuse
Unlimited General Obligation Bonds
Airport Terminal Security Access Improvement
Series 2011 AMT(a)
11/01/36 | | | 5.000 | % | | | 1,750,000 | | | | 1,884,698 | | |
County of Monroe
Unlimited General Obligation Refunding & Public Improvement Bonds
Series 1996 (NPFGC)
03/01/15 | | | 6.000 | % | | | 1,250,000 | | | | 1,271,775 | | |
Mount Sinai Union Free School District
Unlimited General Obligation Refunding Bonds
Series 1992 (AMBAC)
02/15/19 | | | 6.200 | % | | | 1,005,000 | | | | 1,210,110 | | |
Municipal Bonds (continued)
Issue
Description | | Coupon
Rate | | Principal
Amount ($) | |
Value ($) | |
New York State Dormitory Authority
Revenue Bonds
School Districts Bond Financing
Series 2013F
10/01/21 | | | 5.000 | % | | | 1,000,000 | | | | 1,202,530 | | |
Sullivan West Central School District
Unlimited General Obligation Refunding Bonds
Series 2012
04/15/24 | | | 5.000 | % | | | 500,000 | | | | 609,505 | | |
Total | | | | | | | 10,278,733 | | |
Multi-Family 2.3% | |
Housing Development Corp.
Revenue Bonds
Gateway Apartments
Series 2009A
09/15/25 | | | 4.500 | % | | | 165,000 | | | | 175,986 | | |
Series 2009C-1
11/01/34 | | | 5.500 | % | | | 500,000 | | | | 538,285 | | |
Series 2009M
11/01/45 | | | 5.150 | % | | | 1,250,000 | | | | 1,319,725 | | |
Onondaga Civic Development Corp.
Revenue Bonds
Upstate Properties Development, Inc.
Series 2011
12/01/41 | | | 5.250 | % | | | 1,945,000 | | | | 2,122,423 | | |
Total | | | | | | | 4,156,419 | | |
Municipal Power 2.4% | |
Long Island Power Authority
Revenue Bonds
Series 2008A
05/01/33 | | | 6.000 | % | | | 1,000,000 | | | | 1,173,060 | | |
Series 2009A
04/01/23 | | | 5.000 | % | | | 750,000 | | | | 833,798 | | |
Series 2012A
09/01/37 | | | 5.000 | % | | | 2,000,000 | | | | 2,201,020 | | |
Total | | | | | | | 4,207,878 | | |
Nursing Home 0.4% | |
Amherst Industrial Development Agency
Revenue Bonds
Beechwood Health Care Center, Inc.
Series 2007
01/01/40 | | | 5.200 | % | | | 690,000 | | | | 695,341 | | |
Other Bond Issue 0.3% | |
Westchester County Industrial Development Agency
Revenue Bonds
Guiding Eyes for the Blind
Series 2004
08/01/24 | | | 5.375 | % | | | 485,000 | | | | 495,588 | | |
The accompanying Notes to Financial Statements are an integral part of this statement.
Annual Report 2014
11
Columbia New York Tax-Exempt Fund
Portfolio of Investments (continued)
October 31, 2014
Municipal Bonds (continued)
Issue
Description | | Coupon
Rate | | Principal
Amount ($) | |
Value ($) | |
Other Industrial Development Bond 2.8% | |
New York Liberty Development Corp.
Revenue Bonds
Goldman Sachs Headquarters
Series 2007
10/01/37 | | | 5.500 | % | | | 2,000,000 | | | | 2,433,680 | | |
Onondaga County Industrial Development Agency
Revenue Bonds
Bristol-Meyers Squibb Co. Project
Series 1994 AMT(a)
03/01/24 | | | 5.750 | % | | | 2,000,000 | | | | 2,524,420 | | |
Total | | | | | | | 4,958,100 | | |
Pool/Bond Bank 2.6% | |
New York State Dormitory Authority
Revenue Bonds
School Districts Financing Program
Series 2009C (AGM)
10/01/36 | | | 5.125 | % | | | 1,000,000 | | | | 1,131,840 | | |
New York State Environmental Facilities Corp.
Revenue Bonds
Revolving Funds-Pooled Financing
Series 2005B
04/15/35 | | | 5.500 | % | | | 1,000,000 | | | | 1,318,260 | | |
Series 2009A
06/15/34 | | | 5.000 | % | | | 2,000,000 | | | | 2,259,320 | | |
Total | | | | | | | 4,709,420 | | |
Ports 4.4% | |
Port Authority of New York & New Jersey
Revenue Bonds
Consolidated 85th
Series 1993
03/01/28 | | | 5.375 | % | | | 2,000,000 | | | | 2,484,600 | | |
Consolidated 93rd
Series 1994
06/01/94 | | | 6.125 | % | | | 2,250,000 | | | | 2,666,812 | | |
Port Authority of New York & New Jersey(a)
Refunding Revenue Bonds
Consolidated 186th
Series 2014 AMT
10/15/44 | | | 5.000 | % | | | 1,000,000 | | | | 1,113,590 | | |
Revenue Bonds
Consolidated 143rd
Series 2006 (AGM) AMT
10/01/21 | | | 5.000 | % | | | 1,000,000 | | | | 1,059,720 | | |
Consolidated 147th
Series 2007 (NPFGC) AMT
10/15/26 | | | 5.000 | % | | | 500,000 | | | | 541,205 | | |
Total | | | | | | | 7,865,927 | | |
Municipal Bonds (continued)
Issue
Description | | Coupon
Rate | | Principal
Amount ($) | |
Value ($) | |
Prep School 1.9% | |
Build NYC Resource Corp.
Revenue Bonds
Bronx Charter School for Excellence
Series 2013
04/01/33 | | | 5.000 | % | | | 1,000,000 | | | | 1,050,400 | | |
International Leadership Charter School
Series 2013
07/01/33 | | | 5.750 | % | | | 1,500,000 | | | | 1,529,595 | | |
New York State Dormitory Authority
Revenue Bonds
Convent-Sacred Heart
Series 2011 (AGM)
11/01/35 | | | 5.625 | % | | | 750,000 | | | | 872,828 | | |
Total | | | | | | | 3,452,823 | | |
Recreation 3.0% | |
Build NYC Resource Corp.
Revenue Bonds
YMCA of Greater NY Project
Series 2012
08/01/32 | | | 5.000 | % | | | 500,000 | | | | 548,365 | | |
New York City Industrial Development Agency
Revenue Bonds
Pilot-Queens Baseball Stadium
Series 2006 (AMBAC)
01/01/24 | | | 5.000 | % | | | 500,000 | | | | 516,340 | | |
Pilot-Yankee Stadium
Series 2009 (AGM)
03/01/49 | | | 7.000 | % | | | 250,000 | | | | 304,345 | | |
New York City Trust for Cultural Resources
Refunding Revenue Bonds
American Museum of Natural History
Series 2014S
07/01/41 | | | 5.000 | % | | | 2,000,000 | | | | 2,284,700 | | |
Museum of Modern Art
Series 2008-1A
04/01/31 | | | 5.000 | % | | | 750,000 | | | | 840,060 | | |
Revenue Bonds
Lincoln Center
Series 2008C
12/01/18 | | | 5.250 | % | | | 750,000 | | | | 859,635 | | |
Total | | | | | | | 5,353,445 | | |
Refunded/Escrowed 1.9% | |
New York State Dormitory Authority
Prerefunded 07/01/18 Revenue Bonds
Rochester Institute of Technology
Series 2008A
07/01/33 | | | 6.000 | % | | | 1,000,000 | | | | 1,187,910 | | |
The accompanying Notes to Financial Statements are an integral part of this statement.
Annual Report 2014
12
Columbia New York Tax-Exempt Fund
Portfolio of Investments (continued)
October 31, 2014
Municipal Bonds (continued)
Issue
Description | | Coupon
Rate | | Principal
Amount ($) | |
Value ($) | |
Triborough Bridge & Tunnel Authority
Prerefunded 01/01/22 Revenue Bonds
General Purpose
Series 1999B
01/01/30 | | | 5.500 | % | | | 1,800,000 | | | | 2,258,262 | | |
Total | | | | | | | 3,446,172 | | |
Retirement Communities 3.1% | |
New York State Dormitory Authority
Revenue Bonds
Miriam Osborn Memorial Home Association
Series 2012
07/01/29 | | | 5.000 | % | | | 1,000,000 | | | | 1,076,060 | | |
Suffolk County Economic Development Corp.
Refunding Revenue Bonds
Peconic Landing Southold
Series 2010
12/01/40 | | | 6.000 | % | | | 1,225,000 | | | | 1,354,691 | | |
Suffolk County Industrial Development Agency
Refunding Revenue Bonds
Jeffersons Ferry Project
Series 2006
11/01/28 | | | 5.000 | % | | | 1,335,000 | | | | 1,383,300 | | |
Ulster County Capital Resource Corp.
Refunding Revenue Bonds
Alliance Senior Living Co.
Series 2014A(b)(d)
09/15/44 | | | 0.000 | % | | | 1,100,000 | | | | 760,705 | | |
Ulster County Industrial Development Agency
Revenue Bonds
Series 2007A
09/15/42 | | | 6.000 | % | | | 1,000,000 | | | | 883,570 | | |
Total | | | | | | | 5,458,326 | | |
Single Family 0.1% | |
New York Mortgage Agency
Revenue Bonds
Series 2007-140 AMT(a)
10/01/21 | | | 4.600 | % | | | 200,000 | | | | 204,912 | | |
Special Non Property Tax 6.2% | |
Metropolitan Transportation Authority
Revenue Bonds
Series 2009A
11/15/26 | | | 5.300 | % | | | 700,000 | | | | 800,513 | | |
Series 2009B
11/15/34 | | | 5.000 | % | | | 1,000,000 | | | | 1,130,440 | | |
Metropolitan Transportation Authority(c)
Refunding Revenue Bonds
Series 2012A
11/15/32 | | | 0.000 | % | | | 2,500,000 | | | | 1,325,625 | | |
Municipal Bonds (continued)
Issue
Description | | Coupon
Rate | | Principal
Amount ($) | |
Value ($) | |
Nassau County Interim Finance Authority
Revenue Bonds
Sales Tax Secured
Series 2009A
11/15/24 | | | 5.000 | % | | | 250,000 | | | | 287,730 | | |
New York City Transitional Finance Authority Building Aid
Revenue Bonds
Fiscal 2009
Series 2009S-3
01/15/22 | | | 5.000 | % | | | 1,000,000 | | | | 1,139,180 | | |
Series 2009S-5
01/15/32 | | | 5.000 | % | | | 1,000,000 | | | | 1,117,240 | | |
New York City Transitional Finance Authority
Refunded Revenue Bonds
Future Tax Secured
Subordinated Series 2012B
11/01/30 | | | 5.000 | % | | | 500,000 | | | | 590,525 | | |
Subordinated Revenue Bonds
Future Tax Secured
Subordinated Series 2007B
11/01/26 | | | 5.000 | % | | | 1,035,000 | | | | 1,133,045 | | |
New York State Dormitory Authority
Revenue Bonds
Education
Series 2008B
03/15/36 | | | 5.750 | % | | | 500,000 | | | | 582,670 | | |
Series 2009A
03/15/28 | | | 5.000 | % | | | 1,545,000 | | | | 1,761,161 | | |
New York State Thruway Authority Highway & Bridge Trust Fund
Revenue Bonds
Series 2009A-1
04/01/29 | | | 5.000 | % | | | 1,000,000 | | | | 1,126,440 | | |
Total | | | | | | | 10,994,569 | | |
State Appropriated 4.5% | |
Erie County Industrial Development Agency (The)
Revenue Bonds
School District of Buffalo Project
Series 2011A
05/01/32 | | | 5.250 | % | | | 1,000,000 | | | | 1,164,510 | | |
Series 2013A
05/01/26 | | | 5.000 | % | | | 1,000,000 | | | | 1,183,670 | | |
New York Local Government Assistance Corp.
Refunding Revenue Bonds
Senior Lien
Series 2007A
04/01/19 | | | 5.000 | % | | | 1,000,000 | | | | 1,106,740 | | |
New York State Dormitory Authority
Revenue Bonds
Consolidated City University System 2nd Generation
Series 1993A
07/01/20 | | | 6.000 | % | | | 2,000,000 | | | | 2,381,700 | | |
The accompanying Notes to Financial Statements are an integral part of this statement.
Annual Report 2014
13
Columbia New York Tax-Exempt Fund
Portfolio of Investments (continued)
October 31, 2014
Municipal Bonds (continued)
Issue
Description | | Coupon
Rate | | Principal
Amount ($) | |
Value ($) | |
NYSARC, Inc.
Series 2012A
07/01/22 | | | 5.000 | % | | | 890,000 | | | | 1,039,965 | | |
State University Educational Facilities
Series 2000C (AGM)
05/15/17 | | | 5.750 | % | | | 1,000,000 | | | | 1,128,640 | | |
Total | | | | | | | 8,005,225 | | |
Student Loan —% | |
New York Mortgage Agency
Revenue Bonds
New York State Higher Education Finance
Series 2009
11/01/26 | | | 4.750 | % | | | 75,000 | | | | 79,554 | | |
Tobacco 0.6% | |
Chautauqua Tobacco Asset Securitization Corp.
Refunding Revenue Bonds
Series 2014(e)
06/01/34 | | | 5.000 | % | | | 1,000,000 | | | | 1,057,690 | | |
Transportation 5.6% | |
Metropolitan Transportation Authority
Revenue Bonds
Series 2005B (AMBAC)
11/15/23 | | | 5.250 | % | | | 1,250,000 | | | | 1,532,375 | | |
Series 2011D
11/15/36 | | | 5.000 | % | | | 1,000,000 | | | | 1,119,310 | | |
Series 2012E
11/15/31 | | | 5.000 | % | | | 2,000,000 | | | | 2,294,580 | | |
Transportation
Series 2005F
11/15/35 | | | 5.000 | % | | | 500,000 | | | | 516,210 | | |
Series 2006A
11/15/22 | | | 5.000 | % | | | 750,000 | | | | 817,822 | | |
Series 2010D
11/15/34 | | | 5.000 | % | | | 1,350,000 | | | | 1,497,312 | | |
Series 2014B
11/15/44 | | | 5.000 | % | | | 2,000,000 | | | | 2,210,720 | | |
Total | | | | | | | 9,988,329 | | |
Turnpike/Bridge/Toll Road 5.2% | |
New York State Thruway Authority
Revenue Bonds
General
Series 2012I
01/01/32 | | | 5.000 | % | | | 2,000,000 | | | | 2,257,520 | | |
Series 2014J
01/01/41 | | | 5.000 | % | | | 3,000,000 | | | | 3,357,630 | | |
Unrefunded Revenue Bonds
Series 2005F (AMBAC)
01/01/25 | | | 5.000 | % | | | 1,335,000 | | | | 1,345,306 | | |
Triborough Bridge & Tunnel Authority
Refunding Revenue Bonds
Subordinated Series 2013A
11/15/27 | | | 5.000 | % | | | 2,000,000 | | | | 2,370,060 | | |
Total | | | | | | | 9,330,516 | | |
Municipal Bonds (continued)
Issue
Description | | Coupon
Rate | | Principal
Amount ($) | |
Value ($) | |
Water & Sewer 5.4% | |
Great Neck North Water Authority
Revenue Bonds
Series 2008
01/01/33 | | | 5.000 | % | | | 690,000 | | | | 755,867 | | |
New York City Water & Sewer System
Refunding Revenue Bonds
Series 2011AA
06/15/44 | | | 5.000 | % | | | 1,000,000 | | | | 1,098,480 | | |
Revenue Bonds
Fiscal 2009
Series 2008A
06/15/40 | | | 5.750 | % | | | 1,000,000 | | | | 1,151,470 | | |
Series 2008CC
06/15/34 | | | 5.000 | % | | | 3,500,000 | | | | 3,893,260 | | |
Series 2009EE
06/15/40 | | | 5.250 | % | | | 500,000 | | | | 566,065 | | |
Niagara Falls Public Water Authority
Revenue Bonds
Series 2013A
07/15/29 | | | 5.000 | % | | | 1,000,000 | | | | 1,122,050 | | |
Rensselaer County Water Service & Sewer Authority
Revenue Bonds
Water Service
Series 2008
09/01/38 | | | 5.250 | % | | | 1,000,000 | | | | 1,051,580 | | |
Total | | | | | | | 9,638,772 | | |
Total Municipal Bonds
(Cost: $158,718,689) | | | | | | | 173,819,845 | | |
Money Market Funds 0.5%
| | | Shares | | Value ($) | |
Dreyfus New York AMT-Free
Municipal Money Market Fund,
0.000%(f) | | | 804,868 | | | | 804,868 | | |
JPMorgan Tax-Free Money
Market Fund, 0.010%(f) | | | 167,457 | | | | 167,457 | | |
Total Money Market Funds
(Cost: $972,325) | | | | | 972,325 | | |
Total Investments
(Cost: $159,691,014) | | | | | 174,792,170 | | |
Other Assets & Liabilities, Net | | | | | 3,445,599 | | |
Net Assets | | | | | 178,237,769 | | |
The accompanying Notes to Financial Statements are an integral part of this statement.
Annual Report 2014
14
Columbia New York Tax-Exempt Fund
Portfolio of Investments (continued)
October 31, 2014
Notes to Portfolio of Investments
(a) Income from this security may be subject to alternative minimum tax.
(b) Variable rate security.
(c) Zero coupon bond.
(d) Security exempt from registration pursuant to Rule 144A under the Securities Act of 1933. This security may be resold in transactions exempt from registration, normally to qualified institutional buyers. At October 31, 2014, the value of these securities amounted to $760,705 or 0.43% of net assets.
(e) Represents a security purchased on a when-issued or delayed delivery basis.
(f) The rate shown is the seven-day current annualized yield at October 31, 2014.
Abbreviation Legend
AGM Assured Guaranty Municipal Corporation
AMBAC Ambac Assurance Corporation
AMT Alternative Minimum Tax
FHA Federal Housing Authority
NPFGC National Public Finance Guarantee Corporation
Fair Value Measurements
Generally accepted accounting principles (GAAP) require disclosure regarding the inputs and valuation techniques used to measure fair value and any changes in valuation inputs or techniques. In addition, investments shall be disclosed by major category.
The Fund categorizes its fair value measurements according to a three-level hierarchy that maximizes the use of observable inputs and minimizes the use of unobservable inputs by prioritizing that the most observable input be used when available. Observable inputs are those that market participants would use in pricing an investment based on market data obtained from sources independent of the reporting entity. Unobservable inputs are those that reflect the Fund's assumptions about the information market participants would use in pricing an investment. An investment's level within the fair value hierarchy is based on the lowest level of any input that is deemed significant to the asset or liability's fair value measurement. The input levels are not necessarily an indication of the risk or liquidity associated with investments at that level. For example, certain U.S. government securities are generally high quality and liquid, however, they are reflected as Level 2 because the inputs used to determine fair value may not always be quoted prices in an active market.
Fair value inputs are summarized in the three broad levels listed below:
> Level 1 — Valuations based on quoted prices for investments in active markets that the Fund has the ability to access at the measurement date (including NAV for open-end mutual funds). Valuation adjustments are not applied to Level 1 investments.
> Level 2 — Valuations based on other significant observable inputs (including quoted prices for similar securities, interest rates, prepayment speeds, credit risks, etc.).
> Level 3 — Valuations based on significant unobservable inputs (including the Fund's own assumptions and judgment in determining the fair value of investments).
Inputs that are used in determining fair value of an investment may include price information, credit data, volatility statistics, and other factors. These inputs can be either observable or unobservable. The availability of observable inputs can vary between investments, and is affected by various factors such as the type of investment, and the volume and level of activity for that investment or similar investments in the marketplace. The inputs will be considered by the Investment Manager, along with any other relevant factors in the calculation of an investment's fair value. The Fund uses prices and inputs that are current as of the measurement date, which may include periods of market dislocations. During these periods, the availability of prices and inputs may be reduced for many investments. This condition could cause an investment to be reclassified between the various levels within the hierarchy.
Investments falling into the Level 3 category are primarily supported by quoted prices from brokers and dealers participating in the market for those investments. However, these may be classified as Level 3 investments due to lack of market transparency and corroboration to support these quoted prices. Additionally, valuation models may be used as the pricing source for any remaining investments classified as Level 3. These models may rely on one or more significant unobservable inputs and/or significant assumptions by the Investment Manager. Inputs used in valuations may include, but are not limited to, financial statement analysis, capital account balances, discount rates and estimated cash flows, and comparable company data.
The accompanying Notes to Financial Statements are an integral part of this statement.
Annual Report 2014
15
Columbia New York Tax-Exempt Fund
Portfolio of Investments (continued)
October 31, 2014
Fair Value Measurements (continued)
Under the direction of the Fund's Board of Trustees (the Board), the Investment Manager's Valuation Committee (the Committee) is responsible for overseeing the valuation procedures approved by the Board. The Committee consists of voting and non-voting members from various groups within the Investment Manager's organization, including operations and accounting, trading and investments, compliance, risk management and legal.
The Committee meets at least monthly to review and approve valuation matters, which may include a description of specific valuation determinations, data regarding pricing information received from approved pricing vendors and brokers and the results of Board-approved valuation control policies and procedures (the Policies). The Policies address, among other things, instances when market quotations are or are not readily available, including recommendations of third party pricing vendors and a determination of appropriate pricing methodologies; events that require specific valuation determinations and assessment of fair value techniques; securities with a potential for stale pricing, including those that are illiquid, restricted, or in default; and the effectiveness of third party pricing vendors, including periodic reviews of vendors. The Committee meets more frequently, as needed, to discuss additional valuation matters, which may include the need to review back-testing results, review time-sensitive information or approve related valuation actions. The Committee reports to the Board, with members of the Committee meeting with the Board at each of its regularly scheduled meetings to discuss valuation matters and actions during the period, similar to those described earlier.
For investments categorized as Level 3, the Committee monitors information similar to that described above, which may include: (i) data specific to the issuer or comparable issuers, (ii) general market or specific sector news and (iii) quoted prices and specific or similar security transactions. The Committee considers this data and any changes from prior periods in order to assess the reasonableness of observable and unobservable inputs, any assumptions or internal models used to value those securities and changes in fair value. This data is also used to corroborate, when available, information received from approved pricing vendors and brokers. Various factors impact the frequency of monitoring this information (which may occur as often as daily). However, the Committee may determine that changes to inputs, assumptions and models are not required as a result of the monitoring procedures performed.
The following table is a summary of the inputs used to value the Fund's investments at October 31, 2014:
Description | | Level 1
Quoted Prices in Active
Markets for Identical
Assets ($) | |
Level 2
Other Significant
Observable Inputs ($) | |
Level 3
Significant
Unobservable Inputs ($) | |
Total ($) | |
Bonds | |
Municipal Bonds | | | — | | | | 173,819,845 | | | | — | | | | 173,819,845 | | |
Total Bonds | | | — | | | | 173,819,845 | | | | — | | | | 173,819,845 | | |
Mutual Funds | |
Money Market Funds | | | 972,325 | | | | — | | | | — | | | | 972,325 | | |
Total Mutual Funds | | | 972,325 | | | | — | | | | — | | | | 972,325 | | |
Total | | | 972,325 | | | | 173,819,845 | | | | — | | | | 174,792,170 | | |
See the Portfolio of Investments for all investment classifications not indicated in the table.
The Fund's assets assigned to the Level 2 input category are generally valued using the market approach, in which a security's value is determined through reference to prices and information from market transactions for similar or identical assets.
There were no transfers of financial assets between Levels during the period.
The accompanying Notes to Financial Statements are an integral part of this statement.
Annual Report 2014
16
Columbia New York Tax-Exempt Fund
Statement of Assets and Liabilities
October 31, 2014
Assets | |
Investments, at value | |
(identified cost $159,691,014) | | $ | 174,792,170 | | |
Receivable for: | |
Investments sold | | | 2,321,607 | | |
Capital shares sold | | | 436,278 | | |
Interest | | | 2,574,187 | | |
Expense reimbursement due from Investment Manager | | | 596 | | |
Prepaid expenses | | | 1,418 | | |
Trustees' deferred compensation plan | | | 33,768 | | |
Total assets | | | 180,160,024 | | |
Liabilities | |
Payable for: | |
Investments purchased on a delayed delivery basis | | | 1,058,430 | | |
Capital shares purchased | | | 203,149 | | |
Dividend distributions to shareholders | | | 529,721 | | |
Investment management fees | | | 1,953 | | |
Distribution and/or service fees | | | 1,342 | | |
Transfer agent fees | | | 29,562 | | |
Administration fees | | | 342 | | |
Compensation of board members | | | 449 | | |
Chief compliance officer expenses | | | 8 | | |
Other expenses | | | 63,531 | | |
Trustees' deferred compensation plan | | | 33,768 | | |
Total liabilities | | | 1,922,255 | | |
Net assets applicable to outstanding capital stock | | $ | 178,237,769 | | |
Represented by | |
Paid-in capital | | $ | 163,431,571 | | |
Undistributed net investment income | | | 341,120 | | |
Accumulated net realized loss | | | (636,078 | ) | |
Unrealized appreciation (depreciation) on: | |
Investments | | | 15,101,156 | | |
Total — representing net assets applicable to outstanding capital stock | | $ | 178,237,769 | | |
The accompanying Notes to Financial Statements are an integral part of this statement.
Annual Report 2014
17
Columbia New York Tax-Exempt Fund
Statement of Assets and Liabilities (continued)
October 31, 2014
Class A | |
Net assets | | $ | 147,023,553 | | |
Shares outstanding | | | 19,565,387 | | |
Net asset value per share | | $ | 7.51 | | |
Maximum offering price per share(a) | | $ | 7.88 | | |
Class B | |
Net assets | | $ | 654,273 | | |
Shares outstanding | | | 87,101 | | |
Net asset value per share | | $ | 7.51 | | |
Class C | |
Net assets | | $ | 16,578,317 | | |
Shares outstanding | | | 2,206,924 | | |
Net asset value per share | | $ | 7.51 | | |
Class R4 | |
Net assets | | $ | 10,425 | | |
Shares outstanding | | | 1,390 | | |
Net asset value per share | | $ | 7.50 | | |
Class R5 | |
Net assets | | $ | 10,373 | | |
Shares outstanding | | | 1,384 | | |
Net asset value per share | | $ | 7.49 | | |
Class Z | |
Net assets | | $ | 13,960,828 | | |
Shares outstanding | | | 1,859,334 | | |
Net asset value per share | | $ | 7.51 | | |
(a) The maximum offering price per share is calculated by dividing the net asset value per share by 1.0 minus the maximum sales charge of 4.75%.
The accompanying Notes to Financial Statements are an integral part of this statement.
Annual Report 2014
18
Columbia New York Tax-Exempt Fund
Statement of Operations
Year Ended October 31, 2014
Net investment income | |
Income: | |
Dividends | | $ | 131 | | |
Interest | | | 7,695,989 | | |
Total income | | | 7,696,120 | | |
Expenses: | |
Investment management fees | | | 682,302 | | |
Distribution and/or service fees | |
Class A | | | 363,583 | | |
Class B | | | 6,908 | | |
Class C | | | 159,642 | | |
Transfer agent fees | |
Class A | | | 157,126 | | |
Class B | | | 745 | | |
Class C | | | 17,260 | | |
Class R4 | | | 7 | | |
Class R5 | | | 7 | | |
Class Z | | | 9,341 | | |
Administration fees | | | 119,403 | | |
Compensation of board members | | | 25,024 | | |
Custodian fees | | | 2,220 | | |
Printing and postage fees | | | 30,864 | | |
Registration fees | | | 40,191 | | |
Professional fees | | | 29,258 | | |
Chief compliance officer expenses | | | 85 | | |
Other | | | 20,866 | | |
Total expenses | | | 1,664,832 | | |
Fees waived or expenses reimbursed by Investment Manager and its affiliates | | | (230,452 | ) | |
Fees waived by Distributor — Class C | | | (47,893 | ) | |
Expense reductions | | | (200 | ) | |
Total net expenses | | | 1,386,287 | | |
Net investment income | | | 6,309,833 | | |
Realized and unrealized gain (loss) — net | |
Net realized gain (loss) on: | |
Investments | | | (344,736 | ) | |
Net realized loss | | | (344,736 | ) | |
Net change in unrealized appreciation (depreciation) on: | |
Investments | | | 8,391,798 | | |
Net change in unrealized appreciation | | | 8,391,798 | | |
Net realized and unrealized gain | | | 8,047,062 | | |
Net increase in net assets resulting from operations | | $ | 14,356,895 | | |
The accompanying Notes to Financial Statements are an integral part of this statement.
Annual Report 2014
19
Columbia New York Tax-Exempt Fund
Statement of Changes in Net Assets
| | | Year Ended
October 31,
2014 | | Year Ended
October 31,
2013(a)(b) | |
Operations | |
Net investment income | | $ | 6,309,833 | | | $ | 6,718,043 | | |
Net realized gain (loss) | | | (344,736 | ) | | | 1,216,313 | | |
Net change in unrealized appreciation (depreciation) | | | 8,391,798 | | | | (14,263,344 | ) | |
Net increase (decrease) in net assets resulting from operations | | | 14,356,895 | | | | (6,328,988 | ) | |
Distributions to shareholders | |
Net investment income | |
Class A | | | (5,385,619 | ) | | | (5,865,166 | ) | |
Class B | | | (20,441 | ) | | | (29,594 | ) | |
Class C | | | (519,223 | ) | | | (596,393 | ) | |
Class R4 | | | (271 | ) | | | (57 | ) | |
Class R5 | | | (557 | ) | | | (90 | ) | |
Class Z | | | (334,589 | ) | | | (188,432 | ) | |
Net realized gains | |
Class A | | | (961,038 | ) | | | (964,902 | ) | |
Class B | | | (5,041 | ) | | | (7,428 | ) | |
Class C | | | (107,407 | ) | | | (110,755 | ) | |
Class R4 | | | (16 | ) | | | — | | |
Class R5 | | | (15 | ) | | | (13 | ) | |
Class Z | | | (48,653 | ) | | | (5,533 | ) | |
Total distributions to shareholders | | | (7,382,870 | ) | | | (7,768,363 | ) | |
Increase (decrease) in net assets from capital stock activity | | | 1,052,198 | | | | (16,261,740 | ) | |
Total increase (decrease) in net assets | | | 8,026,223 | | | | (30,359,091 | ) | |
Net assets at beginning of year | | | 170,211,546 | | | | 200,570,637 | | |
Net assets at end of year | | $ | 178,237,769 | | | $ | 170,211,546 | | |
Undistributed net investment income | | $ | 341,120 | | | $ | 353,652 | | |
(a) Class R4 shares are based on operations from March 19, 2013 (commencement of operations) through the stated period end.
(b) Class R5 shares are based on operations from November 8, 2012 (commencement of operations) through the stated period end.
The accompanying Notes to Financial Statements are an integral part of this statement.
Annual Report 2014
20
Columbia New York Tax-Exempt Fund
Statement of Changes in Net Assets (continued)
| | | Year Ended October 31, 2014 | | Year Ended October 31, 2013(a)(b) | |
| | | Shares | | Dollars ($) | | Shares | | Dollars ($) | |
Capital stock activity | |
Class A shares | |
Subscriptions(c) | | | 1,973,518 | | | | 14,381,177 | | | | 1,676,945 | | | | 12,757,758 | | |
Distributions reinvested | | | 705,111 | | | | 5,149,430 | | | | 720,949 | | | | 5,430,735 | | |
Redemptions | | | (3,270,079 | ) | | | (23,841,731 | ) | | | (5,173,906 | ) | | | (38,510,384 | ) | |
Net decrease | | | (591,450 | ) | | | (4,311,124 | ) | | | (2,776,012 | ) | | | (20,321,891 | ) | |
Class B shares | |
Subscriptions | | | 881 | | | | 6,418 | | | | 1,016 | | | | 7,677 | | |
Distributions reinvested | | | 1,735 | | | | 12,641 | | | | 2,861 | | | | 21,689 | | |
Redemptions(c) | | | (23,362 | ) | | | (169,485 | ) | | | (75,268 | ) | | | (569,116 | ) | |
Net decrease | | | (20,746 | ) | | | (150,426 | ) | | | (71,391 | ) | | | (539,750 | ) | |
Class C shares | |
Subscriptions | | | 308,797 | | | | 2,262,846 | | | | 345,250 | | | | 2,621,770 | | |
Distributions reinvested | | | 55,968 | | | | 408,608 | | | | 63,230 | | | | 476,946 | | |
Redemptions | | | (412,179 | ) | | | (2,986,008 | ) | | | (763,342 | ) | | | (5,661,238 | ) | |
Net decrease | | | (47,414 | ) | | | (314,554 | ) | | | (354,862 | ) | | | (2,562,522 | ) | |
Class R4 shares | |
Subscriptions | | | 1,061 | | | | 7,696 | | | | 328 | | | | 2,500 | | |
Distributions reinvested | | | — | | | | — | | | | 1 | | | | 8 | | |
Net increase | | | 1,061 | | | | 7,696 | | | | 329 | | | | 2,508 | | |
Class R5 shares | |
Subscriptions | | | 12,785 | | | | 90,667 | | | | 321 | | | | 2,500 | | |
Distributions reinvested | | | — | | | | — | | | | 1 | | | | 8 | | |
Redemptions | | | (11,723 | ) | | | (84,407 | ) | | | — | | | | — | | |
Net increase | | | 1,062 | | | | 6,260 | | | | 322 | | | | 2,508 | | |
Class Z shares | |
Subscriptions | | | 1,006,539 | | | | 7,455,686 | | | | 1,140,510 | | | | 8,538,104 | | |
Distributions reinvested | | | 7,946 | | | | 58,506 | | | �� | 6,288 | | | | 47,273 | | |
Redemptions | | | (236,220 | ) | | | (1,699,846 | ) | | | (193,980 | ) | | | (1,427,970 | ) | |
Net increase | | | 778,265 | | | | 5,814,346 | | | | 952,818 | | | | 7,157,407 | | |
Total net increase (decrease) | | | 120,778 | | | | 1,052,198 | | | | (2,248,796 | ) | | | (16,261,740 | ) | |
(a) Class R4 shares are based on operations from March 19, 2013 (commencement of operations) through the stated period end.
(b) Class R5 shares are based on operations from November 8, 2012 (commencement of operations) through the stated period end.
(c) Includes conversions of Class B shares to Class A shares, if any.
The accompanying Notes to Financial Statements are an integral part of this statement.
Annual Report 2014
21
Columbia New York Tax-Exempt Fund
The following tables are intended to help you understand the Fund's financial performance. Certain information reflects financial results for a single share of a class held for the periods shown. Per share net investment income (loss) amounts are calculated based on average shares outstanding during the period. Total return assumes reinvestment of all dividends and distributions, if any. Total return does not reflect payment of sales charges, if any. Total return and portfolio turnover are not annualized for periods of less than one year. The portfolio turnover rate is calculated without regard to purchase and sales transactions of short-term instruments and certain derivatives, if any. If such transactions were included, the Fund's portfolio turnover rate may be higher.
| | | Year Ended October 31, | |
Class A | | 2014 | | 2013 | | 2012 | | 2011 | | 2010 | |
Per share data | |
Net asset value, beginning of period | | $ | 7.21 | | | $ | 7.76 | | | $ | 7.27 | | | $ | 7.34 | | | $ | 7.25 | | |
Income from investment operations: | |
Net investment income | | | 0.27 | | | | 0.27 | | | | 0.28 | | | | 0.29 | | | | 0.30 | | |
Net realized and unrealized gain (loss) | | | 0.35 | | | | (0.51 | ) | | | 0.50 | | | | (0.06 | )(a) | | | 0.31 | | |
Total from investment operations | | | 0.62 | | | | (0.24 | ) | | | 0.78 | | | | 0.23 | | | | 0.61 | | |
Less distributions to shareholders: | |
Net investment income | | | (0.27 | ) | | | (0.27 | ) | | | (0.28 | ) | | | (0.29 | ) | | | (0.34 | ) | |
Net realized gains | | | (0.05 | ) | | | (0.04 | ) | | | (0.01 | ) | | | (0.01 | ) | | | (0.18 | ) | |
Total distributions to shareholders | | | (0.32 | ) | | | (0.31 | ) | | | (0.29 | ) | | | (0.30 | ) | | | (0.52 | ) | |
Net asset value, end of period | | $ | 7.51 | | | $ | 7.21 | | | $ | 7.76 | | | $ | 7.27 | | | $ | 7.34 | | |
Total return | | | 8.80 | % | | | (3.20 | %) | | | 10.90 | % | | | 3.40 | % | | | 8.86 | % | |
Ratios to average net assets(b) | |
Total gross expenses | | | 0.92 | % | | | 0.91 | % | | | 0.93 | % | | | 1.02 | % | | | 1.12 | % | |
Total net expenses(c) | | | 0.78 | %(d) | | | 0.78 | %(d) | | | 0.79 | %(d) | | | 0.82 | %(d) | | | 0.84 | %(d) | |
Net investment income | | | 3.73 | % | | | 3.57 | % | | | 3.70 | % | | | 4.04 | % | | | 4.11 | % | |
Supplemental data | |
Net assets, end of period (in thousands) | | $ | 147,024 | | | $ | 145,384 | | | $ | 177,945 | | | $ | 163,405 | | | $ | 54,888 | | |
Portfolio turnover | | | 11 | % | | | 15 | % | | | 24 | % | | | 22 | % | | | 9 | % | |
Notes to Financial Highlights
(a) Calculation of the net gain (loss) per share (both realized and unrealized) does not correlate to the aggregate realized and unrealized gain (loss) presented in the Statement of Operations due to the timing of subscriptions and redemptions of Fund shares in relation to fluctuations in the market value of the portfolio.
(b) In addition to the fees and expenses that the Fund bears directly, the Fund indirectly bears a pro rata share of the fees and expenses of any other funds in which it invests. Such indirect expenses are not included in the Fund's reported expense ratios.
(c) Total net expenses include the impact of certain fee waivers/expense reimbursements made by the Investment Manager and certain of its affiliates, if applicable.
(d) The benefits derived from expense reductions had an impact of less than 0.01%.
The accompanying Notes to Financial Statements are an integral part of this statement.
Annual Report 2014
22
Columbia New York Tax-Exempt Fund
Financial Highlights (continued)
| | | Year Ended October 31, | |
Class B | | 2014 | | 2013 | | 2012 | | 2011 | | 2010 | |
Per share data | |
Net asset value, beginning of period | | $ | 7.21 | | | $ | 7.76 | | | $ | 7.27 | | | $ | 7.34 | | | $ | 7.25 | | |
Income from investment operations: | |
Net investment income | | | 0.22 | | | | 0.21 | | | | 0.22 | | | | 0.24 | | | | 0.24 | | |
Net realized and unrealized gain (loss) | | | 0.34 | | | | (0.51 | ) | | | 0.50 | | | | (0.06 | )(a) | | | 0.32 | | |
Total from investment operations | | | 0.56 | | | | (0.30 | ) | | | 0.72 | | | | 0.18 | | | | 0.56 | | |
Less distributions to shareholders: | |
Net investment income | | | (0.21 | ) | | | (0.21 | ) | | | (0.22 | ) | | | (0.24 | ) | | | (0.29 | ) | |
Net realized gains | | | (0.05 | ) | | | (0.04 | ) | | | (0.01 | ) | | | (0.01 | ) | | | (0.18 | ) | |
Total distributions to shareholders | | | (0.26 | ) | | | (0.25 | ) | | | (0.23 | ) | | | (0.25 | ) | | | (0.47 | ) | |
Net asset value, end of period | | $ | 7.51 | | | $ | 7.21 | | | $ | 7.76 | | | $ | 7.27 | | | $ | 7.34 | | |
Total return | | | 7.99 | % | | | (3.93 | %) | | | 10.08 | % | | | 2.62 | % | | | 8.05 | % | |
Ratios to average net assets(b) | |
Total gross expenses | | | 1.67 | % | | | 1.66 | % | | | 1.70 | % | | | 1.87 | % | | | 1.87 | % | |
Total net expenses(c) | | | 1.53 | %(d) | | | 1.53 | %(d) | | | 1.54 | %(d) | | | 1.60 | %(d) | | | 1.59 | %(d) | |
Net investment income | | | 2.99 | % | | | 2.80 | % | | | 2.95 | % | | | 3.38 | % | | | 3.38 | % | |
Supplemental data | |
Net assets, end of period (in thousands) | | $ | 654 | | | $ | 778 | | | $ | 1,390 | | | $ | 2,202 | | | $ | 4,540 | | |
Portfolio turnover | | | 11 | % | | | 15 | % | | | 24 | % | | | 22 | % | | | 9 | % | |
Notes to Financial Highlights
(a) Calculation of the net gain (loss) per share (both realized and unrealized) does not correlate to the aggregate realized and unrealized gain (loss) presented in the Statement of Operations due to the timing of subscriptions and redemptions of Fund shares in relation to fluctuations in the market value of the portfolio.
(b) In addition to the fees and expenses that the Fund bears directly, the Fund indirectly bears a pro rata share of the fees and expenses of any other funds in which it invests. Such indirect expenses are not included in the Fund's reported expense ratios.
(c) Total net expenses include the impact of certain fee waivers/expense reimbursements made by the Investment Manager and certain of its affiliates, if applicable.
(d) The benefits derived from expense reductions had an impact of less than 0.01%.
The accompanying Notes to Financial Statements are an integral part of this statement.
Annual Report 2014
23
Columbia New York Tax-Exempt Fund
Financial Highlights (continued)
| | | Year Ended October 31, | |
Class C | | 2014 | | 2013 | | 2012 | | 2011 | | 2010 | |
Per share data | |
Net asset value, beginning of period | | $ | 7.21 | | | $ | 7.76 | | | $ | 7.27 | | | $ | 7.34 | | | $ | 7.25 | | |
Income from investment operations: | |
Net investment income | | | 0.24 | | | | 0.23 | | | | 0.25 | | | | 0.26 | | | | 0.26 | | |
Net realized and unrealized gain (loss) | | | 0.35 | | | | (0.51 | ) | | | 0.50 | | | | (0.06 | )(a) | | | 0.32 | | |
Total from investment operations | | | 0.59 | | | | (0.28 | ) | | | 0.75 | | | | 0.20 | | | | 0.58 | | |
Less distributions to shareholders: | |
Net investment income | | | (0.24 | ) | | | (0.23 | ) | | | (0.25 | ) | | | (0.26 | ) | | | (0.31 | ) | |
Net realized gains | | | (0.05 | ) | | | (0.04 | ) | | | (0.01 | ) | | | (0.01 | ) | | | (0.18 | ) | |
Total distributions to shareholders | | | (0.29 | ) | | | (0.27 | ) | | | (0.26 | ) | | | (0.27 | ) | | | (0.49 | ) | |
Net asset value, end of period | | $ | 7.51 | | | $ | 7.21 | | | $ | 7.76 | | | $ | 7.27 | | | $ | 7.34 | | |
Total return | | | 8.32 | % | | | (3.64 | %) | | | 10.41 | % | | | 2.95 | % | | | 8.37 | % | |
Ratios to average net assets(b) | |
Total gross expenses | | | 1.66 | % | | | 1.66 | % | | | 1.68 | % | | | 1.82 | % | | | 1.87 | % | |
Total net expenses(c) | | | 1.23 | %(d) | | | 1.23 | %(d) | | | 1.24 | %(d) | | | 1.28 | %(d) | | | 1.29 | %(d) | |
Net investment income | | | 3.28 | % | | | 3.12 | % | | | 3.24 | % | | | 3.64 | % | | | 3.66 | % | |
Supplemental data | |
Net assets, end of period (in thousands) | | $ | 16,578 | | | $ | 16,254 | | | $ | 20,240 | | | $ | 16,164 | | | $ | 9,401 | | |
Portfolio turnover | | | 11 | % | | | 15 | % | | | 24 | % | | | 22 | % | | | 9 | % | |
Notes to Financial Highlights
(a) Calculation of the net gain (loss) per share (both realized and unrealized) does not correlate to the aggregate realized and unrealized gain (loss) presented in the Statement of Operations due to the timing of subscriptions and redemptions of Fund shares in relation to fluctuations in the market value of the portfolio.
(b) In addition to the fees and expenses that the Fund bears directly, the Fund indirectly bears a pro rata share of the fees and expenses of any other funds in which it invests. Such indirect expenses are not included in the Fund's reported expense ratios.
(c) Total net expenses include the impact of certain fee waivers/expense reimbursements made by the Investment Manager and certain of its affiliates, if applicable.
(d) The benefits derived from expense reductions had an impact of less than 0.01%.
The accompanying Notes to Financial Statements are an integral part of this statement.
Annual Report 2014
24
Columbia New York Tax-Exempt Fund
Financial Highlights (continued)
| | | Year Ended October 31, | |
Class R4 | | 2014 | | 2013(a) | |
Per share data | |
Net asset value, beginning of period | | $ | 7.20 | | | $ | 7.63 | | |
Income from investment operations: | |
Net investment income | | | 0.29 | | | | 0.18 | | |
Net realized and unrealized gain (loss) | | | 0.35 | | | | (0.43 | ) | |
Total from investment operations | | | 0.64 | | | | (0.25 | ) | |
Less distributions to shareholders: | |
Net investment income | | | (0.29 | ) | | | (0.18 | ) | |
Net realized gains | | | (0.05 | ) | | | — | | |
Total distributions to shareholders | | | (0.34 | ) | | | (0.18 | ) | |
Net asset value, end of period | | $ | 7.50 | | | $ | 7.20 | | |
Total return | | | 9.09 | % | | | (3.35 | %) | |
Ratios to average net assets(b) | |
Total gross expenses | | | 0.65 | % | | | 0.69 | %(c) | |
Total net expenses(d) | | | 0.53 | %(e) | | | 0.53 | %(c)(e) | |
Net investment income | | | 3.95 | % | | | 3.88 | %(c) | |
Supplemental data | |
Net assets, end of period (in thousands) | | $ | 10 | | | $ | 2 | | |
Portfolio turnover | | | 11 | % | | | 15 | % | |
Notes to Financial Highlights
(a) Based on operations from March 19, 2013 (commencement of operations) through the stated period end.
(b) In addition to the fees and expenses that the Fund bears directly, the Fund indirectly bears a pro rata share of the fees and expenses of any other funds in which it invests. Such indirect expenses are not included in the Fund's reported expense ratios.
(c) Annualized.
(d) Total net expenses include the impact of certain fee waivers/expense reimbursements made by the Investment Manager and certain of its affiliates, if applicable.
(e) The benefits derived from expense reductions had an impact of less than 0.01%.
The accompanying Notes to Financial Statements are an integral part of this statement.
Annual Report 2014
25
Columbia New York Tax-Exempt Fund
Financial Highlights (continued)
| | | Year Ended October 31, | |
Class R5 | | 2014 | | 2013(a) | |
Per share data | |
Net asset value, beginning of period | | $ | 7.20 | | | $ | 7.79 | | |
Income from investment operations: | |
Net investment income | | | 0.29 | | | | 0.28 | | |
Net realized and unrealized gain (loss) | | | 0.34 | | | | (0.55 | ) | |
Total from investment operations | | | 0.63 | | | | (0.27 | ) | |
Less distributions to shareholders: | |
Net investment income | | | (0.29 | ) | | | (0.28 | ) | |
Net realized gains | | | (0.05 | ) | | | (0.04 | ) | |
Total distributions to shareholders | | | (0.34 | ) | | | (0.32 | ) | |
Net asset value, end of period | | $ | 7.49 | | | $ | 7.20 | | |
Total return | | | 8.98 | % | | | (3.52 | %) | |
Ratios to average net assets(b) | |
Total gross expenses | | | 0.62 | % | | | 0.62 | %(c) | |
Total net expenses(d) | | | 0.49 | % | | | 0.50 | %(c) | |
Net investment income | | | 4.13 | % | | | 3.85 | %(c) | |
Supplemental data | |
Net assets, end of period (in thousands) | | $ | 10 | | | $ | 2 | | |
Portfolio turnover | | | 11 | % | | | 15 | % | |
Notes to Financial Highlights
(a) Based on operations from November 8, 2012 (commencement of operations) through the stated period end.
(b) In addition to the fees and expenses that the Fund bears directly, the Fund indirectly bears a pro rata share of the fees and expenses of any other funds in which it invests. Such indirect expenses are not included in the Fund's reported expense ratios.
(c) Annualized.
(d) Total net expenses include the impact of certain fee waivers/expense reimbursements made by the Investment Manager and certain of its affiliates, if applicable.
The accompanying Notes to Financial Statements are an integral part of this statement.
Annual Report 2014
26
Columbia New York Tax-Exempt Fund
Financial Highlights (continued)
| | | Year Ended October 31, | |
Class Z | | 2014 | | 2013 | | 2012 | | 2011(a) | |
Per share data | |
Net asset value, beginning of period | | $ | 7.21 | | | $ | 7.76 | | | $ | 7.27 | | | $ | 7.25 | | |
Income from investment operations: | |
Net investment income | | | 0.29 | | | | 0.29 | | | | 0.30 | | | | 0.05 | | |
Net realized and unrealized gain (loss) | | | 0.35 | | | | (0.51 | ) | | | 0.50 | | | | 0.02 | | |
Total from investment operations | | | 0.64 | | | | (0.22 | ) | | | 0.80 | | | | 0.07 | | |
Less distributions to shareholders: | |
Net investment income | | | (0.29 | ) | | | (0.29 | ) | | | (0.30 | ) | | | (0.05 | ) | |
Net realized gains | | | (0.05 | ) | | | (0.04 | ) | | | (0.01 | ) | | | — | | |
Total distributions to shareholders | | | (0.34 | ) | | | (0.33 | ) | | | (0.31 | ) | | | (0.05 | ) | |
Net asset value, end of period | | $ | 7.51 | | | $ | 7.21 | | | $ | 7.76 | | | $ | 7.27 | | |
Total return | | | 9.07 | % | | | (2.96 | %) | | | 11.19 | % | | | 0.96 | % | |
Ratios to average net assets(b) | |
Total gross expenses | | | 0.67 | % | | | 0.65 | % | | | 0.66 | % | | | 0.61 | %(c) | |
Total net expenses(d) | | | 0.53 | %(e) | | | 0.53 | %(e) | | | 0.54 | %(e) | | | 0.52 | %(c) | |
Net investment income | | | 3.98 | % | | | 3.86 | % | | | 3.90 | % | | | 4.19 | %(c) | |
Supplemental data | |
Net assets, end of period (in thousands) | | $ | 13,961 | | | $ | 7,791 | | | $ | 995 | | | $ | 5 | | |
Portfolio turnover | | | 11 | % | | | 15 | % | | | 24 | % | | | 22 | % | |
Notes to Financial Highlights
(a) Based on operations from September 1, 2011 (commencement of operations) through the stated period end.
(b) In addition to the fees and expenses that the Fund bears directly, the Fund indirectly bears a pro rata share of the fees and expenses of any other funds in which it invests. Such indirect expenses are not included in the Fund's reported expense ratios.
(c) Annualized.
(d) Total net expenses include the impact of certain fee waivers/expense reimbursements made by the Investment Manager and certain of its affiliates, if applicable.
(e) The benefits derived from expense reductions had an impact of less than 0.01%.
The accompanying Notes to Financial Statements are an integral part of this statement.
Annual Report 2014
27
Columbia New York Tax-Exempt Fund
Notes to Financial Statements
October 31, 2014
Note 1. Organization
Columbia New York Tax-Exempt Fund (the Fund), a series of Columbia Funds Series Trust I (the Trust), is a non-diversified fund. The Trust is registered under the Investment Company Act of 1940, as amended (the 1940 Act), as an open-end management investment company organized as a Massachusetts business trust.
Fund Shares
The Trust may issue an unlimited number of shares (without par value). The Fund offers Class A, Class B, Class C, Class R4, Class R5 and Class Z shares. Although all share classes generally have identical voting, dividend and liquidation rights, each share class votes separately when required by the Trust's organizational documents or by law. Different share classes pay different distribution amounts to the extent the expenses of such share classes differ, and distributions in liquidation will be proportional to the net asset value of each share class. Each share class has its own expense structure and sales charges.
Class A shares are subject to a maximum front-end sales charge of 4.75% based on the initial investment amount. Class A shares purchased without an initial sales charge in accounts aggregating $1 million to $50 million at the time of purchase are subject to a contingent deferred sales charge (CDSC) if the shares are sold within 18 months of purchase, charged as follows: 1.00% CDSC if redeemed within 12 months of purchase, and 0.50% CDSC if redeemed more than 12, but less than 18, months after purchase.
Class B shares may be subject to a maximum CDSC of 5.00% based upon the holding period after purchase. Class B shares will generally convert to Class A shares eight years after purchase. The Fund no longer accepts investments by new or existing investors in the Fund's Class B shares, except in connection with the reinvestment of any dividend and/or capital gain distributions in Class B shares of the Fund and exchanges by existing Class B shareholders of certain other funds within the Columbia Family of Funds.
Class C shares are subject to a 1.00% CDSC on shares redeemed within one year of purchase.
Class R4 shares are not subject to sales charges and are generally available only to omnibus retirement plans and certain investors as described in the Fund's prospectus.
Class R5 shares are not subject to sales charges and are generally available only to investors purchasing through authorized investment professionals and omnibus retirement plans.
Class Z shares are not subject to sales charges and are available only to eligible investors, which are subject to
different investment minimums as described in the Fund's prospectus.
Note 2. Summary of Significant Accounting Policies
Basis of Preparation
The Fund is an investment company that applies the accounting and reporting guidance in the Financial Accounting Standards Board (FASB) Accounting Standards Codification Topic 946, Financial Services — Investment Companies (ASC 946). The financial statements are prepared in accordance with U.S. generally accepted accounting principles (GAAP) which requires management to make certain estimates and assumptions that affect the reported amounts of assets and liabilities, the disclosure of contingent assets and liabilities at the date of the financial statements and the reported amounts of income and expenses during the reporting period. Actual results could differ from those estimates.
The following is a summary of significant accounting policies followed by the Fund in the preparation of its financial statements.
Security Valuation
Debt securities generally are valued by pricing services approved by the Board of Trustees (the Board) based upon market transactions for normal, institutional-size trading units of similar securities. The services may use various pricing techniques that take into account, as applicable, factors such as yield, quality, coupon rate, maturity, type of issue, trading characteristics and other data, as well as broker quotes. Debt securities for which quotations are readily available may also be valued based upon an over-the-counter or exchange bid quotation.
Investments in open-end investment companies, including money market funds, are valued at their net asset value.
Investments for which market quotations are not readily available, or that have quotations which management believes are not reliable, are valued at fair value as determined in good faith under procedures established by and under the general supervision of the Board. If a security or class of securities (such as foreign securities) is valued at fair value, such value is likely to be different from the quoted or published price for the security.
The determination of fair value often requires significant judgment. To determine fair value, management may use assumptions including but not limited to future cash flows and estimated risk premiums. Multiple inputs from various sources may be used to determine fair value.
Annual Report 2014
28
Columbia New York Tax-Exempt Fund
Notes to Financial Statements (continued)
October 31, 2014
Delayed Delivery Securities
The Fund may trade securities on other than normal settlement terms, including securities purchased or sold on a "when-issued" basis. This may increase risk to the Fund since the other party to the transaction may fail to deliver which could cause the Fund to subsequently invest at less advantageous prices. The Fund designates cash or liquid securities in an amount equal to the delayed delivery commitment.
Security Transactions
Security transactions are accounted for on the trade date. Cost is determined and gains (losses) are based upon the specific identification method for both financial statement and federal income tax purposes.
Income Recognition
Interest income is recorded on an accrual basis. Market premiums and discounts, including original issue discounts, are amortized and accreted, respectively, over the expected life of the security on all debt securities, unless otherwise noted.
The Fund may place a debt security on non-accrual status and reduce related interest income when it becomes probable that the interest will not be collected and the amount of uncollectible interest can be reasonably estimated. A defaulted debt security is removed from non-accrual status when the issuer resumes interest payments or when collectability of interest is reasonably assured.
Dividend income is recorded on the ex-dividend date.
Expenses
General expenses of the Trust are allocated to the Fund and other funds of the Trust based upon relative net assets or other expense allocation methodologies determined by the nature of the expense. Expenses directly attributable to the Fund are charged to the Fund. Expenses directly attributable to a specific class of shares are charged to that share class.
Determination of Class Net Asset Value
All income, expenses (other than class-specific expenses, which are charged to that share class, as shown in the Statement of Operations) and realized and unrealized gains (losses) are allocated to each class of the Fund on a daily basis, based on the relative net assets of each class, for purposes of determining the net asset value of each class.
Federal Income Tax Status
The Fund intends to qualify each year as a regulated investment company under Subchapter M of the Internal Revenue Code, as amended, and will distribute substantially all of its tax exempt and taxable income (including net short-
term capital gains), if any, for its tax year, and as such will not be subject to federal income taxes. In addition, the Fund intends to distribute in each calendar year substantially all of its net investment income, capital gains and certain other amounts, if any, such that the Fund should not be subject to federal excise tax. Therefore, no federal income or excise tax provision is recorded.
Distributions to Shareholders
Distributions from net investment income, if any, are declared daily and paid monthly. Net realized capital gains, if any, are distributed at least annually. Income distributions and capital gain distributions are determined in accordance with federal income tax regulations, which may differ from GAAP.
Guarantees and Indemnifications
Under the Trust's organizational documents and, in some cases, by contract, its officers and trustees are indemnified against certain liabilities arising out of the performance of their duties to the Trust or its funds. In addition, certain of the Fund's contracts with its service providers contain general indemnification clauses. The Fund's maximum exposure under these arrangements is unknown since the amount of any future claims that may be made against the Fund cannot be determined, and the Fund has no historical basis for predicting the likelihood of any such claims.
Note 3. Fees and Compensation Paid to Affiliates
Investment Management Fees
Under an Investment Management Services Agreement, Columbia Management Investment Advisers, LLC (the Investment Manager), a wholly-owned subsidiary of Ameriprise Financial, Inc. (Ameriprise Financial), determines which securities will be purchased, held or sold. The investment management fee is an annual fee that is equal to a percentage of the Fund's average daily net assets that declines from 0.40% to 0.27% as the Fund's net assets increase. The effective investment management fee rate for the year ended October 31, 2014 was 0.40% of the Fund's average daily net assets.
Administration Fees
Under an Administrative Services Agreement, the Investment Manager also serves as the Fund Administrator. The Fund pays the Fund Administrator an annual fee for administration and accounting services equal to a percentage of the Fund's average daily net assets that declines from 0.07% to 0.04% as the Fund's net assets increase. The effective administration fee rate for the year ended October 31, 2014 was 0.07% of the Fund's average daily net assets.
Annual Report 2014
29
Columbia New York Tax-Exempt Fund
Notes to Financial Statements (continued)
October 31, 2014
Compensation of Board Members
Board members are compensated for their services to the Fund as disclosed in the Statement of Operations. The Trust's eligible Trustees may participate in a Deferred Compensation Plan (the Plan) which may be terminated at any time. Obligations of the Plan will be paid solely out of the Fund's assets.
Compensation of Chief Compliance Officer
The Board has appointed a Chief Compliance Officer to the Fund in accordance with federal securities regulations. The Fund pays its pro-rata share of the expenses associated with the Chief Compliance Officer. The Fund's expenses for the Chief Compliance Officer will not exceed $15,000 per year.
Transfer Agent Fees
Under a Transfer and Dividend Disbursing Agent Agreement, Columbia Management Investment Services Corp. (the Transfer Agent), an affiliate of the Investment Manager and a wholly-owned subsidiary of Ameriprise Financial, is responsible for providing transfer agency services to the Fund. The Transfer Agent has contracted with Boston Financial Data Services (BFDS) to serve as sub-transfer agent.
Effective November 1, 2014, the Transfer Agent receives a monthly transfer agency fee based on the number or the average value of accounts, depending on the type of account. Prior to November 1, 2014, the Transfer Agent received a monthly account-based service fee based on the number of open accounts. In addition, the Transfer Agent also receives sub-transfer agency fees based on a percentage of the average aggregate value of the Fund's shares maintained in omnibus accounts (other than omnibus accounts for which American Enterprise Investment Services Inc. is the broker of record or accounts where the beneficial shareholder is a customer of Ameriprise Financial Services, Inc., which receive a per account fee). The Transfer Agent pays the fees of BFDS for services as sub-transfer agent and is not entitled to reimbursement for such fees from the Fund (with the exception of out-of-pocket fees).
The Transfer Agent also receives compensation from the Fund for various shareholder services and reimbursements for certain out-of-pocket fees. Total transfer agent fees for Class R5 shares are subject to an annual limitation of not more than 0.05% of the average daily net assets attributable to Class R5 shares.
For the year ended October 31, 2014, the Fund's effective transfer agent fee rates as a percentage of average daily net assets of each class were as follows:
Class A | | | 0.11 | % | |
Class B | | | 0.11 | | |
Class C | | | 0.11 | % | |
Class R4 | | | 0.11 | | |
Class R5 | | | 0.05 | | |
Class Z | | | 0.11 | | |
The Fund and certain other associated investment companies, have severally, but not jointly, guaranteed the performance and observance of all the terms and conditions of a lease entered into by Seligman Data Corp. (SDC), the former transfer agent, including the payment of rent by SDC (the Guaranty). SDC was the legacy Seligman funds' former transfer agent.
The lease and the Guaranty expire in January 2019. At October 31, 2014, the Fund's total potential future obligation over the life of the Guaranty is $57,475. The liability remaining at October 31, 2014 for non-recurring charges associated with the lease amounted to $31,561 and is recorded as a part of the payable for other expenses in the Statement of Assets and Liabilities.
An annual minimum account balance fee of $20 may apply to certain accounts with a value below the applicable share class's initial minimum investment requirements to reduce the impact of small accounts on transfer agent fees. These minimum account balance fees are remitted to the Fund and recorded as part of expense reductions in the Statement of Operations. For the year ended October 31, 2014, these minimum account balance fees reduced total expenses of the Fund by $200.
Distribution and Service Fees
The Fund has an agreement with Columbia Management Investment Distributors, Inc. (the Distributor), an affiliate of the Investment Manager and a wholly-owned subsidiary of Ameriprise Financial, for distribution and shareholder services. The Board has approved, and the Fund has adopted, distribution and shareholder service plans (the Plans) applicable to certain share classes, which set the distribution and service fees for the Fund. These fees are calculated daily and are intended to compensate the Distributor and/or eligible selling and/or servicing agents for selling shares of the Fund and providing services to investors.
Under the Plans, the Fund pays a monthly service fee to the Distributor at the maximum annual rate of 0.25% of the average daily net assets attributable to Class A, Class B and Class C shares of the Fund. Also under the Plans, the Fund pays a monthly distribution fee to the Distributor at the maximum annual rate of 0.75% of the average daily net assets attributable to Class B and Class C shares only.
The Distributor has voluntarily agreed to waive a portion of the distribution fee for Class C shares so that the distribution fee does not exceed 0.45% annually of the average daily net
Annual Report 2014
30
Columbia New York Tax-Exempt Fund
Notes to Financial Statements (continued)
October 31, 2014
assets attributable to Class C shares. This arrangement may be modified or terminated by the Distributor at any time.
Sales Charges
Sales charges, including front-end charges and CDSCs, received by the Distributor for distributing Fund shares were $90,800 for Class A, $987 for Class B, and $732 for Class C shares for the year ended October 31, 2014.
Expenses Waived/Reimbursed by the Investment Manager and its Affiliates
The Investment Manager and certain of its affiliates have contractually agreed to waive fees and/or reimburse expenses (excluding certain fees and expenses described below) for the periods disclosed below, unless sooner terminated at the sole discretion of the Board, so that the Fund's net operating expenses, after giving effect to fees waived/expenses reimbursed and any balance credits and/or overdraft charges from the Fund's custodian, do not exceed the following annual rates as a percentage of the class' average daily net assets:
| | | March 1, 2014
through
February 28, 2015 | | Prior to
March 1, 2014 | |
Class A | | | 0.78 | % | | | 0.78 | % | |
Class B | | | 1.53 | | | | 1.53 | | |
Class C | | | 1.53 | | | | 1.53 | | |
Class R4 | | | 0.53 | | | | 0.53 | | |
Class R5 | | | 0.50 | | | | 0.49 | | |
Class Z | | | 0.53 | | | | 0.53 | | |
Under the agreement governing these fee waivers and/or expense reimbursement arrangements, the following fees and expenses are excluded from the waiver/reimbursement commitment, and therefore will be paid by the Fund, if applicable: taxes (including foreign transaction taxes), expenses associated with investments in affiliated and non-affiliated pooled investment vehicles (including mutual funds and exchange-traded funds), transaction costs and brokerage commissions, costs related to any securities lending program, dividend expenses associated with securities sold short, inverse floater program fees and expenses, transaction charges and interest on borrowed money, interest, extraordinary expenses and any other expenses the exclusion of which is specifically approved by the Board. This agreement may be modified or amended only with approval from all parties. Class C distribution fees waived by the Distributor, as discussed above, are in addition to the waiver/reimbursement commitment under the agreement.
Note 4. Federal Tax Information
The timing and character of income and capital gain distributions are determined in accordance with income tax
regulations, which may differ from GAAP because of temporary or permanent book to tax differences.
At October 31, 2014, these differences are primarily due to differing treatment for capital loss carryforwards, principal and/or interest from fixed income securities, Trustees' deferred compensation, distributions, distribution reclassifications and tax straddles. To the extent these differences are permanent, reclassifications are made among the components of the Fund's net assets in the Statement of Assets and Liabilities. Temporary differences do not require reclassifications. In the Statement of Assets and Liabilities the following reclassifications were made:
Undistributed net investment income | | $ | (61,665 | ) | |
Accumulated net realized loss | | | 61,667 | | |
Paid-in capital | | | (2 | ) | |
Net investment income (loss) and net realized gains (losses), as disclosed in the Statement of Operations, and net assets were not affected by this reclassification.
The tax character of distributions paid during the years indicated was as follows:
Year Ended October 31, | | 2014 | | 2013 | |
Ordinary income | | $ | — | | | $ | 356,857 | | |
Tax-exempt income | | | 6,320,672 | | | | 6,679,732 | | |
Long-term capital gains | | | 1,062,198 | | | | 731,774 | | |
Total | | $ | 7,382,870 | | | $ | 7,768,363 | | |
Short-term capital gain distributions, if any, are considered ordinary income distributions for tax purposes.
At October 31, 2014, the components of distributable earnings on a tax basis were as follows:
Undistributed tax-exempt income | | | 583,005 | | |
Capital loss carryforwards | | | (381,066 | ) | |
Net unrealized appreciation | | | 15,240,125 | | |
At October 31, 2014, the cost of investments for federal income tax purposes was $159,552,045 and the aggregate gross unrealized appreciation and depreciation based on that cost was:
Unrealized appreciation | | $ | 15,385,217 | | |
Unrealized depreciation | | | (145,092 | ) | |
Net unrealized appreciation | | $ | 15,240,125 | | |
The following capital loss carryforwards, determined at October 31, 2014, may be available to reduce taxable income arising from future net realized gains on investments, if any, to the extent permitted by the Internal Revenue Code:
Year of Expiration | | Amount ($) | |
No expiration — short-term | | | 381,066 | | |
Annual Report 2014
31
Columbia New York Tax-Exempt Fund
Notes to Financial Statements (continued)
October 31, 2014
Management of the Fund has concluded that there are no significant uncertain tax positions in the Fund that would require recognition in the financial statements. However, management's conclusion may be subject to review and adjustment at a later date based on factors including, but not limited to, new tax laws, regulations, and administrative interpretations (including relevant court decisions). Generally, the Fund's federal tax returns for the prior three fiscal years remain subject to examination by the Internal Revenue Service.
Note 5. Portfolio Information
The cost of purchases and proceeds from sales of securities, excluding short-term obligations and certain derivatives, if any, aggregated to $20,608,098 and $18,991,191, respectively, for the year ended October 31, 2014. The amount of purchase and sale activity impacts the portfolio turnover rate reported in the Financial Highlights.
Note 6. Shareholder Concentration
At October 31, 2014, one unaffiliated shareholder of record owned 13.1% of the outstanding shares of the Fund in one or more accounts. The Fund has no knowledge about whether any portion of those shares was owned beneficially. Affiliated shareholders of record owned 29.5% of the outstanding shares of the Fund in one or more accounts. Subscription and redemption activity by concentrated accounts may have a significant effect on the operations of the Fund.
Note 7. Line of Credit
The Fund has entered into a revolving credit facility with a syndicate of banks led by JPMorgan Chase Bank N.A. (JPMorgan) whereby the Fund may borrow for the temporary funding of shareholder redemptions or for other temporary or emergency purposes. The credit facility agreement, as amended, which is a collective agreement between the Fund and certain other funds managed by the Investment Manager, severally and not jointly, permits collective borrowings up to $500 million. Interest is charged to each participating fund based on its borrowings at a rate equal to the higher of (i) the overnight federal funds rate plus 1.00% or (ii) the one-month LIBOR rate plus 1.00%. Each borrowing under the credit facility matures no later than 60 days after the date of borrowing. Effective December 10, 2013, the Fund also pays a commitment fee equal to its pro rata share of the amount of the credit facility at a rate of 0.075% per annum. Prior to December 10, 2013, the commitment fee was charged at the annual rate of 0.08% per annum. The commitment fee is included in other expenses in the Statement of Operations.
Effective December 9, 2014, the Fund extended its revolving credit facility with JPMorgan. The credit facility agreement, as
amended, permits collective borrowings up to $550 million under the same terms and interest rates as described above.
The Fund had no borrowings during the year ended October 31, 2014.
Note 8. Significant Risks
Credit Risk
Credit risk is the risk that the value of debt securities in the Fund's portfolio may decline because the issuer may default and fail to pay interest or repay principal when due. Rating agencies assign credit ratings to debt securities to indicate their credit risk. Lower rated or unrated debt securities held by the Fund may present increased credit risk as compared to higher-rated debt securities.
Interest Rate Risk
Interest rate risk is the risk of losses attributable to changes in interest rates. In general, if prevailing interest rates rise, the values of debt securities tend to fall, and if interest rates fall, the values of debt securities tend to rise. Actions by governments and central banking authorities can result in increases in interest rates. Increasing interest rates may negatively affect the value of debt securities held by the Fund, resulting in a negative impact on the Fund's performance and net asset value per share. In general, the longer the maturity or duration of a debt security, the greater its sensitivity to changes in interest rates.
Liquidity Risk
Liquidity risk is the risk associated with a lack of marketability of investments which may make it difficult to sell the investment at a desirable time or price. Changing regulatory, market or other conditions or environments (for example, the interest rate or credit environments) may adversely affect the liquidity of the Fund's investments. The Fund may have to accept a lower selling price for the holding, sell other investments, or forego another, more appealing investment opportunity. Generally, the less liquid the market at the time the Fund sells a portfolio investment, the greater the risk of loss or decline of value to the Fund. A less liquid market can lead to an increase in Fund redemptions, which may negatively impact Fund performance and net asset value per share, including, for example, if the Fund is forced to sell securities in a down market.
Geographic Concentration Risk
Because state-specific tax-exempt funds invest primarily in the municipal securities issued by the state and political sub-divisions of the state, the Fund will be particularly affected by political and economic conditions and developments in the state in which it invests. The Fund may, therefore, have a
Annual Report 2014
32
Columbia New York Tax-Exempt Fund
Notes to Financial Statements (continued)
October 31, 2014
greater risk than that of a municipal bond fund which is more geographically diversified. The value of the municipal securities owned by the Fund also may be adversely affected by future changes in federal or state income tax laws.
Non-Diversification Risk
A non-diversified fund is permitted to invest a greater percentage of its total assets in fewer issuers than a diversified fund. The Fund may, therefore, have a greater risk of loss from a few issuers than a similar fund that invests more broadly.
Note 9. Subsequent Events
Management has evaluated the events and transactions that have occurred through the date the financial statements were issued. Other than as noted in Notes 3 and 7 above, there were no items requiring adjustment of the financial statements or additional disclosure.
Note 10. Information Regarding Pending and Settled Legal Proceedings
In December 2005, without admitting or denying the allegations, American Express Financial Corporation (AEFC, which is now known as Ameriprise Financial, Inc. (Ameriprise Financial)) entered into settlement agreements with the Securities and Exchange Commission (SEC) and Minnesota Department of Commerce (MDOC) related to market timing activities. As a result, AEFC was censured and ordered to cease and desist from committing or causing any violations of certain provisions of the Investment Advisers Act of 1940, the Investment Company Act of 1940, and various Minnesota laws. AEFC agreed to pay disgorgement of $10 million and civil money penalties of $7 million. AEFC also agreed to retain an independent distribution consultant to assist in developing a plan for distribution of all disgorgement and civil penalties ordered by the SEC in accordance with various undertakings detailed at www.sec.gov/litigation/admin/ia-2451.pdf. Ameriprise Financial and its affiliates have cooperated with the SEC and the MDOC in these legal proceedings, and have made regular reports to the Funds' Boards of Trustees.
Ameriprise Financial and certain of its affiliates have historically been involved in a number of legal, arbitration and regulatory proceedings, including routine litigation, class actions, and governmental actions, concerning matters arising in connection with the conduct of their business activities. Ameriprise Financial believes that the Funds are not currently the subject of, and that neither Ameriprise Financial nor any of its affiliates are the subject of, any pending legal, arbitration or regulatory proceedings that are likely to have a material adverse effect on the Funds or the ability of Ameriprise Financial or its affiliates to perform under their contracts with
the Funds. Ameriprise Financial is required to make quarterly (10-Q), annual (10-K) and, as necessary, 8-K filings with the Securities and Exchange Commission on legal and regulatory matters that relate to Ameriprise Financial and its affiliates. Copies of these filings may be obtained by accessing the SEC website at www.sec.gov.
There can be no assurance that these matters, or the adverse publicity associated with them, will not result in increased fund redemptions, reduced sale of fund shares or other adverse consequences to the Funds. Further, although we believe proceedings are not likely to have a material adverse effect on the Funds or the ability of Ameriprise Financial or its affiliates to perform under their contracts with the Funds, these proceedings are subject to uncertainties and, as such, we are unable to estimate the possible loss or range of loss that may result. An adverse outcome in one or more of these proceedings could result in adverse judgments, settlements, fines, penalties or other relief that could have a material adverse effect on the consolidated financial condition or results of operations of Ameriprise Financial.
Annual Report 2014
33
Columbia New York Tax-Exempt Fund
Report of Independent Registered Public Accounting Firm
To the Trustees of Columbia Funds Series Trust I and the Shareholders of
Columbia New York Tax-Exempt Fund
In our opinion, the accompanying statement of assets and liabilities, including the portfolio of investments, and the related statements of operations and of changes in net assets and the financial highlights present fairly, in all material respects, the financial position of Columbia New York Tax-Exempt Fund (the "Fund", a series of Columbia Funds Series Trust I) at October 31, 2014, and the results of its operations, the changes in its net assets and the financial highlights for each of the periods indicated, in conformity with accounting principles generally accepted in the United States of America. These financial statements and financial highlights (hereafter referred to as "financial statements") are the responsibility of the Fund's management. Our responsibility is to express an opinion on these financial statements based on our audits. We conducted our audits of these financial statements in accordance with the standards of the Public Company Accounting Oversight Board (United States). Those standards require that we plan and perform the audit to obtain reasonable assurance about whether the financial statements are free of material misstatement. An audit includes examining, on a test basis, evidence supporting the amounts and disclosures in the financial statements, assessing the accounting principles used and significant estimates made by management, and evaluating the overall financial statement presentation. We believe that our audits, which included confirmation of securities at October 31, 2014 by correspondence with the custodian and brokers, provide a reasonable basis for our opinion.
PricewaterhouseCoopers LLP
Minneapolis, Minnesota
December 22, 2014
Annual Report 2014
34
Columbia New York Tax-Exempt Fund
Federal Income Tax Information
(Unaudited)
The Fund hereby designates the following tax attributes for the fiscal year ended October 31, 2014. Shareholders will be notified in early 2015 of the amounts for use in preparing 2014 income tax returns.
Tax Designations:
| Exempt-Interest Dividends | | | 100.00 | % | |
Exempt-Interest Dividends. The percentage of net investment income distributed during the fiscal year that qualifies as exempt-interest dividends for federal income tax purposes. A portion of the income may be subject to federal alternative minimum tax.
Annual Report 2014
35
Columbia New York Tax-Exempt Fund
The Trustees serve terms of indefinite duration. The names, addresses and birth years of the Trustees and Officers of the Funds in Columbia Funds Series Trust I, the year each was first elected or appointed to office, their principal business occupations during at least the last five years, the number of Funds overseen by each Trustee and other directorships they hold are shown below. Each officer listed below serves as an officer of each Fund in Columbia Funds Series Trust I.
Independent Trustees
Name, Address and Year of Birth,
Position with Funds, Year First
Elected or Appointed to Office | | Principal Occupation(s) During Past Five Years, Number of Funds in Columbia
Funds Complex Overseen by Trustee, Other Directorships Held | |
Douglas A. Hacker (Born 1955)
c/o Columbia Management
Investment Advisers, LLC
225 Franklin Street
Boston, MA 02110
Trustee (since 1996) and Chairman of the Board (since 2014) | | Independent business executive since May 2006; Executive Vice President — Strategy of United Airlines from December 2002 to May 2006; President of UAL Loyalty Services (airline marketing company) from September 2001 to December 2002; Executive Vice President and Chief Financial Officer of United Airlines from July 1999 to September 2001. Oversees 56; Spartan Stores, Inc. (food distributor); Nash Finch Company (food distributor) from 2005 to 2013; Aircastle Limited (aircraft leasing); and SeaCube Container Leasing Ltd. (container leasing) from 2010 to 2013 | |
Janet Langford Kelly (Born 1957)
c/o Columbia Management
Investment Advisers, LLC
225 Franklin Street
Boston, MA 02110
Trustee (since 1996) | | Senior Vice President, General Counsel and Corporate Secretary, ConocoPhillips (integrated energy company) since September 2007; Deputy General Counsel — Corporate Legal Services, ConocoPhillips from August 2006 to August 2007; Partner, Zelle, Hofmann, Voelbel, Mason & Gette LLP (law firm) from March 2005 to July 2006; Adjunct Professor of Law, Northwestern University from September 2004 to June 2006; Director, UAL Corporation (airline) from February 2006 to July 2006; Chief Administrative Officer and Senior Vice President, Kmart Holding Corporation (consumer goods) from September 2003 to March 2004. Oversees 56; None | |
Nancy T. Lukitsh (Born 1956)
c/o Columbia Management
Investment Advisers, LLC
225 Franklin Street
Boston, MA 02110
Trustee (since 2011) | | Senior Vice President, Partner and Director of Marketing, Wellington Management Company, LLP (investment adviser) from 1997 to 2010; Chair, Wellington Management Investment Portfolios (commingled non-U.S. investment pools) from 2007 to 2010; Director, Wellington Trust Company, NA and other Wellington affiliates from 1997 to 2010. Oversees 56; None | |
William E. Mayer (Born 1940)
c/o Columbia Management
Investment Advisers, LLC
225 Franklin Street
Boston, MA 02110
Trustee (since 1994) | | Partner, Park Avenue Equity Partners (private equity) since February 1999; Dean and Professor, College of Business and Management, University of Maryland from 1992 to 1996. Oversees 56; DynaVox Inc. (speech creation); Lee Enterprises (print media); WR Hambrecht + Co. (financial service provider) from 2000 to 2012; BlackRock Kelso Capital Corporation (investment company); Premier, Inc. (healthcare) | |
David M. Moffett (Born 1952)
c/o Columbia Management
Investment Advisers, LLC
225 Franklin Street
Boston, MA 02110
Trustee (since 2011) | | Retired. Chief Executive Officer, Federal Home Loan Mortgage Corporation, from 2008 to 2009; Senior Adviser, Global Financial Services Group, Carlyle Group, Inc., from 2007 to 2008; Vice Chairman and Chief Financial Officer, U.S. Bancorp, from 1993 to 2007. Oversees 56; CIT Group Inc. (commercial and consumer finance); eBay Inc. (online trading community); MBIA Inc. (financial service provider); E.W. Scripps Co. (print and television media), Building Materials Holding Corp. (building materials and construction services); Genworth Financial, Inc. (financial and insurance products and services); and University of Oklahoma Foundation | |
Charles R. Nelson (Born 1942)
c/o Columbia Management
Investment Advisers, LLC
225 Franklin Street
Boston, MA 02110
Trustee (since 1981) | | Retired. Professor Emeritus, University of Washington, since 2011; Professor of Economics, University of Washington from 1976 to 2011; Ford and Louisa Van Voorhis Professor of Political Economy, University of Washington from 1993 to 2011; Adjunct Professor of Statistics, University of Washington from 1980 to 2011; Associate Editor, Journal of Money, Credit and Banking from September 1993 to 2008; consultant on econometric and statistical matters. Oversees 56; None | |
John J. Neuhauser (Born 1943)
c/o Columbia Management
Investment Advisers, LLC
225 Franklin Street
Boston, MA 02110
Trustee (since 1984) | | President, Saint Michael's College, since August 2007; Director or Trustee of several non-profit organizations, including Fletcher Allen Health Care, Inc.; Academic Vice President and Dean of Faculties, Boston College from August 1999 to October 2005; University Professor, Boston College from November 2005 to August 2007. Oversees 56; Liberty All-Star Equity Fund and Liberty All-Star Growth Fund (closed-end funds) | |
Patrick J. Simpson (Born 1944)
c/o Columbia Management
Investment Advisers, LLC
225 Franklin Street
Boston, MA 02110
Trustee (since 2000) | | Partner, Perkins Coie LLP (law firm). Oversees 56; None | |
Annual Report 2014
36
Columbia New York Tax-Exempt Fund
Trustees and Officers (continued)
Independent Trustees (continued)
Name, Address and Year of Birth,
Position with Funds, Year First
Elected or Appointed to Office | | Principal Occupation(s) During Past Five Years, Number of Funds in Columbia
Funds Complex Overseen by Trustee, Other Directorships Held | |
Anne-Lee Verville (Born 1945)
c/o Columbia Management
Investment Advisers, LLC
225 Franklin Street
Boston, MA 02110
Trustee (since 1998) | | Retired. General Manager — Global Education Industry from 1994 to 1997, President — Application Systems Division from 1991 to 1994, Chief Financial Officer — US Marketing & Services from 1988 to 1991, and Chief Information Officer from 1987 to 1988, IBM Corporation (computer and technology). Oversees 56; Enesco Group, Inc. (producer of giftware and home and garden decor products) from 2001 to 2006 | |
Interested Trustee
Name, Address and Year of Birth,
Position with Funds, Year First
Elected or Appointed to Office | | Principal Occupation(s) During Past Five Years, Number of Funds in Columbia
Funds Complex Overseen by Trustee, Other Directorships Held | |
William F. Truscott (Born 1960)
53600 Ameriprise Financial Center
Minneapolis, MN 55474
Trustee (since 2012) | | Chairman of the Board and President, Columbia Management Investment Advisers, LLC since May 2010 and February 2012, respectively (previously President and Chief Investment Officer from 2001 to April 2010); Chief Executive Officer, Global Asset Management, Ameriprise Financial, Inc. since September 2012 (previously, Chief Executive Officer, U.S. Asset Management & President, Annuities, from May 2010 to September 2012 and President — U.S. Asset Management and Chief Investment Officer from 2005 to April 2010); Director and Chief Executive Officer, Columbia Management Investment Distributors, Inc. since May 2010 and February 2012, respectively (previously Chairman of the Board and Chief Executive Officer from 2006 to April 2010); Chairman of the Board and Chief Executive Officer, RiverSource Distributors, Inc. since 2006; President and Chief Executive Officer, Ameriprise Certificate Company, 2006 to August 2012; Director, Threadneedle Asset Management Holdings, SARL since 2014. Oversees 188; Chairman of the Board, Columbia Management Investment Advisers, LLC since May 2010; Director, Columbia Management Investment Distributors, Inc. since May 2010; Director, Ameriprise Certificate Company from 2006 to January 2013 | |
The Statement of Additional Information has additional information about the Fund's Board members and is available, without charge, upon request by calling 800.345.6611; contacting your financial intermediary; or visiting columbiamanagement.com.
The Board has appointed officers who are responsible for day-to-day business decisions based on policies it has established. The officers serve at the pleasure of the Board. In addition to Mr. Truscott, who is Senior Vice President, the Funds' other officers are:
Officers
Name,
Address and
Year of Birth | | Position and Year
First Appointed to
Position for any Fund
in the Columbia
Funds Complex or a
Predecessor Thereof | | Principal Occupation(s) During Past Five Years | |
J. Kevin Connaughton
225 Franklin Street
Boston, MA 02110
Born 1964 | | President and Principal Executive Officer (2009) | | Managing Director and General Manager — Mutual Fund Products, Columbia Management Investment Advisers, LLC, since May 2010; and President, Columbia Funds since 2009; Managing Director, Columbia Management Advisors, LLC, from December 2004 to April 2010; Senior Vice President and Chief Financial Officer, Columbia Funds, from June 2008 to January 2009; and senior officer of Columbia Funds and affiliated funds since 2003. | |
Michael G. Clarke
225 Franklin Street
Boston, MA 02110
Born 1969 | | Treasurer (2011) and Chief Financial Officer (2009) | | Vice President — Mutual Fund Administration, Columbia Management Investment Advisers, LLC since May 2010; Managing Director of Fund Administration, Columbia Management Advisors, LLC from September 2004 to April 2010; and senior officer of Columbia Funds and affiliated funds since 2002. | |
Annual Report 2014
37
Columbia New York Tax-Exempt Fund
Trustees and Officers (continued)
Officers (continued)
Name,
Address and
Year of Birth | | Position and Year
First Appointed to
Position for any Fund
in the Columbia
Funds Complex or a
Predecessor Thereof | | Principal Occupation(s) During Past Five Years | |
Scott R. Plummer
5228 Ameriprise
Financial Center
Minneapolis, MN 55474
Born 1959 | | Senior Vice President (2006), Chief Legal Officer (2006) and Assistant Secretary (2011) | | Senior Vice President and Assistant General Counsel — Global Asset Management, Ameriprise Financial since February 2014 (previously, Senior Vice President and Lead Chief Counsel — Asset Management, 2012 – February 2014; Vice President and Lead Chief Counsel — Asset Management, 2010 – 2012; and Vice President and Chief Counsel — Asset Management, 2005 – 2010); Senior Vice President, Chief Legal Officer and Assistant Secretary, Columbia Management Investment Advisers, LLC since June 2005; Vice President, Chief Counsel and Assistant Secretary, Columbia Management Investment Distributors, Inc. since 2008; Vice President, General Counsel and Secretary, Ameriprise Certificate Company since 2005; Chief Counsel, RiverSource Distributors, Inc. since 2006; senior officer of Columbia Funds and affiliated funds since 2006. | |
Thomas P. McGuire
225 Franklin Street
Boston, MA 02110
Born 1972 | | Chief Compliance Officer (2012) | | Vice President — Asset Management Compliance, Ameriprise Financial, Inc. since May 2010; Chief Compliance Officer, Ameriprise Certificate Company since September 2010; Compliance Executive, Bank of America from 2005 to April 2010. | |
Colin Moore
225 Franklin Street
Boston, MA 02110
Born 1958 | | Senior Vice President (2010) | | Executive Vice President and Global Chief Investment Officer, Ameriprise Financial, Inc. since July 2013; Director and Global Chief Investment Officer, Columbia Management Investment Advisers, LLC since May 2010; Manager, Managing Director and Chief Investment Officer, Columbia Management Advisors, LLC from 2007 to April 2010. | |
Michael E. DeFao
225 Franklin Street
Boston, MA 02110
Born 1968 | | Vice President (2011) and Assistant Secretary (2010) | | Vice President and Chief Counsel, Ameriprise Financial, Inc. since May 2010; Associate General Counsel, Bank of America from 2005 to April 2010. | |
Joseph F. DiMaria
225 Franklin Street
Boston, MA 02110
Born 1968 | | Vice President (2011) and Chief Accounting Officer (2008) | | Vice President — Mutual Fund Treasurer, Columbia Management Investment Advisers, LLC since May 2010; Director of Fund Administration, Columbia Management Advisors, LLC from 2006 to April 2010. | |
Paul B. Goucher
100 Park Avenue
New York, NY 10017
Born 1968 | | Vice President (2011) and Assistant Secretary (2008) | | Vice President and Lead Chief Counsel, Ameriprise Financial, Inc. since November 2008 and January 2013, respectively (previously, Chief Counsel from January 2010 to January 2013, and Group Counsel from November 2008 to January 2010); Director, Managing Director and General Counsel, J. & W. Seligman & Co. Incorporated from July 2008 to November 2008. | |
Amy Johnson
5228 Ameriprise
Financial Center
Minneapolis, MN
Born 1965 | | Vice President (2006) | | Senior Vice President and Chief Operating Officer, Columbia Management Investment Advisers, LLC since May 2010; previously, Chief Administrative Officer, from 2009 to April 2010, and Vice President — Asset Management and Trust Company Services from 2006 to 2009. | |
Paul D. Pearson
5228 Ameriprise
Financial Center
Minneapolis, MN
Born 1956 | | Vice President (2011) and Assistant Treasurer (1999) | | Vice President — Investment Accounting, Columbia Management Investment Advisers, LLC since May 2010; Vice President — Managed Assets, Investment Accounting, Ameriprise Financial, Inc. from 1998 to April 2010. | |
Christopher O. Petersen
5228 Ameriprise
Financial Center
Minneapolis, MN 55474
Born 1970 | | Vice President and Secretary (2010) | | Vice President and Chief Counsel, Ameriprise Financial, Inc. since January 2010 (previously, Vice President and Group Counsel or Counsel from 2004 to January 2010); officer of Columbia Funds and affiliated funds since 2007. | |
Stephen T. Welsh
225 Franklin Street
Boston, MA 02110
Born 1957 | | Vice President (2006) | | President and Director, Columbia Management Investment Services Corp. from May 2010 to October 2014; President and Director, Columbia Management Services, Inc. from 2004 to April 2010; and Managing Director, Columbia Management Distributors, Inc. from 2007 to April 2010. | |
Annual Report 2014
38
Columbia New York Tax-Exempt Fund
Board Consideration and Approval of Advisory Agreement
On June 11, 2014, the Board of Trustees (the "Board") and the Trustees who are not interested persons (as defined in the Investment Company Act of 1940) of the Trust (the "Independent Trustees") unanimously approved the continuation of the Investment Management Services Agreement (the "Advisory Agreement") with Columbia Management Investment Advisers, LLC (the "Investment Manager") with respect to Columbia New York Tax-Exempt Fund (the "Fund"), a series of the Trust. As detailed below, the Advisory Fees and Expenses Committee (the "Committee") and the Board met on multiple occasions to review and discuss, both among themselves and with the management team of the Investment Manager, materials provided by the Investment Manager before determining to approve the continuation of the Advisory Agreement.
In connection with their deliberations regarding the continuation of the Advisory Agreement, the Committee and the Board evaluated materials requested from the Investment Manager regarding the Fund and the Advisory Agreement, and discussed these materials with representatives of the Investment Manager at Committee meetings held on March 4, 2014, April 30, 2014 and June 10, 2014 and at Board meetings held on April 30, 2014 and June 11, 2014. In addition, the Board considers matters bearing on the Advisory Agreement at most of its other meetings throughout the year and meets regularly with senior management of the Funds and the Investment Manager. Through the Board's Investment Oversight Committees, Trustees also meet with selected Fund portfolio managers and other investment personnel at various times throughout the year. The Committee and the Board also consulted with its independent fee consultant, Fund counsel and with the Independent Trustees' independent legal counsel, who advised on various matters with respect to the Committee's and the Board's considerations and otherwise assisted the Committee and the Board in their deliberations. On June 10, 2014, the Committee recommended that the Board approve the continuation of the Advisory Agreement. On June 11, 2014, the Board, including the Independent Trustees, voting separately, unanimously approved the continuation of the Advisory Agreement for the Fund.
The Committee and the Board considered all information that they, their legal counsel, or the Investment Manager believed reasonably necessary to evaluate and to determine whether to approve the continuation of the Advisory Agreement. The information and factors considered by the Committee and the Board in recommending for approval or approving the continuation of the Advisory Agreement for the Fund included the following:
• Information on the investment performance of the Fund relative to the performance of a group of mutual funds determined to be comparable to the Fund by an independent third-party data provider, as well as performance relative to benchmarks;
• Information on the Fund's advisory fees and total expenses, including information comparing the Fund's expenses to those of a group of comparable mutual funds, as determined by the independent third-party data provider;
• The Investment Manager's agreement to contractually limit or cap total operating expenses for the Fund through February 28, 2015 so that total operating expenses (excluding certain fees and expenses, such as transaction costs and certain other investment related expenses, interest, taxes, acquired fund fees and expenses, and extraordinary expenses) would not exceed an annual rate of 0.78% for Class A, 1.53% for Class B, 1.53% for Class C, 0.53% for Class R4, 0.50% for Class R5 and 0.53% for Class Z;
• The terms and conditions of the Advisory Agreement;
• The current and proposed terms and conditions of other agreements and arrangements with affiliates of the Investment Manager relating to the operations of the Fund, including the Administrative Services Agreement, the Distribution Agreement and the Transfer and Dividend Disbursing Agent Agreement;
• Descriptions of various functions performed by the Investment Manager under the Advisory Agreement, including portfolio management and portfolio trading practices;
• Information regarding the management fees and investment performance of similarly-managed portfolios of other clients of the Investment Manager, including institutional separate accounts;
• Information regarding the reputation, regulatory history and resources of the Investment Manager, including information regarding senior management, portfolio managers and other personnel;
• Information regarding the capabilities of the Investment Manager with respect to compliance monitoring services, including an assessment of the Investment Manager's compliance system by the Fund's Chief Compliance Officer; and
• The profitability to the Investment Manager and its affiliates from their relationships with the Fund.
Annual Report 2014
39
Columbia New York Tax-Exempt Fund
Board Consideration and Approval of Advisory Agreement (continued)
Nature, Extent and Quality of Services Provided under the Advisory Agreement
The Committee and the Board considered the nature, extent and quality of services provided to the Fund by the Investment Manager and its affiliates under the Advisory Agreement and under separate agreements for the provision of transfer agency and administrative services, and the resources dedicated to the Fund and the other Columbia Funds by the Investment Manager and its affiliates. The Committee and the Board considered, among other things, the Investment Manager's ability to attract, motivate and retain highly qualified research, advisory and supervisory investment professionals (including personnel and other resources, compensation programs for personnel involved in fund management, reputation and other attributes), the portfolio management services provided by those investment professionals, and the quality of the Investment Manager's investment research capabilities and trade execution services. The Committee and the Board also considered the potential benefits to shareholders of investing in a mutual fund that is part of a fund complex offering exposure to a variety of asset classes and investment disciplines and providing a variety of fund and shareholder services.
The Committee and the Board also considered the professional experience and qualifications of the senior personnel of the Investment Manager, which included consideration of the Investment Manager's experience with similarly-structured funds. The Committee and the Board noted the compliance programs of and the compliance-related resources provided to the Fund by the Investment Manager and its affiliates, and considered the Investment Manager's ability to provide administrative services to the Fund pursuant to a separate Administrative Services Agreement, including the Investment Manager's ability to coordinate the activities of the Fund's other service providers. After reviewing these and related factors, the Committee and the Board concluded, within the context of their overall conclusions, that the nature, extent and quality of the services provided to the Fund under the Advisory Agreement supported the continuation of the Advisory Agreement.
Investment Performance
The Committee and the Board reviewed information about the performance of the Fund over various time periods, including performance information relative to benchmarks and information based on reports of the independent third-party data provider that compared the performance of the Fund to the performance of a group of comparable mutual funds, and data provided by the independent fee consultant. The Committee and the Board also reviewed a description of the third party's methodology for identifying the Fund's peer groups for purposes of performance and expense comparisons.
The Committee and the Board noted that, through December 31, 2013, the Fund's performance was in the thirty-third, eighth and twenty-fourth percentile (where the best performance would be in the first percentile) of its category selected by the independent third-party data provider for the purposes of performance comparisons for the one-, three- and five- year periods, respectively.
The Committee and the Board also considered the Investment Manager's performance and reputation generally, the Investment Manager's historical responsiveness to Board concerns about performance, and the Investment Manager's willingness to take steps intended to improve performance. After reviewing these and related factors, the Committee and the Board concluded, within the context of their overall conclusions, that the performance of the Fund was sufficient, in light of other considerations, to warrant the continuation of the Advisory Agreement.
Investment Advisory Fee Rates and Other Expenses
The Committee and the Board considered the advisory fees charged to the Fund under the Advisory Agreement as well as the total expenses incurred by the Fund. In assessing the reasonableness of the fees under the Advisory Agreement, the Committee and the Board considered, among other information, the Fund's advisory fee and its total expense ratio as a percentage of average daily net assets. The Committee and the Board also considered data provided by the independent fee consultant. The Committee and the Board noted that the Fund's actual management fee and net expense ratio are ranked in the first and third quintiles, respectively, (where the lowest fees and expenses would be in the first quintile) against the Fund's expense universe as determined by the independent third-party data provider for purposes of expense comparison. The Committee and the Board also took into account the fee waiver and expense limitation arrangements agreed to by the Investment Manager, as noted above.
The Committee and the Board also received and considered information about the advisory fees charged by the Investment Manager to institutional separate accounts. In considering the fees charged to those accounts, the Committee and the Board took into account, among other things, the Investment Manager's representations about the differences between managing
Annual Report 2014
40
Columbia New York Tax-Exempt Fund
Board Consideration and Approval of Advisory Agreement (continued)
mutual funds as compared to other types of accounts, including differences in the services provided, differences in the risk profile of such business for the Investment Manager and the additional resources required to manage mutual funds effectively. In evaluating the Fund's advisory fees, the Committee and the Board also took into account the demands, complexity and quality of the investment management of the Fund.
After reviewing these and related factors, the Committee and the Board concluded, within the context of their overall conclusions, that the advisory fee rates and expenses of the Fund were sufficient, in light of other considerations, to warrant the continuation of the Advisory Agreement.
Costs of Services Provided and Profitability
The Committee and the Board also took note of the costs of the services provided (both on an absolute and relative basis) and the profitability to the Investment Manager and its affiliates in connection with their relationships with the Fund. In evaluating these considerations, the Committee and the Board took note of the advisory fees charged by the Investment Manager to other clients, including fees charged by the Investment Manager to institutional separate account clients with similar investment strategies to those of the Fund.
The Committee and the Board also considered the compensation directly or indirectly received by the Investment Manager's affiliates in connection with their relationships with the Fund. The Committee and the Board reviewed information provided by management as to the profitability of the Investment Manager and its affiliates of their relationships with the Fund, information about the allocation of expenses used to calculate profitability, and comparisons of profitability levels realized in 2013 to profitability levels realized in 2012. When reviewing profitability, the Committee and the Board also considered court cases in which adviser profitability was an issue in whole or in part, the performance of similarly managed funds, the performance of the Fund, and the expense ratio of the Fund. The Committee and the Board also considered information provided by the Investment Manager regarding the Investment Manager's financial condition and comparing its profitability to that of other asset management firms that are, or are subsidiaries of, publicly traded companies.
After reviewing these and related factors, the Committee and the Board concluded, within the context of their overall conclusions, that the costs of services provided and the profitability to the Investment Manager and its affiliates from their relationships with the Fund supported the continuation of the Advisory Agreement.
Economies of Scale
The Committee and the Board considered the potential existence of economies of scale in the provision by the Investment Manager of services to the Fund, to groups of related funds, and to the Investment Manager's investment advisory clients as a whole, and whether those economies of scale were shared with the Fund through breakpoints in investment advisory fees or other means, such as expense limitation arrangements and additional investments by the Investment Manager in investment, trading and compliance resources. The Committee and the Board noted that the investment advisory fee schedules for the Fund contained breakpoints that would reduce the fee rate on assets above specified threshold levels.
In considering these matters, the Committee and the Board also considered the costs of the services provided and the profitability to the Investment Manager and its affiliates from their relationships with the Fund, as discussed above. After reviewing these and related factors, the Committee and the Board concluded, within the context of their overall conclusions, that the extent to which any economies of scale were expected to be shared with the Fund supported the continuation of the Advisory Agreement.
Other Benefits to the Investment Manager
The Committee and the Board received and considered information regarding "fall-out" or ancillary benefits received by the Investment Manager and its affiliates as a result of their relationships with the Fund, such as the engagement of the Investment Manager to provide administrative services to the Fund and the engagement of the Investment Manager's affiliates to provide distribution and transfer agency services to the Fund. In this regard, among other matters, the Committee and the Board considered that the Fund's distributor retains a portion of the distribution fees from the Fund and receives a portion of the sales charges on sales or redemptions of certain classes of shares of the Fund. The Committee and the Board also considered the benefits of research made available to the Investment Manager by reason of brokerage commissions generated by the Fund's securities transactions, and reviewed information about the Investment Manager's practices with respect to allocating portfolio transactions for brokerage and research services. The Committee and the Board
Annual Report 2014
41
Columbia New York Tax-Exempt Fund
Board Consideration and Approval of Advisory Agreement (continued)
considered the possible conflicts of interest associated with certain fall-out or other ancillary benefits and the reporting, disclosure and other processes that are in place to address such possible conflicts of interest. The Committee and the Board recognized that the Investment Manager's profitability would be somewhat lower without these benefits.
Conclusion
The Committee and the Board reviewed all of the above considerations in reaching their decisions to recommend or approve the continuation of the Advisory Agreement. In their deliberations, the Trustees did not identify any particular information that was all-important or controlling, and individual Trustees may have attributed different weights to the various factors. Based on their evaluation of all factors that they deemed to be material, including those factors described above, and assisted by the advice of independent legal counsel, the Board, including the Independent Trustees, voting separately, unanimously approved the continuation of the Advisory Agreement.
Annual Report 2014
42
Columbia New York Tax-Exempt Fund
Important Information About This Report
Each fund mails one shareholder report to each shareholder address. If you would like more than one report, please call shareholder services at 800.345.6611 and additional reports will be sent to you.
The policy of the Board is to vote the proxies of the companies in which each fund holds investments consistent with the procedures as stated in the Statement of Additional Information (SAI). You may obtain a copy of the SAI without charge by calling 800.345.6611; contacting your financial intermediary; visiting columbiamanagement.com; or searching the website of the Securities and Exchange Commission (SEC) at sec.gov. Information regarding how each fund voted proxies relating to portfolio securities is filed with the SEC by August 31 for the most recent 12-month period ending June 30 of that year, and is available without charge by visiting columbiamanagement.com; or searching the website of the SEC at sec.gov.
Each fund files a complete schedule of portfolio holdings with the SEC for the first and third quarters of each fiscal year on Form N-Q. Each fund's Form N-Q is available on the SEC's website at sec.gov and may be reviewed and copied at the SEC's Public Reference Room in Washington, D.C. Information on the operation of the Public Reference Room may be obtained by calling 800.SEC.0330. Each fund's complete schedule of portfolio holdings, as filed on Form N-Q, can also be obtained without charge, upon request, by calling 800.345.6611.
Annual Report 2014
43

Columbia New York Tax-Exempt Fund
P.O. Box 8081
Boston, MA 02266-8081
columbiamanagement.com
This information is for use with concurrent or prior delivery of a fund prospectus. Please read and consider the investment objectives, risks, charges and expenses for any fund carefully before investing. For a prospectus and, if available, a summary prospectus, which contains this and other important information about the Fund, go to columbiamanagement.com. The Fund is distributed by Columbia Management Investment Distributors, Inc., member FINRA, and managed by Columbia Management Investment Advisers, LLC.
© 2014 Columbia Management Investment Advisers, LLC. All rights reserved.
ANN205_10_D01_(12/14)
Annual Report
October 31, 2014

Columbia AMT-Free Intermediate Muni Bond Fund
Not FDIC insured • No bank guarantee • May lose value
 Dear Shareholders,
The U.S. Economy Gained Momentum
The U.S. economy picked up momentum throughout the third quarter of 2014 with improvements in every sector. Second-quarter gross domestic product growth was revised upward to 4.6%, with expectations that third-quarter growth would also be above trend. American companies added more than 200,000 new jobs monthly, driving unemployment below 6% for the first time since 2008. Consumer spending got a boost as both income and savings rose, and confidence hit a post-recession high. After a weak start to the year, corporate profits rebounded, indicating that business remains in good shape. Rising profits led to higher capital spending. The housing market recovery remained on track, as home sales and prices trended higher, and inventories declined. Manufacturing remained a lynchpin of the economy's expansion. Even so, performance fell short of expectations at the end of the period.
Despite Momentum, Markets Remained Stagnant
The financial markets produced lackluster results, despite good economic news and the Federal Reserve's reassurance that it intended to keep short-term interest rates low for another year. A surge in global tensions and concerns that equity valuations have risen sharply put a damper on investor enthusiasm. The S&P 500 Index inched ahead 1.13%, buoyed by its concentration in large-cap stocks with a defensive edge. Traditional fixed-income sectors, including U.S. Treasuries, mortgages and securitized bonds, eked out returns of less than 1% for the quarter. Investment-grade corporate bonds and high-yield bonds lost some ground, although fundamentals for both groups remained solid. Convertible securities and U.S. Treasury inflation-protected securities pulled up the rear.
Stay on Track with Columbia Management
Backed by more than 100 years of experience, Columbia Management is one of the nation's largest asset managers. At the heart of our success and, most importantly, that of our investors, are highly talented industry professionals, brought together by a unique way of working. At Columbia Management, reaching our performance goals matters, and how we reach them matters just as much.
Visit columbiamanagement.com for:
> The Columbia Management Perspectives blog, offering insights on current market events and investment opportunities
> Detailed up-to-date fund performance and portfolio information
> Quarterly fund commentaries
> Columbia Management investor, our award-winning quarterly newsletter for shareholders
Thank you for your continued support of the Columbia Funds. We look forward to serving your investment needs for many years to come.
Best Regards,

J. Kevin Connaughton
President, Columbia Funds
Investing involves risk including the risk of loss of principal.
The S&P 500 Index, an unmanaged index, measures the performance of 500 widely held, large-capitalization U.S. stocks and is frequently used as a general measure of market performance. Indices are not available for investment, are not professionally managed and do not reflect sales charges, fees, brokerage commissions, taxes or other expenses of investing.
Investors should consider the investment objectives, risks, charges and expenses of a mutual fund carefully before investing. For a free prospectus and, if available, a summary prospectus, which contains this and other important information about a fund, visit columbiamanagement.com. The prospectus should be read carefully before investing.
Columbia Funds are distributed by Columbia Management Investment Distributors, Inc., member FINRA, and managed by Columbia Management Investment Advisers, LLC.
© 2014 Columbia Management Investment Advisers, LLC. All rights reserved.
Columbia AMT-Free Intermediate Muni Bond Fund
Performance Overview | | | 2 | | |
Manager Discussion of Fund Performance | | | 4 | | |
Understanding Your Fund's Expenses | | | 6 | | |
Portfolio of Investments | | | 7 | | |
Statement of Assets and Liabilities | | | 26 | | |
Statement of Operations | | | 28 | | |
Statement of Changes in Net Assets | | | 29 | | |
Financial Highlights | | | 31 | | |
Notes to Financial Statements | | | 38 | | |
Report of Independent Registered
Public Accounting Firm | | | 44 | | |
Federal Income Tax Information | | | 45 | | |
Trustees and Officers | | | 46 | | |
Board Consideration and Approval of Advisory Agreement | | | 49 | | |
Important Information About This Report | | | 53 | | |
Fund Investment Manager
Columbia Management Investment
Advisers, LLC
225 Franklin Street
Boston, MA 02110
Fund Distributor
Columbia Management Investment
Distributors, Inc.
225 Franklin Street
Boston, MA 02110
Fund Transfer Agent
Columbia Management Investment
Services Corp.
P.O. Box 8081
Boston, MA 02266-8081
For more information about any of the funds, please visit columbiamanagement.com or call 800.345.6611. Customer Service Representatives are available to answer your questions Monday through Friday from 8 a.m. to 7 p.m. Eastern time.
The views expressed in this report reflect the current views of the respective parties. These views are not guarantees of future performance and involve certain risks, uncertainties and assumptions that are difficult to predict, so actual outcomes and results may differ significantly from the views expressed. These views are subject to change at any time based upon economic, market or other conditions and the respective parties disclaim any responsibility to update such views. These views may not be relied on as investment advice and, because investment decisions for a Columbia Fund are based on numerous factors, may not be relied on as an indication of trading intent on behalf of any particular Columbia Fund. References to specific securities should not be construed as a recommendation or investment advice.
Columbia AMT-Free Intermediate Muni Bond Fund
Performance Summary
> Columbia AMT-Free Intermediate Muni Bond Fund (the Fund) Class A shares returned 6.03% excluding sales charges for the 12-month period that ended October 31, 2014. Class Z shares of the Fund returned 6.34%.
> The Fund's benchmark, the Barclays 3-15 Year Blend Municipal Bond Index, returned 6.05% for the same time period.
> A slight overweight in bonds in the 17- to 22-year range and an emphasis on issues rated A and BBB aided performance relative to the benchmark.
Average Annual Total Returns (%) (for period ended October 31, 2014)
| | Inception | | 1 Year | | 5 Years | | 10 Years | |
Class A | | 11/25/02 | | | | | | | | | | | | | |
Excluding sales charges | | | | | | | 6.03 | | | | 4.56 | | | | 3.76 | | |
Including sales charges | | | | | | | 2.62 | | | | 3.88 | | | | 3.26 | | |
Class B | | 11/25/02 | | | | | | | | | | | | | |
Excluding sales charges | | | | | | | 5.35 | | | | 3.88 | | | | 3.09 | | |
Including sales charges | | | | | | | 2.35 | | | | 3.88 | | | | 3.09 | | |
Class C | | 11/25/02 | | | | | | | | | | | | | |
Excluding sales charges | | | | | | | 5.60 | | | | 4.31 | | | | 3.53 | | |
Including sales charges | | | | | | | 4.60 | | | | 4.31 | | | | 3.53 | | |
Class R4* | | 03/19/13 | | | 6.31 | | | | 4.77 | | | | 3.96 | | |
Class R5* | | 11/08/12 | | | 6.44 | | | | 4.81 | | | | 3.99 | | |
Class T | | 06/26/00 | | | | | | | | | | | | | |
Excluding sales charges | | | | | | | 6.09 | | | | 4.61 | | | | 3.81 | | |
Including sales charges | | | | | | | 1.01 | | | | 3.60 | | | | 3.31 | | |
Class Z | | 06/14/93 | | | 6.34 | | | | 4.78 | | | | 3.97 | | |
Barclays 3-15 Year Blend Municipal Bond Index | | | | | | | 6.05 | | | | 4.84 | | | | 4.54 | | |
Returns for Class A are shown with and without the maximum initial sales charge of 3.25% (for the one-year and five-year periods) and 4.75% (for the ten-year period). (Prior to August 22, 2005, new purchases of Class A shares had a maximum initial sales charge of 4.75%.) Returns for Class B are shown with and without the applicable contingent deferred sales charge (CDSC) of 3.00% in the first year, declining to 1.00% in the fourth year and eliminated thereafter. Returns for Class C are shown with and without the 1.00% CDSC for the first year only. Returns for Class T are shown with and without the maximum sales charge of 4.75%. The Fund's other classes are not subject to sales charges and have limited eligibility. Please see the Fund's prospectus for details. Performance for different share classes will vary based on differences in sales charges and fees associated with each class. All results shown assume reinvestment of distributions during the period. Returns do not reflect the deduction of taxes that a shareholder may pay on Fund distributions or on the redemption of Fund shares. Performance results reflect the effect of any fee waivers or reimbursements of Fund expenses by Columbia Management Investment Advisers, LLC and/or any of its affiliates. Absent these fee waivers or expense reimbursement arrangements, performance results would have been lower.
The performance information shown represents past performance and is not a guarantee of future results. The investment return and principal value of your investment will fluctuate so that your shares, when redeemed, may be worth more or less than their original cost. Current performance may be lower or higher than the performance information shown. You may obtain performance information current to the most recent month-end by contacting your financial intermediary, visiting columbiamanagement.com or calling 800.345.6611.
*The returns shown for periods prior to the share class inception date (including returns for the Life of the Fund, if shown, which are since Fund inception) include the returns of the Fund's oldest share class. These returns are adjusted to reflect any higher class-related operating expenses of the newer share classes, as applicable. Please visit columbiamanagement.com/mutual-funds/appended-performance for more information.
The Barclays 3-15 Year Blend Municipal Bond Index is an unmanaged index that tracks the performance of municipal bonds issued after December 31, 1990, with remaining maturities between 2 and 17 years and at least $7 million in principal amount outstanding.
Indices are not available for investment, are not professionally managed and do not reflect sales charges, fees, brokerage commissions, taxes or other expenses of investing. Securities in the Fund may not match those in an index.
Annual Report 2014
2
Columbia AMT-Free Intermediate Muni Bond Fund
Performance Overview (continued)
Performance of a Hypothetical $10,000 Investment (November 1, 2004 – October 31, 2014)
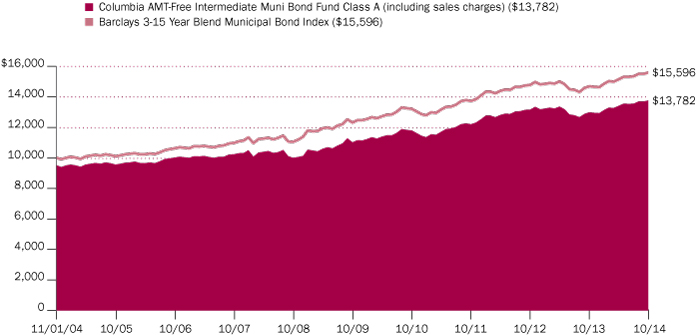
The chart above shows the change in value of a hypothetical $10,000 investment in Class A shares of Columbia AMT-Free Intermediate Muni Bond Fund during the stated time period, and does not reflect the deduction of taxes that a shareholder may pay on Fund distributions or on the redemption of Fund shares. The performance of a $10,000 investment in Class A shares with sales charge is calculated with an initial sales charge of 4.75%, which was the effective sales charge prior to August 22, 2005.
Annual Report 2014
3
Columbia AMT-Free Intermediate Muni Bond Fund
Manager Discussion of Fund Performance
Portfolio Management
Brian McGreevy
Paul Fuchs, CFA
Top Ten States (%)
(at October 31, 2014) | |
California | | | 17.4 | | |
New York | | | 12.9 | | |
Texas | | | 8.6 | | |
Illinois | | | 8.2 | | |
Florida | | | 5.9 | | |
Massachusetts | | | 5.2 | | |
New Jersey | | | 4.1 | | |
Pennsylvania | | | 3.5 | | |
North Carolina | | | 2.7 | | |
Colorado | | | 2.5 | | |
Percentages indicated are based upon total investments (excluding Money Market Funds).
For further detail about these holdings, please refer to the section entitled "Portfolio of Investments."
Fund holdings are as of the date given, are subject to change at any time, and are not recommendations to buy or sell any security.
Quality Breakdown (%)
(at October 31, 2014) | |
AAA rating | | | 5.8 | | |
AA rating | | | 32.9 | | |
A rating | | | 43.8 | | |
BBB rating | | | 12.1 | | |
Non-investment grade | | | 0.9 | | |
Not rated | | | 4.5 | | |
Total | | | 100.0 | | |
Percentages indicated are based upon total fixed income securities (excluding Money Market Funds).
Bond ratings apply to the underlying holdings of the Fund and not the Fund itself and are divided into categories ranging from highest to lowest credit quality, determined by using the middle rating of Moody's, S&P and Fitch, after dropping the highest and lowest available ratings. When ratings are available from only two rating agencies, the lower rating is used. When a rating is available from only one rating agency, that rating is used. When a bond is not rated by any rating agency, it is designated as "Not rated". Credit quality ratings assigned by a rating agency are subjective opinions, not statements of fact, and are subject to
For the 12-month period that ended October 31, 2014, the Fund's Class A shares returned 6.03% excluding sales charges. Class Z shares of the Fund returned 6.34%. The Fund's benchmark, the Barclays 3-15 Year Blend Municipal Bond Index, returned 6.05% for the same time period. Although the Fund's duration was generally in line with that of the benchmark, a slight overweight in bonds in the 17- to 22-year range and an emphasis on issues rated A and BBB aided performance relative to the benchmark. Duration is a measure of interest rate sensitivity.
In July 2014, "AMT-Free" was added to the Fund's name, referencing a policy change that prohibits the Fund from investing in bonds subject to the federal Alternative Minimum Tax. No such bonds were owned during the period.
Strong Demand, Short Supply Aided Municipal Market
The municipal market ended 2013 under pressure, as the Federal Reserve (the Fed) announced its intention to taper its monthly bond purchases beginning in January. Against this backdrop, yields rose and several major credit events clouded the municipal outlook. However, the environment improved in 2014 as money flowed back into municipal funds and new issue supply decreased. Lower rated and longer maturity municipals were the best performers for the period. Five-year yields dropped by six basis points, while 10-year and 15-year yields declined by 37 and 77 basis points, respectively. (A basis point is 1/100th of one percent.) As a result, the yield curve flattened. The yield curve is a graph of AAA municipal bond yields, from short- to long-term. The difference between one- and 15-year yields was 304 basis points at the beginning of the 12-month period and 231 basis points at the end.
Contributors and Detractors
In a period that favored lower quality and longer maturities, we did well to limit exposure to the municipal bonds rated higher than Aa3. Our decision to emphasize the lower investment-grade area, which has been in place for some time, reflects our estimate that it offered more value given the additional yield it provided and the potential for price appreciation if the yield difference between higher quality and lower quality bonds tightened as the economy improved. The Fund's holdings that were rated A and BBB were also a little longer in duration than the bonds in the benchmark, which further aided performance. Exposure to zero coupon bonds also aided results in 2014. These bonds are longer in duration because they are issued at a deep discount, pay no current interest and are redeemed at full value at maturity.
The Fund's local general obligation bonds (GOs) outperformed the benchmark on two fronts: They had duration longer than the benchmark and they were more concentrated in the lower investment-grade range. Electric revenue bonds generated above average results and the transportation sector generated returns of 9.0%+. The Fund's positions in hospital-related, water and sewer bonds and special tax bonds generated returns that were in line with the benchmark. On a state-to-state basis, California holdings continued to generate strong returns, Illinois was a solid performer while New York modestly lagged the market. An underweight in higher quality state GOs and pre-refunded bonds also helped results as these higher quality bonds lagged for the period. Pre-refunded bonds are older bonds that have been refinanced by investing the proceeds from the lower yielding bond in Treasuries or U.S. government-guaranteed securities until
Annual Report 2014
4
Columbia AMT-Free Intermediate Muni Bond Fund
Manager Discussion of Fund Performance (continued)
the scheduled call date of the original bond occurs. Pre-refunding typically occurs when the issuer can issue a new bond at a lower rate.
A very small position in Puerto Rico bonds detracted from performance early in the period and the bonds were sold. The Fund had no direct exposure to Puerto Rico for the rest of the period.
Portfolio Activity
During the period, we decreased exposure to the very shortest maturities and to bonds with short call features. We sold these issues to cover redemptions that occurred in the first half of the period and also to fund new purchases. We added to issues with longer maturities, generally in the 17- to 22-year range, because we believed they offered value. We also added to the Fund's positions in California and Illinois, focusing on lower investment-grade names and non-rated issues.
Looking Ahead
Given the slow but steady improvement in the U.S. economy, we currently do not expect the Fed to materially change its current policy stance until late in 2015. With that in mind, we plan to maintain Fund duration at or near the level of the benchmark. We see value in the seven- to 10-year maturity range and also at the far end of the Fund's target maturity range, which is 17 to 20 years. We believe that security selection, backed by rigorous credit analysis, will be the key to performance going forward. We plan to analyze the potential for changes in tax or revenue policies in light of the November election results and to monitor hospital-related holdings in light of changes, rules and regulations tied to the implementation of the Affordable Care Act.
change, including daily. The ratings assigned by credit rating agencies are but one of the considerations that the Investment Manager and/or Fund's subadviser incorporates into its credit analysis process, along with such other issuer-specific factors as cash flows, capital structure and leverage ratios, ability to de-leverage (repay) through free cash flow, quality of management, market positioning and access to capital, as well as such security-specific factors as the terms of the security (e.g., interest rate, and time to maturity) and the amount and type of any collateral.
Investment Risks
Fixed-income securities present issuer default risk. The Fund invests substantially in municipal securities and will be affected by tax, legislative, regulatory, demographic or political changes, as well as changes impacting a state's financial, economic or other conditions. A relatively small number of tax-exempt issuers may necessitate the Fund investing more heavily in a single issuer and, therefore, be more exposed to the risk of loss than a fund that invests more broadly. Prepayment and extension risk exists as a loan, bond or other investment may be called, prepaid or redeemed before maturity and that similar yielding investments may not be available for purchase. A rise in interest rates may result in a price decline of fixed-income (debt) instruments held by the fund, negatively affecting its performance and NAV. Falling rates may result in the Fund investing in lower yielding debt instruments, lowering the Fund's income and yield. Debt instruments with longer maturity and duration have greater sensitivity to interest rate changes. Interest rates can change due to local government and banking regulation changes. Non-investment-grade (high-yield or junk) securities present greater price volatility and more risk to principal and income than higher rated securities. Market risk may affect a single issuer, sector of the economy, industry or the market as a whole. Federal and state tax rules apply to capital gain distributions and any gains or losses on sales. Income may be subject to state, local or alternative minimum taxes. See the Fund's prospectus for more information on these and other risks.
Annual Report 2014
5
Columbia AMT-Free Intermediate Muni Bond Fund
Understanding Your Fund's Expenses
(Unaudited)
As an investor, you incur two types of costs. There are transaction costs, which generally include sales charges on purchases and may include redemption fees. There are also ongoing costs, which generally include management fees, distribution and/or service fees, and other fund expenses. The following information is intended to help you understand your ongoing costs (in dollars) of investing in the Fund and to help you compare these costs with the ongoing costs of investing in other mutual funds.
Analyzing Your Fund's Expenses
To illustrate these ongoing costs, we have provided examples and calculated the expenses paid by investors in each share class of the Fund during the period. The actual and hypothetical information in the table is based on an initial investment of $1,000 at the beginning of the period indicated and held for the entire period. Expense information is calculated two ways and each method provides you with different information. The amount listed in the "Actual" column is calculated using the Fund's actual operating expenses and total return for the period. You may use the Actual information, together with the amount invested, to estimate the expenses that you paid over the period. Simply divide your account value by $1,000 (for example, an $8,600 account value divided by $1,000 = 8.6), then multiply the results by the expenses paid during the period under the "Actual" column. The amount listed in the "Hypothetical" column assumes a 5% annual rate of return before expenses (which is not the Fund's actual return) and then applies the Fund's actual expense ratio for the period to the hypothetical return. You should not use the hypothetical account values and expenses to estimate either your actual account balance at the end of the period or the expenses you paid during the period. See "Compare With Other Funds" below for details on how to use the hypothetical data.
Compare With Other Funds
Since all mutual funds are required to include the same hypothetical calculations about expenses in shareholder reports, you can use this information to compare the ongoing cost of investing in the Fund with other funds. To do so, compare the hypothetical example with the 5% hypothetical examples that appear in the shareholder reports of other funds. As you compare hypothetical examples of other funds, it is important to note that hypothetical examples are meant to highlight the ongoing costs of investing in a fund only and do not reflect any transaction costs, such as sales charges, or redemption or exchange fees. Therefore, the hypothetical calculations are useful in comparing ongoing costs only, and will not help you determine the relative total costs of owning different funds. If transaction costs were included in these calculations, your costs would be higher.
May 1, 2014 – October 31, 2014
| | Account Value at the Beginning
of the Period ($) | | Account Value at the End
of the Period ($) | | Expenses Paid During
the Period ($) | | Fund's Annualized
Expense Ratio (%) | |
| | Actual | | Hypothetical | | Actual | | Hypothetical | | Actual | | Hypothetical | | Actual | |
Class A | | | 1,000.00 | | | | 1,000.00 | | | | 1,027.00 | | | | 1,021.37 | | | | 3.88 | | | | 3.87 | | | | 0.76 | | |
Class B | | | 1,000.00 | | | | 1,000.00 | | | | 1,024.70 | | | | 1,018.10 | | | | 7.20 | | | | 7.17 | | | | 1.41 | | |
Class C | | | 1,000.00 | | | | 1,000.00 | | | | 1,024.60 | | | | 1,018.10 | | | | 7.20 | | | | 7.17 | | | | 1.41 | | |
Class R4 | | | 1,000.00 | | | | 1,000.00 | | | | 1,029.10 | | | | 1,022.38 | | | | 2.86 | | | | 2.85 | | | | 0.56 | | |
Class R5 | | | 1,000.00 | | | | 1,000.00 | | | | 1,029.50 | | | | 1,022.84 | | | | 2.40 | | | | 2.40 | | | | 0.47 | | |
Class T | | | 1,000.00 | | | | 1,000.00 | | | | 1,027.30 | | | | 1,021.63 | | | | 3.63 | | | | 3.62 | | | | 0.71 | | |
Class Z | | | 1,000.00 | | | | 1,000.00 | | | | 1,029.00 | | | | 1,022.38 | | | | 2.86 | | | | 2.85 | | | | 0.56 | | |
Expenses paid during the period are equal to the annualized expense ratio for each class as indicated above, multiplied by the average account value over the period and then multiplied by the number of days in the Fund's most recent fiscal half year and divided by 365.
Expenses do not include fees and expenses incurred indirectly by the Fund from its investment in underlying funds, including affiliated and non-affiliated pooled investment vehicles, such as mutual funds and exchange-traded funds.
Had Columbia Management Investment Advisers, LLC and/or certain of its affiliates not waived/reimbursed certain fees and expenses, account value at the end of the period would have been reduced.
Annual Report 2014
6
Columbia AMT-Free Intermediate Muni Bond Fund
Portfolio of Investments
October 31, 2014
(Percentages represent value of investments compared to net assets)
Municipal Bonds 98.9%
Issue
Description | | Coupon
Rate | | Principal
Amount ($) | |
Value ($) | |
Alabama 0.6% | |
Alabama Public School & College Authority
Refunding Revenue Bonds
Series 2009A
05/01/19 | | | 5.000 | % | | | 10,000,000 | | | | 11,695,100 | | |
Alaska 1.1% | |
City of Valdez
Refunding Revenue Bonds
BP Pipelines, Inc. Project
Series 2003B
01/01/21 | | | 5.000 | % | | | 19,460,000 | | | | 22,979,146 | | |
Arizona 0.9% | |
Arizona School Facilities Board
Certificate of Participation
Series 2008
09/01/15 | | | 5.500 | % | | | 7,500,000 | | | | 7,830,750 | | |
Maricopa County Industrial Development Authority
Revenue Bonds
Catholic Healthcare West
Series 2007A
07/01/18 | | | 5.000 | % | | | 3,500,000 | | | | 3,865,505 | | |
Salt River Project Agricultural Improvement & Power
District
Revenue Bonds
Series 2009A
01/01/22 | | | 5.000 | % | | | 1,000,000 | | | | 1,157,510 | | |
State of Arizona
Certificate of Participation
Department of Administration
Series 2010A (AGM)
10/01/18 | | | 5.000 | % | | | 5,000,000 | | | | 5,746,450 | | |
Total | | | | | | | 18,600,215 | | |
Arkansas 0.2% | |
County of Independence
Refunding Revenue Bonds
Entergy Mississippi, Inc. Project
Series 1999 (AMBAC)
07/01/22 | | | 4.900 | % | | | 4,600,000 | | | | 4,664,078 | | |
California 17.2% | |
California Health Facilities Financing Authority
Revenue Bonds
St. Joseph Health System
Series 2009B
07/01/18 | | | 5.000 | % | | | 10,445,000 | | | | 11,961,614 | | |
California Municipal Finance Authority
Revenue Bonds
Biola University
Series 2008
10/01/23 | | | 5.625 | % | | | 3,000,000 | | | | 3,351,300 | | |
Municipal Bonds (continued)
Issue
Description | | Coupon
Rate | | Principal
Amount ($) | |
Value ($) | |
California State Public Works Board
Refunding Revenue Bonds
Department of Corrections & Rehabilitation
Series 2006F (NPFGC)
11/01/18 | | | 5.250 | % | | | 4,000,000 | | | | 4,657,400 | | |
Various Capital Projects
Series 2012G
11/01/28 | | | 5.000 | % | | | 5,510,000 | | | | 6,446,590 | | |
Revenue Bonds
Series 2014A
09/01/31 | | | 5.000 | % | | | 15,250,000 | | | | 17,745,358 | | |
Various Capital Projects
Series 2011A
10/01/22 | | | 5.250 | % | | | 3,395,000 | | | | 4,074,034 | | |
Series 2012A
04/01/28 | | | 5.000 | % | | | 10,000,000 | | | | 11,587,300 | | |
Series 2013I
11/01/28 | | | 5.250 | % | | | 9,225,000 | | | | 10,987,805 | | |
11/01/29 | | | 5.000 | % | | | 5,000,000 | | | | 5,805,000 | | |
11/01/31 | | | 5.500 | % | | | 2,930,000 | | | | 3,550,340 | | |
California State University
Revenue Bonds
Systemwide
Series 2008A (AGM)
11/01/22 | | | 5.000 | % | | | 5,000,000 | | | | 5,665,850 | | |
California Statewide Communities Development Authority
Revenue Bonds
Henry Mayo Newhall Memorial
Series 2014A (AGM)
10/01/34 | | | 5.000 | % | | | 5,000,000 | | | | 5,574,900 | | |
City of Fresno Sewer System
Revenue Bonds
Series 1993A-1 (AMBAC)
09/01/19 | | | 5.250 | % | | | 5,000,000 | | | | 5,491,300 | | |
City of Vernon Electric System
Revenue Bonds
Series 2009A
08/01/21 | | | 5.125 | % | | | 10,435,000 | | | | 11,684,904 | | |
County of Sacramento Airport System
Revenue Bonds
Senior Series 2009B
07/01/24 | | | 5.000 | % | | | 1,000,000 | | | | 1,139,920 | | |
Foothill-Eastern Transportation Corridor Agency
Refunding Revenue Bonds
Subordinated Series 2014B-3(a)
01/15/53 | | | 5.500 | % | | | 9,000,000 | | | | 10,436,580 | | |
La Quinta Redevelopment Agency Successor Agency
Refunding Tax Allocation Bonds
Redevelopment Project
Subordinated Series 2013A
09/01/29 | | | 5.000 | % | | | 5,000,000 | | | | 5,605,800 | | |
The accompanying Notes to Financial Statements are an integral part of this statement.
Annual Report 2014
7
Columbia AMT-Free Intermediate Muni Bond Fund
Portfolio of Investments (continued)
October 31, 2014
Municipal Bonds (continued)
Issue
Description | | Coupon
Rate | | Principal
Amount ($) | |
Value ($) | |
Los Angeles Unified School District
Prerefunded 07/01/17 Unlimited General Obligation
Bonds
Election of 2005
Series 2007E (AGM)
07/01/20 | | | 5.000 | % | | | 6,230,000 | | | | 6,961,091 | | |
Manteca Unified School District
Unlimited General Obligation Bonds
Capital Appreciation-Election of 2004
Series 2006 (NPFGC)(b)
08/01/24 | | | 0.000 | % | | | 5,000,000 | | | | 3,467,000 | | |
Monrovia Unified School District
Unlimited General Obligation Refunding Bonds
Series 2005 (NPFGC)
08/01/21 | | | 5.250 | % | | | 5,600,000 | | | | 6,794,648 | | |
Oakland Unified School District/Alameda County
Unlimited General Obligation Bonds
Election of 2006
Series 2009A
08/01/29 | | | 6.125 | % | | | 14,500,000 | | | | 16,657,455 | | |
Oxnard Financing Authority
Revenue Bonds
Redwood Trunk Sewer & Headworks
Series 2004A (NPFGC)
06/01/29 | | | 5.000 | % | | | 3,795,000 | | | | 3,801,110 | | |
Pico Rivera Water Authority
Revenue Bonds
Water System Project
Series 1999A (NPFGC)
05/01/29 | | | 5.500 | % | | | 3,000,000 | | | | 3,437,850 | | |
Rancho Santiago Community College District
Unlimited General Obligation Bonds
Capital Appreciation-Election of 2002
Series 2006C (AGM)(b)
09/01/31 | | | 0.000 | % | | | 28,000,000 | | | | 14,411,600 | | |
Sacramento Municipal Utility District
Revenue Bonds
Cosumnes Project
Series 2006 (NPFGC)
07/01/29 | | | 5.125 | % | | | 7,035,000 | | | | 7,448,869 | | |
San Francisco City & County Airports Commission-San
Francisco International Airport
Revenue Bonds
Series 2010A
05/01/29 | | | 4.900 | % | | | 5,000,000 | | | | 5,761,000 | | |
San Joaquin Hills Transportation Corridor Agency
Revenue Bonds
Senior Lien
Series 1993 Escrowed to Maturity(b)
01/01/25 | | | 0.000 | % | | | 22,405,000 | | | | 18,026,839 | | |
Municipal Bonds (continued)
Issue
Description | | Coupon
Rate | | Principal
Amount ($) | |
Value ($) | |
San Jose Financing Authority
Refunding Revenue Bonds
Civic Center Project
Series 2013A
06/01/29 | | | 5.000 | % | | | 12,000,000 | | | | 13,941,960 | | |
San Mateo County Community College District
Unlimited General Obligation Bonds
Capital Appreciation-Election of 2005
Series 2006A (NPFGC)(b)
09/01/20 | | | 0.000 | % | | | 9,310,000 | | | | 8,455,621 | | |
Southern California Public Power Authority
Revenue Bonds
Project No. 1
Series 2007A
11/01/22 | | | 5.250 | % | | | 2,500,000 | | | | 2,924,575 | | |
Windy Point/Windy Flats Project
Series 2010-1
07/01/28 | | | 5.000 | % | | | 10,000,000 | | | | 11,684,200 | | |
07/01/30 | | | 5.000 | % | | | 15,875,000 | | | | 18,548,667 | | |
State of California Department of Water Resources Power
Supply
Revenue Bonds
Series 2008H
05/01/21 | | | 5.000 | % | | | 5,000,000 | | | | 5,727,050 | | |
State of California
Prerefunded 07/01/19 Unlimited General Obligation Bonds
Series 2009A
07/01/20 | | | 5.000 | % | | | 12,500,000 | | | | 14,699,000 | | |
Unlimited General Obligation Bonds
Series 2002 (AMBAC)
02/01/18 | | | 6.000 | % | | | 5,000,000 | | | | 5,839,650 | | |
Various Purpose
Series 2009
04/01/22 | | | 5.250 | % | | | 1,000,000 | | | | 1,172,760 | | |
10/01/22 | | | 5.250 | % | | | 25,000,000 | | | | 29,793,500 | | |
Series 2010
03/01/25 | | | 5.000 | % | | | 1,000,000 | | | | 1,163,670 | | |
Series 2011
10/01/19 | | | 5.000 | % | | | 12,000,000 | | | | 14,157,960 | | |
09/01/31 | | | 5.000 | % | | | 10,000,000 | | | | 11,534,000 | | |
Unlimited General Obligation Refunding Bonds
Series 2009A
07/01/21 | | | 5.250 | % | | | 1,000,000 | | | | 1,179,520 | | |
West Contra Costa Unified School District
Unlimited General Obligation Bonds
Series 2005 (NPFGC)(b)
08/01/20 | | | 0.000 | % | | | 7,285,000 | | | | 6,440,814 | | |
Total | | | | | | | 359,796,404 | | |
Colorado 2.5% | |
Baptist Road Rural Transportation Authority
Revenue Bonds
Series 2007
12/01/17 | | | 4.800 | % | | | 290,000 | | | | 292,468 | | |
The accompanying Notes to Financial Statements are an integral part of this statement.
Annual Report 2014
8
Columbia AMT-Free Intermediate Muni Bond Fund
Portfolio of Investments (continued)
October 31, 2014
Municipal Bonds (continued)
Issue
Description | | Coupon
Rate | | Principal
Amount ($) | |
Value ($) | |
Board of Governors of Colorado State University System
Refunding Revenue Bonds
Series 2013A
03/01/31 | | | 5.000 | % | | | 4,560,000 | | | | 5,630,505 | | |
Colorado Health Facilities Authority
Refunding Revenue Bonds
Covenant Retirement Communities
Series 2012A
12/01/27 | | | 5.000 | % | | | 4,000,000 | | | | 4,319,680 | | |
Revenue Bonds
Covenant Retirement Communities, Inc.
Series 2005
12/01/18 | | | 5.000 | % | | | 1,000,000 | | | | 1,036,240 | | |
Health Facilities Evangelical Lutheran
Series 2005
06/01/23 | | | 5.250 | % | | | 500,000 | | | | 519,530 | | |
Colorado Health Facilities Authority(a)
Revenue Bonds
Catholic Health Initiatives
Series 2008D-3
10/01/38 | | | 5.500 | % | | | 5,000,000 | | | | 5,265,950 | | |
County of Adams
Refunding Revenue Bonds
Public Service Co. of Colorado Project
Series 2005A (NPFGC)
09/01/17 | | | 4.375 | % | | | 11,550,000 | | | | 11,920,986 | | |
E-470 Public Highway Authority
Revenue Bonds
Capital Appreciation
Senior Series 2000B (NPFGC)(b)
09/01/18 | | | 0.000 | % | | | 1,500,000 | | | | 1,394,205 | | |
North Range Metropolitan District No. 1
Limited General Obligation Refunding Bonds
Series 2007 (ACA)
12/15/15 | | | 5.000 | % | | | 365,000 | | | | 372,052 | | |
12/15/17 | | | 5.000 | % | | | 350,000 | | | | 360,416 | | |
North Range Metropolitan District No. 2
Limited Tax General Obligation Bonds
Series 2007
12/15/14 | | | 5.500 | % | | | 555,000 | | | | 555,913 | | |
Northwest Parkway Public Highway Authority
Prerefunded 06/15/16 Revenue Bonds
Capital Appreciation
Series 2001C (AMBAC)
06/15/21 | | | 5.700 | % | | | 4,000,000 | | | | 4,342,280 | | |
Regional Transportation District
Certificate of Participation
Series 2010A
06/01/25 | | | 5.000 | % | | | 10,000,000 | | | | 11,159,800 | | |
Municipal Bonds (continued)
Issue
Description | | Coupon
Rate | | Principal
Amount ($) | |
Value ($) | |
University of Colorado Hospital Authority
Revenue Bonds
Series 2012A
11/15/27 | | | 5.000 | % | | | 3,750,000 | | | | 4,331,400 | | |
Total | | | | | | | 51,501,425 | | |
Connecticut 0.5% | |
Connecticut State Development Authority
Refunding Revenue Bonds
Connecticut Light & Power Co. Project
Series 2011
09/01/28 | | | 4.375 | % | | | 1,615,000 | | | | 1,757,475 | | |
Connecticut State Health & Educational Facility Authority
Revenue Bonds
Trinity College
Series 1998F (NPFGC)
07/01/21 | | | 5.500 | % | | | 1,000,000 | | | | 1,158,520 | | |
Harbor Point Infrastructure Improvement District
Tax Allocation Bonds
Harbor Point Project
Series 2010A
04/01/22 | | | 7.000 | % | | | 6,591,000 | | | | 7,766,307 | | |
Total | | | | | | | 10,682,302 | | |
District of Columbia 1.6% | |
District of Columbia Water & Sewer Authority
Prerefunded 10/01/18 Revenue Bonds
Series 2009A
10/01/24 | | | 5.000 | % | | | 1,000,000 | | | | 1,157,630 | | |
Metropolitan Washington Airports Authority Dulles Toll Road(b)
Revenue Bonds
Capital Appreciation-2nd Senior Lien
Series 2009B (AGM)
10/01/24 | | | 0.000 | % | | | 20,980,000 | | | | 14,752,926 | | |
10/01/25 | | | 0.000 | % | | | 7,500,000 | | | | 4,999,425 | | |
10/01/26 | | | 0.000 | % | | | 5,000,000 | | | | 3,178,700 | | |
Metropolitan Washington Airports Authority
Revenue Bonds
Series 2009C
10/01/25 | | | 5.250 | % | | | 8,920,000 | | | | 10,207,959 | | |
Total | | | | | | | 34,296,640 | | |
Florida 5.8% | |
Capital Trust Agency, Inc.
Revenue Bonds
Atlantic Housing Foundation
Subordinated Series 2008B(c)
07/15/32 | | | 7.000 | % | | | 1,835,000 | | | | 825,713 | | |
The accompanying Notes to Financial Statements are an integral part of this statement.
Annual Report 2014
9
Columbia AMT-Free Intermediate Muni Bond Fund
Portfolio of Investments (continued)
October 31, 2014
Municipal Bonds (continued)
Issue
Description | | Coupon
Rate | | Principal
Amount ($) | |
Value ($) | |
Citizens Property Insurance Corp.
Revenue Bonds
Senior Secured
Series 2012A-1
06/01/21 | | | 5.000 | % | | | 16,965,000 | | | | 20,033,460 | | |
City of Cocoa Water & Sewer
Refunding Revenue Bonds
Series 2003 (AMBAC)
10/01/19 | | | 5.500 | % | | | 1,000,000 | | | | 1,186,010 | | |
City of Lakeland
Refunding Revenue Bonds
1st Mortgage-Carpenters Home Estates
Series 2008
01/01/19 | | | 5.875 | % | | | 1,620,000 | | | | 1,783,717 | | |
City of Tallahassee
Refunding Revenue Bonds
Series 2001 (NPFGC)
10/01/17 | | | 5.500 | % | | | 1,900,000 | | | | 2,155,436 | | |
10/01/18 | | | 5.500 | % | | | 1,000,000 | | | | 1,165,060 | | |
County of Broward
Refunding Revenue Bonds
Civic Arena Project
Series 2006A (AMBAC)
09/01/18 | | | 5.000 | % | | | 2,500,000 | | | | 2,702,200 | | |
County of Miami-Dade Aviation
Revenue Bonds
Miami International Airport
Series 2010A
10/01/25 | | | 5.500 | % | | | 6,000,000 | | | | 7,110,960 | | |
County of Miami-Dade Seaport Department
Revenue Bonds
Series 2014
10/01/29 | | | 5.000 | % | | | 500,000 | | | | 565,505 | | |
10/01/31 | | | 5.000 | % | | | 600,000 | | | | 672,174 | | |
10/01/33 | | | 5.000 | % | | | 1,215,000 | | | | 1,351,481 | | |
County of Miami-Dade Transit System Sales Surtax
Revenue Bonds
Series 2006 (XLCA)
07/01/19 | | | 5.000 | % | | | 5,040,000 | | | | 5,413,162 | | |
County of Miami-Dade Water & Sewer System
Refunding Revenue Bonds
System
Series 2008B (AGM)
10/01/21 | | | 5.250 | % | | | 20,000,000 | | | | 24,229,200 | | |
Florida Development Finance Corp.
Revenue Bonds
Miami Arts Charter School Project
Series 2014A(d)
06/15/34 | | | 5.875 | % | | | 415,000 | | | | 414,490 | | |
Lake County School Board
Certificate of Participation
Series 2006C (AMBAC)
06/01/18 | | | 5.250 | % | | | 1,500,000 | | | | 1,716,885 | | |
Municipal Bonds (continued)
Issue
Description | | Coupon
Rate | | Principal
Amount ($) | |
Value ($) | |
Lee County Industrial Development Authority
Refunding Revenue Bonds
Shell Point/Alliance Community Project
Series 2007
11/15/22 | | | 5.000 | % | | | 7,650,000 | | | | 8,028,904 | | |
Lee County School Board
Refunding Certificate of Participation
Series 2014A
08/01/28 | | | 5.000 | % | | | 2,000,000 | | | | 2,346,960 | | |
Orange County Health Facilities Authority
Refunding Revenue Bonds
Health Care-Orlando Lutheran
Series 2005
07/01/20 | | | 5.375 | % | | | 3,625,000 | | | | 3,665,165 | | |
Revenue Bonds
Series 1996A Escrowed to Maturity (NPFGC)
10/01/16 | | | 6.250 | % | | | 3,230,000 | | | | 3,487,528 | | |
Orange County School Board
Certificate of Participation
Series 2012B
08/01/26 | | | 5.000 | % | | | 6,500,000 | | | | 7,469,085 | | |
Orlando Utilities Commission
Prerefunded 10/01/15 Revenue Bonds
Series 2005B
10/01/24 | | | 5.000 | % | | | 3,000,000 | | | | 3,132,360 | | |
Palm Beach County Health Facilities Authority
Revenue Bonds
Sinai Residences of Boca Raton
Series 2014
06/01/21 | | | 6.000 | % | | | 1,100,000 | | | | 1,195,018 | | |
Sarasota County Health Facilities Authority
Refunding Revenue Bonds
Village On The Isle Project
Series 2007
01/01/27 | | | 5.500 | % | | | 4,000,000 | | | | 4,276,040 | | |
Seminole Tribe of Florida, Inc.
Revenue Bonds
Series 2007A(d)(e)
10/01/22 | | | 5.750 | % | | | 9,530,000 | | | | 10,350,914 | | |
Southeast Overtown Park West Community
Redevelopment Agency
Tax Allocation Bonds
Series 2014A-1(d)
03/01/30 | | | 5.000 | % | | | 2,500,000 | | | | 2,773,150 | | |
Sterling Hill Community Development District
Special Assessment Bonds
Series 2003B(c)(f)
11/01/10 | | | 5.500 | % | | | 150,000 | | | | 96,097 | | |
Tampa Bay Water
Improvement Refunding Revenue Bonds
Series 2005 (NPFGC)
10/01/19 | | | 5.500 | % | | | 1,500,000 | | | | 1,807,815 | | |
The accompanying Notes to Financial Statements are an integral part of this statement.
Annual Report 2014
10
Columbia AMT-Free Intermediate Muni Bond Fund
Portfolio of Investments (continued)
October 31, 2014
Municipal Bonds (continued)
Issue
Description | | Coupon
Rate | | Principal
Amount ($) | |
Value ($) | |
Tampa Sports Authority
Sales Tax Revenue Bonds
Tampa Bay Arena Project
Series 1995 (NPFGC)
10/01/15 | | | 5.750 | % | | | 555,000 | | | | 567,399 | | |
10/01/20 | | | 5.750 | % | | | 1,000,000 | | | | 1,101,330 | | |
Total | | | | | | | 121,623,218 | | |
Georgia 1.6% | |
City of Atlanta Department of Aviation
Refunding Revenue Bonds
General Subordinated Lien
Series 2014
01/01/32 | | | 5.000 | % | | | 2,000,000 | | | | 2,302,840 | | |
City of Atlanta Water & Wastewater
Revenue Bonds
Series 1999A (NPFGC)
11/01/18 | | | 5.500 | % | | | 15,305,000 | | | | 17,981,079 | | |
DeKalb County Hospital Authority
Revenue Bonds
DeKalb Medical Center, Inc. Project
Series 2010
09/01/30 | | | 6.000 | % | | | 5,000,000 | | | | 5,581,450 | | |
Georgia State Road & Tollway Authority(b)(d)
Revenue Bonds
I-75 S Express Lanes Project
Series 2014
06/01/24 | | | 0.000 | % | | | 625,000 | | | | 354,250 | | |
06/01/34 | | | 0.000 | % | | | 3,750,000 | | | | 1,054,163 | | |
State of Georgia
Unlimited General Obligation Bonds
Series 2012A
07/01/31 | | | 4.000 | % | | | 5,000,000 | | | | 5,414,850 | | |
Total | | | | | | | 32,688,632 | | |
Hawaii 0.8% | |
State of Hawaii Department of Budget & Finance
Revenue Bonds
Hawaii Pacific University
Series 2013A
07/01/20 | | | 5.000 | % | | | 870,000 | | | | 915,031 | | |
07/01/23 | | | 5.750 | % | | | 1,015,000 | | | | 1,106,675 | | |
07/01/27 | | | 6.250 | % | | | 1,400,000 | | | | 1,542,436 | | |
State of Hawaii
Unlimited General Obligation Bonds
Series 2008DK
05/01/22 | | | 5.000 | % | | | 10,750,000 | | | | 12,201,357 | | |
Total | | | | | | | 15,765,499 | | |
Municipal Bonds (continued)
Issue
Description | | Coupon
Rate | | Principal
Amount ($) | |
Value ($) | |
Idaho 0.2% | |
Idaho Health Facilities Authority
Revenue Bonds
Terraces of Boise Project
Series 2014A
10/01/24 | | | 7.000 | % | | | 2,980,000 | | | | 3,179,451 | | |
Series 2014B-1
10/01/22 | | | 6.500 | % | | | 2,000,000 | | | | 2,024,660 | | |
Total | | | | | | | 5,204,111 | | |
Illinois 8.2% | |
Chicago Board of Education
Unlimited General Obligation Refunding Bonds
Dedicated Revenues
Series 2005B (AMBAC)
12/01/21 | | | 5.000 | % | | | 5,825,000 | | | | 5,976,101 | | |
Chicago Midway International Airport
Refunding Revenue Bonds
2nd Lien
Series 2014B
01/01/29 | | | 5.000 | % | | | 6,150,000 | | | | 7,017,949 | | |
Chicago O'Hare International Airport
Refunding Revenue Bonds
General Airport 3rd Lien
Series 2005B (NPFGC)
01/01/17 | | | 5.250 | % | | | 10,000,000 | | | | 10,994,800 | | |
General Senior Lien
Series 2013B
01/01/28 | | | 5.250 | % | | | 11,180,000 | | | | 12,972,042 | | |
Passenger Facility Charge
Series 2012A
01/01/28 | | | 5.000 | % | | | 2,590,000 | | | | 2,930,637 | | |
01/01/29 | | | 5.000 | % | | | 2,500,000 | | | | 2,821,900 | | |
01/01/30 | | | 5.000 | % | | | 3,000,000 | | | | 3,378,030 | | |
Chicago Park District
Unlimited General Obligation Refunding Bonds
Limited Tax
Series 2014B
01/01/29 | | | 5.000 | % | | | 2,500,000 | | | | 2,876,400 | | |
Chicago Transit Authority
Revenue Bonds
Federal Transit Administration Section 5309
Series 2008A
06/01/16 | | | 5.000 | % | | | 2,500,000 | | | | 2,661,025 | | |
Series 2011
12/01/29 | | | 5.250 | % | | | 4,000,000 | | | | 4,564,880 | | |
City of Chicago
Limited General Obligation Refunding Bonds
Emergency Telephone System
Series 1999 (NPFGC)
01/01/18 | | | 5.250 | % | | | 7,540,000 | | | | 8,341,954 | | |
The accompanying Notes to Financial Statements are an integral part of this statement.
Annual Report 2014
11
Columbia AMT-Free Intermediate Muni Bond Fund
Portfolio of Investments (continued)
October 31, 2014
Municipal Bonds (continued)
Issue
Description | | Coupon
Rate | | Principal
Amount ($) | |
Value ($) | |
Revenue Bonds
Asphalt Operating Services - Recovery Zone Facility
Series 2010
12/01/18 | | | 6.125 | % | | | 3,270,000 | | | | 3,452,826 | | |
Unlimited General Obligation Bonds
Series 2010A
12/01/21 | | | 5.000 | % | | | 9,755,000 | | | | 10,576,566 | | |
Unlimited General Obligation Refunding Bonds
Project
Series 2014A
01/01/32 | | | 5.250 | % | | | 3,845,000 | | | | 4,029,983 | | |
County of Cook
Unlimited General Obligation Refunding Bonds
Series 2010A
11/15/22 | | | 5.250 | % | | | 12,000,000 | | | | 13,880,880 | | |
Illinois Finance Authority
Refunding Revenue Bonds
DePaul University
Series 2004A
10/01/17 | | | 5.375 | % | | | 1,000,000 | | | | 1,128,990 | | |
10/01/18 | | | 5.375 | % | | | 2,000,000 | | | | 2,318,500 | | |
Illinois State Toll Highway Authority
Revenue Bonds
Senior Priority
Series 2006A-1 (AGM)
01/01/18 | | | 5.000 | % | | | 2,000,000 | | | | 2,146,120 | | |
Illinois State Toll Highway Authority(g)
Revenue Bonds
Series 2014C
01/01/32 | | | 5.000 | % | | | 9,600,000 | | | | 11,026,272 | | |
Kendall & Kane Counties Community Unit School District No. 115(b)
Prerefunded Unlimited General Obligation Bonds
Capital Appreciation
Series 2002 Escrowed to Maturity (FGIC)
01/01/17 | | | 0.000 | % | | | 600,000 | | | | 592,392 | | |
Unrefunded Unlimited General Obligation Bonds
Capital Appreciation
Series 2002 (NPFGC)
01/01/17 | | | 0.000 | % | | | 3,050,000 | | | | 2,952,187 | | |
Railsplitter Tobacco Settlement Authority
Revenue Bonds
Series 2010
06/01/19 | | | 5.000 | % | | | 5,000,000 | | | | 5,734,400 | | |
06/01/21 | | | 5.250 | % | | | 12,000,000 | | | | 14,175,960 | | |
State of Illinois
Unlimited General Obligation Bonds
Series 2013
07/01/26 | | | 5.500 | % | | | 15,100,000 | | | | 17,015,435 | | |
Series 2014
02/01/25 | | | 5.000 | % | | | 6,000,000 | | | | 6,643,500 | | |
02/01/31 | | | 5.250 | % | | | 4,965,000 | | | | 5,444,619 | | |
Municipal Bonds (continued)
Issue
Description | | Coupon
Rate | | Principal
Amount ($) | |
Value ($) | |
State of Illinois(b)
Revenue Bonds
Capital Appreciation-Civic Center
Series 1990B (AMBAC)
12/15/17 | | | 0.000 | % | | | 5,540,000 | | | | 5,198,625 | | |
Total | | | | | | | 170,852,973 | | |
Indiana 1.7% | |
City of Indianapolis Thermal Energy System
Refunding Revenue Bonds
1st Lien
Series 2014A
10/01/32 | | | 5.000 | % | | | 1,400,000 | | | | 1,599,864 | | |
Indiana Finance Authority
Refunding Revenue Bonds
Indianapolis Power & Light Co.
Series 2009B
01/01/16 | | | 4.900 | % | | | 11,000,000 | | | | 11,559,570 | | |
Revenue Bonds
1st Lien-CWA Authority, Inc.
Series 2011A
10/01/25 | | | 5.250 | % | | | 1,750,000 | | | | 2,076,813 | | |
2nd Lien-CWA Authority, Inc.
Series 2011B
10/01/23 | | | 5.250 | % | | | 7,035,000 | | | | 8,408,302 | | |
Indiana Health & Educational Facilities Financing Authority
Refunding Revenue Bonds
Clarian Health Obligation Group
Series 2006B
02/15/24 | | | 5.000 | % | | | 1,000,000 | | | | 1,053,980 | | |
Revenue Bonds
Baptist Homes of Indiana
Series 2005
11/15/25 | | | 5.250 | % | | | 10,640,000 | | | | 10,848,863 | | |
Total | | | | | | | 35,547,392 | | |
Iowa 0.2% | |
City of Coralville
Tax Allocation Bonds
Tax Increment
Series 2007C
06/01/17 | | | 5.000 | % | | | 730,000 | | | | 737,271 | | |
Iowa Finance Authority
Refunding Revenue Bonds
Development-Care Initiatives Project
Series 2006A
07/01/18 | | | 5.250 | % | | | 2,695,000 | | | | 2,817,946 | | |
Revenue Bonds
Iowa State Revolving Fund
Series 2008
08/01/20 | | | 5.250 | % | | | 500,000 | | | | 579,840 | | |
Total | | | | | | | 4,135,057 | | |
The accompanying Notes to Financial Statements are an integral part of this statement.
Annual Report 2014
12
Columbia AMT-Free Intermediate Muni Bond Fund
Portfolio of Investments (continued)
October 31, 2014
Municipal Bonds (continued)
Issue
Description | | Coupon
Rate | | Principal
Amount ($) | |
Value ($) | |
Kansas 1.0% | |
City of Manhattan
Revenue Bonds
Meadowlark Hills Retirement
Series 2007A
05/15/24 | | | 5.000 | % | | | 6,000,000 | | | | 6,098,460 | | |
Kansas Turnpike Authority
Revenue Bonds
Series 2002 (AGM)
09/01/16 | | | 5.250 | % | | | 1,230,000 | | | | 1,338,769 | | |
State of Kansas Department of Transportation
Revenue Bonds
Series 2004A
03/01/18 | | | 5.500 | % | | | 11,775,000 | | | | 13,601,773 | | |
Total | | | | | | | 21,039,002 | | |
Kentucky 0.8% | |
Louisville & Jefferson County Metropolitan Sewer District
Revenue Bonds
Series 2009A
05/15/21 | | | 5.000 | % | | | 7,445,000 | | | | 8,575,598 | | |
05/15/22 | | | 5.000 | % | | | 7,825,000 | | | | 9,013,304 | | |
Total | | | | | | | 17,588,902 | | |
Louisiana 1.0% | |
Louisiana Office Facilities Corp.
Refunding Revenue Bonds
State Capital
Series 2010A
05/01/20 | | | 5.000 | % | | | 4,290,000 | | | | 5,015,696 | | |
Louisiana State Citizens Property Insurance Corp.
Revenue Bonds
Series 2006B (AMBAC)
06/01/16 | | | 5.000 | % | | | 500,000 | | | | 534,940 | | |
New Orleans Aviation Board
Revenue Bonds
Consolidated Rental Car
Series 2009A
01/01/25 | | | 6.000 | % | | | 4,250,000 | | | | 4,849,420 | | |
Parish of St. Charles
Revenue Bonds
Valero Energy Corp.
Series 2010(a)
12/01/40 | | | 4.000 | % | | | 9,245,000 | | | | 9,939,207 | | |
Total | | | | | | | 20,339,263 | | |
Massachusetts 5.2% | |
Commonwealth of Massachusetts
Limited General Obligation Bonds
Consolidated Loan
Series 2002D (AMBAC/TCRS/BNY)
08/01/18 | | | 5.500 | % | | | 6,500,000 | | | | 7,606,040 | | |
Municipal Bonds (continued)
Issue
Description | | Coupon
Rate | | Principal
Amount ($) | |
Value ($) | |
Limited General Obligation Refunding Bonds
Series 2003D
10/01/17 | | | 5.500 | % | | | 5,000,000 | | | | 5,708,000 | | |
Revenue Bonds
Consolidated Loan
Series 2005A (AGM)
06/01/16 | | | 5.500 | % | | | 13,615,000 | | | | 14,717,271 | | |
Unlimited General Obligation Bonds
Consolidated Loan
Series 1998C
08/01/17 | | | 5.250 | % | | | 1,775,000 | | | | 2,002,253 | | |
Unlimited General Obligation Refunding Bonds
Series 2004C (AGM)
12/01/16 | | | 5.500 | % | | | 10,000,000 | | | | 11,050,300 | | |
Massachusetts Bay Transportation Authority
Unrefunded Revenue Bonds
General Transportation
Series 1991 (NPFGC)
03/01/21 | | | 7.000 | % | | | 2,395,000 | | | | 2,962,495 | | |
Massachusetts Clean Water Trust (The)
Refunding Revenue Bonds
Pool Program
Series 2004A
08/01/17 | | | 5.250 | % | | | 2,920,000 | | | | 3,293,293 | | |
Revenue Bonds
MWRA Program
Subordinated Series 1999A
08/01/19 | | | 6.000 | % | | | 2,500,000 | | | | 3,054,075 | | |
Massachusetts Development Finance Agency
Revenue Bonds
1st Mortgage-Orchard Cove
Series 2007
10/01/17 | | | 5.000 | % | | | 435,000 | | | | 463,375 | | |
Massachusetts Health & Educational Facilities Authority
Prerefunded 07/01/18 Revenue Bonds
Massachusetts Institute of Technology
Series 2009O
07/01/26 | | | 5.000 | % | | | 500,000 | | | | 575,140 | | |
Revenue Bonds
Boston College
Series 2008M-1
06/01/24 | | | 5.500 | % | | | 2,670,000 | | | | 3,341,238 | | |
Caregroup, Inc.
Series 2008E-2
07/01/20 | | | 5.375 | % | | | 9,720,000 | | | | 11,000,707 | | |
07/01/22 | | | 5.375 | % | | | 13,345,000 | | | | 15,103,337 | | |
Harvard University
Series 2009A
11/15/19 | | | 5.250 | % | | | 1,000,000 | | | | 1,172,880 | | |
Massachusetts Port Authority
Refunding Revenue Bonds
Passenger Facility Charge
Series 2007D (AGM)
07/01/17 | | | 5.000 | % | | | 8,500,000 | | | | 9,475,885 | | |
The accompanying Notes to Financial Statements are an integral part of this statement.
Annual Report 2014
13
Columbia AMT-Free Intermediate Muni Bond Fund
Portfolio of Investments (continued)
October 31, 2014
Municipal Bonds (continued)
Issue
Description | | Coupon
Rate | | Principal
Amount ($) | |
Value ($) | |
Revenue Bonds
Series 2010A
07/01/25 | | | 5.000 | % | | | 1,500,000 | | | | 1,746,915 | | |
Massachusetts Water Pollution Abatement Trust (The)
Prerefunded 08/01/19 Revenue Bonds
State Revolving Fund
Series 2009-14
08/01/24 | | | 5.000 | % | | | 12,530,000 | | | | 14,761,844 | | |
Total | | | | | | | 108,035,048 | | |
Michigan 1.4% | |
City of Detroit Sewage Disposal System
Refunding Revenue Bonds
Senior Lien
Series 2012A
07/01/26 | | | 5.250 | % | | | 2,000,000 | | | | 2,231,360 | | |
07/01/27 | | | 5.250 | % | | | 1,500,000 | | | | 1,669,245 | | |
Detroit City School District
Unlimited General Obligation Bonds
School Building & Site Improvement
Series 2002A (FGIC) (Qualified School Bond Loan Fund)
05/01/19 | | | 6.000 | % | | | 2,000,000 | | | | 2,333,300 | | |
Michigan Finance Authority
Refunding Revenue Bonds
Senior Lien-Detroit Water & Sewer
Series 2014C-6
07/01/33 | | | 5.000 | % | | | 800,000 | | | | 867,584 | | |
Series 2014H-1
10/01/26 | | | 5.000 | % | | | 3,300,000 | | | | 3,843,180 | | |
Revenue Bonds
Senior Lien-Detroit Water & Sewer
Series 2014C-3 AGM
07/01/32 | | | 5.000 | % | | | 1,000,000 | | | | 1,102,230 | | |
Royal Oak Hospital Finance Authority
Refunding Revenue Bonds
William Beaumont Hospital
Series 2014D
09/01/32 | | | 5.000 | % | | | 4,000,000 | | | | 4,494,360 | | |
State of Michigan Trunk Line
Refunding Revenue Bonds
Series 1998A
11/01/16 | | | 5.500 | % | | | 2,000,000 | | | | 2,203,260 | | |
Series 2005 (AGM)
11/01/17 | | | 5.250 | % | | | 5,050,000 | | | | 5,730,336 | | |
Revenue Bonds
Series 2011
11/15/27 | | | 5.000 | % | | | 1,000,000 | | | | 1,168,790 | | |
11/15/28 | | | 5.000 | % | | | 1,000,000 | | | | 1,161,620 | | |
11/15/29 | | | 5.000 | % | | | 1,205,000 | | | | 1,398,053 | | |
Municipal Bonds (continued)
Issue
Description | | Coupon
Rate | | Principal
Amount ($) | |
Value ($) | |
State of Michigan
Unlimited General Obligation Refunding Bonds
Series 2001
12/01/15 | | | 5.500 | % | | | 1,250,000 | | | | 1,322,050 | | |
Total | | | | | | | 29,525,368 | | |
Minnesota 0.2% | |
City of Minneapolis
Revenue Bonds
Fairview Health Services
Series 2008A
11/15/18 | | | 6.000 | % | | | 1,000,000 | | | | 1,103,420 | | |
City of St. Louis Park
Revenue Bonds
Park Nicollet Health Services
Series 2008C
07/01/23 | | | 5.500 | % | | | 750,000 | | | | 837,413 | | |
State of Minnesota
Unlimited General Obligation Bonds
Series 2008C
08/01/19 | | | 5.000 | % | | | 500,000 | | | | 590,285 | | |
Woodbury Housing & Redevelopment Authority
Revenue Bonds
St. Therese of Woodbury
Series 2014
12/01/34 | | | 5.000 | % | | | 1,000,000 | | | | 1,007,840 | | |
Total | | | | | | | 3,538,958 | | |
Missouri 1.6% | |
City of St. Louis Airport
Refunding Revenue Bonds
Lambert-St. Louis International Airport
Series 2007A (AGM)
07/01/21 | | | 5.000 | % | | | 5,000,000 | | | | 5,481,350 | | |
Health & Educational Facilities Authority of the State of Missouri
Revenue Bonds
Lutheran Senior Services
Series 2014
02/01/26 | | | 5.000 | % | | | 1,225,000 | | | | 1,381,874 | | |
02/01/29 | | | 5.000 | % | | | 5,975,000 | | | | 6,612,951 | | |
St. Louis University
Series 1998
10/01/16 | | | 5.500 | % | | | 1,000,000 | | | | 1,096,770 | | |
Washington University
Series 2008A
03/15/18 | | | 5.250 | % | | | 1,000,000 | | | | 1,149,040 | | |
Missouri Joint Municipal Electric Utility Commission
Revenue Bonds
Iatan 2 Project
Series 2009A
01/01/17 | | | 4.500 | % | | | 1,000,000 | | | | 1,084,050 | | |
The accompanying Notes to Financial Statements are an integral part of this statement.
Annual Report 2014
14
Columbia AMT-Free Intermediate Muni Bond Fund
Portfolio of Investments (continued)
October 31, 2014
Municipal Bonds (continued)
Issue
Description | | Coupon
Rate | | Principal
Amount ($) | |
Value ($) | |
Missouri State Environmental Improvement & Energy
Resources Authority
Revenue Bonds
State Revolving Funds Program
Series 2004B
01/01/18 | | | 5.250 | % | | | 7,470,000 | | | | 8,537,612 | | |
Poplar Bluff Regional Transportation Development
District
Revenue Bonds
Series 2012
12/01/26 | | | 3.250 | % | | | 1,075,000 | | | | 1,077,956 | | |
St. Louis County Industrial Development Authority
Revenue Bonds
Friendship Village Sunset Hills
Series 2013A
09/01/23 | | | 5.000 | % | | | 690,000 | | | | 740,894 | | |
St. Andrews Residence for Seniors
Series 2007A
12/01/26 | | | 6.250 | % | | | 7,000,000 | | | | 7,362,040 | | |
Total | | | | | | | 34,524,537 | | |
Nebraska 0.1% | |
Municipal Energy Agency of Nebraska
Refunding Revenue Bonds
Series 2009A (BHAC)
04/01/21 | | | 5.000 | % | | | 750,000 | | | | 860,963 | | |
Nebraska Public Power District
Revenue Bonds
General
Series 2008B
01/01/20 | | | 5.000 | % | | | 570,000 | | | | 640,697 | | |
University of Nebraska
Revenue Bonds
Lincoln Student Fees & Facilities
Series 2009A
07/01/23 | | | 5.000 | % | | | 700,000 | | | | 793,429 | | |
Total | | | | | | | 2,295,089 | | |
Nevada 1.4% | |
Carson City
Refunding Revenue Bonds
Carson Tahoe Regional Medical Center
Series 2012
09/01/27 | | | 5.000 | % | | | 3,250,000 | | | | 3,597,750 | | |
City of Sparks
Tax Anticipation Revenue Bonds
Senior Sales
Series 2008A(d)
06/15/20 | | | 6.500 | % | | | 4,505,000 | | | | 4,917,072 | | |
Municipal Bonds (continued)
Issue
Description | | Coupon
Rate | | Principal
Amount ($) | |
Value ($) | |
County of Clark Department of Aviation
Revenue Bonds
System Subordinated Lien
Series 2009C (AGM)
07/01/25 | | | 5.000 | % | | | 8,190,000 | | | | 9,374,929 | | |
County of Clark
Limited General Obligation Refunding Bonds
Transportation
Series 2009A
12/01/28 | | | 5.000 | % | | | 10,740,000 | | | | 12,285,057 | | |
Total | | | | | | | 30,174,808 | | |
New Hampshire 0.8% | |
New Hampshire Health & Education Facilities Authority Act
Revenue Bonds
Southern New Hampshire Medical Center
Series 2007A
10/01/23 | | | 5.250 | % | | | 7,000,000 | | | | 7,634,550 | | |
University System
Series 2009A
07/01/23 | | | 5.000 | % | | | 8,370,000 | | | | 9,338,911 | | |
Total | | | | | | | 16,973,461 | | |
New Jersey 4.0% | |
County of Passaic
Unlimited General Obligation Refunding Bonds
Series 2003 (AGM)
09/01/16 | | | 5.200 | % | | | 1,500,000 | | | | 1,626,840 | | |
Essex County Improvement Authority
Refunding Revenue Bonds
County Guaranteed Project Consolidation
Series 2004 (NPFGC)
10/01/26 | | | 5.500 | % | | | 750,000 | | | | 963,855 | | |
Freehold Regional High School District
Unlimited General Obligation Refunding Bonds
Series 2001 (NPFGC)
03/01/20 | | | 5.000 | % | | | 1,205,000 | | | | 1,417,249 | | |
Hudson County Improvement Authority
Refunding Revenue Bonds
Hudson County Lease Project
Series 2010 (AGM)
10/01/24 | | | 5.375 | % | | | 2,000,000 | | | | 2,422,440 | | |
Manalapan-Englishtown Regional Board of Education
Unlimited General Obligation Refunding Bonds
Series 2004 (NPFGC)
12/01/20 | | | 5.750 | % | | | 1,325,000 | | | | 1,649,307 | | |
Middlesex County Improvement Authority
Revenue Bonds
Heldrich Center Hotel
Senior Series 2005A
01/01/20 | | | 5.000 | % | | | 815,000 | | | | 625,635 | | |
The accompanying Notes to Financial Statements are an integral part of this statement.
Annual Report 2014
15
Columbia AMT-Free Intermediate Muni Bond Fund
Portfolio of Investments (continued)
October 31, 2014
Municipal Bonds (continued)
Issue
Description | | Coupon
Rate | | Principal
Amount ($) | |
Value ($) | |
New Jersey Economic Development Authority
Refunding Revenue Bonds
New Jersey American Water Co.
Series 2010A
06/01/23 | | | 4.450 | % | | | 1,000,000 | | | | 1,095,240 | | |
School Facilities-Construction
Series 2005K (AMBAC)
12/15/20 | | | 5.250 | % | | | 16,710,000 | | | | 19,456,957 | | |
Series 2009AA
12/15/20 | | | 5.250 | % | | | 1,000,000 | | | | 1,153,670 | | |
Revenue Bonds
Cigarette Tax
Series 2004 Escrowed to Maturity
06/15/16 | | | 5.500 | % | | | 5,500,000 | | | | 5,959,470 | | |
MSU Student Housing Project-Provident
Series 2010
06/01/21 | | | 5.000 | % | | | 1,000,000 | | | | 1,106,580 | | |
New Jersey Economic Development Authority(b)
Revenue Bonds
Capital Appreciation-Motor Vehicle Surcharges
Series 2004 (NPFGC)
07/01/21 | | | 0.000 | % | | | 1,255,000 | | | | 1,044,047 | | |
New Jersey Educational Facilities Authority
Refunding Revenue Bonds
Rowan University
Series 2008B (AGM)
07/01/23 | | | 5.000 | % | | | 750,000 | | | | 842,557 | | |
New Jersey Higher Education Student Assistance
Authority
Refunding Revenue Bonds
Series 2010-1A
12/01/25 | | | 5.000 | % | | | 830,000 | | | | 878,007 | | |
New Jersey Housing & Mortgage Finance Agency
Revenue Bonds
Series 2008AA
10/01/28 | | | 6.375 | % | | | 175,000 | | | | 182,073 | | |
New Jersey State Turnpike Authority
Revenue Bonds
Series 1989 Escrowed to Maturity
01/01/19 | | | 6.000 | % | | | 1,000,000 | | | | 1,180,890 | | |
New Jersey Transportation Trust Fund Authority
Revenue Bonds
Transportation System
Series 2001C (AGM)
12/15/18 | | | 5.500 | % | | | 2,000,000 | | | | 2,304,480 | | |
Series 2003A (AMBAC)
12/15/15 | | | 5.500 | % | | | 4,360,000 | | | | 4,607,125 | | |
Series 2006A
12/15/20 | | | 5.250 | % | | | 1,000,000 | | | | 1,162,480 | | |
12/15/21 | | | 5.500 | % | | | 680,000 | | | | 801,652 | | |
Series 2006A (AGM)
12/15/21 | | | 5.500 | % | | | 4,700,000 | | | | 5,581,015 | | |
12/15/22 | | | 5.250 | % | | | 4,000,000 | | | | 4,722,400 | | |
Series 2010D
12/15/23 | | | 5.250 | % | | | 18,000,000 | | | | 21,076,380 | | |
Municipal Bonds (continued)
Issue
Description | | Coupon
Rate | | Principal
Amount ($) | |
Value ($) | |
Robbinsville Board of Education
Unlimited General Obligation Refunding Bonds
Series 2005 (AGM)
01/01/28 | | | 5.250 | % | | | 500,000 | | | | 643,680 | | |
State of New Jersey
Certificate of Participation
Equipment Lease Purchase
Series 2008A
06/15/23 | | | 5.000 | % | | | 1,000,000 | | | | 1,084,960 | | |
Series 2009A
06/15/17 | | | 5.000 | % | | | 1,000,000 | | | | 1,104,830 | | |
Total | | | | | | | 84,693,819 | | |
New Mexico 0.2% | |
County of Bernalillo
Refunding Revenue Bonds
Series 1998
04/01/27 | | | 5.250 | % | | | 3,000,000 | | | | 3,670,650 | | |
New York 12.8% | |
Albany Industrial Development Agency
Revenue Bonds
St. Peters Hospital Project
Series 2008A
11/15/16 | | | 5.250 | % | | | 1,750,000 | | | | 1,911,385 | | |
11/15/17 | | | 5.250 | % | | | 1,250,000 | | | | 1,407,225 | | |
City of New York
Prerefunded 02/01/16 Unlimited General Obligation Bonds
Series 2005G
08/01/20 | | | 5.000 | % | | | 25,000 | | | | 26,479 | | |
Unlimited General Obligation Bonds
Series 2007D-1
12/01/21 | | | 5.000 | % | | | 5,900,000 | | | | 6,622,396 | | |
Subordinated Series 2008B-1
09/01/22 | | | 5.250 | % | | | 7,200,000 | | | | 8,317,944 | | |
Unrefunded Unlimited General Obligation Bonds
Series 2005G
08/01/20 | | | 5.000 | % | | | 9,975,000 | | | | 10,542,378 | | |
Long Island Power Authority
Revenue Bonds
Series 2012B
09/01/26 | | | 5.000 | % | | | 5,000,000 | | | | 5,738,400 | | |
Metropolitan Transportation Authority
Revenue Bonds
Commuter Facilities
Series 1993O Escrowed to Maturity
07/01/17 | | | 5.500 | % | | | 3,000,000 | | | | 3,346,740 | | |
Series 2004A (NPFGC)
11/15/16 | | | 5.250 | % | | | 3,000,000 | | | | 3,296,280 | | |
11/15/17 | | | 5.250 | % | | | 4,000,000 | | | | 4,548,240 | | |
Series 2009A
11/15/26 | | | 5.300 | % | | | 710,000 | | | | 811,949 | | |
The accompanying Notes to Financial Statements are an integral part of this statement.
Annual Report 2014
16
Columbia AMT-Free Intermediate Muni Bond Fund
Portfolio of Investments (continued)
October 31, 2014
Municipal Bonds (continued)
Issue
Description | | Coupon
Rate | | Principal
Amount ($) | |
Value ($) | |
Transportation
Series 2007A (AGM)
11/15/20 | | | 5.000 | % | | | 5,000,000 | | | | 5,603,550 | | |
11/15/21 | | | 5.000 | % | | | 3,000,000 | | | | 3,356,370 | | |
Nassau County Local Economic Assistance Corp.
Refunding Revenue Bonds
Catholic Health Services
Series 2011
07/01/19 | | | 5.000 | % | | | 6,125,000 | | | | 7,022,068 | | |
07/01/20 | | | 5.000 | % | | | 9,390,000 | | | | 10,891,931 | | |
New York City Transitional Finance Authority
Revenue Bonds
Future Tax Secured
Subordinated Series 2007C-1
11/01/20 | | | 5.000 | % | | | 10,300,000 | | | | 11,533,837 | | |
Subordinated Series 2009A-1
05/01/27 | | | 5.000 | % | | | 10,430,000 | | | | 11,999,298 | | |
New York State Dormitory Authority
Refunding Revenue Bonds
Consolidated Service Contract
Series 2009A
07/01/24 | | | 5.000 | % | | | 3,500,000 | | | | 4,038,650 | | |
Revenue Bonds
Court Facilities Lease
Series 2005A (AMBAC)
05/15/18 | | | 5.250 | % | | | 6,000,000 | | | | 6,879,120 | | |
Mount Sinai School of Medicine
Series 2009
07/01/26 | | | 5.500 | % | | | 14,635,000 | | | | 17,071,727 | | |
07/01/27 | | | 5.500 | % | | | 10,675,000 | | | | 12,421,110 | | |
North Shore-Long Island Jewish Obligation Group
Series 2009A
05/01/30 | | | 5.250 | % | | | 4,750,000 | | | | 5,281,288 | | |
St. John's University
Series 2007C (NPFGC)
07/01/23 | | | 5.250 | % | | | 3,245,000 | | | | 3,939,268 | | |
State University Educational Facilities
3rd General Series 2005A (NPFGC)
05/15/17 | | | 5.500 | % | | | 10,000,000 | | | | 11,237,100 | | |
05/15/22 | | | 5.500 | % | | | 6,730,000 | | | | 8,364,044 | | |
Upstate Community-State Supported
Series 2005B (NPFGC)
07/01/21 | | | 5.500 | % | | | 6,345,000 | | | | 7,777,891 | | |
New York State Thruway Authority
Revenue Bonds
General
2nd Series 2005B (AMBAC)
04/01/20 | | | 5.500 | % | | | 10,840,000 | | | | 13,112,714 | | |
2nd Series 2007B
04/01/19 | | | 5.000 | % | | | 5,000,000 | | | | 5,565,100 | | |
Series 2012I
01/01/24 | | | 5.000 | % | | | 8,500,000 | | | | 10,075,985 | | |
Series 2007H (NPFGC)
01/01/23 | | | 5.000 | % | | | 1,500,000 | | | | 1,676,565 | | |
Municipal Bonds (continued)
Issue
Description | | Coupon
Rate | | Principal
Amount ($) | |
Value ($) | |
New York State Urban Development Corp.
Refunding Revenue Bonds
Service Contract
Series 2008B
01/01/19 | | | 5.000 | % | | | 4,000,000 | | | | 4,563,720 | | |
01/01/20 | | | 5.000 | % | | | 10,460,000 | | | | 11,883,188 | | |
Revenue Bonds
State Personal Income Tax-State Facilities
Series 2004A-2 (NPFGC)
03/15/20 | | | 5.500 | % | | | 29,450,000 | | | | 35,642,451 | | |
Port Authority of New York & New Jersey
Revenue Bonds
Consolidated 154th
Series 2009
09/01/26 | | | 4.750 | % | | | 1,000,000 | | | | 1,111,900 | | |
Suffolk County Industrial Development Agency
Refunding Revenue Bonds
Jeffersons Ferry Project
Series 2006
11/01/28 | | | 5.000 | % | | | 3,000,000 | | | | 3,108,540 | | |
Triborough Bridge & Tunnel Authority
Prerefunded 11/15/18 Revenue Bonds
Subordinated Series 2008D
11/15/22 | | | 5.000 | % | | | 6,165,000 | | | | 7,183,396 | | |
Total | | | | | | | 267,910,227 | | |
North Carolina 2.7% | |
Albemarle Hospital Authority
Prerefunded 10/01/17 Revenue Bonds
Series 2007
10/01/21 | | | 5.250 | % | | | 3,000,000 | | | | 3,404,550 | | |
10/01/27 | | | 5.250 | % | | | 3,700,000 | | | | 4,198,945 | | |
Cape Fear Public Utility Authority
Revenue Bonds
Series 2008
08/01/20 | | | 5.000 | % | | | 800,000 | | | | 914,336 | | |
City of Charlotte Water & Sewer System
Revenue Bonds
Series 2008
07/01/26 | | | 5.000 | % | | | 1,250,000 | | | | 1,426,838 | | |
County of Iredell
Certificate of Participation
Iredell County School Project
Series 2008 (AGM)
06/01/17 | | | 5.250 | % | | | 1,710,000 | | | | 1,903,538 | | |
North Carolina Eastern Municipal Power Agency
Refunding Revenue Bonds
Series 2008A (AGM)
01/01/19 | | | 5.250 | % | | | 5,415,000 | | | | 6,128,697 | | |
Revenue Bonds
Series 2009B
01/01/26 | | | 5.000 | % | | | 21,105,000 | | | | 24,013,269 | | |
The accompanying Notes to Financial Statements are an integral part of this statement.
Annual Report 2014
17
Columbia AMT-Free Intermediate Muni Bond Fund
Portfolio of Investments (continued)
October 31, 2014
Municipal Bonds (continued)
Issue
Description | | Coupon
Rate | | Principal
Amount ($) | |
Value ($) | |
North Carolina Medical Care Commission
Revenue Bonds
Health Care Housing-Arc Projects
Series 2004A
10/01/24 | | | 5.500 | % | | | 1,575,000 | | | | 1,594,388 | | |
State of North Carolina
Refunding Revenue Bonds
Series 2014B
06/01/25 | | | 5.000 | % | | | 10,000,000 | | | | 12,524,300 | | |
Total | | | | | | | 56,108,861 | | |
Ohio 1.7% | |
American Municipal Power, Inc.
Revenue Bonds
AMP Fremont Energy Center Project
Series 2012
02/15/24 | | | 5.000 | % | | | 2,000,000 | | | | 2,312,840 | | |
Prairie State Energy Campus Project
Series 2008A
02/15/20 | | | 5.250 | % | | | 4,060,000 | | | | 4,612,769 | | |
02/15/22 | | | 5.250 | % | | | 9,810,000 | | | | 11,145,631 | | |
City of Cleveland
Limited General Obligation Refunding Bonds
Series 2005 (AMBAC)
10/01/16 | | | 5.500 | % | | | 7,710,000 | | | | 8,442,065 | | |
Mason City School District
Unlimited General Obligation Refunding Bonds
Series 2005 (NPFGC)
12/01/19 | | | 5.250 | % | | | 2,250,000 | | | | 2,684,115 | | |
Ohio State Turnpike Commission
Refunding Revenue Bonds
Series 1998A (NPFGC)
02/15/21 | | | 5.500 | % | | | 2,000,000 | | | | 2,444,440 | | |
State of Ohio
Refunding Revenue Bonds
Cleveland Clinic Health System
Series 2011
01/01/25 | | | 5.000 | % | | | 3,750,000 | | | | 4,301,025 | | |
Total | | | | | | | 35,942,885 | | |
Oklahoma 0.1% | |
Chickasaw Nation
Revenue Bonds
Health System
Series 2007(d)(e)
12/01/17 | | | 5.375 | % | | | 1,960,000 | | | | 2,066,879 | | |
Oregon 0.1% | |
Hospital Facilities Authority of Multnomah County
Refunding Revenue Bonds
Mirabella at South Waterfront
Series 2014A
10/01/34 | | | 5.125 | % | | | 1,000,000 | | | | 1,044,430 | | |
Municipal Bonds (continued)
Issue
Description | | Coupon
Rate | | Principal
Amount ($) | |
Value ($) | |
Oregon State Lottery
Prerefunded 04/01/19 Revenue Bonds
Series 2009A
04/01/24 | | | 5.250 | % | | | 1,000,000 | | | | 1,180,570 | | |
Total | | | | | | | 2,225,000 | | |
Pennsylvania 3.4% | |
City of Philadelphia
Unlimited General Obligation Bonds
Series 2011
08/01/19 | | | 5.250 | % | | | 3,795,000 | | | | 4,449,410 | | |
Commonwealth of Pennsylvania
Unlimited General Obligation Refunding Bonds
3rd Series 2004 (AGM)
07/01/18 | | | 5.375 | % | | | 12,000,000 | | | | 13,908,840 | | |
County of Westmoreland
Unlimited General Obligation Bonds
Capital Appreciation
Series 1997 Escrowed to Maturity (NPFGC)(b)
12/01/18 | | | 0.000 | % | | | 1,000,000 | | | | 914,770 | | |
Delaware River Port Authority
Refunding Revenue Bonds
Port District Project
Series 2012
01/01/27 | | | 5.000 | % | | | 1,835,000 | | | | 2,073,458 | | |
Delaware Valley Regional Finance Authority
Revenue Bonds
Series 1997B (AMBAC)
07/01/17 | | | 5.600 | % | | | 2,000,000 | | | | 2,215,180 | | |
Series 2002
07/01/17 | | | 5.750 | % | | | 2,000,000 | | | | 2,233,040 | | |
Elizabeth Forward School District
Unlimited General Obligation Bonds
Capital Appreciation
Series 1994B Escrowed to Maturity (NPFGC)(b)
09/01/21 | | | 0.000 | % | | | 2,210,000 | | | | 1,964,138 | | |
Lancaster County Solid Waste Management Authority
Revenue Bonds
Series 2013A
12/15/29 | | | 5.250 | % | | | 3,000,000 | | | | 3,483,120 | | |
Northampton County General Purpose Authority
Revenue Bonds
Saint Luke's Hospital Project
Series 2008A
08/15/20 | | | 5.000 | % | | | 3,480,000 | | | | 3,818,708 | | |
08/15/21 | | | 5.125 | % | | | 3,715,000 | | | | 4,087,132 | | |
08/15/22 | | | 5.250 | % | | | 1,965,000 | | | | 2,168,613 | | |
Pennsylvania Turnpike Commission
Revenue Bonds
Subordinated Series 2011A
12/01/31 | | | 5.625 | % | | | 8,150,000 | | | | 9,215,205 | | |
The accompanying Notes to Financial Statements are an integral part of this statement.
Annual Report 2014
18
Columbia AMT-Free Intermediate Muni Bond Fund
Portfolio of Investments (continued)
October 31, 2014
Municipal Bonds (continued)
Issue
Description | | Coupon
Rate | | Principal
Amount ($) | |
Value ($) | |
Pennsylvania Turnpike Commission(a)
Revenue Bonds
Capital Appreciation
Subordinated Series 2010B-2
12/01/24 | | | 0.000 | % | | | 20,000,000 | | | | 21,624,000 | | |
Total | | | | | | | 72,155,614 | | |
Rhode Island 1.9% | |
City of Cranston
Unlimited General Obligation Bonds
Series 2008 (AGM)
07/01/26 | | | 4.750 | % | | | 900,000 | | | | 1,000,008 | | |
07/01/27 | | | 4.750 | % | | | 945,000 | | | | 1,050,008 | | |
Providence Housing Authority
Revenue Bonds
Capital Fund
Series 2008
09/01/24 | | | 5.000 | % | | | 565,000 | | | | 622,105 | | |
09/01/26 | | | 5.000 | % | | | 310,000 | | | | 338,712 | | |
09/01/27 | | | 5.000 | % | | | 690,000 | | | | 752,507 | | |
Rhode Island Convention Center Authority
Refunding Revenue Bonds
Series 2005A (AGM)
05/15/23 | | | 5.000 | % | | | 4,000,000 | | | | 4,099,240 | | |
Rhode Island Depositors Economic Protection Corp.
Prerefunded Revenue Bonds
Series 1993A Escrowed to Maturity (AGM)
08/01/21 | | | 5.750 | % | | | 2,165,000 | | | | 2,715,213 | | |
Rhode Island Economic Development Corp.
Revenue Bonds
East Greenwich Free Library Association
Series 2004
06/15/24 | | | 5.750 | % | | | 415,000 | | | | 415,137 | | |
Grant Anticipation-Department of Transportation
Series 2009A (AGM)
06/15/21 | | | 5.250 | % | | | 2,000,000 | | | | 2,267,520 | | |
Providence Place Mall
Senior Series 2000
07/01/20 | | | 6.125 | % | | | 1,175,000 | | | | 1,175,106 | | |
Series 2008C (AGM)
07/01/17 | | | 5.000 | % | | | 2,245,000 | | | | 2,456,389 | | |
Rhode Island Health & Educational Building Corp.
Refunding Revenue Bonds
Hospital Financing-Lifespan Obligation
Series 2006A (AGM)
05/15/26 | | | 5.000 | % | | | 2,000,000 | | | | 2,074,080 | | |
University of Rhode Island
Series 2008A
09/15/28 | | | 6.500 | % | | | 3,000,000 | | | | 3,527,040 | | |
Revenue Bonds
Bond Financing Program
Series 2009
05/15/25 | | | 5.000 | % | | | 1,515,000 | | | | 1,742,083 | | |
Municipal Bonds (continued)
Issue
Description | | Coupon
Rate | | Principal
Amount ($) | |
Value ($) | |
Brown University
Series 2007
09/01/18 | | | 5.000 | % | | | 1,000,000 | | | | 1,115,410 | | |
Higher Education-Johnson & Wales
Series 1999 (NPFGC)
04/01/18 | | | 5.500 | % | | | 1,420,000 | | | | 1,607,468 | | |
Hospital Financing-Lifespan Obligation
Series 2009A (AGM)
05/15/27 | | | 6.125 | % | | | 400,000 | | | | 462,776 | | |
05/15/30 | | | 6.250 | % | | | 500,000 | | | | 579,740 | | |
New England Institute of Technology
Series 2010
03/01/24 | | | 5.000 | % | | | 1,145,000 | | | | 1,270,160 | | |
Providence Public Schools Financing Program
Series 2006A (AGM)
05/15/23 | | | 5.000 | % | | | 2,000,000 | | | | 2,110,660 | | |
Series 2007A (AGM)
05/15/22 | | | 5.000 | % | | | 2,000,000 | | | | 2,150,160 | | |
Series 2007C (AGM)
05/15/21 | | | 5.000 | % | | | 1,500,000 | | | | 1,606,215 | | |
Public Schools Financing Program
Series 2007B (AMBAC)
05/15/19 | | | 4.250 | % | | | 250,000 | | | | 250,683 | | |
University of Rhode Island
Series 2009A (AGM)
09/15/24 | | | 4.750 | % | | | 1,000,000 | | | | 1,101,160 | | |
Rhode Island Student Loan Authority
Revenue Bonds
Program
Senior Series 2010A
12/01/20 | | | 4.600 | % | | | 885,000 | | | | 939,189 | | |
State of Rhode Island
Certificate of Participation
Lease-Training School Project
Series 2005A (NPFGC)
10/01/19 | | | 5.000 | % | | | 1,200,000 | | | | 1,252,608 | | |
Unlimited General Obligation Refunding Bonds
Consolidated Capital Development Loan
Series 2006A (AGM)
08/01/20 | | | 4.500 | % | | | 1,750,000 | | | | 1,864,642 | | |
Total | | | | | | | 40,546,019 | | |
South Carolina 1.2% | |
County of Florence
Refunding Revenue Bonds
McLeod Regional Medical Center Project
Series 2014
11/01/31 | | | 5.000 | % | | | 3,250,000 | | | | 3,762,330 | | |
11/01/32 | | | 5.000 | % | | | 4,900,000 | | | | 5,645,192 | | |
County of Greenwood
Refunding Revenue Bonds
Self Regional Healthcare
Series 2012B
10/01/31 | | | 5.000 | % | | | 5,000,000 | | | | 5,589,900 | | |
The accompanying Notes to Financial Statements are an integral part of this statement.
Annual Report 2014
19
Columbia AMT-Free Intermediate Muni Bond Fund
Portfolio of Investments (continued)
October 31, 2014
Municipal Bonds (continued)
Issue
Description | | Coupon
Rate | | Principal
Amount ($) | |
Value ($) | |
Greenville County School District
Refunding Revenue Bonds
Building Equity Sooner
Series 2005
12/01/18 | | | 5.500 | % | | | 5,000,000 | | | | 5,881,500 | | |
South Carolina Jobs-Economic Development Authority
Revenue Bonds
Lutheran Homes of South Carolina Obligation Group
Series 2013
05/01/28 | | | 5.000 | % | | | 3,500,000 | | | | 3,637,515 | | |
York Preparatory Academy Project
Series 2014A
11/01/33 | | | 7.000 | % | | | 590,000 | | | | 640,356 | | |
Total | | | | | | | 25,156,793 | | |
South Dakota 0.2% | |
South Dakota Health & Educational Facilities Authority
Revenue Bonds
Regional Health
Series 2011
09/01/19 | | | 5.000 | % | | | 1,250,000 | | | | 1,450,438 | | |
09/01/20 | | | 5.000 | % | | | 1,250,000 | | | | 1,468,237 | | |
09/01/21 | | | 5.000 | % | | | 1,000,000 | | | | 1,156,410 | | |
Total | | | | | | | 4,075,085 | | |
Texas 8.5% | |
Central Texas Regional Mobility Authority
Revenue Bonds
Senior Lien
Series 2010
01/01/19 | | | 5.750 | % | | | 750,000 | | | | 868,883 | | |
01/01/20 | | | 5.750 | % | | | 1,250,000 | | | | 1,472,587 | | |
Series 2011
01/01/31 | | | 5.750 | % | | | 15,230,000 | | | | 17,589,736 | | |
City Public Service Board of San Antonio
Prerefunded 02/01/15 Revenue Bonds
Series 2005
02/01/18 | | | 5.000 | % | | | 10,000,000 | | | | 10,121,600 | | |
City of Austin
Refunding Revenue Bonds
Subordinated Lien
Series 1998 (NPFGC)
05/15/18 | | | 5.250 | % | | | 1,100,000 | | | | 1,259,621 | | |
City of Corpus Christi Utility System
Prerefunded 07/15/15 Revenue Bonds
Series 2005A (AMBAC)
07/15/19 | | | 5.000 | % | | | 2,000,000 | | | | 2,068,300 | | |
City of Houston Airport System
Refunding Revenue Bonds
Subordinated Lien
Series 2012B
07/01/28 | | | 5.000 | % | | | 7,000,000 | | | | 8,040,060 | | |
Municipal Bonds (continued)
Issue
Description | | Coupon
Rate | | Principal
Amount ($) | |
Value ($) | |
City of Houston
Refunding Revenue Bonds
Convention & Entertainment Facilities
Series 2014
09/01/30 | | | 5.000 | % | | | 1,000,000 | | | | 1,153,530 | | |
City of Houston(b)
Revenue Bonds
Capital Appreciation-Convention
Series 2001B (AMBAC)
09/01/17 | | | 0.000 | % | | | 2,000,000 | | | | 1,914,020 | | |
Conroe Independent School District
Unlimited General Obligation Bonds
School Building
Series 2009A
02/15/25 | | | 5.250 | % | | | 1,135,000 | | | | 1,284,400 | | |
Dallas County Community College District
Limited General Obligation Bonds
Series 2009
02/15/20 | | | 5.000 | % | | | 750,000 | | | | 873,173 | | |
Dallas/Fort Worth International Airport
Refunding Revenue Bonds
Series 2012B
11/01/28 | | | 5.000 | % | | | 21,380,000 | | | | 24,696,893 | | |
Dripping Springs Independent School District
Prerefunded 02/15/17 Unlimited General Obligation
Bonds
School Building
Series 2008 (Permanent School Fund Guarantee)
02/15/26 | | | 5.000 | % | | | 1,000,000 | | | | 1,102,400 | | |
Duncanville Independent School District
Unlimited General Obligation Refunding Bonds
Capital Appreciation
Series 2005 (Permanent School Fund Guarantee)(b)
02/15/22 | | | 0.000 | % | | | 2,000,000 | | | | 1,718,760 | | |
Harris County Industrial Development Corp.
Revenue Bonds
Deer Park Refining Project
Series 2008
05/01/18 | | | 4.700 | % | | | 12,000,000 | | | | 13,061,880 | | |
Houston Higher Education Finance Corp.
Revenue Bonds
Cosmos Foundation, Inc.
Series 2011A
05/15/31 | | | 6.500 | % | | | 1,000,000 | | | | 1,201,460 | | |
Lewisville Independent School District
Unlimited General Obligation Bonds
School Building
Series 2009
08/15/21 | | | 5.000 | % | | | 1,000,000 | | | | 1,159,670 | | |
The accompanying Notes to Financial Statements are an integral part of this statement.
Annual Report 2014
20
Columbia AMT-Free Intermediate Muni Bond Fund
Portfolio of Investments (continued)
October 31, 2014
Municipal Bonds (continued)
Issue
Description | | Coupon
Rate | | Principal
Amount ($) | |
Value ($) | |
Lower Colorado River Authority
Refunding Revenue Bonds
LCRA Transmission Services Corp.
Series 2011
05/15/27 | | | 5.000 | % | | | 11,195,000 | | | | 12,568,515 | | |
North Central Texas Health Facility Development Corp.
Revenue Bonds
Hospital-Presbyterian Healthcare
Series 1996B Escrowed to Maturity (NPFGC)
06/01/16 | | | 5.500 | % | | | 6,470,000 | | | | 6,787,289 | | |
North Harris County Regional Water Authority
Revenue Bonds
Senior Lien
Series 2008
12/15/20 | | | 5.250 | % | | | 4,415,000 | | | | 5,060,605 | | |
North Texas Tollway Authority
Refunding Revenue Bonds
System-1st Tier
Series 2008A
01/01/22 | | | 6.000 | % | | | 14,000,000 | | | | 15,973,580 | | |
North Texas Tollway Authority(a)
Refunding Revenue Bonds
System-1st Tier
Series 2008E-3
01/01/38 | | | 5.750 | % | | | 9,350,000 | | | | 9,899,873 | | |
SA Energy Acquisition Public Facility Corp.
Revenue Bonds
Gas Supply
Series 2007
08/01/16 | | | 5.250 | % | | | 4,450,000 | | | | 4,769,154 | | |
Sam Rayburn Municipal Power Agency
Refunding Revenue Bonds
Series 2012
10/01/21 | | | 5.000 | % | | | 2,300,000 | | | | 2,683,364 | | |
San Juan Higher Education Finance Authority
Revenue Bonds
Idea Public Schools
Series 2010A
08/15/20 | | | 5.125 | % | | | 1,600,000 | | | | 1,774,000 | | |
08/15/24 | | | 5.750 | % | | | 1,590,000 | | | | 1,799,928 | | |
Southwest Higher Education Authority, Inc.
Revenue Bonds
Southern Methodist University Project
Series 2009
10/01/26 | | | 5.000 | % | | | 1,000,000 | | | | 1,160,610 | | |
Spring Independent School District
Unlimited General Obligation Bonds
Schoolhouse
Series 2009 (Permanent School Fund Guarantee)
08/15/21 | | | 5.000 | % | | | 750,000 | | | | 861,720 | | |
Municipal Bonds (continued)
Issue
Description | | Coupon
Rate | | Principal
Amount ($) | |
Value ($) | |
Tarrant County Cultural Education Facilities Finance Corp.
Revenue Bonds
Air Force Villages, Inc. Obligation Group
Series 2007
05/15/27 | | | 5.125 | % | | | 4,500,000 | | | | 4,572,495 | | |
Texas City Industrial Development Corp.
Refunding Revenue Bonds
Arco Pipe Line Co. Project
Series 1990
10/01/20 | | | 7.375 | % | | | 3,000,000 | | | | 3,921,840 | | |
University of Houston
Refunding Revenue Bonds
Series 2009
02/15/21 | | | 5.000 | % | | | 1,000,000 | | | | 1,151,060 | | |
University of Texas System (The)
Prerefunded 02/15/17 Revenue Bonds
Financing System
Series 2006D
08/15/18 | | | 5.000 | % | | | 8,455,000 | | | | 9,324,935 | | |
Refunding Revenue Bonds
Financing System
Series 2004A
08/15/17 | | | 5.250 | % | | | 2,000,000 | | | | 2,258,760 | | |
Unrefunded Revenue Bonds
Financing System
Series 2006D
08/15/18 | | | 5.000 | % | | | 1,545,000 | | | | 1,698,465 | | |
Uptown Development Authority
Tax Allocation Bonds
Infrastructure Improvement Facilities
Series 2009
09/01/22 | | | 5.000 | % | | | 750,000 | | | | 826,575 | | |
West Harris County Regional Water Authority
Revenue Bonds
Series 2009
12/15/25 | | | 5.000 | % | | | 1,000,000 | | | | 1,117,580 | | |
Total | | | | | | | 177,797,321 | | |
Utah 0.8% | |
Intermountain Power Agency
Refunding Revenue Bonds
Subordinated Series 2007A (AMBAC)
07/01/17 | | | 5.000 | % | | | 15,000,000 | | | | 16,730,550 | | |
Virgin Islands 0.6% | |
Virgin Islands Public Finance Authority
Refunding Revenue Bonds
Series 2013B(e)
10/01/24 | | | 5.000 | % | | | 9,565,000 | | | | 11,053,027 | | |
The accompanying Notes to Financial Statements are an integral part of this statement.
Annual Report 2014
21
Columbia AMT-Free Intermediate Muni Bond Fund
Portfolio of Investments (continued)
October 31, 2014
Municipal Bonds (continued)
Issue
Description | | Coupon
Rate | | Principal
Amount ($) | |
Value ($) | |
Virgin Islands Water & Power Authority
Refunding Revenue Bonds
Series 2012A(e)
07/01/21 | | | 4.000 | % | | | 625,000 | | | | 639,138 | | |
Total | | | | | | | 11,692,165 | | |
Virginia 1.2% | |
Augusta County Economic Development Authority
Refunding Revenue Bonds
Augusta Health Care, Inc.
Series 2003
09/01/18 | | | 5.250 | % | | | 1,500,000 | | | | 1,695,150 | | |
Dulles Town Center Community Development Authority
Refunding Special Assessment Bonds
Dulles Town Center Project
Series 2012
03/01/26 | | | 4.250 | % | | | 1,000,000 | | | | 989,310 | | |
Virginia College Building Authority
Prerefunded 09/01/18 Revenue Bonds
Public Higher Education Financing
Series 2009
09/01/24 | | | 5.000 | % | | | 5,000 | | | | 5,783 | | |
Unrefunded Revenue Bonds
Public Higher Education Financing
Series 2009
09/01/24 | | | 5.000 | % | | | 995,000 | | | | 1,134,549 | | |
Virginia Gateway Community Development Authority
Refunding Special Assessment Bonds
Series 2012
03/01/30 | | | 5.000 | % | | | 1,500,000 | | | | 1,554,750 | | |
Virginia Public School Authority
Refunding Revenue Bonds
School Financing 1997 Resolution
Series 2005B
08/01/16 | | | 5.250 | % | | | 13,995,000 | | | | 15,179,537 | | |
Virginia Resources Authority
Revenue Bonds
State Revolving Fund
Series 2009
10/01/22 | | | 5.000 | % | | | 500,000 | | | | 587,030 | | |
Subordinated Revenue Bonds
Clean Water State Revolving Fund
Subordinated Series 2007
10/01/17 | | | 5.000 | % | | | 3,760,000 | | | | 4,228,834 | | |
Total | | | | | | | 25,374,943 | | |
Washington 1.1% | |
Energy Northwest
Revenue Bonds
Columbia Generating Station
Series 2007D
07/01/22 | | | 5.000 | % | | | 1,000,000 | | | | 1,107,950 | | |
Municipal Bonds (continued)
Issue
Description | | Coupon
Rate | | Principal
Amount ($) | |
Value ($) | |
State of Washington
Prerefunded 01/01/18 Unlimited General Obligation Bonds
Series 2008D
01/01/20 | | | 5.000 | % | | | 1,000,000 | | | | 1,134,760 | | |
Unlimited General Obligation Bonds
Motor Vehicle Fuel Tax
Series 2010B
08/01/26 | | | 5.000 | % | | | 18,270,000 | | | | 21,116,649 | | |
Total | | | | | | | 23,359,359 | | |
West Virginia 0.2% | |
West Virginia Hospital Finance Authority
Revenue Bonds
Charleston Area Medical Center, Inc.
Series 1993A Escrowed to Maturity
09/01/23 | | | 6.500 | % | | | 3,980,000 | | | | 4,964,135 | | |
Wisconsin 1.6% | |
State of Wisconsin
Revenue Bonds
Series 2009A
05/01/22 | | | 5.000 | % | | | 1,000,000 | | | | 1,158,010 | | |
05/01/23 | | | 5.125 | % | | | 14,000,000 | | | | 16,255,120 | | |
Wisconsin Health & Educational Facilities Authority
Refunding Revenue Bonds
Rogers Memorial Hospital, Inc.
Series 2014A
07/01/34 | | | 5.000 | % | | | 2,500,000 | | | | 2,753,450 | | |
Wheaton Healthcare
Series 2006B
08/15/23 | | | 5.125 | % | | | 13,065,000 | | | | 13,874,769 | | |
Total | | | | | | | 34,041,349 | | |
Total Municipal Bonds
(Cost: $1,881,331,463) | | | | | | | 2,072,578,282 | | |
Money Market Funds 0.5% | |
| | | | | Shares | | Value ($) | |
Dreyfus Tax-Exempt Cash
Management Fund,
0.000%(h) | | | | | 10,419,051 | | | | 10,419,051 | | |
Total Money Market Funds
(Cost: $10,419,051) | | | | | | | 10,419,051 | | |
Total Investments
(Cost: $1,891,750,514) | | | | | | | 2,082,997,333 | | |
Other Assets & Liabilities, Net | | | | | | | 11,855,929 | | |
Net Assets | | | | | | | 2,094,853,262 | | |
The accompanying Notes to Financial Statements are an integral part of this statement.
Annual Report 2014
22
Columbia AMT-Free Intermediate Muni Bond Fund
Portfolio of Investments (continued)
October 31, 2014
Notes to Portfolio of Investments
(a) Variable rate security.
(b) Zero coupon bond.
(c) Identifies securities considered by the Investment Manager to be illiquid as to their marketability. The aggregate value of such securities at October 31, 2014 was $921,810, which represents 0.04% of net assets. Information concerning such security holdings at October 31, 2014 is as follows:
Security Description | | Acquisition Dates | | Cost ($) | |
Capital Trust Agency, Inc.
Revenue Bonds
Atlantic Housing Foundation
Subordinated Series 2008B
07/15/32 7.000% | | 7/23/08 | | | 1,835,000 | | |
Sterling Hill Community Development District
Special Assessment Bonds
Series 2003B
11/01/10 5.500% | | 10/23/03 | | | 149,141 | | |
(d) Security exempt from registration pursuant to Rule 144A under the Securities Act of 1933. This security may be resold in transactions exempt from registration, normally to qualified institutional buyers. At October 31, 2014, the value of these securities amounted to $21,930,918 or 1.05% of net assets.
(e) Municipal obligations include debt obligations issued by or on behalf of territories, possessions, or sovereign nations within the territorial boundaries of the United States. At October 31, 2014, the value of these securities amounted to $24,109,958 or 1.15% of net assets.
(f) Represents securities that have defaulted on payment of interest. The Fund has stopped accruing interest on these securities. At October 31, 2014, the value of these securities amounted to $96,097, which represents less than 0.01% of net assets.
(g) Represents a security purchased on a when-issued or delayed delivery basis.
(h) The rate shown is the seven-day current annualized yield at October 31, 2014.
Abbreviation Legend
ACA ACA Financial Guaranty Corporation
AGM Assured Guaranty Municipal Corporation
AMBAC Ambac Assurance Corporation
BHAC Berkshire Hathaway Assurance Corporation
BNY Bank of New York
FGIC Financial Guaranty Insurance Company
NPFGC National Public Finance Guarantee Corporation
TCRS Transferable Custodial Receipts
XLCA XL Capital Assurance
Fair Value Measurements
Generally accepted accounting principles (GAAP) require disclosure regarding the inputs and valuation techniques used to measure fair value and any changes in valuation inputs or techniques. In addition, investments shall be disclosed by major category.
The Fund categorizes its fair value measurements according to a three-level hierarchy that maximizes the use of observable inputs and minimizes the use of unobservable inputs by prioritizing that the most observable input be used when available. Observable inputs are those that market participants would use in pricing an investment based on market data obtained from sources independent of the reporting entity. Unobservable inputs are those that reflect the Fund's assumptions about the information market participants would use in pricing an investment. An investment's level within the fair value hierarchy is based on the lowest level of any input that is deemed significant to the asset or liability's fair value measurement. The input levels are not necessarily an indication of the risk or liquidity associated with investments at that level. For example, certain U.S. government securities are generally high quality and liquid, however, they are reflected as Level 2 because the inputs used to determine fair value may not always be quoted prices in an active market.
The accompanying Notes to Financial Statements are an integral part of this statement.
Annual Report 2014
23
Columbia AMT-Free Intermediate Muni Bond Fund
Portfolio of Investments (continued)
October 31, 2014
Fair Value Measurements (continued)
Fair value inputs are summarized in the three broad levels listed below:
> Level 1 — Valuations based on quoted prices for investments in active markets that the Fund has the ability to access at the measurement date (including NAV for open-end mutual funds). Valuation adjustments are not applied to Level 1 investments.
> Level 2 — Valuations based on other significant observable inputs (including quoted prices for similar securities, interest rates, prepayment speeds, credit risks, etc.).
> Level 3 — Valuations based on significant unobservable inputs (including the Fund's own assumptions and judgment in determining the fair value of investments).
Inputs that are used in determining fair value of an investment may include price information, credit data, volatility statistics, and other factors. These inputs can be either observable or unobservable. The availability of observable inputs can vary between investments, and is affected by various factors such as the type of investment, and the volume and level of activity for that investment or similar investments in the marketplace. The inputs will be considered by the Investment Manager, along with any other relevant factors in the calculation of an investment's fair value. The Fund uses prices and inputs that are current as of the measurement date, which may include periods of market dislocations. During these periods, the availability of prices and inputs may be reduced for many investments. This condition could cause an investment to be reclassified between the various levels within the hierarchy.
Investments falling into the Level 3 category are primarily supported by quoted prices from brokers and dealers participating in the market for those investments. However, these may be classified as Level 3 investments due to lack of market transparency and corroboration to support these quoted prices. Additionally, valuation models may be used as the pricing source for any remaining investments classified as Level 3. These models may rely on one or more significant unobservable inputs and/or significant assumptions by the Investment Manager. Inputs used in valuations may include, but are not limited to, financial statement analysis, capital account balances, discount rates and estimated cash flows, and comparable company data.
Under the direction of the Fund's Board of Trustees (the Board), the Investment Manager's Valuation Committee (the Committee) is responsible for overseeing the valuation procedures approved by the Board. The Committee consists of voting and non-voting members from various groups within the Investment Manager's organization, including operations and accounting, trading and investments, compliance, risk management and legal.
The Committee meets at least monthly to review and approve valuation matters, which may include a description of specific valuation determinations, data regarding pricing information received from approved pricing vendors and brokers and the results of Board-approved valuation control policies and procedures (the Policies). The Policies address, among other things, instances when market quotations are or are not readily available, including recommendations of third party pricing vendors and a determination of appropriate pricing methodologies; events that require specific valuation determinations and assessment of fair value techniques; securities with a potential for stale pricing, including those that are illiquid, restricted, or in default; and the effectiveness of third party pricing vendors, including periodic reviews of vendors. The Committee meets more frequently, as needed, to discuss additional valuation matters, which may include the need to review back-testing results, review time-sensitive information or approve related valuation actions. The Committee reports to the Board, with members of the Committee meeting with the Board at each of its regularly scheduled meetings to discuss valuation matters and actions during the period, similar to those described earlier.
For investments categorized as Level 3, the Committee monitors information similar to that described above, which may include: (i) data specific to the issuer or comparable issuers, (ii) general market or specific sector news and (iii) quoted prices and specific or similar security transactions. The Committee considers this data and any changes from prior periods in order to assess the reasonableness of observable and unobservable inputs, any assumptions or internal models used to value those securities and changes in fair value. This data is also used to corroborate, when available, information received from approved pricing vendors and brokers. Various factors impact the frequency of monitoring this information (which may occur as often as daily). However, the Committee may determine that changes to inputs, assumptions and models are not required as a result of the monitoring procedures performed.
The accompanying Notes to Financial Statements are an integral part of this statement.
Annual Report 2014
24
Columbia AMT-Free Intermediate Muni Bond Fund
Portfolio of Investments (continued)
October 31, 2014
Fair Value Measurements (continued)
The following table is a summary of the inputs used to value the Fund's investments at October 31, 2014:
Description | | Level 1
Quoted Prices in Active
Markets for Identical
Assets ($) | | Level 2
Other Significant
Observable Inputs ($) | |
Level 3
Significant
Unobservable Inputs ($) | |
Total ($) | |
Bonds | |
Municipal Bonds | | | — | | | | 2,072,578,282 | | | | — | | | | 2,072,578,282 | | |
Total Bonds | | | — | | | | 2,072,578,282 | | | | — | | | | 2,072,578,282 | | |
Mutual Funds | |
Money Market Funds | | | 10,419,051 | | | | — | | | | — | | | | 10,419,051 | | |
Total Mutual Funds | | | 10,419,051 | | | | — | | | | — | | | | 10,419,051 | | |
Total | | | 10,419,051 | | | | 2,072,578,282 | | | | — | | | | 2,082,997,333 | | |
See the Portfolio of Investments for all investment classifications not indicated in the table.
The Fund's assets assigned to the Level 2 input category are generally valued using the market approach, in which a security's value is determined through reference to prices and information from market transactions for similar or identical assets.
There were no transfers of financial assets between levels during the period.
The accompanying Notes to Financial Statements are an integral part of this statement.
Annual Report 2014
25
Columbia AMT-Free Intermediate Muni Bond Fund
Statement of Assets and Liabilities
October 31, 2014
Assets | |
Investments, at value | |
(identified cost $1,891,750,514) | | $ | 2,082,997,333 | | |
Cash | | | 1,403,976 | | |
Receivable for: | |
Capital shares sold | | | 1,585,346 | | |
Interest | | | 27,558,822 | | |
Expense reimbursement due from Investment Manager | | | 6,066 | | |
Prepaid expenses | | | 17,028 | | |
Trustees' deferred compensation plan | | | 206,938 | | |
Total assets | | | 2,113,775,509 | | |
Liabilities | |
Payable for: | |
Investments purchased on a delayed delivery basis | | | 11,051,136 | | |
Capital shares purchased | | | 847,567 | | |
Dividend distributions to shareholders | | | 6,092,934 | | |
Investment management fees | | | 22,724 | | |
Distribution and/or service fees | | | 2,504 | | |
Transfer agent fees | | | 355,169 | | |
Administration fees | | | 3,650 | | |
Compensation of board members | | | 287,056 | | |
Chief compliance officer expenses | | | 101 | | |
Other expenses | | | 52,468 | | |
Trustees' deferred compensation plan | | | 206,938 | | |
Total liabilities | | | 18,922,247 | | |
Net assets applicable to outstanding capital stock | | $ | 2,094,853,262 | | |
Represented by | |
Paid-in capital | | $ | 1,922,889,945 | | |
Undistributed net investment income | | | 1,847,196 | | |
Accumulated net realized loss | | | (21,130,698 | ) | |
Unrealized appreciation (depreciation) on: | |
Investments | | | 191,246,819 | | |
Total — representing net assets applicable to outstanding capital stock | | $ | 2,094,853,262 | | |
The accompanying Notes to Financial Statements are an integral part of this statement.
Annual Report 2014
26
Columbia AMT-Free Intermediate Muni Bond Fund
Statement of Assets and Liabilities (continued)
October 31, 2014
Class A | |
Net assets | | $ | 220,672,833 | | |
Shares outstanding | | | 20,406,300 | | |
Net asset value per share | | $ | 10.81 | | |
Maximum offering price per share(a) | | $ | 11.17 | | |
Class B | |
Net assets | | $ | 528,448 | | |
Shares outstanding | | | 48,879 | | |
Net asset value per share | | $ | 10.81 | | |
Class C | |
Net assets | | $ | 52,507,255 | | |
Shares outstanding | | | 4,854,989 | | |
Net asset value per share | | $ | 10.82 | | |
Class R4 | |
Net assets | | $ | 336,210 | | |
Shares outstanding | | | 31,112 | | |
Net asset value per share | | $ | 10.81 | | |
Class R5 | |
Net assets | | $ | 2,088,060 | | |
Shares outstanding | | | 193,402 | | |
Net asset value per share | | $ | 10.80 | | |
Class T | |
Net assets | | $ | 15,340,887 | | |
Shares outstanding | | | 1,418,677 | | |
Net asset value per share | | $ | 10.81 | | |
Maximum offering price per share(a) | | $ | 11.35 | | |
Class Z | |
Net assets | | $ | 1,803,379,569 | | |
Shares outstanding | | | 166,686,404 | | |
Net asset value per share | | $ | 10.82 | | |
(a) The maximum offering price per share is calculated by dividing the net asset value per share by 1.0 minus the maximum sales charge of 3.25% for Class A and 4.75% for Class T.
The accompanying Notes to Financial Statements are an integral part of this statement.
Annual Report 2014
27
Columbia AMT-Free Intermediate Muni Bond Fund
Statement of Operations
Year Ended October 31, 2014
Net investment income | |
Income: | |
Dividends | | $ | 981 | | |
Interest | | | 85,357,010 | | |
Total income | | | 85,357,991 | | |
Expenses: | |
Investment management fees | | | 8,262,651 | | |
Distribution and/or service fees | |
Class A | | | 413,968 | | |
Class B | | | 5,403 | | |
Class C | | | 426,894 | | |
Class T | | | 24,207 | | |
Transfer agent fees | |
Class A | | | 380,658 | | |
Class B | | | 1,172 | | |
Class C | | | 92,388 | | |
Class R4 | | | 330 | | |
Class R5 | | | 665 | | |
Class T | | | 29,700 | | |
Class Z | | | 3,332,665 | | |
Administration fees | | | 1,327,108 | | |
Compensation of board members | | | 100,609 | | |
Custodian fees | | | 11,958 | | |
Printing and postage fees | | | 66,619 | | |
Registration fees | | | 138,617 | | |
Professional fees | | | 85,599 | | |
Chief compliance officer expenses | | | 1,043 | | |
Other | | | 48,795 | | |
Total expenses | | | 14,751,049 | | |
Fees waived or expenses reimbursed by Investment Manager and its affiliates | | | (2,332,871 | ) | |
Fees waived by Distributor — Class C | | | (74,080 | ) | |
Expense reductions | | | (580 | ) | |
Total net expenses | | | 12,343,518 | | |
Net investment income | | | 73,014,473 | | |
Realized and unrealized gain (loss) — net | |
Net realized gain (loss) on: | |
Investments | | | 4,533,538 | | |
Net realized gain | | | 4,533,538 | | |
Net change in unrealized appreciation (depreciation) on: | |
Investments | | | 48,616,035 | | |
Net change in unrealized appreciation | | | 48,616,035 | | |
Net realized and unrealized gain | | | 53,149,573 | | |
Net increase in net assets resulting from operations | | $ | 126,164,046 | | |
The accompanying Notes to Financial Statements are an integral part of this statement.
Annual Report 2014
28
Columbia AMT-Free Intermediate Muni Bond Fund
Statement of Changes in Net Assets
| | | Year Ended
October 31,
2014 | | Year Ended
October 31,
2013(a)(b) | |
Operations | |
Net investment income | | $ | 73,014,473 | | | $ | 84,491,605 | | |
Net realized gain (loss) | | | 4,533,538 | | | | (4,452,191 | ) | |
Net change in unrealized appreciation (depreciation) | | | 48,616,035 | | | | (115,450,512 | ) | |
Net increase (decrease) in net assets resulting from operations | | | 126,164,046 | | | | (35,411,098 | ) | |
Distributions to shareholders | |
Net investment income | |
Class A | | | (6,904,688 | ) | | | (6,652,613 | ) | |
Class B | | | (17,104 | ) | | | (34,607 | ) | |
Class C | | | (1,422,943 | ) | | | (1,642,196 | ) | |
Class R4 | | | (6,312 | ) | | | (1,016 | ) | |
Class R5 | | | (48,077 | ) | | | (616 | ) | |
Class T | | | (546,915 | ) | | | (593,209 | ) | |
Class Z | | | (64,062,692 | ) | | | (75,543,282 | ) | |
Total distributions to shareholders | | | (73,008,731 | ) | | | (84,467,539 | ) | |
Decrease in net assets from capital stock activity | | | (118,998,163 | ) | | | (482,843,549 | ) | |
Total decrease in net assets | | | (65,842,848 | ) | | | (602,722,186 | ) | |
Net assets at beginning of year | | | 2,160,696,110 | | | | 2,763,418,296 | | |
Net assets at end of year | | $ | 2,094,853,262 | | | $ | 2,160,696,110 | | |
Undistributed net investment income | | $ | 1,847,196 | | | $ | 1,843,224 | | |
(a) Class R4 shares are based on operations from March 19, 2013 (commencement of operations) through the stated period end.
(b) Class R5 shares are based on operations from November 8, 2012 (commencement of operations) through the stated period end.
The accompanying Notes to Financial Statements are an integral part of this statement.
Annual Report 2014
29
Columbia AMT-Free Intermediate Muni Bond Fund
Statement of Changes in Net Assets (continued)
| | | Year Ended October 31, 2014 | | Year Ended October 31, 2013(a)(b) | |
| | | Shares | | Dollars ($) | | Shares | | Dollars ($) | |
Capital stock activity | |
Class A shares | |
Subscriptions(c) | | | 4,526,587 | | | | 48,302,486 | | | | 4,873,576 | | | | 52,497,246 | | |
Distributions reinvested | | | 505,233 | | | | 5,395,324 | | | | 466,757 | | | | 5,024,560 | | |
Redemptions | | | (3,704,492 | ) | | | (39,371,195 | ) | | | (5,493,862 | ) | | | (58,735,063 | ) | |
Net increase (decrease) | | | 1,327,328 | | | | 14,326,615 | | | | (153,529 | ) | | | (1,213,257 | ) | |
Class B shares | |
Subscriptions | | | 332 | | | | 3,542 | | | | 6,230 | | | | 68,751 | | |
Distributions reinvested | | | 1,050 | | | | 11,181 | | | | 1,913 | | | | 20,665 | | |
Redemptions(c) | | | (35,636 | ) | | | (377,269 | ) | | | (91,998 | ) | | | (993,231 | ) | |
Net decrease | | | (34,254 | ) | | | (362,546 | ) | | | (83,855 | ) | | | (903,815 | ) | |
Class C shares | |
Subscriptions | | | 998,776 | | | | 10,675,703 | | | | 1,413,617 | | | | 15,439,047 | | |
Distributions reinvested | | | 99,584 | | | | 1,062,385 | | | | 113,194 | | | | 1,218,453 | | |
Redemptions | | | (1,149,387 | ) | | | (12,210,269 | ) | | | (1,490,734 | ) | | | (15,988,496 | ) | |
Net increase (decrease) | | | (51,027 | ) | | | (472,181 | ) | | | 36,077 | | | | 669,004 | | |
Class R4 shares | |
Subscriptions | | | 30,870 | | | | 332,600 | | | | 28,956 | | | | 302,500 | | |
Distributions reinvested | | | 569 | | | | 6,063 | | | | 92 | | | | 972 | | |
Redemptions | | | (29,375 | ) | | | (310,454 | ) | | | — | | | | — | | |
Net increase | | | 2,064 | | | | 28,209 | | | | 29,048 | | | | 303,472 | | |
Class R5 shares | |
Subscriptions | | | 197,227 | | | | 2,088,076 | | | | 5,885 | | | | 62,491 | | |
Distributions reinvested | | | 4,458 | | | | 47,772 | | | | 52 | | | | 541 | | |
Redemptions | | | (14,169 | ) | | | (151,179 | ) | | | (51 | ) | | | (534 | ) | |
Net increase | | | 187,516 | | | | 1,984,669 | | | | 5,886 | | | | 62,498 | | |
Class T shares | |
Subscriptions | | | 5,276 | | | | 56,311 | | | | 10,509 | | | | 113,164 | | |
Distributions reinvested | | | 36,163 | | | | 385,839 | | | | 38,670 | | | | 416,574 | | |
Redemptions | | | (213,204 | ) | | | (2,279,400 | ) | | | (281,318 | ) | | | (3,013,712 | ) | |
Net decrease | | | (171,765 | ) | | | (1,837,250 | ) | | | (232,139 | ) | | | (2,483,974 | ) | |
Class Z shares | |
Subscriptions | | | 20,966,649 | | | | 223,189,879 | | | | 29,873,064 | | | | 325,676,539 | | |
Distributions reinvested | | | 504,587 | | | | 5,388,725 | | | | 518,290 | | | | 5,587,311 | | |
Redemptions | | | (34,043,952 | ) | | | (361,244,283 | ) | | | (75,431,524 | ) | | | (810,541,327 | ) | |
Net decrease | | | (12,572,716 | ) | | | (132,665,679 | ) | | | (45,040,170 | ) | | | (479,277,477 | ) | |
Total net decrease | | | (11,312,854 | ) | | | (118,998,163 | ) | | | (45,438,682 | ) | | | (482,843,549 | ) | |
(a) Class R4 shares are based on operations from March 19, 2013 (commencement of operations) through the stated period end.
(b) Class R5 shares are based on operations from November 8, 2012 (commencement of operations) through the stated period end.
(c) Includes conversions of Class B shares to Class A shares, if any.
The accompanying Notes to Financial Statements are an integral part of this statement.
Annual Report 2014
30
Columbia AMT-Free Intermediate Muni Bond Fund
The following tables are intended to help you understand the Fund's financial performance. Certain information reflects financial results for a single share of a class held for the periods shown. Per share net investment income (loss) amounts are calculated based on average shares outstanding during the period. Total return assumes reinvestment of all dividends and distributions, if any. Total return does not reflect payment of sales charges, if any. Total return and portfolio turnover are not annualized for periods of less than one year. The portfolio turnover rate is calculated without regard to purchase and sales transactions of short-term instruments and certain derivatives, if any. If such transactions were included, the Fund's portfolio turnover rate may be higher.
| | | Year Ended October 31, | |
Class A | | 2014 | | 2013 | | 2012 | | 2011 | | 2010 | |
Per share data | |
Net asset value, beginning of period | | $ | 10.54 | | | $ | 11.03 | | | $ | 10.56 | | | $ | 10.58 | | | $ | 10.22 | | |
Income from investment operations: | |
Net investment income | | | 0.36 | | | | 0.34 | | | | 0.35 | | | | 0.37 | | | | 0.36 | | |
Net realized and unrealized gain (loss) | | | 0.27 | | | | (0.49 | ) | | | 0.47 | | | | (0.02 | ) | | | 0.36 | | |
Total from investment operations | | | 0.63 | | | | (0.15 | ) | | | 0.82 | | | | 0.35 | | | | 0.72 | | |
Less distributions to shareholders: | |
Net investment income | | | (0.36 | ) | | | (0.34 | ) | | | (0.35 | ) | | | (0.37 | ) | | | (0.36 | ) | |
Total distributions to shareholders | | | (0.36 | ) | | | (0.34 | ) | | | (0.35 | ) | | | (0.37 | ) | | | (0.36 | ) | |
Proceeds from regulatory settlements | | | — | | | | — | | | | 0.00 | (a) | | | — | | | | 0.00 | (a) | |
Net asset value, end of period | | $ | 10.81 | | | $ | 10.54 | | | $ | 11.03 | | | $ | 10.56 | | | $ | 10.58 | | |
Total return | | | 6.03 | % | | | (1.39 | %) | | | 7.88 | % | | | 3.43 | % | | | 7.13 | % | |
Ratios to average net assets(b) | |
Total gross expenses | | | 0.87 | % | | | 0.86 | % | | | 0.86 | % | | | 0.86 | % | | | 0.75 | % | |
Total net expenses(c) | | | 0.75 | %(d) | | | 0.74 | %(d) | | | 0.74 | %(d) | | | 0.73 | %(d) | | | 0.75 | %(d) | |
Net investment income | | | 3.34 | % | | | 3.14 | % | | | 3.22 | % | | | 3.52 | % | | | 3.43 | % | |
Supplemental data | |
Net assets, end of period (in thousands) | | $ | 220,673 | | | $ | 201,053 | | | $ | 212,161 | | | $ | 187,355 | | | $ | 98,208 | | |
Portfolio turnover | | | 9 | % | | | 15 | % | | | 10 | % | | | 9 | % | | | 13 | % | |
Notes to Financial Highlights
(a) Rounds to zero.
(b) In addition to the fees and expenses that the Fund bears directly, the Fund indirectly bears a pro rata share of the fees and expenses of any other funds in which it invests. Such indirect expenses are not included in the Fund's reported expense ratios.
(c) Total net expenses include the impact of certain fee waivers/expense reimbursements made by the Investment Manager and certain of its affiliates, if applicable.
(d) The benefits derived from expense reductions had an impact of less than 0.01%.
The accompanying Notes to Financial Statements are an integral part of this statement.
Annual Report 2014
31
Columbia AMT-Free Intermediate Muni Bond Fund
Financial Highlights (continued)
| | | Year Ended October 31, | |
Class B | | 2014 | | 2013 | | 2012 | | 2011 | | 2010 | |
Per share data | |
Net asset value, beginning of period | | $ | 10.54 | | | $ | 11.03 | | | $ | 10.56 | | | $ | 10.58 | | | $ | 10.22 | | |
Income from investment operations: | |
Net investment income | | | 0.29 | | | | 0.27 | | | | 0.28 | | | | 0.30 | | | | 0.29 | | |
Net realized and unrealized gain (loss) | | | 0.27 | | | | (0.49 | ) | | | 0.47 | | | | (0.02 | ) | | | 0.36 | | |
Total from investment operations | | | 0.56 | | | | (0.22 | ) | | | 0.75 | | | | 0.28 | | | | 0.65 | | |
Less distributions to shareholders: | |
Net investment income | | | (0.29 | ) | | | (0.27 | ) | | | (0.28 | ) | | | (0.30 | ) | | | (0.29 | ) | |
Total distributions to shareholders | | | (0.29 | ) | | | (0.27 | ) | | | (0.28 | ) | | | (0.30 | ) | | | (0.29 | ) | |
Proceeds from regulatory settlements | | | — | | | | — | | | | 0.00 | (a) | | | — | | | | 0.00 | (a) | |
Net asset value, end of period | | $ | 10.81 | | | $ | 10.54 | | | $ | 11.03 | | | $ | 10.56 | | | $ | 10.58 | | |
Total return | | | 5.35 | % | | | (2.02 | %) | | | 7.17 | % | | | 2.76 | % | | | 6.44 | % | |
Ratios to average net assets(b) | |
Total gross expenses | | | 1.52 | % | | | 1.51 | % | | | 1.51 | % | | | 1.52 | % | | | 1.40 | % | |
Total net expenses(c) | | | 1.40 | %(d) | | | 1.39 | %(d) | | | 1.39 | %(d) | | | 1.40 | %(d) | | | 1.40 | %(d) | |
Net investment income | | | 2.69 | % | | | 2.47 | % | | | 2.58 | % | | | 2.85 | % | | | 2.80 | % | |
Supplemental data | |
Net assets, end of period (in thousands) | | $ | 528 | | | $ | 876 | | | $ | 1,842 | | | $ | 2,494 | | | $ | 3,285 | | |
Portfolio turnover | | | 9 | % | | | 15 | % | | | 10 | % | | | 9 | % | | | 13 | % | |
Notes to Financial Highlights
(a) Rounds to zero.
(b) In addition to the fees and expenses that the Fund bears directly, the Fund indirectly bears a pro rata share of the fees and expenses of any other funds in which it invests. Such indirect expenses are not included in the Fund's reported expense ratios.
(c) Total net expenses include the impact of certain fee waivers/expense reimbursements made by the Investment Manager and certain of its affiliates, if applicable.
(d) The benefits derived from expense reductions had an impact of less than 0.01%.
The accompanying Notes to Financial Statements are an integral part of this statement.
Annual Report 2014
32
Columbia AMT-Free Intermediate Muni Bond Fund
Financial Highlights (continued)
| | | Year Ended October 31, | |
Class C | | 2014 | | 2013 | | 2012 | | 2011 | | 2010 | |
Per share data | |
Net asset value, beginning of period | | $ | 10.54 | | | $ | 11.03 | | | $ | 10.56 | | | $ | 10.58 | | | $ | 10.22 | | |
Income from investment operations: | |
Net investment income | | | 0.30 | | | | 0.32 | | | | 0.33 | | | | 0.35 | | | | 0.34 | | |
Net realized and unrealized gain (loss) | | | 0.28 | | | | (0.49 | ) | | | 0.47 | | | | (0.02 | ) | | | 0.36 | | |
Total from investment operations | | | 0.58 | | | | (0.17 | ) | | | 0.80 | | | | 0.33 | | | | 0.70 | | |
Less distributions to shareholders: | |
Net investment income | | | (0.30 | ) | | | (0.32 | ) | | | (0.33 | ) | | | (0.35 | ) | | | (0.34 | ) | |
Total distributions to shareholders | | | (0.30 | ) | | | (0.32 | ) | | | (0.33 | ) | | | (0.35 | ) | | | (0.34 | ) | |
Proceeds from regulatory settlements | | | — | | | | — | | | | 0.00 | (a) | | | — | | | | 0.00 | (a) | |
Net asset value, end of period | | $ | 10.82 | | | $ | 10.54 | | | $ | 11.03 | | | $ | 10.56 | | | $ | 10.58 | | |
Total return | | | 5.60 | % | | | (1.58 | %) | | | 7.66 | % | | | 3.22 | % | | | 6.92 | % | |
Ratios to average net assets(b) | |
Total gross expenses | | | 1.52 | % | | | 1.51 | % | | | 1.51 | % | | | 1.52 | % | | | 1.40 | % | |
Total net expenses(c) | | | 1.26 | %(d) | | | 0.94 | %(d) | | | 0.94 | %(d) | | | 0.93 | %(d) | | | 0.95 | %(d) | |
Net investment income | | | 2.83 | % | | | 2.94 | % | | | 3.01 | % | | | 3.33 | % | | | 3.23 | % | |
Supplemental data | |
Net assets, end of period (in thousands) | | $ | 52,507 | | | $ | 51,706 | | | $ | 53,729 | | | $ | 35,541 | | | $ | 21,903 | | |
Portfolio turnover | | | 9 | % | | | 15 | % | | | 10 | % | | | 9 | % | | | 13 | % | |
Notes to Financial Highlights
(a) Rounds to zero.
(b) In addition to the fees and expenses that the Fund bears directly, the Fund indirectly bears a pro rata share of the fees and expenses of any other funds in which it invests. Such indirect expenses are not included in the Fund's reported expense ratios.
(c) Total net expenses include the impact of certain fee waivers/expense reimbursements made by the Investment Manager and certain of its affiliates, if applicable.
(d) The benefits derived from expense reductions had an impact of less than 0.01%.
The accompanying Notes to Financial Statements are an integral part of this statement.
Annual Report 2014
33
Columbia AMT-Free Intermediate Muni Bond Fund
Financial Highlights (continued)
| | | Year Ended October 31, | |
Class R4 | | 2014 | | 2013(a) | |
Per share data | |
Net asset value, beginning of period | | $ | 10.53 | | | $ | 10.93 | | |
Income from investment operations: | |
Net investment income | | | 0.38 | | | | 0.23 | | |
Net realized and unrealized gain (loss) | | | 0.27 | | | | (0.41 | ) | |
Total from investment operations | | | 0.65 | | | | (0.18 | ) | |
Less distributions to shareholders: | |
Net investment income | | | (0.37 | ) | | | (0.22 | ) | |
Total distributions to shareholders | | | (0.37 | ) | | | (0.22 | ) | |
Net asset value, end of period | | $ | 10.81 | | | $ | 10.53 | | |
Total return | | | 6.31 | % | | | (1.61 | %) | |
Ratios to average net assets(b) | |
Total gross expenses | | | 0.67 | % | | | 0.65 | %(c) | |
Total net expenses(d) | | | 0.55 | %(e) | | | 0.54 | %(c)(e) | |
Net investment income | | | 3.55 | % | | | 3.66 | %(c) | |
Supplemental data | |
Net assets, end of period (in thousands) | | $ | 336 | | | $ | 306 | | |
Portfolio turnover | | | 9 | % | | | 15 | % | |
Notes to Financial Highlights
(a) Based on operations from March 19, 2013 (commencement of operations) through the stated period end.
(b) In addition to the fees and expenses that the Fund bears directly, the Fund indirectly bears a pro rata share of the fees and expenses of any other funds in which it invests. Such indirect expenses are not included in the Fund's reported expense ratios.
(c) Annualized.
(d) Total net expenses include the impact of certain fee waivers/expense reimbursements made by the Investment Manager and certain of its affiliates, if applicable.
(e) The benefits derived from expense reductions had an impact of less than 0.01%.
The accompanying Notes to Financial Statements are an integral part of this statement.
Annual Report 2014
34
Columbia AMT-Free Intermediate Muni Bond Fund
Financial Highlights (continued)
| | | Year Ended October 31, | |
Class R5 | | 2014 | | 2013(a) | |
Per share data | |
Net asset value, beginning of period | | $ | 10.52 | | | $ | 11.07 | | |
Income from investment operations: | |
Net investment income | | | 0.39 | | | | 0.37 | | |
Net realized and unrealized gain (loss) | | | 0.28 | | | | (0.56 | ) | |
Total from investment operations | | | 0.67 | | | | (0.19 | ) | |
Less distributions to shareholders: | |
Net investment income | | | (0.39 | ) | | | (0.36 | ) | |
Total distributions to shareholders | | | (0.39 | ) | | | (0.36 | ) | |
Net asset value, end of period | | $ | 10.80 | | | $ | 10.52 | | |
Total return | | | 6.44 | % | | | (1.73 | %) | |
Ratios to average net assets(b) | |
Total gross expenses | | | 0.53 | % | | | 0.52 | %(c) | |
Total net expenses(d) | | | 0.47 | % | | | 0.45 | %(c) | |
Net investment income | | | 3.62 | % | | | 3.62 | %(c) | |
Supplemental data | |
Net assets, end of period (in thousands) | | $ | 2,088 | | | $ | 62 | | |
Portfolio turnover | | | 9 | % | | | 15 | % | |
Notes to Financial Highlights
(a) Based on operations from November 8, 2012 (commencement of operations) through the stated period end.
(b) In addition to the fees and expenses that the Fund bears directly, the Fund indirectly bears a pro rata share of the fees and expenses of any other funds in which it invests. Such indirect expenses are not included in the Fund's reported expense ratios.
(c) Annualized.
(d) Total net expenses include the impact of certain fee waivers/expense reimbursements made by the Investment Manager and certain of its affiliates, if applicable.
The accompanying Notes to Financial Statements are an integral part of this statement.
Annual Report 2014
35
Columbia AMT-Free Intermediate Muni Bond Fund
Financial Highlights (continued)
| | | Year Ended October 31, | |
Class T | | 2014 | | 2013 | | 2012 | | 2011 | | 2010 | |
Per share data | |
Net asset value, beginning of period | | $ | 10.54 | | | $ | 11.03 | | | $ | 10.56 | | | $ | 10.58 | | | $ | 10.22 | | |
Income from investment operations: | |
Net investment income | | | 0.36 | | | | 0.35 | | | | 0.36 | | | | 0.37 | | | | 0.36 | | |
Net realized and unrealized gain (loss) | | | 0.27 | | | | (0.50 | ) | | | 0.47 | | | | (0.01 | ) | | | 0.36 | | |
Total from investment operations | | | 0.63 | | | | (0.15 | ) | | | 0.83 | | | | 0.36 | | | | 0.72 | | |
Less distributions to shareholders: | |
Net investment income | | | (0.36 | ) | | | (0.34 | ) | | | (0.36 | ) | | | (0.38 | ) | | | (0.36 | ) | |
Total distributions to shareholders | | | (0.36 | ) | | | (0.34 | ) | | | (0.36 | ) | | | (0.38 | ) | | | (0.36 | ) | |
Proceeds from regulatory settlements | | | — | | | | — | | | | 0.00 | (a) | | | — | | | | 0.00 | (a) | |
Net asset value, end of period | | $ | 10.81 | | | $ | 10.54 | | | $ | 11.03 | | | $ | 10.56 | | | $ | 10.58 | | |
Total return | | | 6.09 | % | | | (1.34 | %) | | | 7.93 | % | | | 3.48 | % | | | 7.19 | % | |
Ratios to average net assets(b) | |
Total gross expenses | | | 0.82 | % | | | 0.81 | % | | | 0.81 | % | | | 0.81 | % | | | 0.70 | % | |
Total net expenses(c) | | | 0.70 | %(d) | | | 0.69 | %(d) | | | 0.69 | %(d) | | | 0.68 | %(d) | | | 0.70 | %(d) | |
Net investment income | | | 3.39 | % | | | 3.19 | % | | | 3.28 | % | | | 3.56 | % | | | 3.49 | % | |
Supplemental data | |
Net assets, end of period (in thousands) | | $ | 15,341 | | | $ | 16,759 | | | $ | 20,105 | | | $ | 19,780 | | | $ | 10,243 | | |
Portfolio turnover | | | 9 | % | | | 15 | % | | | 10 | % | | | 9 | % | | | 13 | % | |
Notes to Financial Highlights
(a) Rounds to zero.
(b) In addition to the fees and expenses that the Fund bears directly, the Fund indirectly bears a pro rata share of the fees and expenses of any other funds in which it invests. Such indirect expenses are not included in the Fund's reported expense ratios.
(c) Total net expenses include the impact of certain fee waivers/expense reimbursements made by the Investment Manager and certain of its affiliates, if applicable.
(d) The benefits derived from expense reductions had an impact of less than 0.01%.
The accompanying Notes to Financial Statements are an integral part of this statement.
Annual Report 2014
36
Columbia AMT-Free Intermediate Muni Bond Fund
Financial Highlights (continued)
| | | Year Ended October 31, | |
Class Z | | 2014 | | 2013 | | 2012 | | 2011 | | 2010 | |
Per share data | |
Net asset value, beginning of period | | $ | 10.54 | | | $ | 11.04 | | | $ | 10.57 | | | $ | 10.58 | | | $ | 10.22 | | |
Income from investment operations: | |
Net investment income | | | 0.38 | | | | 0.36 | | | | 0.37 | | | | 0.39 | | | | 0.38 | | |
Net realized and unrealized gain (loss) | | | 0.28 | | | | (0.50 | ) | | | 0.47 | | | | (0.01 | ) | | | 0.36 | | |
Total from investment operations | | | 0.66 | | | | (0.14 | ) | | | 0.84 | | | | 0.38 | | | | 0.74 | | |
Less distributions to shareholders: | |
Net investment income | | | (0.38 | ) | | | (0.36 | ) | | | (0.37 | ) | | | (0.39 | ) | | | (0.38 | ) | |
Total distributions to shareholders | | | (0.38 | ) | | | (0.36 | ) | | | (0.37 | ) | | | (0.39 | ) | | | (0.38 | ) | |
Proceeds from regulatory settlements | | | — | | | | — | | | | 0.00 | (a) | | | — | | | | 0.00 | (a) | |
Net asset value, end of period | | $ | 10.82 | | | $ | 10.54 | | | $ | 11.04 | | | $ | 10.57 | | | $ | 10.58 | | |
Total return | | | 6.34 | % | | | (1.28 | %) | | | 8.07 | % | | | 3.69 | % | | | 7.35 | % | |
Ratios to average net assets(b) | |
Total gross expenses | | | 0.67 | % | | | 0.66 | % | | | 0.66 | % | | | 0.66 | % | | | 0.55 | % | |
Total net expenses(c) | | | 0.55 | %(d) | | | 0.54 | %(d) | | | 0.54 | %(d) | | | 0.54 | %(d) | | | 0.55 | %(d) | |
Net investment income | | | 3.54 | % | | | 3.33 | % | | | 3.42 | % | | | 3.74 | % | | | 3.64 | % | |
Supplemental data | |
Net assets, end of period (in thousands) | | $ | 1,803,380 | | | $ | 1,889,934 | | | $ | 2,475,582 | | | $ | 2,226,049 | | | $ | 2,365,718 | | |
Portfolio turnover | | | 9 | % | | | 15 | % | | | 10 | % | | | 9 | % | | | 13 | % | |
Notes to Financial Highlights
(a) Rounds to zero.
(b) In addition to the fees and expenses that the Fund bears directly, the Fund indirectly bears a pro rata share of the fees and expenses of any other funds in which it invests. Such indirect expenses are not included in the Fund's reported expense ratios.
(c) Total net expenses include the impact of certain fee waivers/expense reimbursements made by the Investment Manager and certain of its affiliates, if applicable.
(d) The benefits derived from expense reductions had an impact of less than 0.01%.
The accompanying Notes to Financial Statements are an integral part of this statement.
Annual Report 2014
37
Columbia AMT-Free Intermediate Muni Bond Fund
Notes to Financial Statements
October 31, 2014
Note 1. Organization
Columbia AMT-Free Intermediate Muni Bond Fund (formerly known as Columbia Intermediate Municipal Bond Fund) (the Fund), a series of Columbia Funds Series Trust I (the Trust), is a diversified fund. The Trust is registered under the Investment Company Act of 1940, as amended (the 1940 Act), as an open-end management investment company organized as a Massachusetts business trust. Effective July 7, 2014, Columbia Intermediate Municipal Bond Fund was renamed Columbia AMT-Free Intermediate Muni Bond Fund.
Fund Shares
The Trust may issue an unlimited number of shares (without par value). The Fund offers Class A, Class B, Class C, Class R4, Class R5, Class T and Class Z shares. Although all share classes generally have identical voting, dividend and liquidation rights, each share class votes separately when required by the Trust's organizational documents or by law. Different share classes pay different distribution amounts to the extent the expenses of such share classes differ, and distributions in liquidation will be proportional to the net asset value of each share class. Each share class has its own expense structure and sales charges.
Class A shares are subject to a maximum front-end sales charge of 3.25% based on the initial investment amount. Class A shares purchased without an initial sales charge in accounts aggregating $1 million to $50 million at the time of purchase are subject to a contingent deferred sales charge (CDSC) if the shares are sold within 18 months of purchase, charged as follows: 1.00% CDSC if redeemed within 12 months of purchase, and 0.50% CDSC if redeemed more than 12, but less than 18, months after purchase.
Class B shares may be subject to a maximum CDSC of 3.00% based upon the holding period after purchase. Class B shares will generally convert to Class A shares eight years after purchase. The Fund no longer accepts investments by new or existing investors in the Fund's Class B shares, except in connection with the reinvestment of any dividend and/or capital gain distributions in Class B shares of the Fund and exchanges by existing Class B shareholders of certain other funds within the Columbia Family of Funds.
Class C shares are subject to a 1.00% CDSC on shares redeemed within one year of purchase.
Class R4 shares are not subject to sales charges and are generally available only to omnibus retirement plans and certain investors as described in the Fund's prospectus.
Class R5 shares are not subject to sales charges and are generally available only to investors purchasing through authorized investment professionals and omnibus retirement plans.
Class T shares are subject to a maximum front-end sales charge of 4.75% based on the investment amount. Class T shares purchased without an initial sales charge in accounts aggregating $1 million to $50 million at the time of purchase are subject to a CDSC if the shares are sold within 18 months of purchase, charged as follows: 1.00% CDSC if redeemed within 12 months of purchase, and 0.50% CDSC if redeemed more than 12, but less than 18, months after purchase. Class T shares are available only to investors who received (and who have continuously held) Class T shares in connection with previous fund reorganizations.
Class Z shares are not subject to sales charges and are available only to eligible investors, which are subject to different investment minimums as described in the Fund's prospectus.
Note 2. Summary of Significant Accounting Policies
Basis of Preparation
The Fund is an investment company that applies the accounting and reporting guidance in the Financial Accounting Standards Board (FASB) Accounting Standards Codification Topic 946, Financial Services — Investment Companies (ASC 946). The financial statements are prepared in accordance with U.S. generally accepted accounting principles (GAAP) which requires management to make certain estimates and assumptions that affect the reported amounts of assets and liabilities, the disclosure of contingent assets and liabilities at the date of the financial statements and the reported amounts of income and expenses during the reporting period. Actual results could differ from those estimates.
The following is a summary of significant accounting policies followed by the Fund in the preparation of its financial statements.
Security Valuation
Debt securities generally are valued by pricing services approved by the Board of Trustees (the Board) based upon market transactions for normal, institutional-size trading units of similar securities. The services may use various pricing techniques that take into account, as applicable, factors such as yield, quality, coupon rate, maturity, type of issue, trading characteristics and other data, as well as broker quotes. Debt securities for which quotations are readily available may also be valued based upon an over-the-counter or exchange bid quotation.
Investments in open-end investment companies, including money market funds, are valued at their net asset value.
Annual Report 2014
38
Columbia AMT-Free Intermediate Muni Bond Fund
Notes to Financial Statements (continued)
October 31, 2014
Investments for which market quotations are not readily available, or that have quotations which management believes are not reliable, are valued at fair value as determined in good faith under procedures established by and under the general supervision of the Board. If a security or class of securities (such as foreign securities) is valued at fair value, such value is likely to be different from the quoted or published price for the security.
The determination of fair value often requires significant judgment. To determine fair value, management may use assumptions including but not limited to future cash flows and estimated risk premiums. Multiple inputs from various sources may be used to determine fair value.
Delayed Delivery Securities
The Fund may trade securities on other than normal settlement terms, including securities purchased or sold on a "when-issued" basis. This may increase risk to the Fund since the other party to the transaction may fail to deliver which could cause the Fund to subsequently invest at less advantageous prices. The Fund designates cash or liquid securities in an amount equal to the delayed delivery commitment.
Security Transactions
Security transactions are accounted for on the trade date. Cost is determined and gains (losses) are based upon the specific identification method for both financial statement and federal income tax purposes.
Income Recognition
Interest income is recorded on an accrual basis. Market premiums and discounts, including original issue discounts, are amortized and accreted, respectively, over the expected life of the security on all debt securities, unless otherwise noted.
The Fund may place a debt security on non-accrual status and reduce related interest income when it becomes probable that the interest will not be collected and the amount of uncollectible interest can be reasonably estimated. A defaulted debt security is removed from non-accrual status when the issuer resumes interest payments or when collectability of interest is reasonably assured.
Dividend income is recorded on the ex-dividend date.
Expenses
General expenses of the Trust are allocated to the Fund and other funds of the Trust based upon relative net assets or other expense allocation methodologies determined by the nature of the expense. Expenses directly attributable to the Fund are charged to the Fund. Expenses directly attributable to a specific class of shares are charged to that share class.
Determination of Class Net Asset Value
All income, expenses (other than class-specific expenses, which are charged to that share class, as shown in the Statement of Operations) and realized and unrealized gains (losses) are allocated to each class of the Fund on a daily basis, based on the relative net assets of each class, for purposes of determining the net asset value of each class.
Federal Income Tax Status
The Fund intends to qualify each year as a regulated investment company under Subchapter M of the Internal Revenue Code, as amended, and will distribute substantially all of its tax exempt and taxable income (including net short-term capital gains), if any, for its tax year, and as such will not be subject to federal income taxes. In addition, the Fund intends to distribute in each calendar year substantially all of its net investment income, capital gains and certain other amounts, if any, such that the Fund should not be subject to federal excise tax. Therefore, no federal income or excise tax provision is recorded.
Distributions to Shareholders
Distributions from net investment income, if any, are declared daily and paid monthly. Net realized capital gains, if any, are distributed at least annually. Income distributions and capital gain distributions are determined in accordance with federal income tax regulations, which may differ from GAAP.
Guarantees and Indemnifications
Under the Trust's organizational documents and, in some cases, by contract, its officers and trustees are indemnified against certain liabilities arising out of the performance of their duties to the Trust or its funds. In addition, certain of the Fund's contracts with its service providers contain general indemnification clauses. The Fund's maximum exposure under these arrangements is unknown since the amount of any future claims that may be made against the Fund cannot be determined, and the Fund has no historical basis for predicting the likelihood of any such claims.
Note 3. Fees and Compensation Paid to Affiliates
Investment Management Fees
Under an Investment Management Services Agreement, Columbia Management Investment Advisers, LLC (the Investment Manager), a wholly-owned subsidiary of Ameriprise Financial, Inc. (Ameriprise Financial), determines which securities will be purchased, held or sold. The investment management fee is an annual fee that is equal to a percentage of the Fund's average daily net assets that declines
Annual Report 2014
39
Columbia AMT-Free Intermediate Muni Bond Fund
Notes to Financial Statements (continued)
October 31, 2014
from 0.41% to 0.25% as the Fund's net assets increase. The effective investment management fee rate for the year ended October 31, 2014 was 0.40% of the Fund's average daily net assets.
Administration Fees
Under an Administrative Services Agreement, the Investment Manager also serves as the Fund Administrator. The Fund pays the Fund Administrator an annual fee for administration and accounting services equal to a percentage of the Fund's average daily net assets that declines from 0.07% to 0.04% as the Fund's net assets increase. The effective administration fee rate for the year ended October 31, 2014 was 0.06% of the Fund's average daily net assets.
Compensation of Board Members
Board members are compensated for their services to the Fund as disclosed in the Statement of Operations. The Trust's eligible Trustees may participate in a Deferred Compensation Plan (the Plan) which may be terminated at any time. Obligations of the Plan will be paid solely out of the Fund's assets.
Compensation of Chief Compliance Officer
The Board has appointed a Chief Compliance Officer to the Fund in accordance with federal securities regulations. The Fund pays its pro-rata share of the expenses associated with the Chief Compliance Officer. The Fund's expenses for the Chief Compliance Officer will not exceed $15,000 per year.
Transfer Agent Fees
Under a Transfer and Dividend Disbursing Agent Agreement, Columbia Management Investment Services Corp. (the Transfer Agent), an affiliate of the Investment Manager and a wholly-owned subsidiary of Ameriprise Financial, is responsible for providing transfer agency services to the Fund. The Transfer Agent has contracted with Boston Financial Data Services (BFDS) to serve as sub-transfer agent.
Effective November 1, 2014, the Transfer Agent receives a monthly transfer agency fee based on the number or the average value of accounts, depending on the type of account. Prior to November 1, 2014, the Transfer Agent received a monthly account-based service fee based on the number of open accounts. In addition, the Transfer Agent also receives sub-transfer agency fees based on a percentage of the average aggregate value of the Fund's shares maintained in omnibus accounts (other than omnibus accounts for which American Enterprise Investment Services Inc. is the broker of record or accounts where the beneficial shareholder is a customer of Ameriprise Financial Services, Inc., which receive a per account fee). The Transfer Agent pays the fees of BFDS for services as sub-transfer agent and is not entitled to
reimbursement for such fees from the Fund (with the exception of out-of-pocket fees).
The Transfer Agent also receives compensation from the Fund for various shareholder services and reimbursements for certain out-of-pocket fees. Total transfer agent fees for Class R5 shares are subject to an annual limitation of not more than 0.05% of the average daily net assets attributable to Class R5 shares.
For the year ended October 31, 2014, the Fund's effective transfer agent fee rates as a percentage of average daily net assets of each class were as follows:
Class A | | | 0.18 | % | |
Class B | | | 0.18 | | |
Class C | | | 0.18 | | |
Class R4 | | | 0.19 | | |
Class R5 | | | 0.05 | | |
Class T | | | 0.18 | | |
Class Z | | | 0.18 | | |
An annual minimum account balance fee of $20 may apply to certain accounts with a value below the applicable share class's initial minimum investment requirements to reduce the impact of small accounts on transfer agent fees. These minimum account balance fees are remitted to the Fund and recorded as part of expense reductions in the Statement of Operations. For the year ended October 31, 2014, these minimum account balance fees reduced total expenses of the Fund by $580.
Distribution and Service Fees
The Fund has an agreement with Columbia Management Investment Distributors, Inc. (the Distributor), an affiliate of the Investment Manager and a wholly-owned subsidiary of Ameriprise Financial, for distribution and shareholder services. The Board has approved, and the Fund has adopted, distribution and shareholder service plans (the Plans) applicable to certain share classes, which set the distribution and service fees for the Fund. These fees are calculated daily and are intended to compensate the Distributor and/or eligible selling and/or servicing agents for selling shares of the Fund and providing services to investors.
Under the Plans, the Fund pays a monthly service fee to the Distributor at the maximum annual rate of 0.20% of the average daily net assets attributable to Class A, Class B and Class C shares of the Fund. Also under the Plans, the Fund pays a monthly distribution fee to the Distributor at the maximum annual rate of 0.65% of the average daily net assets attributable to Class B and Class C shares only.
Prior to March 1, 2014, the Distributor voluntarily waived a portion of the distribution fee for Class C shares so that the
Annual Report 2014
40
Columbia AMT-Free Intermediate Muni Bond Fund
Notes to Financial Statements (continued)
October 31, 2014
distribution fee did not exceed 0.20% annually of the average daily net assets attributable to Class C shares. This arrangement was terminated on March 1, 2014.
Shareholder Services Fees
The Fund has adopted a shareholder services plan that permits it to pay for certain services provided to Class T shareholders by their selling and/or servicing agents. The Fund may pay shareholder servicing fees up to an aggregate annual rate of 0.40% of the Fund's average daily net assets attributable to Class T shares (comprised of up to 0.20% for shareholder liaison services and up to 0.20% for administrative support services). These fees are currently limited to an aggregate annual rate of not more than 0.15% of the Fund's average daily net assets attributable to Class T shares. In addition, the servicing fee for Class T shares will be waived by selling and/or servicing agents to the extent necessary to prevent the net investment income for the Class T shares from falling below 0.00% on a daily basis. The shareholder services fee for the year ended October 31, 2014 was 0.15% of the Fund's average daily net assets attributable to Class T shares.
Sales Charges
Sales charges, including front-end charges and CDSCs, received by the Distributor for distributing Fund shares were $122,377 for Class A, $381 for Class B, $834 for Class C and $85 for Class T shares for the year ended October 31, 2014.
Expenses Waived/Reimbursed by the Investment Manager and its Affiliates
The Investment Manager and certain of its affiliates have contractually agreed to waive fees and/or reimburse expenses (excluding certain fees and expenses described below) for the periods disclosed below, unless sooner terminated at the sole discretion of the Board, so that the Fund's net operating expenses, after giving effect to fees waived/expenses reimbursed and any balance credits and/or overdraft charges from the Fund's custodian, do not exceed the following annual rates as a percentage of the class' average daily net assets:
| | | March 1, 2014
through
February 28, 2015 | | Prior to
March 1, 2014 | |
Class A | | | 0.76 | % | | | 0.74 | % | |
Class B | | | 1.41 | | | | 1.39 | | |
Class C | | | 1.41 | | | | 1.39 | | |
Class R4 | | | 0.56 | | | | 0.54 | | |
Class R5 | | | 0.47 | | | | 0.45 | | |
Class T | | | 0.71 | | | | 0.69 | | |
Class Z | | | 0.56 | | | | 0.54 | | |
Under the agreement governing these fee waivers and/or expense reimbursement arrangements, the following fees and expenses are excluded from the waiver/reimbursement commitment, and therefore will be paid by the Fund, if applicable: taxes (including foreign transaction taxes), expenses associated with investments in affiliated and non-affiliated pooled investment vehicles (including mutual funds and exchange-traded funds), transaction costs and brokerage commissions, costs related to any securities lending program, dividend expenses associated with securities sold short, inverse floater program fees and expenses, transaction charges and interest on borrowed money, interest, extraordinary expenses and any other expenses the exclusion of which is specifically approved by the Board. This agreement may be modified or amended only with approval from all parties. Class C distribution fees waived by the Distributor prior to March 1, 2014, as discussed above, are in addition to the waiver/reimbursement commitment under the agreement.
Note 4. Federal Tax Information
The timing and character of income and capital gain distributions are determined in accordance with income tax regulations, which may differ from GAAP because of temporary or permanent book to tax differences.
At October 31, 2014, these differences are primarily due to differing treatment for capital loss carryforwards, principal and/or interest from fixed income securities, Trustees' deferred compensation, distributions and tax straddles. To the extent these differences are permanent, reclassifications are made among the components of the Fund's net assets in the Statement of Assets and Liabilities. Temporary differences do not require reclassifications. In the Statement of Assets and Liabilities the following reclassifications were made:
Undistributed net investment income | | $ | (1,770 | ) | |
Accumulated net realized loss | | | 1,771 | | |
Paid-in capital | | | (1 | ) | |
Net investment income (loss) and net realized gains (losses), as disclosed in the Statement of Operations, and net assets were not affected by this reclassification.
The tax character of distributions paid during the years indicated was as follows:
Year Ended October 31, | | 2014 | | 2013 | |
Ordinary income | | $ | 215,911 | | | $ | 312,241 | | |
Tax-exempt income | | | 72,792,820 | | | | 84,155,298 | | |
Total | | $ | 73,008,731 | | | | 84,467,539 | | |
Short-term capital gain distributions, if any, are considered ordinary income distributions for tax purposes.
Annual Report 2014
41
Columbia AMT-Free Intermediate Muni Bond Fund
Notes to Financial Statements (continued)
October 31, 2014
At October 31, 2014, the components of distributable earnings on a tax basis were as follows:
Undistributed tax-exempt income | | $ | 7,898,516 | | |
Capital loss carryforwards | | | (21,008,599 | ) | |
Net unrealized appreciation | | | 191,719,824 | | |
At October 31, 2014, the cost of investments for federal income tax purposes was $1,891,277,509 and the aggregate gross unrealized appreciation and depreciation based on that cost was:
Unrealized appreciation | | $ | 193,031,559 | | |
Unrealized depreciation | | | (1,311,735 | ) | |
Net unrealized appreciation | | | 191,719,824 | | |
The following capital loss carryforwards, determined at October 31, 2014, may be available to reduce taxable income arising from future net realized gains on investments, if any, to the extent permitted by the Internal Revenue Code:
Year of Expiration | | Amount ($) | |
2017 | | | 832,773 | | |
2018 | | | 62,558 | | |
No expiration — short-term | | | 18,581,374 | | |
No expiration — long-term | | | 1,531,894 | | |
Total | | | 21,008,599 | | |
Capital loss carryforwards with no expiration are required to be utilized prior to any capital losses which carry an expiration date. As a result of this ordering rule, capital loss carryforwards which carry an expiration date may be more likely to expire unused.
For the year ended October 31, 2014, $4,510,529 of capital loss carryforward was utilized.
Management of the Fund has concluded that there are no significant uncertain tax positions in the Fund that would require recognition in the financial statements. However, management's conclusion may be subject to review and adjustment at a later date based on factors including, but not limited to, new tax laws, regulations, and administrative interpretations (including relevant court decisions). Generally, the Fund's federal tax returns for the prior three fiscal years remain subject to examination by the Internal Revenue Service.
Note 5. Portfolio Information
The cost of purchases and proceeds from sales of securities, excluding short-term obligations and certain derivatives, if any, aggregated to $193,098,822 and $284,041,017, respectively, for the year ended October 31, 2014. The amount
of purchase and sale activity impacts the portfolio turnover rate reported in the Financial Highlights.
Note 6. Shareholder Concentration
At October 31, 2014, one unaffiliated shareholder of record owned 79.1% of the outstanding shares of the Fund in one or more accounts. The Fund has no knowledge about whether any portion of those shares was owned beneficially. Subscription and redemption activity by concentrated accounts may have a significant effect on the operations of the Fund.
Note 7. Line of Credit
The Fund has entered into a revolving credit facility with a syndicate of banks led by JPMorgan Chase Bank N.A. (JPMorgan) whereby the Fund may borrow for the temporary funding of shareholder redemptions or for other temporary or emergency purposes. The credit facility agreement, as amended, which is a collective agreement between the Fund and certain other funds managed by the Investment Manager, severally and not jointly, permits collective borrowings up to $500 million. Interest is charged to each participating fund based on its borrowings at a rate equal to the higher of (i) the overnight federal funds rate plus 1.00% or (ii) the one-month LIBOR rate plus 1.00%. Each borrowing under the credit facility matures no later than 60 days after the date of borrowing. Effective December 10, 2013, the Fund also pays a commitment fee equal to its pro rata share of the amount of the credit facility at a rate of 0.075% per annum. Prior to December 10, 2013, the commitment fee was charged at the annual rate of 0.08% per annum. The commitment fee is included in other expenses in the Statement of Operations.
Effective December 9, 2014, the Fund extended its revolving credit facility with JPMorgan. The credit facility agreement, as amended, permits collective borrowings up to $550 million under the same terms and interest rates as described above.
The Fund had no borrowings during the year ended October 31, 2014.
Note 8. Significant Risks
Credit Risk
Credit risk is the risk that the value of debt securities in the Fund's portfolio may decline because the issuer may default and fail to pay interest or repay principal when due. Rating agencies assign credit ratings to debt securities to indicate their credit risk. Lower rated or unrated debt securities held by the Fund may present increased credit risk as compared to higher-rated debt securities.
Annual Report 2014
42
Columbia AMT-Free Intermediate Muni Bond Fund
Notes to Financial Statements (continued)
October 31, 2014
Interest Rate Risk
Interest rate risk is the risk of losses attributable to changes in interest rates. In general, if prevailing interest rates rise, the values of debt securities tend to fall, and if interest rates fall, the values of debt securities tend to rise. Actions by governments and central banking authorities can result in increases in interest rates. Increasing interest rates may negatively affect the value of debt securities held by the Fund, resulting in a negative impact on the Fund's performance and net asset value per share. In general, the longer the maturity or duration of a debt security, the greater its sensitivity to changes in interest rates.
Liquidity Risk
Liquidity risk is the risk associated with a lack of marketability of investments which may make it difficult to sell the investment at a desirable time or price. Changing regulatory, market or other conditions or environments (for example, the interest rate or credit environments) may adversely affect the liquidity of the Fund's investments. The Fund may have to accept a lower selling price for the holding, sell other investments, or forego another, more appealing investment opportunity. Generally, the less liquid the market at the time the Fund sells a portfolio investment, the greater the risk of loss or decline of value to the Fund. A less liquid market can lead to an increase in Fund redemptions, which may negatively impact Fund performance and net asset value per share, including, for example, if the Fund is forced to sell securities in a down market.
Note 9. Subsequent Events
Management has evaluated the events and transactions that have occurred through the date the financial statements were issued. Other than as noted in Notes 3 and 7 above, there were no items requiring adjustment of the financial statements or additional disclosure.
Note 10. Information Regarding Pending and Settled Legal Proceedings
In December 2005, without admitting or denying the allegations, American Express Financial Corporation (AEFC, which is now known as Ameriprise Financial, Inc. (Ameriprise Financial)) entered into settlement agreements with the Securities and Exchange Commission (SEC) and Minnesota Department of Commerce (MDOC) related to market timing activities. As a result, AEFC was censured and ordered to cease and desist from committing or causing any violations of certain provisions of the Investment Advisers Act of 1940, the Investment Company Act of 1940, and various Minnesota laws. AEFC agreed to pay disgorgement of $10 million and civil
money penalties of $7 million. AEFC also agreed to retain an independent distribution consultant to assist in developing a plan for distribution of all disgorgement and civil penalties ordered by the SEC in accordance with various undertakings detailed at www.sec.gov/litigation/admin/ia-2451.pdf. Ameriprise Financial and its affiliates have cooperated with the SEC and the MDOC in these legal proceedings, and have made regular reports to the Funds' Boards of Trustees.
Ameriprise Financial and certain of its affiliates have historically been involved in a number of legal, arbitration and regulatory proceedings, including routine litigation, class actions, and governmental actions, concerning matters arising in connection with the conduct of their business activities. Ameriprise Financial believes that the Funds are not currently the subject of, and that neither Ameriprise Financial nor any of its affiliates are the subject of, any pending legal, arbitration or regulatory proceedings that are likely to have a material adverse effect on the Funds or the ability of Ameriprise Financial or its affiliates to perform under their contracts with the Funds. Ameriprise Financial is required to make quarterly (10-Q), annual (10-K) and, as necessary, 8-K filings with the Securities and Exchange Commission on legal and regulatory matters that relate to Ameriprise Financial and its affiliates. Copies of these filings may be obtained by accessing the SEC website at www.sec.gov.
There can be no assurance that these matters, or the adverse publicity associated with them, will not result in increased fund redemptions, reduced sale of fund shares or other adverse consequences to the Funds. Further, although we believe proceedings are not likely to have a material adverse effect on the Funds or the ability of Ameriprise Financial or its affiliates to perform under their contracts with the Funds, these proceedings are subject to uncertainties and, as such, we are unable to estimate the possible loss or range of loss that may result. An adverse outcome in one or more of these proceedings could result in adverse judgments, settlements, fines, penalties or other relief that could have a material adverse effect on the consolidated financial condition or results of operations of Ameriprise Financial.
Annual Report 2014
43
Columbia AMT-Free Intermediate Muni Bond Fund
Report of Independent Registered Public Accounting Firm
To the Trustees of Columbia Funds Series Trust I and the Shareholders of
Columbia AMT-Free Intermediate Muni Bond Fund
(formerly Columbia Intermediate Municipal Bond Fund)
In our opinion, the accompanying statement of assets and liabilities, including the portfolio of investments, and the related statements of operations and of changes in net assets and the financial highlights present fairly, in all material respects, the financial position of Columbia AMT-Free Intermediate Muni Bond Fund (formerly Columbia Intermediate Municipal Bond Fund) (the "Fund", a series of Columbia Funds Series Trust I) at October 31, 2014, and the results of its operations, the changes in its net assets and the financial highlights for each of the periods indicated, in conformity with accounting principles generally accepted in the United States of America. These financial statements and financial highlights (hereafter referred to as "financial statements") are the responsibility of the Fund's management. Our responsibility is to express an opinion on these financial statements based on our audits. We conducted our audits of these financial statements in accordance with the standards of the Public Company Accounting Oversight Board (United States). Those standards require that we plan and perform the audit to obtain reasonable assurance about whether the financial statements are free of material misstatement. An audit includes examining, on a test basis, evidence supporting the amounts and disclosures in the financial statements, assessing the accounting principles used and significant estimates made by management, and evaluating the overall financial statement presentation. We believe that our audits, which included confirmation of securities at October 31, 2014 by correspondence with the custodian and broker, provide a reasonable basis for our opinion.
PricewaterhouseCoopers LLP
Minneapolis, Minnesota
December 22, 2014
Annual Report 2014
44
Columbia AMT-Free Intermediate Muni Bond Fund
Federal Income Tax Information
(Unaudited)
The Fund hereby designates the following tax attributes for the fiscal year ended October 31, 2014. Shareholders will be notified in early 2015 of the amounts for use in preparing 2014 income tax returns.
Tax Designations:
| Exempt-Interest Dividends | | | 99.70 | % | |
Exempt-Interest Dividends. The percentage of net investment income distributed during the fiscal year that qualifies as exempt-interest dividends for federal income tax purposes.
Annual Report 2014
45
Columbia AMT-Free Intermediate Muni Bond Fund
The Trustees serve terms of indefinite duration. The names, addresses and birth years of the Trustees and Officers of the Funds in Columbia Funds Series Trust I, the year each was first elected or appointed to office, their principal business occupations during at least the last five years, the number of Funds overseen by each Trustee and other directorships they hold are shown below. Each officer listed below serves as an officer of each Fund in Columbia Funds Series Trust I.
Independent Trustees
Name, Address and Year of Birth,
Position with Funds, Year First
Elected or Appointed to Office | | Principal Occupation(s) During Past Five Years, Number of Funds in Columbia
Funds Complex Overseen by Trustee, Other Directorships Held | |
Douglas A. Hacker (Born 1955)
c/o Columbia Management
Investment Advisers, LLC
225 Franklin Street
Boston, MA 02110
Trustee (since 1996) and Chairman of the Board (since 2014) | | Independent business executive since May 2006; Executive Vice President — Strategy of United Airlines from December 2002 to May 2006; President of UAL Loyalty Services (airline marketing company) from September 2001 to December 2002; Executive Vice President and Chief Financial Officer of United Airlines from July 1999 to September 2001. Oversees 56; Spartan Stores, Inc. (food distributor); Nash Finch Company (food distributor) from 2005 to 2013; Aircastle Limited (aircraft leasing); and SeaCube Container Leasing Ltd. (container leasing) from 2010 to 2013 | |
Janet Langford Kelly (Born 1957)
c/o Columbia Management
Investment Advisers, LLC
225 Franklin Street
Boston, MA 02110
Trustee (since 1996) | | Senior Vice President, General Counsel and Corporate Secretary, ConocoPhillips (integrated energy company) since September 2007; Deputy General Counsel — Corporate Legal Services, ConocoPhillips from August 2006 to August 2007; Partner, Zelle, Hofmann, Voelbel, Mason & Gette LLP (law firm) from March 2005 to July 2006; Adjunct Professor of Law, Northwestern University from September 2004 to June 2006; Director, UAL Corporation (airline) from February 2006 to July 2006; Chief Administrative Officer and Senior Vice President, Kmart Holding Corporation (consumer goods) from September 2003 to March 2004. Oversees 56; None | |
Nancy T. Lukitsh (Born 1956)
c/o Columbia Management
Investment Advisers, LLC
225 Franklin Street
Boston, MA 02110
Trustee (since 2011) | | Senior Vice President, Partner and Director of Marketing, Wellington Management Company, LLP (investment adviser) from 1997 to 2010; Chair, Wellington Management Investment Portfolios (commingled non-U.S. investment pools) from 2007 to 2010; Director, Wellington Trust Company, NA and other Wellington affiliates from 1997 to 2010. Oversees 56; None | |
William E. Mayer (Born 1940)
c/o Columbia Management
Investment Advisers, LLC
225 Franklin Street
Boston, MA 02110
Trustee (since 1994) | | Partner, Park Avenue Equity Partners (private equity) since February 1999; Dean and Professor, College of Business and Management, University of Maryland from 1992 to 1996. Oversees 56; DynaVox Inc. (speech creation); Lee Enterprises (print media); WR Hambrecht + Co. (financial service provider) from 2000 to 2012; BlackRock Kelso Capital Corporation (investment company); Premier, Inc. (healthcare) | |
David M. Moffett (Born 1952)
c/o Columbia Management
Investment Advisers, LLC
225 Franklin Street
Boston, MA 02110
Trustee (since 2011) | | Retired. Chief Executive Officer, Federal Home Loan Mortgage Corporation, from 2008 to 2009; Senior Adviser, Global Financial Services Group, Carlyle Group, Inc., from 2007 to 2008; Vice Chairman and Chief Financial Officer, U.S. Bancorp, from 1993 to 2007. Oversees 56; CIT Group Inc. (commercial and consumer finance); eBay Inc. (online trading community); MBIA Inc. (financial service provider); E.W. Scripps Co. (print and television media), Building Materials Holding Corp. (building materials and construction services); Genworth Financial, Inc. (financial and insurance products and services); and University of Oklahoma Foundation | |
Charles R. Nelson (Born 1942)
c/o Columbia Management
Investment Advisers, LLC
225 Franklin Street
Boston, MA 02110
Trustee (since 1981) | | Retired. Professor Emeritus, University of Washington, since 2011; Professor of Economics, University of Washington from 1976 to 2011; Ford and Louisa Van Voorhis Professor of Political Economy, University of Washington from 1993 to 2011; Adjunct Professor of Statistics, University of Washington from 1980 to 2011; Associate Editor, Journal of Money, Credit and Banking from September 1993 to 2008; consultant on econometric and statistical matters. Oversees 56; None | |
John J. Neuhauser (Born 1943)
c/o Columbia Management
Investment Advisers, LLC
225 Franklin Street
Boston, MA 02110
Trustee (since 1984) | | President, Saint Michael's College, since August 2007; Director or Trustee of several non-profit organizations, including Fletcher Allen Health Care, Inc.; Academic Vice President and Dean of Faculties, Boston College from August 1999 to October 2005; University Professor, Boston College from November 2005 to August 2007. Oversees 56; Liberty All-Star Equity Fund and Liberty All-Star Growth Fund (closed-end funds) | |
Patrick J. Simpson (Born 1944)
c/o Columbia Management
Investment Advisers, LLC
225 Franklin Street
Boston, MA 02110
Trustee (since 2000) | | Partner, Perkins Coie LLP (law firm). Oversees 56; None | |
Annual Report 2014
46
Columbia AMT-Free Intermediate Muni Bond Fund
Trustees and Officers (continued)
Independent Trustees (continued)
Name, Address and Year of Birth,
Position with Funds, Year First
Elected or Appointed to Office | | Principal Occupation(s) During Past Five Years, Number of Funds in Columbia
Funds Complex Overseen by Trustee, Other Directorships Held | |
Anne-Lee Verville (Born 1945)
c/o Columbia Management
Investment Advisers, LLC
225 Franklin Street
Boston, MA 02110
Trustee (since 1998) | | Retired. General Manager — Global Education Industry from 1994 to 1997, President — Application Systems Division from 1991 to 1994, Chief Financial Officer — US Marketing & Services from 1988 to 1991, and Chief Information Officer from 1987 to 1988, IBM Corporation (computer and technology). Oversees 56; Enesco Group, Inc. (producer of giftware and home and garden decor products) from 2001 to 2006 | |
Interested Trustee
Name, Address and Year of Birth,
Position with Funds, Year First
Elected or Appointed to Office | | Principal Occupation(s) During Past Five Years, Number of Funds in Columbia
Funds Complex Overseen by Trustee, Other Directorships Held | |
William F. Truscott (Born 1960)
53600 Ameriprise Financial Center
Minneapolis, MN 55474
Trustee (since 2012) | | Chairman of the Board and President, Columbia Management Investment Advisers, LLC since May 2010 and February 2012, respectively (previously President and Chief Investment Officer from 2001 to April 2010); Chief Executive Officer, Global Asset Management, Ameriprise Financial, Inc. since September 2012 (previously, Chief Executive Officer, U.S. Asset Management & President, Annuities, from May 2010 to September 2012 and President — U.S. Asset Management and Chief Investment Officer from 2005 to April 2010); Director and Chief Executive Officer, Columbia Management Investment Distributors, Inc. since May 2010 and February 2012, respectively (previously Chairman of the Board and Chief Executive Officer from 2006 to April 2010); Chairman of the Board and Chief Executive Officer, RiverSource Distributors, Inc. since 2006; President and Chief Executive Officer, Ameriprise Certificate Company, 2006 to August 2012; Director, Threadneedle Asset Management Holdings, SARL since 2014. Oversees 188; Chairman of the Board, Columbia Management Investment Advisers, LLC since May 2010; Director, Columbia Management Investment Distributors, Inc. since May 2010; Director, Ameriprise Certificate Company from 2006 to January 2013 | |
The Statement of Additional Information has additional information about the Fund's Board members and is available, without charge, upon request by calling 800.345.6611; contacting your financial intermediary; or visiting columbiamanagement.com.
The Board has appointed officers who are responsible for day-to-day business decisions based on policies it has established. The officers serve at the pleasure of the Board. In addition to Mr. Truscott, who is Senior Vice President, the Funds' other officers are:
Officers
Name,
Address and
Year of Birth | | Position and Year
First Appointed to
Position for any Fund
in the Columbia
Funds Complex or a
Predecessor Thereof | | Principal Occupation(s) During Past Five Years | |
J. Kevin Connaughton
225 Franklin Street
Boston, MA 02110
Born 1964 | | President and Principal Executive Officer (2009) | | Managing Director and General Manager — Mutual Fund Products, Columbia Management Investment Advisers, LLC, since May 2010; and President, Columbia Funds since 2009; Managing Director, Columbia Management Advisors, LLC, from December 2004 to April 2010; Senior Vice President and Chief Financial Officer, Columbia Funds, from June 2008 to January 2009; and senior officer of Columbia Funds and affiliated funds since 2003. | |
Michael G. Clarke
225 Franklin Street
Boston, MA 02110
Born 1969 | | Treasurer (2011) and Chief Financial Officer (2009) | | Vice President — Mutual Fund Administration, Columbia Management Investment Advisers, LLC, since May 2010; Managing Director of Fund Administration, Columbia Management Advisors, LLC, from September 2004 to April 2010; and senior officer of Columbia Funds and affiliated funds since 2002. | |
Annual Report 2014
47
Columbia AMT-Free Intermediate Muni Bond Fund
Trustees and Officers (continued)
Officers (continued)
Name,
Address and
Year of Birth | | Position and Year
First Appointed to
Position for any Fund
in the Columbia
Funds Complex or a
Predecessor Thereof | | Principal Occupation(s) During Past Five Years | |
Scott R. Plummer
5228 Ameriprise
Financial Center
Minneapolis, MN 55474
Born 1959 | | Senior Vice President (2006), Chief Legal Officer (2006) and Assistant Secretary (2011) | | Senior Vice President and Assistant General Counsel — Global Asset Management, Ameriprise Financial since February 2014 (previously, Senior Vice President and Lead Chief Counsel — Asset Management, 2012 – February 2014; Vice President and Lead Chief Counsel — Asset Management, 2010 – 2012; and Vice President and Chief Counsel — Asset Management, 2005 – 2010); Senior Vice President, Chief Legal Officer and Assistant Secretary, Columbia Management Investment Advisers, LLC since June 2005; Vice President, Chief Counsel and Assistant Secretary, Columbia Management Investment Distributors, Inc. since 2008; Vice President, General Counsel and Secretary, Ameriprise Certificate Company since 2005; Chief Counsel, RiverSource Distributors, Inc. since 2006; senior officer of Columbia Funds and affiliated funds since 2006. | |
Thomas P. McGuire
225 Franklin Street
Boston, MA 02110
Born 1972 | | Chief Compliance Officer (2012) | | Vice President — Asset Management Compliance, Ameriprise Financial, Inc. since May 2010; Chief Compliance Officer, Ameriprise Certificate Company since September 2010; Compliance Executive, Bank of America from 2005 to April 2010. | |
Colin Moore
225 Franklin Street
Boston, MA 02110
Born 1958 | | Senior Vice President (2010) | | Executive Vice President and Global Chief Investment Officer, Ameriprise Financial, Inc. since July 2013; Director and Global Chief Investment Officer, Columbia Management Investment Advisers, LLC since May 2010; Manager, Managing Director and Chief Investment Officer, Columbia Management Advisors, LLC from 2007 to April 2010. | |
Michael E. DeFao
225 Franklin Street
Boston, MA 02110
Born 1968 | | Vice President (2011) and Assistant Secretary (2010) | | Vice President and Chief Counsel, Ameriprise Financial, Inc. since May 2010; Associate General Counsel, Bank of America from 2005 to April 2010. | |
Joseph F. DiMaria
225 Franklin Street
Boston, MA 02110
Born 1968 | | Vice President (2011) and Chief Accounting Officer (2008) | | Vice President — Mutual Fund Treasurer Columbia Management Investment Advisers, LLC since May 2010; Director of Fund Administration, Columbia Management Advisors, LLC from 2006 to April 2010. | |
Paul B. Goucher
100 Park Avenue
New York, NY 10017
Born 1968 | | Vice President (2011) and Assistant Secretary (2008) | | Vice President and Lead Chief Counsel, Ameriprise Financial, Inc. since November 2008 and January 2013, respectively (previously, Chief Counsel from January 2010 to January 2013, and Group Counsel from November 2008 to January 2010); Director, Managing Director and General Counsel, J. & W. Seligman & Co. Incorporated from July 2008 to November 2008. | |
Amy Johnson
5228 Ameriprise
Financial Center
Minneapolis, MN
Born 1965 | | Vice President (2006) | | Senior Vice President and Chief Operating Officer, Columbia Management Investment Advisers, LLC since May 2010; previously, Chief Administrative Officer, from 2009 to April 2010, and Vice President — Asset Management and Trust Company Services from 2006 to 2009. | |
Paul D. Pearson
5228 Ameriprise
Financial Center
Minneapolis, MN
Born 1956 | | Vice President (2011) and Assistant Treasurer (1999) | | Vice President — Investment Accounting, Columbia Management Investment Advisers, LLC since May 2010; Vice President — Managed Assets, Investment Accounting, Ameriprise Financial, Inc. from 1998 to April 2010. | |
Christopher O. Petersen
5228 Ameriprise
Financial Center
Minneapolis, MN 55474
Born 1970 | | Vice President and Secretary (2010) | | Vice President and Chief Counsel, Ameriprise Financial, Inc. since January 2010 (previously, Vice President and Group Counsel or Counsel from 2004 to January 2010); officer of Columbia Funds and affiliated funds since 2007. | |
Stephen T. Welsh
225 Franklin Street
Boston, MA 02110
Born 1957 | | Vice President (2006) | | President and Director, Columbia Management Investment Services Corp. from May 2010 to October 2014; President and Director, Columbia Management Services, Inc. from 2004 to April 2010; and Managing Director, Columbia Management Distributors, Inc. from 2007 to April 2010. | |
Annual Report 2014
48
Columbia AMT-Free Intermediate Muni Bond Fund
Board Consideration and Approval of Advisory Agreement
On June 11, 2014, the Board of Trustees (the "Board") and the Trustees who are not interested persons (as defined in the Investment Company Act of 1940) of the Trust (the "Independent Trustees") unanimously approved the continuation of the Investment Management Services Agreement (the "Advisory Agreement") with Columbia Management Investment Advisers, LLC (the "Investment Manager") with respect to Columbia AMT-Free Intermediate Muni Bond Fund (the "Fund"), a series of the Trust. As detailed below, the Advisory Fees and Expenses Committee (the "Committee") and the Board met on multiple occasions to review and discuss, both among themselves and with the management team of the Investment Manager, materials provided by the Investment Manager before determining to approve the continuation of the Advisory Agreement.
In connection with their deliberations regarding the continuation of the Advisory Agreement, the Committee and the Board evaluated materials requested from the Investment Manager regarding the Fund and the Advisory Agreement, and discussed these materials with representatives of the Investment Manager at Committee meetings held on March 4, 2014, April 30, 2014 and June 10, 2014 and at Board meetings held on April 30, 2014 and June 11, 2014. In addition, the Board considers matters bearing on the Advisory Agreement at most of its other meetings throughout the year and meets regularly with senior management of the Funds and the Investment Manager. Through the Board's Investment Oversight Committees, Trustees also meet with selected Fund portfolio managers and other investment personnel at various times throughout the year. The Committee and the Board also consulted with its independent fee consultant, Fund counsel and with the Independent Trustees' independent legal counsel, who advised on various matters with respect to the Committee's and the Board's considerations and otherwise assisted the Committee and the Board in their deliberations. On June 10, 2014, the Committee recommended that the Board approve the continuation of the Advisory Agreement. On June 11, 2014, the Board, including the Independent Trustees, voting separately, unanimously approved the continuation of the Advisory Agreement for the Fund.
The Committee and the Board considered all information that they, their legal counsel, or the Investment Manager believed reasonably necessary to evaluate and to determine whether to approve the continuation of the Advisory Agreement. The information and factors considered by the Committee and the Board in recommending for approval or approving the continuation of the Advisory Agreement for the Fund included the following:
• Information on the investment performance of the Fund relative to the performance of a group of mutual funds determined to be comparable to the Fund by an independent third-party data provider, as well as performance relative to benchmarks;
• Information on the Fund's advisory fees and total expenses, including information comparing the Fund's expenses to those of a group of comparable mutual funds, as determined by the independent third-party data provider;
• The Investment Manager's agreement to contractually limit or cap total operating expenses for the Fund through February 28, 2015 so that total operating expenses (excluding certain fees and expenses, such as transaction costs and certain other investment related expenses, interest, taxes, acquired fund fees and expenses, and extraordinary expenses) would not exceed the annual rates of 0.76% for Class A, 1.41% for Class B, 1.41% for Class C, 0.56% for Class R4, 0.47% for Class R5, 0.71% for Class T and 0.56% for Class Z;
• The terms and conditions of the Advisory Agreement;
• The current and proposed terms and conditions of other agreements and arrangements with affiliates of the Investment Manager relating to the operations of the Fund, including the Administrative Services Agreement, the Distribution Agreement and the Transfer and Dividend Disbursing Agent Agreement;
• Descriptions of various functions performed by the Investment Manager under the Advisory Agreement, including portfolio management and portfolio trading practices;
• Information regarding the management fees and investment performance of similarly-managed portfolios of other clients of the Investment Manager, including institutional separate accounts;
• Information regarding the reputation, regulatory history and resources of the Investment Manager, including information regarding senior management, portfolio managers and other personnel;
• Information regarding the capabilities of the Investment Manager with respect to compliance monitoring services, including an assessment of the Investment Manager's compliance system by the Fund's Chief Compliance Officer; and
• The profitability to the Investment Manager and its affiliates from their relationships with the Fund.
Annual Report 2014
49
Columbia AMT-Free Intermediate Muni Bond Fund
Board Consideration and Approval of Advisory Agreement (continued)
Nature, Extent and Quality of Services Provided under the Advisory Agreement
The Committee and the Board considered the nature, extent and quality of services provided to the Fund by the Investment Manager and its affiliates under the Advisory Agreement and under separate agreements for the provision of transfer agency and administrative services, and the resources dedicated to the Fund and the other Columbia Funds by the Investment Manager and its affiliates. The Committee and the Board considered, among other things, the Investment Manager's ability to attract, motivate and retain highly qualified research, advisory and supervisory investment professionals (including personnel and other resources, compensation programs for personnel involved in fund management, reputation and other attributes), the portfolio management services provided by those investment professionals, and the quality of the Investment Manager's investment research capabilities and trade execution services. The Committee and the Board also considered the potential benefits to shareholders of investing in a mutual fund that is part of a fund complex offering exposure to a variety of asset classes and investment disciplines and providing a variety of fund and shareholder services.
The Committee and the Board also considered the professional experience and qualifications of the senior personnel of the Investment Manager, which included consideration of the Investment Manager's experience with similarly-structured funds. The Committee and the Board noted the compliance programs of and the compliance-related resources provided to the Fund by the Investment Manager and its affiliates, and considered the Investment Manager's ability to provide administrative services to the Fund pursuant to a separate Administrative Services Agreement, including the Investment Manager's ability to coordinate the activities of the Fund's other service providers. After reviewing these and related factors, the Committee and the Board concluded, within the context of their overall conclusions, that the nature, extent and quality of the services provided to the Fund under the Advisory Agreement supported the continuation of the Advisory Agreement.
Investment Performance
The Committee and the Board reviewed information about the performance of the Fund over various time periods, including performance information relative to benchmarks and information based on reports of the independent third-party data provider that compared the performance of the Fund to the performance of a group of comparable mutual funds, and data provided by the independent fee consultant. The Committee and the Board also reviewed a description of the third party's methodology for identifying the Fund's peer groups for purposes of performance and expense comparisons. Although the Fund's performance lagged that of a relevant peer group for certain (although not necessarily all) periods, the Committee and the Board concluded that other factors relevant to performance were sufficient, in light of other considerations, to warrant continuation of the Fund's Advisory Agreement. Those factors included one or more of the following: (i) that the Fund's performance, although lagging in certain recent periods, was stronger over the longer term; (ii) that the underperformance was attributable, to a significant extent, to investment decisions that were reasonable and consistent with the Fund's investment strategy and policies and that the Fund was performing within a reasonable range of expectations, given those investment decisions, market conditions and the Fund's investment strategy; (iii) that the Fund's performance was competitive when compared to other relevant performance benchmarks or peer groups; and (iv) that the Investment Manager had taken or was taking steps designed to help improve the Fund's investment performance, including, but not limited to, replacing portfolio managers, enhancing the resources supporting the portfolio managers, or modifying investment strategies.
The Committee and the Board noted that, through December 31, 2013, the Fund's performance was in the sixtieth, thirty-sixth and fiftieth percentiles (where the best performance would be in the first percentile) of its category selected by the independent third-party data provider for the purposes of performance comparisons for the one-, three- and five- year periods, respectively.
The Committee and the Board also considered the Investment Manager's performance and reputation generally, the Investment Manager's historical responsiveness to Board concerns about performance, and the Investment Manager's willingness to take steps intended to improve performance. After reviewing these and related factors, the Committee and the Board concluded, within the context of their overall conclusions, that the performance of the Fund was sufficient, in light of other considerations, to warrant the continuation of the Advisory Agreement.
Investment Advisory Fee Rates and Other Expenses
The Committee and the Board considered the advisory fees charged to the Fund under the Advisory Agreement as well as the total expenses incurred by the Fund. In assessing the reasonableness of the fees under the Advisory Agreement, the Committee and the Board considered, among other information, the Fund's advisory fee and its total expense ratio as a
Annual Report 2014
50
Columbia AMT-Free Intermediate Muni Bond Fund
Board Consideration and Approval of Advisory Agreement (continued)
percentage of average daily net assets. The Committee and the Board also considered data provided by the independent fee consultant. The Committee and the Board noted that the Fund's actual management fee and net expense ratio are ranked in the second and third quintiles, respectively, (where the lowest fees and expenses would be in the first quintile) against the Fund's expense universe as determined by the independent third-party data provider for purposes of expense comparison. The Committee and the Board also took into account the fee waiver and expense limitation arrangements agreed to by the Investment Manager, as noted above.
The Committee and the Board also received and considered information about the advisory fees charged by the Investment Manager to institutional separate accounts. In considering the fees charged to those accounts, the Committee and the Board took into account, among other things, the Investment Manager's representations about the differences between managing mutual funds as compared to other types of accounts, including differences in the services provided, differences in the risk profile of such business for the Investment Manager and the additional resources required to manage mutual funds effectively. In evaluating the Fund's advisory fees, the Committee and the Board also took into account the demands, complexity and quality of the investment management of the Fund.
After reviewing these and related factors, the Committee and the Board concluded, within the context of their overall conclusions, that the advisory fee rates and expenses of the Fund were sufficient, in light of other considerations, to warrant the continuation of the Advisory Agreement.
Costs of Services Provided and Profitability
The Committee and the Board also took note of the costs of the services provided (both on an absolute and relative basis) and the profitability to the Investment Manager and its affiliates in connection with their relationships with the Fund. In evaluating these considerations, the Committee and the Board took note of the advisory fees charged by the Investment Manager to other clients, including fees charged by the Investment Manager to institutional separate account clients with similar investment strategies to those of the Fund.
The Committee and the Board also considered the compensation directly or indirectly received by the Investment Manager's affiliates in connection with their relationships with the Fund. The Committee and the Board reviewed information provided by management as to the profitability of the Investment Manager and its affiliates of their relationships with the Fund, information about the allocation of expenses used to calculate profitability, and comparisons of profitability levels realized in 2013 to profitability levels realized in 2012. When reviewing profitability, the Committee and the Board also considered court cases in which adviser profitability was an issue in whole or in part, the performance of similarly managed funds, the performance of the Fund, and the expense ratio of the Fund. The Committee and the Board also considered information provided by the Investment Manager regarding the Investment Manager's financial condition and comparing its profitability to that of other asset management firms that are, or are subsidiaries of, publicly traded companies.
After reviewing these and related factors, the Committee and the Board concluded, within the context of their overall conclusions, that the costs of services provided and the profitability to the Investment Manager and its affiliates from their relationships with the Fund supported the continuation of the Advisory Agreement.
Economies of Scale
The Committee and the Board considered the potential existence of economies of scale in the provision by the Investment Manager of services to the Fund, to groups of related funds, and to the Investment Manager's investment advisory clients as a whole, and whether those economies of scale were shared with the Fund through breakpoints in investment advisory fees or other means, such as expense limitation arrangements and additional investments by the Investment Manager in investment, trading and compliance resources. The Committee and the Board noted that the investment advisory fee schedules for the Fund contained breakpoints that would reduce the fee rate on assets above specified threshold levels.
In considering these matters, the Committee and the Board also considered the costs of the services provided and the profitability to the Investment Manager and its affiliates from their relationships with the Fund, as discussed above. After reviewing these and related factors, the Committee and the Board concluded, within the context of their overall conclusions, that the extent to which any economies of scale were expected to be shared with the Fund supported the continuation of the Advisory Agreement.
Annual Report 2014
51
Columbia AMT-Free Intermediate Muni Bond Fund
Board Consideration and Approval of Advisory Agreement (continued)
Other Benefits to the Investment Manager
The Committee and the Board received and considered information regarding "fall-out" or ancillary benefits received by the Investment Manager and its affiliates as a result of their relationships with the Fund, such as the engagement of the Investment Manager to provide administrative services to the Fund and the engagement of the Investment Manager's affiliates to provide distribution and transfer agency services to the Fund. In this regard, among other matters, the Committee and the Board considered that the Fund's distributor retains a portion of the distribution fees from the Fund and receives a portion of the sales charges on sales or redemptions of certain classes of shares of the Fund. The Committee and the Board also considered the benefits of research made available to the Investment Manager by reason of brokerage commissions generated by the Fund's securities transactions, and reviewed information about the Investment Manager's practices with respect to allocating portfolio transactions for brokerage and research services. The Committee and the Board considered the possible conflicts of interest associated with certain fall-out or other ancillary benefits and the reporting, disclosure and other processes that are in place to address such possible conflicts of interest. The Committee and the Board recognized that the Investment Manager's profitability would be somewhat lower without these benefits.
Conclusion
The Committee and the Board reviewed all of the above considerations in reaching their decisions to recommend or approve the continuation of the Advisory Agreement. In their deliberations, the Trustees did not identify any particular information that was all-important or controlling, and individual Trustees may have attributed different weights to the various factors. Based on their evaluation of all factors that they deemed to be material, including those factors described above, and assisted by the advice of independent legal counsel, the Board, including the Independent Trustees, voting separately, unanimously approved the continuation of the Advisory Agreement.
Annual Report 2014
52
Columbia AMT-Free Intermediate Muni Bond Fund
Important Information About This Report
Each fund mails one shareholder report to each shareholder address. If you would like more than one report, please call shareholder services at 800.345.6611 and additional reports will be sent to you.
The policy of the Board is to vote the proxies of the companies in which each fund holds investments consistent with the procedures as stated in the Statement of Additional Information (SAI). You may obtain a copy of the SAI without charge by calling 800.345.6611; contacting your financial intermediary; visiting columbiamanagement.com; or searching the website of the Securities and Exchange Commission (SEC) at sec.gov. Information regarding how each fund voted proxies relating to portfolio securities is filed with the SEC by August 31 for the most recent 12-month period ending June 30 of that year, and is available without charge by visiting columbiamanagement.com; or searching the website of the SEC at sec.gov.
Each fund files a complete schedule of portfolio holdings with the SEC for the first and third quarters of each fiscal year on Form N-Q. Each fund's Form N-Q is available on the SEC's website at sec.gov and may be reviewed and copied at the SEC's Public Reference Room in Washington, D.C. Information on the operation of the Public Reference Room may be obtained by calling 800.SEC.0330. Each fund's complete schedule of portfolio holdings, as filed on Form N-Q, can also be obtained without charge, upon request, by calling 800.345.6611.
Annual Report 2014
53

Columbia AMT-Free Intermediate Muni Bond Fund
P.O. Box 8081
Boston, MA 02266-8081
columbiamanagement.com
This information is for use with concurrent or prior delivery of a fund prospectus. Please read and consider the investment objectives, risks, charges and expenses for any fund carefully before investing. For a prospectus and, if available, a summary prospectus, which contains this and other important information about the Fund, go to columbiamanagement.com. The Fund is distributed by Columbia Management Investment Distributors, Inc., member FINRA, and managed by Columbia Management Investment Advisers, LLC.
© 2014 Columbia Management Investment Advisers, LLC. All rights reserved.
ANN167_10_D01_(12/14)
Annual Report
October 31, 2014

Columbia AMT-Free New York Intermediate Muni
Bond Fund
Not FDIC insured • No bank guarantee • May lose value
 Dear Shareholders,
The U.S. Economy Gained Momentum
The U.S. economy picked up momentum throughout the third quarter of 2014 with improvements in every sector. Second-quarter gross domestic product growth was revised upward to 4.6%, with expectations that third-quarter growth would also be above trend. American companies added more than 200,000 new jobs monthly, driving unemployment below 6% for the first time since 2008. Consumer spending got a boost as both income and savings rose, and confidence hit a post-recession high. After a weak start to the year, corporate profits rebounded, indicating that business remains in good shape. Rising profits led to higher capital spending. The housing market recovery remained on track, as home sales and prices trended higher, and inventories declined. Manufacturing remained a lynchpin of the economy's expansion. Even so, performance fell short of expectations at the end of the period.
Despite Momentum, Markets Remained Stagnant
The financial markets produced lackluster results, despite good economic news and the Federal Reserve's reassurance that it intended to keep short-term interest rates low for another year. A surge in global tensions and concerns that equity valuations have risen sharply put a damper on investor enthusiasm. The S&P 500 Index inched ahead 1.13%, buoyed by its concentration in large-cap stocks with a defensive edge. Traditional fixed-income sectors, including U.S. Treasuries, mortgages and securitized bonds, eked out returns of less than 1% for the quarter. Investment-grade corporate bonds and high-yield bonds lost some ground, although fundamentals for both groups remained solid. Convertible securities and U.S. Treasury inflation-protected securities pulled up the rear.
Stay on Track with Columbia Management
Backed by more than 100 years of experience, Columbia Management is one of the nation's largest asset managers. At the heart of our success and, most importantly, that of our investors, are highly talented industry professionals, brought together by a unique way of working. At Columbia Management, reaching our performance goals matters, and how we reach them matters just as much.
Visit columbiamanagement.com for:
> The Columbia Management Perspectives blog, offering insights on current market events and investment opportunities
> Detailed up-to-date fund performance and portfolio information
> Quarterly fund commentaries
> Columbia Management investor, our award-winning quarterly newsletter for shareholders
Thank you for your continued support of the Columbia Funds. We look forward to serving your investment needs for many years to come.
Best Regards,

J. Kevin Connaughton
President, Columbia Funds
Investing involves risk including the risk of loss of principal.
The S&P 500 Index, an unmanaged index, measures the performance of 500 widely held, large-capitalization U.S. stocks and is frequently used as a general measure of market performance. Indices are not available for investment, are not professionally managed and do not reflect sales charges, fees, brokerage commissions, taxes or other expenses of investing.
Investors should consider the investment objectives, risks, charges and expenses of a mutual fund carefully before investing. For a free prospectus and, if available, a summary prospectus, which contains this and other important information about a fund, visit columbiamanagement.com. The prospectus should be read carefully before investing.
Columbia Funds are distributed by Columbia Management Investment Distributors, Inc., member FINRA, and managed by Columbia Management Investment Advisers, LLC.
© 2014 Columbia Management Investment Advisers, LLC. All rights reserved.
Columbia AMT-Free New York Intermediate Muni Bond Fund
Performance Overview | | | 2 | | |
Manager Discussion of Fund Performance | | | 4 | | |
Understanding Your Fund's Expenses | | | 6 | | |
Portfolio of Investments | | | 7 | | |
Statement of Assets and Liabilities | | | 15 | | |
Statement of Operations | | | 17 | | |
Statement of Changes in Net Assets | | | 18 | | |
Financial Highlights | | | 20 | | |
Notes to Financial Statements | | | 26 | | |
Report of Independent Registered
Public Accounting Firm | | | 32 | | |
Federal Income Tax Information | | | 33 | | |
Trustees and Officers | | | 34 | | |
Board Consideration and Approval of Advisory Agreement | | | 37 | | |
Important Information About This Report | | | 41 | | |
Fund Investment Manager
Columbia Management Investment
Advisers, LLC
225 Franklin Street
Boston, MA 02110
Fund Distributor
Columbia Management Investment
Distributors, Inc.
225 Franklin Street
Boston, MA 02110
Fund Transfer Agent
Columbia Management Investment
Services Corp.
P.O. Box 8081
Boston, MA 02266-8081
For more information about any of the funds, please visit columbiamanagement.com or call 800.345.6611. Customer Service Representatives are available to answer your questions Monday through Friday from 8 a.m. to 7 p.m. Eastern time.
The views expressed in this report reflect the current views of the respective parties. These views are not guarantees of future performance and involve certain risks, uncertainties and assumptions that are difficult to predict, so actual outcomes and results may differ significantly from the views expressed. These views are subject to change at any time based upon economic, market or other conditions and the respective parties disclaim any responsibility to update such views. These views may not be relied on as investment advice and, because investment decisions for a Columbia Fund are based on numerous factors, may not be relied on as an indication of trading intent on behalf of any particular Columbia Fund. References to specific securities should not be construed as a recommendation or investment advice.
Columbia AMT-Free New York Intermediate Muni Bond Fund
Performance Summary
> Columbia AMT-Free New York Intermediate Muni Bond Fund (the Fund) Class A shares returned 5.01% excluding sales charges for the 12-month period that ended October 31, 2014. Class Z shares of the Fund returned 5.27%.
> During the same time period, the Barclays New York 3-15 Year Blend Municipal Bond Index (Barclays NY Index) and the Barclays 3-15 Year Blend Municipal Bond Index, which is national in scope, returned 5.67% and 6.05%, respectively.
> The Fund's duration was shorter than that of the Barclays NY Index, which accounted for the majority of its underperformance.
Average Annual Total Returns (%) (for period ended October 31, 2014)
| | Inception | | 1 Year | | 5 Years | | 10 Years | |
Class A | | 11/25/02 | | | | | | | | | | | | | |
Excluding sales charges | | | | | | | 5.01 | | | | 3.94 | | | | 3.50 | | |
Including sales charges | | | | | | | 1.62 | | | | 3.25 | | | | 2.99 | | |
Class B | | 11/25/02 | | | | | | | |
Excluding sales charges | | | | | | | 4.14 | | | | 3.15 | | | | 2.72 | | |
Including sales charges | | | | | | | 1.14 | | | | 3.15 | | | | 2.72 | | |
Class C | | 11/25/02 | | | | | | | | | | | | | |
Excluding sales charges | | | | | | | 4.47 | | | | 3.50 | | | | 3.08 | | |
Including sales charges | | | | | | | 3.47 | | | | 3.50 | | | | 3.08 | | |
Class R4* | | 03/19/13 | | | 5.19 | | | | 4.18 | | | | 3.75 | | |
Class T | | 12/31/91 | | | | | | | | | | | | | |
Excluding sales charges | | | | | | | 5.12 | | | | 4.03 | | | | 3.60 | | |
Including sales charges | | | | | | | 0.11 | | | | 3.01 | | | | 3.09 | | |
Class Z | | 12/31/91 | | | 5.27 | | | | 4.18 | | | | 3.75 | | |
Barclays New York 3-15 Year Blend Municipal Bond Index | | | | | | | 5.67 | | | | 4.64 | | | | 4.46 | | |
Barclays 3-15 Year Blend Municipal Bond Index | | | | | | | 6.05 | | | | 4.84 | | | | 4.54 | | |
Returns for Class A are shown with and without the maximum initial sales charge of 3.25% (for the one-year and five-year periods) and 4.75% (for the ten-year period). (Prior to August 22, 2005, new purchases of Class A shares had a maximum initial sales charge of 4.75%.) Returns for Class B are shown with and without the applicable contingent deferred sales charge (CDSC) of 3.00% in the first year, declining to 1.00% in the fourth year and eliminated thereafter. Returns for Class C are shown with and without the 1.00% CDSC for the first year only. Returns for Class T are shown with and without the maximum sales charge of 4.75%. The Fund's other classes are not subject to sales charges and have limited eligibility. Please see the Fund's prospectus for details. Performance for different share classes will vary based on differences in sales charges and fees associated with each class. All results shown assume reinvestment of distributions during the period. Returns do not reflect the deduction of taxes that a shareholder may pay on Fund distributions or on the redemption of Fund shares. Performance results reflect the effect of any fee waivers or reimbursements of Fund expenses by Columbia Management Investment Advisers, LLC and/or any of its affiliates. Absent these fee waivers or expense reimbursement arrangements, performance results would have been lower.
The performance information shown represents past performance and is not a guarantee of future results. The investment return and principal value of your investment will fluctuate so that your shares, when redeemed, may be worth more or less than their original cost. Current performance may be lower or higher than the performance information shown. You may obtain performance information current to the most recent month-end by contacting your financial intermediary, visiting columbiamanagement.com or calling 800.345.6611.
*The returns shown for periods prior to the share class inception date (including returns for the Life of the Fund, if shown, which are since Fund inception) include the returns of the Fund's oldest share class. Since the Fund launched more than one share class at its inception, Class Z shares were used. These returns are adjusted to reflect any higher class-related operating expenses of the newer share classes, as applicable. Please visit columbiamanagement.com/mutual-funds/appended-performance for more information.
The Barclays New York 3-15 Year Blend Municipal Bond Index is an unmanaged index that tracks investment grade bonds from the state of New York and its municipalities.
The Barclays 3-15 Year Blend Municipal Bond Index is an unmanaged index that tracks the performance of municipal bonds issued after December 31, 1990, with remaining maturities between 2 and 17 years and at least $7 million in principal amount outstanding.
Indices are not available for investment, are not professionally managed and do not reflect sales charges, fees, brokerage commissions, taxes or other expenses of investing. Securities in the Fund may not match those in an index.
Annual Report 2014
2
Columbia AMT-Free New York Intermediate Muni Bond Fund
Performance Overview (continued)
Performance of a Hypothetical $10,000 Investment (November 1, 2004 – October 31, 2014)
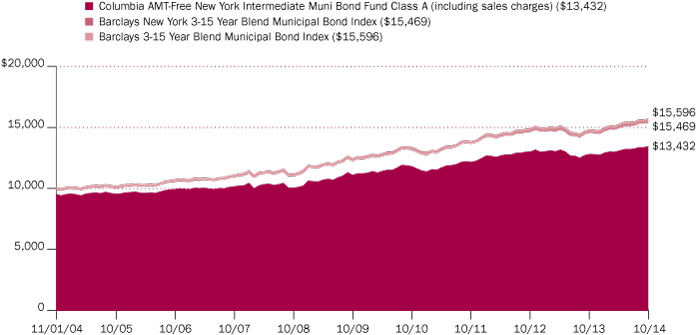
The chart above shows the change in value of a hypothetical $10,000 investment in Class A shares of Columbia AMT-Free New York Intermediate Muni Bond Fund during the stated time period, and does not reflect the deduction of taxes that a shareholder may pay on Fund distributions or on the redemption of Fund shares. The performance of a $10,000 investment in Class A shares with sales charge is calculated with an initial sales charge of 4.75%, which was the effective sales charge prior to August 22, 2005.
Annual Report 2014
3
Columbia AMT-Free New York Intermediate Muni Bond Fund
Manager Discussion of Fund Performance
Portfolio Management
Brian McGreevy
Paul Fuchs, CFA
Quality Breakdown (%)
(at October 31, 2014) | |
AAA rating | | | 3.5 | | |
AA rating | | | 43.5 | | |
A rating | | | 37.9 | | |
BBB rating | | | 8.9 | | |
Non-investment grade | | | 1.1 | | |
Not rated | | | 5.1 | | |
Total | | | 100.0 | | |
Percentages indicated are based upon total fixed income securities (excluding Money Market Funds).
Bond ratings apply to the underlying holdings of the Fund and not the Fund itself and are divided into categories ranging from highest to lowest credit quality, determined by using the middle rating of Moody's, S&P and Fitch, after dropping the highest and lowest available ratings. When ratings are available from only two rating agencies, the lower rating is used. When a rating is available from only one rating agency, that rating is used. When a bond is not rated by any rating agency, it is designated as "Not rated". Credit quality ratings assigned by a rating agency are subjective opinions, not statements of fact, and are subject to change, including daily. The ratings assigned by credit rating agencies are but one of the considerations that the Investment Manager and/or Fund's subadviser incorporates into its credit analysis process, along with such other issuer-specific factors as cash flows, capital structure and leverage ratios, ability to de-leverage (repay) through free cash flow, quality of management, market positioning and access to capital, as well as such security-specific factors as the terms of the security (e.g., interest rate, and time to maturity) and the amount and type of any collateral.
For the 12-month period that ended October 31, 2014, the Fund's Class A shares returned 5.01% excluding sales charges. Class Z shares of the Fund returned 5.27%. During the same 12-month period, the Barclays New York 3-15 Year Blend Municipal Bond Index (Barclays NY Index) returned 5.67% and the Barclays 3-15 Year Blend Municipal Bond Index, which is national in scope, returned 6.05%. The Fund's emphasis on lower rated investment-grade municipal bonds aided performance. The Fund's duration was shorter than that of the Barclays NY Index, which accounted for the majority of the underperformance. Duration is a measure of interest rate sensitivity.
In July 2014 "AMT-Free" was added to the Fund's name, referencing a policy change that prohibits the Fund from owning bonds subject to the federal Alternative Minimum Tax. No such bonds were owned during the period.
Economic News and World Tensions Aided Municipal Market
The municipal market ended 2013 under pressure, as the Federal Reserve (the Fed) announced its intention to taper its monthly bond purchases beginning in January 2014. Against this backdrop, yields rose and several major credit events clouded the municipal outlook. The environment improved in 2014, however, as money flowed into municipal funds and new issue supply decreased. This demand/supply imbalance persisted through the period. Mixed economic news, especially in the first half of 2014, and global tensions, which triggered a flight to safety, also supported fixed-income markets. It is well worth noting that New York state credit ratings were upgraded by three independent agencies after a fourth consecutive on-time budget passed for Governor Cuomo. Lower rated and longer maturity municipals were the best performers for the period. Yields declined (and prices rose) on bonds with maturities of five years or longer.
Contributors and Detractors
The Fund's emphasis on issues rated A and BBB aided performance and boosted the portfolio's yield above the yield of the Barclays NY Index. An overweight in hospital-related credits also contributed to the Fund's solid results as the sector was the best performer for the period. Duration detracted modestly from performance. The Fund's duration was neutral to slightly shorter than that of the Barclays NY Index because we did not expect interest rates to fall meaningfully during the period. An overweight in pre-refunding bonds also detracted from performance. Pre-refunded bonds are older bonds that have been refinanced by investing the proceeds from the lower yielding bond in Treasuries until the scheduled call date of the original bond occurs. Pre-refunding typically occurs when the issuer can issue a new bond at a lower rate. Their defensive characteristics — short average maturity, high quality and liquidity — were out of favor as interest rates declined.
New York Inches Toward Expansion
Technology investment, steady job growth and rising factory production have pushed New York toward the important transition from recovery to expansion during the 12-month period. A technology boom in New York City has attracted significant venture capital, while other areas, such as Albany and Buffalo, have experienced smaller gains within technology. Healthcare and professional services have experienced the biggest job gains, bringing unemployment down to
Annual Report 2014
4
Columbia AMT-Free New York Intermediate Muni Bond Fund
Manager Discussion of Fund Performance (continued)
6.2%, the lowest it has been since 2008 but still above the national average. New York's housing market has improved, but price appreciation and new building lagged the national market and the construction industry continues to struggle. Longer term, the state's favorable industry mix and a highly educated population are positives. However, a struggling housing market, weak population growth and other factors are likely to weigh on the state's expansion.
Looking Ahead
We will continue to seek opportunities to reinvest the Fund's shorter duration, lower yielding bonds into issues rated A and BBB that we believe offer additional yield, attractive relative value and sound fundamentals. In our view, these bonds are desirable because yield is generally the largest contributor to total return and can act as a buffer when prices decline. The eight- to 10-year range currently appears to offer the best value, and we plan to target it for Fund purchases at this time. We will also consider opportunities in the 20-year range. However, we plan to maintain overall duration that is neutral to the Barclays NY Index.
Investment Risks
Fixed-income securities present issuer default risk. The Fund invests substantially in municipal securities and will be affected by tax, legislative, regulatory, demographic or political changes, as well as changes impacting a state's financial, economic or other conditions. A relatively small number of tax-exempt issuers may necessitate the Fund investing more heavily in a single issuer and, therefore, be more exposed to the risk of loss than a fund that invests more broadly. The value of the Fund's portfolio may be more volatile than a more geographically diversified fund. Prepayment and extension risk exists as a loan, bond or other investment may be called, prepaid or redeemed before maturity and that similar yielding investments may not be available for purchase. A rise in interest rates may result in a price decline of fixed-income (debt) instruments held by the fund, negatively affecting its performance and NAV. Falling rates may result in the Fund investing in lower yielding debt instruments, lowering the Fund's income and yield. Debt instruments with longer maturity and duration have greater sensitivity to interest rate changes. Interest rates can change due to local government and banking regulation changes. Non-investment-grade (high-yield or junk) securities present greater price volatility and more risk to principal and income than higher rated securities. Market risk may affect a single issuer, sector of the economy, industry or the market as a whole. Federal and state tax rules apply to capital gain distributions and any gains or losses on sales. Income may be subject to state or local taxes. Liquidity risk is associated with the difficulty of selling underlying investments at a desirable time or price. See the Fund's prospectus for more information on these and other risks.
Annual Report 2014
5
Columbia AMT-Free New York Intermediate Muni Bond Fund
Understanding Your Fund's Expenses
(Unaudited)
As an investor, you incur two types of costs. There are transaction costs, which generally include sales charges on purchases and may include redemption fees. There are also ongoing costs, which generally include management fees, distribution and/or service fees, and other fund expenses. The following information is intended to help you understand your ongoing costs (in dollars) of investing in the Fund and to help you compare these costs with the ongoing costs of investing in other mutual funds.
Analyzing Your Fund's Expenses
To illustrate these ongoing costs, we have provided examples and calculated the expenses paid by investors in each share class of the Fund during the period. The actual and hypothetical information in the table is based on an initial investment of $1,000 at the beginning of the period indicated and held for the entire period. Expense information is calculated two ways and each method provides you with different information. The amount listed in the "Actual" column is calculated using the Fund's actual operating expenses and total return for the period. You may use the Actual information, together with the amount invested, to estimate the expenses that you paid over the period. Simply divide your account value by $1,000 (for example, an $8,600 account value divided by $1,000 = 8.6), then multiply the results by the expenses paid during the period under the "Actual" column. The amount listed in the "Hypothetical" column assumes a 5% annual rate of return before expenses (which is not the Fund's actual return) and then applies the Fund's actual expense ratio for the period to the hypothetical return. You should not use the hypothetical account values and expenses to estimate either your actual account balance at the end of the period or the expenses you paid during the period. See "Compare With Other Funds" below for details on how to use the hypothetical data.
Compare With Other Funds
Since all mutual funds are required to include the same hypothetical calculations about expenses in shareholder reports, you can use this information to compare the ongoing cost of investing in the Fund with other funds. To do so, compare the hypothetical example with the 5% hypothetical examples that appear in the shareholder reports of other funds. As you compare hypothetical examples of other funds, it is important to note that hypothetical examples are meant to highlight the ongoing costs of investing in a fund only and do not reflect any transaction costs, such as sales charges, or redemption or exchange fees. Therefore, the hypothetical calculations are useful in comparing ongoing costs only, and will not help you determine the relative total costs of owning different funds. If transaction costs were included in these calculations, your costs would be higher.
May 1, 2014 – October 31, 2014
| | Account Value at the Beginning
of the Period ($) | | Account Value at the End of the
Period ($) | | Expenses Paid During the
Period ($) | | Fund's Annualized
Expense Ratio (%) | |
| | Actual | | Hypothetical | | Actual | | Hypothetical | | Actual | | Hypothetical | | Actual | |
Class A | | | 1,000.00 | | | | 1,000.00 | | | | 1,026.70 | | | | 1,021.42 | | | | 3.83 | | | | 3.82 | | | | 0.75 | | |
Class B | | | 1,000.00 | | | | 1,000.00 | | | | 1,022.00 | | | | 1,017.64 | | | | 7.64 | | | | 7.63 | | | | 1.50 | | |
Class C | | | 1,000.00 | | | | 1,000.00 | | | | 1,023.50 | | | | 1,019.16 | | | | 6.12 | | | | 6.11 | | | | 1.20 | | |
Class R4 | | | 1,000.00 | | | | 1,000.00 | | | | 1,027.10 | | | | 1,022.68 | | | | 2.55 | | | | 2.55 | | | | 0.50 | | |
Class T | | | 1,000.00 | | | | 1,000.00 | | | | 1,026.30 | | | | 1,021.93 | | | | 3.32 | | | | 3.31 | | | | 0.65 | | |
Class Z | | | 1,000.00 | | | | 1,000.00 | | | | 1,027.10 | | | | 1,022.68 | | | | 2.55 | | | | 2.55 | | | | 0.50 | | |
Expenses paid during the period are equal to the annualized expense ratio for each class as indicated above, multiplied by the average account value over the period and then multiplied by the number of days in the Fund's most recent fiscal half year and divided by 365.
Expenses do not include fees and expenses incurred indirectly by the Fund from its investment in underlying funds, including affiliated and non-affiliated pooled investment vehicles, such as mutual funds and exchange-traded funds.
Had Columbia Management Investment Advisers, LLC and/or certain of its affiliates not waived/reimbursed certain fees and expenses, account value at the end of the period would have been reduced.
Annual Report 2014
6
Columbia AMT-Free New York Intermediate Muni Bond Fund
Portfolio of Investments
October 31, 2014
(Percentages represent value of investments compared to net assets)
Municipal Bonds 98.1%
Issue
Description | | Coupon
Rate | | Principal
Amount ($) | |
Value ($) | |
Disposal 2.2% | |
Babylon Industrial Development Agency
Revenue Bonds
Covanta Babylon, Inc.
Series 2009A
01/01/18 | | | 5.000 | % | | | 3,500,000 | | | | 3,927,105 | | |
Oneida-Herkimer Solid Waste Management Authority
Revenue Bonds
Series 2011
04/01/19 | | | 5.000 | % | | | 830,000 | | | | 942,282 | | |
04/01/20 | | | 5.000 | % | | | 870,000 | | | | 996,255 | | |
Total | | | | | | | 5,865,642 | | |
Higher Education 11.2% | |
Albany Capital Resource Corp.
Refunding Revenue Bonds
Albany College of Pharmacy & Health Services
Series 2014
12/01/31 | | | 5.000 | % | | | 500,000 | | | | 563,245 | | |
Build NYC Resource Corp.
Refunding Revenue Bonds
City University of New York-Queens
Series 2014A
06/01/29 | | | 5.000 | % | | | 225,000 | | | | 263,459 | | |
06/01/30 | | | 5.000 | % | | | 300,000 | | | | 350,460 | | |
County of Saratoga
Refunding Revenue Bonds
Skidmore College
Series 2014B
07/01/21 | | | 5.000 | % | | | 200,000 | | | | 240,178 | | |
07/01/22 | | | 5.000 | % | | | 220,000 | | | | 264,618 | | |
Geneva Development Corp.
Refunding Revenue Bonds
Hobart & William Smith College
Series 2012
09/01/24 | | | 5.000 | % | | | 600,000 | | | | 707,172 | | |
09/01/25 | | | 5.000 | % | | | 300,000 | | | | 349,947 | | |
Hempstead Town Local Development Corp.
Refunding Revenue Bonds
Adelphi University Project
Series 2014
10/01/34 | | | 5.000 | % | | | 300,000 | | | | 342,555 | | |
New York State Dormitory Authority
Revenue Bonds
Barnard College
Series 2007A (NPFGC)
07/01/18 | | | 5.000 | % | | | 1,745,000 | | | | 1,936,985 | | |
Cornell University
Series 2006A
07/01/21 | | | 5.000 | % | | | 2,350,000 | | | | 2,525,263 | | |
Series 2009A
07/01/25 | | | 5.000 | % | | | 1,000,000 | | | | 1,158,790 | | |
Municipal Bonds (continued)
Issue
Description | | Coupon
Rate | | Principal
Amount ($) | |
Value ($) | |
Culinary Institute of America
Series 2012
07/01/28 | | | 5.000 | % | | | 500,000 | | | | 554,995 | | |
Mount Sinai School of Medicine
Series 2009
07/01/27 | | | 5.500 | % | | | 4,000,000 | | | | 4,654,280 | | |
Series 2010A
07/01/21 | | | 5.000 | % | | | 1,000,000 | | | | 1,152,150 | | |
New York University
Series 1998A (NPFGC)
07/01/17 | | | 6.000 | % | | | 2,475,000 | | | | 2,823,059 | | |
07/01/20 | | | 5.750 | % | | | 2,000,000 | | | | 2,434,600 | | |
Series 2001-1 (AMBAC)
07/01/15 | | | 5.500 | % | | | 1,205,000 | | | | 1,246,368 | | |
Rochester Institute of Technology
Series 2010
07/01/21 | | | 5.000 | % | | | 1,000,000 | | | | 1,154,460 | | |
St. John's University
Series 2012A
07/01/27 | | | 5.000 | % | | | 470,000 | | | | 538,442 | | |
Teachers College
Series 2009
03/01/24 | | | 5.000 | % | | | 1,000,000 | | | | 1,128,860 | | |
Oneida County Industrial Development Agency(a)
Revenue Bonds
Hamilton College Project
Series 2007A (NPFGC)
07/01/18 | | | 0.000 | % | | | 1,000,000 | | | | 938,560 | | |
07/01/20 | | | 0.000 | % | | | 1,000,000 | | | | 845,890 | | |
St. Lawrence County Industrial Development Agency
Revenue Bonds
St. Lawrence University
Series 2009A
10/01/16 | | | 5.000 | % | | | 3,000,000 | | | | 3,251,460 | | |
Total | | | | | | | 29,425,796 | | |
Hospital 13.0% | |
Albany Industrial Development Agency
Revenue Bonds
St. Peters Hospital Project
Series 2008A
11/15/22 | | | 5.750 | % | | | 500,000 | | | | 565,125 | | |
11/15/27 | | | 5.250 | % | | | 1,000,000 | | | | 1,100,640 | | |
Series 2008E
11/15/22 | | | 5.250 | % | | | 500,000 | | | | 557,710 | | |
Build NYC Resource Corp.
Refunding Revenue Bonds
New York Methodist Hospital Project
Series 2014
07/01/28 | | | 5.000 | % | | | 150,000 | | | | 171,219 | | |
07/01/29 | | | 5.000 | % | | | 175,000 | | | | 199,133 | | |
The accompanying Notes to Financial Statements are an integral part of this statement.
Annual Report 2014
7
Columbia AMT-Free New York Intermediate Muni Bond Fund
Portfolio of Investments (continued)
October 31, 2014
Municipal Bonds (continued)
Issue
Description | | Coupon
Rate | | Principal
Amount ($) | |
Value ($) | |
County of Saratoga
Revenue Bonds
Saratoga Hospital Project
Series 2013A
12/01/24 | | | 5.000 | % | | | 1,085,000 | | | | 1,274,842 | | |
12/01/25 | | | 5.000 | % | | | 1,115,000 | | | | 1,305,219 | | |
12/01/27 | | | 5.000 | % | | | 1,225,000 | | | | 1,417,448 | | |
Dutchess County Local Development Corp.
Revenue Bonds
Series 2014A
07/01/34 | | | 5.000 | % | | | 300,000 | | | | 334,017 | | |
Monroe County Industrial Development Agency
Refunding Revenue Bonds
Highland Hospital of Rochester
Series 2005
08/01/22 | | | 5.000 | % | | | 700,000 | | | | 720,566 | | |
Nassau County Local Economic Assistance Corp.
Refunding Revenue Bonds
Catholic Health Services
Series 2011
07/01/19 | | | 5.000 | % | | | 1,840,000 | | | | 2,109,486 | | |
07/01/20 | | | 5.000 | % | | | 2,815,000 | | | | 3,265,259 | | |
Revenue Bonds
Catholic Health Services of Long Island
Series 2014
07/01/32 | | | 5.000 | % | | | 1,250,000 | | | | 1,410,250 | | |
07/01/33 | | | 5.000 | % | | | 675,000 | | | | 756,810 | | |
New York State Dormitory Authority
Revenue Bonds
Long Island Jewish Obligated Group
Series 2006A
11/01/19 | | | 5.000 | % | | | 1,000,000 | | | | 1,076,510 | | |
Memorial Sloan-Kettering Cancer Center
Series 2012
07/01/27 | | | 5.000 | % | | | 500,000 | | | | 585,470 | | |
Mount Sinai Hospital
Series 2010A
07/01/26 | | | 5.000 | % | | | 1,725,000 | | | | 1,976,005 | | |
Series 2011A
07/01/31 | | | 5.000 | % | | | 2,000,000 | | | | 2,195,620 | | |
New York University Hospital Center
Series 2006A
07/01/20 | | | 5.000 | % | | | 3,000,000 | | | | 3,265,740 | | |
Series 2011A
07/01/23 | | | 5.125 | % | | | 1,000,000 | | | | 1,153,000 | | |
North Shore-Long Island Jewish Obligation Group
Series 2009A
05/01/30 | | | 5.250 | % | | | 4,000,000 | | | | 4,447,400 | | |
Orange Regional Medical Center
Series 2008
12/01/29 | | | 6.125 | % | | | 1,350,000 | | | | 1,447,051 | | |
United Health Services Hospitals
Series 2009 (FHA)
08/01/18 | | | 4.500 | % | | | 1,000,000 | | | | 1,082,340 | | |
Municipal Bonds (continued)
Issue
Description | | Coupon
Rate | | Principal
Amount ($) | |
Value ($) | |
Onondaga Civic Development Corp.
Revenue Bonds
St. Joseph's Hospital Health Center Project
Series 2014
07/01/25 | | | 5.000 | % | | | 500,000 | | | | 529,140 | | |
Saratoga County Industrial Development Agency
Revenue Bonds
Saratoga Hospital Project
Series 2007B
12/01/22 | | | 5.000 | % | | | 500,000 | | | | 530,930 | | |
12/01/27 | | | 5.125 | % | | | 500,000 | | | | 526,080 | | |
Total | | | | | | | 34,003,010 | | |
Investor Owned 1.1% | |
New York State Energy Research & Development Authority
Revenue Bonds
Rochester Gas & Electric Corp.
Series 2004A (NPFGC)(b)
05/15/32 | | | 4.750 | % | | | 2,650,000 | | | | 2,805,184 | | |
Local Appropriation 1.1% | |
New York State Dormitory Authority
Revenue Bonds
Municipal Health Facilities
Subordinated Series 2001-2
01/15/21 | | | 5.000 | % | | | 2,500,000 | | | | 2,797,325 | | |
Local General Obligation 12.3% | |
City of New York
Unlimited General Obligation Bonds
Series 2005G
08/01/16 | | | 5.250 | % | | | 500,000 | | | | 542,290 | | |
Series 2007D-1
12/01/21 | | | 5.000 | % | | | 2,000,000 | | | | 2,244,880 | | |
Subordinated Series 2008I-1
02/01/23 | | | 5.000 | % | | | 2,000,000 | | | | 2,251,540 | | |
Unlimited General Obligation Refunding Bonds
Series 2014J
08/01/30 | | | 5.000 | % | | | 1,500,000 | | | | 1,767,195 | | |
Unrefunded Unlimited General Obligation Bonds
Series 2007D
02/01/24 | | | 5.000 | % | | | 630,000 | | | | 687,109 | | |
City of Syracuse
Limited General Obligation Refunding & Public
Improvement Bonds
Series 2014
08/15/23 | | | 5.000 | % | | | 405,000 | | | | 489,552 | | |
City of Utica
Limited General Obligation Refunding & Public
Improvement Bonds
Series 2013
04/01/19 | | | 4.000 | % | | | 1,575,000 | | | | 1,699,913 | | |
The accompanying Notes to Financial Statements are an integral part of this statement.
Annual Report 2014
8
Columbia AMT-Free New York Intermediate Muni Bond Fund
Portfolio of Investments (continued)
October 31, 2014
Municipal Bonds (continued)
Issue
Description | | Coupon
Rate | | Principal
Amount ($) | |
Value ($) | |
City of Yonkers
Limited General Obligation Refunding Bonds
Series 2012A
07/01/18 | | | 4.000 | % | | | 2,000,000 | | | | 2,163,560 | | |
Unrefunded Unlimited General Obligation Bonds
Series 2005B (NPFGC)
08/01/21 | | | 5.000 | % | | | 1,825,000 | | | | 1,885,900 | | |
08/01/22 | | | 5.000 | % | | | 1,920,000 | | | | 1,982,592 | | |
County of Albany
Unlimited General Obligation Bonds
Series 2006 (XLCA)
09/15/20 | | | 4.125 | % | | | 1,000,000 | | | | 1,060,780 | | |
County of Allegany
Limited General Obligation Refunding Bonds
Public Improvement-Build America Bonds
Series 2014
09/15/28 | | | 5.000 | % | | | 1,375,000 | | | | 1,647,800 | | |
County of Erie
Limited General Obligation Bonds
Public Improvement
Series 2012A
04/01/25 | | | 5.000 | % | | | 500,000 | | | | 574,105 | | |
County of Monroe
Unlimited General Obligation Refunding & Public
Improvement Bonds
Series 1996 (NPFGC)
03/01/16 | | | 6.000 | % | | | 1,210,000 | | | | 1,286,968 | | |
County of Nassau
Unlimited General Obligation Improvement Bonds
Series 2010A
04/01/18 | | | 4.000 | % | | | 1,340,000 | | | | 1,471,146 | | |
County of Rockland
Limited General Obligation Bonds
Series 2014A (AGM)
03/01/24 | | | 5.000 | % | | | 350,000 | | | | 419,423 | | |
County of Suffolk
Unlimited General Obligation Bonds
Public Improvement
Series 2008B
11/01/19 | | | 5.000 | % | | | 2,315,000 | | | | 2,639,980 | | |
New York State Dormitory Authority
Refunding Revenue Bonds
School Districts Bond Financing
Series 2013E (AGM)
10/01/31 | | | 5.000 | % | | | 500,000 | | | | 583,345 | | |
Ramapo Local Development Corp.
Refunding Revenue Bonds
Guaranteed
Series 2013
03/15/28 | | | 5.000 | % | | | 2,180,000 | | | | 2,433,883 | | |
Municipal Bonds (continued)
Issue
Description | | Coupon
Rate | | Principal
Amount ($) | |
Value ($) | |
Sachem Central School District
Unlimited General Obligation Refunding Bonds
Series 2006 (NPFGC)
10/15/24 | | | 4.250 | % | | | 1,000,000 | | | | 1,032,560 | | |
Three Village Central School District Brookhaven &
Smithtown
Unlimited General Obligation Refunding Bonds
Series 2005 (NPFGC)
06/01/18 | | | 5.000 | % | | | 1,000,000 | | | | 1,140,750 | | |
Town of Oyster Bay
Limited General Obligation Refunding & Public
Improvement Bonds
Series 2014B
08/15/23 | | | 5.000 | % | | | 1,850,000 | | | | 2,189,456 | | |
Total | | | | | | | 32,194,727 | | |
Multi-Family 1.9% | |
Housing Development Corp.
Revenue Bonds
8 Spruce Street
Series 2014E(c)
02/15/48 | | | 3.500 | % | | | 1,000,000 | | | | 1,007,500 | | |
New York State Dormitory Authority
Revenue Bonds
Residential Institution for Children
Series 2008A-1
06/01/33 | | | 5.000 | % | | | 1,700,000 | | | | 1,870,748 | | |
Tompkins County Development Corp.
Revenue Bonds
Tompkins Cortland Community College
Series 2013
07/01/17 | | | 5.000 | % | | | 1,005,000 | | | | 1,079,089 | | |
07/01/18 | | | 5.000 | % | | | 1,045,000 | | | | 1,140,168 | | |
Total | | | | | | | 5,097,505 | | |
Municipal Power 2.9% | |
Long Island Power Authority
Revenue Bonds
Series 2009A
04/01/21 | | | 5.250 | % | | | 1,000,000 | | | | 1,137,480 | | |
04/01/22 | | | 5.500 | % | | | 3,000,000 | | | | 3,430,350 | | |
Series 2011A
05/01/21 | | | 5.000 | % | | | 1,000,000 | | | | 1,161,980 | | |
Series 2012B
09/01/26 | | | 5.000 | % | | | 1,510,000 | | | | 1,732,997 | | |
Total | | | | | | | 7,462,807 | | |
Other Bond Issue 1.2% | |
New York Liberty Development Corp.
Refunding Revenue Bonds
4 World Trade Center Project
Series 2011
11/15/31 | | | 5.000 | % | | | 2,350,000 | | | | 2,635,125 | | |
The accompanying Notes to Financial Statements are an integral part of this statement.
Annual Report 2014
9
Columbia AMT-Free New York Intermediate Muni Bond Fund
Portfolio of Investments (continued)
October 31, 2014
Municipal Bonds (continued)
Issue
Description | | Coupon
Rate | | Principal
Amount ($) | |
Value ($) | |
Westchester County Industrial Development Agency
Revenue Bonds
Guiding Eyes for the Blind
Series 2004
08/01/24 | | | 5.375 | % | | | 430,000 | | | | 439,387 | | |
Total | | | | | | | 3,074,512 | | |
Pool/Bond Bank 6.6% | |
New York Municipal Bond Bank Agency
Revenue Bonds
Subordinated Series 2009C-1
02/15/18 | | | 5.000 | % | | | 3,000,000 | | | | 3,376,350 | | |
New York State Dormitory Authority
Revenue Bonds
School Districts Financing Program
Series 2008A (AGM)
10/01/23 | | | 5.000 | % | | | 3,000,000 | | | | 3,441,750 | | |
Series 2009C (AGM)
10/01/22 | | | 5.000 | % | | | 3,000,000 | | | | 3,438,960 | | |
Series 2012B
10/01/26 | | | 5.000 | % | | | 3,000,000 | | | | 3,527,370 | | |
New York State Environmental Facilities Corp.
Revenue Bonds
Revolving Funds-New York City Municipal Water
Series 2008B
06/15/21 | | | 5.000 | % | | | 3,000,000 | | | | 3,437,460 | | |
Total | | | | | | | 17,221,890 | | |
Ports 2.4% | |
Port Authority of New York & New Jersey
Refunding Revenue Bonds
Consolidated 184th
Series 2014
09/01/30 | | | 5.000 | % | | | 2,000,000 | | | | 2,391,060 | | |
Revenue Bonds
Consolidated 161st
Series 2009
10/15/31 | | | 5.000 | % | | | 3,390,000 | | | | 3,898,805 | | |
Total | | | | | | | 6,289,865 | | |
Prep School 0.9% | |
Build NYC Resource Corp.
Revenue Bonds
International Leadership Charter School
Series 2013
07/01/23 | | | 5.000 | % | | | 1,000,000 | | | | 1,013,270 | | |
Build NYC Resource Corp.(c)
Refunding Revenue Bonds
Horace Mann School Project
Series 2014
07/01/26 | | | 5.000 | % | | | 475,000 | | | | 569,634 | | |
07/01/27 | | | 5.000 | % | | | 600,000 | | | | 717,276 | | |
Total | | | | | | | 2,300,180 | | |
Municipal Bonds (continued)
Issue
Description | | Coupon
Rate | | Principal
Amount ($) | |
Value ($) | |
Recreation 3.1% | |
Build NYC Resource Corp.
Revenue Bonds
YMCA of Greater NY Project
Series 2012
08/01/32 | | | 5.000 | % | | | 500,000 | | | | 548,365 | | |
New York City Industrial Development Agency
Revenue Bonds
Pilot-Queens Baseball Stadium
Series 2006 (AMBAC)
01/01/19 | | | 5.000 | % | | | 850,000 | | | | 891,948 | | |
YMCA of Greater New York Project
Series 2006
08/01/26 | | | 5.000 | % | | | 1,000,000 | | | | 1,030,510 | | |
New York City Trust for Cultural Resources
Refunding Revenue Bonds
Museum of Modern Art
Series 2008-1A
04/01/26 | | | 5.000 | % | | | 4,850,000 | | | | 5,562,174 | | |
Total | | | | | | | 8,032,997 | | |
Refunded/Escrowed 7.8% | |
City of New York
Prerefunded 02/01/17 Unlimited General Obligation Bonds
Series 2007D
02/01/24 | | | 5.000 | % | | | 1,370,000 | | | | 1,507,849 | | |
Prerefunded 12/01/14 Unlimited General Obligation Bonds
Series 2004G
12/01/19 | | | 5.000 | % | | | 1,145,000 | | | | 1,149,614 | | |
Elizabeth Forward School District
Unlimited General Obligation Bonds
Capital Appreciation
Series 1994B Escrowed to Maturity (NPFGC)(a)
09/01/20 | | | 0.000 | % | | | 2,210,000 | | | | 2,026,239 | | |
Metropolitan Transportation Authority
Prerefunded 10/01/15 Revenue Bonds
Series 1998A (FGIC)
04/01/23 | | | 5.000 | % | | | 2,000,000 | | | | 2,088,540 | | |
New York State Dormitory Authority
Revenue Bonds
Capital Appreciation-Memorial Sloan-Kettering Cancer
Center
Series 2003-1 Escrowed to Maturity (NPFGC)(a)
07/01/25 | | | 0.000 | % | | | 3,750,000 | | | | 2,999,400 | | |
Onondaga County Water Authority
Prerefunded 09/15/15 Revenue Bonds
General
Series 2005A (AMBAC)
09/15/22 | | | 5.000 | % | | | 895,000 | | | | 932,724 | | |
09/15/23 | | | 5.000 | % | | | 940,000 | | | | 979,621 | | |
Puerto Rico Highways & Transportation Authority
Refunding Revenue Bonds
Series 2005BB Escrowed to Maturity (AGM)(d)
07/01/22 | | | 5.250 | % | | | 355,000 | | | | 440,907 | | |
The accompanying Notes to Financial Statements are an integral part of this statement.
Annual Report 2014
10
Columbia AMT-Free New York Intermediate Muni Bond Fund
Portfolio of Investments (continued)
October 31, 2014
Municipal Bonds (continued)
Issue
Description | | Coupon
Rate | | Principal
Amount ($) | |
Value ($) | |
Triborough Bridge & Tunnel Authority
Prerefunded 01/01/22 Revenue Bonds
General Purpose
Series 1999B
01/01/30 | | | 5.500 | % | | | 2,000,000 | | | | 2,509,180 | | |
Prerefunded 05/15/18 Revenue Bonds
General Purpose
Series 2008A
11/15/21 | | | 5.000 | % | | | 2,000,000 | | | | 2,298,460 | | |
Prerefunded 11/15/16 Revenue Bonds
General Purpose
Series 2006A
11/15/19 | | | 5.000 | % | | | 2,000,000 | | | | 2,188,240 | | |
Revenue Bonds
General Purpose
Series 1992Y Escrowed to Maturity
01/01/17 | | | 5.500 | % | | | 1,185,000 | | | | 1,250,412 | | |
Total | | | | | | | 20,371,186 | | |
Retirement Communities 2.0% | |
Erie County Industrial Development Agency (The)
Revenue Bonds
Orchard Park CRCC, Inc. Project
Series 2006A
11/15/36 | | | 6.000 | % | | | 1,000,000 | | | | 1,018,550 | | |
New York State Dormitory Authority
Revenue Bonds
Miriam Osborn Memorial Home Association
Series 2012
07/01/26 | | | 5.000 | % | | | 740,000 | | | | 801,464 | | |
07/01/27 | | | 5.000 | % | | | 700,000 | | | | 753,242 | | |
Suffolk County Industrial Development Agency
Refunding Revenue Bonds
Jeffersons Ferry Project
Series 2006
11/01/28 | | | 5.000 | % | | | 2,500,000 | | | | 2,590,450 | | |
Total | | | | | | | 5,163,706 | | |
Sales Tax 1.0% | |
Sales Tax Asset Receivable Corp.
Refunding Revenue Bonds
Fiscal 2015
Series 2014A
10/15/24 | | | 5.000 | % | | | 2,000,000 | | | | 2,513,440 | | |
Special Non Property Tax 8.2% | |
Metropolitan Transportation Authority
Revenue Bonds
Series 2004A (NPFGC)
11/15/18 | | | 5.250 | % | | | 800,000 | | | | 934,176 | | |
New York City Transitional Finance Authority Building Aid
Revenue Bonds
Series 2007S-2 (NPFGC)
01/15/21 | | | 5.000 | % | | | 4,300,000 | | | | 4,683,216 | | |
Municipal Bonds (continued)
Issue
Description | | Coupon
Rate | | Principal
Amount ($) | |
Value ($) | |
New York City Transitional Finance Authority
Revenue Bonds
Future Tax Secured
Subordinated Series 2009A-1
05/01/27 | | | 5.000 | % | | | 5,000,000 | | | | 5,752,300 | | |
New York State Dormitory Authority
Refunding Revenue Bonds
Education
Series 2005B (AMBAC)
03/15/26 | | | 5.500 | % | | | 1,000,000 | | | | 1,288,900 | | |
New York State Housing Finance Agency
Revenue Bonds
Series 2008A
09/15/19 | | | 5.000 | % | | | 1,400,000 | | | | 1,571,696 | | |
New York State Thruway Authority Highway & Bridge Trust
Fund
Revenue Bonds
Series 2008A
04/01/21 | | | 5.000 | % | | | 1,000,000 | | | | 1,130,500 | | |
New York State Thruway Authority
Revenue Bonds
Transportation
Series 2007A
03/15/22 | | | 5.000 | % | | | 1,000,000 | | | | 1,121,330 | | |
Virgin Islands Public Finance Authority(d)
Refunding Revenue Bonds
Series 2013B
10/01/24 | | | 5.000 | % | | | 1,740,000 | | | | 2,010,692 | | |
Revenue Bonds
Matching Fund Loan Notes-Senior Lien
Series 2010A
10/01/25 | | | 5.000 | % | | | 2,755,000 | | | | 3,054,771 | | |
Total | | | | | | | 21,547,581 | | |
State Appropriated 7.6% | |
Erie County Industrial Development Agency (The)
Revenue Bonds
School District of Buffalo Project
Series 2008A (AGM)
05/01/18 | | | 5.000 | % | | | 1,000,000 | | | | 1,142,210 | | |
Series 2011A
05/01/30 | | | 5.250 | % | | | 1,440,000 | | | | 1,694,160 | | |
New York State Dormitory Authority
Refunding Revenue Bonds
Consolidated Service Contract
Series 2009A
07/01/24 | | | 5.000 | % | | | 3,000,000 | | | | 3,461,700 | | |
Revenue Bonds
Mental Health Services Facility Improvements
Series 2009
02/15/18 | | | 5.500 | % | | | 1,000,000 | | | | 1,151,370 | | |
Schools Program
Series 2000
07/01/20 | | | 6.250 | % | | | 1,220,000 | | | | 1,226,125 | | |
The accompanying Notes to Financial Statements are an integral part of this statement.
Annual Report 2014
11
Columbia AMT-Free New York Intermediate Muni Bond Fund
Portfolio of Investments (continued)
October 31, 2014
Municipal Bonds (continued)
Issue
Description | | Coupon
Rate | | Principal
Amount ($) | |
Value ($) | |
State University Educational Facilities
3rd General Series 2005A (NPFGC)
05/15/21 | | | 5.500 | % | | | 1,000,000 | | | | 1,226,330 | | |
Series 1993A
05/15/19 | | | 5.500 | % | | | 2,500,000 | | | | 2,889,575 | | |
Series 2000C (AGM)
05/15/17 | | | 5.750 | % | | | 1,250,000 | | | | 1,410,800 | | |
New York State Urban Development Corp.
Refunding Revenue Bonds
Service Contract
Series 2008B
01/01/26 | | | 5.000 | % | | | 3,125,000 | | | | 3,515,406 | | |
Series 2008C
01/01/22 | | | 5.000 | % | | | 2,000,000 | | | | 2,254,440 | | |
Total | | | | | | | 19,972,116 | | |
Tobacco 1.2% | |
Chautauqua Tobacco Asset Securitization Corp.
Refunding Revenue Bonds
Series 2014(c)
03/01/29 | | | 5.000 | % | | | 3,000,000 | | | | 3,187,650 | | |
Transportation 7.3% | |
Metropolitan Transportation Authority
Revenue Bonds
Series 2005B (AMBAC)
11/15/24 | | | 5.250 | % | | | 750,000 | | | | 922,935 | | |
Series 2006 (CIFG/TCRS)
11/15/22 | | | 5.000 | % | | | 2,280,000 | | | | 2,486,180 | | |
Series 2007B
11/15/22 | | | 5.000 | % | | | 1,500,000 | | | | 1,678,185 | | |
Series 2008C
11/15/23 | | | 6.250 | % | | | 3,570,000 | | | | 4,284,429 | | |
Series 2014C
11/15/29 | | | 5.000 | % | | | 3,000,000 | | | | 3,496,920 | | |
Transportation
Series 2006B
11/15/16 | | | 5.000 | % | | | 1,500,000 | | | | 1,638,285 | | |
Series 2010D
11/15/28 | | | 5.250 | % | | | 3,000,000 | | | | 3,430,800 | | |
Series 2014B
11/15/22 | | | 5.000 | % | | | 1,000,000 | | | | 1,198,770 | | |
Total | | | | | | | 19,136,504 | | |
Turnpike/Bridge/Toll Road 2.2% | |
Niagara Falls Bridge Commission
Revenue Bonds
Bridge System
Series 1993A (AGM)
10/01/19 | | | 4.000 | % | | | 2,000,000 | | | | 2,152,120 | | |
Municipal Bonds (continued)
Issue
Description | | Coupon
Rate | | Principal
Amount ($) | |
Value ($) | |
Triborough Bridge & Tunnel Authority
Refunding Revenue Bonds
General Purpose
Series 2011A
01/01/25 | | | 5.000 | % | | | 3,000,000 | | | | 3,545,310 | | |
Total | | | | | | | 5,697,430 | | |
Water & Sewer 0.9% | |
Rensselaer County Water Service & Sewer Authority
Revenue Bonds
Sewer Service
Series 2008
09/01/28 | | | 5.100 | % | | | 1,155,000 | | | | 1,223,849 | | |
Water Service
Series 2008
09/01/28 | | | 5.100 | % | | | 1,060,000 | | | | 1,123,187 | | |
Total | | | | | | | 2,347,036 | | |
Total Municipal Bonds
(Cost: $236,678,575) | | | | | | | 256,508,089 | | |
Municipal Short Term 1.1%
Issue
Description | | Effective
Yield | | Principal
Amount ($) | | Value ($) | |
Local General Obligation 1.1% | |
Town of Ramapo
Limited General Obligation Notes
BAN Series 2014B(e)
05/27/15 | | | 3.340 | % | | | 3,000,000 | | | | 3,020,010 | | |
Total Municipal Short Term
(Cost: $3,019,991) | | | | | | | 3,020,010 | | |
Money Market Funds 0.2%
| | | Shares | | Value ($) | |
Dreyfus New York AMT-Free
Municipal Money Market Fund,
0.000%(f) | | | 533,838 | | | | 533,838 | | |
Total Money Market Funds
(Cost: $533,838) | | | | | 533,838 | | |
Total Investments
(Cost: $240,232,404) | | | | | 260,061,937 | | |
Other Assets & Liabilities, Net | | | | | 1,471,808 | | |
Net Assets | | | | | 261,533,745 | | |
The accompanying Notes to Financial Statements are an integral part of this statement.
Annual Report 2014
12
Columbia AMT-Free New York Intermediate Muni Bond Fund
Portfolio of Investments (continued)
October 31, 2014
Notes to Portfolio of Investments
(a) Zero coupon bond.
(b) Variable rate security.
(c) Represents a security purchased on a when-issued or delayed delivery basis.
(d) Municipal obligations include debt obligations issued by or on behalf of territories, possessions, or sovereign nations within the territorial boundaries of the United States. At October 31, 2014, the value of these securities amounted to $5,506,370 or 2.11% of net assets.
(e) Security exempt from registration pursuant to Rule 144A under the Securities Act of 1933. This security may be resold in transactions exempt from registration, normally to qualified institutional buyers. At October 31, 2014, the value of these securities amounted to $3,020,010 or 1.15% of net assets.
(f) The rate shown is the seven-day current annualized yield at October 31, 2014.
Abbreviation Legend
AGM Assured Guaranty Municipal Corporation
AMBAC Ambac Assurance Corporation
AMT Alternative Minimum Tax
BAN Bond Anticipation Note
CIFG IXIS Financial Guaranty
FGIC Financial Guaranty Insurance Company
FHA Federal Housing Authority
NPFGC National Public Finance Guarantee Corporation
TCRS Transferable Custodial Receipts
XLCA XL Capital Assurance
Fair Value Measurements
Generally accepted accounting principles (GAAP) require disclosure regarding the inputs and valuation techniques used to measure fair value and any changes in valuation inputs or techniques. In addition, investments shall be disclosed by major category.
The Fund categorizes its fair value measurements according to a three-level hierarchy that maximizes the use of observable inputs and minimizes the use of unobservable inputs by prioritizing that the most observable input be used when available. Observable inputs are those that market participants would use in pricing an investment based on market data obtained from sources independent of the reporting entity. Unobservable inputs are those that reflect the Fund's assumptions about the information market participants would use in pricing an investment. An investment's level within the fair value hierarchy is based on the lowest level of any input that is deemed significant to the asset or liability's fair value measurement. The input levels are not necessarily an indication of the risk or liquidity associated with investments at that level. For example, certain U.S. government securities are generally high quality and liquid, however, they are reflected as Level 2 because the inputs used to determine fair value may not always be quoted prices in an active market.
Fair value inputs are summarized in the three broad levels listed below:
> Level 1 — Valuations based on quoted prices for investments in active markets that the Fund has the ability to access at the measurement date (including NAV for open-end mutual funds). Valuation adjustments are not applied to Level 1 investments.
> Level 2 — Valuations based on other significant observable inputs (including quoted prices for similar securities, interest rates, prepayment speeds, credit risks, etc.).
> Level 3 — Valuations based on significant unobservable inputs (including the Fund's own assumptions and judgment in determining the fair value of investments).
Inputs that are used in determining fair value of an investment may include price information, credit data, volatility statistics, and other factors. These inputs can be either observable or unobservable. The availability of observable inputs can vary between investments, and is affected by various factors such as the type of investment, and the volume and level of activity for that investment or similar investments in the marketplace. The inputs will be considered by the Investment Manager, along with any other relevant factors in the calculation of an investment's fair value. The Fund uses prices and inputs that are current as of the measurement date, which may include periods of market dislocations. During these periods, the availability of prices and inputs may be reduced for many investments. This condition could cause an investment to be reclassified between the various levels within the hierarchy.
The accompanying Notes to Financial Statements are an integral part of this statement.
Annual Report 2014
13
Columbia AMT-Free New York Intermediate Muni Bond Fund
Portfolio of Investments (continued)
October 31, 2014
Fair Value Measurements (continued)
Investments falling into the Level 3 category are primarily supported by quoted prices from brokers and dealers participating in the market for those investments. However, these may be classified as Level 3 investments due to lack of market transparency and corroboration to support these quoted prices. Additionally, valuation models may be used as the pricing source for any remaining investments classified as Level 3. These models may rely on one or more significant unobservable inputs and/or significant assumptions by the Investment Manager. Inputs used in valuations may include, but are not limited to, financial statement analysis, capital account balances, discount rates and estimated cash flows, and comparable company data.
Under the direction of the Fund's Board of Trustees (the Board), the Investment Manager's Valuation Committee (the Committee) is responsible for overseeing the valuation procedures approved by the Board. The Committee consists of voting and non-voting members from various groups within the Investment Manager's organization, including operations and accounting, trading and investments, compliance, risk management and legal.
The Committee meets at least monthly to review and approve valuation matters, which may include a description of specific valuation determinations, data regarding pricing information received from approved pricing vendors and brokers and the results of Board-approved valuation control policies and procedures (the Policies). The Policies address, among other things, instances when market quotations are or are not readily available, including recommendations of third party pricing vendors and a determination of appropriate pricing methodologies; events that require specific valuation determinations and assessment of fair value techniques; securities with a potential for stale pricing, including those that are illiquid, restricted, or in default; and the effectiveness of third party pricing vendors, including periodic reviews of vendors. The Committee meets more frequently, as needed, to discuss additional valuation matters, which may include the need to review back-testing results, review time-sensitive information or approve related valuation actions. The Committee reports to the Board, with members of the Committee meeting with the Board at each of its regularly scheduled meetings to discuss valuation matters and actions during the period, similar to those described earlier.
For investments categorized as Level 3, the Committee monitors information similar to that described above, which may include: (i) data specific to the issuer or comparable issuers, (ii) general market or specific sector news and (iii) quoted prices and specific or similar security transactions. The Committee considers this data and any changes from prior periods in order to assess the reasonableness of observable and unobservable inputs, any assumptions or internal models used to value those securities and changes in fair value. This data is also used to corroborate, when available, information received from approved pricing vendors and brokers. Various factors impact the frequency of monitoring this information (which may occur as often as daily). However, the Committee may determine that changes to inputs, assumptions and models are not required as a result of the monitoring procedures performed.
The following table is a summary of the inputs used to value the Fund's investments at October 31, 2014:
Description | | Level 1
Quoted Prices in Active
Markets for Identical
Assets ($) | |
Level 2
Other Significant
Observable Inputs ($) | |
Level 3
Significant
Unobservable Inputs ($) | |
Total ($) | |
Bonds | |
Municipal Bonds | | | — | | | | 256,508,089 | | | | — | | | | 256,508,089 | | |
Total Bonds | | | — | | | | 256,508,089 | | | | — | | | | 256,508,089 | | |
Short-Term Securities | |
Municipal Short Term | | | — | | | | 3,020,010 | | | | — | | | | 3,020,010 | | |
Total Short-Term Securities | | | — | | | | 3,020,010 | | | | — | | | | 3,020,010 | | |
Mutual Funds | |
Money Market Funds | | | 533,838 | | | | — | | | | — | | | | 533,838 | | |
Total Mutual Funds | | | 533,838 | | | | — | | | | — | | | | 533,838 | | |
Total | | | 533,838 | | | | 259,528,099 | | | | — | | | | 260,061,937 | | |
See the Portfolio of Investments for all investment classifications not indicated in the table.
The Fund's assets assigned to the Level 2 input category represent certain short-term obligations which are valued using amortized cost, an income approach which converts future cash flows to a present value based upon the discount or premium at purchase.
There were no transfers of financial assets between levels during the period.
The accompanying Notes to Financial Statements are an integral part of this statement.
Annual Report 2014
14
Columbia AMT-Free New York Intermediate Muni Bond Fund
Statement of Assets and Liabilities
October 31, 2014
Assets | |
Investments, at value | |
(identified cost $240,232,404) | | $ | 260,061,937 | | |
Cash | | | 515,524 | | |
Receivable for: | |
Investments sold | | | 3,718,645 | | |
Capital shares sold | | | 278,922 | | |
Interest | | | 3,309,017 | | |
Expense reimbursement due from Investment Manager | | | 1,412 | | |
Prepaid expenses | | | 2,073 | | |
Trustees' deferred compensation plan | | | 35,958 | | |
Total assets | | | 267,923,488 | | |
Liabilities | |
Payable for: | |
Investments purchased on a delayed delivery basis | | | 5,478,045 | | |
Capital shares purchased | | | 80,697 | | |
Dividend distributions to shareholders | | | 709,372 | | |
Investment management fees | | | 2,865 | | |
Distribution and/or service fees | | | 531 | | |
Transfer agent fees | | | 49,996 | | |
Administration fees | | | 500 | | |
Chief compliance officer expenses | | | 12 | | |
Other expenses | | | 31,767 | | |
Trustees' deferred compensation plan | | | 35,958 | | |
Total liabilities | | | 6,389,743 | | |
Net assets applicable to outstanding capital stock | | $ | 261,533,745 | | |
Represented by | |
Paid-in capital | | $ | 243,382,538 | | |
Undistributed net investment income | | | 209,892 | | |
Accumulated net realized loss | | | (1,888,218 | ) | |
Unrealized appreciation (depreciation) on: | |
Investments | | | 19,829,533 | | |
Total — representing net assets applicable to outstanding capital stock | | $ | 261,533,745 | | |
The accompanying Notes to Financial Statements are an integral part of this statement.
Annual Report 2014
15
Columbia AMT-Free New York Intermediate Muni Bond Fund
Statement of Assets and Liabilities (continued)
October 31, 2014
Class A | |
Net assets | | $ | 19,872,675 | | |
Shares outstanding | | | 1,628,176 | | |
Net asset value per share | | $ | 12.21 | | |
Maximum offering price per share(a) | | $ | 12.62 | | |
Class B | |
Net assets | | $ | 90,350 | | |
Shares outstanding | | | 7,403 | | |
Net asset value per share | | $ | 12.20 | | |
Class C | |
Net assets | | $ | 18,832,840 | | |
Shares outstanding | | | 1,543,181 | | |
Net asset value per share | | $ | 12.20 | | |
Class R4 | |
Net assets | | $ | 476,523 | | |
Shares outstanding | | | 39,078 | | |
Net asset value per share | | $ | 12.19 | | |
Class T | |
Net assets | | $ | 7,744,491 | | |
Shares outstanding | | | 634,674 | | |
Net asset value per share | | $ | 12.20 | | |
Maximum offering price per share(a) | | $ | 12.81 | | |
Class Z | |
Net assets | | $ | 214,516,866 | | |
Shares outstanding | | | 17,579,866 | | |
Net asset value per share | | $ | 12.20 | | |
(a) The maximum offering price per share is calculated by dividing the net asset value per share by 1.0 minus the maximum sales charge of 3.25% for Class A and 4.75% for Class T.
The accompanying Notes to Financial Statements are an integral part of this statement.
Annual Report 2014
16
Columbia AMT-Free New York Intermediate Muni Bond Fund
Statement of Operations
Year Ended October 31, 2014
Net investment income | |
Income: | |
Dividends | | $ | 249 | | |
Interest | | | 9,936,044 | | |
Total income | | | 9,936,293 | | |
Expenses: | |
Investment management fees | | | 1,014,210 | | |
Distribution and/or service fees | |
Class A | | | 44,739 | | |
Class B | | | 1,113 | | |
Class C | | | 184,564 | | |
Class T | | | 11,792 | | |
Transfer agent fees | |
Class A | | | 32,917 | | |
Class B | | | 206 | | |
Class C | | | 33,965 | | |
Class R4 | | | 399 | | |
Class T | | | 14,467 | | |
Class Z | | | 384,579 | | |
Administration fees | | | 177,279 | | |
Compensation of board members | | | 27,012 | | |
Custodian fees | | | 2,593 | | |
Printing and postage fees | | | 31,927 | | |
Registration fees | | | 43,620 | | |
Professional fees | | | 31,540 | | |
Chief compliance officer expenses | | | 125 | | |
Other | | | 9,110 | | |
Total expenses | | | 2,046,157 | | |
Fees waived or expenses reimbursed by Investment Manager and its affiliates | | | (536,026 | ) | |
Fees waived by Distributor — Class C | | | (58,408 | ) | |
Expense reductions | | | (160 | ) | |
Total net expenses | | | 1,451,563 | | |
Net investment income | | | 8,484,730 | | |
Realized and unrealized gain (loss) — net | |
Net realized gain (loss) on: | |
Investments | | | (74,284 | ) | |
Net realized loss | | | (74,284 | ) | |
Net change in unrealized appreciation (depreciation) on: | |
Investments | | | 4,317,609 | | |
Net change in unrealized appreciation | | | 4,317,609 | | |
Net realized and unrealized gain | | | 4,243,325 | | |
Net increase in net assets resulting from operations | | $ | 12,728,055 | | |
The accompanying Notes to Financial Statements are an integral part of this statement.
Annual Report 2014
17
Columbia AMT-Free New York Intermediate Muni Bond Fund
Statement of Changes in Net Assets
| | | Year Ended
October 31,
2014 | | Year Ended
October 31,
2013(a) | |
Operations | |
Net investment income | | $ | 8,484,730 | | | $ | 9,732,270 | | |
Net realized loss | | | (74,284 | ) | | | (880,694 | ) | |
Net change in unrealized appreciation (depreciation) | | | 4,317,609 | | | | (13,472,817 | ) | |
Net increase (decrease) in net assets resulting from operations | | | 12,728,055 | | | | (4,621,241 | ) | |
Distributions to shareholders | |
Net investment income | |
Class A | | | (564,925 | ) | | | (667,992 | ) | |
Class B | | | (2,696 | ) | | | (3,285 | ) | |
Class C | | | (503,269 | ) | | | (554,310 | ) | |
Class R4 | | | (7,380 | ) | | | (516 | ) | |
Class T | | | (256,367 | ) | | | (273,862 | ) | |
Class Z | | | (7,126,609 | ) | | | (8,216,843 | ) | |
Total distributions to shareholders | | | (8,461,246 | ) | | | (9,716,808 | ) | |
Decrease in net assets from capital stock activity | | | (2,820,393 | ) | | | (63,809,691 | ) | |
Total increase (decrease) in net assets | | | 1,446,416 | | | | (78,147,740 | ) | |
Net assets at beginning of year | | | 260,087,329 | | | | 338,235,069 | | |
Net assets at end of year | | $ | 261,533,745 | | | $ | 260,087,329 | | |
Undistributed net investment income | | $ | 209,892 | | | $ | 200,086 | | |
(a) Class R4 shares are based on operations from March 19, 2013 (commencement of operations) through the stated period end.
The accompanying Notes to Financial Statements are an integral part of this statement.
Annual Report 2014
18
Columbia AMT-Free New York Intermediate Muni Bond Fund
Statement of Changes in Net Assets (continued)
| | | Year Ended October 31, 2014 | | Year Ended October 31, 2013(a) | |
| | | Shares | | Dollars ($) | | Shares | | Dollars ($) | |
Capital stock activity | |
Class A shares | |
Subscriptions(b) | | | 743,504 | | | | 8,993,582 | | | | 692,122 | | | | 8,554,836 | | |
Distributions reinvested | | | 41,661 | | | | 503,367 | | | | 50,672 | | | | 621,116 | | |
Redemptions | | | (664,352 | ) | | | (8,000,772 | ) | | | (969,546 | ) | | | (11,777,896 | ) | |
Net increase (decrease) | | | 120,813 | | | | 1,496,177 | | | | (226,752 | ) | | | (2,601,944 | ) | |
Class B shares | |
Subscriptions | | | 43 | | | | 525 | | | | 64 | | | | 779 | | |
Distributions reinvested | | | 177 | | | | 2,133 | | | | 197 | | | | 2,426 | | |
Redemptions(b) | | | (2,744 | ) | | | (33,200 | ) | | | (9,526 | ) | | | (119,165 | ) | |
Net decrease | | | (2,524 | ) | | | (30,542 | ) | | | (9,265 | ) | | | (115,960 | ) | |
Class C shares | |
Subscriptions | | | 295,910 | | | | 3,569,528 | | | | 357,122 | | | | 4,399,629 | | |
Distributions reinvested | | | 20,021 | | | | 241,748 | | | | 23,476 | | | | 287,866 | | |
Redemptions | | | (314,800 | ) | | | (3,792,144 | ) | | | (671,942 | ) | | | (8,177,831 | ) | |
Net increase (decrease) | | | 1,131 | | | | 19,132 | | | | (291,344 | ) | | | (3,490,336 | ) | |
Class R4 shares | |
Subscriptions | | | 46,689 | | | | 563,687 | | | | 4,311 | | | | 51,883 | | |
Distributions reinvested | | | 589 | | | | 7,141 | | | | 38 | | | | 458 | | |
Redemptions | | | (11,895 | ) | | | (142,402 | ) | | | (654 | ) | | | (7,787 | ) | |
Net increase | | | 35,383 | | | | 428,426 | | | | 3,695 | | | | 44,554 | | |
Class T shares | |
Subscriptions | | | 2,360 | | | | 28,488 | | | | 4,793 | | | | 59,442 | | |
Distributions reinvested | | | 12,814 | | | | 154,694 | | | | 14,120 | | | | 172,955 | | |
Redemptions | | | (74,038 | ) | | | (889,368 | ) | | | (87,992 | ) | | | (1,080,988 | ) | |
Net decrease | | | (58,864 | ) | | | (706,186 | ) | | | (69,079 | ) | | | (848,591 | ) | |
Class Z shares | |
Subscriptions | | | 2,295,241 | | | | 27,701,774 | | | | 2,524,419 | | | | 31,200,266 | | |
Distributions reinvested | | | 85,230 | | | | 1,029,554 | | | | 99,309 | | | | 1,218,622 | | |
Redemptions | | | (2,727,687 | ) | | | (32,758,728 | ) | | | (7,301,211 | ) | | | (89,216,302 | ) | |
Net decrease | | | (347,216 | ) | | | (4,027,400 | ) | | | (4,677,483 | ) | | | (56,797,414 | ) | |
Total net decrease | | | (251,277 | ) | | | (2,820,393 | ) | | | (5,270,228 | ) | | | (63,809,691 | ) | |
(a) Class R4 shares are based on operations from March 19, 2013 (commencement of operations) through the stated period end.
(b) Includes conversions of Class B shares to Class A shares, if any.
The accompanying Notes to Financial Statements are an integral part of this statement.
Annual Report 2014
19
Columbia AMT-Free New York Intermediate Muni Bond Fund
The following tables are intended to help you understand the Fund's financial performance. Certain information reflects financial results for a single share of a class held for the periods shown. Per share net investment income (loss) amounts are calculated based on average shares outstanding during the period. Total return assumes reinvestment of all dividends and distributions, if any. Total return does not reflect payment of sales charges, if any. Total return and portfolio turnover are not annualized for periods of less than one year. The portfolio turnover rate is calculated without regard to purchase and sales transactions of short-term instruments and certain derivatives, if any. If such transactions were included, the Fund's portfolio turnover rate may be higher.
| | | Year Ended October 31, | |
Class A | | 2014 | | 2013 | | 2012 | | 2011 | | 2010 | |
Per share data | |
Net asset value, beginning of period | | $ | 12.00 | | | $ | 12.55 | | | $ | 12.10 | | | $ | 12.14 | | | $ | 11.76 | | |
Income from investment operations: | |
Net investment income | | | 0.38 | | | | 0.37 | | | | 0.37 | | | | 0.39 | | | | 0.38 | | |
Net realized and unrealized gain (loss) | | | 0.21 | | | | (0.55 | ) | | | 0.45 | | | | (0.04 | ) | | | 0.38 | | |
Total from investment operations | | | 0.59 | | | | (0.18 | ) | | | 0.82 | | | | 0.35 | | | | 0.76 | | |
Less distributions to shareholders: | |
Net investment income | | | (0.38 | ) | | | (0.37 | ) | | | (0.37 | ) | | | (0.39 | ) | | | (0.38 | ) | |
Total distributions to shareholders | | | (0.38 | ) | | | (0.37 | ) | | | (0.37 | ) | | | (0.39 | ) | | | (0.38 | ) | |
Net asset value, end of period | | $ | 12.21 | | | $ | 12.00 | | | $ | 12.55 | | | $ | 12.10 | | | $ | 12.14 | | |
Total return | | | 5.01 | % | | | (1.49 | %) | | | 6.84 | % | | | 2.99 | % | | | 6.59 | % | |
Ratios to average net assets(a) | |
Total gross expenses | | | 0.96 | % | | | 0.95 | % | | | 0.99 | % | | | 0.98 | % | | | 0.93 | % | |
Total net expenses(b) | | | 0.75 | %(c) | | | 0.75 | %(c) | | | 0.75 | %(c) | | | 0.76 | %(c) | | | 0.80 | %(c) | |
Net investment income | | | 3.17 | % | | | 2.98 | % | | | 2.97 | % | | | 3.30 | % | | | 3.20 | % | |
Supplemental data | |
Net assets, end of period (in thousands) | | $ | 19,873 | | | $ | 18,084 | | | $ | 21,764 | | | $ | 15,431 | | | $ | 12,110 | | |
Portfolio turnover | | | 14 | % | | | 13 | % | | | 7 | % | | | 8 | % | | | 10 | % | |
Notes to Financial Highlights
(a) In addition to the fees and expenses that the Fund bears directly, the Fund indirectly bears a pro rata share of the fees and expenses of any other funds in which it invests. Such indirect expenses are not included in the Fund's reported expense ratios.
(b) Total net expenses include the impact of certain fee waivers/expense reimbursements made by the Investment Manager and certain of its affiliates, if applicable.
(c) The benefits derived from expense reductions had an impact of less than 0.01%.
The accompanying Notes to Financial Statements are an integral part of this statement.
Annual Report 2014
20
Columbia AMT-Free New York Intermediate Muni Bond Fund
Financial Highlights (continued)
| | | Year Ended October 31, | |
Class B | | 2014 | | 2013 | | 2012 | | 2011 | | 2010 | |
Per share data | |
Net asset value, beginning of period | | $ | 12.00 | | | $ | 12.55 | | | $ | 12.10 | | | $ | 12.14 | | | $ | 11.76 | | |
Income from investment operations: | |
Net investment income | | | 0.29 | | | | 0.27 | | | | 0.28 | | | | 0.30 | | | | 0.30 | | |
Net realized and unrealized gain (loss) | | | 0.20 | | | | (0.55 | ) | | | 0.44 | | | | (0.04 | ) | | | 0.37 | | |
Total from investment operations | | | 0.49 | | | | (0.28 | ) | | | 0.72 | | | | 0.26 | | | | 0.67 | | |
Less distributions to shareholders: | |
Net investment income | | | (0.29 | ) | | | (0.27 | ) | | | (0.27 | ) | | | (0.30 | ) | | | (0.29 | ) | |
Total distributions to shareholders | | | (0.29 | ) | | | (0.27 | ) | | | (0.27 | ) | | | (0.30 | ) | | | (0.29 | ) | |
Net asset value, end of period | | $ | 12.20 | | | $ | 12.00 | | | $ | 12.55 | | | $ | 12.10 | | | $ | 12.14 | | |
Total return | | | 4.14 | % | | | (2.23 | %) | | | 6.02 | % | | | 2.23 | % | | | 5.80 | % | |
Ratios to average net assets(a) | |
Total gross expenses | | | 1.71 | % | | | 1.70 | % | | | 1.74 | % | | | 1.75 | % | | | 1.68 | % | |
Total net expenses(b) | | | 1.50 | %(c) | | | 1.50 | %(c) | | | 1.50 | %(c) | | | 1.52 | %(c) | | | 1.55 | %(c) | |
Net investment income | | | 2.43 | % | | | 2.21 | % | | | 2.25 | % | | | 2.55 | % | | | 2.47 | % | |
Supplemental data | |
Net assets, end of period (in thousands) | | $ | 90 | | | $ | 119 | | | $ | 241 | | | $ | 459 | | | $ | 1,016 | | |
Portfolio turnover | | | 14 | % | | | 13 | % | | | 7 | % | | | 8 | % | | | 10 | % | |
Notes to Financial Highlights
(a) In addition to the fees and expenses that the Fund bears directly, the Fund indirectly bears a pro rata share of the fees and expenses of any other funds in which it invests. Such indirect expenses are not included in the Fund's reported expense ratios.
(b) Total net expenses include the impact of certain fee waivers/expense reimbursements made by the Investment Manager and certain of its affiliates, if applicable.
(c) The benefits derived from expense reductions had an impact of less than 0.01%.
The accompanying Notes to Financial Statements are an integral part of this statement.
Annual Report 2014
21
Columbia AMT-Free New York Intermediate Muni Bond Fund
Financial Highlights (continued)
| | | Year Ended October 31, | |
Class C | | 2014 | | 2013 | | 2012 | | 2011 | | 2010 | |
Per share data | |
Net asset value, beginning of period | | $ | 12.00 | | | $ | 12.55 | | | $ | 12.10 | | | $ | 12.14 | | | $ | 11.76 | | |
Income from investment operations: | |
Net investment income | | | 0.33 | | | | 0.32 | | | | 0.32 | | | | 0.34 | | | | 0.33 | | |
Net realized and unrealized gain (loss) | | | 0.20 | | | | (0.55 | ) | | | 0.45 | | | | (0.04 | ) | | | 0.39 | | |
Total from investment operations | | | 0.53 | | | | (0.23 | ) | | | 0.77 | | | | 0.30 | | | | 0.72 | | |
Less distributions to shareholders: | |
Net investment income | | | (0.33 | ) | | | (0.32 | ) | | | (0.32 | ) | | | (0.34 | ) | | | (0.34 | ) | |
Total distributions to shareholders | | | (0.33 | ) | | | (0.32 | ) | | | (0.32 | ) | | | (0.34 | ) | | | (0.34 | ) | |
Net asset value, end of period | | $ | 12.20 | | | $ | 12.00 | | | $ | 12.55 | | | $ | 12.10 | | | $ | 12.14 | | |
Total return | | | 4.47 | % | | | (1.88 | %) | | | 6.41 | % | | | 2.57 | % | | | 6.16 | % | |
Ratios to average net assets(a) | |
Total gross expenses | | | 1.71 | % | | | 1.70 | % | | | 1.74 | % | | | 1.73 | % | | | 1.67 | % | |
Total net expenses(b) | | | 1.18 | %(c) | | | 1.15 | %(c) | | | 1.15 | %(c) | | | 1.16 | %(c) | | | 1.20 | %(c) | |
Net investment income | | | 2.74 | % | | | 2.58 | % | | | 2.57 | % | | | 2.89 | % | | | 2.77 | % | |
Supplemental data | |
Net assets, end of period (in thousands) | | $ | 18,833 | | | $ | 18,498 | | | $ | 23,008 | | | $ | 14,355 | | | $ | 12,224 | | |
Portfolio turnover | | | 14 | % | | | 13 | % | | | 7 | % | | | 8 | % | | | 10 | % | |
Notes to Financial Highlights
(a) In addition to the fees and expenses that the Fund bears directly, the Fund indirectly bears a pro rata share of the fees and expenses of any other funds in which it invests. Such indirect expenses are not included in the Fund's reported expense ratios.
(b) Total net expenses include the impact of certain fee waivers/expense reimbursements made by the Investment Manager and certain of its affiliates, if applicable.
(c) The benefits derived from expense reductions had an impact of less than 0.01%.
The accompanying Notes to Financial Statements are an integral part of this statement.
Annual Report 2014
22
Columbia AMT-Free New York Intermediate Muni Bond Fund
Financial Highlights (continued)
| | | Year Ended October 31, | |
Class R4 | | 2014 | | 2013(a) | |
Per share data | |
Net asset value, beginning of period | | $ | 11.99 | | | $ | 12.42 | | |
Income from investment operations: | |
Net investment income | | | 0.41 | | | | 0.25 | | |
Net realized and unrealized gain (loss) | | | 0.20 | | | | (0.43 | ) | |
Total from investment operations | | | 0.61 | | | | (0.18 | ) | |
Less distributions to shareholders: | |
Net investment income | | | (0.41 | ) | | | (0.25 | ) | |
Total distributions to shareholders | | | (0.41 | ) | | | (0.25 | ) | |
Net asset value, end of period | | $ | 12.19 | | | $ | 11.99 | | |
Total return | | | 5.19 | % | | | (1.48 | %) | |
Ratios to average net assets(b) | |
Total gross expenses | | | 0.72 | % | | | 0.67 | %(c) | |
Total net expenses(d) | | | 0.50 | %(e) | | | 0.50 | %(c)(e) | |
Net investment income | | | 3.39 | % | | | 3.43 | %(c) | |
Supplemental data | |
Net assets, end of period (in thousands) | | $ | 477 | | | $ | 44 | | |
Portfolio turnover | | | 14 | % | | | 13 | % | |
Notes to Financial Highlights
(a) Based on operations from March 19, 2013 (commencement of operations) through the stated period end.
(b) In addition to the fees and expenses that the Fund bears directly, the Fund indirectly bears a pro rata share of the fees and expenses of any other funds in which it invests. Such indirect expenses are not included in the Fund's reported expense ratios.
(c) Annualized.
(d) Total net expenses include the impact of certain fee waivers/expense reimbursements made by the Investment Manager and certain of its affiliates, if applicable.
(e) The benefits derived from expense reductions had an impact of less than 0.01%.
The accompanying Notes to Financial Statements are an integral part of this statement.
Annual Report 2014
23
Columbia AMT-Free New York Intermediate Muni Bond Fund
Financial Highlights (continued)
| | | Year Ended October 31, | |
Class T | | 2014 | | 2013 | | 2012 | | 2011 | | 2010 | |
Per share data | |
Net asset value, beginning of period | | $ | 11.99 | | | $ | 12.55 | | | $ | 12.10 | | | $ | 12.14 | | | $ | 11.76 | | |
Income from investment operations: | |
Net investment income | | | 0.39 | | | | 0.38 | | | | 0.38 | | | | 0.40 | | | | 0.40 | | |
Net realized and unrealized gain (loss) | | | 0.21 | | | | (0.56 | ) | | | 0.45 | | | | (0.04 | ) | | | 0.38 | | |
Total from investment operations | | | 0.60 | | | | (0.18 | ) | | | 0.83 | | | | 0.36 | | | | 0.78 | | |
Less distributions to shareholders: | |
Net investment income | | | (0.39 | ) | | | (0.38 | ) | | | (0.38 | ) | | | (0.40 | ) | | | (0.40 | ) | |
Total distributions to shareholders | | | (0.39 | ) | | | (0.38 | ) | | | (0.38 | ) | | | (0.40 | ) | | | (0.40 | ) | |
Net asset value, end of period | | $ | 12.20 | | | $ | 11.99 | | | $ | 12.55 | | | $ | 12.10 | | | $ | 12.14 | | |
Total return | | | 5.12 | % | | | (1.47 | %) | | | 6.95 | % | | | 3.09 | % | | | 6.69 | % | |
Ratios to average net assets(a) | |
Total gross expenses | | | 0.86 | % | | | 0.85 | % | | | 0.90 | % | | | 0.89 | % | | | 0.83 | % | |
Total net expenses(b) | | | 0.65 | %(c) | | | 0.65 | %(c) | | | 0.65 | %(c) | | | 0.67 | %(c) | | | 0.70 | %(c) | |
Net investment income | | | 3.27 | % | | | 3.08 | % | | | 3.08 | % | | | 3.40 | % | | | 3.31 | % | |
Supplemental data | |
Net assets, end of period (in thousands) | | $ | 7,744 | | | $ | 8,319 | | | $ | 9,570 | | | $ | 9,420 | | | $ | 10,969 | | |
Portfolio turnover | | | 14 | % | | | 13 | % | | | 7 | % | | | 8 | % | | | 10 | % | |
Notes to Financial Highlights
(a) In addition to the fees and expenses that the Fund bears directly, the Fund indirectly bears a pro rata share of the fees and expenses of any other funds in which it invests. Such indirect expenses are not included in the Fund's reported expense ratios.
(b) Total net expenses include the impact of certain fee waivers/expense reimbursements made by the Investment Manager and certain of its affiliates, if applicable.
(c) The benefits derived from expense reductions had an impact of less than 0.01%.
The accompanying Notes to Financial Statements are an integral part of this statement.
Annual Report 2014
24
Columbia AMT-Free New York Intermediate Muni Bond Fund
Financial Highlights (continued)
| | | Year Ended October 31, | |
Class Z | | 2014 | | 2013 | | 2012 | | 2011 | | 2010 | |
Per share data | |
Net asset value, beginning of period | | $ | 11.99 | | | $ | 12.55 | | | $ | 12.10 | | | $ | 12.14 | | | $ | 11.76 | | |
Income from investment operations: | |
Net investment income | | | 0.41 | | | | 0.40 | | | | 0.40 | | | | 0.42 | | | | 0.41 | | |
Net realized and unrealized gain (loss) | | | 0.21 | | | | (0.56 | ) | | | 0.45 | | | | (0.04 | ) | | | 0.38 | | |
Total from investment operations | | | 0.62 | | | | (0.16 | ) | | | 0.85 | | | | 0.38 | | | | 0.79 | | |
Less distributions to shareholders: | |
Net investment income | | | (0.41 | ) | | | (0.40 | ) | | | (0.40 | ) | | | (0.42 | ) | | | (0.41 | ) | |
Total distributions to shareholders | | | (0.41 | ) | | | (0.40 | ) | | | (0.40 | ) | | | (0.42 | ) | | | (0.41 | ) | |
Net asset value, end of period | | $ | 12.20 | | | $ | 11.99 | | | $ | 12.55 | | | $ | 12.10 | | | $ | 12.14 | | |
Total return | | | 5.27 | % | | | (1.32 | %) | | | 7.11 | % | | | 3.24 | % | | | 6.85 | % | |
Ratios to average net assets(a) | |
Total gross expenses | | | 0.71 | % | | | 0.70 | % | | | 0.74 | % | | | 0.73 | % | | | 0.68 | % | |
Total net expenses(b) | | | 0.50 | %(c) | | | 0.50 | %(c) | | | 0.50 | %(c) | | | 0.52 | %(c) | | | 0.55 | %(c) | |
Net investment income | | | 3.42 | % | | | 3.22 | % | | | 3.23 | % | | | 3.55 | % | | | 3.46 | % | |
Supplemental data | |
Net assets, end of period (in thousands) | | $ | 214,517 | | | $ | 215,024 | | | $ | 283,653 | | | $ | 258,766 | | | $ | 292,941 | | |
Portfolio turnover | | | 14 | % | | | 13 | % | | | 7 | % | | | 8 | % | | | 10 | % | |
Notes to Financial Highlights
(a) In addition to the fees and expenses that the Fund bears directly, the Fund indirectly bears a pro rata share of the fees and expenses of any other funds in which it invests. Such indirect expenses are not included in the Fund's reported expense ratios.
(b) Total net expenses include the impact of certain fee waivers/expense reimbursements made by the Investment Manager and certain of its affiliates, if applicable.
(c) The benefits derived from expense reductions had an impact of less than 0.01%.
The accompanying Notes to Financial Statements are an integral part of this statement.
Annual Report 2014
25
Columbia AMT-Free New York Intermediate Muni Bond Fund
Notes to Financial Statements
October 31, 2014
Note 1. Organization
Columbia AMT-Free New York Intermediate Muni Bond Fund (formerly known as Columbia New York Intermediate Municipal Bond Fund) (the Fund), a series of Columbia Funds Series Trust I (the Trust), is a non-diversified fund. The Trust is registered under the Investment Company Act of 1940, as amended (the 1940 Act), as an open-end management investment company organized as a Massachusetts business trust. Effective July 7, 2014, Columbia New York Intermediate Municipal Bond Fund was renamed Columbia AMT-Free New York Intermediate Muni Bond Fund.
Fund Shares
The Trust may issue an unlimited number of shares (without par value). The Fund offers Class A, Class B, Class C, Class R4, Class T and Class Z shares. Although all share classes generally have identical voting, dividend and liquidation rights, each share class votes separately when required by the Trust's organizational documents or by law. Different share classes pay different distribution amounts to the extent the expenses of such share classes differ, and distributions in liquidation will be proportional to the net asset value of each share class. Each share class has its own expense structure and sales charges.
Class A shares are subject to a maximum front-end sales charge of 3.25% based on the initial investment amount. Class A shares purchased without an initial sales charge in accounts aggregating $1 million to $50 million at the time of purchase are subject to a contingent deferred sales charge (CDSC) if the shares are sold within 18 months of purchase, charged as follows: 1.00% CDSC if redeemed within 12 months of purchase, and 0.50% CDSC if redeemed more than 12, but less than 18, months after purchase.
Class B shares may be subject to a maximum CDSC of 3.00% based upon the holding period after purchase. Class B shares will generally convert to Class A shares eight years after purchase. The Fund no longer accepts investments by new or existing investors in the Fund's Class B shares, except in connection with the reinvestment of any dividend and/or capital gain distributions in Class B shares of the Fund and exchanges by existing Class B shareholders of certain other funds within the Columbia Family of Funds.
Class C shares are subject to a 1.00% CDSC on shares redeemed within one year of purchase.
Class R4 shares are not subject to sales charges and are generally available only to omnibus retirement plans and certain investors as described in the Fund's prospectus.
Class T shares are subject to a maximum front-end sales charge of 4.75% based on the investment amount. Class T shares purchased without an initial sales charge in accounts
aggregating $1 million to $50 million at the time of purchase are subject to a CDSC if the shares are sold within 18 months of purchase, charged as follows: 1.00% CDSC if redeemed within 12 months of purchase, and 0.50% CDSC if redeemed more than 12, but less than 18, months after purchase. Class T shares are available only to investors who received (and who have continuously held) Class T shares in connection with previous fund reorganizations.
Class Z shares are not subject to sales charges and are available only to eligible investors, which are subject to different investment minimums as described in the Fund's prospectus.
Note 2. Summary of Significant Accounting Policies
Basis of Preparation
The Fund is an investment company that applies the accounting and reporting guidance in the Financial Accounting Standards Board (FASB) Accounting Standards Codification Topic 946, Financial Services — Investment Companies (ASC 946). The financial statements are prepared in accordance with U.S. generally accepted accounting principles (GAAP) which requires management to make certain estimates and assumptions that affect the reported amounts of assets and liabilities, the disclosure of contingent assets and liabilities at the date of the financial statements and the reported amounts of income and expenses during the reporting period. Actual results could differ from those estimates.
The following is a summary of significant accounting policies followed by the Fund in the preparation of its financial statements.
Security Valuation
Debt securities generally are valued by pricing services approved by the Board of Trustees (the Board) based upon market transactions for normal, institutional-size trading units of similar securities. The services may use various pricing techniques that take into account, as applicable, factors such as yield, quality, coupon rate, maturity, type of issue, trading characteristics and other data, as well as broker quotes. Debt securities for which quotations are readily available may also be valued based upon an over-the-counter or exchange bid quotation.
Investments in open-end investment companies, including money market funds, are valued at their net asset value.
Short-term securities within 60 days to maturity are valued at amortized cost, which approximates market value. Short-term securities maturing in more than 60 days from the valuation
Annual Report 2014
26
Columbia AMT-Free New York Intermediate Muni Bond Fund
Notes to Financial Statements (continued)
October 31, 2014
date are valued at the market price or approximate market value based on current interest rates.
Investments for which market quotations are not readily available, or that have quotations which management believes are not reliable, are valued at fair value as determined in good faith under procedures established by and under the general supervision of the Board. If a security or class of securities (such as foreign securities) is valued at fair value, such value is likely to be different from the quoted or published price for the security.
The determination of fair value often requires significant judgment. To determine fair value, management may use assumptions including but not limited to future cash flows and estimated risk premiums. Multiple inputs from various sources may be used to determine fair value.
Delayed Delivery Securities
The Fund may trade securities on other than normal settlement terms, including securities purchased or sold on a "when-issued" basis. This may increase risk to the Fund since the other party to the transaction may fail to deliver which could cause the Fund to subsequently invest at less advantageous prices. The Fund designates cash or liquid securities in an amount equal to the delayed delivery commitment.
Security Transactions
Security transactions are accounted for on the trade date. Cost is determined and gains (losses) are based upon the specific identification method for both financial statement and federal income tax purposes.
Income Recognition
Interest income is recorded on an accrual basis. Market premiums and discounts, including original issue discounts, are amortized and accreted, respectively, over the expected life of the security on all debt securities, unless otherwise noted.
The Fund may place a debt security on non-accrual status and reduce related interest income when it becomes probable that the interest will not be collected and the amount of uncollectible interest can be reasonably estimated. A defaulted debt security is removed from non-accrual status when the issuer resumes interest payments or when collectability of interest is reasonably assured.
Dividend income is recorded on the ex-dividend date.
Expenses
General expenses of the Trust are allocated to the Fund and other funds of the Trust based upon relative net assets or other expense allocation methodologies determined by the nature of the expense. Expenses directly attributable to the Fund are
charged to the Fund. Expenses directly attributable to a specific class of shares are charged to that share class.
Determination of Class Net Asset Value
All income, expenses (other than class-specific expenses, which are charged to that share class, as shown in the Statement of Operations) and realized and unrealized gains (losses) are allocated to each class of the Fund on a daily basis, based on the relative net assets of each class, for purposes of determining the net asset value of each class.
Federal Income Tax Status
The Fund intends to qualify each year as a regulated investment company under Subchapter M of the Internal Revenue Code, as amended, and will distribute substantially all of its tax exempt and taxable income (including net short-term capital gains), if any, for its tax year, and as such will not be subject to federal income taxes. In addition, the Fund intends to distribute in each calendar year substantially all of its net investment income, capital gains and certain other amounts, if any, such that the Fund should not be subject to federal excise tax. Therefore, no federal income or excise tax provision is recorded.
Distributions to Shareholders
Distributions from net investment income, if any, are declared daily and paid monthly. Net realized capital gains, if any, are distributed at least annually. Income distributions and capital gain distributions are determined in accordance with federal income tax regulations, which may differ from GAAP.
Guarantees and Indemnifications
Under the Trust's organizational documents and, in some cases, by contract, its officers and trustees are indemnified against certain liabilities arising out of the performance of their duties to the Trust or its funds. In addition, certain of the Fund's contracts with its service providers contain general indemnification clauses. The Fund's maximum exposure under these arrangements is unknown since the amount of any future claims that may be made against the Fund cannot be determined, and the Fund has no historical basis for predicting the likelihood of any such claims.
Note 3. Fees and Compensation Paid to Affiliates
Investment Management Fees
Under an Investment Management Services Agreement, Columbia Management Investment Advisers, LLC (the Investment Manager), a wholly-owned subsidiary of Ameriprise Financial, Inc. (Ameriprise Financial), determines which securities will be purchased, held or sold. The
Annual Report 2014
27
Columbia AMT-Free New York Intermediate Muni Bond Fund
Notes to Financial Statements (continued)
October 31, 2014
investment management fee is an annual fee that is equal to a percentage of the Fund's average daily net assets that declines from 0.40% to 0.27% as the Fund's net assets increase. The effective investment management fee rate for the year ended October 31, 2014 was 0.40% of the Fund's average daily net assets.
Administration Fees
Under an Administrative Services Agreement, the Investment Manager also serves as the Fund Administrator. The Fund pays the Fund Administrator an annual fee for administration and accounting services equal to a percentage of the Fund's average daily net assets that declines from 0.07% to 0.04% as the Fund's net assets increase. The effective administration fee rate for the year ended October 31, 2014 was 0.07% of the Fund's average daily net assets.
Compensation of Board Members
Board members are compensated for their services to the Fund as disclosed in the Statement of Operations. The Trust's eligible Trustees may participate in a Deferred Compensation Plan (the Plan) which may be terminated at any time. Obligations of the Plan will be paid solely out of the Fund's assets.
Compensation of Chief Compliance Officer
The Board has appointed a Chief Compliance Officer to the Fund in accordance with federal securities regulations. The Fund pays its pro-rata share of the expenses associated with the Chief Compliance Officer. The Fund's expenses for the Chief Compliance Officer will not exceed $15,000 per year.
Transfer Agent Fees
Under a Transfer and Dividend Disbursing Agent Agreement, Columbia Management Investment Services Corp. (the Transfer Agent), an affiliate of the Investment Manager and a wholly-owned subsidiary of Ameriprise Financial, is responsible for providing transfer agency services to the Fund. The Transfer Agent has contracted with Boston Financial Data Services (BFDS) to serve as sub-transfer agent.
Effective November 1, 2014, the Transfer Agent receives a monthly transfer agency fee based on the number or the average value of accounts, depending on the type of account. Prior to November 1, 2014, the Transfer Agent received a monthly account-based service fee based on the number of open accounts. In addition, the Transfer Agent also receives sub-transfer agency fees based on a percentage of the average aggregate value of the Fund's shares maintained in omnibus accounts (other than omnibus accounts for which American Enterprise Investment Services Inc. is the broker of record or accounts where the beneficial shareholder is a customer of Ameriprise Financial Services, Inc., which receive a per
account fee). The Transfer Agent pays the fees of BFDS for services as sub-transfer agent and is not entitled to reimbursement for such fees from the Fund (with the exception of out-of-pocket fees).
The Transfer Agent also receives compensation from the Fund for various shareholder services and reimbursements for certain out-of-pocket fees.
For the year ended October 31, 2014, the Fund's effective transfer agent fee rates as a percentage of average daily net assets of each class were as follows:
Class A | | | 0.18 | % | |
Class B | | | 0.18 | | |
Class C | | | 0.18 | | |
Class R4 | | | 0.18 | | |
Class T | | | 0.18 | | |
Class Z | | | 0.18 | | |
An annual minimum account balance fee of $20 may apply to certain accounts with a value below the applicable share class's initial minimum investment requirements to reduce the impact of small accounts on transfer agent fees. These minimum account balance fees are remitted to the Fund and recorded as part of expense reductions in the Statement of Operations. For the year ended October 31, 2014, these minimum account balance fees reduced total expenses of the Fund by $160.
Distribution and Service Fees
The Fund has an agreement with Columbia Management Investment Distributors, Inc. (the Distributor), an affiliate of the Investment Manager and a wholly-owned subsidiary of Ameriprise Financial, for distribution and shareholder services. The Board has approved, and the Fund has adopted, distribution and shareholder service plans (the Plans) applicable to certain share classes, which set the distribution and service fees for the Fund. These fees are calculated daily and are intended to compensate the Distributor and/or eligible selling and/or servicing agents for selling shares of the Fund and providing services to investors.
Under the Plans, the Fund pays a monthly service fee to the Distributor at the maximum annual rate of 0.25% of the average daily net assets attributable to Class A, Class B and Class C shares of the Fund. Also under the Plans, the Fund pays a monthly distribution fee to the Distributor at the maximum annual rate of 0.75% of the average daily net assets attributable to Class B and Class C shares only.
Effective March 1, 2014, the Distributor has voluntarily agreed to waive a portion of the distribution fee for Class C shares so that the distribution fee does not exceed 0.45% annually of the average daily net assets attributable to Class C
Annual Report 2014
28
Columbia AMT-Free New York Intermediate Muni Bond Fund
Notes to Financial Statements (continued)
October 31, 2014
shares. This arrangement may be modified or terminated by the Distributor at any time. Prior to March 1, 2014, the Distributor voluntarily waived a portion of the distribution fee for Class C shares so that the distribution fee did not exceed 0.40% annually of the average daily net assets attributable to Class C shares.
Shareholder Services Fees
The Fund has adopted a shareholder services plan that permits it to pay for certain services provided to Class T shareholders by their selling and/or servicing agents. The Fund may pay shareholder servicing fees up to an aggregate annual rate of 0.40% of the Fund's average daily net assets attributable to Class T shares (comprised of up to 0.20% for shareholder liaison services and up to 0.20% for administrative support services). These fees are currently limited to an aggregate annual rate of not more than 0.15% of the Fund's average daily net assets attributable to Class T shares. In addition, the servicing fee for Class T shares will be waived by selling and/or servicing agents to the extent necessary to prevent the net investment income for the Class T shares from falling below 0.00% on a daily basis. The shareholder services fee for the year ended October 31, 2014 was 0.15% of the Fund's average daily net assets attributable to Class T shares.
Sales Charges
Sales charges, including front-end charges and CDSCs, received by the Distributor for distributing Fund shares were $24,092 for Class A, $649 for Class C and $28 for Class T shares for the year ended October 31, 2014.
Expenses Waived/Reimbursed by the Investment Manager and its Affiliates
The Investment Manager and certain of its affiliates have contractually agreed to waive fees and/or reimburse expenses (excluding certain fees and expenses described below), for the period disclosed below, unless sooner terminated at the sole discretion of the Board, so that the Fund's net operating expenses, after giving effect to fees waived/expenses reimbursed and any balance credits and/or overdraft charges from the Fund's custodian, do not exceed the following annual rates as a percentage of the class' average daily net assets:
| | | Fee Rates Contractual
through
February 28, 2015 | |
Class A | | | 0.75 | % | |
Class B | | | 1.50 | | |
Class C | | | 1.50 | | |
Class R4 | | | 0.50 | | |
Class T | | | 0.65 | | |
Class Z | | | 0.50 | | |
Under the agreement governing these fee waivers and/or expense reimbursement arrangements, the following fees and expenses are excluded from the waiver/reimbursement commitment, and therefore will be paid by the Fund, if applicable: taxes (including foreign transaction taxes), expenses associated with investments in affiliated and non-affiliated pooled investment vehicles (including mutual funds and exchange-traded funds), transaction costs and brokerage commissions, costs related to any securities lending program, dividend expenses associated with securities sold short, inverse floater program fees and expenses, transaction charges and interest on borrowed money, interest, extraordinary expenses and any other expenses the exclusion of which is specifically approved by the Board. This agreement may be modified or amended only with approval from all parties. Class C distribution fees waived by the Distributor, as discussed above, are in addition to the waiver/reimbursement commitment under the agreement.
Note 4. Federal Tax Information
The timing and character of income and capital gain distributions are determined in accordance with income tax regulations, which may differ from GAAP because of temporary or permanent book to tax differences.
At October 31, 2014, these differences are primarily due to differing treatment for capital loss carryforwards, principal and/or interest from fixed income securities, Trustees' deferred compensation and distributions. To the extent these differences are permanent, reclassifications are made among the components of the Fund's net assets in the Statement of Assets and Liabilities. Temporary differences do not require reclassifications. In the Statement of Assets and Liabilities the following reclassifications were made:
Undistributed net investment income | | $ | (13,678 | ) | |
Accumulated net realized loss | | | 13,676 | | |
Paid-in capital | | | 2 | | |
Net investment income (loss) and net realized gains (losses), as disclosed in the Statement of Operations, and net assets were not affected by this reclassification.
The tax character of distributions paid during the years indicated was as follows:
Year Ended October 31, | | 2014 | | 2013 | |
Ordinary income | | $ | — | | | $ | 6,463 | | |
Tax-exempt income | | | 8,461,246 | | | | 9,710,345 | | |
Total | | $ | 8,461,246 | | | $ | 9,716,808 | | |
Short-term capital gain distributions, if any, are considered ordinary income distributions for tax purposes.
Annual Report 2014
29
Columbia AMT-Free New York Intermediate Muni Bond Fund
Notes to Financial Statements (continued)
October 31, 2014
At October 31, 2014, the components of distributable earnings on a tax basis were as follows:
Undistributed tax-exempt income | | $ | 845,988 | | |
Capital loss carryforwards | | | (1,888,218 | ) | |
Net unrealized appreciation | | | 19,938,767 | | |
At October 31, 2014, the cost of investments for federal income tax purposes was $240,123,170 and the aggregate gross unrealized appreciation and depreciation based on that cost was:
Unrealized appreciation | | $ | 20,000,228 | | |
Unrealized depreciation | | | (61,461 | ) | |
Net unrealized appreciation | | $ | 19,938,767 | | |
The following capital loss carryforwards, determined at October 31, 2014, may be available to reduce taxable income arising from future net realized gains on investments, if any, to the extent permitted by the Internal Revenue Code:
Year of Expiration | | Amount ($) | |
2017 | | | 946,916 | | |
No expiration — short-term | | | 941,302 | | |
Total | | | 1,888,218 | | |
Capital loss carryforwards with no expiration are required to be utilized prior to any capital losses which carry an expiration date. As a result of this ordering rule, capital loss carryforwards which carry an expiration date may be more likely to expire unused.
Management of the Fund has concluded that there are no significant uncertain tax positions in the Fund that would require recognition in the financial statements. However, management's conclusion may be subject to review and adjustment at a later date based on factors including, but not limited to, new tax laws, regulations, and administrative interpretations (including relevant court decisions). Generally, the Fund's federal tax returns for the prior three fiscal years remain subject to examination by the Internal Revenue Service.
Note 5. Portfolio Information
The cost of purchases and proceeds from sales of securities, excluding short-term obligations and certain derivatives, if any, aggregated to $34,701,773 and $35,215,111, respectively, for the year ended October 31, 2014. The amount of purchase and sale activity impacts the portfolio turnover rate reported in the Financial Highlights.
Note 6. Shareholder Concentration
At October 31, 2014, one unaffiliated shareholder of record owned 69.8% of the outstanding shares of the Fund in one or more accounts. The Fund has no knowledge about whether any
portion of those shares was owned beneficially. Subscription and redemption activity by concentrated accounts may have a significant effect on the operations of the Fund.
Note 7. Line of Credit
The Fund has entered into a revolving credit facility with a syndicate of banks led by JPMorgan Chase Bank N.A. (JPMorgan) whereby the Fund may borrow for the temporary funding of shareholder redemptions or for other temporary or emergency purposes. The credit facility agreement, as amended, which is a collective agreement between the Fund and certain other funds managed by the Investment Manager, severally and not jointly, permits collective borrowings up to $500 million. Interest is charged to each participating fund based on its borrowings at a rate equal to the higher of (i) the overnight federal funds rate plus 1.00% or (ii) the one-month LIBOR rate plus 1.00%. Each borrowing under the credit facility matures no later than 60 days after the date of borrowing. Effective December 10, 2013, the Fund also pays a commitment fee equal to its pro rata share of the amount of the credit facility at a rate of 0.075% per annum. Prior to December 10, 2013, the commitment fee was charged at the annual rate of 0.08% per annum. The commitment fee is included in other expenses in the Statement of Operations.
Effective December 9, 2014, the Fund extended its revolving credit facility with JPMorgan. The credit facility agreement, as amended, permits collective borrowings up to $550 million under the same terms and interest rates as described above.
The Fund had no borrowings during the year ended October 31, 2014.
Note 8. Significant Risks
Credit Risk
Credit risk is the risk that the value of debt securities in the Fund's portfolio may decline because the issuer may default and fail to pay interest or repay principal when due. Rating agencies assign credit ratings to debt securities to indicate their credit risk. Lower rated or unrated debt securities held by the Fund may present increased credit risk as compared to higher-rated debt securities.
Interest Rate Risk
Interest rate risk is the risk of losses attributable to changes in interest rates. In general, if prevailing interest rates rise, the values of debt securities tend to fall, and if interest rates fall, the values of debt securities tend to rise. Actions by governments and central banking authorities can result in increases in interest rates. Increasing interest rates may negatively affect the value of debt securities held by the Fund, resulting in a negative impact on the Fund's performance and
Annual Report 2014
30
Columbia AMT-Free New York Intermediate Muni Bond Fund
Notes to Financial Statements (continued)
October 31, 2014
net asset value per share. In general, the longer the maturity or duration of a debt security, the greater its sensitivity to changes in interest rates.
Liquidity Risk
Liquidity risk is the risk associated with a lack of marketability of investments which may make it difficult to sell the investment at a desirable time or price. Changing regulatory, market or other conditions or environments (for example, the interest rate or credit environments) may adversely affect the liquidity of the Fund's investments. The Fund may have to accept a lower selling price for the holding, sell other investments, or forego another, more appealing investment opportunity. Generally, the less liquid the market at the time the Fund sells a portfolio investment, the greater the risk of loss or decline of value to the Fund. A less liquid market can lead to an increase in Fund redemptions, which may negatively impact Fund performance and net asset value per share, including, for example, if the Fund is forced to sell securities in a down market.
Geographic Concentration Risk
Because state-specific tax-exempt funds invest primarily in the municipal securities issued by the state and political sub-divisions of the state, the Fund will be particularly affected by political and economic conditions and developments in the state in which it invests. The Fund may, therefore, have a greater risk than that of a municipal bond fund which is more geographically diversified. The value of the municipal securities owned by the Fund also may be adversely affected by future changes in federal or state income tax laws.
Non-Diversification Risk
A non-diversified fund is permitted to invest a greater percentage of its total assets in fewer issuers than a diversified fund. The Fund may, therefore, have a greater risk of loss from a few issuers than a similar fund that invests more broadly.
Note 9. Subsequent Events
Management has evaluated the events and transactions that have occurred through the date the financial statements were issued. Other than as noted in Notes 3 and 7 above, there were no items requiring adjustment of the financial statements or additional disclosure.
Note 10. Information Regarding Pending and Settled Legal Proceedings
In December 2005, without admitting or denying the allegations, American Express Financial Corporation (AEFC, which is now known as Ameriprise Financial, Inc. (Ameriprise Financial)) entered into settlement agreements with the
Securities and Exchange Commission (SEC) and Minnesota Department of Commerce (MDOC) related to market timing activities. As a result, AEFC was censured and ordered to cease and desist from committing or causing any violations of certain provisions of the Investment Advisers Act of 1940, the Investment Company Act of 1940, and various Minnesota laws. AEFC agreed to pay disgorgement of $10 million and civil money penalties of $7 million. AEFC also agreed to retain an independent distribution consultant to assist in developing a plan for distribution of all disgorgement and civil penalties ordered by the SEC in accordance with various undertakings detailed at www.sec.gov/litigation/admin/ia-2451.pdf. Ameriprise Financial and its affiliates have cooperated with the SEC and the MDOC in these legal proceedings, and have made regular reports to the Funds' Boards of Trustees.
Ameriprise Financial and certain of its affiliates have historically been involved in a number of legal, arbitration and regulatory proceedings, including routine litigation, class actions, and governmental actions, concerning matters arising in connection with the conduct of their business activities. Ameriprise Financial believes that the Funds are not currently the subject of, and that neither Ameriprise Financial nor any of its affiliates are the subject of, any pending legal, arbitration or regulatory proceedings that are likely to have a material adverse effect on the Funds or the ability of Ameriprise Financial or its affiliates to perform under their contracts with the Funds. Ameriprise Financial is required to make quarterly (10-Q), annual (10-K) and, as necessary, 8-K filings with the Securities and Exchange Commission on legal and regulatory matters that relate to Ameriprise Financial and its affiliates. Copies of these filings may be obtained by accessing the SEC website at www.sec.gov.
There can be no assurance that these matters, or the adverse publicity associated with them, will not result in increased fund redemptions, reduced sale of fund shares or other adverse consequences to the Funds. Further, although we believe proceedings are not likely to have a material adverse effect on the Funds or the ability of Ameriprise Financial or its affiliates to perform under their contracts with the Funds, these proceedings are subject to uncertainties and, as such, we are unable to estimate the possible loss or range of loss that may result. An adverse outcome in one or more of these proceedings could result in adverse judgments, settlements, fines, penalties or other relief that could have a material adverse effect on the consolidated financial condition or results of operations of Ameriprise Financial.
Annual Report 2014
31
Columbia AMT-Free New York Intermediate Muni Bond Fund
Report of Independent Registered Public Accounting Firm
To the Trustees of Columbia Funds Series Trust I and the Shareholders of
Columbia AMT-Free New York Intermediate Muni Bond Fund (formerly
Columbia New York Intermediate Municipal Bond Fund)
In our opinion, the accompanying statement of assets and liabilities, including the portfolio of investments, and the related statements of operations and of changes in net assets and the financial highlights present fairly, in all material respects, the financial position of Columbia AMT-Free New York Intermediate Muni Bond Fund (formerly Columbia New York Intermediate Municipal Bond Fund) (the "Fund", a series of Columbia Funds Series Trust I) at October 31, 2014, and the results of its operations, the changes in its net assets and the financial highlights for each of the periods indicated, in conformity with accounting principles generally accepted in the United States of America. These financial statements and financial highlights (hereafter referred to as "financial statements") are the responsibility of the Fund's management. Our responsibility is to express an opinion on these financial statements based on our audits. We conducted our audits of these financial statements in accordance with the standards of the Public Company Accounting Oversight Board (United States). Those standards require that we plan and perform the audit to obtain reasonable assurance about whether the financial statements are free of material misstatement. An audit includes examining, on a test basis, evidence supporting the amounts and disclosures in the financial statements, assessing the accounting principles used and significant estimates made by management, and evaluating the overall financial statement presentation. We believe that our audits, which included confirmation of securities at October 31, 2014 by correspondence with the custodian and brokers, provide a reasonable basis for our opinion.
PricewaterhouseCoopers LLP
Minneapolis, Minnesota
December 22, 2014
Annual Report 2014
32
Columbia AMT-Free New York Intermediate Muni Bond Fund
Federal Income Tax Information
(Unaudited)
The Fund hereby designates the following tax attributes for the fiscal year ended October 31, 2014. Shareholders will be notified in early 2015 of the amounts for use in preparing 2014 income tax returns.
Tax Designations:
Capital Gain Dividend | | $ | 8,461,246 | | |
| Exempt-Interest Dividends | | | 100.00 | % | |
Capital Gain Dividend. The Fund designates as a capital gain dividend the amount reflected above, or if subsequently determined to be different, the net capital gain of such fiscal period.
Exempt-Interest Dividends. The percentage of net investment income distributed during the fiscal year that qualifies as exempt-interest dividends for federal income tax purposes.
Annual Report 2014
33
Columbia AMT-Free New York Intermediate Muni Bond Fund
The Trustees serve terms of indefinite duration. The names, addresses and birth years of the Trustees and Officers of the Funds in Columbia Funds Series Trust I, the year each was first elected or appointed to office, their principal business occupations during at least the last five years, the number of Funds overseen by each Trustee and other directorships they hold are shown below. Each officer listed below serves as an officer of each Fund in Columbia Funds Series Trust I.
Independent Trustees
Name, Address and Year of Birth,
Position with Funds, Year First
Elected or Appointed to Office | | Principal Occupation(s) During Past Five Years, Number of Funds in Columbia
Funds Complex Overseen by Trustee, Other Directorships Held | |
Douglas A. Hacker (Born 1955)
c/o Columbia Management
Investment Advisers, LLC
225 Franklin Street
Boston, MA 02110
Trustee (since 1996) and Chairman of the Board (since 2014) | | Independent business executive since May 2006; Executive Vice President — Strategy of United Airlines from December 2002 to May 2006; President of UAL Loyalty Services (airline marketing company) from September 2001 to December 2002; Executive Vice President and Chief Financial Officer of United Airlines from July 1999 to September 2001. Oversees 56; Spartan Stores, Inc. (food distributor); Nash Finch Company (food distributor) from 2005 to 2013; Aircastle Limited (aircraft leasing); and SeaCube Container Leasing Ltd. (container leasing) from 2010 to 2013 | |
Janet Langford Kelly (Born 1957)
c/o Columbia Management
Investment Advisers, LLC
225 Franklin Street
Boston, MA 02110
Trustee (since 1996) | | Senior Vice President, General Counsel and Corporate Secretary, ConocoPhillips (integrated energy company) since September 2007; Deputy General Counsel — Corporate Legal Services, ConocoPhillips from August 2006 to August 2007; Partner, Zelle, Hofmann, Voelbel, Mason & Gette LLP (law firm) from March 2005 to July 2006; Adjunct Professor of Law, Northwestern University from September 2004 to June 2006; Director, UAL Corporation (airline) from February 2006 to July 2006; Chief Administrative Officer and Senior Vice President, Kmart Holding Corporation (consumer goods) from September 2003 to March 2004. Oversees 56; None | |
Nancy T. Lukitsh (Born 1956)
c/o Columbia Management
Investment Advisers, LLC
225 Franklin Street
Boston, MA 02110
Trustee (since 2011) | | Senior Vice President, Partner and Director of Marketing, Wellington Management Company, LLP (investment adviser) from 1997 to 2010; Chair, Wellington Management Investment Portfolios (commingled non-U.S. investment pools) from 2007 to 2010; Director, Wellington Trust Company, NA and other Wellington affiliates from 1997 to 2010. Oversees 56; None | |
William E. Mayer (Born 1940)
c/o Columbia Management
Investment Advisers, LLC
225 Franklin Street
Boston, MA 02110
Trustee (since 1994) | | Partner, Park Avenue Equity Partners (private equity) since February 1999; Dean and Professor, College of Business and Management, University of Maryland from 1992 to 1996. Oversees 56; DynaVox Inc. (speech creation); Lee Enterprises (print media); WR Hambrecht + Co. (financial service provider) from 2000 to 2012; BlackRock Kelso Capital Corporation (investment company); Premier, Inc. (healthcare) | |
David M. Moffett (Born 1952)
c/o Columbia Management
Investment Advisers, LLC
225 Franklin Street
Boston, MA 02110
Trustee (since 2011) | | Retired. Chief Executive Officer, Federal Home Loan Mortgage Corporation, from 2008 to 2009; Senior Adviser, Global Financial Services Group, Carlyle Group, Inc., from 2007 to 2008; Vice Chairman and Chief Financial Officer, U.S. Bancorp, from 1993 to 2007. Oversees 56; CIT Group Inc. (commercial and consumer finance); eBay Inc. (online trading community); MBIA Inc. (financial service provider); E.W. Scripps Co. (print and television media), Building Materials Holding Corp. (building materials and construction services); Genworth Financial, Inc. (financial and insurance products and services); and University of Oklahoma Foundation | |
Charles R. Nelson (Born 1942)
c/o Columbia Management
Investment Advisers, LLC
225 Franklin Street
Boston, MA 02110
Trustee (since 1981) | | Retired. Professor Emeritus, University of Washington, since 2011; Professor of Economics, University of Washington from 1976 to 2011; Ford and Louisa Van Voorhis Professor of Political Economy, University of Washington from 1993 to 2011; Adjunct Professor of Statistics, University of Washington from 1980 to 2011; Associate Editor, Journal of Money, Credit and Banking from September 1993 to 2008; consultant on econometric and statistical matters. Oversees 56; None | |
John J. Neuhauser (Born 1943)
c/o Columbia Management
Investment Advisers, LLC
225 Franklin Street
Boston, MA 02110
Trustee (since 1984) | | President, Saint Michael's College, since August 2007; Director or Trustee of several non-profit organizations, including Fletcher Allen Health Care, Inc.; Academic Vice President and Dean of Faculties, Boston College from August 1999 to October 2005; University Professor, Boston College from November 2005 to August 2007. Oversees 56; Liberty All-Star Equity Fund and Liberty All-Star Growth Fund (closed-end funds) | |
Patrick J. Simpson (Born 1944)
c/o Columbia Management
Investment Advisers, LLC
225 Franklin Street
Boston, MA 02110
Trustee (since 2000) | | Partner, Perkins Coie LLP (law firm). Oversees 56; None | |
Annual Report 2014
34
Columbia AMT-Free New York Intermediate Muni Bond Fund
Trustees and Officers (continued)
Independent Trustees (continued)
Name, Address and Year of Birth,
Position with Funds, Year First
Elected or Appointed to Office | | Principal Occupation(s) During Past Five Years, Number of Funds in Columbia
Funds Complex Overseen by Trustee, Other Directorships Held | |
Anne-Lee Verville (Born 1945)
c/o Columbia Management
Investment Advisers, LLC
225 Franklin Street
Boston, MA 02110
Trustee (since 1998) | | Retired. General Manager — Global Education Industry from 1994 to 1997, President — Application Systems Division from 1991 to 1994, Chief Financial Officer — US Marketing & Services from 1988 to 1991, and Chief Information Officer from 1987 to 1988, IBM Corporation (computer and technology). Oversees 56; Enesco Group, Inc. (producer of giftware and home and garden decor products) from 2001 to 2006 | |
Interested Trustee
Name, Address and Year of Birth,
Position with Funds, Year First
Elected or Appointed to Office | | Principal Occupation(s) During Past Five Years, Number of Funds in Columbia
Funds Complex Overseen by Trustee, Other Directorships Held | |
William F. Truscott (Born 1960)
53600 Ameriprise Financial Center
Minneapolis, MN 55474
Trustee (since 2012) | | Chairman of the Board and President, Columbia Management Investment Advisers, LLC since May 2010 and February 2012, respectively (previously President and Chief Investment Officer from 2001 to April 2010); Chief Executive Officer, Global Asset Management, Ameriprise Financial, Inc. since September 2012 (previously, Chief Executive Officer, U.S. Asset Management & President, Annuities, from May 2010 to September 2012 and President — U.S. Asset Management and Chief Investment Officer from 2005 to April 2010); Director and Chief Executive Officer, Columbia Management Investment Distributors, Inc. since May 2010 and February 2012, respectively (previously Chairman of the Board and Chief Executive Officer from 2006 to April 2010); Chairman of the Board and Chief Executive Officer, RiverSource Distributors, Inc. since 2006; President and Chief Executive Officer, Ameriprise Certificate Company, 2006 to August 2012; Director, Threadneedle Asset Management Holdings, SARL since 2014. Oversees 188; Chairman of the Board, Columbia Management Investment Advisers, LLC since May 2010; Director, Columbia Management Investment Distributors, Inc. since May 2010; Director, Ameriprise Certificate Company from 2006 to January 2013 | |
The Statement of Additional Information has additional information about the Fund's Board members and is available, without charge, upon request by calling 800.345.6611; contacting your financial intermediary; or visiting columbiamanagement.com.
The Board has appointed officers who are responsible for day-to-day business decisions based on policies it has established. The officers serve at the pleasure of the Board. In addition to Mr. Truscott, who is Senior Vice President, the Funds' other officers are:
Officers
Name,
Address and
Year of Birth | | Position and Year
First Appointed to
Position for any Fund
in the Columbia
Funds Complex or a
Predecessor Thereof | | Principal Occupation(s) During Past Five Years | |
J. Kevin Connaughton
225 Franklin Street
Boston, MA 02110
Born 1964 | | President and Principal Executive Officer (2009) | | Managing Director and General Manager — Mutual Fund Products, Columbia Management Investment Advisers, LLC since May 2010; and President, Columbia Funds since 2009; Managing Director, Columbia Management Advisors, LLC from December 2004 to April 2010; Senior Vice President and Chief Financial Officer, Columbia Funds from June 2008 to January 2009; and senior officer of Columbia Funds and affiliated funds since 2003. | |
Michael G. Clarke
225 Franklin Street
Boston, MA 02110
Born 1969 | | Treasurer (2011) and Chief Financial Officer (2009) | | Vice President — Mutual Fund Administration, Columbia Management Investment Advisers, LLC since May 2010; Managing Director of Fund Administration, Columbia Management Advisors, LLC from September 2004 to April 2010; and senior officer of Columbia Funds and affiliated funds since 2002. | |
Annual Report 2014
35
Columbia AMT-Free New York Intermediate Muni Bond Fund
Trustees and Officers (continued)
Officers (continued)
Name,
Address and
Year of Birth | | Position and Year
First Appointed to
Position for any Fund
in the Columbia
Funds Complex or a
Predecessor Thereof | | Principal Occupation(s) During Past Five Years | |
Scott R. Plummer
5228 Ameriprise
Financial Center
Minneapolis, MN 55474
Born 1959 | | Senior Vice President (2006), Chief Legal Officer (2006) and Assistant Secretary (2011) | | Senior Vice President and Assistant General Counsel — Global Asset Management, Ameriprise Financial since February 2014 (previously, Senior Vice President and Lead Chief Counsel — Asset Management, 2012 – February 2014; Vice President and Lead Chief Counsel — Asset Management, 2010 – 2012; and Vice President and Chief Counsel — Asset Management, 2005 – 2010); Senior Vice President, Chief Legal Officer and Assistant Secretary, Columbia Management Investment Advisers, LLC since June 2005; Vice President, Chief Counsel and Assistant Secretary, Columbia Management Investment Distributors, Inc. since 2008; Vice President, General Counsel and Secretary, Ameriprise Certificate Company since 2005; Chief Counsel, RiverSource Distributors, Inc. since 2006; senior officer of Columbia Funds and affiliated funds since 2006. | |
Thomas P. McGuire
225 Franklin Street
Boston, MA 02110
Born 1972 | | Chief Compliance Officer (2012) | | Vice President — Asset Management Compliance, Ameriprise Financial, Inc. since May 2010; Chief Compliance Officer, Ameriprise Certificate Company since September 2010; Compliance Executive, Bank of America from 2005 to April 2010. | |
Colin Moore
225 Franklin Street
Boston, MA 02110
Born 1958 | | Senior Vice President (2010) | | Executive Vice President and Global Chief Investment Officer, Ameriprise Financial, Inc. since July 2013; Director and Global Chief Investment Officer, Columbia Management Investment Advisers, LLC since May 2010; Manager, Managing Director and Chief Investment Officer, Columbia Management Advisors, LLC from 2007 to April 2010. | |
Michael E. DeFao
225 Franklin Street
Boston, MA 02110
Born 1968 | | Vice President (2011) and Assistant Secretary (2010) | | Vice President and Chief Counsel, Ameriprise Financial, Inc. since May 2010; Associate General Counsel, Bank of America from 2005 to April 2010. | |
Joseph F. DiMaria
225 Franklin Street
Boston, MA 02110
Born 1968 | | Vice President (2011) and Chief Accounting Officer (2008) | | Vice President — Mutual Fund Treasurer, Columbia Management Investment Advisers, LLC since May 2010; Director of Fund Administration, Columbia Management Advisors, LLC from 2006 to April 2010. | |
Paul B. Goucher
100 Park Avenue
New York, NY 10017
Born 1968 | | Vice President (2011) and Assistant Secretary (2008) | | Vice President and Lead Chief Counsel, Ameriprise Financial, Inc. since November 2008 and January 2013, respectively (previously, Chief Counsel from January 2010 to January 2013, and Group Counsel from November 2008 to January 2010); Director, Managing Director and General Counsel, J. & W. Seligman & Co. Incorporated from July 2008 to November 2008. | |
Amy Johnson
5228 Ameriprise
Financial Center
Minneapolis, MN
Born 1965 | | Vice President (2006) | | Senior Vice President and Chief Operating Officer, Columbia Management Investment Advisers, LLC since May 2010; previously, Chief Administrative Officer, from 2009 to April 2010, and Vice President — Asset Management and Trust Company Services from 2006 to 2009. | |
Paul D. Pearson
5228 Ameriprise
Financial Center
Minneapolis, MN
Born 1956 | | Vice President (2011) and Assistant Treasurer (1999) | | Vice President — Investment Accounting, Columbia Management Investment Advisers, LLC since May 2010; Vice President — Managed Assets, Investment Accounting, Ameriprise Financial, Inc. from 1998 to April 2010. | |
Christopher O. Petersen
5228 Ameriprise
Financial Center
Minneapolis, MN 55474
Born 1970 | | Vice President and Secretary (2010) | | Vice President and Chief Counsel, Ameriprise Financial, Inc. since January 2010 (previously, Vice President and Group Counsel or Counsel from 2004 to January 2010); officer of Columbia Funds and affiliated funds since 2007. | |
Stephen T. Welsh
225 Franklin Street
Boston, MA 02110
Born 1957 | | Vice President (2006) | | President and Director, Columbia Management Investment Services Corp. from May 2010 to October 2014; President and Director, Columbia Management Services, Inc. from 2004 to April 2010; and Managing Director, Columbia Management Distributors, Inc. from 2007 to April 2010. | |
Annual Report 2014
36
Columbia AMT-Free New York Intermediate Muni Bond Fund
Board Consideration and Approval of Advisory Agreement
On June 11, 2014, the Board of Trustees (the "Board") and the Trustees who are not interested persons (as defined in the Investment Company Act of 1940) of the Trust (the "Independent Trustees") unanimously approved the continuation of the Investment Management Services Agreement (the "Advisory Agreement") with Columbia Management Investment Advisers, LLC (the "Investment Manager") with respect to Columbia AMT-Free New York Intermediate Muni Bond Fund (the "Fund"), a series of the Trust. As detailed below, the Advisory Fees and Expenses Committee (the "Committee") and the Board met on multiple occasions to review and discuss, both among themselves and with the management team of the Investment Manager, materials provided by the Investment Manager before determining to approve the continuation of the Advisory Agreement.
In connection with their deliberations regarding the continuation of the Advisory Agreement, the Committee and the Board evaluated materials requested from the Investment Manager regarding the Fund and the Advisory Agreement, and discussed these materials with representatives of the Investment Manager at Committee meetings held on March 4, 2014, April 30, 2014 and June 10, 2014 and at Board meetings held on April 30, 2014 and June 11, 2014. In addition, the Board considers matters bearing on the Advisory Agreement at most of its other meetings throughout the year and meets regularly with senior management of the Funds and the Investment Manager. Through the Board's Investment Oversight Committees, Trustees also meet with selected Fund portfolio managers and other investment personnel at various times throughout the year. The Committee and the Board also consulted with its independent fee consultant, Fund counsel and with the Independent Trustees' independent legal counsel, who advised on various matters with respect to the Committee's and the Board's considerations and otherwise assisted the Committee and the Board in their deliberations. On June 10, 2014, the Committee recommended that the Board approve the continuation of the Advisory Agreement. On June 11, 2014, the Board, including the Independent Trustees, voting separately, unanimously approved the continuation of the Advisory Agreement for the Fund.
The Committee and the Board considered all information that they, their legal counsel, or the Investment Manager believed reasonably necessary to evaluate and to determine whether to approve the continuation of the Advisory Agreement. The information and factors considered by the Committee and the Board in recommending for approval or approving the continuation of the Advisory Agreement for the Fund included the following:
• Information on the investment performance of the Fund relative to the performance of a group of mutual funds determined to be comparable to the Fund by an independent third-party data provider, as well as performance relative to benchmarks;
• Information on the Fund's advisory fees and total expenses, including information comparing the Fund's expenses to those of a group of comparable mutual funds, as determined by the independent third-party data provider;
• The Investment Manager's agreement to contractually limit or cap total operating expenses for the Fund through February 28, 2015 so that total operating expenses (excluding certain fees and expenses, such as transaction costs and certain other investment related expenses, interest, taxes, acquired fund fees and expenses, and extraordinary expenses) would not exceed the annual rates of 0.75% for Class A, 1.50% for Class B, 1.50% for Class C, 0.50% for Class R4, 0.65% for Class T and 0.50% for Class Z;
• The terms and conditions of the Advisory Agreement;
• The current and proposed terms and conditions of other agreements and arrangements with affiliates of the Investment Manager relating to the operations of the Fund, including the Administrative Services Agreement, the Distribution Agreement and the Transfer and Dividend Disbursing Agent Agreement;
• Descriptions of various functions performed by the Investment Manager under the Advisory Agreement, including portfolio management and portfolio trading practices;
• Information regarding the management fees and investment performance of similarly-managed portfolios of other clients of the Investment Manager, including institutional separate accounts;
• Information regarding the reputation, regulatory history and resources of the Investment Manager, including information regarding senior management, portfolio managers and other personnel;
• Information regarding the capabilities of the Investment Manager with respect to compliance monitoring services, including an assessment of the Investment Manager's compliance system by the Fund's Chief Compliance Officer; and
Annual Report 2014
37
Columbia AMT-Free New York Intermediate Muni Bond Fund
Board Consideration and Approval of Advisory Agreement (continued)
• The profitability to the Investment Manager and its affiliates from their relationships with the Fund.
Nature, Extent and Quality of Services Provided under the Advisory Agreement
The Committee and the Board considered the nature, extent and quality of services provided to the Fund by the Investment Manager and its affiliates under the Advisory Agreement and under separate agreements for the provision of transfer agency and administrative services, and the resources dedicated to the Fund and the other Columbia Funds by the Investment Manager and its affiliates. The Committee and the Board considered, among other things, the Investment Manager's ability to attract, motivate and retain highly qualified research, advisory and supervisory investment professionals (including personnel and other resources, compensation programs for personnel involved in fund management, reputation and other attributes), the portfolio management services provided by those investment professionals, and the quality of the Investment Manager's investment research capabilities and trade execution services. The Committee and the Board also considered the potential benefits to shareholders of investing in a mutual fund that is part of a fund complex offering exposure to a variety of asset classes and investment disciplines and providing a variety of fund and shareholder services.
The Committee and the Board also considered the professional experience and qualifications of the senior personnel of the Investment Manager, which included consideration of the Investment Manager's experience with similarly-structured funds. The Committee and the Board noted the compliance programs of and the compliance-related resources provided to the Fund by the Investment Manager and its affiliates, and considered the Investment Manager's ability to provide administrative services to the Fund pursuant to a separate Administrative Services Agreement, including the Investment Manager's ability to coordinate the activities of the Fund's other service providers. After reviewing these and related factors, the Committee and the Board concluded, within the context of their overall conclusions, that the nature, extent and quality of the services provided to the Fund under the Advisory Agreement supported the continuation of the Advisory Agreement.
Investment Performance
The Committee and the Board reviewed information about the performance of the Fund over various time periods, including performance information relative to benchmarks and information based on reports of the independent third-party data provider that compared the performance of the Fund to the performance of a group of comparable mutual funds, and data provided by the independent fee consultant. The Committee and the Board also reviewed a description of the third party's methodology for identifying the Fund's peer groups for purposes of performance and expense comparisons.
The Committee and the Board noted that, through December 31, 2013, the Fund's performance was in the thirty-seventh, thirty-seventh and forty-sixth percentile (where the best performance would be in the first percentile) of its category selected by the independent third-party data provider for the purposes of performance comparisons for the one-, three- and five- year periods, respectively.
The Committee and the Board also considered the Investment Manager's performance and reputation generally, the Investment Manager's historical responsiveness to Board concerns about performance, and the Investment Manager's willingness to take steps intended to improve performance. After reviewing these and related factors, the Committee and the Board concluded, within the context of their overall conclusions, that the performance of the Fund was sufficient, in light of other considerations, to warrant the continuation of the Advisory Agreement.
Investment Advisory Fee Rates and Other Expenses
The Committee and the Board considered the advisory fees charged to the Fund under the Advisory Agreement as well as the total expenses incurred by the Fund. In assessing the reasonableness of the fees under the Advisory Agreement, the Committee and the Board considered, among other information, the Fund's advisory fee and its total expense ratio as a percentage of average daily net assets. The Committee and the Board also considered data provided by the independent fee consultant. The Committee and the Board noted that the Fund's actual management fee and net expense ratio are ranked in the first and third quintiles, respectively, (where the lowest fees and expenses would be in the first quintile) against the Fund's expense universe as determined by the independent third-party data provider for purposes of expense comparison. The Committee and the Board also took into account the fee waiver and expense limitation arrangements agreed to by the Investment Manager, as noted above.
The Committee and the Board also received and considered information about the advisory fees charged by the Investment Manager to institutional separate accounts. In considering the fees charged to those accounts, the Committee and the Board
Annual Report 2014
38
Columbia AMT-Free New York Intermediate Muni Bond Fund
Board Consideration and Approval of Advisory Agreement (continued)
took into account, among other things, the Investment Manager's representations about the differences between managing mutual funds as compared to other types of accounts, including differences in the services provided, differences in the risk profile of such business for the Investment Manager and the additional resources required to manage mutual funds effectively. In evaluating the Fund's advisory fees, the Committee and the Board also took into account the demands, complexity and quality of the investment management of the Fund.
After reviewing these and related factors, the Committee and the Board concluded, within the context of their overall conclusions, that the advisory fee rates and expenses of the Fund were sufficient, in light of other considerations, to warrant the continuation of the Advisory Agreement.
Costs of Services Provided and Profitability
The Committee and the Board also took note of the costs of the services provided (both on an absolute and relative basis) and the profitability to the Investment Manager and its affiliates in connection with their relationships with the Fund. In evaluating these considerations, the Committee and the Board took note of the advisory fees charged by the Investment Manager to other clients, including fees charged by the Investment Manager to institutional separate account clients with similar investment strategies to those of the Fund.
The Committee and the Board also considered the compensation directly or indirectly received by the Investment Manager's affiliates in connection with their relationships with the Fund. The Committee and the Board reviewed information provided by management as to the profitability of the Investment Manager and its affiliates of their relationships with the Fund, information about the allocation of expenses used to calculate profitability, and comparisons of profitability levels realized in 2013 to profitability levels realized in 2012. When reviewing profitability, the Committee and the Board also considered court cases in which adviser profitability was an issue in whole or in part, the performance of similarly managed funds, the performance of the Fund, and the expense ratio of the Fund. The Committee and the Board also considered information provided by the Investment Manager regarding the Investment Manager's financial condition and comparing its profitability to that of other asset management firms that are, or are subsidiaries of, publicly traded companies.
After reviewing these and related factors, the Committee and the Board concluded, within the context of their overall conclusions, that the costs of services provided and the profitability to the Investment Manager and its affiliates from their relationships with the Fund supported the continuation of the Advisory Agreement.
Economies of Scale
The Committee and the Board considered the potential existence of economies of scale in the provision by the Investment Manager of services to the Fund, to groups of related funds, and to the Investment Manager's investment advisory clients as a whole, and whether those economies of scale were shared with the Fund through breakpoints in investment advisory fees or other means, such as expense limitation arrangements and additional investments by the Investment Manager in investment, trading and compliance resources. The Committee and the Board noted that the investment advisory fee schedules for the Fund contained breakpoints that would reduce the fee rate on assets above specified threshold levels.
In considering these matters, the Committee and the Board also considered the costs of the services provided and the profitability to the Investment Manager and its affiliates from their relationships with the Fund, as discussed above. After reviewing these and related factors, the Committee and the Board concluded, within the context of their overall conclusions, that the extent to which any economies of scale were expected to be shared with the Fund supported the continuation of the Advisory Agreement.
Other Benefits to the Investment Manager
The Committee and the Board received and considered information regarding "fall-out" or ancillary benefits received by the Investment Manager and its affiliates as a result of their relationships with the Fund, such as the engagement of the Investment Manager to provide administrative services to the Fund and the engagement of the Investment Manager's affiliates to provide distribution and transfer agency services to the Fund. In this regard, among other matters, the Committee and the Board considered that the Fund's distributor retains a portion of the distribution fees from the Fund and receives a portion of the sales charges on sales or redemptions of certain classes of shares of the Fund. The Committee and the Board also considered the benefits of research made available to the Investment Manager by reason of brokerage commissions generated by the Fund's securities transactions, and reviewed information about the Investment Manager's
Annual Report 2014
39
Columbia AMT-Free New York Intermediate Muni Bond Fund
Board Consideration and Approval of Advisory Agreement (continued)
practices with respect to allocating portfolio transactions for brokerage and research services. The Committee and the Board considered the possible conflicts of interest associated with certain fall-out or other ancillary benefits and the reporting, disclosure and other processes that are in place to address such possible conflicts of interest. The Committee and the Board recognized that the Investment Manager's profitability would be somewhat lower without these benefits.
Conclusion
The Committee and the Board reviewed all of the above considerations in reaching their decisions to recommend or approve the continuation of the Advisory Agreement. In their deliberations, the Trustees did not identify any particular information that was all-important or controlling, and individual Trustees may have attributed different weights to the various factors. Based on their evaluation of all factors that they deemed to be material, including those factors described above, and assisted by the advice of independent legal counsel, the Board, including the Independent Trustees, voting separately, unanimously approved the continuation of the Advisory Agreement.
Annual Report 2014
40
Columbia AMT-Free New York Intermediate Muni Bond Fund
Important Information About This Report
Each fund mails one shareholder report to each shareholder address. If you would like more than one report, please call shareholder services at 800.345.6611 and additional reports will be sent to you.
The policy of the Board is to vote the proxies of the companies in which each fund holds investments consistent with the procedures as stated in the Statement of Additional Information (SAI). You may obtain a copy of the SAI without charge by calling 800.345.6611; contacting your financial intermediary; visiting columbiamanagement.com; or searching the website of the Securities and Exchange Commission (SEC) at sec.gov. Information regarding how each fund voted proxies relating to portfolio securities is filed with the SEC by August 31 for the most recent 12-month period ending June 30 of that year, and is available without charge by visiting columbiamanagement.com; or searching the website of the SEC at sec.gov.
Each fund files a complete schedule of portfolio holdings with the SEC for the first and third quarters of each fiscal year on Form N-Q. Each fund's Form N-Q is available on the SEC's website at sec.gov and may be reviewed and copied at the SEC's Public Reference Room in Washington, D.C. Information on the operation of the Public Reference Room may be obtained by calling 800.SEC.0330. Each fund's complete schedule of portfolio holdings, as filed on Form N-Q, can also be obtained without charge, upon request, by calling 800.345.6611.
Annual Report 2014
41

Columbia AMT-Free New York Intermediate Muni Bond Fund
P.O. Box 8081
Boston, MA 02266-8081
columbiamanagement.com
This information is for use with concurrent or prior delivery of a fund prospectus. Please read and consider the investment objectives, risks, charges and expenses for any fund carefully before investing. For a prospectus and, if available, a summary prospectus, which contains this and other important information about the Fund, go to columbiamanagement.com. The Fund is distributed by Columbia Management Investment Distributors, Inc., member FINRA, and managed by Columbia Management Investment Advisers, LLC.
© 2014 Columbia Management Investment Advisers, LLC. All rights reserved.
ANN204_10_D01_(12/14)
Annual Report
October 31, 2014

Columbia International Bond Fund
Not FDIC insured • No bank guarantee • May lose value
 Dear Shareholders,
The U.S. Economy Gained Momentum
The U.S. economy picked up momentum throughout the third quarter of 2014 with improvements in every sector. Second-quarter gross domestic product growth was revised upward to 4.6%, with expectations that third-quarter growth would also be above trend. American companies added more than 200,000 new jobs monthly, driving unemployment below 6% for the first time since 2008. Consumer spending got a boost as both income and savings rose, and confidence hit a post-recession high. After a weak start to the year, corporate profits rebounded, indicating that business remains in good shape. Rising profits led to higher capital spending. The housing market recovery remained on track, as home sales and prices trended higher, and inventories declined. Manufacturing remained a lynchpin of the economy's expansion. Even so, performance fell short of expectations at the end of the period.
Despite Momentum, Markets Remained Stagnant
The financial markets produced lackluster results, despite good economic news and the Federal Reserve's reassurance that it intended to keep short-term interest rates low for another year. A surge in global tensions and concerns that equity valuations have risen sharply put a damper on investor enthusiasm. The S&P 500 Index inched ahead 1.13%, buoyed by its concentration in large-cap stocks with a defensive edge. Traditional fixed-income sectors, including U.S. Treasuries, mortgages and securitized bonds, eked out returns of less than 1% for the quarter. Investment-grade corporate bonds and high-yield bonds lost some ground, although fundamentals for both groups remained solid. Convertible securities and U.S. Treasury inflation-protected securities pulled up the rear.
Stay on Track with Columbia Management
Backed by more than 100 years of experience, Columbia Management is one of the nation's largest asset managers. At the heart of our success and, most importantly, that of our investors, are highly talented industry professionals, brought together by a unique way of working. At Columbia Management, reaching our performance goals matters, and how we reach them matters just as much.
Visit columbiamanagement.com for:
> The Columbia Management Perspectives blog, offering insights on current market events and investment opportunities
> Detailed up-to-date fund performance and portfolio information
> Quarterly fund commentaries
> Columbia Management investor, our award-winning quarterly newsletter for shareholders
Thank you for your continued support of the Columbia Funds. We look forward to serving your investment needs for many years to come.
Best Regards,

J. Kevin Connaughton
President, Columbia Funds
Investing involves risk including the risk of loss of principal.
The S&P 500 Index, an unmanaged index, measures the performance of 500 widely held, large-capitalization U.S. stocks and is frequently used as a general measure of market performance. Indices are not available for investment, are not professionally managed and do not reflect sales charges, fees, brokerage commissions, taxes or other expenses of investing.
Investors should consider the investment objectives, risks, charges and expenses of a mutual fund carefully before investing. For a free prospectus and, if available, a summary prospectus, which contains this and other important information about a fund, visit columbiamanagement.com. The prospectus should be read carefully before investing.
Columbia Funds are distributed by Columbia Management Investment Distributors, Inc., member FINRA, and managed by Columbia Management Investment Advisers, LLC.
© 2014 Columbia Management Investment Advisers, LLC. All rights reserved.
Columbia International Bond Fund
Performance Overview | | | 2 | | |
Manager Discussion of Fund Performance | | | 4 | | |
Understanding Your Fund's Expenses | | | 7 | | |
Portfolio of Investments | | | 8 | | |
Statement of Assets and Liabilities | | | 15 | | |
Statement of Operations | | | 17 | | |
Statement of Changes in Net Assets | | | 18 | | |
Financial Highlights | | | 20 | | |
Notes to Financial Statements | | | 25 | | |
Report of Independent Registered
Public Accounting Firm | | | 36 | | |
Federal Income Tax Information | | | 37 | | |
Trustees and Officers | | | 38 | | |
Board Consideration and Approval of Advisory Agreement | | | 41 | | |
Important Information About This Report | | | 45 | | |
Fund Investment Manager
Columbia Management Investment
Advisers, LLC
225 Franklin Street
Boston, MA 02110
Fund Distributor
Columbia Management Investment
Distributors, Inc.
225 Franklin Street
Boston, MA 02110
Fund Transfer Agent
Columbia Management Investment
Services Corp.
P.O. Box 8081
Boston, MA 02266-8081
For more information about any of the funds, please visit columbiamanagement.com or call 800.345.6611. Customer Service Representatives are available to answer your questions Monday through Friday from 8 a.m. to 7 p.m. Eastern time.
The views expressed in this report reflect the current views of the respective parties. These views are not guarantees of future performance and involve certain risks, uncertainties and assumptions that are difficult to predict, so actual outcomes and results may differ significantly from the views expressed. These views are subject to change at any time based upon economic, market or other conditions and the respective parties disclaim any responsibility to update such views. These views may not be relied on as investment advice and, because investment decisions for a Columbia Fund are based on numerous factors, may not be relied on as an indication of trading intent on behalf of any particular Columbia Fund. References to specific securities should not be construed as a recommendation or investment advice.
Columbia International Bond Fund
Performance Summary
> Columbia International Bond Fund (the Fund) Class A shares returned 1.03% excluding sales charges for the 12-month period that ended October 31, 2014.
> The Fund outperformed its Blended Benchmark, which returned -1.62% for the 12-month period.
> The Fund also outperformed the Citigroup Non-U.S. Dollar World Government Bond (All Maturities) Index — Unhedged, which returned -2.88% for the same time period.
> Exposure to local emerging market rates and significant underweights in the Japanese yen and euro contributed positively to the Fund's relative results. These positive contributors more than offset the detracting effect of an overweight to emerging market currencies and underweights to eurozone rates and spreads.
Average Annual Total Returns (%) (for period ended October 31, 2014)
| | Inception | | 1 Year | | 5 Years | | Life | |
Class A | | 12/01/08 | | | | | | | | | | | | | |
Excluding sales charges | | | | | | | 1.03 | | | | 2.15 | | | | 3.78 | | |
Including sales charges | | | | | | | -3.74 | | | | 1.17 | | | | 2.92 | | |
Class C | | 12/01/08 | | | | | | | | | | | | | |
Excluding sales charges | | | | | | | 0.38 | | | | 1.39 | | | | 3.00 | | |
Including sales charges | | | | | | | -0.61 | | | | 1.39 | | | | 3.00 | | |
Class I* | | 09/27/10 | | | 1.49 | | | | 2.42 | | | | 4.01 | | |
Class W* | | 06/18/12 | | | 0.85 | | | | 1.82 | | | | 3.40 | | |
Class Z | | 12/01/08 | | | 1.34 | | | | 2.41 | | | | 4.04 | | |
Blended Benchmark | | | | | | | -1.62 | | | | 2.28 | | | | 5.25 | | |
Citigroup Non-U.S. Dollar World Government Bond
(All Maturities) Index — Unhedged | | | | | | | -2.88 | | | | 0.83 | | | | 3.14 | | |
Returns for Class A are shown with and without the maximum initial sales charge of 4.75%. Returns for Class C are shown with and without the applicable contingent deferred sales charge (CDSC) of 1.00% for the first year only. The Fund's other classes are not subject to sales charges and have limited eligibility. Please see the Fund's prospectus for details. Performance for different share classes will vary based on differences in sales charges and fees associated with each class. All results shown assume reinvestment of distributions during the period. Returns do not reflect the deduction of taxes that a shareholder may pay on Fund distributions or on the redemption of Fund shares. Performance results reflect the effect of any fee waivers or reimbursements of Fund expenses by Columbia Management Investment Advisers, LLC and/or any of its affiliates. Absent these fee waivers or expense reimbursement arrangements, performance results would have been lower.
The performance information shown represents past performance and is not a guarantee of future results. The investment return and principal value of your investment will fluctuate so that your shares, when redeemed, may be worth more or less than their original cost. Current performance may be lower or higher than the performance information shown. You may obtain performance information current to the most recent month-end by contacting your financial intermediary, visiting columbiamanagement.com or calling 800.345.6611.
*The returns shown for periods prior to the share class inception date (including returns for the Life of the Fund, if shown, which are since Fund inception) include the returns of the Fund's oldest share class. Since the Fund launched more than one share class at its inception, Class A shares were used. These returns are adjusted to reflect any higher class-related operating expenses of the newer share classes, as applicable. Please visit columbiamanagement.com/mutual-funds/appended-performance for more information.
The Blended Benchmark, a weighted custom composite, established by the Investment Manager, consists of a 60% weighting in the Citigroup World Government Bond (excluding the U.S. and Japan) Index (the Citigroup WGBI — ex U.S./Japan), a 20% weighting in the Citigroup Japan Government Bond Index (the Citigroup Japan GBI) and a 20% weighting in the JPMorgan Government Bond Index — Emerging Markets Global Diversified Composite (the JPM GBI EM — Global Diversified). The Citigroup WGBI — ex U.S./Japan has the same calculation and inclusion criteria as the Fund's primary benchmark, the Citigroup Non.U.S. WGBI — Unhedged, while excluding issues from the United States and also Japan. The Citigroup Japan GBI is a market-weighted index based on Yen-denominated debt instruments issued by the government of Japan. The JPM GBI — EM Global Diversified tracks total returns for emerging markets local-currency denominated fixed income instruments.
The Citigroup Non-U.S. Dollar World Government Bond (All Maturities) Index — Unhedged is calculated on a market-weighted basis and includes investment-grade, fixed-rate bonds, issued by governments outside of the United States (currently, 21 countries), with a remaining maturity of one year or longer and with amounts outstanding of at least the equivalent of U.S. $25 million.
Indices are not available for investment, are not professionally managed and do not reflect sales charges, fees, brokerage commissions, taxes or other expenses of investing. Securities in the Fund may not match those in an index.
Annual Report 2014
2
Columbia International Bond Fund
Performance Overview (continued)
Performance of a Hypothetical $10,000 Investment (December 1, 2008 – October 31, 2014)
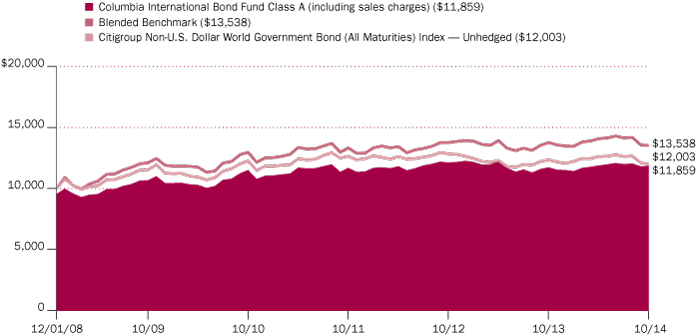
The chart above shows the change in value of a hypothetical $10,000 investment in Class A shares of Columbia International Bond Fund during the stated time period, and does not reflect the deduction of taxes that a shareholder may pay on Fund distributions or on the redemption of Fund shares.
Annual Report 2014
3
Columbia International Bond Fund
Manager Discussion of Fund Performance
Portfolio Management
Jim Cielinski
Matthew Cobon
Zach Pandl
Gene Tannuzzo, CFA
Quality Breakdown (%)
(at October 31, 2014) | |
AAA rating | | | 12.6 | | |
AA rating | | | 14.2 | | |
A rating | | | 24.0 | | |
BBB rating | | | 39.2 | | |
Non-investment grade | | | 6.3 | | |
Not rated | | | 3.7 | | |
Total | | | 100.0 | | |
Percentages indicated are based upon total fixed income securities (excluding Money Market Funds).
Bond ratings apply to the underlying holdings of the Fund and not the Fund itself and are divided into categories ranging from highest to lowest credit quality, determined by using the middle rating of Moody's, S&P and Fitch, after dropping the highest and lowest available ratings. When ratings are available from only two rating agencies, the lower rating is used. When a rating is available from only one rating agency, that rating is used. When a bond is not rated by any rating agency, it is designated as "Not rated". Credit quality ratings assigned by a rating agency are subjective opinions, not statements of fact, and are subject to change, including daily. The ratings assigned by credit rating agencies are but one of the considerations that the Investment Manager and/or Fund's subadviser incorporates into its credit analysis process, along with such other country-specific factors as the direction and stance of fiscal policy, balance of payment trends and commodity prices, the level and structure of public debt as well as political stability and commitment to strong macroeconomic policies.
The Board of Trustees of the Fund has approved a Plan of Liquidation and Termination (the Plan) pursuant to which the Fund will be liquidated an terminated. Under the terms of the Plan, it is anticipated that the redemption of all shares of the Fund will occur in the first quarter of 2015.
At October 31, 2014, approximately 97% of the Fund's shares were owned in the aggregate by affiliated funds-of-funds managed by Columbia Management Investment Advisers (Columbia). As a result of asset allocation decisions by Columbia, it is possible that the Fund may experience relatively large purchases or redemptions from affiliated funds-of-funds. Columbia seeks to minimize the impact of these transactions by structuring them over a reasonable period of time. The Fund may experience increased expenses as it buys and sells securities as a result of purchases or redemptions by affiliated funds-of-funds.
For the 12-month period that ended October 31, 2014, the Fund's Class A shares returned 1.03% excluding sales charges. The Fund outperformed its Blended Benchmark, which returned -1.62% for the 12-month period. The Fund also outperformed the Citigroup Non-U.S. Dollar World Government Bond (All Maturities) Index — Unhedged, which returned -2.88% for the same time period. Exposure to local emerging market rates and significant underweights in the Japanese yen and euro contributed positively to the Fund's relative results. These positive contributors more than offset the detracting effect of an overweight to emerging market currencies and underweights to eurozone rates and spreads.
Active Management Decisions Benefited Fund Returns
During the annual period, the Fund benefited significantly from sizable underweights to the Japanese yen and to the euro. The Fund's overweight exposures to local interest rate markets in Poland, Mexico, Australia, New Zealand and Indonesia also contributed positively. Partially offsetting these positive contributors were an overweight to emerging market currencies overall and underweighted exposure to eurozone rates, European periphery spreads and Japanese rates, which detracted.
Shifting Market Conditions Drove Portfolio Changes
We made a number of changes to portfolio positioning in reaction to shifting market conditions. We made a significant shift away from investing in low yielding, developed market sovereign bonds, including those of Japan, France, Germany and Norway. The proceeds from these positions were invested in sovereign debt of countries with what we considered to have more attractive total return potential. Some of these countries included those with higher yielding eurozone debt, such as Portugal and Spain. Others included higher yielding yet high quality emerging market countries, such as Mexico, South Korea, Indonesia, Malaysia and Romania. We significantly reduced the size of the Fund's U.S. dollar-denominated emerging market bond exposure in favor of higher quality emerging market local currency bonds.
Derivative Positions in the Fund
The Fund utilized currency forward contracts and futures contracts during the annual period. Currency forward contracts were used to manage the currency weights in the Fund for hedging and investment purposes. Futures contracts were used to manage the duration and yield curve exposure of the Fund vs. the Blended Benchmark.
Annual Report 2014
4
Columbia International Bond Fund
Manager Discussion of Fund Performance (continued)
Looking Ahead
We currently expect global monetary policy divergence to be a major theme for the fixed-income markets over the next several months. The U.S. and the U.K. appear to be closer to normalizing monetary policy on improving economic fundamentals, while Europe and Japan are in the process of further easing policy. The European Central Bank (ECB) recently affirmed its commitment to expand the size of its balance sheet to early 2012 levels, which implies an increase of about one trillion euros through a combination of bond purchases and long-term loans to banks. Additionally, despite political obstacles, sovereign quantitative easing by the ECB seems to be a distinct possibility. At the same time, the Bank of Japan (BoJ) has increased the size of its own asset purchase program and extended the duration of the assets it will add to its balance sheet. Together, we believe the ECB and BoJ actions ensure that global liquidity will remain abundant even though the U.S. Federal Reserve (Fed) ended its asset purchase program on schedule in October 2014. While U.S. yields remain above those in other developed market economies, the outlooks for economic growth and policy appear to have diverged. Thus, we believe strong economic growth in the U.S. will likely force the Fed to increase short-term interest rates from the zero lower bound in the not too distant future. At the end of the annual period, the market seemed to anticipate the first rate increase by the Fed to occur between June and September 2015. Together, we believe these factors may well drive an increase in volatility in global rates and currencies in the year ahead, which, in our view, presents some potentially attractive investment opportunities.
Given our current view, the Fund maintained an underweight in international developed bonds at the end of the annual period, as we believe most of these markets offer paltry yields with little upside price potential. We continued to favor exposure to high quality emerging market local currency bonds and higher yielding government bonds in the eurozone. We maintained a smaller Fund position in hard currency emerging market bonds, but the sector, in our view, is becoming increasingly driven by idiosyncratic country stories in contrast to any broad-based themes. Additionally, the plunge in commodity prices during the annual period is likely, in our opinion, to exert further pressure on commodity-exporting countries that have failed to undertake necessary structural reforms.
Country Breakdown (%)
(at October 31, 2014) | |
Australia | | | 6.6 | | |
Brazil | | | 3.2 | | |
Canada | | | 2.0 | | |
Chile | | | 2.1 | | |
Colombia | | | 2.5 | | |
Iceland | | | 2.0 | | |
Indonesia | | | 6.0 | | |
Ireland | | | 2.0 | | |
Italy | | | 6.5 | | |
Kazakhstan | | | 0.3 | | |
Lithuania | | | 0.2 | | |
Malaysia | | | 3.6 | | |
Mexico | | | 10.5 | | |
New Zealand | | | 6.8 | | |
Peru | | | 4.8 | | |
Philippines | | | 0.9 | | |
Poland | | | 3.7 | | |
Portugal | | | 5.2 | | |
Romania | | | 4.9 | | |
Russian Federation | | | 1.4 | | |
Singapore | | | 3.0 | | |
Slovenia | | | 2.0 | | |
South Africa | | | 2.1 | | |
South Korea | | | 3.7 | | |
Spain | | | 5.0 | | |
Sweden | | | 1.6 | | |
Turkey | | | 0.9 | | |
Ukraine | | | 0.2 | | |
United Kingdom | | | 4.1 | | |
United States(a) | | | 2.0 | | |
Uruguay | | | 0.2 | | |
Total | | | 100.0 | | |
Percentages indicated are based upon total investments. The Fund's portfolio composition is subject to change.
(a) Includes investments in Money Market Funds.
Annual Report 2014
5
Columbia International Bond Fund
Manager Discussion of Fund Performance (continued)
Investment Risks
Market risk may affect a single issuer, sector of the economy, industry or the market as a whole. Fixed-income securities present issuer default risk. A rise in interest rates may result in a price decline of fixed-income securities held by the Fund. Falling rates may result in the Fund investing in lower yielding securities, lowering the Fund's income and yield. Non-investment-grade securities (high-yield or junk bonds) are volatile and carry more risk to principal and income than investment-grade securities. Prepayment and extension risk exists as a loan, bond or other investment may be called, prepaid or redeemed before maturity and that similar yielding investments may not be available for purchase. Risks are enhanced for emerging market and sovereign debt issuers. Investing in derivatives is a specialized activity that involves special risks that subject the Fund to significant loss potential, including when used as leverage, and may result in greater fluctuation in fund value. Liquidity risk is associated with the difficulty of selling underlying investments at a desirable time or price. See the Fund's prospectus for more information on these and other risks.
Annual Report 2014
6
Columbia International Bond Fund
Understanding Your Fund's Expenses
(Unaudited)
As an investor, you incur two types of costs. There are transaction costs, which generally include sales charges on purchases and may include redemption fees. There are also ongoing costs, which generally include management fees, distribution and/or service fees, and other fund expenses. The following information is intended to help you understand your ongoing costs (in dollars) of investing in the Fund and to help you compare these costs with the ongoing costs of investing in other mutual funds.
Analyzing Your Fund's Expenses
To illustrate these ongoing costs, we have provided examples and calculated the expenses paid by investors in each share class of the Fund during the period. The actual and hypothetical information in the table is based on an initial investment of $1,000 at the beginning of the period indicated and held for the entire period. Expense information is calculated two ways and each method provides you with different information. The amount listed in the "Actual" column is calculated using the Fund's actual operating expenses and total return for the period. You may use the Actual information, together with the amount invested, to estimate the expenses that you paid over the period. Simply divide your account value by $1,000 (for example, an $8,600 account value divided by $1,000 = 8.6), then multiply the results by the expenses paid during the period under the "Actual" column. The amount listed in the "Hypothetical" column assumes a 5% annual rate of return before expenses (which is not the Fund's actual return) and then applies the Fund's actual expense ratio for the period to the hypothetical return. You should not use the hypothetical account values and expenses to estimate either your actual account balance at the end of the period or the expenses you paid during the period. See "Compare With Other Funds" below for details on how to use the hypothetical data.
Compare With Other Funds
Since all mutual funds are required to include the same hypothetical calculations about expenses in shareholder reports, you can use this information to compare the ongoing cost of investing in the Fund with other funds. To do so, compare the hypothetical example with the 5% hypothetical examples that appear in the shareholder reports of other funds. As you compare hypothetical examples of other funds, it is important to note that hypothetical examples are meant to highlight the ongoing costs of investing in a fund only and do not reflect any transaction costs, such as sales charges, or redemption or exchange fees. Therefore, the hypothetical calculations are useful in comparing ongoing costs only, and will not help you determine the relative total costs of owning different funds. If transaction costs were included in these calculations, your costs would be higher.
May 1, 2014 – October 31, 2014
| | Account Value at the Beginning
of the Period ($) | | Account Value at the End
of the Period ($) | | Expenses Paid During
the Period ($) | | Fund's Annualized
Expense Ratio (%) | |
| | Actual | | Hypothetical | | Actual | | Hypothetical | | Actual | | Hypothetical | | Actual | |
Class A | | | 1,000.00 | | | | 1,000.00 | | | | 997.70 | | | | 1,019.71 | | | | 5.49 | | | | 5.55 | | | | 1.09 | | |
Class C | | | 1,000.00 | | | | 1,000.00 | | | | 993.90 | | | | 1,015.93 | | | | 9.25 | | | | 9.35 | | | | 1.84 | | |
Class I | | | 1,000.00 | | | | 1,000.00 | | | | 999.60 | | | | 1,021.63 | | | | 3.58 | | | | 3.62 | | | | 0.71 | | |
Class W | | | 1,000.00 | | | | 1,000.00 | | | | 997.70 | | | | 1,019.71 | | | | 5.49 | | | | 5.55 | | | | 1.09 | | |
Class Z | | | 1,000.00 | | | | 1,000.00 | | | | 999.00 | | | | 1,020.97 | | | | 4.23 | | | | 4.28 | | | | 0.84 | | |
Expenses paid during the period are equal to the annualized expense ratio for each class as indicated above, multiplied by the average account value over the period and then multiplied by the number of days in the Fund's most recent fiscal half year and divided by 365.
Expenses do not include fees and expenses incurred indirectly by the Fund from its investment in underlying funds, including affiliated and non-affiliated pooled investment vehicles, such as mutual funds and exchange-traded funds.
Had Columbia Management Investment Advisers, LLC and/or certain of its affiliates not waived/reimbursed certain fees and expenses, account value at the end of the period would have been reduced.
Annual Report 2014
7
Columbia International Bond Fund
Portfolio of Investments
October 31, 2014
(Percentages represent value of investments compared to net assets)
Corporate Bonds & Notes(a) 3.8%
Issuer | | Coupon
Rate | | Principal
Amount ($) | | Value ($) | |
South Korea 3.6% | |
Bank Of Korea
08/09/15 | | | 2.370 | % | | KRW | | | | | 2,860,000,000 | | | | 2,682,055 | | |
Ukraine 0.2% | |
MHP SA(b)
04/02/20 | | | 8.250 | % | | | | | | | 200,000 | | | | 173,000 | | |
Total Corporate Bonds & Notes
(Cost: $3,021,339) | | | | | | | | | 2,855,055 | | |
Inflation-Indexed Bonds(a) 3.9%
Brazil 2.8% | |
Brazil Notas do Tesouro Nacional
Series B
08/15/18 | | | 6.000 | % | | BRL | | | | | 516,688 | | | | 2,122,563 | | |
Italy 1.0% | |
Italy Buoni Poliennali Del Tesoro
09/15/41 | | | 2.550 | % | | EUR | | | | | 552,488 | | | | 731,750 | | |
Uruguay 0.1% | |
Uruguay Government International Bond
04/05/27 | | | 4.250 | % | | UYU | | | | | 1,422,045 | | | | 63,150 | | |
Total Inflation-Indexed Bonds
(Cost: $3,138,740) | | | | | | | | | 2,917,463 | | |
Foreign Government Obligations(a)(c) 87.6%
Australia 6.4% | |
Australia Government Bond
Senior Unsecured
10/21/19 | | | 2.750 | % | | AUD | | | | | 4,239,000 | | | | 3,716,852 | | |
04/21/24 | | | 2.750 | % | | AUD | | | | | 1,370,000 | | | | 1,152,662 | | |
Total | | | | | | | | | 4,869,514 | | |
Brazil 0.3% | |
Brazilian Government International Bond
Senior Unsecured
01/20/34 | | | 8.250 | % | | | | | | | 70,000 | | | | 96,950 | | |
Petrobras International Finance Co. SA
01/27/21 | | | 5.375 | % | | | | | | | 150,000 | | | | 153,342 | | |
Total | | | | | | | | | 250,292 | | |
Canada 1.9% | |
Canadian Government Bond
09/01/18 | | | 1.250 | % | | CAD | | | | | 900,000 | | | | 794,920 | | |
Foreign Government Obligations(a)(c) (continued)
Issuer | | Coupon
Rate | | Principal
Amount ($) | | Value ($) | |
Province of Quebec
12/01/17 | | | 4.500 | % | | CAD | | | | | 700,000 | | | | 675,858 | | |
Total | | | | | | | | | 1,470,778 | | |
Chile 2.0% | |
Chile Government International Bond
Senior Unsecured
08/05/20 | | | 5.500 | % | | CLP | | | | | 830,000,000 | | | | 1,511,178 | | |
Colombia 2.4% | |
Colombia Government International Bond
Senior Unsecured
04/14/21 | | | 7.750 | % | | COP | | | | | 2,520,000,000 | | | | 1,332,936 | | |
07/12/21 | | | 4.375 | % | | | | | | | 200,000 | | | | 213,300 | | |
05/21/24 | | | 8.125 | % | | | | | | | 50,000 | | | | 66,625 | | |
Ecopetrol SA
Senior Unsecured
07/23/19 | | | 7.625 | % | | | | | | | 45,000 | | | | 53,663 | | |
Empresas Publicas de Medellin ESP
Senior Unsecured(b)
02/01/21 | | | 8.375 | % | | COP | | | | | 340,000,000 | | | | 175,990 | | |
Total | | | | | | | | | 1,842,514 | | |
Iceland 1.9% | |
Iceland Government International Bond
05/11/22 | | | 5.875 | % | | | | | | | 1,300,000 | | | | 1,468,919 | | |
Indonesia 5.8% | |
Indonesia Treasury Bond
Senior Unsecured
07/15/17 | | | 10.000 | % | | IDR | | | | | 5,260,000,000 | | | | 459,189 | | |
03/15/24 | | | 8.375 | % | | IDR | | | | | 28,500,000,000 | | | | 2,408,998 | | |
09/15/25 | | | 11.000 | % | | IDR | | | | | 8,070,000,000 | | | | 795,775 | | |
Majapahit Holding BV(b)
08/07/19 | | | 8.000 | % | | | | | | | 450,000 | | | | 527,625 | | |
PT Perusahaan Listrik Negara
Senior Unsecured(b)
11/22/21 | | | 5.500 | % | | | | | | | 200,000 | | | | 212,638 | | |
Total | | | | | | | | | 4,404,225 | | |
Ireland 1.9% | |
Ireland Government Bond
03/18/24 | | | 3.400 | % | | EUR | | | | | 1,025,000 | | | | 1,469,829 | | |
Italy 5.4% | |
Italy Buoni Poliennali Del Tesoro
12/01/18 | | | 3.500 | % | | EUR | | | | | 1,380,000 | | | | 1,899,446 | | |
09/01/22 | | | 5.500 | % | | EUR | | | | | 1,380,000 | | | | 2,164,105 | | |
Total | | | | | | | | | 4,063,551 | | |
The accompanying Notes to Financial Statements are an integral part of this statement.
Annual Report 2014
8
Columbia International Bond Fund
Portfolio of Investments (continued)
October 31, 2014
Foreign Government Obligations(a)(c) (continued)
Issuer | | Coupon
Rate | | Principal
Amount ($) | | Value ($) | |
Kazakhstan 0.3% | |
KazMunayGas National Co. JSC
Senior Unsecured(b)
05/05/20 | | | 7.000 | % | | | | | | | 200,000 | | | | 225,250 | | |
Lithuania 0.2% | |
Lithuania Government International Bond
Senior Unsecured(b)
03/09/21 | | | 6.125 | % | | | | | | | 120,000 | | | | 140,039 | | |
Malaysia 3.5% | |
Malaysia Government Bond
Senior Unsecured
10/31/19 | | | 3.654 | % | | MYR | | | | | 8,660,000 | | | | 2,633,288 | | |
Mexico 10.3% | |
Comision Federal de Electricidad
Senior Unsecured(b)
05/26/21 | | | 4.875 | % | | | | | | | 200,000 | | | | 213,000 | | |
Mexican Bonos
12/13/18 | | | 8.500 | % | | MXN | | | | | 11,205,000 | | | | 945,437 | | |
06/11/20 | | | 8.000 | % | | MXN | | | | | 19,600,000 | | | | 1,648,838 | | |
12/05/24 | | | 10.000 | % | | MXN | | | | | 21,500,000 | | | | 2,087,094 | | |
05/31/29 | | | 8.500 | % | | MXN | | | | | 28,000,000 | | | | 2,473,459 | | |
Mexico Government International Bond
Senior Unsecured
01/11/40 | | | 6.050 | % | | | | | | | 40,000 | | | | 48,300 | | |
Pemex Project Funding Master Trust
01/21/21 | | | 5.500 | % | | | | | | | 300,000 | | | | 331,665 | | |
Total | | | | | | | | | 7,747,793 | | |
New Zealand 6.6% | |
New Zealand Government Bond
Senior Unsecured
12/15/17 | | | 6.000 | % | | NZD | | | | | 690,000 | | | | 573,832 | | |
05/15/21 | | | 6.000 | % | | NZD | | | | | 210,000 | | | | 183,168 | | |
04/15/23 | | | 5.500 | % | | NZD | | | | | 4,946,000 | | | | 4,262,421 | | |
Total | | | | | | | | | 5,019,421 | | |
Peru 4.7% | |
Peruvian Government International Bond
Senior Unsecured
07/21/25 | | | 7.350 | % | | | | | | | 200,000 | | | | 264,500 | | |
08/12/26 | | | 8.200 | % | | PEN | | | | | 7,550,000 | | | | 3,161,546 | | |
11/21/33 | | | 8.750 | % | | | | | | | 27,000 | | | | 41,513 | | |
03/14/37 | | | 6.550 | % | | | | | | | 45,000 | | | | 57,487 | | |
Total | | | | | | | | | 3,525,046 | | |
Philippines 0.9% | |
Philippine Government International Bond
Senior Unsecured
01/15/21 | | | 4.950 | % | | PHP | | | | | 28,000,000 | | | | 642,745 | | |
Foreign Government Obligations(a)(c) (continued)
Issuer | | Coupon
Rate | | Principal
Amount ($) | | Value ($) | |
Poland 3.6% | |
Poland Government Bond
10/25/19 | | | 5.500 | % | | PLN | | | | | 6,438,000 | | | | 2,223,769 | | |
10/25/21 | | | 5.750 | % | | PLN | | | | | 1,380,000 | | | | 501,613 | | |
Total | | | | | | | | | 2,725,382 | | |
Portugal 5.1% | |
Portugal Government International Bond(b)
10/15/24 | | | 5.125 | % | | | | | | | 1,927,000 | | | | 1,984,610 | | |
Portugal Obrigacoes do Tesouro OT
Senior Unsecured(b)
04/15/21 | | | 3.850 | % | | EUR | | | | | 1,360,000 | | | | 1,852,795 | | |
Total | | | | | | | | | 3,837,405 | | |
Romania 4.7% | |
Romania Government Bond
08/29/16 | | | 4.750 | % | | RON | | | | | 4,700,000 | | | | 1,397,440 | | |
Romanian Government International Bond
06/24/19 | | | 4.750 | % | | RON | | | | | 5,950,000 | | | | 1,821,966 | | |
Romanian Government International Bond(b)
Senior Unsecured
02/07/22 | | | 6.750 | % | | | | | | | 300,000 | | | | 359,625 | | |
Total | | | | | | | | | 3,579,031 | | |
Russian Federation 1.3% | |
Gazprom OAO Via Gaz Capital SA(b)
Senior Unsecured
04/11/18 | | | 8.146 | % | | | | | | | 200,000 | | | | 220,928 | | |
03/07/22 | | | 6.510 | % | | | | | | | 400,000 | | | | 417,500 | | |
Russian Foreign Bond — Eurobond
Senior Unsecured
03/31/30 | | | 7.500 | % | | | | | | | 93,010 | | | | 105,519 | | |
Russian Foreign Bond — Eurobond(b)
Senior Unsecured
04/29/20 | | | 5.000 | % | | | | | | | 100,000 | | | | 104,000 | | |
03/31/30 | | | 7.500 | % | | | | | | | 131,000 | | | | 148,618 | | |
Total | | | | | | | | | 996,565 | | |
Singapore 3.0% | |
Singapore Government Bond
Senior Unsecured
09/01/24 | | | 3.000 | % | | SGD | | | | | 2,700,000 | | | | 2,233,436 | | |
Slovenia 2.0% | |
Slovenia Government Bond
04/08/21 | | | 3.000 | % | | EUR | | | | | 1,120,000 | | | | 1,477,887 | | |
South Africa 2.0% | |
South Africa Government Bond
01/15/20 | | | 7.250 | % | | ZAR | | | | | 15,200,000 | | | | 1,376,451 | | |
The accompanying Notes to Financial Statements are an integral part of this statement.
Annual Report 2014
9
Columbia International Bond Fund
Portfolio of Investments (continued)
October 31, 2014
Foreign Government Obligations(a)(c) (continued)
Issuer | | Coupon
Rate | | Principal
Amount ($) | | Value ($) | |
South Africa Government International Bond
Senior Unsecured
03/08/41 | | | 6.250 | % | | | | | | | 120,000 | | | | 141,051 | | |
Total | | | | | | | | | 1,517,502 | | |
Spain 4.9% | |
Spain Government Bond
Senior Unsecured
04/30/20 | | | 4.000 | % | | EUR | | | | | 550,000 | | | | 792,630 | | |
Spain Government Bond(b)
04/30/24 | | | 3.800 | % | | EUR | | | | | 2,020,000 | | | | 2,921,927 | | |
Total | | | | | | | | | 3,714,557 | | |
Sweden 1.5% | |
Sweden Government Bond
05/12/25 | | | 2.500 | % | | SEK | | | | | 7,500,000 | | | | 1,147,353 | | |
Turkey 0.9% | |
Turkey Government International Bond
Senior Unsecured
03/30/21 | | | 5.625 | % | | | | | | | 450,000 | | | | 492,741 | | |
02/05/25 | | | 7.375 | % | | | | | | | 140,000 | | | | 173,033 | | |
Total | | | | | | | | | 665,774 | | |
United Kingdom 4.0% | |
Network Rail Infrastructure Finance PLC
Government Guaranteed
12/09/30 | | | 4.375 | % | | GBP | | | | | 60,000 | | | | 114,057 | | |
Foreign Government Obligations(a)(c) (continued)
Issuer | | Coupon
Rate | | Principal
Amount ($) | | Value ($) | |
United Kingdom Gilt
09/07/20 | | | 3.750 | % | | GBP | | | | | 625,000 | | | | 1,113,392 | | |
09/07/21 | | | 3.750 | % | | GBP | | | | | 595,000 | | | | 1,068,789 | | |
03/07/25 | | | 5.000 | % | | GBP | | | | | 350,000 | | | | 701,862 | | |
Total | | | | | | | | | 2,998,100 | | |
Uruguay 0.1% | |
Uruguay Government International Bond
Senior Unsecured PIK
01/15/33 | | | 7.875 | % | | | | | | | 40,000 | | | | 54,700 | | |
Total Foreign Government Obligations
(Cost: $67,741,242) | | | | | | | | | 66,232,074 | | |
Money Market Funds 1.9%
| | | Shares | | Value ($) | |
Columbia Short-Term Cash Fund,
0.092%(d)(e) | | | 1,451,820 | | | | 1,451,820 | | |
Total Money Market Funds
(Cost: $1,451,820) | | | | | 1,451,820 | | |
Total Investments
(Cost: $75,353,141) | | | | | 73,456,412 | | |
Other Assets & Liabilities, Net | | | | | 2,099,293 | | |
Net Assets | | | | | 75,555,705 | | |
Investments in Derivatives
Forward Foreign Currency Exchange Contracts Open at October 31, 2014
Counterparty | | Exchange Date | | Currency to
be Delivered | | Currency to
be Received | | Unrealized
Appreciation ($) | | Unrealized
Depreciation ($) | |
Citigroup Global Markets Inc.
| | 11/25/14
| | | 5,553,000
AUD | | | | 4,843,826
USD | | | | —
| | | | (35,699
| ) | |
Deutsche Bank
| | 11/25/14
| | | 4,450,286
USD | | | | 4,740,000,000
KRW | | | | —
| | | | (35,246
| ) | |
Deutsche Bank
| | 11/25/14
| | | 1,089,570
USD | | | | 2,470,000
TRY | | | | 16,381
| | | | —
| | |
Goldman, Sachs & Co.
| | 11/25/14
| | | 6,000,000
SEK | | | | 834,081
USD | | | | 21,495
| | | | —
| | |
HSBC Securities (USA), Inc.
| | 11/25/14
| | | 1,669,000
CAD | | | | 1,481,652
USD | | | | 1,558
| | | | —
| | |
J.P. Morgan Securities, Inc.
| | 11/24/14
| | | 1,101,726
USD | | | | 3,600,000
MYR | | | | —
| | | | (13,683
| ) | |
Standard Chartered Bank
| | 11/14/14
| | | 1,081,308
USD | | | | 645,000,000
CLP | | | | 38,538
| | | | —
| | |
The accompanying Notes to Financial Statements are an integral part of this statement.
Annual Report 2014
10
Columbia International Bond Fund
Portfolio of Investments (continued)
October 31, 2014
Forward Foreign Currency Exchange Contracts Open at October 31, 2014 (continued)
Counterparty | | Exchange Date | | Currency to
be Delivered | | Currency to
be Received | | Unrealized
Appreciation ($) | | Unrealized
Depreciation ($) | |
Standard Chartered Bank
| | 11/14/14
| | | 1,628,840
USD | | | | 3,330,000,000
COP | | | | —
| | | | (12,368
| ) | |
Standard Chartered Bank
| | 11/25/14
| | | 2,249,446
USD | | | | 30,480,000
MXN | | | | 11,054
| | | | —
| | |
Standard Chartered Bank
| | 11/25/14
| | | 4,235,000
GBP | | | | 6,807,021
USD | | | | 33,450
| | | | —
| | |
UBS Securities
| | 11/25/14
| | | 6,512,000
NZD | | | | 5,152,685
USD | | | | 86,884
| | | | —
| | |
UBS Securities
| | 12/08/14
| | | 18,620,000
EUR | | | | 23,331,419
USD | | | | —
| | | | (8,466
| ) | |
Total | | | | | | | | | 209,360 | | | | (105,462 | ) | |
Futures Contracts Outstanding at October 31, 2014
At October 31, 2014, cash totaling $256,164 was pledged as collateral to cover initial margin requirements on open futures contracts.
Long Futures Contracts Outstanding
Contract Description | | Number of
Contracts | | Trading
Currency | | Notional
Market
Value ($) | | Expiration
Date | | Unrealized
Appreciation ($) | | Unrealized
Depreciation ($) | |
US LONG BOND | | | 24 | | | USD | | | | | 3,386,250 | | | 12/2014 | | | 42,714 | | | | — | | |
US ULTRA T-BOND | | | 24 | | | USD | | | | | 3,763,500 | | | 12/2014 | | | 176,214 | | | | — | | |
Total | | | | | | | | | | | 218,928 | | | | — | | |
Short Futures Contracts Outstanding
Contract Description | | Number of
Contracts | | Trading
Currency | | Notional
Market
Value ($) | | Expiration
Date | | Unrealized
Appreciation ($) | | Unrealized
Depreciation ($) | |
| EURO BUXL 30YR BOND | | | (3 | ) | | EUR | | | | | (546,323 | ) | | 12/2014 | | | — | | | | (20,143 | ) | |
| EURO-BUND | | | (47 | ) | | EUR | | | | | (8,888,305 | ) | | 12/2014 | | | — | | | | (102,145 | ) | |
Total | | | | | | | | | | | — | | | | (122,288 | ) | |
Interest Rate Swap Contracts Outstanding at October 31, 2014
At October 31, 2014, cash totaling $638,351 was pledged as collateral to cover open centrally cleared interest rate swap contracts.
Counterparty | | Floating Rate
Index | | Fund
Pay/Receive
Floating Rate | | Fixed
Rate (%) | | Expiration
Date | | Notional
Currency | | Notional
Amount | | Unamortized
Premium (Paid)
Received ($) | | Unrealized
Appreciation ($) | | Unrealized
Depreciation ($) | |
Morgan Stanley*
| | 3-Month
USD LIBOR-BBA | | Receive
| | | 1.7515
| | | 10/10/19
| | USD |
| | | | 10,000,000
| | | | (291
| ) | | | —
| | | | (15,403
| ) | |
Morgan Stanley*
| | 3-Month
USD LIBOR-BBA | | Receive
| | | 2.4765
| | | 10/10/24
| | USD |
| | | | 11,000,000
| | | | (336
| ) | | | —
| | | | (19,909
| ) | |
Morgan Stanley*
| | 3-Month
USD LIBOR-BBA | | Receive
| | | 2.3650
| | | 10/16/24
| | USD |
| | | | 4,400,000
| | | | (284
| ) | | | 38,443
| | | | —
| | |
Total | | | | | | | | | | | | | | | (911 | ) | | | 38,443 | | | | (35,312 | ) | |
* Centrally cleared swap contract
The accompanying Notes to Financial Statements are an integral part of this statement.
Annual Report 2014
11
Columbia International Bond Fund
Portfolio of Investments (continued)
October 31, 2014
Notes to Portfolio of Investments
(a) Principal amounts are denominated in United States Dollars unless otherwise noted.
(b) Security exempt from registration pursuant to Rule 144A under the Securities Act of 1933. This security may be resold in transactions exempt from registration, normally to qualified institutional buyers. At October 31, 2014, the value of these securities amounted to $9,677,545 or 12.81% of net assets.
(c) Principal and interest may not be guaranteed by the government.
(d) The rate shown is the seven-day current annualized yield at October 31, 2014.
(e) As defined in the Investment Company Act of 1940, an affiliated company is one in which the Fund owns 5% or more of the company's outstanding voting securities, or a company which is under common ownership or control with the Fund. Holdings and transactions in these affiliated companies during the year ended October 31, 2014, are as follows:
Issuer | | Beginning
Cost ($) | | Purchase
Cost ($) | | Proceeds
From Sales ($) | | Ending
Cost ($) | | Dividends —
Affiliated
Issuers ($) | | Value ($) | |
Columbia Short-Term Cash Fund | | | 3,085,789 | | | | 46,464,593 | | | | (48,098,562 | ) | | | 1,451,820 | | | | 2,490 | | | | 1,451,820 | | |
Abbreviation Legend
PIK Payment-in-Kind
Currency Legend
AUD Australian Dollar
BRL Brazilian Real
CAD Canadian Dollar
CLP Chilean Peso
COP Colombian Peso
EUR Euro
GBP British Pound
IDR Indonesian Rupiah
KRW Korean Won
MXN Mexican Peso
MYR Malaysia Ringgits
NZD New Zealand Dollar
PEN Peru Nuevos Soles
PHP Philippine Peso
PLN Polish Zloty
RON Romania, New Lei
SEK Swedish Krona
SGD Singapore Dollar
TRY Turkish Lira
USD US Dollar
UYU Uruguay Pesos
ZAR South African Rand
The accompanying Notes to Financial Statements are an integral part of this statement.
Annual Report 2014
12
Columbia International Bond Fund
Portfolio of Investments (continued)
October 31, 2014
Generally accepted accounting principles (GAAP) require disclosure regarding the inputs and valuation techniques used to measure fair value and any changes in valuation inputs or techniques. In addition, investments shall be disclosed by major category.
The Fund categorizes its fair value measurements according to a three-level hierarchy that maximizes the use of observable inputs and minimizes the use of unobservable inputs by prioritizing that the most observable input be used when available. Observable inputs are those that market participants would use in pricing an investment based on market data obtained from sources independent of the reporting entity. Unobservable inputs are those that reflect the Fund's assumptions about the information market participants would use in pricing an investment. An investment's level within the fair value hierarchy is based on the lowest level of any input that is deemed significant to the asset or liability's fair value measurement. The input levels are not necessarily an indication of the risk or liquidity associated with investments at that level. For example, certain U.S. government securities are generally high quality and liquid, however, they are reflected as Level 2 because the inputs used to determine fair value may not always be quoted prices in an active market.
Fair value inputs are summarized in the three broad levels listed below:
> Level 1 — Valuations based on quoted prices for investments in active markets that the Fund has the ability to access at the measurement date (including NAV for open-end mutual funds). Valuation adjustments are not applied to Level 1 investments.
> Level 2 — Valuations based on other significant observable inputs (including quoted prices for similar securities, interest rates, prepayment speeds, credit risks, etc.).
> Level 3 — Valuations based on significant unobservable inputs (including the Fund's own assumptions and judgment in determining the fair value of investments).
Inputs that are used in determining fair value of an investment may include price information, credit data, volatility statistics, and other factors. These inputs can be either observable or unobservable. The availability of observable inputs can vary between investments, and is affected by various factors such as the type of investment, and the volume and level of activity for that investment or similar investments in the marketplace. The inputs will be considered by the Investment Manager, along with any other relevant factors in the calculation of an investment's fair value. The Fund uses prices and inputs that are current as of the measurement date, which may include periods of market dislocations. During these periods, the availability of prices and inputs may be reduced for many investments. This condition could cause an investment to be reclassified between the various levels within the hierarchy.
Investments falling into the Level 3 category are primarily supported by quoted prices from brokers and dealers participating in the market for those investments. However, these may be classified as Level 3 investments due to lack of market transparency and corroboration to support these quoted prices. Additionally, valuation models may be used as the pricing source for any remaining investments classified as Level 3. These models may rely on one or more significant unobservable inputs and/or significant assumptions by the Investment Manager. Inputs used in valuations may include, but are not limited to, financial statement analysis, capital account balances, discount rates and estimated cash flows, and comparable company data.
Under the direction of the Fund's Board of Trustees (the Board), the Investment Manager's Valuation Committee (the Committee) is responsible for overseeing the valuation procedures approved by the Board. The Committee consists of voting and non-voting members from various groups within the Investment Manager's organization, including operations and accounting, trading and investments, compliance, risk management and legal.
The Committee meets at least monthly to review and approve valuation matters, which may include a description of specific valuation determinations, data regarding pricing information received from approved pricing vendors and brokers and the results of Board-approved valuation control policies and procedures (the Policies). The Policies address, among other things, instances when market quotations are or are not readily available, including recommendations of third party pricing vendors and a determination of appropriate pricing methodologies; events that require specific valuation determinations and assessment of fair value techniques; securities with a potential for stale pricing, including those that are illiquid, restricted, or in default; and the effectiveness of third party pricing vendors, including periodic reviews of vendors. The Committee meets more frequently, as needed, to discuss additional valuation matters, which may include the need to review back-testing results, review time-sensitive information or approve related valuation actions. The Committee reports to the Board, with members of the Committee meeting with the Board at each of its regularly scheduled meetings to discuss valuation matters and actions during the period, similar to those described earlier.
For investments categorized as Level 3, the Committee monitors information similar to that described above, which may include: (i) data specific to the issuer or comparable issuers, (ii) general market or specific sector news and (iii) quoted prices and specific or similar security transactions. The Committee considers this data and any changes from prior periods in order to assess the reasonableness of observable and unobservable inputs, any assumptions or internal models used to value those securities and changes in fair value. This data is also used to corroborate, when available, information received from approved pricing vendors and brokers. Various factors impact the frequency of monitoring this information (which may occur as often as daily). However, the Committee may determine that changes to inputs, assumptions and models are not required as a result of the monitoring procedures performed.
The accompanying Notes to Financial Statements are an integral part of this statement.
Annual Report 2014
13
Columbia International Bond Fund
Portfolio of Investments (continued)
October 31, 2014
Fair Value Measurements (continued)
The following table is a summary of the inputs used to value the Fund's investments at October 31, 2014:
Description | | Level 1
Quoted Prices in Active
Markets for Identical
Assets ($) | | Level 2
Other Significant
Observable Inputs ($) | | Level 3
Significant
Unobservable Inputs ($) | | Total ($) | |
Bonds | |
Corporate Bonds & Notes | | | — | | | | 2,855,055 | | | | — | | | | 2,855,055 | | |
Inflation-Indexed Bonds | | | — | | | | 2,917,463 | | | | — | | | | 2,917,463 | | |
Foreign Government Obligations | | | — | | | | 66,232,074 | | | | — | | | | 66,232,074 | | |
Total Bonds | | | — | | | | 72,004,592 | | | | — | | | | 72,004,592 | | |
Mutual Funds | |
Money Market Funds | | | 1,451,820 | | | | — | | | | — | | | | 1,451,820 | | |
Total Mutual Funds | | | 1,451,820 | | | | — | | | | — | | | | 1,451,820 | | |
Investments in Securities | | | 1,451,820 | | | | 72,004,592 | | | | — | | | | 73,456,412 | | |
Derivatives | |
Assets | |
Forward Foreign Currency Exchange Contracts | | | — | | | | 209,360 | | | | — | | | | 209,360 | | |
Futures Contracts | | | 218,928 | | | | — | | | | — | | | | 218,928 | | |
Swap Contracts | | | — | | | | 38,443 | | | | — | | | | 38,443 | | |
Liabilities | |
Forward Foreign Currency Exchange Contracts | | | — | | | | (105,462 | ) | | | — | | | | (105,462 | ) | |
Futures Contracts | | | (122,288 | ) | | | — | | | | — | | | | (122,288 | ) | |
Swap Contracts | | | — | | | | (35,312 | ) | | | — | | | | (35,312 | ) | |
Total | | | 1,548,460 | | | | 72,111,621 | | | | — | | | | 73,660,081 | | |
See the Portfolio of Investments for all investment classifications not indicated in the table.
The Fund's assets assigned to the Level 2 input category are generally valued using the market approach, in which a security's value is determined through reference to prices and information from market transactions for similar or identical assets.
There were no transfers of financial assets between levels during the period.
Derivative instruments are valued at unrealized appreciation (depreciation).
The accompanying Notes to Financial Statements are an integral part of this statement.
Annual Report 2014
14
Columbia International Bond Fund
Statement of Assets and Liabilities
October 31, 2014
Assets | |
Investments, at value | |
Unaffiliated issuers (identified cost $73,901,321) | | $ | 72,004,592 | | |
Affiliated issuers (identified cost $1,451,820) | | | 1,451,820 | | |
Total investments (identified cost $75,353,141) | | | 73,456,412 | | |
Foreign currency (identified cost $116,518) | | | 115,370 | | |
Margin deposits | | | 894,515 | | |
Unrealized appreciation on forward foreign currency exchange contracts | | | 209,360 | | |
Premiums paid on outstanding swap contracts | | | 911 | | |
Receivable for: | |
Investments sold | | | 192,158 | | |
Capital shares sold | | | 4,932 | | |
Dividends | | | 367 | | |
Interest | | | 850,229 | | |
Reclaims | | | 37,639 | | |
Variation margin | | | 53,089 | | |
Expense reimbursement due from Investment Manager | | | 232 | | |
Prepaid expenses | | | 491 | | |
Trustees' deferred compensation plan | | | 13,224 | | |
Total assets | | | 75,828,929 | | |
Liabilities | |
Unrealized depreciation on forward foreign currency exchange contracts | | | 105,462 | | |
Payable for: | |
Investments purchased | | | 73,442 | | |
Capital shares purchased | | | 18,523 | | |
Variation margin | | | 26,517 | | |
Investment management fees | | | 1,183 | | |
Distribution and/or service fees | | | 15 | | |
Transfer agent fees | | | 419 | | |
Administration fees | | | 166 | | |
Chief compliance officer expenses | | | 3 | | |
Accounting fees | | | 27,710 | | |
Other expenses | | | 6,560 | | |
Trustees' deferred compensation plan | | | 13,224 | | |
Total liabilities | | | 273,224 | | |
Net assets applicable to outstanding capital stock | | $ | 75,555,705 | | |
Represented by | |
Paid-in capital | | $ | 75,258,947 | | |
Undistributed net investment income | | | 1,179,686 | | |
Accumulated net realized gain | | | 833,790 | | |
Unrealized appreciation (depreciation) on: | |
Investments | | | (1,896,729 | ) | |
Foreign currency translations | | | (23,658 | ) | |
Forward foreign currency exchange contracts | | | 103,898 | | |
Futures contracts | | | 96,640 | | |
Swap contracts | | | 3,131 | | |
Total — representing net assets applicable to outstanding capital stock | | $ | 75,555,705 | | |
The accompanying Notes to Financial Statements are an integral part of this statement.
Annual Report 2014
15
Columbia International Bond Fund
Statement of Assets and Liabilities (continued)
October 31, 2014
Class A | |
Net assets | | $ | 1,447,178 | | |
Shares outstanding | | | 130,790 | | |
Net asset value per share | | $ | 11.06 | | |
Maximum offering price per share(a) | | $ | 11.61 | | |
Class C | |
Net assets | | $ | 157,579 | | |
Shares outstanding | | | 14,336 | | |
Net asset value per share | | $ | 10.99 | | |
Class I | |
Net assets | | $ | 73,001,097 | | |
Shares outstanding | | | 6,580,933 | | |
Net asset value per share | | $ | 11.09 | | |
Class W | |
Net assets | | $ | 40,862 | | |
Shares outstanding | | | 3,701 | | |
Net asset value per share | | $ | 11.04 | | |
Class Z | |
Net assets | | $ | 908,989 | | |
Shares outstanding | | | 82,030 | | |
Net asset value per share | | $ | 11.08 | | |
(a) The maximum offering price per share is calculated by dividing the net asset value per share by 1.0 minus the maximum sales charge of 4.75%.
The accompanying Notes to Financial Statements are an integral part of this statement.
Annual Report 2014
16
Columbia International Bond Fund
Statement of Operations
Year Ended October 31, 2014
Net investment income | |
Income: | |
Dividends — affiliated issuers | | $ | 2,490 | | |
Interest | | | 2,143,646 | | |
Foreign taxes withheld | | | (25,201 | ) | |
Total income | | | 2,120,935 | | |
Expenses: | |
Investment management fees | | | 344,763 | | |
Distribution and/or service fees | |
Class A | | | 3,791 | | |
Class C | | | 1,349 | | |
Class W | | | 771 | | |
Transfer agent fees | |
Class A | | | 2,787 | | |
Class C | | | 243 | | |
Class W | | | 753 | | |
Class Z | | | 10,571 | | |
Administration fees | | | 48,388 | | |
Compensation of board members | | | 22,211 | | |
Custodian fees | | | 13,602 | | |
Printing and postage fees | | | 26,586 | | |
Registration fees | | | 55,328 | | |
Professional fees | | | 29,482 | | |
Chief compliance officer expenses | | | 31 | | |
Other | | | 10,079 | | |
Total expenses | | | 570,735 | | |
Fees waived or expenses reimbursed by Investment Manager and its affiliates | | | (120,740 | ) | |
Total net expenses | | | 449,995 | | |
Net investment income | | | 1,670,940 | | |
Realized and unrealized gain (loss) — net | |
Net realized gain (loss) on: | |
Investments | | | 670,118 | | |
Foreign currency translations | | | (141,918 | ) | |
Forward foreign currency exchange contracts | | | 1,347,993 | | |
Futures contracts | | | (493,904 | ) | |
Swap contracts | | | (7 | ) | |
Increase from payment by affiliate (Note 6) | | | 18,180 | | |
Net realized gain | | | 1,400,462 | | |
Net change in unrealized appreciation (depreciation) on: | |
Investments | | | (2,473,959 | ) | |
Foreign currency translations | | | 8,806 | | |
Forward foreign currency exchange contracts | | | 69,650 | | |
Futures contracts | | | 270,737 | | |
Swap contracts | | | 3,131 | | |
Net change in unrealized depreciation | | | (2,121,635 | ) | |
Net realized and unrealized loss | | | (721,173 | ) | |
Net increase in net assets resulting from operations | | $ | 949,767 | | |
The accompanying Notes to Financial Statements are an integral part of this statement.
Annual Report 2014
17
Columbia International Bond Fund
Statement of Changes in Net Assets
| | | Year Ended
October 31,
2014 | | Year Ended
October 31,
2013 | |
Operations | |
Net investment income | | $ | 1,670,940 | | | $ | 1,636,511 | | |
Net realized gain (loss) | | | 1,400,462 | | | | (579,216 | ) | |
Net change in unrealized depreciation | | | (2,121,635 | ) | | | (3,061,955 | ) | |
Net increase (decrease) in net assets resulting from operations | | | 949,767 | | | | (2,004,660 | ) | |
Distributions to shareholders | |
Net investment income | |
Class A | | | (19,072 | ) | | | (28,349 | ) | |
Class C | | | (1,344 | ) | | | (1,901 | ) | |
Class I | | | (838,651 | ) | | | (779,855 | ) | |
Class W | | | (590 | ) | | | (63,316 | ) | |
Class Z | | | (29,000 | ) | | | (235,445 | ) | |
Total distributions to shareholders | | | (888,657 | ) | | | (1,108,866 | ) | |
Increase (decrease) in net assets from capital stock activity | | | 10,670,362 | | | | (669,850 | ) | |
Total increase (decrease) in net assets | | | 10,731,472 | | | | (3,783,376 | ) | |
Net assets at beginning of year | | | 64,824,233 | | | | 68,607,609 | | |
Net assets at end of year | | $ | 75,555,705 | | | $ | 64,824,233 | | |
Undistributed net investment income | | $ | 1,179,686 | | | $ | 8,133 | | |
The accompanying Notes to Financial Statements are an integral part of this statement.
Annual Report 2014
18
Columbia International Bond Fund
Statement of Changes in Net Assets (continued)
| | | Year Ended October 31, 2014 | | Year Ended October 31, 2013 | |
| | | Shares | | Dollars ($) | | Shares | | Dollars ($) | |
Capital stock activity | |
Class A shares | |
Subscriptions | | | 21,524 | | | | 237,438 | | | | 82,970 | | | | 942,084 | | |
Distributions reinvested | | | 1,577 | | | | 17,704 | | | | 2,353 | | | | 26,994 | | |
Redemptions | | | (43,222 | ) | | | (478,105 | ) | | | (112,934 | ) | | | (1,277,338 | ) | |
Net decrease | | | (20,121 | ) | | | (222,963 | ) | | | (27,611 | ) | | | (308,260 | ) | |
Class C shares | |
Subscriptions | | | 4,527 | | | | 50,566 | | | | 3,966 | | | | 45,469 | | |
Distributions reinvested | | | 81 | | | | 905 | | | | 138 | | | | 1,594 | | |
Redemptions | | | (2,826 | ) | | | (31,216 | ) | | | (11,363 | ) | | | (126,077 | ) | |
Net increase (decrease) | | | 1,782 | | | | 20,255 | | | | (7,259 | ) | | | (79,014 | ) | |
Class I shares | |
Subscriptions | | | 2,308,771 | | | | 25,586,240 | | | | 756,398 | | | | 8,441,218 | | |
Distributions reinvested | | | 74,561 | | | | 838,500 | | | | 68,323 | | | | 779,812 | | |
Redemptions | | | (384,700 | ) | | | (4,226,572 | ) | | | (204,106 | ) | | | (2,331,847 | ) | |
Net increase | | | 1,998,632 | | | | 22,198,168 | | | | 620,615 | | | | 6,889,183 | | |
Class W shares | |
Subscriptions | | | 3,745 | | | | 41,183 | | | | 128,934 | | | | 1,454,318 | | |
Distributions reinvested | | | 41 | | | | 457 | | | | 5,518 | | | | 63,280 | | |
Redemptions | | | (349,285 | ) | | | (3,814,051 | ) | | | (165,754 | ) | | | (1,851,195 | ) | |
Net decrease | | | (345,499 | ) | | | (3,772,411 | ) | | | (31,302 | ) | | | (333,597 | ) | |
Class Z shares | |
Subscriptions | | | 13,663 | | | | 150,357 | | | | 43,084 | | | | 492,663 | | |
Distributions reinvested | | | 296 | | | | 3,335 | | | | 456 | | | | 5,230 | | |
Redemptions | | | (681,255 | ) | | | (7,706,379 | ) | | | (659,599 | ) | | | (7,336,055 | ) | |
Net decrease | | | (667,296 | ) | | | (7,552,687 | ) | | | (616,059 | ) | | | (6,838,162 | ) | |
Total net increase (decrease) | | | 967,498 | | | | 10,670,362 | | | | (61,616 | ) | | | (669,850 | ) | |
The accompanying Notes to Financial Statements are an integral part of this statement.
Annual Report 2014
19
Columbia International Bond Fund
The following tables are intended to help you understand the Fund's financial performance. Certain information reflects financial results for a single share of a class held for the periods shown. Per share net investment income (loss) amounts are calculated based on average shares outstanding during the period. Total return assumes reinvestment of all dividends and distributions, if any. Total return does not reflect payment of sales charges, if any. Total return and portfolio turnover are not annualized for periods of less than one year. The portfolio turnover rate is calculated without regard to purchase and sales transactions of short-term instruments and certain derivatives, if any. If such transactions were included, the Fund's portfolio turnover rate may be higher.
| | | Year Ended October 31, | | Year Ended May 31, | |
Class A | | 2014 | | 2013 | | 2012(a) | | 2012 | | 2011 | | 2010 | |
Per share data | |
Net asset value, beginning of period | | $ | 11.09 | | | $ | 11.62 | | | $ | 11.06 | | | $ | 11.50 | | | $ | 10.28 | | | $ | 10.39 | | |
Income from investment operations: | |
Net investment income | | | 0.27 | | | | 0.24 | | | | 0.10 | | | | 0.26 | | | | 0.21 | | | | 0.19 | | |
Net realized and unrealized gain (loss) | | | (0.15 | ) | | | (0.61 | ) | | | 0.53 | | | | (0.42 | ) | | | 1.39 | | | | (0.07 | ) | |
Increase from payment by affiliate | | | 0.00 | (b) | | | — | | | | — | | | | — | | | | — | | | | — | | |
Total from investment operations | | | 0.12 | | | | (0.37 | ) | | | 0.63 | | | | (0.16 | ) | | | 1.60 | | | | 0.12 | | |
Less distributions to shareholders: | |
Net investment income | | | (0.15 | ) | | | (0.16 | ) | | | (0.07 | ) | | | (0.28 | ) | | | (0.36 | ) | | | (0.22 | ) | |
Net realized gains | | | — | | | | — | | | | — | | | | — | | | | (0.02 | ) | | | (0.01 | ) | |
Total distributions to shareholders | | | (0.15 | ) | | | (0.16 | ) | | | (0.07 | ) | | | (0.28 | ) | | | (0.38 | ) | | | (0.23 | ) | |
Redemption fees: | |
Redemption fees added to paid-in capital | | | — | | | | — | | | | — | | | | — | | | | — | | | | 0.00 | (b) | |
Net asset value, end of period | | $ | 11.06 | | | $ | 11.09 | | | $ | 11.62 | | | $ | 11.06 | | | $ | 11.50 | | | $ | 10.28 | | |
Total return | | | 1.03 | %(c) | | | (3.22 | %) | | | 5.70 | % | | | (1.40 | %) | | | 15.86 | % | | | 1.07 | % | |
Ratios to average net assets(d) | |
Total gross expenses | | | 1.34 | % | | | 1.36 | % | | | 1.57 | %(e) | | | 1.36 | % | | | 2.09 | % | | | 2.12 | % | |
Total net expenses(f) | | | 1.09 | % | | | 1.09 | %(g) | | | 1.10 | %(e) | | | 1.10 | % | | | 1.07 | %(g) | | | 1.05 | %(g) | |
Net investment income | | | 2.41 | % | | | 2.17 | % | | | 1.99 | %(e) | | | 2.29 | % | | | 1.90 | % | | | 1.78 | % | |
Supplemental data | |
Net assets, end of period (in thousands) | | $ | 1,447 | | | $ | 1,673 | | | $ | 2,074 | | | $ | 1,903 | | | $ | 1,254 | | | $ | 990 | | |
Portfolio turnover | | | 80 | % | | | 16 | % | | | 5 | % | | | 20 | % | | | 31 | % | | | 30 | % | |
Notes to Financial Highlights
(a) For the period from June 1, 2012 to October 31, 2012. During the period, the Fund's fiscal year end was changed from May 31 to October 31.
(b) Rounds to zero.
(c) The Fund received a payment from an affiliate. Had the Fund not received this payment, the total return would have been lower by 0.03%.
(d) In addition to the fees and expenses that the Fund bears directly, the Fund indirectly bears a pro rata share of the fees and expenses of any other funds in which it invests. Such indirect expenses are not included in the Fund's reported expense ratios.
(e) Annualized.
(f) Total net expenses include the impact of certain fee waivers/expense reimbursements made by the Investment Manager and certain of its affiliates, if applicable.
(g) The benefits derived from expense reductions had an impact of less than 0.01%.
The accompanying Notes to Financial Statements are an integral part of this statement.
Annual Report 2014
20
Columbia International Bond Fund
Financial Highlights (continued)
| | | Year Ended October 31, | | Year Ended May 31, | |
Class C | | 2014 | | 2013 | | 2012(a) | | 2012 | | 2011 | | 2010 | |
Per share data | |
Net asset value, beginning of period | | $ | 11.05 | | | $ | 11.61 | | | $ | 11.05 | | | $ | 11.49 | | | $ | 10.27 | | | $ | 10.39 | | |
Income from investment operations: | |
Net investment income | | | 0.18 | | | | 0.16 | | | | 0.06 | | | | 0.18 | | | | 0.12 | | | | 0.11 | | |
Net realized and unrealized gain (loss) | | | (0.14 | ) | | | (0.62 | ) | | | 0.53 | | | | (0.42 | ) | | | 1.40 | | | | (0.08 | ) | |
Increase from payment by affiliate | | | 0.00 | (b) | | | — | | | | — | | | | — | | | | — | | | | — | | |
Total from investment operations | | | 0.04 | | | | (0.46 | ) | | | 0.59 | | | | (0.24 | ) | | | 1.52 | | | | 0.03 | | |
Less distributions to shareholders: | |
Net investment income | | | (0.10 | ) | | | (0.10 | ) | | | (0.03 | ) | | | (0.20 | ) | | | (0.28 | ) | | | (0.14 | ) | |
Net realized gains | | | — | | | | — | | | | — | | | | — | | | | (0.02 | ) | | | (0.01 | ) | |
Total distributions to shareholders | | | (0.10 | ) | | | (0.10 | ) | | | (0.03 | ) | | | (0.20 | ) | | | (0.30 | ) | | | (0.15 | ) | |
Redemption fees: | |
Redemption fees added to paid-in capital | | | — | | | | — | | | | — | | | | — | | | | — | | | | 0.00 | (b) | |
Net asset value, end of period | | $ | 10.99 | | | $ | 11.05 | | | $ | 11.61 | | | $ | 11.05 | | | $ | 11.49 | | | $ | 10.27 | | |
Total return | | | 0.38 | %(c) | | | (4.01 | %) | | | 5.37 | % | | | (2.10 | %) | | | 15.01 | % | | | 0.21 | % | |
Ratios to average net assets(d) | |
Total gross expenses | | | 2.09 | % | | | 2.11 | % | | | 2.30 | %(e) | | | 2.10 | % | | | 2.85 | % | | | 2.87 | % | |
Total net expenses(f) | | | 1.84 | % | | | 1.84 | %(g) | | | 1.85 | %(e) | | | 1.85 | % | | | 1.83 | %(g) | | | 1.80 | %(g) | |
Net investment income | | | 1.67 | % | | | 1.41 | % | | | 1.23 | %(e) | | | 1.58 | % | | | 1.10 | % | | | 1.06 | % | |
Supplemental data | |
Net assets, end of period (in thousands) | | $ | 158 | | | $ | 139 | | | $ | 230 | | | $ | 240 | | | $ | 418 | | | $ | 355 | | |
Portfolio turnover | | | 80 | % | | | 16 | % | | | 5 | % | | | 20 | % | | | 31 | % | | | 30 | % | |
Notes to Financial Highlights
(a) For the period from June 1, 2012 to October 31, 2012. During the period, the Fund's fiscal year end was changed from May 31 to October 31.
(b) Rounds to zero.
(c) The Fund received a payment from an affiliate. Had the Fund not received this payment, the total return would have been lower by 0.03%.
(d) In addition to the fees and expenses that the Fund bears directly, the Fund indirectly bears a pro rata share of the fees and expenses of any other funds in which it invests. Such indirect expenses are not included in the Fund's reported expense ratios.
(e) Annualized.
(f) Total net expenses include the impact of certain fee waivers/expense reimbursements made by the Investment Manager and certain of its affiliates, if applicable.
(g) The benefits derived from expense reductions had an impact of less than 0.01%.
The accompanying Notes to Financial Statements are an integral part of this statement.
Annual Report 2014
21
Columbia International Bond Fund
Financial Highlights (continued)
| | | Year Ended October 31, | | Year Ended May 31, | |
Class I | | 2014 | | 2013 | | 2012(a) | | 2012 | | 2011(b) | |
Per share data | |
Net asset value, beginning of period | | $ | 11.09 | | | $ | 11.62 | | | $ | 11.06 | | | $ | 11.48 | | | $ | 11.34 | | |
Income from investment operations: | |
Net investment income | | | 0.31 | | | | 0.28 | | | | 0.11 | | | | 0.29 | | | | 0.23 | | |
Net realized and unrealized gain (loss) | | | (0.14 | ) | | | (0.62 | ) | | | 0.53 | | | | (0.40 | ) | | | 0.25 | | |
Increase from payment by affiliate | | | 0.00 | (c) | | | — | | | | — | | | | — | | | | — | | |
Total from investment operations | | | 0.17 | | | | (0.34 | ) | | | 0.64 | | | | (0.11 | ) | | | 0.48 | | |
Less distributions to shareholders: | |
Net investment income | | | (0.17 | ) | | | (0.19 | ) | | | (0.08 | ) | | | (0.31 | ) | | | (0.32 | ) | |
Net realized gains | | | — | | | | — | | | | — | | | | — | | | | (0.02 | ) | |
Total distributions to shareholders | | | (0.17 | ) | | | (0.19 | ) | | | (0.08 | ) | | | (0.31 | ) | | | (0.34 | ) | |
Net asset value, end of period | | $ | 11.09 | | | $ | 11.09 | | | $ | 11.62 | | | $ | 11.06 | | | $ | 11.48 | | |
Total return | | | 1.49 | %(d) | | | (2.94 | %) | | | 5.82 | % | | | (0.95 | %) | | | 4.44 | % | |
Ratios to average net assets(e) | |
Total gross expenses | | | 0.91 | % | | | 0.88 | % | | | 1.13 | %(f) | | | 0.97 | % | | | 1.33 | %(f) | |
Total net expenses(g) | | | 0.72 | % | | | 0.74 | % | | | 0.79 | %(f) | | | 0.81 | % | | | 0.84 | %(f)(h) | |
Net investment income | | | 2.79 | % | | | 2.52 | % | | | 2.29 | %(f) | | | 2.59 | % | | | 2.96 | %(f) | |
Supplemental data | |
Net assets, end of period (in thousands) | | $ | 73,001 | | | $ | 50,832 | | | $ | 46,022 | | | $ | 44,311 | | | $ | 29,870 | | |
Portfolio turnover | | | 80 | % | | | 16 | % | | | 5 | % | | | 20 | % | | | 31 | % | |
Notes to Financial Highlights
(a) For the period from June 1, 2012 to October 31, 2012. During the period, the Fund's fiscal year end was changed from May 31 to October 31.
(b) Based on operations from September 27, 2010 (commencement of operations) through the stated period end.
(c) Rounds to zero.
(d) The Fund received a payment from an affiliate. Had the Fund not received this payment, the total return would have been lower by 0.03%.
(e) In addition to the fees and expenses that the Fund bears directly, the Fund indirectly bears a pro rata share of the fees and expenses of any other funds in which it invests. Such indirect expenses are not included in the Fund's reported expense ratios.
(f) Annualized.
(g) Total net expenses include the impact of certain fee waivers/expense reimbursements made by the Investment Manager and certain of its affiliates, if applicable.
(h) The benefits derived from expense reductions had an impact of less than 0.01%.
The accompanying Notes to Financial Statements are an integral part of this statement.
Annual Report 2014
22
Columbia International Bond Fund
Financial Highlights (continued)
| | | Year Ended October 31, | |
Class W | | 2014 | | 2013 | | 2012(a) | |
Per share data | |
Net asset value, beginning of period | | $ | 11.09 | | | $ | 11.62 | | | $ | 11.21 | | |
Income from investment operations: | |
Net investment income | | | 0.24 | | | | 0.24 | | | | 0.09 | | |
Net realized and unrealized gain (loss) | | | (0.14 | ) | | | (0.61 | ) | | | 0.39 | | |
Increase from payment by affiliate | | | 0.00 | (b) | | | — | | | | — | | |
Total from investment operations | | | 0.10 | | | | (0.37 | ) | | | 0.48 | | |
Less distributions to shareholders: | |
Net investment income | | | (0.15 | ) | | | (0.16 | ) | | | (0.07 | ) | |
Total distributions to shareholders | | | (0.15 | ) | | | (0.16 | ) | | | (0.07 | ) | |
Net asset value, end of period | | $ | 11.04 | | | $ | 11.09 | | | $ | 11.62 | | |
Total return | | | 0.85 | %(c) | | | (3.22 | %) | | | 4.27 | % | |
Ratios to average net assets(d) | |
Total gross expenses | | | 1.35 | % | | | 1.36 | % | | | 1.63 | %(e) | |
Total net expenses(f) | | | 1.09 | % | | | 1.09 | %(g) | | | 1.10 | %(e) | |
Net investment income | | | 1.97 | % | | | 2.17 | % | | | 2.04 | %(e) | |
Supplemental data | |
Net assets, end of period (in thousands) | | $ | 41 | | | $ | 3,872 | | | $ | 4,421 | | |
Portfolio turnover | | | 80 | % | | | 16 | % | | | 5 | % | |
Notes to Financial Highlights
(a) Based on operations from June 18, 2012 (commencement of operations) through the stated period end.
(b) Rounds to zero.
(c) The Fund received a payment from an affiliate. Had the Fund not received this payment, the total return would have been lower by 0.03%.
(d) In addition to the fees and expenses that the Fund bears directly, the Fund indirectly bears a pro rata share of the fees and expenses of any other funds in which it invests. Such indirect expenses are not included in the Fund's reported expense ratios.
(e) Annualized.
(f) Total net expenses include the impact of certain fee waivers/expense reimbursements made by the Investment Manager and certain of its affiliates, if applicable.
(g) The benefits derived from expense reductions had an impact of less than 0.01%.
The accompanying Notes to Financial Statements are an integral part of this statement.
Annual Report 2014
23
Columbia International Bond Fund
Financial Highlights (continued)
| | | Year Ended October 31, | | Year Ended May 31, | |
Class Z | | 2014 | | 2013 | | 2012(a) | | 2012 | | 2011 | | 2010 | |
Per share data | |
Net asset value, beginning of period | | $ | 11.09 | | | $ | 11.62 | | | $ | 11.06 | | | $ | 11.49 | | | $ | 10.28 | | | $ | 10.39 | | |
Income from investment operations: | |
Net investment income | | | 0.29 | | | | 0.27 | | | | 0.11 | | | | 0.29 | | | | 0.23 | | | | 0.21 | | |
Net realized and unrealized gain (loss) | | | (0.14 | ) | | | (0.62 | ) | | | 0.53 | | | | (0.41 | ) | | | 1.39 | | | | (0.06 | ) | |
Increase from payment by affiliate | | | 0.00 | (b) | | | — | | | | — | | | | — | | | | — | | | | — | | |
Total from investment operations | | | 0.15 | | | | (0.35 | ) | | | 0.64 | | | | (0.12 | ) | | | 1.62 | | | | 0.15 | | |
Less distributions to shareholders: | |
Net investment income | | | (0.16 | ) | | | (0.18 | ) | | | (0.08 | ) | | | (0.31 | ) | | | (0.39 | ) | | | (0.25 | ) | |
Net realized gains | | | — | | | | — | | | | — | | | | — | | | | (0.02 | ) | | | (0.01 | ) | |
Total distributions to shareholders | | | (0.16 | ) | | | (0.18 | ) | | | (0.08 | ) | | | (0.31 | ) | | | (0.41 | ) | | | (0.26 | ) | |
Redemption fees: | |
Redemption fees added to paid-in capital | | | — | | | | — | | | | — | | | | — | | | | — | | | | 0.00 | (b) | |
Net asset value, end of period | | $ | 11.08 | | | $ | 11.09 | | | $ | 11.62 | | | $ | 11.06 | | | $ | 11.49 | | | $ | 10.28 | | |
Total return | | | 1.34 | %(c) | | | (3.01 | %) | | | 5.81 | % | | | (1.06 | %) | | | 16.05 | % | | | 1.31 | % | |
Ratios to average net assets(d) | |
Total gross expenses | | | 1.09 | % | | | 1.12 | % | | | 1.30 | %(e) | | | 1.10 | % | | | 1.85 | % | | | 1.87 | % | |
Total net expenses(f) | | | 0.84 | % | | | 0.84 | %(g) | | | 0.85 | %(e) | | | 0.85 | % | | | 0.83 | %(g) | | | 0.80 | %(g) | |
Net investment income | | | 2.64 | % | | | 2.40 | % | | | 2.23 | %(e) | | | 2.56 | % | | | 2.11 | % | | | 1.98 | % | |
Supplemental data | |
Net assets, end of period (in thousands) | | $ | 909 | | | $ | 8,308 | | | $ | 15,860 | | | $ | 15,311 | | | $ | 15,745 | | | $ | 14,562 | | |
Portfolio turnover | | | 80 | % | | | 16 | % | | | 5 | % | | | 20 | % | | | 31 | % | | | 30 | % | |
Notes to Financial Highlights
(a) For the period from June 1, 2012 to October 31, 2012. During the period, the Fund's fiscal year end was changed from May 31 to October 31.
(b) Rounds to zero.
(c) The Fund received a payment from an affiliate. Had the Fund not received this payment, the total return would have been lower by 0.03%.
(d) In addition to the fees and expenses that the Fund bears directly, the Fund indirectly bears a pro rata share of the fees and expenses of any other funds in which it invests. Such indirect expenses are not included in the Fund's reported expense ratios.
(e) Annualized.
(f) Total net expenses include the impact of certain fee waivers/expense reimbursements made by the Investment Manager and certain of its affiliates, if applicable.
(g) The benefits derived from expense reductions had an impact of less than 0.01%.
The accompanying Notes to Financial Statements are an integral part of this statement.
Annual Report 2014
24
Columbia International Bond Fund
Notes to Financial Statements
October 31, 2014
Note 1. Organization
Columbia International Bond Fund (the Fund), a series of Columbia Funds Series Trust I (the Trust), is a non-diversified fund. The Trust is registered under the Investment Company Act of 1940, as amended (the 1940 Act), as an open-end management investment company organized as a Massachusetts business trust.
Fund Shares
The Trust may issue an unlimited number of shares (without par value). The Fund offers Class A, Class C, Class I, Class W and Class Z shares. Although all share classes generally have identical voting, dividend and liquidation rights, each share class votes separately when required by the Trust's organizational documents or by law. Different share classes pay different distribution amounts to the extent the expenses of such share classes differ, and distributions in liquidation will be proportional to the net asset value of each share class. Each share class has its own expense structure and sales charges.
Class A shares are subject to a maximum front-end sales charge of 4.75% based on the initial investment amount. Class A shares purchased without an initial sales charge in accounts aggregating $1 million to $50 million at the time of purchase are subject to a contingent deferred sales charge (CDSC) if the shares are sold within 18 months of purchase, charged as follows: 1.00% CDSC if redeemed within 12 months of purchase, and 0.50% CDSC if redeemed more than 12, but less than 18, months after purchase.
Class C shares are subject to a 1.00% CDSC on shares redeemed within one year of purchase.
Class I shares are not subject to sales charges and are available only to the Columbia Family of Funds.
Class W shares are not subject to sales charges and are available only to investors purchasing through authorized investment programs managed by investment professionals, including discretionary managed account programs.
Class Z shares are not subject to sales charges and are available only to eligible investors, which are subject to different investment minimums as described in the Fund's prospectus.
Note 2. Summary of Significant Accounting Policies
Basis of Preparation
The Fund is an investment company that applies the accounting and reporting guidance in the Financial Accounting Standards Board (FASB) Accounting Standards Codification Topic 946, Financial Services — Investment Companies (ASC 946). The financial statements are prepared in accordance with U.S.
generally accepted accounting principles (GAAP) which requires management to make certain estimates and assumptions that affect the reported amounts of assets and liabilities, the disclosure of contingent assets and liabilities at the date of the financial statements and the reported amounts of income and expenses during the reporting period. Actual results could differ from those estimates.
The following is a summary of significant accounting policies followed by the Fund in the preparation of its financial statements.
Security Valuation
Debt securities generally are valued by pricing services approved by the Board of Trustees (the Board) based upon market transactions for normal, institutional-size trading units of similar securities. The services may use various pricing techniques that take into account, as applicable, factors such as yield, quality, coupon rate, maturity, type of issue, trading characteristics and other data, as well as broker quotes. Debt securities for which quotations are readily available may also be valued based upon an over-the-counter or exchange bid quotation.
Investments in open-end investment companies, including money market funds, are valued at their net asset value.
Forward foreign currency exchange contracts are marked-to-market based upon foreign currency exchange rates provided by a pricing service.
Futures and options on futures contracts are valued based upon the settlement price established each day by the board of trade or exchange on which they are traded.
Swap transactions are valued through an independent pricing service or broker, or if neither is available, through an internal model based upon observable inputs.
Investments for which market quotations are not readily available, or that have quotations which management believes are not reliable, are valued at fair value as determined in good faith under procedures established by and under the general supervision of the Board. If a security or class of securities (such as foreign securities) is valued at fair value, such value is likely to be different from the quoted or published price for the security.
The determination of fair value often requires significant judgment. To determine fair value, management may use assumptions including but not limited to future cash flows and estimated risk premiums. Multiple inputs from various sources may be used to determine fair value.
Foreign Currency Transactions and Translations
The values of all assets and liabilities denominated in foreign currencies are generally translated into U.S. dollars at
Annual Report 2014
25
Columbia International Bond Fund
Notes to Financial Statements (continued)
October 31, 2014
exchange rates determined at the close of the New York Stock Exchange. Net realized and unrealized gains (losses) on foreign currency transactions and translations include gains (losses) arising from the fluctuation in exchange rates between trade and settlement dates on securities transactions, gains (losses) arising from the disposition of foreign currency and currency gains (losses) between the accrual and payment dates on dividends, interest income and foreign withholding taxes.
For financial statement purposes, the Fund does not distinguish that portion of gains (losses) on investments which is due to changes in foreign exchange rates from that which is due to changes in market prices of the investments. Such fluctuations are included with the net realized and unrealized gains (losses) on investments in the Statement of Operations.
Derivative Instruments
The Fund invests in certain derivative instruments, as detailed below, to meet its investment objectives. Derivatives are instruments whose values depend on, or are derived from, in whole or in part, the value of one or more other assets, such as securities, currencies, commodities or indices. Derivative instruments may be used to increase investment flexibility (including to maintain cash reserves while maintaining exposure to certain other assets), for risk management (hedging) purposes, to facilitate trading, to reduce transaction costs and to pursue higher investment returns. The Fund may also use derivative instruments to mitigate certain investment risks, such as foreign currency exchange rate risk, interest rate risk and credit risk. Derivatives may involve various risks, including the potential inability of the counterparty to fulfill its obligation under the terms of the contract, the potential for an illiquid secondary market (making it difficult for the Fund to sell, including at favorable prices) and the potential for market movements which may expose the Fund to gains or losses in excess of the amount shown in the Statement of Assets and Liabilities. The notional amounts of derivative instruments, if applicable, are not recorded in the financial statements.
A derivative instrument may suffer a marked-to-market loss if the value of the contract decreases due to an unfavorable change in the market rates or values of the underlying instrument. Losses can also occur if the counterparty does not perform under the contract. The Fund's risk of loss from counterparty credit risk on over-the-counter derivatives is generally limited to the aggregate unrealized gain netted against any collateral held by the Fund and the amount of any variation margin held by the counterparty. With exchange-traded or centrally cleared derivatives, there is reduced counterparty credit risk to the Fund since the exchange's clearinghouse, as counterparty to such instruments, guarantees
against a possible default. The clearinghouse stands between the buyer and the seller of the contract; therefore, the counterparty credit risk is failure of the clearinghouse. However, credit risk still exists in exchange-traded or centrally cleared derivatives with respect to initial and variation margin that is held in a broker's customer account. While brokers are required to segregate customer margin from their own assets, in the event that a broker becomes insolvent or goes into bankruptcy and at that time there is a shortfall in the aggregate amount of margin held by the broker for all its clients, U.S. bankruptcy laws will typically allocate that shortfall on a pro-rata basis across all the broker's customers (including the Fund), potentially resulting in losses to the Fund.
In order to better define its contractual rights and to secure rights that will help the Fund mitigate its counterparty risk, the Fund may enter into an International Swaps and Derivatives Association, Inc. Master Agreement (ISDA Master Agreement) or similar agreement with its derivative contract counterparties. An ISDA Master Agreement is an agreement between the Fund and a counterparty that governs over-the-counter derivatives and forward foreign currency exchange contracts and typically contains, among other things, collateral posting terms and netting provisions in the event of a default and/or termination event. Under an ISDA Master Agreement, the Fund may, under certain circumstances, offset with the counterparty certain derivative instrument's payables and/or receivables with collateral held and/or posted and create one single net payment. The provisions of the ISDA Master Agreement typically permit a single net payment in the event of default (close-out netting) including the bankruptcy or insolvency of the counterparty. Note, however, that bankruptcy or insolvency laws of a particular jurisdiction may impose restrictions on or prohibitions against the right of offset in bankruptcy, insolvency or other events.
Collateral (margin) requirements differ by type of derivative. Margin requirements are established by the exchange or clearinghouse for exchange-traded and centrally cleared derivatives. Brokers can ask for margin in excess of the minimum in certain circumstances. Collateral terms are contract specific for over-the-counter derivatives. For over-the-counter derivatives traded under an ISDA Master Agreement, the collateral requirements are typically calculated by netting the marked-to-market amount for each transaction under such agreement and comparing that amount to the value of any variation margin currently pledged by the Fund and/or the counterparty. Generally, the amount of collateral due from or to a party has to exceed a minimum transfer amount threshold (e.g., $500,000) before a transfer has to be made. To the extent amounts due to the Fund from its counterparties are not fully collateralized, contractually or otherwise, the Fund bears the
Annual Report 2014
26
Columbia International Bond Fund
Notes to Financial Statements (continued)
October 31, 2014
risk of loss from counterparty nonperformance. The Fund attempts to mitigate counterparty risk by only entering into agreements with counterparties that it believes have the financial resources to honor their obligations and by monitoring the financial stability of those counterparties.
Certain ISDA Master Agreements allow counterparties to over-the-counter derivatives to terminate derivative contracts prior to maturity in the event the Fund's net assets decline by a stated percentage over a specified time period or if the Fund fails to meet the terms of the ISDA Master Agreement, which would cause the Fund to accelerate payment of any net liability owed to the counterparty. The Fund also has termination rights if the counterparty fails to meet the terms of the ISDA Master Agreement. In addition to considering counterparty credit risk, the Fund would consider terminating the derivative contracts based on whether termination would result in a net liability owed from the counterparty.
For financial reporting purposes, the Fund does not offset derivative assets and derivative liabilities that are subject to netting arrangements in the Statement of Assets and Liabilities.
Forward Foreign Currency Exchange Contracts
Forward foreign currency exchange contracts are over-the-counter agreements between two parties to buy and sell a currency at a set price on a future date. The Fund utilized forward foreign currency exchange contracts to hedge the currency exposure associated with some or all of the Fund's securities, to shift foreign currency exposure back to U.S. dollars and to shift investment exposure from one currency to another, to generate total return through long and short currency positions versus the U.S. dollar. These instruments may be used for other purposes in future periods.
The values of forward foreign currency exchange contracts fluctuate daily with changes in foreign currency exchange rates. Changes in the value of these contracts are recorded as unrealized appreciation or depreciation until the contract is exercised or has expired. The Fund will realize a gain or loss when the forward foreign currency exchange contract is closed or expires.
The use of forward foreign currency exchange contracts does not eliminate fluctuations in the prices of the Fund's portfolio securities. The risks of forward foreign currency exchange contracts include movement in the values of the foreign currencies relative to the U.S. dollar (or other foreign currencies) and the possibility that counterparties will not complete their contractual obligations, which may be in excess of the amount reflected, if any, in the Statement of Assets and Liabilities.
Futures Contracts
Futures contracts are exchange traded and represent commitments for the future purchase or sale of an asset at a specified price on a specified date. The Fund bought and sold futures contracts to manage the duration and yield curve exposure of the Fund versus the benchmark and manage exposure to movements in interest rates. These instruments may be used for other purposes in future periods. Upon entering into futures contracts, the Fund bears risks that it may not achieve the anticipated benefits of the futures contracts and may realize a loss. Additional risks include counterparty credit risk, the possibility of an illiquid market, and that a change in the value of the contract or option may not correlate with changes in the value of the underlying asset.
Upon entering into a futures contract, the Fund pledges cash or securities with the broker in an amount sufficient to meet the initial margin requirement. The initial margin deposit must be maintained at an established level over the life of the contract. Cash deposited as initial margin is recorded in the Statement of Assets and Liabilities as margin deposits. Securities deposited as initial margin are designated in the Portfolio of Investments. Subsequent payments (variation margin) are made or received by the Fund each day. The variation margin payments are equal to the daily change in the contract value and are recorded as variation margin receivable or payable and are offset in unrealized gains or losses. The Fund recognizes a realized gain or loss when the contract is closed or expires. Futures contracts involve, to varying degrees, risk of loss in excess of the variation margin disclosed in the Statement of Assets and Liabilities.
Swap Contracts
Swap contracts are privately negotiated in the over-the-counter market and may be entered into as a bilateral contract or centrally cleared (centrally cleared swap contract). In a centrally cleared swap contract, immediately following execution of the swap contract with a broker, the swap contract is novated to a central counterparty (the CCP) and the CCP becomes the Fund's counterparty to the centrally cleared swap contract. The Fund is required to deposit initial margin with the broker in the form of cash or securities in an amount that varies depending on the size and risk profile of the particular swap contract. Securities deposited as initial margin are designated in the Portfolio of Investments and cash deposited is recorded in the Statement of Assets and Liabilities as margin deposits. Unlike a bilateral swap contract, for centrally cleared swap contracts, the Fund has minimal credit exposure to the counterparty because the CCP stands between the Fund and the counterparty. Swap contracts are marked-to-market daily and changes in value are recorded as unrealized
Annual Report 2014
27
Columbia International Bond Fund
Notes to Financial Statements (continued)
October 31, 2014
appreciation (depreciation). The daily change in valuation of centrally cleared swap contracts, if any, is recorded as a receivable or payable for variation margin in the Statements of Assets and Liabilities.
Interest Rate Swap Contracts
The Fund entered into interest rate swap transactions to gain exposure to or protect itself from market rate changes. These instruments may be used for other purposes in future periods. Interest rate swaps are agreements between two parties that involve the exchange of one type of interest rate for another type of interest rate cash flow on specified dates in the future, based on a predetermined, specified notional amount. Certain interest rate swaps are considered forward-starting, whereby the accrual for the exchange of cash flows does not begin until a specified date in the future (the effective date). The net cash flow for a standard interest rate swap transaction is generally the difference between a floating market interest rate versus a fixed interest rate.
Interest rate swaps are valued daily and unrealized appreciation (depreciation) is recorded. Certain interest rate swaps may accrue periodic interest on a daily basis as a component of unrealized appreciation (depreciation); the Fund will realize a gain or loss upon the payment or receipt of accrued interest. The Fund will realize a gain or a loss when the interest rate swap is terminated.
Risks of entering into interest rate swaps include a lack of correlation between the swaps and the portfolio of bonds the
swaps are designed to hedge or replicate. A lack of correlation may cause the interest rate swaps to experience adverse changes in value relative to expectations. In addition, interest rate swaps are subject to the risk of default of a counterparty, and the risk of adverse movements in market interest rates relative to the interest rate swap positions taken. The Fund's maximum risk of loss from counterparty credit risk is the discounted net value of the cash flows to be received from/paid to the counterparty over the contract's remaining life to the extent that such amount is positive, plus the cost of entering into a similar transaction with another counterparty.
The Fund attempts to mitigate counterparty credit risk by entering into interest rate swap transactions only with counterparties that meet prescribed levels of creditworthiness, as determined by the Investment Manager. The Fund and any counterparty are required to maintain an agreement that requires the Fund and that counterparty to monitor (on a daily basis) the net market value of all derivative transactions entered into pursuant to the agreement between the Fund and such counterparty. If the net market value of such derivatives transactions between the Fund and that counterparty exceeds a certain threshold (as defined in the agreement), the Fund or the counterparty is required to post cash and/or securities as collateral. Market values of derivatives transactions presented in the financial statements are not netted with the market values of other derivatives transactions or with any collateral amounts posted by the Fund or any counterparty.
Offsetting of Derivative Assets and Derivative Liabilities
The following tables present the Fund's gross and net amount of assets and liabilities available for offset under netting arrangements as well as any related collateral received or pledged by the Fund as of October 31, 2014:
| | | | | | | | Gross Amounts Not Offset in
the Statement of Assets and Liabilities | | | |
| | Gross
Amounts of
Recognized
Assets ($) | | Gross Amounts
Offset in the
Statement of
Assets and
Liabilities ($) | | Net Amounts of
Assets
Presented in the
Statement of
Assets and
Liabilities ($) | | Financial
Instruments ($)(a) | | Cash
Collateral
Received ($) | | Securities
Collateral
Received ($) | | Net
Amount ($)(b) | |
Asset Derivatives: | |
Forward Foreign Currency
Exchange Contracts | | | 209,360 | | | | — | | | | 209,360 | | | | 37,215 | | | | — | | | | — | | | | 172,145 | | |
Centrally Cleared Swap
Contracts(c) | | | 51,510 | | | | — | | | | 51,510 | | | | — | | | | — | | | | — | | | | 51,510 | | |
Total | | | 260,870 | | | | — | | | | 260,870 | | | | 37,215 | | | | — | | | | — | | | | 223,655 | | |
Annual Report 2014
28
Columbia International Bond Fund
Notes to Financial Statements (continued)
October 31, 2014
| | | | | | | | Gross Amounts Not Offset in
the Statement of Assets and Liabilities | | | |
| | Gross
Amounts of
Recognized
Liabilities ($) | | Gross Amounts
Offset in the
Statement of
Assets and
Liabilities ($) | | Net Amounts of
Liabilities
Presented in the
Statement of
Assets and
Liabilities ($) | | Financial
Instruments ($)(d) | | Cash
Collateral
Pledged ($) | | Securities
Collateral
Pledged ($) | | Net
Amount($)(e) | |
Liability Derivatives: | |
Forward Foreign Currency
Exchange Contracts | | | 105,462 | | | | — | | | | 105,462 | | | | 37,215 | | | | — | | | | — | | | | 68,247 | | |
Total | | | 105,462 | | | | — | | | | 105,462 | | | | 37,215 | | | | — | | | | — | | | | 68,247 | | |
(a) Represents the amount of assets that could be offset by liabilities with the same counterparty under master netting or similar agreements that management elects not to offset on the Statement of Assets and Liabilities.
(b) Represents the net amount due from counterparties in the event of default.
(c) Centrally cleared swaps are included within receivable for variation margin on the Statement of Assets and Liabilities.
(d) Represents the amount of liabilities that could be offset by assets with the same counterparty under master netting or similar agreements that management elects not to offset on the Statement of Assets and Liabilities.
(e) Represents the net amount due to counterparties in the event of default.
Effects of Derivative Transactions in the Financial Statements
The following tables are intended to provide additional information about the effect of derivatives on the financial statements of the Fund, including: the fair value of derivatives by risk category and the location of those fair values in the Statement of Assets and Liabilities; and the impact of derivative transactions over the period in the Statement of Operations, including realized gains or losses and unrealized gains or losses. The derivative schedules following the Portfolio of Investments present additional information regarding derivative instruments outstanding at the end of the period, if any.
The following table is a summary of the fair value of derivative instruments (not considered to be hedging instruments for accounting disclosure purposes) at October 31, 2014:
Asset Derivatives | |
Risk Exposure
Category | | Statement of Assets and
Liabilities Location | | Fair Value ($) | |
Foreign exchange
risk
| | Unrealized appreciation on
forward foreign currency
exchange contracts | | | 209,360
| | |
Interest rate risk
| | Net assets — unrealized
appreciation on futures
contracts | | | 218,928
| * | |
Interest rate risk
| | Net assets — unrealized
appreciation on swap
contracts | | | 38,443
| * | |
Interest rate risk
| | Premiums paid on
outstanding swap
contracts | | | 911
| | |
Total | | | | | 467,642 | | |
Liability Derivatives | |
Risk Exposure
Category | | Statement of Assets and
Liabilities Location | | Fair Value ($) | |
Foreign exchange
risk
| | Unrealized depreciation on
forward foreign currency
exchange contracts | | | 105,462
| | |
Interest rate risk
| | Net assets — unrealized
depreciation on futures
contracts | | | 122,288
| * | |
Interest rate risk
| | Net assets — unrealized
depreciation on swap
contracts | | | 35,312
| * | |
Total | | | | | 263,062 | | |
*Includes cumulative appreciation (depreciation) as reported in the tables following the Portfolio of Investments. Only the current day's variation margin is reported in receivables or payables in the Statement of Assets and Liabilities.
Annual Report 2014
29
Columbia International Bond Fund
Notes to Financial Statements (continued)
October 31, 2014
The following table indicates the effect of derivative instruments (not considered to be hedging instruments for accounting disclosure purposes) in the Statement of Operations for the year ended October 31, 2014:
Amount of Realized Gain (Loss) on Derivatives Recognized in Income | |
Risk Exposure Category | | Forward Foreign
Currency Exchange
Contracts ($) | | Futures
Contracts ($) | | Swap
Contracts ($) | | Total ($) | |
Foreign exchange risk | | | 1,347,993 | | | | — | | | | — | | | | 1,347,993 | | |
Interest rate risk | | | — | | | | (493,904 | ) | | | (7 | ) | | | (493,911 | ) | |
Total | | | 1,347,993 | | | | (493,904 | ) | | | (7 | ) | | | 854,082 | | |
Change in Unrealized Appreciation (Depreciation) on Derivatives Recognized in Income | |
Risk Exposure Category | | Forward Foreign
Currency Exchange
Contracts ($) | | Futures
Contracts ($) | | Swap
Contracts ($) | | Total ($) | |
Foreign exchange risk | | | 69,650 | | | | — | | | | — | | | | 69,650 | | |
Interest rate risk | | | — | | | | 270,737 | | | | 3,131 | | | | 273,868 | | |
Total | | | 69,650 | | | | 270,737 | | | | 3,131 | | | | 343,518 | | |
The following table is a summary of the average outstanding volume by derivative instrument for the year ended October 31, 2014:
Derivative Instrument | | Average Notional
Amounts ($)* | |
Futures contracts — Long | | | 1,787,438 | | |
Futures contracts — Short | | | 9,380,349 | | |
Derivative Instrument | | Average Unrealized
Appreciation ($)* | | Average Unrealized
Depreciation ($)* | |
Forward foreign
currency exchange
contracts | | | 152,823
| | | | (55,019
| ) | |
Interest rate swap contracts | | | 9,611 | | | | (8,828 | ) | |
*Based on the ending quarterly outstanding amounts for the year ended October 31, 2014.
Treasury Inflation Protected Securities
The Fund may invest in treasury inflation protected securities (TIPS). The principal amount of TIPS is adjusted periodically and is increased for inflation or decreased for deflation based on a monthly published index. These adjustments are recorded as interest income in the Statement of Operations. Coupon payments are based on the adjusted principal at the time the interest is paid.
Security Transactions
Security transactions are accounted for on the trade date. Cost is determined and gains (losses) are based upon the specific identification method for both financial statement and federal income tax purposes.
Income Recognition
Interest income is recorded on an accrual basis. Market premiums and discounts, including original issue discounts, are amortized and accreted, respectively, over the expected life of the security on all debt securities, unless otherwise noted.
The Fund may place a debt security on non-accrual status and reduce related interest income when it becomes probable that the interest will not be collected and the amount of uncollectible interest can be reasonably estimated. A defaulted debt security is removed from non-accrual status when the issuer resumes interest payments or when collectability of interest is reasonably assured.
Dividend income is recorded on the ex-dividend date.
The value of additional securities received as an income payment is recorded as income and increases the cost basis of such securities.
Expenses
General expenses of the Trust are allocated to the Fund and other funds of the Trust based upon relative net assets or other expense allocation methodologies determined by the nature of the expense. Expenses directly attributable to the Fund are charged to the Fund. Expenses directly attributable to a specific class of shares are charged to that share class.
Determination of Class Net Asset Value
All income, expenses (other than class-specific expenses, which are charged to that share class, as shown in the Statement of Operations) and realized and unrealized gains (losses) are allocated to each class of the Fund on a daily basis, based on the relative net assets of each class, for purposes of determining the net asset value of each class.
Annual Report 2014
30
Columbia International Bond Fund
Notes to Financial Statements (continued)
October 31, 2014
Federal Income Tax Status
The Fund intends to qualify each year as a regulated investment company under Subchapter M of the Internal Revenue Code, as amended, and will distribute substantially all of its taxable income (including net short-term capital gains), if any, for its tax year, and as such will not be subject to federal income taxes. In addition, the Fund intends to distribute in each calendar year substantially all of its net investment income, capital gains and certain other amounts, if any, such that the Fund should not be subject to federal excise tax. Therefore, no federal income or excise tax provision is recorded.
Foreign Taxes
The Fund may be subject to foreign taxes on income, gains on investments or currency repatriation, a portion of which may be recoverable. The Fund will accrue such taxes and recoveries, as applicable, based upon its current interpretation of tax rules and regulations that exist in the markets in which it invests.
Realized gains in certain countries may be subject to foreign taxes at the Fund level, based on statutory rates. The Fund accrues for such foreign taxes on realized and unrealized gains at the appropriate rate for each jurisdiction, as applicable. The amount, if any, is disclosed as a liability on the Statement of Assets and Liabilities.
Distributions to Shareholders
Distributions from net investment income, if any, are declared and paid monthly. Net realized capital gains, if any, are distributed at least annually. Income distributions and capital gain distributions are determined in accordance with federal income tax regulations, which may differ from GAAP.
Guarantees and Indemnifications
Under the Trust's organizational documents and, in some cases, by contract, its officers and trustees are indemnified against certain liabilities arising out of the performance of their duties to the Trust or its funds. In addition, certain of the Fund's contracts with its service providers contain general indemnification clauses. The Fund's maximum exposure under these arrangements is unknown since the amount of any future claims that may be made against the Fund cannot be determined, and the Fund has no historical basis for predicting the likelihood of any such claims.
Note 3. Fees and Compensation Paid to Affiliates
Investment Management Fees
Under an Investment Management Services Agreement, Columbia Management Investment Advisers, LLC (the Investment Manager), a wholly-owned subsidiary of Ameriprise Financial, Inc. (Ameriprise Financial), determines which securities will be purchased, held or sold. The investment management fee is an annual fee that is equal to a percentage of the Fund's average daily net assets that declines from 0.57% to 0.47% as the Fund's net assets increase. The effective investment management fee rate for the year ended October 31, 2014 was 0.57% of the Fund's average daily net assets.
The Investment Manager has entered into a personnel-sharing arrangement with its affiliate, Threadneedle Investments (Threadneedle). Threadneedle, like the Investment Manager, is a wholly-owned subsidiary of Ameriprise Financial and is an SEC-registered investment adviser. Pursuant to this arrangement, certain employees of Threadneedle serve as "associated persons" of the Investment Manager and, in this capacity, subject to the oversight and supervision of the Investment Manager and consistent with the investment objectives, policies and limitations set forth in the Fund's prospectus and Statement of Additional Information (SAI), may provide research and related services, and discretionary investment management services (including acting as portfolio managers) to the Fund on behalf of the Investment Manager.
Administration Fees
Under an Administrative Services Agreement, the Investment Manager also serves as the Fund Administrator. The Fund pays the Fund Administrator an annual fee for administration and accounting services equal to a percentage of the Fund's average daily net assets that declines from 0.08% to 0.05% as the Fund's net assets increase. The effective administration fee rate for the year ended October 31, 2014 was 0.08% of the Fund's average daily net assets.
Compensation of Board Members
Board members are compensated for their services to the Fund as disclosed in the Statement of Operations. The Trust's eligible Trustees may participate in a Deferred Compensation Plan (the Plan) which may be terminated at any time. Obligations of the Plan will be paid solely out of the Fund's assets.
Compensation of Chief Compliance Officer
The Board has appointed a Chief Compliance Officer to the Fund in accordance with federal securities regulations. The Fund pays its pro-rata share of the expenses associated with
Annual Report 2014
31
Columbia International Bond Fund
Notes to Financial Statements (continued)
October 31, 2014
the Chief Compliance Officer. The Fund's expenses for the Chief Compliance Officer will not exceed $15,000 per year.
Transfer Agent Fees
Under a Transfer and Dividend Disbursing Agent Agreement, Columbia Management Investment Services Corp. (the Transfer Agent), an affiliate of the Investment Manager and a wholly-owned subsidiary of Ameriprise Financial, is responsible for providing transfer agency services to the Fund. The Transfer Agent has contracted with Boston Financial Data Services (BFDS) to serve as sub-transfer agent.
Effective November 1, 2014, the Transfer Agent receives a monthly transfer agency fee based on the number or the average value of accounts, depending on the type of account. Prior to November 1, 2014, the Transfer Agent received a monthly account-based service fee based on the number of open accounts. In addition, the Transfer Agent also receives sub-transfer agency fees based on a percentage of the average aggregate value of the Fund's shares maintained in omnibus accounts (other than omnibus accounts for which American Enterprise Investment Services Inc. is the broker of record or accounts where the beneficial shareholder is a customer of Ameriprise Financial Services, Inc., which receive a per account fee). The Transfer Agent pays the fees of BFDS for services as sub-transfer agent and is not entitled to reimbursement for such fees from the Fund (with the exception of out-of-pocket fees).
The Transfer Agent also receives compensation from the Fund for various shareholder services and reimbursements for certain out-of-pocket fees. Class I shares do not pay transfer agent fees.
For the year ended October 31, 2014, the Fund's effective transfer agent fee rates as a percentage of average daily net assets of each class were as follows:
Class A | | | 0.18 | % | |
Class C | | | 0.18 | | |
Class W | | | 0.19 | | |
Class Z | | | 0.19 | | |
An annual minimum account balance fee of $20 may apply to certain accounts with a value below the applicable share class's initial minimum investment requirements to reduce the impact of small accounts on transfer agent fees. These minimum account balance fees are remitted to the Fund and recorded as part of expense reductions in the Statement of Operations. For the year ended October 31, 2014, no minimum account balance fees were charged by the Fund.
Distribution and Service Fees
The Fund has an agreement with Columbia Management Investment Distributors, Inc. (the Distributor), an affiliate of
the Investment Manager and a wholly-owned subsidiary of Ameriprise Financial, for distribution and shareholder services. The Board has approved, and the Fund has adopted, distribution and shareholder service plans (the Plans) applicable to certain share classes, which set the distribution and service fees for the Fund. These fees are calculated daily and are intended to compensate the Distributor and/or eligible selling and/or servicing agents for selling shares of the Fund and providing services to investors.
Under the Plans, the Fund pays a monthly service fee to the Distributor at the maximum annual rate of 0.25% of the average daily net assets attributable to Class A, Class C and Class W shares of the Fund. Also under the Plans, the Fund pays a monthly distribution fee to the Distributor at the maximum annual rates of 0.75% and 0.25% of the average daily net assets attributable to Class C and Class W shares, respectively.
Although the Fund may pay a distribution fee up to 0.25% of the Fund's average daily net assets attributable to Class W shares and a service fee of up to 0.25% of the Fund's average daily net assets attributable to Class W shares, the aggregate fee shall not exceed 0.25% of the Fund's average daily net assets attributable to Class W shares.
Sales Charges
Sales charges, including front-end charges and CDSCs, received by the Distributor for distributing Fund shares were $2,573 for Class A shares for the year ended October 31, 2014.
Expenses Waived/Reimbursed by the Investment Manager and its Affiliates
The Investment Manager and certain of its affiliates have contractually agreed to waive fees and/or reimburse expenses (excluding certain fees and expenses described below) for the periods disclosed below, unless sooner terminated at the sole discretion of the Board, so that the Fund's net operating expenses, after giving effect to fees waived/expenses reimbursed and any balance credits and/or overdraft charges from the Fund's custodian, do not exceed the following annual rates as a percentage of the class' average daily net assets:
| | | March 1, 2014
through
February 28, 2015 | | Prior to
March 1, 2014 | |
Class A | | | 1.09 | % | | | 1.09 | % | |
Class C | | | 1.84 | | | | 1.84 | | |
Class I | | | 0.71 | | | | 0.74 | | |
Class W | | | 1.09 | | | | 1.09 | | |
Class Z | | | 0.84 | | | | 0.84 | | |
Annual Report 2014
32
Columbia International Bond Fund
Notes to Financial Statements (continued)
October 31, 2014
Under the agreement governing these fee waivers and/or expense reimbursement arrangements, the following fees and expenses are excluded from the waiver/reimbursement commitment, and therefore will be paid by the Fund, if applicable: taxes (including foreign transaction taxes), expenses associated with investments in affiliated and non-affiliated pooled investment vehicles (including mutual funds and exchange-traded funds), transaction costs and brokerage commissions, costs related to any securities lending program, dividend expenses associated with securities sold short, inverse floater program fees and expenses, transaction charges and interest on borrowed money, interest, extraordinary expenses and any other expenses the exclusion of which is specifically approved by the Board. This agreement may be modified or amended only with approval from all parties.
Note 4. Federal Tax Information
The timing and character of income and capital gain distributions are determined in accordance with income tax regulations, which may differ from GAAP because of temporary or permanent book to tax differences.
At October 31, 2014, these differences are primarily due to differing treatment for principal and/or interest from fixed income securities, Trustees' deferred compensation, foreign currency transactions, non-deductible expenses, derivative investments, and tax straddles. To the extent these differences are permanent, reclassifications are made among the components of the Fund's net assets in the Statement of Assets and Liabilities. Temporary differences do not require reclassifications. In the Statement of Assets and Liabilities the following reclassifications were made:
Undistributed net investment income | | $ | 389,270 | | |
Accumulated net realized gain | | | (384,065 | ) | |
Paid-in capital | | | (5,205 | ) | |
Net investment income (loss) and net realized gains (losses), as disclosed in the Statement of Operations, and net assets were not affected by this reclassification.
The tax character of distributions paid during the years indicated was as follows:
Year Ended October 31, | | 2014 | | 2013 | |
Ordinary income | | $ | 888,657 | | | $ | 1,108,866 | | |
Total | | $ | 888,657 | | | $ | 1,108,866 | | |
Short-term capital gain distributions, if any, are considered ordinary income distributions for tax purposes.
At October 31, 2014, the components of distributable earnings on a tax basis were as follows:
Undistributed ordinary income | | $ | 1,333,928 | | |
Undistributed long-term capital gains | | | 988,464 | | |
Net unrealized depreciation | | | (1,894,271 | ) | |
At October 31, 2014, the cost of investments for federal income tax purposes was $75,350,683 and the aggregate gross unrealized appreciation and depreciation based on that cost was:
Unrealized appreciation | | $ | 594,207 | | |
Unrealized depreciation | | | (2,488,478 | ) | |
Net unrealized depreciation | | | (1,894,271 | ) | |
For the year ended October 31, 2014, $356,702 of capital loss carryforward was utilized.
Management of the Fund has concluded that there are no significant uncertain tax positions in the Fund that would require recognition in the financial statements. However, management's conclusion may be subject to review and adjustment at a later date based on factors including, but not limited to, new tax laws, regulations, and administrative interpretations (including relevant court decisions). Generally, the Fund's federal tax returns for the prior three fiscal years remain subject to examination by the Internal Revenue Service.
Note 5. Portfolio Information
The cost of purchases and proceeds from sales of securities, excluding short-term obligations and certain derivatives, if any, aggregated to $61,035,945 and $45,897,832, respectively, for the year ended October 31, 2014, of which $560,219 and $560,284, respectively, were U.S. government securities. The amount of purchase and sale activity impacts the portfolio turnover rate reported in the Financial Highlights.
Note 6. Payments by Affiliates
During the year ended October 31, 2014, the Investment Manager reimbursed the Fund $18,180 for a loss on a trading error.
Note 7. Affiliated Money Market Fund
The Fund invests in Columbia Short-Term Cash Fund, an affiliated money market fund established for the exclusive use by the Fund and other affiliated funds. The income earned by the Fund from such investments is included as Dividends — affiliated issuers in the Statement of Operations. As an investing fund, the Fund indirectly bears its proportionate share of the expenses of Columbia Short-Term Cash Fund.
Annual Report 2014
33
Columbia International Bond Fund
Notes to Financial Statements (continued)
October 31, 2014
Note 8. Shareholder Concentration
At October 31, 2014, affiliated shareholders of record owned 98.1% of the outstanding shares of the Fund in one or more accounts. Subscription and redemption activity by concentrated accounts may have a significant effect on the operations of the Fund.
Note 9. Line of Credit
The Fund has entered into a revolving credit facility with a syndicate of banks led by JPMorgan Chase Bank N.A. (JPMorgan) whereby the Fund may borrow for the temporary funding of shareholder redemptions or for other temporary or emergency purposes. The credit facility agreement, as amended, which is a collective agreement between the Fund and certain other funds managed by the Investment Manager, severally and not jointly, permits collective borrowings up to $500 million. Interest is charged to each participating fund based on its borrowings at a rate equal to the higher of (i) the overnight federal funds rate plus 1.00% or (ii) the one-month LIBOR rate plus 1.00%. Each borrowing under the credit facility matures no later than 60 days after the date of borrowing. Effective December 10, 2013, the Fund also pays a commitment fee equal to its pro rata share of the amount of the credit facility at a rate of 0.075% per annum. Prior to December 10, 2013, the commitment fee was charged at the annual rate of 0.08% per annum. The commitment fee is included in other expenses in the Statement of Operations.
Effective December 9, 2014, the Fund extended its revolving credit facility with JPMorgan. The credit facility agreement, as amended, permits collective borrowings up to $550 million under the same terms and interest rates as described above.
The Fund had no borrowings during the year ended October 31, 2014.
Note 10. Significant Risks
Credit Risk
Credit risk is the risk that the value of debt securities in the Fund's portfolio may decline because the issuer may default and fail to pay interest or repay principal when due. Rating agencies assign credit ratings to debt securities to indicate their credit risk. Lower rated or unrated debt securities held by the Fund may present increased credit risk as compared to higher-rated debt securities.
Interest Rate Risk
Interest rate risk is the risk of losses attributable to changes in interest rates. In general, if prevailing interest rates rise, the values of debt securities tend to fall, and if interest rates fall, the values of debt securities tend to rise. Actions by
governments and central banking authorities can result in increases in interest rates. Increasing interest rates may negatively affect the value of debt securities held by the Fund, resulting in a negative impact on the Fund's performance and net asset value per share. In general, the longer the maturity or duration of a debt security, the greater its sensitivity to changes in interest rates.
Liquidity Risk
Liquidity risk is the risk associated with a lack of marketability of investments which may make it difficult to sell the investment at a desirable time or price. Changing regulatory, market or other conditions or environments (for example, the interest rate or credit environments) may adversely affect the liquidity of the Fund's investments. The Fund may have to accept a lower selling price for the holding, sell other investments, or forego another, more appealing investment opportunity. Generally, the less liquid the market at the time the Fund sells a portfolio investment, the greater the risk of loss or decline of value to the Fund. A less liquid market can lead to an increase in Fund redemptions, which may negatively impact Fund performance and net asset value per share, including, for example, if the Fund is forced to sell securities in a down market.
Foreign Securities and Emerging Market Countries Risk
Investing in foreign securities may include certain risks and considerations not typically associated with investing in U.S. securities, such as fluctuating currency values and changing local and regional economic, political and social conditions, which may result in greater market volatility. In addition, certain foreign securities may not be as liquid as U.S. securities. Investing in emerging markets may accentuate these risks. These countries are also more likely to experience high levels of inflation, deflation or currency devaluation which could hurt their economies and securities markets.
Non-Diversification Risk
A non-diversified fund is permitted to invest a greater percentage of its total assets in fewer issuers than a diversified fund. The Fund may, therefore, have a greater risk of loss from a few issuers than a similar fund that invests more broadly.
Note 11. Subsequent Events
Management has evaluated the events and transactions that have occurred through the date the financial statements were issued. Other than as noted below and in Notes 3 and 9 above, there were no items requiring adjustment of the financial statements or additional disclosure.
Annual Report 2014
34
Columbia International Bond Fund
Notes to Financial Statements (continued)
October 31, 2014
The Board of Trustees of the Fund has approved a Plan of Liquidation and Termination (the Plan) pursuant to which the Fund will be liquidated and terminated. Under the terms of the Plan, it is anticipated that the liquidation of the Fund will occur in the first quarter of 2015.
Note 12. Information Regarding Pending and Settled Legal Proceedings
In December 2005, without admitting or denying the allegations, American Express Financial Corporation (AEFC, which is now known as Ameriprise Financial, Inc. (Ameriprise Financial)) entered into settlement agreements with the Securities and Exchange Commission (SEC) and Minnesota Department of Commerce (MDOC) related to market timing activities. As a result, AEFC was censured and ordered to cease and desist from committing or causing any violations of certain provisions of the Investment Advisers Act of 1940, the Investment Company Act of 1940, and various Minnesota laws. AEFC agreed to pay disgorgement of $10 million and civil money penalties of $7 million. AEFC also agreed to retain an independent distribution consultant to assist in developing a plan for distribution of all disgorgement and civil penalties ordered by the SEC in accordance with various undertakings detailed at www.sec.gov/litigation/admin/ia-2451.pdf. Ameriprise Financial and its affiliates have cooperated with the SEC and the MDOC in these legal proceedings, and have made regular reports to the Funds' Boards of Trustees.
Ameriprise Financial and certain of its affiliates have historically been involved in a number of legal, arbitration and regulatory proceedings, including routine litigation, class actions, and governmental actions, concerning matters arising in connection with the conduct of their business activities. Ameriprise Financial believes that the Funds are not currently the subject of, and that neither Ameriprise Financial nor any of its affiliates are the subject of, any pending legal, arbitration or regulatory proceedings that are likely to have a material adverse effect on the Funds or the ability of Ameriprise Financial or its affiliates to perform under their contracts with the Funds. Ameriprise Financial is required to make quarterly (10-Q), annual (10-K) and, as necessary, 8-K filings with the Securities and Exchange Commission on legal and regulatory matters that relate to Ameriprise Financial and its affiliates. Copies of these filings may be obtained by accessing the SEC website at www.sec.gov.
There can be no assurance that these matters, or the adverse publicity associated with them, will not result in increased fund redemptions, reduced sale of fund shares or other adverse consequences to the Funds. Further, although we believe proceedings are not likely to have a material adverse effect on the Funds or the ability of Ameriprise Financial or its affiliates to perform under their contracts with the Funds, these
proceedings are subject to uncertainties and, as such, we are unable to estimate the possible loss or range of loss that may result. An adverse outcome in one or more of these proceedings could result in adverse judgments, settlements, fines, penalties or other relief that could have a material adverse effect on the consolidated financial condition or results of operations of Ameriprise Financial.
Annual Report 2014
35
Columbia International Bond Fund
Report of Independent Registered Public Accounting Firm
To the Trustees of Columbia Funds Series Trust I and the Shareholders of
Columbia International Bond Fund
In our opinion, the accompanying statement of assets and liabilities, including the portfolio of investments, and the related statements of operations and of changes in net assets and the financial highlights present fairly, in all material respects, the financial position of Columbia International Bond Fund (the "Fund", a series of Columbia Funds Series Trust I) at October 31, 2014, and the results of its operations, the changes in its net assets and the financial highlights for each of the periods indicated, in conformity with accounting principles generally accepted in the United States of America. These financial statements and financial highlights (hereafter referred to as "financial statements") are the responsibility of the Fund's management. Our responsibility is to express an opinion on these financial statements based on our audits. We conducted our audits of these financial statements in accordance with the standards of the Public Company Accounting Oversight Board (United States). Those standards require that we plan and perform the audit to obtain reasonable assurance about whether the financial statements are free of material misstatement. An audit includes examining, on a test basis, evidence supporting the amounts and disclosures in the financial statements, assessing the accounting principles used and significant estimates made by management, and evaluating the overall financial statement presentation. We believe that our audits, which included confirmation of securities at October 31, 2014 by correspondence with the custodian, brokers and transfer agent, provide a reasonable basis for our opinion.
As discussed in Note 11 to the financial statements, the Board of Trustees of the Fund has approved a plan to liquidate and terminate the Fund. The financial statements do not include any adjustments that might result from the outcome of this planned liquidation.
PricewaterhouseCoopers LLP
Minneapolis, Minnesota
December 22, 2014
Annual Report 2014
36
Columbia International Bond Fund
Federal Income Tax Information
(Unaudited)
The Fund hereby designates the following tax attributes for the fiscal year ended October 31, 2014. Shareholders will be notified in early 2015 of the amounts for use in preparing 2014 income tax returns.
Tax Designations:
Capital Gain Dividend | | $ | 1,037,887 | | |
Capital Gain Dividend. The Fund designates as a capital gain dividend the amount reflected above, or if subsequently determined to be different, the net capital gain of such fiscal period.
Annual Report 2014
37
Columbia International Bond Fund
The Trustees serve terms of indefinite duration. The names, addresses and birth years of the Trustees and Officers of the Funds in Columbia Funds Series Trust I, the year each was first elected or appointed to office, their principal business occupations during at least the last five years, the number of Funds overseen by each Trustee and other directorships they hold are shown below. Each officer listed below serves as an officer of each Fund in Columbia Funds Series Trust I.
Independent Trustees
Name, Address and Year of Birth,
Position with Funds, Year First
Elected or Appointed to Office | | Principal Occupation(s) During Past Five Years, Number of Funds in Columbia
Funds Complex Overseen by Trustee, Other Directorships Held | |
Douglas A. Hacker (Born 1955)
c/o Columbia Management
Investment Advisers, LLC
225 Franklin Street
Boston, MA 02110
Trustee (since 1996) and Chairman of the Board (since 2014) | | Independent business executive since May 2006; Executive Vice President — Strategy of United Airlines from December 2002 to May 2006; President of UAL Loyalty Services (airline marketing company) from September 2001 to December 2002; Executive Vice President and Chief Financial Officer of United Airlines from July 1999 to September 2001. Oversees 56; Spartan Stores, Inc. (food distributor); Nash Finch Company (food distributor) from 2005 to 2013; Aircastle Limited (aircraft leasing); and SeaCube Container Leasing Ltd. (container leasing) from 2010 to 2013 | |
Janet Langford Kelly (Born 1957)
c/o Columbia Management
Investment Advisers, LLC
225 Franklin Street
Boston, MA 02110
Trustee (since 1996) | | Senior Vice President, General Counsel and Corporate Secretary, ConocoPhillips (integrated energy company) since September 2007; Deputy General Counsel — Corporate Legal Services, ConocoPhillips from August 2006 to August 2007; Partner, Zelle, Hofmann, Voelbel, Mason & Gette LLP (law firm) from March 2005 to July 2006; Adjunct Professor of Law, Northwestern University from September 2004 to June 2006; Director, UAL Corporation (airline) from February 2006 to July 2006; Chief Administrative Officer and Senior Vice President, Kmart Holding Corporation (consumer goods) from September 2003 to March 2004. Oversees 56; None | |
Nancy T. Lukitsh (Born 1956)
c/o Columbia Management
Investment Advisers, LLC
225 Franklin Street
Boston, MA 02110
Trustee (since 2011) | | Senior Vice President, Partner and Director of Marketing, Wellington Management Company, LLP (investment adviser) from 1997 to 2010; Chair, Wellington Management Investment Portfolios (commingled non-U.S. investment pools) from 2007 to 2010; Director, Wellington Trust Company, NA and other Wellington affiliates from 1997 to 2010. Oversees 56; None | |
William E. Mayer (Born 1940)
c/o Columbia Management
Investment Advisers, LLC
225 Franklin Street
Boston, MA 02110
Trustee (since 1994) | | Partner, Park Avenue Equity Partners (private equity) since February 1999; Dean and Professor, College of Business and Management, University of Maryland from 1992 to 1996. Oversees 56; DynaVox Inc. (speech creation); Lee Enterprises (print media); WR Hambrecht + Co. (financial service provider) from 2000 to 2012; BlackRock Kelso Capital Corporation (investment company); Premier, Inc. (healthcare) | |
David M. Moffett (Born 1952)
c/o Columbia Management
Investment Advisers, LLC
225 Franklin Street
Boston, MA 02110
Trustee (since 2011) | | Retired. Chief Executive Officer, Federal Home Loan Mortgage Corporation, from 2008 to 2009; Senior Adviser, Global Financial Services Group, Carlyle Group, Inc., from 2007 to 2008; Vice Chairman and Chief Financial Officer, U.S. Bancorp, from 1993 to 2007. Oversees 56; CIT Group Inc. (commercial and consumer finance); eBay Inc. (online trading community); MBIA Inc. (financial service provider); E.W. Scripps Co. (print and television media), Building Materials Holding Corp. (building materials and construction services); Genworth Financial, Inc. (financial and insurance products and services); and University of Oklahoma Foundation | |
Charles R. Nelson (Born 1942)
c/o Columbia Management
Investment Advisers, LLC
225 Franklin Street
Boston, MA 02110
Trustee (since 1981) | | Retired. Professor Emeritus, University of Washington, since 2011; Professor of Economics, University of Washington from 1976 to 2011; Ford and Louisa Van Voorhis Professor of Political Economy, University of Washington from 1993 to 2011; Adjunct Professor of Statistics, University of Washington from 1980 to 2011; Associate Editor, Journal of Money, Credit and Banking from September 1993 to 2008; consultant on econometric and statistical matters. Oversees 56; None | |
John J. Neuhauser (Born 1943)
c/o Columbia Management
Investment Advisers, LLC
225 Franklin Street
Boston, MA 02110
Trustee (since 1984) | | President, Saint Michael's College, since August 2007; Director or Trustee of several non-profit organizations, including Fletcher Allen Health Care, Inc.; Academic Vice President and Dean of Faculties, Boston College from August 1999 to October 2005; University Professor, Boston College from November 2005 to August 2007. Oversees 56; Liberty All-Star Equity Fund and Liberty All-Star Growth Fund (closed-end funds) | |
Patrick J. Simpson (Born 1944)
c/o Columbia Management
Investment Advisers, LLC
225 Franklin Street
Boston, MA 02110
Trustee (since 2000) | | Partner, Perkins Coie LLP (law firm). Oversees 56; None | |
Annual Report 2014
38
Columbia International Bond Fund
Trustees and Officers (continued)
Independent Trustees (continued)
Name, Address and Year of Birth,
Position with Funds, Year First
Elected or Appointed to Office | | Principal Occupation(s) During Past Five Years, Number of Funds in Columbia
Funds Complex Overseen by Trustee, Other Directorships Held | |
Anne-Lee Verville (Born 1945)
c/o Columbia Management
Investment Advisers, LLC
225 Franklin Street
Boston, MA 02110
Trustee (since 1998) | | Retired. General Manager — Global Education Industry from 1994 to 1997, President — Application Systems Division from 1991 to 1994, Chief Financial Officer — US Marketing & Services from 1988 to 1991, and Chief Information Officer from 1987 to 1988, IBM Corporation (computer and technology). Oversees 56; Enesco Group, Inc. (producer of giftware and home and garden decor products) from 2001 to 2006 | |
Interested Trustee
Name, Address and Year of Birth,
Position with Funds, Year First
Elected or Appointed to Office | | Principal Occupation(s) During Past Five Years, Number of Funds in Columbia
Funds Complex Overseen by Trustee, Other Directorships Held | |
William F. Truscott (Born 1960)
53600 Ameriprise Financial Center
Minneapolis, MN 55474
Trustee (since 2012) | | Chairman of the Board and President, Columbia Management Investment Advisers, LLC since May 2010 and February 2012, respectively (previously President and Chief Investment Officer from 2001 to April 2010); Chief Executive Officer, Global Asset Management, Ameriprise Financial, Inc. since September 2012 (previously, Chief Executive Officer, U.S. Asset Management & President, Annuities, from May 2010 to September 2012 and President — U.S. Asset Management and Chief Investment Officer from 2005 to April 2010); Director and Chief Executive Officer, Columbia Management Investment Distributors, Inc. since May 2010 and February 2012, respectively (previously Chairman of the Board and Chief Executive Officer from 2006 to April 2010); Chairman of the Board and Chief Executive Officer, RiverSource Distributors, Inc. since 2006; President and Chief Executive Officer, Ameriprise Certificate Company, 2006 to August 2012; Director, Threadneedle Asset Management Holdings, SARL since 2014, Oversees 188; Chairman of the Board, Columbia Management Investment Advisers, LLC since May 2010, Director, Columbia Management Investment Distributors, Inc. since May 2010; Director, Ameriprise Certificate Company from 2006 to January 2013 | |
The Statement of Additional Information has additional information about the Fund's Board members and is available, without charge, upon request by calling 800.345.6611; contacting your financial intermediary; or visiting columbiamanagement.com.
The Board has appointed officers who are responsible for day-to-day business decisions based on policies it has established. The officers serve at the pleasure of the Board. In addition to Mr. Truscott, who is Senior Vice President, the Funds' other officers are:
Officers
Name,
Address and
Year of Birth | | Position and Year
First Appointed to
Position for any Fund
in the Columbia
Funds Complex or a
Predecessor Thereof | | Principal Occupation(s) During Past Five Years | |
J. Kevin Connaughton
225 Franklin Street
Boston, MA 02110
Born 1964 | | President and Principal Executive Officer (2009) | | Managing Director and General Manager — Mutual Fund Products, Columbia Management Investment Advisers, LLC, since May 2010; and President, Columbia Funds since 2009; Managing Director, Columbia Management Advisors, LLC, from December 2004 to April 2010; Senior Vice President and Chief Financial Officer, Columbia Funds from June 2008 to January 2009; and senior officer of Columbia Funds and affiliated funds since 2003. | |
Michael G. Clarke
225 Franklin Street
Boston, MA 02110
Born 1969 | | Treasurer (2011) and Chief Financial Officer (2009) | | Vice President — Mutual Fund Administration, Columbia Management Investment Advisers, LLC, since May 2010; Managing Director of Fund Administration, Columbia Management Advisors, LLC from September 2004 to April 2010; and senior officer of Columbia Funds and affiliated funds since 2002. | |
Annual Report 2014
39
Columbia International Bond Fund
Trustees and Officers (continued)
Officers (continued)
Name,
Address and
Year of Birth | | Position and Year
First Appointed to
Position for any Fund
in the Columbia
Funds Complex or a
Predecessor Thereof | | Principal Occupation(s) During Past Five Years | |
Scott R. Plummer
5228 Ameriprise
Financial Center
Minneapolis, MN 55474
Born 1959 | | Senior Vice President (2006), Chief Legal Officer (2006) and Assistant Secretary (2011) | | Senior Vice President and Assistant General Counsel — Global Asset Management, Ameriprise Financial since February 2014 (previously, Senior Vice President and Lead Chief Counsel — Asset Management, 2012 – February 2014; Vice President and Lead Chief Counsel — Asset Management, 2010 – 2012; and Vice President and Chief Counsel — Asset Management, 2005 – 2010); Senior Vice President, Chief Legal Officer and Assistant Secretary, Columbia Management Investment Advisers, LLC since June 2005; Vice President, Chief Counsel and Assistant Secretary, Columbia Management Investment Distributors, Inc. since 2008; Vice President, General Counsel and Secretary, Ameriprise Certificate Company since 2005; Chief Counsel, RiverSource Distributors, Inc. since 2006; senior officer of Columbia Funds and affiliated funds since 2006. | |
Thomas P. McGuire
225 Franklin Street
Boston, MA 02110
Born 1972 | | Chief Compliance Officer (2012) | | Vice President — Asset Management Compliance, Ameriprise Financial, Inc. since May 2010; Chief Compliance Officer, Ameriprise Certificate Company since September 2010; Compliance Executive, Bank of America from 2005 to April 2010. | |
Colin Moore
225 Franklin Street
Boston, MA 02110
Born 1958 | | Senior Vice President (2010) | | Executive Vice President and Global Chief Investment Officer, Ameriprise Financial, Inc. since July 2013; Director and Global Chief Investment Officer, Columbia Management Investment Advisers, LLC since May 2010; Manager, Managing Director and Chief Investment Officer, Columbia Management Advisors, LLC from 2007 to April 2010. | |
Michael E. DeFao
225 Franklin Street
Boston, MA 02110
Born 1968 | | Vice President (2011) and Assistant Secretary (2010) | | Vice President and Chief Counsel, Ameriprise Financial, Inc. since May 2010; Associate General Counsel, Bank of America from 2005 to April 2010. | |
Joseph F. DiMaria
225 Franklin Street
Boston, MA 02110
Born 1968 | | Vice President (2011) and Chief Accounting Officer (2008) | | Vice President — Mutual Fund Treasurer, Columbia Management Investment Advisers, LLC since May 2010; Director of Fund Administration, Columbia Management Advisors, LLC from 2006 to April 2010. | |
Paul B. Goucher
100 Park Avenue
New York, NY 10017
Born 1968 | | Vice President (2011) and Assistant Secretary (2008) | | Vice President and Lead Chief Counsel, Ameriprise Financial, Inc., since November 2008 and January 2013, respectively (previously, Chief Counsel from January 2010 to January 2013, and Group Counsel from November 2008 to January 2010); Director, Managing Director and General Counsel, J. & W. Seligman & Co. Incorporated from July 2008 to November 2008. | |
Amy Johnson
5228 Ameriprise
Financial Center
Minneapolis, MN
Born 1965 | | Vice President (2006) | | Senior Vice President and Chief Operating Officer, Columbia Management Investment Advisers, LLC since May 2010; previously, Chief Administrative Officer, from 2009 to April 2010, and Vice President — Asset Management and Trust Company Services from 2006 to 2009. | |
Paul D. Pearson
5228 Ameriprise
Financial Center
Minneapolis, MN
Born 1956 | | Vice President (2011) and Assistant Treasurer (1999) | | Vice President — Investment Accounting, Columbia Management Investment Advisers, LLC since May 2010; Vice President — Managed Assets, Investment Accounting, Ameriprise Financial, Inc. from 1998 to April 2010. | |
Christopher O. Petersen
5228 Ameriprise
Financial Center
Minneapolis, MN 55474
Born 1970 | | Vice President and Secretary (2010) | | Vice President and Chief Counsel, Ameriprise Financial, Inc. since January 2010 (previously, Vice President and Group Counsel or Counsel from 2004 to January 2010); officer of Columbia Funds and affiliated funds since 2007. | |
Stephen T. Welsh
225 Franklin Street
Boston, MA 02110
Born 1957 | | Vice President (2006) | | President and Director, Columbia Management Investment Services Corp. from May 2012 to October 2014; President and Director, Columbia Management Services, Inc. from 2004 to April 2010; and Managing Director, Columbia Management Distributors, Inc. from 2007 to April 2010. | |
Annual Report 2014
40
Columbia International Bond Fund
Board Consideration and Approval of Advisory Agreement
On June 11, 2014, the Board of Trustees (the "Board") and the Trustees who are not interested persons (as defined in the Investment Company Act of 1940) of the Trust (the "Independent Trustees") unanimously approved the continuation of the Investment Management Services Agreement (the "Advisory Agreement") with Columbia Management Investment Advisers, LLC (the "Investment Manager") with respect to Columbia International Bond Fund (the "Fund"), a series of the Trust. As detailed below, the Advisory Fees and Expenses Committee (the "Committee") and the Board met on multiple occasions to review and discuss, both among themselves and with the management team of the Investment Manager, materials provided by the Investment Manager before determining to approve the continuation of the Advisory Agreement.
In connection with their deliberations regarding the continuation of the Advisory Agreement, the Committee and the Board evaluated materials requested from the Investment Manager regarding the Fund and the Advisory Agreement, and discussed these materials with representatives of the Investment Manager at Committee meetings held on March 4, 2014, April 30, 2014 and June 10, 2014 and at Board meetings held on April 30, 2014 and June 11, 2014. In addition, the Board considers matters bearing on the Advisory Agreement at most of its other meetings throughout the year and meets regularly with senior management of the Funds and the Investment Manager. Through the Board's Investment Oversight Committees, Trustees also meet with selected Fund portfolio managers and other investment personnel at various times throughout the year. The Committee and the Board also consulted with its independent fee consultant, Fund counsel and with the Independent Trustees' independent legal counsel, who advised on various matters with respect to the Committee's and the Board's considerations and otherwise assisted the Committee and the Board in their deliberations. On June 10, 2014, the Committee recommended that the Board approve the continuation of the Advisory Agreement. On June 11, 2014, the Board, including the Independent Trustees, voting separately, unanimously approved the continuation of the Advisory Agreement for the Fund.
The Committee and the Board considered all information that they, their legal counsel, or the Investment Manager believed reasonably necessary to evaluate and to determine whether to approve the continuation of the Advisory Agreement. The information and factors considered by the Committee and the Board in recommending for approval or approving the continuation of the Advisory Agreement for the Fund included the following:
• Information on the investment performance of the Fund relative to the performance of a group of mutual funds determined to be comparable to the Fund by an independent third-party data provider, as well as performance relative to benchmarks;
• Information on the Fund's advisory fees and total expenses, including information comparing the Fund's expenses to those of a group of comparable mutual funds, as determined by the independent third-party data provider;
• The Investment Manager's agreement to contractually limit or cap total operating expenses for the Fund through February 28, 2015, so that total operating expenses (excluding certain fees and expenses, such as transaction costs and certain other investment related expenses, interest, taxes, acquired fund fees and expenses, and extraordinary expenses) would not exceed an annual rate of 1.09% for Class A, 1.84% for Class C, 0.71% for Class I, 1.09% for Class W and 0.84% for Class Z;
• The terms and conditions of the Advisory Agreement;
• The current and proposed terms and conditions of other agreements and arrangements with affiliates of the Investment Manager relating to the operations of the Fund, including the Administrative Services Agreement, the Distribution Agreement and the Transfer and Dividend Disbursing Agent Agreement;
• Descriptions of various functions performed by the Investment Manager under the Advisory Agreement, including portfolio management and portfolio trading practices;
• Information regarding the management fees and investment performance of similarly-managed portfolios of other clients of the Investment Manager, including institutional separate accounts;
• Information regarding the reputation, regulatory history and resources of the Investment Manager, including information regarding senior management, portfolio managers and other personnel;
• Information regarding the capabilities of the Investment Manager with respect to compliance monitoring services, including an assessment of the Investment Manager's compliance system by the Fund's Chief Compliance Officer; and
• The profitability to the Investment Manager and its affiliates from their relationships with the Fund.
Annual Report 2014
41
Columbia International Bond Fund
Board Consideration and Approval of Advisory Agreement (continued)
Nature, Extent and Quality of Services Provided under the Advisory Agreement
The Committee and the Board considered the nature, extent and quality of services provided to the Fund by the Investment Manager and its affiliates under the Advisory Agreement and under separate agreements for the provision of transfer agency and administrative services, and the resources dedicated to the Fund and the other Columbia Funds by the Investment Manager and its affiliates. The Committee and the Board considered, among other things, the Investment Manager's ability to attract, motivate and retain highly qualified research, advisory and supervisory investment professionals (including personnel and other resources, compensation programs for personnel involved in fund management, reputation and other attributes), the portfolio management services provided by those investment professionals, and the quality of the Investment Manager's investment research capabilities and trade execution services. The Committee and the Board also considered the potential benefits to shareholders of investing in a mutual fund that is part of a fund complex offering exposure to a variety of asset classes and investment disciplines and providing a variety of fund and shareholder services.
The Committee and the Board also considered the professional experience and qualifications of the senior personnel of the Investment Manager, which included consideration of the Investment Manager's experience with similarly-structured funds. The Committee and the Board noted the compliance programs of and the compliance-related resources provided to the Fund by the Investment Manager and its affiliates, and considered the Investment Manager's ability to provide administrative services to the Fund pursuant to a separate Administrative Services Agreement, including the Investment Manager's ability to coordinate the activities of the Fund's other service providers. After reviewing these and related factors, the Committee and the Board concluded, within the context of their overall conclusions, that the nature, extent and quality of the services provided to the Fund under the Advisory Agreement supported the continuation of the Advisory Agreement.
Investment Performance
The Committee and the Board reviewed information about the performance of the Fund over various time periods, including performance information relative to benchmarks and information based on reports of the independent third-party data provider that compared the performance of the Fund to the performance of a group of comparable mutual funds, and data provided by the independent fee consultant. The Committee and the Board also reviewed a description of the third party's methodology for identifying the Fund's peer groups for purposes of performance and expense comparisons. Although the Fund's performance lagged that of a relevant peer group for certain (although not necessarily all) periods, the Committee and the Board concluded that other factors relevant to performance were sufficient, in light of other considerations, to warrant continuation of the Fund's Advisory Agreement. Those factors included one or more of the following: (i) that the Fund's performance, although lagging in certain recent periods, was stronger over the longer term; (ii) that the underperformance was attributable, to a significant extent, to investment decisions that were reasonable and consistent with the Fund's investment strategy and policies and that the Fund was performing within a reasonable range of expectations, given those investment decisions, market conditions and the Fund's investment strategy; (iii) that the Fund's performance was competitive when compared to other relevant performance benchmarks or peer groups; and (iv) that the Investment Manager had taken or was taking steps designed to help improve the Fund's investment performance, including, but not limited to, replacing portfolio managers, enhancing the resources supporting the portfolio managers, or modifying investment strategies.
The Committee and the Board noted that, through December 31, 2013, the Fund's performance was in the 78th, 69th and 69th percentile (where the best performance would be in the first percentile) of its category selected by the independent third-party data provider for the purposes of performance comparisons for the one-, three- and five- year periods, respectively.
The Committee and the Board also considered the Investment Manager's performance and reputation generally, the Investment Manager's historical responsiveness to Board concerns about performance, and the Investment Manager's willingness to take steps intended to improve performance. After reviewing these and related factors, the Committee and the Board concluded, within the context of their overall conclusions, that the performance of the Fund was sufficient, in light of other considerations, to warrant the continuation of the Advisory Agreement.
Investment Advisory Fee Rates and Other Expenses
The Committee and the Board considered the advisory fees charged to the Fund under the Advisory Agreement as well as the total expenses incurred by the Fund. In assessing the reasonableness of the fees under the Advisory Agreement, the
Annual Report 2014
42
Columbia International Bond Fund
Board Consideration and Approval of Advisory Agreement (continued)
Committee and the Board considered, among other information, the Fund's advisory fee and its total expense ratio as a percentage of average daily net assets. The Committee and the Board also considered data provided by the independent fee consultant. The Committee and the Board noted that the Fund's actual management fee and net expense ratio are ranked in the first and fourth quintiles, respectively, (where the lowest fees and expenses would be in the first quintile) against the Fund's expense universe as determined by the independent third-party data provider for purposes of expense comparison. The Committee and the Board also took into account the fee waiver and expense limitation arrangements agreed to by the Investment Manager, as noted above.
The Committee and the Board also received and considered information about the advisory fees charged by the Investment Manager to institutional separate accounts. In considering the fees charged to those accounts, the Committee and the Board took into account, among other things, the Investment Manager's representations about the differences between managing mutual funds as compared to other types of accounts, including differences in the services provided, differences in the risk profile of such business for the Investment Manager and the additional resources required to manage mutual funds effectively. In evaluating the Fund's advisory fees, the Committee and the Board also took into account the demands, complexity and quality of the investment management of the Fund.
After reviewing these and related factors, the Committee and the Board concluded, within the context of their overall conclusions, that the advisory fee rates and expenses of the Fund were sufficient, in light of other considerations, to warrant the continuation of the Advisory Agreement.
Costs of Services Provided and Profitability
The Committee and the Board also took note of the costs of the services provided (both on an absolute and relative basis) and the profitability to the Investment Manager and its affiliates in connection with their relationships with the Fund. In evaluating these considerations, the Committee and the Board took note of the advisory fees charged by the Investment Manager to other clients, including fees charged by the Investment Manager to institutional separate account clients with similar investment strategies to those of the Fund.
The Committee and the Board also considered the compensation directly or indirectly received by the Investment Manager's affiliates in connection with their relationships with the Fund. The Committee and the Board reviewed information provided by management as to the profitability of the Investment Manager and its affiliates of their relationships with the Fund, information about the allocation of expenses used to calculate profitability, and comparisons of profitability levels realized in 2013 to profitability levels realized in 2012. When reviewing profitability, the Committee and the Board also considered court cases in which adviser profitability was an issue in whole or in part, the performance of similarly managed funds, the performance of the Fund, and the expense ratio of the Fund. The Committee and the Board also considered information provided by the Investment Manager regarding the Investment Manager's financial condition and comparing its profitability to that of other asset management firms that are, or are subsidiaries of, publicly traded companies.
After reviewing these and related factors, the Committee and the Board concluded, within the context of their overall conclusions, that the costs of services provided and the profitability to the Investment Manager and its affiliates from their relationships with the Fund supported the continuation of the Advisory Agreement.
Economies of Scale
The Committee and the Board considered the potential existence of economies of scale in the provision by the Investment Manager of services to the Fund, to groups of related funds, and to the Investment Manager's investment advisory clients as a whole, and whether those economies of scale were shared with the Fund through breakpoints in investment advisory fees or other means, such as expense limitation arrangements and additional investments by the Investment Manager in investment, trading and compliance resources. The Committee and the Board noted that the investment advisory fee schedules for the Fund contained breakpoints that would reduce the fee rate on assets above specified threshold levels.
In considering these matters, the Committee and the Board also considered the costs of the services provided and the profitability to the Investment Manager and its affiliates from their relationships with the Fund, as discussed above. After reviewing these and related factors, the Committee and the Board concluded, within the context of their overall conclusions, that the extent to which any economies of scale were expected to be shared with the Fund supported the continuation of the Advisory Agreement.
Annual Report 2014
43
Columbia International Bond Fund
Board Consideration and Approval of Advisory Agreement (continued)
Other Benefits to the Investment Manager
The Committee and the Board received and considered information regarding "fall-out" or ancillary benefits received by the Investment Manager and its affiliates as a result of their relationships with the Fund, such as the engagement of the Investment Manager to provide administrative services to the Fund and the engagement of the Investment Manager's affiliates to provide distribution and transfer agency services to the Fund. In this regard, among other matters, the Committee and the Board considered that the Fund's distributor retains a portion of the distribution fees from the Fund and receives a portion of the sales charges on sales or redemptions of certain classes of shares of the Fund. The Committee and the Board also considered the benefits of research made available to the Investment Manager by reason of brokerage commissions generated by the Fund's securities transactions, and reviewed information about the Investment Manager's practices with respect to allocating portfolio transactions for brokerage and research services. The Committee and the Board considered the possible conflicts of interest associated with certain fall-out or other ancillary benefits and the reporting, disclosure and other processes that are in place to address such possible conflicts of interest. The Committee and the Board recognized that the Investment Manager's profitability would be somewhat lower without these benefits.
Conclusion
The Committee and the Board reviewed all of the above considerations in reaching their decisions to recommend or approve the continuation of the Advisory Agreement. In their deliberations, the Trustees did not identify any particular information that was all-important or controlling, and individual Trustees may have attributed different weights to the various factors. Based on their evaluation of all factors that they deemed to be material, including those factors described above, and assisted by the advice of independent legal counsel, the Board, including the Independent Trustees, voting separately, unanimously approved the continuation of the Advisory Agreement.
Annual Report 2014
44
Columbia International Bond Fund
Important Information About This Report
Each fund mails one shareholder report to each shareholder address. If you would like more than one report, please call shareholder services at 800.345.6611 and additional reports will be sent to you.
The policy of the Board is to vote the proxies of the companies in which each fund holds investments consistent with the procedures as stated in the Statement of Additional Information (SAI). You may obtain a copy of the SAI without charge by calling 800.345.6611; contacting your financial intermediary; visiting columbiamanagement.com; or searching the website of the Securities and Exchange Commission (SEC) at sec.gov. Information regarding how each fund voted proxies relating to portfolio securities is filed with the SEC by August 31 for the most recent 12-month period ending June 30 of that year, and is available without charge by visiting columbiamanagement.com; or searching the website of the SEC at sec.gov.
Each fund files a complete schedule of portfolio holdings with the SEC for the first and third quarters of each fiscal year on Form N-Q. Each fund's Form N-Q is available on the SEC's website at sec.gov and may be reviewed and copied at the SEC's Public Reference Room in Washington, D.C. Information on the operation of the Public Reference Room may be obtained by calling 800.SEC.0330. Each fund's complete schedule of portfolio holdings, as filed on Form N-Q, can also be obtained without charge, upon request, by calling 800.345.6611.
Annual Report 2014
45

Columbia International Bond Fund
P.O. Box 8081
Boston, MA 02266-8081
columbiamanagement.com
This information is for use with concurrent or prior delivery of a fund prospectus. Please read and consider the investment objectives, risks, charges and expenses for any fund carefully before investing. For a prospectus and, if available, a summary prospectus, which contains this and other important information about the Fund, go to columbiamanagement.com. The Fund is distributed by Columbia Management Investment Distributors, Inc., member FINRA, and managed by Columbia Management Investment Advisers, LLC.
© 2014 Columbia Management Investment Advisers, LLC. All rights reserved.
ANN169_10_D01_(12/14)
Annual Report
October 31, 2014

Columbia AMT-Free Massachusetts Intermediate
Muni Bond Fund
Not FDIC insured • No bank guarantee • May lose value
About Columbia Management
Backed by more than 100 years of experience, Columbia Management is one of the nation's largest asset managers. At the heart of our success — and, most importantly, that of our investors — are some of the most talented professionals in the industry, brought together by a unique way of working.
It starts with carefully selected, specialized investment teams. While each team brings a diverse and innovative range of skills, all are grounded by a common set of core beliefs. All possess a solid conviction in the power of proprietary, bottom-up research. All look not only at generating returns, but also at the likely consistency of those returns and the risks required to achieve them. And while our culture encourages teams to operate independently and question established thinking, a rigorous investment oversight process ensures that each team stays true to its clearly articulated investment process. At Columbia Management, reaching our performance goals matters, and the way we reach them matters just as much.
Columbia funds are distributed by Columbia Management Investment Distributors, Inc., member FINRA, and managed by Columbia Management Investment Advisers, LLC.
© 2014 Columbia Management Investment Advisers, LLC. All rights reserved.
Not part of the shareholder report
Connect with Columbia Management
Get the market insight you need from our investment experts
Investor insight
Stay informed with economic and market commentary, investment videos, white papers, mutual fund commentary and more at columbiamanagement.com.
Columbia Management investor
(e-newsletter)
Read our award-winning* shareholder newsletter. Our quarterly newsletter is available online and provides timely and relevant content about economic trends, fund news, service enhancements and changes. Sign up to receive the newsletter electronically at columbiamanagement.com/newsletter.
Investment videos
Watch and discover what our thought leaders are saying about financial markets and the economy. For an analysis of current events and trends that may affect your investments, visit our online video library at columbiamanagement.com/
market-insights/videos.
Social media
Columbia Management offers you multiple ways to access our market commentary and investment insights.
> Perspectives blog at columbiamanagement.com
Read timely posts by our investment team, including our chief investment officer, chief economist and portfolio managers.
> Twitter.com/ColumbiaMgmt
Follow us on Twitter for quick, up-to-the-minute comments on market news and more.
> Youtube.com/columbiamanagement
View our commentaries on the economy, markets and current investment opportunities.
> Linkedin.com/company/columbia-management
Connect with us on LinkedIn for updates from our thought leaders.
*Columbia Management investor was awarded top honors in the Mutual Fund Education Alliance STAR Awards competition for excellence in mutual fund marketing and communications. Materials in the competition were evaluated on educational value, message comprehension, effective design and objectives.
Not part of the shareholder report
 Dear Shareholders,
The U.S. Economy Gained Momentum
The U.S. economy picked up momentum throughout the third quarter of 2014 with improvements in every sector. Second-quarter gross domestic product growth was revised upward to 4.6%, with expectations that third-quarter growth would also be above trend. American companies added more than 200,000 new jobs monthly, driving unemployment below 6% for the first time since 2008. Consumer spending got a boost as both income and savings rose, and confidence hit a post-recession high. After a weak start to the year, corporate profits rebounded, indicating that business remains in good shape. Rising profits led to higher capital spending. The housing market recovery remained on track, as home sales and prices trended higher, and inventories declined. Manufacturing remained a lynchpin of the economy's expansion. Even so, performance fell short of expectations at the end of the period.
Despite Momentum, Markets Remained Stagnant
The financial markets produced lackluster results, despite good economic news and the Federal Reserve's reassurance that it intended to keep short-term interest rates low for another year. A surge in global tensions and concerns that equity valuations have risen sharply put a damper on investor enthusiasm. The S&P 500 Index inched ahead 1.13%, buoyed by its concentration in large-cap stocks with a defensive edge. Traditional fixed-income sectors, including U.S. Treasuries, mortgages and securitized bonds, eked out returns of less than 1% for the quarter. Investment-grade corporate bonds and high-yield bonds lost some ground, although fundamentals for both groups remained solid. Convertible securities and U.S. Treasury inflation-protected securities pulled up the rear.
Stay on Track with Columbia Management
Backed by more than 100 years of experience, Columbia Management is one of the nation's largest asset managers. At the heart of our success and, most importantly, that of our investors, are highly talented industry professionals, brought together by a unique way of working. At Columbia Management, reaching our performance goals matters, and how we reach them matters just as much.
Visit columbiamanagement.com for:
> The Columbia Management Perspectives blog, offering insights on current market events and investment opportunities
> Detailed up-to-date fund performance and portfolio information
> Quarterly fund commentaries
> Columbia Management investor, our award-winning quarterly newsletter for shareholders
Thank you for your continued support of the Columbia Funds. We look forward to serving your investment needs for many years to come.
Best Regards,

J. Kevin Connaughton
President, Columbia Funds
Investing involves risk including the risk of loss of principal.
The S&P 500 Index, an unmanaged index, measures the performance of 500 widely held, large-capitalization U.S. stocks and is frequently used as a general measure of market performance. Indices are not available for investment, are not professionally managed and do not reflect sales charges, fees, brokerage commissions, taxes or other expenses of investing.
Investors should consider the investment objectives, risks, charges and expenses of a mutual fund carefully before investing. For a free prospectus and, if available, a summary prospectus, which contains this and other important information about a fund, visit columbiamanagement.com. The prospectus should be read carefully before investing.
Columbia Funds are distributed by Columbia Management Investment Distributors, Inc., member FINRA, and managed by Columbia Management Investment Advisers, LLC.
© 2014 Columbia Management Investment Advisers, LLC. All rights reserved.
Columbia AMT-Free Massachusetts Intermediate Muni Bond Fund
Performance Overview | | | 2 | | |
Manager Discussion of Fund Performance | | | 4 | | |
Understanding Your Fund's Expenses | | | 6 | | |
Portfolio of Investments | | | 7 | | |
Statement of Assets and Liabilities | | | 13 | | |
Statement of Operations | | | 15 | | |
Statement of Changes in Net Assets | | | 16 | | |
Financial Highlights | | | 18 | | |
Notes to Financial Statements | | | 24 | | |
Report of Independent Registered
Public Accounting Firm | | | 30 | | |
Federal Income Tax Information | | | 31 | | |
Trustees and Officers | | | 32 | | |
Board Consideration and Approval of Advisory Agreement | | | 35 | | |
Important Information About This Report | | | 39 | | |
Fund Investment Manager
Columbia Management Investment
Advisers, LLC
225 Franklin Street
Boston, MA 02110
Fund Distributor
Columbia Management Investment
Distributors, Inc.
225 Franklin Street
Boston, MA 02110
Fund Transfer Agent
Columbia Management Investment
Services Corp.
P.O. Box 8081
Boston, MA 02266-8081
For more information about any of the funds, please visit columbiamanagement.com or call 800.345.6611. Customer Service Representatives are available to answer your questions Monday through Friday from 8 a.m. to 7 p.m. Eastern time.
The views expressed in this report reflect the current views of the respective parties. These views are not guarantees of future performance and involve certain risks, uncertainties and assumptions that are difficult to predict, so actual outcomes and results may differ significantly from the views expressed. These views are subject to change at any time based upon economic, market or other conditions and the respective parties disclaim any responsibility to update such views. These views may not be relied on as investment advice and, because investment decisions for a Columbia Fund are based on numerous factors, may not be relied on as an indication of trading intent on behalf of any particular Columbia Fund. References to specific securities should not be construed as a recommendation or investment advice.
Columbia AMT-Free Massachusetts Intermediate Muni Bond Fund
Performance Summary
> Columbia AMT-Free Massachusetts Intermediate Muni Bond Fund (the Fund) Class A shares returned 4.65% excluding sales charges for the 12-month period that ended October 31, 2014. Class Z shares of the Fund returned 5.00%.
> The Fund's benchmark, the Barclays 3-15 Year Blend Municipal Bond Index, which is national in scope, returned 6.05% for the same time period.
> The Fund's shortfall relative to the benchmark was generally the result of its duration positioning.
Average Annual Total Returns (%) (for period ended October 31, 2014)
| | Inception | | 1 Year | | 5 Years | | 10 Years | |
Class A | | 12/09/02 | | | | | | | | | | | | | |
Excluding sales charges | | | | | | | 4.65 | | | | 3.86 | | | | 3.53 | | |
Including sales charges | | | | | | | 1.28 | | | | 3.17 | | | | 3.03 | | |
Class B | | 12/09/02 | | | | | | | | | | | | | |
Excluding sales charges | | | | | | | 3.96 | | | | 3.09 | | | | 2.76 | | |
Including sales charges | | | | | | | 0.96 | | | | 3.09 | | | | 2.76 | | |
Class C | | 12/09/02 | | | | | | | | | | | | | |
Excluding sales charges | | | | | | | 4.20 | | | | 3.44 | | | | 3.11 | | |
Including sales charges | | | | | | | 3.20 | | | | 3.44 | | | | 3.11 | | |
Class R4* | | 03/19/13 | | | 5.01 | | | | 4.13 | | | | 3.80 | | |
Class T | | 06/26/00 | | | | | | | | | | | | | |
Excluding sales charges | | | | | | | 4.85 | | | | 3.98 | | | | 3.64 | | |
Including sales charges | | | | | | | -0.13 | | | | 2.97 | | | | 3.14 | | |
Class Z | | 06/14/93 | | | 5.00 | | | | 4.13 | | | | 3.80 | | |
Barclays 3-15 Year Blend Municipal Bond Index | | | | | | | 6.05 | | | | 4.84 | | | | 4.54 | | |
Returns for Class A are shown with and without the maximum initial sales charge of 3.25% (for the six-month, one-year and five-year periods) and 4.75% (for the ten-year period). (Prior to August 22, 2005, new purchases of Class A shares had a maximum initial sales charge of 4.75%.) Returns for Class B are shown with and without the applicable contingent deferred sales charge (CDSC) of 3.00% in the first year, declining to 1.00% in the fourth year and eliminated thereafter. Returns for Class C are shown with and without the 1.00% CDSC for the first year only. Returns for Class T are shown with and without the maximum sales charge of 4.75%. The Fund's other classes are not subject to sales charges and have limited eligibility. Please see the Fund's prospectus for details. Performance for different share classes will vary based on differences in sales charges and fees associated with each class. All results shown assume reinvestment of distributions during the period. Returns do not reflect the deduction of taxes that a shareholder may pay on Fund distributions or on the redemption of Fund shares. Performance results reflect the effect of any fee waivers or reimbursements of Fund expenses by Columbia Management Investment Advisers, LLC and/or any of its affiliates. Absent these fee waivers or expense reimbursement arrangements, performance results would have been lower.
The performance information shown represents past performance and is not a guarantee of future results. The investment return and principal value of your investment will fluctuate so that your shares, when redeemed, may be worth more or less than their original cost. Current performance may be lower or higher than the performance information shown. You may obtain performance information current to the most recent month-end by contacting your financial intermediary, visiting columbiamanagement.com or calling 800.345.6611.
*The returns shown for periods prior to the share class inception date (including returns for the Life of the Fund, if shown, which are since Fund inception) include the returns of the Fund's oldest share class. These returns are adjusted to reflect any higher class-related operating expenses of the newer share classes, as applicable. Please visit columbiamanagement.com/mutual-funds/appended-performance for more information.
The Barclays 3-15 Year Blend Municipal Bond Index is an unmanaged index that tracks the performance of municipal bonds issued after December 31, 1990, with remaining maturities between 2 and 17 years and at least $7 million in principal amount outstanding.
Indices are not available for investment, are not professionally managed and do not reflect sales charges, fees, brokerage commissions, taxes or other expenses of investing. Securities in the Fund may not match those in an index.
Annual Report 2014
2
Columbia AMT-Free Massachusetts Intermediate Muni Bond Fund
Performance Overview (continued)
Performance of a Hypothetical $10,000 Investment (November 1, 2004 – October 31, 2014)

The chart above shows the change in value of a hypothetical $10,000 investment in Class A shares of Columbia AMT-Free Massachusetts Intermediate Muni Bond Fund during the stated time period, and does not reflect the deduction of taxes that a shareholder may pay on Fund distributions or on the redemption of Fund shares. The performance of a $10,000 investment in Class A shares with sales charge is calculated with an initial sales charge of 4.75%, which was the effective sales charge prior to August 22, 2005.
Annual Report 2014
3
Columbia AMT-Free Massachusetts Intermediate Muni Bond Fund
Manager Discussion of Fund Performance
Portfolio Management
Brian McGreevy
Paul Fuchs, CFA
Quality Breakdown (%)
(at October 31, 2014) | |
AAA rating | | | 5.9 | | |
AA rating | | | 52.5 | | |
A rating | | | 25.4 | | |
BBB rating | | | 12.7 | | |
Non-investment grade | | | 1.5 | | |
Not rated | | | 2.0 | | |
Total | | | 100.0 | | |
Percentages indicated are based upon total fixed income securities (excluding Money Market Funds).
Bond ratings apply to the underlying holdings of the Fund and not the Fund itself and are divided into categories ranging from highest to lowest credit quality, determined by using the middle rating of Moody's, S&P and Fitch, after dropping the highest and lowest available ratings. When ratings are available from only two rating agencies, the lower rating is used. When a rating is available from only one rating agency, that rating is used. When a bond is not rated by any rating agency, it is designated as "Not rated". Credit quality ratings assigned by a rating agency are subjective opinions, not statements of fact, and are subject to change, including daily. The ratings assigned by credit rating agencies are but one of the considerations that the Investment Manager and/or Fund's subadviser incorporates into its credit analysis process, along with such other issuer-specific factors as cash flows, capital structure and leverage ratios, ability to de-leverage (repay) through free cash flow, quality of management, market positioning and access to capital, as well as such security-specific factors as the terms of the security (e.g., interest rate, and time to maturity) and the amount and type of any collateral.
For the 12-month period that ended October 31, 2014, the Fund's Class A shares returned 4.65% excluding sales charges. Class Z shares of the Fund returned 5.00%. By comparison, the Fund's benchmark, the Barclays 3-15 Year Blend Municipal Bond Index, which is a national mix of municipal securities, returned 6.05% for the same time period. Its shortfall relative to the benchmark was generally the result of its duration positioning. Duration is a measure of interest rate sensitivity. The Fund's duration was shorter than that of the benchmark during the period. The Fund had less exposure than the benchmark to bonds in the 12- to 17-year range, a segment of the municipal market that performed strongly during the period. The Fund's emphasis on bonds rated BBB aided performance.
In July 2014, "AMT-Free" was added to the Fund's name, referencing a policy change that prohibits the Fund from investing in bonds subject to the federal Alternative Minimum Tax. No such bonds were owned during the period.
Strong Demand and Short Supply Aided Municipal Market
The municipal market ended 2013 under pressure, as the Federal Reserve (the Fed) announced its intention to taper its monthly bond purchases beginning in January 2014. Against this backdrop, yields rose and several major credit events clouded the municipal outlook. However, the environment improved in 2014 as money flowed back into municipal funds and new issue supply decreased. Lower rated and longer maturity municipals were the best performers for the period. Five-year yields dropped by six basis points, while 10-year and 15-year yields declined by 37 and 77 basis points, respectively. (A basis point is 1/100th of one percent.) As a result, the yield curve flattened. The yield curve is a graph of yields of municipal bonds rated AAA, from short to long term. The difference between one- and 15-year yields was 304 basis points at the beginning of the 12-month period and 231 basis points at the end.
Contributors and Detractors
In a year of generally solid results for municipal bonds, the Fund's sector positioning aided results relative to its benchmark. Hospital-related holdings generated solid returns, and we added to hospital names that we liked during the period — generally those in the 12- to 17-year maturity range. Electric revenue bonds were the best performing sector for the Fund, with returns in excess of 7.5%. Education bonds were the largest sector holding and garnered above-benchmark returns. Special tax bonds also made a positive contribution to results. The Fund's yield was in line with the yield of the benchmark.
The Fund's weight in each of the top three rating categories was approximately equal to the benchmark's weights, the result of the generally higher quality of Massachusetts bonds. The Fund had more exposure to bonds rated BBB, which generated solid returns, but lagged the return of the benchmark's holdings that were rated BBB. The Fund also lagged the overall benchmark in its return from state general obligation (GO) bonds, due to the fact that Massachusetts GOs were higher quality and shorter duration than GOs in the benchmark.
Annual Report 2014
4
Columbia AMT-Free Massachusetts Intermediate Muni Bond Fund
Manager Discussion of Fund Performance (continued)
Steady Growth for Massachusetts
Strong performance from education, healthcare and the high tech service sector helped the Massachusetts' economy grow at a solid, steady pace over the past year. In contrast to other states in the Northeast, Massachusetts has attracted an expanding labor force and its already highly educated workforce helped account for an unemployment rate that, at 5.8%, is in line with the national average. Personal income is growing faster than the national average, which has translated into soaring real estate prices. We believe that education, healthcare and technology may continue to drive growth over the next several years. Even though financial services and manufacturing play diminishing roles in the Commonwealth's industry mix, growth elsewhere points to a solid outlook. Growth is expected to keep pace with the national average and to exceed growth in the rest of the Northeast.
Looking Ahead
Given the slow but steady improvement in the U.S. economy, we do not, at this time, expect the Fed to materially change its current policy stance until late in 2015. With that in mind, we currently plan to maintain Fund duration at or near the level of the benchmark. We presently see value in the seven- to 10-year maturity range and also at the far end of the Fund's target maturity range, which is 17 to 20 years. We believe that security selection, backed by rigorous credit analysis, will be the key to performance going forward. We plan to analyze the potential for changes in tax or revenue policies in light of the November election results and to monitor hospital-related holdings in light of changes, rules and regulations tied to the implementation of the Affordable Care Act.
Investment Risks
Fixed-income securities present issuer default risk. The Fund invests substantially in municipal securities and will be affected by tax, legislative, regulatory, demographic or political changes, as well as changes impacting a state's financial, economic or other conditions. A relatively small number of tax-exempt issuers may necessitate the Fund investing more heavily in a single issuer and, therefore, be more exposed to the risk of loss than a fund that invests more broadly. The value of the Fund's portfolio may be more volatile than a more geographically diversified fund. Prepayment and extension risk exists as a loan, bond or other investment may be called, prepaid or redeemed before maturity and that similar yielding investments may not be available for purchase. A rise in interest rates may result in a price decline of fixed-income (debt) instruments held by the fund, negatively affecting its performance and NAV. Falling rates may result in the fund investing in lower yielding debt instruments, lowering the fund's income and yield. Debt instruments with longer maturity and duration have greater sensitivity to interest rate changes. Interest rates can change due to local government and banking regulation changes. Non-investment-grade (high-yield or junk) securities present greater price volatility and more risk to principal and income than higher rated securities. Market risk may affect a single issuer, sector of the economy, industry or the market as a whole. Federal and state tax rules apply to capital gain distributions and any gains or losses on sales. Income may be subject to state or local taxes. Liquidity risk is associated with the difficulty of selling underlying investments at a desirable time or price. See the Fund's prospectus for more information on these and other risks.
Annual Report 2014
5
Columbia AMT-Free Massachusetts Intermediate Muni Bond Fund
Understanding Your Fund's Expenses
(Unaudited)
As an investor, you incur two types of costs. There are transaction costs, which generally include sales charges on purchases and may include redemption fees. There are also ongoing costs, which generally include management fees, distribution and/or service fees, and other fund expenses. The following information is intended to help you understand your ongoing costs (in dollars) of investing in the Fund and to help you compare these costs with the ongoing costs of investing in other mutual funds.
Analyzing Your Fund's Expenses
To illustrate these ongoing costs, we have provided examples and calculated the expenses paid by investors in each share class of the Fund during the period. The actual and hypothetical information in the table is based on an initial investment of $1,000 at the beginning of the period indicated and held for the entire period. Expense information is calculated two ways and each method provides you with different information. The amount listed in the "Actual" column is calculated using the Fund's actual operating expenses and total return for the period. You may use the Actual information, together with the amount invested, to estimate the expenses that you paid over the period. Simply divide your account value by $1,000 (for example, an $8,600 account value divided by $1,000 = 8.6), then multiply the results by the expenses paid during the period under the "Actual" column. The amount listed in the "Hypothetical" column assumes a 5% annual rate of return before expenses (which is not the Fund's actual return) and then applies the Fund's actual expense ratio for the period to the hypothetical return. You should not use the hypothetical account values and expenses to estimate either your actual account balance at the end of the period or the expenses you paid during the period. See "Compare With Other Funds" below for details on how to use the hypothetical data.
Compare With Other Funds
Since all mutual funds are required to include the same hypothetical calculations about expenses in shareholder reports, you can use this information to compare the ongoing cost of investing in the Fund with other funds. To do so, compare the hypothetical example with the 5% hypothetical examples that appear in the shareholder reports of other funds. As you compare hypothetical examples of other funds, it is important to note that hypothetical examples are meant to highlight the ongoing costs of investing in a fund only and do not reflect any transaction costs, such as sales charges, or redemption or exchange fees. Therefore, the hypothetical calculations are useful in comparing ongoing costs only, and will not help you determine the relative total costs of owning different funds. If transaction costs were included in these calculations, your costs would be higher.
May 1, 2014 – October 31, 2014
| | Account Value at the Beginning
of the Period ($) | | Account Value at the End of the
Period ($) | | Expenses Paid During the
Period ($) | | Fund's Annualized
Expense Ratio (%) | |
| | Actual | | Hypothetical | | Actual | | Hypothetical | | Actual | | Hypothetical | | Actual | |
Class A | | | 1,000.00 | | | | 1,000.00 | | | | 1,023.50 | | | | 1,021.12 | | | | 4.13 | | | | 4.13 | | | | 0.81 | | |
Class B | | | 1,000.00 | | | | 1,000.00 | | | | 1,020.50 | | | | 1,017.34 | | | | 7.94 | | | | 7.93 | | | | 1.56 | | |
Class C | | | 1,000.00 | | | | 1,000.00 | | | | 1,021.20 | | | | 1,018.85 | | | | 6.42 | | | | 6.41 | | | | 1.26 | | |
Class R4 | | | 1,000.00 | | | | 1,000.00 | | | | 1,025.70 | | | | 1,022.38 | | | | 2.86 | | | | 2.85 | | | | 0.56 | | |
Class T | | | 1,000.00 | | | | 1,000.00 | | | | 1,024.90 | | | | 1,021.63 | | | | 3.62 | | | | 3.62 | | | | 0.71 | | |
Class Z | | | 1,000.00 | | | | 1,000.00 | | | | 1,025.70 | | | | 1,022.38 | | | | 2.86 | | | | 2.85 | | | | 0.56 | | |
Expenses paid during the period are equal to the annualized expense ratio for each class as indicated above, multiplied by the average account value over the period and then multiplied by the number of days in the Fund's most recent fiscal half year and divided by 365.
Expenses do not include fees and expenses incurred indirectly by the Fund from its investment in underlying funds, including affiliated and non-affiliated pooled investment vehicles, such as mutual funds and exchange-traded funds.
Had Columbia Management Investment Advisers, LLC and/or certain of its affiliates not waived/reimbursed certain fees and expenses, account value at the end of the period would have been reduced.
Annual Report 2014
6
Columbia AMT-Free Massachusetts Intermediate Muni Bond Fund
Portfolio of Investments
October 31, 2014
(Percentages represent value of investments compared to net assets)
Municipal Bonds 98.5%
Issue
Description | | Coupon
Rate | | Principal
Amount ($) | | Value ($) | |
Airport 3.1% | |
Massachusetts Port Authority
Refunding Revenue Bonds
Passenger Facility Charge
Series 2007D (AGM)
07/01/17 | | | 5.000 | % | | | 3,000,000 | | | | 3,344,430 | | |
Series 2014C
07/01/31 | | | 5.000 | % | | | 1,900,000 | | | | 2,239,454 | | |
Revenue Bonds
Series 2005C (AMBAC)
07/01/22 | | | 5.000 | % | | | 3,500,000 | | | | 3,609,585 | | |
Total | | | | | | | 9,193,469 | | |
Assisted Living 0.6% | |
Massachusetts Development Finance Agency
Refunding Revenue Bonds
1st Mortgage-VOA Concord
Series 2007
11/01/17 | | | 5.000 | % | | | 320,000 | | | | 332,448 | | |
11/01/27 | | | 5.125 | % | | | 1,500,000 | | | | 1,504,125 | | |
Total | | | | | | | 1,836,573 | | |
Higher Education 19.3% | |
Massachusetts Development Finance Agency
Revenue Bonds
Boston College
Series 2007P
07/01/20 | | | 5.000 | % | | | 3,260,000 | | | | 3,633,139 | | |
Brandeis University
Series 2010O-2
10/01/24 | | | 5.000 | % | | | 5,000,000 | | | | 5,764,650 | | |
Emerson College
Series 2006A
01/01/20 | | | 5.000 | % | | | 870,000 | | | | 938,930 | | |
01/01/21 | | | 5.000 | % | | | 2,500,000 | | | | 2,698,075 | | |
01/01/23 | | | 5.000 | % | | | 1,000,000 | | | | 1,076,550 | | |
Massachusetts College-Pharmacy & Allied Health
Series 2013
07/01/25 | | | 5.000 | % | | | 675,000 | | | | 797,668 | | |
Merrimack College
Series 2012A
07/01/27 | | | 5.000 | % | | | 1,075,000 | | | | 1,144,585 | | |
Mount Holyoke College
Series 2008
07/01/23 | | | 5.000 | % | | | 1,285,000 | | | | 1,454,890 | | |
Simmons College
Series 2013J
10/01/24 | | | 5.250 | % | | | 500,000 | | | | 577,380 | | |
10/01/25 | | | 5.500 | % | | | 450,000 | | | | 527,346 | | |
Wheelock College
Series 2007C
10/01/17 | | | 5.000 | % | | | 740,000 | | | | 802,123 | | |
Worcester Polytechnic Institute
Series 2007 (NPFGC)
09/01/22 | | | 5.000 | % | | | 1,710,000 | | | | 1,886,284 | | |
Municipal Bonds (continued)
Issue
Description | | Coupon
Rate | | Principal
Amount ($) | | Value ($) | |
Massachusetts Health & Educational Facilities Authority
Revenue Bonds
Berklee College of Music
Series 2007A
10/01/32 | | | 5.000 | % | | | 2,440,000 | | | | 2,671,971 | | |
Boston College
Series 2008M-1
06/01/24 | | | 5.500 | % | | | 3,000,000 | | | | 3,754,200 | | |
Massachusetts Institute of Technology
Series 2002K
07/01/17 | | | 5.375 | % | | | 2,275,000 | | | | 2,565,813 | | |
07/01/22 | | | 5.500 | % | | | 1,000,000 | | | | 1,265,920 | | |
Series 2004M
07/01/19 | | | 5.250 | % | | | 610,000 | | | | 725,760 | | |
Northeastern University
Series 2008T-1
10/01/28 | | | 5.000 | % | | | 1,750,000 | | | | 1,996,295 | | |
Series 2008T-2
10/01/29 | | | 5.000 | % | | | 4,045,000 | | | | 4,605,111 | | |
Simmons College
Series 2009I
10/01/18 | | | 6.750 | % | | | 1,365,000 | | | | 1,623,367 | | |
Suffolk University
Series 2009A
07/01/24 | | | 6.000 | % | | | 2,100,000 | | | | 2,477,895 | | |
Tufts University
Series 2002J
08/15/16 | | | 5.500 | % | | | 1,500,000 | | | | 1,635,015 | | |
Series 2008
08/15/17 | | | 5.000 | % | | | 1,145,000 | | | | 1,283,201 | | |
Massachusetts State College Building Authority
Revenue Bonds
Series 2012A
05/01/29 | | | 5.000 | % | | | 3,000,000 | | | | 3,532,470 | | |
University of Massachusetts Building Authority
Revenue Bonds
Senior Series 2008-2 (AGM)
05/01/21 | | | 5.000 | % | | | 1,510,000 | | | | 1,702,208 | | |
Senior Series 2009-1
05/01/23 | | | 5.000 | % | | | 5,000,000 | | | | 5,731,200 | | |
Total | | | | | | | 56,872,046 | | |
Hospital 13.1% | |
Massachusetts Development Finance Agency
Revenue Bonds
Berkshire Health System
Series 2012G
10/01/26 | | | 5.000 | % | | | 1,200,000 | | | | 1,333,632 | | |
Boston Medical Center
Series 2012C
07/01/27 | | | 5.250 | % | | | 3,695,000 | | | | 4,058,551 | | |
Children's Hospital
Series 2014P
10/01/31 | | | 5.000 | % | | | 1,200,000 | | | | 1,414,668 | | |
The accompanying Notes to Financial Statements are an integral part of this statement.
Annual Report 2014
7
Columbia AMT-Free Massachusetts Intermediate Muni Bond Fund
Portfolio of Investments (continued)
October 31, 2014
Municipal Bonds (continued)
Issue
Description | | Coupon
Rate | | Principal
Amount ($) | | Value ($) | |
Milford Regional Medical Center
Series 2014F
07/15/26 | | | 5.000 | % | | | 315,000 | | | | 336,811 | | |
Southcoast Health System Obligation Group
Series 2013
07/01/27 | | | 5.000 | % | | | 1,050,000 | | | | 1,219,617 | | |
UMASS Memorial Health Care Obligation
Series 2011H
07/01/26 | | | 5.125 | % | | | 2,000,000 | | | | 2,126,220 | | |
Massachusetts Development Finance Agency(a)
Revenue Bonds
Baystate Medical Center
Series 2014N
07/01/28 | | | 5.000 | % | | | 1,000,000 | | | | 1,144,130 | | |
07/01/34 | | | 5.000 | % | | | 1,500,000 | | | | 1,680,495 | | |
Massachusetts Health & Educational Facilities Authority
Revenue Bonds
Caregroup, Inc.
Series 1998B-2 (NPFGC)
02/01/27 | | | 5.375 | % | | | 1,585,000 | | | | 1,782,856 | | |
Series 2004D (NPFGC)
07/01/22 | | | 5.250 | % | | | 1,000,000 | | | | 1,133,050 | | |
Series 2008E-2
07/01/19 | | | 5.375 | % | | | 4,675,000 | | | | 5,317,812 | | |
Massachusetts Eye & Ear Infirmary
Series 2010C
07/01/17 | | | 5.000 | % | | | 1,425,000 | | | | 1,544,728 | | |
Milford Regional Medical Center
Series 2007E
07/15/17 | | | 5.000 | % | | | 1,050,000 | | | | 1,134,042 | | |
07/15/22 | | | 5.000 | % | | | 1,500,000 | | | | 1,567,380 | | |
Milton Hospital
Series 2005D
07/01/30 | | | 5.250 | % | | | 2,150,000 | | | | 2,163,846 | | |
Partners Healthcare
Series 2010J-2
07/01/22 | | | 5.000 | % | | | 5,000,000 | | | | 5,762,200 | | |
Partners Healthcare System
Series 2005F
07/01/17 | | | 5.000 | % | | | 2,000,000 | | | | 2,062,080 | | |
Series 2007G
07/01/18 | | | 5.000 | % | | | 2,575,000 | | | | 2,860,413 | | |
Total | | | | | | | 38,642,531 | | |
Human Service Provider 0.5% | |
Massachusetts Development Finance Agency
Revenue Bonds
Evergreen Center, Inc.
Series 2005
01/01/20 | | | 5.500 | % | | | 1,355,000 | | | | 1,360,271 | | |
Joint Power Authority 4.3% | |
Berkshire Wind Power Cooperative Corp.
Revenue Bonds
Series 2010-1
07/01/24 | | | 5.250 | % | | | 3,785,000 | | | | 4,165,847 | | |
07/01/25 | | | 5.000 | % | | | 2,000,000 | | | | 2,171,600 | | |
Municipal Bonds (continued)
Issue
Description | | Coupon
Rate | | Principal
Amount ($) | | Value ($) | |
Massachusetts Clean Energy Cooperative Corp.
Revenue Bonds
Municipal Lighting Plant Cooperative
Series 2013
07/01/27 | | | 5.000 | % | | | 2,720,000 | | | | 3,218,929 | | |
Massachusetts Municipal Wholesale Electric Co.
Revenue Bonds
Project No. 6
Series 2011
07/01/19 | | | 5.000 | % | | | 2,760,000 | | | | 3,210,018 | | |
Total | | | | | | | 12,766,394 | | |
Local General Obligation 1.4% | |
City of Fall River
Limited General Obligation Refunding Bonds
State Qualified
Series 2012
03/01/21 | | | 4.000 | % | | | 335,000 | | | | 379,944 | | |
City of Lawrence
Limited General Obligation Refunding Bonds
State Qualified
Series 2006 (AGM)
02/01/18 | | | 5.000 | % | | | 1,500,000 | | | | 1,640,985 | | |
City of Springfield
Limited General Obligation Bonds
State Qualified Municipal Purpose Loan
Series 2007 (AGM)
08/01/21 | | | 4.500 | % | | | 2,000,000 | | | | 2,152,100 | | |
Total | | | | | | | 4,173,029 | | |
Municipal Power 0.3% | |
Guam Power Authority
Refunding Revenue Bonds
Series 2012A (AGM)(b)
10/01/24 | | | 5.000 | % | | | 630,000 | | | | 746,701 | | |
Other Bond Issue 3.1% | |
Boston Housing Authority
Revenue Bonds
Series 2008 (AGM)
04/01/20 | | | 5.000 | % | | | 2,135,000 | | | | 2,367,502 | | |
04/01/23 | | | 5.000 | % | | | 1,865,000 | | | | 2,029,213 | | |
04/01/24 | | | 5.000 | % | | | 3,260,000 | | | | 3,534,427 | | |
Massachusetts Development Finance Agency
Revenue Bonds
Broad Institute
Series 2011A
04/01/23 | | | 5.250 | % | | | 1,000,000 | | | | 1,194,980 | | |
Total | | | | | | | 9,126,122 | | |
The accompanying Notes to Financial Statements are an integral part of this statement.
Annual Report 2014
8
Columbia AMT-Free Massachusetts Intermediate Muni Bond Fund
Portfolio of Investments (continued)
October 31, 2014
Municipal Bonds (continued)
Issue
Description | | Coupon
Rate | | Principal
Amount ($) | | Value ($) | |
Pool/Bond Bank 3.0% | |
Massachusetts Clean Water Trust (The)
Refunding Revenue Bonds
Pool Program
Series 2006
08/01/20 | | | 5.250 | % | | | 3,000,000 | | | | 3,651,330 | | |
Revenue Bonds
Pool Program
Series 2005-11
08/01/19 | | | 5.250 | % | | | 4,465,000 | | | | 5,322,771 | | |
Total | | | | | | | 8,974,101 | | |
Prep School 1.9% | |
Massachusetts Development Finance Agency
Revenue Bonds
Foxborough Regional Charter School
Series 2010A
07/01/30 | | | 6.375 | % | | | 2,955,000 | | | | 3,263,384 | | |
Noble & Greenough School
Series 2011
04/01/21 | | | 4.000 | % | | | 1,500,000 | | | | 1,692,375 | | |
Park School
Series 2012
09/01/20 | | | 5.000 | % | | | 150,000 | | | | 174,622 | | |
09/01/21 | | | 5.000 | % | | | 330,000 | | | | 386,562 | | |
Total | | | | | | | 5,516,943 | | |
Refunded/Escrowed 7.5% | |
Massachusetts Development Finance Agency(c)
Prerefunded 05/01/19 Revenue Bonds
Dominion Energy Brayton 1
Series 2009
12/01/42 | | | 5.750 | % | | | 3,460,000 | | | | 4,171,895 | | |
Prerefunded 09/01/16 Revenue Bonds
Dominion Energy Brayton
Series 2010A
12/01/41 | | | 2.250 | % | | | 2,260,000 | | | | 2,335,823 | | |
Massachusetts School Building Authority
Prerefunded 08/15/15 Revenue Bonds
Series 2005A (AGM)
08/15/26 | | | 5.000 | % | | | 5,000,000 | | | | 5,190,800 | | |
Massachusetts State College Building Authority
Revenue Bonds
Capital Appreciation
Senior Series 1999A Escrowed to Maturity (NPFGC)(d)
05/01/28 | | | 0.000 | % | | | 4,000,000 | | | | 2,799,840 | | |
Massachusetts Water Pollution Abatement Trust (The)
Prerefunded 08/01/19 Revenue Bonds
State Revolving Fund
Series 2009-14
08/01/24 | | | 5.000 | % | | | 3,100,000 | | | | 3,652,172 | | |
Municipal Bonds (continued)
Issue
Description | | Coupon
Rate | | Principal
Amount ($) | | Value ($) | |
Massachusetts Water Resources Authority
Refunding Revenue Bonds
General
Series 1998B Escrowed to Maturity (AGM/TCRS)
08/01/15 | | | 5.500 | % | | | 1,025,000 | | | | 1,065,949 | | |
Revenue Bonds
General
Series 2002J Escrowed to Maturity (AGM/TCRS)
08/01/15 | | | 5.250 | % | | | 1,500,000 | | | | 1,557,120 | | |
Puerto Rico Highways & Transportation Authority
Refunding Revenue Bonds
Series 2005BB Escrowed to Maturity (AGM)(b)
07/01/22 | | | 5.250 | % | | | 1,075,000 | | | | 1,335,139 | | |
Total | | | | | | | 22,108,738 | | |
Retirement Communities 0.4% | |
Massachusetts Development Finance Agency
Revenue Bonds
1st Mortgage-Orchard Cove
Series 2007
10/01/17 | | | 5.000 | % | | | 650,000 | | | | 692,400 | | |
10/01/18 | | | 5.000 | % | | | 515,000 | | | | 544,432 | | |
Total | | | | | | | 1,236,832 | | |
Special Non Property Tax 10.1% | |
Commonwealth of Massachusetts
Revenue Bonds
Series 2004 (NPFGC)
01/01/19 | | | 5.250 | % | | | 750,000 | | | | 867,120 | | |
Massachusetts Bay Transportation Authority
Revenue Bonds
Senior Series 2003A
07/01/17 | | | 5.250 | % | | | 1,000,000 | | | | 1,125,380 | | |
07/01/19 | | | 5.250 | % | | | 625,000 | | | | 743,288 | | |
Senior Series 2004C
07/01/18 | | | 5.250 | % | | | 1,000,000 | | | | 1,159,290 | | |
Senior Series 2005B (NPFGC)
07/01/23 | | | 5.500 | % | | | 2,890,000 | | | | 3,685,906 | | |
Senior Series 2006A
07/01/22 | | | 5.250 | % | | | 3,500,000 | | | | 4,345,565 | | |
Senior Series 2008B
07/01/23 | | | 5.000 | % | | | 910,000 | | | | 1,122,166 | | |
Massachusetts School Building Authority
Revenue Bonds
Senior Series 2011B
10/15/27 | | | 5.000 | % | | | 4,000,000 | | | | 4,772,680 | | |
Series 2007A (AMBAC)
08/15/18 | | | 5.000 | % | | | 5,000,000 | | | | 5,607,800 | | |
Territory of Guam
Revenue Bonds
Series 2011A(b)
01/01/31 | | | 5.000 | % | | | 950,000 | | | | 1,036,440 | | |
The accompanying Notes to Financial Statements are an integral part of this statement.
Annual Report 2014
9
Columbia AMT-Free Massachusetts Intermediate Muni Bond Fund
Portfolio of Investments (continued)
October 31, 2014
Municipal Bonds (continued)
Issue
Description | | Coupon
Rate | | Principal
Amount ($) | | Value ($) | |
Virgin Islands Public Finance Authority(b)
Refunding Revenue Bonds
Gross Receipts Taxes Loan
Series 2012A
10/01/22 | | | 4.000 | % | | | 2,000,000 | | | | 2,106,120 | | |
Revenue Bonds
Matching Fund Loan Notes-Senior Lien
Series 2010A
10/01/25 | | | 5.000 | % | | | 2,755,000 | | | | 3,054,772 | | |
Total | | | | | | | 29,626,527 | | |
Special Property Tax 1.6% | |
Metropolitan Boston Transit Parking Corp.
Revenue Bonds
Series 2011
07/01/25 | | | 5.000 | % | | | 3,210,000 | | | | 3,796,146 | | |
07/01/27 | | | 5.000 | % | | | 775,000 | | | | 903,906 | | |
Total | | | | | | | 4,700,052 | | |
State Appropriated 0.9% | |
Massachusetts Development Finance Agency
Revenue Bonds
Visual & Performing Arts Project
Series 2000
08/01/17 | | | 6.000 | % | | | 540,000 | | | | 615,022 | | |
08/01/21 | | | 6.000 | % | | | 1,750,000 | | | | 2,075,325 | | |
Total | | | | | | | 2,690,347 | | |
State General Obligation 15.3% | |
Commonwealth of Massachusetts
Limited General Obligation Bonds
Consolidated Loan
Series 2002D (AMBAC/TCRS/BNY)
08/01/18 | | | 5.500 | % | | | 3,500,000 | | | | 4,095,560 | | |
Series 2008A
08/01/16 | | | 5.000 | % | | | 2,000,000 | | | | 2,160,620 | | |
Limited General Obligation Refunding Bonds
Series 2003D
10/01/17 | | | 5.500 | % | | | 5,000,000 | | | | 5,708,000 | | |
Series 2003D (AMBAC)
10/01/19 | | | 5.500 | % | | | 5,000,000 | | | | 6,034,050 | | |
Series 2003D (NPFGC)
10/01/20 | | | 5.500 | % | | | 2,500,000 | | | | 3,073,650 | | |
Series 2004B
08/01/20 | | | 5.250 | % | | | 3,000,000 | | | | 3,634,650 | | |
Series 2006B (AGM)
09/01/22 | | | 5.250 | % | | | 4,000,000 | | | | 4,971,960 | | |
Unlimited General Obligation Refunding Bonds
Series 2003D (AGM)
10/01/19 | | | 5.500 | % | | | 3,500,000 | | | | 4,223,835 | | |
Series 2004C (AMBAC)
12/01/24 | | | 5.500 | % | | | 5,000,000 | | | | 6,451,100 | | |
Series 2004C (NPFGC)
12/01/19 | | | 5.500 | % | | | 3,795,000 | | | | 4,602,918 | | |
Total | | | | | | | 44,956,343 | | |
Municipal Bonds (continued)
Issue
Description | | Coupon
Rate | | Principal
Amount ($) | | Value ($) | |
Student Loan 2.7% | |
Massachusetts Educational Financing Authority
Revenue Bonds
Issue I
Series 2010A
01/01/22 | | | 5.500 | % | | | 4,625,000 | | | | 5,298,261 | | |
Series 2009I
01/01/18 | | | 5.125 | % | | | 2,530,000 | | | | 2,688,125 | | |
Total | | | | | | | 7,986,386 | | |
Transportation 0.3% | |
Woods Hole Martha's Vineyard & Nantucket Steamship Authority
Revenue Bonds
Series 2004B
03/01/18 | | | 5.000 | % | | | 975,000 | | | | 990,347 | | |
Turnpike/Bridge/Toll Road 1.8% | |
Massachusetts Department of Transportation
Revenue Bonds
Senior Series 2010B
01/01/22 | | | 5.000 | % | | | 2,180,000 | | | | 2,489,102 | | |
01/01/32 | | | 5.000 | % | | | 2,400,000 | | | | 2,659,560 | | |
Total | | | | | | | 5,148,662 | | |
Water & Sewer 7.3% | |
Massachusetts Water Resources Authority
Refunding Revenue Bonds
General
Series 2005A (NPFGC/TCRS)
08/01/17 | | | 5.250 | % | | | 6,000,000 | | | | 6,770,580 | | |
Series 2007B (AGM/TCRS)
08/01/23 | | | 5.250 | % | | | 5,500,000 | | | | 6,923,180 | | |
Series 2012B
08/01/28 | | | 5.000 | % | | | 5,000,000 | | | | 5,894,200 | | |
Revenue Bonds
General
Series 2002J (AGM/TCRS)
08/01/18 | | | 5.250 | % | | | 1,000,000 | | | | 1,161,300 | | |
Springfield Water & Sewer Commission
Refunding Revenue Bonds
General
Series 2012C
07/15/26 | | | 5.000 | % | | | 365,000 | | | | 444,008 | | |
Series 2014C
07/15/24 | | | 5.000 | % | | | 260,000 | | | | 320,668 | | |
Total | | | | | | | 21,513,936 | | |
Total Municipal Bonds
(Cost: $264,610,248) | | | | | | | 290,166,350 | | |
The accompanying Notes to Financial Statements are an integral part of this statement.
Annual Report 2014
10
Columbia AMT-Free Massachusetts Intermediate Muni Bond Fund
Portfolio of Investments (continued)
October 31, 2014
Money Market Funds 0.3%
| | | | | Shares | | Value ($) | |
Dreyfus Tax-Exempt Cash Management Fund,
0.000%(e) | | | | | 1,027,254 | | | | 1,027,254 | | |
Total Money Market Funds
(Cost: $1,027,254) | | | | | | | | | | | 1,027,254 | | |
Total Investments
(Cost: $265,637,502) | | | | | | | | | | | 291,193,604 | | |
Other Assets & Liabilities, Net | | | | | | | | | | | 3,492,749 | | |
Net Assets | | | | | | | | | | | 294,686,353 | | |
Notes to Portfolio of Investments
(a) Represents a security purchased on a when-issued or delayed delivery basis.
(b) Municipal obligations include debt obligations issued by or on behalf of territories, possessions, or sovereign nations within the territorial boundaries of the United States. At October 31, 2014, the value of these securities amounted to $8,279,172 or 2.81% of net assets.
(c) Variable rate security.
(d) Zero coupon bond.
(e) The rate shown is the seven-day current annualized yield at October 31, 2014.
Abbreviation Legend
AGM Assured Guaranty Municipal Corporation
AMBAC Ambac Assurance Corporation
BNY Bank of New York
NPFGC National Public Finance Guarantee Corporation
TCRS Transferable Custodial Receipts
Fair Value Measurements
Generally accepted accounting principles (GAAP) require disclosure regarding the inputs and valuation techniques used to measure fair value and any changes in valuation inputs or techniques. In addition, investments shall be disclosed by major category.
The Fund categorizes its fair value measurements according to a three-level hierarchy that maximizes the use of observable inputs and minimizes the use of unobservable inputs by prioritizing that the most observable input be used when available. Observable inputs are those that market participants would use in pricing an investment based on market data obtained from sources independent of the reporting entity. Unobservable inputs are those that reflect the Fund's assumptions about the information market participants would use in pricing an investment. An investment's level within the fair value hierarchy is based on the lowest level of any input that is deemed significant to the asset or liability's fair value measurement. The input levels are not necessarily an indication of the risk or liquidity associated with investments at that level. For example, certain U.S. government securities are generally high quality and liquid, however, they are reflected as Level 2 because the inputs used to determine fair value may not always be quoted prices in an active market.
Fair value inputs are summarized in the three broad levels listed below:
> Level 1 — Valuations based on quoted prices for investments in active markets that the Fund has the ability to access at the measurement date (including NAV for open-end mutual funds). Valuation adjustments are not applied to Level 1 investments.
> Level 2 — Valuations based on other significant observable inputs (including quoted prices for similar securities, interest rates, prepayment speeds, credit risks, etc.).
> Level 3 — Valuations based on significant unobservable inputs (including the Fund's own assumptions and judgment in determining the fair value of investments).
Inputs that are used in determining fair value of an investment may include price information, credit data, volatility statistics, and other factors. These inputs can be either observable or unobservable. The availability of observable inputs can vary between investments, and is
The accompanying Notes to Financial Statements are an integral part of this statement.
Annual Report 2014
11
Columbia AMT-Free Massachusetts Intermediate Muni Bond Fund
Portfolio of Investments (continued)
October 31, 2014
Fair Value Measurements (continued)
affected by various factors such as the type of investment, and the volume and level of activity for that investment or similar investments in the marketplace. The inputs will be considered by the Investment Manager, along with any other relevant factors in the calculation of an investment's fair value. The Fund uses prices and inputs that are current as of the measurement date, which may include periods of market dislocations. During these periods, the availability of prices and inputs may be reduced for many investments. This condition could cause an investment to be reclassified between the various levels within the hierarchy.
Investments falling into the Level 3 category are primarily supported by quoted prices from brokers and dealers participating in the market for those investments. However, these may be classified as Level 3 investments due to lack of market transparency and corroboration to support these quoted prices. Additionally, valuation models may be used as the pricing source for any remaining investments classified as Level 3. These models may rely on one or more significant unobservable inputs and/or significant assumptions by the Investment Manager. Inputs used in valuations may include, but are not limited to, financial statement analysis, capital account balances, discount rates and estimated cash flows, and comparable company data.
Under the direction of the Fund's Board of Trustees (the Board), the Investment Manager's Valuation Committee (the Committee) is responsible for overseeing the valuation procedures approved by the Board. The Committee consists of voting and non-voting members from various groups within the Investment Manager's organization, including operations and accounting, trading and investments, compliance, risk management and legal.
The Committee meets at least monthly to review and approve valuation matters, which may include a description of specific valuation determinations, data regarding pricing information received from approved pricing vendors and brokers and the results of Board-approved valuation control policies and procedures (the Policies). The Policies address, among other things, instances when market quotations are or are not readily available, including recommendations of third party pricing vendors and a determination of appropriate pricing methodologies; events that require specific valuation determinations and assessment of fair value techniques; securities with a potential for stale pricing, including those that are illiquid, restricted, or in default; and the effectiveness of third party pricing vendors, including periodic reviews of vendors. The Committee meets more frequently, as needed, to discuss additional valuation matters, which may include the need to review back-testing results, review time-sensitive information or approve related valuation actions. The Committee reports to the Board, with members of the Committee meeting with the Board at each of its regularly scheduled meetings to discuss valuation matters and actions during the period, similar to those described earlier.
For investments categorized as Level 3, the Committee monitors information similar to that described above, which may include: (i) data specific to the issuer or comparable issuers, (ii) general market or specific sector news and (iii) quoted prices and specific or similar security transactions. The Committee considers this data and any changes from prior periods in order to assess the reasonableness of observable and unobservable inputs, any assumptions or internal models used to value those securities and changes in fair value. This data is also used to corroborate, when available, information received from approved pricing vendors and brokers. Various factors impact the frequency of monitoring this information (which may occur as often as daily). However, the Committee may determine that changes to inputs, assumptions and models are not required as a result of the monitoring procedures performed.
The following table is a summary of the inputs used to value the Fund's investments at October 31, 2014:
Description | | Level 1
Quoted Prices in Active
Markets for Identical
Assets ($) | | Level 2
Other Significant
Observable Inputs ($) | | Level 3
Significant
Unobservable Inputs ($) | | Total ($) | |
Bonds | |
Municipal Bonds | | | — | | | | 290,166,350 | | | | — | | | | 290,166,350 | | |
Total Bonds | | | — | | | | 290,166,350 | | | | — | | | | 290,166,350 | | |
Mutual Funds | |
Money Market Funds | | | 1,027,254 | | | | — | | | | — | | | | 1,027,254 | | |
Total Mutual Funds | | | 1,027,254 | | | | — | | | | — | | | | 1,027,254 | | |
Total | | | 1,027,254 | | | | 290,166,350 | | | | — | | | | 291,193,604 | | |
See the Portfolio of Investments for all investment classifications not indicated in the table.
The Fund's assets assigned to the Level 2 input category are generally valued using the market approach, in which a security's value is determined through reference to prices and information from market transactions for similar or identical assets.
There were no transfers of financial assets between levels during the period.
The accompanying Notes to Financial Statements are an integral part of this statement.
Annual Report 2014
12
Columbia AMT-Free Massachusetts Intermediate Muni Bond Fund
Statement of Assets and Liabilities
October 31, 2014
Assets | |
Investments, at value | |
(identified cost $265,637,502) | | $ | 291,193,604 | | |
Cash | | | 1,024,919 | | |
Receivable for: | |
Investments sold | | | 2,612,575 | | |
Capital shares sold | | | 297,971 | | |
Interest | | | 3,374,367 | | |
Expense reimbursement due from Investment Manager | | | 1,137 | | |
Prepaid expenses | | | 2,418 | | |
Trustees' deferred compensation plan | | | 44,140 | | |
Total assets | | | 298,551,131 | | |
Liabilities | |
Payable for: | |
Investments purchased on a delayed delivery basis | | | 2,826,010 | | |
Capital shares purchased | | | 117,335 | | |
Dividend distributions to shareholders | | | 789,707 | | |
Investment management fees | | | 3,231 | | |
Distribution and/or service fees | | | 441 | | |
Transfer agent fees | | | 51,903 | | |
Administration fees | | | 559 | | |
Chief compliance officer expenses | | | 15 | | |
Other expenses | | | 31,437 | | |
Trustees' deferred compensation plan | | | 44,140 | | |
Total liabilities | | | 3,864,778 | | |
Net assets applicable to outstanding capital stock | | $ | 294,686,353 | | |
Represented by | |
Paid-in capital | | $ | 269,512,118 | | |
Excess of distributions over net investment income | | | (27,044 | ) | |
Accumulated net realized loss | | | (354,823 | ) | |
Unrealized appreciation (depreciation) on: | |
Investments | | | 25,556,102 | | |
Total — representing net assets applicable to outstanding capital stock | | $ | 294,686,353 | | |
The accompanying Notes to Financial Statements are an integral part of this statement.
Annual Report 2014
13
Columbia AMT-Free Massachusetts Intermediate Muni Bond Fund
Statement of Assets and Liabilities (continued)
October 31, 2014
Class A | |
Net assets | | $ | 22,539,686 | | |
Shares outstanding | | | 2,046,276 | | |
Net asset value per share | | $ | 11.01 | | |
Maximum offering price per share(a) | | $ | 11.38 | | |
Class B | |
Net assets | | $ | 10,213 | | |
Shares outstanding | | | 927 | | |
Net asset value per share | | $ | 11.02 | | |
Class C | |
Net assets | | $ | 10,366,069 | | |
Shares outstanding | | | 941,114 | | |
Net asset value per share | | $ | 11.01 | | |
Class R4 | |
Net assets | | $ | 122,194 | | |
Shares outstanding | | | 11,101 | | |
Net asset value per share | | $ | 11.01 | | |
Class T | |
Net assets | | $ | 21,344,563 | | |
Shares outstanding | | | 1,937,514 | | |
Net asset value per share | | $ | 11.02 | | |
Maximum offering price per share(a) | | $ | 11.57 | | |
Class Z | |
Net assets | | $ | 240,303,628 | | |
Shares outstanding | | | 21,813,188 | | |
Net asset value per share | | $ | 11.02 | | |
(a) The maximum offering price per share is calculated by dividing the net asset value per share by 1.0 minus the maximum sales charge of 3.25% for Class A and 4.75% for Class T.
The accompanying Notes to Financial Statements are an integral part of this statement.
Annual Report 2014
14
Columbia AMT-Free Massachusetts Intermediate Muni Bond Fund
Statement of Operations
Year Ended October 31, 2014
Net investment income | |
Income: | |
Dividends | | $ | 163 | | |
Interest | | | 11,445,872 | | |
Total income | | | 11,446,035 | | |
Expenses: | |
Investment management fees | | | 1,203,390 | | |
Distribution and/or service fees | |
Class A | | | 55,974 | | |
Class B | | | 62 | | |
Class C | | | 108,439 | | |
Class T | | | 32,712 | | |
Transfer agent fees | |
Class A | | | 42,559 | | |
Class B | | | 12 | | |
Class C | | | 20,618 | | |
Class R4 | | | 170 | | |
Class T | | | 41,459 | | |
Class Z | | | 467,128 | | |
Administration fees | | | 208,051 | | |
Compensation of board members | | | 28,336 | | |
Custodian fees | | | 2,776 | | |
Printing and postage fees | | | 31,461 | | |
Registration fees | | | 49,227 | | |
Professional fees | | | 33,135 | | |
Chief compliance officer expenses | | | 154 | | |
Other | | | 9,938 | | |
Total expenses | | | 2,335,601 | | |
Fees waived or expenses reimbursed by Investment Manager and its affiliates | | | (453,509 | ) | |
Fees waived by Distributor — Class C | | | (34,367 | ) | |
Expense reductions | | | (160 | ) | |
Total net expenses | | | 1,847,565 | | |
Net investment income | | | 9,598,470 | | |
Realized and unrealized gain (loss) — net | |
Net realized gain (loss) on: | |
Investments | | | 566,030 | | |
Net realized gain | | | 566,030 | | |
Net change in unrealized appreciation (depreciation) on: | |
Investments | | | 4,143,941 | | |
Net change in unrealized appreciation | | | 4,143,941 | | |
Net realized and unrealized gain | | | 4,709,971 | | |
Net increase in net assets resulting from operations | | $ | 14,308,441 | | |
The accompanying Notes to Financial Statements are an integral part of this statement.
Annual Report 2014
15
Columbia AMT-Free Massachusetts Intermediate Muni Bond Fund
Statement of Changes in Net Assets
| | | Year Ended
October 31,
2014 | | Year Ended
October 31,
2013(a) | |
Operations | |
Net investment income | | $ | 9,598,470 | | | $ | 10,788,737 | | |
Net realized gain (loss) | | | 566,030 | | | | (920,854 | ) | |
Net change in unrealized appreciation (depreciation) | | | 4,143,941 | | | | (15,498,721 | ) | |
Net increase (decrease) in net assets resulting from operations | | | 14,308,441 | | | | (5,630,838 | ) | |
Distributions to shareholders | |
Net investment income | |
Class A | | | (669,698 | ) | | | (861,094 | ) | |
Class B | | | (137 | ) | | | (885 | ) | |
Class C | | | (277,794 | ) | | | (301,560 | ) | |
Class R4 | | | (2,911 | ) | | | (971 | ) | |
Class T | | | (674,951 | ) | | | (772,676 | ) | |
Class Z | | | (7,967,121 | ) | | | (8,844,907 | ) | |
Net realized gains | |
Class A | | | — | | | | (20,015 | ) | |
Class B | | | — | | | | (52 | ) | |
Class C | | | — | | | | (7,543 | ) | |
Class T | | | — | | | | (18,418 | ) | |
Class Z | | | — | | | | (189,557 | ) | |
Total distributions to shareholders | | | (9,592,612 | ) | | | (11,017,678 | ) | |
Decrease in net assets from capital stock activity | | | (27,789,400 | ) | | | (45,286,824 | ) | |
Total decrease in net assets | | | (23,073,571 | ) | | | (61,935,340 | ) | |
Net assets at beginning of year | | | 317,759,924 | | | | 379,695,264 | | |
Net assets at end of year | | $ | 294,686,353 | | | $ | 317,759,924 | | |
Excess of distributions over net investment income | | $ | (27,044 | ) | | $ | (32,902 | ) | |
(a) Class R4 shares are based on operations from March 19, 2013 (commencement of operations) through the stated period end.
The accompanying Notes to Financial Statements are an integral part of this statement.
Annual Report 2014
16
Columbia AMT-Free Massachusetts Intermediate Muni Bond Fund
Statement of Changes in Net Assets (continued)
| | | Year Ended October 31, 2014 | | Year Ended October 31, 2013(a) | |
| | | Shares | | Dollars ($) | | Shares | | Dollars ($) | |
Capital stock activity | |
Class A shares | |
Subscriptions(b) | | | 572,875 | | | | 6,239,883 | | | | 740,966 | | | | 8,279,822 | | |
Distributions reinvested | | | 53,081 | | | | 579,080 | | | | 58,311 | | | | 644,552 | | |
Redemptions | | | (950,488 | ) | | | (10,302,589 | ) | | | (1,285,182 | ) | | | (14,119,884 | ) | |
Net decrease | | | (324,532 | ) | | | (3,483,626 | ) | | | (485,905 | ) | | | (5,195,510 | ) | |
Class B shares | |
Subscriptions | | | 915 | | | | 10,000 | | | | 44 | | | | 493 | | |
Distributions reinvested | | | 12 | | | | 137 | | | | 34 | | | | 378 | | |
Redemptions(b) | | | (135 | ) | | | (1,477 | ) | | | (8,698 | ) | | | (96,556 | ) | |
Net increase (decrease) | | | 792 | | | | 8,660 | | | | (8,620 | ) | | | (95,685 | ) | |
Class C shares | |
Subscriptions | | | 130,319 | | | | 1,417,391 | | | | 259,514 | | | | 2,907,720 | | |
Distributions reinvested | | | 18,223 | | | | 198,761 | | | | 18,720 | | | | 206,855 | | |
Redemptions | | | (244,790 | ) | | | (2,666,471 | ) | | | (296,366 | ) | | | (3,250,413 | ) | |
Net decrease | | | (96,248 | ) | | | (1,050,319 | ) | | | (18,132 | ) | | | (135,838 | ) | |
Class R4 shares | |
Subscriptions | | | 5,289 | | | | 57,600 | | | | 5,490 | | | | 61,500 | | |
Distributions reinvested | | | 245 | | | | 2,681 | | | | 86 | | | | 930 | | |
Redemptions | | | (9 | ) | | | (96 | ) | | | — | | | | — | | |
Net increase | | | 5,525 | | | | 60,185 | | | | 5,576 | | | | 62,430 | | |
Class T shares | |
Subscriptions | | | 24,513 | | | | 267,348 | | | | 23,869 | | | | 262,719 | | |
Distributions reinvested | | | 29,674 | | | | 323,741 | | | | 31,104 | | | | 344,145 | | |
Redemptions | | | (250,388 | ) | | | (2,718,871 | ) | | | (567,006 | ) | | | (6,285,793 | ) | |
Net decrease | | | (196,201 | ) | | | (2,127,782 | ) | | | (512,033 | ) | | | (5,678,929 | ) | |
Class Z shares | |
Subscriptions | | | 1,718,530 | | | | 18,733,438 | | | | 2,503,155 | | | | 28,010,518 | | |
Distributions reinvested | | | 27,321 | | | | 298,216 | | | | 29,416 | | | | 325,449 | | |
Redemptions | | | (3,697,484 | ) | | | (40,228,172 | ) | | | (5,678,660 | ) | | | (62,579,259 | ) | |
Net decrease | | | (1,951,633 | ) | | | (21,196,518 | ) | | | (3,146,089 | ) | | | (34,243,292 | ) | |
Total net decrease | | | (2,562,297 | ) | | | (27,789,400 | ) | | | (4,165,203 | ) | | | (45,286,824 | ) | |
(a) Class R4 shares are based on operations from March 19, 2013 (commencement of operations) through the stated period end.
(b) Includes conversions of Class B shares to Class A shares, if any.
The accompanying Notes to Financial Statements are an integral part of this statement.
Annual Report 2014
17
Columbia AMT-Free Massachusetts Intermediate Muni Bond Fund
The following tables are intended to help you understand the Fund's financial performance. Certain information reflects financial results for a single share of a class held for the periods shown. Per share net investment income (loss) amounts are calculated based on average shares outstanding during the period. Total return assumes reinvestment of all dividends and distributions, if any. Total return does not reflect payment of sales charges, if any. Total return and portfolio turnover are not annualized for periods of less than one year. The portfolio turnover rate is calculated without regard to purchase and sales transactions of short-term instruments and certain derivatives, if any. If such transactions were included, the Fund's portfolio turnover rate may be higher.
| | | Year Ended October 31, | |
Class A | | 2014 | | 2013 | | 2012 | | 2011 | | 2010 | |
Per share data | |
Net asset value, beginning of period | | $ | 10.84 | | | $ | 11.34 | | | $ | 10.95 | | | $ | 10.95 | | | $ | 10.61 | | |
Income from investment operations: | |
Net investment income | | | 0.33 | | | | 0.32 | | | | 0.32 | | | | 0.34 | | | | 0.34 | | |
Net realized and unrealized gain (loss) | | | 0.17 | | | | (0.50 | ) | | | 0.41 | | | | 0.00 | (a) | | | 0.34 | | |
Total from investment operations | | | 0.50 | | | | (0.18 | ) | | | 0.73 | | | | 0.34 | | | | 0.68 | | |
Less distributions to shareholders: | |
Net investment income | | | (0.33 | ) | | | (0.31 | ) | | | (0.33 | ) | | | (0.34 | ) | | | (0.34 | ) | |
Net realized gains | | | — | | | | (0.01 | ) | | | (0.01 | ) | | | (0.00 | )(a) | | | — | | |
Total distributions to shareholders | | | (0.33 | ) | | | (0.32 | ) | | | (0.34 | ) | | | (0.34 | ) | | | (0.34 | ) | |
Net asset value, end of period | | $ | 11.01 | | | $ | 10.84 | | | $ | 11.34 | | | $ | 10.95 | | | $ | 10.95 | | |
Total return | | | 4.65 | % | | | (1.58 | %) | | | 6.69 | % | | | 3.24 | % | | | 6.51 | % | |
Ratios to average net assets(b) | |
Total gross expenses | | | 0.96 | % | | | 0.95 | % | | | 0.98 | % | | | 0.99 | % | | | 0.91 | % | |
Total net expenses(c) | | | 0.81 | %(d) | | | 0.79 | %(d) | | | 0.75 | %(d) | | | 0.77 | %(d) | | | 0.80 | %(d) | |
Net investment income | | | 2.99 | % | | | 2.86 | % | | | 2.88 | % | | | 3.16 | % | | | 3.12 | % | |
Supplemental data | |
Net assets, end of period (in thousands) | | $ | 22,540 | | | $ | 25,699 | | | $ | 32,398 | | | $ | 29,849 | | | $ | 30,998 | | |
Portfolio turnover | | | 3 | % | | | 7 | % | | | 11 | % | | | 10 | % | | | 9 | % | |
Notes to Financial Highlights
(a) Rounds to zero.
(b) In addition to the fees and expenses that the Fund bears directly, the Fund indirectly bears a pro rata share of the fees and expenses of any other funds in which it invests. Such indirect expenses are not included in the Fund's reported expense ratios.
(c) Total net expenses include the impact of certain fee waivers/expense reimbursements made by the Investment Manager and certain of its affiliates, if applicable.
(d) The benefits derived from expense reductions had an impact of less than 0.01%.
The accompanying Notes to Financial Statements are an integral part of this statement.
Annual Report 2014
18
Columbia AMT-Free Massachusetts Intermediate Muni Bond Fund
Financial Highlights (continued)
| | | Year Ended October 31, | |
Class B | | 2014 | | 2013 | | 2012 | | 2011 | | 2010 | |
Per share data | |
Net asset value, beginning of period | | $ | 10.84 | | | $ | 11.34 | | | $ | 10.95 | | | $ | 10.95 | | | $ | 10.61 | | |
Income from investment operations: | |
Net investment income | | | 0.24 | | | | 0.23 | | | | 0.24 | | | | 0.26 | | | | 0.26 | | |
Net realized and unrealized gain (loss) | | | 0.18 | | | | (0.50 | ) | | | 0.40 | | | | 0.00 | (a) | | | 0.34 | | |
Total from investment operations | | | 0.42 | | | | (0.27 | ) | | | 0.64 | | | | 0.26 | | | | 0.60 | | |
Less distributions to shareholders: | |
Net investment income | | | (0.24 | ) | | | (0.22 | ) | | | (0.24 | ) | | | (0.26 | ) | | | (0.26 | ) | |
Net realized gains | | | — | | | | (0.01 | ) | | | (0.01 | ) | | | (0.00 | )(a) | | | — | | |
Total distributions to shareholders | | | (0.24 | ) | | | (0.23 | ) | | | (0.25 | ) | | | (0.26 | ) | | | (0.26 | ) | |
Net asset value, end of period | | $ | 11.02 | | | $ | 10.84 | | | $ | 11.34 | | | $ | 10.95 | | | $ | 10.95 | | |
Total return | | | 3.96 | % | | | (2.37 | %) | | | 5.89 | % | | | 2.48 | % | | | 5.72 | % | |
Ratios to average net assets(b) | |
Total gross expenses | | | 1.71 | % | | | 1.70 | % | | | 1.83 | % | | | 1.79 | % | | | 1.66 | % | |
Total net expenses(c) | | | 1.56 | %(d) | | | 1.53 | %(d) | | | 1.50 | %(d) | | | 1.53 | %(d) | | | 1.55 | %(d) | |
Net investment income | | | 2.19 | % | | | 2.07 | % | | | 2.13 | % | | | 2.44 | % | | | 2.42 | % | |
Supplemental data | |
Net assets, end of period (in thousands) | | $ | 10 | | | $ | 1 | | | $ | 99 | | | $ | 145 | | | $ | 1,008 | | |
Portfolio turnover | | | 3 | % | | | 7 | % | | | 11 | % | | | 10 | % | | | 9 | % | |
Notes to Financial Highlights
(a) Rounds to zero.
(b) In addition to the fees and expenses that the Fund bears directly, the Fund indirectly bears a pro rata share of the fees and expenses of any other funds in which it invests. Such indirect expenses are not included in the Fund's reported expense ratios.
(c) Total net expenses include the impact of certain fee waivers/expense reimbursements made by the Investment Manager and certain of its affiliates, if applicable.
(d) The benefits derived from expense reductions had an impact of less than 0.01%.
The accompanying Notes to Financial Statements are an integral part of this statement.
Annual Report 2014
19
Columbia AMT-Free Massachusetts Intermediate Muni Bond Fund
Financial Highlights (continued)
| | | Year Ended October 31, | |
Class C | | 2014 | | 2013 | | 2012 | | 2011 | | 2010 | |
Per share data | |
Net asset value, beginning of period | | $ | 10.84 | | | $ | 11.34 | | | $ | 10.95 | | | $ | 10.95 | | | $ | 10.61 | | |
Income from investment operations: | |
Net investment income | | | 0.28 | | | | 0.27 | | | | 0.28 | | | | 0.30 | | | | 0.30 | | |
Net realized and unrealized gain (loss) | | | 0.17 | | | | (0.49 | ) | | | 0.40 | | | | 0.00 | (a) | | | 0.34 | | |
Total from investment operations | | | 0.45 | | | | (0.22 | ) | | | 0.68 | | | | 0.30 | | | | 0.64 | | |
Less distributions to shareholders: | |
Net investment income | | | (0.28 | ) | | | (0.27 | ) | | | (0.28 | ) | | | (0.30 | ) | | | (0.30 | ) | |
Net realized gains | | | — | | | | (0.01 | ) | | | (0.01 | ) | | | (0.00 | )(a) | | | — | | |
Total distributions to shareholders | | | (0.28 | ) | | | (0.28 | ) | | | (0.29 | ) | | | (0.30 | ) | | | (0.30 | ) | |
Net asset value, end of period | | $ | 11.01 | | | $ | 10.84 | | | $ | 11.34 | | | $ | 10.95 | | | $ | 10.95 | | |
Total return | | | 4.20 | % | | | (1.97 | %) | | | 6.27 | % | | | 2.83 | % | | | 6.09 | % | |
Ratios to average net assets(b) | |
Total gross expenses | | | 1.71 | % | | | 1.70 | % | | | 1.73 | % | | | 1.74 | % | | | 1.66 | % | |
Total net expenses(c) | | | 1.24 | %(d) | | | 1.19 | %(d) | | | 1.15 | %(d) | | | 1.17 | %(d) | | | 1.20 | %(d) | |
Net investment income | | | 2.56 | % | | | 2.46 | % | | | 2.48 | % | | | 2.75 | % | | | 2.75 | % | |
Supplemental data | |
Net assets, end of period (in thousands) | | $ | 10,366 | | | $ | 11,244 | | | $ | 11,970 | | | $ | 9,931 | | | $ | 10,452 | | |
Portfolio turnover | | | 3 | % | | | 7 | % | | | 11 | % | | | 10 | % | | | 9 | % | |
Notes to Financial Highlights
(a) Rounds to zero.
(b) In addition to the fees and expenses that the Fund bears directly, the Fund indirectly bears a pro rata share of the fees and expenses of any other funds in which it invests. Such indirect expenses are not included in the Fund's reported expense ratios.
(c) Total net expenses include the impact of certain fee waivers/expense reimbursements made by the Investment Manager and certain of its affiliates, if applicable.
(d) The benefits derived from expense reductions had an impact of less than 0.01%.
The accompanying Notes to Financial Statements are an integral part of this statement.
Annual Report 2014
20
Columbia AMT-Free Massachusetts Intermediate Muni Bond Fund
Financial Highlights (continued)
| | | Year Ended October 31, | |
Class R4 | | 2014 | | 2013(a) | |
Per share data | |
Net asset value, beginning of period | | $ | 10.83 | | | $ | 11.19 | | |
Income from investment operations: | |
Net investment income | | | 0.35 | | | | 0.21 | | |
Net realized and unrealized gain (loss) | | | 0.18 | | | | (0.36 | ) | |
Total from investment operations | | | 0.53 | | | | (0.15 | ) | |
Less distributions to shareholders: | |
Net investment income | | | (0.35 | ) | | | (0.21 | ) | |
Total distributions to shareholders | | | (0.35 | ) | | | (0.21 | ) | |
Net asset value, end of period | | $ | 11.01 | | | $ | 10.83 | | |
Total return | | | 5.01 | % | | | (1.32 | %) | |
Ratios to average net assets(b) | |
Total gross expenses | | | 0.71 | % | | | 0.68 | %(c) | |
Total net expenses(d) | | | 0.56 | %(e) | | | 0.56 | %(c)(e) | |
Net investment income | | | 3.26 | % | | | 3.19 | %(c) | |
Supplemental data | |
Net assets, end of period (in thousands) | | $ | 122 | | | $ | 60 | | |
Portfolio turnover | | | 3 | % | | | 7 | % | |
Notes to Financial Highlights
(a) Based on operations from March 19, 2013 (commencement of operations) through the stated period end.
(b) In addition to the fees and expenses that the Fund bears directly, the Fund indirectly bears a pro rata share of the fees and expenses of any other funds in which it invests. Such indirect expenses are not included in the Fund's reported expense ratios.
(c) Annualized.
(d) Total net expenses include the impact of certain fee waivers/expense reimbursements made by the Investment Manager and certain of its affiliates, if applicable.
(e) The benefits derived from expense reductions had an impact of less than 0.01%.
The accompanying Notes to Financial Statements are an integral part of this statement.
Annual Report 2014
21
Columbia AMT-Free Massachusetts Intermediate Muni Bond Fund
Financial Highlights (continued)
| | | Year Ended October 31, | |
Class T | | 2014 | | 2013 | | 2012 | | 2011 | | 2010 | |
Per share data | |
Net asset value, beginning of period | | $ | 10.84 | | | $ | 11.34 | | | $ | 10.95 | | | $ | 10.95 | | | $ | 10.61 | | |
Income from investment operations: | |
Net investment income | | | 0.34 | | | | 0.33 | | | | 0.34 | | | | 0.35 | | | | 0.35 | | |
Net realized and unrealized gain (loss) | | | 0.18 | | | | (0.50 | ) | | | 0.40 | | | | 0.00 | (a) | | | 0.34 | | |
Total from investment operations | | | 0.52 | | | | (0.17 | ) | | | 0.74 | | | | 0.35 | | | | 0.69 | | |
Less distributions to shareholders: | |
Net investment income | | | (0.34 | ) | | | (0.32 | ) | | | (0.34 | ) | | | (0.35 | ) | | | (0.35 | ) | |
Net realized gains | | | — | | | | (0.01 | ) | | | (0.01 | ) | | | (0.00 | )(a) | | | — | | |
Total distributions to shareholders | | | (0.34 | ) | | | (0.33 | ) | | | (0.35 | ) | | | (0.35 | ) | | | (0.35 | ) | |
Net asset value, end of period | | $ | 11.02 | | | $ | 10.84 | | | $ | 11.34 | | | $ | 10.95 | | | $ | 10.95 | | |
Total return | | | 4.85 | % | | | (1.48 | %) | | | 6.80 | % | | | 3.34 | % | | | 6.62 | % | |
Ratios to average net assets(b) | |
Total gross expenses | | | 0.86 | % | | | 0.85 | % | | | 0.88 | % | | | 0.89 | % | | | 0.81 | % | |
Total net expenses(c) | | | 0.71 | %(d) | | | 0.69 | %(d) | | | 0.65 | %(d) | | | 0.67 | %(d) | | | 0.70 | %(d) | |
Net investment income | | | 3.10 | % | | | 2.96 | % | | | 2.98 | % | | | 3.25 | % | | | 3.26 | % | |
Supplemental data | |
Net assets, end of period (in thousands) | | $ | 21,345 | | | $ | 23,131 | | | $ | 30,008 | | | $ | 34,952 | | | $ | 39,300 | | |
Portfolio turnover | | | 3 | % | | | 7 | % | | | 11 | % | | | 10 | % | | | 9 | % | |
Notes to Financial Highlights
(a) Rounds to zero.
(b) In addition to the fees and expenses that the Fund bears directly, the Fund indirectly bears a pro rata share of the fees and expenses of any other funds in which it invests. Such indirect expenses are not included in the Fund's reported expense ratios.
(c) Total net expenses include the impact of certain fee waivers/expense reimbursements made by the Investment Manager and certain of its affiliates, if applicable.
(d) The benefits derived from expense reductions had an impact of less than 0.01%.
The accompanying Notes to Financial Statements are an integral part of this statement.
Annual Report 2014
22
Columbia AMT-Free Massachusetts Intermediate Muni Bond Fund
Financial Highlights (continued)
| | | Year Ended October 31, | |
Class Z | | 2014 | | 2013 | | 2012 | | 2011 | | 2010 | |
Per share data | |
Net asset value, beginning of period | | $ | 10.84 | | | $ | 11.34 | | | $ | 10.95 | | | $ | 10.95 | | | $ | 10.61 | | |
Income from investment operations: | |
Net investment income | | | 0.35 | | | | 0.34 | | | | 0.35 | | | | 0.37 | | | | 0.37 | | |
Net realized and unrealized gain (loss) | | | 0.18 | | | | (0.49 | ) | | | 0.40 | | | | 0.00 | (a) | | | 0.34 | | |
Total from investment operations | | | 0.53 | | | | (0.15 | ) | | | 0.75 | | | | 0.37 | | | | 0.71 | | |
Less distributions to shareholders: | |
Net investment income | | | (0.35 | ) | | | (0.34 | ) | | | (0.35 | ) | | | (0.37 | ) | | | (0.37 | ) | |
Net realized gains | | | — | | | | (0.01 | ) | | | (0.01 | ) | | | (0.00 | )(a) | | | — | | |
Total distributions to shareholders | | | (0.35 | ) | | | (0.35 | ) | | | (0.36 | ) | | | (0.37 | ) | | | (0.37 | ) | |
Net asset value, end of period | | $ | 11.02 | | | $ | 10.84 | | | $ | 11.34 | | | $ | 10.95 | | | $ | 10.95 | | |
Total return | | | 5.00 | % | | | (1.33 | %) | | | 6.96 | % | | | 3.49 | % | | | 6.77 | % | |
Ratios to average net assets(b) | |
Total gross expenses | | | 0.71 | % | | | 0.70 | % | | | 0.73 | % | | | 0.74 | % | | | 0.66 | % | |
Total net expenses(c) | | | 0.56 | %(d) | | | 0.54 | %(d) | | | 0.50 | %(d) | | | 0.52 | %(d) | | | 0.55 | %(d) | |
Net investment income | | | 3.24 | % | | | 3.10 | % | | | 3.13 | % | | | 3.40 | % | | | 3.41 | % | |
Supplemental data | |
Net assets, end of period (in thousands) | | $ | 240,304 | | | $ | 257,624 | | | $ | 305,220 | | | $ | 284,128 | | | $ | 286,196 | | |
Portfolio turnover | | | 3 | % | | | 7 | % | | | 11 | % | | | 10 | % | | | 9 | % | |
Notes to Financial Highlights
(a) Rounds to zero.
(b) In addition to the fees and expenses that the Fund bears directly, the Fund indirectly bears a pro rata share of the fees and expenses of any other funds in which it invests. Such indirect expenses are not included in the Fund's reported expense ratios.
(c) Total net expenses include the impact of certain fee waivers/expense reimbursements made by the Investment Manager and certain of its affiliates, if applicable.
(d) The benefits derived from expense reductions had an impact of less than 0.01%.
The accompanying Notes to Financial Statements are an integral part of this statement.
Annual Report 2014
23
Columbia AMT-Free Massachusetts Intermediate Muni Bond Fund
Notes to Financial Statements
October 31, 2014
Note 1. Organization
Columbia AMT-Free Massachusetts Intermediate Muni Bond Fund (formerly known as Columbia Massachusetts Intermediate Municipal Bond Fund) (the Fund), a series of Columbia Funds Series Trust I (the Trust), is a non-diversified fund. The Trust is registered under the Investment Company Act of 1940, as amended (the 1940 Act), as an open-end management investment company organized as a Massachusetts business trust. Effective July 7, 2014, Columbia Massachusetts Intermediate Municipal Bond Fund was renamed Columbia AMT-Free Massachusetts Intermediate Muni Bond Fund.
Fund Shares
The Trust may issue an unlimited number of shares (without par value). The Fund offers Class A, Class B, Class C, Class R4, Class T and Class Z shares. Although all share classes generally have identical voting, dividend and liquidation rights, each share class votes separately when required by the Trust's organizational documents or by law. Different share classes pay different distribution amounts to the extent the expenses of such share classes differ, and distributions in liquidation will be proportional to the net asset value of each share class. Each share class has its own expense structure and sales charges.
Class A shares are subject to a maximum front-end sales charge of 3.25% based on the initial investment amount. Class A shares purchased without an initial sales charge in accounts aggregating $1 million to $50 million at the time of purchase are subject to a contingent deferred sales charge (CDSC) if the shares are sold within 18 months of purchase, charged as follows: 1.00% CDSC if redeemed within 12 months of purchase, and 0.50% CDSC if redeemed more than 12, but less than 18, months after purchase.
Class B shares may be subject to a maximum CDSC of 3.00% based upon the holding period after purchase. Class B shares will generally convert to Class A shares eight years after purchase. The Fund no longer accepts investments by new or existing investors in the Fund's Class B shares, except in connection with the reinvestment of any dividend and/or capital gain distributions in Class B shares of the Fund and exchanges by existing Class B shareholders of certain other funds within the Columbia Family of Funds.
Class C shares are subject to a 1.00% CDSC on shares redeemed within one year of purchase.
Class R4 shares are not subject to sales charges and are generally available only to omnibus retirement plans and certain investors as described in the Fund's prospectus.
Class T shares are subject to a maximum front-end sales charge of 4.75% based on the investment amount. Class T shares purchased without an initial sales charge in accounts aggregating $1 million to $50 million at the time of purchase are subject to a CDSC if the shares are sold within 18 months of purchase, charged as follows: 1.00% CDSC if redeemed within 12 months of purchase, and 0.50% CDSC if redeemed more than 12, but less than 18, months after purchase. Class T shares are available only to investors who received (and who have continuously held) Class T shares in connection with previous fund reorganizations.
Class Z shares are not subject to sales charges and are available only to eligible investors, which are subject to different investment minimums as described in the Fund's prospectus.
Note 2. Summary of Significant Accounting Policies
Basis of Preparation
The Fund is an investment company that applies the accounting and reporting guidance in the Financial Accounting Standards Board (FASB) Accounting Standards Codification Topic 946, Financial Services — Investment Companies (ASC 946). The financial statements are prepared in accordance with U.S. generally accepted accounting principles (GAAP) which requires management to make certain estimates and assumptions that affect the reported amounts of assets and liabilities, the disclosure of contingent assets and liabilities at the date of the financial statements and the reported amounts of income and expenses during the reporting period. Actual results could differ from those estimates.
The following is a summary of significant accounting policies followed by the Fund in the preparation of its financial statements.
Security Valuation
Debt securities generally are valued by pricing services approved by the Board of Trustees (the Board) based upon market transactions for normal, institutional-size trading units of similar securities. The services may use various pricing techniques that take into account, as applicable, factors such as yield, quality, coupon rate, maturity, type of issue, trading characteristics and other data, as well as broker quotes. Debt securities for which quotations are readily available may also be valued based upon an over-the-counter or exchange bid quotation.
Investments in open-end investment companies, including money market funds, are valued at their net asset value.
Annual Report 2014
24
Columbia AMT-Free Massachusetts Intermediate Muni Bond Fund
Notes to Financial Statements (continued)
October 31, 2014
Investments for which market quotations are not readily available, or that have quotations which management believes are not reliable, are valued at fair value as determined in good faith under procedures established by and under the general supervision of the Board. If a security or class of securities (such as foreign securities) is valued at fair value, such value is likely to be different from the quoted or published price for the security.
The determination of fair value often requires significant judgment. To determine fair value, management may use assumptions including but not limited to future cash flows and estimated risk premiums. Multiple inputs from various sources may be used to determine fair value.
Delayed Delivery Securities
The Fund may trade securities on other than normal settlement terms, including securities purchased or sold on a "when-issued" basis. This may increase risk to the Fund since the other party to the transaction may fail to deliver which could cause the Fund to subsequently invest at less advantageous prices. The Fund designates cash or liquid securities in an amount equal to the delayed delivery commitment.
Security Transactions
Security transactions are accounted for on the trade date. Cost is determined and gains (losses) are based upon the specific identification method for both financial statement and federal income tax purposes.
Income Recognition
Interest income is recorded on an accrual basis. Market premiums and discounts, including original issue discounts, are amortized and accreted, respectively, over the expected life of the security on all debt securities, unless otherwise noted.
The Fund may place a debt security on non-accrual status and reduce related interest income when it becomes probable that the interest will not be collected and the amount of uncollectible interest can be reasonably estimated. A defaulted debt security is removed from non-accrual status when the issuer resumes interest payments or when collectability of interest is reasonably assured.
Dividend income is recorded on the ex-dividend date.
Expenses
General expenses of the Trust are allocated to the Fund and other funds of the Trust based upon relative net assets or other expense allocation methodologies determined by the nature of the expense. Expenses directly attributable to the Fund are charged to the Fund. Expenses directly attributable to a specific class of shares are charged to that share class.
Determination of Class Net Asset Value
All income, expenses (other than class-specific expenses, which are charged to that share class, as shown in the Statement of Operations) and realized and unrealized gains (losses) are allocated to each class of the Fund on a daily basis, based on the relative net assets of each class, for purposes of determining the net asset value of each class.
Federal Income Tax Status
The Fund intends to qualify each year as a regulated investment company under Subchapter M of the Internal Revenue Code, as amended, and will distribute substantially all of its tax exempt and taxable income (including net short-term capital gains), if any, for its tax year, and as such will not be subject to federal income taxes. In addition, the Fund intends to distribute in each calendar year substantially all of its net investment income, capital gains and certain other amounts, if any, such that the Fund should not be subject to federal excise tax. Therefore, no federal income or excise tax provision is recorded.
Distributions to Shareholders
Distributions from net investment income, if any, are declared daily and paid monthly. Net realized capital gains, if any, are distributed at least annually. Income distributions and capital gain distributions are determined in accordance with federal income tax regulations, which may differ from GAAP.
Guarantees and Indemnifications
Under the Trust's organizational documents and, in some cases, by contract, its officers and trustees are indemnified against certain liabilities arising out of the performance of their duties to the Trust or its funds. In addition, certain of the Fund's contracts with its service providers contain general indemnification clauses. The Fund's maximum exposure under these arrangements is unknown since the amount of any future claims that may be made against the Fund cannot be determined, and the Fund has no historical basis for predicting the likelihood of any such claims.
Note 3. Fees and Compensation Paid to Affiliates
Investment Management Fees
Under an Investment Management Services Agreement, Columbia Management Investment Advisers, LLC (the Investment Manager), a wholly-owned subsidiary of Ameriprise Financial, Inc. (Ameriprise Financial), determines which securities will be purchased, held or sold. The investment management fee is an annual fee that is equal to a percentage of the Fund's average daily net assets that declines
Annual Report 2014
25
Columbia AMT-Free Massachusetts Intermediate Muni Bond Fund
Notes to Financial Statements (continued)
October 31, 2014
from 0.40% to 0.27% as the Fund's net assets increase. The effective investment management fee rate for the year ended October 31, 2014 was 0.40% of the Fund's average daily net assets.
Administration Fees
Under an Administrative Services Agreement, the Investment Manager also serves as the Fund Administrator. The Fund pays the Fund Administrator an annual fee for administration and accounting services equal to a percentage of the Fund's average daily net assets that declines from 0.07% to 0.04% as the Fund's net assets increase. The effective administration fee rate for the year ended October 31, 2014 was 0.07% of the Fund's average daily net assets.
Compensation of Board Members
Board members are compensated for their services to the Fund as disclosed in the Statement of Operations. The Trust's eligible Trustees may participate in a Deferred Compensation Plan (the Plan) which may be terminated at any time. Obligations of the Plan will be paid solely out of the Fund's assets.
Compensation of Chief Compliance Officer
The Board has appointed a Chief Compliance Officer to the Fund in accordance with federal securities regulations. The Fund pays its pro-rata share of the expenses associated with the Chief Compliance Officer. The Fund's expenses for the Chief Compliance Officer will not exceed $15,000 per year.
Transfer Agent Fees
Under a Transfer and Dividend Disbursing Agent Agreement, Columbia Management Investment Services Corp. (the Transfer Agent), an affiliate of the Investment Manager and a wholly-owned subsidiary of Ameriprise Financial, is responsible for providing transfer agency services to the Fund. The Transfer Agent has contracted with Boston Financial Data Services (BFDS) to serve as sub-transfer agent.
Effective November 1, 2014, the Transfer Agent receives a monthly transfer agency fee based on the number or the average value of accounts, depending on the type of account. Prior to November 1, 2014, the Transfer Agent received a monthly account-based service fee based on the number of open accounts. In addition, the Transfer Agent also receives sub-transfer agency fees based on a percentage of the average aggregate value of the Fund's shares maintained in omnibus accounts (other than omnibus accounts for which American Enterprise Investment Services Inc. is the broker of record or accounts where the beneficial shareholder is a customer of Ameriprise Financial Services, Inc., which receive a per account fee). The Transfer Agent pays the fees of BFDS for
services as sub-transfer agent and is not entitled to reimbursement for such fees from the Fund (with the exception of out-of-pocket fees).
The Transfer Agent also receives compensation from the Fund for various shareholder services and reimbursements for certain out-of-pocket fees.
For the year ended October 31, 2014, the Fund's effective transfer agent fee rates as a percentage of average daily net assets of each class were as follows:
Class A | | | 0.19 | % | |
Class B | | | 0.19 | | |
Class C | | | 0.19 | | |
Class R4 | | | 0.19 | | |
Class T | | | 0.19 | | |
Class Z | | | 0.19 | | |
An annual minimum account balance fee of $20 may apply to certain accounts with a value below the applicable share class's initial minimum investment requirements to reduce the impact of small accounts on transfer agent fees. These minimum account balance fees are remitted to the Fund and recorded as part of expense reductions in the Statement of Operations. For the year ended October 31, 2014, these minimum account balance fees reduced total expenses of the Fund by $160.
Distribution and Service Fees
The Fund has an agreement with Columbia Management Investment Distributors, Inc. (the Distributor), an affiliate of the Investment Manager and a wholly-owned subsidiary of Ameriprise Financial, for distribution and shareholder services. The Board has approved, and the Fund has adopted, distribution and shareholder service plans (the Plans) applicable to certain share classes, which set the distribution and service fees for the Fund. These fees are calculated daily and are intended to compensate the Distributor and/or eligible selling and/or servicing agents for selling shares of the Fund and providing services to investors.
Under the Plans, the Fund pays a monthly service fee to the Distributor at the maximum annual rate of 0.25% of the average daily net assets attributable to Class A, Class B and Class C shares of the Fund. Also under the Plans, the Fund pays a monthly distribution fee to the Distributor at the maximum annual rate of 0.75% of the average daily net assets attributable to Class B and Class C shares, only.
Effective March 1, 2014, the Distributor has voluntarily agreed to waive a portion of the distribution fee for Class C shares so that the distribution fee does not exceed 0.45% annually of the average daily net assets attributable to Class C
Annual Report 2014
26
Columbia AMT-Free Massachusetts Intermediate Muni Bond Fund
Notes to Financial Statements (continued)
October 31, 2014
shares. This arrangement may be modified or terminated by the Distributor at any time. Prior to March 1, 2014, the Distributor voluntarily waived a portion of the distribution fee for Class C shares so that the distribution fee did not exceed 0.40% annually of the average daily net assets attributable to Class C shares.
Shareholder Services Fees
The Fund has adopted a shareholder services plan that permits it to pay for certain services provided to Class T shareholders by their selling and/or servicing agents. The Fund may pay shareholder servicing fees up to an aggregate annual rate of 0.50% of the Fund's average daily net assets attributable to Class T shares (comprised of up to 0.25% for shareholder liaison services and up to 0.25% for administrative support services). These fees are currently limited to an aggregate annual rate of not more than 0.30% of the Fund's average daily net assets attributable to Class T shares. The effective shareholder services fee rate for the year ended October 31, 2014 was 0.15% of the Fund's average daily net assets attributable to Class T shares.
Sales Charges
Sales charges, including front-end charges and CDSCs, received by the Distributor for distributing Fund shares were $23,131 for Class A, $107 for Class C, and $23 for Class T shares for the year ended October 31, 2014.
Expenses Waived/Reimbursed by the Investment Manager and its Affiliates
The Investment Manager and certain of its affiliates have contractually agreed to waive fees and/or reimburse expenses (excluding certain fees and expenses described below) for the period disclosed below, unless sooner terminated at the sole discretion of the Board, so that the Fund's net operating expenses, after giving effect to fees waived/expenses reimbursed and any balance credits and/or overdraft charges from the Fund's custodian, do not exceed the following annual rates as a percentage of the class' average daily net assets:
| | | Fee Rates Contractual
through
February 28, 2015 | |
Class A | | | 0.81 | % | |
Class B | | | 1.56 | | |
Class C | | | 1.56 | | |
Class R4 | | | 0.56 | | |
Class T | | | 0.71 | | |
Class Z | | | 0.56 | | |
Under the agreement governing these fee waivers and/or expense reimbursement arrangements, the following fees and
expenses are excluded from the waiver/reimbursement commitment, and therefore will be paid by the Fund, if applicable: taxes (including foreign transaction taxes), expenses associated with investments in affiliated and non-affiliated pooled investment vehicles (including mutual funds and exchange-traded funds), transaction costs and brokerage commissions, costs related to any securities lending program, dividend expenses associated with securities sold short, inverse floater program fees and expenses, transaction charges and interest on borrowed money, interest, extraordinary expenses and any other expenses the exclusion of which is specifically approved by the Board. This agreement may be modified or amended only with approval from all parties. Class C distribution fees waived by the Distributor, as discussed above, are in addition to the waiver/reimbursement commitment under the agreement.
Note 4. Federal Tax Information
The timing and character of income and capital gain distributions are determined in accordance with income tax regulations, which may differ from GAAP because of temporary or permanent book to tax differences.
At October 31, 2014, these differences are primarily due to differing treatment for capital loss carryforwards, Trustees' deferred compensation, distributions and principal and/or interest of fixed income securities. To the extent these differences are permanent, reclassifications are made among the components of the Fund's net assets in the Statement of Assets and Liabilities. Temporary differences do not require reclassifications.
The Fund did not have any permanent differences; therefore, no reclassifications were made to the Statement of Assets and Liabilities.
The tax character of distributions paid during the years indicated was as follows:
Year Ended October 31, | | 2014 | | 2013 | |
Ordinary income | | $ | 6,544 | | | $ | 4,241 | | |
Tax-exempt income | | | 9,586,068 | | | | 10,807,963 | | |
Long-term capital gains | | | — | | | | 205,474 | | |
Total | | $ | 9,592,612 | | | $ | 11,017,678 | | |
Short-term capital gain distributions, if any, are considered ordinary income distributions for tax purposes.
At October 31, 2014, the components of distributable earnings on a tax basis were as follows:
Undistributed tax exempt income | | $ | 780,563 | | |
Capital loss carryforwards | | | (354,824 | ) | |
Net unrealized appreciation | | | 25,582,343 | | |
Annual Report 2014
27
Columbia AMT-Free Massachusetts Intermediate Muni Bond Fund
Notes to Financial Statements (continued)
October 31, 2014
At October 31, 2014, the cost of investments for federal income tax purposes was $265,611,261 and the aggregate gross unrealized appreciation and depreciation based on that cost was:
Unrealized appreciation | | $ | 25,639,110 | | |
Unrealized depreciation | | | (56,767 | ) | |
Net unrealized appreciation | | $ | 25,582,343 | | |
The following capital loss carryforwards, determined at October 31, 2014, may be available to reduce taxable income arising from future net realized gains on investments, if any, to the extent permitted by the Internal Revenue Code:
Year of Expiration | | Amount ($) | |
No expiration — short-term | | | 354,824 | | |
For the year ended October 31, 2014, $566,030 of capital loss carryforward was utilized.
Management of the Fund has concluded that there are no significant uncertain tax positions in the Fund that would require recognition in the financial statements. However, management's conclusion may be subject to review and adjustment at a later date based on factors including, but not limited to, new tax laws, regulations, and administrative interpretations (including relevant court decisions). Generally, the Fund's federal tax returns for the prior three fiscal years remain subject to examination by the Internal Revenue Service.
Note 5. Portfolio Information
The cost of purchases and proceeds from sales of securities, excluding short-term obligations and certain derivatives, if any, aggregated to $9,880,561 and $35,728,189, respectively, for the year ended October 31, 2014. The amount of purchase and sale activity impacts the portfolio turnover rate reported in the Financial Highlights.
Note 6. Shareholder Concentration
At October 31, 2014, one unaffiliated shareholder of record owned 82.0% of the outstanding shares of the Fund in one or more accounts. The Fund has no knowledge about whether any portion of those shares was owned beneficially. Subscription and redemption activity by concentrated accounts may have a significant effect on the operations of the Fund.
Note 7. Line of Credit
The Fund has entered into a revolving credit facility with a syndicate of banks led by JPMorgan Chase Bank N.A. (JPMorgan) whereby the Fund may borrow for the temporary funding of shareholder redemptions or for other temporary or emergency purposes. The credit facility agreement, as
amended, which is a collective agreement between the Fund and certain other funds managed by the Investment Manager, severally and not jointly, permits collective borrowings up to $500 million. Interest is charged to each participating fund based on its borrowings at a rate equal to the higher of (i) the overnight federal funds rate plus 1.00% or (ii) the one-month LIBOR rate plus 1.00%. Each borrowing under the credit facility matures no later than 60 days after the date of borrowing. Effective December 10, 2013, the Fund also pays a commitment fee equal to its pro rata share of the amount of the credit facility at a rate of 0.075% per annum. Prior to December 10, 2013, the commitment fee was charged at the annual rate of 0.08% per annum. The commitment fee is included in other expenses in the Statement of Operations.
Effective December 9, 2014, the Fund extended its revolving credit facility with JPMorgan. The credit facility agreement, as amended, permits collective borrowings up to $550 million under the same terms and interest rates as described above.
The Fund had no borrowings during the year ended October 31, 2014.
Note 8. Significant Risks
Credit Risk
Credit risk is the risk that the value of debt securities in the Fund's portfolio may decline because the issuer may default and fail to pay interest or repay principal when due. Rating agencies assign credit ratings to debt securities to indicate their credit risk. Lower rated or unrated debt securities held by the Fund may present increased credit risk as compared to higher-rated debt securities.
Interest Rate Risk
Interest rate risk is the risk of losses attributable to changes in interest rates. In general, if prevailing interest rates rise, the values of debt securities tend to fall, and if interest rates fall, the values of debt securities tend to rise. Actions by governments and central banking authorities can result in increases in interest rates. Increasing interest rates may negatively affect the value of debt securities held by the Fund, resulting in a negative impact on the Fund's performance and net asset value per share. In general, the longer the maturity or duration of a debt security, the greater its sensitivity to changes in interest rates.
Liquidity Risk
Liquidity risk is the risk associated with a lack of marketability of investments which may make it difficult to sell the investment at a desirable time or price. Changing regulatory, market or other conditions or environments (for example, the interest rate or credit environments) may
Annual Report 2014
28
Columbia AMT-Free Massachusetts Intermediate Muni Bond Fund
Notes to Financial Statements (continued)
October 31, 2014
adversely affect the liquidity of the Fund's investments. The Fund may have to accept a lower selling price for the holding, sell other investments, or forego another, more appealing investment opportunity. Generally, the less liquid the market at the time the Fund sells a portfolio investment, the greater the risk of loss or decline of value to the Fund. A less liquid market can lead to an increase in Fund redemptions, which may negatively impact Fund performance and net asset value per share, including, for example, if the Fund is forced to sell securities in a down market.
Geographic Concentration Risk
Because state-specific tax-exempt funds invest primarily in the municipal securities issued by the state and political sub-divisions of the state, the Fund will be particularly affected by political and economic conditions and developments in the state in which it invests. The Fund may, therefore, have a greater risk than that of a municipal bond fund which is more geographically diversified. The value of the municipal securities owned by the Fund also may be adversely affected by future changes in federal or state income tax laws.
Non-Diversification Risk
A non-diversified fund is permitted to invest a greater percentage of its total assets in fewer issuers than a diversified fund. The Fund may, therefore, have a greater risk of loss from a few issuers than a similar fund that invests more broadly.
Note 9. Subsequent Events
Management has evaluated the events and transactions that have occurred through the date the financial statements were issued. Other than as noted in Notes 3 and Note 7 above, there were no items requiring adjustment of the financial statements or additional disclosure.
Note 10. Information Regarding Pending and Settled Legal Proceedings
In December 2005, without admitting or denying the allegations, American Express Financial Corporation (AEFC, which is now known as Ameriprise Financial, Inc. (Ameriprise Financial)) entered into settlement agreements with the Securities and Exchange Commission (SEC) and Minnesota Department of Commerce (MDOC) related to market timing activities. As a result, AEFC was censured and ordered to cease and desist from committing or causing any violations of certain provisions of the Investment Advisers Act of 1940, the Investment Company Act of 1940, and various Minnesota laws. AEFC agreed to pay disgorgement of $10 million and civil money penalties of $7 million. AEFC also agreed to retain an independent distribution consultant to assist in developing a plan for distribution of all disgorgement and civil penalties
ordered by the SEC in accordance with various undertakings detailed at www.sec.gov/litigation/admin/ia-2451.pdf. Ameriprise Financial and its affiliates have cooperated with the SEC and the MDOC in these legal proceedings, and have made regular reports to the Funds' Boards of Trustees.
Ameriprise Financial and certain of its affiliates have historically been involved in a number of legal, arbitration and regulatory proceedings, including routine litigation, class actions, and governmental actions, concerning matters arising in connection with the conduct of their business activities. Ameriprise Financial believes that the Funds are not currently the subject of, and that neither Ameriprise Financial nor any of its affiliates are the subject of, any pending legal, arbitration or regulatory proceedings that are likely to have a material adverse effect on the Funds or the ability of Ameriprise Financial or its affiliates to perform under their contracts with the Funds. Ameriprise Financial is required to make quarterly (10-Q), annual (10-K) and, as necessary, 8-K filings with the Securities and Exchange Commission on legal and regulatory matters that relate to Ameriprise Financial and its affiliates. Copies of these filings may be obtained by accessing the SEC website at www.sec.gov.
There can be no assurance that these matters, or the adverse publicity associated with them, will not result in increased fund redemptions, reduced sale of fund shares or other adverse consequences to the Funds. Further, although we believe proceedings are not likely to have a material adverse effect on the Funds or the ability of Ameriprise Financial or its affiliates to perform under their contracts with the Funds, these proceedings are subject to uncertainties and, as such, we are unable to estimate the possible loss or range of loss that may result. An adverse outcome in one or more of these proceedings could result in adverse judgments, settlements, fines, penalties or other relief that could have a material adverse effect on the consolidated financial condition or results of operations of Ameriprise Financial.
Annual Report 2014
29
Columbia AMT-Free Massachusetts Intermediate Muni Bond Fund
Report of Independent Registered Public Accounting Firm
To the Trustees of Columbia Funds Series Trust I and the Shareholders of
Columbia AMT-Free Massachusetts Intermediate Muni Bond Fund
(formerly Columbia Massachusetts Intermediate Municipal Bond Fund)
In our opinion, the accompanying statement of assets and liabilities, including the portfolio of investments, and the related statements of operations and of changes in net assets and the financial highlights present fairly, in all material respects, the financial position of Columbia AMT-Free Massachusetts Intermediate Muni Bond Fund (formerly Columbia Massachusetts Intermediate Municipal Bond Fund) (the "Fund", a series of Columbia Funds Series Trust I) at October 31, 2014, and the results of its operations, the changes in its net assets and the financial highlights for each of the periods indicated, in conformity with accounting principles generally accepted in the United States of America. These financial statements and financial highlights (hereafter referred to as "financial statements") are the responsibility of the Fund's management. Our responsibility is to express an opinion on these financial statements based on our audits. We conducted our audits of these financial statements in accordance with the standards of the Public Company Accounting Oversight Board (United States). Those standards require that we plan and perform the audit to obtain reasonable assurance about whether the financial statements are free of material misstatement. An audit includes examining, on a test basis, evidence supporting the amounts and disclosures in the financial statements, assessing the accounting principles used and significant estimates made by management, and evaluating the overall financial statement presentation. We believe that our audits, which included confirmation of securities at October 31, 2014 by correspondence with the custodian and brokers, provide a reasonable basis for our opinion.
PricewaterhouseCoopers LLP
Minneapolis, Minnesota
December 22, 2014
Annual Report 2014
30
Columbia AMT-Free Massachusetts Intermediate Muni Bond Fund
Federal Income Tax Information
(Unaudited)
The Fund hereby designates the following tax attributes for the fiscal year ended October 31, 2014. Shareholders will be notified in early 2015 of the amounts for use in preparing 2014 income tax returns.
Tax Designations:
| Exempt-Interest Dividends | | | 99.93 | % | |
Exempt-Interest Dividends. The percentage of net investment income distributed during the fiscal year that qualifies as exempt-interest dividends for federal income tax purposes.
Annual Report 2014
31
Columbia AMT-Free Massachusetts Intermediate Muni Bond Fund
The Trustees serve terms of indefinite duration. The names, addresses and birth years of the Trustees and Officers of the Funds in Columbia Funds Series Trust I, the year each was first elected or appointed to office, their principal business occupations during at least the last five years, the number of Funds overseen by each Trustee and other directorships they hold are shown below. Each officer listed below serves as an officer of each Fund in Columbia Funds Series Trust I.
Independent Trustees
Name, Address and Year of Birth,
Position with Funds, Year First
Elected or Appointed to Office | | Principal Occupation(s) During Past Five Years, Number of Funds in Columbia
Funds Complex Overseen by Trustee, Other Directorships Held | |
Douglas A. Hacker (Born 1955)
c/o Columbia Management
Investment Advisers, LLC
225 Franklin Street
Boston, MA 02110
Trustee (since 1996) and Chairman of the Board (since 2014) | | Independent business executive since May 2006; Executive Vice President — Strategy of United Airlines from December 2002 to May 2006; President of UAL Loyalty Services (airline marketing company) from September 2001 to December 2002; Executive Vice President and Chief Financial Officer of United Airlines from July 1999 to September 2001. Oversees 56; Spartan Stores, Inc. (food distributor); Nash Finch Company (food distributor) from 2005 to 2013; Aircastle Limited (aircraft leasing); and SeaCube Container Leasing Ltd. (container leasing) from 2010 to 2013 | |
Janet Langford Kelly (Born 1957)
c/o Columbia Management
Investment Advisers, LLC
225 Franklin Street
Boston, MA 02110
Trustee (since 1996) | | Senior Vice President, General Counsel and Corporate Secretary, ConocoPhillips (integrated energy company) since September 2007; Deputy General Counsel — Corporate Legal Services, ConocoPhillips from August 2006 to August 2007; Partner, Zelle, Hofmann, Voelbel, Mason & Gette LLP (law firm) from March 2005 to July 2006; Adjunct Professor of Law, Northwestern University from September 2004 to June 2006; Director, UAL Corporation (airline) from February 2006 to July 2006; Chief Administrative Officer and Senior Vice President, Kmart Holding Corporation (consumer goods) from September 2003 to March 2004. Oversees 56; None | |
Nancy T. Lukitsh (Born 1956)
c/o Columbia Management
Investment Advisers, LLC
225 Franklin Street
Boston, MA 02110
Trustee (since 2011) | | Senior Vice President, Partner and Director of Marketing, Wellington Management Company, LLP (investment adviser) from 1997 to 2010; Chair, Wellington Management Investment Portfolios (commingled non-U.S. investment pools) from 2007 to 2010; Director, Wellington Trust Company, NA and other Wellington affiliates from 1997 to 2010. Oversees 56; None | |
William E. Mayer (Born 1940)
c/o Columbia Management
Investment Advisers, LLC
225 Franklin Street
Boston, MA 02110
Trustee (since 1994) | | Partner, Park Avenue Equity Partners (private equity) since February 1999; Dean and Professor, College of Business and Management, University of Maryland from 1992 to 1996. Oversees 56; DynaVox Inc. (speech creation); Lee Enterprises (print media); WR Hambrecht + Co. (financial service provider) from 2000 to 2012; BlackRock Kelso Capital Corporation (investment company); Premier, Inc. (healthcare) | |
David M. Moffett (Born 1952)
c/o Columbia Management
Investment Advisers, LLC
225 Franklin Street
Boston, MA 02110
Trustee (since 2011) | | Retired. Chief Executive Officer, Federal Home Loan Mortgage Corporation, from 2008 to 2009; Senior Adviser, Global Financial Services Group, Carlyle Group, Inc., from 2007 to 2008; Vice Chairman and Chief Financial Officer, U.S. Bancorp, from 1993 to 2007. Oversees 56; CIT Group Inc. (commercial and consumer finance); eBay Inc. (online trading community); MBIA Inc. (financial service provider); E.W. Scripps Co. (print and television media), Building Materials Holding Corp. (building materials and construction services); Genworth Financial, Inc. (financial and insurance products and services); and University of Oklahoma Foundation | |
Charles R. Nelson (Born 1942)
c/o Columbia Management
Investment Advisers, LLC
225 Franklin Street
Boston, MA 02110
Trustee (since 1981) | | Retired. Professor Emeritus, University of Washington, since 2011; Professor of Economics, University of Washington from 1976 to 2011; Ford and Louisa Van Voorhis Professor of Political Economy, University of Washington from 1993 to 2011; Adjunct Professor of Statistics, University of Washington from 1980 to 2011; Associate Editor, Journal of Money, Credit and Banking from September 1993 to 2008; consultant on econometric and statistical matters. Oversees 56; None | |
John J. Neuhauser (Born 1943)
c/o Columbia Management
Investment Advisers, LLC
225 Franklin Street
Boston, MA 02110
Trustee (since 1984) | | President, Saint Michael's College, since August 2007; Director or Trustee of several non-profit organizations, including Fletcher Allen Health Care, Inc.; Academic Vice President and Dean of Faculties, Boston College from August 1999 to October 2005; University Professor, Boston College from November 2005 to August 2007. Oversees 56; Liberty All-Star Equity Fund and Liberty All-Star Growth Fund (closed-end funds) | |
Patrick J. Simpson (Born 1944)
c/o Columbia Management
Investment Advisers, LLC
225 Franklin Street
Boston, MA 02110
Trustee (since 2000) | | Partner, Perkins Coie LLP (law firm). Oversees 56; None | |
Annual Report 2014
32
Columbia AMT-Free Massachusetts Intermediate Muni Bond Fund
Trustees and Officers (continued)
Independent Trustees (continued)
Name, Address and Year of Birth,
Position with Funds, Year First
Elected or Appointed to Office | | Principal Occupation(s) During Past Five Years, Number of Funds in Columbia
Funds Complex Overseen by Trustee, Other Directorships Held | |
Anne-Lee Verville (Born 1945)
c/o Columbia Management
Investment Advisers, LLC
225 Franklin Street
Boston, MA 02110
Trustee (since 1998) | | Retired. General Manager — Global Education Industry from 1994 to 1997, President — Application Systems Division from 1991 to 1994, Chief Financial Officer — US Marketing & Services from 1988 to 1991, and Chief Information Officer from 1987 to 1988, IBM Corporation (computer and technology). Oversees 56; Enesco Group, Inc. (producer of giftware and home and garden decor products) from 2001 to 2006 | |
Interested Trustee
Name, Address and Year of Birth,
Position with Funds, Year First
Elected or Appointed to Office | | Principal Occupation(s) During Past Five Years, Number of Funds in Columbia
Funds Complex Overseen by Trustee, Other Directorships Held | |
William F. Truscott (Born 1960)
53600 Ameriprise Financial Center
Minneapolis, MN 55474
Trustee (since 2012) | | Chairman of the Board and President, Columbia Management Investment Advisers, LLC since May 2010 and February 2012, respectively (previously President and Chief Investment Officer from 2001 to April 2010); Chief Executive Officer, Global Asset Management, Ameriprise Financial, Inc. since September 2012 (previously, Chief Executive Officer, U.S. Asset Management & President, Annuities, from May 2010 to September 2012 and President — U.S. Asset Management and Chief Investment Officer from 2005 to April 2010); Director and Chief Executive Officer, Columbia Management Investment Distributors, Inc. since May 2010 and February 2012, respectively (previously Chairman of the Board and Chief Executive Officer from 2006 to April 2010); Chairman of the Board and Chief Executive Officer, RiverSource Distributors, Inc. since 2006; President and Chief Executive Officer, Ameriprise Certificate Company, 2006 to August 2012; Director, Threadneedle Asset Management Holdings, SARL since 2014. Oversees 188; Chairman of the Board, Columbia Management Investment Advisers, LLC since May 2010; Director, Columbia Management Investment Distributors, Inc. since May 2010; Director, Ameriprise Certificate Company from 2006 to January 2013 | |
The Statement of Additional Information has additional information about the Fund's Board members and is available, without charge, upon request by calling 800.345.6611; contacting your financial intermediary; or visiting columbiamanagement.com.
The Board has appointed officers who are responsible for day-to-day business decisions based on policies it has established. The officers serve at the pleasure of the Board. In addition to Mr. Truscott, who is Senior Vice President, the Funds' other officers are:
Officers
Name,
Address and
Year of Birth | | Position and Year
First Appointed to
Position for any Fund
in the Columbia
Funds Complex or a
Predecessor Thereof | | Principal Occupation(s) During Past Five Years | |
J. Kevin Connaughton
225 Franklin Street
Boston, MA 02110
Born 1964 | | President and Principal Executive Officer (2009) | | Managing Director and General Manager — Mutual Fund Products, Columbia Management Investment Advisers, LLC since May 2010; and President, Columbia Funds since 2009; Managing Director, Columbia Management Advisors, LLC, from December 2004 to April 2010; Senior Vice President and Chief Financial Officer, Columbia Funds from June 2008 to January 2009; and senior officer of Columbia Funds and affiliated funds since 2003. | |
Michael G. Clarke
225 Franklin Street
Boston, MA 02110
Born 1969 | | Treasurer (2011) and Chief Financial Officer (2009) | | Vice President — Mutual Fund Administration, Columbia Management Investment Advisers, LLC since May 2010; Managing Director of Fund Administration, Columbia Management Advisors, LLC from September 2004 to April 2010; and senior officer of Columbia Funds and affiliated funds since 2002. | |
Annual Report 2014
33
Columbia AMT-Free Massachusetts Intermediate Muni Bond Fund
Trustees and Officers (continued)
Officers (continued)
Name,
Address and
Year of Birth | | Position and Year
First Appointed to
Position for any Fund
in the Columbia
Funds Complex or a
Predecessor Thereof | | Principal Occupation(s) During Past Five Years | |
Scott R. Plummer
5228 Ameriprise
Financial Center
Minneapolis, MN 55474
Born 1959 | | Senior Vice President (2006), Chief Legal Officer (2006) and Assistant Secretary (2011) | | Senior Vice President and Assistant General Counsel — Global Asset Management, Ameriprise Financial since February 2014 (previously, Senior Vice President and Lead Chief Counsel — Asset Management, 2012 – February 2014; Vice President and Lead Chief Counsel — Asset Management, 2010 – 2012; and Vice President and Chief Counsel — Asset Management, 2005 – 2010); Senior Vice President, Chief Legal Officer and Assistant Secretary, Columbia Management Investment Advisers, LLC since June 2005; Vice President, Chief Counsel and Assistant Secretary, Columbia Management Investment Distributors, Inc. since 2008; Vice President, General Counsel and Secretary, Ameriprise Certificate Company since 2005; Chief Counsel, RiverSource Distributors, Inc. since 2006; senior officer of Columbia Funds and affiliated funds since 2006. | |
Thomas P. McGuire
225 Franklin Street
Boston, MA 02110
Born 1972 | | Chief Compliance Officer (2012) | | Vice President — Asset Management Compliance, Ameriprise Financial, Inc. since May 2010; Chief Compliance Officer, Ameriprise Certificate Company since September 2010; Compliance Executive, Bank of America from 2005 to April 2010. | |
Colin Moore
225 Franklin Street
Boston, MA 02110
Born 1958 | | Senior Vice President (2010) | | Executive Vice President and Global Chief Investment Officer, Ameriprise Financial, Inc. since July 2013; Director and Global Chief Investment Officer, Columbia Management Investment Advisers, LLC since May 2010; Manager, Managing Director and Chief Investment Officer, Columbia Management Advisors, LLC from 2007 to April 2010. | |
Michael E. DeFao
225 Franklin Street
Boston, MA 02110
Born 1968 | | Vice President (2011) and Assistant Secretary (2010) | | Vice President and Chief Counsel, Ameriprise Financial, Inc. since May 2010; Associate General Counsel, Bank of America from 2005 to April 2010. | |
Joseph F. DiMaria
225 Franklin Street
Boston, MA 02110
Born 1968 | | Vice President (2011) and Chief Accounting Officer (2008) | | Vice President — Mutual Fund Treasurer, Columbia Management Investment Advisers, LLC since May 2010; Director of Fund Administration, Columbia Management Advisors, LLC from 2006 to April 2010. | |
Paul B. Goucher
100 Park Avenue
New York, NY 10017
Born 1968 | | Vice President (2011) and Assistant Secretary (2008) | | Vice President and Lead Chief Counsel, Ameriprise Financial, Inc. since November 2008 and January 2013, respectively (previously, Chief Counsel from January 2010 to January 2013, and Group Counsel from November 2008 to January 2010); Director, Managing Director and General Counsel, J. & W. Seligman & Co. Incorporated from July 2008 to November 2008. | |
Amy Johnson
5228 Ameriprise
Financial Center
Minneapolis, MN
Born 1965 | | Vice President (2006) | | Senior Vice President and Chief Operating Officer, Columbia Management Investment Advisers, LLC since May 2010; previously, Chief Administrative Officer, from 2009 to April 2010, and Vice President — Asset Management and Trust Company Services from 2006 to 2009. | |
Paul D. Pearson
5228 Ameriprise
Financial Center
Minneapolis, MN
Born 1956 | | Vice President (2011) and Assistant Treasurer (1999) | | Vice President — Investment Accounting, Columbia Management Investment Advisers, LLC since May 2010; Vice President — Managed Assets, Investment Accounting, Ameriprise Financial, Inc. from 1998 to April 2010. | |
Christopher O. Petersen
5228 Ameriprise
Financial Center
Minneapolis, MN 55474
Born 1970 | | Vice President and Secretary (2010) | | Vice President and Chief Counsel, Ameriprise Financial, Inc. since January 2010 (previously, Vice President and Group Counsel or Counsel from 2004 to January 2010); officer of Columbia Funds and affiliated funds since 2007. | |
Stephen T. Welsh
225 Franklin Street
Boston, MA 02110
Born 1957 | | Vice President (2006) | | President and Director, Columbia Management Investment Services Corp. from May 2010 to October 2014; President and Director, Columbia Management Services, Inc. from 2004 to April 2010; and Managing Director, Columbia Management Distributors, Inc. from 2007 to April 2010. | |
Annual Report 2014
34
Columbia AMT-Free Massachusetts Intermediate Muni Bond Fund
Board Consideration and Approval of Advisory Agreement
On June 11, 2014, the Board of Trustees (the "Board") and the Trustees who are not interested persons (as defined in the Investment Company Act of 1940) of the Trust (the "Independent Trustees") unanimously approved the continuation of the Investment Management Services Agreement (the "Advisory Agreement") with Columbia Management Investment Advisers, LLC (the "Investment Manager") with respect to Columbia AMT-Free Massachusetts Intermediate Muni Bond Fund (the "Fund"), a series of the Trust. As detailed below, the Advisory Fees and Expenses Committee (the "Committee") and the Board met on multiple occasions to review and discuss, both among themselves and with the management team of the Investment Manager, materials provided by the Investment Manager before determining to approve the continuation of the Advisory Agreement.
In connection with their deliberations regarding the continuation of the Advisory Agreement, the Committee and the Board evaluated materials requested from the Investment Manager regarding the Fund and the Advisory Agreement, and discussed these materials with representatives of the Investment Manager at Committee meetings held on March 4, 2014, April 30, 2014 and June 10, 2014 and at Board meetings held on April 30, 2014 and June 11, 2014. In addition, the Board considers matters bearing on the Advisory Agreement at most of its other meetings throughout the year and meets regularly with senior management of the Funds and the Investment Manager. Through the Board's Investment Oversight Committees, Trustees also meet with selected Fund portfolio managers and other investment personnel at various times throughout the year. The Committee and the Board also consulted with its independent fee consultant, Fund counsel and with the Independent Trustees' independent legal counsel, who advised on various matters with respect to the Committee's and the Board's considerations and otherwise assisted the Committee and the Board in their deliberations. On June 10, 2014, the Committee recommended that the Board approve the continuation of the Advisory Agreement. On June 11, 2014, the Board, including the Independent Trustees, voting separately, unanimously approved the continuation of the Advisory Agreement for the Fund.
The Committee and the Board considered all information that they, their legal counsel, or the Investment Manager believed reasonably necessary to evaluate and to determine whether to approve the continuation of the Advisory Agreement. The information and factors considered by the Committee and the Board in recommending for approval or approving the continuation of the Advisory Agreement for the Fund included the following:
• Information on the investment performance of the Fund relative to the performance of a group of mutual funds determined to be comparable to the Fund by an independent third-party data provider, as well as performance relative to benchmarks;
• Information on the Fund's advisory fees and total expenses, including information comparing the Fund's expenses to those of a group of comparable mutual funds, as determined by the independent third-party data provider;
• The Investment Manager's agreement to contractually limit or cap total operating expenses for the Fund through February 28, 2015 so that total operating expenses (excluding certain fees and expenses, such as transaction costs and certain other investment related expenses, interest, taxes, acquired fund fees and expenses, and extraordinary expenses) would not exceed the annual rates of 0.81% for Class A, 1.56% for Class B, 1.56% for Class C, 0.56% for Class R4, 0.71% for Class T and 0.56% for Class Z;
• The terms and conditions of the Advisory Agreement;
• The current and proposed terms and conditions of other agreements and arrangements with affiliates of the Investment Manager relating to the operations of the Fund, including the Administrative Services Agreement, the Distribution Agreement and the Transfer and Dividend Disbursing Agent Agreement;
• Descriptions of various functions performed by the Investment Manager under the Advisory Agreement, including portfolio management and portfolio trading practices;
• Information regarding the management fees and investment performance of similarly-managed portfolios of other clients of the Investment Manager, including institutional separate accounts;
• Information regarding the reputation, regulatory history and resources of the Investment Manager, including information regarding senior management, portfolio managers and other personnel;
• Information regarding the capabilities of the Investment Manager with respect to compliance monitoring services, including an assessment of the Investment Manager's compliance system by the Fund's Chief Compliance Officer; and
• The profitability to the Investment Manager and its affiliates from their relationships with the Fund.
Annual Report 2014
35
Columbia AMT-Free Massachusetts Intermediate Muni Bond Fund
Board Consideration and Approval of Advisory Agreement (continued)
Nature, Extent and Quality of Services Provided under the Advisory Agreement
The Committee and the Board considered the nature, extent and quality of services provided to the Fund by the Investment Manager and its affiliates under the Advisory Agreement and under separate agreements for the provision of transfer agency and administrative services, and the resources dedicated to the Fund and the other Columbia Funds by the Investment Manager and its affiliates. The Committee and the Board considered, among other things, the Investment Manager's ability to attract, motivate and retain highly qualified research, advisory and supervisory investment professionals (including personnel and other resources, compensation programs for personnel involved in fund management, reputation and other attributes), the portfolio management services provided by those investment professionals, and the quality of the Investment Manager's investment research capabilities and trade execution services. The Committee and the Board also considered the potential benefits to shareholders of investing in a mutual fund that is part of a fund complex offering exposure to a variety of asset classes and investment disciplines and providing a variety of fund and shareholder services.
The Committee and the Board also considered the professional experience and qualifications of the senior personnel of the Investment Manager, which included consideration of the Investment Manager's experience with similarly-structured funds. The Committee and the Board noted the compliance programs of and the compliance-related resources provided to the Fund by the Investment Manager and its affiliates, and considered the Investment Manager's ability to provide administrative services to the Fund pursuant to a separate Administrative Services Agreement, including the Investment Manager's ability to coordinate the activities of the Fund's other service providers. After reviewing these and related factors, the Committee and the Board concluded, within the context of their overall conclusions, that the nature, extent and quality of the services provided to the Fund under the Advisory Agreement supported the continuation of the Advisory Agreement.
Investment Performance
The Committee and the Board reviewed information about the performance of the Fund over various time periods, including performance information relative to benchmarks and information based on reports of the independent third-party data provider that compared the performance of the Fund to the performance of a group of comparable mutual funds, and data provided by the independent fee consultant. The Committee and the Board also reviewed a description of the third party's methodology for identifying the Fund's peer groups for purposes of performance and expense comparisons. Although the Fund's performance lagged that of a relevant peer group for certain (although not necessarily all) periods, the Committee and the Board concluded that other factors relevant to performance were sufficient, in light of other considerations, to warrant continuation of the Fund's Advisory Agreement. Those factors included one or more of the following: (i) that the Fund's performance, although lagging in certain recent periods, was stronger over the longer term; (ii) that the underperformance was attributable, to a significant extent, to investment decisions that were reasonable and consistent with the Fund's investment strategy and policies and that the Fund was performing within a reasonable range of expectations, given those investment decisions, market conditions and the Fund's investment strategy; (iii) that the Fund's performance was competitive when compared to other relevant performance benchmarks or peer groups; and (iv) that the Investment Manager had taken or was taking steps designed to help improve the Fund's investment performance, including, but not limited to, enhancing the resources supporting the portfolio managers, or modifying investment strategies.
The Committee and the Board noted that, through December 31, 2013, the Fund's performance was in the sixty-seventh, forty-eighth and fiftieth percentile (where the best performance would be in the first percentile) of its category selected by the independent third-party data provider for the purposes of performance comparisons for the one-, three- and five- year periods, respectively.
The Committee and the Board also considered the Investment Manager's performance and reputation generally, the Investment Manager's historical responsiveness to Board concerns about performance, and the Investment Manager's willingness to take steps intended to improve performance. After reviewing these and related factors, the Committee and the Board concluded, within the context of their overall conclusions, that the performance of the Fund was sufficient, in light of other considerations, to warrant the continuation of the Advisory Agreement.
Investment Advisory Fee Rates and Other Expenses
The Committee and the Board considered the advisory fees charged to the Fund under the Advisory Agreement as well as the total expenses incurred by the Fund. In assessing the reasonableness of the fees under the Advisory Agreement, the Committee and the Board considered, among other information, the Fund's advisory fee and its total expense ratio as a
Annual Report 2014
36
Columbia AMT-Free Massachusetts Intermediate Muni Bond Fund
Board Consideration and Approval of Advisory Agreement (continued)
percentage of average daily net assets. The Committee and the Board also considered data provided by the independent fee consultant. The Committee and the Board noted that the Fund's actual management fee and net expense ratio are both ranked in the first quintile (where the lowest fees and expenses would be in the first quintile) against the Fund's expense universe as determined by the independent third-party data provider for purposes of expense comparison. The Committee and the Board also took into account the fee waiver and expense limitation arrangements agreed to by the Investment Manager, as noted above.
The Committee and the Board also received and considered information about the advisory fees charged by the Investment Manager to institutional separate accounts. In considering the fees charged to those accounts, the Committee and the Board took into account, among other things, the Investment Manager's representations about the differences between managing mutual funds as compared to other types of accounts, including differences in the services provided, differences in the risk profile of such business for the Investment Manager and the additional resources required to manage mutual funds effectively. In evaluating the Fund's advisory fees, the Committee and the Board also took into account the demands, complexity and quality of the investment management of the Fund.
After reviewing these and related factors, the Committee and the Board concluded, within the context of their overall conclusions, that the advisory fee rates and expenses of the Fund were sufficient, in light of other considerations, to warrant the continuation of the Advisory Agreement.
Costs of Services Provided and Profitability
The Committee and the Board also took note of the costs of the services provided (both on an absolute and relative basis) and the profitability to the Investment Manager and its affiliates in connection with their relationships with the Fund. In evaluating these considerations, the Committee and the Board took note of the advisory fees charged by the Investment Manager to other clients, including fees charged by the Investment Manager to institutional separate account clients with similar investment strategies to those of the Fund.
The Committee and the Board also considered the compensation directly or indirectly received by the Investment Manager's affiliates in connection with their relationships with the Fund. The Committee and the Board reviewed information provided by management as to the profitability of the Investment Manager and its affiliates of their relationships with the Fund, information about the allocation of expenses used to calculate profitability, and comparisons of profitability levels realized in 2013 to profitability levels realized in 2012. When reviewing profitability, the Committee and the Board also considered court cases in which adviser profitability was an issue in whole or in part, the performance of similarly managed funds, the performance of the Fund, and the expense ratio of the Fund. The Committee and the Board also considered information provided by the Investment Manager regarding the Investment Manager's financial condition and comparing its profitability to that of other asset management firms that are, or are subsidiaries of, publicly traded companies.
After reviewing these and related factors, the Committee and the Board concluded, within the context of their overall conclusions, that the costs of services provided and the profitability to the Investment Manager and its affiliates from their relationships with the Fund supported the continuation of the Advisory Agreement.
Economies of Scale
The Committee and the Board considered the potential existence of economies of scale in the provision by the Investment Manager of services to the Fund, to groups of related funds, and to the Investment Manager's investment advisory clients as a whole, and whether those economies of scale were shared with the Fund through breakpoints in investment advisory fees or other means, such as expense limitation arrangements and additional investments by the Investment Manager in investment, trading and compliance resources. The Committee and the Board noted that the investment advisory fee schedules for the Fund contained breakpoints that would reduce the fee rate on assets above specified threshold levels.
In considering these matters, the Committee and the Board also considered the costs of the services provided and the profitability to the Investment Manager and its affiliates from their relationships with the Fund, as discussed above. After reviewing these and related factors, the Committee and the Board concluded, within the context of their overall conclusions, that the extent to which any economies of scale were expected to be shared with the Fund supported the continuation of the Advisory Agreement.
Annual Report 2014
37
Columbia AMT-Free Massachusetts Intermediate Muni Bond Fund
Board Consideration and Approval of Advisory Agreement (continued)
Other Benefits to the Investment Manager
The Committee and the Board received and considered information regarding "fall-out" or ancillary benefits received by the Investment Manager and its affiliates as a result of their relationships with the Fund, such as the engagement of the Investment Manager to provide administrative services to the Fund and the engagement of the Investment Manager's affiliates to provide distribution and transfer agency services to the Fund. In this regard, among other matters, the Committee and the Board considered that the Fund's distributor retains a portion of the distribution fees from the Fund and receives a portion of the sales charges on sales or redemptions of certain classes of shares of the Fund. The Committee and the Board also considered the benefits of research made available to the Investment Manager by reason of brokerage commissions generated by the Fund's securities transactions, and reviewed information about the Investment Manager's practices with respect to allocating portfolio transactions for brokerage and research services. The Committee and the Board considered the possible conflicts of interest associated with certain fall-out or other ancillary benefits and the reporting, disclosure and other processes that are in place to address such possible conflicts of interest. The Committee and the Board recognized that the Investment Manager's profitability would be somewhat lower without these benefits.
Conclusion
The Committee and the Board reviewed all of the above considerations in reaching their decisions to recommend or approve the continuation of the Advisory Agreement. In their deliberations, the Trustees did not identify any particular information that was all-important or controlling, and individual Trustees may have attributed different weights to the various factors. Based on their evaluation of all factors that they deemed to be material, including those factors described above, and assisted by the advice of independent legal counsel, the Board, including the Independent Trustees, voting separately, unanimously approved the continuation of the Advisory Agreement.
Annual Report 2014
38
Columbia AMT-Free Massachusetts Intermediate Muni Bond Fund
Important Information About This Report
Each fund mails one shareholder report to each shareholder address. If you would like more than one report, please call shareholder services at 800.345.6611 and additional reports will be sent to you.
The policy of the Board is to vote the proxies of the companies in which each fund holds investments consistent with the procedures as stated in the Statement of Additional Information (SAI). You may obtain a copy of the SAI without charge by calling 800.345.6611; contacting your financial intermediary; visiting columbiamanagement.com; or searching the website of the Securities and Exchange Commission (SEC) at sec.gov. Information regarding how each fund voted proxies relating to portfolio securities is filed with the SEC by August 31 for the most recent 12-month period ending June 30 of that year, and is available without charge by visiting columbiamanagement.com; or searching the website of the SEC at sec.gov.
Each fund files a complete schedule of portfolio holdings with the SEC for the first and third quarters of each fiscal year on Form N-Q. Each fund's Form N-Q is available on the SEC's website at sec.gov and may be reviewed and copied at the SEC's Public Reference Room in Washington, D.C. Information on the operation of the Public Reference Room may be obtained by calling 800.SEC.0330. Each fund's complete schedule of portfolio holdings, as filed on Form N-Q, can also be obtained without charge, upon request, by calling 800.345.6611.
Annual Report 2014
39

Columbia AMT-Free Massachusetts Intermediate Muni Bond Fund
P.O. Box 8081
Boston, MA 02266-8081
columbiamanagement.com
This information is for use with concurrent or prior delivery of a fund prospectus. Please read and consider the investment objectives, risks, charges and expenses for any fund carefully before investing. For a prospectus and, if available, a summary prospectus, which contains this and other important information about the Fund, go to columbiamanagement.com. The Fund is distributed by Columbia Management Investment Distributors, Inc., member FINRA, and managed by Columbia Management Investment Advisers, LLC.
© 2014 Columbia Management Investment Advisers, LLC. All rights reserved.
ANN191_10_D01_(12/14)
Annual Report
October 31, 2014

Columbia Strategic Income Fund
Not FDIC insured • No bank guarantee • May lose value
About Columbia Management
Backed by more than 100 years of experience, Columbia Management is one of the nation's largest asset managers. At the heart of our success — and, most importantly, that of our investors — are some of the most talented professionals in the industry, brought together by a unique way of working.
It starts with carefully selected, specialized investment teams. While each team brings a diverse and innovative range of skills, all are grounded by a common set of core beliefs. All possess a solid conviction in the power of proprietary, bottom-up research. All look not only at generating returns, but also at the likely consistency of those returns and the risks required to achieve them. And while our culture encourages teams to operate independently and question established thinking, a rigorous investment oversight process ensures that each team stays true to its clearly articulated investment process. At Columbia Management, reaching our performance goals matters, and the way we reach them matters just as much.
Columbia funds are distributed by Columbia Management Investment Distributors, Inc., member FINRA, and managed by Columbia Management Investment Advisers, LLC.
© 2014 Columbia Management Investment Advisers, LLC. All rights reserved.
Not part of the shareholder report
Connect with Columbia Management
Get the market insight you need from our investment experts
Investor insight
Stay informed with economic and market commentary, investment videos, white papers, mutual fund commentary and more at columbiamanagement.com.
Columbia Management investor
(e-newsletter)
Read our award-winning* shareholder newsletter. Our quarterly newsletter is available online and provides timely and relevant content about economic trends, fund news, service enhancements and changes. Sign up to receive the newsletter electronically at columbiamanagement.com/newsletter.
Investment videos
Watch and discover what our thought leaders are saying about financial markets and the economy. For an analysis of current events and trends that may affect your investments, visit our online video library at columbiamanagement.com/
market-insights/videos.
Social media
Columbia Management offers you multiple ways to access our market commentary and investment insights.
> Perspectives blog at columbiamanagement.com
Read timely posts by our investment team, including our chief investment officer, chief economist and portfolio managers.
> Twitter.com/ColumbiaMgmt
Follow us on Twitter for quick, up-to-the-minute comments on market news and more.
> Youtube.com/columbiamanagement
View our commentaries on the economy, markets and current investment opportunities.
> Linkedin.com/company/columbia-management
Connect with us on LinkedIn for updates from our thought leaders.
*Columbia Management investor was awarded top honors in the Mutual Fund Education Alliance STAR Awards competition for excellence in mutual fund marketing and communications. Materials in the competition were evaluated on educational value, message comprehension, effective design and objectives.
Not part of the shareholder report
Subscribe to Columbia Management
Get market insight and fund updates delivered to you
Email subscription center
Visit the Columbia Management email subscription center at columbiamanagement.com/subscribe to register for economic and market commentary, product and service updates, white papers and more.
> Columbia Management investor
Quarterly newsletter featuring the latest macro- and micro-economic trends, investment themes, products, service changes and other items of interest to Columbia Management investors
> Investment Strategy Outlook
Quarterly publication featuring the Columbia Management Asset Allocation Team's perspective on global economic investment conditions and markets
> MarketTrack
Quarterly publication featuring more than 40 charts and graphs that highlight the current state of the economy and markets; includes straightforward insight on current investment opportunities
> White papers
Frequent articles that delve deep into a variety of investment topics
> Mutual fund updates
Quarterly portfolio manager commentary and fund fact sheets available for Columbia funds. (Not all funds have a commentary.)
Register today by visiting columbiamanagement.com/subscribe
Not part of the shareholder report
 Dear Shareholders,
The U.S. Economy Gained Momentum
The U.S. economy picked up momentum throughout the third quarter of 2014 with improvements in every sector. Second-quarter gross domestic product growth was revised upward to 4.6%, with expectations that third-quarter growth would also be above trend. American companies added more than 200,000 new jobs monthly, driving unemployment below 6% for the first time since 2008. Consumer spending got a boost as both income and savings rose, and confidence hit a post-recession high. After a weak start to the year, corporate profits rebounded, indicating that business remains in good shape. Rising profits led to higher capital spending. The housing market recovery remained on track, as home sales and prices trended higher, and inventories declined. Manufacturing remained a lynchpin of the economy's expansion. Even so, performance fell short of expectations at the end of the period.
Despite Momentum, Markets Remained Stagnant
The financial markets produced lackluster results, despite good economic news and the Federal Reserve's reassurance that it intended to keep short-term interest rates low for another year. A surge in global tensions and concerns that equity valuations have risen sharply put a damper on investor enthusiasm. The S&P 500 Index inched ahead 1.13%, buoyed by its concentration in large-cap stocks with a defensive edge. Traditional fixed-income sectors, including U.S. Treasuries, mortgages and securitized bonds, eked out returns of less than 1% for the quarter. Investment-grade corporate bonds and high-yield bonds lost some ground, although fundamentals for both groups remained solid. Convertible securities and U.S. Treasury inflation-protected securities pulled up the rear.
Stay on Track with Columbia Management
Backed by more than 100 years of experience, Columbia Management is one of the nation's largest asset managers. At the heart of our success and, most importantly, that of our investors, are highly talented industry professionals, brought together by a unique way of working. At Columbia Management, reaching our performance goals matters, and how we reach them matters just as much.
Visit columbiamanagement.com for:
> The Columbia Management Perspectives blog, offering insights on current market events and investment opportunities
> Detailed up-to-date fund performance and portfolio information
> Quarterly fund commentaries
> Columbia Management investor, our award-winning quarterly newsletter for shareholders
Thank you for your continued support of the Columbia Funds. We look forward to serving your investment needs for many years to come.
Best Regards,

J. Kevin Connaughton
President, Columbia Funds
Investing involves risk including the risk of loss of principal.
The S&P 500 Index, an unmanaged index, measures the performance of 500 widely held, large-capitalization U.S. stocks and is frequently used as a general measure of market performance. Indices are not available for investment, are not professionally managed and do not reflect sales charges, fees, brokerage commissions, taxes or other expenses of investing.
Investors should consider the investment objectives, risks, charges and expenses of a mutual fund carefully before investing. For a free prospectus and, if available, a summary prospectus, which contains this and other important information about a fund, visit columbiamanagement.com. The prospectus should be read carefully before investing.
Columbia Funds are distributed by Columbia Management Investment Distributors, Inc., member FINRA, and managed by Columbia Management Investment Advisers, LLC.
© 2014 Columbia Management Investment Advisers, LLC. All rights reserved.
Columbia Strategic Income Fund
Fund Investment Manager
Columbia Management Investment
Advisers, LLC
225 Franklin Street
Boston, MA 02110
Fund Distributor
Columbia Management Investment
Distributors, Inc.
225 Franklin Street
Boston, MA 02110
Fund Transfer Agent
Columbia Management Investment
Services Corp.
P.O. Box 8081
Boston, MA 02266-8081
For more information about any of the funds, please visit columbiamanagement.com or call 800.345.6611. Customer Service Representatives are available to answer your questions Monday through Friday from 8 a.m. to 7 p.m. Eastern time.
The views expressed in this report reflect the current views of the respective parties. These views are not guarantees of future performance and involve certain risks, uncertainties and assumptions that are difficult to predict, so actual outcomes and results may differ significantly from the views expressed. These views are subject to change at any time based upon economic, market or other conditions and the respective parties disclaim any responsibility to update such views. These views may not be relied on as investment advice and, because investment decisions for a Columbia Fund are based on numerous factors, may not be relied on as an indication of trading intent on behalf of any particular Columbia Fund. References to specific securities should not be construed as a recommendation or investment advice.
Performance Overview | | | 3 | | |
Manager Discussion of Fund Performance | | | 5 | | |
Understanding Your Fund's Expenses | | | 7 | | |
Portfolio of Investments | | | 8 | | |
Statement of Assets and Liabilities | | | 40 | | |
Statement of Operations | | | 42 | | |
Statement of Changes in Net Assets | | | 43 | | |
Financial Highlights | | | 46 | | |
Notes to Financial Statements | | | 56 | | |
Report of Independent Registered
Public Accounting Firm | | | 70 | | |
Federal Income Tax Information | | | 71 | | |
Trustees and Officers | | | 72 | | |
Board Consideration and Approval of Advisory Agreement | | | 75 | | |
Important Information About This Report | | | 79 | | |
Columbia Strategic Income Fund
Performance Summary
> Columbia Strategic Income Fund (the Fund) Class A shares returned 4.64% excluding sales charges for the 12-month period that ended October 31, 2014.
> The Fund outperformed its benchmark, the Barclays U.S. Aggregate Bond Index, which returned 4.14% for the same period.
> During the same 12-month period, the Bank of America (BofA) Merrill Lynch U.S. Cash Pay High Yield Constrained Index returned 5.77%, the Citigroup Non-U.S. World Government Bond (All Maturities) Index — Unhedged returned -2.88% and the J.P. Morgan Emerging Markets Bond Index (EMBI) — Global returned 7.20%.
> Sector allocation overall contributed positively to the Fund's outperformance, more than offsetting duration positioning, which detracted.
Average Annual Total Returns (%) (for period ended October 31, 2014)
| | | Inception | | 1 Year | | 5 Years | | 10 Years | |
Class A | | 04/21/77 | | | | | | | | | | | | | |
Excluding sales charges | | | | | | | 4.64 | | | | 6.74 | | | | 6.03 | | |
Including sales charges | | | | | | | -0.29 | | | | 5.71 | | | | 5.50 | | |
Class B | | 05/15/92 | | | | | | | | | | | | | |
Excluding sales charges | | | | | | | 3.85 | | | | 5.91 | | | | 5.22 | | |
Including sales charges | | | | | | | -1.04 | | | | 5.59 | | | | 5.22 | | |
Class C | | 07/01/97 | | | | | | | | | | | | | |
Excluding sales charges | | | | | | | 4.00 | | | | 6.10 | | | | 5.39 | | |
Including sales charges | | | | | | | 3.02 | | | | 6.10 | | | | 5.39 | | |
Class K* | | 03/07/11 | | | 4.83 | | | | 6.81 | | | | 6.06 | | |
Class R* | | 09/27/10 | | | 4.35 | | | | 6.56 | | | | 5.81 | | |
Class R4* | | 11/08/12 | | | 4.98 | | | | 6.83 | | | | 6.07 | | |
Class R5* | | 03/07/11 | | | 4.92 | | | | 7.00 | | | | 6.16 | | |
Class W* | | 09/27/10 | | | 4.67 | | | | 6.74 | | | | 6.03 | | |
Class Y* | | 06/13/13 | | | 5.15 | | | | 6.85 | | | | 6.08 | | |
Class Z | | 01/29/99 | | | 4.97 | | | | 6.99 | | | | 6.27 | | |
Barclays U.S. Aggregate Bond Index | | | | | | | 4.14 | | | | 4.22 | | | | 4.64 | | |
BofA Merrill Lynch U.S. Cash Pay High Yield Constrained Index | | | | | | | 5.77 | | | | 10.17 | | | | 8.03 | | |
Citigroup Non-U.S. World Government Bond (All Maturities)
Index — Unhedged (Citigroup Non-U.S. WGBI — Unhedged) | | | | | | | -2.88 | | | | 0.83 | | | | 3.55 | | |
J.P. Morgan Emerging Markets Bond Index — Global (EMBI Global) | | | | | | | 7.20 | | | | 8.27 | | | | 8.38 | | |
Blended Benchmark | | | | | | | 4.10 | | | | 6.43 | | | | 6.36 | | |
Barclays U.S. Government/Credit Bond Index | | | | | | | 4.21 | | | | 4.43 | | | | 4.61 | | |
Returns for Class A are shown with and without the maximum initial sales charge of 4.75%. Returns for Class B are shown with and without the applicable contingent deferred sales charge (CDSC) of 5.00% in the first year, declining to 1.00% in the sixth year and eliminated thereafter. Returns for Class C are shown with and without the 1.00% CDSC for the first year only. The Fund's other classes are not subject to sales charges and have limited eligibility. Please see the Fund's prospectus for details. Performance for different share classes will vary based on differences in sales charges and fees associated with each class. All results shown assume reinvestment of distributions during the period. Returns do not reflect the deduction of taxes that a shareholder may pay on Fund distributions or on the redemption of Fund shares. Performance results reflect the effect of any fee waivers or reimbursements of Fund expenses by Columbia Management Investment Advisers, LLC and/or any of its affiliates. Absent these fee waivers or expense reimbursement arrangements, performance results would have been lower.
The performance information shown represents past performance and is not a guarantee of future results. The investment return and principal value of your investment will fluctuate so that your shares, when redeemed, may be worth more or less than their original cost. Current performance may be lower or higher than the performance information shown. You may obtain performance information current to the most recent month-end by contacting your financial intermediary, visiting columbiamanagement.com or calling 800.345.6611.
*The returns shown for periods prior to the share class inception date (including returns for the Life of the Fund, if shown, which are since Fund inception) include the returns of the Fund's oldest share class. These returns are adjusted to reflect any higher class-related operating expenses of the newer share classes, as applicable. Please visit columbiamanagement.com/mutual-funds/appended-performance for more information.
Annual Report 2014
3
Columbia Strategic Income Fund
Performance Overview (continued)
Effective on August 29, 2014, the Fund's Blended Benchmark was replaced with the following three supplemental benchmarks: BofA Merrill Lynch U.S. Cash Pay High Yield Constrained Index, Citigroup Non-U.S. World Government Bond (All Maturities) Index — Unhedged and the J.P. Morgan EMBI — Global. Information on the indices will be included for a one-year transition period. After the transition period, we will remove the Barclays U.S. Government/Credit Index and the Blended Benchmark. Further, the Fund's benchmark, the Barclays U.S. Government/Credit Index, was replaced with the Barclays U.S. Aggregate Bond Index.
The Barclays U.S. Aggregate Bond Index is a market value-weighted index that tracks the daily price, coupon, pay-downs and total return performance of fixed-rate, publicly placed, dollar-denominated and non-convertible investment grade debt issues with at least $250 million par amount outstanding and with at least one year to final maturity.
The BofA Merrill Lynch U.S. Cash Pay High Yield Constrained Index tracks the performance of U.S. dollar-denominated below investment grade corporate debt, currently in a coupon paying period, that is publicly issued in the U.S. domestic market.
The Citigroup Non-U.S. World Government Bond (All Maturities) Index — Unhedged is calculated on a market-weighted basis and includes all fixed-rate bonds with a remaining maturity of one year or longer and with amounts outstanding of at least the equivalent of U.S. $25 million, while excluding floating or variable rate bonds.
The J.P. Morgan Emerging Markets Bond Index (EMBI) — Global is based on U.S. dollar-denominated debt instruments issued by emerging market sovereign and quasi-sovereign entities, such as Brady bonds, Eurobonds and loans, and reflects reinvestment of all distributions and changes in market prices.
The Blended Benchmark consists of a 35% weighting of the Barclays U.S. Aggregate Bond Index, a 35% weighting of the Bank of America Merrill Lynch (BofAML) U.S. Cash Pay High Yield Constrained Index, a 15% weighting of the Citigroup Non-U.S. World Government Bond (All Maturities) Index — Unhedged (Citigroup Non U.S. WGBI — Unhedged) and a 15% weighting of the J.P. Morgan Emerging Markets Bond Index (EMBI) — Global.
The Barclays U.S. Government/Credit Bond Index tracks the performance of U.S. government and corporate bonds rated investment grade or better, with maturities of at least one year.
Indices are not available for investment, are not professionally managed and do not reflect sales charges, fees, brokerage commissions, taxes or other expenses of investing. Securities in the Fund may not match those in an index.
Performance of a Hypothetical $10,000 Investment (November 1, 2004 – October 31, 2014)
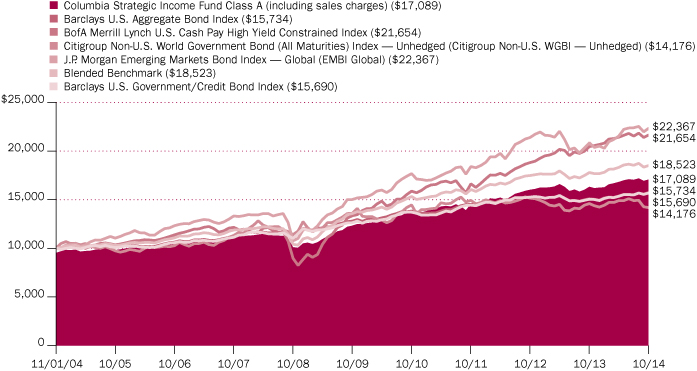
The chart above shows the change in value of a hypothetical $10,000 investment in Class A shares of Columbia Strategic Income Fund during the stated time period, and does not reflect the deduction of taxes that a shareholder may pay on Fund distributions or on the redemption of Fund shares.
Annual Report 2014
4
Columbia Strategic Income Fund
Manager Discussion of Fund Performance
Effective at the close of business on August 29, 2014, the Fund's principal investment strategies were revised to allow portfolio managers more flexibility to invest across various bond market sectors and across the credit quality spectrum. In connection with these changes, the Fund's blended benchmark was replaced with the following three supplemental benchmarks: Bank of America (BofA) Merrill Lynch U.S. Cash Pay High Yield Constrained Index, Citigroup Non-U.S. World Government Bond (All Maturities) Index — Unhedged and the J.P. Morgan Emerging Markets Bond Index (EMBI) — Global. Further, the Fund's benchmark, the Barclays U.S. Government/Credit Index, was replaced with the Barclays U.S. Aggregate Bond Index.
For the 12-month period that ended October 31, 2014, the Fund's Class A shares returned 4.64% without sales charge. The Fund outperformed its benchmark, the Barclays U.S. Aggregate Bond Index, which returned 4.14% for the same period. During the same 12-month period, the BofA Merrill Lynch U.S. Cash Pay High Yield Constrained Index returned 5.77%, the Citigroup Non-U.S. World Government Bond (All Maturities) Index — Unhedged returned -2.88% and the JP Morgan EMBI — Global returned 7.20%. Sector allocation overall contributed positively to the Fund's outperformance, more than offsetting duration positioning, which detracted.
Bond Markets Driven by Global Reach for Yield
Amid an environment of loose monetary policy by major central banks around the world, weak global economic growth and deflationary concerns drove long-term global bond yields lower during the annual period. The U.S. Treasury yield curve flattened, as long-term yields declined and short-term rates rose on expectations for a slight increase in the targeted federal funds rate target.
Sentiment was dominated by the global reach for yield, as investors continued to favor riskier sectors of the bond market to compensate for low rates on sectors with lower risk. This trend particularly benefited corporate credit, as both investment-grade and high-yield issuance ran at both historically high volumes and historically low rates. U.S. investment-grade corporate bonds, as measured by the Barclays U.S. Corporate Investment Grade Index, posted a total return of 6.29% for the annual period, while high-yield corporate bonds, as measured by the BofA Merrill Lynch U.S. Cash Pay High Yield Constrained Index, gained 5.77%. Municipal bonds and emerging market bonds also performed well during the annual period. The Barclays Municipal Bond Index increased 7.82% and the JP Morgan EMBI — Global gained 7.20%. International developed market government bonds, on the other hand, were especially weak, driven in large part by a stronger U.S. dollar. The Citigroup Non-U.S. World Government Bond (All Maturities) Index — Unhedged returned -2.88%.
Sector Allocation Aided Fund Results
Sector allocation overall contributed positively to the Fund's results during the annual period, driven by overweight positions in high-yield bonds, bank loans and emerging market bonds as well as an underweight allocation to bonds in international developed markets. Security selection in the mortgage-backed securities sector helped as well.
The Fund's yield curve positioning also contributed positively to the Fund's relative results, as the Fund was well positioned for the flattening of the yield curve that occurred during the annual period.
Duration Positioning Hampered Performance
Duration positioning negatively impacted the Fund's performance. The Fund maintained a shorter duration than the Barclays U.S. Aggregate Bond Index,
Portfolio Management
Colin Lundgren, CFA
Brian Lavin, CFA
Zach Pandl
Gene Tannuzzo, CFA
Portfolio Breakdown (%)
(at October 31, 2014) | |
Asset-Backed Securities —
Non-Agency | | | 2.3 | | |
Commercial Mortgage-Backed
Securities — Non-Agency | | | 4.6 | | |
Common Stocks | | | 0.0 | (a) | |
Consumer Discretionary | | | 0.0 | (a) | |
Information Technology | | | 0.0 | (a) | |
Materials | | | 0.0 | (a) | |
Telecommunication Services | | | 0.0 | (a) | |
Corporate Bonds & Notes | | | 41.7 | | |
Foreign Government Obligations | | | 22.1 | | |
Inflation-Indexed Bonds | | | 3.2 | | |
Money Market Funds | | | 4.9 | | |
Municipal Bonds | | | 0.3 | | |
Residential Mortgage-Backed Securities — Agency | | | 4.4 | | |
Residential Mortgage-Backed Securities — Non-Agency | | | 11.0 | | |
Senior Loans | | | 4.7 | | |
U.S. Treasury Obligations | | | 0.8 | | |
Total | | | 100.0 | | |
Percentages indicated are based upon total investments. The Fund's portfolio composition is subject to change.
(a) Rounds to zero.
Quality Breakdown (%)
(at October 31, 2014) | |
AAA rating | | | 8.5 | | |
AA rating | | | 1.6 | | |
A rating | | | 4.4 | | |
BBB rating | | | 20.4 | | |
BB rating | | | 18.9 | | |
B rating | | | 22.9 | | |
CCC rating | | | 7.3 | | |
CC rating | | | 0.0 | (a) | |
Not rated | | | 16.0 | | |
Total | | | 100.0 | | |
Percentages indicated are based upon total fixed income securities (excluding Money Market Funds).
(a) Rounds to zero.
Annual Report 2014
5
Columbia Strategic Income Fund
Manager Discussion of Fund Performance (continued)
Bond ratings apply to the underlying holdings of the Fund and not the Fund itself and are divided into categories ranging from highest to lowest credit quality, determined by using the middle rating of Moody's, S&P and Fitch, after dropping the highest and lowest available ratings. When ratings are available from only two rating agencies, the lower rating is used. When a rating is available from only one rating agency, that rating is used. When a bond is not rated by any rating agency, it is designated as "Not rated". Credit quality ratings assigned by a rating agency are subjective opinions, not statements of fact, and are subject to change, including daily. The ratings assigned by credit rating agencies are but one of the considerations that the Investment Manager incorporates into its credit analysis process, along with such other issuer-specific factors as cash flows, capital structure and leverage ratios, ability to de-leverage (repay) through free cash flow, quality of management, market positioning and access to capital, as well as such security-specific factors as the terms of the security (e.g., interest rate, and time to maturity) and the amount and type of any collateral.
Investment Risks
Market risk may affect a single issuer, sector of the economy, industry or the market as a whole. Mortgage- and asset-backed securities are affected by interest rates, financial health of issuers/originators, creditworthiness of entities providing credit enhancements and the value of underlying assets. Fixed-income securities present issuer default risk. Non-investment-grade (high-yield or junk) securities present greater price volatility and more risk to principal and income than higher rated securities. A rise in interest rates may result in a price decline of fixed-income securities held by the fund. Falling rates may result in the fund investing in lower yielding securities, lowering the fund's income and yield. Floating rate loans typically present greater risk than other fixed income investments as they are generally subject to legal or contractual resale restrictions, may trade less frequently and experience value impairments during liquidation. Prepayment and extension risk exists as a loan, bond or other investment may be called, prepaid or redeemed before maturity and that similar yielding investments may not be available for purchase. Foreign investments subject the fund to risks, including political, economic, market, social and others within a particular country, as well as to currency instabilities and less stringent financial and accounting standards generally applicable to U.S. issuers. Risks are enhanced for emerging market and sovereign debt issuers. Investing in derivatives is a specialized activity that involves special risks that subject the fund to significant loss potential, including when used as leverage, and may result in greater fluctuation in fund value. Liquidity risk is associated with the difficulty of selling underlying investments at a desirable time or price. See the Fund's prospectus for more information on these and other risks.
which hurt the Fund as interest rates declined during the annual period. Duration is a measure of the Fund's sensitivity to changes in interest rates.
The Fund's modestly overweight position in Treasury inflation-protected securities (TIPS) was also a detractor from its relative performance, as the sector was weak during the annual period. Security selection within the emerging market bond sector also detracted.
Derivative Positions in the Fund
The Fund utilized government bond futures and swaps to manage duration and yield curve exposure, credit default swaps to hedge credit exposure, currency forwards for hedging and total return purposes and mortgage TBAs to add exposure to agency mortgage-backed securities (MBS). TBAs, which stands for "to be announced," are mortgage securities bought and sold for future settlement with an agreed upon price, coupon and face value, but without reference to the characteristics of the underlying pool of mortgages until 48 hours before delivery is taken. This feature gives TBA participants immediate exposure to agency MBS without having to value each individual security.
Shifting Market Conditions Drove Portfolio Changes
During the annual period, we reduced the Fund's duration in an effort to protect against rising interest rates. We increasingly believed that the U.S. economy was accelerating at a faster pace than that which the market was giving it credit. We increased the Fund's exposure to non-agency mortgage-backed securities, commercial mortgage-backed securities and asset-backed securities due to improving market fundamentals, declining supply and what we considered to be reasonable valuations. We reduced the Fund's exposure to investment-grade corporate credit. While we believed credit fundamentals remained strong, tighter spreads (narrower yield differentials between corporate bonds and U.S. Treasuries) left little room for further upside in high quality credit, in our view. In terms of yield curve positioning, we shifted the majority of the Fund's short position to further out the curve, as we believed a strengthening U.S. economy could lead to higher long-term rates and a steeper yield curve.
Looking Ahead
At this time, we expect global monetary policy divergence to be a major theme for the fixed-income markets over the next several months. The U.S. and the U.K. appear to be closer to normalizing monetary policy on improving economic fundamentals, while Europe and Japan are in the process of further easing policy. The European Central Bank (ECB) recently affirmed its commitment to expand the size of its balance sheet to early 2012 levels, which implies an increase of about one trillion euros through a combination of bond purchases and long-term loans to banks. Additionally, despite political obstacles, sovereign quantitative easing by the ECB seems to be a distinct possibility. At the same time, the Bank of Japan (BoJ) has increased the size of its own asset purchase program and extended the duration of the assets it will add to its balance sheet. Together, we believe the ECB and BoJ actions ensure that global liquidity will remain abundant even though the U.S. Federal Reserve (Fed) ended its asset purchase program on schedule in October 2014. While U.S. yields currently remain above those in other developed market economies, the outlooks for economic growth and policy appear to have diverged. As a result, we believe strong economic growth in the U.S. may force the Fed to increase short-term interest rates from the zero lower bound in the not too distant future. At the end of the annual period, the market seemed to anticipate the first rate increase by the Fed to occur between June and September 2015. Together, we believe these factors may well drive an increase in volatility in global rates and currencies in the year ahead, which, in our view, presents attractive investment opportunities for the Fund.
Annual Report 2014
6
Columbia Strategic Income Fund
Understanding Your Fund's Expenses
(Unaudited)
As an investor, you incur two types of costs. There are transaction costs, which generally include sales charges on purchases and may include redemption fees. There are also ongoing costs, which generally include management fees, distribution and/or service fees, and other fund expenses. The following information is intended to help you understand your ongoing costs (in dollars) of investing in the Fund and to help you compare these costs with the ongoing costs of investing in other mutual funds.
Analyzing Your Fund's Expenses
To illustrate these ongoing costs, we have provided examples and calculated the expenses paid by investors in each share class of the Fund during the period. The actual and hypothetical information in the table is based on an initial investment of $1,000 at the beginning of the period indicated and held for the entire period. Expense information is calculated two ways and each method provides you with different information. The amount listed in the "Actual" column is calculated using the Fund's actual operating expenses and total return for the period. You may use the Actual information, together with the amount invested, to estimate the expenses that you paid over the period. Simply divide your account value by $1,000 (for example, an $8,600 account value divided by $1,000 = 8.6), then multiply the results by the expenses paid during the period under the "Actual" column. The amount listed in the "Hypothetical" column assumes a 5% annual rate of return before expenses (which is not the Fund's actual return) and then applies the Fund's actual expense ratio for the period to the hypothetical return. You should not use the hypothetical account values and expenses to estimate either your actual account balance at the end of the period or the expenses you paid during the period. See "Compare With Other Funds" below for details on how to use the hypothetical data.
Compare With Other Funds
Since all mutual funds are required to include the same hypothetical calculations about expenses in shareholder reports, you can use this information to compare the ongoing cost of investing in the Fund with other funds. To do so, compare the hypothetical example with the 5% hypothetical examples that appear in the shareholder reports of other funds. As you compare hypothetical examples of other funds, it is important to note that hypothetical examples are meant to highlight the ongoing costs of investing in a fund only and do not reflect any transaction costs, such as sales charges, or redemption or exchange fees. Therefore, the hypothetical calculations are useful in comparing ongoing costs only, and will not help you determine the relative total costs of owning different funds. If transaction costs were included in these calculations, your costs would be higher.
May 1, 2014 – October 31, 2014
| | | Account Value at the Beginning
of the Period ($) | | Account Value at the End of the
Period ($) | | Expenses Paid During the
Period ($) | | Fund's Annualized
Expense Ratio (%) | |
| | | Actual | | Hypothetical | | Actual | | Hypothetical | | Actual | | Hypothetical | | Actual | |
Class A | | | 1,000.00 | | | | 1,000.00 | | | | 1,016.00 | | | | 1,019.96 | | | | 5.28 | | | | 5.30 | | | | 1.04 | | |
Class B | | | 1,000.00 | | | | 1,000.00 | | | | 1,010.50 | | | | 1,016.18 | | | | 9.07 | | | | 9.10 | | | | 1.79 | | |
Class C | | | 1,000.00 | | | | 1,000.00 | | | | 1,011.30 | | | | 1,016.69 | | | | 8.57 | | | | 8.59 | | | | 1.69 | | |
Class K | | | 1,000.00 | | | | 1,000.00 | | | | 1,015.10 | | | | 1,020.57 | | | | 4.67 | | | | 4.69 | | | | 0.92 | | |
Class R | | | 1,000.00 | | | | 1,000.00 | | | | 1,013.00 | | | | 1,018.70 | | | | 6.55 | | | | 6.56 | | | | 1.29 | | |
Class R4 | | | 1,000.00 | | | | 1,000.00 | | | | 1,017.50 | | | | 1,021.22 | | | | 4.02 | | | | 4.02 | | | | 0.79 | | |
Class R5 | | | 1,000.00 | | | | 1,000.00 | | | | 1,016.40 | | | | 1,021.83 | | | | 3.41 | | | | 3.41 | | | | 0.67 | | |
Class W | | | 1,000.00 | | | | 1,000.00 | | | | 1,014.40 | | | | 1,019.96 | | | | 5.28 | | | | 5.30 | | | | 1.04 | | |
Class Y | | | 1,000.00 | | | | 1,000.00 | | | | 1,016.70 | | | | 1,022.03 | | | | 3.20 | | | | 3.21 | | | | 0.63 | | |
Class Z | | | 1,000.00 | | | | 1,000.00 | | | | 1,015.80 | | | | 1,021.22 | | | | 4.01 | | | | 4.02 | | | | 0.79 | | |
Expenses paid during the period are equal to the annualized expense ratio for each class as indicated above, multiplied by the average account value over the period and then multiplied by the number of days in the Fund's most recent fiscal half year and divided by 365.
Expenses do not include fees and expenses incurred indirectly by the Fund from its investment in underlying funds, including affiliated and non-affiliated pooled investment vehicles, such as mutual funds and exchange-traded funds.
Had Columbia Management Investment Advisers, LLC and/or certain of its affiliates not waived/reimbursed certain fees and expenses, account value at the end of the period would have been reduced.
Annual Report 2014
7
Columbia Strategic Income Fund
Portfolio of Investments
October 31, 2014
(Percentages represent value of investments compared to net assets)
Corporate Bonds & Notes(a) 41.8%
Issuer | | Coupon
Rate | | Principal
Amount ($) | | Value ($) | |
Aerospace & Defense 0.6% | |
ADS Tactical, Inc.
Senior Secured(b)
04/01/18 | | | 11.000 | % | | | | | | | 1,507,000 | | | | 1,471,209 | | |
Bombardier, Inc.(b)
Senior Unsecured
03/15/20 | | | 7.750 | % | | | | | | | 27,000 | | | | 29,970 | | |
10/15/22 | | | 6.000 | % | | | | | | | 974,000 | | | | 1,000,176 | | |
01/15/23 | | | 6.125 | % | | | | | | | 3,399,000 | | | | 3,513,716 | | |
Northrop Grumman Corp.
Senior Unsecured
03/15/21 | | | 3.500 | % | | | | | | | 2,765,000 | | | | 2,877,008 | | |
TransDigm, Inc.
10/15/20 | | | 5.500 | % | | | | | | | 317,000 | | | | 317,000 | | |
07/15/22 | | | 6.000 | % | | | | | | | 425,000 | | | | 429,781 | | |
07/15/24 | | | 6.500 | % | | | | | | | 3,160,000 | | | | 3,254,800 | | |
Total | | | | | | | | | 12,893,660 | | |
Automotive 0.8% | |
American Axle & Manufacturing, Inc.
02/15/19 | | | 5.125 | % | | | | | | | 1,285,000 | | | | 1,304,275 | | |
03/15/21 | | | 6.250 | % | | | | | | | 1,620,000 | | | | 1,701,000 | | |
Chrysler Group LLC/Co-Issuer, Inc.
Secured
06/15/19 | | | 8.000 | % | | | | | | | 1,840,000 | | | | 1,971,100 | | |
06/15/21 | | | 8.250 | % | | | | | | | 1,986,000 | | | | 2,219,355 | | |
Gates Global LLC/Co.(b)
07/15/22 | | | 6.000 | % | | | | | | | 1,253,000 | | | | 1,215,410 | | |
General Motors Co.
Senior Unsecured
10/02/23 | | | 4.875 | % | | | | | | | 4,287,000 | | | | 4,592,449 | | |
General Motors Financial Co., Inc.
09/25/21 | | | 4.375 | % | | | | | | | 1,003,000 | | | | 1,050,743 | | |
Jaguar Land Rover Automotive PLC(b)
12/15/18 | | | 4.125 | % | | | | | | | 1,433,000 | | | | 1,458,077 | | |
11/15/19 | | | 4.250 | % | | | | | | | 347,000 | | | | 348,735 | | |
Schaeffler Finance BV
Senior Secured(b)
05/15/21 | | | 4.250 | % | | | | | | | 182,000 | | | | 176,995 | | |
Schaeffler Holding Finance BV
Senior Secured PIK(b)
11/15/19 | | | 6.250 | % | | | | | | | 1,349,000 | | | | 1,396,215 | | |
Total | | | | | | | | | 17,434,354 | | |
Banking 1.4% | |
Agromercantil Senior Trust(b)
04/10/19 | | | 6.250 | % | | | | | | | 1,295,000 | | | | 1,342,268 | | |
Ally Financial, Inc.
03/15/20 | | | 8.000 | % | | | | | | | 2,515,000 | | | | 3,024,288 | | |
09/15/20 | | | 7.500 | % | | | | | | | 5,645,000 | | | | 6,717,550 | | |
Corporate Bonds & Notes(a) (continued)
Issuer | | Coupon
Rate | | Principal
Amount ($) | | Value ($) | |
Senior Unsecured
09/30/24 | | | 5.125 | % | | | | | | | 1,715,000 | | | | 1,783,600 | | |
BES Investimento do Brasil SA
Senior Unsecured(b)
03/25/15 | | | 5.625 | % | | | | | | | 1,000,000 | | | | 994,000 | | |
Banco de Credito del Peru
Subordinated Notes(b)(c)(d)
10/15/22 | | | 7.170 | % | | PEN | | | | | 2,000,000 | | | | 697,913 | | |
Bank of America Corp.
Senior Unsecured
07/24/23 | | | 4.100 | % | | | | | | | 2,165,000 | | | | 2,260,154 | | |
Citigroup, Inc.
Senior Unsecured
06/16/24 | | | 3.750 | % | | | | | | | 2,140,000 | | | | 2,174,555 | | |
Goldman Sachs Group, Inc. (The)
Senior Unsecured
07/08/24 | | | 3.850 | % | | | | | | | 2,115,000 | | | | 2,131,037 | | |
Grupo Aval Ltd.(b)
09/26/22 | | | 4.750 | % | | | | | | | 1,000,000 | | | | 999,200 | | |
Industrial Senior Trust(b)
11/01/22 | | | 5.500 | % | | | | | | | 1,000,000 | | | | 992,500 | | |
Lloyds Banking Group PLC(b)(c)
12/31/49 | | | 6.657 | % | | | | | | | 230,000 | | | | 247,825 | | |
Morgan Stanley
Senior Unsecured(b)
10/22/20 | | | 11.500 | % | | BRL | | | | | 4,485,000 | | | | 1,848,646 | | |
Popular, Inc.
Senior Unsecured
07/01/19 | | | 7.000 | % | | | | | | | 714,000 | | | | 719,355 | | |
Royal Bank of Scotland Group PLC
Subordinated Notes
05/28/24 | | | 5.125 | % | | | | | | | 1,650,000 | | | | 1,671,740 | | |
Synovus Financial Corp.
Senior Unsecured
02/15/19 | | | 7.875 | % | | | | | | | 3,705,000 | | | | 4,149,600 | | |
Total | | | | | | | | | 31,754,231 | | |
Brokerage/Asset Managers/Exchanges 0.1% | |
E*TRADE Financial Corp.
Senior Unsecured
11/15/19 | | | 6.375 | % | | | | | | | 2,708,000 | | | | 2,887,405 | | |
Building Materials 0.7% | |
Allegion US Holding Co., Inc.
10/01/21 | | | 5.750 | % | | | | | | | 1,646,000 | | | | 1,724,185 | | |
American Builders & Contractors Supply Co., Inc.
Senior Unsecured(b)
04/15/21 | | | 5.625 | % | | | | | | | 2,031,000 | | | | 2,061,465 | | |
The accompanying Notes to Financial Statements are an integral part of this statement.
Annual Report 2014
8
Columbia Strategic Income Fund
Portfolio of Investments (continued)
October 31, 2014
Corporate Bonds & Notes(a) (continued)
Issuer | | Coupon
Rate | | Principal
Amount ($) | | Value ($) | |
Building Materials Corp. of America(b)
Senior Secured
02/15/20 | | | 7.000 | % | | | | | | | 945,000 | | | | 994,140 | | |
Senior Unsecured
05/01/21 | | | 6.750 | % | | | | | | | 2,517,000 | | | | 2,699,482 | | |
Building Materials Corp. of America(b)(e)
Senior Unsecured
11/15/24 | | | 5.375 | % | | | | | | | 1,311,000 | | | | 1,314,278 | | |
Gibraltar Industries, Inc.
02/01/21 | | | 6.250 | % | | | | | | | 723,000 | | | | 744,690 | | |
HD Supply, Inc.
07/15/20 | | | 7.500 | % | | | | | | | 2,000,000 | | | | 2,130,000 | | |
07/15/20 | | | 11.500 | % | | | | | | | 1,340,000 | | | | 1,561,100 | | |
Nortek, Inc.
04/15/21 | | | 8.500 | % | | | | | | | 1,307,000 | | | | 1,405,025 | | |
Union Andina de Cementos SAA
Senior Unsecured(b)
10/30/21 | | | 5.875 | % | | | | | | | 1,300,000 | | | | 1,319,760 | | |
Total | | | | | | | | | 15,954,125 | | |
Cable and Satellite 2.2% | |
CCO Holdings LLC/Capital Corp.
09/30/22 | | | 5.250 | % | | | | | | | 3,443,000 | | | | 3,464,519 | | |
01/15/24 | | | 5.750 | % | | | | | | | 1,479,000 | | | | 1,514,126 | | |
CCOH Safari LLC(e)
12/01/22 | | | 5.500 | % | | | | | | | 1,302,000 | | | | 1,315,020 | | |
12/01/24 | | | 5.750 | % | | | | | | | 3,126,000 | | | | 3,143,584 | | |
CSC Holdings, Inc.
Senior Unsecured
11/15/21 | | | 6.750 | % | | | | | | | 4,456,000 | | | | 4,957,300 | | |
Cequel Communications Holdings I LLC/Capital Corp.(b)
Senior Unsecured
09/15/20 | | | 6.375 | % | | | | | | | 2,149,000 | | | | 2,240,332 | | |
12/15/21 | | | 5.125 | % | | | | | | | 1,229,000 | | | | 1,199,811 | | |
DISH DBS Corp.
06/01/21 | | | 6.750 | % | | | | | | | 4,868,000 | | | | 5,403,480 | | |
07/15/22 | | | 5.875 | % | | | | | | | 1,382,000 | | | | 1,464,920 | | |
DigitalGlobe, Inc.(b)
02/01/21 | | | 5.250 | % | | | | | | | 746,000 | | | | 725,485 | | |
Hughes Satellite Systems Corp.
06/15/21 | | | 7.625 | % | | | | | | | 585,000 | | | | 650,813 | | |
Senior Secured
06/15/19 | | | 6.500 | % | | | | | | | 4,440,000 | | | | 4,806,300 | | |
Intelsat Jackson Holdings SA
04/01/19 | | | 7.250 | % | | | | | | | 395,000 | | | | 414,750 | | |
Senior Unsecured
04/01/21 | | | 7.500 | % | | | | | | | 2,660,000 | | | | 2,879,450 | | |
Intelsat Luxembourg SA
06/01/21 | | | 7.750 | % | | | | | | | 1,134,000 | | | | 1,185,030 | | |
06/01/23 | | | 8.125 | % | | | | | | | 1,699,000 | | | | 1,805,187 | | |
Corporate Bonds & Notes(a) (continued)
Issuer | | Coupon
Rate | | Principal
Amount ($) | | Value ($) | |
Mediacom Broadband LLC/Corp.
04/15/21 | | | 5.500 | % | | | | | | | 288,000 | | | | 293,040 | | |
NBCUniversal Media LLC
04/01/21 | | | 4.375 | % | | | | | | | 2,660,000 | | | | 2,922,071 | | |
Numericable Group SA(b)
Senior Secured
05/15/19 | | | 4.875 | % | | | | | | | 1,836,000 | | | | 1,831,410 | | |
05/15/22 | | | 6.000 | % | | | | | | | 3,393,000 | | | | 3,469,342 | | |
05/15/24 | | | 6.250 | % | | | | | | | 226,000 | | | | 232,498 | | |
Time Warner Cable, Inc.
09/15/42 | | | 4.500 | % | | | | | | | 380,000 | | | | 374,608 | | |
Unitymedia KabelBW GmbH(b)
01/15/25 | | | 6.125 | % | | | | | | | 1,611,000 | | | | 1,681,481 | | |
Virgin Media Finance PLC
Senior Unsecured(b)
10/15/24 | | | 6.000 | % | | | | | | | 567,000 | | | | 589,680 | | |
Virgin Media Secured Finance PLC
Senior Secured(b)
04/15/21 | | | 5.375 | % | | | | | | | 375,000 | | | | 388,594 | | |
Total | | | | | | | | | 48,952,831 | | |
Chemicals 1.5% | |
Axalta Coating Systems Dutch Holding B BV/U.S.
Holdings, Inc.(b)
05/01/21 | | | 7.375 | % | | | | | | | 2,338,000 | | | | 2,527,962 | | |
Celanese U.S. Holdings LLC
06/15/21 | | | 5.875 | % | | | | | | | 814,000 | | | | 883,190 | | |
Eco Services Operations LLC/Finance Corp.
Senior Unsecured(b)
11/01/22 | | | 8.500 | % | | | | | | | 739,000 | | | | 761,170 | | |
Huntsman International LLC
11/15/20 | | | 4.875 | % | | | | | | | 2,071,000 | | | | 2,086,533 | | |
INEOS Group Holdings SA(b)
08/15/18 | | | 6.125 | % | | | | | | | 318,000 | | | | 320,783 | | |
02/15/19 | | | 5.875 | % | | | | | | | 2,138,000 | | | | 2,135,327 | | |
JM Huber Corp.
Senior Unsecured(b)
11/01/19 | | | 9.875 | % | | | | | | | 2,430,000 | | | | 2,697,300 | | |
LYB International Finance BV
07/15/23 | | | 4.000 | % | | | | | | | 1,360,000 | | | | 1,410,548 | | |
Mexichem SAB de CV(b)
09/17/44 | | | 5.875 | % | | | | | | | 1,200,000 | | | | 1,200,000 | | |
NOVA Chemicals Corp.(b)
Senior Unsecured
08/01/23 | | | 5.250 | % | | | | | | | 1,337,000 | | | | 1,397,165 | | |
05/01/25 | | | 5.000 | % | | | | | | | 1,396,000 | | | | 1,441,370 | | |
PQ Corp.
Secured(b)
05/01/18 | | | 8.750 | % | | | | | | | 11,024,000 | | | | 11,685,440 | | |
The accompanying Notes to Financial Statements are an integral part of this statement.
Annual Report 2014
9
Columbia Strategic Income Fund
Portfolio of Investments (continued)
October 31, 2014
Corporate Bonds & Notes(a) (continued)
Issuer | | Coupon
Rate | | Principal
Amount ($) | | Value ($) | |
Sibur Securities Ltd.(b)
01/31/18 | | | 3.914 | % | | | | | | | 2,300,000 | | | | 2,137,091 | | |
WR Grace & Co.(b)
10/01/21 | | | 5.125 | % | | | | | | | 1,073,000 | | | | 1,117,937 | | |
10/01/24 | | | 5.625 | % | | | | | | | 777,000 | | | | 818,764 | | |
Total | | | | | | | | | 32,620,580 | | |
Construction Machinery 0.9% | |
Ashtead Capital, Inc.
Secured(b)
07/15/22 | | | 6.500 | % | | | | | | | 1,554,000 | | | | 1,682,205 | | |
CNH Industrial Capital LLC
Senior Unsecured(b)
07/15/19 | | | 3.375 | % | | | | | | | 1,538,000 | | | | 1,495,705 | | |
Case New Holland Industrial, Inc.
12/01/17 | | | 7.875 | % | | | | | | | 6,862,000 | | | | 7,702,595 | | |
Columbus McKinnon Corp.
02/01/19 | | | 7.875 | % | | | | | | | 950,000 | | | | 992,750 | | |
H&E Equipment Services, Inc.
09/01/22 | | | 7.000 | % | | | | | | | 2,665,000 | | | | 2,844,887 | | |
United Rentals North America, Inc.
05/15/20 | | | 7.375 | % | | | | | | | 1,015,000 | | | | 1,101,275 | | |
04/15/22 | | | 7.625 | % | | | | | | | 1,765,000 | | | | 1,967,975 | | |
06/15/23 | | | 6.125 | % | | | | | | | 1,724,000 | | | | 1,855,455 | | |
Total | | | | | | | | | 19,642,847 | | |
Consumer Cyclical Services 0.7% | |
ADT Corp. (The)
Senior Unsecured
07/15/22 | | | 3.500 | % | | | | | | | 2,428,000 | | | | 2,173,060 | | |
06/15/23 | | | 4.125 | % | | | | | | | 1,050,000 | | | | 966,000 | | |
APX Group, Inc.
12/01/20 | | | 8.750 | % | | | | | | | 2,240,000 | | | | 1,937,600 | | |
Senior Secured
12/01/19 | | | 6.375 | % | | | | | | | 6,023,000 | | | | 5,917,598 | | |
APX Group, Inc.(b)
Senior Unsecured
12/01/20 | | | 8.750 | % | | | | | | | 805,000 | | | | 696,325 | | |
IHS, Inc.(b)
11/01/22 | | | 5.000 | % | | | | | | | 1,101,000 | | | | 1,117,515 | | |
Monitronics International, Inc.
04/01/20 | | | 9.125 | % | | | | | | | 2,240,000 | | | | 2,304,400 | | |
Total | | | | | | | | | 15,112,498 | | |
Consumer Products 0.6% | |
Revlon Consumer Products Corp.
02/15/21 | | | 5.750 | % | | | | | | | 805,000 | | | | 805,000 | | |
Serta Simmons Holdings LLC
Senior Unsecured(b)
10/01/20 | | | 8.125 | % | | | | | | | 4,275,000 | | | | 4,584,937 | | |
Corporate Bonds & Notes(a) (continued)
Issuer | | Coupon
Rate | | Principal
Amount ($) | | Value ($) | |
Spectrum Brands, Inc.
03/15/20 | | | 6.750 | % | | | | | | | 667,000 | | | | 705,353 | | |
11/15/20 | | | 6.375 | % | | | | | | | 2,086,000 | | | | 2,205,945 | | |
11/15/22 | | | 6.625 | % | | | | | | | 725,000 | | | | 777,563 | | |
Springs Industries, Inc.
Senior Secured
06/01/21 | | | 6.250 | % | | | | | | | 3,414,000 | | | | 3,388,395 | | |
Tempur Sealy International, Inc.
12/15/20 | | | 6.875 | % | | | | | | | 488,000 | | | | 520,940 | | |
Total | | | | | | | | | 12,988,133 | | |
Diversified Manufacturing 0.5% | |
Actuant Corp.
06/15/22 | | | 5.625 | % | | | | | | | 1,319,000 | | | | 1,368,463 | | |
Amsted Industries, Inc.(b)
03/15/22 | | | 5.000 | % | | | | | | | 1,736,000 | | | | 1,712,130 | | |
09/15/24 | | | 5.375 | % | | | | | | | 1,172,000 | | | | 1,172,000 | | |
Entegris, Inc.(b)
04/01/22 | | | 6.000 | % | | | | | | | 1,983,000 | | | | 2,017,702 | | |
Hamilton Sundstrand Corp.
Senior Unsecured(b)
12/15/20 | | | 7.750 | % | | | | | | | 3,493,000 | | | | 3,632,720 | | |
Total | | | | | | | | | 9,903,015 | | |
Electric 1.3% | |
AES Corp. (The)
Senior Unsecured
07/01/21 | | | 7.375 | % | | | | | | | 3,126,000 | | | | 3,566,569 | | |
Calpine Corp.
Senior Secured(b)
01/15/22 | | | 6.000 | % | | | | | | | 2,690,000 | | | | 2,898,475 | | |
Companhia de Eletricidade do Estad
04/27/16 | | | 11.750 | % | | BRL | | | | | 2,313,000 | | | | 914,783 | | |
Duke Energy Corp.
Senior Unsecured
09/15/21 | | | 3.550 | % | | | | | | | 415,000 | | | | 431,950 | | |
08/15/22 | | | 3.050 | % | | | | | | | 5,280,000 | | | | 5,276,246 | | |
NRG Energy, Inc.
07/15/22 | | | 6.250 | % | | | | | | | 4,383,000 | | | | 4,580,235 | | |
PPL Capital Funding, Inc.
06/01/23 | | | 3.400 | % | | | | | | | 5,780,000 | | | | 5,771,405 | | |
Progress Energy, Inc.
Senior Unsecured
04/01/22 | | | 3.150 | % | | | | | | | 5,994,000 | | | | 6,041,316 | | |
Total | | | | | | | | | 29,480,979 | | |
The accompanying Notes to Financial Statements are an integral part of this statement.
Annual Report 2014
10
Columbia Strategic Income Fund
Portfolio of Investments (continued)
October 31, 2014
Corporate Bonds & Notes(a) (continued)
Issuer | | Coupon
Rate | | Principal
Amount ($) | | Value ($) | |
Finance Companies 1.5% | |
AerCap Ireland Capital Ltd./Global Aviation Trust(b)
05/15/21 | | | 4.500 | % | | | | | | | 2,541,000 | | | | 2,566,410 | | |
Senior Unsecured
10/01/21 | | | 5.000 | % | | | | | | | 1,114,000 | | | | 1,158,560 | | |
Aircastle Ltd.
Senior Unsecured
03/15/21 | | | 5.125 | % | | | | | | | 1,088,000 | | | | 1,101,600 | | |
Aviation Capital Group Corp.
Senior Unsecured(b)
04/06/21 | | | 6.750 | % | | | | | | | 100,000 | | | | 114,000 | | |
CIT Group, Inc.
Senior Unsecured(b)
02/15/19 | | | 5.500 | % | | | | | | | 2,957,000 | | | | 3,149,205 | | |
International Lease Finance Corp.
Senior Unsecured
04/01/19 | | | 5.875 | % | | | | | | | 853,000 | | | | 919,107 | | |
12/15/20 | | | 8.250 | % | | | | | | | 4,098,000 | | | | 4,917,600 | | |
01/15/22 | | | 8.625 | % | | | | | | | 2,266,000 | | | | 2,809,840 | | |
Navient Corp.
Senior Unsecured
01/15/19 | | | 5.500 | % | | | | | | | 559,000 | | | | 579,616 | | |
01/25/22 | | | 7.250 | % | | | | | | | 1,244,000 | | | | 1,390,170 | | |
03/25/24 | | | 6.125 | % | | | | | | | 1,401,000 | | | | 1,446,547 | | |
Provident Funding Associates LP/Finance Corp.(b)
06/15/21 | | | 6.750 | % | | | | | | | 3,196,000 | | | | 3,188,010 | | |
Senior Unsecured
02/15/19 | | | 10.125 | % | | | | | | | 480,000 | | | | 513,000 | | |
Springleaf Finance Corp.
12/15/17 | | | 6.900 | % | | | | | | | 1,928,000 | | | | 2,087,060 | | |
06/01/20 | | | 6.000 | % | | | | | | | 645,000 | | | | 667,575 | | |
10/01/21 | | | 7.750 | % | | | | | | | 1,668,000 | | | | 1,884,840 | | |
10/01/23 | | | 8.250 | % | | | | | | | 1,220,000 | | | | 1,372,500 | | |
iStar Financial, Inc
Senior Unsecured
07/01/19 | | | 5.000 | % | | | | | | | 1,955,000 | | | | 1,945,225 | | |
Total | | | | | | | | | 31,810,865 | | |
Food and Beverage 1.7% | |
Aramark Services, Inc.
03/15/20 | | | 5.750 | % | | | | | | | 2,800,000 | | | | 2,926,000 | | |
B&G Foods, Inc.
06/01/21 | | | 4.625 | % | | | | | | | 4,077,000 | | | | 4,005,652 | | |
ConAgra Foods, Inc.
Senior Unsecured
09/15/22 | | | 3.250 | % | | | | | | | 5,750,000 | | | | 5,640,181 | | |
Constellation Brands, Inc.(e)
11/15/19 | | | 3.875 | % | | | | | | | 522,000 | | | | 529,830 | | |
11/15/24 | | | 4.750 | % | | | | | | | 522,000 | | | | 533,745 | | |
Cosan Luxembourg SA(b)
03/14/23 | | | 5.000 | % | | | | | | | 491,000 | | | | 470,624 | | |
Corporate Bonds & Notes(a) (continued)
Issuer | | Coupon
Rate | | Principal
Amount ($) | | Value ($) | |
Darling Ingredients, Inc.
01/15/22 | | | 5.375 | % | | | | | | | 2,589,000 | | | | 2,595,472 | | |
Diamond Foods, Inc.(b)
03/15/19 | | | 7.000 | % | | | | | | | 551,000 | | | | 562,020 | | |
Heineken NV
Senior Unsecured(b)
04/01/22 | | | 3.400 | % | | | | | | | 4,300,000 | | | | 4,376,149 | | |
MHP SA(b)
04/02/20 | | | 8.250 | % | | | | | | | 5,000,000 | | | | 4,325,000 | | |
Molson Coors Brewing Co.
05/01/42 | | | 5.000 | % | | | | | | | 3,880,000 | | | | 4,027,727 | | |
Pinnacle Foods Finance LLC/Corp.
05/01/21 | | | 4.875 | % | | | | | | | 334,000 | | | | 330,660 | | |
Post Holdings, Inc.(b)
12/15/22 | | | 6.000 | % | | | | | | | 902,000 | | | | 870,430 | | |
SABMiller Holdings, Inc.(b)
01/15/22 | | | 3.750 | % | | | | | | | 4,880,000 | | | | 5,040,015 | | |
WhiteWave Foods Co. (The)
10/01/22 | | | 5.375 | % | | | | | | | 1,918,000 | | | | 2,018,695 | | |
Total | | | | | | | | | 38,252,200 | | |
Gaming 1.4% | |
GLP Capital LP/Financing II, Inc.
11/01/23 | | | 5.375 | % | | | | | | | 275,000 | | | | 289,438 | | |
MCE Finance Ltd.(b)
02/15/21 | | | 5.000 | % | | | | | | | 4,698,000 | | | | 4,627,530 | | |
MGM Resorts International
03/01/18 | | | 11.375 | % | | | | | | | 1,925,000 | | | | 2,348,500 | | |
10/01/20 | | | 6.750 | % | | | | | | | 444,000 | | | | 487,290 | | |
12/15/21 | | | 6.625 | % | | | | | | | 4,363,000 | | | | 4,777,485 | | |
Penn National Gaming, Inc.
Senior Unsecured
11/01/21 | | | 5.875 | % | | | | | | | 1,248,000 | | | | 1,191,840 | | |
Pinnacle Entertainment, Inc.
08/01/21 | | | 6.375 | % | | | | | | | 2,010,000 | | | | 2,150,700 | | |
Seminole Tribe of Florida, Inc.(b)
Senior Secured
10/01/20 | | | 6.535 | % | | | | | | | 1,335,000 | | | | 1,435,125 | | |
Senior Unsecured
10/01/20 | | | 7.804 | % | | | | | | | 1,970,000 | | | | 2,145,665 | | |
Seneca Gaming Corp.(b)
12/01/18 | | | 8.250 | % | | | | | | | 2,909,000 | | | | 3,039,905 | | |
SugarHouse HSP Gaming LP/Finance Corp.
Senior Secured(b)
06/01/21 | | | 6.375 | % | | | | | | | 3,303,000 | | | | 3,162,622 | | |
Tunica-Biloxi Gaming Authority
Senior Unsecured(b)(f)
11/15/15 | | | 9.000 | % | | | | | | | 2,397,000 | | | | 1,420,222 | | |
The accompanying Notes to Financial Statements are an integral part of this statement.
Annual Report 2014
11
Columbia Strategic Income Fund
Portfolio of Investments (continued)
October 31, 2014
Corporate Bonds & Notes(a) (continued)
Issuer | | Coupon
Rate | | Principal
Amount ($) | | Value ($) | |
Wynn Macau Ltd.
Senior Unsecured(b)
10/15/21 | | | 5.250 | % | | | | | | | 3,187,000 | | | | 3,187,000 | | |
Total | | | | | | | | | 30,263,322 | | |
Health Care 2.8% | |
Acadia Healthcare Co., Inc.
07/01/22 | | | 5.125 | % | | | | | | | 524,000 | | | | 520,070 | | |
Amsurg Corp.
11/30/20 | | | 5.625 | % | | | | | | | 1,096,000 | | | | 1,128,880 | | |
Amsurg Corp.(b)
07/15/22 | | | 5.625 | % | | | | | | | 1,393,000 | | | | 1,443,322 | | |
Biomet, Inc.
08/01/20 | | | 6.500 | % | | | | | | | 547,000 | | | | 585,290 | | |
CHS/Community Health Systems, Inc.(b)
02/01/22 | | | 6.875 | % | | | | | | | 3,355,000 | | | | 3,615,012 | | |
Senior Secured
08/01/21 | | | 5.125 | % | | | | | | | 614,000 | | | | 641,630 | | |
Catamaran Corp.
03/15/21 | | | 4.750 | % | | | | | | | 573,000 | | | | 568,703 | | |
ConvaTec Healthcare E SA
Senior Unsecured(b)
12/15/18 | | | 10.500 | % | | | | | | | 3,752,000 | | | | 3,977,120 | | |
DaVita HealthCare Partners, Inc.
08/15/22 | | | 5.750 | % | | | | | | | 3,428,000 | | | | 3,633,680 | | |
07/15/24 | | | 5.125 | % | | | | | | | 2,874,000 | | | | 2,931,480 | | |
Emdeon, Inc.
12/31/19 | | | 11.000 | % | | | | | | | 2,635,000 | | | | 2,921,556 | | |
Fresenius Medical Care U.S. Finance II, Inc.(b)
07/31/19 | | | 5.625 | % | | | | | | | 813,000 | | | | 870,926 | | |
01/31/22 | | | 5.875 | % | | | | | | | 1,960,000 | | | | 2,136,400 | | |
10/15/24 | | | 4.750 | % | | | | | | | 385,000 | | | | 386,203 | | |
Fresenius Medical Care U.S. Finance, Inc.(b)
09/15/18 | | | 6.500 | % | | | | | | | 332,000 | | | | 367,690 | | |
HCA Holdings, Inc.
Senior Unsecured
02/15/21 | | | 6.250 | % | | | | | | | 408,000 | | | | 439,110 | | |
HCA, Inc.
02/15/22 | | | 7.500 | % | | | | | | | 3,328,000 | | | | 3,864,640 | | |
Senior Secured
03/15/19 | | | 3.750 | % | | | | | | | 1,016,000 | | | | 1,018,540 | | |
02/15/20 | | | 6.500 | % | | | | | | | 3,788,000 | | | | 4,228,355 | | |
04/15/25 | | | 5.250 | % | | | | | | | 2,457,000 | | | | 2,546,066 | | |
IMS Health, Inc.
Senior Unsecured(b)
11/01/20 | | | 6.000 | % | | | | | | | 1,511,000 | | | | 1,567,663 | | |
Kinetic Concepts, Inc./KCI U.S.A., Inc.
Secured
11/01/18 | | | 10.500 | % | | | | | | | 1,262,000 | | | | 1,388,200 | | |
Corporate Bonds & Notes(a) (continued)
Issuer | | Coupon
Rate | | Principal
Amount ($) | | Value ($) | |
LifePoint Hospitals, Inc.
12/01/21 | | | 5.500 | % | | | | | | | 2,289,000 | | | | 2,397,728 | | |
MPH Acquisition Holdings LLC(b)
04/01/22 | | | 6.625 | % | | | | | | | 2,083,000 | | | | 2,181,943 | | |
Physio-Control International, Inc.
Senior Secured(b)
01/15/19 | | | 9.875 | % | | | | | | | 2,011,000 | | | | 2,166,853 | | |
STHI Holding Corp.
Secured(b)
03/15/18 | | | 8.000 | % | | | | | | | 891,000 | | | | 935,550 | | |
Teleflex, Inc.(b)
06/15/24 | | | 5.250 | % | | | | | | | 163,000 | | | | 165,445 | | |
Tenet Healthcare Corp.
Senior Secured
10/01/20 | | | 6.000 | % | | | | | | | 1,506,000 | | | | 1,618,950 | | |
04/01/21 | | | 4.500 | % | | | | | | | 2,605,000 | | | | 2,611,512 | | |
Senior Unsecured
04/01/22 | | | 8.125 | % | | | | | | | 5,225,000 | | | | 5,989,156 | | |
Tenet Healthcare Corp.(b)
Senior Unsecured
03/01/19 | | | 5.000 | % | | | | | | | 413,000 | | | | 413,516 | | |
Universal Health Services, Inc.
Senior Secured(b)
08/01/22 | | | 4.750 | % | | | | | | | 2,839,000 | | | | 2,890,457 | | |
Total | | | | | | | | | 62,151,646 | | |
Healthcare Insurance —% | |
Centene Corp.
Senior Unsecured
05/15/22 | | | 4.750 | % | | | | | | | 983,000 | | | | 994,059 | | |
Home Construction 0.4% | |
Brookfield Residential Properties, Inc./U.S. Corp.(b)
07/01/22 | | | 6.125 | % | | | | | | | 894,000 | | | | 949,875 | | |
Meritage Homes Corp.
03/01/18 | | | 4.500 | % | | | | | | | 1,527,000 | | | | 1,557,540 | | |
04/15/20 | | | 7.150 | % | | | | | | | 588,000 | | | | 646,800 | | |
04/01/22 | | | 7.000 | % | | | | | | | 1,368,000 | | | | 1,484,280 | | |
Shea Homes LP/Funding Corp.
Senior Secured
05/15/19 | | | 8.625 | % | | | | | | | 1,535,000 | | | | 1,634,775 | | |
TRI Pointe Holdings, Inc.
Senior Unsecured(b)
06/15/19 | | | 4.375 | % | | | | | | | 786,000 | | | | 782,070 | | |
Taylor Morrison Communities, Inc./Monarch, Inc.(b)
04/15/20 | | | 7.750 | % | | | | | | | 1,529,000 | | | | 1,639,853 | | |
04/15/20 | | | 7.750 | % | | | | | | | 474,000 | | | | 508,365 | | |
04/15/21 | | | 5.250 | % | | | | | | | 49,000 | | | | 49,349 | | |
Total | | | | | | | | | 9,252,907 | | |
The accompanying Notes to Financial Statements are an integral part of this statement.
Annual Report 2014
12
Columbia Strategic Income Fund
Portfolio of Investments (continued)
October 31, 2014
Corporate Bonds & Notes(a) (continued)
Issuer | | Coupon
Rate | | Principal
Amount ($) | | Value ($) | |
Independent Energy 4.8% | |
Antero Resources Corp.(b)
12/01/22 | | | 5.125 | % | | | | | | | 3,546,000 | | | | 3,546,709 | | |
Antero Resources Finance Corp.
11/01/21 | | | 5.375 | % | | | | | | | 1,300,000 | | | | 1,319,500 | | |
Athlon Holdings LP/Finance Corp.
04/15/21 | | | 7.375 | % | | | | | | | 3,313,000 | | | | 3,627,735 | | |
Athlon Holdings LP/Finance Corp.(b)
05/01/22 | | | 6.000 | % | | | | | | | 1,767,000 | | | | 1,897,316 | | |
Canadian Oil Sands Ltd.(b)
04/01/22 | | | 4.500 | % | | | | | | | 3,810,000 | | | | 4,036,162 | | |
Carrizo Oil & Gas, Inc.
10/15/18 | | | 8.625 | % | | | | | | | 1,747,000 | | | | 1,816,880 | | |
Chesapeake Energy Corp.
08/15/20 | | | 6.625 | % | | | | | | | 4,760,000 | | | | 5,378,800 | | |
02/15/21 | | | 6.125 | % | | | | | | | 3,151,000 | | | | 3,497,610 | | |
03/15/23 | | | 5.750 | % | | | | | | | 3,754,000 | | | | 4,110,630 | | |
Cimarex Energy Co.
05/01/22 | | | 5.875 | % | | | | | | | 1,414,000 | | | | 1,520,050 | | |
06/01/24 | | | 4.375 | % | | | | | | | 518,000 | | | | 526,418 | | |
Comstock Resources, Inc.
06/15/20 | | | 9.500 | % | | | | | | | 4,940,000 | | | | 5,211,700 | | |
Concho Resources, Inc.
01/15/21 | | | 7.000 | % | | | | | | | 3,680,000 | | | | 3,969,800 | | |
01/15/22 | | | 6.500 | % | | | | | | | 1,059,000 | | | | 1,143,720 | | |
04/01/23 | | | 5.500 | % | | | | | | | 3,842,000 | | | | 4,062,915 | | |
Continental Resources, Inc.
09/15/22 | | | 5.000 | % | | | | | | | 5,978,000 | | | | 6,336,680 | | |
EP Energy LLC/Everest Acquisition Finance, Inc.
05/01/20 | | | 9.375 | % | | | | | | | 2,479,000 | | | | 2,714,505 | | |
09/01/22 | | | 7.750 | % | | | | | | | 425,000 | | | | 448,375 | | |
Kodiak Oil & Gas Corp.
01/15/21 | | | 5.500 | % | | | | | | | 5,078,000 | | | | 5,154,170 | | |
02/01/22 | | | 5.500 | % | | | | | | | 6,603,000 | | | | 6,735,060 | | |
Kosmos Energy Ltd.
Senior Secured(b)
08/01/21 | | | 7.875 | % | | | | | | | 1,008,000 | | | | 927,360 | | |
Laredo Petroleum, Inc.
02/15/19 | | | 9.500 | % | | | | | | | 6,085,000 | | | | 6,419,675 | | |
01/15/22 | | | 5.625 | % | | | | | | | 2,276,000 | | | | 2,241,860 | | |
05/01/22 | | | 7.375 | % | | | | | | | 1,529,000 | | | | 1,590,160 | | |
Oasis Petroleum, Inc.
02/01/19 | | | 7.250 | % | | | | | | | 3,349,000 | | | | 3,449,470 | | |
11/01/21 | | | 6.500 | % | | | | | | | 3,320,000 | | | | 3,403,000 | | |
03/15/22 | | | 6.875 | % | | | | | | | 1,759,000 | | | | 1,829,360 | | |
01/15/23 | | | 6.875 | % | | | | | | | 2,463,000 | | | | 2,561,520 | | |
Parsley Energy LLC/Finance Corp.
Senior Unsecured(b)
02/15/22 | | | 7.500 | % | | | | | | | 3,511,000 | | | | 3,440,780 | | |
Corporate Bonds & Notes(a) (continued)
Issuer | | Coupon
Rate | | Principal
Amount ($) | | Value ($) | |
RKI Exploration & Production LLC/Finance Corp.(b)
08/01/21 | | | 8.500 | % | | | | | | | 1,166,000 | | | | 1,139,765 | | |
RSP Permian, Inc.(b)
10/01/22 | | | 6.625 | % | | | | | | | 805,000 | | | | 802,826 | | |
SM Energy Co.
Senior Unsecured
01/01/23 | | | 6.500 | % | | | | | | | 529,000 | | | | 546,193 | | |
01/15/24 | | | 5.000 | % | | | | | | | 1,593,000 | | | | 1,489,455 | | |
Tullow Oil PLC(b)
04/15/22 | | | 6.250 | % | | | | | | | 4,000,000 | | | | 3,720,000 | | |
Whiting Petroleum Corp.
10/01/18 | | | 6.500 | % | | | | | | | 156,000 | | | | 160,680 | | |
03/15/21 | | | 5.750 | % | | | | | | | 2,546,000 | | | | 2,686,030 | | |
Zhaikmunai LLP
11/13/19 | | | 7.125 | % | | | | | | | 2,154,000 | | | | 2,240,160 | | |
Total | | | | | | | | | 105,703,029 | | |
Leisure 0.5% | |
AMC Entertainment, Inc.
12/01/20 | | | 9.750 | % | | | | | | | 1,965,000 | | | | 2,181,150 | | |
Activision Blizzard, Inc.(b)
09/15/21 | | | 5.625 | % | | | | | | | 5,679,000 | | | | 6,041,036 | | |
09/15/23 | | | 6.125 | % | | | | | | | 647,000 | | | | 700,378 | | |
Cedar Fair LP/Canada's Wonderland Co./Magnum
Management Corp.(b)
06/01/24 | | | 5.375 | % | | | | | | | 1,636,000 | | | | 1,636,000 | | |
Six Flags, Inc., Escrow(b)(d)(g)(h)
06/01/44 | | | 0.000 | % | | | | | | | 1,557,000 | | | | — | | |
Total | | | | | | | | | 10,558,564 | | |
Lodging 0.4% | |
Choice Hotels International, Inc.
07/01/22 | | | 5.750 | % | | | | | | | 1,055,000 | | | | 1,136,762 | | |
Hilton Worldwide Finance/Corp.(b)
10/15/21 | | | 5.625 | % | | | | | | | 3,213,000 | | | | 3,385,699 | | |
Playa Resorts Holding BV(b)
08/15/20 | | | 8.000 | % | | | | | | | 3,827,000 | | | | 3,960,945 | | |
Total | | | | | | | | | 8,483,406 | | |
Media and Entertainment 2.8% | |
21st Century Fox America, Inc.(b)
09/15/44 | | | 4.750 | % | | | | | | | 1,610,000 | | | | 1,664,336 | | |
AMC Networks, Inc.
07/15/21 | | | 7.750 | % | | | | | | | 1,476,000 | | | | 1,608,840 | | |
12/15/22 | | | 4.750 | % | | | | | | | 4,568,000 | | | | 4,533,740 | | |
British Sky Broadcasting Group PLC(b)
11/26/22 | | | 3.125 | % | | | | | | | 8,915,000 | | | | 8,749,555 | | |
The accompanying Notes to Financial Statements are an integral part of this statement.
Annual Report 2014
13
Columbia Strategic Income Fund
Portfolio of Investments (continued)
October 31, 2014
Corporate Bonds & Notes(a) (continued)
Issuer | | Coupon
Rate | | Principal
Amount ($) | | Value ($) | |
CBS Outdoor Americas Capital LLC/Corp.(b)
02/15/22 | | | 5.250 | % | | | | | | | 1,931,000 | | | | 1,993,758 | | |
02/15/24 | | | 5.625 | % | | | | | | | 431,000 | | | | 449,318 | | |
03/15/25 | | | 5.875 | % | | | | | | | 2,195,000 | | | | 2,304,750 | | |
Clear Channel Worldwide Holdings, Inc.
03/15/20 | | | 7.625 | % | | | | | | | 3,128,000 | | | | 3,327,410 | | |
Senior Unsecured
11/15/22 | | | 6.500 | % | | | | | | | 4,779,000 | | | | 4,946,265 | | |
Gannett Co., Inc.
10/15/19 | | | 5.125 | % | | | | | | | 755,000 | | | | 785,200 | | |
10/15/23 | | | 6.375 | % | | | | | | | 377,000 | | | | 405,275 | | |
Gannett Co., Inc.(b)
09/15/21 | | | 4.875 | % | | | | | | | 655,000 | | | | 659,913 | | |
09/15/24 | | | 5.500 | % | | | | | | | 574,000 | | | | 592,655 | | |
Lamar Media Corp.
05/01/23 | | | 5.000 | % | | | | | | | 1,308,000 | | | | 1,308,164 | | |
01/15/24 | | | 5.375 | % | | | | | | | 828,000 | | | | 856,980 | | |
MDC Partners, Inc.(b)
04/01/20 | | | 6.750 | % | | | | | | | 3,471,000 | | | | 3,601,162 | | |
Netflix, Inc.
Senior Unsecured(b)
03/01/24 | | | 5.750 | % | | | | | | | 695,000 | | | | 728,013 | | |
Nielsen Finance Co. SARL (The)(b)
10/01/21 | | | 5.500 | % | | | | | | | 2,784,000 | | | | 2,881,440 | | |
Nielsen Finance LLC/Co.
10/01/20 | | | 4.500 | % | | | | | | | 1,019,000 | | | | 1,019,204 | | |
Nielsen Finance LLC/Co.(b)
04/15/22 | | | 5.000 | % | | | | | | | 922,000 | | | | 935,830 | | |
Sinclair Television Group, Inc.(b)
08/01/24 | | | 5.625 | % | | | | | | | 2,215,000 | | | | 2,187,312 | | |
Starz LLC/Finance Corp.
09/15/19 | | | 5.000 | % | | | | | | | 404,000 | | | | 416,120 | | |
Thomson Reuters Corp.
Senior Unsecured
05/23/43 | | | 4.500 | % | | | | | | | 975,000 | | | | 935,557 | | |
Univision Communications, Inc.(b)
05/15/21 | | | 8.500 | % | | | | | | | 2,106,000 | | | | 2,277,112 | | |
Senior Secured
11/01/20 | | | 7.875 | % | | | | | | | 1,991,000 | | | | 2,150,280 | | |
09/15/22 | | | 6.750 | % | | | | | | | 870,000 | | | | 965,700 | | |
05/15/23 | | | 5.125 | % | | | | | | | 5,009,000 | | | | 5,284,495 | | |
iHeartCommunications, Inc. PIK
02/01/21 | | | 14.000 | % | | | | | | | 2,257,360 | | | | 1,963,903 | | |
iHeartCommunications, Inc.
Senior Secured
03/01/21 | | | 9.000 | % | | | | | | | 2,782,000 | | | | 2,782,000 | | |
Total | | | | | | | | | 62,314,287 | | |
Corporate Bonds & Notes(a) (continued)
Issuer | | Coupon
Rate | | Principal
Amount ($) | | Value ($) | |
Metals 0.9% | |
ArcelorMittal
Senior Unsecured
03/01/21 | | | 6.000 | % | | | | | | | 1,301,000 | | | | 1,395,322 | | |
02/25/22 | | | 6.750 | % | | | | | | | 4,919,000 | | | | 5,460,090 | | |
Calcipar SA
Senior Secured(b)
05/01/18 | | | 6.875 | % | | | | | | | 3,797,000 | | | | 3,929,895 | | |
Constellium NV(b)
05/15/24 | | | 5.750 | % | | | | | | | 688,000 | | | | 681,120 | | |
Peabody Energy Corp.
11/15/21 | | | 6.250 | % | | | | | | | 1,340,000 | | | | 1,268,813 | | |
Samarco Mineracao SA(b)
Senior Unsecured
11/01/22 | | | 4.125 | % | | | | | | | 2,250,000 | | | | 2,144,542 | | |
10/24/23 | | | 5.750 | % | | | | | | | 3,900,000 | | | | 4,046,250 | | |
Total | | | | | | | | | 18,926,032 | | |
Midstream 2.5% | |
Access Midstream Partners LP/Finance Corp.
05/15/23 | | | 4.875 | % | | | | | | | 3,724,000 | | | | 3,891,580 | | |
03/15/24 | | | 4.875 | % | | | | | | | 76,000 | | | | 79,420 | | |
Crestwood Midstream Partners LP/Finance Corp.
03/01/22 | | | 6.125 | % | | | | | | | 987,000 | | | | 996,870 | | |
Hiland Partners LP/Finance Corp.(b)
10/01/20 | | | 7.250 | % | | | | | | | 6,962,000 | | | | 7,362,315 | | |
05/15/22 | | | 5.500 | % | | | | | | | 2,056,000 | | | | 2,025,160 | | |
Kinder Morgan Energy Partners LP
Senior Unsecured
02/15/23 | | | 3.450 | % | | | | | | | 1,623,000 | | | | 1,559,453 | | |
Kinder Morgan, Inc.
Senior Unsecured
09/15/20 | | | 6.500 | % | | | | | | | 6,549,000 | | | | 7,501,541 | | |
MarkWest Energy Partners LP/Finance Corp.
06/15/22 | | | 6.250 | % | | | | | | | 2,942,000 | | | | 3,170,005 | | |
02/15/23 | | | 5.500 | % | | | | | | | 2,894,000 | | | | 3,082,110 | | |
07/15/23 | | | 4.500 | % | | | | | | | 3,707,000 | | | | 3,799,675 | | |
NiSource Finance Corp.
02/15/44 | | | 4.800 | % | | | | | | | 1,000,000 | | | | 1,056,348 | | |
Northwest Pipeline LLC
Senior Unsecured
04/15/17 | | | 5.950 | % | | | | | | | 500,000 | | | | 551,887 | | |
Regency Energy Partners LP/Finance Corp.
09/01/20 | | | 5.750 | % | | | | | | | 1,682,000 | | | | 1,787,125 | | |
07/15/21 | | | 6.500 | % | | | | | | | 3,807,000 | | | | 4,044,937 | | |
10/01/22 | | | 5.000 | % | | | | | | | 1,581,000 | | | | 1,612,620 | | |
Sabine Pass Liquefaction LLC
Senior Secured
02/01/21 | | | 5.625 | % | | | | | | | 863,000 | | | | 903,993 | | |
The accompanying Notes to Financial Statements are an integral part of this statement.
Annual Report 2014
14
Columbia Strategic Income Fund
Portfolio of Investments (continued)
October 31, 2014
Corporate Bonds & Notes(a) (continued)
Issuer | | Coupon
Rate | | Principal
Amount ($) | | Value ($) | |
Sabine Pass Liquefaction LLC(b)
Senior Secured
03/15/22 | | | 6.250 | % | | | | | | | 781,000 | | | | 839,575 | | |
Southern Natural Gas Co. LLC
Senior Unsecured(b)
04/01/17 | | | 5.900 | % | | | | | | | 2,315,000 | | | | 2,537,136 | | |
Targa Resources Partners LP/Finance Corp.
05/01/23 | | | 5.250 | % | | | | | | | 103,000 | | | | 108,150 | | |
11/15/23 | | | 4.250 | % | | | | | | | 1,018,000 | | | | 1,007,820 | | |
Targa Resources Partners LP/Finance Corp.(b)
11/15/19 | | | 4.125 | % | | | | | | | 983,000 | | | | 997,745 | | |
Tesoro Logistics LP/Finance Corp.(b)
Senior Unsecured
10/15/19 | | | 5.500 | % | | | | | | | 512,000 | | | | 526,080 | | |
10/15/22 | | | 6.250 | % | | | | | | | 1,509,000 | | | | 1,561,815 | | |
TransCanada PipeLines Ltd.
Senior Unsecured
10/16/43 | | | 5.000 | % | | | | | | | 720,000 | | | | 770,565 | | |
Transcontinental Gas Pipe Line Co. LLC
Senior Unsecured
08/01/42 | | | 4.450 | % | | | | | | | 2,275,000 | | | | 2,205,917 | | |
Total | | | | | | | | | 53,979,842 | | |
Natural Gas 0.1% | |
Sempra Energy
Senior Unsecured
12/01/23 | | | 4.050 | % | | | | | | | 2,745,000 | | | | 2,915,201 | | |
Oil Field Services 0.1% | |
Noble Holding International Ltd.
03/15/42 | | | 5.250 | % | | | | | | | 2,245,000 | | | | 1,962,765 | | |
Other Financial Institutions 0.2% | |
FTI Consulting, Inc.
11/15/22 | | | 6.000 | % | | | | | | | 859,000 | | | | 879,401 | | |
Icahn Enterprises LP/Finance Corp.
08/01/20 | | | 6.000 | % | | | | | | | 1,207,000 | | | | 1,267,350 | | |
02/01/22 | | | 5.875 | % | | | | | | | 1,476,000 | | | | 1,516,590 | | |
Total | | | | | | | | | 3,663,341 | | |
Other Industry 0.1% | |
CB Richard Ellis Services, Inc.
03/15/25 | | | 5.250 | % | | | | | | | 2,453,000 | | | | 2,511,259 | | |
Other REIT 0.2% | |
CyrusOne LP/Finance Corp.
11/15/22 | | | 6.375 | % | | | | | | | 2,451,000 | | | | 2,579,678 | | |
DuPont Fabros Technology LP
09/15/21 | | | 5.875 | % | | �� | | | | | 1,028,000 | | | | 1,069,120 | | |
Total | | | | | | | | | 3,648,798 | | |
Corporate Bonds & Notes(a) (continued)
Issuer | | Coupon
Rate | | Principal
Amount ($) | | Value ($) | |
Packaging 0.5% | |
Ardagh Packaging Finance PLC/Holdings USA, Inc.(b)
01/31/21 | | | 6.750 | % | | | | | | | 1,257,000 | | | | 1,285,282 | | |
Beverage Packaging Holdings (Luxembourg) II SA(b)
12/15/16 | | | 5.625 | % | | | | | | | 689,000 | | | | 690,723 | | |
06/15/17 | | | 6.000 | % | | | | | | | 409,000 | | | | 407,978 | | |
Reynolds Group Issuer, Inc./LLC
08/15/19 | | | 9.875 | % | | | | | | | 4,344,000 | | | | 4,718,670 | | |
02/15/21 | | | 8.250 | % | | | | | | | 300,000 | | | | 322,500 | | |
Signode Industrial Group Luxembourg SA/US, Inc.
Senior Unsecured(b)
05/01/22 | | | 6.375 | % | | | | | | | 2,768,000 | | | | 2,684,960 | | |
Total | | | | | | | | | 10,110,113 | | |
Paper 0.1% | |
Inversiones CMPC SA(b)
09/15/24 | | | 4.750 | % | | | | | | | 2,000,000 | | | | 2,007,985 | | |
Pharmaceuticals 0.6% | |
Capsugel SA
Senior Unsecured PIK(b)
05/15/19 | | | 7.000 | % | | | | | | | 613,000 | | | | 623,341 | | |
Grifols Worldwide Operations Ltd.
Senior Unsecured(b)
04/01/22 | | | 5.250 | % | | | | | | | 1,035,000 | | | | 1,060,875 | | |
Jaguar Holding Co. I
Senior Unsecured PIK(b)
10/15/17 | | | 9.375 | % | | | | | | | 1,176,000 | | | | 1,203,930 | | |
Jaguar Holding Co. II/Merger Sub, Inc.
Senior Unsecured(b)
12/01/19 | | | 9.500 | % | | | | | | | 912,000 | | | | 978,120 | | |
Valeant Pharmaceuticals International, Inc.(b)
08/15/18 | | | 6.750 | % | | | | | | | 1,757,000 | | | | 1,869,009 | | |
10/15/20 | | | 6.375 | % | | | | | | | 4,197,000 | | | | 4,307,171 | | |
07/15/21 | | | 7.500 | % | | | | | | | 3,913,000 | | | | 4,186,910 | | |
Total | | | | | | | | | 14,229,356 | | |
Property & Casualty 1.0% | |
HUB International Ltd.
Senior Unsecured(b)
10/01/21 | | | 7.875 | % | | | | | | | 5,092,000 | | | | 5,308,410 | | |
Hub Holdings LLC/Finance, Inc.
Senior Unsecured PIK(b)
07/15/19 | | | 8.125 | % | | | | | | | 480,000 | | | | 476,400 | | |
Liberty Mutual Group, Inc.(b)
05/01/22 | | | 4.950 | % | | | | | | | 8,205,000 | | | | 8,892,858 | | |
06/15/23 | | | 4.250 | % | | | | | | | 5,935,000 | | | | 6,138,238 | | |
Total | | | | | | | | | 20,815,906 | | |
The accompanying Notes to Financial Statements are an integral part of this statement.
Annual Report 2014
15
Columbia Strategic Income Fund
Portfolio of Investments (continued)
October 31, 2014
Corporate Bonds & Notes(a) (continued)
Issuer | | Coupon
Rate | | Principal
Amount ($) | | Value ($) | |
Railroads 0.2% | |
Florida East Coast Holdings Corp.(b)
05/01/20 | | | 9.750 | % | | | | | | | 1,810,000 | | | | 1,843,938 | | |
Senior Secured
05/01/19 | | | 6.750 | % | | | | | | | 1,866,000 | | | | 1,925,488 | | |
Panama Canal Railway Co.
Senior Secured
11/01/26 | | | 7.000 | % | | | | | | | 545,670 | | | | 540,213 | | |
Total | | | | | | | | | 4,309,639 | | |
Restaurants 0.6% | |
BC ULC/New Red Finance Inc.
Secured(b)
04/01/22 | | | 6.000 | % | | | | | | | 3,696,000 | | | | 3,746,820 | | |
Yum! Brands, Inc.
Senior Unsecured
11/01/20 | | | 3.875 | % | | | | | | | 1,800,000 | | | | 1,869,693 | | |
11/01/21 | | | 3.750 | % | | | | | | | 3,050,000 | | | | 3,141,726 | | |
11/01/23 | | | 3.875 | % | | | | | | | 4,440,000 | | | | 4,454,874 | | |
Total | | | | | | | | | 13,213,113 | | |
Retailers 0.3% | |
GameStop Corp.(b)
10/01/19 | | | 5.500 | % | | | | | | | 1,683,000 | | | | 1,695,623 | | |
Group 1 Automotive, Inc.(b)
06/01/22 | | | 5.000 | % | | | | | | | 828,000 | | | | 819,720 | | |
J. Crew Group, Inc.
Senior Unsecured PIK(b)
05/01/19 | | | 7.750 | % | | | | | | | 400,000 | | | | 384,000 | | |
Rite Aid Corp.
06/15/21 | | | 6.750 | % | | | | | | | 2,455,000 | | | | 2,620,712 | | |
Senior Unsecured
02/15/27 | | | 7.700 | % | | | | | | | 919,000 | | | | 1,020,090 | | |
Total | | | | | | | | | 6,540,145 | | |
Technology 1.8% | |
Alliance Data Systems Corp.(b)
12/01/17 | | | 5.250 | % | | | | | | | 2,329,000 | | | | 2,398,870 | | |
04/01/20 | | | 6.375 | % | | | | | | | 1,321,000 | | | | 1,380,445 | | |
08/01/22 | | | 5.375 | % | | | | | | | 3,467,000 | | | | 3,519,005 | | |
Ancestry.com, Inc.
12/15/20 | | | 11.000 | % | | | | | | | 324,000 | | | | 366,930 | | |
Ancestry.com, Inc.(b)
Senior Unsecured PIK
10/15/18 | | | 9.625 | % | | | | | | | 993,000 | | | | 993,000 | | |
Audatex North America, Inc.(b)
06/15/21 | | | 6.000 | % | | | | | | | 956,000 | | | | 1,010,970 | | |
CDW LLC/Finance Corp.
08/15/22 | | | 6.000 | % | | | | | | | 2,407,000 | | | | 2,539,385 | | |
Corporate Bonds & Notes(a) (continued)
Issuer | | Coupon
Rate | | Principal
Amount ($) | | Value ($) | |
Ceridian LLC/Comdata, Inc.(b)
11/15/17 | | | 8.125 | % | | | | | | | 1,115,000 | | | | 1,115,000 | | |
Equinix, Inc.
Senior Unsecured
04/01/20 | | | 4.875 | % | | | | | | | 1,054,000 | | | | 1,077,715 | | |
07/15/21 | | | 7.000 | % | | | | | | | 1,055,000 | | | | 1,147,313 | | |
04/01/23 | | | 5.375 | % | | | | | | | 580,000 | | | | 598,125 | | |
First Data Corp.
01/15/21 | | | 12.625 | % | | | | | | | 2,859,000 | | | | 3,452,242 | | |
First Data Corp.(b)
Secured
01/15/21 | | | 8.250 | % | | | | | | | 2,163,000 | | | | 2,346,855 | | |
Senior Secured
11/01/20 | | | 6.750 | % | | | | | | | 2,943,000 | | | | 3,163,725 | | |
Goodman Networks, Inc.
Senior Secured
07/01/18 | | | 12.125 | % | | | | | | | 1,780,000 | | | | 1,904,600 | | |
Iron Mountain, Inc.
08/15/23 | | | 6.000 | % | | | | | | | 1,084,000 | | | | 1,143,620 | | |
NCR Corp.
12/15/21 | | | 5.875 | % | | | | | | | 572,000 | | | | 586,300 | | |
Nuance Communications, Inc.(b)
08/15/20 | | | 5.375 | % | | | | | | | 4,623,000 | | | | 4,646,115 | | |
Qualitytech LP/Finance Corp.(b)
08/01/22 | | | 5.875 | % | | | | | | | 1,213,000 | | | | 1,225,130 | | |
Sensata Technologies BV(b)
11/01/24 | | | 5.625 | % | | | | | | | 626,000 | | | | 660,821 | | |
VeriSign, Inc.
Senior Unsecured
05/01/23 | | | 4.625 | % | | | | | | | 1,734,000 | | | | 1,727,498 | | |
Zebra Technologies Corp.
Senior Unsecured(b)
10/15/22 | | | 7.250 | % | | | | | | | 2,341,000 | | | | 2,463,902 | | |
Total | | | | | | | | | 39,467,566 | | |
Transportation Services 0.4% | |
Avis Budget Car Rental LLC/Finance, Inc.
03/15/20 | | | 9.750 | % | | | | | | | 1,330,000 | | | | 1,466,325 | | |
Concesionaria Mexiquense SA de CV
(linked to Mexican Unidad de Inversion Index)(b)
12/15/35 | | | 5.950 | % | | MXN | | | | | 31,201,818 | | | | 2,334,416 | | |
ERAC U.S.A. Finance LLC(b)
10/01/20 | | | 5.250 | % | | | | | | | 1,150,000 | | | | 1,296,994 | | |
03/15/42 | | | 5.625 | % | | | | | | | 415,000 | | | | 472,310 | | |
Hertz Corp. (The)
04/15/19 | | | 6.750 | % | | | | | | | 1,200,000 | | | | 1,251,000 | | |
10/15/22 | | | 6.250 | % | | | | | | | 1,271,000 | | | | 1,296,420 | | |
Total | | | | | | | | | 8,117,465 | | |
The accompanying Notes to Financial Statements are an integral part of this statement.
Annual Report 2014
16
Columbia Strategic Income Fund
Portfolio of Investments (continued)
October 31, 2014
Corporate Bonds & Notes(a) (continued)
Issuer | | Coupon
Rate | | Principal
Amount ($) | | Value ($) | |
Treasury 0.4% | |
Bank Of Korea
08/09/15 | | | 2.370 | % | | KRW | | | | | 9,200,000,000 | | | | 8,627,590 | | |
Wireless 2.6% | |
Altice SA
Senior Secured(b)
05/15/22 | | | 7.750 | % | | | | | | | 2,416,000 | | | | 2,536,800 | | |
Crown Castle International Corp.
Senior Unsecured
04/15/22 | | | 4.875 | % | | | | | | | 3,246,000 | | | | 3,278,460 | | |
01/15/23 | | | 5.250 | % | | | | | | | 3,958,000 | | | | 4,052,002 | | |
ENTEL Chile SA
Senior Unsecured(b)
08/01/26 | | | 4.750 | % | | | | | | | 1,400,000 | | | | 1,417,724 | | |
SBA Communications Corp.
Senior Unsecured(b)
07/15/22 | | | 4.875 | % | | | | | | | 2,142,000 | | | | 2,109,602 | | |
SBA Telecommunications, Inc.
07/15/20 | | | 5.750 | % | | | | | | | 4,581,000 | | | | 4,787,145 | | |
Sprint Communications, Inc.(b)
11/15/18 | | | 9.000 | % | | | | | | | 4,328,000 | | | | 5,079,990 | | |
03/01/20 | | | 7.000 | % | | | | | | | 4,701,000 | | | | 5,243,965 | | |
Sprint Corp.(b)
09/15/21 | | | 7.250 | % | | | | | | | 2,884,000 | | | | 3,049,830 | | |
09/15/23 | | | 7.875 | % | | | | | | | 3,879,000 | | | | 4,199,017 | | |
T-Mobile USA, Inc.
01/15/22 | | | 6.125 | % | | | | | | | 1,189,000 | | | | 1,232,101 | | |
04/28/22 | | | 6.731 | % | | | | | | | 2,065,000 | | | | 2,183,738 | | |
03/01/23 | | | 6.000 | % | | | | | | | 1,693,000 | | | | 1,743,790 | | |
04/01/23 | | | 6.625 | % | | | | | | | 2,318,000 | | | | 2,445,490 | | |
01/15/24 | | | 6.500 | % | | | | | | | 1,189,000 | | | | 1,245,478 | | |
03/01/25 | | | 6.375 | % | | | | | | | 423,000 | | | | 434,633 | | |
VimpelCom Holdings BV(b)
02/13/18 | | | 9.000 | % | | RUB | | | | | 71,400,000 | | | | 1,526,836 | | |
03/01/22 | | | 7.504 | % | | | | | | | 1,000,000 | | | | 997,500 | | |
Wind Acquisition Finance SA(b)
04/23/21 | | | 7.375 | % | | | | | | | 1,843,000 | | | | 1,801,533 | | |
Senior Secured
04/30/20 | | | 6.500 | % | | | | | | | 3,617,000 | | | | 3,761,680 | | |
07/15/20 | | | 4.750 | % | | | | | | | 3,393,000 | | | | 3,316,657 | | |
Total | | | | | | | | | 56,443,971 | | |
Wirelines 1.6% | |
CenturyLink, Inc.
Senior Unsecured
06/15/21 | | | 6.450 | % | | | | | | | 5,005,000 | | | | 5,480,475 | | |
12/01/23 | | | 6.750 | % | | | | | | | 1,695,000 | | | | 1,881,450 | | |
Corporate Bonds & Notes(a) (continued)
Issuer | | Coupon
Rate | | Principal
Amount ($) | | Value ($) | |
EarthLink Holdings Corp.
Senior Secured
06/01/20 | | | 7.375 | % | | | | | | | 2,157,000 | | | | 2,200,140 | | |
Frontier Communications Corp.
Senior Unsecured
07/01/21 | | | 9.250 | % | | | | | | | 2,622,000 | | | | 3,126,735 | | |
09/15/21 | | | 6.250 | % | | | | | | | 180,000 | | | | 185,963 | | |
04/15/22 | | | 8.750 | % | | | | | | | 953,000 | | | | 1,100,715 | | |
04/15/24 | | | 7.625 | % | | | | | | | 978,000 | | | | 1,051,350 | | |
01/15/25 | | | 6.875 | % | | | | | | | 2,042,000 | | | | 2,067,525 | | |
Level 3 Escrow II, Inc.(b)
08/15/22 | | | 5.375 | % | | | | | | | 2,452,000 | | | | 2,488,780 | | |
Level 3 Financing, Inc.
06/01/20 | | | 7.000 | % | | | | | | | 1,828,000 | | | | 1,955,960 | | |
Level 3 Financing, Inc.(b)
01/15/21 | | | 6.125 | % | | | | | | | 1,312,000 | | | | 1,375,960 | | |
Level 3 Financing, Inc.(b)(c)
01/15/18 | | | 3.823 | % | | | | | | | 474,000 | | | | 475,185 | | |
Ooredoo International Finance Ltd.(b)
06/10/19 | | | 7.875 | % | | | | | | | 600,000 | | | | 739,084 | | |
Telecom Italia Capital SA
06/18/19 | | | 7.175 | % | | | | | | | 1,566,000 | | | | 1,785,240 | | |
Telecom Italia SpA
Senior Unsecured(b)
05/30/24 | | | 5.303 | % | | | | | | | 1,897,000 | | | | 1,915,026 | | |
Verizon Communications, Inc.
Senior Unsecured
11/01/42 | | | 3.850 | % | | | | | | | 2,755,000 | | | | 2,427,611 | | |
Windstream Corp.
09/01/18 | | | 8.125 | % | | | | | | | 1,485,000 | | | | 1,548,112 | | |
10/15/20 | | | 7.750 | % | | | | | | | 2,188,000 | | | | 2,330,220 | | |
Zayo Group LLC/Capital, Inc.
07/01/20 | | | 10.125 | % | | | | | | | 1,262,000 | | | | 1,400,820 | | |
Total | | | | | | | | | 35,536,351 | | |
Total Corporate Bonds & Notes
(Cost: $889,022,946) | | | | | | | | | 916,435,381 | | |
Residential Mortgage-Backed Securities — Agency 4.4% | |
Federal Home Loan Mortgage Corp.(c)(i)(j)
CMO IO Series 2957 Class SW
04/15/35 | | | 5.847 | % | | | | | | | 5,610,138 | | | | 1,038,658 | | |
CMO IO Series 311 Class S1 | |
08/15/43 | | | 5.797 | % | | | | | | | 11,758,182 | | | | 2,642,829 | | |
CMO IO Series 318 Class S1 | |
11/15/43 | | | 5.797 | % | | | | | | | 11,705,512 | | | | 2,653,917 | | |
CMO IO Series 3761 Class KS
06/15/40 | | | 5.847 | % | | | | | | | 7,840,229 | | | | 1,059,242 | | |
The accompanying Notes to Financial Statements are an integral part of this statement.
Annual Report 2014
17
Columbia Strategic Income Fund
Portfolio of Investments (continued)
October 31, 2014
Residential Mortgage-Backed Securities — Agency (continued)
Issuer | | Coupon
Rate | | Principal
Amount ($) | | Value ($) | |
CMO IO Series 4174 Class SB
05/15/39 | | | 6.047 | % | | | | | | | 20,689,036 | | | | 3,913,787 | | |
Federal Home Loan Mortgage Corp.(i)
01/01/20 | | | 10.500 | % | | | | | | | 2,773 | | | | 2,789 | | |
Federal Home Loan Mortgage Corp.(i)(j)
CMO IO Series 304 Class C69 | |
12/15/42 | | | 4.000 | % | | | | | | | 17,868,083 | | | | 4,271,847 | | |
CMO IO Series 4098 Class AI
05/15/39 | | | 3.500 | % | | | | | | | 16,812,669 | | | | 2,922,442 | | |
CMO IO Series 4120 Class AI
11/15/39 | | | 3.500 | % | | | | | | | 15,523,844 | | | | 1,929,926 | | |
CMO IO Series 4121 Class IA
01/15/41 | | | 3.500 | % | | | | | | | 14,081,069 | | | | 2,905,815 | | |
CMO IO Series 4121 Class MI
10/15/42 | | | 4.000 | % | | | | | | | 11,472,463 | | | | 2,877,040 | | |
CMO IO Series 4147 Class CI
01/15/41 | | | 3.500 | % | | | | | | | 19,765,731 | | | | 3,661,104 | | |
CMO IO Series 4213 Class DI
06/15/38 | | | 3.500 | % | | | | | | | 26,353,366 | | | | 4,044,093 | | |
Federal National Mortgage Association(c)(i)(j)
CMO IO Series 2006-5 Class N1
08/25/34 | | | 1.906 | % | | | | | | | 22,244,599 | | | | 945,195 | | |
CMO IO Series 2006-5 Class N2 | |
02/25/35 | | | 1.952 | % | | | | | | | 31,248,891 | | | | 1,895,095 | | |
CMO IO Series 2010-135 Class MS
12/25/40 | | | 5.798 | % | | | | | | | 5,073,392 | | | | 861,527 | | |
CMO IO Series 2013-124 Class SB
12/25/43 | | | 5.798 | % | | | | | | | 19,262,411 | | | | 4,617,508 | | |
Federal National Mortgage Association(e)(i)
11/18/29 | | | 3.000 | % | | | | | | | 19,000,000 | | | | 19,705,079 | | |
Federal National Mortgage Association(i)
12/01/20 | | | 4.500 | % | | | | | | | 85,866 | | | | 91,080 | | |
02/01/35 | | | 5.500 | % | | | | | | | 143,447 | | | | 161,269 | | |
05/01/41 | | | 4.000 | % | | | | | | | 8,828,891 | | | | 9,379,662 | | |
Federal National Mortgage Association(i)(j)
CMO IO STRIPS Series 417 Class C5
02/25/43 | | | 3.500 | % | | | | | | | 13,580,605 | | | | 2,934,401 | | |
CMO IO Series 2012-118 Class BI
12/25/39 | | | 3.500 | % | | | | | | | 24,927,164 | | | | 4,154,790 | | |
CMO IO Series 2012-121 Class GI
08/25/39 | | | 3.500 | % | | | | | | | 18,677,921 | | | | 2,494,810 | | |
CMO IO Series 2012-129 Class IC
01/25/41 | | | 3.500 | % | | | | | | | 14,358,674 | | | | 2,025,460 | | |
CMO IO Series 2012-131 Class MI
01/25/40 | | | 3.500 | % | | | | | | | 21,169,090 | | | | 3,271,039 | | |
CMO IO Series 2012-133 Class EI
07/25/31 | | | 3.500 | % | | | | | | | 9,460,387 | | | | 1,389,348 | | |
CMO IO Series 2012-139 Class IL
04/25/40 | | | 3.500 | % | | | | | | | 12,779,799 | | | | 1,851,036 | | |
CMO IO Series 2012-96 Class CI
04/25/39 | | | 3.500 | % | | | | | | | 21,001,098 | | | | 2,847,203 | | |
Residential Mortgage-Backed Securities — Agency (continued)
Issuer | | Coupon
Rate | | Principal
Amount ($) | | Value ($) | |
CMO IO Series 2013-1 Class AI
02/25/43 | | | 3.500 | % | | | | | | | 8,326,835 | | | | 1,530,342 | | |
CMO IO Series 2013-6 Class MI
02/25/40 | | | 3.500 | % | | | | | | | 14,773,578 | | | | 1,919,128 | | |
Total Residential Mortgage-Backed
Securities — Agency
(Cost: $96,174,654) | | | | | | | | | 95,997,461 | | |
Residential Mortgage-Backed Securities —
Non-Agency 11.1% | |
Apollo Residential Mortgage Securitization Trust
CMO Series 2013-1 Class A(b)(i)
05/25/47 | | | 4.000 | % | | | | | | | 6,681,070 | | | | 6,891,670 | | |
BCAP LLC Trust(b)(c)(i)
CMO Series 2010-RR11 Class 5A2
03/27/37 | | | 4.824 | % | | | | | | | 5,634,078 | | | | 5,706,493 | | |
CMO Series 2010-RR7 Class 17A7
03/26/36 | | | 5.017 | % | | | | | | | 1,769,159 | | | | 1,666,979 | | |
CMO Series 2013-RR3 Class 6A5
03/26/36 | | | 2.466 | % | | | | | | | 5,158,206 | | | | 5,046,052 | | |
CMO Series 2013-RR5 Class 4A1
09/26/36 | | | 3.000 | % | | | | | | | 4,579,145 | | | | 4,551,082 | | |
Series 2013-RR1 Class 10A1
10/26/36 | | | 3.000 | % | | | | | | | 3,299,415 | | | | 3,319,043 | | |
BCAP LLC Trust(b)(i)
CMO Series 2010-RR7 Class 8A6
05/26/35 | | | 5.500 | % | | | | | | | 545,747 | | | | 544,298 | | |
Bayview Opportunity Master Fund Trust IIB LP
CMO Series 2012-6NPL Class A(b)(c)(i)
01/28/33 | | | 2.981 | % | | | | | | | 2,065,727 | | | | 2,069,858 | | |
CAM Mortgage Trust(b)(c)(i)
CMO Series 2014-1 Class A
12/15/53 | | | 3.352 | % | | | | | | | 258,360 | | | | 258,419 | | |
CMO Series 2014-2 Class A
05/15/48 | | | 2.600 | % | | | | | | | 13,401,957 | | | | 13,400,416 | | |
CSMC Trust
CMO Series 2014-RPL3 Class A1(b)(c)(i)
07/25/54 | | | 3.500 | % | | | | | | | 15,950,029 | | | | 15,812,937 | | |
Citigroup Mortgage Loan Trust, Inc.(b)(c)(i)
CMO Series 2009-4 Class 9A2
03/25/36 | | | 2.615 | % | | | | | | | 3,040,248 | | | | 2,617,891 | | |
CMO Series 2010-2 Class 5A2A
12/25/35 | | | 5.500 | % | | | | | | | 3,871,000 | | | | 3,955,608 | | |
CMO Series 2010-7 Class 3A4
12/25/35 | | | 6.059 | % | | | | | | | 2,185,000 | | | | 2,185,926 | | |
CMO Series 2012-3 Class 2A3
04/25/37 | | | 2.657 | % | | | | | | | 3,707,542 | | | | 3,568,031 | | |
CMO Series 2013-12 Class 2A3
09/25/35 | | | 4.750 | % | | | | | | | 6,002,633 | | | | 5,972,256 | | |
The accompanying Notes to Financial Statements are an integral part of this statement.
Annual Report 2014
18
Columbia Strategic Income Fund
Portfolio of Investments (continued)
October 31, 2014
Residential Mortgage-Backed Securities —
Non-Agency (continued)
Issuer | | Coupon
Rate | | Principal
Amount ($) | | Value ($) | |
Series 2013-11 Class 3A3
09/25/34 | | | 2.403 | % | | | | | | | 5,763,738 | | | | 5,530,377 | | |
Citigroup Mortgage Loan Trust, Inc.(b)(i)
CMO Series 2011-12 Class 3A3
09/25/47 | | | 5.593 | % | | | | | | | 5,500,000 | | | | 5,315,657 | | |
CMO Series 2012-A Class A
06/25/51 | | | 2.500 | % | | | | | | | 5,350,043 | | | | 5,181,157 | | |
Citigroup Mortgage Loan Trust(b)(c)(i)
CMO Series 2010-6 Class 2A2
09/25/35 | | | 2.655 | % | | | | | | | 1,143,314 | | | | 1,065,880 | | |
CMO Series 2010-6 Class 3A2
07/25/36 | | | 2.617 | % | | | | | | | 4,920,000 | | | | 4,729,782 | | |
CMO Series 2013-2 Class 1A1
11/25/37 | | | 3.110 | % | | | | | | | 3,359,628 | | | | 3,397,491 | | |
Credit Suisse Mortgage Capital Certificates(b)(c)(i)
CMO Series 2011-4R Class 4A7
08/27/37 | | | 4.000 | % | | | | | | | 8,522,738 | | | | 8,466,041 | | |
CMO Series 2011-5R Class 3A1
09/27/47 | | | 2.870 | % | | | | | | | 3,523,479 | | | | 3,372,107 | | |
Series 2008-4R Class 3A4
01/26/38 | | | 2.784 | % | | | | | | | 6,187,000 | | | | 5,722,233 | | |
Series 2012-11 Class 3A2
06/29/47 | | | 1.154 | % | | | | | | | 8,599,883 | | | | 8,112,828 | | |
Series 2014-2R Class 18A1
01/27/37 | | | 3.000 | % | | | | | | | 11,058,547 | | | | 10,959,021 | | |
Series 2014-2R Class 19A1
05/27/36 | | | 3.000 | % | | | | | | | 7,955,764 | | | | 7,942,295 | | |
Credit Suisse Mortgage Capital Certificates(b)(i)
CMO Series 2010-9R Class 10A5
04/27/37 | | | 4.000 | % | | | | | | | 3,000,000 | | | | 3,011,196 | | |
CMO Series 2010-9R Class 7A5
05/27/37 | | | 4.000 | % | | | | | | | 4,000,000 | | | | 4,010,364 | | |
Series 2010-9R Class 1A5
08/27/37 | | | 4.000 | % | | | | | | | 9,414,000 | | | | 8,734,074 | | |
Credit Suisse Securities (USA) LLC(b)(c)(i)
02/25/54 | | | 3.060 | % | | | | | | | 21,525,220 | | | | 21,202,341 | | |
Credit Suisse Securities (USA) LLC(b)(i)
CMO Series 2014-5R Class 8A1
11/27/37 | | | 2.625 | % | | | | | | | 8,322,801 | | | | 8,072,450 | | |
CMO Series 2014-RPL1 Class A3
02/25/54 | | | 3.958 | % | | | | | | | 2,250,000 | | | | 2,236,745 | | |
Deutsche Mortgage Securities, Inc. Mortgage Loan Trust
CMO Series 2003-1 Class 1A7(i)
04/25/33 | | | 5.500 | % | | | | | | | 1,333,209 | | | | 1,337,708 | | |
GCAT
Series 2013-RP1 Class A1(b)(c)(i)
06/25/18 | | | 3.500 | % | | | | | | | 9,125,643 | | | | 9,194,792 | | |
GS Mortgage Securities Corp. Resecuritization Trust
CMO Series 2013-1R Class A(b)(c)(i)
11/26/36 | | | 0.312 | % | | | | | | | 8,206,003 | | | | 7,660,300 | | |
Residential Mortgage-Backed Securities —
Non-Agency (continued)
Issuer | | Coupon
Rate | | Principal
Amount ($) | | Value ($) | |
JPMorgan Resecuritization Trust
CMO Series 2010-5 Class 1A6(b)(c)(i)
04/26/37 | | | 4.500 | % | | | | | | | 897,252 | | | | 898,858 | | |
Jefferies Resecuritization Trust
Series 2014-1A1 Class R1(b)(i)
12/27/37 | | | 4.000 | % | | | | | | | 2,837,038 | | | | 2,830,763 | | |
NRPL Trust
Series 2014-1A Class A1(b)(c)(i)
05/01/48 | | | 3.250 | % | | | | | | | 10,273,980 | | | | 10,273,980 | | |
Nomura Resecuritization Trust
CMO Series 2011-2RA Class 2A13(b)(c)(i)
07/26/35 | | | 2.517 | % | | | | | | | 4,923,000 | | | | 4,770,367 | | |
Residential Mortgage Asset Trust
Series 2012-1A Class A1(b)(c)(i)
08/26/52 | | | 2.734 | % | | | | | | | 1,255,093 | | | | 1,260,293 | | |
Springleaf Mortgage Loan Trust
CMO Series 2012-3A Class B1(b)(c)(i)
12/25/59 | | | 6.000 | % | | | | | | | 6,000,000 | | | | 6,227,011 | | |
US Residential Opportunity Fund Trust
Series 2014-1A Class NOTE(b)(c)(i)
03/25/34 | | | 3.466 | % | | | | | | | 3,466,084 | | | | 3,469,730 | | |
Total Residential Mortgage-Backed
Securities — Non-Agency
(Cost: $241,432,087) | | | | | | | | | 242,552,800 | | |
Commercial Mortgage-Backed Securities —
Non-Agency 4.6% | |
American Homes 4 Rent(b)(c)(i)
Series 2014-F Class SFR1
06/17/31 | | | 3.500 | % | | | | | | | 2,000,000 | | | | 1,858,016 | | |
American Homes 4 Rent(b)(i)
Series 2014-SFR2 Class E
10/17/36 | | | 6.231 | % | | | | | | | 4,500,000 | | | | 4,519,612 | | |
BHMS Mortgage Trust
Series 2014-ATLS Class DFX(b)(c)(i)
07/05/33 | | | 4.691 | % | | | | | | | 4,500,000 | | | | 4,515,372 | | |
Banc of America Merrill Lynch Commercial Mortgage
Securities Trust
Series 2013-DSNY Class F(b)(c)(i)
09/15/26 | | | 3.654 | % | | | | | | | 8,054,000 | | | | 8,096,221 | | |
Banc of America Merrill Lynch Re-Remic Trust
Series 2014-FRR7 Class B(c)(i)
10/26/44 | | | 2.402 | % | | | | | | | 3,900,000 | | | | 3,608,303 | | |
Bear Stearns Commercial Mortgage Securities Trust
Series 2005-T18 Class A4(c)(i)
02/13/42 | | | 4.933 | % | | | | | | | 1,303,103 | | | | 1,307,715 | | |
The accompanying Notes to Financial Statements are an integral part of this statement.
Annual Report 2014
19
Columbia Strategic Income Fund
Portfolio of Investments (continued)
October 31, 2014
Commercial Mortgage-Backed Securities —
Non-Agency (continued)
Issuer | | Coupon
Rate | | Principal
Amount ($) | | Value ($) | |
Citigroup/Deutsche Bank Commercial Mortgage Trust
Series 2007-AMFX Class CD4(c)(i)
12/11/49 | | | 5.366 | % | | | | | | | 4,250,000 | | | | 4,445,028 | | |
Commercial Mortgage Trust
Series 2013-RIA4 Class A(b)(c)(i)
11/27/28 | | | 6.000 | % | | | | | | | 6,650,000 | | | | 6,735,732 | | |
GS Mortgage Securities Trust
Series 2007-GG10 Class AM(c)(i)
08/10/45 | | | 5.797 | % | | | | | | | 17,621,500 | | | | 18,128,224 | | |
JPMorgan Chase Commercial Mortgage Securities Trust
Series 2006-LDP9 Class AM(i)
05/15/47 | | | 5.372 | % | | | | | | | 3,100,000 | | | | 3,222,273 | | |
ORES NPL LLC(b)(i)
Series 2013-LV2 Class A
09/25/25 | | | 3.081 | % | | | | | | | 6,421,206 | | | | 6,421,206 | | |
Series 2014-LV3 Class B
03/27/24 | | | 6.000 | % | | | | | | | 6,300,000 | | | | 6,286,505 | | |
Rialto Real Estate Fund LLC
Series 2014-LT6 Class B(b)(i)
09/15/24 | | | 5.486 | % | | | | | | | 6,375,000 | | | | 6,417,661 | | |
Rialto Real Estate Fund LP
Series 2014-LT5 Class A(b)(i)
05/15/24 | | | 2.850 | % | | | | | | | 2,173,726 | | | | 2,173,150 | | |
TIAA Seasoned Commercial Mortgage Trust
Series 2007-C4 Class A3(c)(i)
08/15/39 | | | 5.563 | % | | | | | | | 8,417 | | | | 8,443 | | |
VFC LLC(b)(i)
Series 2014-2 Class A
07/20/30 | | | 2.750 | % | | | | | | | 16,393,938 | | | | 16,394,476 | | |
Series 2014-2 Class B
07/20/30 | | | 5.500 | % | | | | | | | 6,400,000 | | | | 6,396,570 | | |
Total Commercial Mortgage-Backed
Securities — Non-Agency
(Cost: $100,307,543) | | | | | | | | | 100,534,507 | | |
Asset-Backed Securities — Non-Agency 2.3% | |
A Voce CLO Ltd.
Series 2014-1A Class C(b)(c)
07/15/26 | | | 3.734 | % | | | | | | | 7,200,000 | | | | 6,707,153 | | |
American Credit Acceptance Receivables Trust
Series 2012-3 Class A(b)
11/15/16 | | | 1.640 | % | | | | | | | 614,234 | | | | 615,206 | | |
GCAT LLC
Series 2014-2 Class A1(b)(c)
10/25/19 | | | 3.375 | % | | | | | | | 7,427,052 | | | | 7,386,738 | | |
Asset-Backed Securities — Non-Agency (continued)
Issuer | | Coupon
Rate | | Principal
Amount ($) | | Value ($) | |
GMAC Mortgage Home Equity Loan Trust
Series 2004-HE5 Class A5 (FGIC)(c)
09/25/34 | | | 5.865 | % | | | | | | | 1,265,926 | | | | 1,297,358 | | |
New York Mortgage Trust Residential LLC
Series 2013-RP1A Class A(b)(c)(d)
07/25/18 | | | 4.250 | % | | | | | | | 8,199,850 | | | | 8,240,849 | | |
Oak Hill Credit Partners X Ltd.
Series 2014-10A Class C(b)(c)
07/20/26 | | | 3.354 | % | | | | | | | 7,650,000 | | | | 7,601,706 | | |
Selene Non-Performing Loans LLC
Series 2014-1A Class A(b)(c)
05/25/54 | | | 2.981 | % | | | | | | | 6,943,838 | | | | 6,881,531 | | |
Symphony CLO Ltd.
Series 2014-14A Class D2(b)(c)
07/14/26 | | | 3.830 | % | | | | | | | 5,000,000 | | | | 4,726,305 | | |
Truman Capital Mortgage Loan Trust
Series 2014-NPL2 Class A1(b)(c)
06/25/54 | | | 3.125 | % | | | | | | | 1,919,011 | | | | 1,916,604 | | |
Vericrest Opportunity Loan Transferee
CMO Series 2013-NPL4 Class A1(b)(c)
11/25/53 | | | 3.960 | % | | | | | | | 4,019,799 | | | | 4,035,672 | | |
Total Asset-Backed Securities — Non-Agency
(Cost: $49,839,096) | | | | | | | | | 49,409,122 | | |
Inflation-Indexed Bonds(a) 3.1%
Brazil 0.3% | |
Brazil Notas do Tesouro Nacional
08/15/22 | | | 6.000 | % | | BRL | | | | | 698,830 | | | | 2,876,867 | | |
08/15/30 | | | 6.000 | % | | BRL | | | | | 247,812 | | | | 1,010,723 | | |
Series B
08/15/18 | | | 6.000 | % | | BRL | | | | | 743,436 | | | | 3,054,047 | | |
Total | | | | | | | | | 6,941,637 | | |
Italy 0.1% | |
Italy Buoni Poliennali Del Tesoro
09/15/41 | | | 2.550 | % | | EUR | | | | | 1,603,299 | | | | 2,123,510 | | |
United States 2.1% | |
U.S. Treasury Inflation-Indexed Bond
01/15/23 | | | 0.125 | % | | | | | | | 20,166,102 | | | | 19,739,146 | | |
01/15/24 | | | 0.625 | % | | | | | | | 13,269,270 | | | | 13,484,895 | | |
02/15/43 | | | 0.625 | % | | | | | | | 13,947,668 | | | | 12,740,330 | | |
Total | | | | | | | | | 45,964,371 | | |
The accompanying Notes to Financial Statements are an integral part of this statement.
Annual Report 2014
20
Columbia Strategic Income Fund
Portfolio of Investments (continued)
October 31, 2014
Inflation-Indexed Bonds(a) (continued)
Issuer | | Coupon
Rate | | Principal
Amount ($) | | Value ($) | |
Uruguay 0.6% | |
Uruguay Government International Bond
04/05/27 | | | 4.250 | % | | UYU | | | | | 121,339,461 | | | | 5,388,460 | | |
Senior Unsecured
09/14/18 | | | 5.000 | % | | UYU | | | | | 43,140,454 | | | | 1,901,467 | | |
12/15/28 | | | 4.375 | % | | UYU | | | | | 152,181,654 | | | | 6,884,389 | | |
Total | | | | | | | | | 14,174,316 | | |
Total Inflation-Indexed Bonds
(Cost: $72,007,296) | | | | | | | | | 69,203,834 | | |
U.S. Treasury Obligations 0.8% | |
U.S. Treasury
05/15/23 | | | 1.750 | % | | | | | | | 1,040,000 | | | | 1,001,000 | | |
02/15/24 | | | 2.750 | % | | | | | | | 2,021,200 | | | | 2,099,206 | | |
U.S. Treasury(k)
05/15/43 | | | 2.875 | % | | | | | | | 16,070,000 | | | | 15,472,397 | | |
Total U.S. Treasury Obligations
(Cost: $16,557,852) | | | | | | | | | 18,572,603 | | |
Foreign Government Obligations(a)(l) 22.1%
Argentina 0.2% | |
Argentina Bonar Bonds
04/17/17 | | | 7.000 | % | | | | | | | 2,994,419 | | | | 2,657,547 | | |
Provincia de Buenos Aires
Senior Unsecured(b)
01/26/21 | | | 10.875 | % | | | | | | | 240,000 | | | | 218,400 | | |
Provincia de Cordoba
Senior Unsecured(b)
08/17/17 | | | 12.375 | % | | | | | | | 2,346,000 | | | | 2,158,320 | | |
Total | | | | | | | | | 5,034,267 | | |
Australia 0.6% | |
Australia Government Bond
Senior Unsecured
04/21/24 | | | 2.750 | % | | AUD | | | | | 2,600,000 | | | | 2,187,533 | | |
Treasury Corp. of Victoria
Local Government Guaranteed
11/15/16 | | | 5.750 | % | | AUD | | | | | 12,750,000 | | | | 11,891,816 | | |
Total | | | | | | | | | 14,079,349 | | |
Brazil 0.8% | |
Brazilian Government International Bond
08/17/40 | | | 11.000 | % | | | | | | | 2,700,000 | | | | 2,916,000 | | |
Senior Unsecured
01/05/24 | | | 8.500 | % | | BRL | | | | | 6,700,000 | | | | 2,588,987 | | |
01/20/34 | | | 8.250 | % | | | | | | | 3,160,000 | | | | 4,376,600 | | |
Foreign Government Obligations(a)(l) (continued)
Issuer | | Coupon
Rate | | Principal
Amount ($) | | Value ($) | |
Petrobras Global Finance BV
05/20/23 | | | 4.375 | % | | | | | | | 1,000,000 | | | | 953,297 | | |
Petrobras International Finance Co. SA
01/27/21 | | | 5.375 | % | | | | | | | 5,900,000 | | | | 6,031,439 | | |
01/20/40 | | | 6.875 | % | | | | | | | 1,400,000 | | | | 1,468,082 | | |
Total | | | | | | | | | 18,334,405 | | |
Chile 0.2% | |
Chile Government International Bond
Senior Unsecured
08/05/20 | | | 5.500 | % | | CLP | | | | | 1,850,000,000 | | | | 3,368,289 | | |
Empresa Nacional del Petroleo
Senior Unsecured(b)
07/08/19 | | | 6.250 | % | | | | | | | 600,000 | | | | 676,500 | | |
Total | | | | | | | | | 4,044,789 | | |
Colombia 1.3% | |
Bogota Distrito Capital
Senior Unsecured(b)
07/26/28 | | | 9.750 | % | | COP | | | | | 200,000,000 | | | | 117,375 | | |
Colombia Government International Bond
Senior Unsecured
04/14/21 | | | 7.750 | % | | COP | | | | | 9,150,000,000 | | | | 4,839,827 | | |
06/28/27 | | | 9.850 | % | | COP | | | | | 2,520,000,000 | | | | 1,567,360 | | |
01/18/41 | | | 6.125 | % | | | | | | | 4,200,000 | | | | 5,024,617 | | |
Corporación Andina de Fomento
06/15/22 | | | 4.375 | % | | | | | | | 1,150,000 | | | | 1,235,819 | | |
Ecopetrol SA
Senior Unsecured
07/23/19 | | | 7.625 | % | | | | | | | 2,655,000 | | | | 3,166,088 | | |
01/16/25 | | | 4.125 | % | | | | | | | 1,200,000 | | | | 1,170,000 | | |
Emgesa SA ESP
Senior Unsecured
01/25/21 | | | 8.750 | % | | COP | | | | | 1,700,000,000 | | | | 888,272 | | |
Empresa de Energia de Bogota SA ESP
Senior Unsecured(b)
11/10/21 | | | 6.125 | % | | | | | | | 1,112,000 | | | | 1,206,042 | | |
Empresas Publicas de Medellin ESP(b)
Senior Unsecured
07/29/19 | | | 7.625 | % | | | | | | | 100,000 | | | | 119,089 | | |
02/01/21 | | | 8.375 | % | | COP | | | | | 13,266,000,000 | | | | 6,866,727 | | |
09/10/24 | | | 7.625 | % | | COP | | | | | 1,216,000,000 | | | | 591,777 | | |
Transportadora de Gas Internacional SA ESP
Senior Unsecured(b)
03/20/22 | | | 5.700 | % | | | | | | | 1,415,000 | | | | 1,512,817 | | |
Total | | | | | | | | | 28,305,810 | | |
The accompanying Notes to Financial Statements are an integral part of this statement.
Annual Report 2014
21
Columbia Strategic Income Fund
Portfolio of Investments (continued)
October 31, 2014
Foreign Government Obligations(a)(l) (continued)
Issuer | | Coupon
Rate | | Principal
Amount ($) | | Value ($) | |
Croatia 0.2% | |
Croatia Government International Bond
Senior Unsecured(b)
01/26/24 | | | 6.000 | % | | | | | | | 4,100,000 | | | | 4,433,125 | | |
Dominican Republic 1.0% | |
Banco de Reservas de La Republica Dominicana
Subordinated Notes(b)
02/01/23 | | | 7.000 | % | | | | | | | 2,750,000 | | | | 2,777,500 | | |
Dominican Republic International Bond
Senior Unsecured
02/10/23 | | | 14.500 | % | | DOP | | | | | 25,000,000 | | | | 642,727 | | |
Dominican Republic International Bond(b)
Senior Unsecured
05/06/21 | | | 7.500 | % | | | | | | | 3,022,000 | | | | 3,435,972 | | |
04/20/27 | | | 8.625 | % | | | | | | | 2,900,000 | | | | 3,574,250 | | |
04/30/44 | | | 7.450 | % | | | | | | | 3,900,000 | | | | 4,358,250 | | |
Dominican Republic International Bond(b)(d)
07/05/19 | | | 15.000 | % | | DOP | | | | | 116,000,000 | | | | 3,024,226 | | |
01/08/21 | | | 14.000 | % | | DOP | | | | | 79,470,000 | | | | 1,994,480 | | |
Dominican Republic International Bond(d)
02/22/19 | | | 12.000 | % | | DOP | | | | | 42,000,000 | | | | 990,408 | | |
Total | | | | | | | | | 20,797,813 | | |
El Salvador 0.1% | |
El Salvador Government International Bond(b)
Senior Unsecured
04/10/32 | | | 8.250 | % | | | | | | | 400,000 | | | | 466,000 | | |
06/15/35 | | | 7.650 | % | | | | | | | 490,000 | | | | 534,100 | | |
02/01/41 | | | 7.625 | % | | | | | | | 1,500,000 | | | | 1,620,000 | | |
Total | | | | | | | | | 2,620,100 | | |
Georgia 0.2% | |
Georgian Railway JSC
Senior Unsecured(b)
07/11/22 | | | 7.750 | % | | | | | | | 4,839,000 | | | | 5,419,680 | | |
Ghana 0.1% | |
Republic of Ghana(b)
08/07/23 | | | 7.875 | % | | | | | | | 1,200,000 | | | | 1,207,800 | | |
01/18/26 | | | 8.125 | % | | | | | | | 800,000 | | | | 804,000 | | |
Total | | | | | | | | | 2,011,800 | | |
Guatemala 0.4% | |
Guatemala Government Bond(b)
Senior Unsecured
06/06/22 | | | 5.750 | % | | | | | | | 4,500,000 | | | | 4,938,750 | | |
02/13/28 | | | 4.875 | % | | | | | | | 3,852,000 | | | | 3,938,670 | | |
Total | | | | | | | | | 8,877,420 | | |
Foreign Government Obligations(a)(l) (continued)
Issuer | | Coupon
Rate | | Principal
Amount ($) | | Value ($) | |
Hungary 0.8% | |
Hungary Government International Bond
Senior Unsecured
02/19/18 | | | 4.125 | % | | | | | | | 2,000,000 | | | | 2,070,000 | | |
11/22/23 | | | 5.750 | % | | | | | | | 5,382,000 | | | | 5,920,200 | | |
03/25/24 | | | 5.375 | % | | | | | | | 3,850,000 | | | | 4,105,063 | | |
Magyar Export-Import Bank Zrt.(b)
02/12/18 | | | 5.500 | % | | | | | | | 4,111,000 | | | | 4,342,696 | | |
Government Guaranteed
01/30/20 | | | 4.000 | % | | | | | | | 1,579,000 | | | | 1,569,131 | | |
Total | | | | | | | | | 18,007,090 | | |
Indonesia 2.6% | |
Indonesia Government International Bond(b)
Senior Unsecured
04/20/15 | | | 7.250 | % | | | | | | | 1,300,000 | | | | 1,337,375 | | |
03/13/20 | | | 5.875 | % | | | | | | | 11,125,000 | | | | 12,432,187 | | |
04/25/22 | | | 3.750 | % | | | | | | | 1,600,000 | | | | 1,592,000 | | |
Indonesia Treasury Bond
Senior Unsecured
07/15/17 | | | 10.000 | % | | IDR | | | | | 15,043,000,000 | | | | 1,313,228 | | |
04/15/19 | | | 7.875 | % | | IDR | | | | | 13,000,000,000 | | | | 1,076,789 | | |
09/15/19 | | | 11.500 | % | | IDR | | | | | 36,600,000,000 | | | | 3,450,546 | | |
11/15/20 | | | 11.000 | % | | IDR | | | | | 2,000,000,000 | | | | 188,530 | | |
06/15/21 | | | 12.800 | % | | IDR | | | | | 17,200,000,000 | | | | 1,768,390 | | |
03/15/24 | | | 8.375 | % | | IDR | | | | | 77,800,000,000 | | | | 6,576,144 | | |
09/15/25 | | | 11.000 | % | | IDR | | | | | 16,500,000,000 | | | | 1,627,049 | | |
05/15/27 | | | 7.000 | % | | IDR | | | | | 56,380,000,000 | | | | 4,203,424 | | |
03/15/29 | | | 9.000 | % | | IDR | | | | | 16,350,000,000 | | | | 1,420,996 | | |
Majapahit Holding BV(b)
01/20/20 | | | 7.750 | % | | | | | | | 1,100,000 | | | | 1,281,350 | | |
06/29/37 | | | 7.875 | % | | | | | | | 2,780,000 | | | | 3,349,900 | | |
PT Pertamina Persero(b)
Senior Unsecured
05/03/22 | | | 4.875 | % | | | | | | | 1,600,000 | | | | 1,632,000 | | |
05/20/23 | | | 4.300 | % | | | | | | | 4,788,000 | | | | 4,656,330 | | |
PT Perusahaan Listrik Negara
Senior Unsecured(b)
11/22/21 | | | 5.500 | % | | | | | | | 6,778,000 | | | | 7,206,297 | | |
Pertamina Persero PT
Senior Unsecured(b)
05/30/44 | | | 6.450 | % | | | | | | | 1,245,000 | | | | 1,325,925 | | |
Total | | | | | | | | | 56,438,460 | | |
Italy 0.7% | |
Italy Buoni Poliennali Del Tesoro
09/01/22 | | | 5.500 | % | | EUR | | | | | 1,000,000 | | | | 1,568,192 | | |
Senior Unsecured
05/01/21 | | | 3.750 | % | | EUR | | | | | 7,620,000 | | | | 10,773,091 | | |
Republic of Italy
11/15/16 | | | 2.750 | % | | EUR | | | | | 1,600,000 | | | | 2,087,748 | | |
Total | | | | | | | | | 14,429,031 | | |
The accompanying Notes to Financial Statements are an integral part of this statement.
Annual Report 2014
22
Columbia Strategic Income Fund
Portfolio of Investments (continued)
October 31, 2014
Foreign Government Obligations(a)(l) (continued)
Issuer | | Coupon
Rate | | Principal
Amount ($) | | Value ($) | |
Ivory Coast 0.1% | |
Ivory Coast Government International Bond(b)
Senior Unsecured
07/23/24 | | | 5.375 | % | | | | | | | 700,000 | | | | 670,250 | | |
Ivory Coast Government International Bond(c)
Senior Unsecured
12/31/32 | | | 5.750 | % | | | | | | | 1,200,000 | | | | 1,158,240 | | |
Total | | | | | | | | | 1,828,490 | | |
Kazakhstan 0.5% | |
KazMunayGas National Co. JSC(b)
Senior Unsecured
07/02/18 | | | 9.125 | % | | | | | | | 3,980,000 | | | | 4,701,375 | | |
04/09/21 | | | 6.375 | % | | | | | | | 500,000 | | | | 548,750 | | |
04/30/23 | | | 4.400 | % | | | | | | | 4,287,000 | | | | 4,179,825 | | |
KazMunayGas National Co. JSC(b)(e)
11/07/44 | | | 6.000 | % | | | | | | | 900,000 | | | | 887,679 | | |
Total | | | | | | | | | 10,317,629 | | |
Macedonia —% | |
Macedonia Government Bond(b)
07/24/21 | | | 3.975 | % | | EUR | | | 716,000 | | | | 909,490 | | |
Malaysia 0.1% | |
Malaysia Government Bond
Senior Unsecured
10/31/19 | | | 3.654 | % | | MYR | | | 10,600,000 | | | | 3,223,193 | | |
Mexico 2.4% | |
Mexican Bonos
12/17/15 | | | 8.000 | % | | MXN | | | 14,850,000 | | | | 1,159,918 | | |
06/16/16 | | | 6.250 | % | | MXN | | | 29,600,000 | | | | 2,290,124 | | |
12/15/16 | | | 7.250 | % | | MXN | | | 6,590,000 | | | | 523,447 | | |
12/14/17 | | | 7.750 | % | | MXN | | | 9,500,000 | | | | 773,968 | | |
12/13/18 | | | 8.500 | % | | MXN | | | 36,260,000 | | | | 3,059,486 | | |
06/11/20 | | | 8.000 | % | | MXN | | | 86,530,000 | | | | 7,279,283 | | |
06/10/21 | | | 6.500 | % | | MXN | | | 50,000 | | | | 3,903 | | |
06/09/22 | | | 6.500 | % | | MXN | | | 88,200,000 | | | | 6,876,374 | | |
12/05/24 | | | 10.000 | % | | MXN | | | 44,000,000 | | | | 4,271,263 | | |
06/03/27 | | | 7.500 | % | | MXN | | | 44,450,000 | | | | 3,647,179 | | |
Senior Unsecured
11/23/34 | | | 7.750 | % | | MXN | | | 31,000,000 | | | | 2,571,884 | | |
Mexico Government International Bond
Senior Unsecured
01/11/40 | | | 6.050 | % | | | | | | | 2,350,000 | | | | 2,837,625 | | |
Pemex Finance Ltd.
(NPFGC)
08/15/17 | | | 10.610 | % | | | | | | | 1,237,500 | | | | 1,378,701 | | |
Senior Unsecured
11/15/18 | | | 9.150 | % | | | | | | | 2,485,000 | | | | 2,776,093 | | |
Foreign Government Obligations(a)(l) (continued)
Issuer | | Coupon
Rate | | Principal
Amount ($) | | Value ($) | |
Pemex Project Funding Master Trust
01/21/21 | | | 5.500 | % | | | | | | | 1,750,000 | | | | 1,934,713 | | |
06/15/38 | | | 6.625 | % | | | | | | | 450,000 | | | | 522,675 | | |
Petroleos Mexicanos
03/01/18 | | | 5.750 | % | | | | | | | 2,870,000 | | | | 3,172,211 | | |
05/03/19 | | | 8.000 | % | | | | | | | 600,000 | | | | 728,940 | | |
11/24/21 | | | 7.650 | % | | MXN | | | 26,200,000 | | | | 2,069,415 | | |
09/12/24 | | | 7.190 | % | | MXN | | | 19,070,000 | | | | 1,434,968 | | |
06/15/35 | | | 6.625 | % | | | | | | | 870,000 | | | | 1,026,600 | | |
06/02/41 | | | 6.500 | % | | | | | | | 2,500,000 | | | | 2,925,000 | | |
Total | | | | | | | | | 53,263,770 | | |
Morocco 0.1% | |
Morocco Government International Bond
Senior Unsecured(b)
12/11/22 | | | 4.250 | % | | | | | | | 2,317,000 | | | | 2,345,963 | | |
Netherlands 0.1% | |
Petrobras Global Finance BV
03/17/24 | | | 6.250 | % | | | | | | | 1,226,000 | | | | 1,303,557 | | |
New Zealand 0.5% | |
New Zealand Government Bond
Senior Unsecured
03/15/19 | | | 5.000 | % | | NZD | | | 5,000,000 | | | | 4,086,528 | | |
05/15/21 | | | 6.000 | % | | NZD | | | 6,100,000 | | | | 5,320,597 | | |
04/15/23 | | | 5.500 | % | | NZD | | | 2,460,000 | | | | 2,120,007 | | |
Total | | | | | | | | | 11,527,132 | | |
Panama 0.1% | |
Ena Norte Trust
Pass-Through Certificates(b)
04/25/23 | | | 4.950 | % | | | | | | | 1,520,416 | | | | 1,562,228 | | |
Paraguay 0.1% | |
Republic of Paraguay(b)
08/11/44 | | | 6.100 | % | | | | | | | 1,848,000 | | | | 1,981,980 | | |
Peru 0.8% | |
Corporacion Financiera de Desarrollo SA
Senior Unsecured(b)
02/08/22 | | | 4.750 | % | | | | | | | 2,900,000 | | | | 3,029,479 | | |
Peru Enhanced Pass-Through Finance Ltd.
Pass-Through Certificates(b)(m)
05/31/18 | | | 0.000 | % | | | | | | | 1,487,682 | | | | 1,394,646 | | |
Peruvian Government International Bond
Senior Unsecured
08/12/26 | | | 8.200 | % | | PEN | | | 9,407,000 | | | | 3,939,161 | | |
11/21/33 | | | 8.750 | % | | | | | | | 2,508,000 | | | | 3,856,050 | | |
The accompanying Notes to Financial Statements are an integral part of this statement.
Annual Report 2014
23
Columbia Strategic Income Fund
Portfolio of Investments (continued)
October 31, 2014
Foreign Government Obligations(a)(l) (continued)
Issuer | | Coupon
Rate | | Principal
Amount ($) | | Value ($) | |
Peruvian Government International Bond(b)
Senior Unsecured
08/12/20 | | | 7.840 | % | | PEN | | | | | 3,100,000 | | | | 1,228,323 | | |
08/12/26 | | | 8.200 | % | | PEN | | | | | 5,925,000 | | | | 2,481,081 | | |
Peruvian Government International Bond(b)(e)
08/12/24 | | | 5.700 | % | | PEN | | | | | 4,500,000 | | | | 1,533,972 | | |
Total | | | | | | | | | 17,462,712 | | |
Philippines 0.2% | |
Philippine Government International Bond
Senior Unsecured
01/15/21 | | | 4.950 | % | | PHP | | | | | 65,000,000 | | | | 1,492,086 | | |
03/30/26 | | | 5.500 | % | | | | | | | 1,025,000 | | | | 1,196,687 | | |
Power Sector Assets & Liabilities Management Corp.
Government Guaranteed(b)
12/02/24 | | | 7.390 | % | | | | | | | 1,390,000 | | | | 1,807,000 | | |
Total | | | | | | | | | 4,495,773 | | |
Poland 0.4% | |
Poland Government Bond
10/25/19 | | | 5.500 | % | | PLN | | | | | 11,243,000 | | | | 3,883,478 | | |
Poland Government International Bond
Senior Unsecured
07/15/19 | | | 6.375 | % | | | | | | | 1,470,000 | | | | 1,744,082 | | |
03/23/22 | | | 5.000 | % | | | | | | | 2,950,000 | | | | 3,315,062 | | |
Total | | | | | | | | | 8,942,622 | | |
Qatar 0.2% | |
Nakilat, Inc.
Senior Secured(b)
12/31/33 | | | 6.067 | % | | | | | | | 3,260,000 | | | | 3,700,100 | | |
Republic of Namibia 0.2% | |
Namibia International Bonds
Senior Unsecured(b)
11/03/21 | | | 5.500 | % | | | | | | | 4,100,000 | | | | 4,428,000 | | |
Republic of the Congo —% | |
Republic of Congo
Senior Unsecured(c)
06/30/29 | | | 3.500 | % | | | | | | | 446,500 | | | | 407,949 | | |
Romania 0.6% | |
Romania Government Bond
08/29/16 | | | 4.750 | % | | RON | | | | | 16,900,000 | | | | 5,024,837 | | |
Romanian Government International Bond(b)
Senior Unsecured
02/07/22 | | | 6.750 | % | | | | | | | 2,500,000 | | | | 2,996,875 | | |
08/22/23 | | | 4.375 | % | | | | | | | 5,312,000 | | | | 5,531,120 | | |
Total | | | | | | | | | 13,552,832 | | |
Foreign Government Obligations(a)(l) (continued)
Issuer | | Coupon
Rate | | Principal
Amount ($) | | Value ($) | |
Russian Federation 1.3% | |
Eurasian Development Bank
Senior Unsecured
10/05/17 | | | 8.000 | % | | RUB | | | | | 121,600,000 | | | | 2,588,416 | | |
Gazprom Neft OAO Via GPN Capital SA
Senior Unsecured(b)
09/19/22 | | | 4.375 | % | | | | | | | 4,800,000 | | | | 4,272,000 | | |
Gazprom OAO Via Gaz Capital SA(b)
Senior Unsecured
04/11/18 | | | 8.146 | % | | | | | | | 2,813,000 | | | | 3,107,352 | | |
01/23/21 | | | 5.999 | % | | | | | | | 2,000,000 | | | | 2,035,000 | | |
03/07/22 | | | 6.510 | % | | | | | | | 2,577,000 | | | | 2,689,744 | | |
08/16/37 | | | 7.288 | % | | | | | | | 300,000 | | | | 319,500 | | |
Russian Agricultural Bank OJSC Via RSHB Capital SA
Senior Unsecured(b)
12/27/17 | | | 5.298 | % | | | | | | | 300,000 | | | | 292,125 | | |
Russian Foreign Bond — Eurobond
Senior Unsecured(c)
03/31/30 | | | 7.500 | % | | | | | | | 10,224,550 | | | | 11,599,650 | | |
Vnesheconombank Via VEB Finance PLC
Senior Unsecured(b)
11/22/25 | | | 6.800 | % | | | | | | | 833,000 | | | | 823,629 | | |
Total | | | | | | | | | 27,727,416 | | |
Senegal —% | |
Senegal Government International Bond(b)
07/30/24 | | | 6.250 | % | | | | | | | 505,000 | | | | 499,950 | | |
Serbia 0.1% | |
Republic of Serbia(b)
12/03/18 | | | 5.875 | % | | | | | | | 2,229,000 | | | | 2,359,954 | | |
South Africa 0.2% | |
South Africa Government Bond
01/31/30 | | | 8.000 | % | | ZAR | | | | | 12,400,000 | | | | 1,096,801 | | |
South Africa Government International Bond
Senior Unsecured
01/17/24 | | | 4.665 | % | | | | | | | 1,800,000 | | | | 1,872,000 | | |
Transnet SOC Ltd.
Senior Unsecured(b)
07/26/22 | | | 4.000 | % | | | | | | | 1,100,000 | | | | 1,051,875 | | |
Total | | | | | | | | | 4,020,676 | | |
South Korea 0.2% | |
Export-Import Bank of Korea
Senior Unsecured
04/11/22 | | | 5.000 | % | | | | | | | 3,900,000 | | | | 4,400,354 | | |
Export-Import Bank of Korea(b)
02/15/15 | | | 5.000 | % | | IDR | | | | | 8,000,000,000 | | | | 656,321 | | |
Total | | | | | | | | | 5,056,675 | | |
The accompanying Notes to Financial Statements are an integral part of this statement.
Annual Report 2014
24
Columbia Strategic Income Fund
Portfolio of Investments (continued)
October 31, 2014
Foreign Government Obligations(a)(l) (continued)
Issuer | | Coupon
Rate | | Principal
Amount ($) | | Value ($) | |
Spain 0.3% | |
Spain Government Bond
Senior Unsecured
04/30/20 | | | 4.000 | % | | EUR | | | | | 1,300,000 | | | | 1,873,489 | | |
04/30/21 | | | 5.500 | % | | EUR | | | | | 2,430,000 | | | | 3,831,535 | | |
Spain Government Bond(b)
Senior Unsecured
10/31/23 | | | 4.400 | % | | EUR | | | | | 700,000 | | | | 1,057,839 | | |
Total | | | | | | | | | 6,762,863 | | |
Sweden 0.1% | |
Sweden Government Bond
05/12/25 | | | 2.500 | % | | SEK | | | | | 14,300,000 | | | | 2,187,619 | | |
Trinidad and Tobago 0.4% | |
Petroleum Co. of Trinidad & Tobago Ltd.
Senior Unsecured(b)
08/14/19 | | | 9.750 | % | | | | | | | 7,514,000 | | | | 9,392,500 | | |
Turkey 1.6% | |
Export Credit Bank of Turkey
Senior Unsecured(b)
09/23/21 | | | 5.000 | % | | | | | | | 600,000 | | | | 604,500 | | |
Turkey Government International Bond
02/17/45 | | | 6.625 | % | | | | | | | 600,000 | | | | 718,680 | | |
Senior Unsecured
09/26/16 | | | 7.000 | % | | | | | | | 1,235,000 | | | | 1,350,151 | | |
06/05/20 | | | 7.000 | % | | | | | | | 850,000 | | | | 988,975 | | |
03/30/21 | | | 5.625 | % | | | | | | | 5,050,000 | | | | 5,529,649 | | |
09/26/22 | | | 6.250 | % | | | | | | | 1,300,000 | | | | 1,475,500 | | |
03/23/23 | | | 3.250 | % | | | | | | | 2,800,000 | | | | 2,614,500 | | |
02/05/25 | | | 7.375 | % | | | | | | | 13,080,000 | | | | 16,166,226 | | |
03/17/36 | | | 6.875 | % | | | | | | | 630,000 | | | | 762,300 | | |
05/30/40 | | | 6.750 | % | | | | | | | 1,500,000 | | | | 1,814,625 | | |
01/14/41 | | | 6.000 | % | | | | | | | 2,200,000 | | | | 2,438,040 | | |
Total | | | | | | | | | 34,463,146 | | |
United Arab Emirates 0.3% | |
Abu Dhabi National Energy Co.(b)
Senior Unsecured
12/13/21 | | | 5.875 | % | | | | | | | 1,300,000 | | | | 1,523,438 | | |
01/12/23 | | | 3.625 | % | | | | | | | 2,200,000 | | | | 2,213,750 | | |
05/06/24 | | | 3.875 | % | | | | | | | 1,629,000 | | | | 1,656,203 | | |
Dolphin Energy Ltd.
Senior Secured(b)
12/15/21 | | | 5.500 | % | | | | | | | 1,423,000 | | | | 1,624,263 | | |
Total | | | | | | | | | 7,017,654 | | |
United Kingdom 0.2% | |
United Kingdom Gilt
03/07/25 | | | 5.000 | % | | GBP | | | | | 1,945,000 | | | | 3,900,349 | | |
Foreign Government Obligations(a)(l) (continued)
Issuer | | Coupon
Rate | | Principal
Amount ($) | | Value ($) | |
Uruguay 0.2% | |
Uruguay Government International Bond
Senior Unsecured
03/21/36 | | | 7.625 | % | | | | | | | 725,000 | | | | 987,813 | | |
Senior Unsecured PIK
01/15/33 | | | 7.875 | % | | | | | | | 1,940,000 | | | | 2,652,950 | | |
Total | | | | | | | | | 3,640,763 | | |
Venezuela 1.4% | |
Petroleos de Venezuela SA
04/12/17 | | | 5.250 | % | | | | | | | 14,120,000 | | | | 9,361,560 | | |
11/02/17 | | | 8.500 | % | | | | | | | 3,170,800 | | | | 2,401,564 | | |
11/17/21 | | | 9.000 | % | | | | | | | 3,498,521 | | | | 2,217,188 | | |
Senior Unsecured
10/28/15 | | | 5.000 | % | | | | | | | 3,203,562 | | | | 2,835,152 | | |
Venezuela Government International Bond
Senior Unsecured
02/26/16 | | | 5.750 | % | | | | | | | 2,050,000 | | | | 1,742,500 | | |
08/23/22 | | | 12.750 | % | | | | | | | 3,006,000 | | | | 2,389,770 | | |
05/07/23 | | | 9.000 | % | | | | | | | 14,104,800 | | | | 9,062,334 | | |
Total | | | | | | | | | 30,010,068 | | |
Zambia 0.2% | |
Zambia Government International Bond
Senior Unsecured(b)
04/14/24 | | | 8.500 | % | | | | | | | 4,077,000 | | | | 4,657,973 | | |
Total Foreign Government Obligations
(Cost: $483,058,598) | | | | | | | | | 485,784,165 | | |
Municipal Bonds 0.3%
Issue
Description | | Coupon
Rate | | Principal
Amount ($) | | Value ($) | |
California 0.1% | |
Cabazon Band Mission Indians
Revenue Bonds
Mortgage Notes
Series 2004(b)(f)(h)(n)
10/01/11 | | | 13.000 | % | | | | | | | 2,820,000 | | | | 1,433,350 | | |
Puerto Rico 0.2% | |
Commonwealth of Puerto Rico
Unlimited General Obligation Bonds
Series 2014A(n)
07/01/35 | | | 8.000 | % | | | | | | | 4,920,000 | | | | 4,304,803 | | |
Total Municipal Bonds
(Cost: $7,397,312) | | | | | | | | | 5,738,153 | | |
The accompanying Notes to Financial Statements are an integral part of this statement.
Annual Report 2014
25
Columbia Strategic Income Fund
Portfolio of Investments (continued)
October 31, 2014
Senior Loans 4.7%
Borrower | | Weighted
Average
Coupon | | Principal
Amount ($) | | Value ($) | |
Aerospace & Defense 0.1% | |
Doncasters US Finance LLC
Tranche B Term Loan(c)(o)
04/09/20 | | | 4.500 | % | | | | | | | 1,009,634 | | | | 999,537 | | |
TASC, Inc.
1st Lien Term Loan(c)(o)
05/22/20 | | | 6.500 | % | | | | | | | 548,625 | | | | 539,573 | | |
Total | | | | | | | | | 1,539,110 | | |
Automotive 0.1% | |
Gates Global LLC
Term Loan(c)(o)
07/05/21 | | | 4.250 | % | | | | | | | 1,050,000 | | | | 1,036,875 | | |
Navistar, Inc.
Tranche B Term Loan(c)(o)
08/17/17 | | | 5.750 | % | | | | | | | 348,750 | | | | 349,406 | | |
Total | | | | | | | | | 1,386,281 | | |
Brokerage/Asset Managers/Exchanges —% | |
USI, Inc.
Term Loan(c)(o)
12/27/19 | | | 4.250 | % | | | | | | | 810,624 | | | | 801,505 | | |
Building Materials —% | |
Contech Engineered Solutions LLC
Term Loan(c)(o)
04/29/19 | | | 6.250 | % | | | | | | | 370,312 | | | | 368,924 | | |
Roofing Supply Group LLC
Term Loan(c)(o)
05/31/19 | | | 5.000 | % | | | | | | | 536,040 | | | | 527,774 | | |
Total | | | | | | | | | 896,698 | | |
Cable and Satellite 0.2% | |
Encompass Digital Media, Inc.
1st Lien Tranche B Term Loan(c)(o)
06/06/21 | | | 5.500 | % | | | | | | | 977,644 | | | | 976,421 | | |
MCC Iowa LLC
Tranche G Term Loan(c)(o)
01/20/20 | | | 4.000 | % | | | | | | | 1,053,500 | | | | 1,035,064 | | |
Mediacom Illinois LLC
Tranche E Term Loan(c)(o)
10/23/17 | | | 3.130 | % | | | | | | | 890,138 | | | | 870,110 | | |
TWCC Holding Corp.
2nd Lien Term Loan(c)(o)
06/26/20 | | | 7.000 | % | | | | | | | 625,000 | | | | 612,238 | | |
Total | | | | | | | | | 3,493,833 | | |
Senior Loans (continued)
Borrower | | Weighted
Average
Coupon | | Principal
Amount ($) | | Value ($) | |
Chemicals 0.5% | |
American Pacific Corp.
Term Loan(c)(o)
02/27/19 | | | 7.000 | % | | | | | | | 997,494 | | | | 997,494 | | |
Ascend Performance Materials Operations LLC
Tranche B Term Loan(c)(o)
04/10/18 | | | 6.750 | % | | | | | | | 783,920 | | | | 758,442 | | |
Axalta Coating Systems Dutch Holding B BV
Tranche B Term Loan(c)(o)
02/01/20 | | | 3.750 | % | | | | | | | 962,878 | | | | 946,635 | | |
HII Holding Corp.
2nd Lien Term Loan(c)(o)
12/21/20 | | | 9.500 | % | | | | | | | 1,350,000 | | | | 1,356,750 | | |
Kronos Worldwide, Inc.
Term Loan(c)(o)
02/18/20 | | | 4.750 | % | | | | | | | 995,000 | | | | 992,095 | | |
MacDermid, Inc.
Tranche B 1st Lien Term Loan(c)(o)
06/07/20 | | | 4.000 | % | | | | | | | 1,000,000 | | | | 978,330 | | |
Nexeo Solutions LLC
Term Loan(c)(o)
09/08/17 | | | 5.000 | % | | | | | | | 906,792 | | | | 894,324 | | |
Oxea Finance & Cy SCA
2nd Lien Term Loan(c)(o)
07/15/20 | | | 8.250 | % | | | | | | | 425,000 | | | | 411,187 | | |
Polymer Group, Inc.
Term Loan(c)(o)
12/19/19 | | | 5.250 | % | | | | | | | 994,987 | | | | 994,987 | | |
Solenis International LP/Holdings 3 LLC
Term Loan(c)(o)
07/31/21 | | | 4.250 | % | | | | | | | 250,000 | | | | 246,250 | | |
Univar, Inc.
Tranche B Term Loan(c)(o)
06/30/17 | | | 5.000 | % | | | | | | | 1,943,259 | | | | 1,928,684 | | |
Total | | | | | | | | | 10,505,178 | | |
Construction Machinery —% | |
Douglas Dynamics LLC
Term Loan(c)(o)
04/18/18 | | | 5.750 | % | | | | | | | 643,220 | | | | 640,004 | | |
Consumer Cyclical Services 0.2% | |
IG Investments Holdings LLC
1st Lien Tranche B Term Loan(c)(o)
10/31/19 | | | 5.250 | % | | | | | | | 540,375 | | | | 539,024 | | |
Pre-Paid Legal Services, Inc.
Term Loan(c)(o)
07/01/19 | | | 6.250 | % | | | | | | | 355,645 | | | | 354,607 | | |
The accompanying Notes to Financial Statements are an integral part of this statement.
Annual Report 2014
26
Columbia Strategic Income Fund
Portfolio of Investments (continued)
October 31, 2014
Senior Loans (continued)
Borrower | | Weighted
Average
Coupon | | Principal
Amount ($) | | Value ($) | |
Quikrete Holdings, Inc.
1st Lien Term Loan(c)(o)
09/28/20 | | | 4.000 | % | | | | | | | 956,633 | | | | 946,588 | | |
Sabre GLBL, Inc.
Tranche B Term Loan(c)(o)
02/19/19 | | | 4.000 | % | | | | | | | 625,355 | | | | 614,930 | | |
ServiceMaster Co. LLC (The)
Term Loan(c)(o)
07/01/21 | | | 4.250 | % | | | | | | | 1,000,000 | | | | 990,210 | | |
Weight Watchers International, Inc.
Tranche B-2 Term Loan(c)(o)
04/02/20 | | | 4.000 | % | | | | | | | 1,379,000 | | | | 1,051,488 | | |
Total | | | | | | | | | 4,496,847 | | |
Consumer Products 0.2% | |
Affinion Group, Inc.
Tranche B Term Loan(c)(e)(o)
04/30/18 | | | 6.750 | % | | | | | | | 1,196,992 | | | | 1,157,097 | | |
Fender Musical Instruments Corp.
Term Loan(c)(o)
04/03/19 | | | 5.750 | % | | | | | | | 376,125 | | | | 374,086 | | |
Herff Jones, Inc.
Term Loan(c)(o)
06/25/19 | | | 5.500 | % | | | | | | | 920,340 | | | | 916,889 | | |
Party City Holdings, Inc.
Term Loan(c)(o)
07/27/19 | | | 4.000 | % | | | | | | | 1,421,172 | | | | 1,390,716 | | |
Total | | | | | | | | | 3,838,788 | | |
Diversified Manufacturing 0.2% | |
Accudyne Industries Borrower SCA/LLC
Term Loan(c)(o)
12/13/19 | | | 4.000 | % | | | | | | | 1,366,950 | | | | 1,341,893 | | |
Allflex Holdings III, Inc.(c)(o)
1st Lien Term Loan
07/17/20 | | | 4.250 | % | | | | | | | 1,039,500 | | | | 1,016,330 | | |
2nd Lien Term Loan
07/19/21 | | | 8.000 | % | | | | | | | 250,000 | | | | 246,250 | | |
Apex Tool Group LLC
Term Loan(c)(o)
01/31/20 | | | 4.500 | % | | | | | | | 884,031 | | | | 837,620 | | |
Filtration Group Corp.
1st Lien Term Loan(c)(o)
11/20/20 | | | 4.500 | % | | | | | | | 1,121,978 | | | | 1,117,490 | | |
William Morris Endeavor Entertainment LLC(c)(o)
1st Lien Term Loan
05/06/21 | | | 5.250 | % | | | | | | | 274,313 | | | | 269,581 | | |
2nd Lien Term Loan
05/06/22 | | | 8.250 | % | | | | | | | 250,000 | | | | 243,750 | | |
Total | | | | | | | | | 5,072,914 | | |
Senior Loans (continued)
Borrower | | Weighted
Average
Coupon | | Principal
Amount ($) | | Value ($) | |
Electric 0.2% | |
Calpine Corp.(c)(o)
Term Loan
04/01/18 | | | 4.000 | % | | | | | | | 628,399 | | | | 625,452 | | |
04/01/18 | | | 4.000 | % | | | | | | | 241,875 | | | | 240,741 | | |
EquiPower Resources Holdings LLC(c)(o)
1st Lien Tranche B Term Loan
12/21/18 | | | 4.250 | % | | | | | | | 291,692 | | | | 289,959 | | |
1st Lien Tranche C Term Loan
12/31/19 | | | 4.250 | % | | | | | | | 814,692 | | | | 809,852 | | |
Essential Power LLC
Term Loan(c)(o)
08/08/19 | | | 4.750 | % | | | | | | | 448,775 | | | | 448,775 | | |
NRG Energy, Inc.
Term Loan(c)(o)
07/01/18 | | | 2.750 | % | | | | | | | 629,046 | | | | 617,773 | | |
TPF Generation Holdings LLC
Term Loan(c)(o)
12/31/17 | | | 4.750 | % | | | | | | | 746,231 | | | | 710,785 | | |
Texas Competitive Electric Holdings Co. LLC
Term Loan(c)(f)(o)
04/25/15 | | | 4.647 | % | | | | | | | 1,345,944 | | | | 973,293 | | |
Windsor Financing LLC
Tranche B Term Loan(c)(o)
12/05/17 | | | 6.250 | % | | | | | | | 320,523 | | | | 322,126 | | |
Total | | | | | | | | | 5,038,756 | | |
Environmental 0.1% | |
ADS Waste Holdings, Inc.
Tranche B-2 Term Loan(c)(o)
10/09/19 | | | 3.750 | % | | | | | | | 933,375 | | | | 912,608 | | |
STI Infrastructure SARL
Term Loan(c)(e)(o)
08/22/20 | | | 6.250 | % | | | | | | | 498,741 | | | | 491,883 | | |
Waste Industries U.S.A., Inc.
Tranche B Term Loan(c)(o)
03/17/17 | | | 4.000 | % | | | | | | | 638,625 | | | | 633,835 | | |
Total | | | | | | | | | 2,038,326 | | |
Food and Beverage 0.2% | |
AdvancePierre Foods, Inc.
1st Lien Term Loan(c)(o)
07/10/17 | | | 5.750 | % | | | | | | | 1,965,000 | | | | 1,955,175 | | |
Arysta LifeScience SPC LLC
2nd Lien Term Loan(c)(o)
11/30/20 | | | 8.250 | % | | | | | | | 425,000 | | | | 427,478 | | |
Big Heart Pet Brands
Term Loan(c)(o)
03/09/20 | | | 3.500 | % | | | | | | | 677,621 | | | | 650,942 | | |
The accompanying Notes to Financial Statements are an integral part of this statement.
Annual Report 2014
27
Columbia Strategic Income Fund
Portfolio of Investments (continued)
October 31, 2014
Senior Loans (continued)
Borrower | | Weighted
Average
Coupon | | Principal
Amount ($) | | Value ($) | |
Performance Food Group, Inc.
2nd Lien Term Loan(c)(o)
11/14/19 | | | 6.250 | % | | | | | | | 1,110,937 | | | | 1,106,083 | | |
Total | | | | | | | | | 4,139,678 | | |
Gaming 0.2% | |
CCM Merger, Inc.
Term Loan(c)(o)
08/06/21 | | | 4.500 | % | | | | | | | 391,837 | | | | 389,388 | | |
Cannery Casino Resorts LLC
2nd Lien Term Loan(c)(o)
10/02/19 | | | 10.000 | % | | | | | | | 250,000 | | | | 225,000 | | |
Peppermill Casinos, Inc.
Tranche B Term Loan(c)(o)
11/09/18 | | | 7.000 | % | | | | | | | 1,007,026 | | | | 1,015,838 | | |
ROC Finance LLC
Tranche B Term Loan(c)(o)
06/20/19 | | | 5.000 | % | | | | | | | 1,039,500 | | | | 993,699 | | |
Scientific Games International, Inc.
Tranche B2 Term Loan(c)(o)
10/01/21 | | | 6.000 | % | | | | | | | 1,000,000 | | | | 978,330 | | |
Stockbridge/SBE Holdings
Tranche B Term Loan(c)(o)
05/02/17 | | | 13.000 | % | | | | | | | 150,000 | | | | 154,500 | | |
Total | | | | | | | | | 3,756,755 | | |
Health Care 0.3% | |
Alere, Inc.
Tranche B Term Loan(c)(o)
06/30/17 | | | 4.250 | % | | | | | | | 1,296,281 | | | | 1,291,744 | | |
Alliance HealthCare Services, Inc.
Term Loan(c)(o)
06/03/19 | | | 4.250 | % | | | | | | | 543,127 | | | | 534,980 | | |
CHS/Community Health Systems, Inc.(c)(o)
Tranche D Term Loan
01/27/21 | | | 4.250 | % | | | | | | | 757,654 | | | | 757,889 | | |
Tranche E Term Loan
01/25/17 | | | 3.485 | % | | | | | | | 284,263 | | | | 283,316 | | |
DaVita HealthCare Partners, Inc.
Tranche B Term Loan(c)(o)
06/24/21 | | | 3.500 | % | | | | | | | 623,437 | | | | 617,758 | | |
IASIS Healthcare LLC
Tranche B-2 Term Loan(c)(o)
05/03/18 | | | 4.500 | % | | | | | | | 830,784 | | | | 829,396 | | |
Onex Carestream Finance LP
1st Lien Term Loan(c)(o)
06/07/19 | | | 5.000 | % | | | | | | | 591,642 | | | | 592,015 | | |
Senior Loans (continued)
Borrower | | Weighted
Average
Coupon | | Principal
Amount ($) | | Value ($) | |
Quintiles Transnational Corp.
Term B-3 Term Loan(c)(o)
06/08/18 | | | 3.750 | % | | | | | | | 942,873 | | | | 933,841 | | |
Total | | | | | | | | | 5,840,939 | | |
Independent Energy 0.1% | |
Samson Investment Co.
2nd Lien Tranche 1 Term Loan(c)(o)
09/25/18 | | | 5.000 | % | | | | | | | 1,425,000 | | | | 1,311,769 | | |
Templar Energy LLC
2nd Lien Term Loan(c)(o)
11/25/20 | | | 8.500 | % | | | | | | | 1,000,000 | | | | 901,000 | | |
Total | | | | | | | | | 2,212,769 | | |
Leisure 0.1% | |
24 Hour Fitness Worldwide, Inc.
Term Loan(c)(o)
05/28/21 | | | 4.750 | % | | | | | | | 448,875 | | | | 447,753 | | |
Lions Gate Entertainment
Term Loan(c)(o)
07/19/20 | | | 5.000 | % | | | | | | | 1,000,000 | | | | 1,002,500 | | |
Zuffa LLC
Term Loan(c)(o)
02/25/20 | | | 3.750 | % | | | | | | | 1,743,946 | | | | 1,698,899 | | |
Total | | | | | | | | | 3,149,152 | | |
Media and Entertainment 0.4% | |
Clear Channel Communications, Inc.
Tranche D Term Loan(c)(o)
01/30/19 | | | 6.992 | % | | | | | | | 1,128,407 | | | | 1,063,704 | | |
Getty Images, Inc.
Term Loan(c)(o)
10/18/19 | | | 4.750 | % | | | | | | | 1,965,000 | | | | 1,853,251 | | |
Granite Broadcasting
1st Lien Tranche B Term Loan(c)(o)
05/23/18 | | | 6.750 | % | | | | | | | 231,584 | | | | 229,655 | | |
Ion Media Networks, Inc.
Term Loan(c)(o)
12/18/20 | | | 5.000 | % | | | | | | | 992,500 | | | | 990,019 | | |
Learfield Communications, Inc.
1st Lien Term Loan(c)(o)
10/09/20 | | | 4.500 | % | | | | | | | 1,588,020 | | | | 1,580,080 | | |
Radio One, Inc.
Term Loan(c)(o)
03/31/16 | | | 7.500 | % | | | | | | | 716,097 | | | | 714,306 | | |
RentPath, Inc.
Tranche B Term Loan(c)(o)
05/29/20 | | | 6.000 | % | | | | | | | 1,036,875 | | | | 1,034,283 | | |
The accompanying Notes to Financial Statements are an integral part of this statement.
Annual Report 2014
28
Columbia Strategic Income Fund
Portfolio of Investments (continued)
October 31, 2014
Senior Loans (continued)
Borrower | | Weighted
Average
Coupon | | Principal
Amount ($) | | Value ($) | |
Univision Communications, Inc.
Term Loan(c)(o)
03/01/20 | | | 4.000 | % | | | | | | | 1,083,500 | | | | 1,071,538 | | |
Total | | | | | | | | | 8,536,836 | | |
Metals 0.1% | |
Essar Steel Algoma, Inc.
Term Loan(c)(o)
11/15/14 | | | 12.250 | % | | | | | | | 319,312 | | | | 319,114 | | |
FMG Resources August 2006 Proprietary Ltd.
Term Loan(c)(o)
06/30/19 | | | 3.750 | % | | | | | | | 1,057,471 | | | | 1,030,675 | | |
Noranda Aluminum Acquisition Corp.
Tranche B Term Loan(c)(o)
02/28/19 | | | 5.750 | % | | | | | | | 295,455 | | | | 286,960 | | |
Total | | | | | | | | | 1,636,749 | | |
Midstream —% | |
Philadelphia Energy Solutions Refining and Marketing LLC
Term Loan(c)(o)
04/04/18 | | | 6.250 | % | | | | | | | 119,090 | | | | 112,242 | | |
Oil Field Services 0.1% | |
Drillships Financing Holding, Inc.
Tranche B1 Term Loan(c)(o)
03/31/21 | | | 6.000 | % | | | | | | | 882,123 | | | | 841,325 | | |
Fieldwood Energy LLC
2nd Lien Term Loan(c)(e)(o)
09/30/20 | | | 8.375 | % | | | | | | | 1,000,000 | | | | 960,630 | | |
Total | | | | | | | | | 1,801,955 | | |
Other Financial Institutions —% | |
AlixPartners LLP
1st Lien Tranche B-2 Term Loan(c)(o)
07/10/20 | | | 4.000 | % | | | | | | | 278,977 | | | | 274,561 | | |
Other Industry 0.1% | |
ATI Acquisition Co.
Tranche B Term Loan(c)(d)(f)(g)(h)(o)
12/30/14 | | | 0.000 | % | | | | | | | 114,179 | | | | — | | |
Harland Clarke Holdings Corp.
Tranche B-3 Term Loan(c)(o)
05/22/18 | | | 7.000 | % | | | | | | | 435,937 | | | | 439,935 | | |
Sensus U.S.A., Inc.(c)(o)
1st Lien Term Loan
05/09/17 | | | 4.750 | % | | | | | | | 989,771 | | | | 960,078 | | |
2nd Lien Term Loan
05/09/18 | | | 8.500 | % | | | | | | | 725,000 | | | | 706,875 | | |
Senior Loans (continued)
Borrower | | Weighted
Average
Coupon | | Principal
Amount ($) | | Value ($) | |
WireCo WorldGroup, Inc.
Term Loan(c)(o)
02/15/17 | | | 6.000 | % | | | | | | | 558,165 | | | | 558,863 | | |
Total | | | | | | | | | 2,665,751 | | |
Packaging 0.1% | |
Ranpak Corp.
1st Lien Term Loan(c)(o)
10/01/21 | | | 4.750 | % | | | | | | | 1,000,000 | | | | 993,750 | | |
Paper —% | |
Caraustar Industries, Inc.
Term Loan(c)(o)
05/01/19 | | | 7.500 | % | | | | | | | 850,382 | | | | 853,307 | | |
Pharmaceuticals 0.1% | |
Par Pharmaceutical Companies, Inc.
Tranche B-2 Term Loan(c)(o)
09/30/19 | | | 4.000 | % | | | | | | | 433,921 | | | | 427,052 | | |
Valeant Pharmaceuticals International, Inc.(c)(o)
Tranche B-C2 Term Loan
12/11/19 | | | 3.750 | % | | | | | | | 618,275 | | | | 612,865 | | |
Tranche B-D2 Term Loan
02/13/19 | | | 3.750 | % | | | | | | | 318,518 | | | | 315,731 | | |
Total | | | | | | | | | 1,355,648 | | |
Property & Casualty 0.1% | |
Alliant Holdings I LLC
Term Loan(c)(o)
12/20/19 | | | 4.250 | % | | | | | | | 1,481,965 | | | | 1,472,703 | | |
Asurion LLC
Tranche B-1 Term Loan(c)(o)
05/24/19 | | | 5.000 | % | | | | | | | 1,134,979 | | | | 1,135,297 | | |
Total | | | | | | | | | 2,608,000 | | |
Retailers 0.6% | |
Academy Ltd.
Term Loan(c)(o)
08/03/18 | | | 4.500 | % | | | | | | | 1,754,959 | | | | 1,745,816 | | |
BJ's Wholesale Club, Inc.
1st Lien Term Loan(c)(o)
09/26/19 | | | 4.500 | % | | | | | | | 1,179,112 | | | | 1,166,272 | | |
David's Bridal, Inc.
Term Loan(c)(o)
10/11/19 | | | 5.000 | % | | | | | | | 1,218,194 | | | | 1,184,182 | | |
Hudson's Bay Co.
1st Lien Term Loan(c)(o)
11/04/20 | | | 4.750 | % | | | | | | | 1,000,000 | | | | 1,000,130 | | |
The accompanying Notes to Financial Statements are an integral part of this statement.
Annual Report 2014
29
Columbia Strategic Income Fund
Portfolio of Investments (continued)
October 31, 2014
Senior Loans (continued)
Borrower | | Weighted
Average
Coupon | | Principal
Amount ($) | | Value ($) | |
J. Crew Group, Inc.
Term Loan(c)(o)
03/05/21 | | | 4.000 | % | | | | | | | 1,484,489 | | | | 1,432,071 | | |
Jo-Ann Stores, Inc.
Tranche B Term Loan(c)(o)
03/16/18 | | | 4.000 | % | | | | | | | 968,695 | | | | 929,947 | | |
Leslie's Poolmart, Inc.
Tranche B Term Loan(c)(o)
10/16/19 | | | 4.250 | % | | | | | | | 994,925 | | | | 975,852 | | |
Neiman Marcus Group, Inc. (The)
Term Loan(c)(o)
10/25/20 | | | 4.250 | % | | | | | | | 693,633 | | | | 684,096 | | |
PetCo Animal Supplies, Inc.
Term Loan(c)(o)
11/24/17 | | | 4.000 | % | | | | | | | 1,353,900 | | | | 1,341,092 | | |
Pilot Travel Centers LLC
Tranche B Term Loan(c)(o)
10/01/21 | | | 4.250 | % | | | | | | | 575,000 | | | | 574,879 | | |
Rite Aid Corp.(c)(o)
2nd Lien Tranche 1 Term Loan
08/21/20 | | | 5.750 | % | | | | | | | 750,000 | | | | 753,750 | | |
Tranche 2 Term Loan
06/21/21 | | | 4.875 | % | | | | | | | 200,000 | | | | 199,500 | | |
Tranche 7 Term Loan
02/21/20 | | | 3.500 | % | | | | | | | 419,703 | | | | 414,352 | | |
Sports Authority, Inc. (The)
Tranche B Term Loan(c)(o)
11/16/17 | | | 7.500 | % | | | | | | | 948,449 | | | | 891,542 | | |
Total | | | | | | | | | 13,293,481 | | |
Supermarkets 0.1% | |
Albertson's LLC
Tranche B-2 Term Loan(c)(o)
03/21/19 | | | 4.750 | % | | | | | | | 1,042,765 | | | | 1,040,158 | | |
Sprouts Farmers Markets Holdings LLC
Term Loan(c)(o)
04/23/20 | | | 4.000 | % | | | | | | | 419,866 | | | | 416,717 | | |
Total | | | | | | | | | 1,456,875 | | |
Technology 0.3% | |
Avago Technologies Ltd.
Term Loan(c)(o)
05/06/21 | | | 3.750 | % | | | | | | | 598,500 | | | | 596,333 | | |
BMC Software Finance, Inc.(c)(e)(o)
09/10/20 | | | 5.000 | % | | | | | | | 1,000,000 | | | | 987,190 | | |
Blue Coat Systems, Inc.(c)(o)
2nd Lien Term Loan
06/26/20 | | | 9.500 | % | | | | | | | 2,008,000 | | | | 1,990,430 | | |
Term Loan
05/31/19 | | | 4.000 | % | | | | | | | 864,065 | | | | 846,420 | | |
Senior Loans (continued)
Borrower | | Weighted
Average
Coupon | | Principal
Amount ($) | | Value ($) | |
Greeneden U.S. Holdings II LLC
Term Loan(c)(o)
02/08/20 | | | 4.000 | % | | | | | | | 309,571 | | | | 301,368 | | |
Infogroup, Inc.
Tranche B Term Loan(c)(o)
05/26/18 | | | 7.500 | % | | | | | | | 675,000 | | | | 615,938 | | |
Micro Focus US, Inc.
Tranche B Term Loan(c)(o)
10/07/21 | | | 5.250 | % | | | | | | | 275,000 | | | | 264,974 | | |
RP Crown Parent LLC
1st Lien Term Loan(c)(o)
12/21/18 | | | 6.000 | % | | | | | | | 1,036,792 | | | | 1,002,930 | | |
TransUnion LLC
Term Loan(c)(o)
04/09/21 | | | 4.000 | % | | | | | | | 348,250 | | | | 343,681 | | |
Verint Systems, Inc.
Tranche B Term Loan(c)(o)
09/06/19 | | | 3.500 | % | | | | | | | 82,830 | | | | 82,167 | | |
Total | | | | | | | | | 7,031,431 | | |
Transportation Services —% | |
Commercial Barge Line Co.
1st Lien Term Loan(c)(o)
09/22/19 | | | 7.500 | % | | | | | | | 467,875 | | | | 467,000 | | |
Hertz Corp. (The)
Letter of Credit(c)(o)
03/11/18 | | | 3.750 | % | | | | | | | 500,000 | | | | 496,250 | | |
Total | | | | | | | | | 963,250 | | |
Wirelines —% | |
Alaska Communications Systems Holdings, Inc.
Term Loan(c)(o)
10/21/16 | | | 6.250 | % | | | | | | | 663,948 | | | | 657,587 | | |
Total Senior Loans
(Cost: $105,175,544) | | | | | | | | | 103,088,956 | | |
Common Stocks 0.1%
Issuer | | | | Shares | | Value ($) | |
Consumer Discretionary 0.1% | |
Auto Components —% | |
Delphi Automotive PLC | | | | | | | 1,315 | | | | 90,709 | | |
Hotels, Restaurants & Leisure —% | |
BLB Management Services , Inc. | | | | | | | 5,526 | | | | 184,569 | | |
The accompanying Notes to Financial Statements are an integral part of this statement.
Annual Report 2014
30
Columbia Strategic Income Fund
Portfolio of Investments (continued)
October 31, 2014
Common Stocks (continued)
Issuer | | Shares | | Value ($) | |
Media 0.1% | |
Cengage Learning, Inc. | | | | | | | 7,982 | | | | 224,494 | | |
Media News Group(p) | | | | | | | 2,495 | | | | 112,275 | | |
Tribune Media Co.(p) | | | | | | | 1,338 | | | | 89,679 | | |
Tribune Publishing Co.(p) | | | | | | | 334 | | | | 6,366 | | |
Total | | | | | | | 432,814 | | |
Total Consumer Discretionary | | | | | | | 708,092 | | |
Information Technology —% | |
IT Services —% | |
Advanstar Communications, Inc.(p) | | | | | | | 705 | | | | 16,215 | | |
Total Information Technology | | | | | | | 16,215 | | |
Materials —% | |
Chemicals —% | |
LyondellBasell Industries NV, Class A | | | | | | | 3,806 | | | | 348,744 | | |
Metals & Mining —% | |
Aleris International, Inc.(p) | | | | | | | 3,721 | | | | 146,979 | | |
Total Materials | | | | | | | 495,723 | | |
Common Stocks (continued)
Issuer | | Shares | | Value ($) | |
Telecommunication Services —% | |
Diversified Telecommunication Services —% | |
Hawaiian Telcom Holdco, Inc.(p) | | | 478 | | | | 12,858 | | |
Total Telecommunication Services | | | | | 12,858 | | |
Total Common Stocks
(Cost: $847,090) | | | | | 1,232,888 | | |
Money Market Funds 4.9%
| | | Shares | | Value ($) | |
Columbia Short-Term Cash Fund,
0.092%(q)(r) | | | 106,858,518 | | | | 106,858,518 | | |
Total Money Market Funds
(Cost: $106,858,518) | | | | | 106,858,518 | | |
Total Investments
(Cost: $2,168,678,536) | | | | | 2,195,408,388 | | |
Other Assets & Liabilities, Net | | | | | (1,875,686 | ) | |
Net Assets | | | | | 2,193,532,702 | | |
Investments in Derivatives
Forward Foreign Currency Exchange Contracts Open at October 31, 2014
Counterparty | | Exchange Date | | Currency to
be Delivered | | Currency to
be Received | | Unrealized
Appreciation ($) | | Unrealized
Depreciation ($) | |
Citigroup Global Markets Inc.
| | 11/20/14
| | | 189,140,000
RUB | | | | 4,599,149
USD | | | | 221,582
| | | | —
| | |
Citigroup Global Markets Inc.
| | 11/25/14
| | | 16,610,000
AUD | | | | 14,488,737
USD | | | | —
| | | | (106,782
| ) | |
Deutsche Bank
| | 11/25/14
| | | 3,917,003
USD | | | | 4,172,000,000
KRW | | | | —
| | | | (31,023
| ) | |
Deutsche Bank
| | 11/25/14
| | | 2,633,494
USD | | | | 5,970,000
TRY | | | | 39,593
| | | | —
| | |
Goldman, Sachs & Co.
| | 11/25/14
| | | 15,770,000
SEK | | | | 2,192,242
USD | | | | 56,495
| | | | —
| | |
J.P. Morgan Securities, Inc.
| | 11/24/14
| | | 3,243,971
USD | | | | 10,600,000
MYR | | | | —
| | | | (40,289
| ) | |
J.P. Morgan Securities, Inc.
| | 11/25/14
| | | 1,305,300
USD | | | | 4,330,000
PLN | | | | —
| | | | (21,379
| ) | |
J.P. Morgan Securities, Inc.
| | 12/03/14
| | | 590,000
SGD | | | | 463,818
USD | | | | 4,640
| | | | —
| | |
Standard Chartered Bank
| | 12/08/14
| | | 5,790,000
GBP | | | | 9,259,484
USD | | | | 314
| | | | —
| | |
The accompanying Notes to Financial Statements are an integral part of this statement.
Annual Report 2014
31
Columbia Strategic Income Fund
Portfolio of Investments (continued)
October 31, 2014
Forward Foreign Currency Exchange Contracts Open at October 31, 2014 (continued)
Counterparty | | Exchange Date | | Currency to
be Delivered | | Currency to
be Received | | Unrealized
Appreciation ($) | | Unrealized
Depreciation ($) | |
UBS Securities
| | 11/25/14
| | | 15,430,000
NZD | | | | 12,209,142
USD | | | | 205,869
| | | | —
| | |
UBS Securities
| | 12/08/14
| | | 32,560,000
EUR | | | | 40,798,657
USD | | | | —
| | | | (14,804
| ) | |
Total | | | | | | | | | 528,493 | | | | (214,277 | ) | |
Futures Contracts Outstanding at October 31, 2014
At October 31, 2014, securities totaling $3,706,226 were pledged as collateral to cover initial margin requirements on open futures contracts.
Long Futures Contracts Outstanding
Contract Description | | Number of
Contracts | | Trading
Currency | | Notional
Market
Value ($) | | Expiration
Date | | Unrealized
Appreciation ($) | | Unrealized
Depreciation ($) | |
US 2YR NOTE | | | 425 | | | USD | | | | | 93,314,063 | | | 12/2014 | | | 278,269 | | | | — | | |
US ULTRA T-BOND | | | 797 | | | USD | | | | | 124,979,563 | | | 12/2014 | | | 2,465,898 | | | | — | | |
Total | | | | | | | | | | | 2,744,167 | | | | — | | |
Short Futures Contracts Outstanding
Contract Description | | Number of
Contracts | | Trading
Currency | | Notional
Market
Value ($) | | Expiration
Date | | Unrealized
Appreciation ($) | | Unrealized
Depreciation ($) | |
| EURO BUXL 30YR BOND | | | (54 | ) | | EUR | | | | | (9,833,820 | ) | | 12/2014 | | | — | | | | (362,570 | ) | |
US 10YR NOTE | | | (2,112 | ) | | USD | | | | | (266,871,011 | ) | | 12/2014 | | | — | | | | (4,580,260 | ) | |
US 5YR NOTE | | | (867 | ) | | USD | | | | | (103,545,541 | ) | | 12/2014 | | | 1,023,902 | | | | — | | |
US LONG BOND | | | (558 | ) | | USD | | | | | (78,730,313 | ) | | 12/2014 | | | — | | | | (2,026,204 | ) | |
Total | | | | | | | | | | | 1,023,902 | | | | (6,969,034 | ) | |
Credit Default Swap Contracts Outstanding at October 31, 2014
At October 31, 2014, securities and cash totaling $6,115,754 were pledged as collateral to cover open centrally cleared credit default swap contracts.
Sell Protection
Counterparty | | Reference
Entity | | Expiration
Date | | Receive
Fixed
Rate (%) | | Implied
Credit
Spread (%)** | | Notional
Amount ($) | | Market
Value ($) | | Unamortized
Premium
(Paid)
Received ($) | | Periodic
Payments
Receivable
(Payable)
($) | | Unrealized
Appreciation
($) | | Unrealized
Depreciation
($) | |
Morgan Stanley*
| | CDX North
America High
Yield 23-V1 | | 12/20/2019
| | | 5.000
| | | | 3.43
| | | | 61,985,000
| | | | 885,644
| | | | —
| | | | 344,361
| | | | 1,230,005
| | | | —
| | |
The accompanying Notes to Financial Statements are an integral part of this statement.
Annual Report 2014
32
Columbia Strategic Income Fund
Portfolio of Investments (continued)
October 31, 2014
Sell Protection (continued)
Counterparty | | Reference
Entity | | Expiration
Date | | Receive
Fixed
Rate (%) | | Implied
Credit
Spread (%)** | | Notional
Amount ($) | | Market
Value ($) | | Unamortized
Premium
(Paid)
Received ($) | | Periodic
Payments
Receivable
(Payable)
($) | | Unrealized
Appreciation
($) | | Unrealized
Depreciation
($) | |
Morgan Stanley* | | CDX North
America High
Yield 23-V1 | | 12/20/2019
| | | 5.000
| | | | 3.43
| | | | 52,000,000
| | | | 1,075,155
| | | | —
| | | | 288,889
| | | | 1,364,044
| | | | —
| | |
Total | | | | | | | | | | | | | | | | | | | 2,594,049 | | | | — | | |
* Centrally cleared swap contract
** Implied credit spreads, represented in absolute terms, utilized in determining the market value of credit default swap agreements on corporate or sovereign issues as of period end serve as an indicator of the current status of the payment/performance risk and represent the likelihood or risk of default for the credit derivative. The implied credit spread of a particular referenced entity reflects the cost of buying/selling protection and may include upfront payments required to be made to enter into the agreement. Wider credit spreads represent a deterioration of the referenced entity's credit soundness and a greater likelihood or risk of default or other credit event occurring as defined under the terms of the agreement.
Interest Rate Swap Contracts Outstanding at October 31, 2014
At October 31, 2014, securities and cash totaling $6,149,818 were pledged as collateral to cover open centrally cleared interest rate swap contracts.
Counterparty | | Floating Rate
Index | | Fund
Pay/Receive
Floating Rate | | Fixed
Rate (%) | | Expiration
Date | | Notional
Currency | | Notional
Amount | | Unamortized
Premium
(Paid)
Received ($) | | Unrealized
Appreciation
($) | | Unrealized
Depreciation
($) | |
Morgan Stanley* | | 3-Month
USD LIBOR-BBA | | Receive | | | 2.551 | | | 9/4/24 | | USD | | | | | 190,000,000 | | | | (1,652 | ) | | | — | | | | (2,210,481 | ) | |
* Centrally cleared swap contract
Notes to Portfolio of Investments
(a) Principal amounts are denominated in United States Dollars unless otherwise noted.
(b) Security exempt from registration pursuant to Rule 144A under the Securities Act of 1933. This security may be resold in transactions exempt from registration, normally to qualified institutional buyers. At October 31, 2014, the value of these securities amounted to $926,300,584 or 42.23% of net assets.
(c) Variable rate security.
(d) Represents fair value as determined in good faith under procedures approved by the Board of Trustees. At October 31, 2014, the value of these securities amounted to $14,947,876, which represents 0.68% of net assets.
(e) Represents a security purchased on a when-issued or delayed delivery basis.
(f) Represents securities that have defaulted on payment of interest. The Fund has stopped accruing interest on these securities. At October 31, 2014, the value of these securities amounted to $2,853,572, which represents 0.13% of net assets.
(g) Negligible market value.
(h) Identifies securities considered by the Investment Manager to be illiquid as to their marketability. The aggregate value of such securities at October 31, 2014 was $1,433,350, which represents 0.07% of net assets. Information concerning such security holdings at October 31, 2014 is as follows:
Security Description | | Acquisition Dates | | Cost ($) | |
ATI Acquisition Co.
Tranche B Term Loan
12/30/14 0.000% | | 12/23/2009 - 10/13/2014 | | | 77,506 | | |
The accompanying Notes to Financial Statements are an integral part of this statement.
Annual Report 2014
33
Columbia Strategic Income Fund
Portfolio of Investments (continued)
October 31, 2014
Notes to Portfolio of Investments (continued)
Security Description | | Acquisition Dates | | Cost ($) | |
Cabazon Band Mission Indians
Revenue Bonds
Mortgage Notes
Series 2004
10/01/11 13.000% | | 10/04/2004 | | | 2,820,000 | | |
Six Flags, Inc., Escrow
06/01/44 0.000% | | 5/07/2010 | | | — | | |
(i) The maturity dates shown represent the original maturity of the underlying obligation. Actual maturity may vary based upon prepayment activity on these obligations. Unless otherwise noted, the coupon rates presented are fixed rates.
(j) Interest Only (IO) security. The actual effective yield of this security is different than the stated coupon rate.
(k) This security, or a portion of this security, has been pledged as collateral in connection with open futures and swap contracts. These values are denoted within the Investments in Derivatives section of the Portfolio of Investments.
(l) Principal and interest may not be guaranteed by the government.
(m) Zero coupon bond.
(n) Municipal obligations include debt obligations issued by or on behalf of territories, possessions, or sovereign nations within the territorial boundaries of the United States. At October 31, 2014, the value of these securities amounted to $5,738,153 or 0.26% of net assets.
(o) Senior loans have rates of interest that float periodically based primarily on the London Interbank Offered Rate ("LIBOR") and other short-term rates. The interest rate shown reflects the weighted average coupon as of October 31, 2014. The interest rate shown for senior loans purchased on a when-issued or delayed delivery basis, if any, reflects an estimated average coupon. Remaining maturities of senior loans may be less than the stated maturities shown as a result of contractual or optional prepayments by the borrower. Such prepayments cannot be predicted.
(p) Non-income producing.
(q) The rate shown is the seven-day current annualized yield at October 31, 2014.
(r) As defined in the Investment Company Act of 1940, an affiliated company is one in which the Fund owns 5% or more of the company's outstanding voting securities, or a company which is under common ownership or control with the Fund. Holdings and transactions in these affiliated companies during the year ended October 31, 2014, are as follows:
Issuer | | Beginning
Cost ($) | | Purchase
Cost ($) | | Proceeds
From Sales ($) | | Ending
Cost ($) | | Dividends —
Affiliated
Issuers ($) | | Value ($) | |
Columbia Short-Term Cash Fund | | | 82,995,116 | | | | 822,725,336 | | | | (798,861,934 | ) | | | 106,858,518 | | | | 75,106 | | | | 106,858,518 | | |
Abbreviation Legend
CMO Collateralized Mortgage Obligation
FGIC Financial Guaranty Insurance Company
NPFGC National Public Finance Guarantee Corporation
PIK Payment-in-Kind
STRIPS Separate Trading of Registered Interest and Principal Securities
Currency Legend
AUD Australian Dollar
BRL Brazilian Real
CLP Chilean Peso
COP Colombian Peso
DOP Dominican Republic Peso
EUR Euro
The accompanying Notes to Financial Statements are an integral part of this statement.
Annual Report 2014
34
Columbia Strategic Income Fund
Portfolio of Investments (continued)
October 31, 2014
Currency Legend (continued)
GBP British Pound
IDR Indonesian Rupiah
KRW Korean Won
MXN Mexican Peso
MYR Malaysia Ringgits
NZD New Zealand Dollar
PEN Peru Nuevos Soles
PHP Philippine Peso
PLN Polish Zloty
RON Romania, New Lei
RUB Russian Rouble
SEK Swedish Krona
SGD Singapore Dollar
TRY Turkish Lira
USD US Dollar
UYU Uruguay Pesos
ZAR South African Rand
Fair Value Measurements
Generally accepted accounting principles (GAAP) require disclosure regarding the inputs and valuation techniques used to measure fair value and any changes in valuation inputs or techniques. In addition, investments shall be disclosed by major category.
The Fund categorizes its fair value measurements according to a three-level hierarchy that maximizes the use of observable inputs and minimizes the use of unobservable inputs by prioritizing that the most observable input be used when available. Observable inputs are those that market participants would use in pricing an investment based on market data obtained from sources independent of the reporting entity. Unobservable inputs are those that reflect the Fund's assumptions about the information market participants would use in pricing an investment. An investment's level within the fair value hierarchy is based on the lowest level of any input that is deemed significant to the asset or liability's fair value measurement. The input levels are not necessarily an indication of the risk or liquidity associated with investments at that level. For example, certain U.S. government securities are generally high quality and liquid, however, they are reflected as Level 2 because the inputs used to determine fair value may not always be quoted prices in an active market.
Fair value inputs are summarized in the three broad levels listed below:
> Level 1 — Valuations based on quoted prices for investments in active markets that the Fund has the ability to access at the measurement date (including NAV for open-end mutual funds). Valuation adjustments are not applied to Level 1 investments.
> Level 2 — Valuations based on other significant observable inputs (including quoted prices for similar securities, interest rates, prepayment speeds, credit risks, etc.).
> Level 3 — Valuations based on significant unobservable inputs (including the Fund's own assumptions and judgment in determining the fair value of investments).
Inputs that are used in determining fair value of an investment may include price information, credit data, volatility statistics, and other factors. These inputs can be either observable or unobservable. The availability of observable inputs can vary between investments, and is affected by various factors such as the type of investment, and the volume and level of activity for that investment or similar investments in the marketplace. The inputs will be considered by the Investment Manager, along with any other relevant factors in the calculation of an investment's fair value. The Fund uses prices and inputs that are current as of the measurement date, which may include periods of market dislocations. During these periods, the availability of prices and inputs may be reduced for many investments. This condition could cause an investment to be reclassified between the various levels within the hierarchy.
The accompanying Notes to Financial Statements are an integral part of this statement.
Annual Report 2014
35
Columbia Strategic Income Fund
Portfolio of Investments (continued)
October 31, 2014
Fair Value Measurements (continued)
Investments falling into the Level 3 category are primarily supported by quoted prices from brokers and dealers participating in the market for those investments. However, these may be classified as Level 3 investments due to lack of market transparency and corroboration to support these quoted prices. Additionally, valuation models may be used as the pricing source for any remaining investments classified as Level 3. These models may rely on one or more significant unobservable inputs and/or significant assumptions by the Investment Manager. Inputs used in valuations may include, but are not limited to, financial statement analysis, capital account balances, discount rates and estimated cash flows, and comparable company data.
Under the direction of the Fund's Board of Trustees (the Board), the Investment Manager's Valuation Committee (the Committee) is responsible for overseeing the valuation procedures approved by the Board. The Committee consists of voting and non-voting members from various groups within the Investment Manager's organization, including operations and accounting, trading and investments, compliance, risk management and legal.
The Committee meets at least monthly to review and approve valuation matters, which may include a description of specific valuation determinations, data regarding pricing information received from approved pricing vendors and brokers and the results of Board-approved valuation control policies and procedures (the Policies). The Policies address, among other things, instances when market quotations are or are not readily available, including recommendations of third party pricing vendors and a determination of appropriate pricing methodologies; events that require specific valuation determinations and assessment of fair value techniques; securities with a potential for stale pricing, including those that are illiquid, restricted, or in default; and the effectiveness of third party pricing vendors, including periodic reviews of vendors. The Committee meets more frequently, as needed, to discuss additional valuation matters, which may include the need to review back-testing results, review time-sensitive information or approve related valuation actions. The Committee reports to the Board, with members of the Committee meeting with the Board at each of its regularly scheduled meetings to discuss valuation matters and actions during the period, similar to those described earlier.
For investments categorized as Level 3, the Committee monitors information similar to that described above, which may include: (i) data specific to the issuer or comparable issuers, (ii) general market or specific sector news and (iii) quoted prices and specific or similar security transactions. The Committee considers this data and any changes from prior periods in order to assess the reasonableness of observable and unobservable inputs, any assumptions or internal models used to value those securities and changes in fair value. This data is also used to corroborate, when available, information received from approved pricing vendors and brokers. Various factors impact the frequency of monitoring this information (which may occur as often as daily). However, the Committee may determine that changes to inputs, assumptions and models are not required as a result of the monitoring procedures performed.
The accompanying Notes to Financial Statements are an integral part of this statement.
Annual Report 2014
36
Columbia Strategic Income Fund
Portfolio of Investments (continued)
October 31, 2014
Fair Value Measurements (continued)
The following table is a summary of the inputs used to value the Fund's investments at October 31, 2014:
Description | | Level 1
Quoted Prices in Active
Markets for Identical
Assets ($) | | Level 2
Other Significant
Observable Inputs ($) | | Level 3
Significant
Unobservable Inputs ($) | | Total ($) | |
Bonds | |
Corporate Bonds & Notes | |
Banking | | | — | | | | 31,056,318 | | | | 697,913 | | | | 31,754,231 | | |
Leisure | | | — | | | | 10,558,564 | | | | — | (a) | | | 10,558,564 | | |
Transportation Services | | | — | | | | 5,783,049 | | | | 2,334,416 | | | | 8,117,465 | | |
All Other Industries | | | — | | | | 866,005,121 | | | | — | | | | 866,005,121 | | |
Residential Mortgage-Backed
Securities — Agency | | | — | | | | 95,997,461 | | | | — | | | | 95,997,461 | | |
Residential Mortgage-Backed
Securities — Non-Agency | | | — | | | | 191,765,377 | | | | 50,787,423 | | | | 242,552,800 | | |
Commercial Mortgage-Backed
Securities — Non-Agency | | | — | | | | 100,534,507 | | | | — | | | | 100,534,507 | | |
Asset-Backed Securities — Non-Agency | | | — | | | | 41,168,273 | | | | 8,240,849 | | | | 49,409,122 | | |
Inflation-Indexed Bonds | | | — | | | | 69,203,834 | | | | — | | | | 69,203,834 | | |
U.S. Treasury Obligations | | | 18,572,603 | | | | — | | | | — | | | | 18,572,603 | | |
Foreign Government Obligations | | | — | | | | 479,775,052 | | | | 6,009,113 | | | | 485,784,165 | | |
Municipal Bonds | | | — | | | | 5,738,153 | | | | — | | | | 5,738,153 | | |
Total Bonds | | | 18,572,603 | | | | 1,897,585,709 | | | | 68,069,714 | | | | 1,984,228,026 | | |
Senior Loans | |
Chemicals | | | — | | | | 6,397,505 | | | | 4,107,673 | | | | 10,505,178 | | |
Construction Machinery | | | — | | | | — | | | | 640,004 | | | | 640,004 | | |
Diversified Manufacturing | | | — | | | | 4,829,164 | | | | 243,750 | | | | 5,072,914 | | |
Electric | | | — | | | | 4,267,855 | | | | 770,901 | | | | 5,038,756 | | |
Gaming | | | — | | | | 3,602,255 | | | | 154,500 | | | | 3,756,755 | | |
Leisure | | | — | | | | 2,146,652 | | | | 1,002,500 | | | | 3,149,152 | | |
Media and Entertainment | | | — | | | | 4,932,454 | | | | 3,604,382 | | | | 8,536,836 | | |
Other Industry | | | — | | | | 439,935 | | | | 2,225,816 | | | | 2,665,751 | | |
Retailers | | | — | | | | 12,401,939 | | | | 891,542 | | | | 13,293,481 | | |
Transportation Services | | | — | | | | 467,000 | | | | 496,250 | | | | 963,250 | | |
All Other Industries | | | — | | | | 49,466,879 | | | | — | | | | 49,466,879 | | |
Total Senior Loans | | | — | | | | 88,951,638 | | | | 14,137,318 | | | | 103,088,956 | | |
The accompanying Notes to Financial Statements are an integral part of this statement.
Annual Report 2014
37
Columbia Strategic Income Fund
Portfolio of Investments (continued)
October 31, 2014
Fair Value Measurements (continued)
Description | | Level 1
Quoted Prices in Active
Markets for Identical
Assets ($) | | Level 2
Other Significant
Observable Inputs ($) | | Level 3
Significant
Unobservable Inputs ($) | | Total ($) | |
Equity Securities | |
Common Stocks | |
Consumer Discretionary | | | 186,755 | | | | 409,062 | | | | 112,275 | | | | 708,092 | | |
Information Technology | | | — | | | | — | | | | 16,215 | | | | 16,215 | | |
Materials | | | 348,743 | | | | — | | | | 146,980 | | | | 495,723 | | |
Telecommunication Services | | | 12,858 | | | | — | | | | — | | | | 12,858 | | |
Total Equity Securities | | | 548,356 | | | | 409,062 | | | | 275,470 | | | | 1,232,888 | | |
Mutual Funds | |
Money Market Funds | | | 106,858,518 | | | | — | | | | — | | | | 106,858,518 | | |
Total Mutual Funds | | | 106,858,518 | | | | — | | | | — | | | | 106,858,518 | | |
Investments in Securities | | | 125,979,477 | | | | 1,986,946,409 | | | | 82,482,502 | | | | 2,195,408,388 | | |
Derivatives | |
Assets | |
Forward Foreign Currency
Exchange Contracts | | | — | | | | 528,493 | | | | — | | | | 528,493 | | |
Futures Contracts | | | 3,768,069 | | | | — | | | | — | | | | 3,768,069 | | |
Swap Contracts | | | — | | | | 2,594,049 | | | | — | | | | 2,594,049 | | |
Liabilities | |
Forward Foreign Currency
Exchange Contracts | | | — | | | | (214,277 | ) | | | — | | | | (214,277 | ) | |
Futures Contracts | | | (6,969,034 | ) | | | — | | | | — | | | | (6,969,034 | ) | |
Swap Contracts | | | — | | | | (2,210,481 | ) | | | — | | | | (2,210,481 | ) | |
Total | | | 122,778,512 | | | | 1,987,644,193 | | | | 82,482,502 | | | | 2,192,905,207 | | |
(a) Rounds to zero.
See the Portfolio of Investments for all investment classifications not indicated in the table.
The Fund's assets assigned to the Level 2 input category are generally valued using the market approach, in which a security's value is determined through reference to prices and information from market transactions for similar or identical assets.
There were no transfers of financial assets between Levels 1 and 2 during the period.
Derivative instruments are valued at unrealized appreciation (depreciation).
The accompanying Notes to Financial Statements are an integral part of this statement.
Annual Report 2014
38
Columbia Strategic Income Fund
Portfolio of Investments (continued)
October 31, 2014
Fair Value Measurements (continued)
The following table is a reconciliation of Level 3 assets for which significant observable and/or unobservable inputs were used to determine fair value:
| | | Corporate
Bonds &
Notes ($) | | Residential
Mortgage-
Backed
Securities —
Non-Agency ($) | | Asset-Backed
Securities —
Non-Agency ($) | | Foreign
Government
Obligations ($) | | Senior
Loans ($) | | Common
Stocks ($) | | Total ($) | |
Balance as of October 31, 2013 | | | 730,616 | | | | 33,919,535 | | | | — | | | | 1,831,434 | | | | 6,217,042 | | | | 314,718 | | | | 43,013,345 | | |
Accrued discounts/premiums | | | 767 | | | | (22,295 | ) | | | (2,689 | ) | | | (28,062 | ) | | | (31,310 | ) | | | — | | | | (83,589 | ) | |
Realized gain (loss) | | | — | | | | 8,564 | | | | — | | | | — | | | | (221,345 | ) | | | — | | | | (212,781 | ) | |
Change in unrealized appreciation
(depreciation)(a) | | | 44,237 | | | | (112,639 | ) | | | 2,168 | | | | 240,388 | | | | (93,042 | ) | | | 104,152 | | | | 185,264 | | |
Sales | | | — | | | | (12,062,129 | ) | | | (104,262 | ) | | | — | | | | (3,032,410 | ) | | | — | | | | (15,198,801 | ) | |
Purchases | | | 2,256,709 | | | | 35,073,000 | | | | 8,345,632 | | | | 3,965,353 | | | | 7,139,912 | | | | — | | | | 56,780,606 | | |
Transfers into Level 3 | | | — | | | | — | | | | — | | | | — | | | | 5,180,585 | | | | 41,168 | | | | 5,221,753 | | |
Transfers out of Level 3 | | | — | | | | (6,016,613 | ) | | | — | | | | — | | | | (1,022,114 | ) | | | (184,568 | ) | | | (7,223,295 | ) | |
Balance as of October 31, 2014 | | | 3,032,329 | | | | 50,787,423 | | | | 8,240,849 | | | | 6,009,113 | | | | 14,137,318 | | | | 275,470 | | | | 82,482,502 | | |
(a) Change in unrealized appreciation (depreciation) relating to securities held at October 31, 2014 was $92,037, which is comprised of Corporate Bonds & Notes of $44,237, Residential Mortgage-Backed Securities — Non-Agency of $(112,639), Asset — Backed Securities — Non-Agency of $2,168, Foreign Government Obligations of $240,388, Senior Loans of $(134,325) and Common Stocks of $52,208.
The Fund's assets assigned to the Level 3 category are valued utilizing the valuation technique deemed the most appropriate in the circumstances. Certain corporate bonds, residential and asset backed securities, foreign government obligations, senior loans, and equity securities classified as Level 3 securities are valued using the market approach and utilize single market quotations from broker dealers which may have included, but were not limited to, observable transactions for identical or similar assets in the market and the distressed nature of the security. The appropriateness of fair values for these securities is monitored on an ongoing basis which may include results of back testing, manual price reviews and other control procedures. Significant increases (decreases) to any of these inputs would result in a significantly lower (higher) valuation measurement.
Financial Assets were transferred from Level 2 to Level 3 due to utilizing a single market quotation from a broker dealer. As a result, as of period end, management determined to value the security(s) under consistently applied procedures established by and under the general supervision of the Board of Trustees.
Financial assets were transferred from Level 3 to Level 2 as observable market inputs were utilized and management determined that there was sufficient, reliable and observable market data to value these assets as of period end.
Transfers in and/or out of Level 3 are determined based on the fair value at the beginning of the period for security positions held throughout the period.
The accompanying Notes to Financial Statements are an integral part of this statement.
Annual Report 2014
39
Columbia Strategic Income Fund
Statement of Assets and Liabilities
October 31, 2014
Assets | |
Investments, at value | |
Unaffiliated issuers (identified cost $2,061,820,018) | | $ | 2,088,549,870 | | |
Affiliated issuers (identified cost $106,858,518) | | | 106,858,518 | | |
Total investments (identified cost $2,168,678,536) | | | 2,195,408,388 | | |
Cash | | | 150,318 | | |
Foreign currency (identified cost $477,370) | | | 465,998 | | |
Margin deposits | | | 5,626,301 | | |
Unrealized appreciation on forward foreign currency exchange contracts | | | 528,493 | | |
Premiums paid on outstanding swap contracts | | | 1,652 | | |
Receivable for: | |
Investments sold | | | 133,297,080 | | |
Capital shares sold | | | 3,392,766 | | |
Dividends | | | 7,652 | | |
Interest | | | 25,657,442 | | |
Reclaims | | | 174,512 | | |
Variation margin | | | 2,040,805 | | |
Expense reimbursement due from Investment Manager | | | 515 | | |
Prepaid expenses | | | 18,209 | | |
Trustees' deferred compensation plan | | | 193,505 | | |
Total assets | | | 2,366,963,636 | | |
Liabilities | |
Unrealized depreciation on forward foreign currency exchange contracts | | | 214,277 | | |
Payable for: | |
Investments purchased | | | 135,757,548 | | |
Investments purchased on a delayed delivery basis | | | 32,603,342 | | |
Capital shares purchased | | | 3,395,182 | | |
Dividends and interest on securities sold short | | | 147,292 | | |
Variation margin | | | 483,088 | | |
Investment management fees | | | 31,174 | | |
Distribution and/or service fees | | | 14,551 | | |
Transfer agent fees | | | 398,382 | | |
Administration fees | | | 3,810 | | |
Plan administration fees | | | 1 | | |
Compensation of board members | | | 52,250 | | |
Chief compliance officer expenses | | | 106 | | |
Other expenses | | | 136,426 | | |
Trustees' deferred compensation plan | | | 193,505 | | |
Total liabilities | | | 173,430,934 | | |
Net assets applicable to outstanding capital stock | | $ | 2,193,532,702 | | |
Represented by | |
Paid-in capital | | $ | 2,130,175,587 | | |
Undistributed net investment income | | | 8,651,007 | | |
Accumulated net realized gain | | | 30,609,466 | | |
Unrealized appreciation (depreciation) on: | |
Investments | | | 26,729,852 | | |
Foreign currency translations | | | (130,029 | ) | |
Forward foreign currency exchange contracts | | | 314,216 | | |
Futures contracts | | | (3,200,965 | ) | |
Swap contracts | | | 383,568 | | |
Total — representing net assets applicable to outstanding capital stock | | $ | 2,193,532,702 | | |
The accompanying Notes to Financial Statements are an integral part of this statement.
Annual Report 2014
40
Columbia Strategic Income Fund
Statement of Assets and Liabilities (continued)
October 31, 2014
Class A | |
Net assets | | $ | 1,313,682,516 | | |
Shares outstanding | | | 214,436,354 | | |
Net asset value per share | | $ | 6.13 | | |
Maximum offering price per share(a) | | $ | 6.44 | | |
Class B | |
Net assets | | $ | 16,181,450 | | |
Shares outstanding | | | 2,642,916 | | |
Net asset value per share | | $ | 6.12 | | |
Class C | |
Net assets | | $ | 186,746,217 | | |
Shares outstanding | | | 30,475,940 | | |
Net asset value per share | | $ | 6.13 | | |
Class K | |
Net assets | | $ | 155,899 | | |
Shares outstanding | | | 25,813 | | |
Net asset value per share | | $ | 6.04 | | |
Class R | |
Net assets | | $ | 1,629,192 | | |
Shares outstanding | | | 264,456 | | |
Net asset value per share | | $ | 6.16 | | |
Class R4 | |
Net assets | | $ | 5,682,901 | | |
Shares outstanding | | | 941,620 | | |
Net asset value per share | | $ | 6.04 | | |
Class R5 | |
Net assets | | $ | 4,193,459 | | |
Shares outstanding | | | 693,831 | | |
Net asset value per share | | $ | 6.04 | | |
Class W | |
Net assets | | $ | 10,100 | | |
Shares outstanding | | | 1,650 | | |
Net asset value per share | | $ | 6.12 | | |
Class Y | |
Net assets | | $ | 1,581,522 | | |
Shares outstanding | | | 262,303 | | |
Net asset value per share | | $ | 6.03 | | |
Class Z | |
Net assets | | $ | 663,669,446 | | |
Shares outstanding | | | 109,902,087 | | |
Net asset value per share | | $ | 6.04 | | |
(a) The maximum offering price per share is calculated by dividing the net asset value per share by 1.0 minus the maximum sales charge of 4.75%.
The accompanying Notes to Financial Statements are an integral part of this statement.
Annual Report 2014
41
Columbia Strategic Income Fund
Statement of Operations
Year Ended October 31, 2014
Net investment income | |
Income: | |
Dividends — unaffiliated issuers | | $ | 32,521 | | |
Dividends — affiliated issuers | | | 75,106 | | |
Interest | | | 115,008,633 | | |
Foreign taxes withheld | | | (241,368 | ) | |
Total income | | | 114,874,892 | | |
Expenses: | |
Investment management fees | | | 11,508,313 | | |
Distribution and/or service fees | |
Class A | | | 3,227,225 | | |
Class B | | | 205,163 | | |
Class C | | | 1,936,407 | | |
Class R | | | 7,821 | | |
Class W | | | 17 | | |
Transfer agent fees | |
Class A | | | 2,256,763 | | |
Class B | | | 35,729 | | |
Class C | | | 338,102 | | |
Class K | | | 81 | | |
Class R | | | 2,737 | | |
Class R4 | | | 7,307 | | |
Class R5 | | | 1,342 | | |
Class W | | | 12 | | |
Class Z | | | 1,232,118 | | |
Administration fees | | | 1,406,311 | | |
Plan administration fees | |
Class K | | | 407 | | |
Compensation of board members | | | 82,383 | | |
Custodian fees | | | 85,396 | | |
Printing and postage fees | | | 216,785 | | |
Registration fees | | | 179,545 | | |
Professional fees | | | 106,433 | | |
Chief compliance officer expenses | | | 1,118 | | |
Other | | | 84,673 | | |
Total expenses | | | 22,922,188 | | |
Fees waived or expenses reimbursed by Investment Manager and its affiliates | | | (23,441 | ) | |
Fees waived by Distributor — Class C | | | (242,507 | ) | |
Expense reductions | | | (6,188 | ) | |
Total net expenses | | | 22,650,052 | | |
Net investment income | | | 92,224,840 | | |
Realized and unrealized gain (loss) — net | |
Net realized gain (loss) on: | |
Investments | | | 16,391,399 | | |
Foreign currency translations | | | (163,737 | ) | |
Forward foreign currency exchange contracts | | | 1,762,598 | | |
Futures contracts | | | 10,430,685 | | |
Swap contracts | | | (564,481 | ) | |
Net realized gain | | | 27,856,464 | | |
Net change in unrealized appreciation (depreciation) on: | |
Investments | | | (20,198,430 | ) | |
Foreign currency translations | | | (8,973 | ) | |
Forward foreign currency exchange contracts | | | (943,473 | ) | |
Futures contracts | | | 527,865 | | |
Swap contracts | | | 383,568 | | |
Net change in unrealized depreciation | | | (20,239,443 | ) | |
Net realized and unrealized gain | | | 7,617,021 | | |
Net increase in net assets resulting from operations | | $ | 99,841,861 | | |
The accompanying Notes to Financial Statements are an integral part of this statement.
Annual Report 2014
42
Columbia Strategic Income Fund
Statement of Changes in Net Assets
| | | Year Ended
October 31,
2014 | | Year Ended
October 31,
2013(a)(b) | |
Operations | |
Net investment income | | $ | 92,224,840 | | | $ | 109,627,163 | | |
Net realized gain | | | 27,856,464 | | | | 62,321,050 | | |
Net change in unrealized depreciation | | | (20,239,443 | ) | | | (126,924,941 | ) | |
Net increase in net assets resulting from operations | | | 99,841,861 | | | | 45,023,272 | | |
Distributions to shareholders | |
Net investment income | |
Class A | | | (50,496,230 | ) | | | (56,573,902 | ) | |
Class B | | | (653,135 | ) | | | (1,206,614 | ) | |
Class C | | | (6,444,716 | ) | | | (8,408,652 | ) | |
Class K | | | (6,672 | ) | | | (7,074 | ) | |
Class R | | | (56,509 | ) | | | (30,212 | ) | |
Class R4 | | | (173,995 | ) | | | (79,956 | ) | |
Class R5 | | | (116,718 | ) | | | (12,980 | ) | |
Class W | | | (256 | ) | | | (102 | ) | |
Class Y | | | (10,870 | ) | | | (102 | ) | |
Class Z | | | (29,888,334 | ) | | | (38,379,276 | ) | |
Net realized gains | |
Class A | | | (36,044,552 | ) | | | (4,588,950 | ) | |
Class B | | | (675,739 | ) | | | (142,982 | ) | |
Class C | | | (5,834,610 | ) | | | (816,591 | ) | |
Class K | | | (4,862 | ) | | | (567 | ) | |
Class R | | | (37,630 | ) | | | (833 | ) | |
Class R4 | | | (88,712 | ) | | | (8 | ) | |
Class R5 | | | (58,030 | ) | | | (25 | ) | |
Class W | | | (71 | ) | | | (8 | ) | |
Class Y | | | (549 | ) | | | — | | |
Class Z | | | (20,774,814 | ) | | | (3,024,482 | ) | |
Total distributions to shareholders | | | (151,367,004 | ) | | | (113,273,316 | ) | |
Decrease in net assets from capital stock activity | | | (68,716,989 | ) | | | (409,893,339 | ) | |
Total decrease in net assets | | | (120,242,132 | ) | | | (478,143,383 | ) | |
Net assets at beginning of year | | | 2,313,774,834 | | | | 2,791,918,217 | | |
Net assets at end of year | | $ | 2,193,532,702 | | | $ | 2,313,774,834 | | |
Undistributed net investment income | | $ | 8,651,007 | | | $ | 3,818,285 | | |
(a) Class R4 shares are based on operations from November 8, 2012 (commencement of operations) through the stated period end.
(b) Class Y shares are based on operations from June 13, 2013 (commencement of operations) through the stated period end.
The accompanying Notes to Financial Statements are an integral part of this statement.
Annual Report 2014
43
Columbia Strategic Income Fund
Statement of Changes in Net Assets (continued)
| | | Year Ended October 31, 2014 | | Year Ended October 31, 2013(a)(b) | |
| | | Shares | | Dollars ($) | | Shares | | Dollars ($) | |
Capital stock activity | |
Class A shares | |
Subscriptions(c) | | | 65,360,791 | | | | 400,346,321 | | | | 44,564,433 | | | | 283,968,679 | | |
Distributions reinvested | | | 12,935,040 | | | | 78,398,656 | | | | 8,634,390 | | | | 54,699,854 | | |
Redemptions | | | (71,969,614 | ) | | | (440,986,881 | ) | | | (77,906,720 | ) | | | (491,242,604 | ) | |
Net increase (decrease) | | | 6,326,217 | | | | 37,758,096 | | | | (24,707,897 | ) | | | (152,574,071 | ) | |
Class B shares | |
Subscriptions | | | 172,372 | | | | 1,053,536 | | | | 490,739 | | | | 3,134,223 | | |
Distributions reinvested | | | 174,921 | | | | 1,057,127 | | | | 166,727 | | | | 1,058,427 | | |
Redemptions(c) | | | (1,954,925 | ) | | | (11,986,412 | ) | | | (4,189,937 | ) | | | (26,566,953 | ) | |
Net decrease | | | (1,607,632 | ) | | | (9,875,749 | ) | | | (3,532,471 | ) | | | (22,374,303 | ) | |
Class C shares | |
Subscriptions | | | 3,961,634 | | | | 24,305,051 | | | | 7,260,562 | | | | 46,357,308 | | |
Distributions reinvested | | | 1,567,141 | | | | 9,493,476 | | | | 1,111,400 | | | | 7,049,760 | | |
Redemptions | | | (10,322,949 | ) | | | (63,246,438 | ) | | | (14,222,016 | ) | | | (89,600,590 | ) | |
Net decrease | | | (4,794,174 | ) | | | (29,447,911 | ) | | | (5,850,054 | ) | | | (36,193,522 | ) | |
Class K shares | |
Subscriptions | | | 398 | | | | 2,400 | | | | — | | | | — | | |
Distributions reinvested | | | 1,831 | | | | 10,937 | | | | 1,165 | | | | 7,288 | | |
Redemptions | | | (4,160 | ) | | | (25,168 | ) | | | (2,237 | ) | | | (14,162 | ) | |
Net decrease | | | (1,931 | ) | | | (11,831 | ) | | | (1,072 | ) | | | (6,874 | ) | |
Class R shares | |
Subscriptions | | | 190,951 | | | | 1,178,705 | | | | 230,616 | | | | 1,477,279 | | |
Distributions reinvested | | | 14,868 | | | | 90,648 | | | | 3,875 | | | | 24,446 | | |
Redemptions | | | (135,132 | ) | | | (836,771 | ) | | | (74,642 | ) | | | (462,038 | ) | |
Net increase | | | 70,687 | | | | 432,582 | | | | 159,849 | | | | 1,039,687 | | |
Class R4 shares | |
Subscriptions | | | 699,631 | | | | 4,232,013 | | | | 1,087,673 | | | | 6,742,914 | | |
Distributions reinvested | | | 25,196 | | | | 151,157 | | | | 9,136 | | | | 56,085 | | |
Redemptions | | | (331,831 | ) | | | (2,006,687 | ) | | | (548,185 | ) | | | (3,359,793 | ) | |
Net increase | | | 392,996 | | | | 2,376,483 | | | | 548,624 | | | | 3,439,206 | | |
Class R5 shares | |
Subscriptions | | | 620,697 | | | | 3,773,902 | | | | 256,331 | | | | 1,582,354 | | |
Distributions reinvested | | | 29,039 | | | | 174,127 | | | | 2,052 | | | | 12,633 | | |
Redemptions | | | (208,549 | ) | | | (1,254,449 | ) | | | (7,029 | ) | | | (43,284 | ) | |
Net increase | | | 441,187 | | | | 2,693,580 | | | | 251,354 | | | | 1,551,703 | | |
Class W shares | |
Subscriptions | | | 1,244 | | | | 7,606 | | | | — | | | | — | | |
Net increase | | | 1,244 | | | | 7,606 | | | | — | | | | — | | |
The accompanying Notes to Financial Statements are an integral part of this statement.
Annual Report 2014
44
Columbia Strategic Income Fund
Statement of Changes in Net Assets (continued)
| | | Year Ended October 31, 2014 | | Year Ended October 31, 2013(a)(b) | |
| | | Shares | | Dollars ($) | | Shares | | Dollars ($) | |
Capital stock activity (continued) | |
Class Y shares | |
Subscriptions | | | 258,916 | | | | 1,554,197 | | | | 3,096 | | | | 18,936 | | |
Distributions reinvested | | | 1,839 | | | | 11,063 | | | | 10 | | | | 60 | | |
Redemptions | | | (1,558 | ) | | | (9,466 | ) | | | — | | | | — | | |
Net increase | | | 259,197 | | | | 1,555,794 | | | | 3,106 | | | | 18,996 | | |
Class Z shares | |
Subscriptions | | | 26,969,988 | | | | 163,228,255 | | | | 33,293,071 | | | | 209,276,647 | | |
Distributions reinvested | | | 1,671,965 | | | | 9,993,382 | | | | 1,427,227 | | | | 8,931,096 | | |
Redemptions | | | (41,021,506 | ) | | | (247,427,276 | ) | | | (68,101,604 | ) | | | (423,001,904 | ) | |
Net decrease | | | (12,379,553 | ) | | | (74,205,639 | ) | | | (33,381,306 | ) | | | (204,794,161 | ) | |
Total net decrease | | | (11,291,762 | ) | | | (68,716,989 | ) | | | (66,509,867 | ) | | | (409,893,339 | ) | |
(a) Class R4 shares are based on operations from November 8, 2012 (commencement of operations) through the stated period end.
(b) Class Y shares are based on operations from June 13, 2013 (commencement of operations) through the stated period end.
(c) Includes conversions of Class B shares to Class A shares, if any.
The accompanying Notes to Financial Statements are an integral part of this statement.
Annual Report 2014
45
Columbia Strategic Income Fund
The following tables are intended to help you understand the Fund's financial performance. Certain information reflects financial results for a single share of a class held for the periods shown. Per share net investment income (loss) amounts are calculated based on average shares outstanding during the period. Total return assumes reinvestment of all dividends and distributions, if any. Total return does not reflect payment of sales charges, if any. Total return and portfolio turnover are not annualized for periods of less than one year. The portfolio turnover rate is calculated without regard to purchase and sales transactions of short-term instruments and certain derivatives, if any. If such transactions were included, the Fund's portfolio turnover rate may be higher.
| | | Year Ended October 31, | | Year Ended May 31, | |
Class A | | 2014 | | 2013 | | 2012(a) | | 2012 | | 2011 | | 2010 | |
Per share data | |
Net asset value, beginning of period | | $ | 6.27 | | | $ | 6.41 | | | $ | 6.11 | | | $ | 6.16 | | | $ | 5.84 | | | $ | 5.40 | | |
Income from investment operations: | |
Net investment income | | | 0.25 | | | | 0.26 | | | | 0.11 | | | | 0.30 | | | | 0.32 | | | | 0.29 | | |
Net realized and unrealized gain (loss) | | | 0.03 | | | | (0.13 | ) | | | 0.30 | | | | (0.04 | ) | | | 0.43 | | | | 0.41 | | |
Total from investment operations | | | 0.28 | | | | 0.13 | | | | 0.41 | | | | 0.26 | | | | 0.75 | | | | 0.70 | | |
Less distributions to shareholders: | |
Net investment income | | | (0.25 | ) | | | (0.25 | ) | | | (0.11 | ) | | | (0.31 | ) | | | (0.43 | ) | | | (0.26 | ) | |
Net realized gains | | | (0.17 | ) | | | (0.02 | ) | | | — | | | | — | | | | — | | | | — | | |
Total distributions to shareholders | | | (0.42 | ) | | | (0.27 | ) | | | (0.11 | ) | | | (0.31 | ) | | | (0.43 | ) | | | (0.26 | ) | |
Net asset value, end of period | | $ | 6.13 | | | $ | 6.27 | | | $ | 6.41 | | | $ | 6.11 | | | $ | 6.16 | | | $ | 5.84 | | |
Total return | | | 4.64 | % | | | 2.01 | % | | | 6.72 | % | | | 4.44 | % | | | 13.21 | % | | | 13.14 | % | |
Ratios to average net assets(b) | |
Total gross expenses | | | 1.04 | % | | | 1.03 | % | | | 1.02 | %(c) | | | 1.03 | % | | | 1.01 | % | | | 0.99 | % | |
Total net expenses(d) | | | 1.04 | %(e) | | | 1.03 | %(e) | | | 1.02 | %(c)(e) | | | 1.02 | %(e) | | | 1.00 | %(e) | | | 0.99 | %(e) | |
Net investment income | | | 4.14 | % | | | 4.10 | % | | | 4.11 | %(c) | | | 4.89 | % | | | 5.22 | % | | | 5.09 | % | |
Supplemental data | |
Net assets, end of period (in thousands) | | $ | 1,313,683 | | | $ | 1,303,812 | | | $ | 1,492,620 | | | $ | 1,365,605 | | | $ | 956,132 | | | $ | 1,013,941 | | |
Portfolio turnover | | | 124 | %(f) | | | 113 | %(f) | | | 48 | %(f) | | | 83 | %(f) | | | 128 | % | | | 50 | % | |
Notes to Financial Highlights
(a) For the period from June 1, 2012 to October 31, 2012. During the period, the Fund's fiscal year end was changed from May 31 to October 31.
(b) In addition to the fees and expenses that the Fund bears directly, the Fund indirectly bears a pro rata share of the fees and expenses of any other funds in which it invests. Such indirect expenses are not included in the Fund's reported expense ratios.
(c) Annualized.
(d) Total net expenses include the impact of certain fee waivers/expense reimbursements made by the Investment Manager and certain of its affiliates, if applicable.
(e) The benefits derived from expense reductions had an impact of less than 0.01%.
(f) Includes mortgage dollar rolls. If mortgage dollar roll transactions were excluded, the portfolio turnover would have been 77%, 71%, 25% and 63% for the years ended October 31, 2014, 2013 and 2012, and year ended May 31, 2012, respectively.
The accompanying Notes to Financial Statements are an integral part of this statement.
Annual Report 2014
46
Columbia Strategic Income Fund
Financial Highlights (continued)
| | | Year Ended October 31, | | Year Ended May 31, | |
Class B | | 2014 | | 2013 | | 2012(a) | | 2012 | | 2011 | | 2010 | |
Per share data | |
Net asset value, beginning of period | | $ | 6.26 | | | $ | 6.41 | | | $ | 6.11 | | | $ | 6.16 | | | $ | 5.84 | | | $ | 5.40 | | |
Income from investment operations: | |
Net investment income | | | 0.21 | | | | 0.21 | | | | 0.09 | | | | 0.25 | | | | 0.27 | | | | 0.25 | | |
Net realized and unrealized gain (loss) | | | 0.02 | | | | (0.14 | ) | | | 0.30 | | | | (0.03 | ) | | | 0.43 | | | | 0.41 | | |
Total from investment operations | | | 0.23 | | | | 0.07 | | | | 0.39 | | | | 0.22 | | | | 0.70 | | | | 0.66 | | |
Less distributions to shareholders: | |
Net investment income | | | (0.20 | ) | | | (0.20 | ) | | | (0.09 | ) | | | (0.27 | ) | | | (0.38 | ) | | | (0.22 | ) | |
Net realized gains | | | (0.17 | ) | | | (0.02 | ) | | | — | | | | — | | | | — | | | | — | | |
Total distributions to shareholders | | | (0.37 | ) | | | (0.22 | ) | | | (0.09 | ) | | | (0.27 | ) | | | (0.38 | ) | | | (0.22 | ) | |
Net asset value, end of period | | $ | 6.12 | | | $ | 6.26 | | | $ | 6.41 | | | $ | 6.11 | | | $ | 6.16 | | | $ | 5.84 | | |
Total return | | | 3.85 | % | | | 1.09 | % | | | 6.39 | % | | | 3.65 | % | | | 12.37 | % | | | 12.30 | % | |
Ratios to average net assets(b) | |
Total gross expenses | | | 1.79 | % | | | 1.78 | % | | | 1.77 | %(c) | | | 1.78 | % | | | 1.76 | % | | | 1.74 | % | |
Total net expenses(d) | | | 1.79 | %(e) | | | 1.78 | %(e) | | | 1.77 | %(c)(e) | | | 1.77 | %(e) | | | 1.75 | %(e) | | | 1.74 | %(e) | |
Net investment income | | | 3.40 | % | | | 3.32 | % | | | 3.37 | %(c) | | | 4.15 | % | | | 4.47 | % | | | 4.43 | % | |
Supplemental data | |
Net assets, end of period (in thousands) | | $ | 16,181 | | | $ | 26,614 | | | $ | 49,873 | | | $ | 55,594 | | | $ | 61,684 | | | $ | 91,784 | | |
Portfolio turnover | | | 124 | %(f) | | | 113 | %(f) | | | 48 | %(f) | | | 83 | %(f) | | | 128 | % | | | 50 | % | |
Notes to Financial Highlights
(a) For the period from June 1, 2012 to October 31, 2012. During the period, the Fund's fiscal year end was changed from May 31 to October 31.
(b) In addition to the fees and expenses that the Fund bears directly, the Fund indirectly bears a pro rata share of the fees and expenses of any other funds in which it invests. Such indirect expenses are not included in the Fund's reported expense ratios.
(c) Annualized.
(d) Total net expenses include the impact of certain fee waivers/expense reimbursements made by the Investment Manager and certain of its affiliates, if applicable.
(e) The benefits derived from expense reductions had an impact of less than 0.01%.
(f) Includes mortgage dollar rolls. If mortgage dollar roll transactions were excluded, the portfolio turnover would have been 77%, 71%, 25% and 63% for the years ended October 31, 2014, 2013 and 2012, and year ended May 31, 2012, respectively.
The accompanying Notes to Financial Statements are an integral part of this statement.
Annual Report 2014
47
Columbia Strategic Income Fund
Financial Highlights (continued)
| | | Year Ended October 31, | | Year Ended May 31, | |
Class C | | 2014 | | 2013 | | 2012(a) | | 2012 | | 2011 | | 2010 | |
Per share data | |
Net asset value, beginning of period | | $ | 6.27 | | | $ | 6.41 | | | $ | 6.11 | | | $ | 6.17 | | | $ | 5.84 | | | $ | 5.41 | | |
Income from investment operations: | |
Net investment income | | | 0.22 | | | | 0.22 | | | | 0.09 | | | | 0.26 | | | | 0.28 | | | | 0.26 | | |
Net realized and unrealized gain (loss) | | | 0.02 | | | | (0.13 | ) | | | 0.30 | | | | (0.04 | ) | | | 0.44 | | | | 0.40 | | |
Total from investment operations | | | 0.24 | | | | 0.09 | | | | 0.39 | | | | 0.22 | | | | 0.72 | | | | 0.66 | | |
Less distributions to shareholders: | |
Net investment income | | | (0.21 | ) | | | (0.21 | ) | | | (0.09 | ) | | | (0.28 | ) | | | (0.39 | ) | | | (0.23 | ) | |
Net realized gains | | | (0.17 | ) | | | (0.02 | ) | | | — | | | | — | | | | — | | | | — | | |
Total distributions to shareholders | | | (0.38 | ) | | | (0.23 | ) | | | (0.09 | ) | | | (0.28 | ) | | | (0.39 | ) | | | (0.23 | ) | |
Net asset value, end of period | | $ | 6.13 | | | $ | 6.27 | | | $ | 6.41 | | | $ | 6.11 | | | $ | 6.17 | | | $ | 5.84 | | |
Total return | | | 4.00 | % | | | 1.40 | % | | | 6.45 | % | | | 3.64 | % | | | 12.72 | % | | | 12.26 | % | |
Ratios to average net assets(b) | |
Total gross expenses | | | 1.79 | % | | | 1.78 | % | | | 1.77 | %(c) | | | 1.78 | % | | | 1.76 | % | | | 1.74 | % | |
Total net expenses(d) | | | 1.66 | %(e) | | | 1.63 | %(e) | | | 1.62 | %(c)(e) | | | 1.62 | %(e) | | | 1.60 | %(e) | | | 1.59 | %(e) | |
Net investment income | | | 3.52 | % | | | 3.50 | % | | | 3.51 | %(c) | | | 4.28 | % | | | 4.62 | % | | | 4.47 | % | |
Supplemental data | |
Net assets, end of period (in thousands) | | $ | 186,746 | | | $ | 221,063 | | | $ | 263,736 | | | $ | 234,351 | | | $ | 185,859 | | | $ | 196,319 | | |
Portfolio turnover | | | 124 | %(f) | | | 113 | %(f) | | | 48 | %(f) | | | 83 | %(f) | | | 128 | % | | | 50 | % | |
Notes to Financial Highlights
(a) For the period from June 1, 2012 to October 31, 2012. During the period, the Fund's fiscal year end was changed from May 31 to October 31.
(b) In addition to the fees and expenses that the Fund bears directly, the Fund indirectly bears a pro rata share of the fees and expenses of any other funds in which it invests. Such indirect expenses are not included in the Fund's reported expense ratios.
(c) Annualized.
(d) Total net expenses include the impact of certain fee waivers/expense reimbursements made by the Investment Manager and certain of its affiliates, if applicable.
(e) The benefits derived from expense reductions had an impact of less than 0.01%.
(f) Includes mortgage dollar rolls. If mortgage dollar roll transactions were excluded, the portfolio turnover would have been 77%, 71%, 25% and 63% for the years ended October 31, 2014, 2013 and 2012, and year ended May 31, 2012, respectively.
The accompanying Notes to Financial Statements are an integral part of this statement.
Annual Report 2014
48
Columbia Strategic Income Fund
Financial Highlights (continued)
| | | Year Ended October 31, | | Year Ended May 31, | |
Class K | | 2014 | | 2013 | | 2012(a) | | 2012 | | 2011(b) | |
Per share data | |
Net asset value, beginning of period | | $ | 6.18 | | | $ | 6.33 | | | $ | 6.04 | | | $ | 6.09 | | | $ | 6.01 | | |
Income from investment operations: | |
Net investment income | | | 0.26 | | | | 0.26 | | | | 0.11 | | | | 0.30 | | | | 0.07 | | |
Net realized and unrealized gain (loss) | | | 0.02 | | | | (0.14 | ) | | | 0.29 | | | | (0.03 | ) | | | 0.09 | | |
Total from investment operations | | | 0.28 | | | | 0.12 | | | | 0.40 | | | | 0.27 | | | | 0.16 | | |
Less distributions to shareholders: | |
Net investment income | | | (0.25 | ) | | | (0.25 | ) | | | (0.11 | ) | | | (0.32 | ) | | | (0.08 | ) | |
Net realized gains | | | (0.17 | ) | | | (0.02 | ) | | | — | | | | — | | | | — | | |
Total distributions to shareholders | | | (0.42 | ) | | | (0.27 | ) | | | (0.11 | ) | | | (0.32 | ) | | | (0.08 | ) | |
Net asset value, end of period | | $ | 6.04 | | | $ | 6.18 | | | $ | 6.33 | | | $ | 6.04 | | | $ | 6.09 | | |
Total return | | | 4.83 | % | | | 1.99 | % | | | 6.68 | % | | | 4.59 | % | | | 2.62 | % | |
Ratios to average net assets(c) | |
Total gross expenses | | | 0.92 | % | | | 0.91 | % | | | 0.91 | %(d) | | | 0.90 | % | | | 0.89 | %(d) | |
Total net expenses(e) | | | 0.92 | % | | | 0.91 | % | | | 0.91 | %(d)(f) | | | 0.90 | %(f) | | | 0.89 | %(d)(f) | |
Net investment income | | | 4.27 | % | | | 4.22 | % | | | 4.22 | %(d) | | | 5.00 | % | | | 5.19 | %(d) | |
Supplemental data | |
Net assets, end of period (in thousands) | | $ | 156 | | | $ | 172 | | | $ | 182 | | | $ | 219 | | | $ | 3 | | |
Portfolio turnover | | | 124 | %(g) | | | 113 | %(g) | | | 48 | %(g) | | | 83 | %(g) | | | 128 | % | |
Notes to Financial Highlights
(a) For the period from June 1, 2012 to October 31, 2012. During the period, the Fund's fiscal year end was changed from May 31 to October 31.
(b) Based on operations from March 7, 2011 (commencement of operations) through the stated period end.
(c) In addition to the fees and expenses that the Fund bears directly, the Fund indirectly bears a pro rata share of the fees and expenses of any other funds in which it invests. Such indirect expenses are not included in the Fund's reported expense ratios.
(d) Annualized.
(e) Total net expenses include the impact of certain fee waivers/expense reimbursements made by the Investment Manager and certain of its affiliates, if applicable.
(f) The benefits derived from expense reductions had an impact of less than 0.01%.
(g) Includes mortgage dollar rolls. If mortgage dollar roll transactions were excluded, the portfolio turnover would have been 77%, 71%, 25% and 63% for the years ended October 31, 2014, 2013 and 2012, and year ended May 31, 2012, respectively.
The accompanying Notes to Financial Statements are an integral part of this statement.
Annual Report 2014
49
Columbia Strategic Income Fund
Financial Highlights (continued)
| | | Year Ended October 31, | | Year Ended May 31, | |
Class R | | 2014 | | 2013 | | 2012(a) | | 2012 | | 2011(b) | |
Per share data | |
Net asset value, beginning of period | | $ | 6.30 | | | $ | 6.44 | | | $ | 6.14 | | | $ | 6.19 | | | $ | 6.16 | | |
Income from investment operations: | |
Net investment income | | | 0.24 | | | | 0.25 | | | | 0.10 | | | | 0.27 | | | | 0.22 | | |
Net realized and unrealized gain (loss) | | | 0.02 | | | | (0.14 | ) | | | 0.30 | | | | (0.02 | ) | | | 0.13 | | |
Total from investment operations | | | 0.26 | | | | 0.11 | | | | 0.40 | | | | 0.25 | | | | 0.35 | | |
Less distributions to shareholders: | |
Net investment income | | | (0.23 | ) | | | (0.23 | ) | | | (0.10 | ) | | | (0.30 | ) | | | (0.32 | ) | |
Net realized gains | | | (0.17 | ) | | | (0.02 | ) | | | — | | | | — | | | | — | | |
Total distributions to shareholders | | | (0.40 | ) | | | (0.25 | ) | | | (0.10 | ) | | | (0.30 | ) | | | (0.32 | ) | |
Net asset value, end of period | | $ | 6.16 | | | $ | 6.30 | | | $ | 6.44 | | | $ | 6.14 | | | $ | 6.19 | | |
Total return | | | 4.35 | % | | | 1.74 | % | | | 6.58 | % | | | 4.20 | % | | | 5.86 | % | |
Ratios to average net assets(c) | |
Total gross expenses | | | 1.29 | % | | | 1.29 | % | | | 1.27 | %(d) | | | 1.29 | % | | | 1.36 | %(d) | |
Total net expenses(e) | | | 1.29 | %(f) | | | 1.29 | %(f) | | | 1.27 | %(d)(f) | | | 1.27 | %(f) | | | 1.25 | %(d)(f) | |
Net investment income | | | 3.88 | % | | | 3.92 | % | | | 3.82 | %(d) | | | 4.44 | % | | | 5.31 | %(d) | |
Supplemental data | |
Net assets, end of period (in thousands) | | $ | 1,629 | | | $ | 1,220 | | | $ | 218 | | | $ | 71 | | | $ | 3 | | |
Portfolio turnover | | | 124 | %(g) | | | 113 | %(g) | | | 48 | %(g) | | | 83 | %(g) | | | 128 | % | |
Notes to Financial Highlights
(a) For the period from June 1, 2012 to October 31, 2012. During the period, the Fund's fiscal year end was changed from May 31 to October 31.
(b) Based on operations from September 27, 2010 (commencement of operations) through the stated period end.
(c) In addition to the fees and expenses that the Fund bears directly, the Fund indirectly bears a pro rata share of the fees and expenses of any other funds in which it invests. Such indirect expenses are not included in the Fund's reported expense ratios.
(d) Annualized.
(e) Total net expenses include the impact of certain fee waivers/expense reimbursements made by the Investment Manager and certain of its affiliates, if applicable.
(f) The benefits derived from expense reductions had an impact of less than 0.01%.
(g) Includes mortgage dollar rolls. If mortgage dollar roll transactions were excluded, the portfolio turnover would have been 77%, 71%, 25% and 63% for the years ended October 31, 2014, 2013 and 2012, and year ended May 31, 2012, respectively.
The accompanying Notes to Financial Statements are an integral part of this statement.
Annual Report 2014
50
Columbia Strategic Income Fund
Financial Highlights (continued)
| | | Year Ended October 31, | |
Class R4 | | 2014 | | 2013(a) | |
Per share data | |
Net asset value, beginning of period | | $ | 6.18 | | | $ | 6.34 | | |
Income from investment operations: | |
Net investment income | | | 0.26 | | | | 0.27 | | |
Net realized and unrealized gain (loss) | | | 0.03 | | | | (0.15 | ) | |
Total from investment operations | | | 0.29 | | | | 0.12 | | |
Less distributions to shareholders: | |
Net investment income | | | (0.26 | ) | | | (0.26 | ) | |
Net realized gains | | | (0.17 | ) | | | (0.02 | ) | |
Total distributions to shareholders | | | (0.43 | ) | | | (0.28 | ) | |
Net asset value, end of period | | $ | 6.04 | | | $ | 6.18 | | |
Total return | | | 4.98 | % | | | 1.97 | % | |
Ratios to average net assets(b) | |
Total gross expenses | | | 0.79 | % | | | 0.80 | %(c) | |
Total net expenses(d) | | | 0.79 | %(e) | | | 0.79 | %(c)(e) | |
Net investment income | | | 4.36 | % | | | 4.54 | %(c) | |
Supplemental data | |
Net assets, end of period (in thousands) | | $ | 5,683 | | | $ | 3,389 | | |
Portfolio turnover | | | 124 | %(f) | | | 113 | %(f) | |
Notes to Financial Highlights
(a) Based on operations from November 8, 2012 (commencement of operations) through the stated period end.
(b) In addition to the fees and expenses that the Fund bears directly, the Fund indirectly bears a pro rata share of the fees and expenses of any other funds in which it invests. Such indirect expenses are not included in the Fund's reported expense ratios.
(c) Annualized.
(d) Total net expenses include the impact of certain fee waivers/expense reimbursements made by the Investment Manager and certain of its affiliates, if applicable.
(e) The benefits derived from expense reductions had an impact of less than 0.01%.
(f) Includes mortgage dollar rolls. If mortgage dollar roll transactions were excluded, the portfolio turnover would have been 77% and 71% for the years ended October 31, 2014 and 2013, respectively.
The accompanying Notes to Financial Statements are an integral part of this statement.
Annual Report 2014
51
Columbia Strategic Income Fund
Financial Highlights (continued)
| | | Year Ended October 31, | | Year Ended May 31, | |
Class R5 | | 2014 | | 2013 | | 2012(a) | | 2012 | | 2011(b) | |
Per share data | |
Net asset value, beginning of period | | $ | 6.19 | | | $ | 6.33 | | | $ | 6.04 | | | $ | 6.09 | | | $ | 6.01 | | |
Income from investment operations: | |
Net investment income | | | 0.27 | | | | 0.29 | | | | 0.12 | | | | 0.32 | | | | 0.08 | | |
Net realized and unrealized gain (loss) | | | 0.02 | | | | (0.14 | ) | | | 0.29 | | | | (0.03 | ) | | | 0.08 | | |
Total from investment operations | | | 0.29 | | | | 0.15 | | | | 0.41 | | | | 0.29 | | | | 0.16 | | |
Less distributions to shareholders: | |
Net investment income | | | (0.27 | ) | | | (0.27 | ) | | | (0.12 | ) | | | (0.34 | ) | | | (0.08 | ) | |
Net realized gains | | | (0.17 | ) | | | (0.02 | ) | | | — | | | | — | | | | — | | |
Total distributions to shareholders | | | (0.44 | ) | | | (0.29 | ) | | | (0.12 | ) | | | (0.34 | ) | | | (0.08 | ) | |
Net asset value, end of period | | $ | 6.04 | | | $ | 6.19 | | | $ | 6.33 | | | $ | 6.04 | | | $ | 6.09 | | |
Total return | | | 4.92 | % | | | 2.39 | % | | | 6.79 | % | | | 4.86 | % | | | 2.68 | % | |
Ratios to average net assets(c) | |
Total gross expenses | | | 0.67 | % | | | 0.69 | % | | | 0.66 | %(d) | | | 0.65 | % | | | 0.63 | %(d) | |
Total net expenses(e) | | | 0.67 | % | | | 0.69 | % | | | 0.66 | %(d)(f) | | | 0.65 | %(f) | | | 0.63 | %(d)(f) | |
Net investment income | | | 4.47 | % | | | 4.73 | % | | | 4.50 | %(d) | | | 5.26 | % | | | 5.45 | %(d) | |
Supplemental data | |
Net assets, end of period (in thousands) | | $ | 4,193 | | | $ | 1,563 | | | $ | 8 | | | $ | 277 | | | $ | 3 | | |
Portfolio turnover | | | 124 | %(g) | | | 113 | %(g) | | | 48 | %(g) | | | 83 | %(g) | | | 128 | % | |
Notes to Financial Highlights
(a) For the period from June 1, 2012 to October 31, 2012. During the period, the Fund's fiscal year end was changed from May 31 to October 31.
(b) Based on operations from March 7, 2011 (commencement of operations) through the stated period end.
(c) In addition to the fees and expenses that the Fund bears directly, the Fund indirectly bears a pro rata share of the fees and expenses of any other funds in which it invests. Such indirect expenses are not included in the Fund's reported expense ratios.
(d) Annualized.
(e) Total net expenses include the impact of certain fee waivers/expense reimbursements made by the Investment Manager and certain of its affiliates, if applicable.
(f) The benefits derived from expense reductions had an impact of less than 0.01%.
(g) Includes mortgage dollar rolls. If mortgage dollar roll transactions were excluded, the portfolio turnover would have been 77%, 71%, 25% and 63% for the years ended October 31, 2014, 2013 and 2012, and year ended May 31, 2012, respectively.
The accompanying Notes to Financial Statements are an integral part of this statement.
Annual Report 2014
52
Columbia Strategic Income Fund
Financial Highlights (continued)
| | | Year Ended October 31, | | Year Ended May 31, | |
Class W | | 2014 | | 2013 | | 2012(a) | | 2012 | | 2011(b) | |
Per share data | |
Net asset value, beginning of period | | $ | 6.26 | | | $ | 6.41 | | | $ | 6.10 | | | $ | 6.16 | | | $ | 6.16 | | |
Income from investment operations: | |
Net investment income | | | 0.25 | | | | 0.27 | | | | 0.11 | | | | 0.30 | | | | 0.21 | | |
Net realized and unrealized gain (loss) | | | 0.03 | | | | (0.15 | ) | | | 0.31 | | | | (0.04 | ) | | | 0.12 | | |
Total from investment operations | | | 0.28 | | | | 0.12 | | | | 0.42 | | | | 0.26 | | | | 0.33 | | |
Less distributions to shareholders: | |
Net investment income | | | (0.25 | ) | | | (0.25 | ) | | | (0.11 | ) | | | (0.32 | ) | | | (0.33 | ) | |
Net realized gains | | | (0.17 | ) | | | (0.02 | ) | | | — | | | | — | | | | — | | |
Total distributions to shareholders | | | (0.42 | ) | | | (0.27 | ) | | | (0.11 | ) | | | (0.32 | ) | | | (0.33 | ) | |
Net asset value, end of period | | $ | 6.12 | | | $ | 6.26 | | | $ | 6.41 | | | $ | 6.10 | | | $ | 6.16 | | |
Total return | | | 4.67 | % | | | 1.91 | % | | | 6.90 | % | | | 4.34 | % | | | 5.53 | % | |
Ratios to average net assets(c) | |
Total gross expenses | | | 1.04 | % | | | 0.97 | % | | | 1.00 | %(d) | | | 1.03 | % | | | 0.89 | %(d) | |
Total net expenses(e) | | | 1.04 | %(f) | | | 0.97 | %(f) | | | 1.00 | %(d)(f) | | | 1.02 | %(f) | | | 0.89 | %(d)(f) | |
Net investment income | | | 4.08 | % | | | 4.21 | % | | | 4.19 | %(d) | | | 4.89 | % | | | 5.10 | %(d) | |
Supplemental data | |
Net assets, end of period (in thousands) | | $ | 10 | | | $ | 3 | | | $ | 3 | | | $ | 2 | | | $ | 3 | | |
Portfolio turnover | | | 124 | %(g) | | | 113 | %(g) | | | 48 | %(g) | | | 83 | %(g) | | | 128 | % | |
Notes to Financial Highlights
(a) For the period from June 1, 2012 to October 31, 2012. During the period, the Fund's fiscal year end was changed from May 31 to October 31.
(b) Based on operations from September 27, 2010 (commencement of operations) through the stated period end.
(c) In addition to the fees and expenses that the Fund bears directly, the Fund indirectly bears a pro rata share of the fees and expenses of any other funds in which it invests. Such indirect expenses are not included in the Fund's reported expense ratios.
(d) Annualized.
(e) Total net expenses include the impact of certain fee waivers/expense reimbursements made by the Investment Manager and certain of its affiliates, if applicable.
(f) The benefits derived from expense reductions had an impact of less than 0.01%.
(g) Includes mortgage dollar rolls. If mortgage dollar roll transactions were excluded, the portfolio turnover would have been 77%, 71%, 25% and 63% for the years ended October 31, 2014, 2013 and 2012, and year ended May 31, 2012, respectively.
The accompanying Notes to Financial Statements are an integral part of this statement.
Annual Report 2014
53
Columbia Strategic Income Fund
Financial Highlights (continued)
| | | Year Ended October 31, | |
Class Y | | 2014 | | 2013(a) | |
Per share data | |
Net asset value, beginning of period | | $ | 6.17 | | | $ | 6.18 | | |
Income from investment operations: | |
Net investment income | | | 0.27 | | | | 0.11 | | |
Net realized and unrealized gain (loss) | | | 0.03 | | | | (0.02 | ) | |
Total from investment operations | | | 0.30 | | | | 0.09 | | |
Less distributions to shareholders: | |
Net investment income | | | (0.27 | ) | | | (0.10 | ) | |
Net realized gains | | | (0.17 | ) | | | — | | |
Total distributions to shareholders | | | (0.44 | ) | | | (0.10 | ) | |
Net asset value, end of period | | $ | 6.03 | | | $ | 6.17 | | |
Total return | | | 5.15 | % | | | 1.57 | % | |
Ratios to average net assets(b) | |
Total gross expenses | | | 0.63 | % | | | 0.64 | %(c) | |
Total net expenses(d) | | | 0.63 | % | | | 0.64 | %(c) | |
Net investment income | | | 4.50 | % | | | 4.94 | %(c) | |
Supplemental data | |
Net assets, end of period (in thousands) | | $ | 1,582 | | | $ | 19 | | |
Portfolio turnover | | | 124 | %(e) | | | 113 | %(e) | |
Notes to Financial Highlights
(a) Based on operations from June 13, 2013 (commencement of operations) through the stated period end.
(b) In addition to the fees and expenses that the Fund bears directly, the Fund indirectly bears a pro rata share of the fees and expenses of any other funds in which it invests. Such indirect expenses are not included in the Fund's reported expense ratios.
(c) Annualized.
(d) Total net expenses include the impact of certain fee waivers/expense reimbursements made by the Investment Manager and certain of its affiliates, if applicable.
(e) Includes mortgage dollar rolls. If mortgage dollar roll transactions were excluded, the portfolio turnover would have been 77% and 71% for the years ended October 31, 2014 and 2013, respectively.
The accompanying Notes to Financial Statements are an integral part of this statement.
Annual Report 2014
54
Columbia Strategic Income Fund
Financial Highlights (continued)
| | | Year Ended October 31, | | Year Ended May 31, | |
Class Z | | 2014 | | 2013 | | 2012(a) | | 2012 | | 2011 | | 2010 | |
Per share data | |
Net asset value, beginning of period | | $ | 6.18 | | | $ | 6.33 | | | $ | 6.04 | | | $ | 6.09 | | | $ | 5.78 | | | $ | 5.35 | | |
Income from investment operations: | |
Net investment income | | | 0.27 | | | | 0.27 | | | | 0.11 | | | | 0.31 | | | | 0.33 | | | | 0.31 | | |
Net realized and unrealized gain (loss) | | | 0.02 | | | | (0.14 | ) | | | 0.29 | | | | (0.03 | ) | | | 0.42 | | | | 0.39 | | |
Total from investment operations | | | 0.29 | | | | 0.13 | | | | 0.40 | | | | 0.28 | | | | 0.75 | | | | 0.70 | | |
Less distributions to shareholders: | |
Net investment income | | | (0.26 | ) | | | (0.26 | ) | | | (0.11 | ) | | | (0.33 | ) | | | (0.44 | ) | | | (0.27 | ) | |
Net realized gains | | | (0.17 | ) | | | (0.02 | ) | | | — | | | | — | | | | — | | | | — | | |
Total distributions to shareholders | | | (0.43 | ) | | | (0.28 | ) | | | (0.11 | ) | | | (0.33 | ) | | | (0.44 | ) | | | (0.27 | ) | |
Net asset value, end of period | | $ | 6.04 | | | $ | 6.18 | | | $ | 6.33 | | | $ | 6.04 | | | $ | 6.09 | | | $ | 5.78 | | |
Total return | | | 4.97 | % | | | 2.13 | % | | | 6.74 | % | | | 4.75 | % | | | 13.46 | % | | | 13.36 | % | |
Ratios to average net assets(b) | |
Total gross expenses | | | 0.79 | % | | | 0.78 | % | | | 0.77 | %(c) | | | 0.78 | % | | | 0.76 | % | | | 0.74 | % | |
Total net expenses(d) | | | 0.79 | %(e) | | | 0.78 | %(e) | | | 0.77 | %(c)(e) | | | 0.77 | %(e) | | | 0.75 | %(e) | | | 0.74 | %(e) | |
Net investment income | | | 4.39 | % | | | 4.34 | % | | | 4.37 | %(c) | | | 5.13 | % | | | 5.47 | % | | | 5.35 | % | |
Supplemental data | |
Net assets, end of period (in thousands) | | $ | 663,669 | | | $ | 755,920 | | | $ | 985,278 | | | $ | 812,836 | | | $ | 660,970 | | | $ | 714,358 | | |
Portfolio turnover | | | 124 | %(f) | | | 113 | %(f) | | | 48 | %(f) | | | 83 | %(f) | | | 128 | % | | | 50 | % | |
Notes to Financial Highlights
(a) For the period from June 1, 2012 to October 31, 2012. During the period, the Fund's fiscal year end was changed from May 31 to October 31.
(b) In addition to the fees and expenses that the Fund bears directly, the Fund indirectly bears a pro rata share of the fees and expenses of any other funds in which it invests. Such indirect expenses are not included in the Fund's reported expense ratios.
(c) Annualized.
(d) Total net expenses include the impact of certain fee waivers/expense reimbursements made by the Investment Manager and certain of its affiliates, if applicable.
(e) The benefits derived from expense reductions had an impact of less than 0.01%.
(f) Includes mortgage dollar rolls. If mortgage dollar roll transactions were excluded, the portfolio turnover would have been 77%, 71%, 25% and 63% for the years ended October 31, 2014, 2013 and 2012, and year ended May 31, 2012, respectively.
The accompanying Notes to Financial Statements are an integral part of this statement.
Annual Report 2014
55
Columbia Strategic Income Fund
Notes to Financial Statements
October 31, 2014
Note 1. Organization
Columbia Strategic Income Fund (the Fund), a series of Columbia Funds Series Trust I (the Trust), is a diversified fund. The Trust is registered under the Investment Company Act of 1940, as amended (the 1940 Act), as an open-end management investment company organized as a Massachusetts business trust.
Fund Shares
The Trust may issue an unlimited number of shares (without par value). The Fund offers Class A, Class B, Class C, Class K, Class R, Class R4, Class R5, Class W, Class Y and Class Z shares. Although all share classes generally have identical voting, dividend and liquidation rights, each share class votes separately when required by the Trust's organizational documents or by law. Different share classes pay different distribution amounts to the extent the expenses of such share classes differ, and distributions in liquidation will be proportional to the net asset value of each share class. Each share class has its own expense structure and sales charges.
Class A shares are subject to a maximum front-end sales charge of 4.75% based on the initial investment amount. Class A shares purchased without an initial sales charge in accounts aggregating $1 million to $50 million at the time of purchase are subject to a contingent deferred sales charge (CDSC) if the shares are sold within 18 months of purchase, charged as follows: 1.00% CDSC if redeemed within 12 months of purchase, and 0.50% CDSC if redeemed more than 12, but less than 18, months after purchase.
Class B shares may be subject to a maximum CDSC of 5.00% based upon the holding period after purchase. Class B shares will generally convert to Class A shares eight years after purchase. The Fund no longer accepts investments by new or existing investors in the Fund's Class B shares, except in connection with the reinvestment of any dividend and/or capital gain distributions in Class B shares of the Fund and exchanges by existing Class B shareholders of certain other funds within the Columbia Family of Funds.
Class C shares are subject to a 1.00% CDSC on shares redeemed within one year of purchase.
Class K shares are not subject to sales charges, however this share class is closed to new investors.
Class R shares are not subject to sales charges and are generally available only to certain retirement plans and other investors as described in the Fund's prospectus.
Class R4 shares are not subject to sales charges and are generally available only to omnibus retirement plans and certain investors as described in the Fund's prospectus.
Class R5 shares are not subject to sales charges and are generally available only to investors purchasing through authorized investment professionals and omnibus retirement plans.
Class W shares are not subject to sales charges and are available only to investors purchasing through authorized investment programs managed by investment professionals, including discretionary managed account programs.
Class Y shares are not subject to sales charges and are generally available only to certain retirement plans as described in the Fund's prospectus.
Class Z shares are not subject to sales charges and are available only to eligible investors, which are subject to different investment minimums as described in the Fund's prospectus.
Note 2. Summary of Significant Accounting Policies
Basis of Preparation
The Fund is an investment company that applies the accounting and reporting guidance in the Financial Accounting Standards Board (FASB) Accounting Standards Codification Topic 946, Financial Services — Investment Companies (ASC 946). The financial statements are prepared in accordance with U.S. generally accepted accounting principles (GAAP) which requires management to make certain estimates and assumptions that affect the reported amounts of assets and liabilities, the disclosure of contingent assets and liabilities at the date of the financial statements and the reported amounts of income and expenses during the reporting period. Actual results could differ from those estimates.
The following is a summary of significant accounting policies followed by the Fund in the preparation of its financial statements.
Security Valuation
Debt securities generally are valued by pricing services approved by the Board of Trustees (the Board) based upon market transactions for normal, institutional-size trading units of similar securities. The services may use various pricing techniques that take into account, as applicable, factors such as yield, quality, coupon rate, maturity, type of issue, trading characteristics and other data, as well as broker quotes. Debt securities for which quotations are readily available may also be valued based upon an over-the-counter or exchange bid quotation.
Asset and mortgage-backed securities are generally valued by pricing services, which utilize pricing models that incorporate the securities' cash flow and loan performance data. These
Annual Report 2014
56
Columbia Strategic Income Fund
Notes to Financial Statements (continued)
October 31, 2014
models also take into account available market data, including trades, market quotations, and benchmark yield curves for identical or similar securities. Factors used to identify similar securities may include, but are not limited to, issuer, collateral type, vintage, prepayment speeds, collateral performance, credit ratings, credit enhancement and expected life. Asset-backed securities for which quotations are readily available may also be valued based upon an over-the-counter or exchange bid quotation.
Senior loan securities for which reliable market quotations are readily available are generally valued by pricing services at the average of the bids received.
All equity securities are valued at the close of business of the New York Stock Exchange (NYSE). Equity securities are valued at the last quoted sales price on the principal exchange or market on which they trade, except for securities traded on the NASDAQ Stock Market, which are valued at the NASDAQ official close price. Unlisted securities or listed securities for which there were no sales during the day are valued at the mean of the latest quoted bid and ask prices on such exchanges or markets.
Foreign equity securities are valued based on quotations from the principal market in which such securities are traded. If any foreign security prices are not readily available as a result of limited share activity, the securities are valued at the mean of the latest quoted bid and ask prices on such exchanges or markets. Foreign currency exchange rates are generally determined at 4:00 p.m. Eastern (U.S.) time. Many securities markets and exchanges outside the U.S. close prior to the close of the NYSE; therefore, the closing prices for securities in such markets or on such exchanges may not fully reflect events that occur after such close but before the close of the NYSE. In those situations, foreign securities will be fair valued pursuant to a policy adopted by the Board, including, if available, utilizing a third party pricing service to determine these fair values. The third party pricing service takes into account multiple factors, including, but not limited to, movements in the U.S. securities markets, certain depositary receipts, futures contracts and foreign exchange rates that have occurred subsequent to the close of the foreign exchange or market, to determine a good faith estimate that reasonably reflects the current market conditions as of the close of the NYSE. The fair value of a security is likely to be different from the quoted or published price, if available.
Investments in open-end investment companies, including money market funds, are valued at their net asset value.
Forward foreign currency exchange contracts are marked-to-market based upon foreign currency exchange rates provided by a pricing service.
Futures and options on futures contracts are valued based upon the settlement price established each day by the board of trade or exchange on which they are traded.
Swap transactions are valued through an independent pricing service or broker, or if neither is available, through an internal model based upon observable inputs.
Investments for which market quotations are not readily available, or that have quotations which management believes are not reliable, are valued at fair value as determined in good faith under procedures established by and under the general supervision of the Board. If a security or class of securities (such as foreign securities) is valued at fair value, such value is likely to be different from the quoted or published price for the security.
The determination of fair value often requires significant judgment. To determine fair value, management may use assumptions including but not limited to future cash flows and estimated risk premiums. Multiple inputs from various sources may be used to determine fair value.
Foreign Currency Transactions and Translations
The values of all assets and liabilities denominated in foreign currencies are generally translated into U.S. dollars at exchange rates determined at the close of the NYSE. Net realized and unrealized gains (losses) on foreign currency transactions and translations include gains (losses) arising from the fluctuation in exchange rates between trade and settlement dates on securities transactions, gains (losses) arising from the disposition of foreign currency and currency gains (losses) between the accrual and payment dates on dividends, interest income and foreign withholding taxes.
For financial statement purposes, the Fund does not distinguish that portion of gains (losses) on investments which is due to changes in foreign exchange rates from that which is due to changes in market prices of the investments. Such fluctuations are included with the net realized and unrealized gains (losses) on investments in the Statement of Operations.
Derivative Instruments
The Fund invests in certain derivative instruments, as detailed below, to meet its investment objectives. Derivatives are instruments whose values depend on, or are derived from, in whole or in part, the value of one or more other assets, such as securities, currencies, commodities or indices. Derivative instruments may be used to increase investment flexibility (including to maintain cash reserves while maintaining exposure to certain other assets), for risk management (hedging) purposes, to facilitate trading, to reduce transaction costs and to pursue higher investment returns. The Fund may also use derivative instruments to mitigate certain investment
Annual Report 2014
57
Columbia Strategic Income Fund
Notes to Financial Statements (continued)
October 31, 2014
risks, such as foreign currency exchange rate risk, interest rate risk and credit risk. Derivatives may involve various risks, including the potential inability of the counterparty to fulfill its obligation under the terms of the contract, the potential for an illiquid secondary market (making it difficult for the Fund to sell, including at favorable prices) and the potential for market movements which may expose the Fund to gains or losses in excess of the amount shown in the Statement of Assets and Liabilities. The notional amounts of derivative instruments, if applicable, are not recorded in the financial statements.
A derivative instrument may suffer a marked-to-market loss if the value of the contract decreases due to an unfavorable change in the market rates or values of the underlying instrument. Losses can also occur if the counterparty does not perform under the contract. The Fund's risk of loss from counterparty credit risk on over-the-counter derivatives is generally limited to the aggregate unrealized gain netted against any collateral held by the Fund and the amount of any variation margin held by the counterparty. With exchange-traded or centrally cleared derivatives, there is reduced counterparty credit risk to the Fund since the exchange's clearinghouse, as counterparty to such instruments, guarantees against a possible default. The clearinghouse stands between the buyer and the seller of the contract; therefore, the counterparty credit risk is failure of the clearinghouse. However, credit risk still exists in exchange-traded or centrally cleared derivatives with respect to initial and variation margin that is held in a broker's customer account. While brokers are required to segregate customer margin from their own assets, in the event that a broker becomes insolvent or goes into bankruptcy and at that time there is a shortfall in the aggregate amount of margin held by the broker for all its clients, U.S. bankruptcy laws will typically allocate that shortfall on a pro-rata basis across all the broker's customers (including the Fund), potentially resulting in losses to the Fund.
In order to better define its contractual rights and to secure rights that will help the Fund mitigate its counterparty risk, the Fund may enter into an International Swaps and Derivatives Association, Inc. Master Agreement (ISDA Master Agreement) or similar agreement with its derivative contract counterparties. An ISDA Master Agreement is an agreement between the Fund and a counterparty that governs over-the-counter derivatives and forward foreign currency exchange contracts and typically contains, among other things, collateral posting terms and netting provisions in the event of a default and/or termination event. Under an ISDA Master Agreement, the Fund may, under certain circumstances, offset with the counterparty certain derivative instrument's payables
and/or receivables with collateral held and/or posted and create one single net payment. The provisions of the ISDA Master Agreement typically permit a single net payment in the event of default (close-out netting) including the bankruptcy or insolvency of the counterparty. Note, however, that bankruptcy or insolvency laws of a particular jurisdiction may impose restrictions on or prohibitions against the right of offset in bankruptcy, insolvency or other events.
Collateral (margin) requirements differ by type of derivative. Margin requirements are established by the exchange or clearinghouse for exchange-traded and centrally cleared derivatives. Brokers can ask for margin in excess of the minimum in certain circumstances. Collateral terms are contract specific for over-the-counter derivatives. For over-the-counter derivatives traded under an ISDA Master Agreement, the collateral requirements are typically calculated by netting the marked-to-market amount for each transaction under such agreement and comparing that amount to the value of any variation margin currently pledged by the Fund and/or the counterparty. Generally, the amount of collateral due from or to a party has to exceed a minimum transfer amount threshold (e.g., $500,000) before a transfer has to be made. To the extent amounts due to the Fund from its counterparties are not fully collateralized, contractually or otherwise, the Fund bears the risk of loss from counterparty nonperformance. The Fund attempts to mitigate counterparty risk by only entering into agreements with counterparties that it believes have the financial resources to honor their obligations and by monitoring the financial stability of those counterparties.
Certain ISDA Master Agreements allow counterparties to over-the-counter derivatives to terminate derivative contracts prior to maturity in the event the Fund's net assets decline by a stated percentage over a specified time period or if the Fund fails to meet the terms of the ISDA Master Agreement, which would cause the Fund to accelerate payment of any net liability owed to the counterparty. The Fund also has termination rights if the counterparty fails to meet the terms of the ISDA Master Agreement. In addition to considering counterparty credit risk, the Fund would consider terminating the derivative contracts based on whether termination would result in a net liability owed from the counterparty.
For financial reporting purposes, the Fund does not offset derivative assets and derivative liabilities that are subject to netting arrangements in the Statement of Assets and Liabilities.
Forward Foreign Currency Exchange Contracts
Forward foreign currency exchange contracts are over-the-counter agreements between two parties to buy and sell a currency at a set price on a future date. The Fund
Annual Report 2014
58
Columbia Strategic Income Fund
Notes to Financial Statements (continued)
October 31, 2014
utilized forward foreign currency exchange contracts to hedge the currency exposure associated with some or all of the Fund's securities and to shift investment exposure from one currency to another. These instruments may be used for other purposes in future periods.
The values of forward foreign currency exchange contracts fluctuate daily with changes in foreign currency exchange rates. Changes in the value of these contracts are recorded as unrealized appreciation or depreciation until the contract is exercised or has expired. The Fund will realize a gain or loss when the forward foreign currency exchange contract is closed or expires.
The use of forward foreign currency exchange contracts does not eliminate fluctuations in the prices of the Fund's portfolio securities. The risks of forward foreign currency exchange contracts include movement in the values of the foreign currencies relative to the U.S. dollar (or other foreign currencies) and the possibility that counterparties will not complete their contractual obligations, which may be in excess of the amount reflected, if any, in the Statement of Assets and Liabilities.
Futures Contracts
Futures contracts are exchange traded and represent commitments for the future purchase or sale of an asset at a specified price on a specified date. The Fund bought and sold futures contracts to manage the duration and yield curve exposure of the Fund versus the benchmark. These instruments may be used for other purposes in future periods. Upon entering into futures contracts, the Fund bears risks that it may not achieve the anticipated benefits of the futures contracts and may realize a loss. Additional risks include counterparty credit risk, the possibility of an illiquid market, and that a change in the value of the contract or option may not correlate with changes in the value of the underlying asset.
Upon entering into a futures contract, the Fund pledges cash or securities with the broker in an amount sufficient to meet the initial margin requirement. The initial margin deposit must be maintained at an established level over the life of the contract. Cash deposited as initial margin is recorded in the Statement of Assets and Liabilities as margin deposits. Securities deposited as initial margin are designated in the Portfolio of Investments. Subsequent payments (variation margin) are made or received by the Fund each day. The variation margin payments are equal to the daily change in the contract value and are recorded as variation margin receivable or payable and are offset in unrealized gains or losses. The Fund recognizes a realized gain or loss when the contract is closed or expires. Futures contracts involve, to varying degrees, risk of loss in excess of the variation margin disclosed in the Statement of Assets and Liabilities.
Swap Contracts
Swap contracts are privately negotiated in the over-the-counter market and may be entered into as a bilateral contract or centrally cleared (centrally cleared swap contract). In a centrally cleared swap contract, immediately following execution of the swap contract with a broker, the swap contract is novated to a central counterparty (the CCP) and the CCP becomes the Fund's counterparty to the centrally cleared swap contract. The Fund is required to deposit initial margin with the broker in the form of cash or securities in an amount that varies depending on the size and risk profile of the particular swap contract. Securities deposited as initial margin are designated in the Portfolio of Investments and cash deposited is recorded in the Statement of Assets and Liabilities as margin deposits. Unlike a bilateral swap contract, for centrally cleared swap contracts, the Fund has minimal credit exposure to the counterparty because the CCP stands between the Fund and the counterparty. Swap contracts are marked-to-market daily and changes in value are recorded as unrealized appreciation (depreciation). The daily change in valuation of centrally cleared swap contracts, if any, is recorded as a receivable or payable for variation margin in the Statements of Assets and Liabilities.
Credit Default Swap Contracts
The Fund entered into credit default swap contracts to increase or decrease its credit exposure to an index. These instruments may be used for other purposes in future periods. Credit default swap contracts are agreements in which one party pays fixed periodic payments to a counterparty in consideration for a guarantee from the counterparty to make a specific payment should a specified credit event(s) take place. Although specified credit events are contract specific, credit events are generally defined as bankruptcy, failure to pay, restructuring, obligation acceleration, obligation default, or repudiation/moratorium.
As the purchaser of a credit default swap contract, the Fund purchases protection by paying a periodic interest rate on the notional amount to the counterparty. The interest amount is accrued daily as a component of unrealized appreciation (depreciation) and is recorded as a realized loss upon payment. If a credit event as specified in the contract occurs, the Fund may have the option either to deliver the reference obligation to the seller in exchange for a cash payment of its par amount, or to receive a net cash settlement equal to the par amount less an agreed-upon value of the reference obligation as of the date of the credit event. The difference between the value of the obligation or cash delivered and the notional amount received will be recorded as a realized gain (loss).
As the seller of a credit default swap contract, the Fund sells protection to a buyer and will generally receive a periodic
Annual Report 2014
59
Columbia Strategic Income Fund
Notes to Financial Statements (continued)
October 31, 2014
interest rate on the notional amount. The interest amount is accrued daily as a component of unrealized appreciation (depreciation) and is recorded as a realized gain upon receipt of the payment. If a credit event as specified in the contract with the counterparty occurs, the Fund may either be required to accept the reference obligation from the buyer in exchange for a cash payment of its notional amount, or to pay the buyer a net cash settlement equal to the notional amount less an agreed-upon value of the reference obligation (recovery value) as of the date of the credit event. The difference between the value of the obligation or cash received and the notional amount paid will be recorded as a realized gain (loss). The maximum potential amount of undiscounted future payments the Fund could be required to make as the seller of protection under a credit default swap contract is equal to the notional amount of the reference obligation. These potential amounts may be partially offset by any recovery values of the respective reference obligations or premiums received upon entering into the agreement. The notional amounts and market values of all credit default swap contracts in which the Fund is the seller of protection, if any, are disclosed in the Credit Default Swap Contracts Outstanding schedule following the Portfolio of Investments. These potential amounts may be partially offset by any recovery values of the respective reference obligations or premiums received upon entering into the agreement.
As a protection seller, the Fund bears the risk of loss from the credit events specified in the contract with the counterparty. For credit default swap contracts on credit indices, quoted market prices and resulting market values serve as an indicator of the current status of the payment/performance risk. Increasing market values, in absolute terms when compared to the notional amount of the swap, represent a deterioration of the reference entity's credit soundness and a greater likelihood or risk of default or other credit event occurring as defined under the terms of the contract.
Any premium paid or received by the Fund upon entering into a credit default swap contract is recorded as an asset or liability, respectively, and amortized daily as a component of realized gain (loss) in the Statement of Operations. Credit default swap contracts are valued daily, and the change in value is recorded as unrealized appreciation (depreciation) until the termination of the swap, at which time a realized gain (loss) is recorded.
Credit default swap contracts can involve greater risks than if a fund had invested in the reference obligation directly since, in addition to general market risks, credit default swaps are subject to counterparty credit risk, leverage risk, hedging risk, correlation risk and liquidity risk. The Fund will enter into credit default swap transactions only with counterparties that meet certain standards of creditworthiness.
Interest Rate Swap Contracts
The Fund entered into interest rate swap transactions to manage duration and yield curve exposure. These instruments may be used for other purposes in future periods. Interest rate swaps are agreements between two parties that involve the exchange of one type of interest rate for another type of interest rate cash flow on specified dates in the future, based on a predetermined, specified notional amount. Certain interest rate swaps are considered forward-starting, whereby the accrual for the exchange of cash flows does not begin until a specified date in the future (the effective date). The net cash flow for a standard interest rate swap transaction is generally the difference between a floating market interest rate versus a fixed interest rate.
Interest rate swaps are valued daily and unrealized appreciation (depreciation) is recorded. Certain interest rate swaps may accrue periodic interest on a daily basis as a component of unrealized appreciation (depreciation); the Fund will realize a gain or loss upon the payment or receipt of accrued interest. The Fund will realize a gain or a loss when the interest rate swap is terminated.
Risks of entering into interest rate swaps include a lack of correlation between the swaps and the portfolio of bonds the swaps are designed to hedge or replicate. A lack of correlation may cause the interest rate swaps to experience adverse changes in value relative to expectations. In addition, interest rate swaps are subject to the risk of default of a counterparty, and the risk of adverse movements in market interest rates relative to the interest rate swap positions taken. The Fund's maximum risk of loss from counterparty credit risk is the discounted net value of the cash flows to be received from/paid to the counterparty over the contract's remaining life to the extent that such amount is positive, plus the cost of entering into a similar transaction with another counterparty.
The Fund attempts to mitigate counterparty credit risk by entering into interest rate swap transactions only with counterparties that meet prescribed levels of creditworthiness, as determined by the Investment Manager. The Fund and any counterparty are required to maintain an agreement that requires the Fund and that counterparty to monitor (on a daily basis) the net market value of all derivative transactions entered into pursuant to the agreement between the Fund and such counterparty. If the net market value of such derivatives transactions between the Fund and that counterparty exceeds a certain threshold (as defined in the agreement), the Fund or the counterparty is required to post cash and/or securities as collateral. Market values of derivatives transactions presented in the financial statements are not netted with the market values of other derivatives transactions or with any collateral amounts posted by the Fund or any counterparty.
Annual Report 2014
60
Columbia Strategic Income Fund
Notes to Financial Statements (continued)
October 31, 2014
Offsetting of Derivative Assets and Derivative Liabilities
The following tables present the Fund's gross and net amount of assets and liabilities available for offset under netting arrangements as well as any related collateral received or pledged by the Fund as of October 31, 2014:
| | | | | | | | Gross Amounts Not Offset in
the Statement of Assets and Liabilities | |
| |
| | Gross
Amounts of
Recognized
Assets ($) | | Gross Amounts
Offset in the
Statement of
Assets and
Liabilities ($) | | Net Amounts of
Assets
Presented in the
Statement of
Assets and
Liabilities ($) | | Financial
Instruments ($)(a) | | Cash
Collateral
Received ($) | | Securities
Collateral
Received ($) | | Net
Amount ($)(b) | |
Asset Derivatives: | |
Forward Foreign Currency
Exchange Contracts | | | 528,493 | | | | — | | | | 528,493 | | | | 157,249 | | | | — | | | | — | | | | 371,244 | | |
Centrally Cleared Swap
Contracts(c) | | | 1,004,209 | | | | — | | | | 1,004,209 | | | | — | | | | — | | | | — | | | | 1,004,209 | | |
Total | | | 1,532,702 | | | | — | | | | 1,532,702 | | | | 157,249 | | | | — | | | | — | | | | 1,375,453 | | |
| | | | | | | | Gross Amounts Not Offset in
the Statement of Assets and Liabilities | |
| |
| | Gross
Amounts of
Recognized
Liabilities ($) | | Gross Amounts
Offset in the
Statement of
Assets and
Liabilities ($) | | Net Amounts of
Liabilities
Presented in the
Statement of
Assets and
Liabilities ($) | | Financial
Instruments ($)(d) | | Cash
Collateral
Pledged ($) | | Securities
Collateral
Pledged ($) | | Net
Amount($)(e) | |
Liability Derivatives: | |
Forward Foreign Currency
Exchange Contracts | | | 214,277 | | | | — | | | | 214,277 | | | | 157,249 | | | | — | | | | — | | | | 57,028 | | |
(a) Represents the amount of assets that could be offset by liabilities with the same counterparty under master netting or similar agreements that management elects not to offset on the Statement of Assets and Liabilities.
(b) Represents the net amount due from counterparties in the event of default.
(c) Centrally cleared swaps are included within receivable for variation margin on the Statement of Assets and Liabilities.
(d) Represents the amount of liabilities that could be offset by assets with the same counterparty under master netting or similar agreements that management elects not to offset on the Statement of Assets and Liabilities.
(e) Represents the net amount due to counterparties in the event of default.
Effects of Derivative Transactions in the Financial Statements
The following tables are intended to provide additional information about the effect of derivatives on the financial statements of the Fund, including: the fair value of derivatives by risk category and the location of those fair values in the Statement of Assets and Liabilities; and the impact of derivative transactions over the period in the Statement of Operations, including realized gains or losses and unrealized gains or losses. The derivative schedules following the Portfolio of Investments present additional information regarding derivative instruments outstanding at the end of the period, if any.
The following table is a summary of the fair value of derivative instruments (not considered to be hedging
instruments for accounting disclosure purposes) at October 31, 2014:
Asset Derivatives | |
Risk Exposure
Category | | Statement of Assets and
Liabilities Location | | Fair Value ($) | |
Credit risk
| | Net assets — unrealized
appreciation on swap
contracts | | | 2,594,049
| * | |
Foreign exchange
risk
| | Unrealized appreciation on
forward foreign currency
exchange contracts | | | 528,493
| | |
Interest rate risk
| | Net assets — unrealized
appreciation on futures
contracts | | | 3,768,069
| * | |
Interest rate risk
| | Premiums paid on
outstanding swap
contracts | | | 1,652
| | |
Total | | | | | 6,892,263 | | |
Annual Report 2014
61
Columbia Strategic Income Fund
Notes to Financial Statements (continued)
October 31, 2014
Liability Derivatives | |
Risk Exposure
Category | | Statement of Assets and
Liabilities Location | | Fair Value ($) | |
Foreign exchange
risk
| | Unrealized depreciation on
forward foreign currency
exchange contracts | | | 214,277
| | |
Interest rate risk
| | Net assets — unrealized
depreciation on futures
contracts | | | 6,969,034
| * | |
Interest rate risk
| | Net assets — unrealized
depreciation on swap
contracts | | | 2,210,481
| * | |
Total | | | | | 9,393,792 | | |
*Includes cumulative appreciation (depreciation) as reported in the tables following the Portfolio of Investments. Only the current day's variation margin is reported in receivables or payables in the Statement of Assets and Liabilities.
The following table indicates the effect of derivative instruments (not considered to be hedging instruments for accounting disclosure purposes) in the Statement of Operations for the year ended October 31, 2014:
Amount of Realized Gain (Loss) on Derivatives Recognized in Income | |
| Risk Exposure Category | | Forward Foreign
Currency Exchange
Contracts ($) | | Futures
Contracts ($) | | Options Contracts
Written and
Purchased ($) | | Swap
Contracts ($) | | Total ($) | |
Credit risk | | | — | | | | — | | | | — | | | | (564,454 | ) | | | (564,454 | ) | |
Foreign exchange risk | | | 1,762,598 | | | | — | | | | — | | | | — | | | | 1,762,598 | | |
Interest rate risk | | | — | | | | 10,430,685 | | | | (106,053 | ) | | | (27 | ) | | | 10,324,605 | | |
Total | | | 1,762,598 | | | | 10,430,685 | | | | (106,053 | ) | | | (564,481 | ) | | | 11,522,749 | | |
Change in Unrealized Appreciation (Depreciation) on Derivatives Recognized in Income | |
| Risk Exposure Category | | Forward Foreign
Currency Exchange
Contracts ($) | | Futures
Contracts ($) | | Options Contracts
Written and
Purchased ($) | | Swap
Contracts ($) | | Total ($) | |
Credit risk | | | — | | | | — | | | | — | | | | 2,594,049 | | | | 2,594,049 | | |
Foreign exchange risk | | | (943,473 | ) | | | — | | | | — | | | | — | | | | (943,473 | ) | |
Interest rate risk | | | — | | | | 527,865 | | | | 53,026 | | | | (2,210,481 | ) | | | (1,629,590 | ) | |
Total | | | (943,473 | ) | | | 527,865 | | | | 53,026 | | | | 383,568 | | | | 20,986 | | |
The following table is a summary of the average outstanding volume by derivative instrument for the year ended October 31, 2014:
Derivative Instrument | | Average Notional Amounts ($)* | |
Futures contracts — Long | | | 239,727,478 | | |
Futures contracts — Short | | | 648,103,605 | | |
Credit default swap
contracts — sell protection | | | 28,496,250 | | |
Derivative Instrument | | Average Unrealized
Appreciation ($)* | | Average Unrealized
Depreciation ($)* | |
Forward foreign
currency exchange
contracts | | | 1,005,358 | | | | (666,505 | ) | |
Interest rate swap contracts | | | — | | | | (552,620 | ) | |
*Based on the ending quarterly outstanding amounts for the year ended October 31, 2014.
Investments in Senior Loans
The Fund may invest in senior loan assignments. When the Fund purchases an assignment of a senior loan, the Fund typically has direct rights against the borrower; provided, however, that the Fund's rights may be more limited than the lender from which it acquired the assignment and the Fund may be able to enforce its rights only through an administrative agent. Although certain senior loan assignments are secured by collateral, the Fund could experience delays or limitations in realizing such collateral or have its interest subordinated to other indebtedness of the obligor. In the event that the administrator or collateral agent of a loan becomes insolvent, enters into receivership or bankruptcy, the Fund may incur costs and delays in realizing payment or may suffer a loss of principal and/or interest. The risk of loss is greater for
Annual Report 2014
62
Columbia Strategic Income Fund
Notes to Financial Statements (continued)
October 31, 2014
unsecured or subordinated loans. In addition, senior loan assignments are vulnerable to market, economic or other conditions or events that may reduce the demand for senior loan assignments and certain senior loan assignments which were liquid, when purchased, may become illiquid.
The Fund may enter into senior loan assignments where all or a portion of the loan may be unfunded. The Fund is obligated to fund these commitments at the borrower's discretion. These commitments are generally traded and priced in the same manner as other senior loan securities and are disclosed as unfunded senior loan commitments in the Fund's Portfolio of Investments. The Fund designates cash or liquid securities to cover these commitments.
Delayed Delivery Securities
The Fund may trade securities on other than normal settlement terms, including securities purchased or sold on a "when-issued" basis. This may increase risk to the Fund since the other party to the transaction may fail to deliver which could cause the Fund to subsequently invest at less advantageous prices. The Fund designates cash or liquid securities in an amount equal to the delayed delivery commitment.
Mortgage Dollar Roll Transactions
The Fund may enter into mortgage "dollar rolls" in which the Fund sells securities for delivery in the current month and simultaneously contracts with the same counterparty to repurchase similar but not identical securities (same type, coupon and maturity) on a specified future date. During the roll period, the Fund loses the right to receive principal and interest paid on the securities sold. However, the Fund will benefit because it receives negotiated amounts in the form of reductions of the purchase price for the future purchase plus the interest earned on the cash proceeds of the securities sold until the settlement date of the forward purchase. The Fund records the incremental difference between the forward purchase and sale of each forward roll as a realized gain or loss. Unless any realized gains exceed the income, capital appreciation, and gain or loss due to mortgage prepayments that would have been realized on the securities sold as part of the mortgage dollar roll, the use of this technique will diminish the investment performance of the Fund compared to what the performance would have been without the use of mortgage dollar rolls. All cash proceeds will be invested in instruments that are permissible investments for the Fund. The Fund identifies cash or liquid securities in an amount equal to the forward purchase price.
For financial reporting and tax purposes, the Fund treats "to be announced" mortgage dollar rolls as two separate transactions, one involving the purchase of a security and a
separate transaction involving a sale. These transactions may increase the Fund's portfolio turnover rate. The Fund does not currently enter into mortgage dollar rolls that are accounted for as financing transactions.
Mortgage dollar rolls involve the risk that the market value of the securities the Fund is obligated to repurchase may decline below the repurchase price, or that the counterparty may default on its obligations.
Treasury Inflation Protected Securities
The Fund may invest in treasury inflation protected securities (TIPS). The principal amount of TIPS is adjusted periodically and is increased for inflation or decreased for deflation based on a monthly published index. These adjustments are recorded as interest income in the Statement of Operations. Coupon payments are based on the adjusted principal at the time the interest is paid.
Stripped Securities
The Fund may invest in Interest Only (IO) and Principal Only (PO) stripped mortgage-backed securities. These securities are derivative multi-class mortgage securities structured so that one class receives most, if not all, of the principal from the underlying mortgage assets, while the other class receives most, if not all, of the interest and the remainder of the principal. If the underlying mortgage assets experience greater than anticipated prepayments of principal, the Fund may fail to fully recoup its initial investment in an IO security, therefore the daily interest accrual factor is adjusted each month to reflect the paydown of principal. The market value of these securities can be extremely volatile in response to changes in interest rates. Credit risk reflects the risk that the Fund may not receive all or part of its principal because the issuer or credit enhancer has defaulted on its obligation.
Security Transactions
Security transactions are accounted for on the trade date. Cost is determined and gains (losses) are based upon the specific identification method for both financial statement and federal income tax purposes.
Trade date for senior loans purchased in the primary market is the date on which the loan is allocated. Trade date for senior loans purchased in the secondary market is the date on which the transaction is entered into.
Income Recognition
Interest income is recorded on an accrual basis. Market premiums and discounts, including original issue discounts, are amortized and accreted, respectively, over the expected life of the security on all debt securities, unless otherwise noted. The Fund classifies gains and losses realized on prepayments
Annual Report 2014
63
Columbia Strategic Income Fund
Notes to Financial Statements (continued)
October 31, 2014
received on mortgage-backed securities as adjustments to interest income.
The Fund may place a debt security on non-accrual status and reduce related interest income when it becomes probable that the interest will not be collected and the amount of uncollectible interest can be reasonably estimated. A defaulted debt security is removed from non-accrual status when the issuer resumes interest payments or when collectability of interest is reasonably assured.
Corporate actions and dividend income are generally recorded net of any non-reclaimable tax withholdings, on the ex-dividend date or upon receipt of ex-dividend notification in the case of certain foreign securities.
Awards from class action litigation are recorded as a reduction of cost basis if the Fund still owns the applicable securities on the payment date. If the Fund no longer owns the applicable securities, the proceeds are recorded as realized gains.
The value of additional securities received as an income payment is recorded as income and increases the cost basis of such securities.
The Fund may receive other income from senior loans, including amendment fees, consent fees and commitment fees. These fees are recorded as income when received by the Fund. These amounts are included in Interest Income in the Statement of Operations.
Expenses
General expenses of the Trust are allocated to the Fund and other funds of the Trust based upon relative net assets or other expense allocation methodologies determined by the nature of the expense. Expenses directly attributable to the Fund are charged to the Fund. Expenses directly attributable to a specific class of shares are charged to that share class.
Determination of Class Net Asset Value
All income, expenses (other than class-specific expenses, which are charged to that share class, as shown in the Statement of Operations) and realized and unrealized gains (losses) are allocated to each class of the Fund on a daily basis, based on the relative net assets of each class, for purposes of determining the net asset value of each class.
Federal Income Tax Status
The Fund intends to qualify each year as a regulated investment company under Subchapter M of the Internal Revenue Code, as amended, and will distribute substantially all of its taxable income (including net short-term capital gains), if any, for its tax year, and as such will not be subject to federal income taxes. In addition, the Fund intends to distribute in each calendar year substantially all of its net investment income,
capital gains and certain other amounts, if any, such that the Fund should not be subject to federal excise tax. Therefore, no federal income or excise tax provision is recorded.
Foreign Taxes
The Fund may be subject to foreign taxes on income, gains on investments or currency repatriation, a portion of which may be recoverable. The Fund will accrue such taxes and recoveries, as applicable, based upon its current interpretation of tax rules and regulations that exist in the markets in which it invests.
Realized gains in certain countries may be subject to foreign taxes at the Fund level, based on statutory rates. The Fund accrues for such foreign taxes on realized and unrealized gains at the appropriate rate for each jurisdiction, as applicable. The amount, if any, is disclosed as a liability on the Statement of Assets and Liabilities.
Distributions to Shareholders
Distributions from net investment income, if any, are declared and paid monthly. Net realized capital gains, if any, are distributed at least annually. Income distributions and capital gain distributions are determined in accordance with federal income tax regulations, which may differ from GAAP.
Guarantees and Indemnifications
Under the Trust's organizational documents and, in some cases, by contract, its officers and trustees are indemnified against certain liabilities arising out of the performance of their duties to the Trust or its funds. In addition, certain of the Fund's contracts with its service providers contain general indemnification clauses. The Fund's maximum exposure under these arrangements is unknown since the amount of any future claims that may be made against the Fund cannot be determined, and the Fund has no historical basis for predicting the likelihood of any such claims.
Note 3. Fees and Compensation Paid to Affiliates
Investment Management Fees
Under an Investment Management Services Agreement, Columbia Management Investment Advisers, LLC (the Investment Manager), a wholly-owned subsidiary of Ameriprise Financial, Inc. (Ameriprise Financial), determines which securities will be purchased, held or sold. The investment management fee is an annual fee that is equal to a percentage of the Fund's average daily net assets that declines from 0.530% to 0.353% as the Fund's net assets increase. The effective investment management fee rate for the year ended October 31, 2014 was 0.52% of the Fund's average daily net assets.
Annual Report 2014
64
Columbia Strategic Income Fund
Notes to Financial Statements (continued)
October 31, 2014
The Investment Manager has entered into a personnel-sharing arrangement with its affiliate, Threadneedle Investments (Threadneedle). Threadneedle, like the Investment Manager, is a wholly-owned subsidiary of Ameriprise Financial and is an SEC-registered investment adviser. Pursuant to this arrangement, certain employees of Threadneedle serve as "associated persons" of the Investment Manager and, in this capacity, subject to the oversight and supervision of the Investment Manager and consistent with the investment objectives, policies and limitations set forth in the Fund's prospectus and Statement of Additional Information (SAI), may provide research and related services, and discretionary investment management services (including acting as portfolio managers) to the Fund on behalf of the Investment Manager.
Administration Fees
Under an Administrative Services Agreement, the Investment Manager also serves as the Fund Administrator. The Fund pays the Fund Administrator an annual fee for administration and accounting services equal to a percentage of the Fund's average daily net assets that declines from 0.07% to 0.04% as the Fund's net assets increase. The effective administration fee rate for the year ended October 31, 2014 was 0.06% of the Fund's average daily net assets.
Compensation of Board Members
Board members are compensated for their services to the Fund as disclosed in the Statement of Operations. The Trust's eligible Trustees may participate in a Deferred Compensation Plan (the Plan) which may be terminated at any time. Obligations of the Plan will be paid solely out of the Fund's assets.
Compensation of Chief Compliance Officer
The Board has appointed a Chief Compliance Officer to the Fund in accordance with federal securities regulations. The Fund pays its pro-rata share of the expenses associated with the Chief Compliance Officer. The Fund's expenses for the Chief Compliance Officer will not exceed $15,000 per year.
Transfer Agent Fees
Under a Transfer and Dividend Disbursing Agent Agreement, Columbia Management Investment Services Corp. (the Transfer Agent), an affiliate of the Investment Manager and a wholly-owned subsidiary of Ameriprise Financial, is responsible for providing transfer agency services to the Fund. The Transfer Agent has contracted with Boston Financial Data Services (BFDS) to serve as sub-transfer agent.
Effective November 1, 2014, the Transfer Agent receives a monthly transfer agency fee based on the number or the average value of accounts, depending on the type of account. Prior to November 1, 2014, the Transfer Agent received a monthly account-based service fee based on the number of
open accounts. In addition, the Transfer Agent also receives sub-transfer agency fees based on a percentage of the average aggregate value of the Fund's shares maintained in omnibus accounts (other than omnibus accounts for which American Enterprise Investment Services Inc. is the broker of record or accounts where the beneficial shareholder is a customer of Ameriprise Financial Services, Inc., which receive a per account fee). The Transfer Agent pays the fees of BFDS for services as sub-transfer agent and is not entitled to reimbursement for such fees from the Fund (with the exception of out-of-pocket fees).
The Transfer Agent also receives compensation from the Fund for various shareholder services and reimbursements for certain out-of-pocket fees. Total transfer agent fees for Class K and Class R5 shares are subject to an annual limitation of not more than 0.05% of the average daily net assets attributable to each share class. Class Y shares are not subject to transfer agent fees.
For the year ended October 31, 2014, the Fund's effective transfer agent fee rates as a percentage of average daily net assets of each class were as follows:
Class A | | | 0.17 | % | |
Class B | | | 0.17 | | |
Class C | | | 0.17 | | |
Class K | | | 0.05 | | |
Class R | | | 0.17 | | |
Class R4 | | | 0.18 | | |
Class R5 | | | 0.05 | | |
Class W | | | 0.18 | | |
Class Z | | | 0.17 | | |
An annual minimum account balance fee of $20 may apply to certain accounts with a value below the applicable share class's initial minimum investment requirements to reduce the impact of small accounts on transfer agent fees. These minimum account balance fees are remitted to the Fund and recorded as part of expense reductions in the Statement of Operations. For the year ended October 31, 2014, these minimum account balance fees reduced total expenses of the Fund by $6,188.
Plan Administration Fees
Under a Plan Administration Services Agreement with the Transfer Agent, the Fund pays an annual fee at a rate of 0.25% of the Fund's average daily net assets attributable to Class K shares for the provision of various administrative, recordkeeping, communication and educational services.
Distribution and Service Fees
The Fund has an agreement with Columbia Management Investment Distributors, Inc. (the Distributor), an affiliate of
Annual Report 2014
65
Columbia Strategic Income Fund
Notes to Financial Statements (continued)
October 31, 2014
the Investment Manager and a wholly-owned subsidiary of Ameriprise Financial, for distribution and shareholder services. The Board has approved, and the Fund has adopted, distribution and shareholder service plans (the Plans) applicable to certain share classes, which set the distribution and service fees for the Fund. These fees are calculated daily and are intended to compensate the Distributor and/or eligible selling and/or servicing agents for selling shares of the Fund and providing services to investors.
Effective July 1, 2011, under the Plans, the Fund pays a monthly service fee to the Distributor equal to 0.25% annually of the average daily net assets attributable to Class A, Class B, Class C and Class W shares of the Fund. Prior to July 1, 2011, the Fund paid a monthly service fee which was equal to 0.15% annually of the average daily net assets attributable to outstanding Class A and Class B shares of the Fund issued prior to January 1, 1993 and 0.25% annually of the average daily net assets attributable to outstanding Class A, Class B, Class C and Class W shares issued thereafter. The arrangement resulted in an annual rate of service fee for shares that was a blend between the 0.15% and 0.25% rates. For the year ended October 31, 2014, the Fund's effective service fee rate was 0.25% of the Fund's average daily net assets attributable to Class A, Class B, Class C and Class W shares.
Also under the Plans, the Fund pays a monthly distribution fee to the Distributor at the maximum annual rates of 0.75%, 0.75%, 0.50% and 0.25% of the average daily net assets attributable to Class B, Class C, Class R and Class W shares, respectively.
Prior to September 1, 2014, the Distributor voluntarily waived a portion of the distribution fee for Class C shares so that the distribution fee did not exceed 0.60% annually of the average daily net assets attributable to Class C shares.
Although the Fund may pay a distribution fee up to 0.25% of the Fund's average daily net assets attributable to Class W shares and a service fee of up to 0.25% of the Fund's average daily net assets attributable to Class W shares, the aggregate fee shall not exceed 0.25% of the Fund's average daily net assets attributable to Class W shares.
Sales Charges
Sales charges, including front-end charges and CDSCs, received by the Distributor for distributing Fund shares were $741,705 for Class A, $11,443 for Class B, and $11,317 for Class C shares for the year ended October 31, 2014.
Expenses Waived/Reimbursed by the Investment Manager and its Affiliates
The Investment Manager and certain of its affiliates have contractually agreed to waive fees and/or reimburse expenses (excluding certain fees and expenses described below) for the
periods disclosed below, unless sooner terminated at the sole discretion of the Board, so that the Fund's net operating expenses, after giving effect to fees waived/expenses reimbursed and any balance credits and/or overdraft charges from the Fund's custodian, do not exceed the following annual rates as a percentage of the class' average daily net assets:
| | | March 1, 2014
through
February 28, 2015 | | Prior to
March 1, 2014 | |
Class A | | | 1.04 | % | | | 1.04 | % | |
Class B | | | 1.79 | | | | 1.79 | | |
Class C | | | 1.79 | | | | 1.79 | | |
Class K | | | 0.96 | | | | 0.97 | | |
Class R | | | 1.29 | | | | 1.29 | | |
Class R4 | | | 0.79 | | | | 0.79 | | |
Class R5 | | | 0.71 | | | | 0.72 | | |
Class W | | | 1.04 | | | | 1.04 | | |
Class Y | | | 0.66 | | | | 0.67 | | |
Class Z | | | 0.79 | | | | 0.79 | | |
Under the agreement governing these fee waivers and/or expense reimbursement arrangements, the following fees and expenses are excluded from the waiver/reimbursement commitment, and therefore will be paid by the Fund, if applicable: taxes (including foreign transaction taxes), expenses associated with investments in affiliated and non-affiliated pooled investment vehicles (including mutual funds and exchange-traded funds), transaction costs and brokerage commissions, costs related to any securities lending program, dividend expenses associated with securities sold short, inverse floater program fees and expenses, transaction charges and interest on borrowed money, interest, extraordinary expenses and any other expenses the exclusion of which is specifically approved by the Board. This agreement may be modified or amended only with approval from all parties. Class C distribution fees waived by the Distributor prior to September 1, 2014, as discussed above, are in addition to the waiver/reimbursement commitment under the agreement.
Note 4. Federal Tax Information
The timing and character of income and capital gain distributions are determined in accordance with income tax regulations, which may differ from GAAP because of temporary or permanent book to tax differences.
At October 31, 2014, these differences are primarily due to differing treatment for principal and/or interest from fixed income securities, deferral/reversal of wash sale losses, Trustees' deferred compensation, distribution reclassifications, foreign currency transactions, derivative investments, tax straddles, swap investments and swap
Annual Report 2014
66
Columbia Strategic Income Fund
Notes to Financial Statements (continued)
October 31, 2014
reclassifications. To the extent these differences are permanent, reclassifications are made among the components of the Fund's net assets in the Statement of Assets and Liabilities. Temporary differences do not require reclassifications. In the Statement of Assets and Liabilities the following reclassifications were made:
Undistributed net investment income | | $ | 455,317 | | |
Accumulated net realized gain | | | (454,922 | ) | |
Paid-in capital | | | (395 | ) | |
Net investment income (loss) and net realized gains (losses), as disclosed in the Statement of Operations, and net assets were not affected by this reclassification.
The tax character of distributions paid during the years indicated was as follows:
Year Ended October 31, | | 2014 | | 2013 | |
Ordinary income | | $ | 90,712,705 | | | $ | 104,698,869 | | |
Long-term capital gains | | | 60,654,298 | | | | 8,574,446 | | |
Total | | | 151,367,003 | | | | 113,273,315 | | |
Short-term capital gain distributions, if any, are considered ordinary income distributions for tax purposes.
At October 31, 2014, the components of distributable earnings on a tax basis were as follows:
Undistributed ordinary income | | | 9,973,183 | | |
Undistributed long-term capital gains | | | 30,091,128 | | |
Net unrealized appreciation | | | 28,483,582 | | |
At October 31, 2014, the cost of investments for federal income tax purposes was $2,166,924,806 and the aggregate gross unrealized appreciation and depreciation based on that cost was:
Unrealized appreciation | | $ | 68,693,977 | | |
Unrealized depreciation | | | (40,210,395 | ) | |
Net unrealized appreciation/depreciation | | | 28,483,582 | | |
Management of the Fund has concluded that there are no significant uncertain tax positions in the Fund that would require recognition in the financial statements. However, management's conclusion may be subject to review and adjustment at a later date based on factors including, but not limited to, new tax laws, regulations, and administrative interpretations (including relevant court decisions). Generally, the Fund's federal tax returns for the prior three fiscal years remain subject to examination by the Internal Revenue Service.
Note 5. Portfolio Information
The cost of purchases and proceeds from sales of securities, excluding short-term obligations and certain derivatives, if any, aggregated to $2,505,935,696 and $2,675,407,247,
respectively, for the year ended October 31, 2014, of which $1,268,551,164 and $1,371,036,681, respectively, were U.S. government securities. The amount of purchase and sale activity impacts the portfolio turnover rate reported in the Financial Highlights.
Note 6. Affiliated Money Market Fund
The Fund invests in Columbia Short-Term Cash Fund, an affiliated money market fund established for the exclusive use by the Fund and other affiliated funds. The income earned by the Fund from such investments is included as Dividends — affiliated issuers in the Statement of Operations. As an investing fund, the Fund indirectly bears its proportionate share of the expenses of Columbia Short-Term Cash Fund.
Note 7. Shareholder Concentration
At October 31, 2014, one unaffiliated shareholder of record owned 28.3% of the outstanding shares of the Fund in one or more accounts. The Fund has no knowledge about whether any portion of those shares was owned beneficially. Affiliated shareholders of record owned 37.9% of the outstanding shares of the Fund in one or more accounts. Subscription and redemption activity by concentrated accounts may have a significant effect on the operations of the Fund.
Note 8. Line of Credit
The Fund has entered into a revolving credit facility with a syndicate of banks led by JPMorgan Chase Bank N.A. (JPMorgan) whereby the Fund may borrow for the temporary funding of shareholder redemptions or for other temporary or emergency purposes. The credit facility agreement, as amended, which is a collective agreement between the Fund and certain other funds managed by the Investment Manager, severally and not jointly, permits collective borrowings up to $500 million. Interest is charged to each participating fund based on its borrowings at a rate equal to the higher of (i) the overnight federal funds rate plus 1.00% or (ii) the one-month LIBOR rate plus 1.00%. Each borrowing under the credit facility matures no later than 60 days after the date of borrowing. Effective December 9, 2013, the Fund also pays a commitment fee equal to its pro rata share of the amount of the credit facility at a rate of 0.075% per annum. Prior to December 10, 2013, the commitment fee was charged at the annual rate of 0.08% per annum. The commitment fee is included in other expenses in the Statement of Operations.
Effective December 9, 2014, the Fund extended its revolving credit facility with JPMorgan. The credit facility agreement, as amended, permits collective borrowings up to $550 million under the same terms and interest rates as described above.
The Fund had no borrowings during the year ended October 31, 2014.
Annual Report 2014
67
Columbia Strategic Income Fund
Notes to Financial Statements (continued)
October 31, 2014
Note 9. Significant Risks
Derivatives Risk
Losses involving derivative instruments may be substantial, because a relatively small price movement in the underlying security(ies) instrument, commodity, currency or index may result in a substantial loss for the Fund. In addition to the potential for increased losses, the use of derivative instruments may lead to increased volatility within the Fund. Derivatives will typically increase the Fund's exposure to principal risks to which it is otherwise exposed, and may expose the Fund to additional risks, including correlation risk, counterparty risk, hedging risk, leverage risk and liquidity risk.
Credit Risk
Credit risk is the risk that the value of debt securities in the Fund's portfolio may decline because the issuer may default and fail to pay interest or repay principal when due. Rating agencies assign credit ratings to debt securities to indicate their credit risk. Lower rated or unrated debt securities held by the Fund may present increased credit risk as compared to higher-rated debt securities.
Interest Rate Risk
Interest rate risk is the risk of losses attributable to changes in interest rates. In general, if prevailing interest rates rise, the values of debt securities tend to fall, and if interest rates fall, the values of debt securities tend to rise. Actions by governments and central banking authorities can result in increases in interest rates. Increasing interest rates may negatively affect the value of debt securities held by the Fund, resulting in a negative impact on the Fund's performance and net asset value per share. In general, the longer the maturity or duration of a debt security, the greater its sensitivity to changes in interest rates.
Liquidity Risk
Liquidity risk is the risk associated with a lack of marketability of investments which may make it difficult to sell the investment at a desirable time or price. Changing regulatory, market or other conditions or environments (for example, the interest rate or credit environments) may adversely affect the liquidity of the Fund's investments. The Fund may have to accept a lower selling price for the holding, sell other investments, or forego another, more appealing investment opportunity. Generally, the less liquid the market at the time the Fund sells a portfolio investment, the greater the risk of loss or decline of value to the Fund. A less liquid market can lead to an increase in Fund redemptions, which may negatively impact Fund performance and net asset value per share, including, for example, if the Fund is forced to sell securities in a down market.
Foreign Securities and Emerging Market Countries Risk
Investing in foreign securities may include certain risks and considerations not typically associated with investing in U.S. securities, such as fluctuating currency values and changing local and regional economic, political and social conditions, which may result in greater market volatility. In addition, certain foreign securities may not be as liquid as U.S. securities. Investing in emerging markets may accentuate these risks. These countries are also more likely to experience high levels of inflation, deflation or currency devaluation which could hurt their economies and securities markets.
High-Yield Securities Risk
Securities rated below investment grade (commonly called "high-yield" or "junk" bonds) and unrated securities of comparable quality expose the Fund to a greater risk of loss of principal and income than a fund that invests solely or primarily in investment grade securities. In addition, these investments have greater price fluctuations, are less liquid and are more likely to experience a default than higher-rated securities. High-yield securities are considered to be predominantly speculative with respect to the issuer's capacity to pay interest and repay principal.
Note 10. Subsequent Events
Management has evaluated the events and transactions that have occurred through the date the financial statements were issued. Other than as noted in Notes 3 and 8 above, there were no items requiring adjustment of the financial statements or additional disclosure.
Note 11. Information Regarding Pending and Settled Legal Proceedings
In December 2005, without admitting or denying the allegations, American Express Financial Corporation (AEFC, which is now known as Ameriprise Financial, Inc. (Ameriprise Financial)) entered into settlement agreements with the Securities and Exchange Commission (SEC) and Minnesota Department of Commerce (MDOC) related to market timing activities. As a result, AEFC was censured and ordered to cease and desist from committing or causing any violations of certain provisions of the Investment Advisers Act of 1940, the Investment Company Act of 1940, and various Minnesota laws. AEFC agreed to pay disgorgement of $10 million and civil money penalties of $7 million. AEFC also agreed to retain an independent distribution consultant to assist in developing a plan for distribution of all disgorgement and civil penalties ordered by the SEC in accordance with various undertakings detailed at www.sec.gov/litigation/admin/ia-2451.pdf. Ameriprise Financial and its affiliates have cooperated with the
Annual Report 2014
68
Columbia Strategic Income Fund
Notes to Financial Statements (continued)
October 31, 2014
SEC and the MDOC in these legal proceedings, and have made regular reports to the Funds' Boards of Trustees.
Ameriprise Financial and certain of its affiliates have historically been involved in a number of legal, arbitration and regulatory proceedings, including routine litigation, class actions, and governmental actions, concerning matters arising in connection with the conduct of their business activities. Ameriprise Financial believes that the Funds are not currently the subject of, and that neither Ameriprise Financial nor any of its affiliates are the subject of, any pending legal, arbitration or regulatory proceedings that are likely to have a material adverse effect on the Funds or the ability of Ameriprise Financial or its affiliates to perform under their contracts with the Funds. Ameriprise Financial is required to make quarterly (10-Q), annual (10-K) and, as necessary, 8-K filings with the Securities and Exchange Commission on legal and regulatory matters that relate to Ameriprise Financial and its affiliates. Copies of these filings may be obtained by accessing the SEC website at www.sec.gov.
There can be no assurance that these matters, or the adverse publicity associated with them, will not result in increased fund redemptions, reduced sale of fund shares or other adverse consequences to the Funds. Further, although we believe proceedings are not likely to have a material adverse effect on the Funds or the ability of Ameriprise Financial or its affiliates to perform under their contracts with the Funds, these proceedings are subject to uncertainties and, as such, we are unable to estimate the possible loss or range of loss that may result. An adverse outcome in one or more of these proceedings could result in adverse judgments, settlements, fines, penalties or other relief that could have a material adverse effect on the consolidated financial condition or results of operations of Ameriprise Financial.
Annual Report 2014
69
Columbia Strategic Income Fund
Report of Independent Registered Public Accounting Firm
To the Trustees of Columbia Funds Series Trust I and the Shareholders of
Columbia Strategic Income Fund
In our opinion, the accompanying statement of assets and liabilities, including the portfolio of investments, and the related statements of operations and of changes in net assets and the financial highlights present fairly, in all material respects, the financial position of Columbia Strategic Income Fund (the "Fund", a series of Columbia Funds Series Trust I) at October 31, 2014, and the results of its operations, the changes in its net assets and the financial highlights for each of the periods indicated, in conformity with accounting principles generally accepted in the United States of America. These financial statements and financial highlights (hereafter referred to as "financial statements") are the responsibility of the Fund's management. Our responsibility is to express an opinion on these financial statements based on our audits. We conducted our audits of these financial statements in accordance with the standards of the Public Company Accounting Oversight Board (United States). Those standards require that we plan and perform the audit to obtain reasonable assurance about whether the financial statements are free of material misstatement. An audit includes examining, on a test basis, evidence supporting the amounts and disclosures in the financial statements, assessing the accounting principles used and significant estimates made by management, and evaluating the overall financial statement presentation. We believe that our audits, which included confirmation of securities at October 31, 2014 by correspondence with the custodian, brokers, agent banks and transfer agent, and the application of alternative auditing procedures where such confirmations had not been received, provide a reasonable basis for our opinion.
PricewaterhouseCoopers LLP
Minneapolis, Minnesota
December 22, 2014
Annual Report 2014
70
Columbia Strategic Income Fund
Federal Income Tax Information
(Unaudited)
The Fund hereby designates the following tax attributes for the fiscal year ended October 31, 2014. Shareholders will be notified in early 2015 of the amounts for use in preparing 2014 income tax returns.
Tax Designations:
Capital Gain Dividend | | $ | 31,725,167 | | |
Capital Gain Dividend. The Fund designates as a capital gain dividend the amount reflected above, or if subsequently determined to be different, the net capital gain of such fiscal period.
Annual Report 2014
71
Columbia Strategic Income Fund
The Trustees serve terms of indefinite duration. The names, addresses and birth years of the Trustees and Officers of the Funds in Columbia Funds Series Trust I, the year each was first elected or appointed to office, their principal business occupations during at least the last five years, the number of Funds overseen by each Trustee and other directorships they hold are shown below. Each officer listed below serves as an officer of each Fund in Columbia Funds Series Trust I.
Independent Trustees
Name, Address and Year of Birth,
Position with Funds, Year First
Elected or Appointed to Office | | Principal Occupation(s) During Past Five Years, Number of Funds in Columbia
Funds Complex Overseen by Trustee, Other Directorships Held | |
Douglas A. Hacker (Born 1955)
c/o Columbia Management
Investment Advisers, LLC
225 Franklin Street
Boston, MA 02110
Trustee (since 1996) and Chairman of the Board
(since 2014) | | Independent business executive since May 2006; Executive Vice President — Strategy of United Airlines from December 2002 to May 2006; President of UAL Loyalty Services (airline marketing company) from September 2001 to December 2002; Executive Vice President and Chief Financial Officer of United Airlines from July 1999 to September 2001. Oversees 56; Spartan Stores, Inc. (food distributor); Nash Finch Company (food distributor from 2005 to 2013); Aircastle Limited (aircraft leasing); and SeaCube Container Leasing Ltd. (container leasing from 2010 to 2013) | |
Janet Langford Kelly (Born 1957)
c/o Columbia Management
Investment Advisers, LLC
225 Franklin Street
Boston, MA 02110
Trustee (since 1996) | | Senior Vice President, General Counsel and Corporate Secretary, ConocoPhillips (integrated energy company) since September 2007; Deputy General Counsel — Corporate Legal Services, ConocoPhillips from August 2006 to August 2007; Partner, Zelle, Hofmann, Voelbel, Mason & Gette LLP (law firm) from March 2005 to July 2006; Adjunct Professor of Law, Northwestern University from September 2004 to June 2006; Director, UAL Corporation (airline) from February 2006 to July 2006; Chief Administrative Officer and Senior Vice President, Kmart Holding Corporation (consumer goods) from September 2003 to March 2004. Oversees 56; None | |
Nancy T. Lukitsh (Born 1956)
c/o Columbia Management
Investment Advisers, LLC
225 Franklin Street
Boston, MA 02110
Trustee (since 2011) | | Senior Vice President, Partner and Director of Marketing, Wellington Management Company, LLP (investment adviser) from 1997 to 2010; Chair, Wellington Management Investment Portfolios (commingled non-U.S. investment pools) from 2007 to 2010; Director, Wellington Trust Company, NA and other Wellington affiliates from 1997 to 2010. Oversees 56; None | |
William E. Mayer (Born 1940)
c/o Columbia Management
Investment Advisers, LLC
225 Franklin Street
Boston, MA 02110
Trustee (since 1994) | | Partner, Park Avenue Equity Partners (private equity) since February 1999; Dean and Professor, College of Business and Management, University of Maryland from 1992 to 1996. Oversees 56; DynaVox Inc. (speech creation); Lee Enterprises (print media); WR Hambrecht + Co. (financial service provider) from 2000 to 2012; BlackRock Kelso Capital Corporation (investment company); Premier, Inc. (healthcare) | |
David M. Moffett (Born 1952)
c/o Columbia Management
Investment Advisers, LLC
225 Franklin Street
Boston, MA 02110
Trustee (since 2011) | | Retired. Chief Executive Officer, Federal Home Loan Mortgage Corporation, from 2008 to 2009; Senior Adviser, Global Financial Services Group, Carlyle Group, Inc., from 2007 to 2008; Vice Chairman and Chief Financial Officer, U.S. Bancorp, from 1993 to 2007. Oversees 56; CIT Group Inc. (commercial and consumer finance); eBay Inc. (online trading community); MBIA Inc. (financial service provider); E.W. Scripps Co. (print and television media), Building Materials Holding Corp. (building materials and construction services); Genworth Financial, Inc. (financial and insurance products and services); and University of Oklahoma Foundation | |
Charles R. Nelson (Born 1942)
c/o Columbia Management
Investment Advisers, LLC
225 Franklin Street
Boston, MA 02110
Trustee (since 1981) | | Retired. Professor Emeritus, University of Washington, since 2011; Professor of Economics, University of Washington from 1976 to 2011; Ford and Louisa Van Voorhis Professor of Political Economy, University of Washington from 1993 to 2011; Adjunct Professor of Statistics, University of Washington from 1980 to 2011; Associate Editor, Journal of Money, Credit and Banking from September 1993 to 2008; consultant on econometric and statistical matters. Oversees 56; None | |
John J. Neuhauser (Born 1943)
c/o Columbia Management
Investment Advisers, LLC
225 Franklin Street
Boston, MA 02110
Trustee (since 1984) | | President, Saint Michael's College, since August 2007; Director or Trustee of several non-profit organizations, including Fletcher Allen Health Care, Inc.; Academic Vice President and Dean of Faculties, Boston College from August 1999 to October 2005; University Professor, Boston College from November 2005 to August 2007. Oversees 56; Liberty All-Star Equity Fund and Liberty All-Star Growth Fund (closed-end funds) | |
Patrick J. Simpson (Born 1944)
c/o Columbia Management
Investment Advisers, LLC
225 Franklin Street
Boston, MA 02110
Trustee (since 2000) | | Partner, Perkins Coie LLP (law firm). Oversees 56; None | |
Annual Report 2014
72
Columbia Strategic Income Fund
Trustees and Officers (continued)
Independent Trustees (continued)
Name, Address and Year of Birth,
Position with Funds, Year First
Elected or Appointed to Office | | Principal Occupation(s) During Past Five Years, Number of Funds in Columbia
Funds Complex Overseen by Trustee, Other Directorships Held | |
Anne-Lee Verville (Born 1945)
c/o Columbia Management
Investment Advisers, LLC
225 Franklin Street
Boston, MA 02110
Trustee (since 1998) | | Retired. General Manager — Global Education Industry from 1994 to 1997, President — Application Systems Division from 1991 to 1994, Chief Financial Officer — US Marketing & Services from 1988 to 1991, and Chief Information Officer from 1987 to 1988, IBM Corporation (computer and technology). Oversees 56; Enesco Group, Inc. (producer of giftware and home and garden decor products) from 2001 to 2006 | |
Interested Trustee
Name, Address and Year of Birth,
Position with Funds, Year First
Elected or Appointed to Office | | Principal Occupation(s) During Past Five Years, Number of Funds in Columbia
Funds Complex Overseen by Trustee, Other Directorships Held | |
William F. Truscott (Born 1960)
53600 Ameriprise Financial Center
Minneapolis, MN 55474
Trustee (since 2012) | | Chairman of the Board and President, Columbia Management Investment Advisers, LLC since May 2010 and February 2012, respectively (previously President and Chief Investment Officer, from 2001 to April 2010); Chief Executive Officer, Global Asset Management, Ameriprise Financial, Inc. since September 2012 (previously, Chief Executive Officer, U.S. Asset Management & President, Annuities, from May 2010 to September 2012 and President — U.S. Asset Management and Chief Investment Officer from 2005 to April 2010); Director and Chief Executive Officer, Columbia Management Investment Distributors, Inc. since May 2010 and February 2012, respectively (previously Chairman of the Board and Chief Executive Officer from 2006 to April 2010); Chairman of the Board and Chief Executive Officer, RiverSource Distributors, Inc. since 2006; President and Chief Executive Officer, Ameriprise Certificate Company, 2006 to August 2012; Director, Threadneedle Asset Management Holdings, SARL since 2014. Oversees 188; Chairman of the Board, Columbia Management Investment Advisers, LLC since May 2010; Director, Columbia Management Investment
Distributors, Inc. since May 2010; Director, Ameriprise Certificate Company from 2006 to January 2013 | |
The Statement of Additional Information has additional information about the Fund's Board members and is available, without charge, upon request by calling 800.345.6611; contacting your financial intermediary; or visiting columbiamanagement.com.
The Board has appointed officers who are responsible for day-to-day business decisions based on policies it has established. The officers serve at the pleasure of the Board. In addition to Mr. Truscott, who is Senior Vice President, the Funds' other officers are:
Officers
Name,
Address and
Year of Birth | | Position and Year
First Appointed to
Position for any Fund
in the Columbia
Funds Complex or a
Predecessor Thereof | | Principal Occupation(s) During Past Five Years | |
J. Kevin Connaughton
225 Franklin Street
Boston, MA 02110
Born 1964 | | President and Principal Executive Officer (2009) | | Managing Director and General Manager — Mutual Fund Products, Columbia Management Investment Advisers, LLC, since May 2010; and President, Columbia Funds since 2009; Managing Director, Columbia Management Advisors, LLC, from December 2004 to April 2010; Senior Vice President and Chief Financial Officer, Columbia Funds, from June 2008 to January 2009; and senior officer of Columbia Funds and affiliated funds since 2003. | |
Michael G. Clarke
225 Franklin Street
Boston, MA 02110
Born 1969 | | Treasurer (2011) and Chief Financial Officer (2009) | | Vice President — Mutual Fund Administration, Columbia Management Investment Advisers, LLC, since May 2010; Managing Director of Fund Administration, Columbia Management Advisors, LLC, from September 2004 to April 2010; and senior officer of Columbia Funds and affiliated funds since 2002. | |
Annual Report 2014
73
Columbia Strategic Income Fund
Trustees and Officers (continued)
Officers (continued)
Name,
Address and
Year of Birth | | Position and Year
First Appointed to
Position for any Fund
in the Columbia
Funds Complex or a
Predecessor Thereof | | Principal Occupation(s) During Past Five Years | |
Scott R. Plummer
5228 Ameriprise
Financial Center
Minneapolis, MN 55474
Born 1959 | | Senior Vice President (2006), Chief Legal Officer (2006) and Assistant Secretary (2011) | | Senior Vice President and Assistant General Counsel — Global Asset Management, Ameriprise Financial since February 2014 (previously, Senior Vice President and Lead Chief Counsel — Asset Management, 2012 – February 2014; Vice President and Lead Chief Counsel — Asset Management, 2010 – 2012; and Vice President and Chief Counsel — Asset Management, 2005 – 2010); Senior Vice President, Chief Legal Officer and Assistant Secretary, Columbia Management Investment Advisers, LLC since June 2005; Vice President, Chief Counsel and Assistant Secretary, Columbia Management Investment Distributors, Inc. since 2008; Vice President, General Counsel and Secretary, Ameriprise Certificate Company since 2005; Chief Counsel, RiverSource Distributors, Inc. since 2006; senior officer of Columbia Funds and affiliated funds since 2006. | |
Thomas P. McGuire
225 Franklin Street
Boston, MA 02110
Born 1972 | | Chief Compliance Officer (2012) | | Vice President — Asset Management Compliance, Ameriprise Financial, Inc. since May 2010; Chief Compliance Officer, Ameriprise Certificate Company, since September 2010; Compliance Executive, Bank of America from 2005 to April 2010. | |
Colin Moore
225 Franklin Street
Boston, MA 02110
Born 1958 | | Senior Vice President (2010) | | Executive Vice President and Global Chief Investment Officer, Ameriprise Financial, Inc. since July 2013; Director and Global Chief Investment Officer, Columbia Management Investment Advisers, LLC since May 2010; Manager, Managing Director and Chief Investment Officer, Columbia Management Advisors, LLC from 2007 to April 2010. | |
Michael E. DeFao
225 Franklin Street
Boston, MA 02110
Born 1968 | | Vice President (2011) and Assistant Secretary (2010) | | Vice President and Chief Counsel, Ameriprise Financial, Inc. since May 2010; Associate General Counsel, Bank of America from 2005 to April 2010. | |
Joseph F. DiMaria
225 Franklin Street
Boston, MA 02110
Born 1968 | | Vice President (2011) and Chief Accounting Officer (2008) | | Vice President — Mutual Fund Treasurer, Columbia Management Investment Advisers, LLC since May 2010; Director of Fund Administration, Columbia Management Advisors, LLC from 2006 to April 2010. | |
Paul B. Goucher
100 Park Avenue
New York, NY 10017
Born 1968 | | Vice President (2011) and Assistant Secretary (2008) | | Vice President and Lead Chief Counsel, Ameriprise Financial, Inc. since November 2008 and January 2013, respectively (previously, Chief Counsel from January 2010 to January 2013, and Group Counsel from November 2008 to January 2010); Director, Managing Director and General Counsel, J. & W. Seligman & Co. Incorporated from July 2008 to November 2008. | |
Amy Johnson
5228 Ameriprise
Financial Center
Minneapolis, MN
Born 1965 | | Vice President (2006) | | Senior Vice President and Chief Operating Officer, Columbia Management Investment Advisers, LLC since May 2010; previously, Chief Administrative Officer, from 2009 to April 2010, and Vice President — Asset Management and Trust Company Services from 2006 to 2009. | |
Paul D. Pearson
5228 Ameriprise
Financial Center
Minneapolis, MN
Born 1956 | | Vice President (2011) and Assistant Treasurer (1999) | | Vice President — Investment Accounting, Columbia Management Investment Advisers, LLC since May 2010; Vice President — Managed Assets, Investment Accounting, Ameriprise Financial, Inc. from 1998 to April 2010. | |
Christopher O. Petersen
5228 Ameriprise
Financial Center
Minneapolis, MN 55474
Born 1970 | | Vice President and Secretary (2010) | | Vice President and Chief Counsel, Ameriprise Financial, Inc. since January 2010 (previously, Vice President and Group Counsel or Counsel from 2004 to January 2010); officer of Columbia Funds and affiliated funds since 2007. | |
Stephen T. Welsh
225 Franklin Street
Boston, MA 02110
Born 1957 | | Vice President (2006) | | President and Director, Columbia Management Investment Services Corp., from May 2010 to October 2014; President and Director, Columbia Management Services, Inc. from 2004 to April 2010; and Managing Director, Columbia Management Distributors, Inc. from 2007 to April 2010. | |
Annual Report 2014
74
Columbia Strategic Income Fund
Board Consideration and Approval of Advisory Agreement
On June 11, 2014, the Board of Trustees (the "Board") and the Trustees who are not interested persons (as defined in the Investment Company Act of 1940) of the Trust (the "Independent Trustees") unanimously approved the continuation of the Investment Management Services Agreement (the "Advisory Agreement") with Columbia Management Investment Advisers, LLC (the "Investment Manager") with respect to Columbia Strategic Income Fund (the "Fund"), a series of the Trust. As detailed below, the Advisory Fees and Expenses Committee (the "Committee") and the Board met on multiple occasions to review and discuss, both among themselves and with the management team of the Investment Manager, materials provided by the Investment Manager before determining to approve the continuation of the Advisory Agreement.
In connection with their deliberations regarding the continuation of the Advisory Agreement, the Committee and the Board evaluated materials requested from the Investment Manager regarding the Fund and the Advisory Agreement, and discussed these materials with representatives of the Investment Manager at Committee meetings held on March 4, 2014, April 30, 2014 and June 10, 2014 and at Board meetings held on April 30, 2014 and June 11, 2014. In addition, the Board considers matters bearing on the Advisory Agreement at most of its other meetings throughout the year and meets regularly with senior management of the Funds and the Investment Manager. Through the Board's Investment Oversight Committees, Trustees also meet with selected Fund portfolio managers and other investment personnel at various times throughout the year. The Committee and the Board also consulted with its independent fee consultant, Fund counsel and with the Independent Trustees' independent legal counsel, who advised on various matters with respect to the Committee's and the Board's considerations and otherwise assisted the Committee and the Board in their deliberations. On June 10, 2014, the Committee recommended that the Board approve the continuation of the Advisory Agreement. On June 11, 2014, the Board, including the Independent Trustees, voting separately, unanimously approved the continuation of the Advisory Agreement for the Fund.
The Committee and the Board considered all information that they, their legal counsel, or the Investment Manager believed reasonably necessary to evaluate and to determine whether to approve the continuation of the Advisory Agreement. The information and factors considered by the Committee and the Board in recommending for approval or approving the continuation of the Advisory Agreement for the Fund included the following:
• Information on the investment performance of the Fund relative to the performance of a group of mutual funds determined to be comparable to the Fund by an independent third-party data provider, as well as performance relative to benchmarks;
• Information on the Fund's advisory fees and total expenses, including information comparing the Fund's expenses to those of a group of comparable mutual funds, as determined by the independent third-party data provider;
• The Investment Manager's agreement to contractually limit or cap total operating expenses for the Fund through February 28, 2015 so that total operating expenses (excluding certain fees and expenses, such as transaction costs and certain other investment related expenses, interest, taxes, acquired fund fees and expenses, and extraordinary expenses) would not exceed the annual rates of 1.04% for Class A, 1.79% for Class B, 1.79% for Class C, 0.96% for Class K, 1.29% for Class R, 0.79% for Class R4, 0.71% for Class R5, 1.04% for Class W, 0.66% for Class Y and 0.79% for Class Z;
• The terms and conditions of the Advisory Agreement;
• The current and proposed terms and conditions of other agreements and arrangements with affiliates of the Investment Manager relating to the operations of the Fund, including the Administrative Services Agreement, the Distribution Agreement and the Transfer and Dividend Disbursing Agent Agreement;
• Descriptions of various functions performed by the Investment Manager under the Advisory Agreement, including portfolio management and portfolio trading practices;
• Information regarding the management fees and investment performance of similarly-managed portfolios of other clients of the Investment Manager, including institutional separate accounts;
• Information regarding the reputation, regulatory history and resources of the Investment Manager, including information regarding senior management, portfolio managers and other personnel;
Annual Report 2014
75
Columbia Strategic Income Fund
Board Consideration and Approval of Advisory Agreement (continued)
• Information regarding the capabilities of the Investment Manager with respect to compliance monitoring services, including an assessment of the Investment Manager's compliance system by the Fund's Chief Compliance Officer; and
• The profitability to the Investment Manager and its affiliates from their relationships with the Fund.
Nature, Extent and Quality of Services Provided under the Advisory Agreement
The Committee and the Board considered the nature, extent and quality of services provided to the Fund by the Investment Manager and its affiliates under the Advisory Agreement and under separate agreements for the provision of transfer agency and administrative services, and the resources dedicated to the Fund and the other Columbia Funds by the Investment Manager and its affiliates. The Committee and the Board considered, among other things, the Investment Manager's ability to attract, motivate and retain highly qualified research, advisory and supervisory investment professionals (including personnel and other resources, compensation programs for personnel involved in fund management, reputation and other attributes), the portfolio management services provided by those investment professionals, and the quality of the Investment Manager's investment research capabilities and trade execution services. The Committee and the Board also considered the potential benefits to shareholders of investing in a mutual fund that is part of a fund complex offering exposure to a variety of asset classes and investment disciplines and providing a variety of fund and shareholder services.
The Committee and the Board also considered the professional experience and qualifications of the senior personnel of the Investment Manager, which included consideration of the Investment Manager's experience with similarly-structured funds. The Committee and the Board noted the compliance programs of and the compliance-related resources provided to the Fund by the Investment Manager and its affiliates, and considered the Investment Manager's ability to provide administrative services to the Fund pursuant to a separate Administrative Services Agreement, including the Investment Manager's ability to coordinate the activities of the Fund's other service providers. After reviewing these and related factors, the Committee and the Board concluded, within the context of their overall conclusions, that the nature, extent and quality of the services provided to the Fund under the Advisory Agreement supported the continuation of the Advisory Agreement.
Investment Performance
The Committee and the Board reviewed information about the performance of the Fund over various time periods, including performance information relative to benchmarks and information based on reports of the independent third-party data provider that compared the performance of the Fund to the performance of a group of comparable mutual funds, and data provided by the independent fee consultant. The Committee and the Board also reviewed a description of the third party's methodology for identifying the Fund's peer groups for purposes of performance and expense comparisons. Although the Fund's performance lagged that of a relevant peer group for certain (although not necessarily all) periods, the Committee and the Board concluded that other factors relevant to performance were sufficient, in light of other considerations, to warrant continuation of the Fund's Advisory Agreement. Those factors included one or more of the following: (i) that the Fund's performance, although lagging in certain recent periods, was stronger over the longer term; (ii) that the underperformance was attributable, to a significant extent, to investment decisions that were reasonable and consistent with the Fund's investment strategy and policies and that the Fund was performing within a reasonable range of expectations, given those investment decisions, market conditions and the Fund's investment strategy; (iii) that the Fund's performance was competitive when compared to other relevant performance benchmarks or peer groups; and (iv) that the Investment Manager had taken or was taking steps designed to help improve the Fund's investment performance, including, but not limited to, enhancing the resources supporting the portfolio managers, or modifying investment strategies.
The Committee and the Board noted that, through December 31, 2013, the Fund's performance was in the seventy-second, forty-first and seventy-ninth percentile (where the best performance would be in the first percentile) of its category selected by the independent third-party data provider for the purposes of performance comparisons for the one-, three- and five- year periods, respectively.
The Committee and the Board also considered the Investment Manager's performance and reputation generally, the Investment Manager's historical responsiveness to Board concerns about performance, and the Investment Manager's willingness to take steps intended to improve performance. After reviewing these and related factors, the Committee and the Board concluded, within the context of their overall conclusions, that the performance of the Fund was sufficient, in light of other considerations, to warrant the continuation of the Advisory Agreement.
Annual Report 2014
76
Columbia Strategic Income Fund
Board Consideration and Approval of Advisory Agreement (continued)
Investment Advisory Fee Rates and Other Expenses
The Committee and the Board considered the advisory fees charged to the Fund under the Advisory Agreement as well as the total expenses incurred by the Fund. In assessing the reasonableness of the fees under the Advisory Agreement, the Committee and the Board considered, among other information, the Fund's advisory fee and its total expense ratio as a percentage of average daily net assets. The Committee and the Board also considered data provided by the independent fee consultant. The Committee and the Board noted that the Fund's actual management fee and net expense ratio are both ranked in the third quintile (where the lowest fees and expenses would be in the first quintile) against the Fund's expense universe as determined by the independent third-party data provider for purposes of expense comparison. The Committee and the Board also took into account the fee waiver and expense limitation arrangements agreed to by the Investment Manager, as noted above.
The Committee and the Board also received and considered information about the advisory fees charged by the Investment Manager to institutional separate accounts. In considering the fees charged to those accounts, the Committee and the Board took into account, among other things, the Investment Manager's representations about the differences between managing mutual funds as compared to other types of accounts, including differences in the services provided, differences in the risk profile of such business for the Investment Manager and the additional resources required to manage mutual funds effectively. In evaluating the Fund's advisory fees, the Committee and the Board also took into account the demands, complexity and quality of the investment management of the Fund.
After reviewing these and related factors, the Committee and the Board concluded, within the context of their overall conclusions, that the advisory fee rates and expenses of the Fund were sufficient, in light of other considerations, to warrant the continuation of the Advisory Agreement.
Costs of Services Provided and Profitability
The Committee and the Board also took note of the costs of the services provided (both on an absolute and relative basis) and the profitability to the Investment Manager and its affiliates in connection with their relationships with the Fund. In evaluating these considerations, the Committee and the Board took note of the advisory fees charged by the Investment Manager to other clients, including fees charged by the Investment Manager to institutional separate account clients with similar investment strategies to those of the Fund.
The Committee and the Board also considered the compensation directly or indirectly received by the Investment Manager's affiliates in connection with their relationships with the Fund. The Committee and the Board reviewed information provided by management as to the profitability of the Investment Manager and its affiliates of their relationships with the Fund, information about the allocation of expenses used to calculate profitability, and comparisons of profitability levels realized in 2013 to profitability levels realized in 2012. When reviewing profitability, the Committee and the Board also considered court cases in which adviser profitability was an issue in whole or in part, the performance of similarly managed funds, the performance of the Fund, and the expense ratio of the Fund. The Committee and the Board also considered information provided by the Investment Manager regarding the Investment Manager's financial condition and comparing its profitability to that of other asset management firms that are, or are subsidiaries of, publicly traded companies.
After reviewing these and related factors, the Committee and the Board concluded, within the context of their overall conclusions, that the costs of services provided and the profitability to the Investment Manager and its affiliates from their relationships with the Fund supported the continuation of the Advisory Agreement.
Economies of Scale
The Committee and the Board considered the potential existence of economies of scale in the provision by the Investment Manager of services to the Fund, to groups of related funds, and to the Investment Manager's investment advisory clients as a whole, and whether those economies of scale were shared with the Fund through breakpoints in investment advisory fees or other means, such as expense limitation arrangements and additional investments by the Investment Manager in investment, trading and compliance resources. The Committee and the Board noted that the investment advisory fee schedules for the Fund contained breakpoints that would reduce the fee rate on assets above specified threshold levels.
In considering these matters, the Committee and the Board also considered the costs of the services provided and the profitability to the Investment Manager and its affiliates from their relationships with the Fund, as discussed above. After
Annual Report 2014
77
Columbia Strategic Income Fund
Board Consideration and Approval of Advisory Agreement (continued)
reviewing these and related factors, the Committee and the Board concluded, within the context of their overall conclusions, that the extent to which any economies of scale were expected to be shared with the Fund supported the continuation of the Advisory Agreement.
Other Benefits to the Investment Manager
The Committee and the Board received and considered information regarding "fall-out" or ancillary benefits received by the Investment Manager and its affiliates as a result of their relationships with the Fund, such as the engagement of the Investment Manager to provide administrative services to the Fund and the engagement of the Investment Manager's affiliates to provide distribution and transfer agency services to the Fund. In this regard, among other matters, the Committee and the Board considered that the Fund's distributor retains a portion of the distribution fees from the Fund and receives a portion of the sales charges on sales or redemptions of certain classes of shares of the Fund. The Committee and the Board also considered the benefits of research made available to the Investment Manager by reason of brokerage commissions generated by the Fund's securities transactions, and reviewed information about the Investment Manager's practices with respect to allocating portfolio transactions for brokerage and research services. The Committee and the Board considered the possible conflicts of interest associated with certain fall-out or other ancillary benefits and the reporting, disclosure and other processes that are in place to address such possible conflicts of interest. The Committee and the Board recognized that the Investment Manager's profitability would be somewhat lower without these benefits.
Conclusion
The Committee and the Board reviewed all of the above considerations in reaching their decisions to recommend or approve the continuation of the Advisory Agreement. In their deliberations, the Trustees did not identify any particular information that was all-important or controlling, and individual Trustees may have attributed different weights to the various factors. Based on their evaluation of all factors that they deemed to be material, including those factors described above, and assisted by the advice of independent legal counsel, the Board, including the Independent Trustees, voting separately, unanimously approved the continuation of the Advisory Agreement.
Annual Report 2014
78
Columbia Strategic Income Fund
Important Information About This Report
Each fund mails one shareholder report to each shareholder address. If you would like more than one report, please call shareholder services at 800.345.6611 and additional reports will be sent to you.
The policy of the Board is to vote the proxies of the companies in which each fund holds investments consistent with the procedures as stated in the Statement of Additional Information (SAI). You may obtain a copy of the SAI without charge by calling 800.345.6611; contacting your financial intermediary; visiting columbiamanagement.com; or searching the website of the Securities and Exchange Commission (SEC) at sec.gov. Information regarding how each fund voted proxies relating to portfolio securities is filed with the SEC by August 31 for the most recent 12-month period ending June 30 of that year, and is available without charge by visiting columbiamanagement.com; or searching the website of the SEC at sec.gov.
Each fund files a complete schedule of portfolio holdings with the SEC for the first and third quarters of each fiscal year on Form N-Q. Each fund's Form N-Q is available on the SEC's website at sec.gov and may be reviewed and copied at the SEC's Public Reference Room in Washington, D.C. Information on the operation of the Public Reference Room may be obtained by calling 800.SEC.0330. Each fund's complete schedule of portfolio holdings, as filed on Form N-Q, can also be obtained without charge, upon request, by calling 800.345.6611.
Annual Report 2014
79

Columbia Strategic Income Fund
P.O. Box 8081
Boston, MA 02266-8081
columbiamanagement.com
This information is for use with concurrent or prior delivery of a fund prospectus. Please read and consider the investment objectives, risks, charges and expenses for any fund carefully before investing. For a prospectus and, if available, a summary prospectus, which contains this and other important information about the Fund, go to columbiamanagement.com. The Fund is distributed by Columbia Management Investment Distributors, Inc., member FINRA, and managed by Columbia Management Investment Advisers, LLC.
© 2014 Columbia Management Investment Advisers, LLC. All rights reserved.
ANN232_10_D01_(12/14)
Item 2. Code of Ethics.
(a) The registrant has adopted a code of ethics that applies to the registrant’s principal executive officer, principal financial officer, principal accounting officer or controller, or persons performing similar functions, regardless of whether these individuals are employed by the registrant or a third party.
(b) During the period covered by this report, there were not any amendments to a provision of the code of ethics adopted in 2(a) above.
(c) During the period covered by this report, there were no waivers, including any implicit waivers, from a provision of the code of ethics described in 2(a) above that relates to one or more of the items set forth in paragraph (b) of this item’s instructions.
Item 3. Audit Committee Financial Expert.
The registrant’s Board of Trustees has determined that Douglas A. Hacker, David M. Moffett and Anne-Lee Verville, each of whom are members of the registrant’s Board of Trustees and Audit Committee, each qualify as an audit committee financial expert. Mr. Hacker, Mr. Moffett and Ms. Verville are each independent trustees, as defined in paragraph (a)(2) of this item’s instructions.
Item 4. Principal Accountant Fees and Services.
Fee information below is disclosed for the eight series of the registrant whose reports to stockholders are included in this annual filing. In addition, two series merged away in 2013 and the fees incurred by those series through its merger date are included in the response to this Item.
(a) Audit Fees. Aggregate Audit Fees billed by the principal accountant for professional services rendered during the fiscal years ended October 31, 2014 and October 31, 2013 are approximately as follows:
2014 | | 2013 | |
$ | 190,800 | | $ | 196,900 | |
| | | | | |
Audit Fees include amounts related to the audit of the registrant’s annual financial statements or services that are normally provided by the accountant in connection with statutory and regulatory filings or engagements for those fiscal years. Fiscal year 2013 also includes audit fees for the review and provision of consent in connection with filing Form N-14 for fund mergers.
(b) Audit-Related Fees. Aggregate Audit-Related Fees billed to the registrant by the principal accountant for professional services rendered during the fiscal years ended October 31, 2014 and October 31, 2013 are approximately as follows:
Audit-Related Fees include amounts for assurance and related services by the principal accountant that are reasonably related to the performance of the audit of the registrant’s financial statements and are not reported in Audit Fees above. In fiscal years 2014 and 2013, Audit-Related Fees consist of agreed-upon procedures performed for semi-annual shareholder reports.
During the fiscal years ended October 31, 2014 and October 31, 2013, there were no Audit-Related Fees billed by the registrant’s principal accountant to the registrant’s investment adviser (not including any sub-adviser whose role is primarily portfolio management and is subcontracted with or overseen by another investment adviser) and any entity controlling, controlled by, or under common control with the adviser that provides ongoing services to the registrant for an engagement that related directly to the operations and financial reporting of the registrant.
(c) Tax Fees. Aggregate Tax Fees billed by the principal accountant to the registrant for professional services rendered during the fiscal years ended October 31, 2014 and October 31, 2013 are approximately as follows:
2014 | | 2013 | |
$ | 26,500 | | $ | 52,700 | |
| | | | | |
Tax Fees include amounts for the review of annual tax returns, the review of required shareholder distribution calculations and typically include amounts for professional services by the principal accountant for tax compliance, tax advice and tax planning. Fiscal year 2014 also includes Tax Fees for the review of foreign tax filings. Fiscal year 2013 also includes Tax Fees for the review of agreed-upon procedures for fund mergers and the review of final tax returns.
During the fiscal years ended October 31, 2014 and October 31, 2013, there were no Tax Fees billed by the registrant’s principal accountant to the registrant’s investment adviser (not including any sub-adviser whose role is primarily portfolio management and is subcontracted with or overseen by another investment adviser) and any entity controlling, controlled by, or under common control with the adviser that provides ongoing services
to the registrant for an engagement that related directly to the operations and financial reporting of the registrant.
(d) All Other Fees. Aggregate All Other Fees billed by the principal accountant to the registrant for professional services rendered during the fiscal years ended October 31, 2014 and October 31, 2013 are approximately as follows:
All Other Fees include amounts for products and services provided by the principal accountant, other than the services reported in paragraphs (a) through (c) above.
Aggregate All Other Fees billed by the registrant’s principal accountant to the registrant’s investment adviser (not including any sub-adviser whose role is primarily portfolio management and is subcontracted with or overseen by another investment adviser) and any entity controlling, controlled by, or under common control with the adviser that provides ongoing services to the registrant for an engagement that related directly to the operations and financial reporting of the registrant during the fiscal years ended October 31, 2014 and October 31, 2013 are approximately as follows:
2014 | | 2013 | |
$ | 325,000 | | $ | 160,400 | |
| | | | | |
In both fiscal years 2014 and 2013, All Other Fees primarily consist of fees billed for internal control examinations of the registrant’s transfer agent and investment advisor.
(e)(1) Audit Committee Pre-Approval Policies and Procedures
The registrant’s Audit Committee is required to pre-approve the engagement of the registrant’s independent auditors to provide audit and non-audit services to the registrant and non-audit services to its investment adviser (excluding any sub-adviser whose role is primarily portfolio management and is sub-contracted or overseen by another investment adviser (the “Adviser”) or any entity controlling, controlled by or under common control with the Adviser that provides ongoing services to the Fund (a “Control Affiliate”) if the engagement relates directly to the operations and financial reporting of the registrant.
The Audit Committee has adopted a Policy for Engagement of Independent Auditors for Audit and Non-Audit Services (the “Policy”). The Policy sets forth the understanding of the Audit Committee regarding the engagement of the registrant’s independent accountants to provide (i) audit and permissible audit-related, tax and other services to the registrant (“Fund Services”); (ii) non-audit services to the registrant’s Adviser and any Control Affiliates, that relates directly to the operations and financial reporting of a Fund (“Fund-related Adviser Services”); and (iii) certain other audit and non-audit services to the registrant’s Adviser and its Control Affiliates. A service will require specific pre-approval by the Audit Committee if it is to be provided by the Fund’s
independent auditor; provided, however, that pre-approval of non-audit services to the Fund, the Adviser or Control Affiliates may be waived if certain de minimis requirements set forth in the SEC’s rules are met.
Under the Policy, the Audit Committee may delegate pre-approval authority to any pre-designated member or members who are independent board members. The member(s) to whom such authority is delegated must report, for informational purposes only, any pre-approval decisions to the Audit Committee at its next regular meeting. The Audit Committee’s responsibilities with respect to the pre-approval of services performed by the independent auditor may not be delegated to management.
On an annual basis, at a regularly scheduled Audit Committee meeting, the Fund’s Treasurer or other Fund officer shall submit to the Audit Committee a schedule of the types of Fund Services and Fund-related Adviser Services that are subject to specific pre-approval. This schedule will provide a description of each type of service that is subject to specific pre-approval, along with total projected fees for each service. The pre-approval will generally cover a one-year period. The Audit Committee will review and approve the types of services and the projected fees for the next one-year period and may add to, or subtract from, the list of pre-approved services from time to time, based on subsequent determinations. This specific approval acknowledges that the Audit Committee is in agreement with the specific types of services that the independent auditor will be permitted to perform and the projected fees for each service.
The Fund’s Treasurer or other Fund officer shall report to the Audit Committee at each of its regular meetings regarding all Fund Services or Fund-related Adviser Services provided since the last such report was rendered, including a description of the services, by category, with forecasted fees for the annual reporting period, proposed changes requiring specific pre-approval and a description of services provided by the independent auditor, by category, with actual fees during the current reporting period.
*****
(e)(2) 100% of the services performed for items (b) through (d) above during 2014 and 2013 were pre-approved by the registrant’s Audit Committee.
(f) Not applicable.
(g) The aggregate non-audit fees billed by the registrant’s accountant for services rendered to the registrant, and rendered to the registrant’s investment adviser (not including any sub-adviser whose role is primarily portfolio management and is subcontracted with or overseen by another investment adviser), and any entity controlling, controlled by, or under common control with the adviser that provides ongoing services to the registrant during the fiscal years ended October 31, 2014 and October 31, 2013 are approximately as follows:
2014 | | 2013 | |
$ | 354,700 | | $ | 216,300 | |
| | | | | |
(h) The registrant’s Audit Committee of the Board of Directors has considered whether the provision of non-audit services that were rendered to the registrant’s adviser (not including any sub-adviser whose role is primarily portfolio management and is subcontracted with or overseen by another investment adviser), and any entity controlling, controlled by, or under common control with the investment adviser that provides ongoing services to the registrant that were not pre-approved pursuant to paragraph (c)(7)(ii) of Rule 2-01 of Regulation S-X, is compatible with maintaining the principal accountant’s independence.
Item 5. Audit Committee of Listed Registrants.
Not applicable.
Item 6. Investments
(a) The registrant’s “Schedule I — Investments in securities of unaffiliated issuers” (as set forth in 17 CFR 210.12-12) is included in Item 1 of this Form N-CSR.
(b) Not applicable.
Item 7. Disclosure of Proxy Voting Policies and Procedures for Closed-End Management Investment Companies.
Not applicable.
Item 8. Portfolio Managers of Closed-End Management Investment Companies.
Not applicable.
Item 9. Purchases of Equity Securities by Closed-End Management Investment Company and Affiliated Purchasers.
Not applicable.
Item 10. Submission of Matters to a Vote of Security Holders.
There were no material changes to the procedures by which shareholders may recommend nominees to the registrant’s board of directors.
Item 11. Controls and Procedures.
(a) The registrant’s principal executive officer and principal financial officers, based on their evaluation of the registrant’s disclosure controls and procedures as of a date within 90 days of the filing of this report, have concluded that such controls and procedures are adequately designed to ensure that material information required to be disclosed by the registrant in Form N-CSR is accumulated and
communicated to the registrant’s management, including the principal executive officer and principal financial officer, or persons performing similar functions, as appropriate to allow timely decisions regarding required disclosure.
(b) There was no change in the registrant’s internal control over financial reporting that occurred during the registrant’s second fiscal quarter of the period covered by this report that has materially affected, or is reasonably likely to materially affect, the registrant’s internal control over financial reporting.
Item 12. Exhibits.
(a)(1) Code of ethics required to be disclosed under Item 2 of Form N-CSR attached hereto as Exhibit 99.CODE ETH.
(a)(2) Certifications pursuant to Rule 30a-2(a) under the Investment Company Act of 1940 (17 CFR 270.30a-2(a)) attached hereto as Exhibit 99.CERT.
(a)(3) Not applicable.
(b) Certification pursuant to Rule 30a-2(b) under the Investment Company Act of 1940 (17 CFR 270.30a-2(b)) attached hereto as Exhibit 99.906CERT.
SIGNATURES
Pursuant to the requirements of the Securities Exchange Act of 1934 and the Investment Company Act of 1940, the registrant has duly caused this report to be signed on its behalf by the undersigned, thereunto duly authorized.
(registrant) | | | Columbia Funds Series Trust I | |
| |
| |
By (Signature and Title) | | /s/ J. Kevin Connaughton | |
| | J. Kevin Connaughton, President and Principal Executive Officer | |
| |
| |
Date | | December 22, 2014 | |
| | | | | |
Pursuant to the requirements of the Securities Exchange Act of 1934 and the Investment Company Act of 1940, this report has been signed below by the following persons on behalf of the registrant and in the capacities and on the dates indicated.
By (Signature and Title) | | /s/ J. Kevin Connaughton | |
| | J. Kevin Connaughton, President and Principal Executive Officer | |
| |
| |
Date | | December 22, 2014 | |
| |
| |
By (Signature and Title) | | /s/ Michael G. Clarke | |
| | Michael G. Clarke, Treasurer and Chief Financial Officer | |
| |
| |
Date | | December 22, 2014 | |
| | | | |