UNITED STATES
SECURITIES AND EXCHANGE COMMISSION
Washington, D.C. 20549
FORM N-CSR
CERTIFIED SHAREHOLDER REPORT OF REGISTERED
MANAGEMENT INVESTMENT COMPANIES
Investment Company Act file number | 811-04367 |
|
Columbia Funds Series Trust I |
(Exact name of registrant as specified in charter) |
|
225 Franklin Street, Boston, MA | | 02110 |
(Address of principal executive offices) | | (Zip code) |
|
Ryan Larrenaga c/o Columbia Management Investment Advisers, LLC 225 Franklin Street Boston, MA 02110 |
(Name and address of agent for service) |
|
Registrant’s telephone number, including area code: | (800) 345-6611 | |
|
Date of fiscal year end: | January 31 | |
|
Date of reporting period: | January 31, 2015 | |
| | | | | | | | |
Form N-CSR is to be used by management investment companies to file reports with the Commission not later than 10 days after the transmission to stockholders of any report that is required to be transmitted to stockholders under Rule 30e-1 under the Investment Company Act of 1940 (17 CFR 270.30e-1). The Commission may use the information provided on Form N-CSR in its regulatory, disclosure review, inspection, and policymaking roles.
A registrant is required to disclose the information specified by Form N-CSR, and the Commission will make this information public. A registrant is not required to respond to the collection of information contained in Form N-CSR unless the Form displays a currently valid Office of Management and Budget (“OMB”) control number. Please direct comments concerning the accuracy of the information collection burden estimate and any suggestions for reducing the burden to Secretary, Securities and Exchange Commission, 450 Fifth Street, NW, Washington, DC 20549-0609. The OMB has reviewed this collection of information under the clearance requirements of 44 U.S.C. § 3507.
Item 1. Reports to Stockholders.

ANNUAL REPORT
January 31, 2015

COLUMBIA DIVERSIFIED REAL RETURN FUND


ABOUT COLUMBIA THREADNEEDLE INVESTMENTS
Columbia Threadneedle Investments is a leading global asset management group that provides a broad range of actively managed investment strategies and solutions for individual, institutional and corporate clients around the world.
With more than 2,000 people, including over 450 investment professionals based in North America, Europe and Asia, we manage $506 billion* of assets across developed and emerging market equities, fixed income, asset allocation solutions and alternatives. We are the 11th largest manager of long-term mutual fund assets in the U.S.** and the 5th largest manager of retail funds in the U.K.***
Our priority is the investment success of our clients. We aim to deliver the investment outcomes they expect through an investment approach that is team-based, performance-driven and risk-aware. Our culture is dynamic and interactive. By sharing our insights across asset classes and geographies, we generate richer perspectives on global, regional and local investment landscapes. The ability to exchange and debate investment ideas in a collaborative environment enriches our teams' investment processes. More importantly, it results in better informed investment decisions for our clients.
Columbia funds are distributed by Columbia Management Investment Distributors, Inc., member FINRA, and managed by Columbia Management Investment Advisers, LLC.
Columbia Threadneedle Investments (Columbia Threadneedle) is the global brand name of the Columbia and Threadneedle group of companies.
* In U.S. dollars as of December 31, 2014. Source: Ameriprise Q4 Earnings Release. Includes all assets managed by entities in the Columbia and Threadneedle groups of companies. Contact us for more current data.
** Source: ICI as of December 31, 2014 for Columbia Management Investment Advisers, LLC.
*** Source: Investment Association as of December 2014 for Threadneedle Asset Management Limited.
© 2015 Columbia Management Investment Advisers, LLC. All rights reserved.
Not part of the shareholder report
Get the market insight you need from our investment experts
Connect with Columbia Threadneedle Investments
Investor insight
Find economic and market commentary, investment videos, white papers, mutual fund commentary and more at columbiathreadneedle.com/us.
 Columbia Threadneedle Investor Newsletter (e-newsletter)
Read our award-winning* shareholder newsletter. Our quarterly newsletter is available online and provides timely and relevant content about economic trends, fund news, service enhancements and changes. Sign up to receive the newsletter electronically at columbiathreadneedle.com/
us/newsletter.

 Investment videos
Get analysis of current events and trends that may affect your investments. Visit our online video library to watch and discover what our thought leaders are saying about the financial markets and economy.
 Social media
We offer you multiple ways to access our market commentary and investment insights.
n Perspectives blog at columbiathreadneedle.com/us
Read timely posts by our investment team, including our chief investment officer, chief economist and portfolio managers.
n Twitter.com/CTinvest_US
Follow us on Twitter for quick, up-to-the-minute comments on market news and more.
n Youtube.com/user/CTinvestUS
View our commentaries on the economy, markets and current investment opportunities.
n Linkedin.com/company/Columbia-Threadneedle-Investments-US
Connect with us on LinkedIn for updates from our thought leaders.
*Columbia Threadneedle Investor Newsletter was awarded top honors in the Mutual Fund Education Alliance STAR Awards competition for excellence in mutual fund marketing and communications in 2011, 2012 and 2013. Materials in the competition were evaluated on educational value, message comprehension, effective design and objectives.
Not part of the shareholder report
Stay informed
Become a subscriber to receive the latest investment publications and mutual fund commentaries
Subscribe to Columbia Threadneedle Investments
Email subscription center
Subscribe to the latest information from Columbia Threadneedle. Visit our email subscription center at columbiathreadneedle.com/us/subscribe to register for economic and market commentary, product and service updates, white papers and more.
n Columbia Threadneedle Investor Newsletter
Quarterly newsletter featuring the latest macro- and micro-economic trends, investment themes, products, service changes and other items of interest to our investors
n Investment Strategy Outlook
Quarterly publication featuring the Columbia Threadneedle Asset Allocation Team's perspective on global economic investment conditions and markets
n MarketTrack
Quarterly publication featuring more than 40 charts and graphs that highlight the current state of the economy and the markets; includes straightforward insight on current investment opportunities
n White papers
Frequent articles that delve deep into a variety of investment topics
n Mutual fund updates
Quarterly portfolio manager commentary and fund fact sheets available for Columbia funds. (Not all funds have a commentary.)
Register your information online at columbiathreadneedle.com/us/subscribe and select the publications you would like to receive. Update your subscriptions at any time by accessing the email subscription center.

CT-MK (03/15) 5383/1125800
 Dear Shareholder,
In a world that is changing faster than ever before, investors want asset managers who offer a global perspective while generating strong and sustainable returns. To that end, Columbia Management, in conjunction with its U.K.-based affiliate, Threadneedle Investments, has rebranded to Columbia Threadneedle Investments. The new global brand represents the combined capabilities, resources and reach of the global group, offering investors access to the best of both firms.
With a presence in 18 countries and more than 450 investment professionals*, our collective perspective and world view as Columbia Threadneedle Investments gives us deeper insight into what might affect the real-life financial outcomes clients are seeking. Putting our views into a global context enables us to build richer perspectives and create the right solutions, and provides us with enhanced capabilities to deliver consistent investment performance, which may ultimately lead to better investor outcomes.
As a result of the rebrand, you will begin to see our new logo and colors reflected in printed materials, such as this shareholder report, as well as on our new website — columbiathreadneedle.com/us. We encourage you to visit us online and view a new video on the "About Us" tab that speaks to the strength of the firm.
While we are introducing a new brand, in many ways, the investment company you know well has not changed. The following remain in effect:
> Fund and strategy names
> Established investment teams, philosophies and processes
> Account services, features, servicing phone numbers and mailing addresses
> Columbia Management Investment Distributors as distributor and Columbia Management Investment Advisers as investment adviser
We recognize that the money we manage represents the hard work and savings of people like you, and that everyone has different ambitions and different definitions of success. Investors have varying goals — funding their children's education, enjoying their retirement, putting money aside for unexpected events, and more. Whatever your ambitions, we believe our wide range of investment products and solutions can help give you confidence that you will reach your goals.
The world is constantly changing, but our priority remains the same: to help you secure your finances, meet your goals and achieve success. Thank you for your continued investment with us. Our service representatives are available at 800.345.6611 to help with any questions.
Sincerely,

Christopher O. Petersen
President, Columbia Funds
Investors should consider the investment objectives, risks, charges and expenses of a mutual fund carefully before investing. For a free prospectus and summary prospectus, which contains this and other important information about a fund, visit columbiathreadneedle.com/us. The prospectus should be read carefully before investing.
* Source: Ameriprise as of December 1, 2014
Columbia Funds are distributed by Columbia Management Investment Distributors, Inc., member FINRA, and managed by Columbia Management Investment Advisers, LLC.
© 2015 Columbia Management Investment Advisers, LLC. All rights reserved.
Columbia Diversified Real Return Fund
Fund Investment Manager
Columbia Management Investment
Advisers, LLC
225 Franklin Street
Boston, MA 02110
Fund Distributor
Columbia Management Investment
Distributors, Inc.
225 Franklin Street
Boston, MA 02110
Fund Transfer Agent
Columbia Management Investment
Services Corp.
P.O. Box 8081
Boston, MA 02266-8081
For more information about any of the funds, please visit columbiathreadneedle.com/us or call 800.345.6611. Customer Service Representatives are available to answer your questions Monday through Friday from 8 a.m. to 7 p.m. Eastern time.
The views expressed in this report reflect the current views of the respective parties. These views are not guarantees of future performance and involve certain risks, uncertainties and assumptions that are difficult to predict, so actual outcomes and results may differ significantly from the views expressed. These views are subject to change at any time based upon economic, market or other conditions and the respective parties disclaim any responsibility to update such views. These views may not be relied on as investment advice and, because investment decisions for a Columbia fund are based on numerous factors, may not be relied on as an indication of trading intent on behalf of any particular Columbia fund. References to specific securities should not be construed as a recommendation or investment advice.
Performance Overview | | | 3 | | |
Manager Discussion of Fund Performance | | | 5 | | |
Understanding Your Fund's Expenses | | | 7 | | |
Portfolio of Investments | | | 8 | | |
Statement of Assets and Liabilities | | | 13 | | |
Statement of Operations | | | 15 | | |
Statement of Changes in Net Assets | | | 16 | | |
Financial Highlights | | | 18 | | |
Notes to Financial Statements | | | 24 | | |
Report of Independent Registered
Public Accounting Firm | | | 34 | | |
Trustees and Officers | | | 35 | | |
Important Information About This Report | | | 39 | | |
Columbia Diversified Real Return Fund
Performance Summary
> Columbia Diversified Real Return Fund (the Fund) Class A shares returned -2.58% excluding sales charges from its inception on March 11, 2014 through January 31, 2015.
> During the same time period, the Fund underperformed its Blended Index, which returned -0.18%, as well as the Citigroup 3-Month U.S. Treasury Bill Index, which returned 0.03%.
> The Fund's underperformance of the Blended Index can be attributed primarily to underlying fund performance, active allocation decisions and duration positioning.
Average Annual Total Returns (%) (for period ended January 31, 2015)
| | | Inception | | Life | |
Class A | | 03/11/14 | | | | | |
Excluding sales charges | | | | | | | -2.58 | | |
Including sales charges | | | | | | | -7.22 | | |
Class C | | 03/11/14 | | | | | |
Excluding sales charges | | | | | | | -3.24 | | |
Including sales charges | | | | | | | -4.18 | | |
Class R4 | | 03/11/14 | | | -2.37 | | |
Class R5 | | 03/11/14 | | | -2.42 | | |
Class W* | | 06/25/14 | | | -2.65 | | |
Class Z | | 03/11/14 | | | -2.37 | | |
Blended Index | | | | | | | -0.18 | | |
Citigroup 3-Month U.S. Treasury Bill Index | | | | | | | 0.03 | | |
Returns for Class A are shown with and without the maximum initial sales charge of 4.75%. Returns for Class C are shown with and without the 1.00% CDSC for the first year only. The Fund's other classes are not subject to sales charges and have limited eligibility. Please see the Fund's prospectus for details. Performance for different share classes will vary based on differences in sales charges and fees associated with each class. All results shown assume reinvestment of distributions during the period. Returns do not reflect the deduction of taxes that a shareholder may pay on Fund distributions or on the redemption of Fund shares. Performance results reflect the effect of any fee waivers or reimbursements of Fund expenses by Columbia Management Investment Advisers, LLC and/or any of its affiliates. Absent these fee waivers or expense reimbursement arrangements, performance results would have been lower.
The performance information shown represents past performance and is not a guarantee of future results. The investment return and principal value of your investment will fluctuate so that your shares, when redeemed, may be worth more or less than their original cost. Current performance may be lower or higher than the performance information shown. You may obtain performance information current to the most recent month-end by contacting your financial intermediary, visiting columbiathreadneedle.com/us or calling 800.345.6611.
*The returns shown for periods prior to the share class inception date (including returns for the Life of the Fund, if shown, which are since Fund inception) include the returns of the Fund's oldest share class. Since the Fund launched more than one share class at its inception, Class A shares were used. These returns are adjusted to reflect any higher class-related operating expenses of the newer share classes, as applicable. Please visit columbiathreadneedle.com/us/investment-products/mutual-funds/appended-performance for more information.
The Blended Index consists of consists of 35% Barclays Global Inflation-Linked Index (Hedged), 30% Credit Suisse Leveraged Loan Index, 20% Barclays U.S. Dollar Floating Rate Note (FRN) Index and 15% Bloomberg Commodity Index Total Return.
The Citigroup 3-Month U.S. Treasury Bill Index, an unmanaged index, is representative of the performance of three-month Treasury bills.
Indices are not available for investment, are not professionally managed and do not reflect sales charges, fees, brokerage commissions, taxes or other expenses of investing. Securities in the Fund may not match those in an index.
Annual Report 2015
3
Columbia Diversified Real Return Fund
Performance Overview (continued)
Performance of a Hypothetical $10,000 Investment (March 11, 2014 – January 31, 2015)
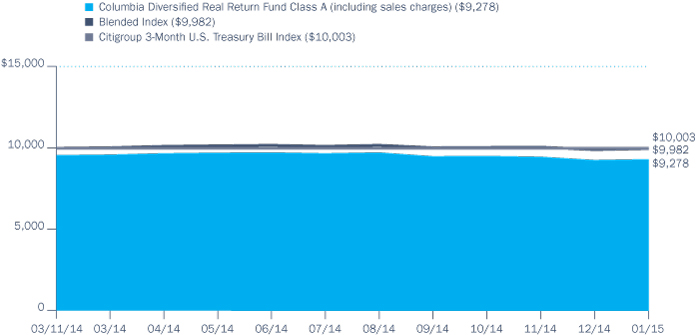
The chart above shows the change in value of a hypothetical $10,000 investment in Class A shares of Columbia Diversified Real Return Fund during the stated time period, and does not reflect the deduction of taxes that a shareholder may pay on Fund distributions or on the redemption of Fund shares.
Annual Report 2015
4
Columbia Diversified Real Return Fund
Manager Discussion of Fund Performance
From the Fund's inception on March 11, 2014 through January 31, 2015, the Fund's Class A shares returned -2.58% excluding sales charges. During the same time period, the Fund underperformed its Blended Index, which returned -0.18%, as well as the Citigroup 3-Month U.S. Treasury Bill Index, which returned 0.03%. The Fund's underperformance of the Blended Index can be attributed primarily to underlying fund performance, active allocation decisions and duration positioning.
Drop in Oil Prices Suppressed U.S. Inflation
Inflation in the U.S. was suppressed during the period due primarily to the sharp drop in commodity prices. Oil prices in particular plunged from nearly $100 per barrel to approximately $45 per barrel. Also contributing to weak inflation data was the strengthening of the U.S. dollar, which drove import prices lower. Core inflation, which excludes energy and food prices, was somewhat stronger, supported by robust services sector pricing and housing data. The headline Consumer Price Index (CPI) registered a year-over-year decline of -0.01% as of January 2015, dropping rapidly after peaking in May 2014 at 2.1% and becoming the first negative 12-month change since the period ending October 2009. Core CPI was 1.6% for the 12 months ended January 2015, similarly having peaked in May 2014 at 2.0%.
Underlying Fund Performance and Positioning Dampened Results
Overall, underlying fund performance, active allocation decisions and duration positioning detracted from the Fund's performance relative to the Blended Index. Investments in underlying funds Columbia Commodity Strategy Fund, Columbia Floating Rate Fund and Columbia Global Inflation-Linked Bond Plus Fund detracted from the Fund's results during the period, as each underperformed its respective benchmark index. Our active allocation decision to favor U.S. inflation-linked bonds over global inflation-linked bonds also detracted. We maintained a more positive view of U.S. inflation-linked bonds given our more constructive outlook on U.S. inflation vs. global inflation. However, global inflation-linked bonds outperformed their U.S. counterparts during the period, with European real rates dropping to unprecedented levels. (Real yield refers to the yield on the inflation-linked securities, not an inflation-adjusted yield.)
We maintained the Fund's duration shorter than that of the Blended Index, which hurt as yields declined both in the U.S. and abroad. To a lesser degree, the Fund's holdings in inflation-sensitive credit sectors, such as oil, mining and energy, dampened relative results, as credit spreads (or the differential in yields between non-Treasury securities and Treasury securities that are identical in all respects except for quality rating) widened. On an absolute basis, exposure to commodities was by far the biggest detractor from the Fund's performance. Commodities, as measured by the Bloomberg Commodity Index, declined 25.38% during the reporting period.
On the positive side, the Fund's yield curve positioning contributed to its results relative to the Blended Index. The Fund was positioned for a flattening yield curve (a narrowing in the differential between shorter-term and longer-term yields) both in the U.S. and globally. As both the U.S. and European yield curves did indeed flatten during the reporting period, such positioning helped. The Fund's relative results were also aided by its overweight allocation to high-yield
Portfolio Management
Jeffrey Knight, CFA
Orhan Imer, Ph.D., CFA
Portfolio Breakdown (%)
(at January 31, 2015) | |
Alternative Investment Funds | | | 15.7 | | |
Fixed-Income Funds | | | 73.6 | | |
Floating Rate | | | 36.1 | | |
High Yield | | | 4.9 | | |
Inflation Protected Securities | | | 32.6 | | |
Asset-Backed Securities | | | 5.2 | | |
Corporate Bonds & Notes | | | 1.8 | | |
Foreign Government
Obligations | | | 1.2 | | |
Money Market Funds | | | 2.5 | | |
Total | | | 100.0 | | |
Percentages indicated are based upon total investments. The Fund's portfolio composition is subject to change.
Annual Report 2015
5
Columbia Diversified Real Return Fund
Manager Discussion of Fund Performance (continued)
Investment Risks
Market risk may impact a single issuer, sector of the economy, industry or the market as a whole. Fixed-income securities and loan investments present issuer default risk. Risks are enhanced for sovereign debt issuers. A rise in interest rates may result in a price decline of fixed-income instruments held by the fund, negatively impacting its performance and NAV. Falling rates may result in the Fund investing in lower yielding debt instruments, lowering the Fund's income and yield. These risks may be heightened for longer maturity and duration securities. Interest payments on inflation-protected securities may be more volatile than interest paid on ordinary bonds. In periods of deflation, these securities may provide no income. Commodities investments may be affected by the overall market and industry- and commodity-specific factors and may be more volatile and less liquid than other investments. Investing in derivatives is a specialized activity which involves special risks, which may result in significant losses or limited gains. Non-investment grade (high-yield or junk securities) securities present greater price volatility and more risk to principal and income than higher-rated securities. International investing involves certain risks and volatility due to potential political, economic or currency instabilities and different financial and accounting standards. Risks are enhanced for emerging market issuers. Asset allocation does not assure a profit or protect against loss. The Fund's investment in other funds subjects it to the investment performance (positive or negative), risks and expenses of these underlying funds. See the Fund's prospectus for more information on these and other risks.
corporate bonds, which outperformed high-yield loans (represented in the Blended Index) during the reporting period. Exposure to global inflation-linked bonds was the greatest positive contributor to the Fund's absolute performance. During the reporting period, the Barclays Global Inflation Linked Index (Hedged) was up 10.81%.
Inflation Views Drove Positioning
Given the Fund's launch date, it was not a matter of making changes during the period but of building the portfolio according to its mandated active investment strategy, which uses multiple asset classes to manage the risks inherent in headline inflation and inflation expectations. At the end of the period, the Fund was overweight in commodities compared to the Blended Index, overweight in inflation-sensitive credit assets vs. cash, overweight in U.S. inflation-linked bonds vs. global inflation-linked bonds, and overweight in high-yield corporate bonds vs. high-yield floating rate loans. The Fund maintained a shorter duration than that of the Blended Index at the end of the period.
Derivative Positions
During the reporting period, the Fund used U.S. and foreign bond futures and interest rate swaps to manage its overall duration and yield curve positioning. While the effect on swap contracts had a positive impact on Fund performance, this was more than offset by the detracting effect of futures contracts during the period.
Looking Ahead
At this time, we expect U.S. inflation to bottom in February or March 2015 and slowly inch back up to an approximately 2.0% level over the remainder of the calendar year. We believe the catalysts of the reversal in the inflation trend are likely to be the stabilization of oil and other commodity prices as well as higher wage and services inflation. We also currently expect inflation risk premiums to normalize in the inflation markets, with higher breakeven rates across the curve and a steeper breakeven curve in the U.S. (Breakeven rates are the difference in yield between inflation-protected and nominal, or non-inflation-protected, debt of the same maturity. If the breakeven rate is negative, it suggests the markets are betting that the economy may face deflation in the near future. If the breakeven rate is positive, it suggests the markets are betting that the economy may face inflation in the near future.)
Globally, we expect inflationary forces to work back into economies. For example, in Europe, action by the European Central Bank is anticipated to be supportive of higher inflationary metrics, as inflation expectations may be pushed out with lower exchanges rates and a strengthening euro-area economy. Similarly, we believe emerging market countries are likely to continue to face higher inflationary pressures, mainly through the exchange rate channel should the strength of the U.S. dollar persist.
At the end of the reporting period, the Fund was positioned in alignment with our current view ahead. We will, of course, carefully monitor monetary policies, economic data and other factors that may impact the U.S. and global inflation scenarios and will make adjustments to Fund positioning as market conditions warrant.
Annual Report 2015
6
Columbia Diversified Real Return Fund
Understanding Your Fund's Expenses
(Unaudited)
As an investor, you incur two types of costs. There are transaction costs, which generally include sales charges on purchases and may include redemption fees. There are also ongoing costs, which generally include management fees, distribution and/or service fees, and other fund expenses. The following information is intended to help you understand your ongoing costs (in dollars) of investing in the Fund and to help you compare these costs with the ongoing costs of investing in other mutual funds.
Analyzing Your Fund's Expenses
To illustrate these ongoing costs, we have provided examples and calculated the expenses paid by investors in each share class of the Fund during the period. The actual and hypothetical information in the table is based on an initial investment of $1,000 at the beginning of the period indicated and held for the entire period. Expense information is calculated two ways and each method provides you with different information. The amount listed in the "Actual" column is calculated using the Fund's actual operating expenses and total return for the period. You may use the Actual information, together with the amount invested, to estimate the expenses that you paid over the period. Simply divide your account value by $1,000 (for example, an $8,600 account value divided by $1,000 = 8.6), then multiply the results by the expenses paid during the period under the "Actual" column. The amount listed in the "Hypothetical" column assumes a 5% annual rate of return before expenses (which is not the Fund's actual return) and then applies the Fund's actual expense ratio for the period to the hypothetical return. You should not use the hypothetical account values and expenses to estimate either your actual account balance at the end of the period or the expenses you paid during the period. See "Compare With Other Funds" below for details on how to use the hypothetical data.
In addition to the ongoing expenses which the Fund bears directly, the Fund's shareholders indirectly bear the Fund's allocable share of the costs and expenses of each underlying fund in which the Fund invests. You can also estimate the effective expenses paid during the period, which includes the indirect fees associated with investing in the underlying funds, by using the amounts listed in the "Effective Expenses Paid During the Period" column.
Compare With Other Funds
Since all mutual funds are required to include the same hypothetical calculations about expenses in shareholder reports, you can use this information to compare the ongoing cost of investing in the Fund with other funds. To do so, compare the hypothetical example with the 5% hypothetical examples that appear in the shareholder reports of other funds. As you compare hypothetical examples of other funds, it is important to note that hypothetical examples are meant to highlight the ongoing costs of investing in a fund only and do not reflect any transaction costs, such as sales charges, or redemption or exchange fees. Therefore, the hypothetical calculations are useful in comparing ongoing costs only, and will not help you determine the relative total costs of owning different funds. If transaction costs were included in these calculations, your costs would be higher.
August 1, 2014 – January 31, 2015
| | | Account Value at
the Beginning of
the Period ($) | | Account Value at
the End of
the Period ($) | | Expenses Paid
During the
Period ($) | | Fund's Annualized
Expense Ratio (%) | | Effective Expenses
Paid During the
Period ($) | | Fund's Effective
Annualized
Expense Ratio (%) | |
| | | Actual | | Hypothetical | | Actual | | Hypothetical | | Actual | | Hypothetical | | Actual | | Actual | | Hypothetical | | Actual | |
Class A | | | 1,000.00 | | | | 1,000.00 | | | | 961.60 | | | | 1,022.86 | | | | 2.16 | | | | 2.23 | | | | 0.44 | | | | 5.16 | | | | 5.32 | | | | 1.05 | | |
Class C | | | 1,000.00 | | | | 1,000.00 | | | | 957.90 | | | | 1,019.05 | | | | 5.89 | | | | 6.07 | | | | 1.20 | | | | 8.88 | | | | 9.16 | | | | 1.81 | | |
Class R4 | | | 1,000.00 | | | | 1,000.00 | | | | 962.80 | | | | 1,024.12 | | | | 0.93 | | | | 0.96 | | | | 0.19 | | | | 3.94 | | | | 4.06 | | | | 0.80 | | |
Class R5 | | | 1,000.00 | | | | 1,000.00 | | | | 961.90 | | | | 1,023.31 | | | | 1.72 | | | | 1.78 | | | | 0.35 | | | | 4.72 | | | | 4.87 | | | | 0.96 | | |
Class W | | | 1,000.00 | | | | 1,000.00 | | | | 960.90 | | | | 1,022.81 | | | | 2.21 | | | | 2.28 | | | | 0.45 | | | | 5.21 | | | | 5.38 | | | | 1.06 | | |
Class Z | | | 1,000.00 | | | | 1,000.00 | | | | 962.80 | | | | 1,024.07 | | | | 0.98 | | | | 1.01 | | | | 0.20 | | | | 3.99 | | | | 4.11 | | | | 0.81 | | |
Expenses paid during the period are equal to the Fund's annualized expense ratio for each class as indicated above, multiplied by the average account value over the period and then multiplied by the number of days in the Fund's most recent fiscal half year and divided by 365.
Effective expenses paid during the period and the Fund's effective annualized expense ratio include expenses borne directly to the class plus the Fund's pro rata portion of the ongoing expenses charged by the underlying funds using the expense ratio of each class of the underlying funds as of the underlying fund's most recent shareholder report.
Had Columbia Management Investment Advisers, LLC and/or certain of its affiliates not waived/reimbursed certain fees and expenses, account value at the end of the period would have been reduced.
Annual Report 2015
7
Columbia Diversified Real Return Fund
Portfolio of Investments
January 31, 2015
(Percentages represent value of investments compared to net assets)
Fixed-Income Funds 73.4%
| | | Shares | | Value ($) | |
Floating Rate 36.0% | |
Columbia Floating Rate Fund,
Class I Shares(a) | | | 381,398 | | | | 3,417,324 | | |
High Yield 4.9% | |
Columbia High Yield Bond Fund,
Class I Shares(a) | | | 86,766 | | | | 256,828 | | |
Columbia Income Opportunities Fund,
Class I Shares(a) | | | 20,674 | | | | 206,947 | | |
Total | | | | | 463,775 | | |
Inflation Protected Securities 32.5% | |
Columbia Global Inflation-Linked
Bond Plus Fund, Class I Shares(a) | | | 149,422 | | | | 1,533,069 | | |
Columbia Inflation Protected
Securities Fund, Class I Shares(a) | | | 167,109 | | | | 1,549,104 | | |
Total | | | | | 3,082,173 | | |
Total Fixed-Income Funds
(Cost: $7,015,805) | | | | | 6,963,272 | | |
Alternative Investment Funds 15.6% | |
Columbia Commodity Strategy Fund,
Class I Shares(a)(b) | | | 234,325 | | | | 1,485,619 | | |
Total Alternative Investment Funds
(Cost: $1,934,631) | | | | | 1,485,619 | | |
Corporate Bonds & Notes 1.8%
Issuer | | Coupon
Rate | | Principal
Amount ($) | | Value ($) | |
Metals 1.5% | |
Alcoa, Inc.
Senior Unsecured
02/01/37 | | | 5.950 | % | | | 50,000 | | | | 53,814 | | |
Freeport-McMoRan, Inc.
03/15/23 | | | 3.875 | % | | | 25,000 | | | | 22,400 | | |
Kinross Gold Corp.
03/15/24 | | | 5.950 | % | | | 25,000 | | | | 24,860 | | |
Vale SA
Senior Unsecured
09/11/42 | | | 5.625 | % | | | 50,000 | | | | 44,053 | | |
Total | | | | | | | 145,127 | | |
Corporate Bonds & Notes (continued)
Issuer | | Coupon
Rate | | Principal
Amount ($) | | Value ($) | |
Midstream 0.3% | |
El Paso Pipeline Partners
Operating Co. LLC
05/01/24 | | | 4.300 | % | | | 25,000 | | | | 25,724 | | |
Total Corporate Bonds & Notes
(Cost: $168,002) | | | | | | | 170,851 | | |
Asset-Backed Securities — Non-Agency 5.2% | |
Dryden Senior Loan Fund
Series 2014-33A Class B(c)(d)
07/15/26 | | | 2.247 | % | | | 250,000 | | | | 245,923 | | |
Symphony CLO V Ltd.
Series 2007-5A Class A1(c)(d)
01/15/24 | | | 1.003 | % | | | 250,000 | | | | 247,824 | | |
Total Asset-Backed Securities — Non-Agency
(Cost: $493,562) | | | | | | | 493,747 | | |
Foreign Government Obligations(e) 1.2%
Netherlands 0.5% | |
Petrobras Global Finance BV(d)
03/17/17 | | | 2.603 | % | | | 50,000 | | | | 45,625 | | |
Turkey 0.7% | |
Turkey Government International Bond
Senior Unsecured
03/17/36 | | | 6.875 | % | | | 50,000 | | | | 64,625 | | |
Total Foreign Government Obligations
(Cost: $101,926) | | | | | | | 110,250 | | |
Money Market Funds 2.5%
| | | Shares | | Value ($) | |
Columbia Short-Term Cash Fund,
0.118%(a)(f) | | | 240,854 | | | | 240,854 | | |
Total Money Market Funds
(Cost: $240,854) | | | | | 240,854 | | |
Total Investments
(Cost: $9,954,780) | | | | | 9,464,593 | | |
Other Assets & Liabilities, Net | | | | | 26,607 | | |
Net Assets | | | | | 9,491,200 | | |
The accompanying Notes to Financial Statements are an integral part of this statement.
Annual Report 2015
8
Columbia Diversified Real Return Fund
Portfolio of Investments (continued)
January 31, 2015
Investments in Derivatives
Futures Contracts Outstanding at January 31, 2015
At January 31, 2015, cash totaling $26,859 was pledged as collateral to cover initial margin requirements on open futures contracts.
Long Futures Contracts Outstanding
Contract Description | | Number of
Contracts | | Trading
Currency | | Notional
Market
Value ($) | | Expiration
Date | | Unrealized
Appreciation ($) | | Unrealized
Depreciation ($) | |
| EURO BUXL 30YR BOND | | | 1 | | | EUR | | | | | 190,292 | | | 03/2015 | | | 7,173 | | | | — | | |
US 10YR NOTE | | | 12 | | | USD | | | | | 1,570,500 | | | 03/2015 | | | 51,163 | | | | — | | |
Total | | | | | | | 1,760,792 | | | | | | 58,336 | | | | — | | |
Short Futures Contracts Outstanding
Contract Description | | Number of
Contracts | | Trading
Currency | | Notional
Market
Value ($) | | Expiration
Date | | Unrealized
Appreciation ($) | | Unrealized
Depreciation ($) | |
| EURO-BOBL | | | (11 | ) | | EUR | | | | | (1,626,962 | ) | | 03/2015 | | | — | | | | (17,639 | ) | |
US 5YR NOTE | | | (16 | ) | | USD | | | | | (1,941,500 | ) | | 03/2015 | | | — | | | | (37,535 | ) | |
US LONG BOND | | | (1 | ) | | USD | | | | | (151,281 | ) | | 03/2015 | | | — | | | | (4,377 | ) | |
Total | | | | | | | (3,719,743 | ) | | | | | — | | | | (59,551 | ) | |
Interest Rate Swap Contracts Outstanding at January 31, 2015
At January 31, 2015, cash totaling $5,459 were pledged as collateral to cover open centrally cleared interest rate swap contracts.
Counterparty | | Floating Rate
Index | | Fund Pay/
Receive
Floating
Rate | | Fixed
Rate (%) | | Expiration
Date | | Notional
Currency | | Notional
Amount ($) | | Unamortized
Premium
(Paid)
Received ($) | | Unrealized
Appreciation ($) | | Unrealized
Depreciation ($) | |
Morgan Stanley*
| | | 6-Month
GBP LIBOR-BBA | | | Pay | | | 1.991 | | | 05/14/2019 | | GBP | | | | | 250,000 | | | | (216 | ) | | | 14,722 | | | | — | | |
*Centrally cleared swap contract.
Notes to Portfolio of Investments
(a) As defined in the Investment Company Act of 1940, an affiliated company is one in which the Fund owns 5% or more of the company's outstanding voting securities, or a company which is under common ownership or control with the Fund. Holdings and transactions in these affiliated companies during the year ended January 31, 2015, are as follows:
Issuer | | Beginning
Cost ($) | | Purchase
Cost ($) | | Proceeds
From
Sales ($) | | Realized
Gain
(Loss) ($) | | Ending
Cost ($) | | Capital Gain
Distributions ($) | | Dividends —
Affiliated
Issuers ($) | | Value ($) | |
Columbia Commodity
Strategy Fund, Class I
Shares | | | — | | | | 2,085,500 | | | | (150,000 | ) | | | (869 | ) | | | 1,934,631 | | | | — | | | | — | | | | 1,485,619 | | |
Columbia Floating Rate
Fund, Class I Shares | | | — | | | | 3,526,567 | | | | — | | | | — | | | | 3,526,567 | | | | — | | | | 126,567 | | | | 3,417,324 | | |
Columbia Global Inflation-
Linked Bond Plus Fund,
Class I Shares | | | — | | | | 2,119,796 | | | | (633,675 | ) | | | 8,003 | | | | 1,494,124 | | | | 17,508 | | | | 102,289 | | | | 1,533,069 | | |
The accompanying Notes to Financial Statements are an integral part of this statement.
Annual Report 2015
9
Columbia Diversified Real Return Fund
Portfolio of Investments (continued)
January 31, 2015
Notes to Portfolio of Investments (continued)
Issuer | | Beginning
Cost ($) | | Purchase
Cost ($) | | Proceeds
From
Sales ($) | | Realized
Gain
(Loss) ($) | | Ending
Cost ($) | | Capital Gain
Distributions ($) | | Dividends —
Affiliated
Issuers ($) | | Value ($) | |
Columbia High Yield Bond
Fund, Class I Shares | | | — | | | | 261,931 | | | | — | | | | — | | | | 261,931 | | | | — | | | | 11,931 | | | | 256,828 | | |
Columbia Income
Opportunities Fund,
Class I Shares | | | — | | | | 261,533 | | | | (49,400 | ) | | | (1,573 | ) | | | 210,560 | | | | 798 | | | | 10,734 | | | | 206,947 | | |
Columbia Inflation
Protected Securities
Fund, Class I Shares | | | — | | | | 1,522,623 | | | | — | | | | — | | | | 1,522,623 | | | | — | | | | 22,623 | | | | 1,549,104 | | |
Columbia Limited
Duration Credit Fund,
Class I Shares* | | | — | | | | 500,301 | | | | (500,552 | ) | | | 251 | | | | — | | | | — | | | | 342 | | | | — | | |
Columbia Short-Term
Cash Fund | | | 10,000,000 | | | | 1,850,321 | | | | (11,609,467 | ) | | | — | | | | 240,854 | | | | — | | | | 191 | | | | 240,854 | | |
Total | | | 10,000,000 | | | | 12,128,572 | | | | (12,943,094 | ) | | | 5,812 | | | | 9,191,290 | | | | 18,306 | | | | 274,677 | | | | 8,689,745 | | |
*Issuer was not an affiliate for the entire period ended January 31, 2015.
(b) Non-income producing.
(c) Security exempt from registration pursuant to Rule 144A under the Securities Act of 1933. This security may be resold in transactions exempt from registration, normally to qualified institutional buyers. At January 31, 2015, the value of these securities amounted to $493,747 or 5.20% of net assets.
(d) Variable rate security.
(e) Principal and interest may not be guaranteed by the government.
(f) The rate shown is the seven-day current annualized yield at January 31, 2015.
Currency Legend
EUR Euro
GBP British Pound
USD US Dollar
Fair Value Measurements
Generally accepted accounting principles (GAAP) require disclosure regarding the inputs and valuation techniques used to measure fair value and any changes in valuation inputs or techniques. In addition, investments shall be disclosed by major category.
The Fund categorizes its fair value measurements according to a three-level hierarchy that maximizes the use of observable inputs and minimizes the use of unobservable inputs by prioritizing that the most observable input be used when available. Observable inputs are those that market participants would use in pricing an investment based on market data obtained from sources independent of the reporting entity. Unobservable inputs are those that reflect the Fund's assumptions about the information market participants would use in pricing an investment. An investment's level within the fair value hierarchy is based on the lowest level of any input that is deemed significant to the asset or liability's fair value measurement. The input levels are not necessarily an indication of the risk or liquidity associated with investments at that level. For example, certain U.S. government securities are generally high quality and liquid, however, they are reflected as Level 2 because the inputs used to determine fair value may not always be quoted prices in an active market.
Fair value inputs are summarized in the three broad levels listed below:
> Level 1 — Valuations based on quoted prices for investments in active markets that the Fund has the ability to access at the measurement date (including NAV for open-end mutual funds). Valuation adjustments are not applied to Level 1 investments.
> Level 2 — Valuations based on other significant observable inputs (including quoted prices for similar securities, interest rates, prepayment speeds, credit risks, etc.).
> Level 3 — Valuations based on significant unobservable inputs (including the Fund's own assumptions and judgment in determining the fair value of investments).
The accompanying Notes to Financial Statements are an integral part of this statement.
Annual Report 2015
10
Columbia Diversified Real Return Fund
Portfolio of Investments (continued)
January 31, 2015
Fair Value Measurements (continued)
Inputs that are used in determining fair value of an investment may include price information, credit data, volatility statistics, and other factors. These inputs can be either observable or unobservable. The availability of observable inputs can vary between investments, and is affected by various factors such as the type of investment, and the volume and level of activity for that investment or similar investments in the marketplace. The inputs will be considered by the Investment Manager, along with any other relevant factors in the calculation of an investment's fair value. The Fund uses prices and inputs that are current as of the measurement date, which may include periods of market dislocations. During these periods, the availability of prices and inputs may be reduced for many investments. This condition could cause an investment to be reclassified between the various levels within the hierarchy.
Investments falling into the Level 3 category are primarily supported by quoted prices from brokers and dealers participating in the market for those investments. However, these may be classified as Level 3 investments due to lack of market transparency and corroboration to support these quoted prices. Additionally, valuation models may be used as the pricing source for any remaining investments classified as Level 3. These models may rely on one or more significant unobservable inputs and/or significant assumptions by the Investment Manager. Inputs used in valuations may include, but are not limited to, financial statement analysis, capital account balances, discount rates and estimated cash flows, and comparable company data.
Under the direction of the Fund's Board of Trustees (the Board), the Investment Manager's Valuation Committee (the Committee) is responsible for overseeing the valuation procedures approved by the Board. The Committee consists of voting and non-voting members from various groups within the Investment Manager's organization, including operations and accounting, trading and investments, compliance, risk management and legal.
The Committee meets at least monthly to review and approve valuation matters, which may include a description of specific valuation determinations, data regarding pricing information received from approved pricing vendors and brokers and the results of Board-approved valuation control policies and procedures (the Policies). The Policies address, among other things, instances when market quotations are or are not readily available, including recommendations of third party pricing vendors and a determination of appropriate pricing methodologies; events that require specific valuation determinations and assessment of fair value techniques; securities with a potential for stale pricing, including those that are illiquid, restricted, or in default; and the effectiveness of third party pricing vendors, including periodic reviews of vendors. The Committee meets more frequently, as needed, to discuss additional valuation matters, which may include the need to review back-testing results, review time-sensitive information or approve related valuation actions. The Committee reports to the Board, with members of the Committee meeting with the Board at each of its regularly scheduled meetings to discuss valuation matters and actions during the period, similar to those described earlier.
For investments categorized as Level 3, the Committee monitors information similar to that described above, which may include: (i) data specific to the issuer or comparable issuers, (ii) general market or specific sector news and (iii) quoted prices and specific or similar security transactions. The Committee considers this data and any changes from prior periods in order to assess the reasonableness of observable and unobservable inputs, any assumptions or internal models used to value those securities and changes in fair value. This data is also used to corroborate, when available, information received from approved pricing vendors and brokers. Various factors impact the frequency of monitoring this information (which may occur as often as daily). However, the Committee may determine that changes to inputs, assumptions and models are not required as a result of the monitoring procedures performed.
The accompanying Notes to Financial Statements are an integral part of this statement.
Annual Report 2015
11
Columbia Diversified Real Return Fund
Portfolio of Investments (continued)
January 31, 2015
Fair Value Measurements (continued)
The following table is a summary of the inputs used to value the Fund's investments at January 31, 2015:
Description | | Level 1
Quoted Prices in Active
Markets for Identical
Assets ($) | | Level 2
Other Significant
Observable Inputs ($) | | Level 3
Significant
Unobservable Inputs ($) | | Total ($) | |
Mutual Funds | |
Fixed-Income Funds | | | 6,963,272 | | | | — | | | | — | | | | 6,963,272 | | |
Alternative Investment Funds | | | 1,485,619 | | | | — | | | | — | | | | 1,485,619 | | |
Money Market Funds | | | 240,854 | | | | — | | | | — | | | | 240,854 | | |
Total Mutual Funds | | | 8,689,745 | | | | — | | | | — | | | | 8,689,745 | | |
Bonds | |
Corporate Bonds & Notes | | | — | | | | 170,851 | | | | — | | | | 170,851 | | |
Asset-Backed Securities — Non-Agency | | | — | | | | 493,747 | | | | — | | | | 493,747 | | |
Foreign Government Obligations | | | — | | | | 110,250 | | | | — | | | | 110,250 | | |
Total Bonds | | | — | | | | 774,848 | | | | — | | | | 774,848 | | |
Investments in Securities | | | 8,689,745 | | | | 774,848 | | | | — | | | | 9,464,593 | | |
Derivatives | |
Assets | |
Futures Contracts | | | 58,336 | | | | — | | | | — | | | | 58,336 | | |
Swap Contracts | | | — | | | | 14,722 | | | | — | | | | 14,722 | | |
Liabilities | |
Futures Contracts | | | (59,551 | ) | | | — | | | | — | | | | (59,551 | ) | |
Total | | | 8,688,530 | | | | 789,570 | | | | — | | | | 9,478,100 | | |
See the Portfolio of Investments for all investment classifications not indicated in the table.
The Fund's assets assigned to the Level 2 input category are generally valued using the market approach, in which a security's value is determined through reference to prices and information from market transactions for similar or identical assets.
There were no transfers of financial assets between levels during the period.
Derivative instruments are valued at unrealized appreciation (depreciation).
The accompanying Notes to Financial Statements are an integral part of this statement.
Annual Report 2015
12
Columbia Diversified Real Return Fund
Statement of Assets and Liabilities
January 31, 2015
Assets | |
Investments, at value | |
Unaffiliated issuers (identified cost $763,490) | | $ | 774,848 | | |
Affiliated issuers (identified cost $9,191,290) | | | 8,689,745 | | |
Total investments (identified cost $9,954,780) | | | 9,464,593 | | |
Margin deposits | | | 32,318 | | |
Premiums paid on outstanding swap contracts | | | 216 | | |
Receivable for: | |
Dividends | | | 13,990 | | |
Interest | | | 5,081 | | |
Variation margin | | | 11,511 | | |
Expense reimbursement due from Investment Manager | | | 260 | | |
Prepaid expenses | | | 740 | | |
Trustees' deferred compensation plan | | | 1,187 | | |
Other assets | | | 15,541 | | |
Total assets | | | 9,545,437 | | |
Liabilities | |
Payable for: | |
Investments purchased | | | 13,967 | | |
Variation margin | | | 10,612 | | |
Investment management fees | | | 20 | | |
Transfer agent fees | | | 57 | | |
Administration fees | | | 6 | | |
Chief compliance officer expenses | | | 1 | | |
Custodian fees | | | 4,120 | | |
Printing and postage fees | | | 4,301 | | |
Accounting fees | | | 19,420 | | |
Other expenses | | | 546 | | |
Trustees' deferred compensation plan | | | 1,187 | | |
Total liabilities | | | 54,237 | | |
Net assets applicable to outstanding capital stock | | $ | 9,491,200 | | |
Represented by | |
Paid-in capital | | $ | 10,016,697 | | |
Undistributed net investment income | | | 7,076 | | |
Accumulated net realized loss | | | (52,500 | ) | |
Unrealized appreciation (depreciation) on: | |
Investments — unaffiliated issuers | | | 11,358 | | |
Investments — affiliated issuers | | | (501,545 | ) | |
Foreign currency translations | | | (3,393 | ) | |
Futures contracts | | | (1,215 | ) | |
Swap contracts | | | 14,722 | | |
Total — representing net assets applicable to outstanding capital stock | | $ | 9,491,200 | | |
The accompanying Notes to Financial Statements are an integral part of this statement.
Annual Report 2015
13
Columbia Diversified Real Return Fund
Statement of Assets and Liabilities (continued)
January 31, 2015
Class A | |
Net assets | | $ | 14,132 | | |
Shares outstanding | | | 1,491 | | |
Net asset value per share | | $ | 9.48 | | |
Maximum offering price per share(a) | | $ | 9.95 | | |
Class C | |
Net assets | | $ | 11,410 | | |
Shares outstanding | | | 1,204 | | |
Net asset value per share | | $ | 9.48 | | |
Class R4 | |
Net assets | | $ | 9,476 | | |
Shares outstanding | | | 1,000 | | |
Net asset value per share | | $ | 9.48 | | |
Class R5 | |
Net assets | | $ | 9,467 | | |
Shares outstanding | | | 1,000 | | |
Net asset value per share | | $ | 9.47 | | |
Class W | |
Net assets | | $ | 9,302 | | |
Shares outstanding | | | 983 | | |
Net asset value per share | | $ | 9.46 | | |
Class Z | |
Net assets | | $ | 9,437,413 | | |
Shares outstanding | | | 996,000 | | |
Net asset value per share | | $ | 9.48 | | |
(a) The maximum offering price per share is calculated by dividing the net asset value per share by 1.0 minus the maximum sales charge of 4.75%.
The accompanying Notes to Financial Statements are an integral part of this statement.
Annual Report 2015
14
Columbia Diversified Real Return Fund
Statement of Operations
Year Ended January 31, 2015(a)
Net investment income | |
Income: | |
Dividends — affiliated issuers | | $ | 274,677 | | |
Interest | | | 18,928 | | |
Total income | | | 293,605 | | |
Expenses: | |
Investment management fees | | | 6,813 | | |
Distribution and/or service fees | |
Class A | | | 22 | | |
Class C | | | 107 | | |
Class W(b) | | | 15 | | |
Transfer agent fees | |
Class C | | | 2 | | |
Class R5 | | | 4 | | |
Class Z | | | 287 | | |
Administration fees | | | 2,157 | | |
Compensation of board members | | | 13,083 | | |
Custodian fees | | | 10,236 | | |
Printing and postage fees | | | 22,882 | | |
Registration fees | | | 47,237 | | |
Professional fees | | | 20,070 | | |
Offering costs | | | 78,691 | | |
Chief compliance officer expenses | | | 4 | | |
Other | | | 2,349 | | |
Total expenses | | | 203,959 | | |
Fees waived or expenses reimbursed by Investment Manager and its affiliates | | | (176,999 | ) | |
Total net expenses | | | 26,960 | | |
Net investment income | | | 266,645 | | |
Realized and unrealized gain (loss) — net | |
Net realized gain (loss) on: | |
Investments — unaffiliated issuers | | | (965 | ) | |
Investments — affiliated issuers | | | 5,812 | | |
Capital gain distributions from underlying affiliated funds | | | 18,306 | | |
Foreign currency translations | | | 12,380 | | |
Futures contracts | | | (61,202 | ) | |
Swap contracts | | | 2,826 | | |
Net realized loss | | | (22,843 | ) | |
Net change in unrealized appreciation (depreciation) on: | |
Investments — unaffiliated issuers | | | 11,358 | | |
Investments — affiliated issuers | | | (501,545 | ) | |
Foreign currency translations | | | (3,393 | ) | |
Futures contracts | | | (1,215 | ) | |
Swap contracts | | | 14,722 | | |
Net change in unrealized depreciation | | | (480,073 | ) | |
Net realized and unrealized loss | | | (502,916 | ) | |
Net decrease in net assets from operations | | $ | (236,271 | ) | |
(a) Based on operations from March 11, 2014 (commencement of operations) through the stated period end.
(b) Based on operations from June 25, 2014 (commencement of operations) through the stated period end.
The accompanying Notes to Financial Statements are an integral part of this statement.
Annual Report 2015
15
Columbia Diversified Real Return Fund
Statement of Changes in Net Assets
| | | Year Ended
January 31, 2015(a)(b) | |
Operations | |
Net investment income | | $ | 266,645 | | |
Net realized loss | | | (22,843 | ) | |
Net change in unrealized depreciation | | | (480,073 | ) | |
Net decrease in net assets resulting from operations | | | (236,271 | ) | |
Distributions to shareholders | |
Net investment income | |
Class A | | | (267 | ) | |
Class C | | | (248 | ) | |
Class R4 | | | (289 | ) | |
Class R5 | | | (294 | ) | |
Class W | | | (235 | ) | |
Class Z | | | (287,894 | ) | |
Total distributions to shareholders | | | (289,227 | ) | |
Increase in net assets from capital stock activity | | | 16,673 | | |
Total decrease in net assets | | | (508,825 | ) | |
Net assets at beginning of year | | | 10,000,025 | | |
Net assets at end of year | | $ | 9,491,200 | | |
Undistributed net investment income | | $ | 7,076 | | |
(a) Based on operations from March 11, 2014 (commencement of operations) through the stated period end.
(b) Class W shares are based on operations from June 25, 2014 (commencement of operations) through the stated period end.
The accompanying Notes to Financial Statements are an integral part of this statement.
Annual Report 2015
16
Columbia Diversified Real Return Fund
Statement of Changes in Net Assets (continued)
| | | Year Ended January 31, 2015(a)(b) | |
| | | Shares | | Dollars ($) | |
Capital stock activity | |
Class A shares | |
Subscriptions | | | 491 | | | | 4,654 | | |
Net increase | | | 491 | | | | 4,654 | | |
Class C shares | |
Subscriptions | | | 1,253 | | | | 12,658 | | |
Distributions reinvested | | | 4 | | | | 40 | | |
Redemptions | | | (1,053 | ) | | | (10,679 | ) | |
Net increase | | | 204 | | | | 2,019 | | |
Class W shares | |
Subscriptions | | | 983 | | | | 10,000 | | |
Net increase | | | 983 | | | | 10,000 | | |
Total net increase | | | 1,678 | | | | 16,673 | | |
(a) Based on operations from March 11, 2014 (commencement of operations) through the stated period end.
(b) Class W shares are based on operations from June 25, 2014 (commencement of operations) through the stated period end.
The accompanying Notes to Financial Statements are an integral part of this statement.
Annual Report 2015
17
Columbia Diversified Real Return Fund
The following tables are intended to help you understand the Fund's financial performance. Certain information reflects financial results for a single share of a class held for the periods shown. Per share net investment income (loss) amounts are calculated based on average shares outstanding during the period. Total return assumes reinvestment of all dividends and distributions, if any. Total return does not reflect payment of sales charges, if any. Total return and portfolio turnover are not annualized for periods of less than one year. The portfolio turnover rate is calculated without regard to purchase and sales transactions of short-term instruments and certain derivatives, if any. If such transactions were included, the Fund's portfolio turnover rate may be higher.
Class A | | Year Ended
January 31,
2015(a) | |
Per share data | |
Net asset value, beginning of period | | $ | 10.00 | | |
Income from investment operations: | |
Net investment income | | | 0.24 | | |
Net realized and unrealized loss | | | (0.49 | ) | |
Total from investment operations | | | (0.25 | ) | |
Less distributions to shareholders: | |
Net investment income | | | (0.27 | ) | |
Total distributions to shareholders | | | (0.27 | ) | |
Net asset value, end of period | | $ | 9.48 | | |
Total return | | | (2.58 | %) | |
Ratios to average net assets(b) | |
Total gross expenses | | | 2.44 | %(c) | |
Total net expenses(d) | | | 0.55 | %(c) | |
Net investment income | | | 2.75 | %(c) | |
Supplemental data | |
Net assets, end of period (in thousands) | | $ | 14 | | |
Portfolio turnover | | | 17 | % | |
Notes to Financial Highlights
(a) Based on operations from March 11, 2014 (commencement of operations) through the stated period end.
(b) In addition to the fees and expenses that the Fund bears directly, the Fund indirectly bears a pro rata share of the fees and expenses of the underlying funds in which the Fund invests. Such indirect expenses are not included in the Fund's reported expense ratios.
(c) Annualized.
(d) Total net expenses include the impact of certain fee waivers/expense reimbursements made by the Investment Manager and certain of its affiliates, if applicable.
The accompanying Notes to Financial Statements are an integral part of this statement.
Annual Report 2015
18
Columbia Diversified Real Return Fund
Financial Highlights (continued)
Class C | | Year Ended
January 31,
2015(a) | |
Per share data | |
Net asset value, beginning of period | | $ | 10.00 | | |
Income from investment operations: | |
Net investment income | | | 0.18 | | |
Net realized and unrealized loss | | | (0.50 | ) | |
Total from investment operations | | | (0.32 | ) | |
Less distributions to shareholders: | |
Net investment income | | | (0.20 | ) | |
Total distributions to shareholders | | | (0.20 | ) | |
Net asset value, end of period | | $ | 9.48 | | |
Total return | | | (3.24 | %) | |
Ratios to average net assets(b) | |
Total gross expenses | | | 3.21 | %(c) | |
Total net expenses(d) | | | 1.31 | %(c) | |
Net investment income | | | 1.99 | %(c) | |
Supplemental data | |
Net assets, end of period (in thousands) | | $ | 11 | | |
Portfolio turnover | | | 17 | % | |
Notes to Financial Highlights
(a) Based on operations from March 11, 2014 (commencement of operations) through the stated period end.
(b) In addition to the fees and expenses that the Fund bears directly, the Fund indirectly bears a pro rata share of the fees and expenses of the underlying funds in which the Fund invests. Such indirect expenses are not included in the Fund's reported expense ratios.
(c) Annualized.
(d) Total net expenses include the impact of certain fee waivers/expense reimbursements made by the Investment Manager and certain of its affiliates, if applicable.
The accompanying Notes to Financial Statements are an integral part of this statement.
Annual Report 2015
19
Columbia Diversified Real Return Fund
Financial Highlights (continued)
Class R4 | | Year Ended
January 31,
2015(a) | |
Per share data | |
Net asset value, beginning of period | | $ | 10.00 | | |
Income from investment operations: | |
Net investment income | | | 0.27 | | |
Net realized and unrealized loss | | | (0.50 | ) | |
Total from investment operations | | | (0.23 | ) | |
Less distributions to shareholders: | |
Net investment income | | | (0.29 | ) | |
Total distributions to shareholders | | | (0.29 | ) | |
Net asset value, end of period | | $ | 9.48 | | |
Total return | | | (2.37 | %) | |
Ratios to average net assets(b) | |
Total gross expenses | | | 2.19 | %(c) | |
Total net expenses(d) | | | 0.30 | %(c) | |
Net investment income | | | 3.03 | %(c) | |
Supplemental data | |
Net assets, end of period (in thousands) | | $ | 9 | | |
Portfolio turnover | | | 17 | % | |
Notes to Financial Highlights
(a) Based on operations from March 11, 2014 (commencement of operations) through the stated period end.
(b) In addition to the fees and expenses that the Fund bears directly, the Fund indirectly bears a pro rata share of the fees and expenses of the underlying funds in which the Fund invests. Such indirect expenses are not included in the Fund's reported expense ratios.
(c) Annualized.
(d) Total net expenses include the impact of certain fee waivers/expense reimbursements made by the Investment Manager and certain of its affiliates, if applicable.
The accompanying Notes to Financial Statements are an integral part of this statement.
Annual Report 2015
20
Columbia Diversified Real Return Fund
Financial Highlights (continued)
Class R5 | | Year Ended
January 31,
2015(a) | |
Per share data | |
Net asset value, beginning of period | | $ | 10.00 | | |
Income from investment operations: | |
Net investment income | | | 0.26 | | |
Net realized and unrealized loss | | | (0.50 | ) | |
Total from investment operations | | | (0.24 | ) | |
Less distributions to shareholders: | |
Net investment income | | | (0.29 | ) | |
Total distributions to shareholders | | | (0.29 | ) | |
Net asset value, end of period | | $ | 9.47 | | |
Total return | | | (2.42 | %) | |
Ratios to average net assets(b) | |
Total gross expenses | | | 2.24 | %(c) | |
Total net expenses(d) | | | 0.35 | %(c) | |
Net investment income | | | 2.97 | %(c) | |
Supplemental data | |
Net assets, end of period (in thousands) | | $ | 9 | | |
Portfolio turnover | | | 17 | % | |
Notes to Financial Highlights
(a) Based on operations from March 11, 2014 (commencement of operations) through the stated period end.
(b) In addition to the fees and expenses that the Fund bears directly, the Fund indirectly bears a pro rata share of the fees and expenses of the underlying funds in which the Fund invests. Such indirect expenses are not included in the Fund's reported expense ratios.
(c) Annualized.
(d) Total net expenses include the impact of certain fee waivers/expense reimbursements made by the Investment Manager and certain of its affiliates, if applicable.
The accompanying Notes to Financial Statements are an integral part of this statement.
Annual Report 2015
21
Columbia Diversified Real Return Fund
Financial Highlights (continued)
Class W | | Year Ended
January 31,
2015(a) | |
Per share data | |
Net asset value, beginning of period | | $ | 10.17 | | |
Income from investment operations: | |
Net investment income | | | 0.19 | | |
Net realized and unrealized loss | | | (0.66 | ) | |
Total from investment operations | | | (0.47 | ) | |
Less distributions to shareholders: | |
Net investment income | | | (0.24 | ) | |
Total distributions to shareholders | | | (0.24 | ) | |
Net asset value, end of period | | $ | 9.46 | | |
Total return | | | (4.67 | %) | |
Ratios to average net assets(b) | |
Total gross expenses | | | 2.45 | %(c) | |
Total net expenses(d) | | | 0.55 | %(c) | |
Net investment income | | | 3.27 | %(c) | |
Supplemental data | |
Net assets, end of period (in thousands) | | $ | 9 | | |
Portfolio turnover | | | 17 | % | |
Notes to Financial Highlights
(a) Based on operations from June 25, 2014 (commencement of operations) through the stated period end.
(b) In addition to the fees and expenses that the Fund bears directly, the Fund indirectly bears a pro rata share of the fees and expenses of the underlying funds in which the Fund invests. Such indirect expenses are not included in the Fund's reported expense ratios.
(c) Annualized.
(d) Total net expenses include the impact of certain fee waivers/expense reimbursements made by the Investment Manager and certain of its affiliates, if applicable.
The accompanying Notes to Financial Statements are an integral part of this statement.
Annual Report 2015
22
Columbia Diversified Real Return Fund
Financial Highlights (continued)
Class Z | | Year Ended
January 31,
2015(a) | |
Per share data | |
Net asset value, beginning of period | | $ | 10.00 | | |
Income from investment operations: | |
Net investment income | | | 0.27 | | |
Net realized and unrealized loss | | | (0.50 | ) | |
Total from investment operations | | | (0.23 | ) | |
Less distributions to shareholders: | |
Net investment income | | | (0.29 | ) | |
Total distributions to shareholders | | | (0.29 | ) | |
Net asset value, end of period | | $ | 9.48 | | |
Total return | | | (2.37 | %) | |
Ratios to average net assets(b) | |
Total gross expenses | | | 2.20 | %(c) | |
Total net expenses(d) | | | 0.30 | %(c) | |
Net investment income | | | 3.02 | %(c) | |
Supplemental data | |
Net assets, end of period (in thousands) | | $ | 9,437 | | |
Portfolio turnover | | | 17 | % | |
Notes to Financial Highlights
(a) Based on operations from March 11, 2014 (commencement of operations) through the stated period end.
(b) In addition to the fees and expenses that the Fund bears directly, the Fund indirectly bears a pro rata share of the fees and expenses of the underlying funds in which the Fund invests. Such indirect expenses are not included in the Fund's reported expense ratios.
(c) Annualized.
(d) Total net expenses include the impact of certain fee waivers/expense reimbursements made by the Investment Manager and certain of its affiliates, if applicable.
The accompanying Notes to Financial Statements are an integral part of this statement.
Annual Report 2015
23
Columbia Diversified Real Return Fund
Notes to Financial Statements
January 31, 2015
Note 1. Organization
Columbia Diversified Real Return Fund (the Fund), a series of Columbia Funds Series Trust I (the Trust), is a diversified fund. The Trust is registered under the Investment Company Act of 1940, as amended (the 1940 Act), as an open-end management investment company organized as a Massachusetts business trust.
The Fund is a "fund-of-funds", investing significantly in funds managed by Columbia Management Investment Advisers, LLC (the Investment Manager), a wholly-owned subsidiary of Ameriprise Financial, Inc. (Ameriprise Financial), or its affiliates (Underlying Funds).
For information on the Underlying Funds, please refer to the Fund's current prospectus and the prospectuses of the Underlying Funds.
On March 10, 2014, the Investment Manager invested $10,000 in the Fund (1,000 shares for Class A, 1,000 shares for Class C, 1,000 shares for Class R4, 1,000 shares for Class R5 and 996,000 shares for Class Z), which represented the initial capital for each class at $10.00 per share. Shares of the Fund were first offered to the public on March 12, 2014.
These financial statements cover the period from March 11, 2014 (commencement of operations) through January 31, 2015.
Fund Shares
The Trust may issue an unlimited number of shares (without par value). The Fund offers Class A, Class C, Class R4, Class R5, Class W and Class Z shares. Although all share classes generally have identical voting, dividend and liquidation rights, each share class votes separately when required by the Trust's organizational documents or by law. Different share classes pay different distribution amounts to the extent the expenses of such share classes differ, and distributions in liquidation will be proportional to the net asset value of each share class. Each share class has its own expense structure and sales charges.
Class A shares are subject to a maximum front-end sales charge of 4.75% based on the initial investment amount. Class A shares purchased without an initial sales charge in accounts aggregating $1 million to $50 million at the time of purchase are subject to a contingent deferred sales charge (CDSC) if the shares are sold within 18 months of purchase, charged as follows: 1.00% CDSC if redeemed within 12 months of purchase, and 0.50% CDSC if redeemed more than 12, but less than 18, months after purchase.
Class C shares are subject to a 1.00% CDSC on shares redeemed within one year of purchase.
Class R4 shares are not subject to sales charges and are generally available only to omnibus retirement plans and certain investors as described in the Fund's prospectus.
Class R5 shares are not subject to sales charges and are generally available only to investors purchasing through authorized investment professionals and omnibus retirement plans.
Class W shares are not subject to sales charges and are available only to investors purchasing through authorized investment programs managed by investment professionals, including discretionary managed account programs. Class W shares commenced operations on June 25, 2014.
Class Z shares are not subject to sales charges and are available only to eligible investors, which are subject to different investment minimums as described in the Fund's prospectus.
Note 2. Summary of Significant Accounting Policies
Basis of Preparation
The Fund is an investment company that applies the accounting and reporting guidance in the Financial Accounting Standards Board (FASB) Accounting Standards Codification Topic 946, Financial Services — Investment Companies (ASC 946). The financial statements are prepared in accordance with U.S. generally accepted accounting principles (GAAP) which requires management to make certain estimates and assumptions that affect the reported amounts of assets and liabilities, the disclosure of contingent assets and liabilities at the date of the financial statements and the reported amounts of income and expenses during the reporting period. Actual results could differ from those estimates.
The following is a summary of significant accounting policies followed by the Fund in the preparation of its financial statements.
Security Valuation
Investments in the Underlying Funds are valued at the net asset value of the applicable class of the Underlying Fund determined as of the close of the New York Stock Exchange (NYSE) on the valuation date.
Debt securities generally are valued by pricing services approved by the Board of Trustees (the Board) based upon market transactions for normal, institutional-size trading units of similar securities. The services may use various pricing techniques that take into account, as applicable, factors such as yield, quality, coupon rate, maturity, type of issue, trading
Annual Report 2015
24
Columbia Diversified Real Return Fund
Notes to Financial Statements (continued)
January 31, 2015
characteristics and other data, as well as broker quotes. Debt securities for which quotations are readily available may also be valued based upon an over-the-counter or exchange bid quotation.
Asset and mortgage-backed securities are generally valued by pricing services, which utilize pricing models that incorporate the securities' cash flow and loan performance data. These models also take into account available market data, including trades, market quotations, and benchmark yield curves for identical or similar securities. Factors used to identify similar securities may include, but are not limited to, issuer, collateral type, vintage, prepayment speeds, collateral performance, credit ratings, credit enhancement and expected life. Asset-backed securities for which quotations are readily available may also be valued based upon an over-the-counter or exchange bid quotation.
Futures and options on futures contracts are valued based upon the settlement price established each day by the board of trade or exchange on which they are traded.
Swap transactions are valued through an independent pricing service or broker, or if neither is available, through an internal model based upon observable inputs.
Investments for which market quotations are not readily available, or that have quotations which management believes are not reliable, are valued at fair value as determined in good faith under procedures established by and under the general supervision of the Board. If a security or class of securities (such as foreign securities) is valued at fair value, such value is likely to be different from the quoted or published price for the security.
The determination of fair value often requires significant judgment. To determine fair value, management may use assumptions including but not limited to future cash flows and estimated risk premiums. Multiple inputs from various sources may be used to determine fair value.
Foreign Currency Transactions and Translations
The values of all assets and liabilities denominated in foreign currencies are generally translated into U.S. dollars at exchange rates determined at the close of the NYSE. Net realized and unrealized gains (losses) on foreign currency transactions and translations include gains (losses) arising from the fluctuation in exchange rates between trade and settlement dates on securities transactions, gains (losses) arising from the disposition of foreign currency and currency gains (losses) between the accrual and payment dates on dividends, interest income and foreign withholding taxes.
For financial statement purposes, the Fund does not distinguish that portion of gains (losses) on investments which
is due to changes in foreign exchange rates from that which is due to changes in market prices of the investments. Such fluctuations are included with the net realized and unrealized gains (losses) on investments in the Statement of Operations.
Derivative Instruments
The Fund invests in certain derivative instruments, as detailed below, to meet its investment objectives. Derivatives are instruments whose values depend on, or are derived from, in whole or in part, the value of one or more other assets, such as securities, currencies, commodities or indices. Derivative instruments may be used to increase investment flexibility (including to maintain cash reserves while maintaining exposure to certain other assets), for risk management (hedging) purposes, to facilitate trading, to reduce transaction costs and to pursue higher investment returns. The Fund may also use derivative instruments to mitigate certain investment risks, such as foreign currency exchange rate risk, interest rate risk and credit risk. Derivatives may involve various risks, including the potential inability of the counterparty to fulfill its obligation under the terms of the contract, the potential for an illiquid secondary market (making it difficult for the Fund to sell, including at favorable prices) and the potential for market movements which may expose the Fund to gains or losses in excess of the amount shown in the Statement of Assets and Liabilities. The notional amounts of derivative instruments, if applicable, are not recorded in the financial statements.
A derivative instrument may suffer a marked-to-market loss if the value of the contract decreases due to an unfavorable change in the market rates or values of the underlying instrument. Losses can also occur if the counterparty does not perform under the contract. The Fund's risk of loss from counterparty credit risk on over-the-counter derivatives is generally limited to the aggregate unrealized gain netted against any collateral held by the Fund and the amount of any variation margin held by the counterparty. With exchange-traded or centrally cleared derivatives, there is reduced counterparty credit risk to the Fund since the exchange's clearinghouse, as counterparty to such instruments, guarantees against a possible default. The clearinghouse stands between the buyer and the seller of the contract; therefore, the counterparty credit risk is failure of the clearinghouse. However, credit risk still exists in exchange-traded or centrally cleared derivatives with respect to initial and variation margin that is held in a broker's customer account. While brokers are required to segregate customer margin from their own assets, in the event that a broker becomes insolvent or goes into bankruptcy and at that time there is a shortfall in the aggregate amount of margin held by the broker for all its clients, U.S. bankruptcy laws will typically allocate that shortfall on a
Annual Report 2015
25
Columbia Diversified Real Return Fund
Notes to Financial Statements (continued)
January 31, 2015
pro-rata basis across all the broker's customers (including the Fund), potentially resulting in losses to the Fund.
In order to better define its contractual rights and to secure rights that will help the Fund mitigate its counterparty risk, the Fund may enter into an International Swaps and Derivatives Association, Inc. Master Agreement (ISDA Master Agreement) or similar agreement with its derivative contract counterparties. An ISDA Master Agreement is an agreement between the Fund and a counterparty that governs over-the-counter derivatives and forward foreign currency exchange contracts and typically contains, among other things, collateral posting terms and netting provisions in the event of a default and/or termination event. Under an ISDA Master Agreement, the Fund may, under certain circumstances, offset with the counterparty certain derivative instrument's payables and/or receivables with collateral held and/or posted and create one single net payment. The provisions of the ISDA Master Agreement typically permit a single net payment in the event of default (close-out netting) including the bankruptcy or insolvency of the counterparty. Note, however, that bankruptcy or insolvency laws of a particular jurisdiction may impose restrictions on or prohibitions against the right of offset in bankruptcy, insolvency or other events.
Collateral (margin) requirements differ by type of derivative. Margin requirements are established by the exchange or clearinghouse for exchange-traded and centrally cleared derivatives. Brokers can ask for margin in excess of the minimum in certain circumstances. Collateral terms are contract specific for over-the-counter derivatives. For over-the-counter derivatives traded under an ISDA Master Agreement, the collateral requirements are typically calculated by netting the marked-to-market amount for each transaction under such agreement and comparing that amount to the value of any variation margin currently pledged by the Fund and/or the counterparty. Generally, the amount of collateral due from or to a party has to exceed a minimum transfer amount threshold (e.g., $500,000) before a transfer has to be made. To the extent amounts due to the Fund from its counterparties are not fully collateralized, contractually or otherwise, the Fund bears the risk of loss from counterparty nonperformance. The Fund attempts to mitigate counterparty risk by only entering into agreements with counterparties that it believes have the financial resources to honor their obligations and by monitoring the financial stability of those counterparties.
Certain ISDA Master Agreements allow counterparties to over-the-counter derivatives to terminate derivative contracts prior to maturity in the event the Fund's net assets decline by a stated percentage over a specified time period or if the Fund fails to meet the terms of the ISDA Master Agreement, which would cause the Fund to accelerate payment of any net
liability owed to the counterparty. The Fund also has termination rights if the counterparty fails to meet the terms of the ISDA Master Agreement. In addition to considering counterparty credit risk, the Fund would consider terminating the derivative contracts based on whether termination would result in a net liability owed from the counterparty.
For financial reporting purposes, the Fund does not offset derivative assets and derivative liabilities that are subject to netting arrangements in the Statement of Assets and Liabilities.
Futures Contracts
Futures contracts are exchange traded and represent commitments for the future purchase or sale of an asset at a specified price on a specified date. The Fund bought and sold futures contracts to manage the duration and yield curve exposure of the Fund versus the benchmark and to manage exposure to movements in interest rates. These instruments may be used for other purposes in future periods. Upon entering into futures contracts, the Fund bears risks that it may not achieve the anticipated benefits of the futures contracts and may realize a loss. Additional risks include counterparty credit risk, the possibility of an illiquid market, and that a change in the value of the contract or option may not correlate with changes in the value of the underlying asset.
Upon entering into a futures contract, the Fund pledges cash or securities with the broker in an amount sufficient to meet the initial margin requirement. The initial margin deposit must be maintained at an established level over the life of the contract. Cash deposited as initial margin is recorded in the Statement of Assets and Liabilities as margin deposits. Securities deposited as initial margin are designated in the Portfolio of Investments. Subsequent payments (variation margin) are made or received by the Fund each day. The variation margin payments are equal to the daily change in the contract value and are recorded as variation margin receivable or payable and are offset in unrealized gains or losses. The Fund recognizes a realized gain or loss when the contract is closed or expires. Futures contracts involve, to varying degrees, risk of loss in excess of the variation margin disclosed in the Statement of Assets and Liabilities.
Swap Contracts
Swap contracts are privately negotiated in the over-the-counter market and may be entered into as a bilateral contract or centrally cleared (centrally cleared swap contract). In a centrally cleared swap contract, immediately following execution of the swap contract with a broker, the swap contract is novated to a central counterparty (the CCP) and the CCP becomes the Fund's counterparty to the centrally cleared swap
Annual Report 2015
26
Columbia Diversified Real Return Fund
Notes to Financial Statements (continued)
January 31, 2015
contract. The Fund is required to deposit initial margin with the broker in the form of cash or securities in an amount that varies depending on the size and risk profile of the particular swap contract. Securities deposited as initial margin are designated in the Portfolio of Investments and cash deposited is recorded in the Statement of Assets and Liabilities as margin deposits. Unlike a bilateral swap contract, for centrally cleared swap contracts, the Fund has minimal credit exposure to the counterparty because the CCP stands between the Fund and the counterparty. Swap contracts are marked-to-market daily and changes in value are recorded as unrealized appreciation (depreciation). The daily change in valuation of centrally cleared swap contracts, if any, is recorded as a receivable or payable for variation margin in the Statement of Assets and Liabilities.
Interest Rate Swap Contracts
The Fund entered into interest rate swap transactions to gain exposure to or protect itself from market rate changes and to synthetically add or subtract principal exposure to a market. These instruments may be used for other purposes in future periods. Interest rate swaps are agreements between two parties that involve the exchange of one type of interest rate for another type of interest rate cash flow on specified dates in the future, based on a predetermined, specified notional amount. Certain interest rate swaps are considered forward-starting, whereby the accrual for the exchange of cash flows does not begin until a specified date in the future (the effective date). The net cash flow for a standard interest rate swap transaction is generally the difference between a floating market interest rate versus a fixed interest rate.
Interest rate swaps are valued daily and unrealized appreciation (depreciation) is recorded. Certain interest rate swaps may accrue periodic interest on a daily basis as a
component of unrealized appreciation (depreciation); the Fund will realize a gain or loss upon the payment or receipt of accrued interest. The Fund will realize a gain or a loss when the interest rate swap is terminated.
Risks of entering into interest rate swaps include a lack of correlation between the swaps and the portfolio of bonds the swaps are designed to hedge or replicate. A lack of correlation may cause the interest rate swaps to experience adverse changes in value relative to expectations. In addition, interest rate swaps are subject to the risk of default of a counterparty, and the risk of adverse movements in market interest rates relative to the interest rate swap positions taken. The Fund's maximum risk of loss from counterparty credit risk is the discounted net value of the cash flows to be received from/paid to the counterparty over the contract's remaining life to the extent that such amount is positive, plus the cost of entering into a similar transaction with another counterparty.
The Fund attempts to mitigate counterparty credit risk by entering into interest rate swap transactions only with counterparties that meet prescribed levels of creditworthiness, as determined by the Investment Manager. The Fund and any counterparty are required to maintain an agreement that requires the Fund and that counterparty to monitor (on a daily basis) the net market value of all derivative transactions entered into pursuant to the agreement between the Fund and such counterparty. If the net market value of such derivatives transactions between the Fund and that counterparty exceeds a certain threshold (as defined in the agreement), the Fund or the counterparty is required to post cash and/or securities as collateral. Market values of derivatives transactions presented in the financial statements are not netted with the market values of other derivatives transactions or with any collateral amounts posted by the Fund or any counterparty.
Offsetting of Derivative Assets and Derivative Liabilities
The following tables present the Fund's gross and net amount of assets and liabilities available for offset under netting arrangements as well as any related collateral received or pledged by the Fund as of January 31, 2015:
| | | | | | | | Gross Amounts Not Offset in
the Statement of Assets and Liabilities | |
| |
| | Gross
Amounts of
Recognized
Assets ($) | | Gross Amounts
Offset in the
Statement of
Assets and
Liabilities ($) | | Net Amounts of
Assets
Presented in the
Statement of
Assets and
Liabilities ($) | | Financial
Instruments ($)(a) | | Cash
Collateral
Received ($) | | Securities
Collateral
Received ($) | | Net
Amount ($)(b) | |
Asset Derivatives: | |
Centrally Cleared Swap Contracts(c) | | | 436 | | | | — | | | | 436 | | | | — | | | | — | | | | — | | | | 436 | | |
(a) Represents the amount of assets that could be offset by liabilities with the same counterparty under master netting or similar agreements that management elects not to offset on the Statement of Assets and Liabilities.
(b) Represents the net amount due from counterparties in the event of default.
(c) Centrally cleared swaps are included within receivable for variation margin on the Statement of Assets and Liabilities.
Annual Report 2015
27
Columbia Diversified Real Return Fund
Notes to Financial Statements (continued)
January 31, 2015
Effects of Derivative Transactions in the Financial Statements
The following tables are intended to provide additional information about the effect of derivatives on the financial statements of the Fund, including: the fair value of derivatives by risk category and the location of those fair values in the Statement of Assets and Liabilities; and the impact of derivative transactions over the period in the Statement of Operations, including realized gains or losses and unrealized gains or losses. The derivative schedules following the Portfolio of Investments present additional information regarding derivative instruments outstanding at the end of the period, if any.
The following table is a summary of the fair value of derivative instruments (not considered to be hedging instruments for accounting disclosure purposes) at January 31, 2015:
Asset Derivatives | |
Risk Exposure
Category | | Statement of Assets and
Liabilities Location | |
Fair Value ($) | |
Interest rate risk
| | Net assets — unrealized
appreciation on futures
contracts | | | 58,336
| * | |
Interest rate risk
| | Net assets — unrealized
appreciation on swap
contracts | | | 14,722 | * | |
Interest rate risk | | Premiums paid on
outstanding swap
contracts | | | 216 | | |
Total | | | | | 73,274 | | |
Liability Derivatives | |
Risk Exposure
Category | | Statement of Assets and
Liabilities Location | | Fair Value ($) | |
Interest rate risk
| | Net assets — unrealized
depreciation on futures
contracts | | | 59,551 | * | |
*Includes cumulative appreciation (depreciation) as reported in the tables following the Portfolio of Investments. Only the current day's variation margin is reported in receivables or payables in the Statement of Assets and Liabilities.
The following table indicates the effect of derivative instruments (not considered to be hedging instruments for accounting disclosure purposes) in the Statement of Operations for the period ended January 31, 2015:
Amount of Realized Gain (Loss) on Derivatives Recognized in Income | |
Risk Exposure
Category | | Futures
Contracts ($) | | Swap
Contracts ($) | | Total ($) | |
Interest rate risk | | | (61,202 | ) | | | 2,826 | | | | (58,376 | ) | |
Change in Unrealized Appreciation (Depreciation) on
Derivatives Recognized in Income | |
Risk Exposure
Category | | Futures
Contracts ($) | | Swap
Contracts ($) | | Total ($) | |
Interest rate risk | | | (1,215 | ) | | | 14,722 | | | | 13,507 | | |
The following table is a summary of the average outstanding volume by derivative instrument for the period ended January 31, 2015:
Derivative
Instrument | | Average notional
amounts($)* | | | |
Futures contracts — Long | | | 1,275,201 | | | | |
Futures contracts — Short | | | 4,131,035 | | | | |
Derivative
Instrument | | Average unrealized
appreciation($)* | | Average unrealized
depreciation($)* | |
Interest rate swaps | | | 5,523 | | | | (465 | ) | |
*Based on the ending quarterly outstanding amounts for the period ended January 31, 2015.
Security Transactions
Security transactions are accounted for on the trade date. Cost is determined and gains (losses) are based upon the specific identification method for both financial statement and federal income tax purposes.
Income Recognition
Income and capital gain distributions from the Underlying Funds, if any, are recorded on the ex-dividend date.
Interest income is recorded on an accrual basis. Market premiums and discounts, including original issue discounts, are amortized and accreted, respectively, over the expected life of the security on all debt securities, unless otherwise noted.
The Fund may place a debt security on non-accrual status and reduce related interest income when it becomes probable that the interest will not be collected and the amount of uncollectible interest can be reasonably estimated. A defaulted debt security is removed from non-accrual status when the issuer resumes interest payments or when collectability of interest is reasonably assured.
Expenses
General expenses of the Trust are allocated to the Fund and other funds of the Trust based upon relative net assets or other expense allocation methodologies determined by the nature of the expense. Expenses directly attributable to the Fund are charged to the Fund. Expenses directly attributable to a specific class of shares are charged to that share class.
Determination of Class Net Asset Value
All income, expenses (other than class-specific expenses, which are charged to that share class, as shown in the
Annual Report 2015
28
Columbia Diversified Real Return Fund
Notes to Financial Statements (continued)
January 31, 2015
Statement of Operations) and realized and unrealized gains (losses) are allocated to each class of the Fund on a daily basis, based on the relative net assets of each class, for purposes of determining the net asset value of each class.
Federal Income Tax Status
The Fund intends to qualify each year as a regulated investment company under Subchapter M of the Internal Revenue Code, as amended, and will distribute substantially all of its taxable income (including net short-term capital gains), if any, for its tax year, and as such will not be subject to federal income taxes. In addition, the Fund intends to distribute in each calendar year substantially all of its net investment income, capital gains and certain other amounts, if any, such that the Fund should not be subject to federal excise tax. Therefore, no federal income or excise tax provision is recorded.
Distributions to Shareholders
Distributions from net investment income, if any, are declared and paid monthly. Net realized capital gains, if any, are distributed at least annually. Income distributions and capital gain distributions are determined in accordance with federal income tax regulations, which may differ from GAAP.
Guarantees and Indemnifications
Under the Trust's organizational documents and, in some cases, by contract, its officers and trustees are indemnified against certain liabilities arising out of the performance of their duties to the Trust or its funds. In addition, certain of the Fund's contracts with its service providers contain general indemnification clauses. The Fund's maximum exposure under these arrangements is unknown since the amount of any future claims that may be made against the Fund cannot be determined, and the Fund has no historical basis for predicting the likelihood of any such claims.
Recent Accounting Pronouncement
Transfers and Servicing (Topic 860), Repurchase-to-Maturity Transactions, Repurchase Financings, and Disclosures
In June 2014, the Financial Accounting Standards Board (FASB) issued Accounting Standards Update (ASU) No. 2014-11, Transfers and Servicing (Topic 860), Repurchase-to-Maturity Transactions, Repurchase Financings, and Disclosures. ASU No. 2014-11 changes the accounting for certain reverse repurchase agreements and similar transactions accounted for as secured borrowings. The disclosure requirements are effective for interim and annual periods beginning after December 15, 2014. At this time, management is evaluating the implications of this guidance
and the impact it will have on the financial statement amounts and footnote disclosures, if any.
Note 3. Fees and Compensation Paid to Affiliates
Investment Management Fees and Underlying Fund Fees
Under an Investment Management Services Agreement, the Investment Manager determines which securities will be purchased, held or sold. The investment management fee is an annual fee that is a blend of (i) 0.00% on assets invested in Columbia proprietary funds, exchange-traded funds (ETFs) and closed-end funds that pay an investment management fee to the Investment Manager, and (ii) 0.70% on assets invested in all other securities, including other funds advised by the Investment Manager that do not pay an investment management fee, ETFs, third-party closed-end funds, derivatives and individual securities.
The annualized effective investment management fee rate for the period ended January 31, 2015 was 0.08% of the Fund's average daily net assets.
In addition to the fees and expenses which the Fund bears directly, the Fund indirectly bears a pro rata share of the fees and expenses of the Underlying Funds in which the Fund invests. Because the Underlying Funds have varied expense and fee levels and the Fund may own different proportions of Underlying Funds at different times, the amount of fees and expenses incurred indirectly by the Fund will vary. These expenses are not reflected in the expenses shown in Statement of Operations and are not included in the ratios to average net assets shown in the Financial Highlights.
Administration Fees
Under an Administrative Services Agreement, the Investment Manager also serves as the Fund Administrator. The Fund pays the Fund Administrator an annual fee for administration and accounting services that is a blend of (i) 0.02% on assets invested in Columbia proprietary funds, exchange-traded funds and closed-end funds that pay an investment management fee to the Investment Manager, and (ii) 0.06% on assets invested in all other securities, including affiliated funds, exchange-traded funds and closed-end funds that do not pay an investment management fee to the Investment Manager, third-party closed-end funds, derivatives and individual securities.
The annualized effective administration fee rate for the period ended January 31, 2015 was 0.02% of the Fund's average daily net assets.
Annual Report 2015
29
Columbia Diversified Real Return Fund
Notes to Financial Statements (continued)
January 31, 2015
Offering Costs
Offering costs were incurred prior to the shares of the Fund being offered. Offering costs include, among other things, state registration filing fees and printing costs. The Fund amortizes offering costs over a period of 12 months from the commencement of operations.
Compensation of Board Members
Board members are compensated for their services to the Fund as disclosed in the Statement of Operations. The Trust's eligible Trustees may participate in a Deferred Compensation Plan (the Plan) which may be terminated at any time. Obligations of the Plan will be paid solely out of the Fund's assets.
Compensation of Chief Compliance Officer
The Board has appointed a Chief Compliance Officer to the Fund in accordance with federal securities regulations. The Fund pays its pro-rata share of the expenses associated with the Chief Compliance Officer. The Fund's expenses for the Chief Compliance Officer will not exceed $15,000 per year.
Transfer Agent Fees
Under a Transfer and Dividend Disbursing Agent Agreement, Columbia Management Investment Services Corp. (the Transfer Agent), an affiliate of the Investment Manager and a wholly-owned subsidiary of Ameriprise Financial, is responsible for providing transfer agency services to the Fund. The Transfer Agent has contracted with Boston Financial Data Services (BFDS) to serve as sub-transfer agent.
Effective November 1, 2014, the Transfer Agent receives a monthly transfer agency fee based on the number or the average value of accounts, depending on the type of account. Prior to November 1, 2014, the Transfer Agent received a monthly account-based service fee based on the number of open accounts. In addition, the Transfer Agent also receives sub-transfer agency fees based on a percentage of the average aggregate value of the Fund's shares maintained in omnibus accounts (other than omnibus accounts for which American Enterprise Investment Services Inc. is the broker of record or accounts where the beneficial shareholder is a customer of Ameriprise Financial Services, Inc., which receive a per account fee). The Transfer Agent pays the fees of BFDS for services as sub-transfer agent and is not entitled to reimbursement for such fees from the Fund (with the exception of out-of-pocket fees).
The Transfer Agent also receives compensation from the Fund for various shareholder services and reimbursements for certain out-of-pocket fees. Total transfer agent fees for Class R5 shares are subject to an annual limitation of not more
than 0.05% of the average daily net assets attributable to Class R5 shares.
For the period ended January 31, 2015, the Fund's annualized effective transfer agent fee rates as a percentage of average daily net assets of each class were as follows:
Class A | | | 0.00 | %* | |
Class C | | | 0.01 | | |
Class R4 | | | 0.00 | * | |
Class R5 | | | 0.05 | | |
Class W | | | 0.00 | * | |
Class Z | | | 0.00 | * | |
*Rounds to zero.
An annual minimum account balance fee of $20 may apply to certain accounts with a value below the applicable share class's initial minimum investment requirements to reduce the impact of small accounts on transfer agent fees. These minimum account balance fees are remitted to the Fund and recorded as part of expense reductions in the Statement of Operations. For the period ended January 31, 2015, no minimum account balance fees were charged by the Fund.
Distribution and Service Fees
The Fund has an agreement with Columbia Management Investment Distributors, Inc. (the Distributor), an affiliate of the Investment Manager and a wholly-owned subsidiary of Ameriprise Financial, for distribution and shareholder services. The Board has approved, and the Fund has adopted, distribution and shareholder service plans (the Plans) applicable to certain share classes, which set the distribution and service fees for the Fund. These fees are calculated daily and are intended to compensate the Distributor and/or eligible selling and/or servicing agents for selling shares of the Fund and providing services to investors.
Under the Plans, the Fund pays a monthly service fee to the Distributor at the maximum annual rate of 0.25% of the average daily net assets attributable to Class A, Class C and Class W shares of the Fund. Also under the Plans, the Fund pays a monthly distribution fee to the Distributor at the maximum annual rate of 0.75% and 0.25% of the average daily net assets attributable to Class C and Class W shares, respectively.
Although the Fund may pay a distribution fee up to 0.25% of the Fund's average daily net assets attributable to Class W shares and a service fee of up to 0.25% of the Fund's average daily net assets attributable to Class W shares, the aggregate fee shall not exceed 0.25% of the Fund's average daily net assets attributable to Class W shares.
Annual Report 2015
30
Columbia Diversified Real Return Fund
Notes to Financial Statements (continued)
January 31, 2015
Expenses Waived/Reimbursed by the Investment Manager and its Affiliates
The Investment Manager and certain of its affiliates have contractually agreed to waive fees and/or reimburse expenses (excluding certain fees and expenses described below) for the period disclosed below, unless sooner terminated at the sole discretion of the Board, so that the Fund's net operating expenses, after giving effect to fees waived/expenses reimbursed and any balance credits and/or overdraft charges from the Fund's custodian, do not exceed the following annual rates as a percentage of the class' average daily net assets:
| | | Fee Rates Contractual
through
May 31, 2015 | |
Class A | | | 0.70 | % | |
Class C | | | 1.45 | | |
Class R4 | | | 0.45 | | |
Class R5 | | | 0.35 | | |
Class W | | | 0.70 | * | |
Class Z | | | 0.45 | | |
*Fee rate is contractual from June 25, 2014 (the commencement of operations of Class W shares) through May 31, 2015.
Under the agreement governing these fee waivers and/or expense reimbursement arrangements, the following fees and expenses are excluded from the waiver/reimbursement commitment, and therefore will be paid by the Fund, if applicable: taxes (including foreign transaction taxes), expenses associated with investments in affiliated and non-affiliated pooled investment vehicles (including mutual funds and exchange-traded funds), transaction costs and brokerage commissions, costs related to any securities lending program, dividend expenses associated with securities sold short, inverse floater program fees and expenses, transaction charges and interest on borrowed money, interest, extraordinary expenses and any other expenses the exclusion of which is specifically approved by the Board. This agreement may be modified or amended only with approval from all parties. Any fees waived and/or expenses reimbursed under the expense reimbursement arrangements described above are not recoverable by the Investment Manager or its affiliates in future periods.
Note 4. Federal Tax Information
The timing and character of income and capital gain distributions are determined in accordance with income tax regulations, which may differ from GAAP because of temporary or permanent book to tax differences.
At January 31, 2015, these differences are primarily due to differing treatment for capital loss carryforwards,
deferral/reversal of wash sale losses, Trustees' deferred compensation, foreign currency transactions, post-October capital losses, re-characterization of distributions for investments and derivative investments. To the extent these differences are permanent, reclassifications are made among the components of the Fund's net assets in the Statement of Assets and Liabilities. Temporary differences do not require reclassifications. In the Statement of Assets and Liabilities the following reclassifications were made:
Undistributed net investment income | | $ | 29,633 | | |
Accumulated net realized loss | | | (29,657 | ) | |
Paid-in capital | | | 24 | | |
Net investment income (loss) and net realized gains (losses), as disclosed in the Statement of Operations, and net assets were not affected by this reclassification.
The tax character of distributions paid during the period indicated was as follows:
| | | Period Ended
January 31,
2015 | |
Ordinary income | | $ | 289,227 | | |
Short-term capital gain distributions, if any, are considered ordinary income distributions for tax purposes.
At January 31, 2015, the components of distributable earnings on a tax basis were as follows:
Undistributed ordinary income | | $ | 14,016 | | |
Capital loss carryforwards | | | (29,673 | ) | |
Net unrealized depreciation | | | (490,570 | ) | |
At January 31, 2015, the cost of investments for federal income tax purposes was $9,955,163 and the aggregate gross unrealized appreciation and depreciation based on that cost was:
Unrealized appreciation | | $ | 87,224 | | |
Unrealized depreciation | | | (577,794 | ) | |
Net unrealized depreciation | | | (490,570 | ) | |
The following capital loss carryforwards, determined at January 31, 2015, may be available to reduce taxable income arising from future net realized gains on investments, if any, to the extent permitted by the Internal Revenue Code:
Year of Expiration | | Amount ($) | |
No expiration — short-term | | | 6,407 | | |
No expiration — long-term | | | 23,266 | | |
Total | | | 29,673 | | |
Under current tax rules, regulated investment companies can elect to treat certain late-year ordinary losses incurred and
Annual Report 2015
31
Columbia Diversified Real Return Fund
Notes to Financial Statements (continued)
January 31, 2015
post-October capital losses (capital losses realized after October 31) as arising on the first day of the following taxable year. As of January 31, 2015, the Fund will elect to treat post-October capital losses of $23,659 as arising on February 1, 2015.
Management of the Fund has concluded that there are no significant uncertain tax positions in the Fund that would require recognition in the financial statements. However, management's conclusion may be subject to review and adjustment at a later date based on factors including, but not limited to, new tax laws, regulations, and administrative interpretations (including relevant court decisions). Generally, the Fund's federal tax returns for the prior three fiscal years remain subject to examination by the Internal Revenue Service.
Note 5. Portfolio Information
The cost of purchases and proceeds from sales of investments in the Underlying Funds, excluding investments in money market funds and certain derivatives, if any, aggregated to $11,338,263 and $1,629,202, respectively, for the period ended January 31, 2015. The amount of purchase and sale activity impacts the portfolio turnover rate reported in the Financial Highlights.
Note 6. Shareholder Concentration
At January 31, 2015, affiliated shareholders of record owned 100% of the outstanding shares of the Fund in one or more accounts. Subscription and redemption activity by concentrated accounts may have a significant effect on the operations of the Fund.
Note 7. Line of Credit
The Fund has entered into a revolving credit facility with a syndicate of banks led by JPMorgan Chase Bank N.A. (JPMorgan) whereby the Fund may borrow for the temporary funding of shareholder redemptions or for other temporary or emergency purposes. Pursuant to a December 9, 2014 amendment, the credit facility agreement, which is a collective agreement between the Fund and certain other funds managed by the Investment Manager, severally and not jointly, permits collective borrowings up to $550 million. Interest is charged to each participating fund based on its borrowings at a rate equal to the higher of (i) the overnight federal funds rate plus 1.00% or (ii) the one-month LIBOR rate plus 1.00%. Each borrowing under the credit facility matures no later than 60 days after the date of borrowing. The Fund also pays a commitment fee equal to its pro rata share of the amount of the credit facility at a rate of 0.075% per annum. The commitment fee is included in other expenses in the Statement of Operations. Prior to the
December 9, 2014 amendment, the credit facility agreement permitted borrowings up to $500 million under the same terms and interest rates as described above.
The Fund had no borrowings during the period ended January 31, 2015.
Note 8. Significant Risks
Derivatives Risk
Losses involving derivative instruments may be substantial, because a relatively small price movement in the underlying security(ies) instrument, commodity, currency or index may result in a substantial loss for the Fund. In addition to the potential for increased losses, the use of derivative instruments may lead to increased volatility within the Fund. Derivatives will typically increase the Fund's exposure to principal risks to which it is otherwise exposed, and may expose the Fund to additional risks, including correlation risk, counterparty risk, hedging risk, leverage risk and liquidity risk.
Note 9. Subsequent Events
Management has evaluated the events and transactions that have occurred through the date the financial statements were issued and noted no items requiring adjustment of the financial statements or additional disclosure.
Note 10. Information Regarding Pending and Settled Legal Proceedings
In December 2005, without admitting or denying the allegations, American Express Financial Corporation (AEFC, which is now known as Ameriprise Financial, Inc. (Ameriprise Financial)) entered into settlement agreements with the Securities and Exchange Commission (SEC) and Minnesota Department of Commerce (MDOC) related to market timing activities. As a result, AEFC was censured and ordered to cease and desist from committing or causing any violations of certain provisions of the Investment Advisers Act of 1940, the Investment Company Act of 1940, and various Minnesota laws. AEFC agreed to pay disgorgement of $10 million and civil money penalties of $7 million. AEFC also agreed to retain an independent distribution consultant to assist in developing a plan for distribution of all disgorgement and civil penalties ordered by the SEC in accordance with various undertakings detailed at www.sec.gov/litigation/admin/ia-2451.pdf. Ameriprise Financial and its affiliates have cooperated with the SEC and the MDOC in these legal proceedings, and have made regular reports to the Funds' Boards of Trustees.
Ameriprise Financial and certain of its affiliates have historically been involved in a number of legal, arbitration and regulatory proceedings, including routine litigation, class
Annual Report 2015
32
Columbia Diversified Real Return Fund
Notes to Financial Statements (continued)
January 31, 2015
actions, and governmental actions, concerning matters arising in connection with the conduct of their business activities. Ameriprise Financial believes that the Funds are not currently the subject of, and that neither Ameriprise Financial nor any of its affiliates are the subject of, any pending legal, arbitration or regulatory proceedings that are likely to have a material adverse effect on the Funds or the ability of Ameriprise Financial or its affiliates to perform under their contracts with the Funds. Ameriprise Financial is required to make quarterly (10-Q), annual (10-K) and, as necessary, 8-K filings with the Securities and Exchange Commission on legal and regulatory matters that relate to Ameriprise Financial and its affiliates. Copies of these filings may be obtained by accessing the SEC website at www.sec.gov.
There can be no assurance that these matters, or the adverse publicity associated with them, will not result in increased fund redemptions, reduced sale of fund shares or other adverse consequences to the Funds. Further, although we believe proceedings are not likely to have a material adverse effect on the Funds or the ability of Ameriprise Financial or its affiliates to perform under their contracts with the Funds, these proceedings are subject to uncertainties and, as such, we are unable to estimate the possible loss or range of loss that may result. An adverse outcome in one or more of these proceedings could result in adverse judgments, settlements, fines, penalties or other relief that could have a material adverse effect on the consolidated financial condition or results of operations of Ameriprise Financial.
Annual Report 2015
33
Columbia Diversified Real Return Fund
Report of Independent Registered Public Accounting Firm
To the Trustees of Columbia Funds Series Trust I and Shareholders of
Columbia Diversified Real Return Fund
In our opinion, the accompanying statement of assets and liabilities, including the portfolio of investments, and the related statements of operations and of changes in net assets and the financial highlights present fairly, in all material respects, the financial position of the Columbia Diversified Real Return Fund (the "Fund", a series of Columbia Funds Series Trust I) at January 31, 2015, and the results of its operations, the changes in its net assets and the financial highlights for the period March 11, 2014 (commencement of operations) through January 31, 2015, in conformity with accounting principles generally accepted in the United States of America. These financial statements and financial highlights (hereafter referred to as "financial statements") are the responsibility of the Fund's management. Our responsibility is to express an opinion on these financial statements based on our audit. We conducted our audit of these financial statements in accordance with the standards of the Public Company Accounting Oversight Board (United States). Those standards require that we plan and perform the audit to obtain reasonable assurance about whether the financial statements are free of material misstatement. An audit includes examining, on a test basis, evidence supporting the amounts and disclosures in the financial statements, assessing the accounting principles used and significant estimates made by management, and evaluating the overall financial statement presentation. We believe that our audit, which included confirmation of securities at January 31, 2015 by correspondence with the custodian, brokers and transfer agent, provide a reasonable basis for our opinion.
PricewaterhouseCoopers LLP
Minneapolis, Minnesota
March 24, 2015
Annual Report 2015
34
Columbia Diversified Real Return Fund
The Trustees serve terms of indefinite duration. The names, addresses and birth years of the Trustees and Officers of the Funds in Columbia Funds Series Trust I, the year each was first elected or appointed to office, their principal business occupations during at least the last five years, the number of Funds overseen by each Trustee and other directorships they hold are shown below. Each officer listed below serves as an officer of each Fund in Columbia Funds Series Trust I.
Independent Trustees
Name, Year of Birth
and Position Held
with the Trust | | Year First
Appointed or
Elected as
Trustee to any
Fund Currently
in the Columbia
Funds Complex
or a Predecessor
Thereof | | Principal Occupation(s)
during the Past Five Years | | Number
of Funds
in the
Columbia
Funds
Complex
Overseen | | Other Directorships
Held by Trustee During
the Past Five Years | |
Douglas A. Hacker
(Born 1955)
Trustee and Chairman
of the Board | | | 1996 | | | Independent business executive since May 2006; Executive Vice President — Strategy of United Airlines from December 2002 to May 2006; President of UAL Loyalty Services (airline marketing company) from September 2001 to December 2002; Executive Vice President and Chief Financial Officer of United Airlines from July 1999 to September 2001 | | | 61 | | | Spartan Nash Company, (food distributor); Nash Finch Company (food distributor) from 2005 to 2013; Aircastle Limited (aircraft leasing); and SeaCube Container Leasing Ltd. (container leasing) from 2010 to 2013; and Travelport Worldwide Limited (travel information technology) | |
Janet Langford Kelly
(Born 1957)
Trustee | | | 1996 | | | Senior Vice President, General Counsel and Corporate Secretary, ConocoPhillips (integrated energy company) since September 2007; Deputy General Counsel — Corporate Legal Services, ConocoPhillips from August 2006 to August 2007; Partner, Zelle, Hofmann, Voelbel, Mason & Gette LLP (law firm) from March 2005 to July 2006; Adjunct Professor of Law, Northwestern University from September 2004 to June 2006; Director, UAL Corporation (airline) from February 2006 to July 2006; Chief Administrative Officer and Senior Vice President, Kmart Holding Corporation (consumer goods) from September 2003 to March 2004 | | | 61 | | | None | |
Nancy T. Lukitsh
(Born 1956)
Trustee | | | 2011 | | | Senior Vice President, Partner and Director of Marketing, Wellington Management Company, LLP (investment adviser) from 1997 to 2010; Chair, Wellington Management Investment Portfolios (commingled non-U.S. investment pools) from 2007 to 2010; Director, Wellington Trust Company, NA and other Wellington affiliates from 1997 to 2010 | | | 61 | | | None | |
William E. Mayer
(Born 1940)
Trustee | | | 1991 | | | Partner, Park Avenue Equity Partners (private equity) since February 1999 | | | 61 | | | DynaVox Inc. (speech creation); Lee Enterprises (print media); WR Hambrecht + Co. (financial service provider) from 2000 to 2012; BlackRock Kelso Capital Corporation (investment company); Premier, Inc. (healthcare) | |
Annual Report 2015
35
Columbia Diversified Real Return Fund
Trustees and Officers (continued)
Independent Trustees (continued)
Name, Year of Birth
and Position Held
with the Trust | | Year First
Appointed or
Elected as
Trustee to any
Fund Currently
in the Columbia
Funds Complex
or a Predecessor
Thereof | | Principal Occupation(s)
during the Past Five Years | | Number
of Funds
in the
Columbia
Funds
Complex
Overseen | | Other Directorships
Held by Trustee During
the Past Five Years | |
David M. Moffett
(Born 1952)
Trustee | | | 2011 | | | Retired. Chief Executive Officer, Federal Home Loan Mortgage Corporation, from 2008 to 2009; Senior Adviser, Global Financial Services Group, Carlyle Group, Inc., from 2007 to 2008; Vice Chairman and Chief Financial Officer, U.S. Bancorp, from 1993 to 2007 | | | 61 | | | CIT Group Inc. (commercial and consumer finance); eBay Inc. (online trading community); MBIA Inc. (financial service provider); E.W. Scripps Co. (print and television media); Building Materials Holding Corp. (building materials and construction services); Genworth Financial, Inc. (financial and insurance products and services); and University of Oklahoma Foundation | |
Charles R. Nelson
(Born 1942)
Trustee | | | 1981 | | | Retired. Professor Emeritus, University of Washington since 2011; Professor of Economics, University of Washington from 1976 to 2011; Ford and Louisa Van Voorhis Professor of Political Economy, University of Washington from 1993 to 2011; Adjunct Professor of Statistics, University of Washington from 1980 to 2011; Associate Editor, Journal of Money, Credit and Banking from September 1993 to 2008; consultant on econometric and statistical matters | | | 61 | | | None | |
John J. Neuhauser
(Born 1943)
Trustee | | | 1984 | | | President, Saint Michael's College since August 2007; Director or Trustee of several non-profit organizations, including Fletcher Allen Health Care, Inc.; Academic Vice President and Dean of Faculties, Boston College from August 1999 to October 2005; University Professor, Boston College from November 2005 to August 2007 | | | 61 | | | Liberty All-Star Equity Fund and Liberty All-Star Growth Fund (closed-end funds) | |
Patrick J. Simpson
(Born 1944)
Trustee | | | 2000 | | | Partner, Perkins Coie LLP (law firm) | | | 61 | | | None | |
Anne-Lee Verville
(Born 1945)
Trustee | | | 1998 | | | Retired. General Manager, Global Education Industry from 1994 to 1997, President — Application Systems Division from 1991 to 1994, Chief Financial Officer — US Marketing & Services from 1988 to 1991, and Chief Information Officer from 1987 to 1988, IBM Corporation (computer and technology) | | | 61 | | | Enesco Group, Inc. (producer of giftware and home and garden decor products) from 2001 to 2006 | |
Annual Report 2015
36
Columbia Diversified Real Return Fund
Trustees and Officers (continued)
Interested Trustee Affiliate with Investment Manager*
Name, Year of Birth
and Position Held
with the Trust | | Year First
Appointed or
Elected as
Trustee to any
Fund Currently
in the Columbia
Funds Complex
or a Predecessor
Thereof | | Principal Occupation(s)
during the Past Five Years | | Number
of Funds
in the
Columbia
Funds
Complex
Overseen | | Other Directorships
Held by Trustee During
the Past Five Years | |
William F. Truscott
(Born 1960)
Trustee | | | 2012 | | | Chairman of the Board and President, Columbia Management Investment Advisers, LLC since May 2010 and February 2012, respectively (previously President and Chief Investment Officer, 2001 – April 2010); Chief Executive Officer, Global Asset Management, Ameriprise Financial, Inc. since September 2012 (previously Chief Executive Officer, U.S. Asset Management & President, Annuities, May 2010 – September 2012 and President — U.S. Asset Management and Chief Investment Officer, 2005 – April 2010); Director and Chief Executive Officer, Columbia Management Investment Distributors, Inc. since May 2010 and February 2012, respectively (previously Chairman of the Board and Chief Executive Officer, 2006 – April 2010); Chairman of the Board and Chief Executive Officer, RiverSource Distributors, Inc. since 2006; Director, Threadneedle Asset Management Holdings, SARL since 2014; President and Chief Executive Officer, Ameriprise Certificate Company, 2006 – August 2012 | | | 193 | | | Chairman of the Board, Columbia Management Investment Advisers, LLC since May 2010; Director, Columbia Management Investment Distributors, Inc. since May 2010; Director, Ameriprise Certificate Company, 2006 to January 2013 | |
* Interested person (as defined under the 1940 Act) by reason of being an officer, director, security holder and/or employee of the Investment Manager or Ameriprise Financial.
The Statement of Additional Information has additional information about the Fund's Board members and is available, without charge, upon request by calling 800.345.6611; contacting your financial intermediary; or visiting columbiathreadneedle.com/us.
The Board has appointed officers who are responsible for day-to-day business decisions based on policies it has established. The officers serve at the pleasure of the Board. In addition to Mr. Truscott, who is Senior Vice President, the Funds' other officers are:
Fund Officers
Name,
Address and
Year of Birth | | Position and Year
First Appointed to
Position for any Fund
in the Columbia
Funds Complex or a
Predecessor Thereof | | Principal Occupation(s) During Past Five Years | |
Christopher O. Petersen
5228 Ameriprise
Financial Center
Minneapolis, MN 55474
Born 1970 | | President and Principal Executive Officer (2015) | | Vice President and Lead Chief Counsel, Ameriprise Financial, Inc. since January 2015 (previously, Vice President and Chief Counsel January 2010 – December 2014; and Vice President and Group Counsel or Counsel 2004 – January 2010); officer of Columbia Funds and affiliated funds since 2007. | |
Michael G. Clarke
225 Franklin Street
Boston, MA 02110
Born 1969 | | Treasurer (2011) and Chief Financial Officer (2009) | | Vice President — Mutual Fund Administration, Columbia Management Investment Advisers, LLC, since May 2010; Managing Director of Fund Administration, Columbia Management Advisors, LLC, September 2004 – April 2010; senior officer of Columbia Funds and affiliated funds since 2002. | |
Annual Report 2015
37
Columbia Diversified Real Return Fund
Trustees and Officers (continued)
Fund Officers (continued)
Name,
Address and
Year of Birth | | Position and Year
First Appointed to
Position for any Fund
in the Columbia
Funds Complex or a
Predecessor Thereof | | Principal Occupation(s) During Past Five Years | |
Paul B. Goucher
100 Park Avenue
New York, NY 10017
Born 1968 | | Senior Vice President (2011), Chief Legal Officer (2015) and Assistant Secretary (2008) | | Vice President and Lead Chief Counsel, Ameriprise Financial, Inc. since November 2008 and January 2013, respectively (previously Chief Counsel, January 2010 – January 2013 and Group Counsel, November 2008 – January 2010). | |
Thomas P. McGuire
225 Franklin Street
Boston, MA 02110
Born 1972 | | Vice President and Chief Compliance Officer (2012) | | Vice President — Asset Management Compliance, Ameriprise Financial, Inc., since May 2010; Chief Compliance Officer, Ameriprise Certificate Company since September 2010; Compliance Executive, Bank of America, 2005 – April 2010. | |
Colin Moore
225 Franklin Street
Boston, MA 02110
Born 1958 | | Senior Vice President (2010) | | Executive Vice President and Global Chief Investment Officer, Ameriprise Financial, Inc., since July 2013; Director and Global Chief Investment Officer, Columbia Management Investment Advisers, LLC since May 2010; Manager, Managing Director and Chief Investment Officer, Columbia Management Advisors, LLC, 2007 – April 2010. | |
Michael E. DeFao
225 Franklin Street
Boston, MA 02110
Born 1968 | | Vice President (2011) and Assistant Secretary (2010) | | Vice President and Chief Counsel, Ameriprise Financial, Inc. since May 2010; Associate General Counsel, Bank of America, 2005 – April 2010. | |
Joseph F. DiMaria
225 Franklin Street
Boston, MA 02110
Born 1968 | | Vice President (2011), Assistant Treasurer (2012) and Chief Accounting Officer (2008) | | Vice President — Mutual Fund Treasurer, Columbia Management Investment Advisers, LLC since May 2010; Director of Fund Administration, Columbia Management Advisors, LLC, 2006 – April 2010. | |
Amy Johnson
5228 Ameriprise
Financial Center
Minneapolis, MN 55474
Born 1965 | | Vice President (2006) | | Managing Director and Chief Operating Officer, Columbia Management Investment Advisers, LLC since May 2010 (previously Chief Administrative Officer, 2009 – April 2010, and Vice President — Asset Management and Trust Company Services, 2006 – 2009). | |
Lyn Kephart-Strong
5228 Ameriprise
Financial Center
Minneapolis, MN 55474
Born 1960 | | Vice President (2015) | | President, Columbia Management Investment Services Corp. since October 2014; Vice President & Resolution Officer, Ameriprise Trust Company since August 2009; President, RiverSource Service Corporation 2004 – 2010. | |
Ryan C. Larrenaga
225 Franklin Street
Boston, MA 02110
Born 1970 | | Vice President and Secretary (2015) | | Vice President and Group Counsel, Ameriprise Financial, Inc. since August 2011 (previously, Counsel from May 2010 to August 2011); Assistant General Counsel, Bank of America, 2005 – April 2010; officer of Columbia Funds and affiliated funds since 2005. | |
Annual Report 2015
38
Columbia Diversified Real Return Fund
Important Information About This Report
Each fund mails one shareholder report to each shareholder address. If you would like more than one report, please call shareholder services at 800.345.6611 and additional reports will be sent to you.
The policy of the Board is to vote the proxies of the companies in which each fund holds investments consistent with the procedures as stated in the Statement of Additional Information (SAI). You may obtain a copy of the SAI without charge by calling 800.345.6611; contacting your financial intermediary; visiting columbiathreadneedle.com/us; or searching the website of the Securities and Exchange Commission (SEC) at sec.gov. Information regarding how each fund voted proxies relating to portfolio securities is filed with the SEC by August 31st for the most recent 12-month period ending June 30th of that year, and is available without charge by visiting columbiathreadneedle.com/us; or searching the website of the SEC at sec.gov.
Each fund files a complete schedule of portfolio holdings with the SEC for the first and third quarters of each fiscal year on Form N-Q. Each fund's Form N-Q is available on the SEC's website at sec.gov and may be reviewed and copied at the SEC's Public Reference Room in Washington, D.C. Information on the operation of the Public Reference Room may be obtained by calling 800.SEC.0330. Each fund's complete schedule of portfolio holdings, as filed on Form N-Q, can also be obtained without charge, upon request, by calling 800.345.6611.
Annual Report 2015
39
Columbia Diversified Real Return Fund
P.O. Box 8081
Boston, MA 02266-8081

This information is for use with concurrent or prior delivery of a fund prospectus. Please read and consider the investment objectives, risks, charges and expenses for any fund carefully before investing. For a prospectus and summary prospectus, which contains this and other important information about the Fund, go to columbiathreadneedle.com/us. The Fund is distributed by Columbia Management Investment Distributors, Inc., member FINRA, and managed by Columbia Management Investment Advisers, LLC.
Columbia Threadneedle Investments (Columbia Threadneedle) is the global brand name of the Columbia and Threadneedle group of companies.
All rights reserved. Columbia Management Investment Distributors, Inc., 225 Franklin Street, Boston, MA 02110-2804
© 2015 Columbia Management Investment Advisers, LLC.
columbiathreadneedle.com/us
ANN249_01_E01_(03/15)
Item 2. Code of Ethics.
(a) The registrant has adopted a code of ethics that applies to the registrant’s principal executive officer, principal financial officer, principal accounting officer or controller, or persons performing similar functions, regardless of whether these individuals are employed by the registrant or a third party.
(b) During the period covered by this report, there were not any amendments to a provision of the code of ethics adopted in 2(a) above.
(c) During the period covered by this report, there were no waivers, including any implicit waivers, from a provision of the code of ethics described in 2(a) above that relates to one or more of the items set forth in paragraph (b) of this item’s instructions.
Item 3. Audit Committee Financial Expert.
The registrant’s Board of Trustees has determined that Douglas A. Hacker, David M. Moffett and Anne-Lee Verville, each of whom are members of the registrant’s Board of Trustees and Audit Committee, each qualify as an audit committee financial expert. Mr. Hacker, Mr. Moffett and Ms. Verville are each independent trustees, as defined in paragraph (a)(2) of this item’s instructions.
Item 4. Principal Accountant Fees and Services.
Fee information below is disclosed for the one series of the registrant whose reports to stockholders are included in this annual filing. The Fund commenced operations on March 11, 2014 so there is no fee information for fiscal year ended January 31, 2014.
(a) Audit Fees. Aggregate Audit Fees billed by the principal accountant for professional services rendered during the fiscal years ended January 31, 2015 and January 31, 2014 are approximately as follows:
Audit Fees include amounts related to the audit of the registrant’s annual financial statements or services that are normally provided by the accountant in connection with statutory and regulatory filings or engagements for those fiscal years.
(b) Audit-Related Fees. Aggregate Audit-Related Fees billed to the registrant by the principal accountant for professional services rendered during the fiscal years ended January 31, 2015 and January 31, 2014 are approximately as follows:
Audit-Related Fees include amounts for assurance and related services by the principal accountant that are reasonably related to the performance of the audit of the registrant’s financial statements and are not reported in Audit Fees above. In fiscal year 2015, Audit-Related Fees consist of agreed-upon procedures performed for semi-annual shareholder reports.
During the fiscal years ended January 31, 2015 and January 31, 2014, there were no Audit-Related Fees billed by the registrant’s principal accountant to the registrant’s investment adviser (not including any sub-adviser whose role is primarily portfolio management and is subcontracted with or overseen by another investment adviser) and any entity controlling, controlled by, or under common control with the adviser that provides ongoing services to the registrant for an engagement that related directly to the operations and financial reporting of the registrant.
(c) Tax Fees. Aggregate Tax Fees billed by the principal accountant to the registrant for professional services rendered during the fiscal years ended January 31, 2015 and January 31, 2014 are approximately as follows:
Tax Fees include amounts for the review of annual tax returns, the review of required shareholder distribution calculations and typically include amounts for professional services by the principal accountant for tax compliance, tax advice and tax planning.
During the fiscal years ended January 31, 2015 and January 31, 2014, there were no Tax Fees billed by the registrant’s principal accountant to the registrant’s investment adviser (not including any sub-adviser whose role is primarily portfolio management and is subcontracted with or overseen by another investment adviser) and any entity controlling, controlled by, or under common control with the adviser that provides ongoing services to the registrant for an engagement that related directly to the operations and financial reporting of the registrant.
(d) All Other Fees. Aggregate All Other Fees billed by the principal accountant to the registrant for professional services rendered during the fiscal years ended January 31, 2015 and January 31, 2014 are approximately as follows:
All Other Fees include amounts for products and services provided by the principal accountant, other than the services reported in paragraphs (a) through (c) above.
Aggregate All Other Fees billed by the registrant’s principal accountant to the registrant’s investment adviser (not including any sub-adviser whose role is primarily portfolio management and is subcontracted with or overseen by another investment adviser) and any entity controlling, controlled by, or under common control with the adviser that provides ongoing services to the registrant for an engagement that related directly to the operations and financial reporting of the registrant during the fiscal years ended January 31, 2015 and January 31, 2014 are approximately as follows:
In fiscal year 2015, All Other Fees primarily consist of fees billed for internal control examinations of the registrant’s transfer agent and investment advisor.
(e)(1) Audit Committee Pre-Approval Policies and Procedures
The registrant’s Audit Committee is required to pre-approve the engagement of the registrant’s independent auditors to provide audit and non-audit services to the registrant and non-audit services to its investment adviser (excluding any sub-adviser whose role is primarily portfolio management and is sub-contracted or overseen by another investment adviser (the “Adviser”) or any entity controlling, controlled by or under common control with the Adviser that provides ongoing services to the Fund (a “Control Affiliate”) if the engagement relates directly to the operations and financial reporting of the registrant.
The Audit Committee has adopted a Policy for Engagement of Independent Auditors for Audit and Non-Audit Services (the “Policy”). The Policy sets forth the understanding of the Audit Committee regarding the engagement of the registrant’s independent accountants to provide (i) audit and permissible audit-related, tax and other services to the registrant (“Fund Services”); (ii) non-audit services to the registrant’s Adviser and any Control Affiliates, that relates directly to the operations and financial reporting of a Fund (“Fund-related Adviser Services”); and (iii) certain other audit and non-audit services to the registrant’s Adviser and its Control Affiliates. A service will require specific pre-approval by the Audit Committee if it is to be provided by the Fund’s independent auditor; provided, however, that pre-approval of non-audit services to the Fund, the Adviser or Control Affiliates may be waived if certain de minimis requirements set forth in the SEC’s rules are met.
Under the Policy, the Audit Committee may delegate pre-approval authority to any pre-designated member or members who are independent board members. The member(s) to whom such authority is delegated must report, for informational purposes only, any pre-approval decisions to the Audit Committee at its next regular meeting. The Audit Committee’s responsibilities with respect to the pre-approval of services performed by the independent auditor may not be delegated to management.
On an annual basis, at a regularly scheduled Audit Committee meeting, the Fund’s Treasurer or other Fund officer shall submit to the Audit Committee a schedule of the types of Fund Services and Fund-related Adviser Services that are subject to specific pre-approval. This schedule will provide a description of each type of service that is subject to specific pre-approval, along with total projected fees for each service. The pre-approval will generally cover a one-year period. The Audit Committee will review and approve the types of services and the projected fees for the next one-year period and may add to, or subtract from, the list of pre-approved services from time to time, based on subsequent determinations. This specific approval acknowledges that the Audit Committee is in agreement with the specific types of services that the independent auditor will be permitted to perform and the projected fees for each service.
The Fund’s Treasurer or other Fund officer shall report to the Audit Committee at each of its regular meetings regarding all Fund Services or Fund-related Adviser Services provided since the last such report was rendered, including a description of the services, by category, with forecasted fees for the annual reporting period, proposed changes requiring specific pre-approval and a description of services provided by the independent auditor, by category, with actual fees during the current reporting period.
*****
(e)(2) 100% of the services performed for items (b) through (d) above during 2015 and 2014 were pre-approved by the registrant’s Audit Committee.
(f) Not applicable.
(g) The aggregate non-audit fees billed by the registrant’s accountant for services rendered to the registrant, and rendered to the registrant’s investment adviser (not including any sub-adviser whose role is primarily portfolio management and is subcontracted with or overseen by another investment adviser), and any entity controlling, controlled by, or under common control with the adviser that provides ongoing services to the registrant during the fiscal years ended January 31, 2015 and January 31, 2014 are approximately as follows:
(h) The registrant’s Audit Committee of the Board of Directors has considered whether the provision of non-audit services that were rendered to the registrant’s adviser (not including any sub-adviser whose role is primarily portfolio management and is
subcontracted with or overseen by another investment adviser), and any entity controlling, controlled by, or under common control with the investment adviser that provides ongoing services to the registrant that were not pre-approved pursuant to paragraph (c)(7)(ii) of Rule 2-01 of Regulation S-X, is compatible with maintaining the principal accountant’s independence.
Item 5. Audit Committee of Listed Registrants.
Not applicable.
Item 6. Investments
(a) The registrant’s “Schedule I — Investments in securities of unaffiliated issuers” (as set forth in 17 CFR 210.12-12) is included in Item 1 of this Form N-CSR.
(b) Not applicable.
Item 7. Disclosure of Proxy Voting Policies and Procedures for Closed-End Management Investment Companies.
Not applicable.
Item 8. Portfolio Managers of Closed-End Management Investment Companies.
Not applicable.
Item 9. Purchases of Equity Securities by Closed-End Management Investment Company and Affiliated Purchasers.
Not applicable.
Item 10. Submission of Matters to a Vote of Security Holders.
There were no material changes to the procedures by which shareholders may recommend nominees to the registrant’s board of directors.
Item 11. Controls and Procedures.
(a) The registrant’s principal executive officer and principal financial officers, based on their evaluation of the registrant’s disclosure controls and procedures as of a date within 90 days of the filing of this report, have concluded that such controls and procedures are adequately designed to ensure that material information required to be disclosed by the registrant in Form N-CSR is accumulated and communicated to the registrant’s management, including the principal executive officer and principal financial officer, or persons performing similar functions, as appropriate to allow timely decisions regarding required disclosure.
(b) There was no change in the registrant’s internal control over financial reporting that occurred during the registrant’s second fiscal quarter of the period covered by this report that has materially affected, or is reasonably likely to materially affect, the registrant’s internal control over financial reporting.
Item 12. Exhibits.
(a)(1) Code of ethics required to be disclosed under Item 2 of Form N-CSR attached hereto as Exhibit 99.CODE ETH.
(a)(2) Certifications pursuant to Rule 30a-2(a) under the Investment Company Act of 1940 (17 CFR 270.30a-2(a)) attached hereto as Exhibit 99.CERT.
(a)(3) Not applicable.
(b) Certification pursuant to Rule 30a-2(b) under the Investment Company Act of 1940 (17 CFR 270.30a-2(b)) attached hereto as Exhibit 99.906CERT.
SIGNATURES
Pursuant to the requirements of the Securities Exchange Act of 1934 and the Investment Company Act of 1940, the registrant has duly caused this report to be signed on its behalf by the undersigned, thereunto duly authorized.
(registrant) | | Columbia Funds Series Trust I | |
| | |
| | |
By (Signature and Title) | /s/ Christopher O. Petersen | |
| Christopher O. Petersen, President and Principal Executive Officer |
| | |
| | |
Date | | March 24, 2015 | |
| | | | |
Pursuant to the requirements of the Securities Exchange Act of 1934 and the Investment Company Act of 1940, this report has been signed below by the following persons on behalf of the registrant and in the capacities and on the dates indicated.
By (Signature and Title) | /s/ Christopher O. Petersen | |
| Christopher O. Petersen, President and Principal Executive Officer |
| | |
| | |
Date | | March 24, 2015 | |
| | |
| | |
By (Signature and Title) | /s/ Michael G. Clarke | |
| Michael G. Clarke, Treasurer and Chief Financial Officer | |
| | |
| | |
Date | | March 24, 2015 | |