UNITED STATES
SECURITIES AND EXCHANGE COMMISSION
Washington, D.C. 20549
FORM N-CSR
CERTIFIED SHAREHOLDER REPORT OF REGISTERED
MANAGEMENT INVESTMENT COMPANIES
Investment Company Act file number | 811-04367 |
|
Columbia Funds Series Trust I |
(Exact name of registrant as specified in charter) |
|
225 Franklin Street, Boston, MA | | 02110 |
(Address of principal executive offices) | | (Zip code) |
|
Ryan Larrenaga c/o Columbia Management Investment Advisers, LLC 225 Franklin Street Boston, MA 02110 |
(Name and address of agent for service) |
|
Registrant’s telephone number, including area code: | (800) 345-6611 | |
|
Date of fiscal year end: | March 31 | |
|
Date of reporting period: | March 31, 2015 | |
| | | | | | | | |
Form N-CSR is to be used by management investment companies to file reports with the Commission not later than 10 days after the transmission to stockholders of any report that is required to be transmitted to stockholders under Rule 30e-1 under the Investment Company Act of 1940 (17 CFR 270.30e-1). The Commission may use the information provided on Form N-CSR in its regulatory, disclosure review, inspection, and policymaking roles.
A registrant is required to disclose the information specified by Form N-CSR, and the Commission will make this information public. A registrant is not required to respond to the collection of information contained in Form N-CSR unless the Form displays a currently valid Office of Management and Budget (“OMB”) control number. Please direct comments concerning the accuracy of the information collection burden estimate and any suggestions for reducing the burden to Secretary, Securities and Exchange Commission, 450 Fifth Street, NW, Washington, DC 20549-0609. The OMB has reviewed this collection of information under the clearance requirements of 44 U.S.C. § 3507.
Item 1. Reports to Stockholders.

ANNUAL REPORT
March 31, 2015

COLUMBIA PACIFIC/ASIA FUND

 Dear Shareholder,
In a world that is changing faster than ever before, investors want asset managers who offer a global perspective while generating strong and sustainable returns. To that end, Columbia Management, in conjunction with its U.K.-based affiliate, Threadneedle Investments, has rebranded to Columbia Threadneedle Investments. The new global brand represents the combined capabilities, resources and reach of the global group, offering investors access to the best of both firms.
With a presence in 18 countries and more than 450 investment professionals*, our collective perspective and world view as Columbia Threadneedle Investments gives us deeper insight into what might affect the real-life financial outcomes clients are seeking. Putting our views into a global context enables us to build richer perspectives and create the right solutions, and provides us with enhanced capabilities to deliver consistent investment performance, which may ultimately lead to better investor outcomes.
As a result of the rebrand, you will begin to see our new logo and colors reflected in printed materials, such as this shareholder report, as well as on our new website — columbiathreadneedle.com/us. We encourage you to visit us online and view a new video on the "About Us" tab that speaks to the strength of the firm.
While we are introducing a new brand, in many ways, the investment company you know well has not changed. The following remain in effect:
n Fund and strategy names
n Established investment teams, philosophies and processes
n Account services, features, servicing phone numbers and mailing addresses
n Columbia Management Investment Distributors as distributor and Columbia Management Investment Advisers as investment adviser
We recognize that the money we manage represents the hard work and savings of people like you, and that everyone has different ambitions and different definitions of success. Investors have varying goals — funding their children's education, enjoying their retirement, putting money aside for unexpected events, and more. Whatever your ambitions, we believe our wide range of investment products and solutions can help give you confidence that you will reach your goals.
The world is constantly changing, but our priority remains the same: to help you secure your finances, meet your goals and achieve success. Thank you for your continued investment with us. Our service representatives are available at 800.345.6611 to help with any questions.
Sincerely,

Christopher O. Petersen
President, Columbia Funds
Investors should consider the investment objectives, risks, charges and expenses of a mutual fund carefully before investing. For a free prospectus and summary prospectus, which contains this and other important information about a fund, visit columbiathreadneedle.com/us. The prospectus should be read carefully before investing.
* Source: Ameriprise as of December 1, 2014
Columbia Funds are distributed by Columbia Management Investment Distributors, Inc., member FINRA, and managed by Columbia Management Investment Advisers, LLC.
© 2015 Columbia Management Investment Advisers, LLC. All rights reserved.
COLUMBIA PACIFIC/ASIA FUND
Performance Overview | | | 2 | | |
Manager Discussion of Fund Performance | | | 4 | | |
Understanding Your Fund's Expenses | | | 7 | | |
Portfolio of Investments | | | 8 | | |
Statement of Assets and Liabilities | | | 14 | | |
Statement of Operations | | | 16 | | |
Statement of Changes in Net Assets | | | 17 | | |
Financial Highlights | | | 19 | | |
Notes to Financial Statements | | | 25 | | |
Report of Independent Registered
Public Accounting Firm | | | 35 | | |
Federal Income Tax Information | | | 36 | | |
Trustees and Officers | | | 37 | | |
Important Information About This Report | | | 41 | | |
Fund Investment Manager
Columbia Management Investment
Advisers, LLC
225 Franklin Street
Boston, MA 02110
Fund Distributor
Columbia Management Investment
Distributors, Inc.
225 Franklin Street
Boston, MA 02110
Fund Transfer Agent
Columbia Management Investment
Services Corp.
P.O. Box 8081
Boston, MA 02266-8081
For more information about any of the funds, please visit columbiathreadneedle.com/us or call 800.345.6611. Customer Service Representatives are available to answer your questions Monday through Friday from 8 a.m. to 7 p.m. Eastern time.
The views expressed in this report reflect the current views of the respective parties. These views are not guarantees of future performance and involve certain risks, uncertainties and assumptions that are difficult to predict, so actual outcomes and results may differ significantly from the views expressed. These views are subject to change at any time based upon economic, market or other conditions and the respective parties disclaim any responsibility to update such views. These views may not be relied on as investment advice and, because investment decisions for a Columbia fund are based on numerous factors, may not be relied on as an indication of trading intent on behalf of any particular Columbia fund. References to specific securities should not be construed as a recommendation or investment advice.
COLUMBIA PACIFIC/ASIA FUND
Performance Summary
n Columbia Pacific/Asia Fund (the Fund) Class A shares returned 12.17% excluding sales charges for the 12-month period that ended March 31, 2015.
n During the same time period, the Fund outperformed both the MSCI All Country (AC) Asia Pacific Index (Net), which returned 8.60%, and the broader MSCI EAFE Index (Net), which returned -0.92%.
n Security selection, sector allocations and country weights all contributed to the Fund's outperformance relative to the MSCI AC Asia Pacific Index (Net), with the biggest boosts coming from the health care, industrials and financials sectors and from positions in India, Japan and the Philippines.
Average Annual Total Returns (%) (for period ended March 31, 2015)
| | | Inception | | 1 Year | | 5 Years | | 10 Years | |
Class A* | | 03/31/08 | | | | | | | | | | | | | |
Excluding sales charges | | | | | | | 12.17 | | | | 7.18 | | | | 6.20 | | |
Including sales charges | | | | | | | 5.77 | | | | 5.91 | | | | 5.57 | | |
Class C* | | 03/31/08 | | | | | | | | | | | | | |
Excluding sales charges | | | | | | | 11.36 | | | | 6.41 | | | | 5.43 | | |
Including sales charges | | | | | | | 10.36 | | | | 6.41 | | | | 5.43 | | |
Class I* | | 09/27/10 | | | 12.72 | | | | 7.59 | | | | 6.58 | | |
Class R4* | | 03/19/13 | | | 12.42 | | | | 7.41 | | | | 6.49 | | |
Class W* | | 06/18/12 | | | 12.27 | | | | 7.17 | | | | 6.26 | | |
Class Z | | 12/31/92 | | | 12.51 | | | | 7.42 | | | | 6.49 | | |
MSCI AC Asia Pacific Index (Net) | | | | | | | 8.60 | | | | 5.81 | | | | 6.27 | | |
MSCI EAFE Index (Net) | | | | | | | -0.92 | | | | 6.16 | | | | 4.95 | | |
Returns for Class A are shown with and without the maximum initial sales charge of 5.75%. Returns for Class C are shown with and without the 1.00% contingent deferred sales charge for the first year only. The Fund's other classes are not subject to sales charges and have limited eligibility. Please see the Fund's prospectus for details. Performance for different share classes will vary based on differences in sales charges and fees associated with each class. All results shown assume reinvestment of distributions during the period. Returns do not reflect the deduction of taxes that a shareholder may pay on Fund distributions or on the redemption of Fund shares. Performance results reflect the effect of any fee waivers or reimbursements of Fund expenses by Columbia Management Investment Advisers, LLC and/or any of its affiliates. Absent these fee waivers or expense reimbursement arrangements, performance results would have been lower.
The performance information shown represents past performance and is not a guarantee of future results. The investment return and principal value of your investment will fluctuate so that your shares, when redeemed, may be worth more or less than their original cost. Current performance may be lower or higher than the performance information shown. You may obtain performance information current to the most recent month-end by contacting your financial intermediary, visiting columbiathreadneedle.com/us or calling 800.345.6611.
*The returns shown for periods prior to the share class inception date (including returns for the Life of the Fund, if shown, which are since Fund inception) include the returns of the Fund's oldest share class. These returns are adjusted to reflect any higher class-related operating expenses of the newer share classes, as applicable. Please visit columbiathreadneedle.com/us/investment-products/mutual-funds/appended-performance for more information.
The MSCI AC Asia Pacific Index (Net) is a free float-adjusted market capitalization weighted index that is designed to measure the equity market performance in 13 developed and emerging markets in the Asia Pacific region.
The MSCI EAFE Index (Net) is a free float-adjusted market capitalization index that is designed to measure the equity market performance of developed markets, excluding the U.S. and Canada. The index is compiled from a composite of securities markets of Europe, Australasia and the Far East and is widely recognized by investors in foreign markets as the measurement index for portfolios of non-North American securities.
Indices are not available for investment, are not professionally managed and do not reflect sales charges, fees, brokerage commissions, taxes (except the MSCI AC Asia Pacific Index (Net) and the MSCI EAFE Index (Net), which reflect reinvested dividends net of withholding taxes) or other expenses of investing. Securities in the Fund may not match those in an index.
Annual Report 2015
2
COLUMBIA PACIFIC/ASIA FUND
PERFORMANCE OVERVIEW (continued)
Performance of a Hypothetical $10,000 Investment (April 1, 2005 – March 31, 2015)
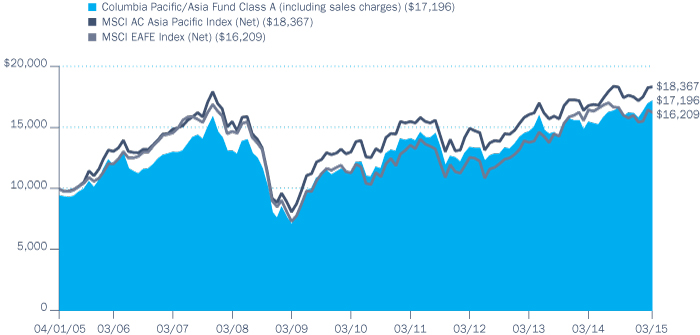
The chart above shows the change in value of a hypothetical $10,000 investment in Class A shares of Columbia Pacific/Asia Fund during the stated time period, and does not reflect the deduction of taxes that a shareholder may pay on Fund distributions or on the redemption of Fund shares.
Annual Report 2015
3
COLUMBIA PACIFIC/ASIA FUND
MANAGER DISCUSSION OF FUND PERFORMANCE
Portfolio Management
Daisuke Nomoto, CMA (SAAJ)
Jasmine Huang, CFA, CPA (U.S. and China), CFM
Christine Seng, CFA
Morningstar Style BoxTM

The Morningstar Style BoxTM is based on a fund's portfolio holdings. For equity funds, the vertical axis shows the market capitalization of the stocks owned, and the horizontal axis shows investment style (value, blend, or growth). Information shown is based on the most recent data provided by Morningstar.
© 2015 Morningstar, Inc. All rights reserved. The Morningstar information contained herein: (1) is proprietary to Morningstar and/or its content providers; (2) may not be copied or distributed; and (3) is not warranted to be accurate, complete or timely. Neither Morningstar nor its content providers are responsible for any damages or losses arising from any use of this information.
For the 12-month period that ended March 31, 2015, the Fund's Class A shares returned 12.17% excluding sales charges. The Fund outperformed the MSCI AC Asia Pacific Index (Net), which returned 8.60%, and the broader MSCI EAFE Index (Net), which returned -0.92% over the same time period. Strong security selection as well as favorable country and sector allocations helped push the Fund ahead of the MSCI AC Asia Pacific Index (Net).
A Favorable Environment for Asia-Pacific Markets
Stock markets in the Asia-Pacific region generated strong returns compared to other parts of the world for the 12-month period ended March 31, 2015. A dramatic fall in oil prices provided a boost to countries, such as India, that depend on energy imports, while weaker currencies relative to the U.S. dollar helped drive gains in export-driven economies, including Japan. Other tailwinds included fledgling indications of improving growth in Japan, which represents roughly 40% of the MSCI AC Asia Pacific Index (Net).
Central bank moves also were supportive of equity markets in the region. In October 2014, the Bank of Japan expanded its quantitative and qualitative easing program by stepping up purchases of Japanese government bonds, exchange-traded funds and real estate investment trusts. China's central bank cut interest rates in November, its first such move in more than two years. On the political front, elections of pro-business leaders in Japan and India helped fuel additional gains in those markets. Finally, the launch of the Shanghai-Hong Kong Stock Connect, which allows investors in Hong Kong and mainland China to trade shares listed on the other market, contributed to the strong performance of "A" shares listed on the China domestic stock exchange.
Strong Security Selection Across Sectors and Countries
Stock selection was positive in most sectors, with gains from the health care, industrials, financials and consumer discretionary sectors boosting performance relative to the MSCI AC Asia Pacific Index (Net). An overweight in the top-performing health care sector further bolstered performance. Security selection was positive in 11 of the 14 countries in which the Fund invested, with investment choices in India, the Philippines and Japan accounting for the most sizable relative gains. Underexposure to some of the weaker-performing segments in the MSCI AC Asia Pacific Index (Net), including energy and South Korea, also aided results.
Technology company Alps Electric was one of the Fund's top individual performers. Shares of this Japanese electronics component manufacturer rose sharply, driven by strong demand for its high-end camera modules used in mobile phones. Another winner was Motherson Sumi Systems, an Indian automobile parts manufacturer. Its shares posted a steep gain, as growing demand for autos fueled healthy revenue growth and higher profits. In health care, India-based global pharmaceuticals company Lupin was a standout, benefiting from new product approvals, a promising drug pipeline, inroads in overseas markets and fast growth in the generic pharmaceutical segment in the United States and Japan. Elsewhere, winners included Japan-based commercial kitchen equipment company
Annual Report 2015
4
COLUMBIA PACIFIC/ASIA FUND
MANAGER DISCUSSION OF FUND PERFORMANCE (continued)
Hoshizaki Electric, which gained from consistently strong earnings results on the back of a competitive product lineup. In financials, shares of GT Capital Holdings, an investment holding company in the Philippines, climbed as sustained improvements in its loan book, expanded capacity in its electricity generation business and strong demand in its automotive dealer division bolstered the company's bottom line. Of these, only Motherson Sumi was included in the benchmark.
Few Disappointments
Stock selection in Hong Kong and Taiwan trimmed performance. In the consumer discretionary sector, shares of Hong Kong-listed Sands China, a casino operator in Macau, tumbled as the Chinese government's anti-corruption campaign slowed gambling and tourist traffic to the island. In industrials, Comsys Holdings, a Japanese sub-contractor focused on the telecommunications industry, saw its stock pull back due to concern over a decline in telecom expenditures. Finally, an investment in Taiwan-based technology company Tong Hsing Electronic Industries hampered performance. Shares of Tong Hsing, which makes ceramic substrates used in semiconductors and LED lighting, declined as the company took longer than expected to work down its LED lighting inventories. We sold Comsys and Tong Hsing before the period's end.
Looking Ahead
We remain optimistic about the outlook for Asia-Pacific equity markets, despite their strong recent performance. While valuations have risen, we believe that they have not reached levels that raise concerns about their potential for further gains. In our view, monetary policy remains supportive, with low prevailing interest rates pushing investors toward equities. That said, we recognize that there are risks, including the potential for a market upheaval once the Federal Reserve starts raising a key short-term interest rate.
At this time, we continue to believe Asia-Pacific equities offer opportunities for multi-decade growth. We currently expect the equity market in Japan to benefit from improved corporate governance and a pickup in economic growth, driven by lower oil prices, a weak yen and reflationary monetary policies. The region has approximately 600 million people (more than 1.8 billion, if India is included), and the growing number of middle-class wage earners plays a significant role for consumption growth. By contrast, we believe that China may face slower growth, as policymakers there try to lower debt levels and clamp down on corruption.
Going forward, we plan to maintain our bottom-up focus on undervalued companies with sustainable free cash flow and management teams focused on improving shareholder value. At period end, the Fund had its biggest stake and roughly 40% of its assets in Japan, and overweights in India, China and the Philippines. From a sector perspective, the Fund had its largest concentration and about 29% of assets in financials, with overweights in health care and information technology.
Top Ten Holdings (%)
(at March 31, 2015) | |
Samsung Electronics Co., Ltd.
(South Korea) | | | 3.0 | | |
Toyota Motor Corp. (Japan) | | | 3.0 | | |
WisdomTree Japan Hedged
Equity Fund (Japan) | | | 2.6 | | |
Taiwan Semiconductor
Manufacturing Co., Ltd., ADR
(Taiwan) | | | 2.2 | | |
KDDI Corp. (Japan) | | | 2.1 | | |
Astellas Pharma, Inc. (Japan) | | | 2.0 | | |
Tencent Holdings Ltd. (China) | | | 1.9 | | |
Central Japan Railway Co.
(Japan) | | | 1.8 | | |
Industrial & Commercial Bank
of China Ltd., Class H (China) | | | 1.8 | | |
CK Hutchison Holdings Ltd.
(Hong Kong) | | | 1.8 | | |
Percentages indicated are based upon total investments (excluding Money Market Funds).
For further detail about these holdings, please refer to the section entitled "Portfolio of Investments."
Fund holdings are as of the date given, are subject to change at any time, and are not recommendations to buy or sell any security.
Portfolio Breakdown (%)
(at March 31, 2015) | |
Common Stocks | | | 97.0 | | |
Consumer Discretionary | | | 10.6 | | |
Consumer Staples | | | 2.7 | | |
Energy | | | 1.0 | | |
Financials | | | 29.2 | | |
Health Care | | | 8.7 | | |
Industrials | | | 12.7 | | |
Information Technology | | | 18.0 | | |
Materials | | | 3.8 | | |
Telecommunication Services | | | 7.1 | | |
Utilities | | | 3.2 | | |
Exchange-Traded Funds | | | 2.6 | | |
Money Market Funds | | | 0.4 | | |
Total | | | 100.0 | | |
Percentages indicated are based upon total investments. The Fund's portfolio composition is subject to change.
Annual Report 2015
5
COLUMBIA PACIFIC/ASIA FUND
MANAGER DISCUSSION OF FUND PERFORMANCE (continued)
Country Breakdown (%)
(at March 31, 2015) | |
Australia | | | 10.6 | | |
China | | | 16.4 | | |
Hong Kong | | | 4.5 | | |
India | | | 7.2 | | |
Indonesia | | | 2.2 | | |
Japan | | | 41.5 | | |
Malaysia | | | 0.6 | | |
Philippines | | | 4.0 | | |
Singapore | | | 2.4 | | |
South Korea | | | 4.4 | | |
Taiwan | | | 4.4 | | |
Thailand | | | 1.4 | | |
United States(a) | | | 0.4 | | |
Total | | | 100.0 | | |
Country Breakdown is based primarily on issuer's place of organization/incorporation. Percentages indicated are based upon total investments. The Fund's portfolio composition is subject to change.
(a) Includes investments in Money Market Funds.
Investment Risks
Market risk may affect a single issuer, sector of the economy, industry or the market as a whole. International investing involves certain risks and volatility due to potential political, economic or currency instabilities and different financial and accounting standards. Risks are enhanced for emerging market issuers. Concentration in the Asia Pacific region, where issuers tend to be less developed than U.S. issuers, presents increased risk of loss than a Fund that does not concentrate its investments. Investments in small- and mid-cap companies involve risks and volatility greater than investments in larger, more established companies. The Fund may invest significantly in issuers within a particular sector that may be negatively affected by similar market or other conditions, making the Fund more vulnerable to unfavorable developments in the sector. Investing in derivatives is a specialized activity that involves special risks that subject the Fund to significant loss potential, including when used as leverage, and may result in greater fluctuation in Fund value. See the Funds' prospectus for more information on these and other risks.
Annual Report 2015
6
COLUMBIA PACIFIC/ASIA FUND
UNDERSTANDING YOUR FUND'S EXPENSES
(Unaudited)
As an investor, you incur two types of costs. There are transaction costs, which generally include sales charges on purchases and may include redemption fees. There are also ongoing costs, which generally include management fees, distribution and/or service fees, and other fund expenses. The following information is intended to help you understand your ongoing costs (in dollars) of investing in the Fund and to help you compare these costs with the ongoing costs of investing in other mutual funds.
Analyzing Your Fund's Expenses
To illustrate these ongoing costs, we have provided examples and calculated the expenses paid by investors in each share class of the Fund during the period. The actual and hypothetical information in the table is based on an initial investment of $1,000 at the beginning of the period indicated and held for the entire period. Expense information is calculated two ways and each method provides you with different information. The amount listed in the "Actual" column is calculated using the Fund's actual operating expenses and total return for the period. You may use the Actual information, together with the amount invested, to estimate the expenses that you paid over the period. Simply divide your account value by $1,000 (for example, an $8,600 account value divided by $1,000 = 8.6), then multiply the results by the expenses paid during the period under the "Actual" column. The amount listed in the "Hypothetical" column assumes a 5% annual rate of return before expenses (which is not the Fund's actual return) and then applies the Fund's actual expense ratio for the period to the hypothetical return. You should not use the hypothetical account values and expenses to estimate either your actual account balance at the end of the period or the expenses you paid during the period. See "Compare With Other Funds" below for details on how to use the hypothetical data.
Compare With Other Funds
Since all mutual funds are required to include the same hypothetical calculations about expenses in shareholder reports, you can use this information to compare the ongoing cost of investing in the Fund with other funds. To do so, compare the hypothetical example with the 5% hypothetical examples that appear in the shareholder reports of other funds. As you compare hypothetical examples of other funds, it is important to note that hypothetical examples are meant to highlight the ongoing costs of investing in a fund only and do not reflect any transaction costs, such as sales charges, or redemption or exchange fees. Therefore, the hypothetical calculations are useful in comparing ongoing costs only, and will not help you determine the relative total costs of owning different funds. If transaction costs were included in these calculations, your costs would be higher.
October 1, 2014 – March 31, 2015
| | | Account Value at the Beginning
of the Period ($) | | Account Value at the End of the
Period ($) | | Expenses Paid During the
Period ($) | | Fund's Annualized
Expense Ratio (%) | |
| | | Actual | | Hypothetical | | Actual | | Hypothetical | | Actual | | Hypothetical | | Actual | |
Class A | | | 1,000.00 | | | | 1,000.00 | | | | 1,082.90 | | | | 1,017.50 | | | | 7.74 | | | | 7.49 | | | | 1.49 | | |
Class C | | | 1,000.00 | | | | 1,000.00 | | | | 1,078.30 | | | | 1,013.81 | | | | 11.55 | | | | 11.20 | | | | 2.23 | | |
Class I | | | 1,000.00 | | | | 1,000.00 | | | | 1,084.90 | | | | 1,019.75 | | | | 5.41 | | | | 5.24 | | | | 1.04 | | |
Class R4 | | | 1,000.00 | | | | 1,000.00 | | | | 1,082.60 | | | | 1,018.65 | | | | 6.54 | | | | 6.34 | | | | 1.26 | | |
Class W | | | 1,000.00 | | | | 1,000.00 | | | | 1,082.60 | | | | 1,017.40 | | | | 7.84 | | | | 7.59 | | | | 1.51 | | |
Class Z | | | 1,000.00 | | | | 1,000.00 | | | | 1,083.40 | | | | 1,018.80 | | | | 6.39 | | | | 6.19 | | | | 1.23 | | |
Expenses paid during the period are equal to the annualized expense ratio for each class as indicated above, multiplied by the average account value over the period and then multiplied by the number of days in the Fund's most recent fiscal half year and divided by 365.
Expenses do not include fees and expenses incurred indirectly by the Fund from its investment in underlying funds, including affiliated and non-affiliated pooled investment vehicles, such as mutual funds and exchange-traded funds.
Annual Report 2015
7
COLUMBIA PACIFIC/ASIA FUND
PORTFOLIO OF INVESTMENTS
March 31, 2015
(Percentages represent value of investments compared to net assets)
Common Stocks 95.9%
Issuer | | Shares | | Value ($) | |
AUSTRALIA 10.5% | |
Amcor Ltd. | | | 274,876 | | | | 2,928,792 | | |
Australia and New Zealand Banking
Group Ltd. | | | 103,881 | | | | 2,889,989 | | |
BHP Billiton Ltd. | | | 132,875 | | | | 3,088,551 | | |
Commonwealth Bank of Australia | | | 63,492 | | | | 4,503,529 | | |
CSL Ltd. | | | 22,397 | | | | 1,566,947 | | |
Macquarie Group Ltd. | | | 69,166 | | | | 4,020,372 | | |
Scentre Group | | | 342,653 | | | | 973,421 | | |
Telstra Corp., Ltd. | | | 900,206 | | | | 4,321,401 | | |
Westpac Banking Corp. | | | 102,210 | | | | 3,055,166 | | |
Total | | | | | 27,348,168 | | |
CHINA 16.3% | |
Baidu, Inc., ADR(a) | | | 7,453 | | | | 1,553,205 | | |
China Biologic Products, Inc.(a) | | | 25,785 | | | | 2,462,725 | | |
China Mobile Ltd. | | | 316,500 | | | | 4,124,753 | | |
Chongqing Changan Automobile Co.,
Ltd., Class B(b)(c) | | | 465,200 | | | | 1,351,319 | | |
CNOOC Ltd. | | | 1,866,000 | | | | 2,633,533 | | |
CSPC Pharmaceutical Group Ltd. | | | 1,232,000 | | | | 1,042,472 | | |
Daqin Railway Co., Ltd., Class A | | | 981,800 | | | | 1,746,766 | | |
Guangdong Investment Ltd. | | | 2,376,000 | | | | 3,115,815 | | |
Haitong Securities Co., Ltd., Class H | | | 615,200 | | | | 1,501,200 | | |
Industrial & Commercial Bank of China
Ltd., Class H | | | 6,398,100 | | | | 4,732,561 | | |
Luthai Textile Co., Ltd., Class B | | | 1,011,720 | | | | 1,472,039 | | |
Pax Global Technology Ltd.(a) | | | 1,771,000 | | | | 1,852,226 | | |
Ping An Insurance Group Co. of China
Ltd., Class H | | | 210,000 | | | | 2,519,293 | | |
Tencent Holdings Ltd. | | | 255,600 | | | | 4,853,823 | | |
Vipshop Holdings Ltd., ADS(a) | | | 59,896 | | | | 1,763,338 | | |
WuXi PharmaTech (Cayman), Inc. ADR(a) | | | 72,806 | | | | 2,823,417 | | |
Zhuzhou CSR Times Electric Co., Ltd.,
Class H | | | 425,000 | | | | 2,795,620 | | |
Total | | | | | 42,344,105 | | |
HONG KONG 4.4% | |
AIA Group Ltd. | | | 439,000 | | | | 2,756,255 | | |
CK Hutchison Holdings Ltd. | | | 223,000 | | | | 4,556,007 | | |
Hutchison Whampoa Ltd. | | | 131,000 | | | | 1,815,772 | | |
Jardine Matheson Holdings Ltd. | | | 24,500 | | | | 1,548,185 | | |
Common Stocks (continued)
Issuer | | Shares | | Value ($) | |
Sands China Ltd. | | | 216,400 | | | | 894,865 | | |
Total | | | | | 11,571,084 | | |
INDIA 7.1% | |
Asian Paints Ltd. | | | 150,625 | | | | 1,954,119 | | |
Eicher Motors Ltd. | | | 3,756 | | | | 955,479 | | |
HCL Technologies Ltd. | | | 175,822 | | | | 2,746,640 | | |
HDFC Bank Ltd., ADR | | | 55,185 | | | | 3,249,845 | | |
Lupin Ltd. | | | 92,359 | | | | 2,967,013 | | |
Motherson Sumi Systems Ltd. | | | 376,267 | | | | 3,092,665 | | |
Tata Motors Ltd. | | | 225,324 | | | | 1,966,609 | | |
UPL Ltd. | | | 240,098 | | | | 1,696,282 | | |
Total | | | | | 18,628,652 | | |
INDONESIA 2.1% | |
PT Bank Rakyat Indonesia Persero Tbk | | | 3,087,700 | | | | 3,131,901 | | |
PT Matahari Department Store Tbk | | | 1,629,500 | | | | 2,450,466 | | |
PT Mitra Keluarga Karyasehat Tbk(a) | | | 9,100 | | | | 15,486 | | |
Total | | | | | 5,597,853 | | |
JAPAN 38.6% | |
Alps Electric Co., Ltd. | | | 138,100 | | | | 3,325,355 | | |
Aozora Bank Ltd. | | | 762,000 | | | | 2,700,955 | | |
Astellas Pharma, Inc. | | | 308,800 | | | | 5,059,657 | | |
Central Japan Railway Co. | | | 26,200 | | | | 4,734,855 | | |
CYBERDYNE, Inc.(a) | | | 22,000 | | | | 572,836 | | |
Daiichikosho Co., Ltd. | | | 93,600 | | | | 2,907,491 | | |
Daikin Industries Ltd. | | | 43,000 | | | | 2,874,724 | | |
FANUC Corp. | | | 8,200 | | | | 1,790,173 | | |
Fuji Heavy Industries Ltd. | | | 92,900 | | | | 3,083,930 | | |
Hoshizaki Electric Co., Ltd. | | | 47,100 | | | | 3,058,616 | | |
Hoya Corp. | | | 96,200 | | | | 3,851,303 | | |
Invincible Investment Corp. | | | 2,335 | | | | 1,195,625 | | |
Kao Corp. | | | 24,400 | | | | 1,218,391 | | |
KDDI Corp. | | | 234,600 | | | | 5,300,208 | | |
Kenedix Retail REIT Corp.(a) | | | 290 | | | | 672,923 | | |
Keyence Corp. | | | 7,700 | | | | 4,201,866 | | |
M3, Inc. | | | 134,100 | | | | 2,844,914 | | |
Mitsubishi UFJ Financial Group, Inc. | | | 613,700 | | | | 3,800,898 | | |
Mitsui Fudosan Co., Ltd. | | | 34,000 | | | | 998,513 | | |
Nakanishi, Inc. | | | 24,100 | | | | 940,477 | | |
Nidec Corp. | | | 33,400 | | | | 2,217,149 | | |
The accompanying Notes to Financial Statements are an integral part of this statement.
Annual Report 2015
8
COLUMBIA PACIFIC/ASIA FUND
PORTFOLIO OF INVESTMENTS (continued)
March 31, 2015
Common Stocks (continued)
Issuer | | Shares | | Value ($) | |
Nihon M&A Center, Inc. | | | 80,300 | | | | 2,767,198 | | |
Nishi-Nippon City Bank Ltd. (The) | | | 449,000 | | | | 1,301,448 | | |
Omron Corp. | | | 76,500 | | | | 3,446,260 | | |
ORIX Corp. | | | 320,890 | | | | 4,508,867 | | |
PeptiDream, Inc.(a) | | | 9,600 | | | | 710,513 | | |
San-A Co., Ltd. | | | 75,100 | | | | 2,847,922 | | |
Seiko Epson Corp. | | | 85,800 | | | | 1,519,634 | | |
Shimano, Inc. | | | 5,300 | | | | 787,592 | | |
Shinmaywa Industries Ltd. | | | 257,000 | | | | 2,724,374 | | |
SoftBank Corp. | | | 15,900 | | | | 926,007 | | |
Sumitomo Mitsui Financial Group, Inc. | | | 85,500 | | | | 3,275,042 | | |
Sysmex Corp. | | | 24,900 | | | | 1,380,627 | | |
Tanseisha Co., Ltd. | | | 116,300 | | | | 832,591 | | |
Temp Holdings Co., Ltd. | | | 50,200 | | | | 1,732,090 | | |
Tokai Tokyo Financial Holdings, Inc. | | | 401,900 | | | | 3,095,983 | | |
Tokyo Gas Co., Ltd. | | | 588,000 | | | | 3,696,599 | | |
Toyota Motor Corp. | | | 108,700 | | | | 7,587,665 | | |
Total | | | | | 100,491,271 | | |
MALAYSIA 0.6% | |
Tenaga Nasional Bhd | | | 390,000 | | | | 1,509,994 | | |
PHILIPPINES 3.9% | |
GT Capital Holdings, Inc. | | | 135,115 | | | | 4,045,209 | | |
Metropolitan Bank & Trust Co. | | | 652,374 | | | | 1,421,213 | | |
Robinsons Retail Holdings, Inc. | | | 862,640 | | | | 1,621,068 | | |
Universal Robina Corp. | | | 259,220 | | | | 1,309,384 | | |
Vista Land & Lifescapes, Inc. | | | 9,216,950 | | | | 1,771,277 | | |
Total | | | | | 10,168,151 | | |
SINGAPORE 2.4% | |
DBS Group Holdings Ltd. | | | 302,600 | | | | 4,486,909 | | |
Frasers Centrepoint Ltd. | | | 1,386,900 | | | | 1,780,428 | | |
Total | | | | | 6,267,337 | | |
SOUTH KOREA 4.3% | |
Samsung Electronics Co., Ltd. | | | 5,989 | | | | 7,766,256 | | |
SK Telecom Co., Ltd. | | | 14,239 | | | | 3,503,741 | | |
Total | | | | | 11,269,997 | | |
TAIWAN 4.3% | |
Catcher Technology Co., Ltd. | | | 144,000 | | | | 1,505,984 | | |
Gigabyte Technology Co., Ltd. | | | 1,725,000 | | | | 2,133,868 | | |
Common Stocks (continued)
Issuer | | Shares | | Value ($) | |
Pegatron Corp. | | | 687,000 | | | | 1,853,557 | | |
Taiwan Semiconductor Manufacturing
Co., Ltd., ADR | | | 243,890 | | | | 5,726,537 | | |
Total | | | | | 11,219,946 | | |
THAILAND 1.4% | |
Bangkok Expressway PCL, Foreign
Registered Shares | | | 969,700 | | | | 1,161,128 | | |
Kasikornbank PCL, Foreign Registered
Shares | | | 335,800 | | | | 2,373,214 | | |
Total | | | | | 3,534,342 | | |
Total Common Stocks
(Cost: $183,176,629) | | | | | 249,950,900 | | |
Exchange-Traded Funds 2.5%
| | | Shares | | Value ($) | |
JAPAN 2.5% | |
WisdomTree Japan Hedged Equity Fund | | | 120,441 | | | | 6,638,708 | | |
Total Exchange-Traded Funds
(Cost: $6,380,872) | | | | | 6,638,708 | | |
Rights —%
Issuer | | Shares | | Value ($) | |
PHILIPPINES —% | |
GT Capital Holdings, Inc. Rights(a)(b)(d) | | | 135,115 | | | | — | | |
Total Rights
(Cost: $—) | | | | | — | | |
Money Market Funds 0.4%
| | Shares | | Value ($) | |
Columbia Short-Term Cash Fund,
0.123%(e)(f) | | | 943,243 | | | | 943,243 | | |
Total Money Market Funds
(Cost: $943,243) | | | | | 943,243 | | |
Total Investments
(Cost: $190,500,744) | | | | | 257,532,851 | | |
Other Assets & Liabilities, Net | | | | | 3,074,057 | | |
Net Assets | | | | | 260,606,908 | | |
The accompanying Notes to Financial Statements are an integral part of this statement.
Annual Report 2015
9
COLUMBIA PACIFIC/ASIA FUND
PORTFOLIO OF INVESTMENTS (continued)
March 31, 2015
Investments in Derivatives
Forward Foreign Currency Exchange Contracts Open at March 31, 2015
Counterparty | | Exchange Date | | Currency to
be Delivered | | Currency to
be Received | | Unrealized
Appreciation ($) | | Unrealized
Depreciation ($) | |
Morgan Stanley & Co.
| | 5/20/15
| | | 57,179,000
CNY | | | | 9,267,411
USD | | | | —
| | | | (5,123
| ) | |
Morgan Stanley & Co.
| | 5/20/15
| | | 13,936,360,000
IDR | | | | 1,053,311
USD | | | | 3,388
| | | | —
| | |
Morgan Stanley & Co.
| | 5/20/15
| | | 167,057,000
INR | | | | 2,633,390
USD | | | | —
| | | | (27,026
| ) | |
Morgan Stanley & Co.
| | 5/20/15
| | | 118,877,000
PHP | | | | 2,646,062
USD | | | | —
| | | | (9,281
| ) | |
Morgan Stanley & Co.
| | 5/20/15
| | | 17,277,000
THB | | | | 528,123
USD | | | | —
| | | | (1,699
| ) | |
Morgan Stanley & Co.
| | 5/20/15
| | | 3,442,272
USD | | | | 4,399,000
AUD | | | | —
| | | | (101,179
| ) | |
Morgan Stanley & Co.
| | 5/20/15
| | | 7,909,357
USD | | | | 8,757,311,000
KRW | | | | —
| | | | (27,698
| ) | |
Morgan Stanley & Co.
| | 5/20/15 | | | 5,306,122
| | | | 165,187,000
USDTWD | | | | —
| | | | (16,583
| ) | |
Total | | | | | | | | | 3,388 | | | | (188,589 | ) | |
Notes to Portfolio of Investments
(a) Non-income producing.
(b) Represents fair value as determined in good faith under procedures approved by the Board of Trustees. At March 31, 2015, the value of these securities amounted to $1,351,319, which represents 0.52% of net assets.
(c) Identifies securities considered by the Investment Manager to be illiquid as to their marketability. The aggregate value of such securities at March 31, 2015 was $1,351,319, which represents 0.52% of net assets. Information concerning such security holdings at March 31, 2015 is as follows:
Security Description | | Acquisition Dates | | Cost ($) | |
Chongqing Changan Automobile Co., Ltd., Class B | | 12/19/2014 | | | 1,016,356 | | |
(d) Negligible market value.
(e) The rate shown is the seven-day current annualized yield at March 31, 2015.
(f) As defined in the Investment Company Act of 1940, an affiliated company is one in which the Fund owns 5% or more of the company's outstanding voting securities, or a company which is under common ownership or control with the Fund. Holdings and transactions in these affiliated companies during the year ended March 31, 2015, are as follows:
Issuer | | Beginning
Cost ($) | | Purchase
Cost ($) | | Proceeds
From Sales ($) | | Ending
Cost ($) | | Dividends —
Affiliated
Issuers ($) | | Value ($) | |
Columbia Short-Term Cash Fund | | | 1,349,698 | | | | 108,517,901 | | | | (108,924,356 | ) | | | 943,243 | | | | 4,860 | | | | 943,243 | | |
Abbreviation Legend
ADR American Depositary Receipt
ADS American Depositary Share
The accompanying Notes to Financial Statements are an integral part of this statement.
Annual Report 2015
10
COLUMBIA PACIFIC/ASIA FUND
PORTFOLIO OF INVESTMENTS (continued)
March 31, 2015
AUD Australian Dollar
CNY China, Yuan Renminbi
IDR Indonesian Rupiah
INR Indian Rupee
KRW Korean Won
PHP Philippine Peso
THB Thailand Baht
TWD Taiwan Dollar
USD US Dollar
Fair Value Measurements
Generally accepted accounting principles (GAAP) require disclosure regarding the inputs and valuation techniques used to measure fair value and any changes in valuation inputs or techniques. In addition, investments shall be disclosed by major category.
The Fund categorizes its fair value measurements according to a three-level hierarchy that maximizes the use of observable inputs and minimizes the use of unobservable inputs by prioritizing that the most observable input be used when available. Observable inputs are those that market participants would use in pricing an investment based on market data obtained from sources independent of the reporting entity. Unobservable inputs are those that reflect the Fund's assumptions about the information market participants would use in pricing an investment. An investment's level within the fair value hierarchy is based on the lowest level of any input that is deemed significant to the asset or liability's fair value measurement. The input levels are not necessarily an indication of the risk or liquidity associated with investments at that level. For example, certain U.S. government securities are generally high quality and liquid, however, they are reflected as Level 2 because the inputs used to determine fair value may not always be quoted prices in an active market.
Fair value inputs are summarized in the three broad levels listed below:
> Level 1 — Valuations based on quoted prices for investments in active markets that the Fund has the ability to access at the measurement date (including NAV for open-end mutual funds). Valuation adjustments are not applied to Level 1 investments.
> Level 2 — Valuations based on other significant observable inputs (including quoted prices for similar securities, interest rates, prepayment speeds, credit risks, etc.).
> Level 3 — Valuations based on significant unobservable inputs (including the Fund's own assumptions and judgment in determining the fair value of investments).
Inputs that are used in determining fair value of an investment may include price information, credit data, volatility statistics, and other factors. These inputs can be either observable or unobservable. The availability of observable inputs can vary between investments, and is affected by various factors such as the type of investment, and the volume and level of activity for that investment or similar investments in the marketplace. The inputs will be considered by the Investment Manager, along with any other relevant factors in the calculation of an investment's fair value. The Fund uses prices and inputs that are current as of the measurement date, which may include periods of market dislocations. During these periods, the availability of prices and inputs may be reduced for many investments. This condition could cause an investment to be reclassified between the various levels within the hierarchy.
Foreign equity securities actively traded in markets where there is a significant delay in the local close relative to the New York Stock Exchange (NYSE) are classified as Level 2. The values of these securities may include an adjustment to reflect the impact of significant market movements following the close of local trading, as described in Note 2 to the financial statements — Security Valuation.
Investments falling into the Level 3 category are primarily supported by quoted prices from brokers and dealers participating in the market for those investments. However, these may be classified as Level 3 investments due to lack of market transparency and corroboration to support these quoted prices. Additionally, valuation models may be used as the pricing source for any remaining investments classified as Level 3. These models may rely on one or more significant unobservable inputs and/or significant assumptions by the Investment Manager. Inputs used in valuations may include, but are not limited to, financial statement analysis, capital account balances, discount rates and estimated cash flows, and comparable company data.
Under the direction of the Fund's Board of Trustees (the Board), the Investment Manager's Valuation Committee (the Committee) is responsible for overseeing the valuation procedures approved by the Board. The Committee consists of voting and non-voting members from various groups within the Investment Manager's organization, including operations and accounting, trading and investments, compliance, risk management and legal.
The accompanying Notes to Financial Statements are an integral part of this statement.
Annual Report 2015
11
COLUMBIA PACIFIC/ASIA FUND
PORTFOLIO OF INVESTMENTS (continued)
March 31, 2015
Fair Value Measurements (continued)
The Committee meets at least monthly to review and approve valuation matters, which may include a description of specific valuation determinations, data regarding pricing information received from approved pricing vendors and brokers and the results of Board-approved valuation control policies and procedures (the Policies). The Policies address, among other things, instances when market quotations are or are not readily available, including recommendations of third party pricing vendors and a determination of appropriate pricing methodologies; events that require specific valuation determinations and assessment of fair value techniques; securities with a potential for stale pricing, including those that are illiquid, restricted, or in default; and the effectiveness of third party pricing vendors, including periodic reviews of vendors. The Committee meets more frequently, as needed, to discuss additional valuation matters, which may include the need to review back-testing results, review time-sensitive information or approve related valuation actions. The Committee reports to the Board, with members of the Committee meeting with the Board at each of its regularly scheduled meetings to discuss valuation matters and actions during the period, similar to those described earlier.
For investments categorized as Level 3, the Committee monitors information similar to that described above, which may include: (i) data specific to the issuer or comparable issuers, (ii) general market or specific sector news and (iii) quoted prices and specific or similar security transactions. The Committee considers this data and any changes from prior periods in order to assess the reasonableness of observable and unobservable inputs, any assumptions or internal models used to value those securities and changes in fair value. This data is also used to corroborate, when available, information received from approved pricing vendors and brokers. Various factors impact the frequency of monitoring this information (which may occur as often as daily). However, the Committee may determine that changes to inputs, assumptions and models are not required as a result of the monitoring procedures performed.
The following table is a summary of the inputs used to value the Fund's investments at March 31, 2015:
Description | | Level 1
Quoted Prices in Active
Markets for Identical
Assets ($) | | Level 2
Other Significant
Observable Inputs ($) | | Level 3
Significant
Unobservable Inputs ($) | | Total ($) | |
Equity Securities | |
Common Stocks | |
Consumer Discretionary | | | 1,763,338 | | | | 24,243,323 | | | | 1,351,319 | | | | 27,357,980 | | |
Consumer Staples | | | — | | | | 6,996,765 | | | | — | | | | 6,996,765 | | |
Energy | | | — | | | | 2,633,533 | | | | — | | | | 2,633,533 | | |
Financials | | | 3,249,845 | | | | 72,068,196 | | | | — | | | | 75,318,041 | | |
Health Care | | | 5,286,142 | | | | 17,100,943 | | | | — | | | | 22,387,085 | | |
Industrials | | | — | | | | 32,754,720 | | | | — | | | | 32,754,720 | | |
Information Technology | | | 7,279,742 | | | | 39,056,772 | | | | — | | | | 46,336,514 | | |
Materials | | | — | | | | 9,667,745 | | | | — | | | | 9,667,745 | | |
Telecommunication Services | | | — | | | | 18,176,109 | | | | — | | | | 18,176,109 | | |
Utilities | | | — | | | | 8,322,408 | | | | — | | | | 8,322,408 | | |
Exchange-Traded Funds | | | 6,638,708 | | | | — | | | | — | | | | 6,638,708 | | |
Rights | |
Financials | | | — | | | | — | | | | 0 | (a) | | | 0 | (a) | |
Total Equity Securities | | | 24,217,775 | | | | 231,020,514 | | | | 1,351,319 | | | | 256,589,608 | | |
Mutual Funds | |
Money Market Funds | | | 943,243 | | | | — | | | | — | | | | 943,243 | | |
Total Mutual Funds | | | 943,243 | | | | — | | | | — | | | | 943,243 | | |
The accompanying Notes to Financial Statements are an integral part of this statement.
Annual Report 2015
12
COLUMBIA PACIFIC/ASIA FUND
PORTFOLIO OF INVESTMENTS (continued)
March 31, 2015
Fair Value Measurements (continued)
Description | | Level 1
Quoted Prices in Active
Markets for Identical
Assets ($) | | Level 2
Other Significant
Observable Inputs ($) | | Level 3
Significant
Unobservable Inputs ($) | | Total ($) | |
Investments in Securities | | | 25,161,018 | | | | 231,020,514 | | | | 1,351,319 | | | | 257,532,851 | | |
Derivatives | |
Assets | |
Forward Foreign Currency
Exchange Contracts | | | — | | | | 3,388 | | | | — | | | | 3,388 | | |
Liabilities | |
Forward Foreign Currency
Exchange Contracts | | | — | | | | (188,589 | ) | | | — | | | | (188,589 | ) | |
Total | | | 25,161,018 | | | | 230,835,313 | | | | 1,351,319 | | | | 257,347,650 | | |
(a) Rounds to zero.
See the Portfolio of Investments for all investment classifications not indicated in the table.
The Fund's assets assigned to the Level 2 input category are generally valued using the market approach, in which a security's value is determined through reference to prices and information from market transactions for similar or identical assets. These assets include certain foreign securities for which a third party statistical pricing service may be employed for purposes of fair market valuation. The model utilized by such third party statistical pricing service takes into account a security's correlation to available market data including, but not limited to, intraday index, ADR, and ETF movements.
There were no transfers of financial assets between levels during the period.
Derivative instruments are valued at unrealized appreciation (depreciation).
The Fund does not hold any significant investments (greater than one percent of net assets) categorized as Level 3.
The Fund's assets assigned to the Level 3 category are valued utilizing the valuation technique deemed the most appropriate in the circumstances.
Certain common stocks classified as Level 3 securities are valued using the market approach. To determine fair value for these securities, management considered various factors which may have included, but were not limited to, the halt price of the security, the movement in observed market prices for other securities from the issuer, the movement in certain foreign or domestic market indices, and the position of the security within the respective company's capital structure. Significant increases (decreases) to any of these inputs would result in a significantly lower (higher) fair value measurement.
Certain rights classified as Level 3 are valued using an income approach. To determine fair value for these securities, management considered estimates of future distributions from the company assets or potential actions related to the respective company's restructuring. Significant increases (decreases) to any of these inputs would result in a significantly lower (higher) fair value measurement.
Transfers in and/or out of Level 3 are determined based on the fair value at the beginning of the period for security positions held throughout the period.
The accompanying Notes to Financial Statements are an integral part of this statement.
Annual Report 2015
13
COLUMBIA PACIFIC/ASIA FUND
STATEMENT OF ASSETS AND LIABILITIES
March 31, 2015
Assets | |
Investments, at value | |
Unaffiliated issuers (identified cost $189,557,501) | | $ | 256,589,608 | | |
Affiliated issuers (identified cost $943,243) | | | 943,243 | | |
Total investments (identified cost $190,500,744) | | | 257,532,851 | | |
Cash | | | 84,817 | | |
Unrealized appreciation on forward foreign currency exchange contracts | | | 3,388 | | |
Receivable for: | |
Investments sold | | | 2,522,756 | | |
Capital shares sold | | | 97,642 | | |
Dividends | | | 1,252,103 | | |
Reclaims | | | 55,887 | | |
Prepaid expenses | | | 871 | | |
Trustees' deferred compensation plan | | | 20,190 | | |
Total assets | | | 261,570,505 | | |
Liabilities | |
Foreign currency (cost $81,808) | | | 81,681 | | |
Unrealized depreciation on forward foreign currency exchange contracts | | | 188,589 | | |
Payable for: | |
Investments purchased | | | 560,627 | | |
Capital shares purchased | | | 39,612 | | |
Investment management fees | | | 6,260 | | |
Distribution and/or service fees | | | 26 | | |
Transfer agent fees | | | 8,958 | | |
Administration fees | | | 576 | | |
Compensation of board members | | | 1,029 | | |
Chief compliance officer expenses | | | 33 | | |
Other expenses | | | 55,801 | | |
Trustees' deferred compensation plan | | | 20,190 | | |
Other liabilities | | | 215 | | |
Total liabilities | | | 963,597 | | |
Net assets applicable to outstanding capital stock | | $ | 260,606,908 | | |
Represented by | |
Paid-in capital | | $ | 205,829,375 | | |
Excess of distributions over net investment income | | | (1,593,030 | ) | |
Accumulated net realized loss | | | (10,467,321 | ) | |
Unrealized appreciation (depreciation) on: | |
Investments | | | 67,032,107 | | |
Foreign currency translations | | | (9,022 | ) | |
Forward foreign currency exchange contracts | | | (185,201 | ) | |
Total — representing net assets applicable to outstanding capital stock | | $ | 260,606,908 | | |
The accompanying Notes to Financial Statements are an integral part of this statement.
Annual Report 2015
14
COLUMBIA PACIFIC/ASIA FUND
STATEMENT OF ASSETS AND LIABILITIES (continued)
March 31, 2015
Class A | |
Net assets | | $ | 2,495,833 | | |
Shares outstanding | | | 251,832 | | |
Net asset value per share | | $ | 9.91 | | |
Maximum offering price per share(a) | | $ | 10.51 | | |
Class C | |
Net assets | | $ | 368,323 | | |
Shares outstanding | | | 37,474 | | |
Net asset value per share | | $ | 9.83 | | |
Class I | |
Net assets | | $ | 179,478,851 | | |
Shares outstanding | | | 18,044,080 | | |
Net asset value per share | | $ | 9.95 | | |
Class R4 | |
Net assets | | $ | 25,120 | | |
Shares outstanding | | | 2,521 | | |
Net asset value per share | | $ | 9.96 | | |
Class W | |
Net assets | | $ | 2,731 | | |
Shares outstanding | | | 276 | | |
Net asset value per share(b) | | $ | 9.91 | | |
Class Z | |
Net assets | | $ | 78,236,050 | | |
Shares outstanding | | | 7,860,164 | | |
Net asset value per share | | $ | 9.95 | | |
(a) The maximum offering price per share is calculated by dividing the net asset value per share by 1.0 minus the maximum sales charge of 5.75%.
(b) Net asset value per share rounds to this amount due to fractional shares outstanding.
The accompanying Notes to Financial Statements are an integral part of this statement.
Annual Report 2015
15
COLUMBIA PACIFIC/ASIA FUND
STATEMENT OF OPERATIONS
Year Ended March 31, 2015
Net investment income | |
Income: | |
Dividends — unaffiliated issuers | | $ | 7,209,654 | | |
Dividends — affiliated issuers | | | 4,860 | | |
Foreign taxes withheld | | | (499,066 | ) | |
Total income | | | 6,715,448 | | |
Expenses: | |
Investment management fees | | | 2,337,343 | | |
Distribution and/or service fees | |
Class A | | | 5,076 | | |
Class C | | | 4,127 | | |
Class W | | | 6 | | |
Transfer agent fees | |
Class A | | | 3,765 | | |
Class C | | | 771 | | |
Class R4 | | | 19 | | |
Class W | | | 4 | | |
Class Z | | | 142,741 | | |
Administration fees | | | 214,928 | | |
Compensation of board members | | | 25,384 | | |
Custodian fees | | | 75,797 | | |
Printing and postage fees | | | 25,352 | | |
Registration fees | | | 67,388 | | |
Professional fees | | | 48,504 | | |
Chief compliance officer expenses | | | 131 | | |
Other | | | 10,933 | | |
Total expenses | | | 2,962,269 | | |
Expense reductions | | | (540 | ) | |
Total net expenses | | | 2,961,729 | | |
Net investment income | | | 3,753,719 | | |
Realized and unrealized gain (loss) — net | |
Net realized gain (loss) on: | |
Investments | | | 12,289,088 | | |
Foreign currency translations | | | (149,988 | ) | |
Forward foreign currency exchange contracts | | | (618,837 | ) | |
Net realized gain | | | 11,520,263 | | |
Net change in unrealized appreciation (depreciation) on: | |
Investments | | | 18,131,993 | | |
Foreign currency translations | | | (7,946 | ) | |
Forward foreign currency exchange contracts | | | (524,664 | ) | |
Net change in unrealized appreciation | | | 17,599,383 | | |
Net realized and unrealized gain | | | 29,119,646 | | |
Net increase in net assets resulting from operations | | $ | 32,873,365 | | |
The accompanying Notes to Financial Statements are an integral part of this statement.
Annual Report 2015
16
COLUMBIA PACIFIC/ASIA FUND
STATEMENT OF CHANGES IN NET ASSETS
| | | Year Ended
March 31,
2015 | | Year Ended
March 31,
2014 | |
Operations | |
Net investment income | | $ | 3,753,719 | | | $ | 4,450,069 | | |
Net realized gain | | | 11,520,263 | | | | 14,754,585 | | |
Net change in unrealized appreciation (depreciation) | | | 17,599,383 | | | | (10,866,018 | ) | |
Net increase in net assets resulting from operations | | | 32,873,365 | | | | 8,338,636 | | |
Distributions to shareholders | |
Net investment income | |
Class A | | | (15,790 | ) | | | (41,635 | ) | |
Class C | | | (1,281 | ) | | | (8,474 | ) | |
Class I | | | (2,495,808 | ) | | | (6,312,506 | ) | |
Class R4 | | | (178 | ) | | | (64 | ) | |
Class W | | | (23 | ) | | | (67 | ) | |
Class Z | | | (916,575 | ) | | | (1,617,068 | ) | |
Total distributions to shareholders | | | (3,429,655 | ) | | | (7,979,814 | ) | |
Decrease in net assets from capital stock activity | | | (39,789,913 | ) | | | (39,945,441 | ) | |
Total decrease in net assets | | | (10,346,203 | ) | | | (39,586,619 | ) | |
Net assets at beginning of year | | | 270,953,111 | | | | 310,539,730 | | |
Net assets at end of year | | $ | 260,606,908 | | | $ | 270,953,111 | | |
Excess of distributions over net investment income | | $ | (1,593,030 | ) | | $ | (1,949,045 | ) | |
The accompanying Notes to Financial Statements are an integral part of this statement.
Annual Report 2015
17
COLUMBIA PACIFIC/ASIA FUND
STATEMENT OF CHANGES IN NET ASSETS (continued)
| | | Year Ended March 31, 2015 | | Year Ended March 31, 2014 | |
| | | Shares | | Dollars ($) | | Shares | | Dollars ($) | |
Capital stock activity | |
Class A shares | |
Subscriptions | | | 350,646 | | | | 3,326,346 | | | | 229,464 | | | | 2,112,675 | | |
Distributions reinvested | | | 1,772 | | | | 15,790 | | | | 4,809 | | | | 41,146 | | |
Redemptions | | | (307,679 | ) | | | (2,918,278 | ) | | | (354,645 | ) | | | (3,126,969 | ) | |
Net increase (decrease) | | | 44,739 | | | | 423,858 | | | | (120,372 | ) | | | (973,148 | ) | |
Class C shares | |
Subscriptions | | | 13,286 | | | | 123,405 | | | | 12,006 | | | | 106,788 | | |
Distributions reinvested | | | 145 | | | | 1,281 | | | | 1,003 | | | | 8,474 | | |
Redemptions | | | (38,563 | ) | | | (362,350 | ) | | | (8,104 | ) | | | (72,163 | ) | |
Net increase (decrease) | | | (25,132 | ) | | | (237,664 | ) | | | 4,905 | | | | 43,099 | | |
Class I shares | |
Subscriptions | | | 471,328 | | | | 4,344,150 | | | | 1,738,160 | | | | 15,420,392 | | |
Distributions reinvested | | | 278,557 | | | | 2,495,774 | | | | 735,318 | | | | 6,312,430 | | |
Redemptions | | | (4,329,372 | ) | | | (41,302,736 | ) | | | (9,435,174 | ) | | | (84,664,229 | ) | |
Net decrease | | | (3,579,487 | ) | | | (34,462,812 | ) | | | (6,961,696 | ) | | | (62,931,407 | ) | |
Class R4 shares | |
Subscriptions | | | 3,018 | | | | 28,580 | | | | — | | | | — | | |
Distributions reinvested | | | 17 | | | | 150 | | | | — | | | | — | | |
Redemptions | | | (798 | ) | | | (7,790 | ) | | | — | | | | — | | |
Net increase | | | 2,237 | | | | 20,940 | | | | — | | | | — | | |
Class W shares | |
Redemptions | | | (55 | ) | | | (500 | ) | | | — | | | | — | | |
Net decrease | | | (55 | ) | | | (500 | ) | | | — | | | | — | | |
Class Z shares | |
Subscriptions | | | 2,786,665 | | | | 26,300,397 | | | | 3,785,196 | | | | 33,589,323 | | |
Distributions reinvested | | | 71,036 | | | | 636,281 | | | | 130,682 | | | | 1,125,559 | | |
Redemptions | | | (3,382,900 | ) | | | (32,470,413 | ) | | | (1,221,543 | ) | | | (10,798,867 | ) | |
Net increase (decrease) | | | (525,199 | ) | | | (5,533,735 | ) | | | 2,694,335 | | | | 23,916,015 | | |
Total net decrease | | | (4,082,897 | ) | | | (39,789,913 | ) | | | (4,382,828 | ) | | | (39,945,441 | ) | |
The accompanying Notes to Financial Statements are an integral part of this statement.
Annual Report 2015
18
COLUMBIA PACIFIC/ASIA FUND
The following tables are intended to help you understand the Fund's financial performance. Certain information reflects financial results for a single share of a class held for the periods shown. Per share net investment income (loss) amounts are calculated based on average shares outstanding during the period. Total return assumes reinvestment of all dividends and distributions, if any. Total return does not reflect payment of sales charges, if any. Total return and portfolio turnover are not annualized for periods of less than one year. The portfolio turnover rate is calculated without regard to purchase and sales transactions of short-term instruments and certain derivatives, if any. If such transactions were included, the Fund's portfolio turnover rate may be higher.
| | | Year Ended March 31, | |
Class A | | 2015 | | 2014 | | 2013 | | 2012 | | 2011 | |
Per share data | |
Net asset value, beginning of period | | $ | 8.92 | | | $ | 8.93 | | | $ | 8.09 | | | $ | 8.56 | | | $ | 7.64 | | |
Income from investment operations: | |
Net investment income | | | 0.10 | | | | 0.11 | | | | 0.13 | | | | 0.13 | | | | 0.08 | | |
Net realized and unrealized gain (loss) | | | 0.98 | | | | 0.08 | | | | 0.88 | | | | (0.50 | )(a) | | | 0.98 | | |
Total from investment operations | | | 1.08 | | | | 0.19 | | | | 1.01 | | | | (0.37 | ) | | | 1.06 | | |
Less distributions to shareholders: | |
Net investment income | | | (0.09 | ) | | | (0.20 | ) | | | (0.17 | ) | | | (0.10 | ) | | | (0.14 | ) | |
Total distributions to shareholders | | | (0.09 | ) | | | (0.20 | ) | | | (0.17 | ) | | | (0.10 | ) | | | (0.14 | ) | |
Proceeds from regulatory settlements | | | — | | | | — | | | | — | | | | 0.00 | (b) | | | — | | |
Net asset value, end of period | | $ | 9.91 | | | $ | 8.92 | | | $ | 8.93 | | | $ | 8.09 | | | $ | 8.56 | | |
Total return | | | 12.17 | % | | | 2.25 | % | | | 12.74 | % | | | (4.28 | %) | | | 14.26 | % | |
Ratios to average net assets(c) | |
Total gross expenses | | | 1.48 | % | | | 1.48 | % | | | 1.53 | % | | | 1.60 | % | | | 1.88 | %(d) | |
Total net expenses(e) | | | 1.48 | %(f) | | | 1.48 | %(f) | | | 1.52 | %(f) | | | 1.60 | %(f) | | | 1.65 | %(d) | |
Net investment income | | | 1.03 | % | | | 1.20 | % | | | 1.56 | % | | | 1.64 | % | | | 1.01 | % | |
Supplemental data | |
Net assets, end of period (in thousands) | | $ | 2,496 | | | $ | 1,847 | | | $ | 2,924 | | | $ | 1,675 | | | $ | 1,394 | | |
Portfolio turnover | | | 60 | % | | | 88 | % | | | 78 | % | | | 94 | % | | | 63 | % | |
Notes to Financial Highlights
(a) Calculation of the net gain (loss) per share (both realized and unrealized) does not correlate to the aggregate realized and unrealized gain (loss) presented in the Statement of Operations due to the timing of subscriptions and redemptions of Fund shares in relation to fluctuations in the market value of the portfolio.
(b) Rounds to zero.
(c) In addition to the fees and expenses that the Fund bears directly, the Fund indirectly bears a pro rata share of the fees and expenses of any other funds in which it invests. Such indirect expenses are not included in the Fund's reported expense ratios.
(d) Ratios include line of credit interest expense which is less than 0.01%.
(e) Total net expenses include the impact of certain fee waivers/expense reimbursements made by the Investment Manager and certain of its affiliates, if applicable.
(f) The benefits derived from expense reductions had an impact of less than 0.01%.
The accompanying Notes to Financial Statements are an integral part of this statement.
Annual Report 2015
19
COLUMBIA PACIFIC/ASIA FUND
FINANCIAL HIGHLIGHTS (continued)
| | | Year Ended March 31, | |
Class C | | 2015 | | 2014 | | 2013 | | 2012 | | 2011 | |
Per share data | |
Net asset value, beginning of period | | $ | 8.86 | | | $ | 8.87 | | | $ | 8.04 | | | $ | 8.47 | | | $ | 7.56 | | |
Income from investment operations: | |
Net investment income | | | 0.03 | | | | 0.03 | | | | 0.07 | | | | 0.07 | | | | 0.00 | (a) | |
Net realized and unrealized gain (loss) | | | 0.97 | | | | 0.09 | | | | 0.87 | | | | (0.49 | )(b) | | | 1.00 | | |
Total from investment operations | | | 1.00 | | | | 0.12 | | | | 0.94 | | | | (0.42 | ) | | | 1.00 | | |
Less distributions to shareholders: | |
Net investment income | | | (0.03 | ) | | | (0.13 | ) | | | (0.11 | ) | | | (0.01 | ) | | | (0.09 | ) | |
Total distributions to shareholders | | | (0.03 | ) | | | (0.13 | ) | | | (0.11 | ) | | | (0.01 | ) | | | (0.09 | ) | |
Proceeds from regulatory settlements | | | — | | | | — | | | | — | | | | 0.00 | (a) | | | — | | |
Net asset value, end of period | | $ | 9.83 | | | $ | 8.86 | | | $ | 8.87 | | | $ | 8.04 | | | $ | 8.47 | | |
Total return | | | 11.36 | % | | | 1.48 | % | | | 11.88 | % | | | (4.91 | %) | | | 13.46 | % | |
Ratios to average net assets(c) | |
Total gross expenses | | | 2.23 | % | | | 2.23 | % | | | 2.28 | % | | | 2.32 | % | | | 2.69 | %(d) | |
Total net expenses(e) | | | 2.23 | %(f) | | | 2.23 | %(f) | | | 2.27 | %(f) | | | 2.32 | %(f) | | | 2.40 | %(d) | |
Net investment income (loss) | | | 0.33 | % | | | 0.31 | % | | | 0.93 | % | | | 0.92 | % | | | (0.01 | %) | |
Supplemental data | |
Net assets, end of period (in thousands) | | $ | 368 | | | $ | 554 | | | $ | 512 | | | $ | 300 | | | $ | 97 | | |
Portfolio turnover | | | 60 | % | | | 88 | % | | | 78 | % | | | 94 | % | | | 63 | % | |
Notes to Financial Highlights
(a) Rounds to zero.
(b) Calculation of the net gain (loss) per share (both realized and unrealized) does not correlate to the aggregate realized and unrealized gain (loss) presented in the Statement of Operations due to the timing of subscriptions and redemptions of Fund shares in relation to fluctuations in the market value of the portfolio.
(c) In addition to the fees and expenses that the Fund bears directly, the Fund indirectly bears a pro rata share of the fees and expenses of any other funds in which it invests. Such indirect expenses are not included in the Fund's reported expense ratios.
(d) Ratios include line of credit interest expense which is less than 0.01%.
(e) Total net expenses include the impact of certain fee waivers/expense reimbursements made by the Investment Manager and certain of its affiliates, if applicable.
(f) The benefits derived from expense reductions had an impact of less than 0.01%.
The accompanying Notes to Financial Statements are an integral part of this statement.
Annual Report 2015
20
COLUMBIA PACIFIC/ASIA FUND
FINANCIAL HIGHLIGHTS (continued)
| | | Year Ended March 31, | |
Class I | | 2015 | | 2014 | | 2013 | | 2012 | | 2011(a) | |
Per share data | |
Net asset value, beginning of period | | $ | 8.95 | | | $ | 8.96 | | | $ | 8.12 | | | $ | 8.61 | | | $ | 7.89 | | |
Income from investment operations: | |
Net investment income | | | 0.14 | | | | 0.14 | | | | 0.16 | | | | 0.16 | | | | 0.08 | | |
Net realized and unrealized gain (loss) | | | 0.98 | | | | 0.09 | | | | 0.89 | | | | (0.49 | )(b) | | | 0.64 | | |
Total from investment operations | | | 1.12 | | | | 0.23 | | | | 1.05 | | | | (0.33 | ) | | | 0.72 | | |
Less distributions to shareholders: | |
Net investment income | | | (0.12 | ) | | | (0.24 | ) | | | (0.21 | ) | | | (0.16 | ) | | | — | | |
Total distributions to shareholders | | | (0.12 | ) | | | (0.24 | ) | | | (0.21 | ) | | | (0.16 | ) | | | — | | |
Proceeds from regulatory settlements | | | — | | | | — | | | | — | | | | 0.00 | (c) | | | — | | |
Net asset value, end of period | | $ | 9.95 | | | $ | 8.95 | | | $ | 8.96 | | | $ | 8.12 | | | $ | 8.61 | | |
Total return | | | 12.72 | % | | | 2.70 | % | | | 13.17 | % | | | (3.83 | %) | | | 9.13 | % | |
Ratios to average net assets(d) | |
Total gross expenses | | | 1.04 | % | | | 1.05 | % | | | 1.07 | % | | | 1.17 | % | | | 1.39 | %(e)(f) | |
Total net expenses(g) | | | 1.04 | % | | | 1.05 | % | | | 1.07 | % | | | 1.17 | % | | | 1.34 | %(e)(f) | |
Net investment income | | | 1.45 | % | | | 1.49 | % | | | 1.96 | % | | | 1.99 | % | | | 1.76 | %(e) | |
Supplemental data | |
Net assets, end of period (in thousands) | | $ | 179,479 | | | $ | 193,467 | | | $ | 256,086 | | | $ | 259,769 | | | $ | 80,449 | | |
Portfolio turnover | | | 60 | % | | | 88 | % | | | 78 | % | | | 94 | % | | | 63 | % | |
Notes to Financial Highlights
(a) Based on operations from September 27, 2010 (commencement of operations) through the stated period end.
(b) Calculation of the net gain (loss) per share (both realized and unrealized) does not correlate to the aggregate realized and unrealized gain (loss) presented in the Statement of Operations due to the timing of subscriptions and redemptions of Fund shares in relation to fluctuations in the market value of the portfolio.
(c) Rounds to zero.
(d) In addition to the fees and expenses that the Fund bears directly, the Fund indirectly bears a pro rata share of the fees and expenses of any other funds in which it invests. Such indirect expenses are not included in the Fund's reported expense ratios.
(e) Annualized.
(f) Ratios include line of credit interest expense which is less than 0.01%.
(g) Total net expenses include the impact of certain fee waivers/expense reimbursements made by the Investment Manager and certain of its affiliates, if applicable.
The accompanying Notes to Financial Statements are an integral part of this statement.
Annual Report 2015
21
COLUMBIA PACIFIC/ASIA FUND
FINANCIAL HIGHLIGHTS (continued)
| | | Year Ended March 31, | |
Class R4 | | 2015 | | 2014 | | 2013(a) | |
Per share data | |
Net asset value, beginning of period | | $ | 8.96 | | | $ | 8.98 | | | $ | 8.81 | | |
Income from investment operations: | |
Net investment income | | | 0.12 | | | | 0.12 | | | | 0.03 | | |
Net realized and unrealized gain | | | 0.98 | | | | 0.09 | | | | 0.14 | | |
Total from investment operations | | | 1.10 | | | | 0.21 | | | | 0.17 | | |
Less distributions to shareholders: | |
Net investment income | | | (0.10 | ) | | | (0.23 | ) | | | — | | |
Total distributions to shareholders | | | (0.10 | ) | | | (0.23 | ) | | | — | | |
Net asset value, end of period | | $ | 9.96 | | | $ | 8.96 | | | $ | 8.98 | | |
Total return | | | 12.42 | % | | | 2.41 | % | | | 1.93 | % | |
Ratios to average net assets(b) | |
Total gross expenses | | | 1.26 | % | | | 1.25 | % | | | 1.63 | %(c) | |
Total net expenses(d) | | | 1.26 | %(e) | | | 1.25 | %(e) | | | 1.14 | %(c) | |
Net investment income | | | 1.28 | % | | | 1.29 | % | | | 1.61 | %(c) | |
Supplemental data | |
Net assets, end of period (in thousands) | | $ | 25 | | | $ | 3 | | | $ | 3 | | |
Portfolio turnover | | | 60 | % | | | 88 | % | | | 78 | % | |
Notes to Financial Highlights
(a) Based on operations from March 19, 2013 (commencement of operations) through the stated period end.
(b) In addition to the fees and expenses that the Fund bears directly, the Fund indirectly bears a pro rata share of the fees and expenses of any other funds in which it invests. Such indirect expenses are not included in the Fund's reported expense ratios.
(c) Annualized.
(d) Total net expenses include the impact of certain fee waivers/expense reimbursements made by the Investment Manager and certain of its affiliates, if applicable.
(e) The benefits derived from expense reductions had an impact of less than 0.01%.
The accompanying Notes to Financial Statements are an integral part of this statement.
Annual Report 2015
22
COLUMBIA PACIFIC/ASIA FUND
FINANCIAL HIGHLIGHTS (continued)
| | | Year Ended March 31, | |
Class W | | 2015 | | 2014 | | 2013(a) | |
Per share data | |
Net asset value, beginning of period | | $ | 8.91 | | | $ | 8.92 | | | $ | 7.55 | | |
Income from investment operations: | |
Net investment income | | | 0.09 | | | | 0.10 | | | | 0.08 | | |
Net realized and unrealized gain | | | 0.99 | | | | 0.09 | | | | 1.46 | | |
Total from investment operations | | | 1.08 | | | | 0.19 | | | | 1.54 | | |
Less distributions to shareholders: | |
Net investment income | | | (0.08 | ) | | | (0.20 | ) | | | (0.17 | ) | |
Total distributions to shareholders | | | (0.08 | ) | | | (0.20 | ) | | | (0.17 | ) | |
Net asset value, end of period | | $ | 9.91 | | | $ | 8.91 | | | $ | 8.92 | | |
Total return | | | 12.27 | % | | | 2.25 | % | | | 20.67 | % | |
Ratios to average net assets(b) | |
Total gross expenses | | | 1.50 | % | | | 1.47 | % | | | 1.54 | %(c) | |
Total net expenses(d) | | | 1.50 | %(e) | | | 1.47 | %(e) | | | 1.54 | %(c)(e) | |
Net investment income | | | 1.00 | % | | | 1.07 | % | | | 1.31 | %(c) | |
Supplemental data | |
Net assets, end of period (in thousands) | | $ | 3 | | | $ | 3 | | | $ | 3 | | |
Portfolio turnover | | | 60 | % | | | 88 | % | | | 78 | % | |
Notes to Financial Highlights
(a) Based on operations from June 18, 2012 (commencement of operations) through the stated period end.
(b) In addition to the fees and expenses that the Fund bears directly, the Fund indirectly bears a pro rata share of the fees and expenses of any other funds in which it invests. Such indirect expenses are not included in the Fund's reported expense ratios.
(c) Annualized.
(d) Total net expenses include the impact of certain fee waivers/expense reimbursements made by the Investment Manager and certain of its affiliates, if applicable.
(e) The benefits derived from expense reductions had an impact of less than 0.01%.
The accompanying Notes to Financial Statements are an integral part of this statement.
Annual Report 2015
23
COLUMBIA PACIFIC/ASIA FUND
FINANCIAL HIGHLIGHTS (continued)
| | | Year Ended March 31, | |
Class Z | | 2015 | | 2014 | | 2013 | | 2012 | | 2011 | |
Per share data | |
Net asset value, beginning of period | | $ | 8.95 | | | $ | 8.96 | | | $ | 8.12 | | | $ | 8.61 | | | $ | 7.69 | | |
Income from investment operations: | |
Net investment income | | | 0.12 | | | | 0.11 | | | | 0.12 | | | | 0.14 | | | | 0.09 | | |
Net realized and unrealized gain (loss) | | | 0.99 | | | | 0.10 | | | | 0.91 | | | | (0.49 | )(a) | | | 0.99 | | |
Total from investment operations | | | 1.11 | | | | 0.21 | | | | 1.03 | | | | (0.35 | ) | | | 1.08 | | |
Less distributions to shareholders: | |
Net investment income | | | (0.11 | ) | | | (0.22 | ) | | | (0.19 | ) | | | (0.14 | ) | | | (0.16 | ) | |
Total distributions to shareholders | | | (0.11 | ) | | | (0.22 | ) | | | (0.19 | ) | | | (0.14 | ) | | | (0.16 | ) | |
Proceeds from regulatory settlements | | | — | | | | — | | | | — | | | | 0.00 | (b) | | | — | | |
Net asset value, end of period | | $ | 9.95 | | | $ | 8.95 | | | $ | 8.96 | | | $ | 8.12 | | | $ | 8.61 | | |
Total return | | | 12.51 | % | | | 2.49 | % | | | 12.97 | % | | | (4.04 | %) | | | 14.44 | % | |
Ratios to average net assets(c) | |
Total gross expenses | | | 1.23 | % | | | 1.23 | % | | | 1.28 | % | | | 1.35 | % | | | 1.66 | %(d) | |
Total net expenses(e) | | | 1.23 | %(f) | | | 1.23 | %(f) | | | 1.28 | %(f) | | | 1.35 | % | | | 1.40 | %(d) | |
Net investment income | | | 1.28 | % | | | 1.27 | % | | | 1.47 | % | | | 1.80 | % | | | 1.22 | % | |
Supplemental data | |
Net assets, end of period (in thousands) | | $ | 78,236 | | | $ | 75,079 | | | $ | 51,013 | | | $ | 23,363 | | | $ | 19,154 | | |
Portfolio turnover | | | 60 | % | | | 88 | % | | | 78 | % | | | 94 | % | | | 63 | % | |
Notes to Financial Highlights
(a) Calculation of the net gain (loss) per share (both realized and unrealized) does not correlate to the aggregate realized and unrealized gain (loss) presented in the Statement of Operations due to the timing of subscriptions and redemptions of Fund shares in relation to fluctuations in the market value of the portfolio.
(b) Rounds to zero.
(c) In addition to the fees and expenses that the Fund bears directly, the Fund indirectly bears a pro rata share of the fees and expenses of any other funds in which it invests. Such indirect expenses are not included in the Fund's reported expense ratios.
(d) Ratios include line of credit interest expense which is less than 0.01%.
(e) Total net expenses include the impact of certain fee waivers/expense reimbursements made by the Investment Manager and certain of its affiliates, if applicable.
(f) The benefits derived from expense reductions had an impact of less than 0.01%.
The accompanying Notes to Financial Statements are an integral part of this statement.
Annual Report 2015
24
COLUMBIA PACIFIC/ASIA FUND
NOTES TO FINANCIAL STATEMENTS
March 31, 2015
Note 1. Organization
Columbia Pacific/Asia Fund (the Fund), a series of Columbia Funds Series Trust I (the Trust), is a diversified fund. The Trust is registered under the Investment Company Act of 1940, as amended (the 1940 Act), as an open-end management investment company organized as a Massachusetts business trust.
Fund Shares
The Trust may issue an unlimited number of shares (without par value). The Fund offers Class A, Class C, Class I, Class R4, Class W and Class Z shares. Although all share classes generally have identical voting, dividend and liquidation rights, each share class votes separately when required by the Trust's organizational documents or by law. Different share classes pay different distribution amounts to the extent the expenses of such share classes differ, and distributions in liquidation will be proportional to the net asset value of each share class. Each share class has its own expense structure and sales charges.
Class A shares are subject to a maximum front-end sales charge of 5.75% based on the initial investment amount. Class A shares purchased without an initial sales charge in accounts aggregating $1 million to $50 million at the time of purchase are subject to a contingent deferred sales charge (CDSC) if the shares are sold within 18 months after purchase, charged as follows: 1.00% CDSC if redeemed within 12 months after purchase, and 0.50% CDSC if redeemed more than 12, but less than 18, months after purchase.
Class C shares are subject to a 1.00% CDSC on shares redeemed within one year after purchase.
Class I shares are not subject to sales charges and are available only to the Columbia Family of Funds.
Class R4 shares are not subject to sales charges and are generally available only to omnibus retirement plans and certain investors as described in the Fund's prospectus.
Class W shares are not subject to sales charges and are available only to investors purchasing through authorized investment programs managed by investment professionals, including discretionary managed account programs.
Class Z shares are not subject to sales charges and are available only to eligible investors, which are subject to different investment minimums as described in the Fund's prospectus.
Note 2. Summary of Significant Accounting Policies
Basis of Preparation
The Fund is an investment company that applies the accounting and reporting guidance in the Financial Accounting Standards Board (FASB) Accounting Standards Codification Topic 946, Financial Services — Investment Companies (ASC 946). The financial statements are prepared in accordance with U.S. generally accepted accounting principles (GAAP), which requires management to make certain estimates and assumptions that affect the reported amounts of assets and liabilities, the disclosure of contingent assets and liabilities at the date of the financial statements and the reported amounts of income and expenses during the reporting period. Actual results could differ from those estimates.
The following is a summary of significant accounting policies followed by the Fund in the preparation of its financial statements.
Security Valuation
All equity securities and exchange-traded funds (ETFs) are valued at the close of business of the New York Stock Exchange (NYSE). Equity securities and ETFs are valued at the last quoted sales price on the principal exchange or market on which they trade, except for securities traded on the NASDAQ Stock Market, which are valued at the NASDAQ official close price. Unlisted securities or listed securities for which there were no sales during the day are valued at the mean of the latest quoted bid and ask prices on such exchanges or markets.
Foreign equity securities are valued based on quotations from the principal market in which such securities are traded. If any foreign security prices are not readily available as a result of limited share activity, the securities are valued at the mean of the latest quoted bid and ask prices on such exchanges or markets. Foreign currency exchange rates are generally determined at 4:00 p.m. Eastern (U.S.) time. Many securities markets and exchanges outside the U.S. close prior to the close of the NYSE; therefore, the closing prices for securities in such markets or on such exchanges may not fully reflect events that occur after such close but before the close of the NYSE. In those situations, foreign securities will be fair valued pursuant to a policy adopted by the Board of Trustees (the Board), including, if available, utilizing a third party pricing service
Annual Report 2015
25
COLUMBIA PACIFIC/ASIA FUND
NOTES TO FINANCIAL STATEMENTS (continued)
March 31, 2015
to determine these fair values. The third party pricing service takes into account multiple factors, including, but not limited to, movements in the U.S. securities markets, certain depositary receipts, futures contracts and foreign exchange rates that have occurred subsequent to the close of the foreign exchange or market, to determine a good faith estimate that reasonably reflects the current market conditions as of the close of the NYSE. The fair value of a security is likely to be different from the quoted or published price, if available.
Investments in open-end investment companies, including money market funds, are valued at their net asset value.
Forward foreign currency exchange contracts are marked-to-market based upon foreign currency exchange rates provided by a pricing service.
Investments for which market quotations are not readily available, or that have quotations which management believes are not reliable, are valued at fair value as determined in good faith under procedures established by and under the general supervision of the Board. If a security or class of securities (such as foreign securities) is valued at fair value, such value is likely to be different from the quoted or published price for the security.
The determination of fair value often requires significant judgment. To determine fair value, management may use assumptions including but not limited to future cash flows and estimated risk premiums. Multiple inputs from various sources may be used to determine fair value.
Foreign Currency Transactions and Translations
The values of all assets and liabilities denominated in foreign currencies are generally translated into U.S. dollars at exchange rates determined at the close of the NYSE. Net realized and unrealized gains (losses) on foreign currency transactions and translations include gains (losses) arising from the fluctuation in exchange rates between trade and settlement dates on securities transactions, gains (losses) arising from the disposition of foreign currency and currency gains (losses) between the accrual and payment dates on dividends, interest income and foreign withholding taxes.
For financial statement purposes, the Fund does not distinguish that portion of gains (losses) on investments which is due to changes in foreign exchange rates from that which is due to changes in market prices of the investments. Such fluctuations are included with the net realized and unrealized gains (losses) on investments in the Statement of Operations.
Derivative Instruments
The Fund invests in certain derivative instruments, as detailed below, to meet its investment objectives. Derivatives are instruments whose values depend on, or are derived from, in whole or in part, the value of one or more other assets, such as securities, currencies, commodities or indices. Derivative instruments may be used to increase investment flexibility (including to maintain cash reserves while maintaining exposure to certain other assets), for risk management (hedging) purposes, to facilitate trading, to reduce transaction costs and to pursue higher investment returns. The Fund may also use derivative instruments to mitigate certain investment risks, such as foreign currency exchange rate risk, interest rate risk and credit risk. Derivatives may involve various risks, including the potential inability of the counterparty to fulfill its obligation under the terms of the contract, the potential for an illiquid secondary market (making it difficult for the Fund to sell, including at favorable prices) and the potential for market movements which may expose the Fund to gains or losses in excess of the amount shown in the Statement of Assets and Liabilities. The notional amounts of derivative instruments, if applicable, are not recorded in the financial statements.
A derivative instrument may suffer a marked-to-market loss if the value of the contract decreases due to an unfavorable change in the market rates or values of the underlying instrument. Losses can also occur if the counterparty does not perform under the contract. The Fund's risk of loss from counterparty credit risk on over-the-counter derivatives is generally limited to the aggregate unrealized gain netted against any collateral held by the Fund and the amount of any variation margin held by the counterparty. With exchange-traded or centrally cleared derivatives, there is reduced counterparty credit risk to the Fund since the exchange's clearinghouse, as counterparty to such instruments, guarantees against a possible default. The clearinghouse stands between the buyer and the seller of the contract; therefore, the counterparty credit risk is failure of the clearinghouse. However, credit risk still exists in exchange-traded or centrally cleared derivatives with respect to initial and variation margin that is held in a broker's customer account. While brokers are required to segregate customer margin from their own assets, in the event that a broker becomes insolvent or goes into bankruptcy and at that time there is a shortfall in the aggregate amount of margin held by the broker for all its clients, U.S. bankruptcy laws will typically allocate that shortfall on a pro-rata basis across
Annual Report 2015
26
COLUMBIA PACIFIC/ASIA FUND
NOTES TO FINANCIAL STATEMENTS (continued)
March 31, 2015
all the broker's customers (including the Fund), potentially resulting in losses to the Fund.
In order to better define its contractual rights and to secure rights that will help the Fund mitigate its counterparty risk, the Fund may enter into an International Swaps and Derivatives Association, Inc. Master Agreement (ISDA Master Agreement) or similar agreement with its derivative contract counterparties. An ISDA Master Agreement is an agreement between the Fund and a counterparty that governs over-the-counter derivatives and forward foreign currency exchange contracts and typically contains, among other things, collateral posting terms and netting provisions in the event of a default and/or termination event. Under an ISDA Master Agreement, the Fund may, under certain circumstances, offset with the counterparty certain derivative instrument's payables and/or receivables with collateral held and/or posted and create one single net payment. The provisions of the ISDA Master Agreement typically permit a single net payment in the event of default (close-out netting) including the bankruptcy or insolvency of the counterparty. Note, however, that bankruptcy or insolvency laws of a particular jurisdiction may impose restrictions on or prohibitions against the right of offset in bankruptcy, insolvency or other events.
Collateral (margin) requirements differ by type of derivative. Margin requirements are established by the exchange or clearinghouse for exchange-traded and centrally cleared derivatives. Brokers can ask for margin in excess of the minimum in certain circumstances. Collateral terms are contract specific for over-the-counter derivatives. For over-the-counter derivatives traded under an ISDA Master Agreement, the collateral requirements are typically calculated by netting the marked-to-market amount for each transaction under such agreement and comparing that amount to the value of any variation margin currently pledged by the Fund and/or the counterparty. Generally, the amount of collateral due from or to a party has to exceed a minimum transfer amount threshold (e.g., $500,000) before a transfer has to be made. To the extent amounts due to the Fund from its counterparties are not fully collateralized, contractually or otherwise, the Fund bears the risk of loss from counterparty nonperformance. The Fund attempts to mitigate counterparty risk by only entering into agreements with counterparties that it believes have the financial resources to honor their obligations and by monitoring the financial stability of those counterparties.
Certain ISDA Master Agreements allow counterparties to over-the-counter derivatives to terminate derivative
contracts prior to maturity in the event the Fund's net assets decline by a stated percentage over a specified time period or if the Fund fails to meet the terms of the ISDA Master Agreement, which would cause the Fund to accelerate payment of any net liability owed to the counterparty. The Fund also has termination rights if the counterparty fails to meet the terms of the ISDA Master Agreement. In addition to considering counterparty credit risk, the Fund would consider terminating the derivative contracts based on whether termination would result in a net liability owed from the counterparty.
For financial reporting purposes, the Fund does not offset derivative assets and derivative liabilities that are subject to netting arrangements in the Statement of Assets and Liabilities.
Forward Foreign Currency Exchange Contracts
Forward foreign currency exchange contracts are over-the-counter agreements between two parties to buy and sell a currency at a set price on a future date. The Fund utilized forward foreign currency exchange contracts to hedge the currency exposure associated with some or all of the Fund's securities, to shift investment exposure from one currency to another, to shift U.S. dollar exposure to achieve a representative weighted mix of major currencies in its benchmark and/or to recover an underweight country exposure in its portfolio. These instruments may be used for other purposes in future periods.
The values of forward foreign currency exchange contracts fluctuate daily with changes in foreign currency exchange rates. Changes in the value of these contracts are recorded as unrealized appreciation or depreciation until the contract is exercised or has expired. The Fund will realize a gain or loss when the forward foreign currency exchange contract is closed or expires.
The use of forward foreign currency exchange contracts does not eliminate fluctuations in the prices of the Fund's portfolio securities. The risks of forward foreign currency exchange contracts include movement in the values of the foreign currencies relative to the U.S. dollar (or other foreign currencies) and the possibility that counterparties will not complete their contractual obligations, which may be in excess of the amount reflected, if any, in the Statement of Assets and Liabilities.
Annual Report 2015
27
COLUMBIA PACIFIC/ASIA FUND
NOTES TO FINANCIAL STATEMENTS (continued)
March 31, 2015
Offsetting of Derivative Assets and Derivative Liabilities
The following tables present the Fund's gross and net amount of assets and liabilities available for offset under netting arrangements as well as any related collateral received or pledged by the Fund as of March 31, 2015:
| | | | | | | | | Gross Amounts Not Offset in
the Statement of Assets and Liabilities | | | |
| | | Gross
Amounts of
Recognized
Assets ($) | | Gross Amounts
Offset in the
Statement of
Assets and
Liabilities ($) | | Net Amounts of
Assets
Presented in the
Statement of
Assets and
Liabilities ($) | | Financial
Instruments ($)(a) | | Cash
Collateral
Received ($) | | Securities
Collateral
Received ($) | | Net
Amount ($)(b) | |
Asset Derivatives: | |
Forward Foreign Currency
Exchange Contracts | | | 3,388 | | | | — | | | | 3,388 | | | | 3,388 | | | | — | | | | — | | | | — | | |
| | | | | | | | | Gross Amounts Not Offset in
the Statement of Assets and Liabilities | | | |
| | | Gross
Amounts of
Recognized
Liabilities ($) | | Gross Amounts
Offset in the
Statement of
Assets and
Liabilities ($) | | Net Amounts of
Liabilities
Presented in the
Statement of
Assets and
Liabilities ($) | | Financial
Instruments ($)(c) | | Cash
Collateral
Pledged ($) | | Securities
Collateral
Pledged ($) | | Net
Amount ($)(d) | |
Liability Derivatives: | |
Forward Foreign Currency
Exchange Contracts | | | 188,589 | | | | — | | | | 188,589 | | | | 3,388 | | | | — | | | | — | | | | 185,201 | | |
(a) Represents the amount of assets that could be offset by liabilities with the same counterparty under master netting or similar agreements that management elects not to offset on the Statement of Assets and Liabilities.
(b) Represents the net amount due from counterparties in the event of default.
(c) Represents the amount of liabilities that could be offset by assets with the same counterparty under master netting or similar agreements that management elects not to offset on the Statement of Assets and Liabilities.
(d) Represents the net amount due to counterparties in the event of default.
Effects of Derivative Transactions in the Financial Statements
The following tables are intended to provide additional information about the effect of derivatives on the financial statements of the Fund, including: the fair value of derivatives by risk category and the location of those fair values in the Statement of Assets and Liabilities; and the impact of derivative transactions over the period in the Statement of Operations, including realized gains or losses and unrealized gains or losses. The derivative schedules following the Portfolio of Investments present additional information regarding derivative instruments outstanding at the end of the period, if any.
The following table is a summary of the fair value of derivative instruments (not considered to be hedging
instruments for accounting disclosure purposes) at March 31, 2015:
Asset Derivatives | |
Risk Exposure
Category | | Statement of Assets and
Liabilities Location | | Fair Value ($) | |
Foreign exchange
risk
| | Unrealized appreciation on
forward foreign currency
exchange contracts | | | 3,388
| | |
Liability Derivatives | |
Risk Exposure
Category | | Statement of Assets and
Liabilities Location | | Fair Value ($) | |
Foreign exchange
risk
| | Unrealized depreciation on
forward foreign currency
exchange contracts | | | 188,589
| | |
The following table indicates the effect of derivative instruments (not considered to be hedging instruments
Annual Report 2015
28
COLUMBIA PACIFIC/ASIA FUND
NOTES TO FINANCIAL STATEMENTS (continued)
March 31, 2015
for accounting disclosure purposes) in the Statement of Operations for the year ended March 31, 2015:
Amount of Realized Gain (Loss) on Derivatives Recognized in Income | |
| Risk Exposure Category | | Forward Foreign Currency
Exchange Contracts ($) | |
Foreign exchange risk | | | (618,837 | ) | |
Change in Unrealized Appreciation (Depreciation) on
Derivatives Recognized in Income | |
| Risk Exposure Category | | Forward Foreign Currency
Exchange Contracts ($) | |
Foreign exchange risk | | | (524,664 | ) | |
The following table is a summary of the average outstanding volume by derivative instrument for the year ended March 31, 2015:
Derivative Instrument | | Average Unrealized
Appreciation ($)* | | Average Unrealized
Depreciation ($)* | |
Forward foreign currency
exchange contracts | | | 175,490 | | | | (220,825) | | |
*Based on the ending quarterly outstanding amounts for the year ended March 31, 2015.
Security Transactions
Security transactions are accounted for on the trade date. Cost is determined and gains (losses) are based upon the specific identification method for both financial statement and federal income tax purposes.
Income Recognition
Corporate actions and dividend income are generally recorded net of any non-reclaimable tax withholdings, on the ex-dividend date or upon receipt of ex-dividend notification in the case of certain foreign securities.
Awards from class action litigation are recorded as a reduction of cost basis if the Fund still owns the applicable securities on the payment date. If the Fund no longer owns the applicable securities, the proceeds are recorded as realized gains.
Expenses
General expenses of the Trust are allocated to the Fund and other funds of the Trust based upon relative net assets or other expense allocation methodologies determined by the nature of the expense. Expenses directly attributable to the Fund are charged to the Fund. Expenses directly attributable to a specific class of shares are charged to that share class.
Determination of Class Net Asset Value
All income, expenses (other than class-specific expenses, which are charged to that share class, as
shown in the Statement of Operations) and realized and unrealized gains (losses) are allocated to each class of the Fund on a daily basis, based on the relative net assets of each class, for purposes of determining the net asset value of each class.
Federal Income Tax Status
The Fund intends to qualify each year as a regulated investment company under Subchapter M of the Internal Revenue Code, as amended, and will distribute substantially all of its taxable income (including net short-term capital gains), if any, for its tax year, and as such will not be subject to federal income taxes. In addition, the Fund intends to distribute in each calendar year substantially all of its net investment income, capital gains and certain other amounts, if any, such that the Fund should not be subject to federal excise tax. Therefore, no federal income or excise tax provision is recorded.
Foreign Taxes
The Fund may be subject to foreign taxes on income, gains on investments or currency repatriation, a portion of which may be recoverable. The Fund will accrue such taxes and recoveries, as applicable, based upon its current interpretation of tax rules and regulations that exist in the markets in which it invests.
Realized gains in certain countries may be subject to foreign taxes at the Fund level, based on statutory rates. The Fund accrues for such foreign taxes on realized and unrealized gains at the appropriate rate for each jurisdiction, as applicable. The amount, if any, is disclosed as a liability on the Statement of Assets and Liabilities.
Distributions to Shareholders
Distributions from net investment income, if any, are declared and paid semi-annually. Net realized capital gains, if any, are distributed at least annually. Income distributions and capital gain distributions are determined in accordance with federal income tax regulations, which may differ from GAAP.
Guarantees and Indemnifications
Under the Trust's organizational documents and, in some cases, by contract, its officers and trustees are indemnified against certain liabilities arising out of the performance of their duties to the Trust or its funds. In addition, certain of the Fund's contracts with its service providers contain general indemnification clauses. The Fund's maximum exposure under these arrangements is
Annual Report 2015
29
COLUMBIA PACIFIC/ASIA FUND
NOTES TO FINANCIAL STATEMENTS (continued)
March 31, 2015
unknown since the amount of any future claims that may be made against the Fund cannot be determined, and the Fund has no historical basis for predicting the likelihood of any such claims.
Note 3. Fees and Compensation Paid to Affiliates
Investment Management Fees
Under an Investment Management Services Agreement, Columbia Management Investment Advisers, LLC (the Investment Manager), a wholly-owned subsidiary of Ameriprise Financial, Inc. (Ameriprise Financial), determines which securities will be purchased, held or sold. The investment management fee is an annual fee that is equal to a percentage of the Fund's average daily net assets that declines from 0.87% to 0.66% as the Fund's net assets increase. The effective investment management fee rate for the year ended March 31, 2015 was 0.87% of the Fund's average daily net assets.
Effective June 2, 2014, the Investment Manager entered into a personnel-sharing arrangement with its affiliate, Threadneedle Investments (Threadneedle). Threadneedle, like the Investment Manager, is a wholly-owned subsidiary of Ameriprise Financial and is an SEC-registered investment adviser. Pursuant to this arrangement, certain employees of Threadneedle serve as "associated persons" of the Investment Manager and, in this capacity, subject to the oversight and supervision of the Investment Manager and consistent with the investment objectives, policies and limitations set forth in the Fund's prospectus and Statement of Additional Information (SAI), may provide research and related services, and discretionary investment management services (including acting as portfolio managers) to the Fund on behalf of the Investment Manager.
Administration Fees
Under an Administrative Services Agreement, the Investment Manager also serves as the Fund Administrator. The Fund pays the Fund Administrator an annual fee for administration and accounting services equal to a percentage of the Fund's average daily net assets that declines from 0.08% to 0.06% as the Fund's net assets increase. The effective administration fee rate for the year ended March 31, 2015 was 0.08% of the Fund's average daily net assets.
Compensation of Board Members
Board members are compensated for their services to the Fund as disclosed in the Statement of Operations.
The Trust's eligible Trustees may participate in a Deferred Compensation Plan (the Plan) which may be terminated at any time. Obligations of the Plan will be paid solely out of the Fund's assets.
Compensation of Chief Compliance Officer
The Board has appointed a Chief Compliance Officer to the Fund in accordance with federal securities regulations. The Fund pays its pro-rata share of the expenses associated with the Chief Compliance Officer.
Transfer Agent Fees
Under a Transfer and Dividend Disbursing Agent Agreement, Columbia Management Investment Services Corp. (the Transfer Agent), an affiliate of the Investment Manager and a wholly-owned subsidiary of Ameriprise Financial, is responsible for providing transfer agency services to the Fund. The Transfer Agent has contracted with Boston Financial Data Services (BFDS) to serve as sub-transfer agent.
Effective November 1, 2014, the Transfer Agent receives a monthly transfer agency fee based on the number or the average value of accounts, depending on the type of account. Prior to November 1, 2014, the Transfer Agent received a monthly account-based service fee based on the number of open accounts. In addition, the Transfer Agent also receives sub-transfer agency fees based on a percentage of the average aggregate value of the Fund's shares maintained in omnibus accounts (other than omnibus accounts for which American Enterprise Investment Services Inc. is the broker of record or accounts where the beneficial shareholder is a customer of Ameriprise Financial Services, Inc., for which the Transfer Agent receives a per account fee). The Transfer Agent pays the fees of BFDS for services as sub-transfer agent and is not entitled to reimbursement for such fees from the Fund (with the exception of out-of-pocket fees).
The Transfer Agent also receives compensation from the Fund for various shareholder services and reimbursements for certain out-of-pocket fees. Class I shares do not pay transfer agency fees.
For the year ended March 31, 2015, the Fund's effective transfer agent fee rates as a percentage of average daily net assets of each class were as follows:
Class A | | | 0.19 | % | |
Class C | | | 0.19 | | |
Class R4 | | | 0.19 | | |
Class W | | | 0.14 | | |
Class Z | | | 0.19 | | |
Annual Report 2015
30
COLUMBIA PACIFIC/ASIA FUND
NOTES TO FINANCIAL STATEMENTS (continued)
March 31, 2015
An annual minimum account balance fee of $20 may apply to certain accounts with a value below the applicable share class's initial minimum investment requirements to reduce the impact of small accounts on transfer agent fees. These minimum account balance fees are remitted to the Fund and recorded as part of expense reductions in the Statement of Operations. For the year ended March 31, 2015, these minimum account balance fees reduced total expenses of the Fund by $540.
Distribution and Service Fees
The Fund has an agreement with Columbia Management Investment Distributors, Inc. (the Distributor), an affiliate of the Investment Manager and a wholly-owned subsidiary of Ameriprise Financial, for distribution and shareholder services. The Board has approved, and the Fund has adopted, distribution and shareholder service plans (the Plans) applicable to certain share classes, which set the distribution and service fees for the Fund. These fees are calculated daily and are intended to compensate the Distributor and/or eligible selling and/or servicing agents for selling shares of the Fund and providing services to investors.
Under the Plans, the Fund pays a monthly service fee to the Distributor at the maximum annual rate of 0.25% of the average daily net assets attributable to Class A, Class C and Class W shares of the Fund. Also under the Plans, the Fund pays a monthly distribution fee to the Distributor at the maximum annual rates of 0.75% and 0.25% of the average daily net assets attributable to Class C and Class W shares, respectively.
Although the Fund may pay a distribution fee up to 0.25% of the Fund's average daily net assets attributable to Class W shares and a service fee of up to 0.25% of the Fund's average daily net assets attributable to Class W shares, the aggregate fee shall not exceed 0.25% of the Fund's average daily net assets attributable to Class W shares.
Sales Charges
Sales charges, including front-end charges and CDSCs, received by the Distributor for distributing Fund shares were $7,352 for Class A shares for the year ended March 31, 2015.
Expenses Waived/Reimbursed by the Investment Manager and its Affiliates
The Fund's expense ratio is subject to an expense reimbursement arrangement pursuant to which fees will be waived and/or expenses reimbursed (excluding
certain fees and expenses described below), so that the Fund's net operating expenses, after giving effect to fees waived/expenses reimbursed and any balance credits and/or overdraft charges from the Fund's custodian, do not exceed the annual rates of:
| | | Voluntary
Expense Cap
Effective
August 1, 2014 | | Contractual
Expense Cap
Prior to
August 1, 2014 | |
Class A | | | 1.68 | % | | | 1.64 | % | |
Class C | | | 2.43 | | | | 2.39 | | |
Class I | | | 1.30 | | | | 1.24 | | |
Class R4 | | | 1.43 | | | | 1.39 | | |
Class W | | | 1.68 | | | | 1.64 | | |
Class Z | | | 1.43 | | | | 1.39 | | |
The voluntary expense cap arrangement may be revised or discontinued at any time. Under the arrangements, the following fees and expenses are excluded from the waiver/reimbursement commitment, and therefore will be paid by the Fund, if applicable: taxes (including foreign transaction taxes), expenses associated with investments in affiliated and non-affiliated pooled investment vehicles (including mutual funds and exchange-traded funds), transaction costs and brokerage commissions, costs related to any securities lending program, dividend expenses associated with securities sold short, inverse floater program fees and expenses, transaction charges and interest on borrowed money, interest and extraordinary expenses. Any fees waived and/or expenses reimbursed under the expense reimbursement arrangements described above are not recoverable by the Investment Manager or its affiliates in future periods.
Note 4. Federal Tax Information
The timing and character of income and capital gain distributions are determined in accordance with income tax regulations, which may differ from GAAP because of temporary or permanent book to tax differences.
At March 31, 2015, these differences are primarily due to differing treatment for capital loss carryforwards, deferral/reversal of wash sale losses, Trustees' deferred compensation, foreign currency transactions, passive foreign investment company (PFIC) holdings and derivative investments. To the extent these differences are permanent, reclassifications are made among the components of the Fund's net assets in the Statement of Assets and Liabilities. Temporary differences do not
Annual Report 2015
31
COLUMBIA PACIFIC/ASIA FUND
NOTES TO FINANCIAL STATEMENTS (continued)
March 31, 2015
require reclassifications. In the Statement of Assets and Liabilities the following reclassifications were made:
Excess of distributions over net investment income | | $ | 31,951 | | |
Accumulated net realized loss | | | (16,440 | ) | |
Paid-in capital | | | (15,511 | ) | |
Net investment income (loss) and net realized gains (losses), as disclosed in the Statement of Operations, and net assets were not affected by this reclassification.
The tax character of distributions paid during the years indicated was as follows:
Year Ended March 31, | | 2015 | | 2014 | |
Ordinary income | | $ | 3,429,655 | | | $ | 7,979,814 | | |
Short-term capital gain distributions, if any, are considered ordinary income distributions for tax purposes.
At March 31, 2015, the components of distributable earnings on a tax basis were as follows:
Undistributed ordinary income | | $ | 771,874 | | |
Undistributed long-term capital gains | | | 624,471 | | |
Capital loss carryforwards | | | (10,567,071 | ) | |
Net unrealized appreciation | | | 64,001,901 | | |
At March 31, 2015, the cost of investments for federal income tax purposes was $193,530,950 and the aggregate gross unrealized appreciation and depreciation based on that cost was:
Unrealized appreciation | | $ | 66,666,181 | | |
Unrealized depreciation | | | (2,664,280 | ) | |
Net unrealized appreciation | | $ | 64,001,901 | | |
The following capital loss carryforwards, determined at March 31, 2015, may be available to reduce taxable income arising from future net realized gains on investments, if any, to the extent permitted by the Internal Revenue Code:
Year of Expiration | | Amount ($) | |
2017 | | | 173,275 | | |
2018 | | | 9,603,381 | | |
2019 | | | 790,415 | | |
Total | | | 10,567,071 | | |
For the year ended March 31, 2015, $10,809,834 of capital loss carryforward was utilized.
Management of the Fund has concluded that there are no significant uncertain tax positions in the Fund that would require recognition in the financial statements. However, management's conclusion may be subject to
review and adjustment at a later date based on factors including, but not limited to, new tax laws, regulations, and administrative interpretations (including relevant court decisions). Generally, the Fund's federal tax returns for the prior three fiscal years remain subject to examination by the Internal Revenue Service.
Note 5. Portfolio Information
The cost of purchases and proceeds from sales of securities, excluding short-term investments and derivatives, if any, aggregated to $159,090,835 and $200,853,150, respectively, for the year ended March 31, 2015. The amount of purchase and sale activity impacts the portfolio turnover rate reported in the Financial Highlights.
Note 6. Affiliated Money Market Fund
The Fund invests in Columbia Short-Term Cash Fund, an affiliated money market fund established for the exclusive use by the Fund and other affiliated funds. The income earned by the Fund from such investments is included as Dividends — affiliated issuers in the Statement of Operations. As an investing fund, the Fund indirectly bears its proportionate share of the expenses of Columbia Short-Term Cash Fund.
Note 7. Shareholder Concentration
At March 31, 2015, one unaffiliated shareholder of record owned 11.5% of the outstanding shares of the Fund in one or more accounts. The Fund has no knowledge about whether any portion of those shares was owned beneficially. Affiliated shareholders of record owned 81.5% of the outstanding shares of the Fund in one or more accounts. Subscription and redemption activity by concentrated accounts may have a significant effect on the operations of the Fund.
Note 8. Line of Credit
The Fund has entered into a revolving credit facility with a syndicate of banks led by JPMorgan Chase Bank, N.A. (JPMorgan) whereby the Fund may borrow for the temporary funding of shareholder redemptions or for other temporary or emergency purposes. Pursuant to a December 9, 2014 amendment, the credit facility agreement, which is a collective agreement between the Fund and certain other funds managed by the Investment Manager, severally and not jointly, permits collective borrowings up to $550 million. Interest is charged to each participating fund based on its borrowings at a rate equal to the higher of (i) the overnight federal funds rate plus 1.00% or (ii) the one-month LIBOR rate plus 1.00%.
Annual Report 2015
32
COLUMBIA PACIFIC/ASIA FUND
NOTES TO FINANCIAL STATEMENTS (continued)
March 31, 2015
Each borrowing under the credit facility matures no later than 60 days after the date of borrowing. The Fund also pays a commitment fee equal to its pro rata share of the amount of the credit facility at a rate of 0.075% per annum. The commitment fee is included in other expenses in the Statement of Operations. Prior to the December 9, 2014 amendment, the credit facility agreement permitted borrowings up to $500 million under the same terms and interest rates as described above.
The Fund had no borrowings during the year ended March 31, 2015.
Note 9. Significant Risks
Financial Sector Risk
Sector risk occurs when a fund invests a significant portion of its assets in securities of companies conducting business in a related group of industries within an economic sector. Companies in the same economic sector may be similarly affected by economic, regulatory, political or market events or conditions, making a fund more vulnerable to unfavorable developments in that economic sector than funds that invest more broadly. The Fund may be more susceptible to the particular risks that may affect companies in the financial sector than if it were invested in a wider variety of companies in unrelated sectors.
Foreign Securities and Emerging Market Countries Risk
Investing in foreign securities may include certain risks and considerations not typically associated with investing in U.S. securities, such as fluctuating currency values and changing local and regional economic, political and social conditions, which may result in greater market volatility. In addition, certain foreign securities may not be as liquid as U.S. securities. Investing in emerging markets may accentuate these risks. These countries are also more likely to experience high levels of inflation, deflation or currency devaluation which could hurt their economies and securities markets. To the extent that the Fund concentrates its investment exposure to any one or a few specific countries, the Fund will be particularly susceptible to the various conditions, events or other factors impacting those countries and may, therefore, have a greater risk than that of a fund which is more geographically diversified.
Note 10. Subsequent Events
Management has evaluated the events and transactions that have occurred through the date the financial statements were issued and noted no items requiring adjustment of the financial statements or additional disclosure.
Note 11. Information Regarding Pending and Settled Legal Proceedings
In December 2005, without admitting or denying the allegations, American Express Financial Corporation (AEFC, which is now known as Ameriprise Financial, Inc. (Ameriprise Financial)) entered into settlement agreements with the Securities and Exchange Commission (SEC) and Minnesota Department of Commerce (MDOC) related to market timing activities. As a result, AEFC was censured and ordered to cease and desist from committing or causing any violations of certain provisions of the Investment Advisers Act of 1940, the Investment Company Act of 1940, and various Minnesota laws. AEFC agreed to pay disgorgement of $10 million and civil money penalties of $7 million. AEFC also agreed to retain an independent distribution consultant to assist in developing a plan for distribution of all disgorgement and civil penalties ordered by the SEC in accordance with various undertakings detailed at www.sec.gov/litigation/admin/ia-2451.pdf. Ameriprise Financial and its affiliates have cooperated with the SEC and the MDOC in these legal proceedings, and have made regular reports to the Funds' Boards of Trustees.
Ameriprise Financial and certain of its affiliates have historically been involved in a number of legal, arbitration and regulatory proceedings, including routine litigation, class actions, and governmental actions, concerning matters arising in connection with the conduct of their business activities. Ameriprise Financial believes that the Funds are not currently the subject of, and that neither Ameriprise Financial nor any of its affiliates are the subject of, any pending legal, arbitration or regulatory proceedings that are likely to have a material adverse effect on the Funds or the ability of Ameriprise Financial or its affiliates to perform under their contracts with the Funds. Ameriprise Financial is required to make quarterly (10-Q), annual (10-K) and, as necessary, 8-K filings with the Securities and Exchange Commission on legal and regulatory matters that relate to Ameriprise Financial and its affiliates. Copies of these filings may be obtained by accessing the SEC website at www.sec.gov.
Annual Report 2015
33
COLUMBIA PACIFIC/ASIA FUND
NOTES TO FINANCIAL STATEMENTS (continued)
March 31, 2015
There can be no assurance that these matters, or the adverse publicity associated with them, will not result in increased fund redemptions, reduced sale of fund shares or other adverse consequences to the Funds. Further, although we believe proceedings are not likely to have a material adverse effect on the Funds or the ability of Ameriprise Financial or its affiliates to perform under their contracts with the Funds, these proceedings are subject to uncertainties and, as such, we are unable to estimate the possible loss or range of loss that may result. An adverse outcome in one or more of these proceedings could result in adverse judgments, settlements, fines, penalties or other relief that could have a material adverse effect on the consolidated financial condition or results of operations of Ameriprise Financial.
Annual Report 2015
34
COLUMBIA PACIFIC/ASIA FUND
REPORT OF INDEPENDENT REGISTERED PUBLIC ACCOUNTING FIRM
To the Trustees of Columbia Funds Series Trust I and the Shareholders of
Columbia Pacific/Asia Fund
In our opinion, the accompanying statement of assets and liabilities, including the portfolio of investments, and the related statements of operations and of changes in net assets and the financial highlights present fairly, in all material respects, the financial position of Columbia Pacific/Asia Fund (the "Fund", a series of Columbia Funds Series Trust I) at March 31, 2015, and the results of its operations, the changes in its net assets and the financial highlights for each of the periods indicated, in conformity with accounting principles generally accepted in the United States of America. These financial statements and financial highlights (hereafter referred to as "financial statements") are the responsibility of the Fund's management. Our responsibility is to express an opinion on these financial statements based on our audits. We conducted our audits of these financial statements in accordance with the standards of the Public Company Accounting Oversight Board (United States). Those standards require that we plan and perform the audit to obtain reasonable assurance about whether the financial statements are free of material misstatement. An audit includes examining, on a test basis, evidence supporting the amounts and disclosures in the financial statements, assessing the accounting principles used and significant estimates made by management, and evaluating the overall financial statement presentation. We believe that our audits, which included confirmation of securities at March 31, 2015 by correspondence with the custodian, brokers and transfer agent, provide a reasonable basis for our opinion.
PricewaterhouseCoopers LLP
Minneapolis, Minnesota
May 22, 2015
Annual Report 2015
35
COLUMBIA PACIFIC/ASIA FUND
FEDERAL INCOME TAX INFORMATION
(Unaudited)
The Fund hereby designates the following tax attributes for the fiscal year ended March 31, 2015. Shareholders will be notified in early 2016 of the amounts for use in preparing 2015 income tax returns.
Tax Designations:
| Qualified Dividend Income | | | 100.00 | % | |
Capital Gain Dividend | | $ | 655,695 | | |
Foreign Taxes Paid | | $ | 480,396 | | |
Foreign Taxes Paid Per Share | | $ | 0.02 | | |
Foreign Source Income | | $ | 6,782,646 | | |
Foreign Source Income Per Share | | $ | 0.26 | | |
Qualified Dividend Income. For taxable, non-corporate shareholders, the percentage of ordinary income distributed during the fiscal year that represents qualified dividend income subject to reduced tax rates.
Capital Gain Dividend. The Fund designates as a capital gain dividend the amount reflected above, or if subsequently determined to be different, the net capital gain of such fiscal period.
Foreign Taxes. The Fund makes the election to pass through to shareholders the foreign taxes paid. Eligible shareholders may claim a foreign tax credit. These taxes, and the corresponding foreign source income, are provided.
Annual Report 2015
36
COLUMBIA PACIFIC/ASIA FUND
The Trustees serve terms of indefinite duration. The names, addresses and birth years of the Trustees and Officers of the Funds in Columbia Funds Series Trust I, the year each was first elected or appointed to office, their principal business occupations during at least the last five years, the number of Funds overseen by each Trustee and other directorships they hold are shown below. Each officer listed below serves as an officer of each Fund in Columbia Funds Series Trust I.
Independent Trustees
Name, Year of Birth
and Position Held
with the Trust | | Year First
Appointed or
Elected as
Trustee to any
Fund Currently
in the Columbia
Funds Complex
or a Predecessor
Thereof | | Principal Occupation(s)
during the Past Five Years | | Number
of Funds
in the
Columbia
Funds
Complex
Overseen | | Other Directorships
Held by Trustee During
the Past Five Years | |
Douglas A. Hacker
(Born 1955)
Trustee and Chairman
of the Board | | | 1996 | | | Independent business executive since May 2006; Executive Vice President — Strategy of United Airlines from December 2002 to May 2006; President of UAL Loyalty Services (airline marketing company) from September 2001 to December 2002; Executive Vice President and Chief Financial Officer of United Airlines from July 1999 to September 2001 | | | 59 | | | Spartan Nash Company, (food distributor); Nash Finch Company (food distributor) from 2005 to 2013; Aircastle Limited (aircraft leasing); and SeaCube Container Leasing Ltd. (container leasing) from 2010 to 2013; and Travelport Worldwide Limited (travel information technology) | |
Janet Langford Kelly
(Born 1957)
Trustee | | | 1996 | | | Senior Vice President, General Counsel and Corporate Secretary, ConocoPhillips (integrated energy company) since September 2007; Deputy General Counsel — Corporate Legal Services, ConocoPhillips from August 2006 to August 2007; Partner, Zelle, Hofmann, Voelbel, Mason & Gette LLP (law firm) from March 2005 to July 2006; Adjunct Professor of Law, Northwestern University from September 2004 to June 2006; Director, UAL Corporation (airline) from February 2006 to July 2006; Chief Administrative Officer and Senior Vice President, Kmart Holding Corporation (consumer goods) from September 2003 to March 2004 | | | 59 | | | None | |
Nancy T. Lukitsh
(Born 1956)
Trustee | | | 2011 | | | Senior Vice President, Partner and Director of Marketing, Wellington Management Company, LLP (investment adviser) from 1997 to 2010; Chair, Wellington Management Investment Portfolios (commingled non-U.S. investment pools) from 2007 to 2010; Director, Wellington Trust Company, NA and other Wellington affiliates from 1997 to 2010 | | | 59 | | | None | |
William E. Mayer
(Born 1940)
Trustee | | | 1991 | | | Partner, Park Avenue Equity Partners (private equity) since February 1999 | | | 59 | | | DynaVox Inc. (speech creation); Lee Enterprises (print media); WR Hambrecht + Co. (financial service provider) from 2000 to 2012; BlackRock Kelso Capital Corporation (investment company); Premier, Inc. (healthcare) | |
Annual Report 2015
37
COLUMBIA PACIFIC/ASIA FUND
TRUSTEES AND OFFICERS (continued)
Independent Trustees (continued)
Name, Year of Birth
and Position Held
with the Trust | | Year First
Appointed or
Elected as
Trustee to any
Fund Currently
in the Columbia
Funds Complex
or a Predecessor
Thereof | | Principal Occupation(s)
during the Past Five Years | | Number
of Funds
in the
Columbia
Funds
Complex
Overseen | | Other Directorships
Held by Trustee During
the Past Five Years | |
David M. Moffett
(Born 1952)
Trustee | | | 2011 | | | Retired. Consultant to Bridgewater and Associates; Chief Executive Officer, Federal Home Loan Mortgage Corporation, from 2008 to 2009; Senior Adviser, Global Financial Services Group, Carlyle Group, Inc., from 2007 to 2008; Vice Chairman and Chief Financial Officer, U.S. Bancorp, from 1993 to 2007 | | | 59 | | | CIT Group Inc. (commercial and consumer finance); eBay Inc. (online trading community); MBIA Inc. (financial service provider); E.W. Scripps Co. (print and television media); Building Materials Holding Corp. (building materials and construction services); Genworth Financial, Inc. (financial and insurance products and services); and University of Oklahoma Foundation | |
Charles R. Nelson
(Born 1942)
Trustee | | | 1981 | | | Retired. Professor Emeritus, University of Washington since 2011; Professor of Economics, University of Washington from 1976 to 2011; Ford and Louisa Van Voorhis Professor of Political Economy, University of Washington from 1993 to 2011; Adjunct Professor of Statistics, University of Washington from 1980 to 2011; Associate Editor, Journal of Money, Credit and Banking from September 1993 to 2008; consultant on econometric and statistical matters | | | 59 | | | None | |
John J. Neuhauser
(Born 1943)
Trustee | | | 1984 | | | President, Saint Michael's College since August 2007; Director or Trustee of several non-profit organizations, including Fletcher Allen Health Care, Inc.; Academic Vice President and Dean of Faculties, Boston College from August 1999 to October 2005; University Professor, Boston College from November 2005 to August 2007 | | | 59 | | | Liberty All-Star Equity Fund and Liberty All-Star Growth Fund (closed-end funds) | |
Patrick J. Simpson
(Born 1944)
Trustee | | | 2000 | | | Partner, Perkins Coie LLP (law firm) | | | 59 | | | None | |
Anne-Lee Verville
(Born 1945)
Trustee | | | 1998 | | | Retired. General Manager, Global Education Industry from 1994 to 1997, President — Application Systems Division from 1991 to 1994, Chief Financial Officer — US Marketing & Services from 1988 to 1991, and Chief Information Officer from 1987 to 1988, IBM Corporation (computer and technology) | | | 59 | | | Enesco Group, Inc. (producer of giftware and home and garden decor products) from 2001 to 2006 | |
Annual Report 2015
38
COLUMBIA PACIFIC/ASIA FUND
TRUSTEES AND OFFICERS (continued)
Interested Trustee Affiliate with Investment Manager*
Name, Year of Birth
and Position Held
with the Trust | | Year First
Appointed or
Elected as
Trustee to any
Fund Currently
in the Columbia
Funds Complex
or a Predecessor
Thereof | | Principal Occupation(s)
during the Past Five Years | | Number
of Funds
in the
Columbia
Funds
Complex
Overseen | | Other Directorships
Held by Trustee During
the Past Five Years | |
William F. Truscott
(Born 1960)
Trustee | | | 2012 | | | Chairman of the Board and President, Columbia Management Investment Advisers, LLC since May 2010 and February 2012, respectively (previously President and Chief Investment Officer, 2001-April 2010); Chief Executive Officer, Global Asset Management, Ameriprise Financial, Inc. since September 2012 (previously Chief Executive Officer, U.S. Asset Management & President, Annuities, May 2010-September 2012 and President — U.S. Asset Management and Chief Investment Officer, 2005-April 2010); Director and Chief Executive Officer, Columbia Management Investment Distributors, Inc. since May 2010 and February 2012, respectively (previously Chairman of the Board and Chief Executive Officer, 2006-April 2010); Chairman of the Board and Chief Executive Officer, RiverSource Distributors, Inc. since 2006; Director, Threadneedle Asset Management Holdings, SARL since 2014; President and Chief Executive Officer, Ameriprise Certificate Company, 2006-August 2012 | | | 186 | | | Chairman of the Board, Columbia Management Investment Advisers, LLC since May 2010; Director, Columbia Management Investment Distributors, Inc. since May 2010; Director, Ameriprise Certificate Company, 2006 to January 2013 | |
* Interested person (as defined under the 1940 Act) by reason of being an officer, director, security holder and/or employee of the Investment Manager or Ameriprise Financial.
The Statement of Additional Information has additional information about the Fund's Board members and is available, without charge, upon request by calling 800.345.6611; contacting your financial intermediary; or visiting columbiathreadneedle.com/us.
The Board has appointed officers who are responsible for day-to-day business decisions based on policies it has established. The officers serve at the pleasure of the Board. In addition to Mr. Truscott, who is Senior Vice President, the Funds' other officers are:
Fund Officers
Name,
Address and
Year of Birth | | Position and Year
First Appointed to
Position for any Fund
in the Columbia
Funds Complex or a
Predecessor Thereof | | Principal Occupation(s) During Past Five Years | |
Christopher O. Petersen
5228 Ameriprise
Financial Center
Minneapolis, MN 55474
Born 1970 | | President and Principal Executive Officer (2015) | | Vice President and Lead Chief Counsel, Ameriprise Financial, Inc. since January 2015 (previously, Vice President and Chief Counsel January 2010-December 2014; and Vice President and Group Counsel or Counsel 2004- January 2010); officer of Columbia Funds and affiliated funds since 2007. | |
Michael G. Clarke
225 Franklin Street
Boston, MA 02110
Born 1969 | | Treasurer (2011) and Chief Financial Officer (2009) | | Vice President — Mutual Fund Administration, Columbia Management Investment Advisers, LLC, since May 2010; Managing Director of Fund Administration, Columbia Management Advisors, LLC, September 2004-April 2010; senior officer of Columbia Funds and affiliated funds since 2002. | |
Annual Report 2015
39
COLUMBIA PACIFIC/ASIA FUND
TRUSTEES AND OFFICERS (continued)
Fund Officers (continued)
Name,
Address and
Year of Birth | | Position and Year
First Appointed to
Position for any Fund
in the Columbia
Funds Complex or a
Predecessor Thereof | | Principal Occupation(s) During Past Five Years | |
Paul B. Goucher
100 Park Avenue
New York, NY 10017
Born 1968 | | Senior Vice President (2011), Chief Legal Officer (2015) and Assistant Secretary (2008) | | Vice President and Lead Chief Counsel, Ameriprise Financial, Inc. since November 2008 and January 2013, respectively (previously Chief Counsel, January 2010-January 2013 and Group Counsel, November 2008-January 2010). | |
Thomas P. McGuire
225 Franklin Street
Boston, MA 02110
Born 1972 | | Vice President and Chief Compliance Officer (2012) | | Vice President — Asset Management Compliance, Ameriprise Financial, Inc., since May 2010; Chief Compliance Officer, Ameriprise Certificate Company since September 2010; Compliance Executive, Bank of America, 2005-April 2010. | |
Colin Moore
225 Franklin Street
Boston, MA 02110
Born 1958 | | Senior Vice President (2010) | | Executive Vice President and Global Chief Investment Officer, Ameriprise Financial, Inc., since July 2013; Director and Global Chief Investment Officer, Columbia Management Investment Advisers, LLC since May 2010; Manager, Managing Director and Chief Investment Officer, Columbia Management Advisors, LLC, 2007-April 2010. | |
Michael E. DeFao
225 Franklin Street
Boston, MA 02110
Born 1968 | | Vice President (2011) and Assistant Secretary (2010) | | Vice President and Chief Counsel, Ameriprise Financial, Inc. since May 2010; Associate General Counsel, Bank of America, 2005-April 2010. | |
Joseph F. DiMaria
225 Franklin Street
Boston, MA 02110
Born 1968 | | Vice President (2011), Assistant Treasurer (2012) and Chief Accounting Officer (2008) | | Vice President — Mutual Fund Treasurer, Columbia Management Investment Advisers, LLC since May 2010; Director of Fund Administration, Columbia Management Advisors, LLC, 2006-April 2010. | |
Amy Johnson
5228 Ameriprise
Financial Center
Minneapolis, MN 55474
Born 1965 | | Vice President (2006) | | Managing Director and Chief Operating Officer, Columbia Management Investment Advisers, LLC since May 2010 (previously Chief Administrative Officer, 2009-April 2010, and Vice President — Asset Management and Trust Company Services, 2006-2009). | |
Lyn Kephart-Strong
5228 Ameriprise
Financial Center
Minneapolis, MN 55474
Born 1960 | | Vice President (2015) | | President, Columbia Management Investment Services Corp. since October 2014; Vice President & Resolution Officer, Ameriprise Trust Company since August 2009; President, RiverSource Service Corporation 2004-2010. | |
Ryan C. Larrenaga
225 Franklin Street
Boston, MA 02110
Born 1970 | | Vice President and Secretary (2015) | | Vice President and Group Counsel, Ameriprise Financial, Inc. since August 2011 (previously, Counsel from May 2010 to August 2011); Assistant General Counsel, Bank of America, 2005-April 2010; officer of Columbia Funds and affiliated funds since 2005. | |
Annual Report 2015
40
COLUMBIA PACIFIC/ASIA FUND
IMPORTANT INFORMATION ABOUT THIS REPORT
Each fund mails one shareholder report to each shareholder address. If you would like more than one report, please call shareholder services at 800.345.6611 and additional reports will be sent to you.
The policy of the Board is to vote the proxies of the companies in which each fund holds investments consistent with the procedures as stated in the Statement of Additional Information (SAI). You may obtain a copy of the SAI without charge by calling 800.345.6611; contacting your financial intermediary; visiting columbiathreadneedle.com/us; or searching the website of the Securities and Exchange Commission (SEC) at sec.gov. Information regarding how each fund voted proxies relating to portfolio securities is filed with the SEC by August 31st for the most recent 12-month period ending June 30th of that year, and is available without charge by visiting columbiathreadneedle.com/us, or searching the website of the SEC at sec.gov.
Each fund files a complete schedule of portfolio holdings with the SEC for the first and third quarters of each fiscal year on Form N-Q. Each fund's Form N-Q is available on the SEC's website at sec.gov and may be reviewed and copied at the SEC's Public Reference Room in Washington, D.C. Information on the operation of the Public Reference Room may be obtained by calling 800.SEC.0330. Each fund's complete schedule of portfolio holdings, as filed on Form N-Q, can also be obtained without charge, upon request, by calling 800.345.6611.
Annual Report 2015
41
Columbia Pacific/Asia Fund
P.O. Box 8081
Boston, MA 02266-8081

This information is for use with concurrent or prior delivery of a fund prospectus. Please read and consider the investment objectives, risks, charges and expenses for any fund carefully before investing. For a prospectus and summary prospectus, which contains this and other important information about the Fund, go to columbiathreadneedle.com/us. The Fund is distributed by Columbia Management Investment Distributors, Inc., member FINRA, and managed by Columbia Management Investment Advisers, LLC.
Columbia Threadneedle Investments (Columbia Threadneedle) is the global brand name of the Columbia and Threadneedle group of companies.
All rights reserved. Columbia Management Investment Distributors, Inc., 225 Franklin Street, Boston, MA 02110-2804
© 2015 Columbia Management Investment Advisers, LLC.
columbiathreadneedle.com/us
ANN209_03_E01_(05/15)

ANNUAL REPORT
March 31, 2015

COLUMBIA SELECT LARGE CAP GROWTH FUND


ABOUT COLUMBIA THREADNEEDLE INVESTMENTS
Columbia Threadneedle Investments is a leading global asset management group that provides a broad range of actively managed investment strategies and solutions for individual, institutional and corporate clients around the world.
With more than 2,000 people, including over 450 investment professionals based in North America, Europe and Asia, we manage $506 billion* of assets across developed and emerging market equities, fixed income, asset allocation solutions and alternatives. We are the 11th largest manager of long-term mutual fund assets in the U.S.** and the 5th largest manager of retail funds in the U.K.***
Our priority is the investment success of our clients. We aim to deliver the investment outcomes they expect through an investment approach that is team-based, performance-driven and risk-aware. Our culture is dynamic and interactive. By sharing our insights across asset classes and geographies, we generate richer perspectives on global, regional and local investment landscapes. The ability to exchange and debate investment ideas in a collaborative environment enriches our teams' investment processes. More importantly, it results in better informed investment decisions for our clients.
Columbia funds are distributed by Columbia Management Investment Distributors, Inc., member FINRA, and managed by Columbia Management Investment Advisers, LLC.
Columbia Threadneedle Investments (Columbia Threadneedle) is the global brand name of the Columbia and Threadneedle group of companies.
* In U.S. dollars as of December 31, 2014. Source: Ameriprise Q4 Earnings Release. Includes all assets managed by entities in the Columbia and Threadneedle groups of companies. Contact us for more current data.
** Source: ICI as of December 31, 2014 for Columbia Management Investment Advisers, LLC.
*** Source: Investment Association as of December 2014 for Threadneedle Asset Management Limited.
© 2015 Columbia Management Investment Advisers, LLC. All rights reserved.
Not part of the shareholder report
 Dear Shareholder,
In a world that is changing faster than ever before, investors want asset managers who offer a global perspective while generating strong and sustainable returns. To that end, Columbia Management, in conjunction with its U.K.-based affiliate, Threadneedle Investments, has rebranded to Columbia Threadneedle Investments. The new global brand represents the combined capabilities, resources and reach of the global group, offering investors access to the best of both firms.
With a presence in 18 countries and more than 450 investment professionals*, our collective perspective and world view as Columbia Threadneedle Investments gives us deeper insight into what might affect the real-life financial outcomes clients are seeking. Putting our views into a global context enables us to build richer perspectives and create the right solutions, and provides us with enhanced capabilities to deliver consistent investment performance, which may ultimately lead to better investor outcomes.
As a result of the rebrand, you will begin to see our new logo and colors reflected in printed materials, such as this shareholder report, as well as on our new website — columbiathreadneedle.com/us. We encourage you to visit us online and view a new video on the "About Us" tab that speaks to the strength of the firm.
While we are introducing a new brand, in many ways, the investment company you know well has not changed. The following remain in effect:
n Fund and strategy names
n Established investment teams, philosophies and processes
n Account services, features, servicing phone numbers and mailing addresses
n Columbia Management Investment Distributors as distributor and Columbia Management Investment Advisers as investment adviser
We recognize that the money we manage represents the hard work and savings of people like you, and that everyone has different ambitions and different definitions of success. Investors have varying goals — funding their children's education, enjoying their retirement, putting money aside for unexpected events, and more. Whatever your ambitions, we believe our wide range of investment products and solutions can help give you confidence that you will reach your goals.
The world is constantly changing, but our priority remains the same: to help you secure your finances, meet your goals and achieve success. Thank you for your continued investment with us. Our service representatives are available at 800.345.6611 to help with any questions.
Sincerely,

Christopher O. Petersen
President, Columbia Funds
Investors should consider the investment objectives, risks, charges and expenses of a mutual fund carefully before investing. For a free prospectus and summary prospectus, which contains this and other important information about a fund, visit columbiathreadneedle.com/us. The prospectus should be read carefully before investing.
* Source: Ameriprise as of December 1, 2014
Columbia Funds are distributed by Columbia Management Investment Distributors, Inc., member FINRA, and managed by Columbia Management Investment Advisers, LLC.
© 2015 Columbia Management Investment Advisers, LLC. All rights reserved.
COLUMBIA SELECT LARGE CAP GROWTH FUND
Fund Investment Manager
Columbia Management Investment
Advisers, LLC
225 Franklin Street
Boston, MA 02110
Fund Distributor
Columbia Management Investment
Distributors, Inc.
225 Franklin Street
Boston, MA 02110
Fund Transfer Agent
Columbia Management Investment
Services Corp.
P.O. Box 8081
Boston, MA 02266-8081
For more information about any of the funds, please visit columbiathreadneedle.com/us or call 800.345.6611. Customer Service Representatives are available to answer your questions Monday through Friday from 8 a.m. to 7 p.m. Eastern time.
The views expressed in this report reflect the current views of the respective parties. These views are not guarantees of future performance and involve certain risks, uncertainties and assumptions that are difficult to predict, so actual outcomes and results may differ significantly from the views expressed. These views are subject to change at any time based upon economic, market or other conditions and the respective parties disclaim any responsibility to update such views. These views may not be relied on as investment advice and, because investment decisions for a Columbia fund are based on numerous factors, may not be relied on as an indication of trading intent on behalf of any particular Columbia fund. References to specific securities should not be construed as a recommendation or investment advice.
Performance Overview | | | 3 | | |
Manager Discussion of Fund Performance | | | 5 | | |
Understanding Your Fund's Expenses | | | 8 | | |
Portfolio of Investments | | | 9 | | |
Statement of Assets and Liabilities | | | 13 | | |
Statement of Operations | | | 15 | | |
Statement of Changes in Net Assets | | | 16 | | |
Financial Highlights | | | 19 | | |
Notes to Financial Statements | | | 28 | | |
Report of Independent Registered
Public Accounting Firm | | | 35 | | |
Federal Income Tax Information | | | 36 | | |
Trustees and Officers | | | 37 | | |
Important Information About This Report | | | 41 | | |
COLUMBIA SELECT LARGE CAP GROWTH FUND
Performance Summary
n Columbia Select Large Cap Growth Fund (the Fund) Class A shares returned 14.42% excluding sales charges for the 12-month period that ended March 31, 2015.
n The Fund underperformed its benchmark, the Russell 1000 Growth Index, which returned 16.09% for the same time period.
n Stock selection in the consumer discretionary, information technology and industrials sectors generally accounted for the Fund's modest shortfall relative to the benchmark.
Average Annual Total Returns (%) (for period ended March 31, 2015)
| | | Inception | | 1 Year | | 5 Years | | 10 Years | |
Class A* | | 09/28/07 | | | | | | | | | | | | | |
Excluding sales charges | | | | | | | 14.42 | | | | 16.62 | | | | 10.95 | | |
Including sales charges | | | | | | | 7.86 | | | | 15.24 | | | | 10.29 | | |
Class C* | | 09/28/07 | | | | | | | | | | | | | |
Excluding sales charges | | | | | | | 13.62 | | | | 15.77 | | | | 10.13 | | |
Including sales charges | | | | | | | 12.66 | | | | 15.77 | | | | 10.13 | | |
Class I* | | 09/27/10 | | | 14.96 | | | | 17.14 | | | | 11.32 | | |
Class R | | 12/31/04 | | | 14.16 | | | | 16.35 | | | | 10.65 | | |
Class R4* | | 11/08/12 | | | 14.76 | | | | 16.93 | | | | 11.22 | | |
Class R5* | | 11/08/12 | | | 14.89 | | | | 17.01 | | | | 11.25 | | |
Class W* | | 09/27/10 | | | 14.41 | | | | 16.62 | | | | 10.93 | | |
Class Y* | | 11/08/12 | | | 14.91 | | | | 17.04 | | | | 11.27 | | |
Class Z | | 10/01/97 | | | 14.74 | | | | 16.92 | | | | 11.21 | | |
Russell 1000 Growth Index | | | | | | | 16.09 | | | | 15.63 | | | | 9.36 | | |
Returns for Class A are shown with and without the maximum initial sales charge of 5.75%. Returns for Class C are shown with and without the applicable contingent deferred sales charge (CDSC) of 1.00% in the first year only. The Fund's other classes are not subject to sales charges and have limited eligibility. Please see the Fund's prospectus for details. Performance for different share classes will vary based on differences in sales charges and fees associated with each class. All results shown assume reinvestment of distributions during the period. Returns do not reflect the deduction of taxes that a shareholder may pay on Fund distributions or on the redemption of Fund shares. Performance results reflect the effect of any fee waivers or reimbursements of Fund expenses by Columbia Management Investment Advisers, LLC and/or any of its affiliates. Absent these fee waivers or expense reimbursement arrangements, performance results would have been lower.
The performance information shown represents past performance and is not a guarantee of future results. The investment return and principal value of your investment will fluctuate so that your shares, when redeemed, may be worth more or less than their original cost. Current performance may be lower or higher than the performance information shown. You may obtain performance information current to the most recent month-end by contacting your financial intermediary, visiting columbiathreadneedle.com/us or calling 800.345.6611.
*The returns shown for periods prior to the share class inception date (including returns for the Life of the Fund, if shown, which are since Fund inception) include the returns of the Fund's oldest share class. These returns are adjusted to reflect any higher class-related operating expenses of the newer share classes, as applicable. Please visit columbiathreadneedle.com/us/investment-products/mutual-funds/appended-performance for more information.
The Russell 1000 Growth Index, an unmanaged index, measures the performance of those Russell 1000 Index companies with higher price-to-book ratios and higher forecasted growth values.
Indices are not available for investment, are not professionally managed and do not reflect sales charges, fees, brokerage commissions, taxes or other expenses of investing. Securities in the Fund may not match those in an index.
Annual Report 2015
3
COLUMBIA SELECT LARGE CAP GROWTH FUND
PERFORMANCE OVERVIEW (continued)
Performance of a Hypothetical $10,000 Investment (April 1, 2005 – March 31, 2015)

The chart above shows the change in value of a hypothetical $10,000 investment in Class A shares of Columbia Select Large Cap Growth Fund during the stated time period, and does not reflect the deduction of taxes that a shareholder may pay on Fund distributions or on the redemption of Fund shares.
Annual Report 2015
4
COLUMBIA SELECT LARGE CAP GROWTH FUND
MANAGER DISCUSSION OF FUND PERFORMANCE
For the 12-month period that ended March 31, 2015, the Fund's Class A shares returned 14.42% excluding sales charges. The Fund underperformed its benchmark, the Russell 1000 Growth Index, which returned 16.09% for the same time period. Stock selection in the consumer discretionary, information technology and industrials sectors generally accounted for the Fund's modest shortfall relative to the benchmark. An emphasis on health care stocks, combined with superior stock selection in biotechnology, benefited the Fund's relative results.
Stocks Climbed as U.S. Economy Strengthened
After a cold and difficult winter brought many parts of the United States to a standstill early in 2014, the pace of U.S. economic growth picked up and good news appeared in many sectors. The labor market added 261,000 new jobs monthly, on average, during the 12-month period ended March 31, 2015. Solid new job growth drove the unemployment rate down to 5.5%, and prospects for higher wages generally buoyed consumer confidence during the period. Manufacturing activity remained solid, as capacity utilization rose to a post-recovery high late in 2014. However, another stormy winter in the Northeast and Midwest nipped growth early in 2015. Manufacturing activity and consumer confidence slipped somewhat as harsh weather weighed on short-term expectations. The housing market's recovery was restrained by both periods of bad weather, tighter borrowing standards, rising prices, declining inventories and higher mortgage rates.
Investors responded favorably to the generally good economic news. However, concerns about increased global tensions, uncertainty about the Federal Reserve's (the Fed's) next move and sinking oil prices resulted in bouts of volatility that became more pronounced as the period wore on. The Fed spent 2014 winding down its monthly bond purchases, ending its program of quantitative easing in October, and suggested that it would raise short-term interest rates sometime in 2015. However, the timing of that move remained unclear at period end, especially as some weaker data appeared in the final months of the period. In this environment, mid- and large-company stocks were the strongest equity market performers, outperforming small-cap stocks by a solid margin. Growth stocks comfortably outperformed value stocks for the period.
Against this backdrop, the Fund's high growth-oriented portfolio came under pressure early in the period, as investors focused on the impact of bad winter weather on the U.S. economy and the general surprise of declining interest rates. Shares of companies with some of the highest growth rates were sold in favor of more value-oriented fare. As the year progressed, investors seemed to focus more on corporate earnings, which favored the high quality growth companies that the Fund invests in. The Fund outperformed its benchmark in the second half of the 12-month period but could not make up enough ground to overcome the early spring sell-off. Nevertheless, it delivered a solid double-digit return for the year.
Contributors and Detractors
The Fund's substantial positions in biotechnology names within the health care sector aided results and amplified gains. Within biotechnology, the
Portfolio Management
Thomas Galvin, CFA
Todd Herget
Richard Carter
Morningstar Style BoxTM
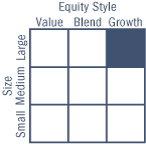
The Morningstar Style BoxTM is based on a fund's portfolio holdings. For equity funds, the vertical axis shows the market capitalization of the stocks owned, and the horizontal axis shows investment style (value, blend, or growth). Information shown is based on the most recent data provided by Morningstar.
© 2015 Morningstar, Inc. All rights reserved. The Morningstar information contained herein: (1) is proprietary to Morningstar and/or its content providers; (2) may not be copied or distributed; and (3) is not warranted to be accurate, complete or timely. Neither Morningstar nor its content providers are responsible for any damages or losses arising from any use of this information.
Top Ten Holdings (%)
(at March 31, 2015) | |
Amazon.com, Inc. | | | 4.4 | | |
Priceline Group, Inc. (The) | | | 4.3 | | |
Twitter, Inc. | | | 4.2 | | |
Bristol-Myers Squibb Co. | | | 4.1 | | |
salesforce.com, Inc. | | | 4.0 | | |
LinkedIn Corp., Class A | | | 3.8 | | |
Vertex Pharmaceuticals, Inc. | | | 3.7 | | |
Illumina, Inc. | | | 3.7 | | |
Facebook, Inc., Class A | | | 3.7 | | |
Biogen, Inc. | | | 3.6 | | |
Percentages indicated are based upon total investments (excluding Money Market Funds).
For further detail about these holdings, please refer to the section entitled "Portfolio of Investments."
Fund holdings are as of the date given, are subject to change at any time, and are not recommendations to buy or sell any security.
Annual Report 2015
5
COLUMBIA SELECT LARGE CAP GROWTH FUND
MANAGER DISCUSSION OF FUND PERFORMANCE (continued)
Portfolio Breakdown (%)
(at March 31, 2015) | |
Common Stocks | | | 98.4 | | |
Consumer Discretionary | | | 19.4 | | |
Energy | | | 5.7 | | |
Health Care | | | 25.5 | | |
Industrials | | | 2.1 | | |
Information Technology | | | 43.3 | | |
Materials | | | 2.4 | | |
Money Market Funds | | | 1.6 | | |
Total | | | 100.0 | | |
Percentages indicated are based upon total investments. The Fund's portfolio composition is subject to change.
Investment Risks
Market risk may affect a single issuer, sector of the economy, industry or the market as a whole. Growth securities, at times, may not perform as well as value securities or the stock market in general and may be out of favor with investors. Foreign investments subject the Fund to risks, including political, economic, market, social and others within a particular country, as well as to currency instabilities and less stringent financial and accounting standards generally applicable to U.S. issuers. Investments in a limited number of companies or sectors, subject the Fund to greater risk of loss. The Fund may invest significantly in issuers within a particular sector, which may be negatively affected by market, economic or other conditions, making the Fund more vulnerable to unfavorable developments in the sector. See the Fund's prospectus for more information on these and other risks.
Fund benefited from investments in Pharmacyclics, which is focused on the development and commercialization of small molecule drugs for oncology and immunology; Vertex Pharmaceuticals, which develops cystic fibrosis therapies; Alexion Pharmaceuticals, which focuses on rare blood disorders; Celgene, which manufactures drug therapies for cancer and inflammatory disorders; and Gilead Sciences, which specializes in HIV and hepatitis C treatments. Pharmacyclics shares more than doubled in price, as the company announced faster-than-expected market penetration of its leading drug Imbruvica. An announcement of a buyout by pharmaceutical company AbbVie sent Pharmacyclics shares even higher. We exited the position and took profits on news of the deal, redeploying assets into Intercept Pharmaceuticals and other existing holdings.
Intercept Pharmaceuticals is focused on developing and commercializing therapeutics to treat chronic liver diseases. If the drug is approved, it has the potential for significant sales and earnings growth for years to come. We sold Gilead Sciences as it approached our price target in early December.
Despite some major disappointments in the consumer discretionary sector, a position in Tractor Supply was a notable outperformer. The company is a rural-lifestyle retailer headquartered in Tennessee, with more than 1,300 stores in 48 states. It offers a wide range of products from livestock supplies and hardware to clothing and agricultural products. During the period, the company announced better-than-expected comparative data and raised future earnings guidance, which sent the stock sharply higher.
Stock selection in the consumer discretionary, information technology and industrials sectors detracted from the Fund's relative results. Within the consumer discretionary sector, the Fund's position in fashion apparel designer Michael Kors was a notable detractor. Shares declined in the double digits in a period of mixed results for many higher end retailers, as a strong U.S. dollar weighed on international sales. Michael Kors continued to deliver strong top-line sales growth; however, investor concerns regarding margins sent its share price lower. We maintain the Fund's position, as we continue to believe that the company is well positioned to take additional market share within the affordable luxury segment of consumer spending. In addition, priceline.com trended lower in the second half of 2014, despite a solid fourth quarter, as weakness in Europe, foreign currency effects and tougher year-over-year comparisons weighed on near-term earnings expectations. Media firm Discovery Communications was also a notable detractor, owing to disappointing results and lowered forward earnings guidance. We sold the position.
In the technology sector, positions in VMware, a global leader in server virtualization; Splunk, an enterprise software company focused on machine-generated log data; and ARM Holdings, which makes energy efficient semiconductors, detracted from relative results in the information technology sector, outweighing positive results from positions in social media names LinkedIn, Facebook and Chinese internet search leader Baidu. Splunk shares fell along with many other big data, cloud-related names during the spring selloff of high growth names. ARM Holdings
Annual Report 2015
6
COLUMBIA SELECT LARGE CAP GROWTH FUND
MANAGER DISCUSSION OF FUND PERFORMANCE (continued)
shares declined on concerns that royalty streams would be lower than expected while smartphone inventories continue to correct and concerns that the Chinese "4G" market — short for fourth generation mobile technology — buildout was proceeding at a pace that was slower than anticipated. We continue to like ARM Holdings, as it is one of the industry's best opportunities for long-term secular growth. Both companies performed better in the second half of the period, but were still detractors for the year.
In industrials, positions in industrial fastener distributor Fastenal and aerospace metal component supplier Precision Castparts held back relative results. Fastenal shares declined as the company posted disappointing sales and noted a slowdown in sales to oil and gas customers. We exited the position, as the company's prospects deteriorated relative to our prior expectations.
Looking Ahead
The final months of the 12-month period were marked by volatility as investors continued to sort out the impact of continued low energy prices, the potential for an increase in short-term borrowing rates, the continued impact of a strong dollar and the potential for slowing economic growth. Of these factors, we are especially interested at this time in the impact of the strong dollar on corporate earnings and demand for U.S. goods and services. Yet, we presently remain optimistic about the Fund's prospects and constructive on the broader equity market, especially relative to other investment options. Projected earnings for large U.S. companies have started to come down, and lower energy prices are currently proving to be a headwind for many industrial firms. The tradeoff is that consumer activity, which makes up nearly two-thirds of U.S. economic activity, should benefit from lower energy prices. In this environment, we continue to seek companies that offer differentiated products and services with the potential to achieve earnings growth that exceeds the growth of competitors who lack differentiation.
Annual Report 2015
7
COLUMBIA SELECT LARGE CAP GROWTH FUND
UNDERSTANDING YOUR FUND'S EXPENSES
(Unaudited)
As an investor, you incur two types of costs. There are transaction costs, which generally include sales charges on purchases and may include redemption fees. There are also ongoing costs, which generally include management fees, distribution and/or service fees, and other fund expenses. The following information is intended to help you understand your ongoing costs (in dollars) of investing in the Fund and to help you compare these costs with the ongoing costs of investing in other mutual funds.
Analyzing Your Fund's Expenses
To illustrate these ongoing costs, we have provided examples and calculated the expenses paid by investors in each share class of the Fund during the period. The actual and hypothetical information in the table is based on an initial investment of $1,000 at the beginning of the period indicated and held for the entire period. Expense information is calculated two ways and each method provides you with different information. The amount listed in the "Actual" column is calculated using the Fund's actual operating expenses and total return for the period. You may use the Actual information, together with the amount invested, to estimate the expenses that you paid over the period. Simply divide your account value by $1,000 (for example, an $8,600 account value divided by $1,000 = 8.6), then multiply the results by the expenses paid during the period under the "Actual" column. The amount listed in the "Hypothetical" column assumes a 5% annual rate of return before expenses (which is not the Fund's actual return) and then applies the Fund's actual expense ratio for the period to the hypothetical return. You should not use the hypothetical account values and expenses to estimate either your actual account balance at the end of the period or the expenses you paid during the period. See "Compare With Other Funds" below for details on how to use the hypothetical data.
Compare With Other Funds
Since all mutual funds are required to include the same hypothetical calculations about expenses in shareholder reports, you can use this information to compare the ongoing cost of investing in the Fund with other funds. To do so, compare the hypothetical example with the 5% hypothetical examples that appear in the shareholder reports of other funds. As you compare hypothetical examples of other funds, it is important to note that hypothetical examples are meant to highlight the ongoing costs of investing in a fund only and do not reflect any transaction costs, such as sales charges, or redemption or exchange fees. Therefore, the hypothetical calculations are useful in comparing ongoing costs only, and will not help you determine the relative total costs of owning different funds. If transaction costs were included in these calculations, your costs would be higher.
October 1, 2014 – March 31, 2015
| | | Account Value at the Beginning
of the Period ($) | | Account Value at the End of the
Period ($) | | Expenses Paid During the
Period ($) | | Fund's Annualized
Expense Ratio (%) | |
| | | Actual | | Hypothetical | | Actual | | Hypothetical | | Actual | | Hypothetical | | Actual | |
Class A | | | 1,000.00 | | | | 1,000.00 | | | | 1,099.60 | | | | 1,019.45 | | | | 5.76 | | | | 5.54 | | | | 1.10 | | |
Class C | | | 1,000.00 | | | | 1,000.00 | | | | 1,096.00 | | | | 1,015.71 | | | | 9.67 | | | | 9.30 | | | | 1.85 | | |
Class I | | | 1,000.00 | | | | 1,000.00 | | | | 1,102.30 | | �� | | 1,021.69 | | | | 3.41 | | | | 3.28 | | | | 0.65 | | |
Class R | | | 1,000.00 | | | | 1,000.00 | | | | 1,098.80 | | | | 1,018.20 | | | | 7.06 | | | | 6.79 | | | | 1.35 | | |
Class R4 | | | 1,000.00 | | | | 1,000.00 | | | | 1,101.70 | | | | 1,020.69 | | | | 4.45 | | | | 4.28 | | | | 0.85 | | |
Class R5 | | | 1,000.00 | | | | 1,000.00 | | | | 1,102.10 | | | | 1,021.44 | | | | 3.67 | | | | 3.53 | | | | 0.70 | | |
Class W | | | 1,000.00 | | | | 1,000.00 | | | | 1,099.60 | | | | 1,019.45 | | | | 5.76 | | | | 5.54 | | | | 1.10 | | |
Class Y | | | 1,000.00 | | | | 1,000.00 | | | | 1,102.00 | | | | 1,021.69 | | | | 3.41 | | | | 3.28 | | | | 0.65 | | |
Class Z | | | 1,000.00 | | | | 1,000.00 | | | | 1,101.40 | | | | 1,020.69 | | | | 4.45 | | | | 4.28 | | | | 0.85 | | |
Expenses paid during the period are equal to the annualized expense ratio for each class as indicated above, multiplied by the average account value over the period and then multiplied by the number of days in the Fund's most recent fiscal half year and divided by 365.
Expenses do not include fees and expenses incurred indirectly by the Fund from its investment in underlying funds, including affiliated and non-affiliated pooled investment vehicles, such as mutual funds and exchange-traded funds.
Annual Report 2015
8
COLUMBIA SELECT LARGE CAP GROWTH FUND
PORTFOLIO OF INVESTMENTS
March 31, 2015
(Percentages represent value of investments compared to net assets)
Common Stocks 99.4%
Issuer | | Shares | | Value ($) | |
CONSUMER DISCRETIONARY 19.6% | |
Automobiles 1.9% | |
Tesla Motors, Inc.(a) | | | 723,257 | | | | 136,529,224 | | |
Internet & Catalog Retail 8.7% | |
Amazon.com, Inc.(a) | | | 840,788 | | | | 312,857,215 | | |
Priceline Group, Inc. (The)(a) | | | 262,903 | | | | 306,058,527 | | |
Total | | | | | 618,915,742 | | |
Specialty Retail 2.8% | |
Tractor Supply Co. | | | 2,304,318 | | | | 196,005,289 | | |
Textiles, Apparel & Luxury Goods 6.2% | |
Michael Kors Holdings Ltd.(a) | | | 2,795,063 | | | | 183,775,392 | | |
Nike, Inc., Class B | | | 2,535,720 | | | | 254,408,788 | | |
Total | | | | | 438,184,180 | | |
Total Consumer Discretionary | | | | | 1,389,634,435 | | |
ENERGY 5.8% | |
Energy Equipment & Services 2.2% | |
FMC Technologies, Inc.(a) | | | 4,280,169 | | | | 158,409,054 | | |
Oil, Gas & Consumable Fuels 3.6% | |
Cabot Oil & Gas Corp. | | | 8,543,230 | | | | 252,281,582 | | |
Total Energy | | | | | 410,690,636 | | |
HEALTH CARE 25.7% | |
Biotechnology 16.1% | |
Alexion Pharmaceuticals, Inc.(a) | | | 1,404,374 | | | | 243,378,014 | | |
Biogen, Inc.(a) | | | 604,902 | | | | 255,413,820 | | |
Celgene Corp.(a) | | | 2,101,472 | | | | 242,257,692 | | |
Intercept Pharmaceuticals, Inc.(a) | | | 490,383 | | | | 138,297,814 | | |
Vertex Pharmaceuticals, Inc.(a) | | | 2,227,395 | | | | 262,765,788 | | |
Total | | | | | 1,142,113,128 | | |
Life Sciences Tools & Services 3.7% | |
Illumina, Inc.(a) | | | 1,411,462 | | | | 262,023,806 | | |
Pharmaceuticals 5.9% | |
Bristol-Myers Squibb Co. | | | 4,517,593 | | | | 291,384,749 | | |
Novo Nordisk A/S, ADR | | | 2,436,773 | | | | 130,099,310 | | |
Total | | | | | 421,484,059 | | |
Total Health Care | | | | | 1,825,620,993 | | |
Common Stocks (continued)
Issuer | | Shares | | Value ($) | |
INDUSTRIALS 2.1% | |
Aerospace & Defense 2.1% | |
Precision Castparts Corp. | | | 702,205 | | | | 147,463,050 | | |
Total Industrials | | | | | 147,463,050 | | |
INFORMATION TECHNOLOGY 43.7% | |
Internet Software & Services 20.7% | |
Alibaba Group Holding Ltd., ADR(a) | | | 2,508,144 | | | | 208,777,907 | | |
Baidu, Inc., ADR(a) | | | 1,203,445 | | | | 250,797,938 | | |
Facebook, Inc., Class A(a) | | | 3,142,343 | | | | 258,347,730 | | |
LinkedIn Corp., Class A(a) | | | 1,064,606 | | | | 266,002,455 | | |
MercadoLibre, Inc. | | | 1,549,488 | | | | 189,843,270 | | |
Twitter, Inc.(a) | | | 5,892,318 | | | | 295,087,285 | | |
Total | | | | | 1,468,856,585 | | |
IT Services 6.7% | |
Cognizant Technology Solutions Corp.,
Class A(a) | | | 3,581,787 | | | | 223,467,691 | | |
Visa, Inc., Class A | | | 3,900,376 | | | | 255,123,594 | | |
Total | | | | | 478,591,285 | | |
Semiconductors & Semiconductor Equipment 2.9% | |
ARM Holdings PLC, ADR | | | 4,155,410 | | | | 204,861,713 | | |
Software 13.4% | |
Mobileye NV(a) | | | 3,397,079 | | | | 142,779,230 | | |
salesforce.com, Inc.(a) | | | 4,237,516 | | | | 283,108,444 | | |
ServiceNow, Inc.(a) | | | 1,390,790 | | | | 109,566,436 | | |
Splunk, Inc.(a) | | | 3,832,393 | | | | 226,877,666 | | |
VMware, Inc., Class A(a) | | | 2,260,300 | | | | 185,367,203 | | |
Total | | | | | 947,698,979 | | |
Total Information Technology | | | | | 3,100,008,562 | | |
MATERIALS 2.5% | |
Chemicals 2.5% | |
Monsanto Co. | | | 1,549,985 | | | | 174,435,312 | | |
Total Materials | | | | | 174,435,312 | | |
Total Common Stocks
(Cost: $4,667,022,197) | | | | | 7,047,852,988 | | |
The accompanying Notes to Financial Statements are an integral part of this statement.
Annual Report 2015
9
COLUMBIA SELECT LARGE CAP GROWTH FUND
PORTFOLIO OF INVESTMENTS (continued)
March 31, 2015
Money Market Funds 1.6%
| | | Shares | | Value ($) | |
Columbia Short-Term Cash Fund,
0.123%(b)(c) | | | 116,529,953 | | | | 116,529,953 | | |
Total Money Market Funds
(Cost: $116,529,953) | | | | | 116,529,953 | | |
Total Investments
(Cost: $4,783,552,150) | | | | | 7,164,382,941 | | |
Other Assets & Liabilities, Net | | | | | (74,131,582 | ) | |
Net Assets | | | | | 7,090,251,359 | | |
Notes to Portfolio of Investments
(a) Non-income producing.
(b) As defined in the Investment Company Act of 1940, an affiliated company is one in which the Fund owns 5% or more of the company's outstanding voting securities, or a company which is under common ownership or control with the Fund. Holdings and transactions in these affiliated companies during the year ended March 31, 2015, are as follows:
Issuer | |
Beginning
Cost ($) | |
Purchase
Cost ($) | | Proceeds
From Sales ($) | | Realized
Gain (Loss) ($) | | Ending
Cost ($) | | Dividends —
Affiliated
Issuers ($) | | Value ($) | |
Columbia
Short-Term
Cash Fund | | | 112,206,652 | | | | 2,173,610,660 | | | | (2,169,287,359 | ) | | | — | | | | 116,529,953 | | | | 95,257 | | | | 116,529,953 | | |
MercadoLibre,
Inc.* | | | 272,572,884 | | | | 188,246,166 | | | | (206,226,819 | ) | | | (71,138,138 | ) | | | 183,454,093 | | | | 570,399 | | | | 189,843,270 | | |
Total | | | 384,779,536 | | | | 2,361,856,826 | | | | (2,375,514,178 | ) | | | (71,138,138 | ) | | | 299,984,046 | | | | 665,656 | | | | 306,373,223 | | |
*Issuer was not an affiliate for the entire period ended March 31, 2015.
(c) The rate shown is the seven-day current annualized yield at March 31, 2015.
Abbreviation Legend
ADR American Depositary Receipt
Fair Value Measurements
Generally accepted accounting principles (GAAP) require disclosure regarding the inputs and valuation techniques used to measure fair value and any changes in valuation inputs or techniques. In addition, investments shall be disclosed by major category.
The Fund categorizes its fair value measurements according to a three-level hierarchy that maximizes the use of observable inputs and minimizes the use of unobservable inputs by prioritizing that the most observable input be used when available. Observable inputs are those that market participants would use in pricing an investment based on market data obtained from sources independent of the reporting entity. Unobservable inputs are those that reflect the Fund's assumptions about the information market participants would use in pricing an investment. An investment's level within the fair value hierarchy is based on the lowest level of any input that is deemed significant to the asset or liability's fair value measurement. The input levels are not necessarily an indication of the risk or liquidity associated with investments at that level. For example, certain U.S. government securities are generally high quality and liquid, however, they are reflected as Level 2 because the inputs used to determine fair value may not always be quoted prices in an active market.
The accompanying Notes to Financial Statements are an integral part of this statement.
Annual Report 2015
10
COLUMBIA SELECT LARGE CAP GROWTH FUND
PORTFOLIO OF INVESTMENTS (continued)
March 31, 2015
Fair Value Measurements (continued)
Fair value inputs are summarized in the three broad levels listed below:
> Level 1 — Valuations based on quoted prices for investments in active markets that the Fund has the ability to access at the measurement date (including NAV for open-end mutual funds). Valuation adjustments are not applied to Level 1 investments.
> Level 2 — Valuations based on other significant observable inputs (including quoted prices for similar securities, interest rates, prepayment speeds, credit risks, etc.).
> Level 3 — Valuations based on significant unobservable inputs (including the Fund's own assumptions and judgment in determining the fair value of investments).
Inputs that are used in determining fair value of an investment may include price information, credit data, volatility statistics, and other factors. These inputs can be either observable or unobservable. The availability of observable inputs can vary between investments, and is affected by various factors such as the type of investment, and the volume and level of activity for that investment or similar investments in the marketplace. The inputs will be considered by the Investment Manager, along with any other relevant factors in the calculation of an investment's fair value. The Fund uses prices and inputs that are current as of the measurement date, which may include periods of market dislocations. During these periods, the availability of prices and inputs may be reduced for many investments. This condition could cause an investment to be reclassified between the various levels within the hierarchy.
Investments falling into the Level 3 category are primarily supported by quoted prices from brokers and dealers participating in the market for those investments. However, these may be classified as Level 3 investments due to lack of market transparency and corroboration to support these quoted prices. Additionally, valuation models may be used as the pricing source for any remaining investments classified as Level 3. These models may rely on one or more significant unobservable inputs and/or significant assumptions by the Investment Manager. Inputs used in valuations may include, but are not limited to, financial statement analysis, capital account balances, discount rates and estimated cash flows, and comparable company data.
Under the direction of the Fund's Board of Trustees (the Board), the Investment Manager's Valuation Committee (the Committee) is responsible for overseeing the valuation procedures approved by the Board. The Committee consists of voting and non-voting members from various groups within the Investment Manager's organization, including operations and accounting, trading and investments, compliance, risk management and legal.
The Committee meets at least monthly to review and approve valuation matters, which may include a description of specific valuation determinations, data regarding pricing information received from approved pricing vendors and brokers and the results of Board-approved valuation control policies and procedures (the Policies). The Policies address, among other things, instances when market quotations are or are not readily available, including recommendations of third party pricing vendors and a determination of appropriate pricing methodologies; events that require specific valuation determinations and assessment of fair value techniques; securities with a potential for stale pricing, including those that are illiquid, restricted, or in default; and the effectiveness of third party pricing vendors, including periodic reviews of vendors. The Committee meets more frequently, as needed, to discuss additional valuation matters, which may include the need to review back-testing results, review time-sensitive information or approve related valuation actions. The Committee reports to the Board, with members of the Committee meeting with the Board at each of its regularly scheduled meetings to discuss valuation matters and actions during the period, similar to those described earlier.
For investments categorized as Level 3, the Committee monitors information similar to that described above, which may include: (i) data specific to the issuer or comparable issuers, (ii) general market or specific sector news and (iii) quoted prices and specific or similar security transactions. The Committee considers this data and any changes from prior periods in order to assess the reasonableness of observable and unobservable inputs, any assumptions or internal models used to value those securities and changes in fair value. This data is also used to corroborate, when available, information received from approved pricing vendors and brokers. Various factors impact the frequency of monitoring this information (which may occur as often as daily). However, the Committee may determine that changes to inputs, assumptions and models are not required as a result of the monitoring procedures performed.
The accompanying Notes to Financial Statements are an integral part of this statement.
Annual Report 2015
11
COLUMBIA SELECT LARGE CAP GROWTH FUND
PORTFOLIO OF INVESTMENTS (continued)
March 31, 2015
Fair Value Measurements (continued)
The following table is a summary of the inputs used to value the Fund's investments at March 31, 2015:
Description | | Level 1
Quoted Prices in Active
Markets for Identical
Assets ($) | | Level 2
Other Significant
Observable Inputs ($) | | Level 3
Significant
Unobservable Inputs ($) | | Total ($) | |
Equity Securities | |
Common Stocks | |
Consumer Discretionary | | | 1,389,634,435 | | | | — | | | | — | | | | 1,389,634,435 | | |
Energy | | | 410,690,636 | | | | — | | | | — | | | | 410,690,636 | | |
Health Care | | | 1,825,620,993 | | | | — | | | | — | | | | 1,825,620,993 | | |
Industrials | | | 147,463,050 | | | | — | | | | — | | | | 147,463,050 | | |
Information Technology | | | 3,100,008,562 | | | | — | | | | — | | | | 3,100,008,562 | | |
Materials | | | 174,435,312 | | | | — | | | | — | | | | 174,435,312 | | |
Total Equity Securities | | | 7,047,852,988 | | | | — | | | | — | | | | 7,047,852,988 | | |
Mutual Funds | |
Money Market Funds | | | 116,529,953 | | | | — | | | | — | | | | 116,529,953 | | |
Total Mutual Funds | | | 116,529,953 | | | | — | | | | — | | | | 116,529,953 | | |
Total | | | 7,164,382,941 | | | | — | | | | — | | | | 7,164,382,941 | | |
See the Portfolio of Investments for all investment classifications not indicated in the table.
There were no transfers of financial assets between levels during the period.
The accompanying Notes to Financial Statements are an integral part of this statement.
Annual Report 2015
12
COLUMBIA SELECT LARGE CAP GROWTH FUND
STATEMENT OF ASSETS AND LIABILITIES
March 31, 2015
Assets | |
Investments, at value | |
Unaffiliated issuers (identified cost $4,667,022,197) | | $ | 7,047,852,988 | | |
Affiliated issuers (identified cost $116,529,953) | | | 116,529,953 | | |
Total investments (identified cost $4,783,552,150) | | | 7,164,382,941 | | |
Receivable for: | |
Investments sold | | | 63,749,889 | | |
Capital shares sold | | | 6,455,645 | | |
Dividends | | | 1,588,512 | | |
Prepaid expenses | | | 21,531 | | |
Trustees' deferred compensation plan | | | 124,892 | | |
Total assets | | | 7,236,323,410 | | |
Liabilities | |
Payable for: | |
Investments purchased | | | 134,616,236 | | |
Capital shares purchased | | | 9,294,519 | | |
Investment management fees | | | 114,145 | | |
Distribution and/or service fees | | | 17,041 | | |
Transfer agent fees | | | 1,705,350 | | |
Administration fees | | | 8,889 | | |
Compensation of board members | | | 8,068 | | |
Chief compliance officer expenses | | | 887 | | |
Other expenses | | | 182,024 | | |
Trustees' deferred compensation plan | | | 124,892 | | |
Total liabilities | | | 146,072,051 | | |
Net assets applicable to outstanding capital stock | | $ | 7,090,251,359 | | |
Represented by | |
Paid-in capital | | $ | 4,332,837,922 | | |
Excess of distributions over net investment income | | | (123,699 | ) | |
Accumulated net realized gain | | | 376,706,345 | | |
Unrealized appreciation (depreciation) on: | |
Investments | | | 2,380,830,791 | | |
Total — representing net assets applicable to outstanding capital stock | | $ | 7,090,251,359 | | |
The accompanying Notes to Financial Statements are an integral part of this statement.
Annual Report 2015
13
COLUMBIA SELECT LARGE CAP GROWTH FUND
STATEMENT OF ASSETS AND LIABILITIES (continued)
March 31, 2015
Class A | |
Net assets | | $ | 1,466,540,704 | | |
Shares outstanding | | | 79,298,920 | | |
Net asset value per share | | $ | 18.49 | | |
Maximum offering price per share(a) | | $ | 19.62 | | |
Class C | |
Net assets | | $ | 226,538,233 | | |
Shares outstanding | | | 13,082,589 | | |
Net asset value per share | | $ | 17.32 | | |
Class I | |
Net assets | | $ | 256,222,392 | | |
Shares outstanding | | | 13,479,367 | | |
Net asset value per share | | $ | 19.01 | | |
Class R | |
Net assets | | $ | 23,092,302 | | |
Shares outstanding | | | 1,301,875 | | |
Net asset value per share | | $ | 17.74 | | |
Class R4 | |
Net assets | | $ | 17,987,906 | | |
Shares outstanding | | | 936,086 | | |
Net asset value per share | | $ | 19.22 | | |
Class R5 | |
Net assets | | $ | 754,743,881 | | |
Shares outstanding | | | 39,183,803 | | |
Net asset value per share | | $ | 19.26 | | |
Class W | |
Net assets | | $ | 42,248,295 | | |
Shares outstanding | | | 2,284,512 | | |
Net asset value per share | | $ | 18.49 | | |
Class Y | |
Net assets | | $ | 27,581,338 | | |
Shares outstanding | | | 1,422,141 | | |
Net asset value per share | | $ | 19.39 | | |
Class Z | |
Net assets | | $ | 4,275,296,308 | | |
Shares outstanding | | | 226,929,550 | | |
Net asset value per share | | $ | 18.84 | | |
(a) The maximum offering price per share is calculated by dividing the net asset value per share by 1.0 minus the maximum sales charge of 5.75%.
The accompanying Notes to Financial Statements are an integral part of this statement.
Annual Report 2015
14
COLUMBIA SELECT LARGE CAP GROWTH FUND
STATEMENT OF OPERATIONS
Year Ended March 31, 2015
Net investment income | |
Income: | |
Dividends — unaffiliated issuers | | $ | 23,742,043 | | |
Dividends — affiliated issuers | | | 665,656 | | |
Total income | | | 24,407,699 | | |
Expenses: | |
Investment management fees | | | 40,020,937 | | |
Distribution and/or service fees | |
Class A | | | 3,677,732 | | |
Class C | | | 2,050,521 | | |
Class R | | | 105,410 | | |
Class W | | | 99,150 | | |
Transfer agent fees | |
Class A | | | 2,872,647 | | |
Class C | | | 401,101 | | |
Class R | | | 41,239 | | |
Class R4 | | | 31,586 | | |
Class R5 | | | 325,794 | | |
Class W | | | 77,544 | | |
Class Z | | | 8,159,896 | | |
Administration fees | | | 3,122,847 | | |
Compensation of board members | | | 177,908 | | |
Custodian fees | | | 44,469 | | |
Printing and postage fees | | | 398,311 | | |
Registration fees | | | 201,297 | | |
Professional fees | | | 222,228 | | |
Line of credit interest expense | | | 310 | | |
Chief compliance officer expenses | | | 3,594 | | |
Other | | | 277,199 | | |
Total expenses | | | 62,311,720 | | |
Expense reductions | | | (2,550 | ) | |
Total net expenses | | | 62,309,170 | | |
Net investment loss | | | (37,901,471 | ) | |
Realized and unrealized gain (loss) — net | |
Net realized gain (loss) on: | |
Investments — unaffiliated issuers | | | 981,879,510 | | |
Investments — affiliated issuers | | | (71,138,138 | ) | |
Net realized gain | | | 910,741,372 | | |
Net change in unrealized appreciation (depreciation) on: | |
Investments — unaffiliated issuers | | | 29,552,561 | | |
Investments — affiliated issuers | | | 41,633,249 | | |
Net change in unrealized appreciation | | | 71,185,810 | | |
Net realized and unrealized gain | | | 981,927,182 | | |
Net increase in net assets resulting from operations | | $ | 944,025,711 | | |
The accompanying Notes to Financial Statements are an integral part of this statement.
Annual Report 2015
15
COLUMBIA SELECT LARGE CAP GROWTH FUND
STATEMENT OF CHANGES IN NET ASSETS
| | | Year Ended
March 31,
2015 | | Year Ended
March 31,
2014 | |
Operations | |
Net investment loss | | $ | (37,901,471 | ) | | $ | (37,776,122 | ) | |
Net realized gain | | | 910,741,372 | | | | 970,822,038 | | |
Net change in unrealized appreciation | | | 71,185,810 | | | | 617,203,992 | | |
Net increase in net assets resulting from operations | | | 944,025,711 | | | | 1,550,249,908 | | |
Distributions to shareholders | |
Net realized gains | |
Class A | | | (224,391,627 | ) | | | (54,722,500 | ) | |
Class C | | | (32,012,991 | ) | | | (5,586,569 | ) | |
Class I | | | (39,187,496 | ) | | | (9,907,359 | ) | |
Class R | | | (3,239,656 | ) | | | (635,235 | ) | |
Class R4 | | | (2,896,682 | ) | | | (265,929 | ) | |
Class R5 | | | (96,834,572 | ) | | | (21,254,199 | ) | |
Class W | | | (5,912,722 | ) | | | (839,796 | ) | |
Class Y | | | (3,379,406 | ) | | | (865,216 | ) | |
Class Z | | | (638,359,057 | ) | | | (150,305,360 | ) | |
Total distributions to shareholders | | | (1,046,214,209 | ) | | | (244,382,163 | ) | |
Increase in net assets from capital stock activity | | | 317,539,175 | | | | 397,818,812 | | |
Total increase in net assets | | | 215,350,677 | | | | 1,703,686,557 | | |
Net assets at beginning of year | | | 6,874,900,682 | | | | 5,171,214,125 | | |
Net assets at end of year | | $ | 7,090,251,359 | | | $ | 6,874,900,682 | | |
Excess of distributions over net investment income | | $ | (123,699 | ) | | $ | (100,899 | ) | |
The accompanying Notes to Financial Statements are an integral part of this statement.
Annual Report 2015
16
COLUMBIA SELECT LARGE CAP GROWTH FUND
STATEMENT OF CHANGES IN NET ASSETS (continued)
| | | Year Ended March 31, 2015 | | Year Ended March 31, 2014 | |
| | | Shares | | Dollars ($) | | Shares | | Dollars ($) | |
Capital stock activity | |
Class A shares | |
Subscriptions | | | 22,233,025 | | | | 404,335,050 | | | | 24,844,617 | | | | 442,762,404 | | |
Distributions reinvested | | | 12,574,955 | | | | 217,891,055 | | | | 3,002,623 | | | | 53,746,950 | | |
Redemptions | | | (36,146,375 | ) | | | (660,782,717 | ) | | | (24,229,209 | ) | | | (430,284,790 | ) | |
Net increase (decrease) | | | (1,338,395 | ) | | | (38,556,612 | ) | | | 3,618,031 | | | | 66,224,564 | | |
Class C shares | |
Subscriptions | | | 3,559,713 | | | | 60,612,288 | | | | 4,457,705 | | | | 78,694,484 | | |
Distributions reinvested | | | 1,470,220 | | | | 24,016,184 | | | | 264,501 | | | | 4,509,734 | | |
Redemptions | | | (2,309,540 | ) | | | (39,377,445 | ) | | | (951,289 | ) | | | (16,015,391 | ) | |
Net increase | | | 2,720,393 | | | | 45,251,027 | | | | 3,770,917 | | | | 67,188,827 | | |
Class I shares | |
Subscriptions | | | 2,704,124 | | | | 49,089,110 | | | | 2,802,098 | | | | 46,545,578 | | |
Distributions reinvested | | | 2,207,888 | | | | 39,187,115 | | | | 541,377 | | | | 9,907,200 | | |
Redemptions | | | (4,695,703 | ) | | | (89,921,042 | ) | | | (7,395,422 | ) | | | (132,022,480 | ) | |
Net increase (decrease) | | | 216,309 | | | | (1,644,817 | ) | | | (4,051,947 | ) | | | (75,569,702 | ) | |
Class R shares | |
Subscriptions | | | 422,716 | | | | 7,424,236 | | | | 463,604 | | | | 8,252,025 | | |
Distributions reinvested | | | 180,877 | | | | 3,015,512 | | | | 36,719 | | | | 635,235 | | |
Redemptions | | | (412,997 | ) | | | (7,225,463 | ) | | | (303,238 | ) | | | (5,092,080 | ) | |
Net increase | | | 190,596 | | | | 3,214,285 | | | | 197,085 | | | | 3,795,180 | | |
Class R4 shares | |
Subscriptions | | | 1,104,065 | | | | 20,795,862 | | | | 666,442 | | | | 12,140,497 | | |
Distributions reinvested | | | 161,127 | | | | 2,890,202 | | | | 14,383 | | | | 265,793 | | |
Redemptions | | | (962,371 | ) | | | (17,720,757 | ) | | | (47,917 | ) | | | (874,735 | ) | |
Net increase | | | 302,821 | | | | 5,965,307 | | | | 632,908 | | | | 11,531,555 | | |
Class R5 shares | |
Subscriptions | | | 11,535,395 | | | | 220,091,651 | | | | 41,170,313 | | | | 667,023,626 | | |
Distributions reinvested | | | 5,381,599 | | | | 96,812,816 | | | | 1,147,984 | | | | 21,249,178 | | |
Redemptions | | | (10,165,758 | ) | | | (190,346,294 | ) | | | (14,095,567 | ) | | | (263,028,006 | ) | |
Net increase | | | 6,751,236 | | | | 126,558,173 | | | | 28,222,730 | | | | 425,244,798 | | |
Class W shares | |
Subscriptions | | | 366,457 | | | | 6,657,756 | | | | 1,190,833 | | | | 21,870,989 | | |
Distributions reinvested | | | 341,119 | | | | 5,912,339 | | | | 46,907 | | | | 839,636 | | |
Redemptions | | | (450,080 | ) | | | (8,197,836 | ) | | | (442,033 | ) | | | (7,820,951 | ) | |
Net increase | | | 257,496 | | | | 4,372,259 | | | | 795,707 | | | | 14,889,674 | | |
Class Y shares | |
Subscriptions | | | 677,984 | | | | 12,798,124 | | | | 1,313,197 | | | | 22,067,283 | | |
Distributions reinvested | | | 186,569 | | | | 3,379,029 | | | | 39,814 | | | | 741,335 | | |
Redemptions | | | (521,989 | ) | | | (9,941,290 | ) | | | (273,623 | ) | | | (5,327,446 | ) | |
Net increase | | | 342,564 | | | | 6,235,863 | | | | 1,079,388 | | | | 17,481,172 | | |
The accompanying Notes to Financial Statements are an integral part of this statement.
Annual Report 2015
17
COLUMBIA SELECT LARGE CAP GROWTH FUND
STATEMENT OF CHANGES IN NET ASSETS (continued)
| | | Year Ended March 31, 2015 | | Year Ended March 31, 2014 | |
| | | Shares | | Dollars ($) | | Shares | | Dollars ($) | |
Capital stock activity (continued) | |
Class Z shares | |
Subscriptions | | | 52,594,708 | | | | 971,027,816 | | | | 55,037,001 | | | | 994,453,958 | | |
Distributions reinvested | | | 15,976,278 | | | | 281,585,327 | | | | 3,114,528 | | | | 56,590,967 | | |
Redemptions | | | (59,043,711 | ) | | | (1,086,469,453 | ) | | | (69,853,504 | ) | | | (1,184,012,181 | ) | |
Net increase (decrease) | | | 9,527,275 | | | | 166,143,690 | | | | (11,701,975 | ) | | | (132,967,256 | ) | |
Total net increase | | | 18,970,295 | | | | 317,539,175 | | | | 22,562,844 | | | | 397,818,812 | | |
The accompanying Notes to Financial Statements are an integral part of this statement.
Annual Report 2015
18
COLUMBIA SELECT LARGE CAP GROWTH FUND
The following tables are intended to help you understand the Fund's financial performance. Certain information reflects financial results for a single share of a class held for the periods shown. Per share net investment income (loss) amounts are calculated based on average shares outstanding during the period. Total return assumes reinvestment of all dividends and distributions, if any. Total return does not reflect payment of sales charges, if any. Total return and portfolio turnover are not annualized for periods of less than one year. The portfolio turnover rate is calculated without regard to purchase and sales transactions of short-term instruments and certain derivatives, if any. If such transactions were included, the Fund's portfolio turnover rate may be higher.
| | | Year Ended March 31, | |
Class A | | 2015 | | 2014 | | 2013 | | 2012 | | 2011 | |
Per share data | |
Net asset value, beginning of period | | $ | 18.92 | | | $ | 15.23 | | | $ | 14.28 | | | $ | 13.63 | | | $ | 10.60 | | |
Income from investment operations: | |
Net investment loss | | | (0.13 | ) | | | (0.14 | ) | | | (0.05 | ) | | | (0.09 | ) | | | (0.09 | ) | |
Net realized and unrealized gain | | | 2.54 | | | | 4.55 | | | | 1.00 | | | | 0.95 | | | | 3.12 | | |
Total from investment operations | | | 2.41 | | | | 4.41 | | | | 0.95 | | | | 0.86 | | | | 3.03 | | |
Less distributions to shareholders: | |
Net realized gains | | | (2.84 | ) | | | (0.72 | ) | | | — | | | | (0.21 | ) | | | — | | |
Total distributions to shareholders | | | (2.84 | ) | | | (0.72 | ) | | | — | | | | (0.21 | ) | | | — | | |
Proceeds from regulatory settlements | | | — | | | | — | | | | — | | | | 0.00 | (a) | | | — | | |
Net asset value, end of period | | $ | 18.49 | | | $ | 18.92 | | | $ | 15.23 | | | $ | 14.28 | | | $ | 13.63 | | |
Total return | | | 14.42 | % | | | 29.19 | % | | | 6.65 | % | | | 6.39 | % | | | 28.58 | % | |
Ratios to average net assets(b) | |
Total gross expenses | | | 1.09 | %(c) | | | 1.10 | %(c) | | | 1.11 | %(c) | | | 1.11 | % | | | 1.24 | % | |
Total net expenses(d) | | | 1.09 | %(c)(e) | | | 1.10 | %(c)(e) | | | 1.11 | %(c)(e) | | | 1.11 | %(e) | | | 1.24 | %(e) | |
Net investment loss | | | (0.73 | %) | | | (0.81 | %) | | �� | (0.40 | %) | | | (0.66 | %) | | | (0.79 | %) | |
Supplemental data | |
Net assets, end of period (in thousands) | | $ | 1,466,541 | | | $ | 1,525,489 | | | $ | 1,173,231 | | | $ | 2,023,475 | | | $ | 1,242,211 | | |
Portfolio turnover | | | 47 | % | | | 53 | % | | | 36 | % | | | 53 | % | | | 71 | % | |
Notes to Financial Highlights
(a) Rounds to zero.
(b) In addition to the fees and expenses that the Fund bears directly, the Fund indirectly bears a pro rata share of the fees and expenses of any other funds in which it invests. Such indirect expenses are not included in the Fund's reported expense ratios.
(c) Ratios include line of credit interest expense which is less than 0.01%.
(d) Total net expenses include the impact of certain fee waivers/expense reimbursements made by the Investment Manager and certain of its affiliates, if applicable.
(e) The benefits derived from expense reductions had an impact of less than 0.01%.
The accompanying Notes to Financial Statements are an integral part of this statement.
Annual Report 2015
19
COLUMBIA SELECT LARGE CAP GROWTH FUND
FINANCIAL HIGHLIGHTS (continued)
| | | Year Ended March 31, | |
Class C | | 2015 | | 2014 | | 2013 | | 2012 | | 2011 | |
Per share data | |
Net asset value, beginning of period | | $ | 17.98 | | | $ | 14.61 | | | $ | 13.80 | | | $ | 13.28 | | | $ | 10.40 | | |
Income from investment operations: | |
Net investment loss | | | (0.26 | ) | | | (0.27 | ) | | | (0.15 | ) | | | (0.17 | ) | | | (0.17 | ) | |
Net realized and unrealized gain | | | 2.41 | | | | 4.36 | | | | 0.96 | | | | 0.90 | | | | 3.05 | | |
Total from investment operations | | | 2.15 | | | | 4.09 | | | | 0.81 | | | | 0.73 | | | | 2.88 | | |
Less distributions to shareholders: | |
Net realized gains | | | (2.81 | ) | | | (0.72 | ) | | | — | | | | (0.21 | ) | | | — | | |
Total distributions to shareholders | | | (2.81 | ) | | | (0.72 | ) | | | — | | | | (0.21 | ) | | | — | | |
Proceeds from regulatory settlements | | | — | | | | — | | | | — | | | | 0.00 | (a) | | | — | | |
Net asset value, end of period | | $ | 17.32 | | | $ | 17.98 | | | $ | 14.61 | | | $ | 13.80 | | | $ | 13.28 | | |
Total return | | | 13.62 | % | | | 28.23 | % | | | 5.87 | % | | | 5.57 | % | | | 27.69 | % | |
Ratios to average net assets(b) | |
Total gross expenses | | | 1.84 | %(c) | | | 1.85 | %(c) | | | 1.87 | %(c) | | | 1.86 | % | | | 1.99 | % | |
Total net expenses(d) | | | 1.84 | %(c)(e) | | | 1.85 | %(c)(e) | | | 1.87 | %(c)(e) | | | 1.86 | %(e) | | | 1.99 | %(e) | |
Net investment loss | | | (1.49 | %) | | | (1.56 | %) | | | (1.12 | %) | | | (1.35 | %) | | | (1.49 | %) | |
Supplemental data | |
Net assets, end of period (in thousands) | | $ | 226,538 | | | $ | 186,302 | | | $ | 96,328 | | | $ | 81,441 | | | $ | 14,523 | | |
Portfolio turnover | | | 47 | % | | | 53 | % | | | 36 | % | | | 53 | % | | | 71 | % | |
Notes to Financial Highlights
(a) Rounds to zero.
(b) In addition to the fees and expenses that the Fund bears directly, the Fund indirectly bears a pro rata share of the fees and expenses of any other funds in which it invests. Such indirect expenses are not included in the Fund's reported expense ratios.
(c) Ratios include line of credit interest expense which is less than 0.01%.
(d) Total net expenses include the impact of certain fee waivers/expense reimbursements made by the Investment Manager and certain of its affiliates, if applicable.
(e) The benefits derived from expense reductions had an impact of less than 0.01%.
The accompanying Notes to Financial Statements are an integral part of this statement.
Annual Report 2015
20
COLUMBIA SELECT LARGE CAP GROWTH FUND
FINANCIAL HIGHLIGHTS (continued)
| | | Year Ended March 31, | |
Class I | | 2015 | | 2014 | | 2013 | | 2012 | | 2011(a) | |
Per share data | |
Net asset value, beginning of period | | $ | 19.37 | | | $ | 15.51 | | | $ | 14.47 | | | $ | 13.75 | | | $ | 11.23 | | |
Income from investment operations: | |
Net investment income (loss) | | | (0.05 | ) | | | (0.06 | ) | | | 0.01 | | | | (0.02 | ) | | | (0.01 | ) | |
Net realized and unrealized gain | | | 2.61 | | | | 4.64 | | | | 1.03 | | | | 0.95 | | | | 2.53 | | |
Total from investment operations | | | 2.56 | | | | 4.58 | | | | 1.04 | | | | 0.93 | | | | 2.52 | | |
Less distributions to shareholders: | |
Net realized gains | | | (2.92 | ) | | | (0.72 | ) | | | — | | | | (0.21 | ) | | | — | | |
Total distributions to shareholders | | | (2.92 | ) | | | (0.72 | ) | | | — | | | | (0.21 | ) | | | — | | |
Proceeds from regulatory settlements | | | — | | | | — | | | | — | | | | 0.00 | (b) | | | — | | |
Net asset value, end of period | | $ | 19.01 | | | $ | 19.37 | | | $ | 15.51 | | | $ | 14.47 | | | $ | 13.75 | | |
Total return | | | 14.96 | % | | | 29.77 | % | | | 7.19 | % | | | 6.85 | % | | | 22.44 | % | |
Ratios to average net assets(c) | |
Total gross expenses | | | 0.65 | %(d) | | | 0.65 | %(d) | | | 0.67 | %(d) | | | 0.67 | % | | | 0.76 | %(e) | |
Total net expenses(f) | | | 0.65 | %(d) | | | 0.65 | %(d) | | | 0.67 | %(d) | | | 0.67 | %(g) | | | 0.76 | %(e)(g) | |
Net investment income (loss) | | | (0.29 | %) | | | (0.35 | %) | | | 0.07 | % | | | (0.19 | %) | | | (0.18 | %)(e) | |
Supplemental data | |
Net assets, end of period (in thousands) | | $ | 256,222 | | | $ | 256,893 | | | $ | 268,592 | | | $ | 283,920 | | | $ | 126,813 | | |
Portfolio turnover | | | 47 | % | | | 53 | % | | | 36 | % | | | 53 | % | | | 71 | % | |
Notes to Financial Highlights
(a) Based on operations from September 27, 2010 (commencement of operations) through the stated period end.
(b) Rounds to zero.
(c) In addition to the fees and expenses that the Fund bears directly, the Fund indirectly bears a pro rata share of the fees and expenses of any other funds in which it invests. Such indirect expenses are not included in the Fund's reported expense ratios.
(d) Ratios include line of credit interest expense which is less than 0.01%.
(e) Annualized.
(f) Total net expenses include the impact of certain fee waivers/expense reimbursements made by the Investment Manager and certain of its affiliates, if applicable.
(g) The benefits derived from expense reductions had an impact of less than 0.01%.
The accompanying Notes to Financial Statements are an integral part of this statement.
Annual Report 2015
21
COLUMBIA SELECT LARGE CAP GROWTH FUND
FINANCIAL HIGHLIGHTS (continued)
| | | Year Ended March 31, | |
Class R | | 2015 | | 2014 | | 2013 | | 2012 | | 2011 | |
Per share data | |
Net asset value, beginning of period | | $ | 18.27 | | | $ | 14.77 | | | $ | 13.87 | | | $ | 13.28 | | | $ | 10.35 | | |
Income from investment operations: | |
Net investment loss | | | (0.17 | ) | | | (0.18 | ) | | | (0.08 | ) | | | (0.10 | ) | | | (0.12 | ) | |
Net realized and unrealized gain | | | 2.45 | | | | 4.40 | | | | 0.98 | | | | 0.90 | | | | 3.05 | | |
Total from investment operations | | | 2.28 | | | | 4.22 | | | | 0.90 | | | | 0.80 | | | | 2.93 | | |
Less distributions to shareholders: | |
Net realized gains | | | (2.81 | ) | | | (0.72 | ) | | | — | | | | (0.21 | ) | | | — | | |
Total distributions to shareholders | | | (2.81 | ) | | | (0.72 | ) | | | — | | | | (0.21 | ) | | | — | | |
Proceeds from regulatory settlements | | | — | | | | — | | | | — | | | | 0.00 | (a) | | | — | | |
Net asset value, end of period | | $ | 17.74 | | | $ | 18.27 | | | $ | 14.77 | | | $ | 13.87 | | | $ | 13.28 | | |
Total return | | | 14.16 | % | | | 28.81 | % | | | 6.49 | % | | | 6.11 | % | | | 28.31 | % | |
Ratios to average net assets(b) | |
Total gross expenses | | | 1.34 | %(c) | | | 1.35 | %(c) | | | 1.37 | %(c) | | | 1.35 | % | | | 1.49 | % | |
Total net expenses(d) | | | 1.34 | %(c)(e) | | | 1.35 | %(c)(e) | | | 1.37 | %(c)(e) | | | 1.35 | %(e) | | | 1.49 | %(e) | |
Net investment loss | | | (0.99 | %) | | | (1.06 | %) | | | (0.63 | %) | | | (0.84 | %) | | | (1.03 | %) | |
Supplemental data | |
Net assets, end of period (in thousands) | | $ | 23,092 | | | $ | 20,300 | | | $ | 13,498 | | | $ | 14,619 | | | $ | 2,926 | | |
Portfolio turnover | | | 47 | % | | | 53 | % | | | 36 | % | | | 53 | % | | | 71 | % | |
Notes to Financial Highlights
(a) Rounds to zero.
(b) In addition to the fees and expenses that the Fund bears directly, the Fund indirectly bears a pro rata share of the fees and expenses of any other funds in which it invests. Such indirect expenses are not included in the Fund's reported expense ratios.
(c) Ratios include line of credit interest expense which is less than 0.01%.
(d) Total net expenses include the impact of certain fee waivers/expense reimbursements made by the Investment Manager and certain of its affiliates, if applicable.
(e) The benefits derived from expense reductions had an impact of less than 0.01%.
The accompanying Notes to Financial Statements are an integral part of this statement.
Annual Report 2015
22
COLUMBIA SELECT LARGE CAP GROWTH FUND
FINANCIAL HIGHLIGHTS (continued)
| | | Year Ended March 31, | |
Class R4 | | 2015 | | 2014 | | 2013(a) | |
Per share data | |
Net asset value, beginning of period | | $ | 19.55 | | | $ | 15.69 | | | $ | 13.14 | | |
Income from investment operations: | |
Net investment income (loss) | | | (0.10 | ) | | | (0.11 | ) | | | 0.03 | | |
Net realized and unrealized gain | | | 2.66 | | | | 4.69 | | | | 2.52 | | |
Total from investment operations | | | 2.56 | | | | 4.58 | | | | 2.55 | | |
Less distributions to shareholders: | |
Net realized gains | | | (2.89 | ) | | | (0.72 | ) | | | — | | |
Total distributions to shareholders | | | (2.89 | ) | | | (0.72 | ) | | | — | | |
Net asset value, end of period | | $ | 19.22 | | | $ | 19.55 | | | $ | 15.69 | | |
Total return | | | 14.76 | % | | | 29.42 | % | | | 19.41 | % | |
Ratios to average net assets(b) | |
Total gross expenses | | | 0.84 | %(c) | | | 0.85 | %(c) | | | 0.82 | %(d) | |
Total net expenses(e) | | | 0.84 | %(c)(f) | | | 0.85 | %(c)(f) | | | 0.82 | %(d) | |
Net investment income (loss) | | | (0.52 | %) | | | (0.59 | %) | | | 0.60 | %(d) | |
Supplemental data | |
Net assets, end of period (in thousands) | | $ | 17,988 | | | $ | 12,381 | | | $ | 6 | | |
Portfolio turnover | | | 47 | % | | | 53 | % | | | 36 | % | |
Notes to Financial Highlights
(a) Based on operations from November 8, 2012 (commencement of operations) through the stated period end.
(b) In addition to the fees and expenses that the Fund bears directly, the Fund indirectly bears a pro rata share of the fees and expenses of any other funds in which it invests. Such indirect expenses are not included in the Fund's reported expense ratios.
(c) Ratios include line of credit interest expense which is less than 0.01%.
(d) Annualized.
(e) Total net expenses include the impact of certain fee waivers/expense reimbursements made by the Investment Manager and certain of its affiliates, if applicable.
(f) The benefits derived from expense reductions had an impact of less than 0.01%.
The accompanying Notes to Financial Statements are an integral part of this statement.
Annual Report 2015
23
COLUMBIA SELECT LARGE CAP GROWTH FUND
FINANCIAL HIGHLIGHTS (continued)
| | | Year Ended March 31, | |
Class R5 | | 2015 | | 2014 | | 2013(a) | |
Per share data | |
Net asset value, beginning of period | | $ | 19.59 | | | $ | 15.69 | | | $ | 13.14 | | |
Income from investment operations: | |
Net investment income (loss) | | | (0.06 | ) | | | (0.07 | ) | | | 0.01 | | |
Net realized and unrealized gain | | | 2.64 | | | | 4.69 | | | | 2.54 | | |
Total from investment operations | | | 2.58 | | | | 4.62 | | | | 2.55 | | |
Less distributions to shareholders: | |
Net realized gains | | | (2.91 | ) | | | (0.72 | ) | | | — | | |
Total distributions to shareholders | | | (2.91 | ) | | | (0.72 | ) | | | — | | |
Net asset value, end of period | | $ | 19.26 | | | $ | 19.59 | | | $ | 15.69 | | |
Total return | | | 14.89 | % | | | 29.68 | % | | | 19.41 | % | |
Ratios to average net assets(b) | |
Total gross expenses | | | 0.70 | %(c) | | | 0.70 | %(c) | | | 0.69 | %(d) | |
Total net expenses(e) | | | 0.70 | %(c) | | | 0.70 | %(c) | | | 0.69 | %(d) | |
Net investment income (loss) | | | (0.34 | %) | | | (0.41 | %) | | | 0.13 | %(d) | |
Supplemental data | |
Net assets, end of period (in thousands) | | $ | 754,744 | | | $ | 635,330 | | | $ | 66,054 | | |
Portfolio turnover | | | 47 | % | | | 53 | % | | | 36 | % | |
Notes to Financial Highlights
(a) Based on operations from November 8, 2012 (commencement of operations) through the stated period end.
(b) In addition to the fees and expenses that the Fund bears directly, the Fund indirectly bears a pro rata share of the fees and expenses of any other funds in which it invests. Such indirect expenses are not included in the Fund's reported expense ratios.
(c) Ratios include line of credit interest expense which is less than 0.01%.
(d) Annualized.
(e) Total net expenses include the impact of certain fee waivers/expense reimbursements made by the Investment Manager and certain of its affiliates, if applicable.
The accompanying Notes to Financial Statements are an integral part of this statement.
Annual Report 2015
24
COLUMBIA SELECT LARGE CAP GROWTH FUND
FINANCIAL HIGHLIGHTS (continued)
| | | Year Ended March 31, | |
Class W | | 2015 | | 2014 | | 2013 | | 2012 | | 2011(a) | |
Per share data | |
Net asset value, beginning of period | | $ | 18.92 | | | $ | 15.23 | | | $ | 14.28 | | | $ | 13.63 | | | $ | 11.16 | | |
Income from investment operations: | |
Net investment loss | | | (0.13 | ) | | | (0.14 | ) | | | (0.06 | ) | | | (0.09 | ) | | | (0.05 | ) | |
Net realized and unrealized gain | | | 2.54 | | | | 4.55 | | | | 1.01 | | | | 0.95 | | | | 2.52 | | |
Total from investment operations | | | 2.41 | | | | 4.41 | | | | 0.95 | | | | 0.86 | | | | 2.47 | | |
Less distributions to shareholders: | |
Net realized gains | | | (2.84 | ) | | | (0.72 | ) | | | — | | | | (0.21 | ) | | | — | | |
Total distributions to shareholders | | | (2.84 | ) | | | (0.72 | ) | | | — | | | | (0.21 | ) | | | — | | |
Proceeds from regulatory settlements | | | — | | | | — | | | | — | | | | 0.00 | (b) | | | — | | |
Net asset value, end of period | | $ | 18.49 | | | $ | 18.92 | | | $ | 15.23 | | | $ | 14.28 | | | $ | 13.63 | | |
Total return | | | 14.41 | % | | | 29.19 | % | | | 6.65 | % | | | 6.39 | % | | | 22.13 | % | |
Ratios to average net assets(c) | |
Total gross expenses | | | 1.09 | %(d) | | | 1.11 | %(d) | | | 1.12 | %(d) | | | 1.12 | % | | | 1.25 | %(e) | |
Total net expenses(f) | | | 1.09 | %(d)(g) | | | 1.11 | %(d)(g) | | | 1.12 | %(d)(g) | | | 1.12 | %(g) | | | 1.25 | %(e)(g) | |
Net investment loss | | | (0.74 | %) | | | (0.81 | %) | | | (0.46 | %) | | | (0.67 | %) | | | (0.78 | %)(e) | |
Supplemental data | |
Net assets, end of period (in thousands) | | $ | 42,248 | | | $ | 38,342 | | | $ | 18,755 | | | $ | 52,432 | | | $ | 41,768 | | |
Portfolio turnover | | | 47 | % | | | 53 | % | | | 36 | % | | | 53 | % | | | 71 | % | |
Notes to Financial Highlights
(a) Based on operations from September 27, 2010 (commencement of operations) through the stated period end.
(b) Rounds to zero.
(c) In addition to the fees and expenses that the Fund bears directly, the Fund indirectly bears a pro rata share of the fees and expenses of any other funds in which it invests. Such indirect expenses are not included in the Fund's reported expense ratios.
(d) Ratios include line of credit interest expense which is less than 0.01%.
(e) Annualized.
(f) Total net expenses include the impact of certain fee waivers/expense reimbursements made by the Investment Manager and certain of its affiliates, if applicable.
(g) The benefits derived from expense reductions had an impact of less than 0.01%.
The accompanying Notes to Financial Statements are an integral part of this statement.
Annual Report 2015
25
COLUMBIA SELECT LARGE CAP GROWTH FUND
FINANCIAL HIGHLIGHTS (continued)
| | | Year Ended March 31, | |
Class Y | | 2015 | | 2014 | | 2013(a) | |
Per share data | |
Net asset value, beginning of period | | $ | 19.71 | | | $ | 15.77 | | | $ | 13.20 | | |
Income from investment operations: | |
Net investment income (loss) | | | (0.06 | ) | | | (0.07 | ) | | | 0.05 | | |
Net realized and unrealized gain | | | 2.66 | | | | 4.73 | | | | 2.52 | | |
Total from investment operations | | | 2.60 | | | | 4.66 | | | | 2.57 | | |
Less distributions to shareholders: | |
Net realized gains | | | (2.92 | ) | | | (0.72 | ) | | | — | | |
Total distributions to shareholders | | | (2.92 | ) | | | (0.72 | ) | | | — | | |
Net asset value, end of period | | $ | 19.39 | | | $ | 19.71 | | | $ | 15.77 | | |
Total return | | | 14.91 | % | | | 29.78 | % | | | 19.47 | % | |
Ratios to average net assets(b) | |
Total gross expenses | | | 0.65 | %(c) | | | 0.65 | %(c) | | | 0.65 | %(d) | |
Total net expenses(e) | | | 0.65 | %(c) | | | 0.65 | %(c) | | | 0.65 | %(d) | |
Net investment income (loss) | | | (0.30 | %) | | | (0.36 | %) | | | 0.81 | %(d) | |
Supplemental data | |
Net assets, end of period (in thousands) | | $ | 27,581 | | | $ | 21,274 | | | $ | 3 | | |
Portfolio turnover | | | 47 | % | | | 53 | % | | | 36 | % | |
Notes to Financial Highlights
(a) Based on operations from November 8, 2012 (commencement of operations) through the stated period end.
(b) In addition to the fees and expenses that the Fund bears directly, the Fund indirectly bears a pro rata share of the fees and expenses of any other funds in which it invests. Such indirect expenses are not included in the Fund's reported expense ratios.
(c) Ratios include line of credit interest expense which is less than 0.01%.
(d) Annualized.
(e) Total net expenses include the impact of certain fee waivers/expense reimbursements made by the Investment Manager and certain of its affiliates, if applicable.
The accompanying Notes to Financial Statements are an integral part of this statement.
Annual Report 2015
26
COLUMBIA SELECT LARGE CAP GROWTH FUND
FINANCIAL HIGHLIGHTS (continued)
| | | Year Ended March 31, | |
Class Z | | 2015 | | 2014 | | 2013 | | 2012 | | 2011 | |
Per share data | |
Net asset value, beginning of period | | $ | 19.22 | | | $ | 15.43 | | | $ | 14.43 | | | $ | 13.74 | | | $ | 10.65 | | |
Income from investment operations: | |
Net investment loss | | | (0.09 | ) | | | (0.10 | ) | | | (0.02 | ) | | | (0.06 | ) | | | (0.06 | ) | |
Net realized and unrealized gain | | | 2.60 | | | | 4.61 | | | | 1.02 | | | | 0.96 | | | | 3.15 | | |
Total from investment operations | | | 2.51 | | | | 4.51 | | | | 1.00 | | | | 0.90 | | | | 3.09 | | |
Less distributions to shareholders: | |
Net realized gains | | | (2.89 | ) | | | (0.72 | ) | | | — | | | | (0.21 | ) | | | — | | |
Total distributions to shareholders | | | (2.89 | ) | | | (0.72 | ) | | | — | | | | (0.21 | ) | | | — | | |
Proceeds from regulatory settlements | | | — | | | | — | | | | — | | | | 0.00 | (a) | | | — | | |
Net asset value, end of period | | $ | 18.84 | | | $ | 19.22 | | | $ | 15.43 | | | $ | 14.43 | | | $ | 13.74 | | |
Total return | | | 14.74 | % | | | 29.46 | % | | | 6.93 | % | | | 6.64 | % | | | 29.01 | % | |
Ratios to average net assets(b) | |
Total gross expenses | | | 0.84 | %(c) | | | 0.85 | %(c) | | | 0.87 | %(c) | | | 0.86 | % | | | 0.99 | % | |
Total net expenses(d) | | | 0.84 | %(c)(e) | | | 0.85 | %(c)(e) | | | 0.87 | %(c)(e) | | | 0.86 | %(e) | | | 0.99 | %(e) | |
Net investment loss | | | (0.49 | %) | | | (0.56 | %) | | | (0.16 | %) | | | (0.43 | %) | | | (0.54 | %) | |
Supplemental data | |
Net assets, end of period (in thousands) | | $ | 4,275,296 | | | $ | 4,178,590 | | | $ | 3,534,748 | | | $ | 4,373,501 | | | $ | 3,353,583 | | |
Portfolio turnover | | | 47 | % | | | 53 | % | | | 36 | % | | | 53 | % | | | 71 | % | |
Notes to Financial Highlights
(a) Rounds to zero.
(b) In addition to the fees and expenses that the Fund bears directly, the Fund indirectly bears a pro rata share of the fees and expenses of any other funds in which it invests. Such indirect expenses are not included in the Fund's reported expense ratios.
(c) Ratios include line of credit interest expense which is less than 0.01%.
(d) Total net expenses include the impact of certain fee waivers/expense reimbursements made by the Investment Manager and certain of its affiliates, if applicable.
(e) The benefits derived from expense reductions had an impact of less than 0.01%.
The accompanying Notes to Financial Statements are an integral part of this statement.
Annual Report 2015
27
COLUMBIA SELECT LARGE CAP GROWTH FUND
NOTES TO FINANCIAL STATEMENTS
March 31, 2015
Note 1. Organization
Columbia Select Large Cap Growth Fund (the Fund), a series of Columbia Funds Series Trust I (the Trust), is a diversified fund. The Trust is registered under the Investment Company Act of 1940, as amended (the 1940 Act), as an open-end management investment company organized as a Massachusetts business trust.
Fund Shares
The Trust may issue an unlimited number of shares (without par value). The Fund offers Class A, Class C, Class I, Class R, Class R4, Class R5, Class W, Class Y and Class Z shares. Although all share classes generally have identical voting, dividend and liquidation rights, each share class votes separately when required by the Trust's organizational documents or by law. Different share classes pay different distribution amounts to the extent the expenses of such share classes differ, and distributions in liquidation will be proportional to the net asset value of each share class. Each share class has its own expense structure and sales charges.
Class A shares are subject to a maximum front-end sales charge of 5.75% based on the initial investment amount. Class A shares purchased without an initial sales charge in accounts aggregating $1 million to $50 million at the time of purchase are subject to a contingent deferred sales charge (CDSC) if the shares are sold within 18 months after purchase, charged as follows: 1.00% CDSC if redeemed within 12 months after purchase, and 0.50% CDSC if redeemed more than 12, but less than 18, months after purchase.
Class C shares are subject to a 1.00% CDSC on shares redeemed within one year after purchase.
Class I shares are not subject to sales charges and are available only to the Columbia Family of Funds.
Class R shares are not subject to sales charges and are generally available only to certain retirement plans and other investors as described in the Fund's prospectus.
Class R4 shares are not subject to sales charges and are generally available only to omnibus retirement plans and certain investors as described in the Fund's prospectus.
Class R5 shares are not subject to sales charges and are generally available only to investors purchasing through authorized investment professionals and omnibus retirement plans.
Class W shares are not subject to sales charges and are available only to investors purchasing through authorized
investment programs managed by investment professionals, including discretionary managed account programs.
Class Y shares are not subject to sales charges and are generally available only to certain retirement plans as described in the Fund's prospectus.
Class Z shares are not subject to sales charges and are available only to eligible investors, which are subject to different investment minimums as described in the Fund's prospectus.
Note 2. Summary of Significant Accounting Policies
Basis of Preparation
The Fund is an investment company that applies the accounting and reporting guidance in the Financial Accounting Standards Board (FASB) Accounting Standards Codification Topic 946, Financial Services — Investment Companies (ASC 946). The financial statements are prepared in accordance with U.S. generally accepted accounting principles (GAAP), which requires management to make certain estimates and assumptions that affect the reported amounts of assets and liabilities, the disclosure of contingent assets and liabilities at the date of the financial statements and the reported amounts of income and expenses during the reporting period. Actual results could differ from those estimates.
The following is a summary of significant accounting policies followed by the Fund in the preparation of its financial statements.
Security Valuation
All equity securities are valued at the close of business of the New York Stock Exchange (NYSE). Equity securities are valued at the last quoted sales price on the principal exchange or market on which they trade, except for securities traded on the NASDAQ Stock Market, which are valued at the NASDAQ official close price. Unlisted securities or listed securities for which there were no sales during the day are valued at the mean of the latest quoted bid and ask prices on such exchanges or markets.
Foreign equity securities are valued based on quotations from the principal market in which such securities are traded. If any foreign security prices are not readily available as a result of limited share activity, the securities are valued at the mean of the latest quoted bid and ask prices on such exchanges or markets.
Annual Report 2015
28
COLUMBIA SELECT LARGE CAP GROWTH FUND
NOTES TO FINANCIAL STATEMENTS (continued)
March 31, 2015
Foreign currency exchange rates are generally determined at 4:00 p.m. Eastern (U.S.) time. Many securities markets and exchanges outside the U.S. close prior to the close of the NYSE; therefore, the closing prices for securities in such markets or on such exchanges may not fully reflect events that occur after such close but before the close of the NYSE. In those situations, foreign securities will be fair valued pursuant to a policy adopted by the Board of Trustees (the Board), including, if available, utilizing a third party pricing service to determine these fair values. The third party pricing service takes into account multiple factors, including, but not limited to, movements in the U.S. securities markets, certain depositary receipts, futures contracts and foreign exchange rates that have occurred subsequent to the close of the foreign exchange or market, to determine a good faith estimate that reasonably reflects the current market conditions as of the close of the NYSE. The fair value of a security is likely to be different from the quoted or published price, if available.
Investments in open-end investment companies, including money market funds, are valued at their net asset value.
Investments for which market quotations are not readily available, or that have quotations which management believes are not reliable, are valued at fair value as determined in good faith under procedures established by and under the general supervision of the Board. If a security or class of securities (such as foreign securities) is valued at fair value, such value is likely to be different from the quoted or published price for the security.
The determination of fair value often requires significant judgment. To determine fair value, management may use assumptions including but not limited to future cash flows and estimated risk premiums. Multiple inputs from various sources may be used to determine fair value.
Security Transactions
Security transactions are accounted for on the trade date. Cost is determined and gains (losses) are based upon the specific identification method for both financial statement and federal income tax purposes.
Income Recognition
Corporate actions and dividend income are generally recorded net of any non-reclaimable tax withholdings, on the ex-dividend date or upon receipt of ex-dividend notification in the case of certain foreign securities.
Awards from class action litigation are recorded as a reduction of cost basis if the Fund still owns the
applicable securities on the payment date. If the Fund no longer owns the applicable securities, the proceeds are recorded as realized gains.
Expenses
General expenses of the Trust are allocated to the Fund and other funds of the Trust based upon relative net assets or other expense allocation methodologies determined by the nature of the expense. Expenses directly attributable to the Fund are charged to the Fund. Expenses directly attributable to a specific class of shares are charged to that share class.
Determination of Class Net Asset Value
All income, expenses (other than class-specific expenses, which are charged to that share class, as shown in the Statement of Operations) and realized and unrealized gains (losses) are allocated to each class of the Fund on a daily basis, based on the relative net assets of each class, for purposes of determining the net asset value of each class.
Federal Income Tax Status
The Fund intends to qualify each year as a regulated investment company under Subchapter M of the Internal Revenue Code, as amended, and will distribute substantially all of its taxable income (including net short-term capital gains), if any, for its tax year, and as such will not be subject to federal income taxes. In addition, the Fund intends to distribute in each calendar year substantially all of its net investment income, capital gains and certain other amounts, if any, such that the Fund should not be subject to federal excise tax. Therefore, no federal income or excise tax provision is recorded.
Distributions to Shareholders
Distributions from net investment income, if any, are declared and paid each calendar quarter. Net realized capital gains, if any, are distributed at least annually. Income distributions and capital gain distributions are determined in accordance with federal income tax regulations, which may differ from GAAP.
Guarantees and Indemnifications
Under the Trust's organizational documents and, in some cases, by contract, its officers and trustees are indemnified against certain liabilities arising out of the performance of their duties to the Trust or its funds. In addition, certain of the Fund's contracts with its service providers contain general indemnification clauses. The Fund's maximum exposure under these arrangements is
Annual Report 2015
29
COLUMBIA SELECT LARGE CAP GROWTH FUND
NOTES TO FINANCIAL STATEMENTS (continued)
March 31, 2015
unknown since the amount of any future claims that may be made against the Fund cannot be determined, and the Fund has no historical basis for predicting the likelihood of any such claims.
Note 3. Fees and Compensation Paid to Affiliates
Investment Management Fees
Under an Investment Management Services Agreement, Columbia Management Investment Advisers, LLC (the Investment Manager), a wholly-owned subsidiary of Ameriprise Financial, Inc. (Ameriprise Financial), determines which securities will be purchased, held or sold. The investment management fee is an annual fee that is equal to a percentage of the Fund's average daily net assets that declines from 0.71% to 0.54% as the Fund's net assets increase. The effective investment management fee rate for the year ended March 31, 2015 was 0.58% of the Fund's average daily net assets.
Administration Fees
Under an Administrative Services Agreement, the Investment Manager also serves as the Fund Administrator. The Fund pays the Fund Administrator an annual fee for administration and accounting services equal to a percentage of the Fund's average daily net assets that declines from 0.06% to 0.03% as the Fund's net assets increase. The effective administration fee rate for the year ended March 31, 2015 was 0.05% of the Fund's average daily net assets.
Compensation of Board Members
Board members are compensated for their services to the Fund as disclosed in the Statement of Operations. The Trust's eligible Trustees may participate in a Deferred Compensation Plan (the Plan) which may be terminated at any time. Obligations of the Plan will be paid solely out of the Fund's assets.
Compensation of Chief Compliance Officer
The Board has appointed a Chief Compliance Officer to the Fund in accordance with federal securities regulations. The Fund pays its pro-rata share of the expenses associated with the Chief Compliance Officer.
Transfer Agent Fees
Under a Transfer and Dividend Disbursing Agent Agreement, Columbia Management Investment Services Corp. (the Transfer Agent), an affiliate of the Investment
Manager and a wholly-owned subsidiary of Ameriprise Financial, is responsible for providing transfer agency services to the Fund. The Transfer Agent has contracted with Boston Financial Data Services (BFDS) to serve as sub-transfer agent.
Effective November 1, 2014, the Transfer Agent receives a monthly transfer agency fee based on the number or the average value of accounts, depending on the type of account. Prior to November 1, 2014, the Transfer Agent received a monthly account-based service fee based on the number of open accounts. In addition, the Transfer Agent also receives sub-transfer agency fees based on a percentage of the average aggregate value of the Fund's shares maintained in omnibus accounts (other than omnibus accounts for which American Enterprise Investment Services Inc. is the broker of record or accounts where the beneficial shareholder is a customer of Ameriprise Financial Services, Inc., for which the Transfer Agent receives a per account fee). The Transfer Agent pays the fees of BFDS for services as sub-transfer agent and is not entitled to reimbursement for such fees from the Fund (with the exception of out-of-pocket fees).
The Transfer Agent also receives compensation from the Fund for various shareholder services and reimbursements for certain out-of-pocket fees. Total transfer agent fees for Class R5 shares are subject to an annual limitation of not more than 0.05% of the average daily net assets attributable to Class R5 shares. Class I and Class Y shares do not pay transfer agency fees.
For the year ended March 31, 2015, the Fund's effective transfer agent fee rates as a percentage of average daily net assets of each class were as follows:
Class A | | | 0.20 | % | |
Class C | | | 0.20 | | |
Class R | | | 0.20 | | |
Class R4 | | | 0.20 | | |
Class R5 | | | 0.05 | | |
Class W | | | 0.20 | | |
Class Z | | | 0.20 | | |
An annual minimum account balance fee of $20 may apply to certain accounts with a value below the applicable share class's initial minimum investment requirements to reduce the impact of small accounts on transfer agent fees. These minimum account balance fees are remitted to the Fund and recorded as part of expense reductions in the Statement of Operations. For the year ended
Annual Report 2015
30
COLUMBIA SELECT LARGE CAP GROWTH FUND
NOTES TO FINANCIAL STATEMENTS (continued)
March 31, 2015
March 31, 2015, these minimum account balance fees reduced total expenses of the Fund by $2,550.
Distribution and Service Fees
The Fund has an agreement with Columbia Management Investment Distributors, Inc. (the Distributor), an affiliate of the Investment Manager and a wholly-owned subsidiary of Ameriprise Financial, for distribution and shareholder services. The Board has approved, and the Fund has adopted, distribution and shareholder service plans (the Plans) applicable to certain share classes, which set the distribution and service fees for the Fund. These fees are calculated daily and are intended to compensate the Distributor and/or eligible selling and/or servicing agents for selling shares of the Fund and providing services to investors.
Under the Plans, the Fund pays a monthly service fee to the Distributor at the maximum annual rate of 0.25% of the average daily net assets attributable to Class A, Class C and Class W shares of the Fund. Also under the Plans, the Fund pays a monthly distribution fee to the Distributor at the maximum annual rates of 0.75%, 0.50% and 0.25% of the average daily net assets attributable to Class C, Class R and Class W shares, respectively.
Although the Fund may pay a distribution fee up to 0.25% of the Fund's average daily net assets attributable to Class W shares and a service fee of up to 0.25% of the Fund's average daily net assets attributable to Class W shares, the aggregate fee shall not exceed 0.25% of the Fund's average daily net assets attributable to Class W shares.
Sales Charges
Sales charges, including front-end charges and CDSCs, received by the Distributor for distributing Fund shares were $1,093,247 for Class A and $43,068 for Class C shares for the year ended March 31, 2015.
Expenses Waived/Reimbursed by the Investment Manager and its Affiliates
The Fund's expense ratio is subject to an expense reimbursement arrangement pursuant to which fees will be waived and/or expenses reimbursed (excluding certain fees and expenses described below), so that the Fund's net operating expenses, after giving effect to fees waived/expenses reimbursed and any balance credits
and/or overdraft charges from the Fund's custodian, do not exceed the annual rates of:
| | | Voluntary
Expense Cap
Effective
August 1, 2014 | | Contractual
Expense Cap
Prior to
August 1, 2014 | |
Class A | | | 1.22 | % | | | 1.19 | % | |
Class C | | | 1.97 | | | | 1.94 | | |
Class I | | | 0.83 | | | | 0.82 | | |
Class R | | | 1.47 | | | | 1.44 | | |
Class R4 | | | 0.97 | | | | 0.94 | | |
Class R5 | | | 0.88 | | | | 0.87 | | |
Class W | | | 1.22 | | | | 1.19 | | |
Class Y | | | 0.83 | | | | 0.82 | | |
Class Z | | | 0.97 | | | | 0.94 | | |
The voluntary expense cap arrangement may be revised or discontinued at any time. Under the arrangements, the following fees and expenses are excluded from the waiver/reimbursement commitment, and therefore will be paid by the Fund, if applicable: taxes (including foreign transaction taxes), expenses associated with investments in affiliated and non-affiliated pooled investment vehicles (including mutual funds and exchange-traded funds), transaction costs and brokerage commissions, costs related to any securities lending program, dividend expenses associated with securities sold short, inverse floater program fees and expenses, transaction charges and interest on borrowed money, interest and extraordinary expenses. Any fees waived and/or expenses reimbursed under the expense reimbursement arrangements described above are not recoverable by the Investment Manager or its affiliates in future periods.
Note 4. Federal Tax Information
The timing and character of income and capital gain distributions are determined in accordance with income tax regulations, which may differ from GAAP because of temporary or permanent book to tax differences.
At March 31, 2015, these differences are primarily due to differing treatment for deferral/reversal of wash sale losses, Trustees' deferred compensation and net operating loss reclassification. To the extent these differences are permanent, reclassifications are made among the components of the Fund's net assets in the Statement of Assets and Liabilities. Temporary
Annual Report 2015
31
COLUMBIA SELECT LARGE CAP GROWTH FUND
NOTES TO FINANCIAL STATEMENTS (continued)
March 31, 2015
differences do not require reclassifications. In the Statement of Assets and Liabilities the following reclassifications were made:
Excess of distributions over net investment income | | $ | 37,878,671 | | |
Accumulated net realized gain | | | (37,878,671 | ) | |
Net investment income (loss) and net realized gains (losses), as disclosed in the Statement of Operations, and net assets were not affected by this reclassification.
The tax character of distributions paid during the years indicated was as follows:
Year Ended March 31, | | 2015 | | 2014 | |
Ordinary income | | $ | 23,915,068 | | | $ | — | | |
Long-term capital gains | | | 1,022,299,141 | | | | 244,382,163 | | |
Total | | $ | 1,046,214,209 | | | $ | 244,382,163 | | |
Short-term capital gain distributions, if any, are considered ordinary income distributions for tax purposes.
At March 31, 2015, the components of distributable earnings on a tax basis were as follows:
Undistributed ordinary income | | | 113,136,465 | | |
Undistributed long-term capital gains | | | 268,909,812 | | |
Net unrealized appreciation | | | 2,375,490,859 | | |
At March 31, 2015, the cost of investments for federal income tax purposes was $4,788,892,082 and the aggregate gross unrealized appreciation and depreciation based on that cost was:
Unrealized appreciation | | $ | 2,450,405,963 | | |
Unrealized depreciation | | | (74,915,104 | ) | |
Net unrealized appreciation | | | 2,375,490,859 | | |
Management of the Fund has concluded that there are no significant uncertain tax positions in the Fund that would require recognition in the financial statements. However, management's conclusion may be subject to review and adjustment at a later date based on factors including, but not limited to, new tax laws, regulations, and administrative interpretations (including relevant court decisions). Generally, the Fund's federal tax returns for the prior three fiscal years remain subject to examination by the Internal Revenue Service.
Note 5. Portfolio Information
The cost of purchases and proceeds from sales of securities, excluding short-term investments and derivatives, if any, aggregated to $3,205,776,817 and
$3,930,041,471, respectively, for the year ended March 31, 2015. The amount of purchase and sale activity impacts the portfolio turnover rate reported in the Financial Highlights.
Note 6. Affiliated Money Market Fund
The Fund invests in Columbia Short-Term Cash Fund, an affiliated money market fund established for the exclusive use by the Fund and other affiliated funds. The income earned by the Fund from such investments is included as Dividends — affiliated issuers in the Statement of Operations. As an investing fund, the Fund indirectly bears its proportionate share of the expenses of Columbia Short-Term Cash Fund.
Note 7. Shareholder Concentration
At March 31, 2015, two unaffiliated shareholders of record owned 48.9% of the outstanding shares of the Fund in one or more accounts. The Fund has no knowledge about whether any portion of those shares was owned beneficially. Affiliated shareholders of record owned 13.0% of the outstanding shares of the Fund in one or more accounts. Subscription and redemption activity by concentrated accounts may have a significant effect on the operations of the Fund.
Note 8. Line of Credit
The Fund has entered into a revolving credit facility with a syndicate of banks led by JPMorgan Chase Bank, N.A. (JPMorgan) whereby the Fund may borrow for the temporary funding of shareholder redemptions or for other temporary or emergency purposes. Pursuant to a December 9, 2014 amendment, the credit facility agreement, which is a collective agreement between the Fund and certain other funds managed by the Investment Manager, severally and not jointly, permits collective borrowings up to $550 million. Interest is charged to each participating fund based on its borrowings at a rate equal to the higher of (i) the overnight federal funds rate plus 1.00% or (ii) the one-month LIBOR rate plus 1.00%. Each borrowing under the credit facility matures no later than 60 days after the date of borrowing. The Fund also pays a commitment fee equal to its pro rata share of the amount of the credit facility at a rate of 0.075% per annum. The commitment fee is included in other expenses in the Statement of Operations. Prior to the December 9, 2014 amendment, the credit facility agreement permitted borrowings up to $500 million
Annual Report 2015
32
COLUMBIA SELECT LARGE CAP GROWTH FUND
NOTES TO FINANCIAL STATEMENTS (continued)
March 31, 2015
under the same terms and interest rates as described above.
For the year ended March 31, 2015, the average daily loan balance outstanding on days when borrowing existed was $4,800,000 at a weighted average interest rate of 1.16%. Interest expense incurred by the Fund is recorded as a line of credit interest expense in the Statement of Operations.
Note 9. Significant Risks
Consumer Discretionary Sector Risk
Sector risk occurs when a fund invests a significant portion of its assets in securities of companies conducting business in a related group of industries within an economic sector. Companies in the same economic sector may be similarly affected by economic, regulatory, political or market events or conditions, making a fund more vulnerable to unfavorable developments in that economic sector than funds that invest more broadly. The Fund may be more susceptible to the particular risks that may affect companies in the consumer discretionary sector than if it were invested in a wider variety of companies in unrelated sectors.
Health Care Sector Risk
Sector risk occurs when a fund invests a significant portion of its assets in securities of companies conducting business in a related group of industries within an economic sector. Companies in the same economic sector may be similarly affected by economic, regulatory, political or market events or conditions, making a fund more vulnerable to unfavorable developments in that economic sector than funds that invest more broadly. The Fund may be more susceptible to the particular risks that may affect companies in the health care sector than if it were invested in a wider variety of companies in unrelated sectors.
Information Technology Sector Risk
Sector risk occurs when a fund invests a significant portion of its assets in securities of companies conducting business in a related group of industries within an economic sector. Companies in the same economic sector may be similarly affected by economic, regulatory, political or market events or conditions, making a fund more vulnerable to unfavorable developments in that economic sector than funds that invest more broadly. The Fund may be more susceptible to the particular risks that may affect companies in the information technology sector than if it were invested in a wider variety of companies in unrelated sectors.
Note 10. Subsequent Events
Management has evaluated the events and transactions that have occurred through the date the financial statements were issued and noted no items requiring adjustment of the financial statements or additional disclosure.
Note 11. Information Regarding Pending and Settled Legal Proceedings
In December 2005, without admitting or denying the allegations, American Express Financial Corporation (AEFC, which is now known as Ameriprise Financial, Inc. (Ameriprise Financial)) entered into settlement agreements with the Securities and Exchange Commission (SEC) and Minnesota Department of Commerce (MDOC) related to market timing activities. As a result, AEFC was censured and ordered to cease and desist from committing or causing any violations of certain provisions of the Investment Advisers Act of 1940, the Investment Company Act of 1940, and various Minnesota laws. AEFC agreed to pay disgorgement of $10 million and civil money penalties of $7 million. AEFC also agreed to retain an independent distribution consultant to assist in developing a plan for distribution of all disgorgement and civil penalties ordered by the SEC in accordance with various undertakings detailed at www.sec.gov/litigation/admin/ia-2451.pdf. Ameriprise Financial and its affiliates have cooperated with the SEC and the MDOC in these legal proceedings, and have made regular reports to the Funds' Boards of Trustees.
Ameriprise Financial and certain of its affiliates have historically been involved in a number of legal, arbitration and regulatory proceedings, including routine litigation, class actions, and governmental actions, concerning matters arising in connection with the conduct of their business activities. Ameriprise Financial believes that the Funds are not currently the subject of, and that neither Ameriprise Financial nor any of its affiliates are the subject of, any pending legal, arbitration or regulatory proceedings that are likely to have a material adverse effect on the Funds or the ability of Ameriprise Financial or its affiliates to perform under their contracts with the Funds. Ameriprise Financial is required to make quarterly (10-Q), annual (10-K) and, as necessary, 8-K filings with the Securities and Exchange Commission on legal and regulatory matters that relate to Ameriprise Financial and its affiliates. Copies of these filings may be obtained by accessing the SEC website at www.sec.gov.
Annual Report 2015
33
COLUMBIA SELECT LARGE CAP GROWTH FUND
NOTES TO FINANCIAL STATEMENTS (continued)
March 31, 2015
There can be no assurance that these matters, or the adverse publicity associated with them, will not result in increased fund redemptions, reduced sale of fund shares or other adverse consequences to the Funds. Further, although we believe proceedings are not likely to have a material adverse effect on the Funds or the ability of Ameriprise Financial or its affiliates to perform under their contracts with the Funds, these proceedings are subject to uncertainties and, as such, we are unable to estimate the possible loss or range of loss that may result. An adverse outcome in one or more of these proceedings could result in adverse judgments, settlements, fines, penalties or other relief that could have a material adverse effect on the consolidated financial condition or results of operations of Ameriprise Financial.
Annual Report 2015
34
COLUMBIA SELECT LARGE CAP GROWTH FUND
REPORT OF INDEPENDENT REGISTERED PUBLIC ACCOUNTING FIRM
To the Trustees of Columbia Funds Series Trust I and the Shareholders of
Columbia Select Large Cap Growth Fund
In our opinion, the accompanying statement of assets and liabilities, including the portfolio of investments, and the related statements of operations and of changes in net assets and the financial highlights present fairly, in all material respects, the financial position of Columbia Select Large Cap Growth Fund (the "Fund", a series of Columbia Funds Series Trust I) at March 31, 2015, and the results of its operations, the changes in its net assets and the financial highlights for each of the periods indicated, in conformity with accounting principles generally accepted in the United States of America. These financial statements and financial highlights (hereafter referred to as "financial statements") are the responsibility of the Fund's management. Our responsibility is to express an opinion on these financial statements based on our audits. We conducted our audits of these financial statements in accordance with the standards of the Public Company Accounting Oversight Board (United States). Those standards require that we plan and perform the audit to obtain reasonable assurance about whether the financial statements are free of material misstatement. An audit includes examining, on a test basis, evidence supporting the amounts and disclosures in the financial statements, assessing the accounting principles used and significant estimates made by management, and evaluating the overall financial statement presentation. We believe that our audits, which included confirmation of securities at March 31, 2015 by correspondence with the custodian, brokers and transfer agent, provide a reasonable basis for our opinion.
PricewaterhouseCoopers LLP
Minneapolis, Minnesota
May 22, 2015
Annual Report 2015
35
COLUMBIA SELECT LARGE CAP GROWTH FUND
FEDERAL INCOME TAX INFORMATION
(Unaudited)
The Fund hereby designates the following tax attributes for the fiscal year ended March 31, 2015. Shareholders will be notified in early 2016 of the amounts for use in preparing 2015 income tax returns.
Tax Designations:
| Qualified Dividend Income | | | 77.59 | % | |
| Dividends Received Deduction | | | 75.96 | % | |
Capital Gain Dividend | | $ | 795,500,203 | | |
Qualified Dividend Income. For taxable, non-corporate shareholders, the percentage of ordinary income distributed during the fiscal year that represents qualified dividend income subject to reduced tax rates.
Dividends Received Deduction. The percentage of ordinary income distributed during the fiscal year that qualifies for the corporate dividends received deduction.
Capital Gain Dividend. The Fund designates as a capital gain dividend the amount reflected above, or if subsequently determined to be different, the net capital gain of such fiscal period.
Annual Report 2015
36
COLUMBIA SELECT LARGE CAP GROWTH FUND
The Trustees serve terms of indefinite duration. The names, addresses and birth years of the Trustees and Officers of the Funds in Columbia Funds Series Trust I, the year each was first elected or appointed to office, their principal business occupations during at least the last five years, the number of Funds overseen by each Trustee and other directorships they hold are shown below. Each officer listed below serves as an officer of each Fund in Columbia Funds Series Trust I.
Independent Trustees
Name, Year of Birth
and Position Held
with the Trust | | Year First
Appointed or
Elected as
Trustee to any
Fund Currently
in the Columbia
Funds Complex
or a Predecessor
Thereof | | Principal Occupation(s)
during the Past Five Years | | Number
of Funds
in the
Columbia
Funds
Complex
Overseen | | Other Directorships
Held by Trustee During
the Past Five Years | |
Douglas A. Hacker
(Born 1955)
Trustee and Chairman
of the Board | | | 1996 | | | Independent business executive since May 2006; Executive Vice President — Strategy of United Airlines from December 2002 to May 2006; President of UAL Loyalty Services (airline marketing company) from September 2001 to December 2002; Executive Vice President and Chief Financial Officer of United Airlines from July 1999 to September 2001 | | | 59 | | | Spartan Nash Company, (food distributor); Nash Finch Company (food distributor) from 2005 to 2013; Aircastle Limited (aircraft leasing); and SeaCube Container Leasing Ltd. (container leasing) from 2010 to 2013; and Travelport Worldwide Limited (travel information technology) | |
Janet Langford Kelly
(Born 1957)
Trustee | | | 1996 | | | Senior Vice President, General Counsel and Corporate Secretary, ConocoPhillips (integrated energy company) since September 2007; Deputy General Counsel — Corporate Legal Services, ConocoPhillips from August 2006 to August 2007; Partner, Zelle, Hofmann, Voelbel, Mason & Gette LLP (law firm) from March 2005 to July 2006; Adjunct Professor of Law, Northwestern University from September 2004 to June 2006; Director, UAL Corporation (airline) from February 2006 to July 2006; Chief Administrative Officer and Senior Vice President, Kmart Holding Corporation (consumer goods) from September 2003 to March 2004 | | | 59 | | | None | |
Nancy T. Lukitsh
(Born 1956)
Trustee | | | 2011 | | | Senior Vice President, Partner and Director of Marketing, Wellington Management Company, LLP (investment adviser) from 1997 to 2010; Chair, Wellington Management Investment Portfolios (commingled non-U.S. investment pools) from 2007 to 2010; Director, Wellington Trust Company, NA and other Wellington affiliates from 1997 to 2010 | | | 59 | | | None | |
William E. Mayer
(Born 1940)
Trustee | | | 1991 | | | Partner, Park Avenue Equity Partners (private equity) since February 1999 | | | 59 | | | DynaVox Inc. (speech creation); Lee Enterprises (print media); WR Hambrecht + Co. (financial service provider) from 2000 to 2012; BlackRock Kelso Capital Corporation (investment company); Premier, Inc. (healthcare) | |
Annual Report 2015
37
COLUMBIA SELECT LARGE CAP GROWTH FUND
TRUSTEES AND OFFICERS (continued)
Independent Trustees (continued)
Name, Year of Birth
and Position Held
with the Trust | | Year First
Appointed or
Elected as
Trustee to any
Fund Currently
in the Columbia
Funds Complex
or a Predecessor
Thereof | | Principal Occupation(s)
during the Past Five Years | | Number
of Funds
in the
Columbia
Funds
Complex
Overseen | | Other Directorships
Held by Trustee During
the Past Five Years | |
David M. Moffett
(Born 1952)
Trustee | | | 2011 | | | Retired. Consultant to Bridgewater and Associates; Chief Executive Officer, Federal Home Loan Mortgage Corporation, from 2008 to 2009; Senior Adviser, Global Financial Services Group, Carlyle Group, Inc., from 2007 to 2008; Vice Chairman and Chief Financial Officer, U.S. Bancorp, from 1993 to 2007 | | | 59 | | | CIT Group Inc. (commercial and consumer finance); eBay Inc. (online trading community); MBIA Inc. (financial service provider); E.W. Scripps Co. (print and television media); Building Materials Holding Corp. (building materials and construction services); Genworth Financial, Inc. (financial and insurance products and services); and University of Oklahoma Foundation | |
Charles R. Nelson
(Born 1942)
Trustee | | | 1981 | | | Retired. Professor Emeritus, University of Washington since 2011; Professor of Economics, University of Washington from 1976 to 2011; Ford and Louisa Van Voorhis Professor of Political Economy, University of Washington from 1993 to 2011; Adjunct Professor of Statistics, University of Washington from 1980 to 2011; Associate Editor, Journal of Money, Credit and Banking from September 1993 to 2008; consultant on econometric and statistical matters | | | 59 | | | None | |
John J. Neuhauser
(Born 1943)
Trustee | | | 1984 | | | President, Saint Michael's College since August 2007; Director or Trustee of several non-profit organizations, including Fletcher Allen Health Care, Inc.; Academic Vice President and Dean of Faculties, Boston College from August 1999 to October 2005; University Professor, Boston College from November 2005 to August 2007 | | | 59 | | | Liberty All-Star Equity Fund and Liberty All-Star Growth Fund (closed-end funds) | |
Patrick J. Simpson
(Born 1944)
Trustee | | | 2000 | | | Partner, Perkins Coie LLP (law firm) | | | 59 | | | None | |
Anne-Lee Verville
(Born 1945)
Trustee | | | 1998 | | | Retired. General Manager, Global Education Industry from 1994 to 1997, President — Application Systems Division from 1991 to 1994, Chief Financial Officer — US Marketing & Services from 1988 to 1991, and Chief Information Officer from 1987 to 1988, IBM Corporation (computer and technology) | | | 59 | | | Enesco Group, Inc. (producer of giftware and home and garden decor products) from 2001 to 2006 | |
Annual Report 2015
38
COLUMBIA SELECT LARGE CAP GROWTH FUND
TRUSTEES AND OFFICERS (continued)
Interested Trustee Affiliate with Investment Manager*
Name, Year of Birth
and Position Held
with the Trust | | Year First
Appointed or
Elected as
Trustee to any
Fund Currently
in the Columbia
Funds Complex
or a Predecessor
Thereof | | Principal Occupation(s)
during the Past Five Years | | Number
of Funds
in the
Columbia
Funds
Complex
Overseen | | Other Directorships
Held by Trustee During
the Past Five Years | |
William F. Truscott
(Born 1960)
Trustee | | | 2012 | | | Chairman of the Board and President, Columbia Management Investment Advisers, LLC since May 2010 and February 2012, respectively (previously President and Chief Investment Officer, 2001-April 2010); Chief Executive Officer, Global Asset Management, Ameriprise Financial, Inc. since September 2012 (previously Chief Executive Officer, U.S. Asset Management & President, Annuities, May 2010-September 2012 and President — U.S. Asset Management and Chief Investment Officer, 2005-April 2010); Director and Chief Executive Officer, Columbia Management Investment Distributors, Inc. since May 2010 and February 2012, respectively (previously Chairman of the Board and Chief Executive Officer, 2006-April 2010); Chairman of the Board and Chief Executive Officer, RiverSource Distributors, Inc. since 2006; Director, Threadneedle Asset Management Holdings, SARL since 2014; President and Chief Executive Officer, Ameriprise Certificate Company, 2006-August 2012 | | | 186 | | | Chairman of the Board, Columbia Management Investment Advisers, LLC since May 2010; Director, Columbia Management Investment Distributors, Inc. since May 2010; Director, Ameriprise Certificate Company, 2006 to January 2013 | |
* Interested person (as defined under the 1940 Act) by reason of being an officer, director, security holder and/or employee of the Investment Manager or Ameriprise Financial.
The Statement of Additional Information has additional information about the Fund's Board members and is available, without charge, upon request by calling 800.345.6611; contacting your financial intermediary; or visiting columbiathreadneedle.com/us.
The Board has appointed officers who are responsible for day-to-day business decisions based on policies it has established. The officers serve at the pleasure of the Board. In addition to Mr. Truscott, who is Senior Vice President, the Funds' other officers are:
Fund Officers
Name,
Address and
Year of Birth | | Position and Year
First Appointed to
Position for any Fund
in the Columbia
Funds Complex or a
Predecessor Thereof | | Principal Occupation(s) During Past Five Years | |
Christopher O. Petersen
5228 Ameriprise
Financial Center
Minneapolis, MN 55474
Born 1970 | | President and Principal Executive Officer (2015) | | Vice President and Lead Chief Counsel, Ameriprise Financial, Inc. since January 2015 (previously, Vice President and Chief Counsel January 2010-December 2014; and Vice President and Group Counsel or Counsel 2004-January 2010); officer of Columbia Funds and affiliated funds since 2007. | |
Michael G. Clarke
225 Franklin Street
Boston, MA 02110
Born 1969 | | Treasurer (2011) and Chief Financial Officer (2009) | | Vice President — Mutual Fund Administration, Columbia Management Investment Advisers, LLC, since May 2010; Managing Director of Fund Administration, Columbia Management Advisors, LLC, September 2004-April 2010; senior officer of Columbia Funds and affiliated funds since 2002. | |
Annual Report 2015
39
COLUMBIA SELECT LARGE CAP GROWTH FUND
TRUSTEES AND OFFICERS (continued)
Fund Officers (continued)
Name,
Address and
Year of Birth | | Position and Year
First Appointed to
Position for any Fund
in the Columbia
Funds Complex or a
Predecessor Thereof | | Principal Occupation(s) During Past Five Years | |
Paul B. Goucher
100 Park Avenue
New York, NY 10017
Born 1968 | | Senior Vice President (2011), Chief Legal Officer (2015) and Assistant Secretary (2008) | | Vice President and Lead Chief Counsel, Ameriprise Financial, Inc. since November 2008 and January 2013, respectively (previously Chief Counsel, January 2010-January 2013 and Group Counsel, November 2008-January 2010). | |
Thomas P. McGuire
225 Franklin Street
Boston, MA 02110
Born 1972 | | Vice President and Chief Compliance Officer (2012) | | Vice President — Asset Management Compliance, Ameriprise Financial, Inc., since May 2010; Chief Compliance Officer, Ameriprise Certificate Company since September 2010; Compliance Executive, Bank of America, 2005-April 2010. | |
Colin Moore
225 Franklin Street
Boston, MA 02110
Born 1958 | | Senior Vice President (2010) | | Executive Vice President and Global Chief Investment Officer, Ameriprise Financial, Inc., since July 2013; Director and Global Chief Investment Officer, Columbia Management Investment Advisers, LLC since May 2010; Manager, Managing Director and Chief Investment Officer, Columbia Management Advisors, LLC, 2007-April 2010. | |
Michael E. DeFao
225 Franklin Street
Boston, MA 02110
Born 1968 | | Vice President (2011) and Assistant Secretary (2010) | | Vice President and Chief Counsel, Ameriprise Financial, Inc. since May 2010; Associate General Counsel, Bank of America, 2005-April 2010. | |
Joseph F. DiMaria
225 Franklin Street
Boston, MA 02110
Born 1968 | | Vice President (2011), Assistant Treasurer (2012) and Chief Accounting Officer (2008) | | Vice President — Mutual Fund Treasurer, Columbia Management Investment Advisers, LLC since May 2010; Director of Fund Administration, Columbia Management Advisors, LLC, 2006-April 2010. | |
Amy Johnson
5228 Ameriprise
Financial Center
Minneapolis, MN 55474
Born 1965 | | Vice President (2006) | | Managing Director and Chief Operating Officer, Columbia Management Investment Advisers, LLC since May 2010 (previously Chief Administrative Officer, 2009-April 2010, and Vice President — Asset Management and Trust Company Services, 2006-2009). | |
Lyn Kephart-Strong
5228 Ameriprise
Financial Center
Minneapolis, MN 55474
Born 1960 | | Vice President (2015) | | President, Columbia Management Investment Services Corp. since October 2014; Vice President & Resolution Officer, Ameriprise Trust Company since August 2009; President, RiverSource Service Corporation 2004-2010. | |
Ryan C. Larrenaga
225 Franklin Street
Boston, MA 02110
Born 1970 | | Vice President and Secretary (2015) | | Vice President and Group Counsel, Ameriprise Financial, Inc. since August 2011 (previously, Counsel from May 2010 to August 2011); Assistant General Counsel, Bank of America, 2005-April 2010; officer of Columbia Funds and affiliated funds since 2005. | |
Annual Report 2015
40
COLUMBIA SELECT LARGE CAP GROWTH FUND
IMPORTANT INFORMATION ABOUT THIS REPORT
Each fund mails one shareholder report to each shareholder address. If you would like more than one report, please call shareholder services at 800.345.6611 and additional reports will be sent to you.
The policy of the Board is to vote the proxies of the companies in which each fund holds investments consistent with the procedures as stated in the Statement of Additional Information (SAI). You may obtain a copy of the SAI without charge by calling 800.345.6611; contacting your financial intermediary; visiting columbiathreadneedle.com/us; or searching the website of the Securities and Exchange Commission (SEC) at sec.gov. Information regarding how each fund voted proxies relating to portfolio securities is filed with the SEC by August 31st for the most recent 12-month period ending June 30th of that year, and is available without charge by visiting columbiathreadneedle.com/us, or searching the website of the SEC at sec.gov.
Each fund files a complete schedule of portfolio holdings with the SEC for the first and third quarters of each fiscal year on Form N-Q. Each fund's Form N-Q is available on the SEC's website at sec.gov and may be reviewed and copied at the SEC's Public Reference Room in Washington, D.C. Information on the operation of the Public Reference Room may be obtained by calling 800.SEC.0330. Each fund's complete schedule of portfolio holdings, as filed on Form N-Q, can also be obtained without charge, upon request, by calling 800.345.6611.
Annual Report 2015
41
Columbia Select Large Cap Growth Fund
P.O. Box 8081
Boston, MA 02266-8081

This information is for use with concurrent or prior delivery of a fund prospectus. Please read and consider the investment objectives, risks, charges and expenses for any fund carefully before investing. For a prospectus and summary prospectus, which contains this and other important information about the Fund, go to columbiathreadneedle.com/us. The Fund is distributed by Columbia Management Investment Distributors, Inc., member FINRA, and managed by Columbia Management Investment Advisers, LLC.
Columbia Threadneedle Investments (Columbia Threadneedle) is the global brand name of the Columbia and Threadneedle group of companies.
All rights reserved. Columbia Management Investment Distributors, Inc., 225 Franklin Street, Boston, MA 02110-2804
© 2015 Columbia Management Investment Advisers, LLC.
columbiathreadneedle.com/us
ANN215_03_E01_(05/15)

ANNUAL REPORT
March 31, 2015

ACTIVE PORTFOLIOS® MULTI-MANAGER GROWTH FUND


ABOUT COLUMBIA THREADNEEDLE INVESTMENTS
Columbia Threadneedle Investments is a leading global asset management group that provides a broad range of actively managed investment strategies and solutions for individual, institutional and corporate clients around the world.
With more than 2,000 people, including over 450 investment professionals based in North America, Europe and Asia, we manage $506 billion* of assets across developed and emerging market equities, fixed income, asset allocation solutions and alternatives. We are the 11th largest manager of long-term mutual fund assets in the U.S.** and the 5th largest manager of retail funds in the U.K.***
Our priority is the investment success of our clients. We aim to deliver the investment outcomes they expect through an investment approach that is team-based, performance-driven and risk-aware. Our culture is dynamic and interactive. By sharing our insights across asset classes and geographies, we generate richer perspectives on global, regional and local investment landscapes. The ability to exchange and debate investment ideas in a collaborative environment enriches our teams’ investment processes. More importantly, it results in better informed investment decisions for our clients.
Columbia funds are distributed by Columbia Management Investment Distributors, Inc., member FINRA, and managed by Columbia Management Investment Advisers, LLC.
Columbia Threadneedle Investments (Columbia Threadneedle) is the global brand name of the Columbia and Threadneedle group of companies.
| * | | In U.S. dollars as of December 31, 2014. Source: Ameriprise Q4 Earnings Release. Includes all assets managed by entities in the Columbia and Threadneedle groups of companies. |
Contact us for more current data.
| ** | | Source: ICI as of December 31, 2014 for Columbia Management Investment Advisers, LLC. |
| *** | | Source: Investment Association as of December 2014 for Threadneedle Asset Management Limited. |
© 2015 Columbia Management Investment Advisers, LLC. All rights reserved.
Not part of the shareholder report
Get the market insight you need from our investment experts
Connect with Columbia Threadneedle Investments
Investor insight
Find economic and market commentary, investment videos, white papers,
mutual fund commentary and more at columbiathreadneedle.com/us.
| | | | |
 | | Columbia Threadneedle Investor Newsletter (e-newsletter) Read our award-winning* shareholder
newsletter. Our quarterly newsletter
is available online and provides timely
and relevant content about economic
trends, fund news, service enhancements and
changes. Sign up to receive the newsletter
electronically at columbiathreadneedle.com/
us/newsletter. | |  |
| | |
 | | Investment videos Get analysis of current events and trends that may affect your investments.
Visit our online video library to watch and discover what our thought leaders
are saying about the financial markets and economy. |
| | |
| | Social media We offer you multiple ways to access our market commentary and
investment insights. |
| | n | | Perspectives blog at columbiathreadneedle.com/us |
Read timely posts by our investment team, including our chief investment officer, chief economist and portfolio managers.
| | n | | twitter.com/CTinvest_US |
Follow us on Twitter for quick, up-to-the-minute comments on market news and more.
View our commentaries on the economy, markets and current investment opportunities.
| | n | | linkedin.com/company/columbia-threadneedle-investments-us |
Connect with us on LinkedIn for updates from our thought leaders.
| * | Columbia Threadneedle Investor Newsletter was awarded top honors in the Mutual Fund Education Alliance STAR Awards competition for excellence in mutual fund marketing and communications in 2011, 2012 and 2013. Materials in the competition were evaluated on educational value, message comprehension, effective design and objectives. |
Not part of the shareholder report
Stay informed
Become a subscriber to receive the latest investment publications and mutual fund commentaries
Subscribe to Columbia Threadneedle Investments
Email subscription center
Subscribe to the latest information from Columbia Threadneedle. Visit our email subscription center at columbiathreadneedle.com/us/subscribe to register for economic and market commentary, product and service updates, white papers and more.
| n | | Columbia Threadneedle Investor Newsletter |
Quarterly newsletter featuring the latest macro- and micro-economic trends, investment themes, products, service changes and other items of interest to our investors
| n | | Investment Strategy Outlook |
Quarterly publication featuring the Columbia Threadneedle Asset Allocation Team’s perspective on global economic investment conditions and markets
Quarterly publication featuring more than 40 charts and graphs that highlight the current state of the economy and the markets; includes straightforward insight on current investment opportunities
Frequent articles that delve deep into a variety of investment topics
Quarterly portfolio manager commentary and fund fact sheets available for Columbia funds. (Not all funds have a commentary.)
Register your information online at columbiathreadneedle.com/us/subscribe and select the publications you would like to receive. Update your subscriptions at any time by accessing the email subscription center.
CT-MK (03/15) 5383/1125800
PRESIDENT’S MESSAGE

Dear Shareholder,
In a world that is changing faster than ever before, investors want asset managers who offer a global perspective while generating strong and sustainable returns. To that end, Columbia Management, in conjunction with its U.K.-based affiliate, Threadneedle Investments, has rebranded to Columbia Threadneedle Investments. The new global brand represents the combined capabilities, resources and reach of the global group, offering investors access to the best of both firms.
With a presence in 18 countries and more than 450 investment professionals*, our collective perspective and world view as Columbia Threadneedle Investments gives us deeper insight into what might affect the real-life financial outcomes clients are seeking. Putting our views into a global context enables us to build richer perspectives and create the right solutions, and provides us with enhanced capabilities to deliver consistent investment performance, which may ultimately lead to better investor outcomes.
As a result of the rebrand, you will begin to see our new logo and colors reflected in printed materials, such as this shareholder report, as well as on our new website — columbiathreadneedle.com/us. We encourage you to visit us online and view a new video on the “About Us” tab that speaks to the strength of the firm.
While we are introducing a new brand, in many ways, the investment company you know well has not changed. The following remain in effect:
| n | | Fund and strategy names |
| n | | Established investment teams, philosophies and processes |
| n | | Account services, features, servicing phone numbers and mailing addresses |
| n | | Columbia Management Investment Distributors as distributor and Columbia Management Investment Advisers as investment adviser |
We recognize that the money we manage represents the hard work and savings of people like you, and that everyone has different ambitions and different definitions of success. Investors have varying goals — funding their children’s education, enjoying their retirement, putting money aside for unexpected events, and more. Whatever your ambitions, we believe our wide range of investment products and solutions can help give you confidence that you will reach your goals.
The world is constantly changing, but our priority remains the same: to help you secure your finances, meet your goals and achieve success. Thank you for your continued investment with us. Our service representatives are available at 800.345.6611 to help with any questions.
Sincerely,

Christopher O. Petersen
President, Columbia Funds
Investors should consider the investment objectives, risks, charges and expenses of a mutual fund carefully before investing. For a free prospectus and summary prospectus, which contains this and other important information about a fund, visit columbiathreadneedle.com/us. The prospectus should be read carefully before investing.
* Source: Ameriprise as of December 1, 2014
Columbia Funds are distributed by Columbia Management Investment Distributors, Inc., member FINRA, and managed by Columbia Management Investment Advisers, LLC.
© 2015 Columbia Management Investment Advisers, LLC. All rights reserved.
Annual Report 2015
| | |
| |
| | ACTIVE PORTFOLIOS® MULTI-MANAGER GROWTH FUND |
TABLE OF CONTENTS
Fund Investment Manager
Columbia Management Investment
Advisers, LLC
225 Franklin Street
Boston, MA 02110
Fund Distributor
Columbia Management Investment
Distributors, Inc.
225 Franklin Street
Boston, MA 02110
Fund Transfer Agent
Columbia Management Investment
Services Corp.
P.O. Box 8081
Boston, MA 02266-8081
For more information about any of the funds, please visit columbiathreadneedle.com/us or call 800.345.6611. Customer Service Representatives are available to answer your questions Monday through Friday from 8 a.m. to 7 p.m. Eastern time.
The views expressed in this report reflect the current views of the respective parties. These views are not guarantees of future performance and involve certain risks, uncertainties and assumptions that are difficult to predict, so actual outcomes and results may differ significantly from the views expressed. These views are subject to change at any time based upon economic, market or other conditions and the respective parties disclaim any responsibility to update such views. These views may not be relied on as investment advice and, because investment decisions for a Columbia fund are based on numerous factors, may not be relied on as an indication of trading intent on behalf of any particular Columbia fund. References to specific securities should not be construed as a recommendation or investment advice.
Annual Report 2015
| | |
| |
| ACTIVE PORTFOLIOS® MULTI-MANAGER GROWTH FUND | | |
PERFORMANCE OVERVIEW
Performance Summary
| n | | Active Portfolios® Multi-Manager Growth Fund (the Fund) Class A shares returned 13.24% for the 12 months ended March 31, 2015. |
| n | | The Fund underperformed its benchmark, the Russell 1000 Growth Index, which returned 16.09% during the same time period. |
| n | | Stock selection generally accounted for the Fund’s shortfall relative to the benchmark. |
| | | | | | | | | | |
Average Annual Total Returns (%) (for period ended March 31, 2015) | | | | | | | | | | |
| | | Inception | | 1 Year | | | Life | |
Class A | | 04/20/12 | | | 13.24 | | | | 16.95 | |
Russell 1000 Growth Index | | | | | 16.09 | | | | 17.32 | |
All results shown assume reinvestment of distributions during the period. Returns do not reflect the deduction of taxes that a shareholder may pay on Fund distributions or on the redemption of Fund shares. Performance results reflect the effect of any fee waivers or reimbursements of Fund expenses by Columbia Management Investment Advisers, LLC and/or any of its affiliates. Absent these fee waivers or expense reimbursement arrangements, performance results would have been lower.
The performance information shown represents past performance and is not a guarantee of future results. The investment return and principal value of your investment will fluctuate so that your shares, when redeemed, may be worth more or less than their original cost. Current performance may be lower or higher than the performance information shown. You may obtain performance information current to the most recent month-end by contacting your financial intermediary, visiting columbiathreadneedle.com/us or calling 800.345.6611.
The Russell 1000 Growth Index, an unmanaged index, measures the performance of those Russell 1000 Index companies with higher price-to-book ratios and higher forecasted growth values.
Indices are not available for investment, are not professionally managed and do not reflect sales charges, fees, brokerage commissions, taxes or other expenses of investing. Securities in the Fund may not match those in an index.
| | |
| |
| | ACTIVE PORTFOLIOS® MULTI-MANAGER GROWTH FUND |
PERFORMANCE OVERVIEW (continued)
|
Performance of a Hypothetical $10,000 Investment (April 20, 2012 — March 31, 2015) |
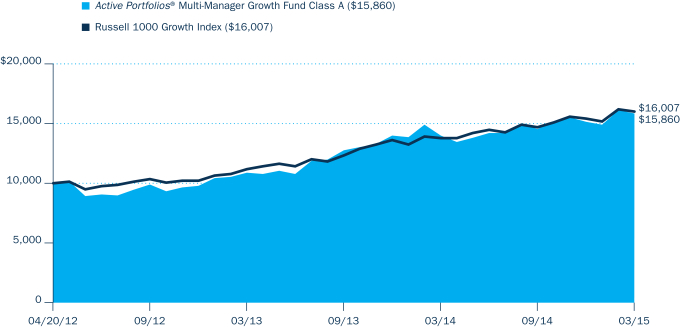
The chart above shows the change in value of a hypothetical $10,000 investment in Class A shares of Active Portfolios® Multi-Manager Growth Fund during the stated time period, and does not reflect the deduction of taxes that a shareholder may pay on Fund distributions or on the redemption of Fund shares.
| | |
| |
| ACTIVE PORTFOLIOS® MULTI-MANAGER GROWTH FUND | | |
MANAGER DISCUSSION OF FUND PERFORMANCE
For the 12-month period ended March 31, 2015, the Fund’s Class A shares returned 13.24% excluding sales charges. The Fund underperformed its benchmark, the Russell 1000 Growth Index, which returned 16.09% for the same time period. Within the segment of the portfolio managed by Columbia Management Investment Advisers, LLC (CMIA), stock selection in the consumer discretionary, information technology and industrials sectors generally accounted for the modest shortfall relative to the benchmark. Within the segment of the portfolio managed by Loomis Sayles & Company, L.P. (Loomis Sayles), security selection within health care, information technology and financials detracted the most from relative performance. As of April 30, 2015, CMIA and Loomis Sayles managed approximately 84% and 16% of the portfolio, respectively.
Stocks Climbed as U.S. Economy Strengthened
After a cold and difficult winter brought many parts of the United States to a standstill early in 2014, the pace of U.S. economic growth picked up and good news appeared in many sectors. The labor market added 261,000 new jobs monthly, on average, during the 12-month period ended March 31, 2015. Solid new job growth drove the unemployment rate down to 5.5%, and prospects for higher wages generally buoyed consumer confidence during the period. Manufacturing activity remained solid, as capacity utilization rose to a post-recovery high late in 2014. However, another stormy winter in the Northeast and Midwest nipped growth early in 2015. Manufacturing activity and consumer confidence slipped somewhat as harsh weather weighed on short-term expectations. The housing market’s recovery was restrained by both periods of bad weather, tighter borrowing standards, rising prices, declining inventories and higher mortgage rates.
Investors responded favorably to the generally good economic news. However, concerns about increased global tensions, uncertainty about the Federal Reserve’s (the Fed’s) next move and sinking oil prices resulted in bouts of volatility that became more pronounced as the period wore on. The Fed spent 2014 winding down its monthly bond purchases, ending its program of quantitative easing in October, and suggested that it would raise short-term interest rates sometime in 2015. However, the timing of that move remained unclear at period end, especially as some weaker data appeared in the final months of the period. In this environment, mid- and large-company stocks were the strongest equity market performers, outperforming small-cap stocks by a solid margin. Growth stocks comfortably outperformed value stocks for the period.
Contributors and Detractors
CMIA: The portfolio’s substantial positions in biotechnology names within the health care sector aided results and amplified gains. Within biotechnology, the portfolio benefited from investments in Pharmacyclics, which is focused on the development and commercialization of small molecule drugs for oncology and immunology; Vertex Pharmaceuticals, which develops cystic fibrosis therapies; Alexion Pharmaceuticals, which focuses on rare blood disorders; Celgene, which manufactures drug therapies for cancer and inflammatory disorders; and Gilead Sciences, which specializes in HIV and hepatitis C treatments. Pharmacyclics shares more than doubled in price, as the company announced faster-than-expected market penetration of its leading drug Imbruvica. An announcement of a buyout by
Portfolio Management
Columbia Management Investment Advisers, LLC
Thomas Galvin, CFA
Todd Herget
Richard Carter
Loomis, Sayles & Company, L.P.
Aziz Hamzaogullari, CFA
Morningstar Style Box™

The Morningstar Style Box™ is based on a fund’s portfolio holdings. For equity funds, the vertical axis shows the market capitalization of the stocks owned, and the horizontal axis shows investment style (value, blend, or growth). Information shown is based on the most recent data provided by Morningstar.
© 2015 Morningstar, Inc. All rights reserved. The Morningstar information contained herein: (1) is proprietary to Morningstar and/or its content providers; (2) may not be copied or distributed; and (3) is not warranted to be accurate, complete or timely. Neither Morningstar nor its content providers are responsible for any damages or losses arising from any use of this information.
| | | | |
Top Ten Holdings (%) (at March 31, 2015) | |
Amazon.com, Inc. | | | 4.4 | |
Facebook, Inc., Class A | | | 3.9 | |
Twitter, Inc. | | | 3.9 | |
Visa, Inc., Class A | | | 3.8 | |
Priceline Group, Inc. (The) | | | 3.6 | |
Bristol-Myers Squibb Co. | | | 3.4 | |
salesforce.com, Inc. | | | 3.4 | |
Alibaba Group Holding Ltd., ADR | | | 3.2 | |
LinkedIn Corp., Class A | | | 3.2 | |
Illumina, Inc. | | | 3.1 | |
Percentages indicated are based upon total investments (excluding Money Market Funds).
For further detail about these holdings, please refer to the section entitled “Portfolio of Investments.”
Fund holdings are as of the date given, are subject to change at any time, and are not recommendations to buy or sell any security.
| | |
| |
| | ACTIVE PORTFOLIOS® MULTI-MANAGER GROWTH FUND |
MANAGER DISCUSSION OF FUND PERFORMANCE (continued)
| | | | |
Portfolio Breakdown (%) (at March 31, 2015) | |
Common Stocks | | | 98.2 | |
Consumer Discretionary | | | 17.7 | |
Consumer Staples | | | 2.8 | |
Energy | | | 5.3 | |
Financials | | | 0.8 | |
Health Care | | | 23.5 | |
Industrials | | | 2.6 | |
Information Technology | | | 43.4 | |
Materials | | | 2.1 | |
Money Market Funds | | | 1.8 | |
Total | | | 100.0 | |
Percentages indicated are based upon total investments. The Fund’s portfolio composition is subject to change.
Investment Risks
The Fund is subject to stock market fluctuations. By maintaining a relatively concentrated portfolio, the Fund may be subject to greater risk than a Fund that is more fully diversified. The Fund may invest in foreign securities. International investing involves special risks, including foreign taxation, currency risks, risks associated with possible differences in financial standards, and other monetary and political risks. See the Fund’s prospectus for more information on these and other risks.
pharmaceutical company AbbVie sent Pharmacyclics shares even higher. We exited the position and took profits on news of the deal, redeploying assets into Intercept Pharmaceuticals and other existing holdings. Intercept Pharmaceuticals is focused on developing and commercializing therapeutics to treat chronic liver diseases. If the drug is approved, it has the potential for significant sales and earnings growth for years to come. We sold Gilead Sciences as it approached our price target in early December.
Despite some major disappointments in the consumer discretionary sector, a position in Tractor Supply was a notable outperformer. The company is a rural-lifestyle retailer headquartered in Tennessee, with more than 1,300 stores in 48 states. It offers a wide range of products from livestock supplies and hardware to clothing and agricultural products. During the period, the company announced better-than-expected comparative data and raised future earnings guidance, which sent the stock sharply higher.
Stock selection in the consumer discretionary, information technology and industrials sectors detracted from the portfolio’s relative results. Within the consumer discretionary sector, the portfolio’s position in fashion apparel designer Michael Kors was a notable detractor. Shares declined in the double digits in a period of mixed results for many higher end retailers, as a strong U.S. dollar weighed on international sales. Michael Kors continued to deliver strong top-line sales growth; however, investor concerns regarding margins sent its share price lower. We maintain the position, as we continue to believe that the company is well positioned to take additional market share within the affordable luxury segment of consumer spending. In addition, priceline.com trended lower in the second half of 2014, despite a solid fourth quarter, as weakness in Europe, foreign currency effects and tougher year-over-year comparisons weighed on near-term earnings expectations. Media firm Discovery Communications was also a notable detractor, owing to disappointing results and lowered forward earnings guidance. We sold the position.
In the technology sector, positions in VMware, a global leader in server virtualization; Splunk, an enterprise software company focused on machine-generated log data; and ARM Holdings, which makes energy efficient semiconductors, detracted from relative results in the information technology sector, outweighing positive results from positions in social media names LinkedIn, Facebook and Chinese internet search leader Baidu. Splunk shares fell along with many other big data, cloud-related names during the spring selloff of high-growth names. ARM Holdings shares declined on concerns that royalty streams would be lower than expected while smartphone inventories continue to correct and concerns that the Chinese “4G” market — short for fourth generation mobile technology — buildout was proceeding at a pace that was slower than anticipated. We continue to like ARM Holdings, as it is one of the industry’s best opportunities for long-term secular growth. Both companies performed better in the second half of the period, but were still detractors for the year.
In industrials, positions in industrial fastener distributor Fastenal and aerospace metal component supplier Precision Castparts held back relative results. Fastenal shares declined as the company posted disappointing sales and noted a slowdown in sales to oil and gas customers. We exited the position, as the company’s prospects deteriorated relative to our prior expectations.
| | |
| |
| ACTIVE PORTFOLIOS® MULTI-MANAGER GROWTH FUND | | |
MANAGER DISCUSSION OF FUND PERFORMANCE (continued)
Loomis Sayles: Energy, consumer discretionary and consumer staples contributed most to the portfolio’s relative results for the period. Allocation helped the most in energy, which was an underweighted sector. Security selection helped the most in consumer discretionary, which was underweighted in our portion of the portfolio, and consumer staples, which was an overweight. Energy posted a loss for the period while both consumer discretionary and consumer staples had positive returns.
Monster Beverage, Facebook and Cisco were the largest individual contributors for the period. Energy drink company Monster Beverage reported solid global sales growth with improved margins and profitability in international markets, where we believe the company’s expansion strategy is positioned to reap the benefits of scale. Announcement of Monster’s partnership with Coca-Cola drove price appreciation during the period, but we believe that the benefits of the partnership will be realized after the deal closes in 2015. The deal has the potential to help Monster realize faster global expansion and profitability, increasing our estimate of the company’s initial intrinsic value by approximately 50%. In addition, Facebook reported more than 50% growth in total revenue. A key growth driver, mobile revenue increased 60% and represents about 69% of advertising revenue. Users grew 13% with more than 1 billion mobile users and daily engagement above 60%. Facebook reported attractive margins, free cash flow growth and a net cash position. With growth well above average for both the advertising industry and the online advertising segment, Facebook gained market share in both categories. We believe the company is well positioned to benefit from the secular growth in online advertising. Cisco also reported strong and improving revenue during the period and, after several down quarters, recently posted double-digit growth in its largest and very profitable switches business, where Cisco’s next-generation software-defined networking solution is gaining traction. Weak spending in emerging markets and by global carriers remains a temporary headwind. High gross margins combined with operating expense discipline allowed the company to deliver solid and improved operating margins. With its scale, technological know-how and unique end-to-end solution, we believe Cisco is well positioned to extend its industry leadership. We believe Monster Beverage, Facebook and Cisco continue to sell at meaningful discounts to our estimate of their intrinsic values.
Security selection and overweights in the health care, information technology and financials sectors detracted the most from the performance of our portion of the portfolio relative to its benchmark. Qualcomm, Schlumberger and Alibaba were the largest individual detractors during the period. Each of the three posted negative returns. However, we held onto all three because we are confident of their longer term potential. Qualcomm shares rallied somewhat late in the period on news of its settlement with Chinese antitrust regulators. With this reaffirmation of its royalty business in China, we believe Qualcomm can now address the payment backlog in China, which hurt royalty revenue during the period, and realize full future payments. In our view, near-term chipset revenue will be affected by Apple’s market share gains and Samsung’s in-house chip production. We believe the current market price seems to ignore the benefits of the reaffirmation of Qualcomm’s royalty business, which globally generates more than 60% of its profits and free cash flow. In addition, Schlumberger reported solid fundamentals for most of the year. Increased oil production coupled with
| | |
| |
| | ACTIVE PORTFOLIOS® MULTI-MANAGER GROWTH FUND |
MANAGER DISCUSSION OF FUND PERFORMANCE (continued)
weakening global demand triggered a sharp decline in oil prices in late 2014, resulting in slowing demand for Schlumberger’s oilfield services. Longer term, we believe that increased demand for oil will drive renewed growth in oil production. We believe Schlumberger is well positioned to weather the downturn and capitalize on demand when the market normalizes. We added to the portfolio’s position in Schlumberger on near-term price weakness. Furthermore, China-based e-commerce company Alibaba, which the portfolio has held since the third quarter of 2014, supported our long-term investment thesis with a report of fundamentally strong results. Recent results disappointed market expectations, and China’s government alleged Alibaba was not doing enough to prevent the sale of fraudulent products. Alibaba disputed the findings, reiterating its zero-tolerance policy, and the government subsequently removed the report from its website. We added to the portfolio’s position on price weakness and believe Alibaba is well positioned for secular growth in the China e-commerce market. Overall, we believe the current stock prices for Qualcomm, Schlumberger and Alibaba reflect a lack of appreciation for the potential sustainability of business models and significant long-term growth opportunities for all three companies.
Looking Ahead
CMIA: The final months of the 12-month period were marked by volatility as investors continued to sort out the impact of continued low energy prices, the potential for an increase in short-term borrowing rates, the continued impact of a strong dollar and the potential for slowing economic growth. Of these factors, we are especially interested at this time in the impact of the strong dollar on corporate earnings and demand for U.S. goods and services. Yet, we presently remain optimistic about the Fund’s prospects and constructive on the broader equity market, especially relative to other investment options. Projected earnings for large U.S. companies have started to come down, and lower energy prices are proving to be a headwind for many industrial firms. The tradeoff is that consumer activity, which makes up nearly two-thirds of U.S. economic activity, should benefit from lower energy prices. In this environment, we continue to seek companies that offer differentiated products and services with the potential to achieve earnings growth that exceeds the growth of competitors who lack differentiation.
Loomis Sayles: We remain committed to our long-term investment approach. We are an active manager with a long-term, private equity approach to investing. Through our proprietary bottom-up research framework, we look to invest in those few high quality businesses with sustainable competitive advantages and profitable growth that trade at a significant discount to intrinsic value. All aspects of our investment thesis must be present simultaneously for us to make an investment. Often our research is completed well in advance of the opportunity to invest. We are patient investors and maintain coverage of high-quality businesses in order to take advantage of meaningful price dislocations if and when they occur. In a typical year we may analyze 30 companies and invest in only a select few. For example, in 2012 we made five purchases, in 2013 only one purchase and in 2014, we purchased three.
| | |
| |
| ACTIVE PORTFOLIOS® MULTI-MANAGER GROWTH FUND | | |
UNDERSTANDING YOUR FUND’S EXPENSES
(Unaudited)
As an investor, you incur two types of costs. There are transaction costs, which generally include sales charges on purchases and may include redemption fees. There are also ongoing costs, which generally include management fees, distribution and/or service fees, and other fund expenses. The following information is intended to help you understand your ongoing costs (in dollars) of investing in the Fund and to help you compare these costs with the ongoing costs of investing in other mutual funds.
Analyzing Your Fund’s Expenses
To illustrate these ongoing costs, we have provided examples and calculated the expenses paid by investors of the Fund during the period. The actual and hypothetical information in the table is based on an initial investment of $1,000 at the beginning of the period indicated and held for the entire period. Expense information is calculated two ways and each method provides you with different information. The amount listed in the “Actual” column is calculated using the Fund’s actual operating expenses and total return for the period. You may use the Actual information, together with the amount invested, to estimate the expenses that you paid over the period. Simply divide your account value by $1,000 (for example, an $8,600 account value divided by $1,000 = 8.6), then multiply the results by the expenses paid during the period under the “Actual” column. The amount listed in the “Hypothetical” column assumes a 5% annual rate of return before expenses (which is not the Fund’s actual return) and then applies the Fund’s actual expense ratio for the period to the hypothetical return. You should not use the hypothetical account values and expenses to estimate either your actual account balance at the end of the period or the expenses you paid during the period. See “Compare With Other Funds” below for details on how to use the hypothetical data.
Compare With Other Funds
Since all mutual funds are required to include the same hypothetical calculations about expenses in shareholder reports, you can use this information to compare the ongoing cost of investing in the Fund with other funds. To do so, compare the hypothetical example with the 5% hypothetical examples that appear in the shareholder reports of other funds. As you compare hypothetical examples of other funds, it is important to note that hypothetical examples are meant to highlight the ongoing costs of investing in a fund only and do not reflect any transaction costs, such as sales charges, or redemption or exchange fees. Therefore, the hypothetical calculations are useful in comparing ongoing costs only, and will not help you determine the relative total costs of owning different funds. If transaction costs were included in these calculations, your costs would be higher.
October 1, 2014 – March 31, 2015
| | | | | | | | | | | | | | | | | | | | | | | | | | | | |
| | | Account Value at the
Beginning of the
Period ($) | | | Account Value at the
End of the
Period ($) | | | Expenses Paid During
the Period ($) | | | Fund’s Annualized
Expense Ratio (%) | |
| | | | Actual | | | | Hypothetical | | | | Actual | | | | Hypothetical | | | | Actual | | | | Hypothetical | | | | Actual | |
Class A | | | 1,000.00 | | | | 1,000.00 | | | | 1,090.40 | | | | 1,019.15 | | | | 6.05 | | | | 5.84 | | | | 1.16 | |
Expenses paid during the period are equal to the annualized expense ratio as indicated above, multiplied by the average account value over the period and then multiplied by the number of days in the Fund’s most recent fiscal half year and divided by 365.
Expenses do not include fees and expenses incurred indirectly by the Fund from its investment in underlying funds, including affiliated and non-affiliated pooled investment vehicles, such as mutual funds and exchange-traded funds.
| | |
| |
| | ACTIVE PORTFOLIOS® MULTI-MANAGER GROWTH FUND |
PORTFOLIO OF INVESTMENTS
March 31, 2015
(Percentages represent value of investments compared to net assets)
| | | | | | | | |
| Common Stocks 99.2% | |
| Issuer | | Shares | | | Value ($) | |
CONSUMER DISCRETIONARY 17.9% | |
Automobiles 1.7% | |
| | |
Tesla Motors, Inc.(a) | | | 168,418 | | | | 31,792,266 | |
|
Hotels, Restaurants & Leisure 0.4% | |
| | |
Yum! Brands, Inc. | | | 81,821 | | | | 6,440,949 | |
|
Internet & Catalog Retail 7.9% | |
| | |
Amazon.com, Inc.(a) | | | 214,566 | | | | 79,840,009 | |
| | |
Priceline Group, Inc. (The)(a) | | | 56,415 | | | | 65,675,522 | |
| | | | | | | | | |
Total | | | | | | | 145,515,531 | |
|
Specialty Retail 2.5% | |
| | |
Lowe’s Companies, Inc. | | | 63,146 | | | | 4,697,431 | |
| | |
Tractor Supply Co. | | | 488,008 | | | | 41,509,960 | |
| | | | | | | | | |
Total | | | | | | | 46,207,391 | |
|
Textiles, Apparel & Luxury Goods 5.4% | |
| | |
Michael Kors Holdings Ltd.(a) | | | 656,626 | | | | 43,173,160 | |
| | |
Nike, Inc., Class B | | | 547,570 | | | | 54,937,698 | |
| | | | | | | | | |
Total | | | | | | | 98,110,858 | |
| | | | | | | | | |
Total Consumer Discretionary | | | | | | | 328,066,995 | |
| | |
| | | | | | | | |
CONSUMER STAPLES 2.8% | |
Beverages 1.7% | |
| | |
Coca-Cola Co. (The) | | | 228,351 | | | | 9,259,633 | |
| | |
Monster Beverage Corp.(a) | | | 98,260 | | | | 13,598,693 | |
| | |
SABMiller PLC, ADR | | | 151,534 | | | | 7,963,869 | |
| | | | | | | | | |
Total | | | | | | | 30,822,195 | |
|
Food Products 0.6% | |
| | |
Danone SA, ADR | | | 825,222 | | | | 11,148,749 | |
|
Household Products 0.5% | |
| | |
Procter & Gamble Co. (The) | | | 112,523 | | | | 9,220,135 | |
| | | | | | | | | |
Total Consumer Staples | | | | | | | 51,191,079 | |
| | |
| | | | | | | | |
ENERGY 5.3% | |
Energy Equipment & Services 2.3% | |
| | |
FMC Technologies, Inc.(a) | | | 924,270 | | | | 34,207,233 | |
| | |
Schlumberger Ltd. | | | 93,906 | | | | 7,835,516 | |
| | | | | | | | | |
Total | | | | | | | 42,042,749 | |
|
Oil, Gas & Consumable Fuels 3.0% | |
| | |
Cabot Oil & Gas Corp. | | | 1,886,740 | | | | 55,715,432 | |
| | | | | | | | | |
Total Energy | | | | | | | 97,758,181 | |
| | |
| | | | | | | | |
FINANCIALS 0.8% | |
Capital Markets 0.6% | |
| | |
Greenhill & Co., Inc. | | | 49,539 | | | | 1,964,221 | |
| | |
SEI Investments Co. | | | 210,524 | | | | 9,282,003 | |
| | | | | | | | | |
Total | | | | | | | 11,246,224 | |
| | | | | | | | |
| Common Stocks (continued) | |
| Issuer | | Shares | | | Value ($) | |
Consumer Finance 0.2% | |
| | |
American Express Co. | | | 46,406 | | | | 3,625,237 | |
| | | | | | | | | |
Total Financials | | | | | | | 14,871,461 | |
| | |
| | | | | | | | |
HEALTH CARE 23.7% | |
Biotechnology 13.6% | |
| | |
Alexion Pharmaceuticals, Inc.(a) | | | 301,625 | | | | 52,271,612 | |
| | |
Amgen, Inc. | | | 45,420 | | | | 7,260,387 | |
| | |
Biogen, Inc.(a) | | | 128,280 | | | | 54,164,947 | |
| | |
Celgene Corp.(a) | | | 431,834 | | | | 49,781,824 | |
| | |
Intercept Pharmaceuticals, Inc.(a) | | | 105,102 | | | | 29,640,866 | |
| | |
Vertex Pharmaceuticals, Inc.(a) | | | 480,280 | | | | 56,658,632 | |
| | | | | | | | | |
Total | | | | | | | 249,778,268 | |
|
Health Care Equipment & Supplies 0.7% | |
| | |
Varian Medical Systems, Inc.(a) | | | 89,408 | | | | 8,412,399 | |
| | |
Zimmer Holdings, Inc. | | | 44,012 | | | | 5,172,290 | |
| | | | | | | | | |
Total | | | | | | | 13,584,689 | |
|
Life Sciences Tools & Services 3.1% | |
| | |
Illumina, Inc.(a) | | | 306,044 | | | | 56,814,008 | |
|
Pharmaceuticals 6.3% | |
| | |
Bristol-Myers Squibb Co. | | | 968,050 | | | | 62,439,225 | |
| | |
Merck & Co., Inc. | | | 77,674 | | | | 4,464,702 | |
| | |
Novartis AG, ADR | | | 96,351 | | | | 9,501,172 | |
| | |
Novo Nordisk A/S, ADR | | | 724,105 | | | | 38,659,966 | |
| | | | | | | | | |
Total | | | | | | | 115,065,065 | |
| | | | | | | | | |
Total Health Care | | | | | | | 435,242,030 | |
| | |
| | | | | | | | |
INDUSTRIALS 2.6% | |
Aerospace & Defense 1.6% | |
| | |
Precision Castparts Corp. | | | 141,708 | | | | 29,758,680 | |
|
Air Freight & Logistics 1.0% | |
| | |
Expeditors International of Washington, Inc. | | | 197,550 | | | | 9,517,959 | |
| | |
United Parcel Service, Inc., Class B | | | 84,317 | | | | 8,173,690 | |
| | | | | | | | | |
Total | | | | | | | 17,691,649 | |
| | | | | | | | | |
Total Industrials | | | | | | | 47,450,329 | |
| | |
| | | | | | | | |
INFORMATION TECHNOLOGY 44.0% | |
Communications Equipment 1.5% | |
| | |
Cisco Systems, Inc. | | | 565,242 | | | | 15,558,286 | |
| | |
QUALCOMM, Inc. | | | 162,318 | | | | 11,255,130 | |
| | | | | | | | | |
Total | | | | | | | 26,813,416 | |
|
Internet Software & Services 20.0% | |
| | |
Alibaba Group Holding Ltd., ADR(a) | | | 707,384 | | | | 58,882,644 | |
| | |
Baidu, Inc., ADR(a) | | | 256,836 | | | | 53,524,623 | |
The accompanying Notes to Financial Statements are an integral part of this statement.
| | |
| |
| ACTIVE PORTFOLIOS® MULTI-MANAGER GROWTH FUND | | |
PORTFOLIO OF INVESTMENTS (continued)
March 31, 2015
| | | | | | | | |
| Common Stocks (continued) | |
| Issuer | | Shares | | | Value ($) | |
Facebook, Inc., Class A(a) | | | 867,837 | | | | 71,349,219 | |
| | |
Google, Inc., Class A(a) | | | 11,757 | | | | 6,521,608 | |
| | |
Google, Inc., Class C(a) | | | 11,755 | | | | 6,441,740 | |
| | |
LinkedIn Corp., Class A(a) | | | 230,505 | | | | 57,593,979 | |
| | |
MercadoLibre, Inc. | | | 349,500 | | | | 42,820,740 | |
| | |
Twitter, Inc.(a) | | | 1,400,240 | | | | 70,124,019 | |
| | | | | | | | | |
Total | | | | | | | 367,258,572 | |
|
IT Services 6.6% | |
| | |
Automatic Data Processing, Inc. | | | 32,272 | | | | 2,763,774 | |
| | |
Cognizant Technology Solutions Corp., Class A(a) | | | 775,410 | | | | 48,377,830 | |
| | |
Visa, Inc., Class A | | | 1,065,392 | | | | 69,687,290 | |
| | | | | | | | | |
Total | | | | | | | 120,828,894 | |
|
Semiconductors & Semiconductor Equipment 2.8% | |
| | |
Altera Corp. | | | 18,569 | | | | 796,796 | |
| | |
Analog Devices, Inc. | | | 22,196 | | | | 1,398,348 | |
| | |
ARM Holdings PLC, ADR | | | 991,057 | | | | 48,859,110 | |
| | | | | | | | | |
Total | | | | | | | 51,054,254 | |
|
Software 13.1% | |
| | |
Autodesk, Inc.(a) | | | 140,911 | | | | 8,263,021 | |
| | |
Factset Research Systems, Inc. | | | 42,723 | | | | 6,801,502 | |
| | |
Microsoft Corp. | | | 150,041 | | | | 6,099,917 | |
| | |
Mobileye NV(a) | | | 736,336 | | | | 30,948,202 | |
| | |
Oracle Corp. | | | 293,872 | | | | 12,680,577 | |
| | | | | | | | |
| Common Stocks (continued) | |
| Issuer | | Shares | | | Value ($) | |
salesforce.com, Inc.(a) | | | 919,634 | | | | 61,440,748 | |
| | |
ServiceNow, Inc.(a) | | | 297,090 | | | | 23,404,750 | |
| | |
Splunk, Inc.(a) | | | 830,327 | | | | 49,155,358 | |
| | |
VMware, Inc., Class A(a) | | | 504,324 | | | | 41,359,611 | |
| | | | | | | | | |
Total | | | | | | | 240,153,686 | |
| | | | | | | | | |
Total Information Technology | | | | | | | 806,108,822 | |
| | |
| | | | | | | | |
MATERIALS 2.1% | |
Chemicals 2.1% | |
| | |
Monsanto Co. | | | 343,440 | | | | 38,650,738 | |
| | | | | | | | | |
Total Materials | | | | | | | 38,650,738 | |
| | | | | | | | | |
Total Common Stocks | | | | | | | | |
(Cost: $1,478,885,963) | | | | | | | 1,819,339,635 | |
| | |
| | | | | | | | |
| Money Market Funds 1.8% | |
| | | Shares | | | Value ($) | |
| | |
Columbia Short-Term Cash Fund, 0.123%(b)(c) | | | 33,227,513 | | | | 33,227,513 | |
| | | | | | | | | |
Total Money Market Funds | | | | | | | | |
(Cost: $33,227,513) | | | | | | | 33,227,513 | |
| | | | | | | | | |
Total Investments | | | | | | | | |
(Cost: $1,512,113,476) | | | | | | | 1,852,567,148 | |
| | | | | | | | | |
Other Assets & Liabilities, Net | | | | | | | (18,918,477 | ) |
| | | | | | | | | |
Net Assets | | | | | | | 1,833,648,671 | |
| | | | | | | | | |
Notes to Portfolio of Investments
| (b) | The rate shown is the seven-day current annualized yield at March 31, 2015. |
| (c) | As defined in the Investment Company Act of 1940, an affiliated company is one in which the Fund owns 5% or more of the company’s outstanding voting securities, or a company which is under common ownership or control with the Fund. Holdings and transactions in these affiliated companies during the year ended March 31, 2015, are as follows: |
| | | | | | | | | | | | | | | | | | | | | | | | |
| Issuer | | Beginning
Cost ($) | | | Purchase
Cost ($) | | | Proceeds
From Sales ($) | | | Ending
Cost ($) | | | Dividends —
Affiliated
Issuers ($) | | | Value ($) | |
Columbia Short-Term Cash Fund | | | 9,613,880 | | | | 627,617,087 | | | | (604,003,454 | ) | | | 33,227,513 | | | | 32,627 | | | | 33,227,513 | |
Abbreviation Legend
| | |
| ADR | | American Depositary Receipt |
Fair Value Measurements
Generally accepted accounting principles (GAAP) require disclosure regarding the inputs and valuation techniques used to measure fair value and any changes in valuation inputs or techniques. In addition, investments shall be disclosed by major category.
The Fund categorizes its fair value measurements according to a three-level hierarchy that maximizes the use of observable inputs and minimizes the use of unobservable inputs by prioritizing that the most observable input be used when available. Observable inputs are those that market participants would use in pricing an investment based on market data obtained from sources independent of the reporting entity. Unobservable inputs are those that reflect the Fund’s assumptions about the information market participants would use in pricing an investment. An investment’s level within the fair value hierarchy is based on the lowest level of any input that is deemed significant to the asset or liability’s fair value measurement. The input levels are not necessarily an indication of the risk or liquidity associated with investments at that level. For example, certain U.S. government securities are generally high quality and liquid, however, they are reflected as Level 2 because the inputs used to determine fair value may not always be quoted prices in an active market.
The accompanying Notes to Financial Statements are an integral part of this statement.
| | |
| |
| | ACTIVE PORTFOLIOS® MULTI-MANAGER GROWTH FUND |
PORTFOLIO OF INVESTMENTS (continued)
March 31, 2015
Fair Value Measurements (continued)
Fair value inputs are summarized in the three broad levels listed below:
| n | | Level 1 — Valuations based on quoted prices for investments in active markets that the Fund has the ability to access at the measurement date (including NAV for open-end mutual funds). Valuation adjustments are not applied to Level 1 investments. |
| n | | Level 2 — Valuations based on other significant observable inputs (including quoted prices for similar securities, interest rates, prepayment speeds, credit risks, etc.). |
| n | | Level 3 — Valuations based on significant unobservable inputs (including the Fund’s own assumptions and judgment in determining the fair value of investments). |
Inputs that are used in determining fair value of an investment may include price information, credit data, volatility statistics, and other factors. These inputs can be either observable or unobservable. The availability of observable inputs can vary between investments, and is affected by various factors such as the type of investment, and the volume and level of activity for that investment or similar investments in the marketplace. The inputs will be considered by the Investment Manager, along with any other relevant factors in the calculation of an investment’s fair value. The Fund uses prices and inputs that are current as of the measurement date, which may include periods of market dislocations. During these periods, the availability of prices and inputs may be reduced for many investments. This condition could cause an investment to be reclassified between the various levels within the hierarchy.
Investments falling into the Level 3 category are primarily supported by quoted prices from brokers and dealers participating in the market for those investments. However, these may be classified as Level 3 investments due to lack of market transparency and corroboration to support these quoted prices. Additionally, valuation models may be used as the pricing source for any remaining investments classified as Level 3. These models may rely on one or more significant unobservable inputs and/or significant assumptions by the Investment Manager. Inputs used in valuations may include, but are not limited to, financial statement analysis, capital account balances, discount rates and estimated cash flows, and comparable company data.
Under the direction of the Fund’s Board of Trustees (the Board), the Investment Manager’s Valuation Committee (the Committee) is responsible for overseeing the valuation procedures approved by the Board. The Committee consists of voting and non-voting members from various groups within the Investment Manager’s organization, including operations and accounting, trading and investments, compliance, risk management and legal.
The Committee meets at least monthly to review and approve valuation matters, which may include a description of specific valuation determinations, data regarding pricing information received from approved pricing vendors and brokers and the results of Board-approved valuation control policies and procedures (the Policies). The Policies address, among other things, instances when market quotations are or are not readily available, including recommendations of third party pricing vendors and a determination of appropriate pricing methodologies; events that require specific valuation determinations and assessment of fair value techniques; securities with a potential for stale pricing, including those that are illiquid, restricted, or in default; and the effectiveness of third party pricing vendors, including periodic reviews of vendors. The Committee meets more frequently, as needed, to discuss additional valuation matters, which may include the need to review back-testing results, review time-sensitive information or approve related valuation actions. The Committee reports to the Board, with members of the Committee meeting with the Board at each of its regularly scheduled meetings to discuss valuation matters and actions during the period, similar to those described earlier.
For investments categorized as Level 3, the Committee monitors information similar to that described above, which may include: (i) data specific to the issuer or comparable issuers, (ii) general market or specific sector news and (iii) quoted prices and specific or similar security transactions. The Committee considers this data and any changes from prior periods in order to assess the reasonableness of observable and unobservable inputs, any assumptions or internal models used to value those securities and changes in fair value. This data is also used to corroborate, when available, information received from approved pricing vendors and brokers. Various factors impact the frequency of monitoring this information (which may occur as often as daily). However, the Committee may determine that changes to inputs, assumptions and models are not required as a result of the monitoring procedures performed.
The accompanying Notes to Financial Statements are an integral part of this statement.
| | |
| |
| ACTIVE PORTFOLIOS® MULTI-MANAGER GROWTH FUND | | |
PORTFOLIO OF INVESTMENTS (continued)
March 31, 2015
Fair Value Measurements (continued)
The following table is a summary of the inputs used to value the Fund’s investments at March 31, 2015:
| | | | | | | | | | | | | | | | |
| Description | | Level 1
Quoted Prices in Active
Markets for Identical
Assets ($) | | | Level 2
Other Significant
Observable Inputs ($) | | | Level 3
Significant
Unobservable Inputs ($) | | | Total ($) | |
Equity Securities | | | | | | | | | | | | | | | | |
| | | | |
Common Stocks | | | | | | | | | | | | | | | | |
| | | | |
Consumer Discretionary | | | 328,066,995 | | | | — | | | | — | | | | 328,066,995 | |
| | | | |
Consumer Staples | | | 51,191,079 | | | | — | | | | — | | | | 51,191,079 | |
| | | | |
Energy | | | 97,758,181 | | | | — | | | | — | | | | 97,758,181 | |
| | | | |
Financials | | | 14,871,461 | | | | — | | | | — | | | | 14,871,461 | |
| | | | |
Health Care | | | 435,242,030 | | | | — | | | | — | | | | 435,242,030 | |
| | | | |
Industrials | | | 47,450,329 | | | | — | | | | — | | | | 47,450,329 | |
| | | | |
Information Technology | | | 806,108,822 | | | | — | | | | — | | | | 806,108,822 | |
| | | | |
Materials | | | 38,650,738 | | | | — | | | | — | | | | 38,650,738 | |
| | | | | | | | | | | | | | | | | |
Total Equity Securities | | | 1,819,339,635 | | | | — | | | | — | | | | 1,819,339,635 | |
| | | | | | | | | | | | | | | | | |
Mutual Funds | | | | | | | | | | | | | | | | |
| | | | |
Money Market Funds | | | 33,227,513 | | | | — | | | | — | | | | 33,227,513 | |
| | | | | | | | | | | | | | | | | |
Total Mutual Funds | | | 33,227,513 | | | | — | | | | — | | | | 33,227,513 | |
| | | | | | | | | | | | | | | | | |
Total | | | 1,852,567,148 | | | | — | | | | — | | | | 1,852,567,148 | |
| | | | | | | | | | | | | | | | | |
See the Portfolio of Investments for all investment classifications not indicated in the table.
There were no transfers of financial assets between levels during the period.
The accompanying Notes to Financial Statements are an integral part of this statement.
| | |
| |
| | ACTIVE PORTFOLIOS® MULTI-MANAGER GROWTH FUND |
STATEMENT OF ASSETS AND LIABILITIES
March 31, 2015
| | | | |
Assets | | | | |
| |
Investments, at value | | | | |
| |
Unaffiliated issuers (identified cost $1,478,885,963) | | | $1,819,339,635 | |
| |
Affiliated issuers (identified cost $33,227,513) | | | 33,227,513 | |
| |
Total investments (identified cost $1,512,113,476) | | | 1,852,567,148 | |
| |
Receivable for: | | | | |
| |
Investments sold | | | 9,192,443 | |
| |
Capital shares sold | | | 4,148,187 | |
| |
Dividends | | | 861,302 | |
| |
Reclaims | | | 48,206 | |
| |
Prepaid expenses | | | 5,340 | |
| |
Trustees’ deferred compensation plan | | | 18,346 | |
| |
Total assets | | | 1,866,840,972 | |
| |
| |
Liabilities | | | | |
| |
Payable for: | | | | |
| |
Investments purchased | | | 29,573,126 | |
| |
Capital shares purchased | | | 3,190,644 | |
| |
Investment management fees | | | 32,833 | |
| |
Distribution and/or service fees | | | 12,688 | |
| |
Transfer agent fees | | | 249,163 | |
| |
Administration fees | | | 2,743 | |
| |
Compensation of board members | | | 2,579 | |
| |
Chief compliance officer expenses | | | 226 | |
| |
Other expenses | | | 109,953 | |
| |
Trustees’ deferred compensation plan | | | 18,346 | |
| |
Total liabilities | | | 33,192,301 | |
| |
Net assets applicable to outstanding capital stock | | | $1,833,648,671 | |
| |
| |
Represented by | | | | |
| |
Paid-in capital | | | $1,390,804,588 | |
| |
Excess of distributions over net investment income | | | (39,212 | ) |
| |
Accumulated net realized gain | | | 102,429,623 | |
| |
Unrealized appreciation (depreciation) on: | | | | |
| |
Investments | | | 340,453,672 | |
| |
Total — representing net assets applicable to outstanding capital stock | | | $1,833,648,671 | |
| |
| |
Class A | | | | |
| |
Net assets | | | $1,833,648,671 | |
| |
Shares outstanding | | | 132,934,173 | |
| |
Net asset value per share | | | $13.79 | |
| |
The accompanying Notes to Financial Statements are an integral part of this statement.
| | |
| |
| ACTIVE PORTFOLIOS® MULTI-MANAGER GROWTH FUND | | |
STATEMENT OF OPERATIONS
Year Ended March 31, 2015
| | | | |
Net investment income | | | | |
| |
Income: | | | | |
| |
Dividends — unaffiliated issuers | | | $9,110,066 | |
| |
Dividends — affiliated issuers | | | 32,627 | |
| |
Foreign taxes withheld | | | (85,313 | ) |
| |
Total income | | | 9,057,380 | |
| |
| |
Expenses: | | | | |
| |
Investment management fees | | | 11,264,268 | |
| |
Distribution and/or service fees | | | | |
| |
Class A | | | 4,315,618 | |
| |
Transfer agent fees | | | | |
| |
Class A | | | 2,979,467 | |
| |
Administration fees | | | 938,124 | |
| |
Compensation of board members | | | 58,261 | |
| |
Custodian fees | | | 30,989 | |
| |
Printing and postage fees | | | 294,073 | |
| |
Registration fees | | | 81,078 | |
| |
Professional fees | | | 73,870 | |
| |
Chief compliance officer expenses | | | 888 | |
| |
Other | | | 72,442 | |
| |
Total expenses | | | 20,109,078 | |
| |
Net investment loss | | | (11,051,698 | ) |
| |
| |
Realized and unrealized gain (loss) — net | | | | |
| |
Net realized gain (loss) on: | | | | |
| |
Investments | | | 205,565,598 | |
| |
Net realized gain | | | 205,565,598 | |
| |
Net change in unrealized appreciation (depreciation) on: | | | | |
| |
Investments | | | 25,469,792 | |
| |
Net change in unrealized appreciation | | | 25,469,792 | |
| |
Net realized and unrealized gain | | | 231,035,390 | |
| |
Net increase in net assets resulting from operations | | | $219,983,692 | |
| |
The accompanying Notes to Financial Statements are an integral part of this statement.
| | |
| |
| | ACTIVE PORTFOLIOS® MULTI-MANAGER GROWTH FUND |
STATEMENT OF CHANGES IN NET ASSETS
| | | | | | | | |
| | | Year Ended
March 31, 2015 | | | Year Ended
March 31, 2014 | |
Operations | | | | | | | | |
| | |
Net investment loss | | | $(11,051,698 | ) | | | $(12,458,516 | ) |
| | |
Net realized gain | | | 205,565,598 | | | | 185,600,978 | |
| | |
Net change in unrealized appreciation | | | 25,469,792 | | | | 180,798,484 | |
| |
Net increase in net assets resulting from operations | | | 219,983,692 | | | | 353,940,946 | |
| |
| | |
Distributions to shareholders | | | | | | | | |
| | |
Net realized gains | | | | | | | | |
| | |
Class A | | | (224,723,028 | ) | | | (6,203,490 | ) |
| |
Total distributions to shareholders | | | (224,723,028 | ) | | | (6,203,490 | ) |
| |
Increase in net assets from capital stock activity | | | 303,960,903 | | | | 68,406,085 | |
| |
Total increase in net assets | | | 299,221,567 | | | | 416,143,541 | |
| | |
Net assets at beginning of year | | | 1,534,427,104 | | | | 1,118,283,563 | |
| |
Net assets at end of year | | | $1,833,648,671 | | | | $1,534,427,104 | |
| |
Excess of distributions over net investment income | | | $(39,212 | ) | | | $(34,483 | ) |
| |
The accompanying Notes to Financial Statements are an integral part of this statement.
| | |
| |
| ACTIVE PORTFOLIOS® MULTI-MANAGER GROWTH FUND | | |
STATEMENT OF CHANGES IN NET ASSETS (continued)
| | | | | | | | | | | | | | | | |
| | | Year Ended
March 31, 2015 | | | Year Ended
March 31, 2014 | |
| | | Shares | | | Dollars ($) | | | Shares | | | Dollars ($) | |
Capital stock activity | | | | | | | | | | | | | | | | |
| | | | |
Class A shares | | | | | | | | | | | | | | | | |
| | | | |
Subscriptions | | | 35,065,687 | | | | 472,571,521 | | | | 47,181,934 | | | | 579,530,099 | |
| | | | |
Distributions reinvested | | | 17,410,669 | | | | 224,722,681 | | | | 470,309 | | | | 6,203,382 | |
| | | | |
Redemptions | | | (29,534,609 | ) | | | (393,333,299 | ) | | | (40,367,158 | ) | | | (517,327,396 | ) |
| |
Net increase | | | 22,941,747 | | | | 303,960,903 | | | | 7,285,085 | | | | 68,406,085 | |
| |
Total net increase | | | 22,941,747 | | | | 303,960,903 | | | | 7,285,085 | | | | 68,406,085 | |
| |
The accompanying Notes to Financial Statements are an integral part of this statement.
| | |
| |
| | ACTIVE PORTFOLIOS® MULTI-MANAGER GROWTH FUND |
FINANCIAL HIGHLIGHTS
The following table is intended to help you understand the Fund’s financial performance. Certain information reflects financial results for a single share of a class held for the periods shown. Per share net investment income (loss) amounts are calculated based on average shares outstanding during the period. Total return assumes reinvestment of all dividends and distributions, if any. Total return does not reflect payment of sales charges, if any. Total return and portfolio turnover are not annualized for periods of less than one year. The portfolio turnover rate is calculated without regard to purchase and sales transactions of short-term instruments and certain derivatives, if any. If such transactions were included, the Fund’s portfolio turnover rate may be higher.
| | | | | | | | | | | | |
| | | Year Ended March 31, | |
Class A | | | 2015 | | | | 2014 | | | | 2013(a) | |
Per share data | | | | | | | | | | | | |
Net asset value, beginning of period | | | $13.95 | | | | $10.89 | | | | $10.00 | |
| | | | | | | | | | | | | |
Income from investment operations: | | | | | | | | | | | | |
| | | |
Net investment loss | | | (0.09 | ) | | | (0.11 | ) | | | (0.04 | ) |
| | | | | | | | | | | | | |
Net realized and unrealized gain | | | 1.75 | | | | 3.22 | | | | 0.93 | |
| | | | | | | | | | | | | |
Total from investment operations | | | 1.66 | | | | 3.11 | | | | 0.89 | |
| | | | | | | | | | | | | |
Less distributions to shareholders: | | | | | | | | | | | | |
| | | |
Net realized gains | | | (1.82 | ) | | | (0.05 | ) | | | — | |
| | | | | | | | | | | | | |
Total distributions to shareholders | | | (1.82 | ) | | | (0.05 | ) | | | — | |
| | | | | | | | | | | | | |
Net asset value, end of period | | | $13.79 | | | | $13.95 | | | | $10.89 | |
| | | | | | | | | | | | | |
Total return | | | 13.24 | % | | | 28.62 | % | | | 8.90 | % |
| | | | | | | | | | | | | |
Ratios to average net assets(b) | | | | | | | | | | | | |
| | | |
Total gross expenses | | | 1.16 | % | | | 1.19 | % | | | 1.25 | %(c) |
| | | | | | | | | | | | | |
Total net expenses(d) | | | 1.16 | % | | | 1.19 | % | | | 1.19 | %(c) |
| | | | | | | | | | | | | |
Net investment loss | | | (0.64 | %) | | | (0.87 | %) | | | (0.41 | %)(c) |
| | | | | | | | | | | | | |
Supplemental data | | | | | | | | | | | | |
| | | |
Net assets, end of period (in thousands) | | | $1,833,649 | | | | $1,534,427 | | | | $1,118,284 | |
| | | | | | | | | | | | | |
Portfolio turnover | | | 48 | % | | | 64 | % | | | 44 | % |
| | | | | | | | | | | | | |
Notes to Financial Highlights
| (a) | Based on operations from April 20, 2012 (commencement of operations) through the stated period end. |
| (b) | In addition to the fees and expenses that the Fund bears directly, the Fund indirectly bears a pro rata share of the fees and expenses of any other funds in which it invests. Such indirect expenses are not included in the Fund’s reported expense ratios. |
| (d) | Total net expenses include the impact of certain fee waivers/expense reimbursements made by the Investment Manager and certain of its affiliates, if applicable. |
The accompanying Notes to Financial Statements are an integral part of this statement.
| | |
| |
| ACTIVE PORTFOLIOS® MULTI-MANAGER GROWTH FUND | | |
NOTES TO FINANCIAL STATEMENTS
March 31, 2015
Note 1. Organization
Active Portfolios® Multi-Manager Growth Fund (the Fund), a series of Columbia Funds Series Trust I (the Trust), is a diversified fund. The Trust is registered under the Investment Company Act of 1940, as amended (the 1940 Act), as an open-end management investment company organized as a Massachusetts business trust.
Fund Shares
The Trust may issue an unlimited number of shares (without par value). The Fund only offers Class A shares that are available only to certain eligible investors through certain wrap fee programs sponsored and/or managed by Ameriprise Financial, Inc. (Ameriprise Financial) or its affiliates.
Class A shares are not subject to any front-end sales charge or contingent deferred sales charge.
Note 2. Summary of Significant Accounting Policies
Basis of Preparation
The Fund is an investment company that applies the accounting and reporting guidance in the Financial Accounting Standards Board (FASB) Accounting Standards Codification Topic 946, Financial Services — Investment Companies (ASC 946). The financial statements are prepared in accordance with U.S. generally accepted accounting principles (GAAP), which requires management to make certain estimates and assumptions that affect the reported amounts of assets and liabilities, the disclosure of contingent assets and liabilities at the date of the financial statements and the reported amounts of income and expenses during the reporting period. Actual results could differ from those estimates.
The following is a summary of significant accounting policies followed by the Fund in the preparation of its financial statements.
Security Valuation
All equity securities are valued at the close of business of the New York Stock Exchange (NYSE). Equity securities are valued at the last quoted sales price on the principal exchange or market on which they trade, except for securities traded on the NASDAQ Stock Market, which are valued at the NASDAQ official close price. Unlisted securities or listed securities for which there were no sales during the day are valued at the mean of the latest quoted bid and ask prices on such exchanges or markets.
Foreign equity securities are valued based on quotations from the principal market in which such securities are traded. If any foreign security prices are not readily available as a result of limited share activity, the securities are valued at the mean of the latest quoted bid and ask prices on such exchanges or markets. Foreign currency exchange rates are generally determined at 4:00 p.m. Eastern (U.S.) time. Many securities markets and exchanges outside the U.S. close prior to the close of the NYSE; therefore, the closing prices for securities in such markets or on such exchanges may not fully reflect events that occur after such close but before the close of the NYSE. In those situations, foreign securities will be fair valued pursuant to a policy adopted by the Board of Trustees (the Board), including, if available, utilizing a third party pricing service to determine these fair values. The third party pricing service takes into account multiple factors, including, but not limited to, movements in the U.S. securities markets, certain depositary receipts, futures contracts and foreign exchange rates that have occurred subsequent to the close of the foreign exchange or market, to determine a good faith estimate that reasonably reflects the current market conditions as of the close of the NYSE. The fair value of a security is likely to be different from the quoted or published price, if available.
Investments in open-end investment companies, including money market funds, are valued at their net asset value.
Investments for which market quotations are not readily available, or that have quotations which management believes are not reliable, are valued at fair value as determined in good faith under procedures established by and under the general supervision of the Board. If a security or class of securities (such as foreign securities) is valued at fair value, such value is likely to be different from the quoted or published price for the security.
The determination of fair value often requires significant judgment. To determine fair value, management may use assumptions including but not limited to future cash flows and estimated risk premiums. Multiple inputs from various sources may be used to determine fair value.
Security Transactions
Security transactions are accounted for on the trade date. Cost is determined and gains (losses) are based upon the specific identification method for both financial statement and federal income tax purposes.
| | |
| |
| | ACTIVE PORTFOLIOS® MULTI-MANAGER GROWTH FUND |
NOTES TO FINANCIAL STATEMENTS (continued)
March 31, 2015
Income Recognition
Corporate actions and dividend income are generally recorded net of any non-reclaimable tax withholdings, on the ex-dividend date or upon receipt of ex-dividend notification in the case of certain foreign securities.
Awards from class action litigation are recorded as a reduction of cost basis if the Fund still owns the applicable securities on the payment date. If the Fund no longer owns the applicable securities, the proceeds are recorded as realized gains.
Expenses
General expenses of the Trust are allocated to the Fund and other funds of the Trust based upon relative net assets or other expense allocation methodologies determined by the nature of the expense. Expenses directly attributable to the Fund are charged to the Fund.
Federal Income Tax Status
The Fund intends to qualify each year as a regulated investment company under Subchapter M of the Internal Revenue Code, as amended, and will distribute substantially all of its taxable income (including net short-term capital gains), if any, for its tax year, and as such will not be subject to federal income taxes. In addition, the Fund intends to distribute in each calendar year substantially all of its net investment income, capital gains and certain other amounts, if any, such that the Fund should not be subject to federal excise tax. Therefore, no federal income or excise tax provision is recorded.
Foreign Taxes
The Fund may be subject to foreign taxes on income, gains on investments or currency repatriation, a portion of which may be recoverable. The Fund will accrue such taxes and recoveries, as applicable, based upon its current interpretation of tax rules and regulations that exist in the markets in which it invests.
Realized gains in certain countries may be subject to foreign taxes at the Fund level, based on statutory rates. The Fund accrues for such foreign taxes on realized and unrealized gains at the appropriate rate for each jurisdiction, as applicable. The amount, if any, is disclosed as a liability on the Statement of Assets and Liabilities.
Distributions to Shareholders
Distributions from net investment income, if any, are declared and paid each calendar quarter. Net realized capital gains, if any, are distributed at least annually. Income distributions and capital gain distributions are determined in accordance with federal income tax regulations, which may differ from GAAP.
Guarantees and Indemnifications
Under the Trust’s organizational documents and, in some cases, by contract, its officers and trustees are indemnified against certain liabilities arising out of the performance of their duties to the Trust or its funds. In addition, certain of the Fund’s contracts with its service providers contain general indemnification clauses. The Fund’s maximum exposure under these arrangements is unknown since the amount of any future claims that may be made against the Fund cannot be determined, and the Fund has no historical basis for predicting the likelihood of any such claims.
Note 3. Fees and Compensation Paid to Affiliates
Investment Management Fees
Under an Investment Management Services Agreement, Columbia Management Investment Advisers, LLC (the Investment Manager), a wholly-owned subsidiary of Ameriprise Financial, Inc. (Ameriprise Financial), is responsible for the ultimate oversight of investments made by the Fund. The Fund’s subadviser (see Subadvisory Agreement below) shares the responsibility for the day-to-day portfolio management of the Fund with the Investment Manager. The investment management fee is an annual fee that is equal to a percentage of the Fund’s average daily net assets that declines from 0.71% to 0.54% as the Fund’s net assets increase. The effective investment management fee rate for the year ended March 31, 2015 was 0.65% of the Fund’s average daily net assets.
Subadvisory Agreements
The Investment Manager has entered into a Subadvisory Agreement with Loomis, Sayles & Company, L.P. (Loomis Sayles) to subadvise a portion of the assets of the Fund. The Investment Manager compensates Loomis Sayles to manage the investment of a portion of the Fund’s assets.
| | |
| |
| ACTIVE PORTFOLIOS® MULTI-MANAGER GROWTH FUND | | |
NOTES TO FINANCIAL STATEMENTS (continued)
March 31, 2015
Administration Fees
Under an Administrative Services Agreement, the Investment Manager also serves as the Fund Administrator. The Fund pays the Fund Administrator an annual fee for administration and accounting services equal to a percentage of the Fund’s average daily net assets that declines from 0.06% to 0.03% as the Fund’s net assets increase. The effective administration fee rate for the year ended March 31, 2015 was 0.05% of the Fund’s average daily net assets.
Compensation of Board Members
Board members are compensated for their services to the Fund as disclosed in the Statement of Operations. The Trust’s eligible Trustees may participate in a Deferred Compensation Plan (the Plan) which may be terminated at any time. Obligations of the Plan will be paid solely out of the Fund’s assets.
Compensation of Chief Compliance Officer
The Board has appointed a Chief Compliance Officer to the Fund in accordance with federal securities regulations. The Fund pays its pro-rata share of the expenses associated with the Chief Compliance Officer.
Transfer Agent Fees
Under a Transfer and Dividend Disbursing Agent Agreement, Columbia Management Investment Services Corp. (the Transfer Agent), an affiliate of the Investment Manager and a wholly-owned subsidiary of Ameriprise Financial, is responsible for providing transfer agency services to the Fund. The Transfer Agent has contracted with Boston Financial Data Services (BFDS) to serve as sub-transfer agent.
Effective November 1, 2014, the Transfer Agent receives a monthly transfer agency fee based on the number or the average value of accounts, depending on the type of account. Prior to November 1, 2014, the Transfer Agent received a monthly account-based service fee based on the number of open accounts. In addition, the Transfer Agent also receives sub-transfer agency fees based on a percentage of the average aggregate value of the Fund’s shares maintained in omnibus accounts (other than omnibus accounts for which American Enterprise Investment Services Inc. is the broker of record or accounts where the beneficial shareholder is a customer of Ameriprise Financial Services, Inc., for which the Transfer Agent receives a per account fee). The Transfer Agent pays the fees of BFDS for services as sub-transfer
agent and is not entitled to reimbursement for such fees from the Fund (with the exception of out-of-pocket fees).
The Transfer Agent also receives compensation from the Fund for various shareholder services and reimbursements for certain out-of-pocket fees.
For the year ended March 31, 2015, the Fund’s effective transfer agent fee rates as a percentage of average daily net assets for Class A shares was 0.17%.
An annual minimum account balance fee of $20 may apply to certain accounts with a value below the applicable Fund’s initial minimum investment requirements to reduce the impact of small accounts on transfer agent fees. These minimum account balance fees are recorded as part of expense reductions in the Statement of Operations. For the year ended March 31, 2015, no minimum account balance fees were charged by the Fund.
Distribution and Service Fees
The Fund has an agreement with Columbia Management Investment Distributors, Inc. (the Distributor), an affiliate of the Investment Manager and a wholly-owned subsidiary of Ameriprise Financial, for distribution and shareholder services. The Board has approved, and the Fund has adopted, distribution and shareholder service plans (the Plans) applicable to certain share classes, which set the distribution and service fees for the Fund. These fees are calculated daily and are intended to compensate the Distributor and/or eligible selling and/or servicing agents for selling shares of the Fund and providing services to investors.
Under the Plans, the Fund pays a monthly service fee to the Distributor at the maximum annual rate of 0.25% of the average daily net assets attributable to Class A shares of the Fund, and a monthly distribution fee to the Distributor at the maximum annual rates of 0.25% of the average daily net assets attributable to Class A shares, however the aggregate fee shall not exceed 0.25% of the Fund’s average daily net assets attributable to Class A shares.
Expenses Waived/Reimbursed by the Investment Manager and its Affiliates
The Fund’s expense ratio is subject to an expense reimbursement arrangement pursuant to which fees will be waived and/or expenses reimbursed (excluding certain fees and expenses described below), so that the Fund’s net operating expenses, after giving effect to fees waived/expenses reimbursed and any balance credits
| | |
| |
| | ACTIVE PORTFOLIOS® MULTI-MANAGER GROWTH FUND |
NOTES TO FINANCIAL STATEMENTS (continued)
March 31, 2015
and/or overdraft charges from the Fund’s custodian, do not exceed the annual rates of:
| | | | | | | | |
| | | Voluntary Expense Cap Effective August 1, 2014 | | | Contractual Expense Cap Prior to August 1, 2014 | |
Class A | | | 1.22 | % | | | 1.19 | % |
The voluntary expense cap arrangement may be revised or discontinued at any time. Under the arrangements, the following fees and expenses are excluded from the waiver/reimbursement commitment, and therefore will be paid by the Fund, if applicable: taxes (including foreign transaction taxes), expenses associated with investments in affiliated and non-affiliated pooled investment vehicles (including mutual funds and exchange-traded funds), transaction costs and brokerage commissions, costs related to any securities lending program, dividend expenses associated with securities sold short, inverse floater program fees and expenses, transaction charges and interest on borrowed money, interest and extraordinary expenses. Any fees waived and/or expenses reimbursed under the expense reimbursement arrangements described above are not recoverable by the Investment Manager or its affiliates in future periods.
Note 4. Federal Tax Information
The timing and character of income and capital gain distributions are determined in accordance with income tax regulations, which may differ from GAAP because of temporary or permanent book to tax differences.
At March 31, 2015, these differences are primarily due to differing treatment for deferral/reversal of wash sale losses, Trustees’ deferred compensation and net operating loss reclassification. To the extent these differences are permanent, reclassifications are made among the components of the Fund’s net assets in the Statement of Assets and Liabilities. Temporary differences do not require reclassifications. In the Statement of Assets and Liabilities the following reclassifications were made:
| | | | |
Excess of distributions over net investment income | | | $11,046,969 | |
Accumulated net realized gain | | | (11,046,969 | ) |
Net investment income (loss) and net realized gains (losses), as disclosed in the Statement of Operations, and net assets were not affected by this reclassification.
The tax character of distributions paid during the years indicated was as follows:
| | | | | | | | |
| | | Year Ended
March 31, 2015 ($) | | | Year Ended
March 31,
2014 ($) | |
Ordinary income | | | 2,613,702 | | | | — | |
Long-term capital gains | | | 222,109,326 | | | | 6,203,490 | |
Total | | | 224,723,028 | | | | 6,203,490 | |
Short-term capital gain distributions, if any, are considered ordinary income distributions for tax purposes.
At March 31, 2015, the components of distributable earnings on a tax basis were as follows:
| | | | |
Undistributed ordinary income | | | $5,619,411 | |
Undistributed long-term capital gains | | | 98,193,290 | |
Net unrealized appreciation | | | 339,070,594 | |
At March 31, 2015, the cost of investments for federal income tax purposes was $1,513,496,554 and the aggregate gross unrealized appreciation and depreciation based on that cost was:
| | | | |
Unrealized appreciation | | | $372,387,538 | |
Unrealized depreciation | | | (33,316,944 | ) |
Net unrealized appreciation | | | 339,070,594 | |
Management of the Fund has concluded that there are no significant uncertain tax positions in the Fund that would require recognition in the financial statements. However, management’s conclusion may be subject to review and adjustment at a later date based on factors including, but not limited to, new tax laws, regulations, and administrative interpretations (including relevant court decisions). Generally, the Fund’s federal tax returns for the prior three fiscal years remain subject to examination by the Internal Revenue Service.
Note 5. Portfolio Information
The cost of purchases and proceeds from sales of securities, excluding short-term investments and derivatives, if any, aggregated to $877,086,500 and $817,827,312, respectively, for the year ended March 31, 2015. The amount of purchase and sale activity impacts the portfolio turnover rate reported in the Financial Highlights.
Note 6. Affiliated Money Market Fund
The Fund invests in Columbia Short-Term Cash Fund, an affiliated money market fund established for the exclusive use by the Fund and other affiliated funds. The income earned by the Fund from such investments is
| | |
| |
| ACTIVE PORTFOLIOS® MULTI-MANAGER GROWTH FUND | | |
NOTES TO FINANCIAL STATEMENTS (continued)
March 31, 2015
included as Dividends — affiliated issuers in the Statement of Operations. As an investing fund, the Fund indirectly bears its proportionate share of the expenses of Columbia Short-Term Cash Fund.
Note 7. Shareholder Concentration
At March 31, 2015, affiliated shareholders of record owned 100.0% of the outstanding shares of the Fund in one or more accounts. Subscription and redemption activity by concentrated accounts may have a significant effect on the operations of the Fund.
Note 8. Line of Credit
The Fund has entered into a revolving credit facility with a syndicate of banks led by JPMorgan Chase Bank, N.A. (JPMorgan) whereby the Fund may borrow for the temporary funding of shareholder redemptions or for other temporary or emergency purposes. Pursuant to a December 9, 2014 amendment, the credit facility agreement, which is a collective agreement between the Fund and certain other funds managed by the Investment Manager, severally and not jointly, permits collective borrowings up to $550 million. Interest is charged to each participating fund based on its borrowings at a rate equal to the higher of (i) the overnight federal funds rate plus 1.00% or (ii) the one-month LIBOR rate plus 1.00%. Each borrowing under the credit facility matures no later than 60 days after the date of borrowing. The Fund also pays a commitment fee equal to its pro rata share of the amount of the credit facility at a rate of 0.075% per annum. The commitment fee is included in other expenses in the Statement of Operations. Prior to the December 9, 2014 amendment, the credit facility agreement permitted borrowings up to $500 million under the same terms and interest rates as described above.
The Fund had no borrowings during the year ended March 31, 2015.
Note 9. Significant Risks
Health Care Sector Risk
Sector risk occurs when a fund invests a significant portion of its assets in securities of companies conducting business in a related group of industries within an economic sector. Companies in the same economic sector may be similarly affected by economic, regulatory, political or market events or conditions, making a fund more vulnerable to unfavorable developments in that economic sector than funds that invest more broadly. The Fund may be more susceptible
to the particular risks that may affect companies in the health care sector than if it were invested in a wider variety of companies in unrelated sectors.
Information Technology Sector Risk
Sector risk occurs when a fund invests a significant portion of its assets in securities of companies conducting business in a related group of industries within an economic sector. Companies in the same economic sector may be similarly affected by economic, regulatory, political or market events or conditions, making a fund more vulnerable to unfavorable developments in that economic sector than funds that invest more broadly. The Fund may be more susceptible to the particular risks that may affect companies in the information technology sector than if it were invested in a wider variety of companies in unrelated sectors.
Note 10. Subsequent Events
Management has evaluated the events and transactions that have occurred through the date the financial statements were issued and noted no items requiring adjustment of the financial statements or additional disclosure.
Note 11. Information Regarding Pending and Settled Legal Proceedings
In December 2005, without admitting or denying the allegations, American Express Financial Corporation (AEFC, which is now known as Ameriprise Financial, Inc. (Ameriprise Financial)) entered into settlement agreements with the Securities and Exchange Commission (SEC) and Minnesota Department of Commerce (MDOC) related to market timing activities. As a result, AEFC was censured and ordered to cease and desist from committing or causing any violations of certain provisions of the Investment Advisers Act of 1940, the Investment Company Act of 1940, and various Minnesota laws. AEFC agreed to pay disgorgement of $10 million and civil money penalties of $7 million. AEFC also agreed to retain an independent distribution consultant to assist in developing a plan for distribution of all disgorgement and civil penalties ordered by the SEC in accordance with various undertakings detailed at www.sec.gov/litigation/admin/ia-2451.pdf. Ameriprise Financial and its affiliates have cooperated with the SEC and the MDOC in these legal proceedings, and have made regular reports to the Funds’ Boards of Trustees.
Ameriprise Financial and certain of its affiliates have historically been involved in a number of legal, arbitration
| | |
| |
| | ACTIVE PORTFOLIOS® MULTI-MANAGER GROWTH FUND |
NOTES TO FINANCIAL STATEMENTS (continued)
March 31, 2015
and regulatory proceedings, including routine litigation, class actions, and governmental actions, concerning matters arising in connection with the conduct of their business activities. Ameriprise Financial believes that the Funds are not currently the subject of, and that neither Ameriprise Financial nor any of its affiliates are the subject of, any pending legal, arbitration or regulatory proceedings that are likely to have a material adverse effect on the Funds or the ability of Ameriprise Financial or its affiliates to perform under their contracts with the Funds. Ameriprise Financial is required to make quarterly (10-Q), annual (10-K) and, as necessary, 8-K filings with the Securities and Exchange Commission on legal and regulatory matters that relate to Ameriprise Financial and its affiliates. Copies of these filings may be obtained by accessing the SEC website at www.sec.gov.
There can be no assurance that these matters, or the adverse publicity associated with them, will not result in increased fund redemptions, reduced sale of fund shares or other adverse consequences to the Funds. Further, although we believe proceedings are not likely to have a material adverse effect on the Funds or the ability of Ameriprise Financial or its affiliates to perform under their contracts with the Funds, these proceedings are subject to uncertainties and, as such, we are unable to estimate the possible loss or range of loss that may result. An adverse outcome in one or more of these proceedings could result in adverse judgments, settlements, fines, penalties or other relief that could have a material adverse effect on the consolidated financial condition or results of operations of Ameriprise Financial.
| | |
| |
| ACTIVE PORTFOLIOS® MULTI-MANAGER GROWTH FUND | | |
REPORT OF INDEPENDENT REGISTERED PUBLIC ACCOUNTING FIRM
To the Trustees of Columbia Funds Series Trust I and the Shareholders of
Active Portfolios® Multi-Manager Growth Fund
In our opinion, the accompanying statement of assets and liabilities, including the portfolio of investments, and the related statements of operations and of changes in net assets and the financial highlights present fairly, in all material respects, the financial position of Active Portfolios® Multi-Manager Growth Fund (the “Fund”, a series of Columbia Funds Series Trust I) at March 31, 2015, and the results of its operations, the changes in its net assets and the financial highlights for each of the periods indicated, in conformity with accounting principles generally accepted in the United States of America. These financial statements and financial highlights (hereafter referred to as “financial statements”) are the responsibility of the Fund’s management. Our responsibility is to express an opinion on these financial statements based on our audits. We conducted our audits of these financial statements in accordance with the standards of the Public Company Accounting Oversight Board (United States). Those standards require that we plan and perform the audit to obtain reasonable assurance about whether the financial statements are free of material misstatement. An audit includes examining, on a test basis, evidence supporting the amounts and disclosures in the financial statements, assessing the accounting principles used and significant estimates made by management, and evaluating the overall financial statement presentation. We believe that our audits, which included confirmation of securities at March 31, 2015 by correspondence with the custodian, brokers and transfer agent, provide a reasonable basis for our opinion.
PricewaterhouseCoopers LLP
Minneapolis, Minnesota
May 22, 2015
| | |
| |
| | ACTIVE PORTFOLIOS® MULTI-MANAGER GROWTH FUND |
FEDERAL INCOME TAX INFORMATION
(Unaudited)
The Fund hereby designates the following tax attributes for the fiscal year ended March 31, 2015. Shareholders will be notified in early 2016 of the amounts for use in preparing 2015 income tax returns.
Tax Designations
| | | | |
Qualified Dividend Income | | | 100.00 | % |
Dividends Received Deduction | | | 100.00 | % |
Capital Gain Dividend | | | $198,321,460 | |
Qualified Dividend Income. For taxable, non-corporate shareholders, the percentage of ordinary income distributed during the fiscal year that represents qualified dividend income subject to reduced tax rates.
Dividends Received Deduction. The percentage of ordinary income distributed during the fiscal year that qualifies for the corporate dividends received deduction.
Capital Gain Dividend. The Fund designates as a capital gain dividend the amount reflected above, or if subsequently determined to be different, the net capital gain of such fiscal period.
| | |
| |
| ACTIVE PORTFOLIOS® MULTI-MANAGER GROWTH FUND | | |
TRUSTEES AND OFFICERS
The Trustees serve terms of indefinite duration. The names, addresses and birth years of the Trustees and Officers of the Funds in Columbia Funds Series Trust I, the year each was first elected or appointed to office, their principal business occupations during at least the last five years, the number of Funds overseen by each Trustee and other directorships they hold are shown below. Each officer listed below serves as an officer of each Fund in Columbia Funds Series Trust I.
| | | | | | | | |
| Independent Trustees |
Name, Year of Birth
and Position Held
with the Trust | | Year First Appointed or Elected as
Trustee to any Fund Currently
in the Columbia
Funds Complex
or a Predecessor
Thereof | | Principal Occupation(s)
During the Past Five Years | | Number
of Funds
in the
Columbia
Funds
Complex
Overseen | | Other Directorships Held by Trustee During the Past Five Years |
Douglas A. Hacker
(Born 1955)
Trustee and Chairman of the Board | | 1996 | | Independent business executive since May 2006; Executive Vice President — Strategy of United Airlines from December 2002 to May 2006; President of UAL Loyalty Services (airline marketing company) from September 2001 to December 2002; Executive Vice President and Chief Financial Officer of United Airlines from July 1999 to September 2001 | | 59 | | Spartan Nash Company, (food distributor); Nash Finch Company (food distributor) from 2005 to 2013; Aircastle Limited (aircraft leasing); and SeaCube Container Leasing Ltd. (container leasing) from 2010 to 2013; and Travelport Worldwide Limited (travel information technology) |
Janet Langford Kelly
(Born 1957)
Trustee | | 1996 | | Senior Vice President, General Counsel and Corporate Secretary, ConocoPhillips (integrated energy company) since September 2007; Deputy General Counsel — Corporate Legal Services, ConocoPhillips from August 2006 to August 2007; Partner, Zelle, Hofmann, Voelbel, Mason & Gette LLP (law firm) from March 2005 to July 2006; Adjunct Professor of Law, Northwestern University from September 2004 to June 2006; Director, UAL Corporation (airline) from February 2006 to July 2006; Chief Administrative Officer and Senior Vice President, Kmart Holding Corporation (consumer goods) from September 2003 to March 2004 | | 59 | | None |
Nancy T. Lukitsh
(Born 1956)
Trustee | | 2011 | | Senior Vice President, Partner and Director of Marketing, Wellington Management Company, LLP (investment adviser) from 1997 to 2010; Chair, Wellington Management Investment Portfolios (commingled non-U.S. investment pools) from 2007 to 2010; Director, Wellington Trust Company, NA and other Wellington affiliates from 1997 to 2010 | | 59 | | None |
William E. Mayer
(Born 1940)
Trustee | | 1991 | | Partner, Park Avenue Equity Partners (private equity) since February 1999 | | 59 | | DynaVox Inc. (speech creation); Lee Enterprises (print media); WR Hambrecht + Co. (financial service provider) from 2000 to 2012; BlackRock Kelso Capital Corporation (investment company); Premier, Inc. (healthcare) |
| | |
| |
| | ACTIVE PORTFOLIOS® MULTI-MANAGER GROWTH FUND |
TRUSTEES AND OFFICERS (continued)
| | | | | | | | |
| Independent Trustees (continued) |
Name, Year of Birth
and Position Held
with the Trust | | Year First Appointed or Elected as
Trustee to any Fund Currently
in the Columbia
Funds Complex
or a Predecessor
Thereof | | Principal Occupation(s)
During the Past Five Years | | Number
of Funds
in the
Columbia
Funds
Complex
Overseen | | Other Directorships Held by Trustee During the Past Five Years |
David M. Moffett
(Born 1952)
Trustee | | 2011 | | Retired. Consultant to Bridgewater and Associates; Chief Executive Officer, Federal Home Loan Mortgage Corporation, from 2008 to 2009; Senior Adviser, Global Financial Services Group, Carlyle Group, Inc., from 2007 to 2008; Vice Chairman and Chief Financial Officer, U.S. Bancorp, from 1993 to 2007 | | 59 | | CIT Group Inc. (commercial and consumer finance); eBay Inc. (online trading community); MBIA Inc. (financial service provider); E.W. Scripps Co. (print and television media); Building Materials Holding Corp. (building materials and construction services); Genworth Financial, Inc. (financial and insurance products and services); and University of Oklahoma Foundation |
Charles R. Nelson
(Born 1942)
Trustee | | 1981 | | Retired. Professor Emeritus, University of Washington since 2011; Professor of Economics, University of Washington from 1976 to 2011; Ford and Louisa Van Voorhis Professor of Political Economy, University of Washington from 1993 to 2011; Adjunct Professor of Statistics, University of Washington from 1980 to 2011; Associate Editor, Journal of Money, Credit and Banking from September 1993 to 2008; consultant on econometric and statistical matters | | 59 | | None |
John J. Neuhauser
(Born 1943)
Trustee | | 1984 | | President, Saint Michael’s College since August 2007; Director or Trustee of several non- profit organizations, including Fletcher Allen Health Care, Inc.; Academic Vice President and Dean of Faculties, Boston College from August 1999 to October 2005; University Professor, Boston College from November 2005 to August 2007 | | 59 | | Liberty All-Star Equity Fund and Liberty All-Star Growth Fund (closed-end funds) |
Patrick J. Simpson
(Born 1944)
Trustee | | 2000 | | Partner, Perkins Coie LLP (law firm) | | 59 | | None |
Anne-Lee Verville
(Born 1945)
Trustee | | 1998 | | Retired. General Manager, Global Education Industry from 1994 to 1997, President — Application Systems Division from 1991 to 1994, Chief Financial Officer — US Marketing & Services from 1988 to 1991, and Chief Information Officer from 1987 to 1988, IBM Corporation (computer and technology) | | 59 | | Enesco Group, Inc. (producer of giftware and home and garden decor products) from 2001 to 2006 |
| | |
| |
| ACTIVE PORTFOLIOS® MULTI-MANAGER GROWTH FUND | | |
TRUSTEES AND OFFICERS (continued)
| | | | | | | | |
| Interested Trustee Affiliate with Investment Manager* |
Name, Year of Birth
and Position Held
with the Trust | | Year First Appointed or Elected as
Trustee to any
Fund Currently
in the Columbia
Funds Complex
or a Predecessor Thereof | | Principal Occupation(s)
during the Past Five Years | | Number
of Funds
in the
Columbia
Funds
Complex
Overseen | | Other Directorships
Held by Trustee During
the Past Five Years |
William F. Truscott (Born 1960) Trustee | | 2012 | | Chairman of the Board and President, Columbia Management Investment Advisers, LLC since May 2010 and February 2012, respectively (previously President and Chief Investment Officer, 2001-April 2010); Chief Executive Officer, Global Asset Management, Ameriprise Financial, Inc. since September 2012 (previously Chief Executive Officer, U.S. Asset Management & President, Annuities, May 2010-September 2012 and President — U.S. Asset Management and Chief Investment Officer, 2005-April 2010); Director and Chief Executive Officer, Columbia Management Investment Distributors, Inc. since May 2010 and February 2012, respectively (previously Chairman of the Board and Chief Executive Officer, 2006-April 2010); Chairman of the Board and Chief Executive Officer, RiverSource Distributors, Inc. since 2006; Director, Threadneedle Asset Management Holdings, SARL since 2014; President and Chief Executive Officer, Ameriprise Certificate Company, 2006-August 2012 | | 186 | | Chairman of the Board, Columbia Management Investment Advisers, LLC since May 2010; Director, Columbia Management Investment Distributors, Inc. since May 2010; Director, Ameriprise Certificate Company, 2006 to January 2013 |
| * | Interested person (as defined under the 1940 Act) by reason of being an officer, director, security holder and/or employee of the Investment Manager or Ameriprise Financial. |
The Statement of Additional Information has additional information about the Fund’s Board members and is available, without charge, upon request by calling 800.345.6611; contacting your financial intermediary; or visiting columbiathreadneedle.com/us.
| | |
| |
| | ACTIVE PORTFOLIOS® MULTI-MANAGER GROWTH FUND |
TRUSTEES AND OFFICERS (continued)
The Board has appointed officers who are responsible for day-to-day business decisions based on policies it has established. The officers serve at the pleasure of the Board. In addition to Mr. Truscott, who is Senior Vice President, the Funds’ other officers are:
| | | | |
| Fund Officers |
Name, Address and
Year of Birth | | Position and Year
First Appointed to
Position for any Fund
in the Columbia Funds Complex or a Predecessor Thereof | | Principal Occupation(s) During Past Five Years |
Christopher O. Petersen 5228 Ameriprise Financial Center Minneapolis, MN 55474 Born 1970 | | President and Principal Executive Officer (2015) | | Vice President and Lead Chief Counsel, Ameriprise Financial, Inc. since January 2015 (previously, Vice President and Chief Counsel January 2010-December 2014; and Vice President and Group Counsel or Counsel 2004-January 2010); officer of Columbia Funds and affiliated funds since 2007. |
Michael G. Clarke 225 Franklin Street Boston, MA 02110 Born 1969 | | Treasurer (2011) and Chief Financial Officer (2009) | | Vice President — Mutual Fund Administration, Columbia Management Investment Advisers, LLC, since May 2010; Managing Director of Fund Administration, Columbia Management Advisors, LLC, September 2004-April 2010; senior officer of Columbia Funds and affiliated funds since 2002. |
Paul B. Goucher 100 Park Avenue New York, NY 10017 Born 1968 | | Senior Vice President (2011), Chief Legal Officer (2015) and Assistant Secretary (2008) | | Vice President and Lead Chief Counsel, Ameriprise Financial, Inc. since November 2008 and January 2013, respectively (previously Chief Counsel, January 2010-January 2013 and Group Counsel, November 2008-January 2010). |
Thomas P. McGuire 225 Franklin Street Boston, MA 02110 Born 1972 | | Vice President and Chief Compliance Officer (2012) | | Vice President — Asset Management Compliance, Ameriprise Financial, Inc., since May 2010; Chief Compliance Officer, Ameriprise Certificate Company since September 2010; Compliance Executive, Bank of America, 2005-April 2010. |
Colin Moore 225 Franklin Street Boston, MA 02110 Born 1958 | | Senior Vice President (2010) | | Executive Vice President and Global Chief Investment Officer, Ameriprise Financial, Inc., since July 2013; Director and Global Chief Investment Officer, Columbia Management Investment Advisers, LLC since May 2010; Manager, Managing Director and Chief Investment Officer, Columbia Management Advisors, LLC, 2007-April 2010. |
Michael E. DeFao 225 Franklin Street Boston, MA 02110 Born 1968 | | Vice President (2011) and Assistant Secretary (2010) | | Vice President and Chief Counsel, Ameriprise Financial, Inc. since May 2010; Associate General Counsel, Bank of America, 2005-April 2010. |
Joseph F. DiMaria 225 Franklin Street Boston, MA 02110 Born 1968 | | Vice President (2011), Assistant Treasurer (2012) and Chief Accounting Officer (2008) | | Vice President — Mutual Fund Treasurer, Columbia Management Investment Advisers, LLC since May 2010; Director of Fund Administration, Columbia Management Advisors, LLC, 2006-April 2010. |
Amy Johnson 5228 Ameriprise Financial Center Minneapolis, MN 55474 Born 1965 | | Vice President (2006) | | Managing Director and Chief Operating Officer, Columbia Management Investment Advisers, LLC since May 2010 (previously Chief Administrative Officer, 2009-April 2010, and Vice President — Asset Management and Trust Company Services, 2006-2009). |
Lyn Kephart-Strong 5228 Ameriprise Financial Center Minneapolis, MN 55474 Born 1960 | | Vice President (2015) | | President, Columbia Management Investment Services Corp. since October 2014; Vice President & Resolution Officer, Ameriprise Trust Company since August 2009; President, RiverSource Service Corporation 2004-2010. |
Ryan C. Larrenaga 225 Franklin Street Boston, MA 02110 Born 1970 | | Vice President and Secretary (2015) | | Vice President and Group Counsel, Ameriprise Financial, Inc. since August 2011 (previously, Counsel from May 2010 to August 2011); Assistant General Counsel, Bank of America, 2005-April 2010; officer of Columbia Funds and affiliated funds since 2005. |
| | |
| |
| ACTIVE PORTFOLIOS® MULTI-MANAGER GROWTH FUND | | |
IMPORTANT INFORMATION ABOUT THIS REPORT
Each fund mails one shareholder report to each shareholder address. If you would like more than one report, please call shareholder services at 800.345.6611 and additional reports will be sent to you.
The policy of the Board is to vote the proxies of the companies in which each fund holds investments consistent with the procedures as stated in the Statement of Additional Information (SAI). You may obtain a copy of the SAI without charge by calling 800.345.6611; contacting your financial intermediary; visiting columbiathreadneedle.com/us; or searching the website of the Securities and Exchange Commission (SEC) at sec.gov. Information regarding how each fund voted proxies relating to portfolio securities is filed with the SEC by August 31st for the most recent 12-month period ending June 30th of that year, and is available without charge by visiting columbiathreadneedle.com/us, or searching the website of the SEC at sec.gov.
Each fund files a complete schedule of portfolio holdings with the SEC for the first and third quarters of each fiscal year on Form N-Q. Each fund’s Form N-Q is available on the SEC’s website at sec.gov and may be reviewed and copied at the SEC’s Public Reference Room in Washington, D.C. Information on the operation of the Public Reference Room may be obtained by calling 800.SEC.0330. Each fund’s complete schedule of portfolio holdings, as filed on Form N-Q, can also be obtained without charge, upon request, by calling 800.345.6611.
Active Portfolios® Multi-Manager Growth Fund
P.O. Box 8081
Boston, MA 02266-8081
This information is for use with concurrent or prior delivery of a fund prospectus. Please read and consider the investment objectives, risks, charges and expenses for any fund carefully before investing. For a prospectus and summary prospectus, which contains this and other important information about the Fund, go to columbiathreadneedle.com/us. The Fund is distributed by Columbia Management Investment Distributors, Inc., member FINRA, and managed by Columbia Management Investment Advisers, LLC.
Columbia Threadneedle Investments (Columbia Threadneedle) is the global brand name of the Columbia and Threadneedle group of companies. All rights reserved. Columbia Management Investment Distributors, Inc., 225 Franklin Street, Boston, MA 02110-2804
© 2015 Columbia Management Investment Advisers, LLC. All rights reserved.
columbiathreadneedle.com/us
ANN117_03_E01_(05/15)
Item 2. Code of Ethics.
(a) The registrant has adopted a code of ethics that applies to the registrant’s principal executive officer, principal financial officer, principal accounting officer or controller, or persons performing similar functions, regardless of whether these individuals are employed by the registrant or a third party.
(b) During the period covered by this report, there were not any amendments to a provision of the code of ethics adopted in 2(a) above.
(c) During the period covered by this report, there were no waivers, including any implicit waivers, from a provision of the code of ethics described in 2(a) above that relates to one or more of the items set forth in paragraph (b) of this item’s instructions.
Item 3. Audit Committee Financial Expert.
The registrant’s Board of Trustees has determined that Douglas A. Hacker, David M. Moffett and Anne-Lee Verville, each of whom are members of the registrant’s Board of Trustees and Audit Committee, each qualify as an audit committee financial expert. Mr. Hacker, Mr. Moffett and Ms. Verville are each independent trustees, as defined in paragraph (a)(2) of this item’s instructions.
Item 4. Principal Accountant Fees and Services.
Fee information below is disclosed for the three series of the registrant whose reports to stockholders are included in this annual filing.
(a) Audit Fees. Aggregate Audit Fees billed by the principal accountant for professional services rendered during the fiscal years ended March 31, 2015 and March 31, 2014 are approximately as follows:
2015 | | 2014 | |
$ | 66,100 | | $ | 65,300 | |
| | | | | |
Audit Fees include amounts related to the audit of the registrant’s annual financial statements or services that are normally provided by the accountant in connection with statutory and regulatory filings or engagements for those fiscal years.
(b) Audit-Related Fees. Aggregate Audit-Related Fees billed to the registrant by the principal accountant for professional services rendered during the fiscal years ended March 31, 2015 and March 31, 2014 are approximately as follows:
Audit-Related Fees include amounts for assurance and related services by the principal accountant that are reasonably related to the performance of the audit of the registrant’s financial statements and are not reported in Audit Fees above. In fiscal years 2015 and 2014, Audit-Related Fees consist of agreed-upon procedures performed for semi-annual shareholder reports.
During the fiscal years ended March 31, 2015 and March 31, 2014, there were no Audit-Related Fees billed by the registrant’s principal accountant to the registrant’s investment adviser (not including any sub-adviser whose role is primarily portfolio management and is subcontracted with or overseen by another investment adviser) and any entity controlling, controlled by, or under common control with the adviser that provides ongoing services to the registrant for an engagement that related directly to the operations and financial reporting of the registrant.
(c) Tax Fees. Aggregate Tax Fees billed by the principal accountant to the registrant for professional services rendered during the fiscal years ended March 31, 2015 and March 31, 2014 are approximately as follows:
2015 | | 2014 | |
$ | 14,400 | | $ | 17,200 | |
| | | | | |
Tax Fees include amounts for the review of annual tax returns, the review of required shareholder distribution calculations and typically include amounts for professional services by the principal accountant for tax compliance, tax advice and tax planning. In fiscal years 2015 and 2014, Tax Fees also consist of agreed-upon procedures for foreign tax filings.
During the fiscal years ended March 31, 2015 and March 31, 2014, there were no Tax Fees billed by the registrant’s principal accountant to the registrant’s investment adviser (not including any sub-adviser whose role is primarily portfolio management and is subcontracted with or overseen by another investment adviser) and any entity controlling, controlled by, or under common control with the adviser that provides ongoing services to the registrant for an engagement that related directly to the operations and financial reporting of the registrant.
(d) All Other Fees. Aggregate All Other Fees billed by the principal accountant to the registrant for professional services rendered during the fiscal years ended March 31, 2015 and March 31, 2014 are approximately as follows:
All Other Fees include amounts for products and services provided by the principal accountant, other than the services reported in paragraphs (a) through (c) above.
Aggregate All Other Fees billed by the registrant’s principal accountant to the registrant’s investment adviser (not including any sub-adviser whose role is primarily portfolio management and is subcontracted with or overseen by another investment adviser) and any entity controlling, controlled by, or under common control with the adviser that provides ongoing services to the registrant for an engagement that related directly to the operations and financial reporting of the registrant during the fiscal years ended March 31, 2015 and March 31, 2014 are approximately as follows:
2015 | | 2014 | |
$ | 325,000 | | $ | 225,000 | |
| | | | | |
In fiscal years 2015 and 2014, All Other Fees primarily consist of fees billed for internal control examinations of the registrant’s transfer agent and investment advisor.
(e)(1) Audit Committee Pre-Approval Policies and Procedures
The registrant’s Audit Committee is required to pre-approve the engagement of the registrant’s independent auditors to provide audit and non-audit services to the registrant and non-audit services to its investment adviser (excluding any sub-adviser whose role is primarily portfolio management and is sub-contracted or overseen by another investment adviser (the “Adviser”) or any entity controlling, controlled by or under common control with the Adviser that provides ongoing services to the Fund (a “Control Affiliate”) if the engagement relates directly to the operations and financial reporting of the registrant.
The Audit Committee has adopted a Policy for Engagement of Independent Auditors for Audit and Non-Audit Services (the “Policy”). The Policy sets forth the understanding of the Audit Committee regarding the engagement of the registrant’s independent accountants to provide (i) audit and permissible audit-related, tax and other services to the registrant (“Fund Services”); (ii) non-audit services to the registrant’s Adviser and any Control Affiliates, that relates directly to the operations and financial reporting of a Fund (“Fund-related Adviser Services”); and (iii) certain other audit and non-audit services to the registrant’s Adviser and its Control Affiliates. A service will require specific pre-approval by the Audit Committee if it is to be provided by the Fund’s independent auditor; provided, however, that pre-approval of non-audit services to the Fund, the Adviser or Control Affiliates may be waived if certain de minimis requirements set forth in the SEC’s rules are met.
Under the Policy, the Audit Committee may delegate pre-approval authority to any pre-designated member or members who are independent board members. The member(s) to whom such authority is delegated must report, for informational purposes only, any pre-approval decisions to the Audit Committee at its next regular meeting. The Audit
Committee’s responsibilities with respect to the pre-approval of services performed by the independent auditor may not be delegated to management.
On an annual basis, at a regularly scheduled Audit Committee meeting, the Fund’s Treasurer or other Fund officer shall submit to the Audit Committee a schedule of the types of Fund Services and Fund-related Adviser Services that are subject to specific pre-approval. This schedule will provide a description of each type of service that is subject to specific pre-approval, along with total projected fees for each service. The pre-approval will generally cover a one-year period. The Audit Committee will review and approve the types of services and the projected fees for the next one-year period and may add to, or subtract from, the list of pre-approved services from time to time, based on subsequent determinations. This specific approval acknowledges that the Audit Committee is in agreement with the specific types of services that the independent auditor will be permitted to perform and the projected fees for each service.
The Fund’s Treasurer or other Fund officer shall report to the Audit Committee at each of its regular meetings regarding all Fund Services or Fund-related Adviser Services provided since the last such report was rendered, including a description of the services, by category, with forecasted fees for the annual reporting period, proposed changes requiring specific pre-approval and a description of services provided by the independent auditor, by category, with actual fees during the current reporting period.
*****
(e)(2) 100% of the services performed for items (b) through (d) above during 2015 and 2014 were pre-approved by the registrant’s Audit Committee.
(f) Not applicable.
(g) The aggregate non-audit fees billed by the registrant’s accountant for services rendered to the registrant, and rendered to the registrant’s investment adviser (not including any sub-adviser whose role is primarily portfolio management and is subcontracted with or overseen by another investment adviser), and any entity controlling, controlled by, or under common control with the adviser that provides ongoing services to the registrant during the fiscal years ended March 31, 2015 and March 31, 2014 are approximately as follows:
2015 | | 2014 | |
$ | 340,600 | | $ | 243,400 | |
| | | | | |
(h) The registrant’s Audit Committee of the Board of Directors has considered whether the provision of non-audit services that were rendered to the registrant’s adviser (not including any sub-adviser whose role is primarily portfolio management and is subcontracted with or overseen by another investment adviser), and any entity controlling, controlled by, or under common control with the investment adviser that provides ongoing services to the registrant that were not pre-approved pursuant to
paragraph (c)(7)(ii) of Rule 2-01 of Regulation S-X, is compatible with maintaining the principal accountant’s independence.
Item 5. Audit Committee of Listed Registrants.
Not applicable.
Item 6. Investments
(a) The registrant’s “Schedule I — Investments in securities of unaffiliated issuers” (as set forth in 17 CFR 210.12-12) is included in Item 1 of this Form N-CSR.
(b) Not applicable.
Item 7. Disclosure of Proxy Voting Policies and Procedures for Closed-End Management Investment Companies.
Not applicable.
Item 8. Portfolio Managers of Closed-End Management Investment Companies.
Not applicable.
Item 9. Purchases of Equity Securities by Closed-End Management Investment Company and Affiliated Purchasers.
Not applicable.
Item 10. Submission of Matters to a Vote of Security Holders.
There were no material changes to the procedures by which shareholders may recommend nominees to the registrant’s board of directors.
Item 11. Controls and Procedures.
(a) The registrant’s principal executive officer and principal financial officers, based on their evaluation of the registrant’s disclosure controls and procedures as of a date within 90 days of the filing of this report, have concluded that such controls and procedures are adequately designed to ensure that material information required to be disclosed by the registrant in Form N-CSR is accumulated and communicated to the registrant’s management, including the principal executive officer and principal financial officer, or persons performing similar functions, as appropriate to allow timely decisions regarding required disclosure.
(b) There was no change in the registrant’s internal control over financial reporting that occurred during the registrant’s second fiscal quarter of the period covered by
this report that has materially affected, or is reasonably likely to materially affect, the registrant’s internal control over financial reporting.
Item 12. Exhibits.
(a)(1) Code of ethics required to be disclosed under Item 2 of Form N-CSR attached hereto as Exhibit 99.CODE ETH.
(a)(2) Certifications pursuant to Rule 30a-2(a) under the Investment Company Act of 1940 (17 CFR 270.30a-2(a)) attached hereto as Exhibit 99.CERT.
(a)(3) Not applicable.
(b) Certification pursuant to Rule 30a-2(b) under the Investment Company Act of 1940 (17 CFR 270.30a-2(b)) attached hereto as Exhibit 99.906CERT.
SIGNATURES
Pursuant to the requirements of the Securities Exchange Act of 1934 and the Investment Company Act of 1940, the registrant has duly caused this report to be signed on its behalf by the undersigned, thereunto duly authorized.
(registrant) | | Columbia Funds Series Trust I |
By (Signature and Title) | | /s/ Christopher O. Petersen |
| Christopher O. Petersen, President and Principal Executive Officer |
Pursuant to the requirements of the Securities Exchange Act of 1934 and the Investment Company Act of 1940, this report has been signed below by the following persons on behalf of the registrant and in the capacities and on the dates indicated.
By (Signature and Title) | | /s/ Christopher O. Petersen |
| Christopher O. Petersen, President and Principal Executive Officer |
By (Signature and Title) | | /s/ Michael G. Clarke |
| | Michael G. Clarke, Treasurer and Chief Financial Officer |
| | | |